Validation of DNA metabarcoding of fecal samples using cattle fedknown rationsJ.D. Scastaa,⁎, T. Jornsa, J.D. Dernerb, S. Lakec, D.J. Augustined, J.L. Windhe,T.L. Smithf
a Department of Ecosystem Science and Management, University of Wyoming, Laramie, WY 82071, USAb USDA-ARS Rangeland Resources and Systems Research Unit, Cheyenne, WY 82009, USAc Department of Animal Science, University of Wyoming, Laramie, WY 82071, USAd USDA-ARS Rangeland Resources and Systems Research Unit, Fort Collins, CO 80526, USAe Department of Agricultural Economics, University of Wyoming, Laramie, WY 82071, USAf Beef Unit - Agricultural Experiment Station, University of Wyoming, Laramie, WY 82071, USA
A R T I C L E I N F O
Keywords:Botanical compositionDietary protein compositionFree-roaming herbivoresGrazingPlant chloroplastRangelands
A B S T R A C T
Diet composition of free-roaming animals has been persistently difficult to quantify. Fecal DNA(fDNA) metabarcoding is an emerging novel technology to reconstruct botanical composition ofdiets. Validation studies comparing fDNA metabarcodion to fed diets are lacking. A blind 6-weekfeeding study using 5 heifers (416–527 kg) fed different diets weekly with fecal samples collectedfrom individuals 7 days after the introduction of each new diet was conducted. Diets were: (1) C3grass hay (creeping meadow foxtail (Alopecurus arundinaceus)), (2) C4 grass hay (foxtail millet(Setaria italica), (3) C3 grass hay + C4 grass hay + alfalfa hay (Medicago sativa) (equal 1/3proportions dry matter, 17.0%, 30.5%, and 52.5% by crude protein contribution, respectively),(4) C3 grass hay + C4 grass hay + alfalfa hay (equal proportions) + minor component ofWyoming big sagebrush (Artemisia tridentata ssp. wyomingensis) leaves (fed at 25 grams per heiferper day equal to 0.29% by dry matter contribution; crude protein content unknown), (5) alfalfahay + minor components of crested wheatgrass (Agropyron cristatum), western wheatgrass(Pascopyrum smithii), and blue grama (Bouteloua gracilis) that included steams, leaves, and seedheads (varying proportions by dry matter ranging from 0.02 to 0.15% but 0.05%, 0.04%, and0.01% by crude protein contribution), and (6) alfalfa hay. Single species diets were fed ad li-bitum. Diets with multiple forage species were fed at metabolic weight-based amounts withminor diet components introduced 2-3 days after major diet components. At the species level, feddiets and fDNA metabarcoding diets were dissimilar due to misidentification of major C3 and C4diet components. For C3, A. arundinaceus was under the same Operational Taxonomic Unit (OTU)as Phleum pratense (not present in the C3 sourced hay), so blind identification was initially wrong.For C4, S. italica was identified as Setaria palmifolia, which does not grow in the region.Microscopic evaluation of seeds for both misidentifications verified the correct species identifi-cation and the fDNA error. Minor dietary components were detected in only 1 of 5 heifers for all
https://doi.org/10.1016/j.anifeedsci.2019.114219Received 6 April 2019; Received in revised form 2 July 2019; Accepted 10 July 2019
Abbreviations: BLAST, Basic Local Alignment Search Tool; C, Celsius; CI, confidence interval; C3, plant photosynthetic pathway where a 3-carbonmolecule is the first produced and in grasses analogous with cool-season species; C4, plant photosynthetic pathway where an incoming carbondioxide molecule attaches to the 3-carbon molecule producing oxaloacetate (a 4-carbon molecule) and in grasses analogous with warm-seasonspecies; d, days; fDNA, fecal DNA (deoxyribonucleic acid); fNIRS, fecal near-infrared reflectance spectroscopy; g, grams; IACUC, Institutional AnimalCare and Use Committee; m, meters; MW, metabolic weight; OTU, Operational Taxonomic Unit; PCR, polymerase chain reaction; trnL, chloroplastgene region useful for identifying plant species; USDA, United States Department of Agriculture
species. Increasing the utility of fDNA metabarcoding for accurately determining the diet com-position of free-roaming animals will necessitate: 1) improving the reference library of voucherspecies specimens, 2) understanding by technical and scientific staff that multiple species may beattributed to the same OTU, and 3) greater verification of fDNA metabarcoding results usingfield-derived plant composition data, especially in rangeland settings where plant diversity canbe intrinsically high.
1. Introduction
Quantifying diet composition of free-roaming livestock and wildlife can inform decision-making by producers to achieve desiredobjectives through predicting outcomes of grazing strategies and identifying key plant species to guide management (Holechek et al.,1982). Such information is also critical because livestock and wildlife consume different quantities of nutrients temporally as foragequality and animal nutritional needs asynchronously fluctuate (Scasta et al., 2016). While quantitative dietary information is knownto be useful, diet composition of free-roaming animals in extensive and spatially heterogeneous environments has been persistentlydifficult to quantify (Garnick et al., 2018). This challenge persists because (1) animals can be problematic to locate spatially, (2) plantmaterial differentially breaks down in ruminant and non-ruminant animals, and (3) identification of plant fragments is difficult,complex, and time consuming (Holechek et al., 1982).
Diet composition quantification has become increasingly sophisticated (Garnick et al., 2018). Early techniques used direct ob-servation of animal bite counts (Sanders et al., 1980) with subsequent development of more invasive methods including surgicalstomach analysis, and rumen and esophageal fistulation (Holechek et al., 1982). More recently, non-invasive post-digestive tech-niques such as fecal microhistology and near-infrared reflectance spectroscopy (fNIRS) technology has been used (Lyons and Stuth,1992; Decruyenaere et al., 2015; Kartzinel et al., 2015; Ottavian et al., 2015; Núñez-Sánchez et al., 2016). Despite technologicaladvances, individual techniques continue to have challenges and constraints (Garnick et al., 2018). For the bite count method, plantidentification skills are required, animals must be spatially located, and only a single animal is observed at a time (Sanders et al.,1980). For surgical techniques, plant material may be masticated beyond recognition, sample size is small, methods are time in-tensive, and problems can arise from surgical procedures (Holechek et al., 1982). Constraints of fecal microhistology are that plantmaterial in the feces may not be proportional to that consumed by the animal, trained observers are required, slow turn around timefor sample analyses is slow, and bias and errors can be high (Holechek et al., 1982; Garnick et al., 2018). Accurately quantifying dietbotanical composition at the species-level has been problematic for fNIRS (Garnick et al., 2018). In addition, many fNIRS studies onlyquantified a single plant species in the diet (Walker et al., 1998, 2002; Valiente et al., 2004) or very simple diets with only 3 or soplant species (Landau et al., 2004), although more recent attempts have developed fNIRS calibrations for complex diets for up to 25species in the diet (Glasser et al., 2008).
Technological advances now permit reconstruction of diet botanical composition using fecal samples from free-roaming animalsthrough the use of DNA (fDNA) metabarcoding using a single-locus identification system with implications for dietary protein composition(Valentini et al., 2009; Craine et al., 2015; Kartzinel et al., 2015). Advantages of this technique are similar to fNIRS with non-invasivity andlarge sample sizes, but determination of diet botanical composition at the species level is quicker given the automation of readingnumerous plant DNA sequences at a single time compared to the need for individual fNIRS calibrations per plant species (Pompanon et al.,2012). fDNA metabarcoding has focused on the trnL intron located in the plant chloroplast using c-h primers and estimating species dietcomposition through associations to their plant species-specific dietary protein content (Craine et al., 2015; Kartzinel et al., 2015).
Recent fDNA applications have (1) enumerated dietary niche partitioning among African herbivores (Kartzinel et al., 2015), (2)identified seasonal and regional diet fluctuations for bison (Bison bison; Craine et al., 2015), and (3) quantified geographical patternsof cattle (Bos taurus) diets in North America (Craine et al., 2016). Validation of the fDNA metabarcoding technique is lacking throughcomparison of known fed diets to laboratory results. Previous work has generated notable surprises in diet botanical composition offree-roaming herbivores (Craine et al., 2015), including previously unknown and non-graminoid major diet components in cattlediets at a continental scale (Craine et al., 2016), and greater composition of non-graminoid plants in bison diets (Craine et al., 2015).In addition, identification of diet components with resolution only to the family or genus level in some cases has been identified as alimitation, even if additional primers were used (Garnick et al., 2018). Thus, many questions exist regarding more widespread use offDNA in scientific and managerial applications of free-ranging animals. We therefore conducted a blind cattle feeding trial usingknown fed rations (Pompanon et al., 2012) with the objective to validate the use of fDNA metabarcoding. We asked: Does fDNAmetabarcoding accurately identify known major and minor diet components?
2. Materials and methods
2.1. Animal management
Five non-gestating and non-lactating 2-year old Angus-cross heifers (weights ranging from 416 to 527 kg) were used in a 6-weekfeeding study. Animal care and use was approved under University of Wyoming IACUC protocol # 20170208DS00258-01. Heiferswere penned individually in adjoining 160 m2 (4.45 m × 36 m) well-drained pens that included shade, outdoor access, and automaticwater availability.
J.D. Scasta, et al. Animal Feed Science and Technology 255 (2019) 114219
2
2.2. Diet construction and feeding
A unique diet was fed each week over the 6-week study period and every heifer received every diet (February 7th through March14th, 2017). Fecal samples from individual heifers were collected 7 d after each diet introduction. Homogeneous diets (1, 2, and 6;Table 1) were fed ad libitum and provided nutritional resources representing different photosynthetic pathways (C3 or C4) and/orplant growth types (grasses or legumes). Heterogeneous diets (3, 4, 5; Table 1) were fed at metabolic weight (MW) based rationsusing MW0.75 based on individual heifer weights. These diets were comprised of relative proportions of the aforementioned com-ponents with or without minor components (Table 1). Prior to the start of the feeding trial, the heifers were being fed a mixture of thesame C3 hay and legume hay as was subsequently used in the trials. Due to winter weather conditions, animal diets were adjusted onFebruary 28th and March 1st to compensate for sub-freezing temperatures at −4 °C. Minor diet components were introduced 4–5 dbefore each fecal collection due to a limitation of plant material and wanting to get animals transitioned to main diet components.Samples from each forage source were analyzed for crude protein at a commercial lab using NIRS. Forage species information isprovided in Table 2. Diets fed were: (1) C3 grass hay (creeping meadow foxtail (Alopecurus arundinaceus Poir.)), (2) C4 grass hay(foxtail millet (Setaria italica (L.) P. Beauv.)), (3) C3 grass hay + C4 grass hay + alfalfa hay (Medicago sativa (L.)) (equal 1/3 pro-portions by dry matter but 16.9%, 30.5%, and 52.5% by crude protein contribution), (4) C3 grass hay + C4 grass hay + alfalfa hay(equal proportions) + minor component of Wyoming big sagebrush (Artemisia tridentata Nutt. ssp. wyomingensis Beetle & Young)leaves (fed at 25 g per heifer per day equal to 0.29% by dry matter contribution; crude protein content unknown), (5) alfalfahay + minor components of crested wheatgrass (Agropyron cristatum (L.) Gaertn.), western wheatgrass (Pascopyrum smithii (Rydb.) Á.Löve), and blue grama (Bouteloua gracilis (Willd. ex Kunth) Lag. ex Griffiths) that included steams, leaves, and seed heads (varyingproportions by dry matter ranging from 0.02% to 0.15% but 0.05%, 0.04%, and 0.01% by crude protein contribution respectively),and (6) alfalfa hay. Minor components were fed at 2.0 g per day for B. gracilis and 12.6 g per day for A. cristatum. Due to technicianerror, P. smithii was fed at 12.6 g beginning on day three, fed at 3.0 g on days four and five, and 6.0 g on day six with the exception ofone heifer that was fed 4.6 g. Rationale for inclusion of such low trace component amounts was based on the rationale to determine iffDNA could detect low amounts in the diet. Nomenclature adheres to the USDA PLANTS database (https://plants.usda.gov; USDANRCS, 2018).
2.3. Fecal collection and DNA metabarcoding analyses
Individual fecal samples collected on day seven of each diet were initially frozen; all frozen samples were then collectively thawedat the same time and subsampled for analyses at a commercial laboratory for DNA metabarcoding analysis. The fDNA metabarcodingprocess uses DNA extraction from fecal samples and then trnL c and h primers for PCR amplification. Clustered gene sequences areassigned an Operational Taxonomic Unit (OTU) identification number and matched to a reference library. The BLAST nucleotideprogram was used to identify unknown sequences using a 97% base pair matching minimum criteria (Craine et al., 2015, 2016).
2.4. Data analyses
fDNA metabarcoding results predicting dietary protein composition were organized into three different groups: (1) ‘as fed’, (2)‘laboratory non-discretionary’, and (3) ‘laboratory rectified’. The ‘as fed’ data represents the proportion of species in each fed diet thatwe expected relative to crude protein values and mass of feed consumed. The ‘laboratory non-discretionary’ data represents theproportion of species found in the dataset as reported directly by the laboratory, without technicians removing non-sensical OTUs.Each OTU was compared to a reference file and then checked against the USDA PLANTS database (USDA NRCS, 2018). Scientificnames, genus, or family names were added to the dataset. OTUs with precise scientific names were merged and percentages re-lativized. The ‘laboratory rectified’ data group represents the proportion of species found in the dataset after a technician checkedeach OTU against a reference file and then checked each OTU against the USDA PLANTS database. If the species did not grow in theregion from which the forage was sourced, the OTU was discarded. Species with similar OTUs were merged using the technician’sbotanical knowledge and fed rations information. We then assessed if plant species identified with fDNA metabarcoding were the
Table 1Date of feeding trial initiation and diet composition to validation DNA metabarcoding of fecal samples for predicting plant species composition ofcattle diets.
Start Date 1Fed Diet
February 7, 2017 1st - C3 Grass uniform (ad libitum)February 14, 2017 2nd - C4 Grass uniform (ad libitum)February 21, 2017 3rd - C3 + C4 + Legume (metabolic weight based ration)February 28, 2017 4th - C3 + C4 + Legume + minor component of Artemisia tridentata leaves (metabolic weight based ration)March 7, 2017 5th - Legume + minor components of Agropyron cristatum + Pascopyrum smithii + Bouteloua gracilis (metabolic weight based ration)March 14, 2017 6th - Legume uniform (ab libitum)
1 When only one source was used in the diet (1st, 2nd, and 6th diets) heifers were fed ad libitum or the ration was available at all times and theamount and frequency of intake was contingent upon the free choice of the heifer. Diets comprising multiple components were fed metabolic weight(MW) based rations using MW0.75 based on each heifers initial weight.
J.D. Scasta, et al. Animal Feed Science and Technology 255 (2019) 114219
same as what were fed (binary yes/no), proportion of minor plant species detections per heifer group (# out of five heifers) andrelative % protein contributions across heifers.
3. Results
3.1. Can fecal DNA metabarcoding accurately identify known major diet components?
Fed diets and laboratory non-discretionary diet results differed due to misidentification of major C3 and C4 fed diet componentswith fDNA techniques. For the homogeneous C3 diet comprised of A. arundinaceus, the main species identified using fDNA techniqueswas timothy (Phleum pratense (L.)). This incorrect attribution was due to one OTU co-representing P. pratense and A. arundinaceus,along with several other Alopecurus species, at the 97% base pair matching level. Incorrect blind determination of the plant speciesclearly indicates local botanical knowledge is critical to correctly identify species when an OTU represents multiple species acrossmultiple genera. We verified that A. arundinceus was the fed species in this diet using microscopic evaluation of seed characteristicsfrom the hay source; thereby validating that P. pratense was an incorrect attribution to the OTU.
Following this correction, fDNA results for the pure Alopecurus (C3) diet identified six genera comprising > 1% of the diet, and anadditional eight genera comprising 0.1–1% of the diet (Fig. 1a). Furthermore, fDNA significantly underestimated Alopercurus/Phleumas comprising 70.8% + 22.2% (mean + 95% CI) of the diet. At the functional group level, fDNA estimated C3 grasses comprised84.6 + 24.9% (95% CI) of the diet, which was not different from the expected value of 100. Four of the five heifers were estimated tohave > 90% C3 grass in their diet, but high variance around the mean was due to one heifer estimated to have 49% C3 grass and asubstantial forb component (41% Descurainia spp.) in the diet.
For the pure Setaria (C4) fed diet, fDNA results correctly identified the genus, but incorrectly identified the species as S. palmifolia(J. Koenig) Stapf instead of S. italica. We verified, through microscopic evaluation of seed characteristics from the hay source, that thefed species was S. italica. Moreover, the hay seed source was confirmed as certified labeled Golden German foxtail millet (i.e., S.italica). S. italica was not identified at all from the fDNA results, although other Setaria species including S. lachnea, S. parviflora, S.verticillata, and S. viridis were identified at low levels (< 1%). It is concerning that the species identified by fDNA, S. palmifolia,originated in the Pacific islands and the only US states with suitable growing conditions are Hawaii, Texas, Louisiana, and Florida(not South Dakota where the hay was grown, purchased, and loaded by research staff; USDA NRCS, 2018; Wunderlin et al., 2018).For the pure Setaria diet, fDNA estimated five additional genera comprised > 1% of the diet and another 11 genera comprised 0.1–1%of the diet (Fig. 1b). Estimated dietary level for Setaria of 84.2% + 9.1% (mean + 95% CI) was significantly lower than the expectedvalue of 100% (Fig. 1b). The largest source of error (Medicago at 4.3%) was a genus which the heifers had not consumed the weekprior to the pure C4 trial, suggesting a greater than 7 d lag time in the rumen.
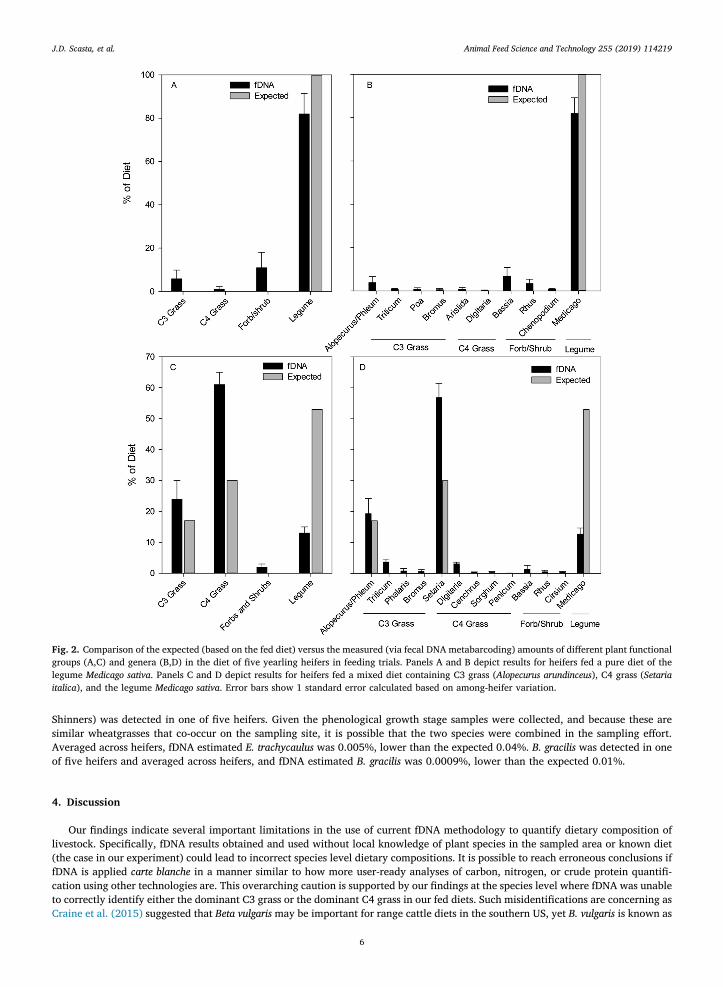
For the pure M. sativa (legume) diet, M. sativa was accurately identified by fDNA. Five other Medicago species were identified byfDNA at levels < 1%. The fDNA results estimated that Medicago comprised 82.5% + 20.2% (mean + 95% CI) of the diet, three othernon-leguminous genera comprised > 1% of the diet, and another six genera comprised 0.1–1% of the diet (Fig. 2a and b). The largestsource of error came from forb and shrub species, collectively estimated to comprise 11% of the diet, and C3 grasses, collectivelyestimated to comprise 6% of the diet.
When heifers were fed a mixed diet containing 17% C3 grass (Alopercurus), 30% C4 grass (Setaria) and 53% legume (Medicago) ona dietary protein basis, the fDNA method substantially underestimated the legume content at only 17.8% + 5.5% (mean + 95% CI)and overestimated both types of grass in the diet (Fig. 2c and d). The magnitude of the legume underestimation in this mixed diet was
Table 2Forage species used to construct known diet combinations to validate DNA metabarcoding of fecal samples for predicting plant species compositionof cattle diets.
C3, Perennial, Graminoid crested wheatgrass Agropyron cristatum (L.) Gaertn. 3.6%C3, Perennial, Graminoid western wheatgrass Pascopyrum smithii (Rydb.) Á. Löve 5.2%C4, Perennial, Graminoid blue grama Bouteloua gracilis (Willd. ex Kunth) Lag. ex
Griffiths5.3%
1 C3 = cool-season and C4 = warm-season; also referred to as photosynthetic carbon metabolism (PCM).2 Nomenclature adheres to USDA PLANTS Database (https://plants.usda.gov/java/).3 Crude protein estimated using near infrared reflectance (NIR) spectrometry conducted using a Foss 2500 at wavelengths between 850 and
2500 nm to quantify presence of key forage quality factors based on NIRS Level 2 equations according to the NIRS Forage and Feed TestingConsortium.
J.D. Scasta, et al. Animal Feed Science and Technology 255 (2019) 114219
greater than twice the level of underestimation when the legume was fed as a pure diet (Fig. 2b and d).
3.2. Can fecal DNA metabarcoding accurately detect known minor diet components?
The detection of minor components was variable. When heifers were fed a mixed C3/C4/legume diet that also contained a minorcomponent of Artemisia tridentata, fDNA estimated that 0.7% + 1.9% (mean + 95% CI) of the diet was A. tridentata, close to theexpected value of 0.4% based on an assumption of dry matter only as crude protein was unknown (Fig. 3). In addition, we note thatresults from this trial were very similar to results from the mixed-diet trial that did not include A. tridentata. In particular, dietarycomposition estimated by fDNA for the legume (19.5% + 10.5%) was substantially lower than the expected value of 53%, whilecomposition estimated by fDNA for C3 and C4 grasses were greater than expected (Fig. 3).
In a separate trial addressing minor dietary components, heifers were fed a nearly pure Medicago diet that contained minoramounts of A. cristatum, P. smithii, and B. gracilis (expected to comprise 0.05%, 0.04%, and 0.01% of dietary protein content, re-spectively). A. cristatum was detected in one of five heifers and averaged across heifers, fDNA estimated A. cristatum was 0.02%, lowerthan the expected 0.05%. P. smithii was not detected by fDNA ever, however slender wheatgrass (Elymus trachycaulus (Link) Gould ex
Fig. 1. Comparison of the expected (based on the fed diet) versus the measured (via fecal DNA metabarcoding) amounts of different plant functionalgroups (A,C) and genera (B,D) in the diet of five yearling heifers in feeding trials. Panels A and B depict results for heifers fed a pure diet of the C3grass Alopecurus arundinceus. Panels C and D depict results for heifers fed a pure diet of the C4 grass Setaria italica. Error bars show 1 standard errorcalculated based on among-heifer variation.
J.D. Scasta, et al. Animal Feed Science and Technology 255 (2019) 114219
5
Shinners) was detected in one of five heifers. Given the phenological growth stage samples were collected, and because these aresimilar wheatgrasses that co-occur on the sampling site, it is possible that the two species were combined in the sampling effort.Averaged across heifers, fDNA estimated E. trachycaulus was 0.005%, lower than the expected 0.04%. B. gracilis was detected in oneof five heifers and averaged across heifers, and fDNA estimated B. gracilis was 0.0009%, lower than the expected 0.01%.
4. Discussion
Our findings indicate several important limitations in the use of current fDNA methodology to quantify dietary composition oflivestock. Specifically, fDNA results obtained and used without local knowledge of plant species in the sampled area or known diet(the case in our experiment) could lead to incorrect species level dietary compositions. It is possible to reach erroneous conclusions iffDNA is applied carte blanche in a manner similar to how more user-ready analyses of carbon, nitrogen, or crude protein quantifi-cation using other technologies are. This overarching caution is supported by our findings at the species level where fDNA was unableto correctly identify either the dominant C3 grass or the dominant C4 grass in our fed diets. Such misidentifications are concerning asCraine et al. (2015) suggested that Beta vulgaris may be important for range cattle diets in the southern US, yet B. vulgaris is known as
Fig. 2. Comparison of the expected (based on the fed diet) versus the measured (via fecal DNA metabarcoding) amounts of different plant functionalgroups (A,C) and genera (B,D) in the diet of five yearling heifers in feeding trials. Panels A and B depict results for heifers fed a pure diet of thelegume Medicago sativa. Panels C and D depict results for heifers fed a mixed diet containing C3 grass (Alopecurus arundinceus), C4 grass (Setariaitalica), and the legume Medicago sativa. Error bars show 1 standard error calculated based on among-heifer variation.
J.D. Scasta, et al. Animal Feed Science and Technology 255 (2019) 114219
6
common beets and is uncommon on North American rangeland and pasture (although it can be a feed additive). The authors of thatstudy concluded that the OTU “best matched with B. vulgaris at the 97% identity level over 94% of the sequence, which suggests thatthe species that comprise the OTU are in the Amaranthaceae family, though might not be of the genus Beta” (Craine et al., 2015).
In addition to the uncertainty with fDNA at the species level, we observed additional uncertainty at the genera level. Prior effortshave indicated that identification at the family level may be the most accurate at times (Kartzinel et al., 2015). However, we wereable to apply local botanical knowledge to infer which species could realistically be represented by the OTUs identified by the fDNAmethod, for both the C3 and the C4 grass. In addition, fDNA correctly identified the legume at the species level. Updated referencelibraries that were made available after our initial experiment indicated that operational taxonomic units (OTUs) for A. arundinaceusand P. pratense were the same. Therefore, verification of fDNA results by knowledgeable technicians using plant composition datafrom the field is necessary in free-roaming rangeland and pasture applications, or any application including confined feeding ex-periments. In addition, if the laboratory had prior information about the key species on-site, that information could alleviate sub-jective interpretative decision making to correct species at the OTU level. To improve the use of fDNA metabarcoding to quantifyprotein diet composition of free roaming animals, it will be critical that knowledge of the plant community be available for re-conciliation and verification of results. (Garnick et al., 2018).
Discrepancies in our study are attributed to fDNA misidentification based on the reference library available at that time andbecause fed diet sources were not homogeneous (i.e., hay meadows were likely more diverse than originally thought particularly forhigh proportion of Descurainia spp. (a weed in the mustard family that is common in hay may meadows dominated by C3 grasses) inthe C3 hay diet). Yet some discrepancies remain unexplained including the mis-identification of S. italica as S. palmifolia. This suggestsdeveloping reference libraries for each study site using DNA sequenced plant voucher specimens could prevent problems (Valentiniet al., 2009). This problem highlights the need for both users of fDNA technology and purveyors of the analyses to co-invest inproducing DNA reference libraries that are much more exhaustive and encompassing. Future research should also test detectionthresholds by incrementally increasing minor components in diets systematically.
Finally, our results show that the fDNA method can either significantly overestimate or underestimate the contribution of a givenplant functional group to the diet, depending on what other functional groups are being consumed. For both C3 and C4 grasses, fDNAunderestimated dietary contribution for animals fed pure diets (Fig. 1), but significantly overestimated their contribution when fed incombination with a highly digestible legume (Fig. 2c). The latter result suggests that differential digestibility of the dietary com-ponents may be an important source of bias in the fDNA method, just as others have shown for microhistological analyses of fecalmaterial (McInnis et al., 1983; Mayes and Dove, 2000; Stewart et al., 2011). Correction of fDNA estimates based on estimates of thedigestibility of dietary components at appropriate phenological stages may be necessary to achieve quantitative measures of dietcomposition.
5. Conclusions
fDNA metabarcoding is a novel technology with much potential for reconstruction of botanical composition of diets for freeroaming animals, but caution must be emphasized when using this methodology. Our validation study suggests that the results can beincorrect and that three steps can help ensure more correct interpretation of the results. First, improving the content of the referencelibrary to which OTUs are compared can enhance accuracy. Second, understanding that a single OTU can be attributed to multiple
Fig. 3. Comparison of the expected (based on the fed diet) versus the measured (via fecal DNA metabarcoding) amounts of different plant functionalgroups (A) and genera (B) in the diet of five yearling heifers that received a mixed diet containing major components of C3 grass (Alopecurusarundinceus; 16.8%), C4 grass (Setaria italica; 30.5%), and a legume (Medicago sativa; 52.3%), and a minor component of the shrub Artemisiatridentata (0.36%). Note the logarithmic scale on the Y-axis. Error bars show 1 standard error.
J.D. Scasta, et al. Animal Feed Science and Technology 255 (2019) 114219
7
species and interpretation must be georeferenced or compared to other sources of evidence. Third, fDNA metabarcoding results areoptimal when verified with field-derived plant composition data, particularly in rangeland settings where plant diversity can beintrinsically high. Finally, using fDNA in tandem with other techniques such as microhistology could be powerful for both qualitycontrol and propelling fDNA for other applications and questions.
Animal care and welfare
Animal care and use was approved under University of Wyoming Institutional Animal Care and Use Committee (IACUC; Protocol# 20170208DS00258-01).
Funding
Support was provided by Western Sustainable Agriculture Research and Education (SARE) Graduate Student Project grant(GW17-059) and the University of Wyoming – Agricultural Experiment Station (UW-AES) through a USDA National Institute of Foodand Agriculture McIntire Stennis Project—“Animal-Plant Interaction Ecology Grant on Wyoming Rangelands” (2015-2020, Project#WYO-559-15).
Declaration of Competing Interest
After project completion, T.J. began working for Jonah Ventures, the laboratory that conducted the fDNA metabarcoding ana-lyses. The authors declare no other conflicts of interest.
Acknowledgements
Support was provided by Western Sustainable Agriculture Research and Education (SARE) Graduate Student Project grant(GW17-059) and the University of Wyoming – Agricultural Experiment Station (UW-AES) through a USDA National Institute of Foodand Agriculture McIntire Stennis Project—“Animal-Plant Interaction Ecology Grant on Wyoming Rangelands” (2015-2020, Project#WYO-559-15).
References
Craine, J.M., Towne, E.G., Miller, M., Fierer, N., 2015. Climatic warming and the future of bison as grazers. Sci. Rep. 5, 1–8. https://doi.org/10.1038/srep16738.Craine, J.M., Angerer, J.P., Elmore, A., Fierer, N., 2016. Continental-scale patterns reveal potential for warming-induced shifts in cattle diet. PLoS One 11, 1–14. https://doi.org/
10.1371/journal.pone.0161511. e0161511.Decruyenaere, V., Planchon, V., Dardenne, P., Stilmant, D., 2015. Prediction error and repeatability of near infrared reflectance spectroscopy applied to faeces samples in order to
predict voluntary intake and digestibility of forages by ruminants. Anim. Feed Sci. Tech. 205, 49–59. https://doi.org/10.1016/j.anifeedsci.2015.04.011.Garnick, S., Barboza, P.S., Walker, J.W., 2018. Assessment of animal-based methods used for estimating and monitoring rangeland herbivore diet composition. Rangeland Ecol.
Manag. 71, 449–457 doi:10.1016.j.rama.2018.03.003.Glasser, T., Landau, S., Ungar, E.D., Perevolotsky, A., Dvash, L., Muklada, H., Kababya, D., Walker, J.W., 2008. A fecal near-infrared reflectance spectroscopy-aided methodology
to determine goat dietary composition in a Mediterranean shrubland. J. Anim. Sci. 86, 1345–1356. https://doi.org/10.2527/jas.2006-817.Holechek, J.L., Vavra, M., Pieper, R.D., 1982. Botanical composition determination of range herbivore diets: a review. J. Range Manage. 35, 309–315. https://doi.org/10.2307/
illuminates dietary niche partitioning by African large herbivores. P. Natl. Acad. Sci. USA 112, 8019–8024. https://doi.org/10.1073/pnas.1503283112.Landau, S., Glasser, T., Dvash, L., Perevolotsky, A., 2004. Faecal NIRS to monitor the diet of Mediterranean goats. S. Afr. J. Anim. Sci. 34 (5), 76–80.Lyons, R.K., Stuth, J.W., 1992. Fecal NIRS equations for predicting diet quality of free-ranging cattle. J. Range Manage. 45, 238–244. https://doi.org/10.2307/4002970.Mayes, R.W., Dove, H., 2000. Measurement of dietary nutrient intake in free-ranging mammalian herbivores. Nutr. Res. Rev. 13, 107–138. https://doi.org/10.1079/
095442200108729025.McInnis, M.L., Vavra, M., Krueger, W.C., 1983. A comparison of four methods used to determine the diets of large herbivores. J. Range Manage. 36, 302–306. https://doi.org/10.
2307/3898474.Núñez-Sánchez, N., Carrion, D., Blanco, F.P., García, V.D., Sigler, A.G., Martínez-Marín, A.L., 2016. Evaluation of botanical and chemical composition of sheep diet by using faecal
near infrared spectroscopy. Anim. Feed Sci. Tech. 222, 1–6. https://doi.org/10.1016/j.anifeedsci.2016.09.010.Ottavian, M., Franceschin, E., Signorin, E., Segato, S., Berzaghi, P., Contiero, B., Cozzi, G., 2015. Application of near infrared reflectance spectroscopy (NIRS) on faecal samples
from lactating dairy cows to assess two levels of concentrate supplementation during summer grazing in alpine pastures. Anim. Feed Sci. Tech. 202, 100–105. https://doi.org/10.1016/j.anifeedsci.2015.01.013.
Pompanon, F., Deagle, B.E., Symondson, W.O., Brown, D.S., Jarman, S.N., Taberlet, P., 2012. Who is eating what: diet assessment using next generation sequencing. Mol. Ecol. 21,1931–1950. https://doi.org/10.1111/j.1365-294X.2011.05403.x.
Sanders, K.D., Dahl, B.E., Scott, G., 1980. Bite-count vs fecal analysis for range animal diets. J. Range Manage. 33, 146–149. https://doi.org/10.2307/3898431.Scasta, J.D., Beck, J.L., Angwin, C.J., 2016. Meta-analysis of diet composition and potential conflict of wild horses with livestock and wild ungulates on western rangelands of
North America. Rangeland Ecol. Manag. 69, 310–318. https://doi.org/10.1016/j.rama.2016.01.001.Stewart, K.M., Bowyer, R.T., Dick, B.L., Kie, J.G., 2011. Effects of density dependence on diet composition of North American elk Cervus elaphus and mule deer Odocoileus
hemionus: an experimental manipulation. Wildlife Biol. 17, 417–431. https://doi.org/10.2981/10-122.USDA NRCS, 2018. The PLANTS Database. (accessed 3 October 2018). http://plants.usda.gov.Valentini, A., Pompanon, F., Taberlet, P., 2009. DNA barcoding for ecologists. Trends Ecol. Evol. (Amst.) 24, 110–117. https://doi.org/10.1016/j.tree.2008.09.011.Valiente, O.L., Andueza, D., de Vega, A., Olmos, G., Muñoz, F., 2004. The use of NIRS for prediction of intake, digestibility and diet composition in sheep fed mixed grain:
roughage diets. J. Anim. Feed Sci. 13, 227–230.Walker, J.W., Clark, D.H., McCoy, S.D., 1998. Fecal NIRS for predicting percent leafy spurge in diets. J. Range Manage. 51, 450–455. https://doi.org/10.2307/4003333.Walker, J.W., McCoy, S.D., Launchbaugh, K.L., Fraker, M.J., Powell, J., 2002. Calibrating fecal NIRS equations for predicting botanical composition of diets. J. Range Manage. 55,
374–382. https://doi.org/10.2307/4003474.Wunderlin, R.P., Hansen, B.F., Franck, A.R., Essig, F.B., 2018. Atlas of Florida Plants. (Accessed 3 October 2018). http://florida.plantatlas.usf.edu/.
J.D. Scasta, et al. Animal Feed Science and Technology 255 (2019) 114219