+ All Categories
Home > Documents > Anina M Pescatore, MSc,1 Cristian M Dogaru, MD, PhD,1 ... 2Institute of Mathematical Statistics and...

Anina M Pescatore, MSc,1 Cristian M Dogaru, MD, PhD,1 ... 2Institute of Mathematical Statistics and...

Date post: 29-Jun-2018
Category:
Upload: voanh
View: 213 times
Download: 0 times
Share this document with a friend
48
Pescatore 1 A simple asthma prediction tool for pre-school children with wheeze or cough 1 2 Anina M Pescatore, MSc, 1 Cristian M Dogaru, MD, PhD, 1 Lutz Duembgen, PhD 2 , 3 MSc, 1 Michael Silverman, MD, 3 Erol A Gaillard, MD, 3 Ben D Spycher, PhD, 1* 4 Claudia E Kuehni, MD, MSc 1* 5 6 1 Institute of Social and Preventive Medicine (ISPM), University of Bern, Bern, 7 Switzerland; 8 2 Institute of Mathematical Statistics and Actuarial Science, University of Bern, Bern, 9 Switzerland 10 3 Department of Infection, Immunity & Inflammation, University of Leicester, 11 Leicester, United Kingdom 12 * Shared last authorship 13 14 Correspondence 15 Prof. Claudia E. Kuehni 16 Institute of Social and Preventive Medicine 17 Finkenhubelweg 11, CH-3012 Bern, Switzerland 18 Tel.: +41 (0)31 631 35 07 19 Fax: +41 (0)31 631 35 20 20 E-mail: [email protected] 21 22 23 24 25
Transcript

Pescatore 1

A simple asthma prediction tool for pre-school children with wheeze or cough 1

2

Anina M Pescatore, MSc,1 Cristian M Dogaru, MD, PhD,1 Lutz Duembgen, PhD2, 3

MSc,1 Michael Silverman, MD,3 Erol A Gaillard, MD,3 Ben D Spycher, PhD,1* 4

Claudia E Kuehni, MD, MSc1* 5

6

1Institute of Social and Preventive Medicine (ISPM), University of Bern, Bern, 7

Switzerland; 8

2Institute of Mathematical Statistics and Actuarial Science, University of Bern, Bern, 9

Switzerland 10

3Department of Infection, Immunity & Inflammation, University of Leicester, 11

Leicester, United Kingdom 12

* Shared last authorship 13

14

Correspondence 15

Prof. Claudia E. Kuehni 16

Institute of Social and Preventive Medicine 17

Finkenhubelweg 11, CH-3012 Bern, Switzerland 18

Tel.: +41 (0)31 631 35 07 19

Fax: +41 (0)31 631 35 20 20

E-mail: [email protected] 21

22

23

24

25

Pescatore 2

Funding 26

Swiss National Science Foundation (PDFMP3-123162 and 3200B0-122341) and 27

Asthma UK 07/048. Ben Spycher is the recipient of a European Respiratory 28

Society/Marie Curie Joint Research Fellowship (MC 1614-2010). 29

30

Word count 31

3452/3500 32

33

Key words 34

Asthma, wheeze, cough, children, prediction, prognosis, persistence, longitudinal, 35

cohort study 36

37

Clinical Implications 38

The proposed asthma prediction tool is simple and uses information that is non-39

invasive and easy to assess. This makes it an ideal instrument for use in clinical 40

practice and research. 41

42

Capsule summary 43

We have developed a simple tool to predict later asthma in preschool children 44

suffering from wheeze or cough. Its simplicity and internal validity facilitate use in 45

clinical practice and epidemiological research. 46

47

Abbreviations 48

ROC curve: receiver operating characteristic curve 49

AUC: area under the ROC curve 50

Pescatore 3

HL test: Hosmer-Lemeshow goodness-of-fit-test 51

OR: odds ratio 52

53

Pescatore 4

Abstract 54

Background: Many preschool children suffer from wheeze or cough, but only some 55

have asthma later. Existing prediction tools are difficult to apply in clinical practice or 56

exhibit methodological weaknesses. 57

Objective: To develop a simple and robust tool for predicting asthma at school-age 58

in pre-school children with wheeze or cough. 59

Methods: From a population-based cohort in Leicestershire, UK, we included 1-3 60

year-olds seeing a doctor for wheeze or cough, and assessed prevalence of asthma 61

five years later. We considered only non-invasive predictors that are easy to assess 62

in primary care: demographic and perinatal data, eczema, upper and lower 63

respiratory symptoms and family history of atopy. We developed a model using 64

logistic regression, avoided over-fitting with LASSO-penalty, and then simplified it to 65

a practical tool. We performed internal validation and assessed its predictive 66

performance using the scaled Brier score and the area under receiver operating 67

characteristic curve (AUC). 68

Results: Of 1226 symptomatic children with follow-up information, 345 (28%) had 69

asthma 5 years later. The tool consists of 10 predictors yielding a total score 70

between 0 and 15: sex, age, wheeze without colds, wheeze frequency, activity 71

disturbance, shortness of breath, exercise-related and aeroallergen-related 72

wheeze/cough, eczema, and parental history of asthma/bronchitis. The scaled Brier 73

scores for the internally validated model and tool were 0.20 and 0.16, and the AUCs 74

were 0.76 and 0.74, respectively. 75

Conclusion: 76

Pescatore 5

This tool represents a simple, low-cost and non-invasive method to predict the risk 77

for later asthma in symptomatic pre-school children, which is ready to be tested in 78

other populations. 79

Pescatore 6

Introduction 80

Many preschool children present to primary care with recurrent wheeze or cough. 81

These symptoms are a burden to families and lead to treatment with inhalers, 82

antibiotics or cough mixtures, hospitalizations and considerable health care costs.1 In 83

this age-group, wheezing illness is heterogeneous and includes different phenotypes 84

with varying prognoses.2-5 Fortunately, only some children will have persistent 85

problems till school-age. The ability to predict persistence of wheeze up to school-86

age would allow preventative and therapeutic efforts to be directed to those most in 87

need6 and would reassure parents of children with transient problems. It would also 88

help to select children for intervention studies aiming to alter the course of disease.7 89

Several groups have presented tools for prediction of later asthma in preschool 90

children8-16, but their use for primary care is limited.17 Some tools were developed in 91

study populations untypical for primary care. For instance, they included 92

asymptomatic children,8, 10, 14, 16 children with mild symptoms, who never visited their 93

doctor,13, 15 or only high-risk children hospitalized for bronchiolitis.12 Several studies 94

excluded children with chronic cough,13, 15 who might actually suffer from a variant of 95

asthma.4, 18 Some tools included predictors, such as parental education, that are not 96

easily generalizable to other populations.9 Other tools involve invasive 97

measurements (blood tests or skin prick tests) that might not be accepted by all 98

families in primary care.8, 11, 13, 14 Finally, the methods commonly used to develop the 99

prediction tools are prone to over-fitting the data.9, 11, 13 Over-fitting leads to reduced 100

performance when tools are applied to other populations.19, 20 101

In this study we aimed to develop a simple tool to predict asthma at school-age in 102

preschool children with wheeze or chronic cough. We designed the tool for 103

application in clinical practice, particularly primary care, by: a) studying a population 104

Pescatore 7

of symptomatic children, who had presented to the doctor for wheeze or cough; b) 105

defining a clinically relevant outcome; c) considering only predictive factors easily 106

assessed during a single consultation (a detailed symptom history, but no blood or 107

skin prick tests and no repeated observations); d) developing a robust model that 108

performs well in internal validation and relevant sensitivity analyses but does not 109

over-fit the data and is therefore likely to be transferable to other populations. 110

111

Methods 112

Study population 113

We analyzed data from a population-based childhood cohort from Leicestershire, 114

UK, described in detail elsewhere.21, 22, 23 In brief, we recruited a representative 115

population-based sample of 6808 children of white and south Asian ethnic origin, 116

born in 1993-97. Perinatal data were collected at birth; data on growth and 117

development were acquired prospectively during childhood. Upper and lower 118

respiratory morbidity, treatments and health care utilization, family history of atopic 119

disease and individual and family-related exposures were assessed by repeated 120

questionnaires (1998, 1999, 2001, 2003, 2006, 2010). The study was approved by 121

the Leicestershire Health Authority Research Ethics Committee. 122

Presentation at baseline (inclusion criteria) 123

Our analysis included all cohort children aged 1-3 years at baseline with parent-124

reported wheeze or chronic cough (cough without colds or cough at night) with one 125

or more visits to the doctor for wheeze or cough during the past 12 months (Fig 1, 126

highlighted in grey). The original questions are provided in the online repository. We 127

included chronic cough, because some children with chronic cough might suffer from 128

a variant of asthma and be at risk for asthma later in life.4, 18 Information on 129

Pescatore 8

symptoms at baseline was taken from the 1998 or the 1999 questionnaire, favoring 130

the questionnaire when children were closest to age 2.0 years. 131

Any asthma at school-age (definition of outcome) 132

We defined a clinically relevant outcome as the combination of current wheeze plus 133

use of asthma medication during the past 12 months at the age of 6-8 years, i.e. 5 134

years later (see online repository for original questions). Asthma medication included 135

short- or long-acting beta-2-agonists, inhaled corticosteroids, leukotriene receptor 136

antagonists or oral corticosteroids. 137

We used Fisher’s exact test to compare characteristics of children with and without 138

the outcome (Table E1, Table I) as well as to compare characteristics of children by 139

availability of follow-up information (Table E2). Choice of potential predictive factors 140

We used the following approach to compile the list of potential predictors. First, we 141

reviewed the literature to identify relevant risk factors for incidence or persistence of 142

childhood asthma.3, 24-31 From these, we only selected factors that are readily 143

available in primary care and do not require repeated observations or additional 144

investigations like blood or skin prick tests. The final list contained 24 potential 145

predictors (Table E1): demographic and perinatal data; eczema; upper and lower 146

respiratory symptoms, particularly those reflecting triggers and severity of wheeze; 147

and parental history of wheeze, asthma, bronchitis or hay fever (see online 148

repository for original questions). We did not include environmental or 149

socioeconomic information, because their prevalence and interpretation is likely to 150

vary between populations and, thus, their inclusion might reduce the generalizability 151

of the tool. 152

Model development 153

We used LASSO-penalized logistic regression to develop the prediction model.32, 33 154

Pescatore 9

This approach allows to identify important predictors and to estimate their influence 155

on later asthma without over-fitting the data. Traditional methods used for selecting 156

predictors, such as stepwise backward or forward selection, tend to over-fit the data, 157

resulting in models that predict outcomes in the current dataset well, but become 158

unreliable in other datasets.20 For our analysis, we recoded all potential predictors 159

with >2 response categories into multiple binary variables. Thus, 38 binary variables 160

derived from the 24 questions entered the variable selection process (see online 161

repository for details). LASSO regression selects predictors in the order of their 162

predictive importance. The final prediction model allows calculation of a prediction 163

score and the probability of later asthma for each child. 164

Model performance 165

We assessed our prediction model in terms of overall performance, discrimination 166

and calibration. To assess overall performance we calculated the scaled Brier 167

score,20 a measure of the discrepancy between the predicted probability and the 168

actual outcome. A scaled Brier score with a value of zero means that the model does 169

not predict later asthma in an individual better than if it had been informed only by 170

the average prevalence of asthma at school-age; the maximal value of one indicates 171

perfect prediction. To determine the discriminative ability of the model (i.e. its ability 172

to distinguish between children with and without later asthma) we plotted the receiver 173

operating characteristics (ROC) curve and calculated the area under this curve 174

(AUC), also known as c-statistic.20, 34 The AUC can take on values from 0 to 1, with 1 175

being a perfectly discriminating model. Discrimination is considered not better than 176

chance if AUC=0.5, moderate if AUC is 0.6 to 0.8, and good if AUC>0.8.34 177

Calibration of the model (how well the predicted probabilities agree with the 178

prevalence of the outcome in subgroups of children) was tested using the Hosmer-179

Pescatore 10

Lemeshow goodness-of-fit-test (HL test)20, 35 and visualized using a calibration plot.20 180

An HL test result of less than 0.05 indicates that the predicted probabilities and the 181

actual outcome agree poorly. In the calibration plot, a perfect calibration curve would 182

lie exactly on the diagonal line. 183

Internal validity 184

A prediction model can be validated internally to provide a more accurate estimate of 185

model performance in other populations. As an internal validation of our model, we 186

used the leave-one-out cross-validation method20, 34 assessing overall performance 187

(Brier), discrimination (AUC), and calibration (see online repository for further 188

explanations). 189

Sensitivity analyses 190

To test the robustness of the model developed in our original study population (P0), 191

we performed sensitivity analyses using modified inclusion criteria at baseline or 192

modified definitions of the outcome, resulting in slight changes of the study 193

populations (P1 to P4, described in more detail in Tables E3 and E4 of the online 194

repository). 195

We first applied our existing prediction model to these modified populations and 196

calculated the scaled Brier score and AUC (Sensitivity analysis I). Second, we 197

developed new models within the slightly modified study populations P1 to P4, and 198

assessed their performance (Sensitivity analysis II). 199

Clinical prediction tool 200

To simplify our model to a practical tool, we considered three different approaches: 201

a) multiplying regression coefficients by factors 10, 5 and 3 and rounding them to the 202

nearest integer;20 b) setting the penalty of the LASSO-penalized logistic regression 203

so that only a few important predictors (5 or 3) were retained, and c) considering a 204

Pescatore 11

model with frequency of wheeze as the only predictor.19 All these approaches aimed 205

to reduce the number of variables while maintaining a comparable predictive 206

performance. 207

208

Results 209

Study population 210

At the baseline survey, 5878 of 6808 children were aged 1-3 years. Figure 1 shows 211

how many of the 1-3 year old children reported episodes of wheeze, cough without 212

colds or cough at night in the past 12 months and in addition reported visits to a 213

doctor (N=2444), making them eligible for the study. For 1226 we had information on 214

any asthma five years later. Their characteristics are shown in Table I for the 215

variables selected by the main model and in Table E1 (online repository) for all 216

potential predictors considered. At baseline, 336 children (27.4%) were aged one 217

year, 702 (57.3%) two years and 188 (15.3%) three years. The mean prediction 218

interval from baseline to outcome was 4.5 (± SD 0.5) years. At school-age, 345 219

(28.1%) had any asthma. 220

Table E2 in the online repository compares eligible children with and without follow-221

up information. The groups were comparable in many aspects (chronic cough, upper 222

respiratory infections, eczema and parental history), but those with follow-up 223

information were more likely to be of white ethnicity and less likely to have wheeze at 224

baseline. 225

Main prediction model 226

Of the 38 binary predictors that entered variable selection, the LASSO-penalized 227

logistic regression retained 22 (Table II). The 5 most important predictors were, in 228

order of importance, shortness of breath, frequent wheeze, wheeze without colds, 229

Pescatore 12

activity disturbance by wheeze and wheeze/cough triggered by exercise. In addition, 230

the model included aeroallergen-related wheeze/cough, male sex, age, birth weight, 231

gestational age, eczema, upper respiratory symptoms, and parental history of 232

wheeze, asthma, bronchitis or hay fever. 233

In the original study population, the overall performance of the main model measured 234

by the scaled Brier score was 0.23 and its discriminative ability (AUC) was 0.78. In 235

internal validation, these measures were comparable, 0.20 and 0.76 respectively. 236

The calibration plot (Fig 2) shows good agreement between the predicted 237

probabilities of later asthma and the observed frequencies in internal validation. The 238

same was indicated by the Hosmer-Lemeshow test (p=0.6). 239

Sensitivity analyses 240

Sensitivity analyses I: The main model was robust to changes in baseline criteria 241

(P1, P2 in Table E3). When the outcome definition was changed to wheeze plus a 242

doctor’s diagnosis of asthma (P3) or to moderately severe asthma (≥4 attacks plus 243

inhaled corticosteroids; P4), the AUC improved to 0.80 and 0.87 respectively (P3 244

and P4 in Table E3). Sensitivity analyses II: The performance of new models 245

developed in these alternative study populations was comparable to the main model 246

for P1-P3 and slightly improved for P4 (Table E4). The selected predictors and 247

estimated coefficients in the newly developed models (Table E5) were comparable to 248

those of the main model. Severity-related predictors (wheeze without colds, frequent 249

attacks, shortness of breath, activity disturbance) gained comparatively more weight 250

when predicting moderately severe asthma (P4). 251

Clinical prediction tool 252

We then simplified the model using the three planned approaches. Our preferred 253

simplification includes 10 variables (13 binary predictors), each of which contributes 254

Pescatore 13

with one of 3 values (1, 2 or 3) to the prediction score (Fig 3; an online version of the 255

prediction tool is available on www.leicestercohorts.org). 256

This tool was derived from the original model by multiplying all regression 257

coefficients with 3 and rounding them to the nearest integer, dropping variables with 258

coefficients rounded to zero.20 It had almost the same discriminative ability 259

(AUC=0.775) as the main model (AUC=0.782) (Fig.4). Other approaches to 260

simplification retained more predictors (making the tool complicated with little benefit) 261

or had reduced discriminative ability (Table E6), particularly the model with 262

frequency of wheeze only. 263

In internal validation, the prediction tool showed only a minor decrease in 264

performance compared to the main model: the scaled Brier score was 0.16 and the 265

AUC 0.74. 266

The maximum score a child can attain using the prediction tool is 15, corresponding 267

to a 95% probability of having any asthma 5 years later (Fig 3). Sensitivity and 268

specificity of the tool are 0.72 and 0.71 for a score of 5, and 0.22 and 0.98 for a 269

score of 10 (additional performance measures are reported in Table E7). In our study 270

sample, 840 (69%) children were at low risk (score ≤5), 288 (23%) at medium risk 271

(score ≥6 and ≤9) and 98 (8%) at high risk (score ≥10) of any asthma 5 years later. 272

The percentage of children with any asthma at school age was 16%, 48% and 79% 273

in the low, medium and high risk groups respectively. 274

275

Discussion 276

Summary of findings 277

We have developed a new tool for predicting asthma at school-age in preschool 278

children who see a doctor for wheeze or cough. Our tool includes 10 predictors 279

Pescatore 14

representing wheeze severity and triggers, male sex, age, eczema and parental 280

respiratory history. It showed good internal validity and is distinguished by ease of 281

use in primary care and epidemiological studies. 282

Comparison with previous prediction models 283

Several prediction models have been proposed for estimating the risk of persistent 284

asthma in preschool children.8-16 Table III summarizes inclusion criteria, outcome, 285

methods used to derive the tool, predictors and performance for three tools that used 286

a similar prediction interval as ours and had a sample size of >300. In short, Castro-287

Rodriguez (Tucson Children’s Respiratory Study) used data from 2-3 year-olds with 288

and without respiratory symptoms to develop two prediction tools for asthma at 289

school-age (loose and stringent asthma predictive index, API; Table III).8 290

Kurukulaaratchy (Isle of Wight birth cohort) proposed a score for persistence of early 291

wheeze up to age 10.13 Caudri (PIAMA birth cohort), developed a clinical risk score 292

for 0-4 year-olds with wheeze or cough to predict asthma at age 7-8.9 293

The performance of these tools was comparable or slightly less than ours (Table III), 294

with a Youden index36 (sensitivity + specificity -1) varying from 0.328 to 0.3813 295

(calculated based on the maximal sum of sensitivity and specificity reported in the 296

respective studies) compared to 0.43 in our study. The Youden index ranges 297

between 0 and 1. Values close to 1 indicate large predictive effectiveness and values 298

close to 0 limited effectiveness. 299

The method used to derive the APIs is difficult to replicate,8 while methods used for 300

the other tools 9, 13 (logistic regression with stepwise variable selection) tend to over-301

fit the data, i.e. the models might be overly influenced by the random variation in the 302

data used to develop them. This limits the application of the models to other 303

populations. 304

Pescatore 15

Only Caudri et al. performed an internal validation of their prediction model and 305

reported a similar AUC (0.72) to the one we obtained (0.74). They included 8 306

predictors with exact regression coefficients, while our model includes 10 predictors 307

with simplified regression coefficients that facilitate calculation of individual risks in a 308

clinical setting. The PIAMA risk score and the API have been tested in a small 309

external population.19, 37 310

In comparison to our tool, previous asthma prediction rules included at most two 311

descriptors of wheeze (out of frequency, duration or wheeze without colds).8-10, 14 In 312

addition, they relied on blood or skin prick tests,8, 11-13, 15 which are more time 313

consuming, costly and cumbersome than a detailed symptom history. 314

Socioeconomic position is a proxy measure for a variety of exposures and health 315

care access and might have a variable impact in different populations. 9 316

Strengths and limitations 317

The main strengths of our tool are the objective approach used for its development 318

and its clinical applicability. We used a population-based sample of an adequate size 319

to develop the model. We included only children with health care visits for wheeze or 320

cough, assuring that the sample represents a clinically relevant population. We 321

defined a clinically relevant outcome measure (wheeze needing treatment). When 322

defining a more severe outcome (moderately severe asthma, defined as ≥4 attacks 323

per year and inhaled corticosteroid treatment) the tool performed even better. All 324

predictors are obtained routinely when taking a respiratory history for a child 325

presenting with chronic cough or wheeze and predictors are easy to assess even 326

during a short primary care consultation or in a questionnaire survey. We used a 327

method that minimizes over-fitting and is less affected by sampling variability 328

compared to stepwise variable selection procedures,38 and we did an internal 329

Pescatore 16

validation. Finally, our model predicts a range of probabilities rather than predicting 330

only a low or high risk as the API.8 331

Like other studies,8, 9, 11, 13 ours relies on parent-reported questionnaire data. 332

However, it uses standardized questions, mostly from the ISAAC-study39 and reflects 333

to some extent the clinical situation, where parents report respiratory symptoms. The 334

applied questionnaire showed good repeatability.40 We did not use objective 335

measurements to define our outcome. However, for a subsample of our study 336

population (N=451), we assessed bronchodilator response in a later survey 337

conducted in 2006 (Table E8). Using the same outcome definitions (any asthma and 338

moderately severe asthma), mean percent change in forced expiratory volume in the 339

1st second (FEV1) was significantly higher in children with any asthma compared to 340

those without (5.5% (95% CI 3.6-7.3) vs 2.6% (2.0-3.2), p<0.001). For maximal 341

expiratory flow at 50% of vital capacity (MEF50), mean percent change was 16.7% 342

(12.8-20.5) and 10.7% (8.8-12.5) respectively (p=0.003). This is less than the cut-343

offs recommended for clinical situations.41 However, our measurements came not 344

from hospital-based children referred when they were unwell, but from community-345

based children with very mild asthma who were usually asymptomatic when 346

measured. Our results are in line with data from Galant et al, where bronchodilator 347

responses for FEV1 were 7.3% (4.2-10.4) in mild persistent asthmatics and 7.6% 348

(5.8-9.5) in mild intermittent asthmatics compared to 2.2% (0.2-4.3) in non-349

asthmatics.42 Children with and without follow-up information were comparable 350

(Table E2), although we cannot exclude that selection bias has affected the 351

composition of the final model. Finally, we interpreted missing values in potential 352

predictor variables as an absence of the respective risk factor, which may also have 353

Pescatore 17

affected the results. However, the number of missing values did not exceed 5.8% in 354

any of the potential predictor variables. 355

Meaning of the study 356

Our model was robust and results changed little with modifications of the inclusion 357

criteria and outcomes. In fact, the performance improved (AUC 0.89 vs. 0.78) when 358

we predicted moderately severe asthma, rather than any asthma. After internal 359

validation, the AUC of main model and tool were similar to the ones before 360

validation, suggesting that there was little over-fitting. 361

Our tool used only information on symptoms that can be gathered in a simple 362

patient’s history. Despite that, it had a similar or better predictive performance than 363

previous tools including more complex measurements.8, 11, 13-15 This suggests that a 364

detailed description of presented symptoms might predict later asthma equally well 365

as more invasive methods, including blood eosinophilia or skin prick tests.8, 11, 13-15 366

Seven of 10 predictors (including the 5 strongest) describe the symptoms: frequency 367

of attacks, activity disturbance, shortness of breath, triggers (wheeze apart from 368

colds, exercise, aeroallergens) and eczema. This is consistent with the old 369

knowledge that frequent wheeze strongly predicts asthma persistence, 10, 43 and with 370

our previous report, showing that frequency of wheeze predicted asthma nearly as 371

well as the complicated API rule.19 In our tool, adding more symptoms (in addition to 372

wheeze frequency) improved the performance (AUC after internal validation 0.74 for 373

the tool vs. 0.57 for wheeze frequency only; Table E6). This shows that more 374

detailed assessment of symptoms in pre-school children improves prediction of later 375

asthma. 376

Future research 377

Pescatore 18

To further evaluate the predictive performance of the proposed tool and assess its 378

generalizability to other populations, external validation in independent samples is 379

necessary.34 We therefore encourage the application and validation of this tool in 380

ongoing epidemiological studies and clinical care (particularly primary care). Some 381

earlier prediction models8, 9, 13 performed similarly in external populations, but their 382

performance remained modest.15, 19, 37 383

Compared to other prediction rules, our tool includes detailed description of symptom 384

severity and pattern. This raises the possibility that further refinement in the 385

description of preschool wheeze phenotype might improve precision of prediction of 386

later asthma. Additional gains might be made by detailed assessment of age-related 387

changes, physiological measurements (lung function, bronchial 388

hyperresponsiveness, exhaled nitric oxide, atopy), environmental, socioeconomic 389

and genetic risk factors.17 All this could, however, compromise the tool’s simplicity. 390

Conclusions 391

This tool represents a simple, low-cost and non-invasive method to predict the risk 392

for later asthma in symptomatic preschool children, which is ready to be tested in 393

other populations. 394

Acknowledgements 395

We thank all the children and parents of Leicestershire for participating in the study 396

and we thank Kali Tal for her editorial assistance. 397

Pescatore 19

References 398

1. Stevens CA, Turner D, Kuehni CE, Couriel JM, Silverman M. The economic 399

impact of preschool asthma and wheeze. Eur Respir J 2003; 21:1000-6. 400

2. Henderson J, Granell R, Heron J, Sherriff A, Simpson A, Woodcock A, et al. 401

Associations of wheezing phenotypes in the first 6 years of life with atopy, 402

lung function and airway responsiveness in mid-childhood. Thorax 2008; 403

63:974-80. 404

3. Martinez FD, Wright AL, Taussig LM, Holberg CJ, Halonen M, Morgan WJ. 405

Asthma and wheezing in the first six years of life. The Group Health Medical 406

Associates. N Engl J Med 1995; 332:133-8. 407

4. Spycher BD, Silverman M, Brooke AM, Minder CE, Kuehni CE. Distinguishing 408

phenotypes of childhood wheeze and cough using latent class analysis. Eur 409

Respir J 2008; 31:974-81. 410

5. Spycher BD, Silverman M, Kuehni CE. Phenotypes of childhood asthma: are 411

they real? Clin Exp Allergy 2010; 40:1130-41. 412

6. Caudri D, Wijga AH, Smit HA, Koppelman GH, Kerkhof M, Hoekstra MO, et al. 413

Asthma symptoms and medication in the PIAMA birth cohort: evidence for 414

under and overtreatment. Pediatr Allergy Immunol 2011; 22:652-9. 415

7. Robertson CF, Price D, Henry R, Mellis C, Glasgow N, Fitzgerald D, et al. 416

Short-course montelukast for intermittent asthma in children: a randomized 417

controlled trial. Am J Respir Crit Care Med 2007; 175:323-9. 418

8. Castro-Rodriguez JA, Holberg CJ, Wright AL, Martinez FD. A clinical index to 419

define risk of asthma in young children with recurrent wheezing. Am J Respir 420

Crit Care Med 2000; 162:1403-6. 421

Pescatore 20

9. Caudri D, Wijga A, CM AS, Hoekstra M, Postma DS, Koppelman GH, et al. 422

Predicting the long-term prognosis of children with symptoms suggestive of 423

asthma at preschool age. J Allergy Clin Immunol 2009; 124:903-10 e1-7. 424

10. Devulapalli CS, Carlsen KC, Haland G, Munthe-Kaas MC, Pettersen M, 425

Mowinckel P, et al. Severity of obstructive airways disease by age 2 years 426

predicts asthma at 10 years of age. Thorax 2008; 63:8-13. 427

11. Eysink PE, ter Riet G, Aalberse RC, van Aalderen WM, Roos CM, van der 428

Zee JS, et al. Accuracy of specific IgE in the prediction of asthma: 429

development of a scoring formula for general practice. Br J Gen Pract 2005; 430

55:125-31. 431

12. Korppi M. Asthma predictive factors in infants with bronchiolitis: asthma risk at 432

13-20 years of age. Eur Respir J 2010; 36:221-2. 433

13. Kurukulaaratchy RJ, Matthews S, Holgate ST, Arshad SH. Predicting 434

persistent disease among children who wheeze during early life. Eur Respir J 435

2003; 22:767-71. 436

14. Lodrup Carlsen KC, Soderstrom L, Mowinckel P, Haland G, Pettersen M, 437

Munthe Kaas MC, et al. Asthma prediction in school children; the value of 438

combined IgE-antibodies and obstructive airways disease severity score. 439

Allergy 2010; 65:1134-40. 440

15. Matricardi PM, Illi S, Keil T, Wagner P, Wahn U, Lau S. Predicting persistence 441

of wheezing: one algorithm does not fit all. Eur Respir J 2010; 35:701-3. 442

16. Balemans WA, van der Ent CK, Schilder AG, Sanders EA, Zielhuis GA, 443

Rovers MM. Prediction of asthma in young adults using childhood 444

characteristics: Development of a prediction rule. J Clin Epidemiol 2006; 445

59:1207-12. 446

Pescatore 21

17. Savenije OE, Kerkhof M, Koppelman GH, Postma DS. Predicting who will 447

have asthma at school age among preschool children. J Allergy Clin Immunol 448

2012; 130:325-31. 449

18. Corrao WM, Braman SS, Irwin RS. Chronic cough as the sole presenting 450

manifestation of bronchial asthma. N Engl J Med 1979; 300:633-7. 451

19. Leonardi NA, Spycher BD, Strippoli MP, Frey U, Silverman M, Kuehni CE. 452

Validation of the Asthma Predictive Index and comparison with simpler clinical 453

prediction rules. J Allergy Clin Immunol 2011; 127:1466-72 e6. 454

20. Steyerberg E. Clinical prediction models: a practical approach to 455

development, validation, and updating: Springer Verlag; 2009. 456

21. Kuehni CE, Brooke AM, Strippoli MP, Spycher BD, Davis A, Silverman M. 457

Cohort profile: the Leicester respiratory cohorts. Int J Epidemiol 2007; 36:977-458

85. 459

22. Dogaru CM, Strippoli MP, Spycher BD, Frey U, Beardsmore CS, Silverman M, 460

et al. Breastfeeding and lung function at school age: does maternal asthma 461

modify the effect? Am J Respir Crit Care Med 2012; 185:874-80. 462

23. Spycher BD, Silverman M, Egger M, Zwahlen M, Kuehni CE. Routine 463

vaccination against pertussis and the risk of childhood asthma: a population-464

based cohort study. Pediatrics 2009; 123:944-50. 465

24. Bisgaard H, Bonnelykke K. Long-term studies of the natural history of asthma 466

in childhood. J Allergy Clin Immunol 2010; 126:187-97; quiz 98-9. 467

25. Frank PI, Morris JA, Hazell ML, Linehan MF, Frank TL. Long term prognosis 468

in preschool children with wheeze: longitudinal postal questionnaire study 469

1993-2004. BMJ 2008; 336:1423-6. 470

Pescatore 22

26. Lowe L, Custovic A, Woodcock A. Childhood asthma. Curr Allergy Asthma 471

Rep 2004; 4:159-65. 472

27. Matricardi PM, Illi S, Gruber C, Keil T, Nickel R, Wahn U, et al. Wheezing in 473

childhood: incidence, longitudinal patterns and factors predicting persistence. 474

Eur Respir J 2008; 32:585-92. 475

28. Midodzi WK, Rowe BH, Majaesic CM, Saunders LD, Senthilselvan A. 476

Predictors for wheezing phenotypes in the first decade of life. Respirology 477

2008; 13:537-45. 478

29. Piippo-Savolainen E, Korppi M. Wheezy babies--wheezy adults? Review on 479

long-term outcome until adulthood after early childhood wheezing. Acta 480

Paediatr 2008; 97:5-11. 481

30. Sherriff A, Peters TJ, Henderson J, Strachan D. Risk factor associations with 482

wheezing patterns in children followed longitudinally from birth to 3(1/2) years. 483

Int J Epidemiol 2001; 30:1473-84. 484

31. Van Bever HP, Desager KN, Hagendorens M. Critical evaluation of prognostic 485

factors in childhood asthma. Pediatr Allergy Immunol 2002; 13:77-83. 486

32. Friedman J, Hastie T, Tibshirani R. Regularization Paths for Generalized 487

Linear Models via Coordinate Descent. J Stat Softw 2010; 33:1-22. 488

33. Tibshirani R. Regression shrinkage and selection via the lasso. Journal of the 489

Royal Statistical Society. Series B (Methodological) 1996:267-88. 490

34. Harrell F. Regression modeling strategies: with applications to linear models, 491

logistic regression, and survival analysis: Springer; 2001. 492

35. Hosmer DW, Hosmer T, Le Cessie S, Lemeshow S. A comparison of 493

goodness-of-fit tests for the logistic regression model. Stat Med 1997; 16:965-494

80. 495

Pescatore 23

36. Youden WJ. Index for rating diagnostic tests. Cancer 1950; 3:32-5. 496

37. Rodriguez-Martinez CE, Sossa-Briceno MP, Castro-Rodriguez JA. 497

Discriminative properties of two predictive indices for asthma diagnosis in a 498

sample of preschoolers with recurrent wheezing. Pediatr Pulmonol 2011; 499

46:1175-81. 500

38. Austin PC, Tu JV. Automated variable selection methods for logistic 501

regression produced unstable models for predicting acute myocardial 502

infarction mortality. J Clin Epidemiol 2004; 57:1138-46. 503

39. Asher MI, Keil U, Anderson HR, Beasley R, Crane J, Martinez F, et al. 504

International Study of Asthma and Allergies in Childhood (ISAAC): rationale 505

and methods. Eur Respir J 1995; 8:483-91. 506

40. Strippoli MP, Silverman M, Michel G, Kuehni CE. A parent-completed 507

respiratory questionnaire for 1-year-old children: repeatability. Arch Dis Child 508

2007; 92:861-5. 509

41. Pellegrino R, Viegi G, Brusasco V, Crapo RO, Burgos F, Casaburi R, et al. 510

Interpretative strategies for lung function tests. Eur Respir J 2005; 26:948-68. 511

42 Galant SP, Morphew T, Amaro S, Liao O. Value of the bronchodilator 512

response in assessing controller naive asthmatic children. J Pediatr 2007; 513

151:457-62, 62 e1.43. Phelan PD, Robertson CF, Olinsky A. The 514

Melbourne Asthma Study: 1964-1999. J Allergy Clin Immunol 2002; 109:189-515

94. 516

517

518

519

520

Pescatore 24

Table I. Characteristics of the study population (N=1226) at baseline, by development of asthma 5 years later* 5 yrs later: 5 yrs later: Asthma

(n=345) No Asthma

(n=881)

n (%) n (%) p-value† Demographic and perinatal data Male 224 (64.9) 454 (51.5) <0.001 Age (years): 1 85 (24.6) 251 (28.5) 0.388

2 204 (59.1) 498 (56.5) 3 56 (16.2) 132 (15.0)

Gestational age <37 weeks 35 (10.1) 49 (5.6) 0.006 Birth weight <2500 g 41 (11.9) 68 (7.7) 0.025

Wheeze-related symptoms‡ Current wheeze 272 (78.8) 425 (48.2) <0.001 Wheeze without colds 127 (36.8) 95 (10.8) <0.001

Frequency of attacks: 0 81 (23.5) 476 (54.0) <0.001

1-3 111 (32.2) 281 (31.9)

4-12 117 (33.9) 106 (12.0) >12 36 (10.4) 18 (2.0)

Activity disturbance: no 141 (40.9) 649 (73.7) <0.001 little 129 (37.4) 185 (21.0) moderate 57 (16.5) 39 (4.4) a lot 18 (5.2) 8 (0.9)

Shortness of breath: never 129 (37.4) 668 (75.8) <0.001 sometimes 166 (48.1) 190 (21.6) always 50 (14.5) 23 (2.6)

Exercise-related wheeze/cough§ 196 (56.8) 286 (32.5) <0.001 Aeroallergen-related wheeze/cough 52 (15.1) 37 (4.2) <0.001

Other symptoms‡ Cough without colds 233 (67.5) 536 (60.8) 0.030 Duration of colds (weeks): <1 75 (21.7) 203 (23.0) 0.194

1-2 198 (57.4) 533 (60.5) >2 72 (20.9) 145 (16.5)

Nasal symptoms 186 (53.9) 350 (39.7) <0.001 Eczema (ever) 190 (55.1) 343 (38.9) <0.001

Parental history

Wheeze, asthma or bronchitis: none 142 (41.2) 499 (56.6) <0.001

father 68 (19.7) 136 (15.4) mother 85 (24.6) 182 (20.7) both 50 (14.5) 64 (7.3)

Hay fever: none 152 (44.1) 474 (53.8) 0.001 father 56 (16.2) 144 (16.3) mother 93 (27.0) 203 (23.0)

both 44 (12.8) 60 (6.8) * This table includes all predictors that were selected for the main model † Fisher's exact test ‡ During the last 12 months § Wheeze or cough with running, playing, laughing or crying 521

Pescatore 25

522

Table II. Important factors for prediction of asthma at school age in symptomatic preschool children (selected by penalized logistic regression) OR§ Regression

coefficient (RC)

Simpli-fied RC*

Order of inclusion

Main model

Tool

Demographic and perinatal data Male 1.48 0.394 1 9 Age: >1 year 1.19 0.171 1 16 Gestational age <37 weeks 1.11 0.108 18 Birthweight <2500g 1.17 0.154 17

Wheeze-related symptoms† Current wheeze 1.18 0.163 13 Wheeze without colds 1.40 0.337 1 3 Frequency of attacks: >3 1.65 0.500 2 2 Activity disturbance: any 1.28 0.243 1 4

moderate or a lot 1.16 0.144 7 a lot 1.63 0.491 1 13

Shortness of breath: sometimes or always 1.98 0.684 2 1 always 1.56 0.442 1 6

Exercise-related wheeze/cough‡ 1.26 0.233 1 5 Aeroallergen-related wheeze/cough 1.22 0.198 1 10

Other symptoms† Cough without colds 1.09 0.086 18 Duration of colds: at least 1week 0.97 -0.031 22 Nasal symptoms 1.17 0.157 12 Eczema (ever) 1.52 0.420 1 7

Parental history Wheeze, asthma or bronchitis: mother or father 1.23 0.203 1 10

both parents 1.26 0.235 1 13 Hay fever: mother or father 1.03 0.025 21

both parents 1.12 0.110 18

Number of binary predictors 22 22 13 22 Number of variables 17 17 10 17

* RC of the main model multiplied by 3 and rounded to the nearest integer (simplification approach where the number of variables was substantially reduced without relevant decrease in predictive performance) † During the last 12 months ‡ Wheeze or cough with running, playing, laughing or crying § Confidence intervals for the ORs are not provided because OR estimates result from penalized logistic regression which is primarily a method for variable selection rather than for statistical inference. Estimates are deliberately biased toward null with the benefit of reducing their variance and improving overall prediction. Confidence intervals are misleading in this context.

Pescatore 26

523 Table III. Comparison of four asthma prediction tools for preschool children 524 Leicester (present study)

(Leicestershire Respiratory Cohort Studies) Tucson (API)8* Tucson Children’s Respiratory Study

IoWBC13 Isle of Wight Birth Cohort

PIAMA9 Prevention and Incidence of Asthma and Mite Allergy

N (included in analysis) 1226 776 336 2054 Inclusion criteria Age (y) 1-3 2-3 4 1-4 Symptoms

Health care visit due to respiratory problems plus at least one of the following symptoms in the past 12 months: Wheeze, cough without colds, cough at night

Entire cohort (including a majority of children without symptoms)

Wheeze at ages 1,2 and 4 yrs

Wheeze or cough at night without colds (or both) in the past 12 months

Outcome definition Age (y) 6-8 8 10 7-8 Prediction interval (y) 4-5 5 6 3-7 Criteria

Wheeze plus asthma medication (past 12 mo)

Doctor’s diagnosis of asthma plus current wheeze, or more than 3 wheeze episodes (past 12 mo)

Current wheeze At ages 7 and 8y: Current wheeze or prescription of inhaled corticosteroids or doctor's diagnosis of asthma (past 12 mo)

Outcome prevalence 28.1 % 13.7% 37.2% 11.7% Predictor variables included in tool Male sex,

Age: >1y, wheeze without colds, frequent wheeze, activity disturbance, shortness of breath, exercise-related wheeze/cough†, aeroallergen-related wheeze/cough, eczema, parental asthma or wheeze bronchitis

Wheeze, frequent wheeze‡ , wheeze without colds, eczema, parental asthma, blood eosinophilia, allergic rhinitis

Family history of asthma, recurrent chest infections (at 2yrs), skin prick test positivity (at 4yrs), nasal symptoms (at 1yr)

Male sex, post term delivery, wheeze/dyspnea without colds, frequent wheeze, eczema, respiratory infections, inhalation medication (parents), parental education

Method used to derive tool Penalized logistic regression The combination of predictors was chosen that yielded the highest PPV and specificity

Stepwise backward logistic regression Stepwise backward logistic regression

Performance measures§ Score-cutoff: ≥5 Loose API Score-cutoff: ≥3 Score-cutoff: ≥20 Youden index36 0.43 0.32 0.38 0.36 Sensitivity (%) 72 51 53 60 Specificity (%) 71 81 85 76 PPV (%) 49 29 68 23 NPV (%) 86 91 74 94 API, Asthma Predictive Index; PPV, positive predictive value; NPV, negative predictive value. 525 * To have a prediction interval comparable to the one in our tool, we focused here on the API for prediction at 8 yrs 526 † Wheeze or cough with running, playing, laughing or crying 527 ‡ This variable is only part of the stringent API, but not of the loose API 528 § Reported for cut-off where sum of sensitivity and specificity pair was maximal. It is possible that a higher sum of sensitivity and specificity exists at a cut-off point that was not reported in the respective studies. 529

Pescatore 27

Figure legends 530

531

Fig 1. Wheeze, cough and health care visits in 1 to 3 year-old children. 532

Proportional Venn diagram for children aged 1 to 3 years, showing frequency of 533

health care visits due to wheeze or cough, current wheeze and chronic cough (cough 534

without colds or cough at night). The shaded grey represents our study population. 535

536

Fig 2. Calibration plot of main model (assessed in leave-one out cross-537

validation). Children are grouped into deciles of their predicted probability. The 538

average predicted probability for later asthma among children within each decile is 539

plotted against the actual observed frequency (prevalence) of asthma in that group. 540

As a visual aid a smoothing technique (locally-weighted polynomial regression) was 541

applied to these data. 542

The straight line represents perfect calibration. 543

544

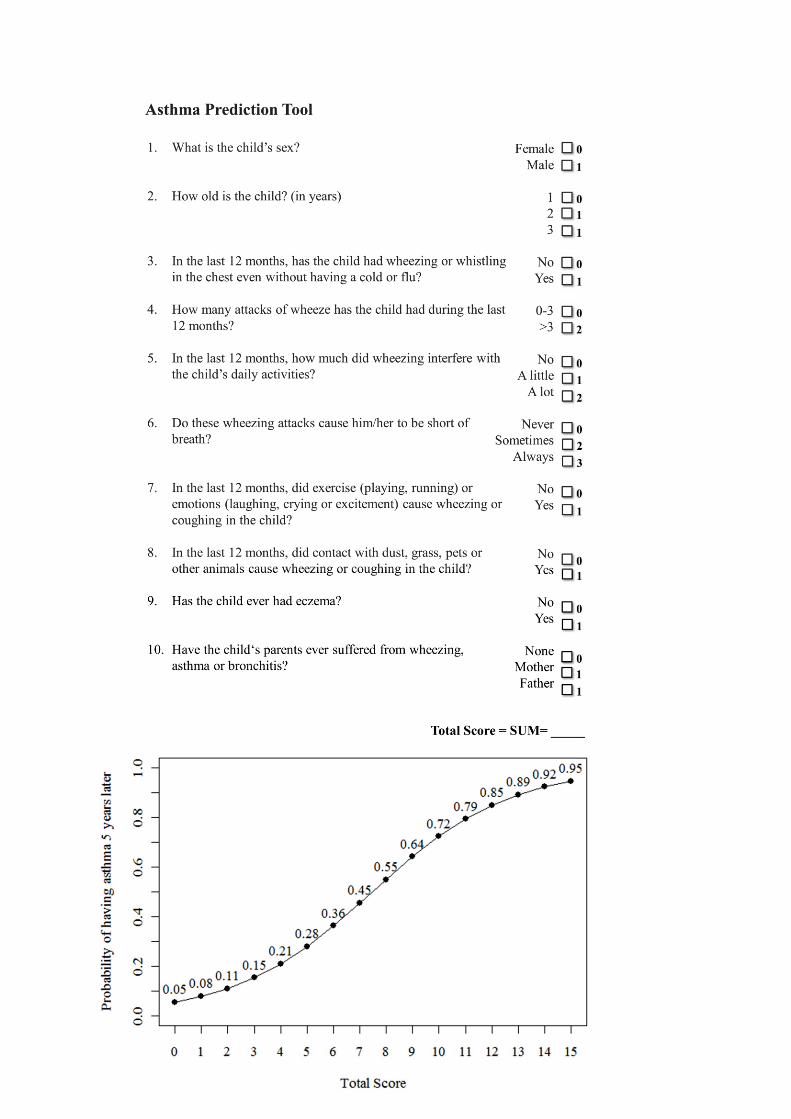
Fig 3. Asthma prediction tool. For any 1-3-year-old child seeking health care due 545

to wheeze or cough the applicable predictors are summed to a total score in the 546

upper part of the figure. The estimated probability of having asthma 5 years later is 547

given below for different total scores. 548

549

Fig 4. Receiver operating characteristic (ROC) curves for the main asthma 550

prediction model and for the prediction tool. 551

The dots represent sensitivity and specificity for different cutoff-values of the 552

prediction tool. 553

554

Pescatore 1

A simple asthma prediction tool for pre-school children with wheeze or cough 1

2

Anina M Pescatore, MSc,1 Cristian M Dogaru, MD, PhD,1 Lutz Duembgen, PhD2, 3

MSc,1 Michael Silverman, MD,3 Erol A Gaillard, MD, 3 Ben D Spycher, PhD,1* 4

Claudia E Kuehni, MD, MSc1* 5

6

1Institute of Social and Preventive Medicine (ISPM), University of Bern, Bern, 7

Switzerland; 8

2Institute of Mathematical Statistics and Actuarial Science, University of Bern, Bern, 9

Switzerland 10

3Department of Infection, Immunity & Inflammation, University of Leicester, 11

Leicester, United Kingdom 12

* Shared last authorship 13

14

15

16

17

18

19

20

21

22

23

Online Repository 24

25

Pescatore 2

Details of statistical methods 26

Development of the main prediction model 27

We used the R package glmnet to fit the penalized logistic regression. The 28

parameter alpha was set to 1 so that only a LASSO type penalty was included. This 29

tends to retain only the most influential predictors. The parameter lambda, which 30

determines the magnitude of the penalty was set to a value that maximized the area 31

under the receiver operating characteristic curve of resulting predictions in 10-fold 32

cross-validation1. All potential predictors with more than 2 response categories were 33

coded as binary variables. If the original categories were ordered, these 34

dichotomous variables represented all possible cut-off points separating lower from 35

higher categories. For instance, frequency of wheezing episodes in the past 12 36

months (0, 1-3, 4-12, >12) was coded into 3 binary variables indicating >0, >3, and 37

>12 episodes respectively. This procedure resulted in 38 binary variables entering 38

variable selection. 39

Confidence intervals for the ORs are not provided because OR estimates result from 40

penalized logistic regression which is primarily a method for variable selection rather 41

than for statistical inference. Estimates are deliberately biased toward null with the 42

benefit of reducing their variance and improving overall prediction. Confidence 43

intervals are misleading in this context. 44

Data were prepared using Stata 11.0 and analysed using R version 2.12.2. We used 45

the R package ROCR to assess discrimination and the functions hosmerlem and 46

val.prob.ci to assess calibration2. 47

48

Clinical prediction tool 49

To simplify our model to a practical tool, we considered three different approaches: 50

a) multiplying regression coefficients by factors 10, 5 and 3 and rounding them to the 51

Pescatore 3

nearest integer;20 b) setting the penalty of the LASSO-penalized logistic regression 52

so that only a few important predictors (5 or 3) were retained, and c) considering a 53

model with frequency of wheeze as the only predictor.19 All these approaches aimed 54

to reduce the number of variables while maintaining a comparable predictive 55

performance. 56

In Table E7 the performance of these tools are compared with the main model in 57

sample (sample used for model development) and by internal validation (see below). 58

In a final step, we recalibrated the probabilities for later asthma of the preferred tool 59

by re-running a logistic regression of the outcome on simplified scores. 60

61

Internal validation 62

To assess the reliability of our result of model performance within our study sample 63

(i.e. to test its repeatability within our development sample) we tested our model in 64

leave-one-out cross-validation. The first step in this technique is to omit the first of 65

total n observations and to use the remaining n-1 observations from the entire study 66

sample to develop a new model. Using this new model, the probability for later 67

asthma is estimated for the one observation left out before. In total, this procedure is 68

repeated n times, each time omitting an observation that has not previously been left 69

out. In the end, internal validity of the model is tested based on these estimated 70

probabilities. 71

Because the purpose was to test the main model’s predictive performance and not 72

how the method performs (including variable selection), we chose leave-one-out 73

cross-validation as an internal validation technique that aims to fit models which are 74

very similar to the main model. Other approaches, such as bootstrapping, would 75

result in fitting models that are less similar to the main model, and thus would have 76

Pescatore 4

tested the repeatability of the method (variable selection approach and estimation of 77

regression coefficients) rather than have validated the main model itself. 78

79

80

References 81

82

E1. Friedman J, Hastie T, Tibshirani R. Regularization Paths for Generalized Linear 83

Models via Coordinate Descent. J Stat Softw 2010; 33:1-22. 84

E2. Homepage for clinical prediction models. [Cited 2011 November 9.] Available from 85

http://survey.erasmusmc.nl/wiki/mgz-86

clinpred/doku.php?id=rcode_and_data:chapter15. 87

88

89

90

Pescatore 5

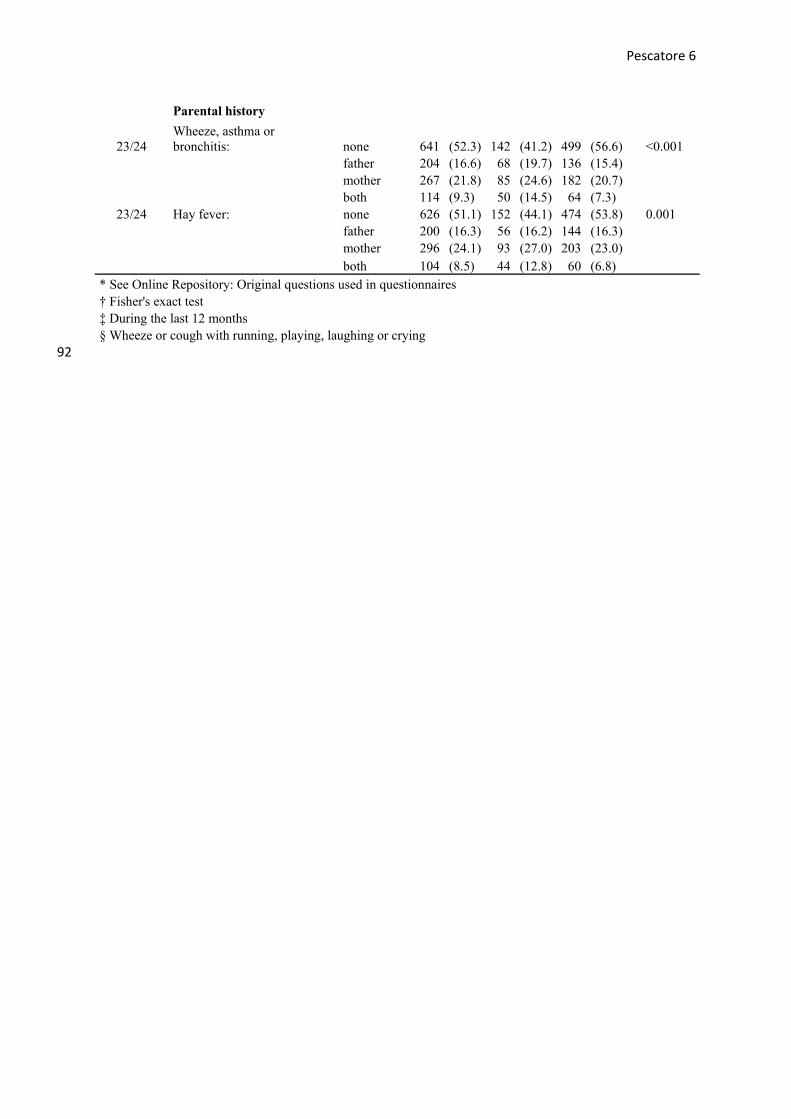
91 Table E1. Characteristics of the study population (N=1226) at baseline by development of asthma 5 years later (all potential predictors considered in the analysis)

5 yrs later: 5 yrs later: Total

study population (N=1226)

Asthma (N=345)

No Asthma (N=881)

Question number* n (%) n (%) n (%) p-value†

Demographic and perinatal data

Male 678 (55.3) 224 (64.9) 454 (51.5) <0.001 Age (years) 1 336 (27.4) 85 (24.6) 251 (28.5) 0.388

2 702 (57.3) 204 (59.1) 498 (56.5) 3 188 (15.3) 56 (16.2) 132 (15.0)

Gestational age <37 weeks 84 (6.9) 35 (10.1) 49 (5.6) 0.006 Birth weight <2500 g 109 (8.9) 41 (11.9) 68 (7.7) 0.025 South Asian ethnicity (versus white) 316 (25.8) 78 (22.6) 238 (27.0) 0.127

Wheeze-related symptoms‡ 8 Current wheeze 697 (56.9) 272 (78.8) 425 (48.2) <0.001 9 Wheeze without colds 222 (18.1) 127 (36.8) 95 (10.8) <0.001

10 Frequency of attacks: 0 557 (45.4) 81 (23.5) 476 (54.0) <0.001 1-3 392 (32.0) 111 (32.2) 281 (31.9) 4-12 223 (18.2) 117 (33.9) 106 (12.0) >12 54 (4.4) 36 (10.4) 18 (2.0)

11 Activity disturbance: no 790 (64.4) 141 (40.9) 649 (73.7) <0.001 little 314 (25.6) 129 (37.4) 185 (21.0) moderate 96 (7.8) 57 (16.5) 39 (4.4) a lot 26 (2.1) 18 (5.2) 8 (0.9)

12 Shortness of breath: never 797 (65.0) 129 (37.4) 668 (75.8) <0.001 sometimes 356 (29.0) 166 (48.1) 190 (21.6) always 73 (6.0) 50 (14.5) 23 (2.6)

13 Sleep disturbance: never 790 (64.4) 148 (42.9) 642 (72.9) <0.001 <1 269 (21.9) 122 (35.4) 147 (16.7) >=1 167 (13.6) 75 (21.7) 92 (10.4)

14 Exercise-related wheeze/cough§ 482 (39.3) 196 (56.8) 286 (32.5) <0.001 14 Aeroallergen-related wheeze/cough 89 (7.3) 52 (15.1) 37 (4.2) <0.001 14 Food-related wheeze/cough 186 (15.2) 54 (15.7) 132 (15.0) 0.791

Other symptoms‡ 15 Cough without colds 769 (62.7) 233 (67.5) 536 (60.8) 0.030 16 Cough at night 631 (51.5) 190 (55.1) 441 (50.1) 0.127 17 Frequency of colds: <4 447 (36.5) 101 (29.3) 346 (39.3) 0.001

4-6 461 (37.6) 134 (38.8) 327 (37.1) >6 318 (25.9) 110 (31.9) 208 (23.6)

18 Duration of colds (weeks): <1 278 (22.7) 75 (21.7) 203 (23.0) 0.194 1-2 731 (59.6) 198 (57.4) 533 (60.5) >2 217 (17.7) 72 (20.9) 145 (16.5)

19 Ear infection(s): 0 599 (48.9) 151 (43.8) 448 (50.9) 0.020 1 351 (28.6) 99 (28.7) 252 (28.6) >1 276 (22.5) 95 (27.5) 181 (20.5)

20 Nasal symptoms 536 (43.7) 186 (53.9) 350 (39.7) <0.001 21 Snoring 880 (71.8) 267 (77.4) 613 (69.6) 0.006 22 Eczema (ever) 533 (43.5) 190 (55.1) 343 (38.9) <0.001

Pescatore 6

Parental history

23/24 Wheeze, asthma or bronchitis: none 641 (52.3) 142 (41.2) 499 (56.6) <0.001

father 204 (16.6) 68 (19.7) 136 (15.4) mother 267 (21.8) 85 (24.6) 182 (20.7) both 114 (9.3) 50 (14.5) 64 (7.3)

23/24 Hay fever: none 626 (51.1) 152 (44.1) 474 (53.8) 0.001 father 200 (16.3) 56 (16.2) 144 (16.3) mother 296 (24.1) 93 (27.0) 203 (23.0)

both 104 (8.5) 44 (12.8) 60 (6.8) * See Online Repository: Original questions used in questionnaires † Fisher's exact test ‡ During the last 12 months § Wheeze or cough with running, playing, laughing or crying

92

Pescatore 7

Table E2. Characteristics of children at baseline, by availability of follow-up information (N=2444)

Follow-up information

available (N=1226)

Follow-up information

not available (N=1218)

n (%) n (%) p-value* Demographic and perinatal data

Male 678 (55.3) 633 (52.0) 0.105

Gestational age <37 weeks 84 (6.9) 86 (7.1) 0.874

Birth weight <2500 g 109 (8.9) 86 (7.1) 0.101

South Asian ethnicity (versus white) 316 (25.8) 386 (31.7) 0.001

Wheeze-related symptoms†

Current wheeze 697 (56.9) 762 (62.6) 0.004

Wheeze without colds 222 (18.1) 272 (22.3) 0.010

Frequency of attacks: 0 557 (45.4) 482 (39.6) 0.012

1-3 392 (32.0) 419 (34.4)

4-12 223 (18.2) 269 (22.1)

>12 54 (4.4) 48 (3.9)

Activity disturbance: no 790 (64.4) 725 (59.5) 0.044

little 314 (25.6) 371 (30.5)

moderate 96 (7.8) 91 (7.5)

a lot 26 (2.1) 31 (2.5)

Shortness of breath: never 797 (65.0) 749 (61.5) 0.193

sometimes 356 (29.0) 387 (31.8)

always 73 (6.0) 82 (6.7)

Sleep disturbance: never 790 (64.4) 728 (59.8) 0.059

<1 269 (21.9) 304 (25.0)

>=1 167 (13.6) 186 (15.3)

Exercise-related wheeze/cough‡ 482 (39.3) 531 (43.6) 0.033

Aeroallergen-related wheeze/cough 89 (7.3) 104 (8.5) 0.261

Food-related wheeze/cough 186 (15.2) 196 (16.1) 0.540

Other symptoms†

Cough without colds 769 (62.7) 798 (65.5) 0.152

Cough at night 631 (51.5) 612 (50.2) 0.571

Frequency of colds: <4 447 (36.5) 420 (34.5) 0.498

4-6 461 (37.6) 484 (39.7)

>6 318 (25.9) 314 (25.8)

Duration of colds (weeks): <1 278 (22.7) 268 (22.0) 0.897

1-2 731 (59.6) 737 (60.5)

>2 217 (17.7) 213 (17.5)

Ear infection(s): 0 599 (48.9) 613 (50.3) 0.481

1 351 (28.6) 322 (26.4)

Pescatore 8

>1 276 (22.5) 283 (23.2)

Nasal symptoms 536 (43.7) 569 (46.7) 0.143

Snoring 880 (71.8) 877 (72.0) 0.928

Eczema (ever) 533 (43.5) 548 (45.0) 0.464

Parental history

Wheeze, asthma or bronchitis: none 641 (52.3) 647 (53.1) 0.581

father 204 (16.6) 178 (14.6)

mother 267 (21.8) 276 (22.7)

both 114 (9.3) 117 (9.6)

Hay fever: none 626 (51.1) 646 (53.0) 0.702

father 200 (16.3) 199 (16.3)

mother 296 (24.1) 271 (22.2)

both 104 (8.5) 102 (8.4)

* Fisher's exact test

† During the last 12 months

‡ Wheeze or cough with running, playing, laughing or crying 93

Pescatore 9

94

Table E3. Sensitivity analysis I: Testing performance of main asthma prediction model in alternative study populations

Baseline criteria Outcome definition

1-3 year-olds 5 yrs later

Study population Hea

lth

care

vis

it a

nd a

ny w

heez

e or

chr

onic

cou

gh

Hea

lth

care

vis

it a

nd a

ny w

heez

e

Any

whe

eze

Any

whe

eze

and

asth

ma

med

icat

ion

Any

whe

eze

and

ever

doc

tor-

diag

nose

d as

thm

a

>4

epis

odes

of

whe

eze

and

inha

led

cort

icos

tero

ids

N n (%) Brier (scaled) AUC*Total Outcome

P0 (used for main model) 1226 345 (28.1) 0.23 0.78 P1 769 285 (37.1) 0.21 0.77 P2 697 272 (39.0) 0.22 0.77 P3 1239 331 (26.7) 0.25 0.80 P4 1053 71 (6.7) -0.51† 0.87 Baseline and outcome criteria refer to the past 12 months, if not otherwise stated *Area under receiver operating characteristic curve † The negative scaled Brier score is due to the large difference in the prevalence of the outcome in P0 and P4. A simple recalibration without changing the score would lead to a scaled Brier score of 0.24

Pescatore 10

95 96 Table E4. Sensitivity analysis II: Testing performance of newly developed asthma prediction models based on alternative study populations

Baseline criteria Outcome definition 1-3 year-olds 5 yrs later

Study population Hea

lth

care

vis

it a

nd a

ny w

heez

e or

chr

onic

cou

gh

Hea

lth

care

vis

it a

nd a

ny w

heez

e

Any

whe

eze

Any

whe

eze

and

asth

ma

med

icat

ion

Any

whe

eze

and

ever

doc

tor-

diag

nose

d as

thm

a

>4

epis

odes

of

whe

eze

and

inha

led

cort

icos

tero

ids

No. of binary predictors in

the model N n (%) Brier (scaled) AUC*Total Outcome

P0 (used for main model) 22 1226 345 (28.1) 0.23 0.78 P1 25 769 285 (37.1) 0.22 0.77 P2 23 697 272 (39.0) 0.23 0.78 P3 26 1239 331 (26.7) 0.26 0.81 P4 20 1053 71 (6.7) 0.28 0.89 Baseline and outcome criteria refer to the past 12 months, if not otherwise stated *Area under receiver operating characteristic curve

Pescatore 11

97

TABLE E5. Selected predictors in sensitivity analysis II and corresponding ORs

Main model* New models

(alternative populations)

P1† P2‡ P3§ P4ǁ Odds Ratio

(OR) OR OR OR OR Demographic and perinatal data Male 1.48 1.43 1.49 1.68 1.00 Age (years) ≥2 1.19 1.53 1.51 1.28 1.00

3 1.00 1.00 1.01 1.06 0.95 Gestational age <37 weeks 1.11 1.13 1.00 1.16 1.00 Birth weight <2500 g 1.17 1.18 1.28 1.34 1.00 South Asian ethnicity (versus white) 1.00 1.00 1.00 1.00 0.53

Wheeze-related symptoms¶ Current wheeze 1.18 1.00 1.00 1.59 1.46 Wheeze without colds 1.40 1.55 1.45 1.42 2.11 Frequency of attacks ≥1 1.00 1.00 1.00 1.05 1.00

>3 1.65 1.53 1.60 1.37 1.16 >12 1.00 1.00 1.00 1.00 2.10

Activity disturbance any 1.28 1.30 1.25 1.28 1.49 moderate or a lot 1.16 1.31 1.17 1.14 1.00 a lot 1.63 1.94 1.87 1.81 2.18

Shortness of breath sometimes or always 1.98 1.90 1.91 1.84 2.06 always 1.56 1.40 1.41 2.10 2.70

Sleep disturbance ≥1/week 1.00 1.00 1.00 1.10 1.00 >1/week 1.00 1.00 1.00 1.00 1.20

Exercise-related wheeze/cough** 1.26 1.09 1.15 1.40 1.27 Aeroallergen-related wheeze/cough 1.22 1.05 1.04 1.33 1.00 Food-related wheeze/cough 1.00 1.03 1.02 0.97 1.00

Other symptoms¶ Cough without colds 1.09 1.10 1.07 1.16 1.37 Cough at night 1.00 1.12 1.13 1.06 1.00 Frequency of colds >3 1.00 1.00 1.00 1.00 1.06

>6 1.00 0.97 1.00 1.00 1.00 Duration of colds (weeks) ≥1 0.97 0.89 0.90 0.80 1.00

>2 1.00 1.00 1.00 1.00 1.00 Ear infection(s) ≥1 1.00 1.13 1.00 1.00 1.00

>1 1.00 1.00 1.00 1.00 1.00 Nasal symptoms 1.17 1.14 1.13 1.18 1.14 Snoring 1.00 1.00 1.00 1.00 1.00 Eczema (ever) 1.52 1.42 1.50 1.39 1.62

Parental history Wheeze or bronchitis mother or father 1.23 1.14 1.06 1.45 1.07

mother or both 1.00 1.00 1.00 1.00 1.00 both parents 1.26 1.57 1.36 1.39 2.02

Hay fever mother or father 1.03 1.00 1.00 1.00 1.09 mother or both 1.00 1.05 1.01 1.00 1.00

Pescatore 12

both parents 1.12 1.28 1.37 1.41 1.34 Baseline and outcome criteria refer to the past 12 months, if not otherwise stated * Inclusion criteria: 1-3 year-olds with health care visit plus either wheeze or cough without colds or cough at night; Outcome: Wheeze plus asthma medication at age 6-8 yrs † Inclusion criterion: 1-3 year-olds with wheeze; Outcome: same as in main model ‡ Inclusion criteria: 1-3 year-olds with health care visit plus wheeze; Outcome: same as in main model § Inclusion criteria: same as in main model; Outcome: Current wheeze plus doctor's diagnosis of asthma (ever) at age 6-8 yrs

ǁInclusion criteria: same as in main model; Outcome: >4 episodes of wheeze and using inhaled corticosteroids

¶ During the last 12 months

**Wheeze or cough with running, playing, laughing or crying 98 99 100

Pescatore 13

101

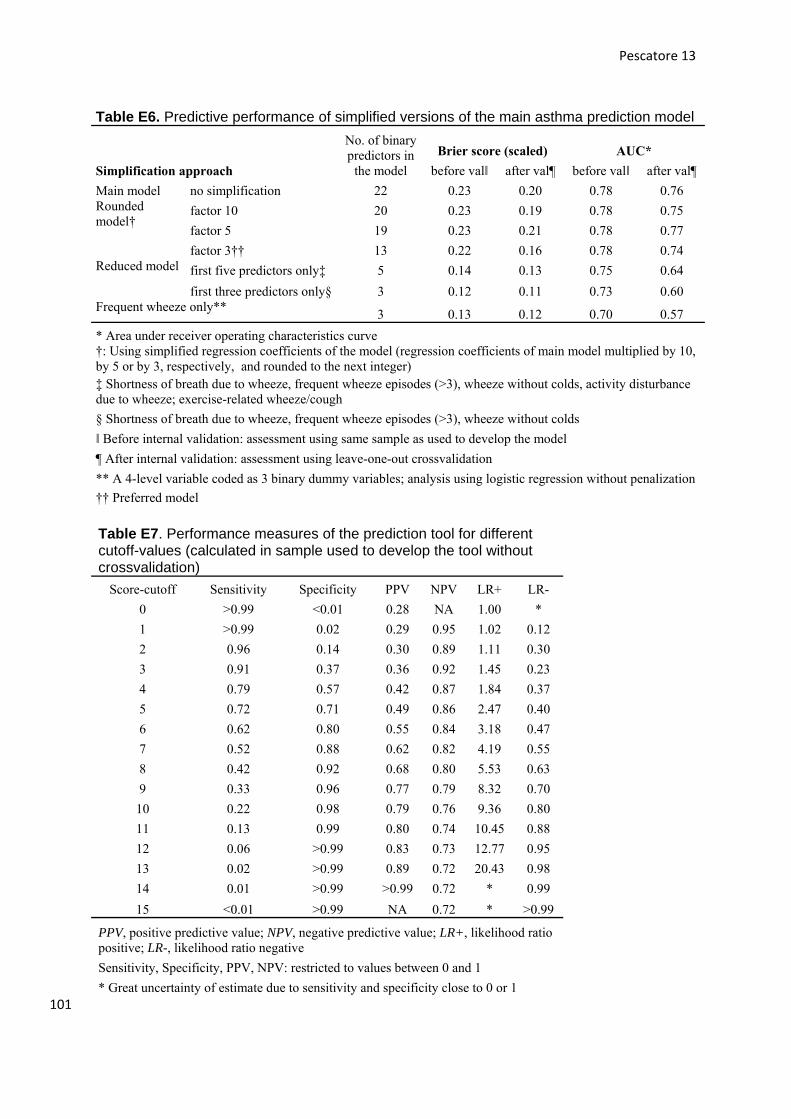
Table E6. Predictive performance of simplified versions of the main asthma prediction model

No. of binary predictors in

the model

Brier score (scaled) AUC*

Simplification approach before valǁ after val¶ before valǁ after val¶

Main model no simplification 22 0.23 0.20 0.78 0.76 Rounded model†

factor 10 20 0.23 0.19 0.78 0.75

factor 5 19 0.23 0.21 0.78 0.77

factor 3†† 13 0.22 0.16 0.78 0.74 Reduced model first five predictors only‡ 5 0.14 0.13 0.75 0.64

first three predictors only§ 3 0.12 0.11 0.73 0.60 Frequent wheeze only**

3 0.13 0.12 0.70 0.57

* Area under receiver operating characteristics curve †: Using simplified regression coefficients of the model (regression coefficients of main model multiplied by 10, by 5 or by 3, respectively, and rounded to the next integer) ‡ Shortness of breath due to wheeze, frequent wheeze episodes (>3), wheeze without colds, activity disturbance due to wheeze; exercise-related wheeze/cough

§ Shortness of breath due to wheeze, frequent wheeze episodes (>3), wheeze without colds

ǁ Before internal validation: assessment using same sample as used to develop the model

¶ After internal validation: assessment using leave-one-out crossvalidation

** A 4-level variable coded as 3 binary dummy variables; analysis using logistic regression without penalization

†† Preferred model

Table E7. Performance measures of the prediction tool for different cutoff-values (calculated in sample used to develop the tool without crossvalidation)

Score-cutoff Sensitivity Specificity PPV NPV LR+ LR-

0 >0.99 <0.01 0.28 NA 1.00 *

1 >0.99 0.02 0.29 0.95 1.02 0.12

2 0.96 0.14 0.30 0.89 1.11 0.30

3 0.91 0.37 0.36 0.92 1.45 0.23

4 0.79 0.57 0.42 0.87 1.84 0.37

5 0.72 0.71 0.49 0.86 2.47 0.40

6 0.62 0.80 0.55 0.84 3.18 0.47

7 0.52 0.88 0.62 0.82 4.19 0.55

8 0.42 0.92 0.68 0.80 5.53 0.63

9 0.33 0.96 0.77 0.79 8.32 0.70

10 0.22 0.98 0.79 0.76 9.36 0.80

11 0.13 0.99 0.80 0.74 10.45 0.88

12 0.06 >0.99 0.83 0.73 12.77 0.95

13 0.02 >0.99 0.89 0.72 20.43 0.98

14 0.01 >0.99 >0.99 0.72 * 0.99

15 <0.01 >0.99 NA 0.72 * >0.99

PPV, positive predictive value; NPV, negative predictive value; LR+, likelihood ratio positive; LR-, likelihood ratio negative

Sensitivity, Specificity, PPV, NPV: restricted to values between 0 and 1

* Great uncertainty of estimate due to sensitivity and specificity close to 0 or 1

Pescatore 14

102 Table E8. Comparison of percentage change in FEV1 and MEF50 after bronchodilator administration by questionnaire-based outcome definitions assessed at the same time Outcome criteria Any asthma

(current wheeze and asthma medication) Moderately severe asthma

(>4 episodes of wheeze in the past 12 months and inhaled corticosteroids)

Fulfilling outcome criteria

Yes No Yes No

NFEV1 111 340 30 389 Mean % change in FEV1 after bronchodilator administration

5.46 95%CI=[3.58,7.34]

2.59 95%CI=[1.96,3.21]

9.10 95%CI=[3.74,14.45]

2.76 95%CI=[2.15,3.38]

NMEF50 109 334 29 382 Mean % change in MEF50 after bronchodilator administration

16.66 95%CI=[12.80,20.53]

10.65 95%CI=[8.75,12.54]

18.60 95%CI=[9.75,27.46]

11.21 95%CI=[9.39,13.03]

FEV1,Forced expiratory volume in the 1st second; MEF50, maximal expiratory flow at 50% of vital capacity 103 t-tests: any asthma: pFEV1=<0.001; pMEF50=0.003; moderately severe asthma: pFEV1<0.001; pMEF50=0.039; 104 105 106 107 108 109 110 111 112 113 114 115 116 Figure legends 117 118 119 Fig E1. Original questions used to define inclusion criteria at baseline 120

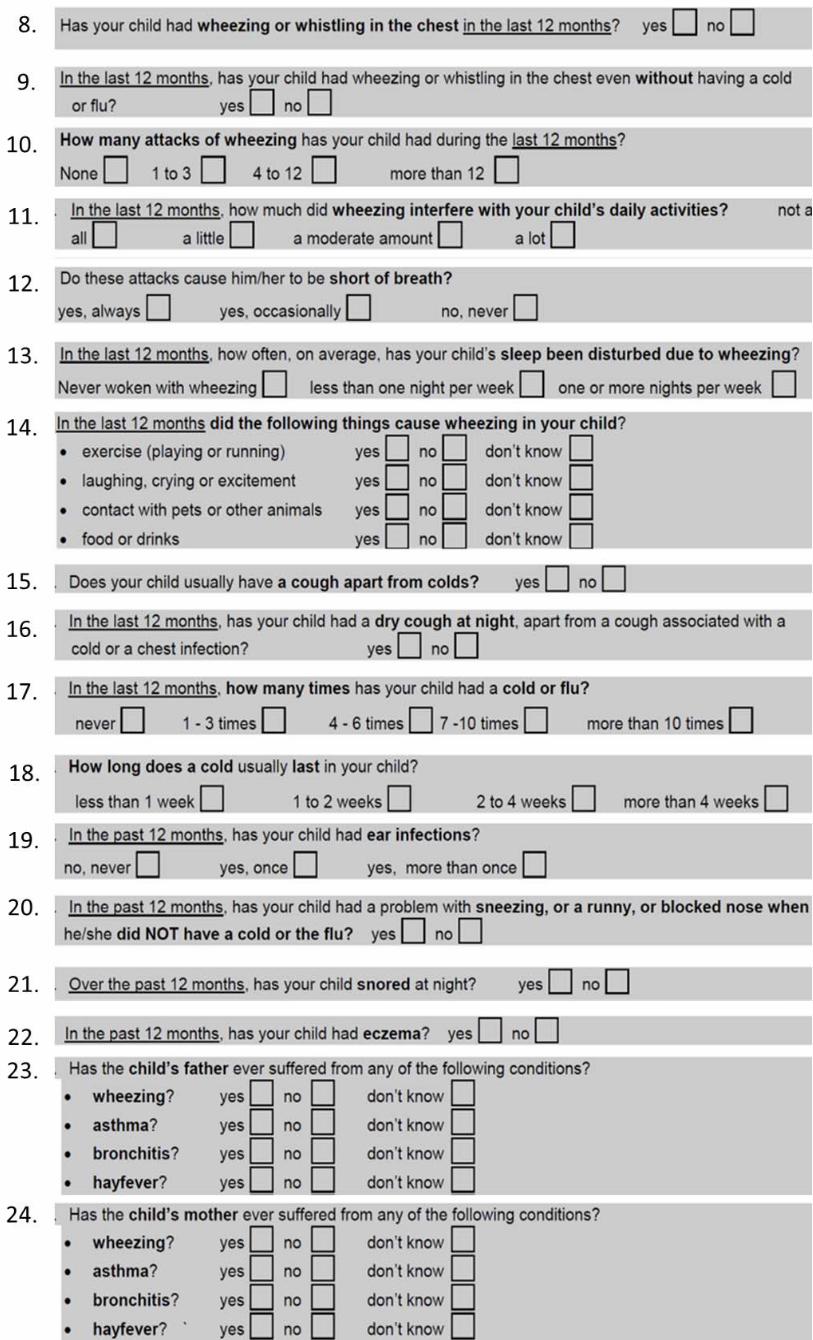
Fig E2. Original questions used to assess outcome at follow-up 121

Fig E3. Original questions used as potential predictive factors 122 123

No wheeze, no cough, no related health care

visitsChroniccough

Currentwheeze

Health carevisits

1089 (18.5%)522 (8.9%)

47(0.8%)

484 (8.2%)1739 (29.6%)

985 (16.8%)

937 (15.9%)

75 (1.3%)

0.0 0.2 0.4 0.6 0.8 1.0

0.0

0.2

0.4

0.6

0.8

1.0

Predicted probability

Obs

erve

d fr

eque

ncy

IdealNon-parametric fitDeciles

10

1-Specificity

Sens

itivi

ty

0.0 0.2 0.4 0.6 0.8 1.0

0.0

0.2

0.4

0.6

0.8

1.0

45

6

7

8

9

10

1112

Main modelPrediction tool


Recommended