44
Innovating Together An introduction to measuring and simulating Vital Signs

Innovating Together
An introduction tomeasuringandsimulating
Vital Signs

rigelmedical.com Innovating Together
We’ve picked your brains to develop theworld’s most advanced vital signs simulator.Your ideas have had us thinking. Some of you wondered why thefunctions of an ECG patient simulator, NIBP and SPO2 simulatorcouldn’t be combined into one compact tester?So we put our heads together and used our unrivalled expertiseto create the hand-held Rigel UNI-SIM. To see the result, or tocontribute your own ideas, call us on 813-886-2775,email us at [email protected] or visit rigelmedical.com
1
Contents
Foreword 2
1 Introduction 2
1.1 Visual inspection 3
1.2 Who should verify the correct operation? 3
2 Physiology of the Respiratory System 4
3 Blood Pressure 5
3.1 Measuring blood pressure 6
3.2 Testing your NIBP monitor 7
3.3 Test setup 7
3.3.1 System pressure leak test: 7
3.3.2 System overpressure valve test 8
3.3.3 Static pressure or linearity test 9
3.3.4 Dynamic pressure 9
3.4 Considerations 9
4 Invasive Blood Pressure 11
4.1 Testing IBP function 11
4.2 Test setup 11
4.2.1 Static pressure or linearity test 12
(verify alarm testing)
4.2.2 Dynamic pressure 12
5 Pulse Oxymetry 13
5.1 Artifacts 14
5.2 Testing your SPO2 monitor – 15
pulse oximeter
5.3 Test setup 16
5.3.1 Testing monitor accuracy 16
5.3.2 Alarms and time response test 17
5.3.3 Sensitivity test 17
5.3.4 Testing the SPO2 probe 17
6 Electrocardiographs (ECG) 18
6.1 Einthoven Triangle 19
6.2 Precordial leads 20
6.3 Unipolar vs. bipolar leads 21
6.4 Color coding 21
6.5 The ECG machine 22
6.6 Testing ECG monitor 22
6.6.1 Linearity of heart rate measurement 23
6.6.2 QRS beep 23
6.6.3 Alarms (high and low) 23
6.6.4 Arrhythmias recognition (Asystolic) 23
6.6.5 Sensitivity test (Gain) 23
6.6.6 Zero offset 23
6.6.7 Frequency response 24
6.6.8 Printer calibration (amplitude, timing) 24
7 Respiration 24
7.1 Testing respiration function 26
7.1.1 Linearity of respiration measurement 26
7.1.2 Sleep apnea 26
7.1.3 Testing apnea alarms 26
8 Temperature 27
8.1 Testing temperature function 27
on multiparametric monitors
8.1.1 Linearity of temperature measurement 27
8.1.2 Testing temperature alarms 28
9 Record Keeping 28
Conclusion 29
Considerations and Recommendations: 29
Appendix A 30
IEC 60601-1 collateral standards
Appendix B 31
IEC 60601-2 particular standards
Appendix C 34
YSI 400 & 700 resistance reference table
Appendix D 35
Example documentation template
Innova t ing Togethe r

Introduction
For decades, considerable work has beencarried out across many industries; to reduce therisk of injury and occupational death to membersof the general public. In addition, to aid theprocess of treating members of the generalpublic, the health sector has evolved, offering anever increasing portfolio of treatments,monitoring and diagnostic tools.
Risks due to injuries or fatalities during medicaltreatment or examination are reduced throughthe introduction of industry practises (i.e.disinfection), guidelines (i.e. best practise),standards (i.e. design criteria, quality processes)and regulations (i.e. mandatory criteria).
To ensure the safety of patients, operators andthe members of public, all medical electronicdevices must meet the design criteria of theinternationally published IEC 60601 standard (or
local equivalent where applicable). Firstpublished in the 1970’s, the IEC 60601 standard(then referred to as IEC 601) describes thedesign criteria of medical electronic equipment(ME Equipment) in areas such as:
Electrical safety Functional accuracy Mechanical safety Radiation safety Operator safety and errors (labelling,
unambiguous instructions) Safety of software Risk assessment and preventative actions
IEC 60601-1-X (X representing a specificstandard number between 1 - 12) is the primarystandard and has eleven (sub) standards directlyrelating to the safety of medical equipment. IEC60601-2-X (X representing a specific standardnumber between 1—65). This part of the standardis specific to various types of medical equipment
2
Foreword
This booklet is written as a guideline for people involved in testing medical, electrical equipment. Allreasonable care has been taken to ensure that the information, reference figures and data are accurateand have been taken from the latest versions of various standards, guidance notes and recognized“best practises” to establish the recommended testing requirements. Rigel Medical, their agents anddistributors, accept no responsibility for any error or omissions within this booklet or for any misinter-pretations by the user. For clarification on any part of this booklet please contact Rigel Medical beforeoperating any test instrument.
No part of this publication shall be deemed to form, or be part of any contract for training or equipmentunless specifically referred to as an inclusion within such contract.
Rigel Medical assumes that the readers of this booklet are electronically and technically competent andtherefore does not accept any liability arising form accidents or fatalities directly or indirectly from thetests described in this booklet.
3
rigelmedical.com
and provides additional information to the fourbasic standards.Appendix A and B provide an overview of the IEC60601-1-X and IEC 60601-2-X standards.
This booklet describes the common aspects ofvital signs monitoring and performance testing ofthose vital signs.
The main vital signs described are:
Blood pressure(Invasive or non invasive methods)
Temperature Electro cardiogram (ECG ) Respiration Blood oxygen saturation (SpO2)
To ensure the correct treatment, diagnoses ormonitoring of patients, it is of critical importancethat the vital signs monitor is able to provideaccurate data across all available vital signs. Suchaccuracy is verified on a regular basis, based onrisk assessment, manufacturer recommendationsand stages of the monitor’s life cycle.
Performances tests (also referred to as quality orfunctional tests) are typically executed usingcalibrated simulators across a number ofapplications and are all part of an acceptancetest, preventative maintenance cycle or repair.
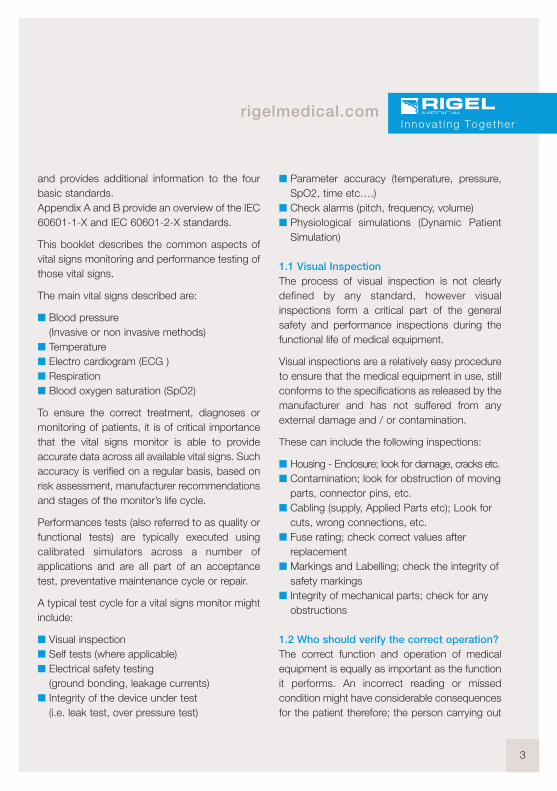
A typical test cycle for a vital signs monitor mightinclude:
Visual inspection Self tests (where applicable) Electrical safety testing
(ground bonding, leakage currents) Integrity of the device under test
(i.e. leak test, over pressure test)
Parameter accuracy (temperature, pressure,SpO2, time etc….)
Check alarms (pitch, frequency, volume) Physiological simulations (Dynamic Patient
Simulation)
1.1 Visual InspectionThe process of visual inspection is not clearlydefined by any standard, however visualinspections form a critical part of the generalsafety and performance inspections during thefunctional life of medical equipment.
Visual inspections are a relatively easy procedureto ensure that the medical equipment in use, stillconforms to the specifications as released by themanufacturer and has not suffered from anyexternal damage and / or contamination.
These can include the following inspections:
Housing - Enclosure; look for damage, cracks etc. Contamination; look for obstruction of moving
parts, connector pins, etc. Cabling (supply, Applied Parts etc); Look for
cuts, wrong connections, etc. Fuse rating; check correct values after
replacement Markings and Labelling; check the integrity of
safety markings Integrity of mechanical parts; check for any
obstructions
1.2 Who should verify the correct operation?The correct function and operation of medicalequipment is equally as important as the functionit performs. An incorrect reading or missedcondition might have considerable consequencesfor the patient therefore; the person carrying out
Innova t ing Togethe r

the maintenance must be technically competent,appropriately trained and aware of the variousparameters being verified.
It is the responsibility of the medical equipmentmanufacturer to provide verification proceduresto ensure optimum performance is beingachieved. The person or organization carryingout the maintenance must make themselvesaware of the required procedures and operationof the medical equipment. When in doubt,contact the manufacturer.
2 Physiology of the respiratory system
All vital signs are related to the operation andfunctioning of the respiratory system. While theElectro Cardiogram (see chapter 6) shows theelectrical activity of the human heart pumping theoxygenated blood (see chapter 5) around thearteries, blood pressure (see chapter 3 & 4) isgenerated. Respiration (see chapter 7) ratesmight show any obstruction (apnea) in theairways thus affecting the oxygen absorption inthe lungs. The core body temperature, togetherwith blood pressure being the most commonlymeasured vital signs, is maintained through goodblood circulation (see chapter 8).
The human heart is central to the respiratorysystem and can be seen as the main enginewithin. The heart circulates blood through thebody and lungs (the carburetor of the bodyattaching oxygen to the hemoglobin protein inthe red blood cells) in order to ensure oxygen isable to reach the (brain) tissues and organs inorder to sustain life.
Figure 1: A simplified representation of thecirculatory system
To establish a single circulation cycle, blood flowsthrough the heart twice, passing through the leftand right side of the heart respectively. Acting astwo “pumps”, the heart circulates oxygenatedblood (red circuit, systemic circulation) from thelungs through the left side of the heart, whiledeoxygenated blood from the tissues flowsthrough the right side of the heart to the lungs inorder to re-oxygenate the blood cells (bluecircuit, pulmonary circulation).
The two ventricles (chambers) provide the bloodfrom the heart while blood is entering the heart inthe two atria (chambers). Valves in and betweenthe different chambers ensure the chambers canfill up with blood during the diastolic phase (theheart muscle relaxes) and pressures can build-upin the ventricles to provide the required conditionto allow circulation from a high pressure (systolic
4

5
rigelmedical.com
phase) to the lower pressure areas. A completecycle of events is referred to as the cardiac cycle,a single heart beat and involves;
1. Atrial systole,2. Ventricular systole and3. Complete cardiac diastole.
Cardiac muscles are electrically stimulated and thecardiac cycle is triggered by Sinoatrial Node (S.A.Node), then synchronized through timing (delays)(Atrioventricular A.V. Node and bundle of His) whichensures coordinated contraction and relaxation ofthe different heart muscles to allow the individualchambers to fill-up and empty. While the heart isself-exciting and able to maintain it’s own pace (S.A.Node), the heart rate can be altered duetometabolic demands (e.g. exercise, emotion,anxiety).
During the cardiac diastolic phase, the heartrelaxes and blood is able to fill the two atria. As theatria fill up to around 70%, the pressure in the atriareleases the valves to the ventricles (tricuspid andmitral valve). The remaining 30% of blood volumein the atria is pumped out as the atria contract(atrial systole) at the start of the heart beat. Theventricles contract (ventricle systole) resulting inthe blood flowing out of the heart through the mainheart valves (aortic and pulmonary valves) into thepulmonary and systemic circulation.
The number of circulations per minute (or beats perminute) can vary due to age, as a result of exercise,hormone levels (ie caused by anxiety or stress) andphysical condition (related to cardiac output).
The greater the need for oxygen by the body, thegreater the need for oxyhemoglobin. A humanheart has a certain capacity to circulate blood(cardiac output) therefore; oneway to increase
blood supply is to increase heart rate. In general;
The smaller the cardiac output, the higher theheart rate.
The greater the cardiac output, the lower theheart rate.
This is evident in infants and children, having arelatively small cardiac output, thus higher heartrate. Their resting heart rate can be between100—150 bpm. In comparison, a trained athlete hasbeen able to increase their cardiac output throughbuild up of exercise. The resting heart rate can beas low as 40 bpm or even lower. Cardiac output isnot classed as a vital sign and therefore notconsidered further in this booklet.
3 Blood pressure
The most common vital sign parameter beingmonitored or measured is the (arterial) bloodpressure. During the cardiac cycle, the ventriclescontract (systole) and the blood pressure is at itshighest (systolic) and during complete cardiacdiastole, the blood pressure is at its lowest(diastolic) which enables the blood to circulatethrough the body through the systemic andpulmonary circulation. The blood flow and pressurechange with each stage of the cardiac cycle and arereported in millimeters of mercury (mmHg).
This is represented in figure 2.
In a healthy patient, the average values for thedifferent pressure variations are:
Systolic pressure 120 mmHg Diastolic pressure 80 mmHg Mean arterial pressure 90—93 mmHg
Innova t ing Togethe r

Figure 2: ECG waveform vs aortic pressureand plethymograph
It is not uncommon to have deviations from thesevalues which can be the result of for example;emotions, anxiety, drug-use, cardiac conditions,life style, fitness, age and diet.
Hypotension Blood pressure beingabnormally lowerthan average
Hypertension Blood pressure beingabnormally higherthan average
3.1 Measuring blood pressureBlood pressure can be measured bothnoninvasively (NIBP) and invasively (IBP) and isassociated with the pressure in the arterial bloodvessels. While the invasive method (see 4) ismore accurate, the non-invasive method (NIBP)is the most common. While invasive proceduresrequire highly skilled people, the non-invasivemethod is relatively simple and can be done byboth skilled and unskilled people. NIBP monitors
range from domestic use to comprehensive multiparameter monitors used in healthcare facilities.
The principles of measuring NIBP can vary from:
Palpation method (feeling) — an indication ofthe minimum (systolic) blood pressure obtainedthrough the touch/feel sensation at determinedpositions (radial, femoral, carotid) of the body.Palpation is often used in emergency and traumacases where rapid detection of a present bloodpressure is required or rapid loss of blood pressureis expected.
Auscultatory method (listening) – as blood flowis interrupted (blocked by external cuff) and released(deflation of the cuff), sounds can be associated withthe systolic and diastolic pressures. When a cuff ispositioned around the upper arm and inflated to thepoint the artery is blocked (no blood flow), the cuff isthen deflated. The pressure at which blood flowregains is the systolic pressure and is accompaniedby a specific beating sound (referred to as firstkorotkoff sound) caused by turbulent blood flow inthe artery. The pressure at which the sound stops(fifth korotkoff sound) is referred to as the diastolicpressure. Observation is done by listening through astethoscope (or can be automated throughmicrophone electronic pick-up), positioned directlyon the elbow artery and the use of a calibratedmanometer. (The mean arterial pressure iscalculated from the systolic and diastolic pressures.There is no agreed standard but the formula belowis often referred to:
Mean BP = 1⁄3* (systolic + 2 x diastolic)
Oscillometric method (measuring) – Unlikethe auscultatory method, the oscillometric methodmeasures the mean arterial pressure and calculates
6
SPO2
Ventricular pressure
Aortic pressureSystolic pressureSystolic pressure
Diastolic pressure
Dicrotic notch
Q S
P T
R
Q S
P T
R
7
rigelmedical.com
the systolic and diastolic pressures from pressurevariations in the cuff when inflated (blocking theblood flow) and then deflated (blood flow regains).While the auscultatory method often relies onhuman interpretation (listening), the oscillometricmethod is done through automation and the use ofelectronic pressure sensors. Due to the use ofelectronic pressure transducers, regular calibrationsare required and often advised by the manufacturer.
3.2 Testing your NIBP monitorAs explained above, oscillometric NIBP monitorsrequire regular performance verifications toensure the correct operation. Common issuesrelating to the accuracy of the NIBP monitor are:
A leak in the cuff or pressure system,resulting in a lower blood pressure reading.
Acoustic variance of the cuff due to incorrectcuff volume, variety in materials used andpositioning or applying cuff on patient.
Incorrect operation of the overpressure valvecaused by a leak or complete malfunction.
Deviation in accuracy of the electronicpressure transducer caused by wear and tearof electronic components.
Changes in atmospheric pressure includingpressure variations caused by closingdoors/windows.
A number of tests are provided to determine thecorrect operation of the NIBP monitors. Theseare:
Pressure leak test (see 3.3.1) Over pressure valve test (see 3.3.2) Static pressure & linearity test (see 3.3.3) Dynamic pressure (see 3.3.4)
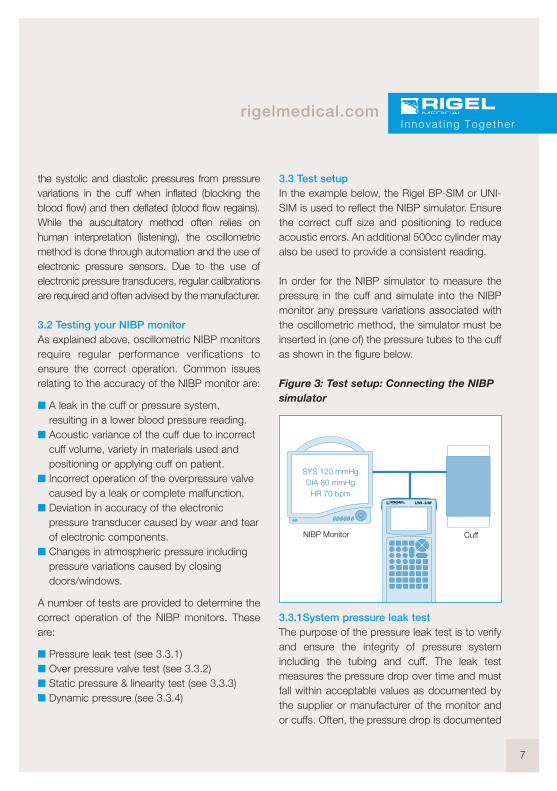
3.3 Test setupIn the example below, the Rigel BP-SIM or UNI-SIM is used to reflect the NIBP simulator. Ensurethe correct cuff size and positioning to reduceacoustic errors. An additional 500cc cylinder mayalso be used to provide a consistent reading.
In order for the NIBP simulator to measure thepressure in the cuff and simulate into the NIBPmonitor any pressure variations associated withthe oscillometric method, the simulator must beinserted in (one of) the pressure tubes to the cuffas shown in the figure below.
Figure 3: Test setup: Connecting the NIBPsimulator
3.3.1System pressure leak testThe purpose of the pressure leak test is to verifyand ensure the integrity of pressure systemincluding the tubing and cuff. The leak testmeasures the pressure drop over time and mustfall within acceptable values as documented bythe supplier or manufacturer of the monitor andor cuffs. Often, the pressure drop is documented
Innova t ing Togethe r
SYS 120 mmHgDIA 80 mmHgHR 70 bpm
UNI-SiM
NIBP Monitor Cuff

as mmHg / min from a certain start pressure e.g.200 mmHg. Refer to the service or maintenanceinstructions provided with the monitor as it mayhave to be set in service or calibration mode.
For example: a manufacturer could specify asystem leak test for a duration of three minuteswhere the expected total pressure drop must notexceed 15 mmHg. This is equal to 5 mmHg perminute.
Some NIBP simulators like the Rigel UNI-SIMhave a built-in pump to generate the requiredpressure levels. Inflate the pressure into thesystem and monitor the pressure drop and time.Figure 4 shows a sample screenshot from theRigel UNI-SIM while performing the leak test.
Figure 4: NIBP leak test on the Rigel UNI-SIM
Once the selected pressure is stabilized, thetimer starts and the UNI-SIM will show real-timesystem pressure over time.
3.3.2 System overpressure valve testWhen dealing with pressure systems, it isimportant to ensure the system is able to ventwhen pressures reach a value exceeding thesafety of the patient or operator and the correctfunctioning of the monitor itself.
The purpose of the overpressure test is todetermine whether the internal safety valve(s) arefunctioning correctly and release the internalpressure when it reaches the maximum allowablesystem pressure set by the monitor’smanufacturer. Refer to the service or maintenanceinstructions provided with the monitor as it mayhave to be set in service or calibration mode.
For example: a manufacturer could specify theset-point of 300 mmHg as the maximumallowable system pressure for an adult settingand 150 mmHg for a pediatric setting (+/-10%).
Some NIBP simulators like the Rigel UNI-SIMhave a built-in pump to generate the requiredpressure levels. Inflate the pressure into thesystem until the monitor releases theoverpressure valve, resulting in an almostinstantaneous pressure drop. The inclusion of theoriginal cuff or air reservoir of 500cc during thistest is advised to provide consistency with thenormal operation of the monitor. Figure 5 showsan example screen shot from the Rigel UNI-SIMdisplaying the set-point at which the pressuredrop (valve release) occurred.
Figure 5: NIBP pop-off test on the Rigel UNI-SIM
8

9
rigelmedical.com
In the example above, the test demonstrates thatthe valve was released at 331 mmHg.
3.3.3 Static pressure or linearity test
The static pressure tests are useful for verifyingthe performance of the pressure transducer andverifying the integrity of tubing systems internal,external and cuff). In addition, the static pressuretest can be used to test the accuracy over arange of pressures. Refer to the service ormaintenance instructions provided with themonitor as it may have to be set in service orcalibration mode.
For example: A manufacturer could ask to performa linearity test on the following static pressures:250mmHg, 200mmHg, 150mmHg, 100mmHg,50mmHg and 0mmHg. The reading valuesshould be at +/-3mmHg from expected value.
Some NIBP simulators like the Rigel UNI-SIM havea built-in pump to generate the required pressurelevels. Inflate the pressure into the system (monitorwith or without the cuff) and compare the readingfrom the monitor with that of the calibratedmanometer (UNI-SIM). The inclusion of the originalcuff or air reservoir of 500cc during this test isadvised to provide consistency with the normaloperation of the monitor.
3.3.4 Dynamic pressureStatic testing is useful for verifying theperformance of the pressure transducer but itdoes not prove the accuracy of the monitor underdynamic pressures. The performances of thecomputing algorithms that enable calculation ofsystolic, diastolic and mean blood pressures aretested in real conditions.
Figure 6: Dynamic pressure simulationsettings on the Rigel UNI-SIM
Patient simulations — It maybe necessary toperform verifications using different patientsettings for example; a low (hypotension), normaland high (hypertension) blood pressure;
Patient A : 80/40 Heart rate 80 Patient B : 120/80 Heart rate 80 Patient C : 180/140 Heart rate 80
Testing alarms – Most monitors are equippedwith both audible and visual alarms. It isimportant to verify these alarms are workingcorrectly. Refer to the monitor’s manual tounderstand the different alarm conditions.
The simulator can be used to introduce certainconditions and arrhythmias that will trigger analarm, subject to monitor and simulator features.Figure 6 shows an example screenshot from theRigel UNI-SIM displaying the various dynamicpressure simulation settings available.
3.4 ConsiderationsThere are some physiological variations from onepatient to another. Different patients havedifferent arterial pulse shapes, arterial
I nnova t ing Togethe r

compliance, flesh rigidity and other factors whichsimply make the BP cuff respond differently. Theoscillometric signal is complex and changes notonly in size but in shape in relation to the cuffpressure.
Manufacturers of automated NIBP monitors areusing different methods and aspects todetermine the systolic and diastolic pressures.
These methods and aspects can include:
Measuring the pulse size Measuring the average pulse size Determining the peak of the pulse size
envelope Measuring the average cuff pressure at a set
point Extracting data during cuff inflation or deflation
All different methods and aspects will result indifferent readings on the same patient. As such,a single NIBP simulator will read different on arange of different makes of NIBP monitors.
During a dynamic simulation, the NIBP monitorwill inflate the cuff to a level above the expectedsystolic pressure. The NIBP simulator, such asthe Rigel UNI-SIM is connected to the pressuresystem, and is able to measure the pressuredrop in the cuff introduced by the monitor.
When the system (cuff) pressure is above thesystolic pressure, blood flow is unable to flowpast the cuff. The pressure variations(oscillations) created by the simulator in the cuffare minimal and is the result of simulating thepulsating arterial blood against the cuff.
As the pressure in the cuff drops, the simulator willsimulate greater oscillations in the cuff, simulating
that blood flow is able to resume further along theartery (along the length of the cuff).
When blood flow in the artery has beenestablished across the full length of the cuff, thesystolic pressure has been achieved although themonitor is not able to establish this at this time asthe oscillations in the cuff continue to increaseuntil the cuff pressure is equal to the mean arterialpressure.
When the pressure drops below the mean arterialpressure, the oscillations from the simulatordecrease again (simulating a reduced pressure onthe artery). When the simulated oscillations reacha minimum, the monitor stops the deflationprocess and determines the systolic and diastolicpressures from the measured mean arterial bloodpressure and or any of the aspects detailed abovedepending on the manufacturer.
An example of the shape of the oscillometricwave form captured by the NIBP monitor isprovided in figure 7.
The deviation in NIBP simulation valuescompared to the values displayed on the monitor,varies between manufacturers of NIBP monitorsand of NIBP simulators. Depending on shape ofthe simulated oscillometric waveform, each typeof monitor might give a different interpretation ofthe systolic and diastolic values. Consistency indeviations is one way of ensuring that the monitorfunction hasn’t deteriorated though accuratesimulation of the manufacturer’s oscillometricwaveform will allow the verification of whether thecorrect components are being used (i.e.compatible or recommended cuffs and tubing),determine the accuracy of the calibration andaccurately simulate alarm conditions.
10

11
rigelmedical.com
To improve the accuracy of simulation, it isessential that the NIBP simulator can simulatemanufacturer specific curves so the calculateddata is taken from identical parts of the envelop.The Rigel UNI-SIM has the ability to create orupload manufacturer specific envelopes toensure repeatable and accurate simulations.
4 Invasive blood pressure
Arterial pressure can be monitored bothinvasively (IBP) and non-invasively (NIBP) asdiscussed in the previous chapter however, itmust also be noted that the automated NIBPmethod can only provide an indirect and non-realtime arterial pressure as it calculates pressuresbased on a typically 30 second cycle.
When a greater accuracy or a real time arterialpressure is required e.g. when a patient’s bloodpressure is expected to vary greatly duringsurgical procedures, it’s most common to usethe invasive method.
During an invasive blood pressure measurement,a liquid filled catheter is placed in the artery(radial, brachial, femoral or axillary). The arterialpressure is directly transferred to the liquid insidethe catheter and tubing to the pressuretransducer (non-invasive but external from themonitor). The pressure transducer converts thepressure to an electronic signal which is thenconnected to the monitor for further processingsuch as determining systolic and diastolicpressures.
4.1 Testing IBP functionA number of tests are provided to determine thecorrect operation of the IBP monitors. These are:
Static pressure & linearity test (see 4.2.1) Dynamic pressure (see 4.2.2)
4.2 Test setupThe external pressure transducer produces a milliVolt (mV) signal. The IBP simulator will producecorresponding mV signals on the signal andexcitation connections to the IBP monitor tosimulate the external pressure transducer.
Innova t ing Togethe r
Figure 7: Oscillometric wave form

There are several types of connectionsdepending on the monitor make and thesensitivity of the pressure transducer(mV/mmHg) will also vary by model. It is advisedthat the correct connections are made andtested prior to the simulations to avoid errors inthe simulations.
In this example we connect the Rigel UNI-SIM tothe IBP monitor and simulate dynamic pressurevalues.
Figure 8: Test setup: Connecting the IBPsimulator
4.2.1 Static pressure or linearity test(verify alarm testing)The static pressure tests are useful for verifyingthe performance of the pressure transducer. Alinearity test can be done similar to that duringthe NIBP simulations, in order to verify theaccuracy of the IBP monitor over a pressurerange.
Start by setting the transducer sensitivity,typically 5µV/V/mmHg. Zero the system bysimulating a zero pressure with the simulator andset up the zero value on the monitor (refer to theservice or maintenance manual for instructions).
Once the zero is established, a number ofdifferent pressure values can be simulated.
For example: A manufacturer could ask to performa linearity test on the following static pressures:250mmHg, 200mmHg, 150mmHg, 100mmHg,50mmHg and 0mmHg. The reading valuesshould be within +/-3mmHg from expectedvalue.
Record whether the alarm on the monitor occursat the set value(s) and whether the alarm(s) is atthe correct pitch and frequency (refer to theinstruction manual).
4.2.2 Dynamic pressureThe accuracy of the pressure transducer canalso be verified using a dynamic pressuresimulation. The performance of the computingalgorithms that enable calculation of systolic,diastolic and mean blood pressures are tested inreal conditions.
Patient simulations — It may be necessary toperform verifications using different patientsettings for example; a low (hypotension), normaland high (hypertension) blood pressure;
Patient A : 80/40 heart rate 80 Patient B : 120/80 heart rate 80 Patient C : 180/140 heart rate 80
Testing alarms – Most monitors are equippedwith both audible and visual alarms. It is
12
SYS 120 mmHg
DIA 80 mmHg
HR 70 bpmUNI-SiM
IBP Monitor

13
rigelmedical.com
important to verify these alarms are workingcorrectly. Refer to the monitor’s manual tounderstand the different alarm conditions.
5 Pulse oxymetry
If we consider the heart as the engine of therespiratory system (see chapter 2) and the lungsas the carburetor, oxygenated blood can beconsidered the fuel whereby the level of oxygencan be directly related to the potential capacity inthe blood (or octane level in fuel 95—98% being atypical value).
Oxygen is absorbed by the blood as it passesthrough the lungs, as oxygen sticks to thehemoglobin protein in the red blood cells. Thequantity of oxygen absorbed (oxyhemoglobin) is asign of the respiratory system’s vitality(performance), hence it is one of the mostcommon monitored vital signs. Displayed inpercentage oxyhemoglobin (SaO2, a directmeasurement) in relation to hemoglobin, pulseoximeters can provide a real-time indication of thetotal oxygen saturation (SpO2) in the blood.
To establish an indication of the oxygen saturation,the pulse oximeter relies on the different lightabsorption characteristics of oxyhemoglobin andhemoglobin at different spectrums of light. Using ared (650—700 nm) and infrared (850—950 nm)spectrum light source, a pulse oximeter candetermine the oxygen concentration by measuringthe difference between the red and infrared lightbeing absorbed by the arterial blood.
To do so, a finger probe (or ear probe) is placedon the finger. A red and infrared spectrum LED is
driven by the monitor at consecutive intervals oftypically 0.2 ms (5kHz). On the opposite side ofthe finger probe, a broadband receiver convertsthe unabsorbed red and infrared light signals intoelectrical signals. Other types of probes (i.e. footprobes) or techniques are available such as areflective method used on the forehead. Thesehowever, are not part of this booklet although theprinciples are similar.
Figure 9: The finger probe pulse oximeter
The red light is absorbed more in relation to infraredlight when passing through hemoglobin (Hb, de-oxygenated blood cells) whilst infrared light isabsorbed more by oxyhemoglobin (HbO2,oxygenated blood cells). The ratio at which the lightis being received can therefore provide anindication of the level of oxygen concentration:
In principle, this translates to:
Less infrared than red light being received:higher concentration of oxyhemoglobin (HbO2)
Less red than infrared light being received:lower concentration of oxyhemoglobin (Hb)
A simplified representation of the absorptionproperties of hemoglobin and oxyhemoglobin isprovided in figure 10. Note that this is not suitablefor clinical use.
Innova t ing Togethe r
SPO2
Red LEDInfrared LED
Photo Detector

Figure 10: Absorption properties ofhemoglobin and oxyhemoglobin.
The red line shows the fully oxygenatedhemoglobin (HbO2 - 100% SpO2) while the blueline shows the fully deoxygenated hemoglobin(Hb - 0% SpO2). At around 800nm wavelengththe absorption is equal for both HbO2 and Hb,this is referred to as the isosbestic point (803nm)
Typical ratio values are:
100% SpO2 R/IR approximate ratio of 0.5 82% SpO2 R/IR approximate ratio of 1.0 0% SpO2 R/IR approximate ratio of 2.0
Different manufacturers use different wavelengths(within the described spectrum) and have differentabsorption look-up tables. This is referred to asthe R-curves for each manufacturer.
5.1 ArtifactsIt is important to realize that light is passingthrough different types of tissue (skin, muscle,bone), cells and vessels (arterial and venous).Therefore, to determine the amount of arterialoxyhemoglobin, the monitor will look at the“pulsating” light absorption waveform, the socalled plethysmograph (see figure 11).
Figure 11: An example plethysmograph vsECG waveform
As the heart pumps the blood through the lungs,the level of oxyhemoglobin is “restored” (typically5% of oxygen in lungs) at every systolic cycle afterwhich it will be absorbed at the capillaries(typically around 40%) until the next systolic cycle.At the peak of the plethysmograph, the monitormeasures the total light absorption (arterial andother cells, tissues, venous vessels) while at thetroughs, the monitor measures all but the arterialabsorption (all remaining cells and tissues). Bysubtracting peak from the trough, the monitor isable to determine the arterial oxyhemoglobin, thevalue for SpO2. See figure 12.
14
Dicrotic notch
Q S
P T P
R10.0
1.0
0.1
0.01600 640 680 720 760 800 840 600 920
Methemoglobin
Oxyhemoglobin
Reduced hemoglobin
Wavelength (nm)
Ext
inct
ion
Coe
ffici
ent
960 1000

15
rigelmedical.com
The monitor will therefore only respond to peakvalues in a pulsating plethysmograph.
The measurement process within pulse oximetrycan be affected by motion and low perfusion(peak to trough value less than 5%). Motionintroduces varying levels of oxyhemoglobin whichmight introduce incorrect readings (heart rate andSpO2 %) where as low perfusion can introducehigher inaccuracy due to noise signal ratio.
External light sources may also introduce errorswhen they contain red and infrared spectrumlight. These light sources could introduce a stableamount of light (DC or non pulsating) or apulsating amount (AC) at frequencies of 50, 60Hzor their harmonics.
Monitors must therefore be able to differentiatebetween a normal plethysmograph and one withartifacts.
Modern technologies in pulse oximeters are ableto differentiate and provide accurate readingsduring low perfusion, motion and light artifactshowever, it is suggested that the performanceunder such conditions is verified on a regularbasis. Recent developments in pulse oximetrysee the use of additional light spectrums to obtainmore detailed information on the exact content ofthe arterial blood including methemoglobin(MetHb) and carboxyhemoglobin (COHb).
5.2 Testing your SPO2 monitor – Pulse oximeterMost pulse oximeters on the market are capableof measuring under extreme conditions (artifacts,low perfusion). In order to establish the correctoperation under these conditions, it is importantto verify both the performance of the monitor aswell as the SpO2 probe and its connectioncables.
Innova t ing Togethe r
Figure 12: Light absorption in thered spectrum
Transmitter RED 660nm Transmitter RED 660nm
INCIDENTLIG
HT
Reciever Sp02 = 80% Reciever Sp02 = 100%
absorption due tobone,skin and other tissues
and pigment
absorption due to MetHb
absorption due to COHb
Hb02: DC absorption
Hb: DC absorption
remaining light
Light Signal Max is normally called IDC
Light Signal Min is normally called IDC + AC
Light SignalMax
Light SignalMax
Light SignalMax

All parts of the SpO2 probe (LED’s, broad banddetector, lens and cabling) are subject to wearand tear and when faulty (or in poor quality) mightintroduce inconsistent and inaccurateperformance with potentially serious implicationson the treatment of well-being of patients.
For this reason, we include both the monitor andthe SpO2 probe when discussing the testingprocedures for pulse oximetry.
Common issues relating to the accuracy of theSpO2 monitor are:
Faulty (near faulty) LED’s (red and infrared) Non-OEM probes (white label) Contaminated lens / probe window Damaged wiring or extension cable Inaccurate calibration of SpO2 monitor Testing of audible alarms Display of plethysmograph
A number of tests are provided to determine thecorrect operation of the SpO2monitors. These are:
Testing monitor accuracy (see 5.3.1) Testing alarms and response time (see 5.3.2) Testing under low perfusion (see 5.3.3) Testing probe quality (see 5.3.4)
5.3 Test setupIn the example below, the Rigel SP-SIM or UNI-SIM is used to represent the SpO2 simulator.Ensure the correct adaptor module is providedduring the test as connector shape and pin-outconfiguration differ between different makes ofSpO2 probes and monitors.
Figure 13: Test setup: Connecting theSPO2 simulator (opto-electronic method)
5.3.1 Testing monitor accuracyThe purpose of this test is to verify the performanceof the monitor measurement circuits and SpO2probe characteristics by simply displaying theSpO2% value and heart rate on the monitor.
To simulate the heart rate, the UNI-SIM simulatesthe (pulsating) plethysmograph at rates of 30 to300 beats per minute (bpm). Simulated saturationlevels can be set between 50 and 100%. In orderto verify a range of possible measurements, somesimulations can be performed across a number ofcritical values (see alarm testing) as example:normal, low and critical.
In addition, artifacts (light, motion andarrhythmia’s) can be introduced to test theperformance of SpO2 monitors either forevaluation, acceptance and as part of preventativemaintenance.
Note that the precision of pulse oximeters canvary greatly between brands but typically doesnot exceed +/-2%.
16
SPO2 98%HR 70 bpm
UNI-SiM
SpO2 Monitor
SPO2
SpO2 Probe
ProbeInterface

17
rigelmedical.com
5.3.2 Alarms and time response testUse the different values of SpO2 simulation totrigger audible alarms. Alarms of medical devicesare specified by the IEC 60601 standard andmust be documented by the manufacturer, suchas pitch, frequency and strength. Consult themonitor’s service or instruction manual for detailson the types of alarms available.
In addition, the SpO2 value is updated at setintervals e.g. every 15 seconds. The setresponse time can be verified using thechronometer function in the UNI-SIM. Theresponse time and alarm function can becombined in a single test setup i.e. by setting theSpO2 value to 94% with a target of 85%. Wait forthe SpO2 monitor to display the 94% SpO2.Activate the chronometer function on the UNI-SIM. This will change the simulation to 85%SpO2 and starts the timer. When the monitorreaches the alarm (i.e. when set to 85% SpO2),press the capture button on the UNI-SIM todisplay the time taken to alarm.
Record whether the alarm on the monitor occursat the set value(s) and whether the alarm(s) is atthe correct pitch and frequency (refer to theinstruction manual).
5.3.3 Sensitivity testTo determine whether the SpO2 monitor is able tomeasure accurately under different pulsevolumes, e.g. as a result of different types ofpatients (normal adult, obese, pediatric, skin colorvariation), the UNI-SIM can be used to simulate avariety of pulse volumes and skin colors.
Using the SpO2 simulator, the pulse volume can bereduced until the monitor displays “no SpO2
signal”. The value before this point highlights theminimum sensitivity of the monitor. It is important torealize that the quality of the probe can affect theoutcome of this test as non-original probes mighthave poorer quality components and have lesssensitivity compared to the original probes (OEM).
Record the sensitivity value over time to monitorthe performance of the oximeter.
5.3.4 Testing the SPO2 probeThe SpO2 sensor is often the weakest link in thechain of SpO2 measurement. Probes areconsidered consumables as they suffersignificant wear and tear thus are easilyreplaceable.To test the functionality of the probeit is important to realize the different parts thatmake up the probe and connections:
1. Red LED2. Infrared LED3. Broadband detector4. Lens5. Cabling6. Connector7. Extension cable (where applicable)
The quality or function of the LED’s willdeteriorate over time. To test the accuracy, theUNI-SIM is able to simulate through the red andinfrared circuit individually. This will allow forcomparison between the two circuits as thereading on the monitor should be within 1% ofeach other. When one of the LED’s hasdeteriorated, the readings will differentiate bymore than 2% of SpO2 value. Replace the probeand repeat the test again to ensure the newprobe is as expected.
Innova t ing Togethe r

Other forms of problems associated with thequality of the SpO2 LED’s are a deterioration ofthe perfusion sensitivity (see 5.3.3). This could bedue to quality of the LED’s, broadband detectoror the lens (contamination or cuts).
When testing the probe, always ensure that thecable and extension leads are flexed during thetests so that open or short circuits cause analarm or a “no reading” on the monitor.
Suggestion: Always record the findings on eachtype of SpO2 probe to build-up an expectedperformance reference list (perfusion, Delta R / IRreading). This will help in identifying poor or (near)faulty SpO2 probes in the future.
Consideration: Some simulators on the marketmight make use of an optical finger, capturing thesignals from the SpO2 probe and changing thecharacteristics before converting them back tored and infrared signals. The advantage would bethe elimination of probe adaptor boxes however,the disadvantages are significant; Red – Infraredlight / blood absorption characteristics have astrong and direct link with the wave length used(LED spectrum). An optical finger may usedifferent wave length or single LED compared tothe manufacturer (OEM). This could result ininaccurate readings. Probe placement will alsoaffect the result and as such can be influencedthus not able to form an accurate reference value.
6 Electrocardiographs (ECG)
The heart, central in the respiratory system,converts bio-electric pulses to a bio- mechanicaloperation (blood flow). The function of the heart
is monitored by measuring the electrical activity(milli-volt signals) generated in the heart and isreferred to as Electrocardiography.
The most common ECG tracing of a cardiac cycle(heart beat) is represented below and consists ofa P wave, the QRS complex and a T wave. Thetypical duration of the electrical activity is usuallyaround 400-600 ms. The ECG trace representsthe change in voltage across different parts of thebody (limbs) because of depolarization(contracting or systole) and repolarisation(relaxing or diastole) in the heart muscles. Thebaseline voltage of the ECG is referred to as theisoelectric line.
Figure 14: An example of an ECG trace
1. The P wave is generated during the atrialdepolarization.
2. Following this, the right and left ventricles aredepolarized, generating the QRS complex.
3. During the T wave, the ventricles re-polarize.4. During the latter part of the T wave, the
human heart is most vulnerable againstdisturbance or fibrillation.
18
QS
P T
R
PR QT
100-200 300-400
400-600
QRS
isoelectric line
app
r.1-
2mV

19
rigelmedical.com
6.1 Einthoven TriangleAs a result of the body’s natural impedance, theelectrical activity results in different potentialsacross the body. One of the most referred tomeans of measuring the electrical potentials is bypositioning electrodes (limb leads) on the patient ina triangular shape, the einthoven triangle, placedon the left leg (LL), right arm (RA) and left arm (LA).
These limbs can also be referred to as:
Left leg (LL) = Left foot or foot (F)Right arm (RA) = Right (R)Left arm (LA) = Left (L)Right leg (RL) = Neutral (N)
This is represented in the diagram below:
Figure 15: The Einthoven triangle
Whereby you can calculate that Lead I + Lead III= Lead 2 (Kirchhoff’s law)
(ΦLA-ΦRA)+(ΦLL-ΦLA)=ΦLL-ΦRA
The ECG waveform, (PQRST) can now bedetermined at various locations of the body, tospecifically highlight anomalies in a specific partof the waveform. These can be directly related tothe performance of the atrium and ventriclemuscles.
Figure 16: A typical waveform (Lead I) andthe derived shapes (Lead II and III)
Using vectors, Lead I, II and III can be separatedinto Augmented limb leads whereby the potentialis measured from one (positive) of the threepositions on the Einthoven triangle and thecombined other two (negative) as shown in figure17 on the following page.
Innova t ing Togethe r
R L
N F
_ +
++
_ _
l
l
Potential
V1= ΦLA-ΦRAV2= ΦLL-ΦRAV3= ΦLL-ΦLA
(-) negative
RA
RA
LA
(+) positive
LA
LL
LL
Lead
I
II
III

Figure 17: Augmented limb leads
6.2 Precordial leadsWhen a more detailed electrocardiogram isrequired, additional leads, the precordial leads,are placed on the chest. The different leadconfigurations will allow diagnosis of numerousheart conditions by studying relative amplitudes,heart rates and uniformity across the differentleads.
The precordial leads (V1,V2,V3,V4,V5 and V6)are placed in close proximity to the heart toensure sufficient signal strength and accuracy.
Placements of the leads are in accordance withfigure 18 below.
Figure 18: Precordial lead placementFor figure 18 use IEC Code 1 for leadidentification, not those shown, including thechest leads which should be C1 – C6 not ‘Y’.
20
R
N
L
C1 C2C3
C4 C5 C6
F
R L
F
R L
F
R L
F
aVL
aVR
aVF
5 KΩ
5 KΩ
5 KΩ
5 KΩ 5 KΩ
5 KΩ
-
R (RA) + F (LL)
L(LA) + (RA)
L(LA) + F(LL)
+
L (LA)
F(LL)
R(RA)
Lead
aVL
aVF
aVR

21
rigelmedical.com
Figure 19: Example of a 12 lead ECG
6.3 Unipolar vs. bipolar leadsECG leads are split between unipolar and bipolarleads. The limb leads (I, II and III) are bipolar,having both a positive and negative pole. Theaugmented leads (aVL, aVF and aVR) andprecordial leads (V1-6) are considered unipolar,having only a true positive pole. The negativepole consists of signals from other poles.
6.4 Color codingECG leads are marked with both abbreviationsand color coding according to the correspondingplacement on the body. There are 2 commonmarkings available on the market today. Theseare shown in the table below.
Innova t ing Togethe r
HR 62 bpm14:37:18
QRS 0:112s0.390s/0.395s
27 80 49
x1.0 .05-150Hz 25mm/sec
Name:ID:Patient IDIncident:Age: 26
12-Lead 2hhhPR0.138sQT/QTcP-QRS-AxesaVR
Normal ECG **Unconfirmed**Normal sinus rhythm
Sex:
o
o o o
o
lv1 lv4
lv5lv2l aVL
l aVF lv3 lv6
Table 1: ECG Abbreviations and color coding
ColourWhite
Black
Green
Red
Brown/Red
Brown/Yellow
Brown/Green
Brown/Blue
Brown/Orange
Brown/Violet
AbbreviationRALARLLLV1V2V3V4V5V6
ColourRed
Yellow
Black
Green
White/Red
White/Yellow
White/Green
White/Brown
White/Black
White/Violet
AbbreviationRLNFC1C2C3C4C5C6
Right ArmLeft ArmRight LegLeft LegChest 1Chest 2Chest 3Chest 4Chest 5Chest 6
Elecrode IEC Code 1 IEC Code 2 (American)

6.5 The ECG MachineTo observe an ECG, the difference between twoelectrical signals at different points on the bodymust be amplified. Then the electrical potentialscan be displayed on the screen. ECG machinesmay typically use 3 lead, 5 lead or 12 leadconfigurations.
Placement of the ECG leads is standardized sothat the interpretation of the ECG is consistent.Cardiac conditions that can be diagnosed usingECG’s include abnormally fast heart rate(tachycardia), abnormally slow rate(bradychardia), heart block, acute myocardialinfraction (a blood clot in the heart), ischemia (arestriction in the blood supply to a part of theheart) and numerous other conditions. Theseconditions come under the generic term of heartarrhythmias.
Figure 20: Patient on ECG recorder
6.6 Testing ECG monitorDue to the important analyzing role of the ECGmonitor, it is crucial to ensure that the input
circuits of the ECG monitor are able to measurethe small ECG signals accurately. That thesoftware is able to interpret these signals to thecorresponding conditions and that alarms arevisible and audible according to themanufacturers specifications.
Therefore, the following simulations andperformance tests are often part of the regularmaintenance:
Linearity of heart rate measurement QRS Beep Alarms (high and low) Alarms for disconnected electrodes Arrhythmias recognition (asystolic) Sensibility test Zero offset Frequency response Printer calibration (amplitude, timing)
The most common instrument used for theabove is a patient or ECG simulator. In theexample below, the patient simulator from theUNI-SIM is used;
Figure 21: Test setup: Connecting the ECGsimulator
22
HR 70 BPM
UNI-SiM
ECG Recorder
1
2
3
4
5
RA
LA
LL
RL
1V
V2
V3
V4
V5
V6
6
7
8
9
10
!
ECGInterface
ECG
23
rigelmedical.com
6.6.1 Linearity of heart rate measurementThe purpose of this test is to verify the capabilityof the monitor to measure and display heart rateaccurately. It is recommended to simulate severalvalues in range spanning 30-300 beats perminute (bpm).
Compare the readings with the simulated valuesand check whether this is within manufacturerspecifications (normally +/- 1 bpm or +/- 1% ofreading).
6.6.2 QRS beepTo aid the monitoring process, it is a requirementto fit the ECG monitor with an audible QRS beep.This provides a clear “beep” each time the QRSwave passes. Frequency and pitch variations canprovide a clear indication of the heart rate withouthaving to have line of sight to the ECG recorder.
6.6.3 Alarms (high and low)IEC 60601-1-8 provides the requirements foralarms on medical devices. Alarms can vary infrequency, pitch, volume and melody. In general,the greater the urgency, the higher the pitch,volume and pulse frequency (or melody).
During the performance test of the ECG recorder,alarms can be tested by simulating different heartrates and arrhythmias using a patient simulator.At the end of the test, the final alarm conditioncan be tested by disconnecting the leads one byone. The monitor should go into alarm conditionwhen this happens.
Record whether the alarm on the monitor occursat the set value(s) and whether the alarm(s) is atthe correct pitch and frequency (refer to theinstruction manual).
6.6.4 Arrhythmias recognition (asystolic)ECG monitors, which are able to interpret theECG recording, are required to provide an alarmwhen they detect a seizure in blood circulation (orlack of pulse). This is the case during ventricularfibrillation and asystole (flat line) when no electricalnor mechanical activity is present in the heart.Ventricular fibrillation is a condition whereby theventricles contract erratically with the net result ofpoor to no blood circulation from the ventricles tothe body. During coarse VFIB, the waveformamplitudes are significantly larger than during fineVFIB. The latter is close to an asystole.
All cases of VFIB lead to rapid loss ofconsciousness in the patient and must betreated immediately with the use of a defibrillator.
6.6.5 Sensitivity test (gain)To ensure the input circuits of the ECG recorderare sensitive enough to measure the ECG mVsignals, the input amplifier settings are tested bysupplying a normal sinus rhythm (NSR) at (e.g.)60 bpm and with a 1mV amplitude.
When the NSR is displayed on the screen, changethe gain of the monitor and check if the changesin amplitude are relative to the gain change i.e. adoubling in gain would result in a doubling ofamplitude. The heart rate should not be affected.Some ECG recorders are supplied with a printerand can allow for gain and amplitude settings tobe easily crossed referenced.
6.6.6 Zero offsetThe zero offset test demonstrates the aligning of theisoelectric line of the ECG wave form with the zeroline of the ECG recorder. This is achieved bychecking whether the ECG line (flat line on the
Innova t ing Togethe r

recorder) is at zero mV when no leads areconnected. When the recorder is equipped (usually)with a printer, the printed line shall be at zero mVolt.
6.6.7 Frequency responseTo limit the sensitivity of the ECG recorder fromexternal signals i.e. mains frequency and otherartifacts, the input circuits are equipped (usually)with filters. So called high pass filters – HPF’s(allowing signals of greater frequency to passthrough) and low pass filters – LPF’s (allowingfrequencies of lower frequencies to pass through)provide a bandwidth of allowable frequencies.
Typical values are 0.5Hz / 1 Hz for HPF’s and 40 Hzfor LPF’s inmonitormode and 0.05 Hz for HPF and40 / 100 / 150 Hz for LPF’s in diagnostic mode.
These filter settings can be selected based uponthe application. To test the settings of the filters,performance wave forms such as a sinus oftriangular waveform can be simulated to the ECGrecorder. By varying the frequency in-and outsidethe bandwidth, the performance can be verified.
6.6.8 Printer calibration (amplitude, timing)ECG recorders with build-in printer facility arerequired to be tested for linearity of the printerspeed. Printer rolls typically move at 25 mm /seconds. To test printer speed and linearity, afixed frequency sinusoidal wave can besimulated. This should result in a consistent wavelength width across the print out and mustcorrespond to the print speed.
ECG recording paper consists of a matrix ofsquares each 1mm x 1mm. At a speed of25mm/s and a sensitivity of 10mm/mV eachsquare represents 0.04s and 0.1mV respectively.
A signal with an amplitude of 1 mV and frequencyof 1 Hz should have an amplitude of 10 mm andwave length of 25 mm.
Figure 22: A sinusoidal test signal of 1Hzand 1mV amplitude
7 Respiration
Unless a human is subject to mechanicalventilation, inspiration of the lungs is controlledby the increase in volume of the thoracic cavity.The thoracic cavity volume is increased as aresult of (Involuntary) contraction of thediaphragm (layer between lungs and abdominalcavity). In addition to the diaphragm, theintercostal muscles also aid the breathingprocess by lifting the lower and upper ribs.Expiration of the lungs is a result of the elasticityof the lungs, forcing air out when the diaphragmand intercostals muscles relax.
When a patient is under general anaesthetic,he/she might no longer be able to sustain theinvoluntary control of the diaphragm andintercostals muscles. A mechanical ventilator isthen required to deliver a set volume per breath
24
1 mV
-1mV
0
1s
1mV

25
rigelmedical.com
and respiratory rate (breaths per minute).Monitoring the respiration rate on patientssubject to anesthesia is vital as it providesimmediate warning of changes to the respirationrate including obstruction of the trachea (airpipe).An obstruction in the trachea stops the oxygensupply to the lungs and stops the expiring ofcarbon dioxide from the blood which can lead toa cardiac arrest and subsequent death ifuntreated e.g. removing the obstruction via anendotrachea tube).
There are several ways of deriving respiration ratefrom the ECG leads and signals.
1. Most commonly used, is the measurement ofthe transthoracic impedance between the ECGleads ie Lead I, II or III. As the thoracic cavityexpands (inspiration), the impedance of the chestincreases. While during expiration, the thoraciccavity reduces in volume thus decreasing itsimpedance.
2. Another method of determining the respirationis through observing the change in the ECGamplitude (ECG Derived Respiration – EDR) as aresult of changes in the position betweenelectrodes and heart as the chest cavity expandsand the heart moves as a result of changes in theposition of the diaphragm. This method can bevisualized on a recorded ECG.
3. A third method to establish the respiration rateis by observing the changes in R-R intervals.(time between the R-peaks of two successiveQRS waves).
Figure 23: Respiration through limb andaugmented leads
In all instances, the ECG leads are placed on ahuman chest as shown above. Respiration ratescan be monitored through all limb andaugmented leads. Most monitors and recordersallow a selection of leads.
Innova t ing Togethe r
R
N
L
C1 C2C3
C4 C5 C6
F
R
N
L
C1 C2C3
C4 C5 C6
F

7.1 Testing respiration functionThe most common method of monitoringrespiration at bedside is through impedancemeasurement across the ECG leads.
The tests to perform on such monitor are:
Linearity of respiration measurement Sleep apnea Alarms (high and low)
Figure 24: Test setup: Connecting therespiration / ECG simulator
7.1.1 Linearity of respiration measurementThe purpose of this test is to verify the capabilityof the monitor to measure and display respirationrate values. It is recommended to simulateseveral values across a range rates from 100bpm down to (sleep) apnea (see 7.1.2).
Check the specification of the monitor to verifythe readings are within the required accuracy.Typical accuracies are within +/- 1bpm.
7.1.2 Sleep apneaDuring our sleep, our airways can becomeobstructed, preventing oxygen to reach the lungsand stopping the expiring of carbon dioxide from
the blood. As a result, the level of carbon dioxideincreases in the blood (level of oxyhemoglobindrops) as it is not able to pass out through thelungs and no new oxyhemoglobin enter theblood stream. While this is not a direct health riskas the brain will signal a wake-up, when leftuntreated, it can lead to more serious conditionssuch as high blood pressure and heart failure.
While sleep apnea can be monitored indifferentways (CO2 monitoring, SpO2 etc), its mostcommonly monitored through the respiration rateon bedside monitors via ECG leads. Sleep apneawill appear as an absence in breath rate (breathrate = 0) and a respiration monitor should soundan alarm when sleep apnea is detected.
7.1.3 Testing apnea alarmsIn order to act swiftly to a deteriorating conditionof the patient, respiration monitors are suppliedwith alarms to indicate a unacceptable change inrespiration rate (too high, too low or apnea).Using a patient simulator, normal (e.g. 15 breathper minute —bpm), low (e.g. 5 bpm), high (e.g. 30bpm) and apnea (0 bpm) can be simulated.Depending on the application of the monitor (i.e.adult or pediatric monitoring), the range of valuescould vary due to natural change in respirationrate in infants (higher) and adults (lower) or whentesting monitors used for exercise stress testing(>30 bpm).
Record whether the alarm on the monitor occursat the set value(s) and whether the alarm(s) is atthe correct pitch and frequency (refer to theinstruction manual).
26
RESP 15 bpm
UNI-SiM
ECG Recorder
1
2
3
4
5
RA
LA
LL
RL
1V
V2
V3
V4
V5
V6
6
7
8
9
10
!
ECGInterface

27
rigelmedical.com
8 Temperature
One of the most commonly monitored vital signs isthe body temperature. Several devices have beenmarketed over the years from contact basedtemperature measurement such as the mercuryfilled thermometers (no longer available due to thetoxic nature of mercury) and resistor based sensorsto non-contact infrared based temperature sensors.
Our core body temperature (Tc) varies by genderand can vary between different stages of the day.In women, the core body temperature alsochanges during the menstrual cycle, peaking atthe time of ovulation.
The average core body temperature is 37°C ±0.5°C. Depending on the placement, applicationand method, different temperature readings areexpected in healthy individuals as shown in table2 on the following page.
The most common temperature sensors used onbedside monitoring are electrical temperaturesensors based on a temperature related varyingresistor (thermistors). These thermistors arecommonly known as NTC’s (negative temperaturecoefficient – meaning that that the resistancedecreases when temperature increases) and PTC’s(positive temperature coefficient – meaning that theresistance is increasing as temperature increases).
The YSI 400 and YSI 700 have become thestandard NTC’s used in the medical industry.While the YSI 400 is slightly more accurate overthe range of 0-75ºC, the YSI 700, which containsa dual element (Ra = 6kΩ@ 25ºC and Rb = 30kΩ@ 25ºC), is able to provide it’s accuracy over awider range (-25ºC to 100ºC).
Body temperature is simulated by the differentresistor values corresponding to the requiredtemperature.
Please see table 3 on the following page.
8.1 Testing temperature function onmultiparametric monitorsWe have the following performance tests :
Linearity of temperature measurement Alarms (high and low)
Ensure the correct temperature sensor (YSI400or 700) on the patient simulator is selected.
Figure 25: Test setup: Connecting thetemperature simulator
8.1.1 Linearity of temperature measurementThe purpose of this test is to verify the linearity ofthe monitor over the most typical range oftemperatures such as body normal, fever (high),hypothermia (low) and room temperature.
A patient simulator is often able to simulateacross this range between 25-41°C. Check thespecification of the monitor to verify the readingsare within the required accuracy.
Innova t ing Togethe r
T1 37 CT2 25 C
YSI 400
o
o
UNI-SiM
TemperatureMonitor

8.1.2 Testing temperature alarmsIn order to act swiftly to a deteriorating conditionof the patient, temperature monitors are suppliedwith alarms to indicate an acceptable change incore or skin temperature. (too high or too low).Using a patient simulator, normal (37°C), low(33°C), high (41°C ) and room (25°C) temperaturemay be simulated.
Record whether the alarm on the monitor occursat the set value(s) and whether the alarm(s) is atthe correct pitch and frequency (refer to theinstruction manual).
9 Record keeping
Overall, the area of risk assessment and thecreation of risk management files has become agrowing feature of routine safety and performancetesting decisions, with different organizations and
departments drawing-up individual plans to dealwith specific safety hazards. Comparison withprevious and expected test results will thereforeallow you to monitor deterioration of the deviceunder test and prevent potential failure before afault occurs.
To ensure proper record keeping is maintained itis important to provide a procedure in which datais collected regarding:
Inspection date Visual inspection Electrical safety Functional testing Next inspection date
Rigel Medical have developed Med-eBase, asoftware package to automate the generation oftest reports including visual inspection, electricalsafety and performance testing. An example ofsuch test template is provided in Appendix D.
28
Table 2: Different temperature reading methods
Accuracy
Core temperature (Tc)
Core temperature (Tc)
0.3 to 0.6˚C < Tc
0.6 to 1.2˚C < Tc
Depending on direct environment
Method
contact and non-contact
contact
contact
contact
contact and non-contact
Application
Non-invasive
Invasive
Invasive
Non-invasive
Non-invasive
Placement
Ear (Tympanic)
Rectally
Orally
Armpit (Axillary)
Skin temperature
Table 3: Resistor values on YSI 400 and 700 sensors
YSI 700 (b)15,520 Ω18,210 Ω21,430 Ω30,000 Ω
YSI 700 (a)3,070 Ω3,610 Ω4,260 Ω6,000 Ω
Resistor Value
YSI 4001,152 Ω1,355 Ω1,599 Ω2,252 Ω
(Body) temperature
41˚C37˚C33˚C
25˚C (room)
A more detailed range of resistor values vs temperature is provided in Appendix C.

29
rigelmedical.com
Going forward, determining the appropriatelevels of both electrical and functional testing willbe central to the introduction of cost effective yetreliable preventative maintenance campaigns.
Conclusion
Planned preventative maintenance is an importantaspect during the useful life of a medical electronicdevice. To ensure safety of the patient andoperator, procedures are required to cover:
Visual inspection Electrical safety testing (see IEC 62353) Performance or functional testing Record keeping
This booklet has provided a basic introduction tovital signs monitoring and suggested testprocedures for each vital sign. Always ensure thatthe function and operation of the DUT isunderstood before commencing on the plannedpreventative maintenance. Without fullyunderstanding the function and or operation,visual inspections, electrical safety tests andfunctional tests might be incorrect or incomplete.Prior to any testing, ensure that the manufacturer’srecommendations are available as they oftensupersede any general inspection guidelines.
Considerations and recommendations
1. Ensure that the operator of test equipment isproperly trained on both the test equipment andDUT to ensure that valid measurements aretaken and understood and prevent unnecessarydanger during the safety test.
2. Always ensure that the DUT does not poseany danger to the user and / or people within thevicinity to the safety test. (e.g. moving parts,open conductors, live components, heat etc).
3. Ensure that manufacturer’s instructions arefollowed and any performance is checkedagainst manufacturer’s documentation.
4. Ensure high accuracy and repeatability ofsimulations and measurement readings (somemanufacturers might specify full scale accuracywhich will effect the accuracy of low valuereadings or measurements).
5. When determining the correct means oftesting a specific medical device, ensure that thechosen test procedures are applicable to theDUT and are clearly documented for future use.
Rigel Medical offers a range of test equipment tocover simulation and performance testing as wellas a range of electrical safety analyzers to meetthe IEC 62353 and IEC 60601 requirements.Please visit our website www.rigelmedical.comfor a full overview of our product offering orregister online for our free newsletter on futureproduct releases and product innovations.
For further questions or comments relating to thisbooklet or on the Rigel Medical product offering,please contact John Backes via email [email protected]
Innova t ing Togethe r

Appendix AIEC 60601-1 Collateral Standards (© IEC Geneva, Switzerland)
30
IEC 60601-1-1
IEC 60601-1-2 (ACDV)
IEC 60601-1-3
IEC 60601-1-4
IEC 60601-1-6
IEC 60601-1-8 (CCDV)
IEC 60601-1-9
IEC 60601-1-10
IEC 60601-1-11
IEC 60601-1-12 (CDM)
MEDICAL ELECTRICAL EQUIPMENT – PART 1: GENERAL REQUIREMENTS FOR SAFETY 1: COLLATERALSTANDARD: SAFETY REQUIREMENTS FOR MEDICAL ELECTRICAL SYSTEMS
MEDICAL ELECTRICAL EQUIPMENT - PART 1-2: GENERAL REQUIREMENTS FOR BASIC SAFETY ANDESSENTIAL PERFORMANCE - COLLATERAL STANDARD: ELECTROMAGNETIC PHENOMENA -REQUIREMENTS AND TESTS
MEDICAL ELECTRICAL EQUIPMENT – PART 1: GENERAL REQUIREMENTS FOR SAFETY – COLLATERALSTANDARD: GENERAL REQUIREMENTS FOR RADIATION PROTECTION IN DIAGNOSTIC X-RAY EQUIPMENT
MEDICAL ELECTRICAL EQUIPMENT: PART 1-4: GENERAL REQUIREMENTS FOR COLLATERAL STANDARD:PROGRAMMABLE ELECTRICAL MEDICAL SYSTEMS
MEDICAL ELECTRICAL EQUIPMENT - PART 1-6: GENERAL REQUIREMENTS FOR BASIC SAFETY ANDESSENTIAL PERFORMANCE - COLLATERAL STANDARD: USABILITY
MEDICAL ELECTRICAL EQUIPMENT - PART 1-8: GENERAL REQUIREMENTS FOR BASIC SAFETY ANDESSENTIAL PERFORMANCE - COLLATERAL STANDARD: GENERAL REQUIREMENTS, TESTS ANDGUIDANCE FOR ALARM SYSTEMS IN MEDICAL ELECTRICAL EQUIPMENT AND MEDICAL ELECTRICALSYSTEMS
MEDICAL ELECTRICAL EQUIPMENT - PART 1-9: GENERAL REQUIREMENTS FOR BASIC SAFETY ANDESSENTIAL PERFORMANCE - COLLATERAL STANDARD: REQUIREMENTS FOR ENVIRONMENTALLYCONSCIOUS DESIGN
MEDICAL ELECTRICAL EQUIPMENT - PART 1-10: GENERAL REQUIREMENTS FOR BASIC SAFETY ANDESSENTIAL PERFORMANCE - COLLATERAL STANDARD: REQUIREMENTS FOR THE DEVELOPMENT OFPHYSIOLOGIC CLOSED-LOOP CONTROLLERS
MEDICAL ELECTRICAL EQUIPMENT - PART 1-11: GENERAL REQUIREMENTS FOR BASIC SAFETY ANDESSENTIAL PERFORMANCE - COLLATERAL STANDARD: REQUIREMENTS FOR MEDICAL ELECTRICALEQUIPMENT AND MEDICAL ELECTRICAL SYSTEM USED IN HOME CARE APPLICATIONS
MEDICAL ELECTRICAL EQUIPMENT - PART 1-12: GENERAL REQUIREMENTS FOR BASIC SAFETY ANDESSENTIAL PERFORMANCE - COLLATERAL STANDARD: REQUIREMENTS FOR MEDICAL ELECTRICALEQUIPMENT AND MEDICAL ELECTRICAL SYSTEMS USED IN THE EMERGENCY MEDICAL SERVICESENVIRONMENT

31
rigelmedical.com
Appendix BIEC 60601-2 Particular Standards (© IEC Geneva, Switzerland)
Innova t ing Togethe r
IEC 60601-2-1
IEC 60601-2-2
IEC 60601-2-3 (ADIS)
IEC 60601-2-4
IEC 60601-2-5
IEC 60601-2-6 (ADIS)
IEC 60601-2-7
IEC 60601-2-8
IEC 60601-2-10 (CCDV)
IEC 60601-2-11
IEC 60601-2-13
IEC 60601-2-16 (RDIS)
IEC 60601-2-17
IEC 60601-2-18
IEC 60601-2-19
IEC 60601-2-20
IEC 60601-2-21
IEC 60601-2-22
MEDICAL ELECTRICAL EQUIPMENT - PART 2-1: PARTICULAR REQUIREMENTS FOR THE SAFETY OFELECTRON ACCELERATORS IN THE RANGE 1 MEV TO 50 MEV
MEDICAL ELECTRICAL EQUIPMENT - PART 2-2: PARTICULAR REQUIREMENTS FOR THE SAFETY OFHIGH FREQUENCY SURGICAL EQUIPMENT
MEDICAL ELECTRICAL EQUIPMENT PART 2: PARTICULAR REQUIREMENTS FOR THE SAFETY OFSHORT-WAVE THERAPY EQUIPMENT
MEDICAL ELECTRICAL EQUIPMENT PART 2: PARTICULAR REQUIREMENTS FOR THE SAFETY OFCARDIAC DEFIBRILLATORS AND CARDIAC DEFIBRILLATORS MONITORS
MEDICAL ELECTRICAL EQUIPMENT - PART 2-5: PARTICULAR REQUIREMENTS FOR THE SAFETY OFULTRASONIC PHYSIOTHERAPY EQUIPMENT
MEDICAL ELECTRICAL EQUIPMENT - PART 2: PARTICULAR REQUIREMENTS FOR THE SAFETY OFMICROWAVE THERAPY EQUIPMENT
MEDICAL ELECTRICAL EQUIPMENT - PART 2-7: PARTICULAR REQUIREMENTS FOR THE SAFETY OFHIGH-VOLTAGE GENERATORS OF DIAGNOSTIC X-RAY GENERATORS
MEDICAL ELECTRICAL EQUIPMENT - PART 2-8: PARTICULAR REQUIREMENTS FOR THE SAFETY OFTHERAPEUTIC X-RAY EQUIPMENT OPERATING IN THE RANGE 10 KV TO 1 MV
MEDICAL ELECTRICAL EQUIPMENT PART 2: PARTICULAR REQUIREMENTS FOR THE SAFETY OFNERVE AND MUSCLE STIMULATORS
MEDICAL ELECTRICAL EQUIPMENT PART 2: PARTICULAR REQUIREMENTS FOR THE SAFETY OFGAMMA BEAM THERAPY EQUIPMENT
MEDICAL ELECTRICAL EQUIPMENT - PART 2-13: PARTICULAR REQUIREMENTS FOR THE SAFETY OFANAESTHETIC WORKSTATIONS
MEDICAL ELECTRICAL EQUIPMENT - PART 2-16: PARTICULAR REQUIREMENTS FOR BASIC SAFETYAND ESSENTIAL PERFORMANCE OF HAEMODIALYSIS, HAEMODIAFILTRATION ANDHAEMOFILTRATION EQUIPMENT
MEDICAL ELECTRICAL EQUIPMENT - PART 2: PARTICULAR REQUIREMENTS FOR THE SAFETY OFREMOTE-CONTROLLED AUTOMATICALLY DRIVEN GAMMARAY AFTER-LOADING EQUIPMENT
MEDICAL ELECTRICAL EQUIPMENT PART 2: PARTICULAR REQUIREMENTS FOR THE SAFETY OFENDOSCOPIC EQUIPMENT
MEDICAL ELECTRICAL EQUIPMENT - PART 2: PARTICULAR REQUIREMENTS OF SAFETY OF BABYINCUBATORS
MEDICAL ELECTRICAL EQUIPMENT - PART 2: PARTICULAR REQUIREMENTS FOR THE SAFETY OFTRANSPORT INCUBATORS
MEDICAL ELECTRICAL EQUIPMENT PART 2: PARTICULAR REQUIREMENTS FOR THE SAFETY OFINFANT RADIANT WARMERS
MEDICAL ELECTRICAL EQUIPMENT - PART 2: PARTICULAR REQUIREMENTS FOR THE SAFETY OFDIAGNOSTIC AND THERAPEUTIC LASER EQUIPMENT

32
IEC 60601-2-23
IEC 60601-2-24 (ADIS)
IEC 60601-2-25
IEC 60601-2-26 (ADIS)
IEC 60601-2-27
IEC 60601-2-28
IEC 60601-2-29
IEC 60601-2-31
IEC 60601-2-32
IEC 60601-2-33
IEC 60601-2-34
IEC 60601-2-36 (1CD)
IEC 60601-2-37
IEC 60601-2-39
IEC 60601-2-40
IEC 60601-2-41 (CCDV)
IEC 60601-2-43
IEC 60601-2-44 (CCDV)
MEDICAL ELECTRICAL EQUIPMENT - PART 2-23: PARTICULAR REQUIREMENTS FOR THE SAFETY,INCLUDING ESSENTIAL PERFORMANCE, OF TRANSCUTANEOUSPARTIAL PRESSURE MONITORINGEQUIPMENT
MEDICAL ELECTRICAL EQUIPMENT - PART 2-24: PARITCULAR REQUIREMENTS FOR THE SAFETY OFINFUSION PUMPS AND CONTROLLERS
MEDICAL ELECTRICAL EQUIPMENT - PART 2-25: PARTICULAR REQUIREMENTS FOR THE SAFETY OFELECTROCARDIOGRAPHS
MEDICAL ELECTRICAL EQUIPMENT PART 2: PARTICULAR REQUIREMENTS FOR THE SAFETY OFELECTROENCEPHALOGRAPHS
MEDICAL ELECTRICAL EQUIPMENT - PART 2: PARTICULAR REQUIREMENTS FOR THE SAFETY OFELECTROCARDIOGRAPHIC MONITORING EQUIPMENT
MEDICAL ELECTRICAL EQUIPMENT - PART 2: PARTICULAR REQUIREMENTS FOR THE SAFETY OF X-RAY SOURCE ASSEMBLIES AND X-RAY TUBE ASSEMBLIES FOR MEDICAL DIAGNOSIS
MEDICAL ELECTRICAL EQUIPMENT - PART 2-29: PARTICULAR REQUIREMENTS FOR THE SAFETY OFRADIOTHERAPY SIMULATORS
MEDICAL ELECTRICAL EQUIPMENT - PART 2: PARTICULAR REQUIREMENTS FOR THE SAFETY OFEXTERNAL CARDIAC PACEMAKERS WITH INTERNAL POWER SOURCE
MEDICAL ELECTRICAL EQUIPMENT PART 2: PARTICULAR REQUIREMENTS FOR THE SAFETY OFASSOCIATED EQUIPMENT OF X-RAY EQUIPMENT
MEDICAL ELECTRICAL EQUIPMENT - PART 2: PARTICULAR REQUIREMENTS FOR THE SAFETY OFMAGNETIC RESONANCE EQUIPMENT FOR MEDICAL DIAGNOSIS
MEDICAL ELECTRICAL EQUIPMENT - PART 2: PARTICULAR REQUIREMENTS FOR THE SAFETY,INCLUDING ESSENTIAL PERFORMANCE, OF INVASIVE BLOOD PRESSURE MONITORING EQUIPMENT
MEDICAL ELECTRICAL EQUIPMENT - PART 2: PARTICULAR REQUIREMENTS FOR THE SAFETY OFEQUIPMENT FOR EXTRACORPOREALLY INDUCED LITHOTRIPSY
MEDICAL ELECTRICAL EQUIPMENT - PART 2-37: PARTICULAR REQUIREMENTS FOR THE BASICSAFETY AND ESSENTIAL PERFORMANCE OF ULTRASONIC MEDICAL DIAGNOSTIC AND MONITORINGEQUIPMENT
MEDICAL ELECTRICAL EQUIPMENT - PART 2-39: PARTICULAR REQUIREMENTS FOR THE SAFETY OFPERITONEAL DIALYSIS EQUIPMENT
MEDICAL ELECTRICAL EQUIPMENT - PART 2-40: PARTICULAR REQUIREMENTS FOR THE SAFETY OFELETROMYOGRAPHS AND EVOKED RESPONSE EQUIPMENT
MEDICAL ELECTRICAL EQUIPMENT - PART 2-41: PARTICULAR REQUIREMENTS FOR THE SAFETY OFSURGICAL LUMINAIRES AND LUMINAIRES FOR DIAGNOSIS
MEDICAL ELECTRICAL EQUIPMENT - PART 2-43: PARTICULAR REQUIREMENTS FOR THE SAFETY OFX-RAY EQUIPMENT FOR INTERVENTIONAL PROCEDURES
MEDICAL ELECTRICAL EQUIPMENT - PART 2-44: PARTICULAR REQUIREMENTS FOR THE SAFETY OFX-RAY EQUIPMENT FOR COMPUTED TOMOGRAPHY

33
rigelmedical.comI nnova t ing Togethe r
IEC 60601-2-45
IEC 60601-2-46
IEC 60601-2-47 (RDIS)
IEC 60601-2-49
IEC 60601-2-50
IEC 60601-2-51
IEC 60601-2-52
IEC 60601-2-53
IEC 60601-2-54
IEC 60601-2-56
IEC 60601-2-57
IEC 60601-2-62 (ACDV)
IEC 60601-2-63 (CCDV)
IEC 60601-2-65 (CCDV)
MEDICAL ELECTRICAL EQUIPMENT - PART 2-45: PARTICULAR REQUIREMENTS FOR THE SAFETY OFMAMMOGRAPHIC X-RAY EQUIPMENT AND MAMMOGRAPHIC STEREOTACTIC DEVICES
MEDICAL ELECTRICAL EQUIPMENT - PART 2-46: PARTICULAR REQUIREMENTS FOR THE SAFETY OFOPERATING TABLES
MEDICAL ELECTRICAL EQUIPMENT - PART 2-47: PARTICULAR REQUIREMENTS FOR THE SAFETY,INCLUDING ESSENTIAL PERFORMANCE, OF AMBULATORY ELECTROCARDIOGRAPHIC SYSTEMS
MEDICAL ELECTRICAL EQUIPMENT - PART 2-49: PARTICULAR REQUIREMENTS FOR THE SAFETY OFMULTIFUNCTION PATIENT MONITORING EQUIPMENT
MEDICAL ELECTRICAL EQUIPMENT - PART 2-5O: PARTICULAR REQUIREMENTS FOR THE SAFETY OFINFANT PHOTOTHERAPY EQUIPMENT
MEDICAL ELECTRICAL EQUIPMENT - PART 2-51: PARTICULAR REQUIREMENTS FOR SAFETY,INCLUDING ESSENTIAL PERFORMANCE, OF RECORDING AND ANALYSING SINGLE CHANNEL ANDMULTICHANNEL ELECTROCARDIOGRAPHS
MEDICAL ELECTRICAL EQUIPMENT - PART 2-52: PARTICULAR REQUIREMENTS FOR BASIC SAFETYAND ESSENTIAL PERFORMANCE OF MEDICAL BEDS
MEDICAL ELECTRICAL EQUIPMENT, PART 2-53: PARTICULAR REQUIREMENTS FOR THE SAFETY ANDESSENTIAL PERFORMANCE OF A STANDARD COMMUNICATIONS PROTOCOL FOR COMPUTERASSISTED ELECTROCARDIOGRAPHY
MEDICAL ELECTRICAL EQUIPMENT - PART 2-54: PARTICULAR REQUIREMENTS FOR BASIC SAFETYAND ESSENTIAL PERFORMANCE OF X-RAY EQUIPMENT FOR RADIOGRAPHY AND RADIOSCOPY
MEDICAL ELECTRICAL EQUIPMENT - PART 2-56: PARTICULAR REQUIREMENTS FOR BASIC SAFETYAND ESSENTIAL PERFORMANCE OF SCREENING THERMOGRAPHS FOR HUMAN FEBRILETEMPERATURE SCREENING
PARTICULAR REQUIREMENTS FOR THE SAFETY AND ESSENTIAL PERFORMANCE OF INTENSE LIGHTSOURCES USED ON HUMANS AND ANIMALS FOR MEDICAL AND COSMETIC PURPOSES
MEDICAL ELECTRICAL EQUIPMENT - PART 2-62: PARTICULAR REQUIREMENTS FOR BASIC SAFETYAND ESSENTIAL PERFORMANCE OF HIGH INTENSITY THERAPEUTIC ULTRASOUND (HITU) SYSTEMS
MEDICAL ELECTRICAL EQUIPMENT - PART 2-63: PARTICULAR REQUIREMENTS FOR BASIC SAFETYAND ESSENTIAL PERFORMANCE OF DENTAL EXTRA-ORAL X-RAY EQUIPMENT
MEDICAL ELECTRICAL EQUIPMENT - PART 2-65: PARTICULAR REQUIREMENTS FOR BASIC SAFETYAND ESSENTIAL PERFORMANCE OF DENTAL INTRA-ORAL X-RAY EQUIPMENT

34
Appendix CYSI 400 & 700 resistance reference table
-1˚C
0˚C
1˚C
2˚C
3˚C
4˚C
5˚C
6˚C
7˚C
8˚C
9˚C
10˚C
11˚C
12˚C
13˚C
14˚C
15˚C
16˚C
17˚C
18˚C
19˚C
20˚C
21˚C
22˚C
23˚C
24˚C
25˚C
7741Ω7355Ω6989Ω6644Ω6319Ω6011Ω5719Ω5444Ω5183Ω4937Ω4703Ω4482Ω4273Ω4074Ω3886Ω3708Ω3539Ω3378Ω3226Ω3081Ω2944Ω2814Ω2690Ω2572Ω2460Ω2354Ω2252Ω
20620Ω19590Ω18620Ω17700Ω16830Ω16010Ω15240Ω14500Ω13810Ω13150Ω12530Ω11940Ω11380Ω10850Ω10350Ω9878Ω9428Ω9000Ω8594Ω8210Ω7844Ω7496Ω7166Ω6852Ω6554Ω6270Ω6000Ω
99800Ω94980Ω90410Ω86090Ω81990Ω78110Ω74440Ω70960Ω67660Ω64530Ω61560Ω58750Ω56070Ω53540Ω51130Ω48840Ω46670Ω44600Ω42640Ω40770Ω38990Ω37300Ω35700Ω34170Ω32710Ω31320Ω30000Ω
Temp 'CYSI 400
ResistanceYSI 700
Resistance AYSI 700
Resistance B
26˚C
27˚C
28˚C
29˚C
30˚C
31˚C
32˚C
33˚C
34˚C
35˚C
36˚C
37˚C
38˚C
39˚C
40˚C
41˚C
42˚C
43˚C
44˚C
45˚C
46˚C
47˚C
48˚C
49˚C
50˚C
51˚C
2156Ω2064Ω1977Ω1894Ω1815Ω1739Ω1667Ω1599Ω1533Ω1471Ω1412Ω1355Ω1301Ω1249Ω1200Ω1152Ω1107Ω1064Ω1023Ω983.8Ω946.2Ω910.2Ω875.8Ω842.8Ω811.3Ω781.1Ω
5744Ω5500Ω5266Ω5046Ω4834Ω4634Ω4442Ω4260Ω4084Ω3918Ω3760Ω3610Ω3466Ω3328Ω3196Ω3070Ω2950Ω2836Ω2726Ω2620Ω2520Ω2424Ω2334Ω2246Ω2162Ω2080Ω
28740Ω27540Ω26400Ω25310Ω24270Ω23280Ω22330Ω21430Ω20570Ω19740Ω18960Ω18210Ω17490Ω16800Ω16150Ω15520Ω14920Ω14350Ω13800Ω13280Ω12770Ω12290Ω11830Ω11390Ω10970Ω10570Ω
Temp 'CYSI 400
ResistanceYSI 700
Resistance AYSI 700
Resistance B

35
rigelmedical.comI nnova t ing Togethe r
Appendix DExample documentation template
Appendix D Example documentation template
Testing organization: Test before putting into service (reference value)Recurrent Test
Test after repairName of testing person:
Responsible organization:
Equipment:
Type: Production No./Serial Nr.:
Manufacturer: Class of protection: I II Battery
Applied part type: 0 B BF CF
Accessories:
Visual inspection:
Functional Test (parameters tested):
Deficiency / Note:
Overall Assessment:
Name:
PIE PERMANENT INSTALLED EQUIPMENTNPS NON-DETACHABLE POWER SUPPLY CORDDPS DETACHABLE POWER SUPPLY CORD
Date/Signature:
Next recurrent test necessary in 6 / 12 / 24 / 36 months
No safety or functional deficiencies were detected
No direct risk, deficiencies detected may be corrected on short term
Equipment shall be taken out of operation until deficiencies are corrected
Equipment does not comply – Modifications / Exchange of components / Taking out of service – is recommended
Measurements: Measured value
Protective ground resistance Ω
Equipment leakage current (according to Figure.....) mA
Patient leakage current (according to Figure....) mA
Insulation resistence (according to Figure.....) MΩ
Test:Measurement equipment:
Complies
Yes No
Mains connection: PIE NPS DPS
ID Number:
1)
1)
BibliographyJacobson, B., & Murray, A. (2007). Medical Devices; Use and Safety, Churchill Livingstone: Elsevier.
Webster,G.J., (Ed.). (1997). Design of Pulse Oximeters (1st ed.), New York: Medical Science Series
12-Lead ECG System, http://www.bem.fi/book/15/15.htm (Aug 2011)

36
Rigel UNI-SIMVital Signs Simulator
The world’s first combined, fully functionalNIBP, SpO2 and patient simulator in a singlehand-held unit. Extremely accurate and featuringfull synchronized functionality. A breakthrough inthe way safety testing is implemented, theUNI-SIM saves time and money, as well assimplifying the testing process.
Features include:
Light, hand-held, battery operation
Combined NIBP, SpO2 and
patient simulator in one unit
User configurable simulations
Full sychronised functionality
Memory for up to 10,000 devices
Rigel BP-SIMNIBP Simulator
The first hand-held NIBP simulator to incorporatecustom settings, including pediatric and adultNIBP pressure simulations, pulse volumeadjustments, heart rate and manufacturer-specific envelopes. Large capacity internalmemory for data capture, storage anddownloading of test results via Bluetooth.
Features include:
Light, hand-held, battery operation
Adult & pediatric NIBP simulations
Manufacturer specific O-curves
Overpressure and leak test
Memory for up to 10,000 devices
Med-ekitcompatible
Med-eBasecompatible
Mainspowered
Barcodescanner
Batterypowered
Bluetoothcompatible
Vital SignsSimulators

37
rigelmedical.comI nnova t ing Togethe r
Please visit rigelmedical.com for more information
Rigel SP-SIMSpO2 Simulator
The first hand-held SpO2 simulator featuringpulse volume adjustments, heart rate andmanufacturer-specific R-curves. The largecapacity internal memory enables test resultsto be captured, stored and downloadedvia Bluetooth.
Features include:
Light, hand-held, battery operation
Tests probe and monitor both at the same time
User configurable simulations
Manufacturer R-curves
Memory for up to 10,000 devices
Rigel 333Patient Simulator
The 333 is one of the smallest, most powerfuland fully comprehensive patient simulatorsavailable. Providing a true 12 lead ECG signalwith 43 arrhythmias, dual invasive bloodpressure, respiration, temperature andindustry standard waveforms.
Features include:
Light, hand-held, battery operation
Accurate 12-lead simulation of 43 arrhythmias
Invasive blood pressure
Temperature & respiration
Performance wave forms

38
Electrical SafetyAnalyzers
Rigel 266 PlusElectrical SafetyAnalyzer
The Rigel 266 Plus is ahighly compact,easy-to-use safetyanalyzer designed to testin accordance withIEC/EN 60601-1, MDADB9801 and AS/NZ3200. This compact unitprovides a highly effectiveand portable test solution.
Features include: Small and compact Conform IEC 60601,
MDA DB 9801 1-25A ground bond
test current Up to 5 applied parts Direct print facility
Rigel 288Electrical SafetyAnalyzer
The 288 is the first trulyhand-held medicalelectrical safety analyzer tocombine the features of anautomatic/manual testerwith a data logging/assetmanagement facility.Control is through a menudriven GUI. A large datamemory and Bluetoothfacility make this aneffective mobile unit.
Features include: Light, hand-held,
battery operation Conform IEC 62353 /
60601/ VDE 0751 /NFPA-99 /AS-NZS 3551
Memory for up to10,000 devices
Bluetoothcommunication
Full, semi automatic &manual tests
Rigel 277 PlusElectrical SafetyAnalyzer
The Rigel 277 Plus is afully comprehensiveelectrical medical safetyanalyzer used within thewidest possible range ofapplications. The ability tomanage results and printrecords means that theuser can manage the testand re-test proceduremore productively.
Features include: Conform IEC 60601 /
61010 / AAMI /NFPA-99 /S-NZS 3200
Onboard printer &QWERTY keyboard
100mA to 25Aground bond current
Full, semi automatic &manual tests
Memory for up to2,500 devices
Rigel 62353Electrical SafetyAnalyzer
The Rigel 62353 is a costeffective automatic safetyanalyzer dedicated to theIEC 62353 standard forroutine and testing afterrepair of medical devices.Offering automatic testsequences, data entryand storage as well as PCdownload capabilities.
Features include: Light, hand-held,
battery operation Conform IEC 62353 Fully customisable test
sequences Data entry and storage PC download Full, semi automatic
& manual tests

39
Rigel Multi-FloInfusion PumpAnalyzer
The market defining RigelMulti-Flo infusion pumpanalyzer is a portableinstrument to accuratelyand swiftly verify theperformance of all infusiondevices. Offeringinstantaneous flow andavailable in 1, 2 and 4individual channelconfiguration. The Multi-Floboasts a large colorscreen, providing preciseinformation on flow rate,occlusion and backpressure and trumpetcurves.
Features include: IEC 60601-2-24
compliant Instant flow and
pressure Compatible with all
infusion devices On-screen trumpet
curve Onboard data storage
PerformanceAnalyzers
rigelmedical.com
Rigel Uni-PulseDefibrillator Analyzer
The innovative Rigel Uni-Pulsedefibrillator analyzer is themost compact andversatile instrument on themarket, able to accuratelyverify all mono and bi-phasic defibrillators andAED’s. Features include:onscreen waveformcapture, built-in 12-leadECG simulator, onboardmemory and optionalvariable load box ensuringthe Rigel Uni-Pulse meets allthe requirementsof IEC 60601-2-4.
Features include: IEC 60601-2-4
compliant Mono and bi-phasic Waveform capture,
store & replay Built-in 12 lead ECG
simulator Auto AED testing
Rigel Uni-ThermElectrosurgicalAnalyzer
The Rigel Uni-Thermoffers the latesttechnology in highfrequency powermeasurement. It’s small,easy-to-use, has a largecolor display andinnovative navigationmaking this a fast,efficient test tool fortesting the performanceof all diathermy machines.A large internal memoryand PC communicationprovides traceability of thetest data.
Features include: HF leakage test Power distribution from
0-5100Ω Current measurement
up to 6A RMS Return plate security
test (Rem) Onboard data storage

40
Med-eKit Elite
The Med-eKit Elite is ahandy and morespecialised carryingsolution. It has a hard-wearing pelican casewhich can be customisedto hold up to twoindividual testers (theRigel 288 and UNI-SIM,for instance). It can alsoinclude a label and resultsprinter, barcode scannerand PC software.
Features include: Configurable with up
to 4 tester functions Lightweight design Durable and robust
enclosure Water-proof design Secure locking
Med-eKit Lite
This new case is astandard accessory forthe Rigel 288,UNI-SIM and Uni-Pulsebiomedical testinginstruments. It can beconfigured to hold anumber of different itemsof test equipment andaccessories likea label results printer anda barcode scanner.
Features include: Carry securely on
back/ easy accessfrom front
Configurablecompartments fortesters and accessories
Extremely lightweightdesign
Suitable for up to 5tester functions
Durable and waterrepellent design
Med-eKit Plus
The Med-eKit Plus is asolution package offeringa complete test set thatincludes electrical safety,vital signs simulator,ventilator test and more. Itcan also feature a laptopof your specificationand our latest assetmanagement software.You could make life a lotmore efficient for yourselfif you included a range ofaccessories like thecompact barcode scannerand results/label printer.
Features include: Cost effective package
deal Configurable including
up to 5 tester functions Optional laptop
included Extremely lightweight
design Durable and water
repellent design
Med-eKit Pro
If you’re after a completebiomedical workshop onwheels, take a look at ourconfigurable Rigel Med-eKit Pro. Housed in adurable and handy trolleycase, it accommodates upto 10 different testers andsimulators, so you cancarry your analyzer, vitalsigns simulator, defibanalyzer, ventilator testerand more, safely andconveniently.
Features include: Integral wheels and
extendable handle foreasy use
Configurable with upto 10 tester functions
Durable and robustenclosure
Water-proof design Secure locking
Med-eKit Solutions

41
You saw database management and work orderschedules as a major benefit, as they lead to fast,efficient test device configuration. You asked for timeand money-saving software to provide monthly scheduletests you could upload to your testers for easy re-test.
You also wanted preventative maintenance whichanalysed and compared results and which also sent youan alarm when devices could be deteriorating or neededto be replaced.
And you asked for test certificate software customisablefor details and logos in PDF format.
So we created Med-eBase software which can beused in a number of database environments,including: SQL and SQLite. This way your data’s secureand easily accessible. It can also be easily interrogatedby third party software which makes compatibility withother software packages easy and straightforward.
AssetManagementSoftware
rigelmedical.com

Rigel Medical, Seaward Group USA,6304 Benjamin Road, Suite 506,Tampa, Florida, 33634, United States
Tel: 813-886-2775 Email: [email protected]: rigelmedical.com
Version 1.2 - 2012
Part of


