12
Banksia Precinct - NSW Department of Planning and Environment Demographic Profile Banksia Precinct Demographic Profile

Banksia Precinct - NSW Department of Planning and Environment Demographic Profile
Banksia Precinct Demographic Profile
Banksia Precinct - NSW Department of Planning and Environment Demographic Profile
Contents
1 Introduction .............................................................................................................................. 1 2 Age structure ............................................................................................................................ 3 3 Culture and Language ............................................................................................................... 4 4 Education .................................................................................................................................. 5 5 Employment ............................................................................................................................. 6 6 Transport .................................................................................................................................. 6 7 Households and Dwellings ........................................................................................................ 7 8 Socio-Economic Advantage ...................................................................................................... 9 9 Projected Population ................................................................................................................ 9
List of figures
Figure 1 Location of the Banksia Precinct ............................................................................................ 1
Figure 2 Banksia Precinct map identifying the Australian Bureau of Statistics’ Statistical Area ..........
Level 1 (SA1) and Bureau of Transport’s Travel Zones .......................................................... 2
Figure 3 Population pyramids, 2011 .................................................................................................... 3
Figure 4 Language spoken at home, 2011 ........................................................................................... 4
Figure 5 Levels of education, 2011 ...................................................................................................... 5
Figure 6 Mode of transport to work , 2011 ......................................................................................... 6
Figure 7 Private motor vehicle ownership by occupied private dwellings, 2011 ................................ 7
Figure 8 Types of dwellings, 2011 ........................................................................................................ 7
Figure 9 Composition of household, 2011 ........................................................................................... 8
Figure 10 Average household size, 2011 ............................................................................................... 8
Figure 11 Distribution of dwellings by tenure type, 2011 ..................................................................... 8
Figure 12 Projected population of Rockdale, by age group 2016-2036 ................................................ 9
List of tables
Table 1 Population by age group, 2011 .............................................................................................. 3
Table 2 Median Age (years), 2011 ...................................................................................................... 3
Table 3 Population by place of birth, 2011 ......................................................................................... 4
Table 4 Population with one or both parents born overseas, 2011 ................................................... 4
Table 5 Top 10 Countries of Birth of people who live in Banksia Precinct ......................................... 4
Table 6 Top 10 Languages spoken at home in Banksia, 2011 ............................................................ 5
Table 7 Highest post-school qualification attained , 2011 .................................................................. 5
Table 8 Type of education institution being attended by student population, 2011 ........................ 6
Table 9 Employment status of the population in labour force, 2011................................................. 6
Table 10 Top 5 industries of employment in Banksia ........................................................................... 6
Table 11 Share of families experiencing housing stress, 2011 ............................................................. 9

1 Banksia Precinct - NSW Department of Planning and Environment Demographic Profile
1 Introduction This profile provides background population statistics to assist in planning the redevelopment of the Banksia Precinct as defined
by NSW Department of Planning and Environment. This is largely based on information drawn for the 2011 Census of Population
and Housing with the latest information relating to NSW population projections up to 2036.
The Banksia Precinct comprises the suburb of Banksia in Sydney’s south and includes the area surrounding the Banksia Railway
Station along the Eastern-Suburbs and Illawarra Line.
The precinct is located within the Bayside Council Local Government Area (the former Rockdale Local Government Area). This
profile is based on data relating to the former Rockdale Local Government Area.
Figure 1 Location of the Banksia Precinct

2 Banksia Precinct - NSW Department of Planning and Environment Demographic Profile
For the purpose of this profile:
the Banksia precinct (see Figure 2) refers to the following:
- Australian Bureau of Statistics (ABS) Statistical Areas Level 1 (SA1s): 1137501, 1137502, 1137510, 1137531, 1138105,
1138106, 1138109, 1138112, 1138134, 1138135, 1138136, 1138137, 1138138.
Bureau of Transport Statistics (BTS) Travel Zones: 2712, 2761, 2713, 2764, 2763, 2762.
Rockdale refers to Rockdale local government area, as defined on 1 July 2011.
Sydney refers to the Sydney Metropolitan planning region.
Figure 2 Banksia Precinct map identifying the Australian Bureau of Statistics’ Statistical Area Level 1 (SA1) and Bureau of Transport’s Travel Zones

3 Banksia Precinct - NSW Department of Planning and Environment Demographic Profile
2 Age structure In 2011, the Banksia Precinct was home to 5,938 residents, representing 6% of the entire Rockdale population.
In 2011, two out of three Banksia residents were of working age, with a high number aged in their late 20s to early 30s (Table 1
and Figure 3). The precinct’s age profile mirrored that of Sydney as a whole with larger populations in the younger working ages.
A larger proportion of people living in Banksia were aged 65 years or older compared to Sydney as a whole. Overall, the
‘average’ Banksia resident was younger compared to Rockdale and Sydney as a whole (Table 2).
Table 1 Population by age group, 2011
Number Age Distribution
Banksia Rockdale Sydney Banksia Rockdale Sydney
Under 15 1,100 17,635 801,837 18.5% 17.0% 18.7%
15-39 2,257 39,564 1,622,604 38.0% 38.2% 37.9%
40-64 1,787 30,822 1,336,048 30.1% 29.8% 31.2%
65 and older 794 15,460 525,728 13.4% 14.9% 12.3%
Total 5,938 103,481 4,286,217
Table 2 Median Age (years), 2011
Banksia Rockdale Sydney
33.5 36.6 35.7
Figure 3 Population pyramids, 2011
Banksia
Rockdale
Sydney

4 Banksia Precinct - NSW Department of Planning and Environment Demographic Profile
3 Culture and Language In 2011, 53 percent of Banksia residents were Australian-born, which is a considerably smaller figure than for Sydney as whole
(Table 3). Additionally, a higher proportion of Banksia residents (79%) were the children of migrants. The overseas-born
population (2,561 residents) in Banksia was culturally diverse, coming from parts of the Middle East, Europe and Asia.
Table 3 Population by place of birth, 2011
Table 4 Population with one or both parents born overseas, 2011
Table 5 Top 10 Countries of Birth of people who live in Banksia Precinct
1. Australia (53.2%)
2. Former Yugoslavia Republic of Macedonia (7.5%)
3. Lebanon (4.4%)
4. China (excludes SARs and Taiwan) (4.4%)
5. Bangladesh (3.1%)
6. Greece (2.6%)
7. Philippines (2.5%)
8. Nepal (2.2%)
9. Italy (2.1%)
10. Indonesia (1.4%)
This cultural diversity is also reflected in the high proportion of Banksia residents who spoke a language other than English at
home. This is comparable to the Rockdale LGA as a whole, and is much higher than the level of non-English speakers in Sydney
overall. Of the people who spoke a language other than English, the share who also spoke English very well (54%) was similar to
Sydney as a whole (56%). This is also reflective of the larger share of residents with at least one parent born overseas.
Banksia Rockdale Sydney
Figure 4 Language spoken at home, 2011
Area Australia Overseas
Banksia 53.2% 46.8%
Rockdale 53.3% 46.7%
Sydney 62.0% 38.0%
Area At least one parent born overseas
Banksia 78.7%
Rockdale 76.6%
Sydney 63.5%

5 Banksia Precinct - NSW Department of Planning and Environment Demographic Profile
Table 6 Top 10 Languages spoken at home in Banksia, 2011
1. English (39.0%)
2. Macedonia (12.7%)
3. Arabic (12.5%)
4. Greek (5.6%)
5. Cantonese (4.1%)
6. Bengali (3.3%)
7. Italian (2.9%)
8. Mandarin (2.7%)
9. Nepali (2.2%)
10. Spanish (1.8%)
4 Education Most of the adult population (aged 15 years or older) in Banksia had completed at least Year 10 at school (82%) and over 45%
had a post school qualification (Figure 5 and Table 7). This revealed residents of Banksia experienced slightly lower rates of post-
school qualification attainment compared to Rockdale (51.1%) and Sydney as a whole (54.9%) (refer to Table 7).
Banksia Rockdale Sydney
Figure 5 Levels of education, 2011
Table 7 Highest post-school qualification attained(1) , 2011
Postgraduate Degree Level
Graduate Diploma and Graduate Certificate Level
Bachelor Degree Level
Advanced Diploma and Diploma Level
Certificate Level
No Post-school Qualification
Banksia 4.6% 1.3% 16.0% 10.0% 15.2% 52.9%
Rockdale 5.9% 1.2% 17.3% 10.8% 15.8% 48.9%
Sydney 6.6% 1.8% 19.8% 10.2% 16.4% 45.1% (1)Of the total population aged 15 years and over.
The number of residents attending an educational institution reflected the age profile of Banksia’s population. Less young
children and a higher population of residents in their late teens to 20s means a larger share of the population were attending
secondary and post-school institutions in 2011, similar to Sydney as a whole.

6 Banksia Precinct - NSW Department of Planning and Environment Demographic Profile
Table 8 Type of education institution(1) being attended by student population, 2011
Preschool Primary school
Secondary school
Technical or further education institution
Tertiary Institution
Banksia 6.4% 29.5% 23.3% 10.6% 24.9%
Rockdale 6.6% 30.1% 23.9% 11.4% 23.1%
Sydney 7.2% 31.5% 26.0% 9.8% 21.9% (1)Excludes “other” institutions.
5 Employment In 2011, 2,890 Banksia residents were part of the labour force. They represented 64.7% of the Banksia population that were
aged 15 years and above—revealing a slightly lower labour force participation rate compared to Sydney as whole (66%) (Table
9).
Table 9 Employment status of the population in labour force, 2011
Employed Unemployed
Banksia 94.3% 5.7%
Rockdale 94.1% 5.9%
Sydney 94.3% 5.7%
Table 10 Top 5 industries of employment in Banksia
1. Transport, Postal and Warehousing (11.1%) 2. Health Care and Social Assistance (10.2%) 3. Accommodation and Food Services (9.6%) 4. Retail Trade (9.3%) 5. Manufacturing (7.3%)
There was a higher concentration of residents in Banksia who worked in transport, postal and warehousing, and accommodation
and food services industries compared to Sydney as a whole.
6 Transport Workers in Banksia were no different to those in Rockdale and Sydney as a whole – the car was the most common mode of
transport used to get to work (more than 60% of residents in all areas). On the other hand, Banksia residents were also more
likely to take the train, and less likely to take the bus to work. Banksia had a higher proportion of its residents taking the train
(31%) compared to Sydney commuters overall (17%).
Figure 6 Mode of transport to work , 2011

7 Banksia Precinct - NSW Department of Planning and Environment Demographic Profile
Households were more likely to own a motor vehicle in Banksia compared to Sydney as a whole (Figure 7). In 2011, most
dwellings in the precinct owned two or more vehicles.
Figure 7 Private motor vehicle ownership by occupied private dwellings, 2011
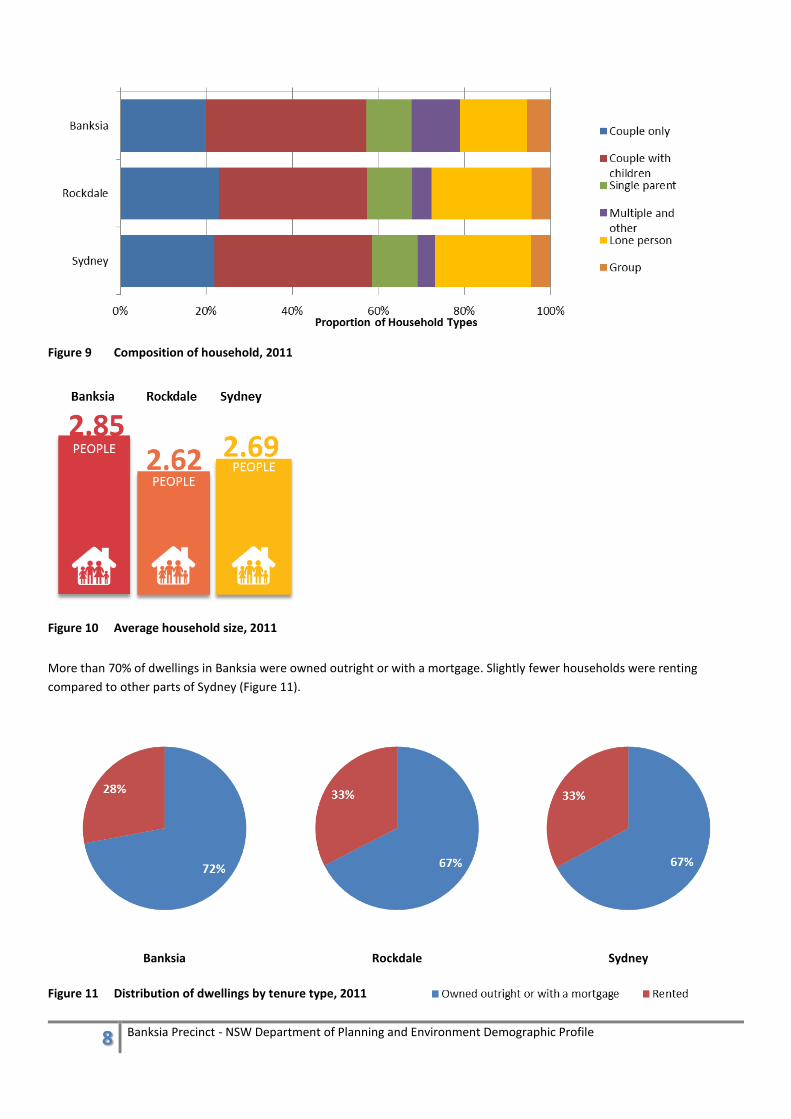
7 Households and Dwellings There were 2,044 dwellings in Banksia in 2011. Most of these (68%) were separate houses, with close to a quarter of dwellings
being flats/units/apartments. The proportion of high density dwellings in Banksia (23%) was much lower compared to Sydney
(30%) and Rockdale (39%) (Figure 8).
Banksia Rockdale Sydney
Figure 8 Types of dwellings, 2011
The data reveals a strong relationship between the main household types of an area, the population’s age profile and housing
stock available. Nuclear families (couple with children) made up more than one-third of all households in Banksia, similar to the
Rockdale and Sydney as a whole. Banksia had a higher proportion of group households (5.5%) compared to both Rockdale and
Sydney as a whole (4.4% and 4.6% respectively). As a result, the average household size (2.9 persons per household) was larger
in Banksia than both Rockdale and Sydney as a whole (2.9 persons per household).
8 Banksia Precinct - NSW Department of Planning and Environment Demographic Profile
Figure 9 Composition of household, 2011
Figure 10 Average household size, 2011
More than 70% of dwellings in Banksia were owned outright or with a mortgage. Slightly fewer households were renting
compared to other parts of Sydney (Figure 11).
Banksia Rockdale Sydney
Figure 11 Distribution of dwellings by tenure type, 2011

9 Banksia Precinct - NSW Department of Planning and Environment Demographic Profile
8 Socio-Economic Advantage There are slightly fewer families in Banksia experiencing housing stress compared to Rockdale. However, the proportion of
families experiencing housing stress in Banksia is slightly higher than that of Sydney as a whole. Overall, all three areas have
more than 40% of families experiencing housing stress in relation to rent levels. This relates to the median income a family earns
in Banksia being similar to Rockdale and Sydney as a whole, earning between the income range of $65,000 - $77,999 per year.
Table 11 Share of families experiencing housing stress, 2011
9 Projected Population Rockdale’s population is expected to grow by 41,000 people over the next 20 years, from 114,450 to 155,450 by 2036. This 36%
increase is marginally less than the growth expected in the Sydney region over the same period (37%).
Like everywhere else, the population of Rockdale is ageing. By 2036, there may be 29,700 residents aged 65 years or older in
Rockdale, making up 19.1% of its total population; this older population made up 15.5% of Rockdale’s population in 2016.
In terms of age structure, Rockdale is projected to have a lower proportion of young people aged 0-29 years, a greater number
of people aged between 30-44 and 75+ and a similar number of people aged 45-74 years compared to Sydney as a whole by
2036.
Figure 12 Projected population of Rockdale, by age group 2016-2036
Area Families experiencing housing stress
Banksia 46.6%
Rockdale 50.6%
Sydney 44.7%

10 Banksia Precinct - NSW Department of Planning and Environment Demographic Profile
Date prepared: October 2014
Updated: October 2016
Sources:
Australian Bureau of Statistics, 2012, Census of Population and Housing 2011, customised tables, ABS, Canberra.
<http://www.abs.gov.au/websitedbs/censushome.nsf/home/Census>
Bureau of Transport Statistics, 2012, 2011 Journey to Work data, BTS, Sydney.
<http://www.bts.nsw.gov.au/Statistics/Journey-to-Work#top>
NSW Department of Planning and Environment, 2016, 2016 NSW and local government area population projections, Sydney.
<http://www.planning.nsw.gov.au/Research-and-Demography/Demography/Population-projections>


