ACE Paper 9/2017 – Annex 1 Annex 1 - 1 of 12 Annex 1 Summary of CWD Monitoring Findings SUMMARY OF SKYPIER PLAN IMPLEMENTATION 1. According to the real-time data collected from all the diverted SkyPier HSFs [note that Automatic Identification System (AIS) is installed on all diverted HSFs] from March to December 2016, the average speeds of all diverted HSFs (apart from three trips) within the SCZ complied with the 15-knot speed limit, with most of the average speeds ranging from 11 to 14 knots. In total, three SkyPier HSF trips were recorded with marginal exceedances of the speed limit in March, June and November 2016. Investigations have been carried out and found that these speeding cases were due to safety reasons, e.g. the need to give way to other vessels encountered in the SCZ. 2. The instantaneous speed (the instant speed with AIS signal transmitted) of all concerned HSFs has also been recorded. Investigation of instantaneous speeding found that all cases were related to navigation or public safety reasons (i.e. strong wind / waves and tidal currents or the need to give way to other vessels), except for seven cases recorded during the period of March to December 2016, in which the ferry captains were either not familiar with the SCZ boundary or was distracted by other boats nearby, or late decelerating of speed at the speed control zone gate. Skipper re-trainings and reminders have been given to the concerned captains to reiterate the exact locations of the entry and exit points of the SCZ. 3. The annual daily average number of SkyPier HSF movements in 2016 was 91, well below the annual daily average cap of 99 SkyPier HSF movements. 4. The SkyPier Plan will continue to be implemented throughout the construction period with monitoring carried out on an ongoing basis as part of the environmental monitoring and audit programme for the 3RS project. Skipper workshops will continue to be conducted. Detailed SkyPier HSF monitoring data, including suspected instantaneous and average speeding investigation findings, are presented in the Monthly EM&A reports, which are available for public viewing in the 3RS project dedicated website (http://env.threerunwaysystem.com/en/index.html).
Transcript
ACE Paper 9/2017 – Annex 1
Annex 1 - 1 of 12
Annex 1 Summary of CWD Monitoring Findings SUMMARY OF SKYPIER PLAN IMPLEMENTATION 1. According to the real-time data collected from all the diverted SkyPier HSFs [note that Automatic Identification System (AIS) is installed on all diverted HSFs] from March to December 2016, the average speeds of all diverted HSFs (apart from three trips) within the SCZ complied with the 15-knot speed limit, with most of the average speeds ranging from 11 to 14 knots. In total, three SkyPier HSF trips were recorded with marginal exceedances of the speed limit in March, June and November 2016. Investigations have been carried out and found that these speeding cases were due to safety reasons, e.g. the need to give way to other vessels encountered in the SCZ.
2. The instantaneous speed (the instant speed with AIS signal transmitted) of all concerned HSFs has also been recorded. Investigation of instantaneous speeding found that all cases were related to navigation or public safety reasons (i.e. strong wind / waves and tidal currents or the need to give way to other vessels), except for seven cases recorded during the period of March to December 2016, in which the ferry captains were either not familiar with the SCZ boundary or was distracted by other boats nearby, or late decelerating of speed at the speed control zone gate. Skipper re-trainings and reminders have been given to the concerned captains to reiterate the exact locations of the entry and exit points of the SCZ. 3. The annual daily average number of SkyPier HSF movements in 2016 was 91, well below the annual daily average cap of 99 SkyPier HSF movements. 4. The SkyPier Plan will continue to be implemented throughout the construction period with monitoring carried out on an ongoing basis as part of the environmental monitoring and audit programme for the 3RS project. Skipper workshops will continue to be conducted. Detailed SkyPier HSF monitoring data, including suspected instantaneous and average speeding investigation findings, are presented in the Monthly EM&A reports, which are available for public viewing in the 3RS project dedicated website (http://env.threerunwaysystem.com/en/index.html).
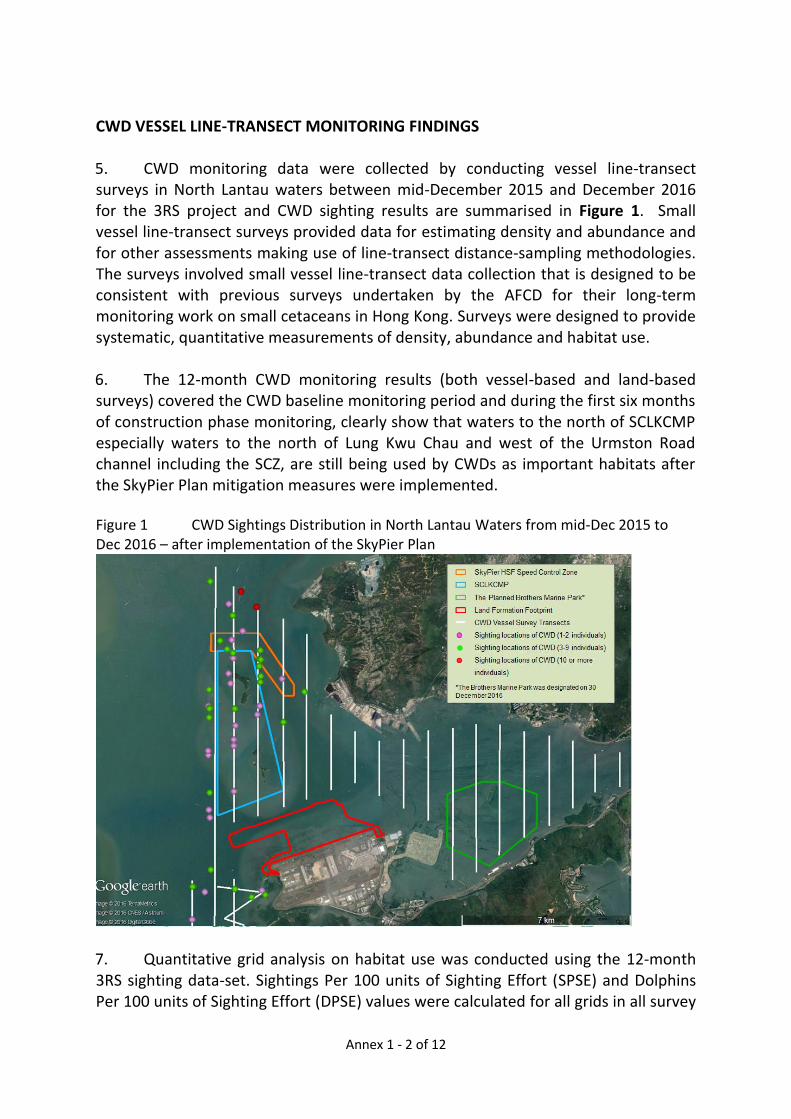
CWD VESSEL LINE-TRANSECT MONITORING FINDINGS 5. CWD monitoring data were collected by conducting vessel line-transect surveys in North Lantau waters between mid-December 2015 and December 2016 for the 3RS project and CWD sighting results are summarised in Figure 1. Small vessel line-transect surveys provided data for estimating density and abundance and for other assessments making use of line-transect distance-sampling methodologies. The surveys involved small vessel line-transect data collection that is designed to be consistent with previous surveys undertaken by the AFCD for their long-term monitoring work on small cetaceans in Hong Kong. Surveys were designed to provide systematic, quantitative measurements of density, abundance and habitat use. 6. The 12-month CWD monitoring results (both vessel-based and land-based surveys) covered the CWD baseline monitoring period and during the first six months of construction phase monitoring, clearly show that waters to the north of SCLKCMP especially waters to the north of Lung Kwu Chau and west of the Urmston Road channel including the SCZ, are still being used by CWDs as important habitats after the SkyPier Plan mitigation measures were implemented. Figure 1 CWD Sightings Distribution in North Lantau Waters from mid-Dec 2015 to Dec 2016 – after implementation of the SkyPier Plan
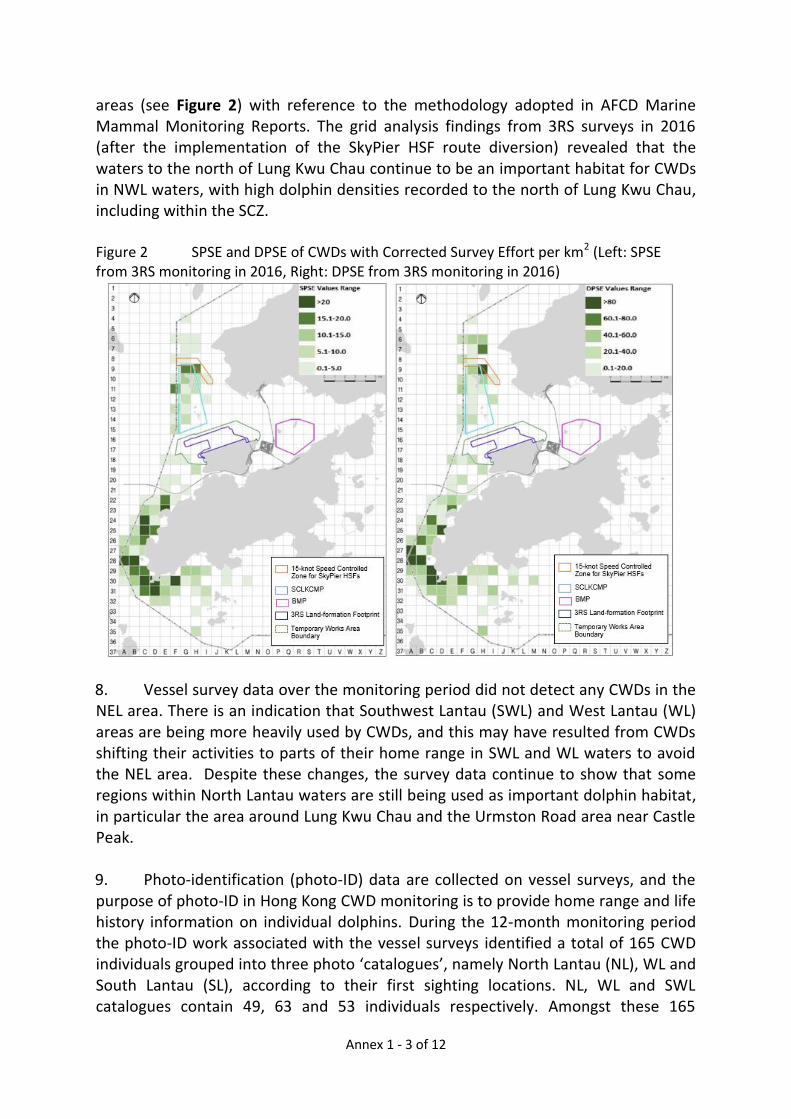
7. Quantitative grid analysis on habitat use was conducted using the 12-month 3RS sighting data-set. Sightings Per 100 units of Sighting Effort (SPSE) and Dolphins Per 100 units of Sighting Effort (DPSE) values were calculated for all grids in all survey
Annex 1 - 3 of 12
areas (see Figure 2) with reference to the methodology adopted in AFCD Marine Mammal Monitoring Reports. The grid analysis findings from 3RS surveys in 2016 (after the implementation of the SkyPier HSF route diversion) revealed that the waters to the north of Lung Kwu Chau continue to be an important habitat for CWDs in NWL waters, with high dolphin densities recorded to the north of Lung Kwu Chau, including within the SCZ. Figure 2 SPSE and DPSE of CWDs with Corrected Survey Effort per km2 (Left: SPSE from 3RS monitoring in 2016, Right: DPSE from 3RS monitoring in 2016)
8. Vessel survey data over the monitoring period did not detect any CWDs in the NEL area. There is an indication that Southwest Lantau (SWL) and West Lantau (WL) areas are being more heavily used by CWDs, and this may have resulted from CWDs shifting their activities to parts of their home range in SWL and WL waters to avoid the NEL area. Despite these changes, the survey data continue to show that some regions within North Lantau waters are still being used as important dolphin habitat, in particular the area around Lung Kwu Chau and the Urmston Road area near Castle Peak. 9. Photo-identification (photo-ID) data are collected on vessel surveys, and the purpose of photo-ID in Hong Kong CWD monitoring is to provide home range and life history information on individual dolphins. During the 12-month monitoring period the photo-ID work associated with the vessel surveys identified a total of 165 CWD individuals grouped into three photo ‘catalogues’, namely North Lantau (NL), WL and South Lantau (SL), according to their first sighting locations. NL, WL and SWL catalogues contain 49, 63 and 53 individuals respectively. Amongst these 165
Annex 1 - 4 of 12
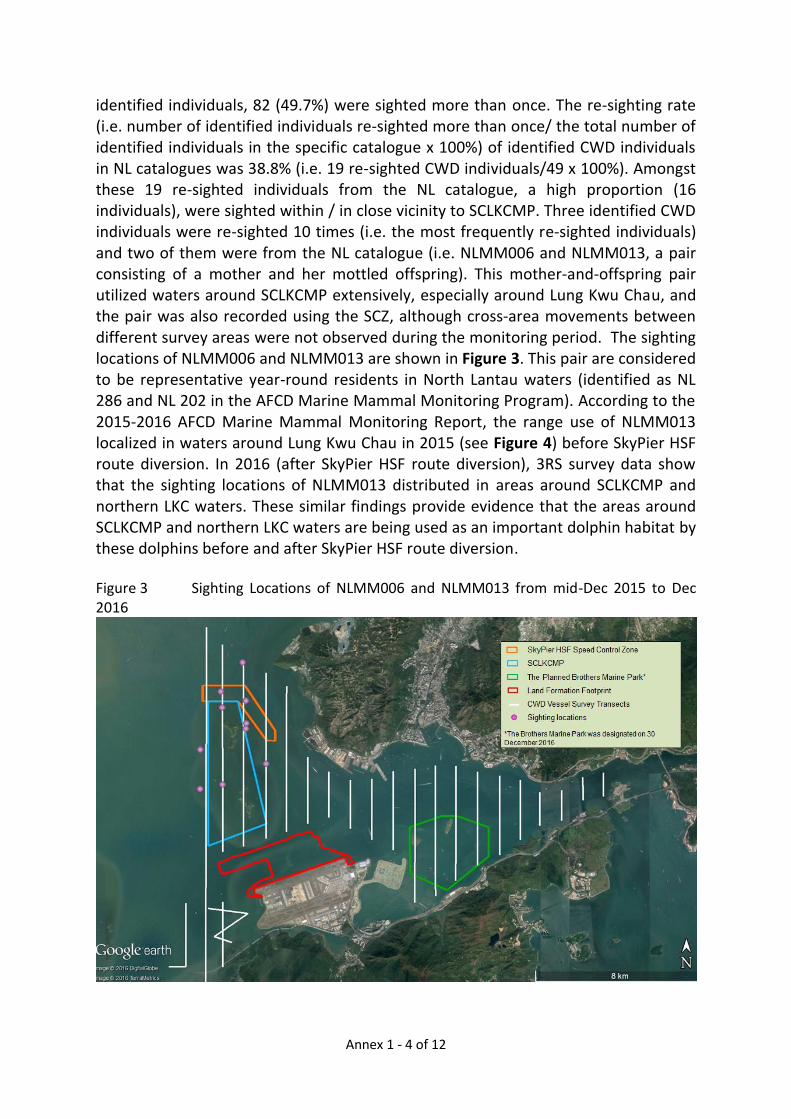
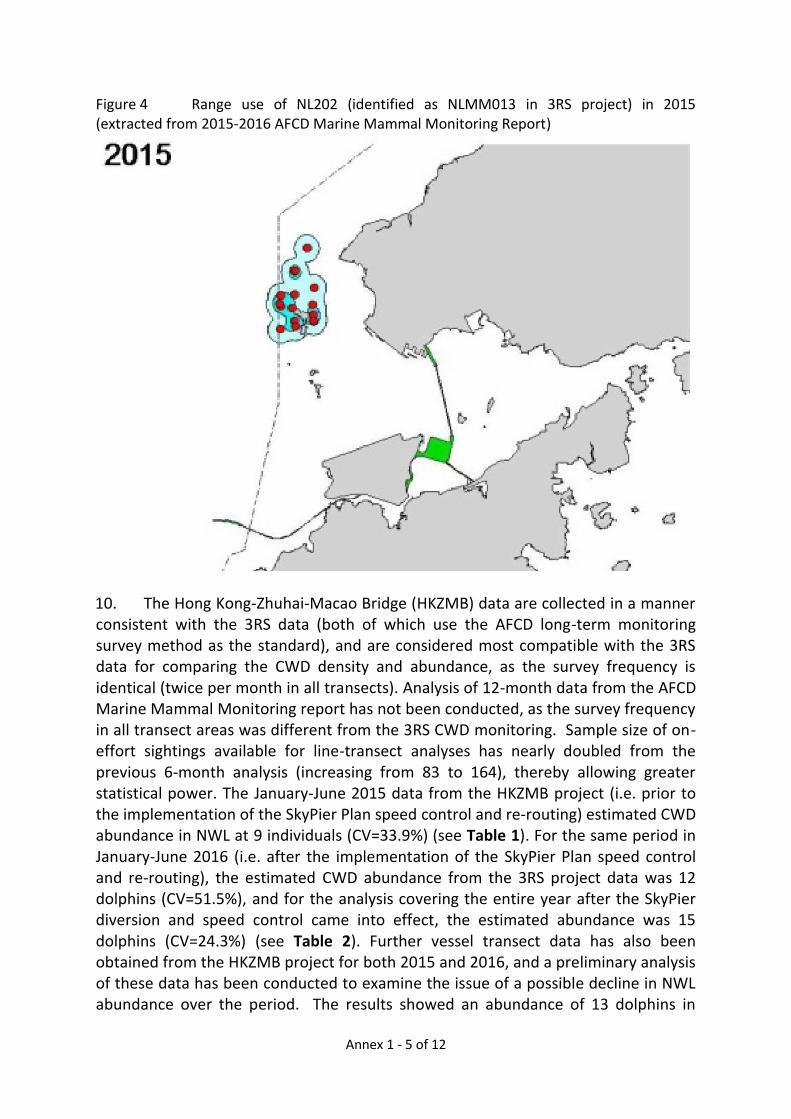
identified individuals, 82 (49.7%) were sighted more than once. The re-sighting rate (i.e. number of identified individuals re-sighted more than once/ the total number of identified individuals in the specific catalogue x 100%) of identified CWD individuals in NL catalogues was 38.8% (i.e. 19 re-sighted CWD individuals/49 x 100%). Amongst these 19 re-sighted individuals from the NL catalogue, a high proportion (16 individuals), were sighted within / in close vicinity to SCLKCMP. Three identified CWD individuals were re-sighted 10 times (i.e. the most frequently re-sighted individuals) and two of them were from the NL catalogue (i.e. NLMM006 and NLMM013, a pair consisting of a mother and her mottled offspring). This mother-and-offspring pair utilized waters around SCLKCMP extensively, especially around Lung Kwu Chau, and the pair was also recorded using the SCZ, although cross-area movements between different survey areas were not observed during the monitoring period. The sighting locations of NLMM006 and NLMM013 are shown in Figure 3. This pair are considered to be representative year-round residents in North Lantau waters (identified as NL 286 and NL 202 in the AFCD Marine Mammal Monitoring Program). According to the 2015-2016 AFCD Marine Mammal Monitoring Report, the range use of NLMM013 localized in waters around Lung Kwu Chau in 2015 (see Figure 4) before SkyPier HSF route diversion. In 2016 (after SkyPier HSF route diversion), 3RS survey data show that the sighting locations of NLMM013 distributed in areas around SCLKCMP and northern LKC waters. These similar findings provide evidence that the areas around SCLKCMP and northern LKC waters are being used as an important dolphin habitat by these dolphins before and after SkyPier HSF route diversion. Figure 3 Sighting Locations of NLMM006 and NLMM013 from mid-Dec 2015 to Dec 2016
Annex 1 - 5 of 12
Figure 4 Range use of NL202 (identified as NLMM013 in 3RS project) in 2015 (extracted from 2015-2016 AFCD Marine Mammal Monitoring Report)
10. The Hong Kong-Zhuhai-Macao Bridge (HKZMB) data are collected in a manner consistent with the 3RS data (both of which use the AFCD long-term monitoring survey method as the standard), and are considered most compatible with the 3RS data for comparing the CWD density and abundance, as the survey frequency is identical (twice per month in all transects). Analysis of 12-month data from the AFCD Marine Mammal Monitoring report has not been conducted, as the survey frequency in all transect areas was different from the 3RS CWD monitoring. Sample size of on-effort sightings available for line-transect analyses has nearly doubled from the previous 6-month analysis (increasing from 83 to 164), thereby allowing greater statistical power. The January-June 2015 data from the HKZMB project (i.e. prior to the implementation of the SkyPier Plan speed control and re-routing) estimated CWD abundance in NWL at 9 individuals (CV=33.9%) (see Table 1). For the same period in January-June 2016 (i.e. after the implementation of the SkyPier Plan speed control and re-routing), the estimated CWD abundance from the 3RS project data was 12 dolphins (CV=51.5%), and for the analysis covering the entire year after the SkyPier diversion and speed control came into effect, the estimated abundance was 15 dolphins (CV=24.3%) (see Table 2). Further vessel transect data has also been obtained from the HKZMB project for both 2015 and 2016, and a preliminary analysis of these data has been conducted to examine the issue of a possible decline in NWL abundance over the period. The results showed an abundance of 13 dolphins in
Annex 1 - 6 of 12
2015 (CV=23.7%), and an abundance of 12 dolphins in 2016 (CV=25.7%). This is a marginal difference and is not considered significant. It should also be noted that the expectation is that CWDs may move away from the works area specifically and the NWL area in general for the duration of the significant marine construction period of the 3RS project. This possibility of CWDs moving away has been taken into account in the EIA, and is an expected response by the CWDs that has been observed in previous projects. 11. One other important issue is the inclusion of Deep Bay when discussing total numbers of dolphins in Hong Kong. Deep Bay (at least the southern portion) has been consistently used as dolphin habitat since the long-term monitoring began in 1995/96. Although the number of dolphins in this area is usually small, it can vary quite a bit (from just a few to up to about a dozen), and this is an area that dolphins may shift to when disturbance in other parts of their habitat is more intense. Vessel line-transect surveys at the Deep Bay area have been conducted for the 3RS project in addition to the required monitoring area under the Updated EM&A Manual, with a frequency of 2 survey days per month between mid-December 2015 to December 2016 using the same small vessel transect survey method. This information was gathered to facilitate a complete assessment of CWD abundance in Hong Kong waters and to review whether dolphins may also be shifting further north within Hong Kong waters as an expected response of moving away from increasing disturbance in other parts of their home ranges. The pooled total number of CWD abundance from 3RS data was estimated as 63 including Deep Bay, while the AFCD marine mammal monitoring findings for 2015 (a combined estimate for SWL, WL, NWL and NEL waters) was 65. 12. These new estimates provided above are more comprehensive than those presented in the earlier 6-month report as they make use of more survey data over a longer period and take into account seasonal variation over a whole year. They are also based on data collected by two independent survey teams, and it is noted that earlier concerns about data comparability issues have been somewhat alleviated by these data comparisons (which show good consistency in data collection methods and comparability in results). While the issue of potential HSF route change impacts on CWDs is important, warranting further analysis as vessel line-transect work continues, the analyses conducted so far do not support the hypothesis of a decline of CWD numbers in in NWL, and in fact suggest that dolphin numbers in NWL may have stabilized or even increased slightly in the period coinciding with the implementation of the SkyPier Plan.
Annex 1 - 7 of 12
Table 1 CWD Line Transects Parameters and Estimates of Density and Abundance for Western Hong Kong based on HKZMB project data January to June 2014 and 2015 and 3RS data January to June 2016 (extracted from supplementary information submitted to ACE)
Table 2 CWD Line Transects Parameters and Estimates of Density and Abundance for Western Hong Kong based on 3RS data (mid-December 2015 to December 2016)
Dec2015-Dec2016 Pooled 166 3.3 1.0 23.40 63 45-89 17.6
* After truncation # From Jefferson (2000)
Summary of CWD Land-based Theodolite Tracking Findings 13. Land-based theodolite tracking of CWDs was carried out at the Lung Kwu Chau monitoring station for the 3RS project during the 12-month period from January to December 2016. During the land-based CWD surveys, vessels travelling in the survey area, including diverted SkyPier HSFs travelling at below 15 knots within the SCZ, non-SkyPier HSFs travelling at their normal speeds and other types of vessels, were tracked. The plots of all the tracked CWD groups are summarized in Figure 5. Concurrent tracking of CWDs and vessels in the SCZ indicates that the SCZ continues to be extensively used by CWDs even after implementation of SkyPier Plan measures.
Annex 1 - 8 of 12
Figure 5 Plots of all-tracked CWDs obtained from Lung Kwu Chau Theodolite Station from
Jan to Dec 2016 – after implementation of the SkyPier Plan
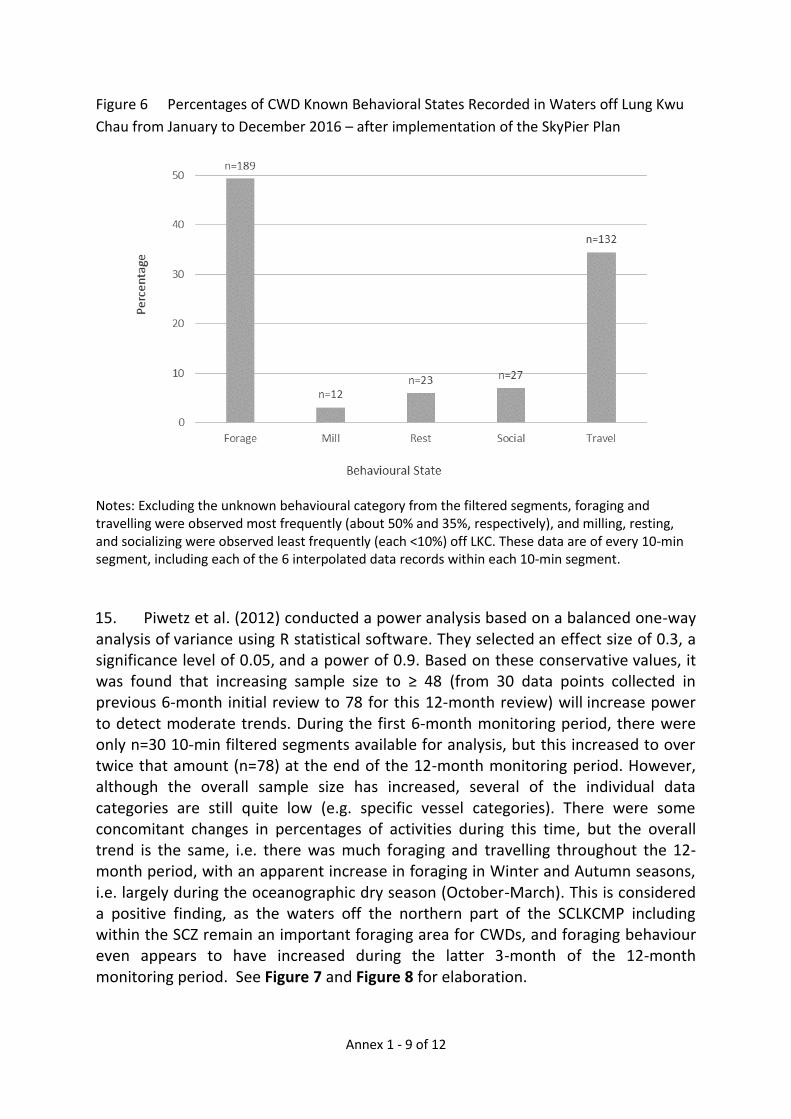
14. Theodolite tracking records show that there was frequent co-occurrence of CWDs with SkyPier HSFs travelling at below 15 knots within the SCZ during the monitoring period. Group sizes of tracked CWDs were generally smaller closer to shore, with the largest groups occurring farther from shore, at times in waters beyond the SCLKCMP boundary, including in waters within the SCZ. As summarized in Figure 6, the land-based survey data from the 12-month period of SkyPier Plan implementation confirms that the waters off Lung Kwu Chau remain an important foraging area for CWDs.
Annex 1 - 9 of 12
Figure 6 Percentages of CWD Known Behavioral States Recorded in Waters off Lung Kwu
Chau from January to December 2016 – after implementation of the SkyPier Plan
Notes: Excluding the unknown behavioural category from the filtered segments, foraging and travelling were observed most frequently (about 50% and 35%, respectively), and milling, resting, and socializing were observed least frequently (each <10%) off LKC. These data are of every 10-min segment, including each of the 6 interpolated data records within each 10-min segment.
15. Piwetz et al. (2012) conducted a power analysis based on a balanced one-way analysis of variance using R statistical software. They selected an effect size of 0.3, a significance level of 0.05, and a power of 0.9. Based on these conservative values, it was found that increasing sample size to ≥ 48 (from 30 data points collected in previous 6-month initial review to 78 for this 12-month review) will increase power to detect moderate trends. During the first 6-month monitoring period, there were only n=30 10-min filtered segments available for analysis, but this increased to over twice that amount (n=78) at the end of the 12-month monitoring period. However, although the overall sample size has increased, several of the individual data categories are still quite low (e.g. specific vessel categories). There were some concomitant changes in percentages of activities during this time, but the overall trend is the same, i.e. there was much foraging and travelling throughout the 12-month period, with an apparent increase in foraging in Winter and Autumn seasons, i.e. largely during the oceanographic dry season (October-March). This is considered a positive finding, as the waters off the northern part of the SCLKCMP including within the SCZ remain an important foraging area for CWDs, and foraging behaviour even appears to have increased during the latter 3-month of the 12-month monitoring period. See Figure 7 and Figure 8 for elaboration.
Annex 1 - 10 of 12
Figure 7 Percentages of CWD Known Behavioral States Recorded in Waters off Lung Kwu
Chau by Oceanographic Season
Figure 8 Percentages of CWD Known Behavioral States Recorded in Waters off Lung Kwu
Chau by Solar Season
16. This 12-month data-set identified that there were no statistically significant differences in movement related data (swim speeds, reorientation rates, linearity) specifically relative to presence and speeds of vessels. However, it must be recognised that sample sizes per vessel category were still low (n<10) for robust
Annex 1 - 11 of 12
multi-variate analyses. It is known from studies both in Hong Kong waters and of Sousa dolphins elsewhere, that dolphins more often rapidly submerge and travel away from high-speed vessels, but continue to forage or travel when vessels approach with lower speeds. That very behaviour of diving and travelling away also makes obtaining enough data for statistical analysis difficult, with rather low overall sighting rates of CWDs in association with fast moving vessels over the monitoring period. 17. Off LKC, vessels were recorded within 500 metres of focal CWD groups on 20 occasions (based on filtered 10-min segments), including high speed ferries under speed restriction on 8 occasions, high speed ferries travelling at speed on 7 occasions, and other vessels (e.g. fishing and government vessels) on 5 occasions. No significant difference was observed in CWD swimming speeds, reorientation rates, or linearity based on high-speed ferry presence when compared to slower speed ferry presence. As discussed above, these numbers are still low for robust statistical analyses. The important point is that dolphins are still present in the area, and are feeding and travelling through the area in an apparently normal fashion. Two examples of CWDs travelling adjacent to the HSFs under speed restriction are presented in Figure 9 and Figure 10, which shows that CWD continue to travel when HSFs approach with lower speeds.
Figure 9 Co-occurrence of HSF under speed restriction and CWD on 20 July 2016
Annex 1 - 12 of 12
Figure 10 Co-occurrence of HSF under speed restriction and CWD on 5 August 2016