26
A Study to Examine the Costs and Benefits of the ELV Directive – Final Report Annexes ANNEX 2: ARISINGS AND TREATMENT OF END OF LIFE VEHICLES

A Study to Examine the Costs and Benefits of the ELV Directive – Final Report Annexes
ANNEX 2: ARISINGS AND TREATMENT OF END OF LIFE VEHICLES
A Study to Examine the Costs and Benefits of the ELV Directive – Final Report Annexes
CONTENTS 1 OVERVIEW............................................................................................................................... 1 2 STOCK OF VEHICLES IN USE ............................................................................................... 3 3 EXPORTS ................................................................................................................................. 4 4 ELV ARISINGS......................................................................................................................... 5 4.1 Numbers of ELVs................................................................................................................... 5 4.2 Weight of Arisings .................................................................................................................. 7 4.3 Vehicle Composition .............................................................................................................. 9 5 ELV TREATMENT AND DISPOSAL...................................................................................... 10 5.1 Overview .............................................................................................................................. 10 5.2 Depollution ........................................................................................................................... 11 5.3 Dismantling .......................................................................................................................... 11 5.4 Shredding............................................................................................................................. 12 5.5 Landfill .................................................................................................................................. 13 5.6 Incineration/Energy Recovery.............................................................................................. 15 6 OVERVIEW OF CURRENT PRACTICE, BY MATERIAL...................................................... 15 6.1 Metals................................................................................................................................... 15 6.2 Tyres .................................................................................................................................... 16 6.3 Batteries ............................................................................................................................... 17 6.4 Plastics................................................................................................................................. 17 6.5 Glass .................................................................................................................................... 17 6.6 Fluids.................................................................................................................................... 18 6.7 Catalytic converters.............................................................................................................. 18 6.8 Secondary Restraint Systems (airbags and seatbelt pretensioners)................................... 19 6.9 Overall Values and Costs .................................................................................................... 19 7 ESTABLISHING THE BASELINE.......................................................................................... 21 7.1 Current Rates of Recycling, Reuse and Recovery .............................................................. 21 7.2 Setting the 2006 Baseline .................................................................................................... 22 7.3 Future Challenges................................................................................................................ 24

A Study to Examine the Costs and Benefits of the ELV Directive – Final Report Annexes
1
1 OVERVIEW
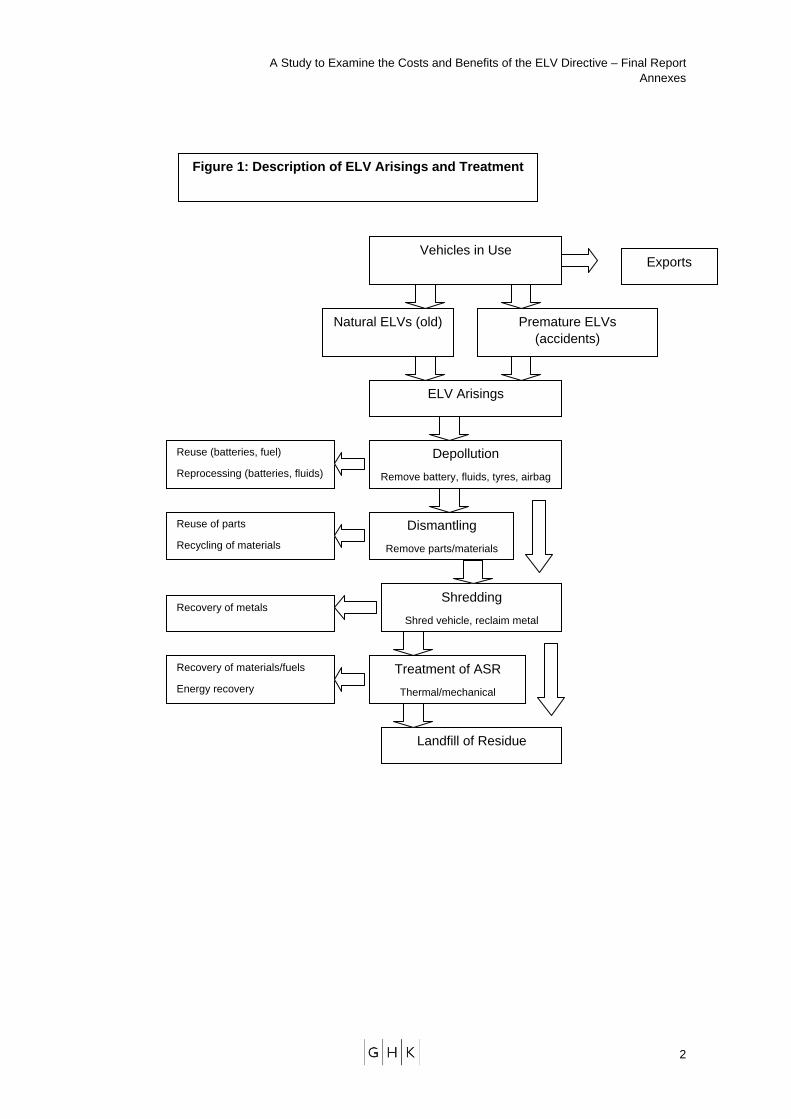
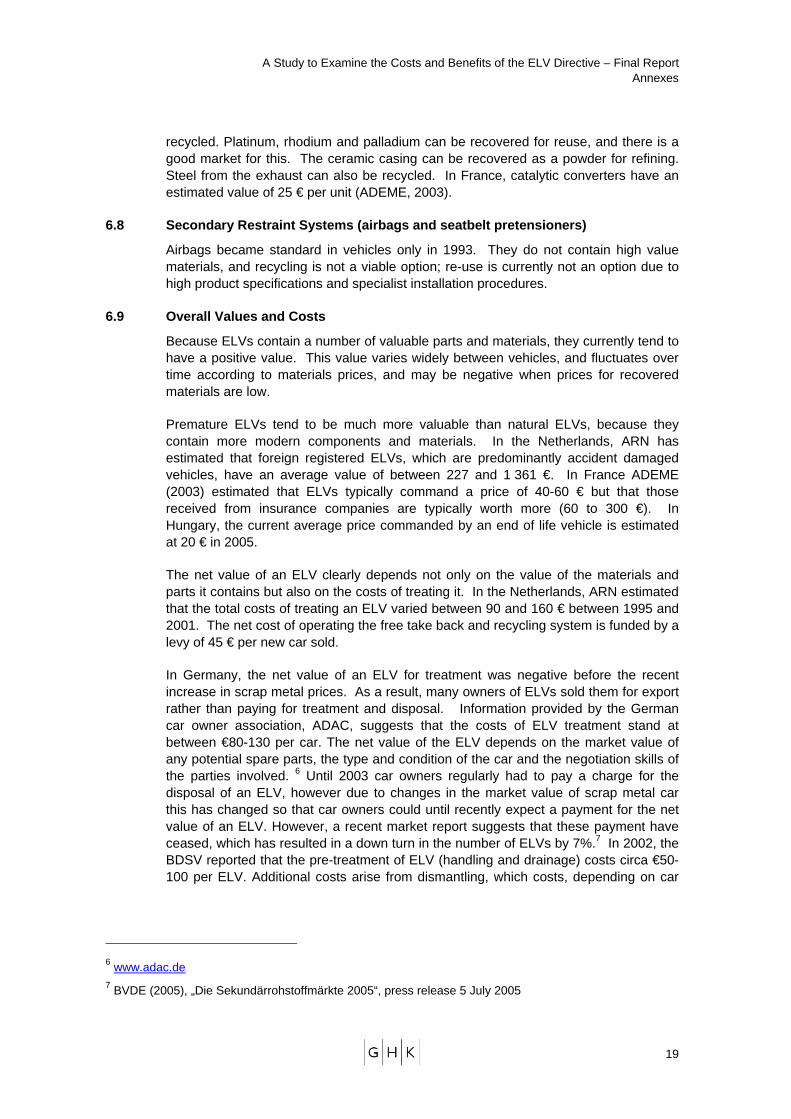
Figure 1 provides a simple overview of how ELVs arise and are treated in the EU. Vehicles reach the end of their life either because they become old and worn out and cease to be roadworthy (“natural” end of life vehicles or NELVs) or because they are written off following involvement in an accident (“premature” end of life vehicles or PELVs). Vehicles may be sold for export either before reaching the end of their life, or at the point of deregistration.
Those that are not exported need to be treated at authorised treatment facilities, and undergo a process of depollution, involving the removal of fuel, oil and other liquids, as well as the battery, airbags and heavy metals. ELVs may be dismantled to remove valuable parts and materials, before they are sent to a shredder; others will be sent directly to the shredder. Shredding involves a capital intensive mechanical process and results in the recovery of metals from the vehicle, leaving auto-shredder residue (ASR), a combination of materials such as plastics, textiles and glass. ASR has traditionally landfilled but is increasingly being treated to separate useable fractions and enhance rates of recycling.
A Study to Examine the Costs and Benefits of the ELV Directive – Final Report Annexes
2
ELV Arisings
Exports
Dismantling
Remove parts/materials
Depollution
Remove battery, fluids, tyres, airbag
Shredding
Shred vehicle, reclaim metal
Landfill of Residue
Reuse of parts
Recycling of materials
Reuse (batteries, fuel)
Reprocessing (batteries, fluids)
Recovery of metals
Vehicles in Use
Natural ELVs (old) Premature ELVs (accidents)
Treatment of ASR
Thermal/mechanical
Recovery of materials/fuels
Energy recovery
Figure 1: Description of ELV Arisings and Treatment
A Study to Examine the Costs and Benefits of the ELV Directive – Final Report Annexes
3
2 STOCK OF VEHICLES IN USE
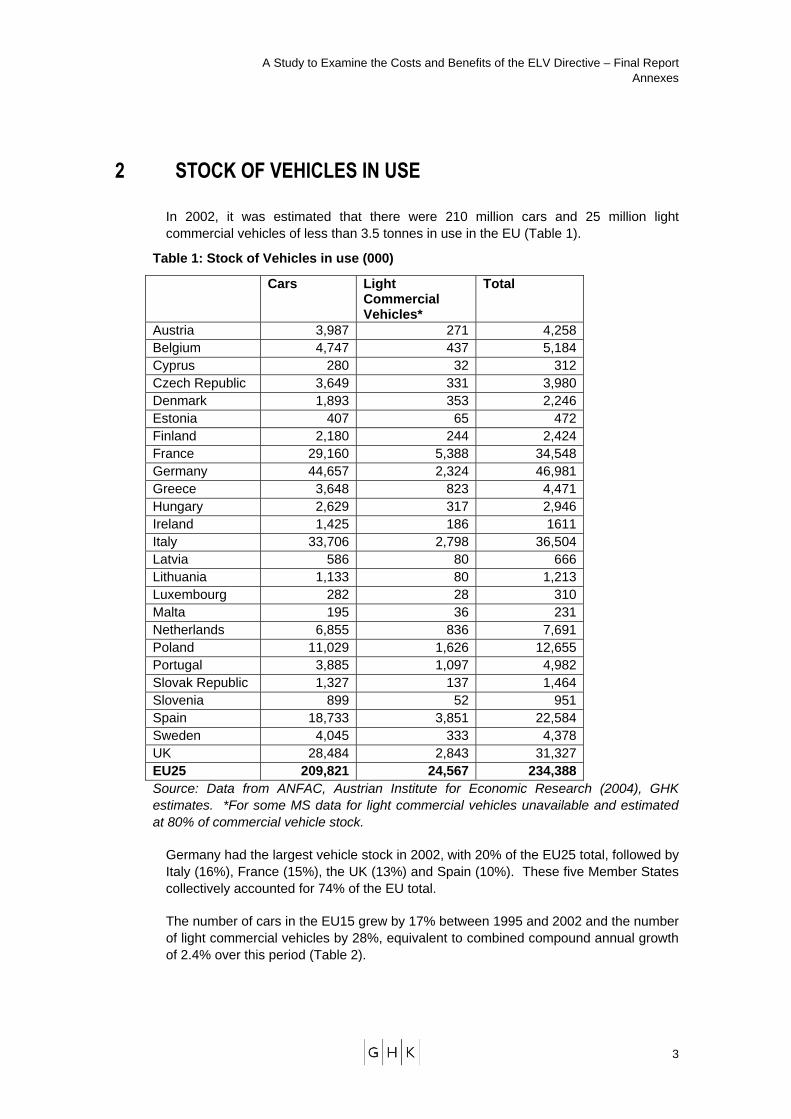
In 2002, it was estimated that there were 210 million cars and 25 million light commercial vehicles of less than 3.5 tonnes in use in the EU (Table 1).
Table 1: Stock of Vehicles in use (000)
Cars Light Commercial Vehicles*
Total
Austria 3,987 271 4,258 Belgium 4,747 437 5,184 Cyprus 280 32 312 Czech Republic 3,649 331 3,980 Denmark 1,893 353 2,246 Estonia 407 65 472 Finland 2,180 244 2,424 France 29,160 5,388 34,548 Germany 44,657 2,324 46,981 Greece 3,648 823 4,471 Hungary 2,629 317 2,946 Ireland 1,425 186 1611 Italy 33,706 2,798 36,504 Latvia 586 80 666 Lithuania 1,133 80 1,213 Luxembourg 282 28 310 Malta 195 36 231 Netherlands 6,855 836 7,691 Poland 11,029 1,626 12,655 Portugal 3,885 1,097 4,982 Slovak Republic 1,327 137 1,464 Slovenia 899 52 951 Spain 18,733 3,851 22,584 Sweden 4,045 333 4,378 UK 28,484 2,843 31,327 EU25 209,821 24,567 234,388 Source: Data from ANFAC, Austrian Institute for Economic Research (2004), GHK estimates. *For some MS data for light commercial vehicles unavailable and estimated at 80% of commercial vehicle stock.
Germany had the largest vehicle stock in 2002, with 20% of the EU25 total, followed by Italy (16%), France (15%), the UK (13%) and Spain (10%). These five Member States collectively accounted for 74% of the EU total.
The number of cars in the EU15 grew by 17% between 1995 and 2002 and the number of light commercial vehicles by 28%, equivalent to combined compound annual growth of 2.4% over this period (Table 2).

A Study to Examine the Costs and Benefits of the ELV Directive – Final Report Annexes
4
Table 2: Growth of Vehicle Stock, EU15, 1995 to 2002 (000 vehicles)
1995 2002 Growth (%)
Annual growth rate (%)
Cars 161,000 187,687 16.6 2.2% Light commercial vehicles
17034 21812 28.0 3.6%
Total 178034 209499 17.7 2.4% Source: As Table 1.
3 EXPORTS
Large numbers of used cars are exported from the EU each year, resulting in a reduction in the number of ELVs that require treatment.
Table 3 presents data published by Eurostat on trade in used vehicles in 2004. The figures demonstrate that more than 3 million vehicles were exported from EU member states in 2004, while 2.3 million vehicles were imported. This suggests that around 1.5% of the vehicle stock is exported in any one year. Two thirds of exports represented intra EU trade, while exports to countries outside the EU totalled almost one million vehicles. With just under 200,000 used vehicles being imported into the EU, net exports of used vehicles totalled nearly 800,000.
Table 3: Trade in Used Cars and Light Commercial Vehicles, EU25, 2004
Exports Imports EU25
extra EU25 intra
Total EU25 extra EU25 intra
Total
Austria 22,781 15,911 38,692 1,062 20,839 21,901Belgium 149,910 229,617 379,527 3,262 33,680 36,942Cyprus 27 740 767 20,286 14,740 35,026Czech Republic
1,678 1,085 2,763 4,219 201,129 205,348
Germany 382,642 1,133,782 1,516,424 11,936 71,657 83,593Denmark 3,013 7,897 10,910 832 3,129 3,961Estonia 716 897 1,613 1,613 16,969 18,582Spain 15,269 49,703 64,972 9,907 72,031 81,938Finland 489 554 1,043 1,242 2,816 4,058France 91,436 124,791 216,227 2,841 54,037 56,878UK 13,504 29,445 42,949 64,399 4,561 68,960Greece 6,732 98 6,830 0 1,085,986 1,085,986Hungary 169 678 847 1,636 8,216 9,852Ireland 408 698 1,106 5,846 5,373 11,219Italy 80,757 249,166 329,923 3,834 62,226 66,060Lithuania 130,121 1,520 131,641 22,386 236,175 258,561Luxembourg 854 10,866 11,720 12,501 8,952 21,453Latvia 641 208 849 3,971 10,351 14,322Malta 2 524 526 4,027 282 4,309
A Study to Examine the Costs and Benefits of the ELV Directive – Final Report Annexes
5
Netherlands 53,514 202,178 255,692 2,987 9,150 12,137Poland 7,868 1,688 9,556 10,323 69,866 80,189Portugal 4,982 2,371 7,353 1,641 2,930 4,571Sweden 18,791 2,470 21,261 8,631 846 9,477Slovenia 8,896 693 9,589 156 61,408 61,564Slovakia 74 274 348 432 11,136 11,568EU total 995,274 2,067,854 3,063,128 199,970 2,068,485 2,268,455Source: Eurostat
The figures demonstrate that patterns of trade vary widely between Member States. Germany, Italy, the Netherlands, Belgium and France are major net exporters of used vehicles, and while most of the trade in each of these Member States is with other EU countries, all are also significant exporters to countries outside the EU. Interestingly, almost all of Lithuania’s used vehicle exports go outside the EU, presumably to states of the former Soviet Union. Lithuania is a major importer from other EU countries, suggesting that many of these exports may originate from elsewhere in the EU. The new Member States are all major net importers of used vehicles, especially from within the EU.
There is some evidence that intra-EU trade in used vehicles is declining. Germany reports that export markets for used cars are becoming saturated, while Poland has experienced a decline in imports in 2005, which may be related to the introduction of regulations for treatment of end of life vehicles, which place obligations on importers of used vehicles.
4 ELV ARISINGS
4.1 Numbers of ELVs
ELVs may enter the waste stream from a variety of sources, including private individuals, garages, local authorities (in the case of abandoned vehicles) and insurance companies (in the case of accident damaged vehicles). In the UK, it is estimated that 10-15% of ELVs are accident damaged vehicles and that the remaining 85-90% have reached the end of their life naturally.
The average age of ELVs has been variously estimated at 15.3 years (Netherlands, 2004), 12.1 years (UK) and more than 11 years (Hungary). In the UK, TRL (2003) estimated the average age of ELVs as a whole at 12.1 years, with the average age of natural end of life vehicles at 12.8 years and that of premature end of life vehicles at 6.7 years (the average age of the vehicle parc).
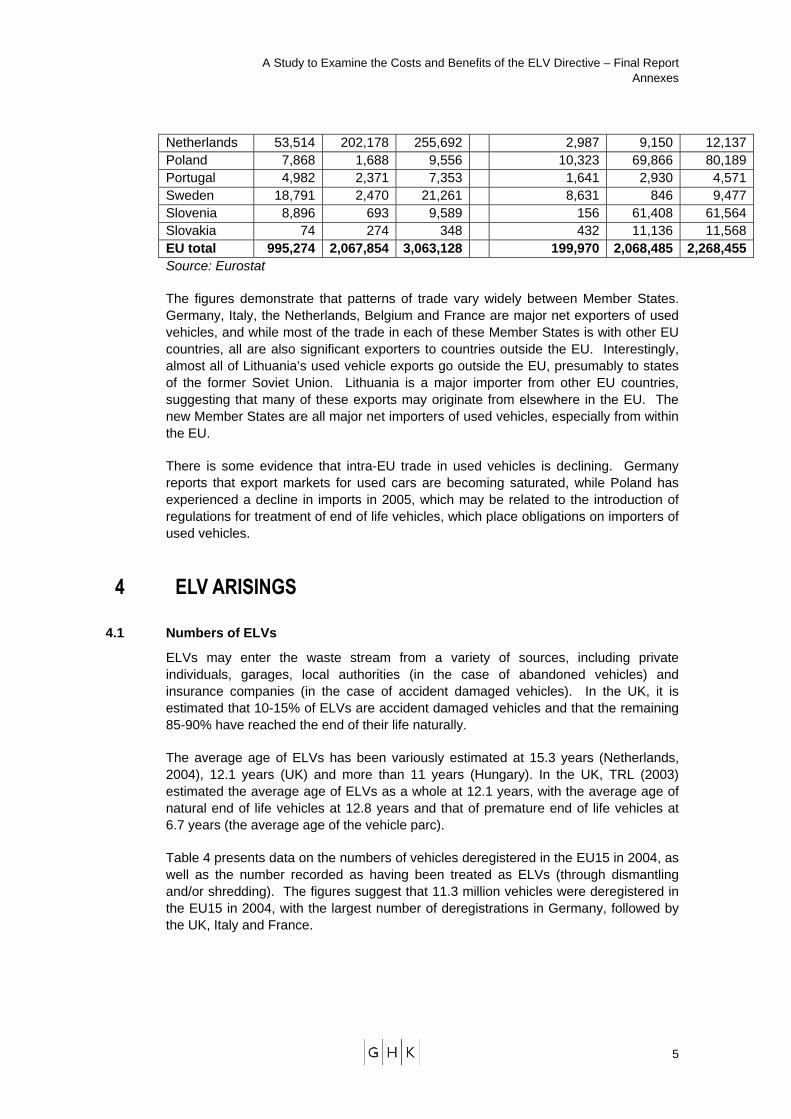
Table 4 presents data on the numbers of vehicles deregistered in the EU15 in 2004, as well as the number recorded as having been treated as ELVs (through dismantling and/or shredding). The figures suggest that 11.3 million vehicles were deregistered in the EU15 in 2004, with the largest number of deregistrations in Germany, followed by the UK, Italy and France.

A Study to Examine the Costs and Benefits of the ELV Directive – Final Report Annexes
6
Table 4: Number of Vehicles Deregistered and ELVs Treated, EU15, 2004
Deregistrations (000)
ELV Treated (000)
Germany 3068 1200UK 2200 2110Italy 1830 915France 1800 1300Spain 850 1000Netherlands 473 272Sweden 258 237Austria 247 124Portugal 130 52Ireland 130 130Finland 105 89Denmark 73 73Belgium 92 92Greece 30 20Luxembourg 10 9EU15 11,296 7,623
Source: ACEA
The difference between the numbers of deregistrations and numbers of ELVs recorded as treated is explained by a variety of factors including exports, illegal and unknown disposal, abandoned vehicles etc. Germany stands out as having a major gap between the number of vehicles deregistered and the number of ELVs treated, because of its large volumes of exports of used vehicles (around 1.5 million vehicles per year). The UK, on the other hand, accounts for 19% of deregistrations in the EU but 28% of the ELVs treated. However, reference to the data on trade in used vehicles in Table 3 suggests that the gaps in estimates between deregistrations and ELV treatment cannot be explained by trade alone, with some countries such as Italy and France having significant unexplained gaps. It may be that the statistics either for used vehicle trade or for number of ELVs treated are incomplete for these countries.
Data for deregistrations in the new member states are highly incomplete, and it has been necessary to estimate them. Table 5 presents estimates based on GHK calculations. It has been assumed that 5.3% of the current vehicle stock is deregistered each year, a similar rate of deregistration to that in the EU15. This suggests a total of 1.3 million deregistrations per year in the new Member States. It is important to note that there is likely to be some double counting here, with vehicles previously deregistered from Member States of the EU15 being exported to the new Member States and eventually deregistered. Net exports of used vehicles from the EU15 to the new MS amount to some 620,000 vehicles per year.

A Study to Examine the Costs and Benefits of the ELV Directive – Final Report Annexes
7
Table 5: Estimated Vehicle Deregistrations and ELV treatment in New Member States, 2004 (‘000)
Deregistrations Cyprus 17Czech Republic 215Estonia 25Hungary 159Latvia 36Lithuania 65Malta 12Poland 682Slovakia 79Slovenia 51New MS 1,342
Based on the above, our best estimate of the number of ELVs requiring treatment in the EU25 each year is as follows (Table 6).
Table 6: Estimated Number of ELVs Requiring Treatment in EU25 (2004)
Vehicles (000)
Deregistered in EU15 11,296
Deregistered in new MS 1,342
Deregistered in EU25 (1) 12,638
Of which:
Exported to another MS (2) 2,068
Exported outside EU (3) 995
ELVs requiring treatment in EU:
Minimum estimate = (1) – (2) – (3)
Maximum estimate = (1) – (3)
Midpoint
9,575
11,643
10,609
4.2 Weight of Arisings
The average weight of ELVs is affected by two conflicting trends relating to vehicle demand and supply:
On the demand side, there is a tendency for consumers to demand larger vehicles, which tends to increase average vehicle weight;
On the supply side, there is a tendency for manufacturers to use lighter components such as plastics and aluminium to improve vehicle performance and efficiency, thus reducing the average weight of a vehicle of a given size.

A Study to Examine the Costs and Benefits of the ELV Directive – Final Report Annexes
8
On balance, however, the average weight of vehicles is increasing. For example, in the UK, the estimated average vehicle weight was estimated to increase from 1025kg in 1997 to 1030kg in 2000 (ACORD, 2001), while in the Netherlands the average ELV weight increased from 911kg in 2003 to 915kg in 2004. The average weight of an ELV in 1999 in Germany was 903kg, whereas the average weight of a car produced in the late 1990s was 1000kg (see Table 7 for trends in average weight and material composition of newly built cars). 1 Data from the National Waste Management Plan for Poland suggest an average ELV weight of 940kg between 1997 and 2000. In the UK, a report by TRL (2003) estimated the average weight of ELVs (including cars and light commercial vehicles) at 940kg in 2000.
The data suggest, therefore, that the average weight of ELVs is currently between 900kg and 950kg but can be expected to increase to 1000kg or more by 2010.
Table 7 demonstrates that the proportion of the weight of newly built German vehicles made up of ferrous metals declined steadily between 1981 and 2000, and that the share of lighter parts in overall weight increased. The figures suggest that the gradual increase in vehicle weight must therefore be accounted for by an increase in car size and hence overall material use.
Table 7: Average weight and material composition of newly built cars, Germany, 1981-2000
Production year 1981-1985 1986-1990 1991-1995 1996-2000 Weight (empty) Kg 910 933 955 1000 FE-Metal % 83 67.5 62.4 57.5 NE-Metal % 4.3 6.1 8.0 10 Plastics % 3.6 4.9 6.2 7.5 Textiles/Mixed % 4.0 5.1 6.2 7.3 Tyres/Rubber % 3.8 3.8 3.9 3.9 Glas % 3.1 3.8 4.5 5.2 Liquids % 2.9 2.8 2.7 2.6 Other % 5.3 6.0 6.1 6.0
Source: Reinhardt T & Richers U (2004), p.19 Tabelle 5
Based on the figures in Table 7, projections can be made of average ELV weights. These are presented in Table 8. The figures are based on an assumed average vehicle life of 12 years, such that vehicles manufactured between 1981 and 1985 (average 1983) on average become end of life vehicles in 2005.
Table 8: Projected ELV Average Weights
Year of production
Average ELV year
Average weight (kg)
1981 to 1985 1995 9101986 to 1990 2000 933
1 Reinhardt T & Richers U (200 4), Entsorgung von Schredderrückständen – Ein aktueller Überblick, Wissenschaftliche Berichte, Forschungszentrum Karlsruhe

A Study to Examine the Costs and Benefits of the ELV Directive – Final Report Annexes
9
1991 to 1995 2005 9551996 to 2000 2010 10002001 to 2005 2015 1025
Source: Table 7 and GHK estimates
Based on the data above, the average weight of ELVs requiring treatment in the EU is estimated in Table 9. These estimates are based on the average ELV weight estimates on Table 8, an estimated total of ELVs requiring treatment from Table 6, and an assumed annual growth rate of 2.4% in the number of ELVs. The estimates assume there is gradual growth in the number and average weight of ELVs requiring treatment, but no major structural change in the market, such as a major reduction in exports, which could significantly increase the weight of ELVs requiring treatment in the EU.
Table 9: Estimated Weight of ELVs Requiring Treatment in the EU
Year No ELVs Treated (000)
Average Weight (kg)
Weight of ELVs Treated (000t)
2004 10,609 951 10,089
2005 10,864 955 10,375
2006 11,124 964 10,724
2007 11,391 973 11,084
2008 11,665 982 11,455
2009 11,945 991 11,837
2010 12,231 1,000 12,231
2011 12,525 1,005 12,588
2012 12,825 1,010 12,954
2013 13,133 1,015 13,330
2014 13,449 1,020 13,717
2015 13,771 1,025 14,116
Source: GHK estimates based on data above
Table 9 suggests that the annual weight of ELVs treated in the EU is currently around 10 million tonnes and will increase to 14.1 million tonnes in 2015, as a result both of growth in vehicle numbers and average weights.
4.3 Vehicle Composition
Table 10 provides an estimated breakdown of the materials and components arising in end of life vehicles. It is taken from a UK study by TRL (2003), and is broadly consistent with estimates for other Member States (e.g. Germany and Spain).
A Study to Examine the Costs and Benefits of the ELV Directive – Final Report Annexes
10
Table 10: Typical Composition of an ELV, by Weight, UK
Material/Component % by weight
Ferrous Metal 68%
Non Ferrous Metal 8%
Plastics and Process Polymers 10%
Tyres 3%
Glass 3%
Batteries 1%
Fluids 2%
Textiles 1%
Rubber 2%
Other 2%
Total 100%
Source: TRL (2003)
It is widely recognised that the material composition of ELVs is changing, with an increase in the proportion of the weight accounted for by plastic and non ferrous metals in place of ferrous metals. Though statistics are scarce, it is widely expected that plastic composition will reach around 15% and non-ferrous metals around 10% by weight in the next few years, suggesting a decline in ferrous metals to just over 60%. By 2015, the typical ELV is likely to comprise of 12% plastics, 9% non-ferrous metals and 65% ferrous metals.
5 ELV TREATMENT AND DISPOSAL
5.1 Overview
ELVs may either be dismantled, to remove valuable parts, or sent directly for shredding, traditionally via a scrap yard. For example, in the UK, it has been estimated that two thirds of ELVs are dismantled while the remaining one third are sent directly to scrap yards from which they are sent for shredding (Defra, 2005). Depollution may take place either at the dismantling stage or prior to shredding. However, while in the past vehicles were often shredded whole, increased requirements under Annex I of the Directive to remove materials (not just for depollution but also other materials such as tyres and glass for recycling) are likely to encourage increased numbers of vehicles to be dismantled prior to shredding.
ELVs may be received by a large number of organised collection points or small operators, including scrap yards, dismantling businesses, salvage operators and secondary metals businesses. In contrast, shredding plants are large, capital intensive operations and are relatively few in number.
For example. in the UK, ELVs are collected by 2500 small scrapyards, dismantlers and recycling businesses, while there are some 37 shredders, with around 70% of capacity

A Study to Examine the Costs and Benefits of the ELV Directive – Final Report Annexes
11
controlled by two companies. The German network consists of approximately 15,000 reception/collection points (e.g. dealerships and garages, which then pass on ELVs to recycling businesses), 1,200 dismantling/recycling businesses and 41 shredder plants. Poland has an estimated 1500 scrapyards, over half of which are still unauthorised in 2005, but only four shredding facilities.
5.2 Depollution
Article 6 of the Directive requires ELVs to be depolluted prior to landfill. Annex 1 specifies the treatment required, which includes:
removal of batteries and liquified gas tanks,
removal or neutralisation of potential explosive components, (e.g. air bags),
removal and separate collection and storage of fuel, motor oil, transmission oil, gearbox oil, hydraulic oil, cooling liquids, antifreeze, brake fluids, air-conditioning system fluids and any other fluid contained in the end-of-life vehicle, unless they are necessary for the re-use of the parts concerned
removal, as far as feasible, of all components identified as containing mercury.
These materials together account for around 3% of ELVs by weight. Batteries may be reused, if in good condition, or sent for reprocessing. Fluids are generally reprocessed or sold for use as fuel.
In France, ADEME (2003) has estimated the cost of depollution at 30 euro per ELV. The Stakeholder Group report puts the average cost of depollution and essential dismantling at 40-80 euro per ELV, including administration costs.
5.3 Dismantling
Dismantling involves the removal of the most valuable or required parts of the vehicle for reuse or reprocessing.
In the UK, TRL (2003) found that the most commonly reused items at dismantlers were:
Wheels (steel/alloy)
Engines
Gearboxes
Spare parts such as carburettors, alternators, starter motors, distributors, headlamps, quarter glass, brake discs and brake callipers
Tyres
Radiators
Batteries

A Study to Examine the Costs and Benefits of the ELV Directive – Final Report Annexes
12
Other spare parts depending on condition and marketability.
If not reused, larger metal parts such as radiators, engines, gearboxes, carburettors, starter motors and alternators are often removed and sent to specialist reprocessors for metal recovery.
A larger proportion of parts from premature ELVs than natural ELVs are reused. TRL’s study of dismantlers estimated that they remove 47% of the weight of PELVs and 9% of NELVs. Not all of the parts removed can then be sold, and it was estimated that 68% of parts removed would then be sold for reuse and the remaining 32% eventually shredded.
Following dismantling, the remainder of the ELV then typically goes through a baling machine before being sent on to a shredder. In Germany, it is estimated that drainage and dismantling of spare parts by dismantling companies reduces the weight of an ELV before it goes to a shredder by about 25-30%. (estimates by the German Car Manufacturer Association)2
Annex I of the Directive specifies that certain materials must be removed from an ELV at the dismantling stage to promote recycling. These include:
• Catalysts;
• Metal components containing copper, aluminium and magnesium if these metals are not segregated in the shredding process;
• Tyres and large plastic components (bumpers, dashboard, fluid containers, etc), if these materials are not segregated in the shredding process;
• Glass.
However, evidence suggests that the labour costs involved in removing glass and plastics from ELVs means that costs are greater than the revenues received (see Section 6 for more details). As a result, dismantlers are likely to require compensation to make this a viable proposition, as occurs in the ARN system in the Netherlands.
5.4 Shredding
The shells of all ELVs treated in the EU are eventually shredded, after depollution and usually after removal of valuable parts through dismantling. This is a capital intensive process undertaken by a limited number of plants in each Member State, which treat an estimated average of 34,000 ELVs each.
ELVs are shredded (often in combination with other sources of metals) and fragments sorted into ferrous metal, non-ferrous metal and shredder residue. A shredder is able to recover the majority of the metal content (ferrous and non-ferrous) of a vehicle by its magnetic and density properties. The non-metallic fraction (shredder residue) comprises materials such as plastic, foam, glass, rubber and textiles. Though a few
2 Reinhardt T & Richers U (2004), Entsorgung von Schredderrückständen – Ein aktueller Überblick, Wissenschaftliche Berichte, Forschungszentrum Karlsruhe

A Study to Examine the Costs and Benefits of the ELV Directive – Final Report Annexes
13
plants are being developed that can process ASR for recycling, the majority is currently landfilled.
BRA (British Metals Recycling Association) estimates are that 1.8m tonnes of ELVs are processed by UK shredders, producing 1.3m tonnes of ferrous product (72%), 72,000 tonnes of non-ferrous product (4%) and 428,000 tonnes of shredder residue (24%)(TRL, 2003). A study undertaken by tecpol in 2003 suggest the shredder output streams consist of 74% FE-metals, 3% NE metals, 6% SSF (heavy shredder fraction), 17 % SLF (light shredder fraction). The UK and German estimates therefore show a high degree of consistency.
Estimates of metal recovery at the shredding stage are complicated by the fact that ELVs are typically mixed with other waste streams during the shredding process.
ADEME (2003) estimated income of 90-95 €/t for ferrous metals and 200-350 €/t of non-ferrous mix recovered from shredders, representing an average of 86-95 €/t of body shell entering the shredder.
5.5 Landfill
Auto shredder residue (ASR) accounts for between 15% and 25% of the weight of ELV arisings, depending on the proportion of materials recovered, and has traditionally been landfilled in the EU.
In Germany, estimates of the proportion of remaining materials from ELVs after treatment range from 18-25%. These materials consist of organic and inorganic substances. Organic substances are mainly polymer materials (plastics, elastomers) followed by small quantities of derived natural products (cellulose fibre products, leather). Inorganic materials include glass, fillers, dust, rust etc. Changes to the landfill regulation came into force in July 2005 [Abfallablagerungs-Verordnung (AbfAblV) and the TA Siedlungsabfall (TASi)] requiring that shredder residue is pre-treated before disposal. For SR this can only be done through thermal treatment. Landfill costs for ASR in Germany were put at 60-170 $/t in a 2003 study3.
In France, ADEME (2003) has estimated the cost of landfill of ASR at 50-55 €/tonne, including tax of 9.15€/t, or 7-16 €/t of body shell entering the shredder. Many dismantlers in France export body shells for shredding in Spain where the cost of ASR disposal is lower.
In Hungary, landfill costs for ASR are currently 40 €/t, according to the recycling consortium Car-Rec.
In the UK, the current cost of landfill of ASR is approximately £15-£20 per tonne plus the current Landfill Tax of £18. The total current cost of landfilling ASR is therefore approximately £35-£40 (52-59 euro). In Budget 2004 the Government announced that the standard rate of Landfill Tax would increase by £3 per tonne to £18 per tonne in 2005-06, and by at least £3 per tonne in the years thereafter, on the way to a medium to long term rate of £35 per tonne. Therefore assuming the actual cost of landfill remains the same, and the rate of Landfill Tax increases in line with Government
3 Kanari N et al (2003), End-of Life Vehicle Recycling in the European Union

A Study to Examine the Costs and Benefits of the ELV Directive – Final Report Annexes
14
projections, the total cost of landfilling ASR is expected to increase to at least £50-£55 in the medium to long term.
In the Netherlands, ARN reports that the Dutch government has increased the rate charged for landfill of ASR to €84/t from 2008. One of the reasons for this increase is to make post-shredder technologies more cost competitive compared to landfill.
There is a lack of reliable and up-to-date data comparing the costs of landfill of ASR in different EU Member States. Data published by Zoboli et al in 2000 is presented in Table 11. This highlights wide variations in landfill costs across the EU.
Table 11: ASR Landfill Costs in Different Countries
Country Cost ($/t) (or euro/t)*
Cost (euro/t) in selected MS
EU Member States Austria 140 Belgium 55 Denmark 70–110 France 40–60 50-55 Germany 60–170 Italy 75–80 Netherlands 70–90 84 from 2008 Spain 20–60 Sweden 90–100 United Kingdom 30–35 52-59 (70 in medium term) Poland 25–30 30 Hungary 40 Czech Republic 30 Other Countries Australia 20 Japan 135–160 Norway 50 United States 50–60 South Africa 25–40 Switzerland 120
Source: R. Zoboli et al., “Regulation and Innovation in the Area of End-of-Life Vehicles,” EUR 19598 EN, ed. F. Leone (Milan, Italy: IDSE-CNR, March 2000) plus Case Studies
The figures in Table 11 and those obtained from the country case studies suggest typical landfill costs as follows (Table 14).
Table 12: Typical Landfill Costs for ASR in the EU
Typical costs in: Range (euro/tonne)
Midpoint (euro/tonne)
Low cost MS 30-40 35
Medium cost MS 50-80 65

A Study to Examine the Costs and Benefits of the ELV Directive – Final Report Annexes
15
High cost MS 90-140 115
5.6 Incineration/Energy Recovery
Incineration with energy recovery is seen as a potentially attractive option in many Member States, but is usually limited by a shortage of capacity.
In Germany, trials have taken place for incineration of shredder residue with other domestic waste, including up to 30% of SR in the mix. Charges for waste incineration in Germany are €70-300/tonne. For new plants costs of €100 /tonne are regarded as realistic. However, due to the change to the landfill regulation from June 2005, it is expected that there is insufficient capacity within Germany for the necessary treatment of domestic waste. This will place significant constraints on the capacity to incinerate ASR, increasing interest in the development of dedicated ASR treatment plant.
In Hungary, public opposition is a significant barrier to development of new waste incinerators. Incineration is a likely option for plastics, but is constrained by a shortage of capacity, prompting interest in the possibility of burning plastics in cement kilns, though this is currently economically unattractive.
In the UK, ACORD (2001) estimated that there is potential for around 100,000 tonnes of ASR to go for incineration with energy recovery, but that the UK is disadvantaged in that there is current spare incineration capacity of only 5,000 tonnes. Recovery of oil from engines and gearboxes already takes place, for use in power stations as a fuel enhancer. Tyres are now increasingly burned in cement kilns, and this accounts for approximately 25-30% of tyre arisings. The MVDA (Motor Vehicle Dismantler’s Association) claims that the estimated capacity of the cement kiln industry is sufficient for all waste tyres in the UK, while the SMMT suggests that tyres could make up much of the 5% allowed to be recovered in 2006. Public opposition to new incinerators means that use of waste streams as “fuel” in power stations, cement kilns and blast furnaces may be more likely. Spare MSW incineration capacity is limited, and burning significant quantities of ASR would be subject to completion of successful trials.
Switzerland and Japan have both banned landfill of ASR, which must be treated or incinerated. Since 2000 ASR has been co-incinerated with MSW as a transitional solution as dedicated ASR treatment plant have been developed. The April 2002 newsletter of the Swiss Auto Recycling Association quotes costs of 230-400 CHF/t (149-259 €/t) for transport and incineration in Switzerland and 345 CHF/t (223 € /t) in Germany, compared to costs of 435 CHF/t (282 f € /t) or the Citron process.
6 OVERVIEW OF CURRENT PRACTICE, BY MATERIAL
6.1 Metals
Metals account for around 75% of total ELV arisings by weight. They are relatively easily separated from ELVs at either the dismantling or the shredding stage, and are valuable materials. Therefore almost 100% of metals are recycled or reused. As a result, metals account for the bulk of recycling and reuse targets, and, regardless of the treatment of other materials, enable all countries to achieve recycling and reuse
A Study to Examine the Costs and Benefits of the ELV Directive – Final Report Annexes
16
rates of 75%. In Germany, for example, recycling rates of 75% have been achieved for several decades.
The price of scrap metal is very volatile and this significantly affects the overall economics of recycling ELVs. While recovery of metals itself is generally cost effective, when metal prices are low returns may not be sufficient to offset other costs involved in treatment of ELVs. For example, in the UK, scrap metal prices declined from £35/tonne in 1998 to around £10 per tonne in 2002, giving ELVs a negative value and leading to a large increase in vehicle abandonment. There has since been a significant increase in metal prices, such that ELVs once again have a positive value. The current market price for scrap steel is £80 per tonne, which is relatively high and has been stable for the last year, buoyed by strong demand from India and China for metal exports.
However, in Germany, a 45% decline in scrap metal prices was observed in the first six months of 2005, though a recovery is expected.
A study of shredders in the UK indicated that the aluminium content of the material they handle has a significant impact on their profitability, since scrap aluminium is worth up to 10 times more than scrap steel (SMMT, 2002).
6.2 Tyres
Tyres have traditionally been landfilled in many Member States. However, the Landfill Directive will ban the landfill of tyres from 2006, forcing their reuse, recycling and recovery. A variety of options exist, including:
Re-use of newer tyres, subject to legal standards on tread
Re-use for landfill engineering – whole tyres can be used in construction of landfill sites.
Recycling through re-treading. Car tyres can be re-treaded once. However, despite improved quality, the market is declining. The EU Retreaders Manufacturers Association (RMA) is trying to promote greater use of retreads, and there is an EU target of 25%.
Recycling through grinding. Crumb is used in sports and play surfaces, brake linings, landscaping mulch, carpet underlay, absorbents for wastes and shoe soles, and in rubberised asphalt for roads. Some crumb is also used in tyre manufacture, along with virgin rubber – this is less than 5% but increasing.
Other recycling techniques include cryogenic fragmentation, de-vulcanisation, microwave technology, and are subject to continuing development.
Energy recovery – tyres have a high calorific value 20% greater than coal, which can be harnessed for energy recovery through burning, pyrolysis, or incineration in cement kilns. Pyrolysis is expanding with new plant coming on line. Burning tyres in cement kilns is increasing but there are concerns about air pollutants, including dioxins and particulates.
Other uses exist, e.g. boat and dock fenders, crash barriers etc.
A Study to Examine the Costs and Benefits of the ELV Directive – Final Report Annexes
17
6.3 Batteries
Recycling and reuse rates exceed 90% in most Member States through established systems for collection and recovery. The average car battery weighs 13.5kg and contains 8.6kg lead, 3.8kg sulphuric acid and 0.7kg polypropylene. Incorrect disposal is an environmental hazard, and incineration leads to release of lead into the air. Even in Hungary, where there is no reprocessing capacity, and batteries have to be exported to Austria, Slovenia, the Czech Republic and Germany, rates of collection of batteries are estimated at 92-95% (Car-Rec, 2005).
6.4 Plastics
The % of weight of ELVs accounted for by plastics is increasing, and is now approximately 11%, as car manufacturers continue to design lightweight vehicles to improve fuel efficiency. There are currently very low rates of recycling due to wide variety of polymer types used, and increasing recycling rates is a priority if targets are to be met. Identification by marking components at production stage is helpful in facilitating recycling, though studies suggest that most progress will be needed at the post shredder rather than dismantling stage. The majority of plastic material from an ELV arises at the shredder as shredder fluff. Once part of this mixture it is very difficult to extract the plastic for recycling, however the removal of plastic components from ELVs prior to shredding is labour intensive and, therefore, costly.
In Germany, a 2003 study4 confirmed the technical feasibility of recycling larger plastic parts such as bumpers, hub caps and front grills, and estimated the dismantling cost at between 6 and 17 euro per ELV. Capacity exists for the recycling of these parts, and is increasing. Other studies5 have highlighted the high costs of dismantling all but the largest and most accessible plastic parts, and emphasised the need to investigate alternatives such as removal of plastics from ASR. For example, the net cost of recycling plastic fuel tanks was put at between 1,298-1645 DM per tonne KKB (plastic fuel tank), mainly due to dismantling and logistics. Recycling from ASR was found to be much more cost-efficient with a net cost for transport, treatment and recycling of DM 300 per tonne KKB.
Similarly, research in the UK found that it was possible to remove 2.6kg of plastic from an ELV, at an average cost of £384 per tonne, and that the cost of removal of a further 2.5kg would increase to £700 per tonne. In many cases, the time taken to extract appreciable quantities of material prevents this from being an economically viable activity for the dismantling industry (JEMA, 2005).
The Stakeholder Group report estimated an average time of 5 minutes for removal of bumpers, 5-20 minutes for the dashboard and 5-20 minutes for plastic fluid containers.
6.5 Glass
Two types of glass are used – toughened and laminated. Toughened glass is easy to remove from vehicles after shattering. Laminated glass does not shatter and needs to be removed manually, which is time consuming. The ease of removing the glass at the
4 Woidasky J & Stolzenberg A (2003), Verwertungspotenzial für Kunstoffteile aus Altfahrzeugen in Deutschland, Fraunhofer Institut Chemische Technologie 5 VKE (no date), Kunstoff im Automobil: Einsatz und Verwertung Langfassung, Frankfurt/Main
A Study to Examine the Costs and Benefits of the ELV Directive – Final Report Annexes
18
dismantling stage is dependent upon the method of sealing the glass in place during manufacture. The use of rubber seals makes the glass removal process comparatively easy compared to the direct bonding method. In the case of rubber seals the whole window can be removed, but the more common ‘direct bonding’ process means the most effective method of removal is to cut a disc of largest possible size from the window, therefore leaving a significant proportion of glass in place. There can also be problems removing glass from door windows due to the locking mechanisms.
The UK currently recycles some vehicle glass, although the majority of ELV glass is landfilled in shredder residue. Dismantlers do not generally remove glass from ELVs prior to being sent to shredders as the removal of the glass is time-consuming and the value of glass waste is relatively low. According to a recent report by CARE the value of glass from one ELV is around £0.48. In order to cover current costs 15 vehicles/hour would need to be processed, which is not feasible using current methods. CARE data suggests that the cost of glass removal is at least £102 per tonne, and could be as high as £389 per tonne, compared to the current market price for cullet which ranges from £5 per tonne to £45 per tonne depending on quality.
In France, ADEME (2003) estimated the costs of glass removal at 1.25 euro per ELV, with a cost of 40-50 euro/tonne for removing the windshield and 10-20 euro per tonne for the side windows.
In Hungary, glass recycling has encountered problems relating to technical and quality issues, which have limited the uses and value of glass collected.
In Germany, a BVSE Market Report on Recycling Materials, September 2005, estimated that mixed autoglass has a negative value of between 25 and 35 euro per tonne.
While glass recycling is currently clearly uneconomic, it will have to increase in line with requirements under Annex I of the Directive to remove glass at the dismantling stage. There is significant industry opposition to this, given the costs involved.
6.6 Fluids
Fluids are generally processed for recycling or as use as a fuel. For example, much of the waste oil collected for recovery in the UK is processed (by removing excess water and filtering out particulates) and used as a fuel burnt in heavy industry and power stations. However, stricter emissions controls could restrict this – the preferred option is therefore refining for use as a lubricant, though this does not currently occur on large scale in UK. Oil filters can retain large amounts of waste oil – this can be recovered using special filter presses prior to recycling.
6.7 Catalytic converters
Catalytic converters are made up of a stainless steel box housing a catalyst containing ceramic or metallic substrates, with active coatings of alumina, ceria and other oxides, and combinations of precious metals – platinum, palladium and rhodium. An industry has grown around the need to remove catalytic converters from ELVs, separate the catalytic element and remove the precious metals. In the US, catalysts have been used for 25 years and recovered platinum now accounts for over one third of the platinum used in new catalysts. In the UK, catalytic converters have been used in all petrol cars since 1993, so increasing numbers of catalytic converters are being
A Study to Examine the Costs and Benefits of the ELV Directive – Final Report Annexes
19
recycled. Platinum, rhodium and palladium can be recovered for reuse, and there is a good market for this. The ceramic casing can be recovered as a powder for refining. Steel from the exhaust can also be recycled. In France, catalytic converters have an estimated value of 25 € per unit (ADEME, 2003).
6.8 Secondary Restraint Systems (airbags and seatbelt pretensioners)
Airbags became standard in vehicles only in 1993. They do not contain high value materials, and recycling is not a viable option; re-use is currently not an option due to high product specifications and specialist installation procedures.
6.9 Overall Values and Costs
Because ELVs contain a number of valuable parts and materials, they currently tend to have a positive value. This value varies widely between vehicles, and fluctuates over time according to materials prices, and may be negative when prices for recovered materials are low.
Premature ELVs tend to be much more valuable than natural ELVs, because they contain more modern components and materials. In the Netherlands, ARN has estimated that foreign registered ELVs, which are predominantly accident damaged vehicles, have an average value of between 227 and 1 361 €. In France ADEME (2003) estimated that ELVs typically command a price of 40-60 € but that those received from insurance companies are typically worth more (60 to 300 €). In Hungary, the current average price commanded by an end of life vehicle is estimated at 20 € in 2005.
The net value of an ELV clearly depends not only on the value of the materials and parts it contains but also on the costs of treating it. In the Netherlands, ARN estimated that the total costs of treating an ELV varied between 90 and 160 € between 1995 and 2001. The net cost of operating the free take back and recycling system is funded by a levy of 45 € per new car sold.
In Germany, the net value of an ELV for treatment was negative before the recent increase in scrap metal prices. As a result, many owners of ELVs sold them for export rather than paying for treatment and disposal. Information provided by the German car owner association, ADAC, suggests that the costs of ELV treatment stand at between €80-130 per car. The net value of the ELV depends on the market value of any potential spare parts, the type and condition of the car and the negotiation skills of the parties involved. 6 Until 2003 car owners regularly had to pay a charge for the disposal of an ELV, however due to changes in the market value of scrap metal car this has changed so that car owners could until recently expect a payment for the net value of an ELV. However, a recent market report suggests that these payment have ceased, which has resulted in a down turn in the number of ELVs by 7%.7 In 2002, the BDSV reported that the pre-treatment of ELV (handling and drainage) costs circa €50-100 per ELV. Additional costs arise from dismantling, which costs, depending on car
6 www.adac.de 7 BVDE (2005), „Die Sekundärrohstoffmärkte 2005“, press release 5 July 2005

A Study to Examine the Costs and Benefits of the ELV Directive – Final Report Annexes
20
type and depth of dismantling, €250-350.8 The latter costs are likely to be covered by the revenues from sale of parts.
For France, ADEME estimated treatment costs for dismantlers (including staff expenses, overheads and depreciation) averaged €330 per ELV, with the value of parts sold averaging €495 per vehicle, with a further €23 received for the sale of the body shell. At the shredding stage, ADEME estimated treatment costs averaging €41 per ELV, including €10 euro per ELV for disposal of ASR, compared to revenues averaging €92 euro per ELV. The difference is made up of transport costs, the purchase price for the body shell, and the profit received.
A summary of the costs of dismantling different vehicle components is as follows:
Glass. UK studies put the costs of dismantling at £102-£389 per tonne (0.15 to 0.58 euro per kg)
Glass. ADEME has estimated removal costs of 40-50 euro/tonne (0.04-0.05 euro/kg) for the windshield and 10-20 euro per tonne (0.01-0.02 euro/kg) for the side windows.
Glass. Most evidence suggests that, once dismantled, mixed autoglass has a negative value of approximately 30 euro/tonne (0.03 euro/kg)
Plastics. German studies put the costs of dismantling larger plastic parts such as bumpers, hub caps and grills at between 6 and 17 euro per ELV. Assuming a yield of 10kg per vehicle, this suggests a cost of 0.6-1.7 euro per kg.
Plastic fuel tanks. German estimates put the costs of recycling at DM 1300-1645 per tonne (approx 0.65-0.8 euro per kg).
Plastic bumpers. The Stakeholder group report estimates a dismantling time of 5 minutes per bumper. If an average bumper is assumed to weigh 5.6kg (based on ARN figures), this suggests a yield of 67kg per hour, at a cost of 0.3 euro per kg (assuming a total labour cost of 20 euro per hour).
Plastics. UK studies put the costs of dismantling 2.5kg of plastics (excluding bumpers) at £384 per tonne (0.57 euro/kg) and the next 2.5kg at £700 per tonne (1.04 euro per kg).
The value of dismantled plastic varies widely according to its quality and composition, and may be positive or negative. However, the costs of treatment are likely to be low compared to the cost of dismantling.
The above evidence suggests that the costs of recycling material from ELVs through dismantling is highly variable, reflecting the steep marginal cost curve for dismantling operations. Some larger parts (e.g. plastic bumpers and larger sections of glass) may be removed relatively cost effectively, while marginal costs rise steeply as more material is removed. The figures suggest that small quantities (maximum 30-40kg) of
8 BDSV (2002)“ Nachteil für den Mittelstand? Entsorgung von Altautos neugeordnet“, press release 25 Januaru 2002
A Study to Examine the Costs and Benefits of the ELV Directive – Final Report Annexes
21
more easily removed materials may be dismantled at a moderate cost of 200-300 euro per tonne, while removal of larger quantities is likely to raise marginal costs to more than 1000 euro per tonne.
7 ESTABLISHING THE BASELINE
7.1 Current Rates of Recycling, Reuse and Recovery
Current rates of recycling, reuse and recovery are estimated from the case studies as follows (Table 13).
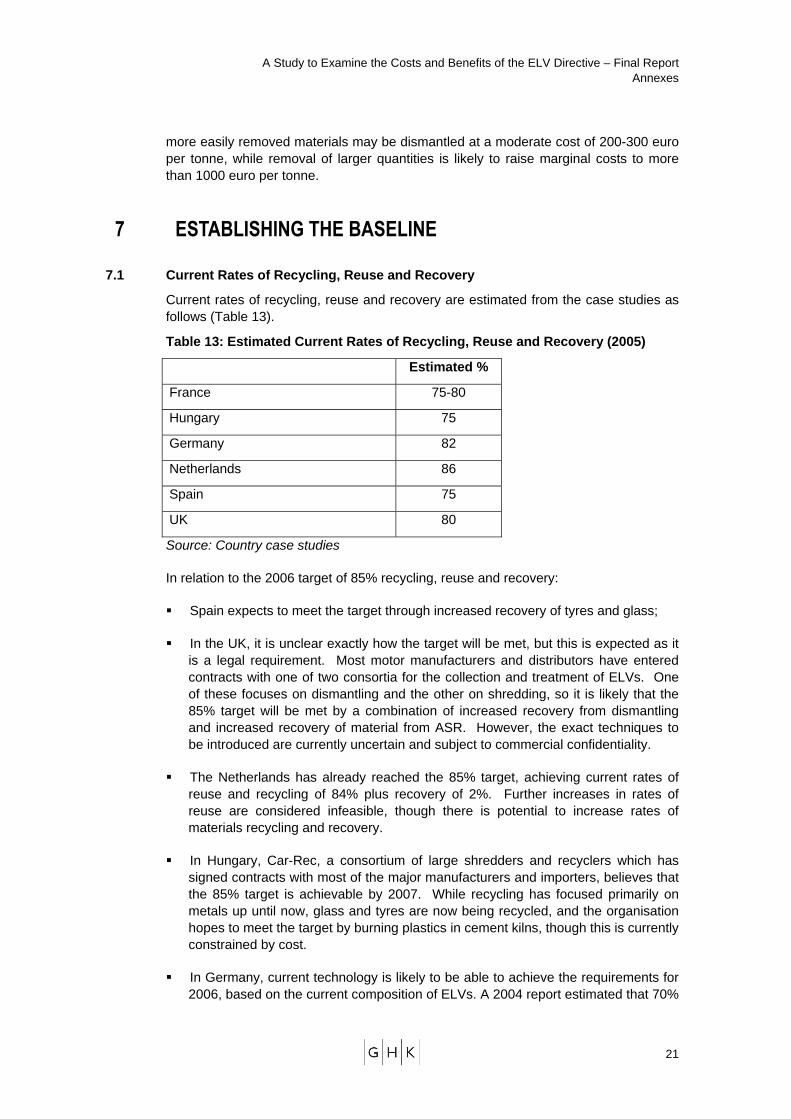
Table 13: Estimated Current Rates of Recycling, Reuse and Recovery (2005)
Estimated %
France 75-80
Hungary 75
Germany 82
Netherlands 86
Spain 75
UK 80
Source: Country case studies
In relation to the 2006 target of 85% recycling, reuse and recovery:
Spain expects to meet the target through increased recovery of tyres and glass;
In the UK, it is unclear exactly how the target will be met, but this is expected as it is a legal requirement. Most motor manufacturers and distributors have entered contracts with one of two consortia for the collection and treatment of ELVs. One of these focuses on dismantling and the other on shredding, so it is likely that the 85% target will be met by a combination of increased recovery from dismantling and increased recovery of material from ASR. However, the exact techniques to be introduced are currently uncertain and subject to commercial confidentiality.
The Netherlands has already reached the 85% target, achieving current rates of reuse and recycling of 84% plus recovery of 2%. Further increases in rates of reuse are considered infeasible, though there is potential to increase rates of materials recycling and recovery.
In Hungary, Car-Rec, a consortium of large shredders and recyclers which has signed contracts with most of the major manufacturers and importers, believes that the 85% target is achievable by 2007. While recycling has focused primarily on metals up until now, glass and tyres are now being recycled, and the organisation hopes to meet the target by burning plastics in cement kilns, though this is currently constrained by cost.
In Germany, current technology is likely to be able to achieve the requirements for 2006, based on the current composition of ELVs. A 2004 report estimated that 70%

A Study to Examine the Costs and Benefits of the ELV Directive – Final Report Annexes
22
of total ELV weight is recycled as FE and NE materials. Additionally, the dismantling of non-metallic materials and parts adds another 10% for re-use or material recycling. This already achieves the required 80% recycling rate. It is estimated that an additional 5%, mainly from the shredder residue, will need to be recovered or recycled to achieve the overall 85% rate9.
7.2 Setting the 2006 Baseline
In most MS, the bulk of the 2006 target is expected to be met by:
Recycling and reuse of metals (76%)
Recycling, reuse and recovery of tyres (3%)
Recycling, reuse and recovery of fluids (2%)
Recycling and reuse of batteries (1%).
The remaining 3% of the target is likely to be met by a combination of reuse of non metal parts, removal and recycling of plastic bumpers and glass, energy recovery from ASR, and, where suitable plant exists, recycling of materials from ASR. The experience of the Netherlands demonstrates that the target can be met primarily through intensive dismantling of ELVs.
Figure 2 provides an illustration of how the 85% target might be achieved from a typical ELV waste stream.
9 Reinhardt T & Richers U (2004), Entsorgung von Schredderrückständen – Ein aktueller Überblick, Wissenschaftliche Berichte, Forschungszentrum Karlsruhe

A Study to Examine the Costs and Benefits of the ELV Directive – Final Report Annexes
23
Typical ELV Ferrous metal – 680kg
Non-ferrous metal – 80kg
Battery – 13kg
Fluids – 17kg
Tyres – 30kg
Other (plastics, glass, textiles, rubber) – 180kg
Total – 1000kg
Depollution
Dismantling
Vehicle Shell Ferrous metal – 620kg
Non-ferrous metal – 40kg
Other (plastics, glass, textiles, rubber) – 150kg
Total – 810 kg
Fluids – 17kg – reuse/recycling/recovery
Battery – 13kg – reuse/recycling
Parts containing:
Ferrous metals – 60kg – reuse/recycling
Non-Ferrous – 40kg – reuse/recycling
Other materials – 30kg - reuse/recycling
Tyres – 30kg – reuse/recycling/recovery
Shredding and metal recovery
Auto shredder residue Other (plastics, glass, textiles, rubber) – 150kg
Ferrous metals – 620kg – recycling
Non-ferrous metal – 40kg - recycling
Landfill Total reuse/recycling/recovery – 850kg
Figure 2: Illustration of Achieving 85% Target

A Study to Examine the Costs and Benefits of the ELV Directive – Final Report Annexes
24
7.3 Future Challenges
Though the 85% target for reuse, recycling and recovery by 2006 is generally technically feasible, there is some concern that changes in the composition of cars provide greater challenges for the future. For example, in the Netherlands, ARN predicts rates of recycling, reuse and recovery to fall post 2006, as a result of increases in the proportion of ELVs accounted for by plastics and other materials that are difficult to recycle, unless new means of recycling, reuse and recovery can be found.
Furthermore, experience from the Netherlands suggests that 85% is close to the ceiling rate for achieving recycling, reuse and recovery through dismantling, suggesting that further increases are likely to depend on the recovery of materials and energy from ASR.
The need to focus on recovery of materials and energy from ASR to meet the 2015 target of 85% recycling/reuse and 95% recycling/reuse/recovery is a common conclusion from the country case studies, and is also the view put forward by the report of the Stakeholder Group, although the latter questions its feasibility.


