29

1

2
ANNEX
Overall Population
Table 1: Total population 16
Table 2: Singapore citizens by age group, ethnic group and gender 17
Table 3: Ethnic mix of citizen population 18
Table 4: Overseas Singaporean population 18
Ageing
Table 5: Old-age support ratio 18
Table 6: Median age 19
Marriage and Parenthood
Table 7: Proportion of singles among citizen males / females aged 20-49 years by age group
19
Table 8: Proportion of singles among citizens by age group, gender and highest qualification attained
20
Table 9: Number of marriages by residency status of grooms and brides 21
Table 10: General marriage rates 21
Table 11: Median age at first marriage 22
Table 12: Origins of non-citizen spouses married to citizens (for marriages in stated year)
23
Table 13: Median age of mothers at first birth by residency status of mothers 23
Table 14: Average number of children born to ever-married females aged 30-49 years by residency status of females
24
Table 15: Proportion of ever-married females aged 30-49 years who are childless by residency status of females
24
Table 16: Number of births by birth order and residency status 25
Table 17: Resident total fertility rate by ethnic group 25
Immigration
Table 18: Profile of SCs and PRs granted in 2016 26
3
OVERVIEW 1. Population in Brief is an annual publication providing key updates and trends on Singapore’s population. 2. Its goal is to promote understanding of the factors that contribute to a sustainable population in Singapore. A sustainable population is one that is balanced across the three pillars of a strong and cohesive society with Singaporeans at its heart, a dynamic and vibrant economy to provide good jobs and opportunities for Singaporeans, and a high quality living environment. 3. Key highlights of the past year:
In 2016, there were 23,873 citizen marriages, slightly above the 23,805 citizen marriages in 2015. There were 33,167 citizen births in 2016, compared with 33,725 in 2015. The number of citizen births remained above the average of the past decade of about 32,200 citizen births.
The citizen population grew at a similar pace as last year, with 3.44 million citizens as of June 2017. The citizen population continues to age, with 14.4% aged 65 and above compared with 13.7% last year. The permanent resident population remained stable at 0.53 million.
The non-resident population declined by 1.6% to 1.65 million as of June 2017, driven mainly by a decline in the number of Work Permit Holders in the Construction and Marine & Offshore Engineering sectors, reflecting the weakness in these sectors.
Overall, total population growth was almost flat at 0.1% in the last year compared with 1.3% in the previous year. The total population size remained stable at 5.61 million as of June 2017.
****

4
KEY INDICATORS
OVERALL POPULATION (‘000) 2016 2017
Citizen population 3,408.9 3,439.2
Permanent resident (PR) population 524.6 526.6
Resident population 3,933.6 3,965.8
Non-resident population 1,673.7 1,646.5
Total population 5,607.3 5,612.3
AGE PROFILE OF CITIZENS 2016 2017
Proportion aged 65 and above (%) 13.7 14.4
Citizen median age (years) 41.0 41.3
Citizen old-age support ratio1 4.7 4.4
MARRIAGE & PARENTHOOD 2015 2016
Number of marriages involving at least one citizen 23,805 23,873
Citizen births 33,725 33,167
Resident total fertility rate2 1.24 1.20
Note: The reference period for all data above is as of June of the year, except for Marriage & Parenthood data which are based on the full calendar year (January to December). Source: Department of Statistics, Immigration & Checkpoints Authority
1 The old-age support ratio refers to the number of persons aged 20-64 years, for every person aged 65 years and over. 2 Total fertility rate refers to the average number of children who would be born per female, if all females live through their childbearing years of 15-49 and bear children according to a given set of age-specific fertility rates.

5
OVERALL POPULATION 1. There were 3.44 million Singapore citizens as of June 2017. Together with 0.53 million permanent residents (PRs), there were 3.97 million residents. Non-residents totalled 1.65 million, and include dependants, international students and individuals who are here to work. Overall, Singapore’s total population stood at 5.61 million.
Diagram 1: Total population, as of June 20173
Source: Department of Statistics, Ministry of Manpower Numbers may not sum due to rounding.
3 The figures are based on stock numbers as of end June 2017. Work Permit Holders are mostly in occupations which face difficulties hiring Singaporeans (e.g. construction workers). S Pass holders work in various industries such as retail, manufacturing, and healthcare (e.g. allied healthcare workers), as well as in social and voluntary welfare sectors as care-givers for the elderly. Employment Pass Holders work in managerial, executive or specialised jobs.

6
2. The citizen population grew by 0.9% due to citizen births and immigration. The PR population remained stable (Chart 1).
Stable Growth in Citizen Population; Stable PR Population Size Chart 1: Total population by residency status, as of June
Source: Department of Statistics Numbers may not sum due to rounding.
3. The non-resident population fell by 1.6% to 1.65 million, due to a decline in foreign employment last year (Chart 2). This was mainly attributed to a decrease in the number of Work Permit Holders in the Construction and Marine & Offshore Engineering sectors, reflecting the weakness in these sectors.
4 The figures refer to foreigners employed at any time in the month, in line with internationally accepted statistical definitions of employment. Foreign domestic workers are excluded in the figures.
Decline in Foreign Employment From June 2016 to June 2017 Chart 2: Foreign employment growth4, as of June
Source: Ministry of Manpower
60K
33K23K 27K
-36K
-60K
-40K
-20K
0K
20K
40K
60K
80K
2012-2013 2013-2014 2014-2015 2015-2016 2016-2017
3.31M 3.34M 3.38M 3.41M 3.44M
0.53M 0.53M 0.53M 0.52M 0.53M
1.55M 1.60M 1.63M 1.67M 1.65M
0.0M
1.0M
2.0M
3.0M
4.0M
5.0M
6.0M
2013 2014 2015 2016 2017
Citizens PRs Non-residents
5.40M 5.47M 5.54M 5.61M 5.61M
7
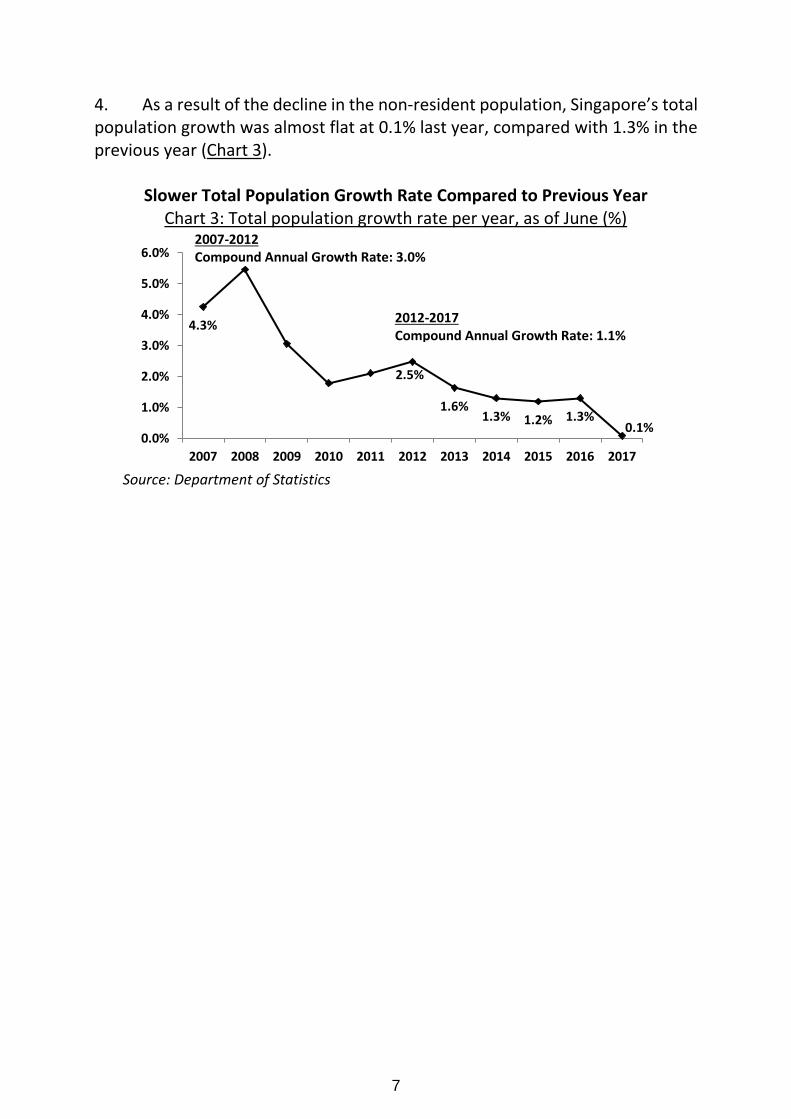
4. As a result of the decline in the non-resident population, Singapore’s total population growth was almost flat at 0.1% last year, compared with 1.3% in the previous year (Chart 3).
Slower Total Population Growth Rate Compared to Previous Year Chart 3: Total population growth rate per year, as of June (%)
Source: Department of Statistics
4.3%
2.5%
1.6%1.3% 1.2% 1.3%
0.1%0.0%
1.0%
2.0%
3.0%
4.0%
5.0%
6.0%
2007 2008 2009 2010 2011 2012 2013 2014 2015 2016 2017
2007-2012 Compound Annual Growth Rate: 3.0%
2012-2017 Compound Annual Growth Rate: 1.1%

8
AGEING 5. With increasing life expectancy and low fertility rates, the proportion of our citizen population aged 65 years5 and above is rising, and doing so at a faster pace compared to the last decade. We can expect the large cohorts of ‘baby boomers6’ to begin entering the post-65 age range (Chart 4a). Between 2016 and 2017, the proportion of citizens aged 65 years and above increased from 13.7% to 14.4%. The median age of the citizen population rose from 41.0 years to 41.3 years in the same period (Chart 4b).
Greater Proportion of Citizen Population Aged 65 Years and Above Chart 4a: Age profile of citizen population, as of June
2007 2017
Chart 4b: Median age and proportion of citizens aged 65 years and above Median age of citizens (years) % of citizens aged 65 years and above
Source: Department of Statistics
5 The benchmark of 65 years aligns with international statistical definitions. 6 For this publication, ‘baby boomers’ are defined as those born from 1950 to 1964.
37.5
39.6
41.041.3
35
36
37
38
39
40
41
42
2007 2012 2016 2017
9.4
11.1
13.714.4
0
2
4
6
8
10
12
14
16
2007 2012 2016 2017

9
6. Currently, there are 4.4 citizens in the working age band of 20-64 years7, for each citizen aged 65 years and above (Chart 5, citizen old-age support ratio). This is a decline from 6.8 in 2007, and could fall to about 2.4 in 2030. If we include PRs, our resident (i.e. citizen + PR) old-age support ratio stands higher at 5.1 in 2017, as majority of our PRs are in the working ages.
Fewer Working-Age Citizens to Each Citizen Aged 65 and Above Chart 5: Citizen old-age support ratio, 1970-2030
Source: Department of Statistics
7. The number of citizens aged 80 and above has also almost doubled over the last decade (Chart 6).
More Citizens Aged 80 and Above Chart 6: Number and % of citizens aged 80 years and above
Source: Department of Statistics
7 Today in Singapore, many of those aged 65 years and above continue to work beyond the working ages of 20-
64 years.
55K(1.7%)
75K(2.3%)
95K(2.8%)
98K(2.9%)
0K
20K
40K
60K
80K
100K
120K
2007 2012 2016 2017
10
MARRIAGE & PARENTHOOD
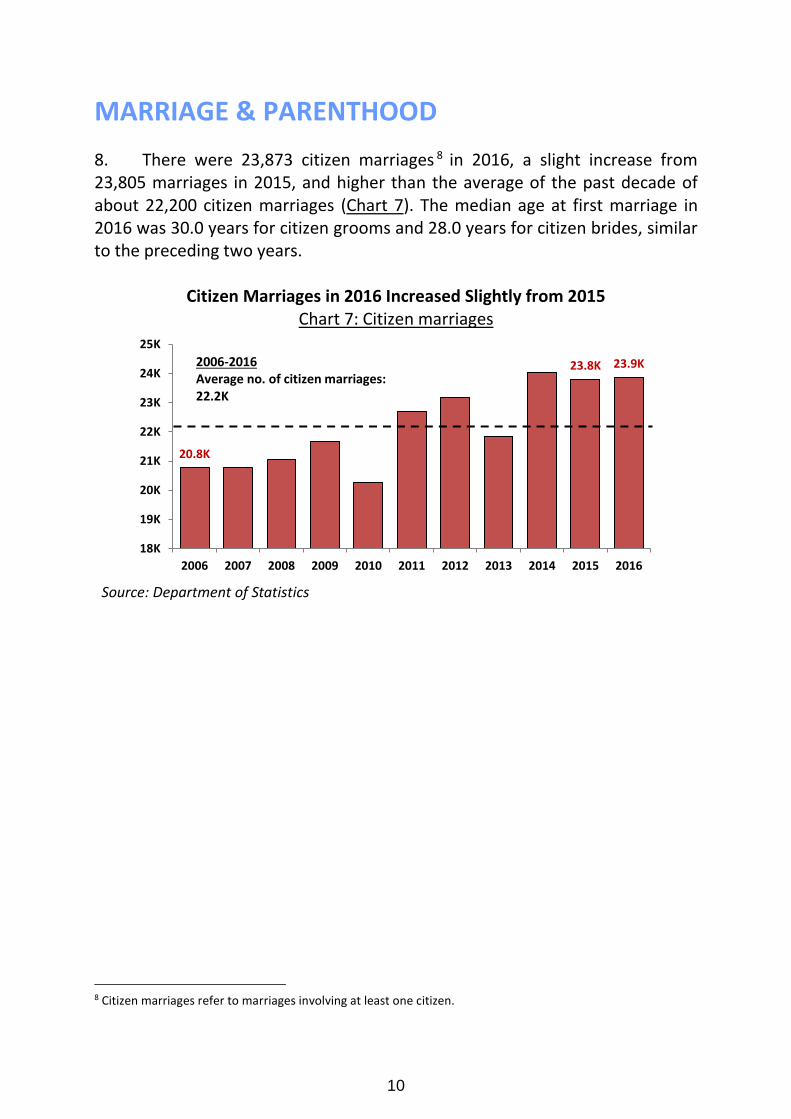
8. There were 23,873 citizen marriages 8 in 2016, a slight increase from 23,805 marriages in 2015, and higher than the average of the past decade of about 22,200 citizen marriages (Chart 7). The median age at first marriage in 2016 was 30.0 years for citizen grooms and 28.0 years for citizen brides, similar to the preceding two years.
Citizen Marriages in 2016 Increased Slightly from 2015 Chart 7: Citizen marriages
Source: Department of Statistics
8 Citizen marriages refer to marriages involving at least one citizen.
20.8K
23.8K 23.9K
18K
19K
20K
21K
22K
23K
24K
25K
2006 2007 2008 2009 2010 2011 2012 2013 2014 2015 2016
2006-2016 Average no. of citizen marriages: 22.2K

11
9. More than a third of citizen marriages last year involved transnational9 couples, and 2 in 10 citizen marriages were inter-ethnic (Chart 8).
Chart 8: Transnational and inter-ethnic marriages involving at least one citizen
Source: Department of Statistics
10. The number of citizen births10 fell slightly to 33,167, from 33,725 in 2015. Nonetheless, this remained above the average of the past decade of about 32,200 citizen births (Chart 9). The median age of citizen mothers at first birth remained at 30.3 years in the last three years.
2016 Citizen Births Remained Above Decade’s Average Chart 9: Citizen births
Source: Immigration & Checkpoints Authority
9 Transnational marriages refer to marriages involving one citizen and one non-citizen (i.e. permanent resident
or non-resident). 10 Citizen births refer to babies born to at least one citizen parent.
39% 39% 39% 41% 41% 39% 40% 39% 37% 36% 36%
15% 16% 17% 19% 20% 20% 21% 21% 20% 21% 21%
0%
10%
20%
30%
40%
50%
2006 2007 2008 2009 2010 2011 2012 2013 2014 2015 2016
Proportion of transnational marriages (%)
Proportion of inter-ethnic marriages (%)
33.2K 33.2K33.7K
33.2K
28K
29K
30K
31K
32K
33K
34K
2006 2007 2008 2009 2010 2011 2012 2013 2014 2015 2016
2006-2016 Average no. of citizen births: 32.2K
12
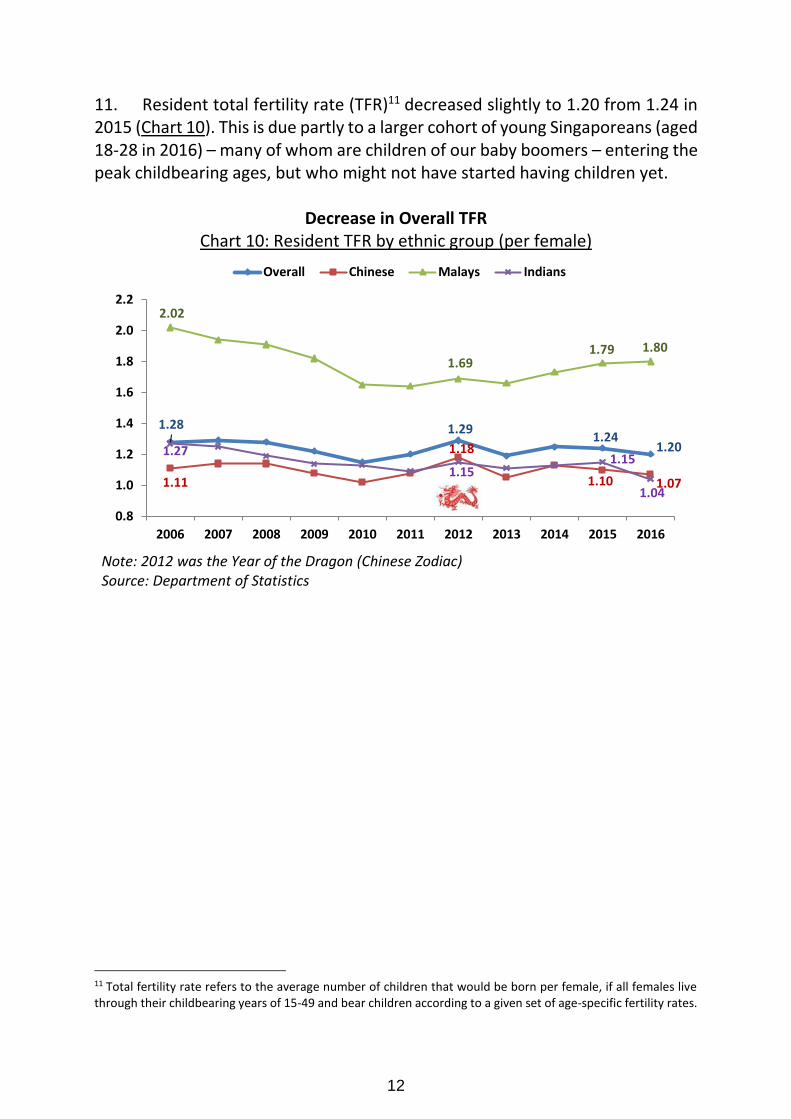
11. Resident total fertility rate (TFR)11 decreased slightly to 1.20 from 1.24 in 2015 (Chart 10). This is due partly to a larger cohort of young Singaporeans (aged 18-28 in 2016) – many of whom are children of our baby boomers – entering the peak childbearing ages, but who might not have started having children yet.
Decrease in Overall TFR Chart 10: Resident TFR by ethnic group (per female)
Note: 2012 was the Year of the Dragon (Chinese Zodiac) Source: Department of Statistics
11 Total fertility rate refers to the average number of children that would be born per female, if all females live through their childbearing years of 15-49 and bear children according to a given set of age-specific fertility rates.
1.28 1.291.24
1.20
1.11
1.18
1.10 1.07
2.02
1.691.79 1.80
1.27
1.151.15
1.04
0.8
1.0
1.2
1.4
1.6
1.8
2.0
2.2
2006 2007 2008 2009 2010 2011 2012 2013 2014 2015 2016
Overall Chinese Malays Indians
13
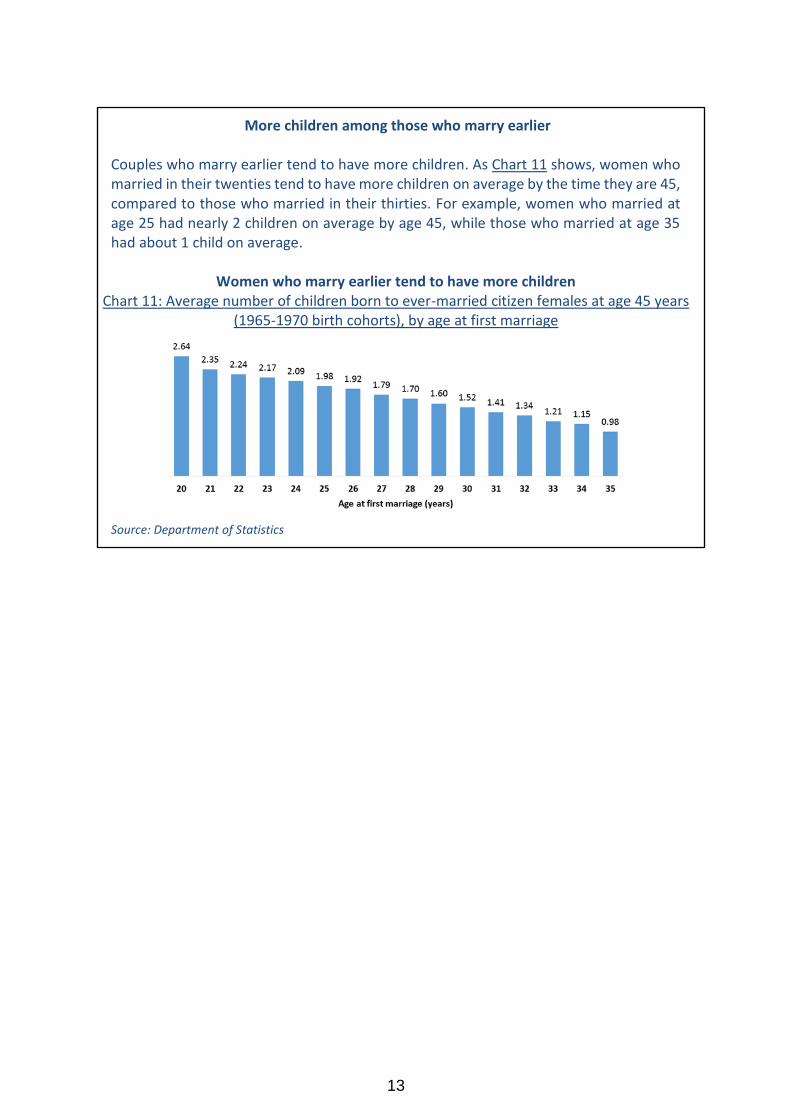
More children among those who marry earlier
Couples who marry earlier tend to have more children. As Chart 11 shows, women who married in their twenties tend to have more children on average by the time they are 45, compared to those who married in their thirties. For example, women who married at age 25 had nearly 2 children on average by age 45, while those who married at age 35 had about 1 child on average.
Women who marry earlier tend to have more children
Chart 11: Average number of children born to ever-married citizen females at age 45 years (1965-1970 birth cohorts), by age at first marriage
Source: Department of Statistics
14
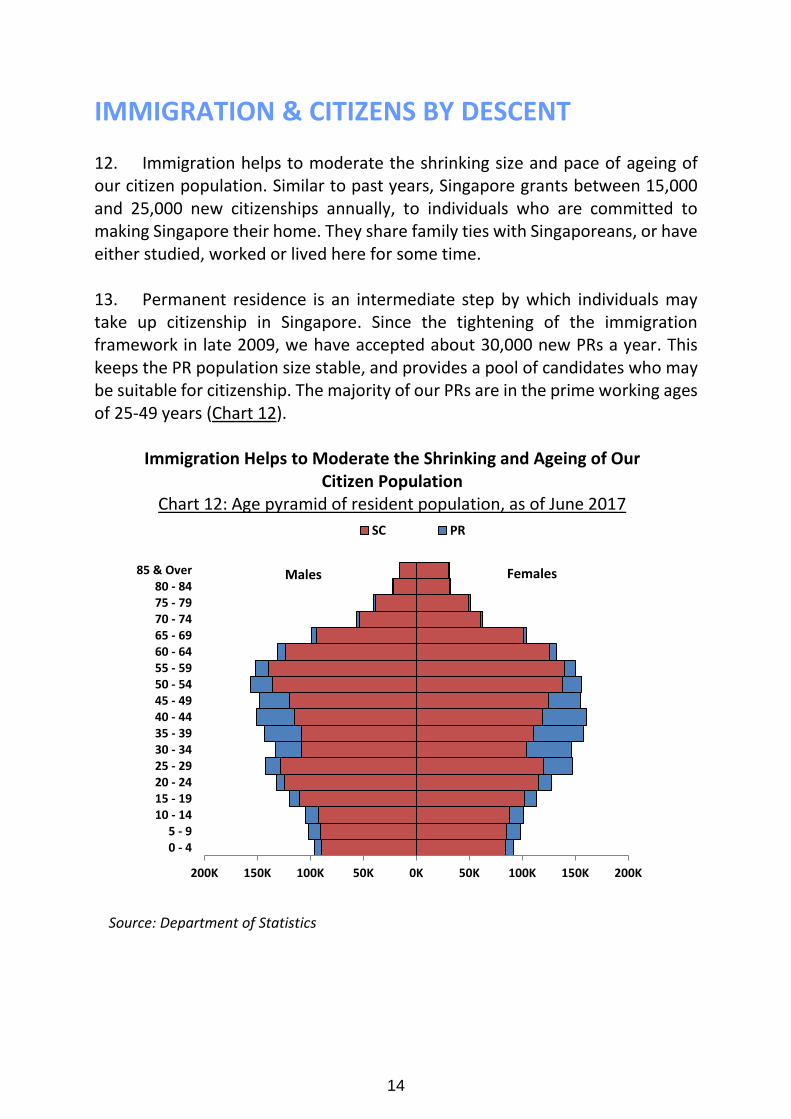
IMMIGRATION & CITIZENS BY DESCENT 12. Immigration helps to moderate the shrinking size and pace of ageing of our citizen population. Similar to past years, Singapore grants between 15,000 and 25,000 new citizenships annually, to individuals who are committed to making Singapore their home. They share family ties with Singaporeans, or have either studied, worked or lived here for some time. 13. Permanent residence is an intermediate step by which individuals may take up citizenship in Singapore. Since the tightening of the immigration framework in late 2009, we have accepted about 30,000 new PRs a year. This keeps the PR population size stable, and provides a pool of candidates who may be suitable for citizenship. The majority of our PRs are in the prime working ages of 25-49 years (Chart 12).
Immigration Helps to Moderate the Shrinking and Ageing of Our Citizen Population
Chart 12: Age pyramid of resident population, as of June 2017
Source: Department of Statistics
200K 150K 100K 50K 0K 50K 100K 150K 200K
0 - 45 - 9
10 - 1415 - 1920 - 2425 - 2930 - 3435 - 3940 - 4445 - 4950 - 5455 - 5960 - 6465 - 6970 - 7475 - 7980 - 84
85 & Over
SC Males PR Males
Females Males

15
14. In 2016, 22,102 Singapore Citizens (SCs) and 31,050 PRs were granted. Besides immigration, citizenships are also granted to children born overseas to Singaporean parents (“citizens by descent”). Last year, such children made up about 1,500 or 7% of the new SCs granted (Chart 13).
Chart 13: Number of SCs and PRs granted
*This is a subset of the total SCs granted each year. It refers to SCs granted to children born overseas to Singaporean parents. Source: Immigration & Checkpoints Authority
63,627
79,167
59,460
29,265 27,521 29,891 29,869 29,854 29,955 31,050
17,334 20,513 19,928 18,758 15,777
20,693 20,572 20,348 20,815 22,102
1,123 1,237 1,298 1,232 1,450 1,307 1,476 1,345 1,579 1,513
0K
10K
20K
30K
40K
50K
60K
70K
80K
90K
2007 2008 2009 2010 2011 2012 2013 2014 2015 2016
Total PRs granted Total SCs granted Granted to SCs by Descent*
16
ANNEX
Detailed Statistical Tables
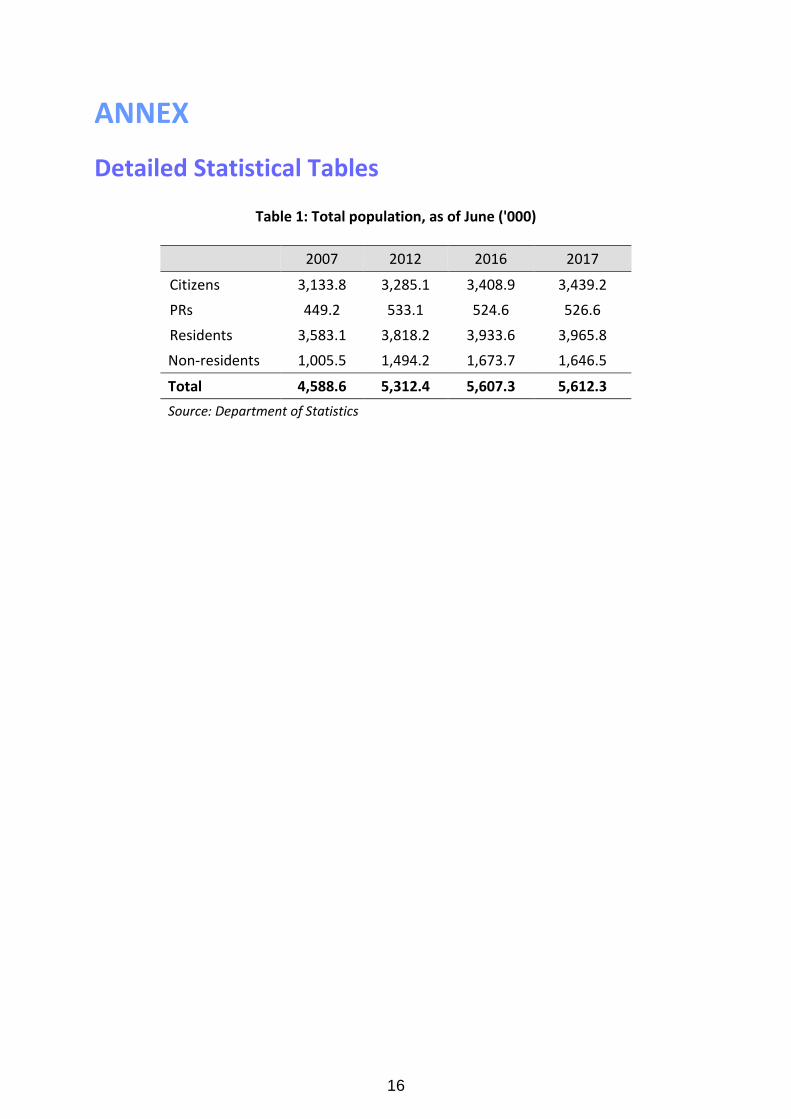
Table 1: Total population, as of June ('000)
2007 2012 2016 2017
Citizens 3,133.8 3,285.1 3,408.9 3,439.2
PRs 449.2 533.1 524.6 526.6
Residents 3,583.1 3,818.2 3,933.6 3,965.8
Non-residents 1,005.5 1,494.2 1,673.7 1,646.5
Total 4,588.6 5,312.4 5,607.3 5,612.3
Source: Department of Statistics

17
Table 2: Singapore citizens by age group, ethnic group and gender, June 2017
Age Group (Years)
Total Chinese Malays Indians Others
Persons Males Females Persons Males Females Persons Males Females Persons Males Females Persons Males Females
Number ('000)
Total 3,439.2 1,707.2 1,731.9 2,617.6 1,294.5 1,323.1 515.0 259.3 255.7 255.8 129.0 126.9 50.8 24.5 26.3
0 - 4 173.3 89.2 84.1 120.9 62.3 58.7 34.3 17.7 16.7 12.7 6.6 6.2 5.3 2.6 2.7
5 - 9 175.3 90.0 85.3 125.4 64.6 60.8 30.8 15.8 15.1 14.1 7.1 7.0 5.0 2.5 2.5
10 - 14 180.0 92.2 87.8 125.9 64.6 61.2 33.6 17.3 16.3 16.2 8.1 8.1 4.3 2.2 2.2
15 - 19 212.4 109.8 102.6 148.6 76.9 71.7 41.3 21.5 19.9 18.3 9.3 9.0 4.2 2.1 2.1
20 - 24 240.3 124.5 115.8 170.4 88.3 82.1 46.5 24.1 22.5 19.7 10.1 9.6 3.7 1.9 1.7
25 - 29 248.1 128.1 120.0 177.5 92.0 85.5 47.4 24.2 23.1 19.7 10.0 9.8 3.5 1.8 1.6
30 - 34 212.5 108.0 104.5 154.2 78.4 75.7 38.5 19.6 18.9 17.0 8.7 8.3 2.9 1.3 1.6
35 - 39 219.1 108.8 110.2 170.2 84.3 85.9 30.0 15.3 14.7 16.0 8.0 8.0 2.8 1.2 1.6
40 - 44 234.8 115.1 119.7 187.0 91.0 96.0 27.9 14.1 13.8 16.8 8.5 8.3 3.1 1.4 1.6
45 - 49 244.2 119.3 125.0 190.4 92.1 98.3 31.5 15.6 15.9 19.1 10.2 9.0 3.2 1.4 1.8
50 - 54 273.7 135.9 137.8 207.5 102.7 104.8 41.4 20.5 20.9 21.6 11.1 10.4 3.2 1.5 1.7
55 - 59 279.9 139.5 140.4 217.3 108.0 109.3 38.9 19.5 19.4 20.7 10.6 10.1 2.9 1.3 1.5
60 - 64 249.1 123.1 126.0 201.6 99.7 101.9 29.2 14.3 14.8 16.1 8.0 8.2 2.2 1.1 1.1
65 - 69 195.4 94.6 100.9 162.9 79.1 83.7 19.0 8.9 10.0 11.9 5.6 6.3 1.7 0.9 0.8
70 - 74 114.4 53.6 60.8 97.7 45.9 51.7 9.8 4.5 5.3 6.0 2.7 3.3 0.9 0.4 0.5
75 - 79 88.3 38.7 49.6 76.4 33.7 42.7 6.8 3.0 3.9 4.3 1.7 2.6 0.7 0.3 0.4
80 - 84 52.7 21.7 31.0 44.3 18.2 26.1 4.8 2.0 2.8 3.0 1.2 1.7 0.6 0.2 0.4
85 & Over
45.8 15.4 30.4 39.4 12.5 26.9 3.2 1.3 1.9 2.5 1.4 1.2 0.6 0.2 0.4
Source: Department of Statistics
17
18
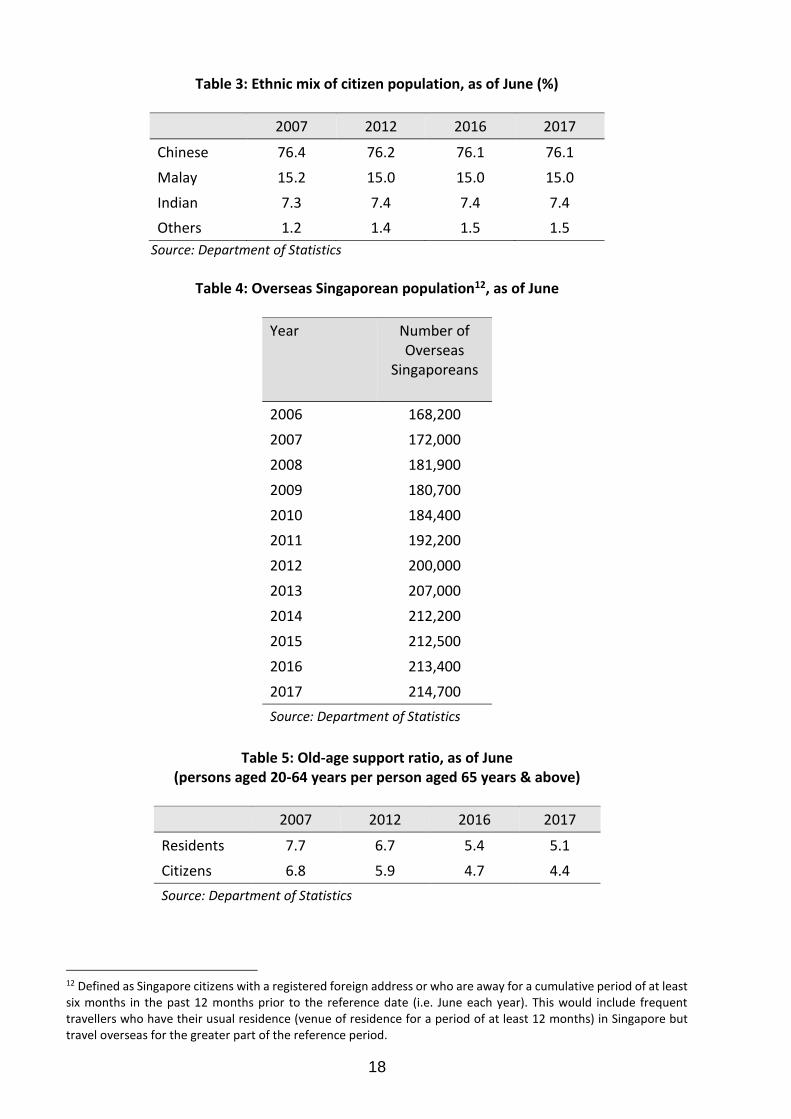
Table 3: Ethnic mix of citizen population, as of June (%)
2007 2012 2016 2017
Chinese 76.4 76.2 76.1 76.1
Malay 15.2 15.0 15.0 15.0
Indian 7.3 7.4 7.4 7.4
Others 1.2 1.4 1.5 1.5
Source: Department of Statistics
Table 4: Overseas Singaporean population12, as of June
Year Number of Overseas
Singaporeans
2006 168,200
2007 172,000
2008 181,900
2009 180,700
2010 184,400
2011 192,200
2012 200,000
2013 207,000
2014 212,200
2015 212,500
2016 213,400
2017 214,700
Source: Department of Statistics
Table 5: Old-age support ratio, as of June
(persons aged 20-64 years per person aged 65 years & above)
2007 2012 2016 2017
Residents 7.7 6.7 5.4 5.1
Citizens 6.8 5.9 4.7 4.4
Source: Department of Statistics
12 Defined as Singapore citizens with a registered foreign address or who are away for a cumulative period of at least six months in the past 12 months prior to the reference date (i.e. June each year). This would include frequent travellers who have their usual residence (venue of residence for a period of at least 12 months) in Singapore but travel overseas for the greater part of the reference period.

19
Table 6: Median age, as of June (years)
2007 2012 2016 2017
Residents 36.4 38.4 40.0 40.5
Citizens 37.5 39.6 41.0 41.3
Source: Department of Statistics
Table 7: Proportion of singles among citizen males / females aged 20-49 years by age group, as of June13 (%)
2006 2011 2015 2016
Proportion of singles among citizen males by age group 20-24 years 97.4 98.7 98.7 98.4 25-29 years 77.2 80.3 82.6 80.6 30-34 years 40.2 45.3 43.4 41.3 35-39 years 23.0 24.6 25.1 24.9 40-44 years 17.3 16.6 18.2 17.6 45-49 years 13.5 13.4 14.2 14.7 Proportion of singles among citizen females by age group 20-24 years 92.0 94.7 96.0 95.7 25-29 years 59.6 66.7 69.0 68.8 30-34 years 27.9 31.4 31.4 31.3 35-39 years 18.5 20.3 21.5 22.4 40-44 years 13.6 16.4 17.9 17.7 45-49 years 13.8 13.4 16.1 14.6
Source: Department of Statistics
13 Data on proportion of singles for selected years prior to 2015 were revised in Feb 2016 for consistency across
different survey sources.

20
Table 8: Proportion of singles among citizens by age group, gender and highest qualification
attained, as of June14,15 (%)
Age group (years) / Highest qualification attained
2006 2011 2016
Males Females Males Females Males Females
Aged 30-39 31.4 23.0 34.5 25.5 33.1 26.9 Below secondary 41.9 18.1 36.1 17.2 40.1 21.0 Secondary 30.2 17.0 33.2 21.5 35.2 21.8 Post-secondary (Non-Tertiary)
28.0 23.4 34.1 21.5 31.5 21.9
Diploma & Professional Qualification
31.8 25.8 35.9 24.8 32.6 24.1
University 27.2 29.4 33.5 30.2 32.1 30.5
Aged 40-49 15.3 13.7 14.9 14.8 16.1 16.1 Below secondary 20.5 10.2 22.8 10.9 22.0 10.9 Secondary 13.6 13.0 14.4 11.5 17.9 12.0 Post-secondary (Non-Tertiary)
13.3 15.9 12.6 16.4 16.8 11.6
Diploma & Professional Qualification
9.0 22.6 12.0 18.0 14.2 19.3
University 9.1 21.4 10.2 22.3 13.7 21.6 Source: Department of Statistics
14 Data by highest qualification attained pertain to citizens who are not attending educational institutions as full-
time students. The data include those who are upgrading their qualifications through part-time courses while
working.
15 Data on proportion of singles for selected years prior to 2015 were revised in Feb 2016 for consistency across
different survey sources.

21
Table 9: Number of marriages by residency status of grooms and brides
Grooms Brides 2006 2011 2015 2016
Total number of marriages 23,706 27,258 28,322 27,971
Citizen Citizen 12,617 13,763 15,243 15,292
Citizen PR 1,169 1,397 1,428 1,471
Citizen Non-resident 5,197 5,490 4,828 4,822
PR Citizen 639 699 684 686
Non-resident Citizen 1,156 1,363 1,622 1,602
PR PR 725 912 603 573
PR Non-resident 962 1,066 941 839
Non-resident PR 519 654 671 642
Non-resident Non-resident 722 1,914 2,302 2,044
Source: Department of Statistics
Table 10: General marriage rates (per 1,000 unmarried males / females aged 15-49 years)
2006 2011 2015 2016
Residents Males 43.7 43.5 44.2 44.4
Females 40.0 39.2 41.1 41.6
Citizens Males 42.0 42.0 43.2 43.7
Females 37.5 37.2 39.8 40.5
Source: Department of Statistics
22
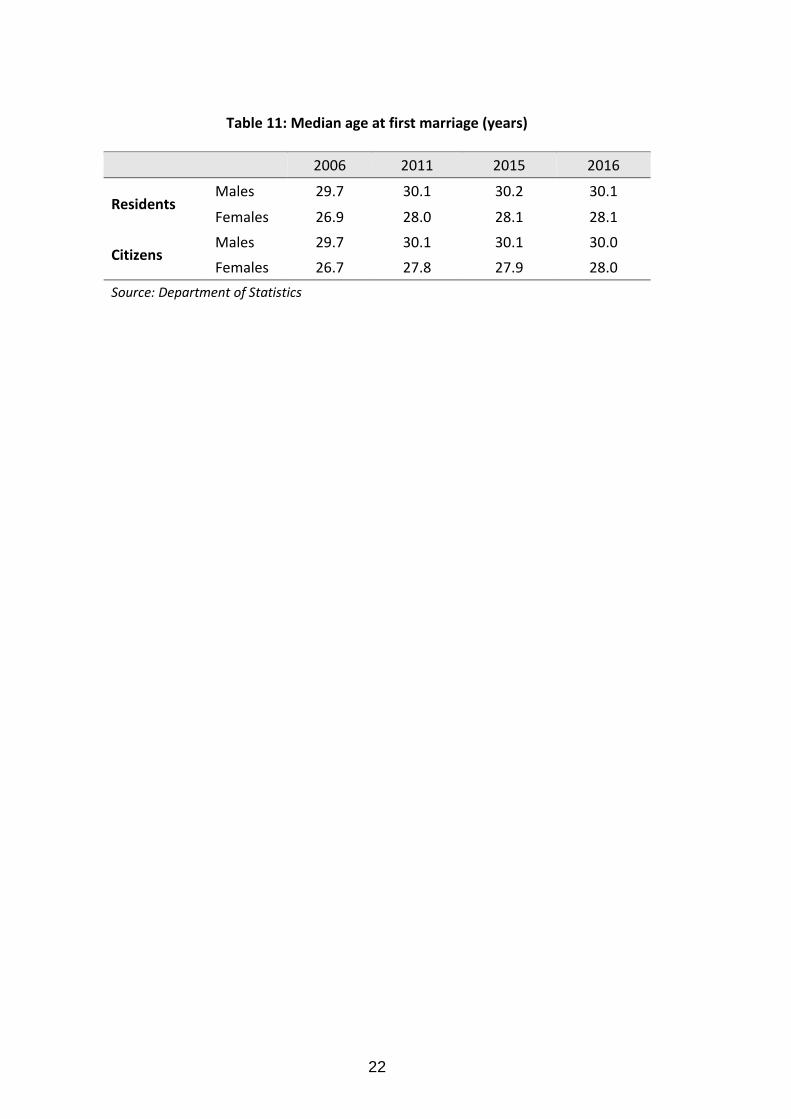
Table 11: Median age at first marriage (years)
2006 2011 2015 2016
Residents Males 29.7 30.1 30.2 30.1
Females 26.9 28.0 28.1 28.1
Citizens Males 29.7 30.1 30.1 30.0
Females 26.7 27.8 27.9 28.0
Source: Department of Statistics
23
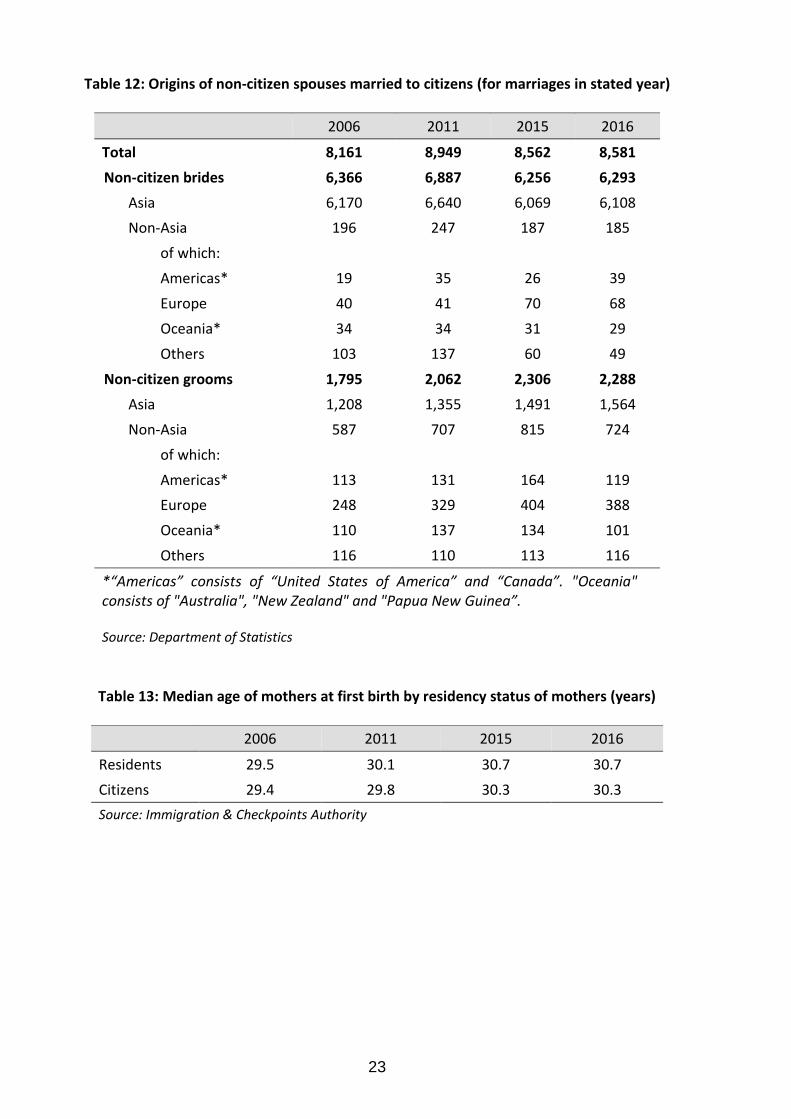
Table 12: Origins of non-citizen spouses married to citizens (for marriages in stated year)
2006 2011 2015 2016
Total 8,161 8,949 8,562 8,581
Non-citizen brides 6,366 6,887 6,256 6,293
Asia 6,170 6,640 6,069 6,108
Non-Asia 196 247 187 185
of which:
Americas* 19 35 26 39
Europe 40 41 70 68
Oceania* 34 34 31 29
Others 103 137 60 49
Non-citizen grooms 1,795 2,062 2,306 2,288
Asia 1,208 1,355 1,491 1,564
Non-Asia 587 707 815 724
of which:
Americas* 113 131 164 119
Europe 248 329 404 388
Oceania* 110 137 134 101
Others 116 110 113 116
*“Americas” consists of “United States of America” and “Canada”. "Oceania" consists of "Australia", "New Zealand" and "Papua New Guinea”. Source: Department of Statistics
Table 13: Median age of mothers at first birth by residency status of mothers (years)
2006 2011 2015 2016
Residents 29.5 30.1 30.7 30.7
Citizens 29.4 29.8 30.3 30.3
Source: Immigration & Checkpoints Authority

24
Table 14: Average number of children born to ever-married females aged 30-49 years by
residency status of females, as of June (per ever-married female)
2006 2011 2015 2016
30-39 40-49 30-39 40-49 30-39 40-49 30-39 40-49
Residents 1.55 2.08 1.46 1.99 1.46 1.85 1.45 1.84
Citizens 1.62 2.13 1.52 2.06 1.49 1.91 1.46 1.90
Source: Department of Statistics
Table 15: Proportion of ever-married females aged 30-49 years who are childless by residency status of females, as of June (%)
2006 2011 2015 2016
30-39 40-49 30-39 40-49 30-39 40-49 30-39 40-49
Residents 18.3 7.7 20.9 9.1 20.7 11.6 20.3 11.4
Citizens 18.5 6.9 21.8 8.4 21.9 11.3 22.6 11.2
Source: Department of Statistics

25
Table 16: Number of births16 by birth order and residency status
Birth Order 2006 2011 2015 2016
Total births 38,317 39,654 42,185 41,251
Resident births 36,272 36,178 37,861 36,875
First 16,372 17,180 17,915 17,070
Second 12,948 12,959 13,314 13,309
Third 4,952 4,356 4,731 4,539
Fourth 1,432 1,211 1,332 1,330
Fifth & over 568 472 569 627
Citizen births 31,956 30,946 33,725 33,167
First 14,365 14,523 15,887 15,337
Second 11,124 10,919 11,632 11,769
Third 4,548 3,908 4,375 4,172
Fourth 1,363 1,136 1,278 1,270
Fifth & over 556 460 553 619
Source: Immigration & Checkpoints Authority
Table 17: Resident total fertility rate by ethnic group (per female)
2006 2011 2015 2016
Overall 1.28 1.20 1.24 1.20
Chinese 1.11 1.08 1.10 1.07
Malays 2.02 1.64 1.79 1.80
Indians 1.27 1.09 1.15 1.04
Source: Department of Statistics
16 Citizen births refer to births born to at least one citizen parent. Resident births refer to births born to at least one
citizen or PR parent.

26
Table 18: Profile of SCs and PRs granted in 2016
New
Permanent Residents
New Citizens
Total 31,050 22,102
By age group (%)
Above 40 years 6.8 22.0
31-40 years 23.5 27.3
21-30 years 40.9 12.5
20 years and below 28.9 38.2
By highest qualification attained among those aged 20 & over (%)
Post-secondary 82.7 73.5
Secondary and below 17.3 26.5
By region of origin (%)
Southeast Asian countries 62.0 62.0
Other Asian countries 29.6 32.2
Others 8.4 5.8
Source: Immigration & Checkpoints Authority

27