69
ANNEX VI Wind Code Evaluation
ANNE X VI
W ind C ode E valuation

W IND CODE EVALUATION
Caribbean Islands (CARICOM)Evaluation Conducted by Winston H.E. Suite
NAME OF DOCUMENT: Caribbean Uniform Building Code (CUBiC)Part 2 Section 2
YEAR: 1985
GENERAL REMARKS:
Structural Design Requirements. Wind load. Has been adapted from adocument prepared for the International Standards Organisation (ISO).Technical Committee 98. Working Group 2 on Wind Loads.
This section of CUBiC consists of a basic document and five technicalAppendices.
“The basic document deals with the various actions of wind which shouldbe considered and the general requirements of the standard” [Foreword]. Theappendices are listed as follows:
Appendix 1 - Simplified Design ProcedureAppendices - Structural Design RequirementAppendix 2 - Reference Velocity Pressure, qrefAppendix 3 - Exposure Factor, CexpAppendix 4 - Aerodynamic Shape Factor,
CshpAppendix 5 - Dynamic Response Factor,Cdyn
The wind climate has been evaluated from an extensive study ofhurricanes in the Caribbean carried out by A.G. Davenport, P.N. Georgiou and D.Surry, A Hurricane Wind Risk Study For the Eastern Caribbean, Jamaica andBelize with special consideration to the influence of Topography. Report for thePan-Caribbean Disaster Prevention and Preparedness Project (PCDPPP), 1985.
SPECIFIC ITEMS:
1. SCOPE [2.201]
1.1Explicit Concepts and Limitations
“This document describes the action of wind on structures and methodsfor calculating characteristic values of wind loads for use in designing buildings,towers, chimneys, bridges and other structures as well as their components and
1
appendages. These loads will be suitable for use in conjunction with other ISOLoad Standards and with ISO 2394 – General Principles on Reliability forStructures”.
“Structures of an unusual nature, size or complexity may require specialengineering study”.
1.2 Performance Objectives
Knowledge of wind and its effects on structures is needed to ensure safeand, at the same time, economic structures.
No more specific performance objectives are expressly listed but the mainobjectives are to protect human life and to reduce economic loss caused by windaction (tropical storms and hurricanes). Even structures which are seriouslydamaged by wind action should not collapse endangering the life of theoccupants.
2. WIND HAZARD
2.1 Basic Wind Speed
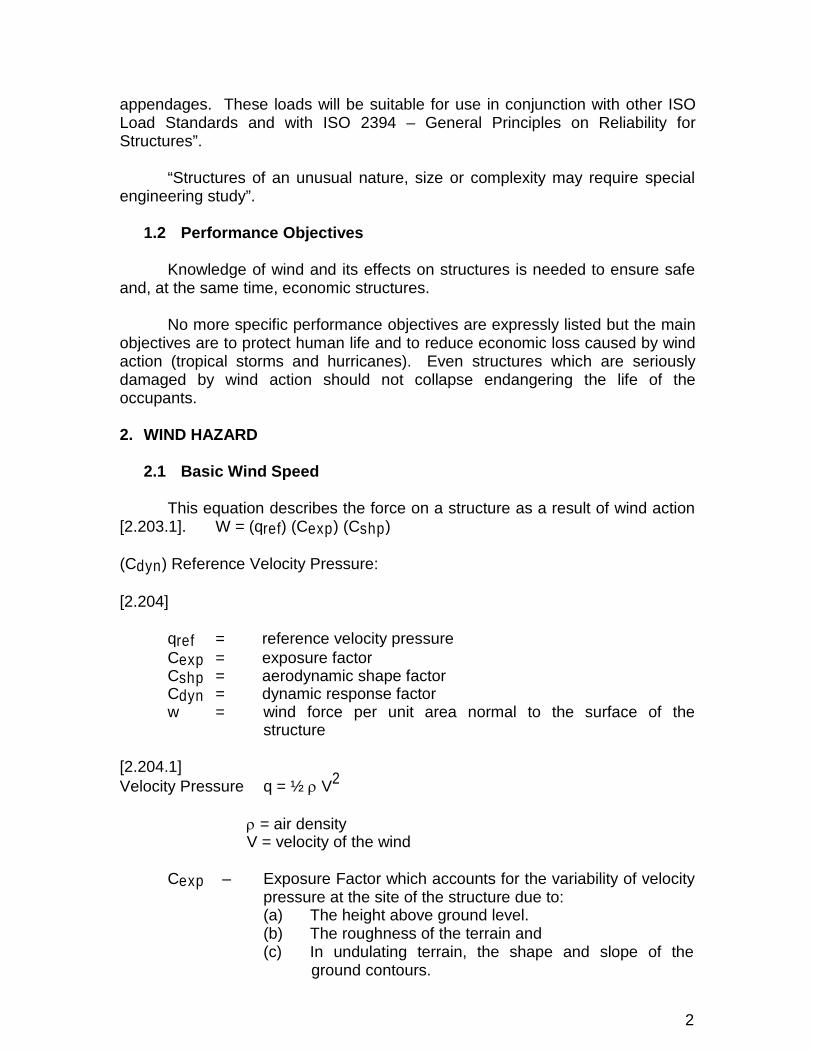
This equation describes the force on a structure as a result of wind action[2.203.1]. W = (qref) (Cexp) (Cshp)
(Cdyn) Reference Velocity Pressure:
[2.204]
qref = reference velocity pressureCexp = exposure factorCshp = aerodynamic shape factorCdyn = dynamic response factorw = wind force per unit area normal to the surface of the
structure
[2.204.1]Velocity Pressure q = ½ V2
= air densityV = velocity of the wind
Cexp – Exposure Factor which accounts for the variability of velocitypressure at the site of the structure due to:(a) The height above ground level.(b) The roughness of the terrain and(c) In undulating terrain, the shape and slope of the
ground contours.
2

The value of the exposure factor may vary with winddirection.
wVref
wherew
= the normal load factor
2.1.1 Height above Ground
[A100] This is listed as less than 15 m above ground see table [A103.1]
2.1.2 Ground Conditions
[A100] Structures should not be situated near a hill crest or headland.
- Deflection under wind loading must always be less than1/500 of the height of structure.
2.1.3 Averaging Period
[A201] This is based on a 10-minute mean velocity pressure.
2.1.4 Return Period
[A201] This is given as once in 50 years.Definition of qref (reference velocity pressure)
2.1.5 Quality of data
The quality of the data is considered very reliable based on anextensive study by A.F. Davenport et al.
2.2 Topography
Exposure Factor Cexp
This factor accounts for the variability of velocity pressure at the site of thestructure due to the following:
(a) height above ground level
(b) roughness of the terrain and
(c) in undulating terrain, the shape and slope of the groundcontours.
Recommended values of the exposure factor are given in [Appendix 3].Table [A301.1].
3

oCexp
(z) A l n (z/z )2
where A is for different roughness length zo and terrain is given in Table [A301.1].
Cexp(z) = B(z/10)2where and B depend on ground roughness given in Table [A301.1].
2.2.1 Escarpments
This issue is discussed under sector dealing with Speed up factor. See[A303], [Table A303.1]
2.2.2 Ridges
[see Table A303.1]
2.2.3 Axisymmetric Hills
[see Table A303.1]
2.2.4 Valleys
Not specifically discussed.
2.3 Height Above Ground
This is contained in [2.2] above.
2.4 Terrain Roughness
(A301) This is aerodynamically described in terms of a roughness lengthzo which characterises the size and distribution of theobstacles around and over which the wind must blow.
[A400 General] Three Categories of aerodynamic shape factors arediscussed.
(i) Aerodynamic shape factor pressure coefficient, acting normal to thesurface.
(ii) Aerodynamic factor (force coefficient) acting in the direction of theresulting force.
(iii) Aerodynamic shape factor defining higher order resultant action ofthe pressure such as movement and torques.
4

3. WIND DESIGN ACTIONS
The wind actions which shall be considered in the design of structuresmay produce any of the following effects[2.202]:
(a) Excessive force or instability.(b) Excessive deflection.(c) Repeated dynamic forces causing fatigue.(d) Aeroelastic instability.
3.1 Importance Factors
(i) The wind force per unit area is assumed to act statically in adirection normal to the surface of the structure or element exceptwhere others were specified e.g. with tangential frictional forces.
[2203.2](ii) Both internal and external forces shall be considered [2.203.2] and
[table A104.1].
(iii) Resonance may amplify the responses to the forces on certainwind sensitive structures. Such structures are characterised bytheir lightness, flexibility and low level of structural damping (seeapp. 5), [2.207.3].
Importance Factors are related to:
Exposure Factor, Cexp
Aerodynamic Shape Factor, Cshp and
Dynamic Response Factor, Cdyn
These are discussed in great detail in Appendices 2, 3, 4 and 5.
3.2 Scale Effects
3.3 Pressure
Velocity Pressure q = ½ V2
= density of air
V = velocity of the wind
5
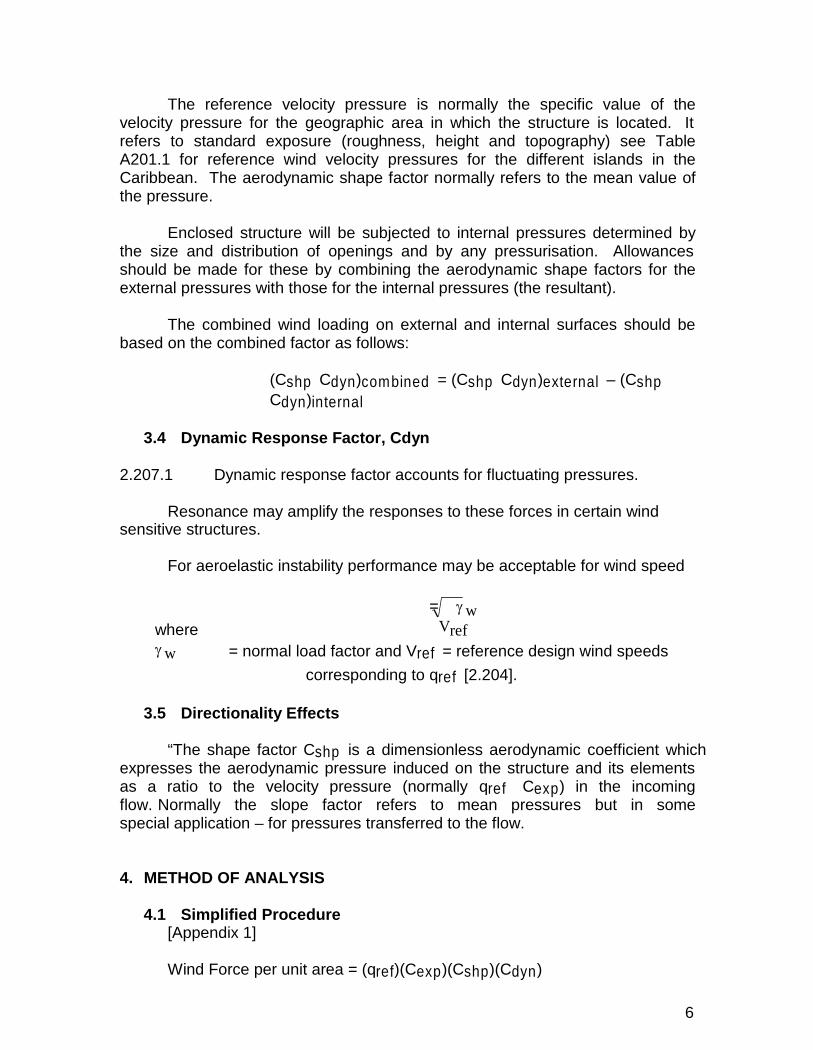
The reference velocity pressure is normally the specific value of thevelocity pressure for the geographic area in which the structure is located. Itrefers to standard exposure (roughness, height and topography) see TableA201.1 for reference wind velocity pressures for the different islands in theCaribbean. The aerodynamic shape factor normally refers to the mean value ofthe pressure.
Enclosed structure will be subjected to internal pressures determined bythe size and distribution of openings and by any pressurisation. Allowancesshould be made for these by combining the aerodynamic shape factors for theexternal pressures with those for the internal pressures (the resultant).
The combined wind loading on external and internal surfaces should bebased on the combined factor as follows:
(Cshp Cdyn)combined = (Cshp Cdyn)external – (CshpCdyn)internal
3.4 Dynamic Response Factor, Cdyn
2.207.1 Dynamic response factor accounts for fluctuating pressures.
Resonance may amplify the responses to these forces in certain windsensitive structures.
For aeroelastic instability performance may be acceptable for wind speed
wherew
= wVref
= normal load factor and Vref = reference design wind speedscorresponding to qref [2.204].
3.5 Directionality Effects
“The shape factor Cshp is a dimensionless aerodynamic coefficient whichexpresses the aerodynamic pressure induced on the structure and its elementsas a ratio to the velocity pressure (normally qref Cexp) in the incomingflow. Normally the slope factor refers to mean pressures but in somespecial application – for pressures transferred to the flow.
4. METHOD OF ANALYSIS
4.1 Simplified Procedure[Appendix 1]
Wind Force per unit area = (qref)(Cexp)(Cshp)(Cdyn)
6

[A100. Criteria]
This method can be used for the design of the main structural system if
(a) the structure is less than 15 m in height above ground(b) the structure is not usually exposed for any wind direction,
that is, it is not situated near a hill crest or head land(c) the structure is relatively rigid. Deflection under wind loading
less than 1/500.H where H = height of structure.
4.1.1 Scope
The simplified method (procedure) is intended for the design of cladding ofmost normal structures.
4.1.2 Limitation
See (a), (b), (c) above, for conditions of applicability.
4.1.3 Design Procedures
W = (qref)(Cexp) [(Cshp) (Cdyn)]
(q = ½ V2) reference [Table 103.1] [Table 104.1]velocitypressure
4.2 Analytical Procedure (Detailed Method) [209.3]
4.2.1 Scope
[Appendices 3, 4, 5]
4.2.2 Limitation
This method is principally of assistance in assessing the dynamicresponse of the structure, the influence of unusual exposure and thecharacteristics of more complex aerodynamic shapes [2.209.3].
Structures sensitive to wind include those that are particularly flexible,slender, lightweight or tall.
7

2
4.2.3 Design Procedure
This is discussed in some detail and there is variation in reference velocitypressure with [A300] height, terrain, roughness and topography.
z Cexp (z) =A
l n etc.
[Table A301.1]
zo
4.3 Experimental Procedure
Cdyn.
Wind tunnel testing is used principally in order to develop dynamic factors,
This is recommended when assessing the influence of unusual exposureand the characteristics of more complex aerodynamic shapes as well asstructures sensitive to wind including those that are particularly flexible, slender,lightweight or tall and structures of unusual geometry, which give rise tounexpectedly large responses to wind. It may be necessary to conductsupplementary studies by experts in the field. These tests may include windtunnel tests. Testing procedures are given in [Appendix 4].
5. INDUCED EFFECTS
5.1 Impact of Flying Object
Not considered. Specific treatment is needed.
5.2 Wind Driven Rain
Not considered. Specific treatment is needed.
6. SAFETY VERIFICATION
Alternative methods of analysis to those recommended in this standardmay be permitted provided it can be demonstrated that the level of safetyachieved is generally equivalent to that achieved in this standard. Safetyconsiderations are included in Appendix 6.
6.1 Structure
No specific guidance is provided.
8
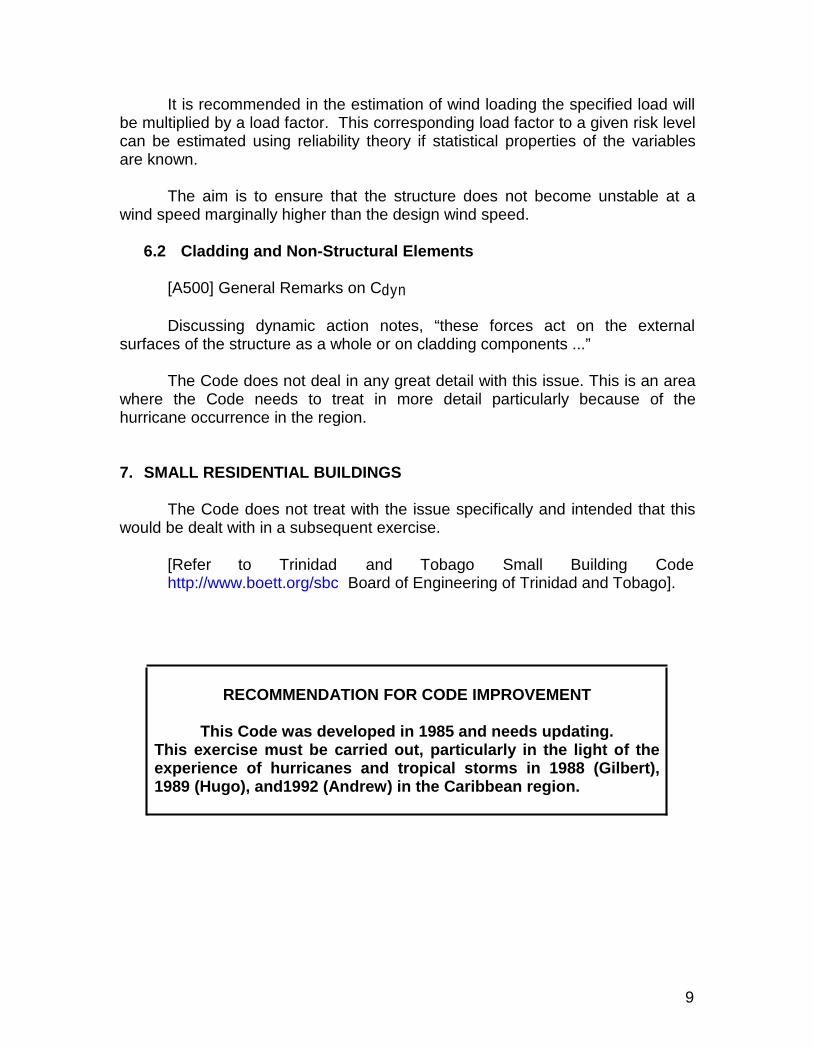
It is recommended in the estimation of wind loading the specified load willbe multiplied by a load factor. This corresponding load factor to a given risk levelcan be estimated using reliability theory if statistical properties of the variablesare known.
The aim is to ensure that the structure does not become unstable at awind speed marginally higher than the design wind speed.
6.2 Cladding and Non-Structural Elements
[A500] General Remarks on Cdyn
Discussing dynamic action notes, “these forces act on the externalsurfaces of the structure as a whole or on cladding components ...”
The Code does not deal in any great detail with this issue. This is an areawhere the Code needs to treat in more detail particularly because of thehurricane occurrence in the region.
7. SMALL RESIDENTIAL BUILDINGS
The Code does not treat with the issue specifically and intended that thiswould be dealt with in a subsequent exercise.
[Refer to Trinidad and Tobago Small Building Codehttp://www.boett.org/sbc Board of Engineering of Trinidad and Tobago].
RECOMMENDATION FOR CODE IMPROVEMENT
This Code was developed in 1985 and needs updating.This exercise must be carried out, particularly in the light of theexperience of hurricanes and tropical storms in 1988 (Gilbert),1989 (Hugo), and1992 (Andrew) in the Caribbean region.
9
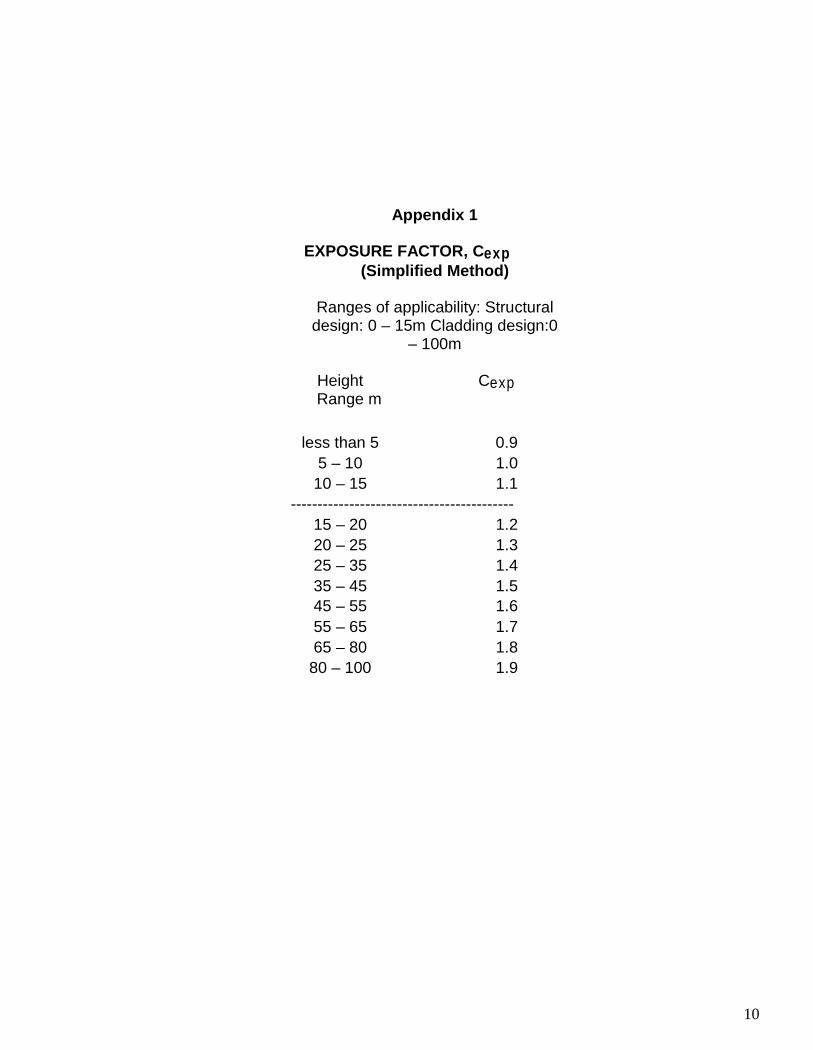
Appendix 1
EXPOSURE FACTOR, Cexp(Simplified Method)
Ranges of applicability: Structuraldesign: 0 – 15m Cladding design:0
– 100m
HeightRange m
Cexp
less than 5 0.95 – 10 1.0
10 – 15 1.1------------------------------------------
15 – 20 1.220 – 25 1.325 – 35 1.435 – 45 1.545 – 55 1.655 – 65 1.765 – 80 1.8
80 – 100 1.9
10
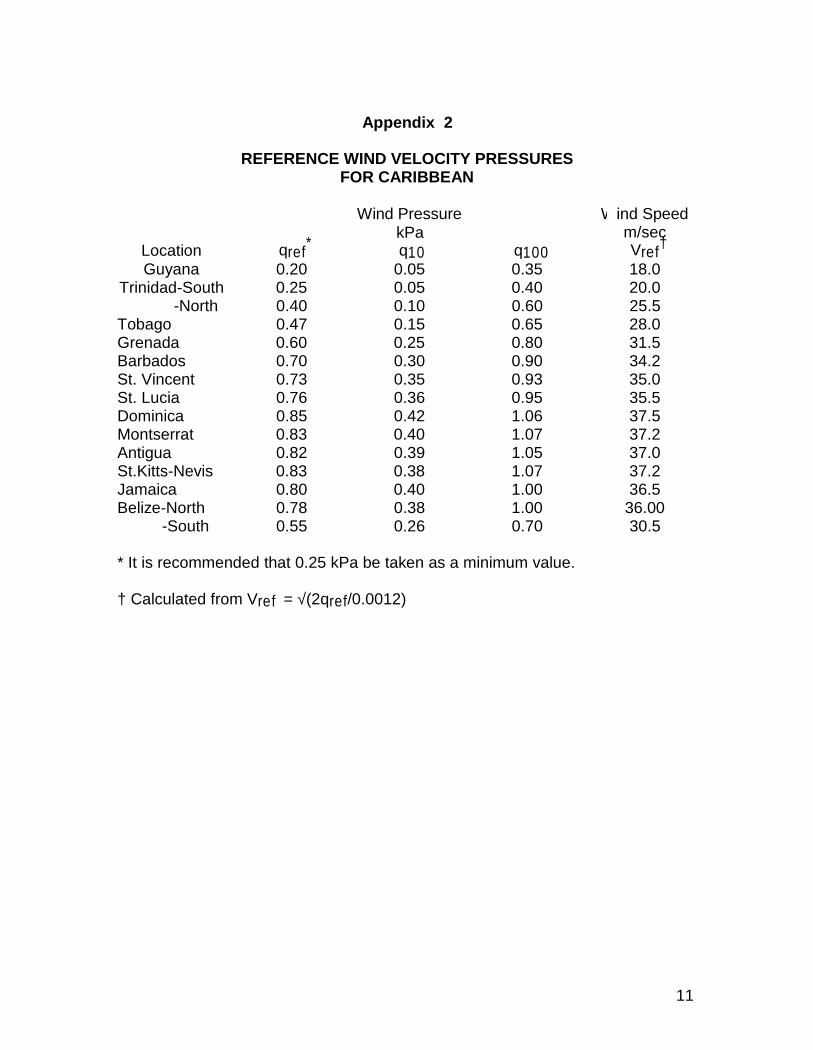
Appendix 2
REFERENCE WIND VELOCITY PRESSURESFOR CARIBBEAN
Wind Pressure WkPa
ind Speedm/sec
Location qref* q10 q100 Vref†Guyana 0.20 0.05 0.35 18.0
Trinidad-South 0.25 0.05 0.40 20.0-North 0.40 0.10 0.60 25.5
Tobago 0.47 0.15 0.65 28.0Grenada 0.60 0.25 0.80 31.5Barbados 0.70 0.30 0.90 34.2St. Vincent 0.73 0.35 0.93 35.0St. Lucia 0.76 0.36 0.95 35.5Dominica 0.85 0.42 1.06 37.5Montserrat 0.83 0.40 1.07 37.2Antigua 0.82 0.39 1.05 37.0St.Kitts-Nevis 0.83 0.38 1.07 37.2Jamaica 0.80 0.40 1.00 36.5Belize-North 0.78 0.38 1.00 36.00
-South 0.55 0.26 0.70 30.5
* It is recommended that 0.25 kPa be taken as a minimum value.
† Calculated from Vref = √(2qref/0.0012)
11

Appendix 3
Relationship Between Reference Velocity Pressure qrefAnd peak Windspeeds over Short Time Intervals In open Terrain
(Intermediate values may be interpolated)
Vpeak(metres/sec) – 10 metresqref
kPaAveraging Time
10 min. 10min. 1 hr. 1min (or“Fastest mile)
3sec
0.30 22.4 21 27 330.40 25.8 25 31 390.50 28.9 27 35 430.60 31.6 30 38 470.70 34.2 32 41 510.80 36.5 35 44 550.90 38.7 37 47 581.00 40.8 39 50 611.10 42.8 41 52 641.20 44.7 43 54 671.30 46.5 44 56 701.40 48.3 46 58 731.50 50.0 48 61 75
*Assuming air density ρair = 1.20kg/m3
Appendix 4REPRESENTATIVE TERRAINS AND THEIR VELOCITY
PROFILE PARAMETERS(profiles matched at 30m)
Logarithmic Power LawTerrain DescriptionRoughnessLength m
ScaleFactor
Index ScaleFactor
zo
A(zo) α B(zo)1. Rough open sea 0.003 0.021 0.11 1.4
2. Open sea 0.03 0.030 0.14 1.03. Suburban,woodland
0.3 0.041 0.22 0.5
4. City centre 3.0 0.058 0.31 0.16
* Recommended values for normal usage
12

Appendix 5
PARAMETERS FOR MAXIMUM SPEED-UPOVER LOW HILLS
kHill Shape †∆Smax a x < 0 x > 02-dimensionalridges (or valleyswith H – minus)
2 H/L 3 1.5 1.5
2-dimensionalescarpment
0.8 H/L 2.5 1.5 4
3-dimensionalaxisymetrical hills
1.6H/L 4 1.5 1.5
Note: † for H/L > 0.5, assume H/L =0.5 in formulae
13
ANNEX VII
SOILS INVESTIGATION REPORT
2
SOILS INVESTIGATION REPORT
FOR
HUGH PARKEY’S BELIZE ADVENTURE ISLAND
SPANISH LOOKOUT CAYE
BELIZE DISTRICT
BELIZE, C. A.
Tunich-Nah Consultants & EngineeringBelize, C.A.
TEL: 501-225-2036email: [email protected]
NOVEMBER, 2007
HUGH PARKEY’S BELIZE ADVENTURE ISLANDSPANISH LOOKOUT CAYE

3
TABLE OF CONTENTS
1 INTRODUCTION 4
2 GROUND CONDITIONS 7
3 SOIL INVESTIGATION 20
4 CONCLUSIONS AND RECOMMENDATIONS 27
5 BIBLIOGRAPHY 29
APPENDICESAppendix I: Probing Records
Appendix II: Plates1. Probing Operation Borehole No. 1.2. Probing Operation Borehole No. 2.3. Probing Operation Borehole No. 8.4. Probing Operation Borehole No. 11.
Appendix III: Report Preparers
4
1 INTRODUCTION
Belize is located at the northernmost point and on the Caribbean coast of the CentralAmerican isthmus. Belize has an area of approximately 8,867 square miles and isbordered by Mexico to the north, Guatemala to the west and south, and the Caribbean Seato the east.
Belize is a tropical country with an extensive coastal area in the inland part with over1,000 cayes and 125 miles of Barrier Reef. The cayes are islands and/or mangroveislands, that are found between the mainland and the barrier reef, on the barrier reef, andon or within the barrier reef perimeters of the off shore atolls. The cayes ranges in sizefrom a few hundred feet to 25 miles long and 4 miles wide.
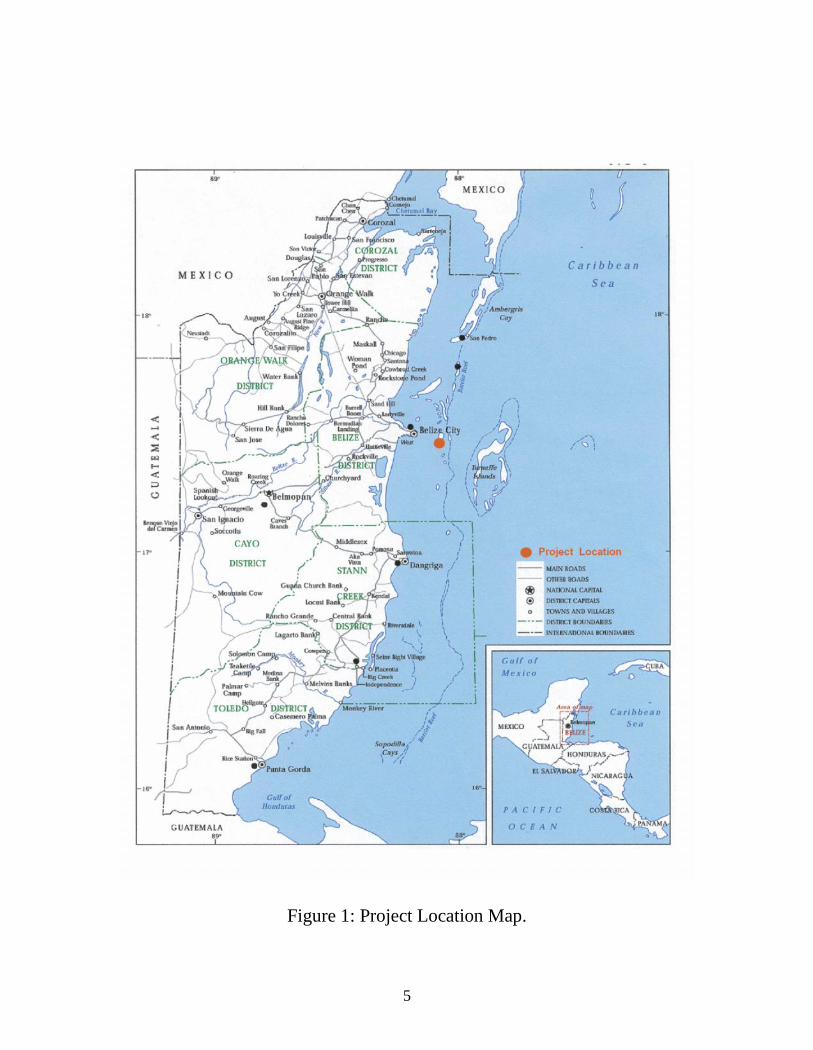
The Spanish Bay Development Project site is located on Spanish Lookout Caye a twinmangrove island, which has an approximate area of 186 acres and is about 8.6 milessoutheast of Belize City. Spanish Lookout Caye is considered as one of the islands of theDrowned Cayes which are a labyrinth of mangrove islands inside the Belize Barrier Reef.
The project site is located on the north-western side of the Spanish Lookout Caye. SeeFigure 1.
The subsoil investigation was carried out on the site of the proposed Spanish BayDevelopment Project. This report describes the site investigation carried out at the siteand presents technical recommendations for the design of the structural facilities based onfindings, and also of associated hazards such as hurricanes and seismic activity that canbe encountered at this site.
The soils investigation for the Spanish Bay Development Project was undertaken byAlberto A. Rosado a Civil / Structural Engineer assisted by two technicians in September2007.
2 GROUND CONDITIONS
Published information on the general ground conditions around the cayes by C.G. Dixon(1956) states “… the Admiralty charts of the coastal waters show that the sea floor hassharp differences of level. Steep escarpments face the east, while from the top of theescarpments the sea floor slopes down gently towards the mainland. Coral reefs mark theedges of the escarpments, and the most prominent is the barrier reef which extends fromnorth to south parallel to the coast about 15 miles off shore.
The cays themselves are sand cays and there are indications that these are at presentbeing actively eroded.”
Dixon describes the cayes in general to have been formed of sand, however, the cayesinside the barrier reef lagoon are made up of sandy shells and those that fringe the barrier
5
Figure 1: Project Location Map.
6
reef are of broken corals. These sand formations overlay a compact limestone rock; theserocks are usually hard.
Published information by Stoddart et al (1982) describes the Drowned cays of whichSpanish Lookout Caye is included as;
“CAYS OF THE BARRIER REEF LAGOON.
A. The Northern Lagoon
The barrier reef lagoon contains islands of many different types and widely differingsizes. The great majority are mangrove islands, and these have been very little studied...
A. The Northern Lagoon
North of latitude 17o30'N the coastal shelf has an average width of 24 km, and betweenBelize and the Bulkhead Reef (which extends as a shallow bar from the mainland toAmbergris Cay) is 2.5-4.5 m deep. The Bulkhead itself carries only 0.5-1.4 m, andencloses the 90 km long Bahia de Chetumal, a shallow embayment with depths of 2-6 m.
The cays of the northern lagoon consist mainly of a series of linear mangrove-sand cays(mangrove islands with a sand ridge on their windward sides) and mangrove cays located3.5-4 km landward of the barrier reef and separated from it by a depression termed the"reef lagoon" and less than 4.5 m deep. In the southern part of the area, large mangrovecays (Hicks Cays, Hen and Chickens, Peter's Bluff, North Drowned Cay, the DrownedCays) extend across the shelf towards the mainland.
There are numerous large mangrove islands on the coastal shelf between 17o 30'N and17o45'N. They include Long Cay (the northernmost of that name), Hicks Cays, Montegoand Frenchman's Cays, Hen and Chicken Cays, Rider's Cays, and the northernmostDrowned Cays. Apart from a narrow seaward sand ridge with coconut woodland on LongCay and on the Drowned Cays …”
“ …those places composed of sand and mud, where the mangrove springs out of thewater, and which are in this neighborhood called by the appropriate name of 'drownedcays’….”
“…6. Mangrove cays. On the Belize shelf these are dominated by Rhizophora mangle;and are described as " little more than mud mounds colonized by vegetation". They arefound only within the lagoon and not on the barrier reef itself… ”
The Geological Map of Belize revised edition 2005 establishes the landform of theSpanish Lookout Caye as being Quaternary Period sand bars, modern reef, calcareoussand and mud from the Holocene (last 10,000 years) to present. See Figure 2. Deposits ofthis age are a common occurrence close to ground level, often forming soils that cover,uncomfortably, harder and older rock at depth.

7
Figure 2. Geological Map of Belize
The Quaternary (Pleistocene) rocks and modern(Holocene) sediments along the coast,and under water, are the youngest cycle of deposition in Belize, and are representedlargely by shallow-water, limy sediments. A Holocene Sediment Map (Figure 3), by theRice University, Texas, presents seafloor sediment data that were collected at severallocations and analyzed for their texture and composition. The sediment facies(characteristics and features of a sedimentary formation) are differentiated into fourteentypes by composition (terrigenous, carbonate, or transitional) and by texture (sands,sandy muds, and muds).
The sediment map characterizes the calcareous sediments on Spanish Lookout Caye as aHalimeda sand.
Ambergris Caye and adjacent Cayes did not exist then as we know them today. Theirfoundation of Cretaceous and Tertiary limestone formed from the accumulation of shellsand reef debris like those being deposited today.

8
Figure 3. Holocene Sediment Map

9
Figure 4. Location of Belize with respect to the North American and CaribbeanTectonic Plates
Belize is located on the Yucatan continental block near the junction of the NorthAmerican and Caribbean tectonic plates, slabs of the earth's crust that have moved pasteach other over the last 80 million years along an east-west fracture zone, what is now theCayman Trench (see Figure 4). Eastward drift of the Caribbean plate resulted in thedominantly structurally controlled, major features of Belize: the Maya Mountains, theoffshore atolls surrounded by deep water, and the location of the coral barrier reef.
Along its entire length the modern barrier reef sits atop a prominent fault that separatesthe shallow platform (coastal zone) to the west from the deeper Caribbean to the east. SeeFigure 5.
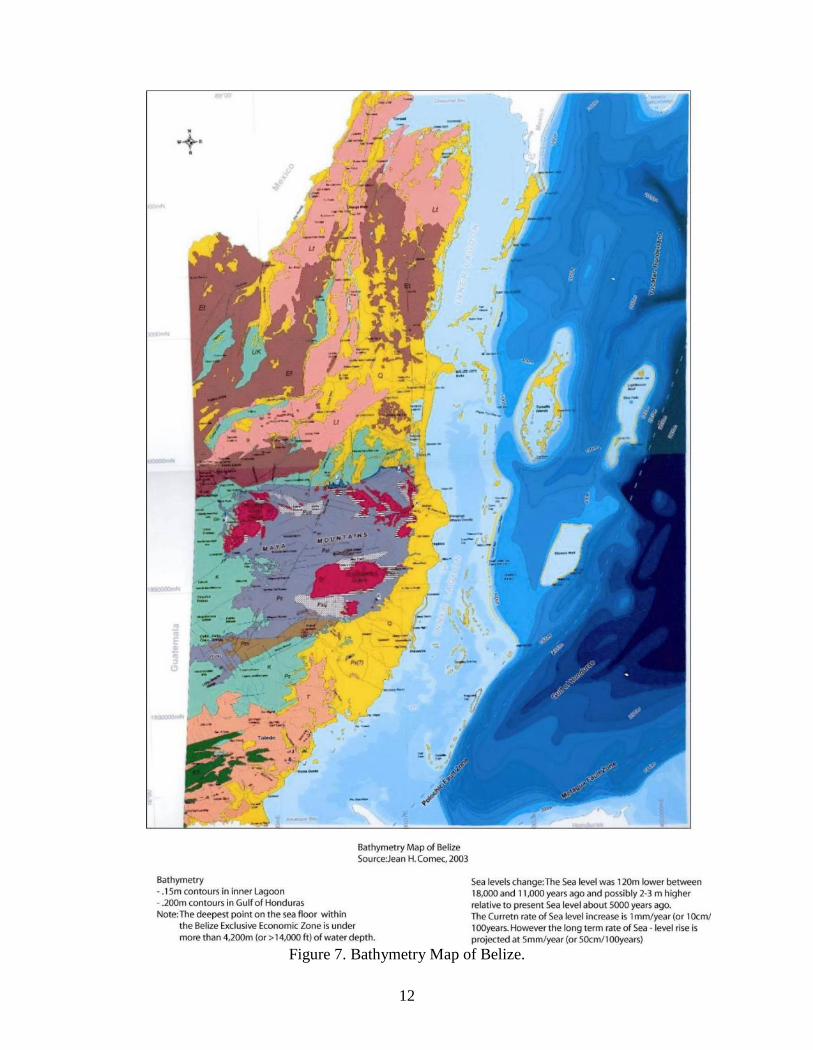
In Belize, earthquake hazard increases steadily from the north of the country to the southas can be observed in Maximum Seismic Intensity Map in Belize, see Figure 6.Earthquakes that affect the country of Belize occur in the Gulf of Honduras which is theplate boundary zone between North America and the Caribbean tectonic plates andspecifically from the two active Polochic and Motagua-Swan Island Fault Zones that arelocated due south of the country of Belize.
South of Chetumal Bay, the continental shelf off Belize is about 15 miles wide, extendingsouth to the latitude of Placentia; then it widens to around 20 to 25 miles from theresouthward to Amatique Bay. On the southern shelf of Belize, the barrier reef is a nearlycontinuous line of reefs near the shelf edge. Shelf waters behind the barrier reef becomeincreasingly deeper from the latitude of Belize City southward, i.e., from about 15 feetoff Belize City to over 125 feet off Placentia. See Figure 7. Bathymetry Map of Belize.

10
Figure 5. Geological Fault Location Map

11
Belize City
MexicoG
uate
mal
a
Project Location
< 55
< 6< 7
Magnitude MW
Car
ibbe
an S
ea
Figure 6: Maximum Seismic Intensity Map in Belize
12
Figure 7. Bathymetry Map of Belize.

13
The coastal zone of Belize is a complex system that includes the shoreline, in addition tothe coastal plains, the lagoons and estuaries, the cayes and atolls, plus the subtidal arewithin the 12 miles territorial limit and a 200 miles exclusive economic zone.
The continental shelf of Belize can be separated into four regions seeFigure 8.
· Coastline· Inner lagoon· Barrier platform· Coral atolls
Figure 8. The Continental Shelf of Belize
Coastline
In general the coastline consists of lagoons, sand-ridge barriers, river deltas and estuaries.To the north of Belize City a lagoon and barrier system is predominant. In the southernpart, beach-ridge systems (located in the Sapodilla Lagoon, Southern Lagoon andDangriga areas), river deltas (Sittee Point) and estuaries, two lagoons (Northern Lagoonand Southern Lagoon) and Barrier island (Placentia Peninsula) are the principal featuresthat characterize the coastline. Mangroves are also abundant.
Inner lagoon
The inner lagoon is the area immediately bordering the mainland, with Belize Citydemarcating the northern and southern regions. The inner lagoon region situated betweenthe platform flat (barrier reef) and mainland is gently sloping and shallow (seldom deeperthan 25 feet) to the north of Belize City and which falls as much as 210 feet deep, to theeast of Punta Gorda. In the north, the inner lagoon consists mainly of sediments fromriver runoff in the nearshore and mud in the offshore, with the presence of a shoalbetween the mainland and Ambergris Caye. In the south, the inner lagoon consists also ofterrigenous sediments in the nearshore and marls in the offshore.
Barrier platform

14
The third region is the barrier platform which is seaward of the inner lagoon. It is theedge of the continental shelf, separated from the mainland by the lagoon; and the threeoffshore atolls, where Belize barrier reef grows. This barrier reef is the largest in theCaribbean and in the western hemisphere. It is a continuous reef that extendsapproximately 125 miles from northern Belize to the Sapodilla Cayes in the south. Thezonation of the barrier reef is evident as the distribution of several coral types occurs inthe specific zones.
In this region there are three primary reef zones:o The lagoon (beach, mangrove, seagrass beds, and patch reefs)o The reef cresto The fore reef.
The lagoon lies between the beach (or coastline) and the reef crest. This shallow area ishome to a diverse group of plant and animal life. Mangroves, found in the transitionalarea between land and water, have the function of protecting the coastline by trappingsediments. The lagoon also includes seagrass beds. In some cases, lagoons contain flat,circular islands of coral surrounded by seagrass and sand, known as patch reefs. As thebottom of the lagoon rises rapidly towards the waters surface the next zone: the reef crestbegins. This zone is characterized by a line of waves that break along its edge, with lowtides further exposing sections of the reef. On the seaward edge of the reef is the finalzone: the fore reef, divided into an upper (gentle slopes extending from 10 ft to 70 ft indepth) and lower (increased depth) section.
Coral atolls
The last region consists of the three coral atolls, which are seaward of the continentalshelf. The presence of atolls is unusual. Most atolls are found in the Pacific, where theyform on the top of submerged volcanoes. Very few occur in the Caribbean, and theydiffer in structure. The three in Belize for example are lying on non-volcanic submarineridges. The three atolls are: Turneffe Atoll, Lighthouse Reef and Glovers Reef. Turneffeis the largest of the three offshore atolls and the only one with an extensive cover ofmangroves.
A particular hazard that is of concern to the Spanish Lookout Caye are hurricanes and itsrelated effects. Since hurricanes result in major coastal changes over short time periodsand they are referred to as catastrophic events because of the extensive damage that iscaused and the unpredictable nature of the event. Hurricanes are so destructive becausethe storm surge, or high tide ahead of the storm, can be very high. They can batter andflood coastal areas. High winds may cause damage to buildings, agricultural crops andforests and can also destroy coral reefs, and shift beaches and sand bars kilometers. Themost vulnerable lands are small narrow cays with little vegetation.
Since 1955 (Hurricane Janet), Belize has been hit several times by hurricanes that havecaused damages and significant impacts. The hurricane Hattie for example, destroyedBelize City in 1961 and was in part responsible for splitting Caulker Caye, into two parts.
15
Hurricanes have great impact on coastal areas and the cayes are more susceptible to thisdamage than the mainland. Hurricanes reach the shores of countries, such as Belize, withthe help of easterly trade winds.
3 SOIL INVESTIGATION
The soils investigation for the Spanish Bay Expansion Project was undertaken by AlbertoA. Rosado a Civil / Structural Engineer assisted by two technicians in September, 2007.
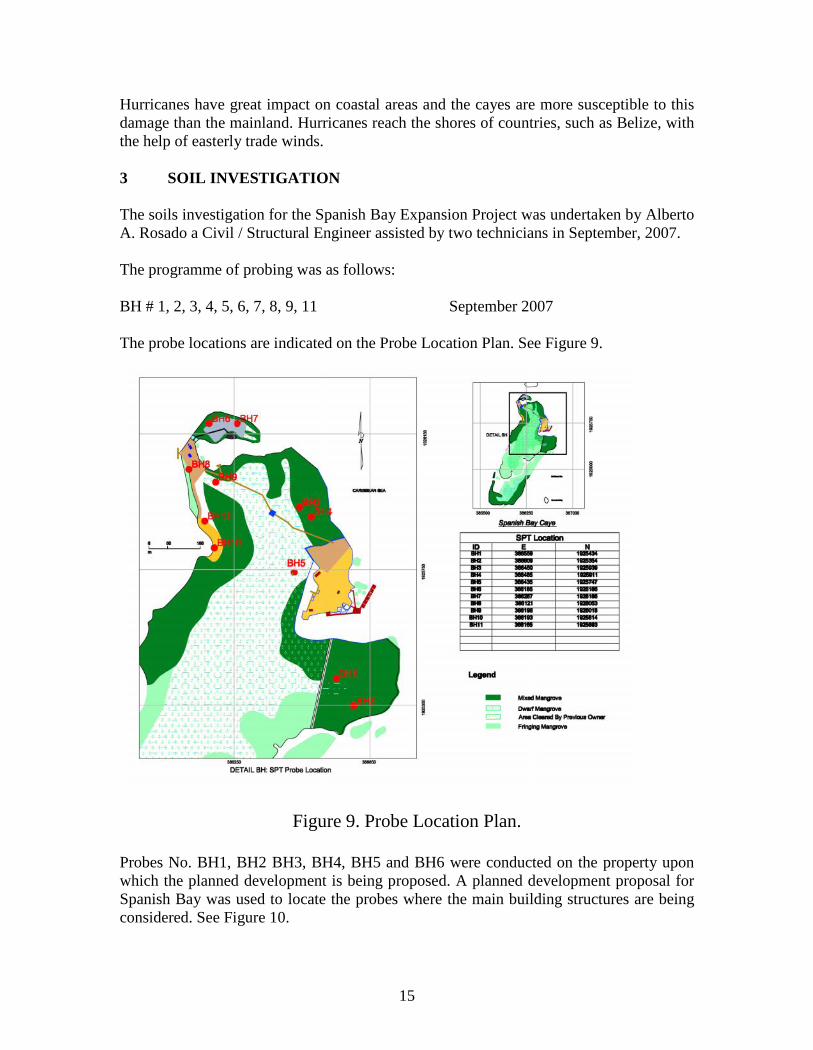
The programme of probing was as follows:
BH # 1, 2, 3, 4, 5, 6, 7, 8, 9, 11 September 2007
The probe locations are indicated on the Probe Location Plan. See Figure 9.
Figure 9. Probe Location Plan.
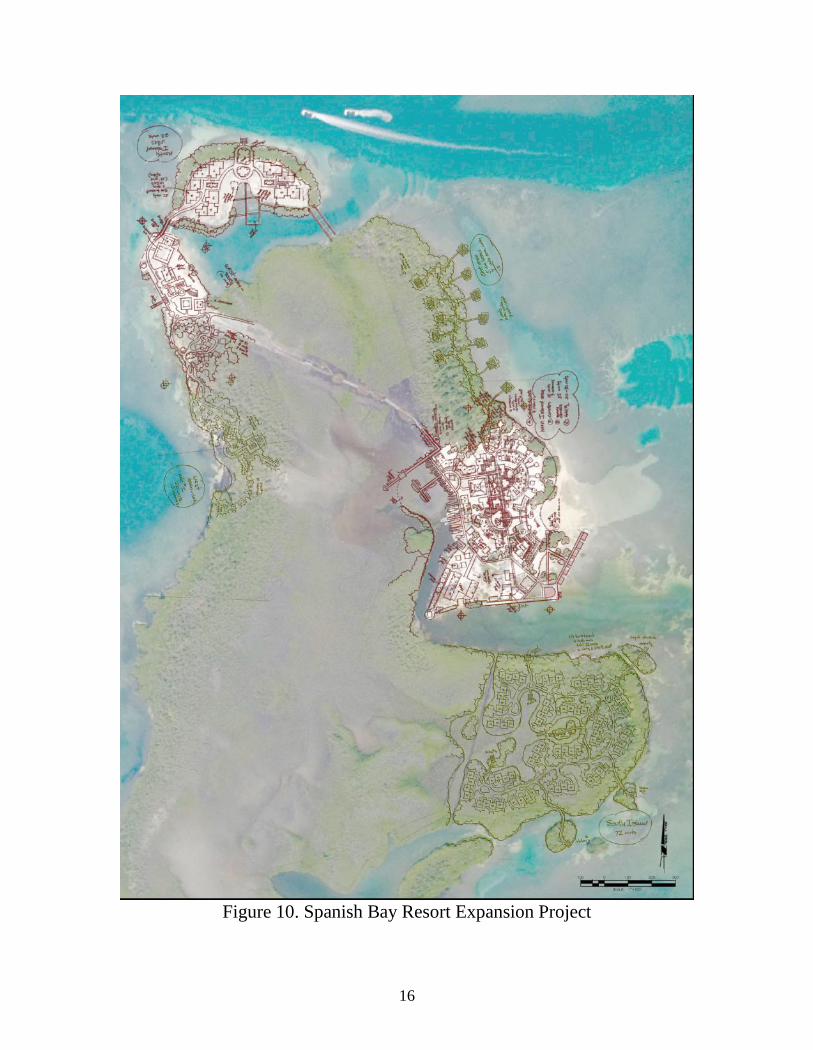
Probes No. BH1, BH2 BH3, BH4, BH5 and BH6 were conducted on the property uponwhich the planned development is being proposed. A planned development proposal forSpanish Bay was used to locate the probes where the main building structures are beingconsidered. See Figure 10.
16
Figure 10. Spanish Bay Resort Expansion Project
17
The equipment used consisted of a Mackintosh Probe manufactured by EngineeringLaboratory Equipment, England. This probe is a method of in situ testing for subsurfacesoil characteristics in which an instrumental device with a conical tip is pushed into theground with rods at a constant rate.
The Mackintosh probe consists basically of a 10 pound hammer sliding on a half inchdiameter rod dropping through a distance of 12 inches and striking an anvil at the lowerend of that rod on the end of which is a hardened steel cone one inch in diameter.The probe is driven by blows of the drop hammer and the number of blows per foot ofpenetration is recorded.The penetration resistance and soil properties are then correlated to the standardpenetration test for cohesive and non-cohesive soils.
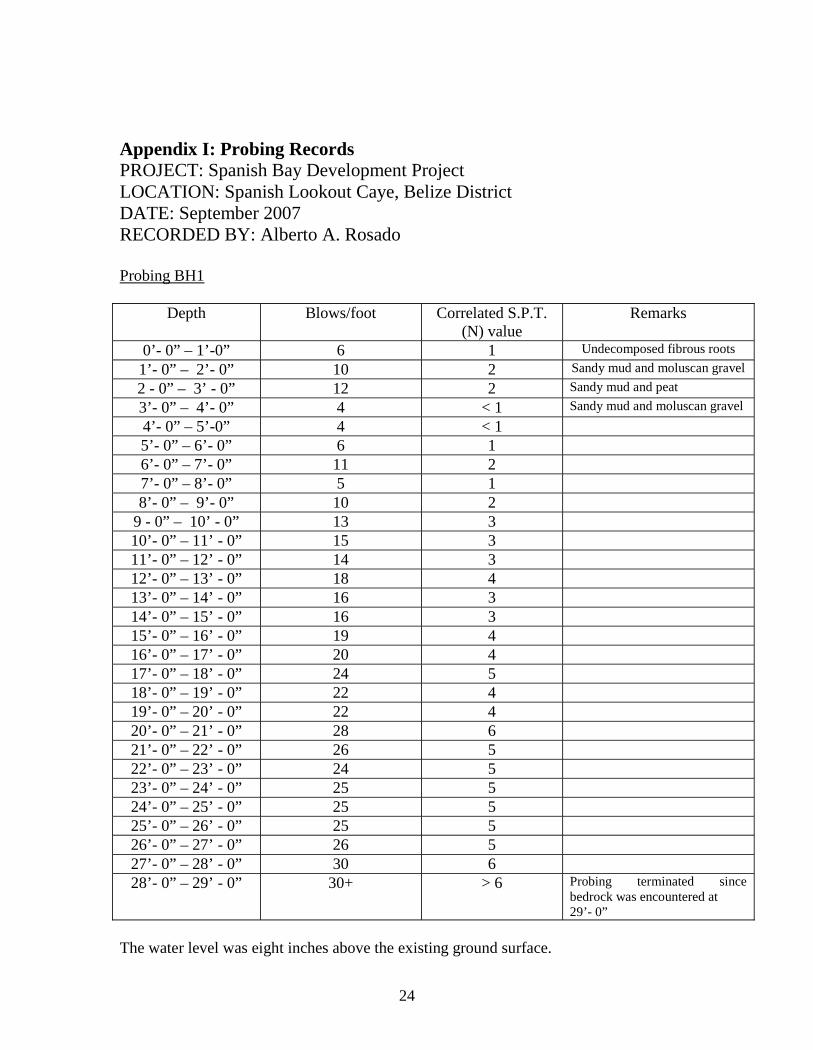
Probe BH1Exploratory investigation of BH1 carried out with the Mackintosh probe revealed organicmaterial (Undecomposed reddish brown fibrous roots) underlain with sandy mud andpeat. The water table was eight inches above the natural ground surface. The organicmaterial was of such consistency that a person could walk on the surface without sinking.The blow counts obtained with the Mackintosh probe per foot of penetration were lessthan or equal to 20 for the first 17 feet below the natural ground surface. The correlatedStandard Penetration Test (SPT) N (blows per foot) were all less than or equal to four.The relative density of this sandy mud as it relates to the SPT N value is very loose(Terzaghi 1967). The probing continued up to a depth of 29 feet with blow counts perfoot between 20 and 30, the SPT(N) values were less than or equal to 6 whichcharacterizes the sandy soil as loose. At a depth of 29 feet a firm bearing strata and/orbedrock level was encountered.
Probe BH2BH2 revealed organic material (Undecomposed reddish brown fibrous roots) underlainwith sand mud and moluscan gravel. The water table was 8 inches above the naturalground surface. The blow counts obtained with the Mackintosh probe per foot ofpenetration were less than 22 for the first 18 feet. The correlated SPT (N) values were allless than or equal to 4. The relative density of this sandy mud as it relates to the SPT (N)value is very loose. The probing continued up to a depth of 28 feet 2 inches with blowcounts between 25 and 30 per foot, the SPT(N) values were less than or equal to 7 whichcharacterizes the sandy soil as loose. A firm bearing strata and/or bedrock level wasencountered at 28 feet 2 inches.
Probe BH3BH3 revealed organic peat and underlain by sandy mud. The water table was at thenatural ground surface. The blow counts obtained with the Mackintosh probe per foot ofpenetration were less than 20 for the first 10 feet. The correlated SPT (N) values were allless than or equal to four. The relative density of this sandy mud as it relates to the SPT(N) value is very loose. The probing continued up to a depth of 30 feet with blow countsbetween 25 and 30 per foot, the SPT(N) values were less than or equal to 6 which

18
characterizes the sandy soil as loose. A firm bearing strata and/or bedrock level wasencountered at 30 feet.
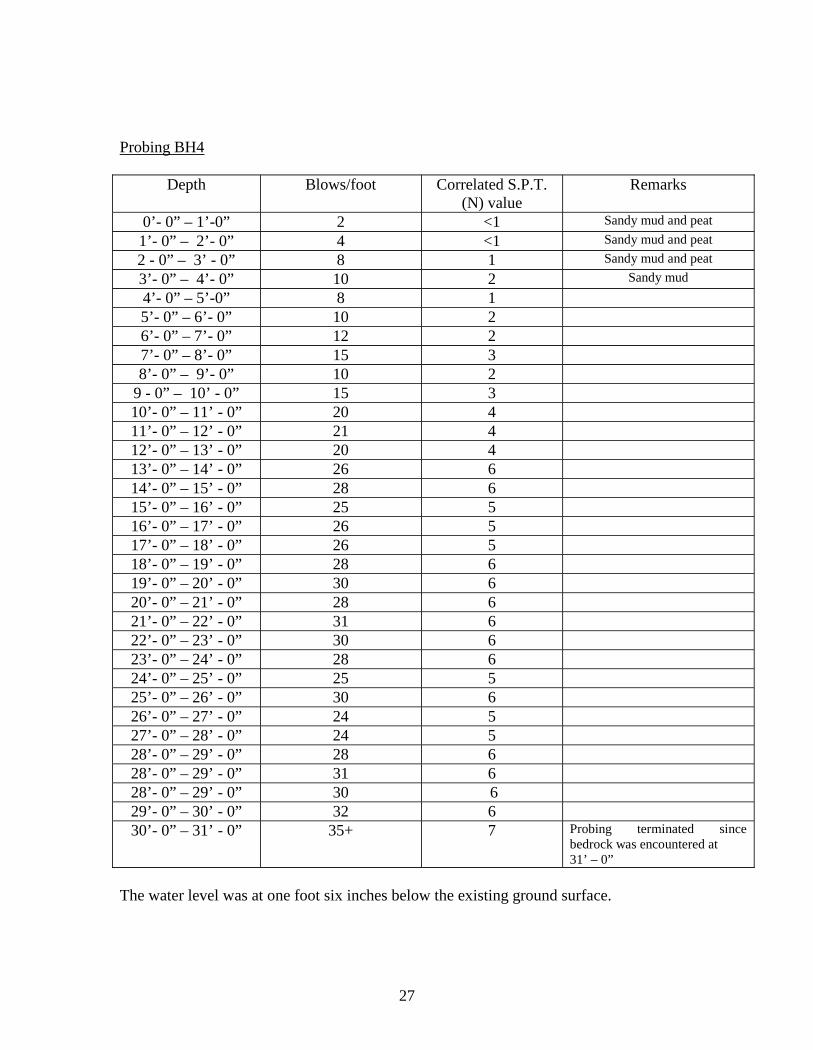
Probe BH4BH4 revealed organic peat underlain by fine sandy mud. The water table was one foot sixinches below the natural ground surface. The blow counts obtained with the Mackintoshprobe per foot of penetration were less than 20 for the first 13 feet. The correlated SPT(N) values were all less than four. The relative density of this sandy mud as it relates tothe SPT (N) value is very loose. The probing continued up to a depth of 31 feet with blowcounts between 21 and 35, the SPT (N) values were less than or equal to 7 whichcharacterizes the sandy soil as loose. A firm bearing strata and/or bedrock level wasencountered at 31 feet.
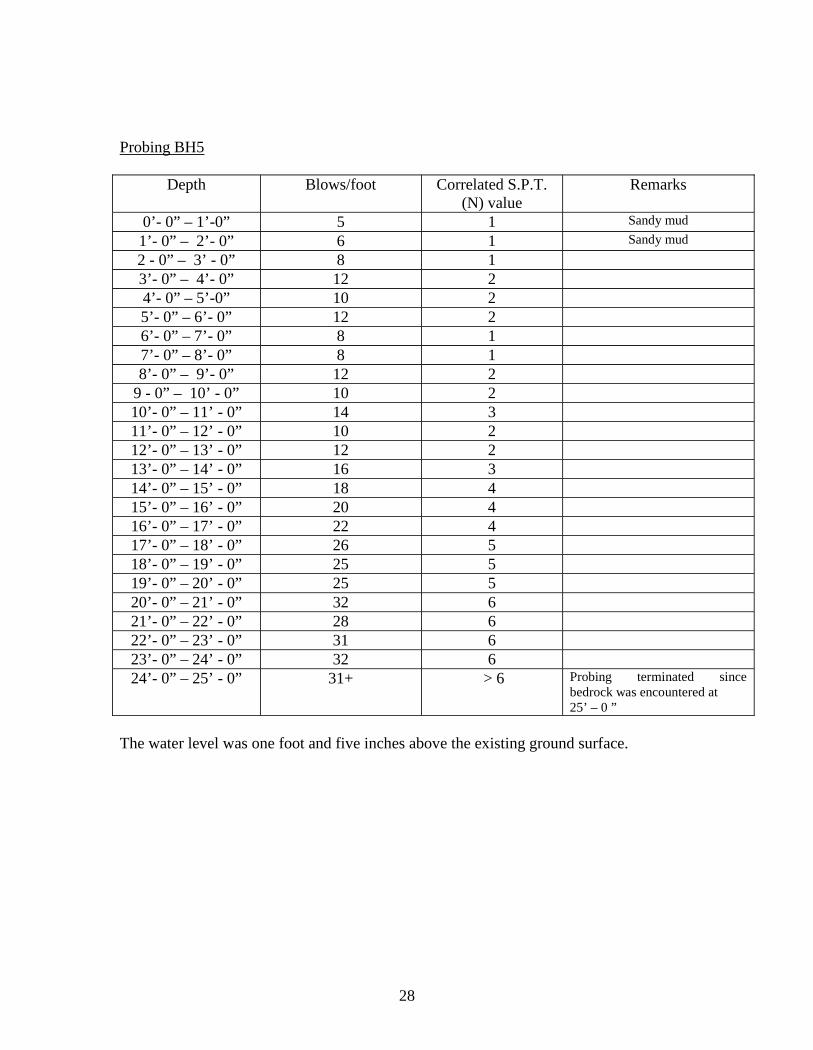
Probe BH5BH5 revealed sandy mud mixed with peat at the top. The water table was one foot fiveinches above the natural ground surface. The blow counts obtained with the Mackintoshprobe per foot of penetration were less than 20 for the first sixteen feet. The correlatedSPT (N) values were all less than four. The relative density of this sandy mud as it relatesto the SPT (N) value is very loose. The probing continued up to a depth of 25 feet withblow counts between 22 and 31, the SPT(N) values were less than or equal to 6 whichcharacterizes the sandy soil as loose. A firm bearing strata and/or bedrock level wasencountered at 25 feet.
Probe BH6BH6 revealed dredged fill consisting of moluscan gravel on the surface. The water tablewas 12 inches below the natural ground surface. The blow counts obtained with theMackintosh probe per foot of penetration were less than 20 for the first 17 feet. Thecorrelated SPT (N) values were all less than four. The relative density of this sandy mudas it relates to the SPT (N) value is very loose. The probing continued up to a depth of 24feet 10 inches with blow counts between 21 and 35 per foot, the SPT(N) values were lessthan or equal to 7 which characterizes the sandy soil as loose. A firm bearing strataand/or bedrock level was encountered at 24 feet 10inches.
Probe BH7BH7 revealed dredged fill consisting of moluscan gravel on the surface. The water tablewas 12 inches below the natural ground surface. The blow counts obtained with theMackintosh probe per foot of penetration were less than 20 for the first 16 feet. Thecorrelated SPT (N) values were all less than four. The relative density of this sandy mudas it relates to the SPT (N) value is very loose. The probing continued up to a depth of 25feet 7 inches with blow counts between 22 and 33 per foot, the SPT(N) values were lessthan or equal to 7 which characterizes the sandy soil as loose. A firm bearing strataand/or bedrock level was encountered at 25 feet 7 inches.
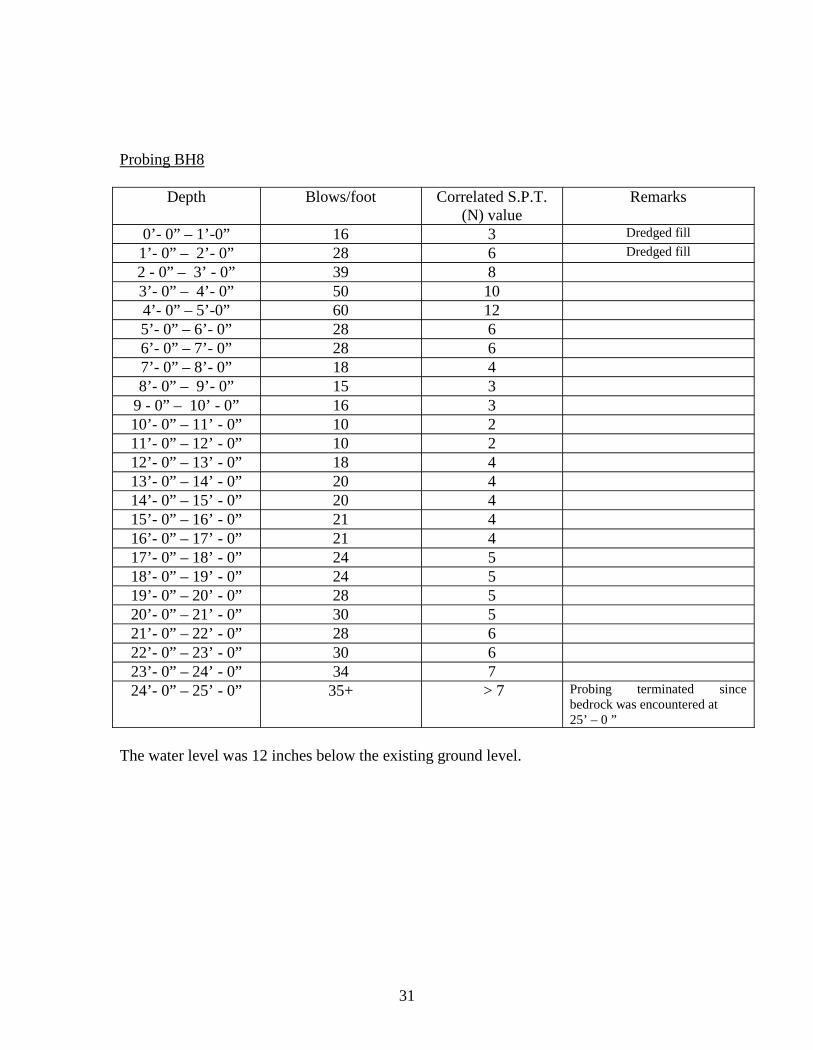
Probe 8BH8 revealed compacted dredged fill consisting of moluscan sand and gravel on thesurface. The water table was 12 inches below the natural ground surface. The blow
19
counts obtained with the Mackintosh probe per foot of penetration ranged from 16 to 60in the first 5 feet. The correlated SPT (N) value were all less than twelve. The relativedensity of this sandy soil as it relates to the SPT (N) value is medium dense. The probingcontinued up to a depth of 25 feet with blow counts ranging between 28 and 35 per foot,the SPT (N) values were less than or equal to 7 which characterizes the sandy soil asloose. A firm bearing strata and/or bedrock level was encountered at 25 feet.
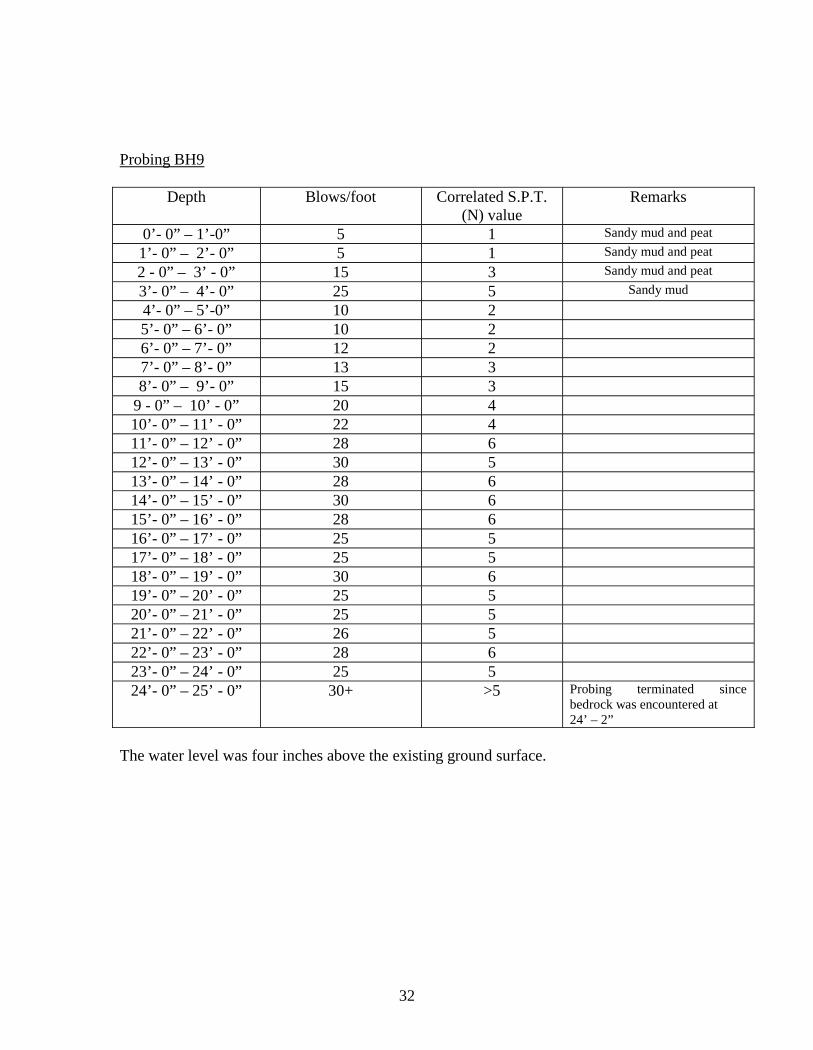
Probe BH9BH9 revealed sandy mud and peat at the surface. The water table was 4 inches above thenatural ground surface. The blow counts obtained with the Mackintosh probe per foot ofpenetration were less than 22 for the first 11 feet. The correlated SPT (N) value were allless than or equal to four. The relative density of this sandy mud as it relates to the SPT(N) value is very loose. The probing continued up to a depth of 22 feet and 2 inches withblow counts between 22 and 34 per foot, the SPT (N) values were less than or equal to 6which characterizes the sandy soil as loose. A firm bearing strata and/or bedrock levelwas encountered at 22 feet and 2 inches.
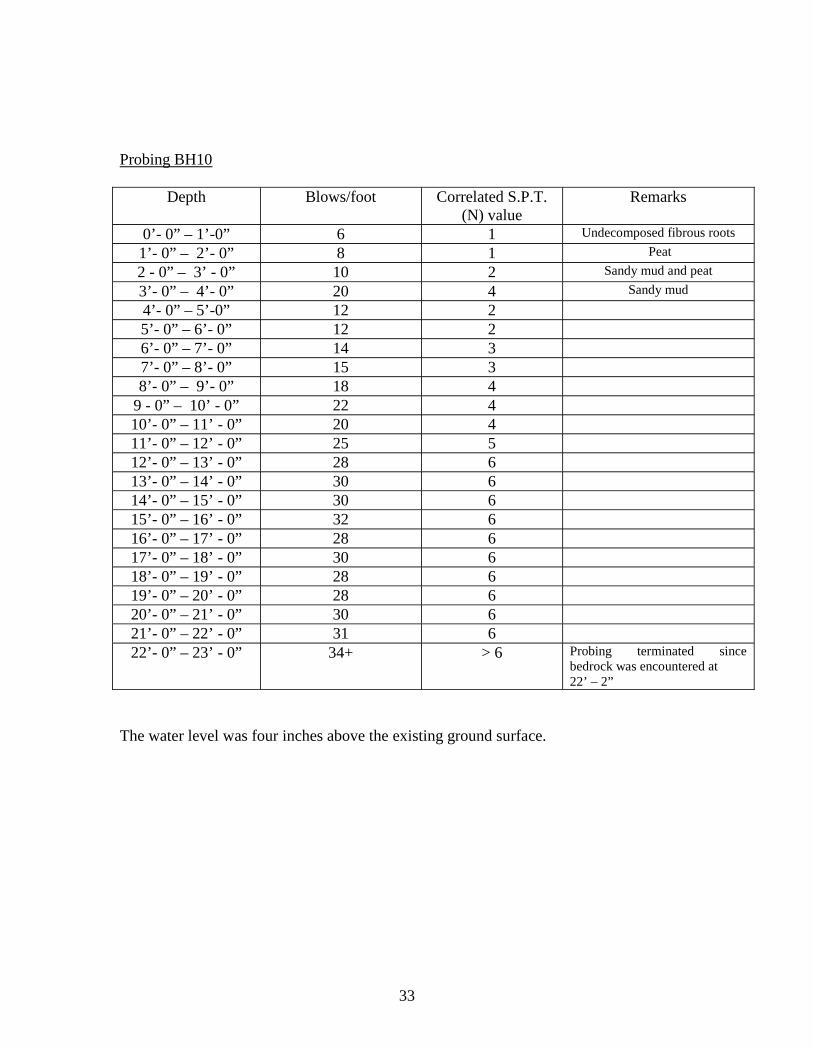
Probe BH10BH10 revealed undecomposed organic material mixed with sandy mud and peat at thesurface. The water table was 4 inches above the natural ground surface. The blow countsobtained with the Mackintosh probe per foot of penetration were less than 20 for the first11 feet. The SPT (N) value were all less than or equal to four. The relative density of thissandy mud as it relates to the SPT (N) value is very loose. The probing continued up to adepth of 22 feet and 2 inches with blow counts between 25 and 34 per foot, the SPT(N)values were less than or equal to 6 which characterizes the sandy soil as loose. A firmbearing strata and/or bedrock level was encountered at 24 feet and 2 inches.
Probe BH11BH11 revealed sandy mud and peat at the surface. The water table was 4 inches abovethe natural ground surface. The blow counts obtained with the Mackintosh probe per footof penetration were less than 20 for the first 10 feet. The correlated SPT (N) values wereall less than or equal to four. The relative density of this sandy mud as it relates to theSPT (N) value is very loose. The probing continued up to a depth of 24 feet and 2 incheswith blow counts between 21 and 35 per foot, the SPT(N) values were less than or equalto 7 which characterizes the sandy soil as loose. A firm bearing strata and/or bedrocklevel was encountered at 24 feet and 2 inches.
The probing records are presented in the Appendix I.
The project site is located on the north side of the Spanish Lookout Caye. The probeswere carried out on mangrove swamps with the exception of probes 6, 7, and 8 whichwere conducted on a section of the island that had been filled with dredged material.
The surface of the project site was characterized in most instances by thick fibrous mat.Below this mat a peat and a grayish sandy mud could be observed. We also noticed that

20
the fibrous mat provide adequate resistance to walk on without appreciable settlement.The areas filled with dredged material were quite firm.
The relative density of the sand underlying the organic material go from very loose sandto loose sand based on the correlated SPT (N) values obtained.
These values are indicative of an underlying soil of a loose density at depth and of lowbearing capacity. The probes indicate that bedrock is at an average depth of 26 feet belowthe surface level and varying from 22 feet to 31 feet.
The very loose density and low bearing capacity of the sandy mud could be harmfullycompressible resulting in undesirable settlement of buildings and other civil infrastructurebeing contemplated.
4 CONCLUSIONS AND RECOMMENDATIONS
The organic material at the surface level can have a major impact on developmentbecause of their inherent weakness and loss of strength when loaded, and their highdegree of compressibility.
The sandy mud at the project site ranges from very loose to loose at depth exhibiting alow bearing capacity. The water content is above the liquid limit such that the soilapproaches the liquid state with loading or disturbance. The very loose density and lowbearing capacity of the sandy mud can result in undesirable settlement of buildingfoundations and other civil infrastructure being contemplated at the site.
The sandy mud at the project site is composed basically of Halimeda Sand which comesfrom minute fragments of calcareous algae (Halimeda 0puntia).
The dredged fill material at the project site showed initial rigidity and strength but wassubject to brittle crushing of their constituent calcareous sand upon conducting theprobes, resulting in sudden loss of strength or bearing capacity. Light structures can beconstructed on these filled areas with little or no appreciable settlement.
A bedrock formation of limestone was formed during the Cretaceous to Pliocene. Thesurface of the bedrock was found to be irregular and varying from 22 feet to 31 feet
The minute shells of the calcareous algae are crushed when disturbed by pile drivingaction and the friction on the pile may drop close to zero, thus, the required foundationworks for heavy structures to be constructed should be supported by end bearing pilesanchored into the bedrock.
The recommended pile to use is prestressed concrete piles since these piles require high-quality concrete, which in turn gives good resistance to driving stresses. The longitudinalreinforcement in these types of piles is designed to resist stresses in lifting and handling.Also, the pile is stressed to prevent the development of hairline cracks. This, together
21
with the high-quality concrete gives a prestressed concrete pile a good durability in acorrosive marine environment.
Alternatively, cast in place piles encased in fiber reinforced polymer (FRP) pipes orpolyvinyl chloride (PVC) pipes could be used for the construction of lightly piledstructures.
The structural design of the buildings are required to consider hurricane wind forces andaccompanying storm surges since the country of Belize is situated in the North EastTrade wind belt and the hurricane zone of the North Atlantic. The country lies roughlybetween Latitudes 16 degrees and 18 degrees North and Longitude 88 degrees and 89degrees west. Hurricane and tropical storms would normally occur between the months ofJune and November.
Buildings designed for hurricane winds can also be damaged due to the undermining offoundations by erosion of sand.
A seismic analysis is recommended for the northern part of the country for which theCaribbean Uniform Building Code (CUBIC) / Structural Design Requirements /Earthquake Load is used as a guide to the seismicity of the region including Belize.CUBIC recommends a zonal coefficient (Z) of 0.50 for the northern part of the countrywhich includes the Belize District.
22
5. BIBLIOGRAPHY
Dixon, C.G., (1956). Geology of Southern British Honduras with notes onadjacent areas. Printed by authority of his Excellency the Governor.
Blyth F.G.H., et al., (1984). A Geology for Engineers, seventh edition.The Bath Press, London
Tomlinson M.J., (1995) Foundation Design and Construction, sixth edition, LongmanGroup Ltd., London.
Gaythwaite J.W. (2004) Design of Marine Facilities for the Berthing, Mooring andRepair of Vessels, second edition. ASCE Press, Reston, Virginia.
Santiesteban I.A. (2003) Multi-sensor data fusion applied to morphodynamics of coastalenvironments in Belize. International Institute for Geo-information, Science and EarthObservation.
D. R. Stoddart, F. R. Fosberg and D. L. Spellman (1982), Cays of the Belize Barrier Reefand Lagoon, Atoll Research Bulletin No. 256
Dr. Clif Jordan (2002), Holocene Sediments of the Belize Shelf
K. Terzaghi and R. B. Peck (1967), Soil Mechanics in Engineering Practice, secondedition. John Wiley & Sons.
B. Gerwick (2007), Construction of Marine and Offshore Structures, third edition, CRCPress

23
APPENDICES
Appendix I: Probing Records
Appendix II: Plates
1. Probe at BH1.2. Probe at BH4.3. Probe at BH6.
Appendix III: Report Preparers
24
Appendix I: Probing RecordsPROJECT: Spanish Bay Development ProjectLOCATION: Spanish Lookout Caye, Belize DistrictDATE: September 2007RECORDED BY: Alberto A. Rosado
Probing BH1
Depth Blows/foot Correlated S.P.T.(N) value
Remarks
0’- 0” – 1’-0” 6 1 Undecomposed fibrous roots
1’- 0” – 2’- 0” 10 2 Sandy mud and moluscan gravel
2 - 0” – 3’ - 0” 12 2 Sandy mud and peat
3’- 0” – 4’- 0” 4 < 1 Sandy mud and moluscan gravel
4’- 0” – 5’-0” 4 < 15’- 0” – 6’- 0” 6 16’- 0” – 7’- 0” 11 27’- 0” – 8’- 0” 5 18’- 0” – 9’- 0” 10 2
9 - 0” – 10’ - 0” 13 310’- 0” – 11’ - 0” 15 311’- 0” – 12’ - 0” 14 312’- 0” – 13’ - 0” 18 413’- 0” – 14’ - 0” 16 314’- 0” – 15’ - 0” 16 315’- 0” – 16’ - 0” 19 416’- 0” – 17’ - 0” 20 417’- 0” – 18’ - 0” 24 518’- 0” – 19’ - 0” 22 419’- 0” – 20’ - 0” 22 420’- 0” – 21’ - 0” 28 621’- 0” – 22’ - 0” 26 522’- 0” – 23’ - 0” 24 523’- 0” – 24’ - 0” 25 524’- 0” – 25’ - 0” 25 525’- 0” – 26’ - 0” 25 526’- 0” – 27’ - 0” 26 527’- 0” – 28’ - 0” 30 628’- 0” – 29’ - 0” 30+ > 6 Probing terminated since
bedrock was encountered at29’- 0”
The water level was eight inches above the existing ground surface.

25
Probing BH2
Depth Blows/foot Correlated S.P.T.(N) value
Remarks
0’- 0” – 1’-0” 7 1 Undecomposed fibrous roots
1’- 0” – 2’- 0” 15 3 Sandy mud and moluscan gravel
2 - 0” – 3’ - 0” 12 2 Sandy mud and peat
3’- 0” – 4’- 0” 6 1 Sandy mud and moluscan gravel
4’- 0” – 5’-0” 8 15’- 0” – 6’- 0” 11 26’- 0” – 7’- 0” 9 27’- 0” – 8’- 0” 11 28’- 0” – 9’- 0” 13 2
9 - 0” – 10’ - 0” 16 310’- 0” – 11’ - 0” 17 311’- 0” – 12’ - 0” 15 312’- 0” – 13’ - 0” 15 313’- 0” – 14’ - 0” 23 414’- 0” – 15’ - 0” 18 415’- 0” – 16’ - 0” 24 516’- 0” – 17’ - 0” 23 417’- 0” – 18’ - 0” 22 418’- 0” – 19’ - 0” 25 519’- 0” – 20’ - 0” 27 520’- 0” – 21’ - 0” 25 521’- 0” – 22’ - 0” 27 522’- 0” – 23’ - 0” 36 723’- 0” – 24’ - 0” 35 724’- 0” – 25’ - 0” 34 725’- 0” – 26’ - 0” 34 726’- 0” – 27’ - 0” 35 727’- 0” – 28’ - 0” 30 628’- 0” – 29’ - 0” 45+ > 9 Probing terminated since
bedrock was encountered at28’-2”
The water level was eight inches above the existing ground surface.

26
Probing BH3
Depth Blows/foot Correlated S.P.T.(N) value
Remarks
0’- 0” – 1’-0” 4 1 Undecomposed fibrous roots
1’- 0” – 2’- 0” 4 1 Sandy mud and peat
2 - 0” – 3’ - 0” 10 2 Sandy mud and peat
3’- 0” – 4’- 0” 20 4 Sandy mud
4’- 0” – 5’-0” 9 25’- 0” – 6’- 0” 8 16’- 0” – 7’- 0” 11 27’- 0” – 8’- 0” 11 28’- 0” – 9’- 0” 13 3
9 - 0” – 10’ - 0” 17 310’- 0” – 11’ - 0” 25 511’- 0” – 12’ - 0” 26 512’- 0” – 13’ - 0” 27 513’- 0” – 14’ - 0” 29 614’- 0” – 15’ - 0” 30 615’- 0” – 16’ - 0” 24 516’- 0” – 17’ - 0” 26 517’- 0” – 18’ - 0” 28 618’- 0” – 19’ - 0” 30 619’- 0” – 20’ - 0” 28 620’- 0” – 21’ - 0” 28 621’- 0” – 22’ - 0” 28 622’- 0” – 23’ - 0” 30 623’- 0” – 24’ - 0” 26 524’- 0” – 25’ - 0” 24 525’- 0” – 26’ - 0” 28 626’- 0” – 27’ - 0” 21 427’- 0” – 28’ - 0” 22 428’- 0” – 29’ - 0” 25 528’- 0” – 29’ - 0” 30 628’- 0” – 29’ - 0” 31 629’- 0” – 30’ - 0” 30+ > 6 Probing terminated since
bedrock was encountered at30’ – 0”
The water level was at the existing ground surface.
27
Probing BH4
Depth Blows/foot Correlated S.P.T.(N) value
Remarks
0’- 0” – 1’-0” 2 <1 Sandy mud and peat
1’- 0” – 2’- 0” 4 <1 Sandy mud and peat
2 - 0” – 3’ - 0” 8 1 Sandy mud and peat
3’- 0” – 4’- 0” 10 2 Sandy mud
4’- 0” – 5’-0” 8 15’- 0” – 6’- 0” 10 26’- 0” – 7’- 0” 12 27’- 0” – 8’- 0” 15 38’- 0” – 9’- 0” 10 2
9 - 0” – 10’ - 0” 15 310’- 0” – 11’ - 0” 20 411’- 0” – 12’ - 0” 21 412’- 0” – 13’ - 0” 20 413’- 0” – 14’ - 0” 26 614’- 0” – 15’ - 0” 28 615’- 0” – 16’ - 0” 25 516’- 0” – 17’ - 0” 26 517’- 0” – 18’ - 0” 26 518’- 0” – 19’ - 0” 28 619’- 0” – 20’ - 0” 30 620’- 0” – 21’ - 0” 28 621’- 0” – 22’ - 0” 31 622’- 0” – 23’ - 0” 30 623’- 0” – 24’ - 0” 28 624’- 0” – 25’ - 0” 25 525’- 0” – 26’ - 0” 30 626’- 0” – 27’ - 0” 24 527’- 0” – 28’ - 0” 24 528’- 0” – 29’ - 0” 28 628’- 0” – 29’ - 0” 31 628’- 0” – 29’ - 0” 30 629’- 0” – 30’ - 0” 32 630’- 0” – 31’ - 0” 35+ 7 Probing terminated since
bedrock was encountered at31’ – 0”
The water level was at one foot six inches below the existing ground surface.
28
Probing BH5
Depth Blows/foot Correlated S.P.T.(N) value
Remarks
0’- 0” – 1’-0” 5 1 Sandy mud
1’- 0” – 2’- 0” 6 1 Sandy mud
2 - 0” – 3’ - 0” 8 13’- 0” – 4’- 0” 12 24’- 0” – 5’-0” 10 25’- 0” – 6’- 0” 12 26’- 0” – 7’- 0” 8 17’- 0” – 8’- 0” 8 18’- 0” – 9’- 0” 12 2
9 - 0” – 10’ - 0” 10 210’- 0” – 11’ - 0” 14 311’- 0” – 12’ - 0” 10 212’- 0” – 13’ - 0” 12 213’- 0” – 14’ - 0” 16 314’- 0” – 15’ - 0” 18 415’- 0” – 16’ - 0” 20 416’- 0” – 17’ - 0” 22 417’- 0” – 18’ - 0” 26 518’- 0” – 19’ - 0” 25 519’- 0” – 20’ - 0” 25 520’- 0” – 21’ - 0” 32 621’- 0” – 22’ - 0” 28 622’- 0” – 23’ - 0” 31 623’- 0” – 24’ - 0” 32 624’- 0” – 25’ - 0” 31+ > 6 Probing terminated since
bedrock was encountered at25’ – 0 ”
The water level was one foot and five inches above the existing ground surface.

29
Probing BH6
Depth Blows/foot Correlated S.P.T.(N) value
Remarks
0’- 0” – 1’-0” 12 2 Dredged fill
1’- 0” – 2’- 0” 14 3 Dredged fill
2 - 0” – 3’ - 0” 15 33’- 0” – 4’- 0” 12 24’- 0” – 5’-0” 12 25’- 0” – 6’- 0” 10 26’- 0” – 7’- 0” 9 27’- 0” – 8’- 0” 10 28’- 0” – 9’- 0” 14 3
9 - 0” – 10’ - 0” 12 210’- 0” – 11’ - 0” 10 211’- 0” – 12’ - 0” 12 212’- 0” – 13’ - 0” 14 313’- 0” – 14’ - 0” 18 414’- 0” – 15’ - 0” 16 315’- 0” – 16’ - 0” 18 416’- 0” – 17’ - 0” 20 417’- 0” – 18’ - 0” 21 418’- 0” – 19’ - 0” 20 419’- 0” – 20’ - 0” 24 520’- 0” – 21’ - 0” 30 621’- 0” – 22’ - 0” 30 622’- 0” – 23’ - 0” 32 623’- 0” – 24’ - 0” 34 724’- 0” – 25’ - 0” 35+ > 7 Probing terminated since
bedrock was encountered at24’ – 10 ”
The water level was one foot below the existing ground surface.

30
Probing BH7
Depth Blows/foot Correlated S.P.T.(N) value
Remarks
0’- 0” – 1’-0” 10 2 Dredged fill
1’- 0” – 2’- 0” 12 2 Dredged fill
2 - 0” – 3’ - 0” 15 33’- 0” – 4’- 0” 10 24’- 0” – 5’-0” 12 25’- 0” – 6’- 0” 12 26’- 0” – 7’- 0” 10 27’- 0” – 8’- 0” 12 28’- 0” – 9’- 0” 15 3
9 - 0” – 10’ - 0” 14 310’- 0” – 11’ - 0” 12 211’- 0” – 12’ - 0” 10 212’- 0” – 13’ - 0” 16 313’- 0” – 14’ - 0” 20 414’- 0” – 15’ - 0” 18 415’- 0” – 16’ - 0” 18 416’- 0” – 17’ - 0” 22 417’- 0” – 18’ - 0” 20 418’- 0” – 19’ - 0” 22 419’- 0” – 20’ - 0” 25 520’- 0” – 21’ - 0” 25 521’- 0” – 22’ - 0” 28 622’- 0” – 23’ - 0” 30 623’- 0” – 24’ - 0” 32 724’- 0” – 25’ - 0” 33+ > 7 Probing terminated since
bedrock was encountered at25’ – 7 ”
The water level was 12 inches below the existing ground level.
31
Probing BH8
Depth Blows/foot Correlated S.P.T.(N) value
Remarks
0’- 0” – 1’-0” 16 3 Dredged fill
1’- 0” – 2’- 0” 28 6 Dredged fill
2 - 0” – 3’ - 0” 39 83’- 0” – 4’- 0” 50 104’- 0” – 5’-0” 60 125’- 0” – 6’- 0” 28 66’- 0” – 7’- 0” 28 67’- 0” – 8’- 0” 18 48’- 0” – 9’- 0” 15 3
9 - 0” – 10’ - 0” 16 310’- 0” – 11’ - 0” 10 211’- 0” – 12’ - 0” 10 212’- 0” – 13’ - 0” 18 413’- 0” – 14’ - 0” 20 414’- 0” – 15’ - 0” 20 415’- 0” – 16’ - 0” 21 416’- 0” – 17’ - 0” 21 417’- 0” – 18’ - 0” 24 518’- 0” – 19’ - 0” 24 519’- 0” – 20’ - 0” 28 520’- 0” – 21’ - 0” 30 521’- 0” – 22’ - 0” 28 622’- 0” – 23’ - 0” 30 623’- 0” – 24’ - 0” 34 724’- 0” – 25’ - 0” 35+ > 7 Probing terminated since
bedrock was encountered at25’ – 0 ”
The water level was 12 inches below the existing ground level.
32
Probing BH9
Depth Blows/foot Correlated S.P.T.(N) value
Remarks
0’- 0” – 1’-0” 5 1 Sandy mud and peat
1’- 0” – 2’- 0” 5 1 Sandy mud and peat
2 - 0” – 3’ - 0” 15 3 Sandy mud and peat
3’- 0” – 4’- 0” 25 5 Sandy mud
4’- 0” – 5’-0” 10 25’- 0” – 6’- 0” 10 26’- 0” – 7’- 0” 12 27’- 0” – 8’- 0” 13 38’- 0” – 9’- 0” 15 3
9 - 0” – 10’ - 0” 20 410’- 0” – 11’ - 0” 22 411’- 0” – 12’ - 0” 28 612’- 0” – 13’ - 0” 30 513’- 0” – 14’ - 0” 28 614’- 0” – 15’ - 0” 30 615’- 0” – 16’ - 0” 28 616’- 0” – 17’ - 0” 25 517’- 0” – 18’ - 0” 25 518’- 0” – 19’ - 0” 30 619’- 0” – 20’ - 0” 25 520’- 0” – 21’ - 0” 25 521’- 0” – 22’ - 0” 26 522’- 0” – 23’ - 0” 28 623’- 0” – 24’ - 0” 25 524’- 0” – 25’ - 0” 30+ >5 Probing terminated since
bedrock was encountered at24’ – 2”
The water level was four inches above the existing ground surface.
33
Probing BH10
Depth Blows/foot Correlated S.P.T.(N) value
Remarks
0’- 0” – 1’-0” 6 1 Undecomposed fibrous roots
1’- 0” – 2’- 0” 8 1 Peat
2 - 0” – 3’ - 0” 10 2 Sandy mud and peat
3’- 0” – 4’- 0” 20 4 Sandy mud
4’- 0” – 5’-0” 12 25’- 0” – 6’- 0” 12 26’- 0” – 7’- 0” 14 37’- 0” – 8’- 0” 15 38’- 0” – 9’- 0” 18 4
9 - 0” – 10’ - 0” 22 410’- 0” – 11’ - 0” 20 411’- 0” – 12’ - 0” 25 512’- 0” – 13’ - 0” 28 613’- 0” – 14’ - 0” 30 614’- 0” – 15’ - 0” 30 615’- 0” – 16’ - 0” 32 616’- 0” – 17’ - 0” 28 617’- 0” – 18’ - 0” 30 618’- 0” – 19’ - 0” 28 619’- 0” – 20’ - 0” 28 620’- 0” – 21’ - 0” 30 621’- 0” – 22’ - 0” 31 622’- 0” – 23’ - 0” 34+ > 6 Probing terminated since
bedrock was encountered at22’ – 2”
The water level was four inches above the existing ground surface.
34
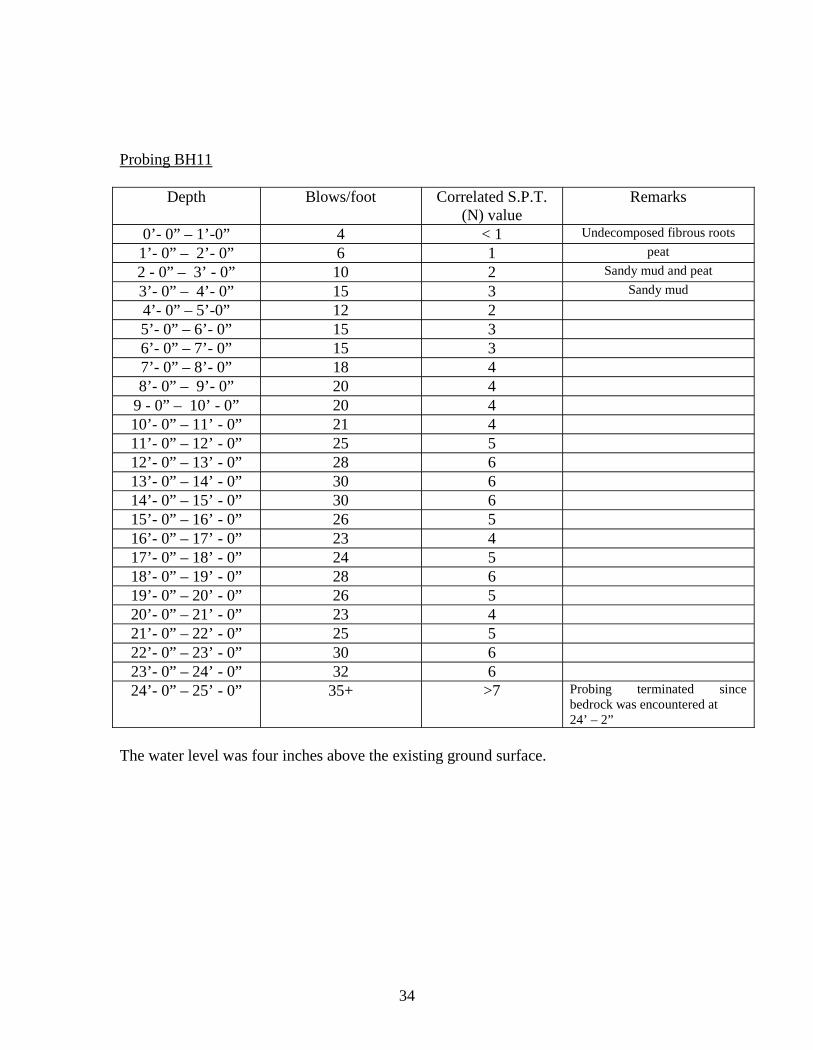
Probing BH11
Depth Blows/foot Correlated S.P.T.(N) value
Remarks
0’- 0” – 1’-0” 4 < 1 Undecomposed fibrous roots
1’- 0” – 2’- 0” 6 1 peat
2 - 0” – 3’ - 0” 10 2 Sandy mud and peat
3’- 0” – 4’- 0” 15 3 Sandy mud
4’- 0” – 5’-0” 12 25’- 0” – 6’- 0” 15 36’- 0” – 7’- 0” 15 37’- 0” – 8’- 0” 18 48’- 0” – 9’- 0” 20 4
9 - 0” – 10’ - 0” 20 410’- 0” – 11’ - 0” 21 411’- 0” – 12’ - 0” 25 512’- 0” – 13’ - 0” 28 613’- 0” – 14’ - 0” 30 614’- 0” – 15’ - 0” 30 615’- 0” – 16’ - 0” 26 516’- 0” – 17’ - 0” 23 417’- 0” – 18’ - 0” 24 518’- 0” – 19’ - 0” 28 619’- 0” – 20’ - 0” 26 520’- 0” – 21’ - 0” 23 421’- 0” – 22’ - 0” 25 522’- 0” – 23’ - 0” 30 623’- 0” – 24’ - 0” 32 624’- 0” – 25’ - 0” 35+ >7 Probing terminated since
bedrock was encountered at24’ – 2”
The water level was four inches above the existing ground surface.

35
Appendix II: Plates
Plate No. 1: Probe at BH1

36
Plate No. 2: Probe at BH2
Plate No. 3: Probe at BH8

37
Plate No. 4: Probe at BH11
APPENDIX III: REPORT PREPARERS
Jose Garcia, P. Eng. Civil/Sanitary Engineer
Alberto Rosado, P. Eng. Civil/Structural Engineer

1
ANNEX VIII
BESST TREATMENT PLANT SPECIFICATIONS

2
SEWER TREATMENT PLANT SPECIFICATIONS
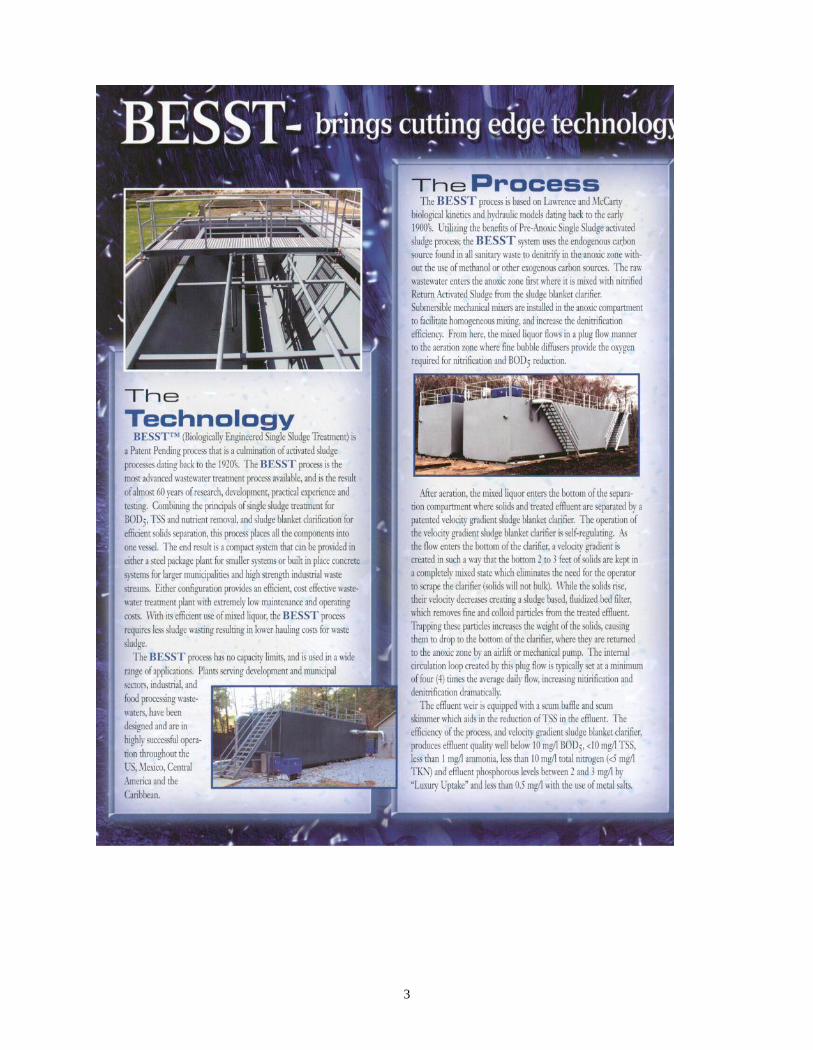
3
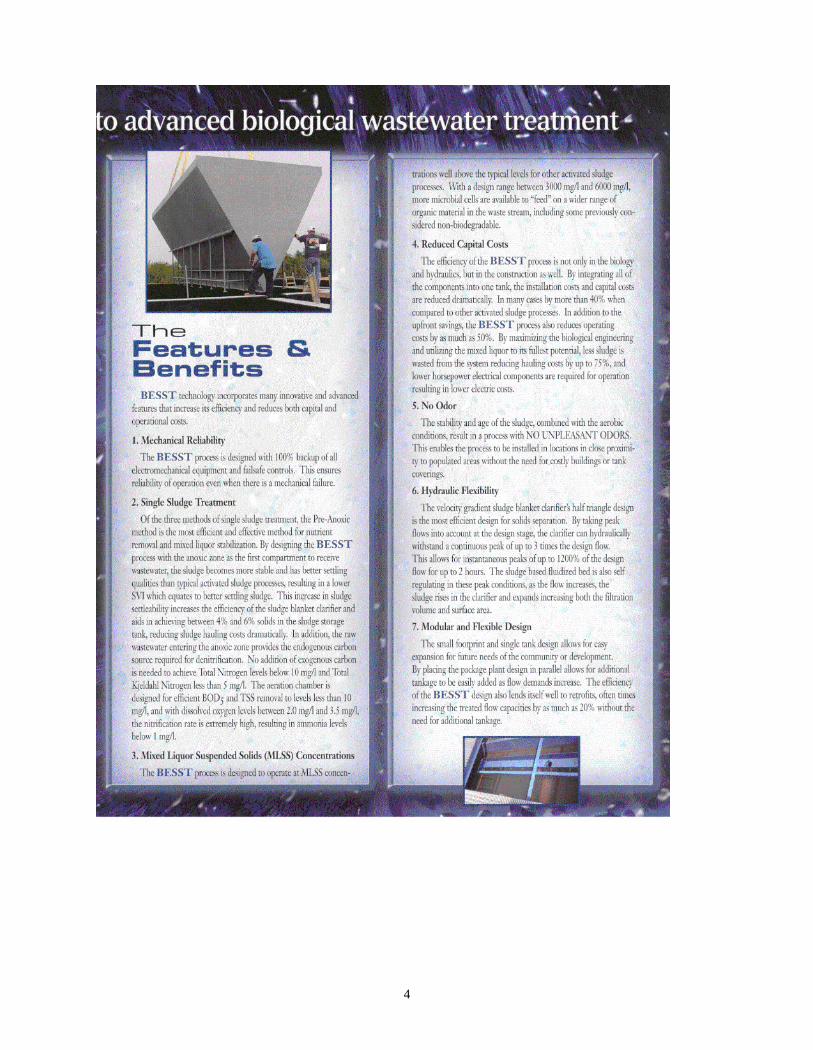
4

5

ANNEX XII
EARTH TUB COMPOSTING TECHNOLOGY

- 1 -
For Composting Organic Wastes
The Earth Tub
Commercial Duty Compost System
The Earth Tub is designed specifically for on-site composting of food-wastes. The Earth Tub is afully enclosed composting vessel featuring power mixing, compost aeration, and biofiltration of allprocess air. This self-contained unit is ideal for composting at schools, universities, restaurants,hospitals and supermarkets.

- 2 -
The Earth Tub Process
Loading
Organic materials such as food scraps, manure or yard waste are loaded through the largehatchway in the cover. Periodically, dry materials such as wood chips, shredded paper orshavings can be added to insure that porosity and moisture levels are ideal for composting.
Mixing
Turn on the auger motor and rotate the cover to shred and mix the new organic material into theactive compost. Two revolutions of the rotating cover are required to mix the outside and centerof the Earth Tub. The auger will shred and mix a ton or more of compost in 10-15 minutes. Duringactive composting, the Earth Tub should be mixed at least two times per week.
Aerobics and odor control
Maintaining aerobic conditions and controlling temperature are essential for composting and odorcontrol. The aeration system draws air through the compost and forces the exhaust air through

- 3 -
our biofiltration air purification system to remove odors. Liquids are collected and disposed to asanitary sewer or holding tank. The overall cleanliness of the in-vessel design allows the EarthTub to be placed in commercial settings close to where waste is generated.
Waste reduction
Heat generated in the Earth Tub rapidly breaks down the food scraps. The volumereduction is typically 70% or higher. After 3--4 weeks of active composting, open thedischarge doors and the auger pushes the compost out as it rotates past the dischargedoor. The compost can be cured for 20-40 days for further stabilization.
Key features
Easy to operate Rapid process reduces volume quickly Heavy-duty plastic construction Minimal need for bulking agent Short time required for mixing/loading Temperature controlled system Insulated for cold weather operation Thorough compost mixing Biofilter odor control system
SpecificationsTub Vessel Height 48"
Overall Height 68"
Overall Diameter 90"
Foam Insulation R-12
Shipping Weight 450 lbs
Volume 3 cubic yards
Mixing Auger 12" Diameter Stainless Steel
Auger Motor 3 Ph 2.5 hp 230/460V
Aeration Blower 80 CFM 100 watt
Power Usage ~1080 KWH per year
Liquid Drain 1” drain on biofilter
Processing Capacity 40-200 ppd*
* Pounds per day of biomass per Earth Tub.

- 0 -
ANNEX X
SHEET PILE SPECIFICATION

- 1 -

- 2 -
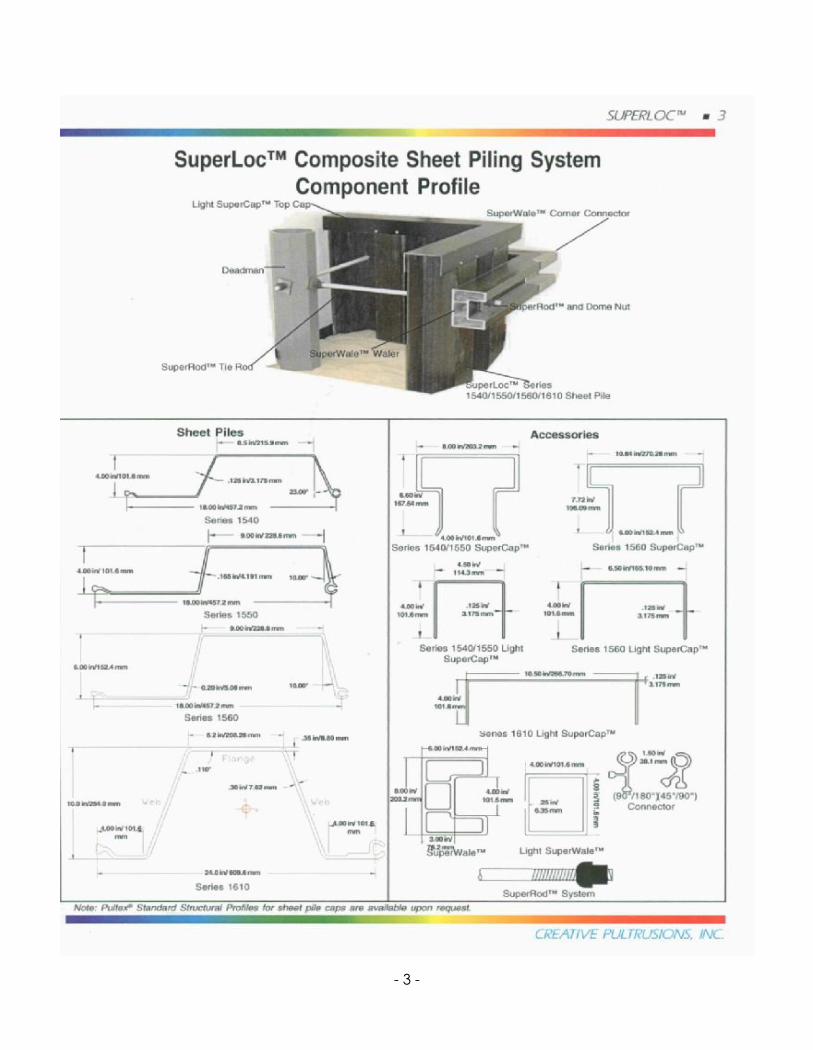
- 3 -
- 4 -

- 5 -

- 6 -

- 7 -
- 8 -


