31
ANNEXES ANNEX I: Monitoring Framework ANNEX II: Appealing Partners and Financial Information

ANNEXESANNEX I: Monitoring Framework
ANNEX II: Appealing Partners and Financial Information

02
ANNEXES
ANNEX I MONITORING INDICATORSData Disaggregation: In all cases where an indicator specifies the unit of measurement as ‘individual’ or ‘percentage,’ the data will be disaggregated by sex and age. All indicators measured by ‘household’ will provide data that is disaggregated by sex. All Sectors aim to provide disaggregated data across indicators, where applicable.
Data Availability: In some cases, the data for the variable ‘In Need’ or ‘Baseline’ is marked as ‘Not Available (NA).’ The use of NA implies that the indicator is new, and therefore the number has yet to be determined, or the information can otherwise not be measured.
‘In Need’: For some indicators, the variable ‘In Need’ includes the entire ‘population in need’ for the 2021 JRP (884,041 Rohingya refugees, 470,000 Bangladeshis in the host communities, or a total of 1,354,041 Rohingya refugees and host community members).
Acronym Legend: NA for 'Not Available' and IN for 'Indicator'
FOOD SECURITY
SECTOR OBJECTIVE 1 : Ensure and sustain the timely provision of life-saving food assistance for Rohingya refugees.
INDICATOR IN NEED BASELINE TARGET DATA SOURCE REPORTING ENTITY
FREQUENCY
IN1: Number of refugees receiving regular food assistance. 884,041 884,041 884,041 Distribution reports,
5Ws FSS Partners Monthly
IN2: Percentage of refugee households reached with timely food assistance in case of a disaster.
100 100 100 Distribution reports, 5Ws FSS Partners Monthly
IN3: Percentage of refugee households with acceptable Food Consumption Score.
NA 50 100 Assessment reports, monitoring reports
FSS Partners Quarterly
IN4: Percentage of refugee households using consumption-based coping strategy.
NA 80 0 Assessment reports, monitoring reports
FSS Partners Quarterly
SECTOR OBJECTIVE 2 : Support capacity building of Rohingya refugees that can support their sustainable rein-tegration in Myanmar.
INDICATOR IN NEED BASELINE TARGET DATA SOURCE REPORTING ENTITY
FREQUENCY
IN1: Number of households receiving capacity building support.
187,932 62,000 187,932 Distribution reports, 5Ws FSS Partners Monthly
IN2: Number of refugees participating in food for assets/cash-for-work activities.
NA 3,601 7,000 Distribution reports, 5Ws FSS Partners Monthly
IN3: Percentage of refugee households using a crisis coping strategy (reduced coping strategy index).
NA 62 0 Assessment reports, monitoring reports
FSS Partners Quarterly

03
ANNEXES
SECTOR OBJECTIVE 3 : Enhance livelihoods and resilience of vulnerable host communities and support social protection interventions, in cooperation with the Government of Bangladesh.
INDICATOR IN NEED BASELINE TARGET DATA SOURCE REPORTING ENTITY
FREQUENCY
IN1: Number of host community households reached with agricultural livelihoods support.
25,370 25,370 25,370 Distribution reports, 5Ws FSS Partners Monthly
IN2: Number of host community households reached with non-agricultural livelihoods support.
33,630 33,630 33,630 Distribution reports, 5Ws FSS Partners Monthly
IN3: Number of host community households reached with food or cash support.
43,000 43,000 43,000 Distribution reports, 5Ws FSS Partners Monthly
IN4: Number of host community individuals participating in food for assets/cash-for-work activities.
43,000 43,000 43,000 Distribution reports, 5Ws FSS Partners Monthly
IN5: Percentage of host community households using a crisis coping strategy (livelihood coping strategy index).
NA 33 0 Assessment reports, monitoring reports
FSS Partners Quarterly
HEALTH
SECTOR OBJECTIVE 1 : Improve equitable access to and utilization of life-saving and comprehensive primary and secondary health services for all crisis-affected populations.
INDICATOR IN NEED BASELINE TARGET DATA SOURCE REPORTING ENTITY
FREQUENCY
IN1: Under 5 mortality / 1,000 / month. NA 0.59 <1.5
Community-based Mortality Surveillance
CH WG Monthly
IN2: Number of consultations / person / year. NA 2.4 2 4W Health Sector Monthly
IN3: Number of women of reproductive age using any method of contraception.
173,037 96,461 141,476 SRH Service data SRH WG Monthly
IN4: Number of consultations for clinical mental health and focused psychosocial support.
NA 22,000 34,000 4Ws Health Sector Monthly
IN5: Percentage of facility-based deliveries.
42,896 (deliveries) 59.8 65 CH WG
Reporting tool CH WG Monthly
IN6: Number of patients referred to higher-level care for acute emergencies.
NA 10,000 10,000 4Ws Health Sector Quarterly
IN7: Percentage of health facilities offering GBV services (CMR/IPV or first line support and referral).
137 (facilities) 59 100 Quarterly
Reporting Tool Health Sector Quarterly
04
ANNEXES
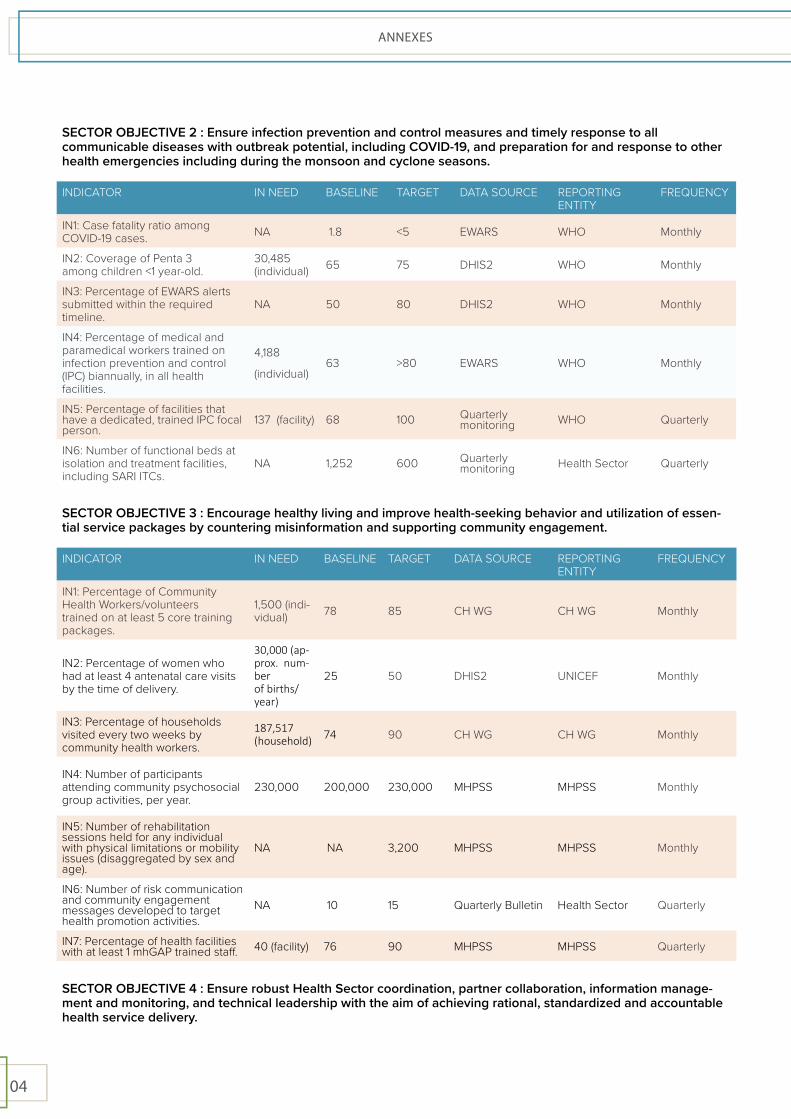
SECTOR OBJECTIVE 2 : Ensure infection prevention and control measures and timely response to all communicable diseases with outbreak potential, including COVID-19, and preparation for and response to other health emergencies including during the monsoon and cyclone seasons.
INDICATOR IN NEED BASELINE TARGET DATA SOURCE REPORTING ENTITY
FREQUENCY
IN1: Case fatality ratio among COVID-19 cases. NA 1.8 <5 EWARS WHO Monthly
IN2: Coverage of Penta 3 among children <1 year-old.
30,485 (individual) 65 75 DHIS2 WHO Monthly
IN3: Percentage of EWARS alerts submitted within the required timeline.
NA 50 80 DHIS2 WHO Monthly
IN4: Percentage of medical and paramedical workers trained on infection prevention and control (IPC) biannually, in all health facilities.
4,188
(individual) 63 >80 EWARS WHO Monthly
IN5: Percentage of facilities that have a dedicated, trained IPC focal person.
137 (facility) 68 100 Quarterly monitoring WHO Quarterly
IN6: Number of functional beds at isolation and treatment facilities, including SARI ITCs.
NA 1,252 600 Quarterly monitoring Health Sector Quarterly
SECTOR OBJECTIVE 3 : Encourage healthy living and improve health-seeking behavior and utilization of essen-tial service packages by countering misinformation and supporting community engagement.
INDICATOR IN NEED BASELINE TARGET DATA SOURCE REPORTING ENTITY
FREQUENCY
IN1: Percentage of Community Health Workers/volunteers trained on at least 5 core training packages.
1,500 (indi-vidual) 78 85 CH WG CH WG Monthly
IN2: Percentage of women who had at least 4 antenatal care visits by the time of delivery.
30,000 (ap-prox. num-ber of births/year)
25 50 DHIS2 UNICEF Monthly
IN3: Percentage of households visited every two weeks by community health workers.
187,517 (household) 74 90 CH WG CH WG Monthly
IN4: Number of participants attending community psychosocial group activities, per year.
230,000 200,000 230,000 MHPSS MHPSS Monthly
IN5: Number of rehabilitation sessions held for any individual with physical limitations or mobility issues (disaggregated by sex and age).
NA NA 3,200 MHPSS MHPSS Monthly
IN6: Number of risk communication and community engagement messages developed to target health promotion activities.
NA 10 15 Quarterly Bulletin Health Sector Quarterly
IN7: Percentage of health facilities with at least 1 mhGAP trained staff. 40 (facility) 76 90 MHPSS MHPSS Quarterly
SECTOR OBJECTIVE 4 : Ensure robust Health Sector coordination, partner collaboration, information manage-ment and monitoring, and technical leadership with the aim of achieving rational, standardized and accountable health service delivery.

05
ANNEXES
INDICATOR IN NEED BASELINE TARGET DATA SOURCE REPORTING ENTITY
FREQUENCY
IN1: Number of regular health information management products developed by the Health Sector and shared with partners (4Ws, Bulletin, Quarterly monitoring, Maps, factsheets, etc).
NA 16 33 Health Sector and Working Groups Health Sector Quarterly
IN2: Number of supportive supervisions by the Health Sector coordination members and interagency / government teams to camp and government health facilities, including health posts, PHCs, field hospitals and SARI ITCs.
NA 9 4 Health Sector Health Sector Quarterly
IN3: Number of camp-level health coordination meetings held. NA 94 408 Health Sector Health Sector Monthly
IN4: Average of reporting rate in DHIS2 for Rohingya refugee server.
NA 94 95 DHIS2 UNICEF / Health Sector Monthly
IN5: Percentage of PHCs and health posts where individual satisfaction is monitored through exit surveys or other community feedback mechanism.
All Health Facilities 96 100 Quarterly
Monitoring Health Sector Monthly
SHELTER AND NON-FOOD ITEMS
SECTOR OBJECTIVE 1 : Provide life-saving emergency Shelter/NFI support to households affected by disasters and other shocks.
INDICATOR IN NEED BASELINE TARGET DATA SOURCE REPORTING ENTITY
FREQUENCY
IN1: Number of households assisted with emergency shelter support.
187,932 33,417 187,932 Sector RDV reporting SNFI Sector Weekly
IN2: Number of gender-related issues referred through effective camp Focal Points or Catchment Focal Points.
NA 0 400 4W SNFI Sector Monthly
IN3: Number of households receiving emergency NFI assistance post-natural disaster or shock.
NA 27,379 4,300 4W SNFI Sector Monthly
SECTOR OBJECTIVE 2 : Provide safe and dignified living conditions to reduce suffering.
INDICATOR IN NEED BASELINE TARGET DATA SOURCE REPORTING ENTITY
FREQUENCY
IN1: Number of Rohingya households reached with Shelter/NFI assistance.
187,932 188,540 187,932 4W SNFI Sector Monthly
IN2: Number of host community households benefitting from Shelter/NFI assistance.
50,000 29,754 24,246 4W SNFI Sector Monthly

06
ANNEXES
IN3: Number of cross-cutting Sector documents (including HLP guidance/advocacy) developed that advance the Sector’s strategic objectives.
8 1 8 4W SNFI Sector Bi-annually
IN4: Percentage of Rohingya households benefiting from durable materials (treated bamboo, steel shelters, reinforced concrete posts).
82 39 43 4W SNFI Sector Monthly
SECTOR OBJECTIVE 3 : Mitigating potential tensions between Rohingya refugees and host communities.
INDICATOR IN NEED BASELINE TARGET DATA SOURCE REPORTING ENTITY
FREQUENCY
IN1: Number of HLP cases addressed through HLP case management, including alternative dispute resolution mechanisms (Rohingya and host community).
10 1 10 4W SNFI Sector Monthly
IN2: Number of people (women, older people, people with specific needs) involved in shelter activities.
680 NA 680 4W SNFI Sector Monthly
IN3: Number of camps assisted with community-led shelter activities.
34 0 34 4W SNFI Sector Monthly
IN4: Number of consultations for community-led programming. NA 0 20 4W SNFI Sector Monthly
WATER SANITATION AND HYGIENE
SECTOR OBJECTIVE 1 : Ensure regular, sufficient, and equitable access to safe water for drinking and domestic needs.
INDICATOR IN NEED BASELINE TARGET DATA SOURCE REPORTING ENTITY
FRE-QUENCY
IN1: Number of targeted people disaggregated by sex, age and disability benefitting from at least 20 l/p/d of safe water for drinking and other domestic purposes.
1,354,041 808,200 1,125,4164W, Infrastructure monitoring tool
WASH partners
/ DPHE Monthly
IN2: Percentage of water quality tests meeting minimum water quality standards.
7,000
(tests) 75 85 Water quality
monitoring WASH partners Monthly
IN3: Number of targeted people in host communities who are benefiting from safe and maintained water facilities.
472,002
(individual) 208,292 236,009
4W, Infrastructure monitoring tool
WASH partners
/ DPHE Monthly
IN4: Number of people disaggregated by host community and camps reporting having enough water to meet all domestic needs.
1,354,041
1,146,120 (88% in camps and 77% in host community)
1,219,456 (92% in camps and 85% in host com-munity)
HH survey, MSNA WASH partners Bi-
annually
SECTOR OBJECTIVE 2 : Ensure adequate and appropriate sanitation facilities that allow rapid, safe, and secure access for all and at all times.
INDICATOR IN NEED BASELINE TARGET DATA SOURCE REPORTING ENTITY
FREQUEN-CY

07
ANNEXES
IN1: Number of targeted people in camps who have access to functional and improved latrine facilities.
884,041 645,290 884,041 4W, Infrastructure mapping, key informant interviews
WASH partners Monthly
IN2: Percentage of households reporting visible waste in the vicinity of their accommodation.
187,756
(household) 27 20 Household Survey,
MSNA WASH partners Bi-annually
IN3: Number of targeted people who are accessing safe, functional and dignified communal bathing facilities.
884,041 417,160 884,041 4W, Infrastructure Mapping Tools WASH partners Monthly
IN4: Number of fully functional sanitation facilities (bathing cubicles and latrines).
86,070
(facility) 78 90
Infrastructure monitoring tool, partners reports
WASH partners Monthly
SECTOR OBJECTIVE 3 : Ensure the change of potentially health-compromising behaviours through participatory hygiene promotion and distribution of hygiene items with particular focus on contagious diseases.
INDICATOR IN NEED BASELINE TARGET DATA SOURCE REPORTING ENTITY
FREQUEN-CY
IN1: Percentage of targeted people able to identify three occasions when hand-washing is critical.
1,354,041
(individual) 71 80
KAP Survey, Household Survey, MSNA
WASH partners Twice per year
IN2: Percentage of women and girls accessing MHM supply according to WASH Sector standards and at least twice per year.
270,048
(individual) 76 80 4W WASH partners Monthly
IN3: Percentage of households in camps that have at least two clean and covered water containers at the time of assessment.
187,756
(household) 75 100 4W WASH partners Monthly
IN4: Percentage of households reporting having soap during the assessment.
229,917
(household)
95 in camps, 96 in host community
100 KAP Survey, Household Survey, MSNA
WASH partners Bi-annually
SITE MANAGEMENT AND SITE DEVELOPMENT
SECTOR OBJECTIVE 1 : Support Camp Administration (Government of Bangladesh CiCs and their teams) through the Capacity Sharing Initiative (CSI) and by establishing and running camp management and emergency preparedness and response programmes.
INDICATOR IN NEED BASELINE TARGET DATA SOURCE REPORTING ENTITY
FREQUEN-CY
IN1: Percentage of refugees living in camps where SMSD supports harmonized monthly facility and service monitoring. v
884,041 (in-dividual) 0 100 Kobo, Camp
profiles
Camp manag-ers / UN AoR
agencies /
SMSD Sector
Monthly
IN2: Percentage of refugees living in camps where a multi-hazard emergency preparedness and response plan has been updated and tested.
884,041 (in-dividual) 100 100 Preparedness
plans, reports SMSD Sector Annual
IN3: Percentage of SMSD staff and volunteers who have been trained on gender, protection and PSEA standards and practices.
4,420 (indi-vidual) 60 100 SMSD training
tracker Partners / SMSD Sector Monthly

08
ANNEXES
SECTOR OBJECTIVE 2 : Enable safe living conditions through rationalized and participatory site planning and through environmentally conscious construction and site maintenance initiatives.
INDICATOR IN NEED BASELINE TARGET DATA SOURCE REPORTING ENTITY
FREQUENCY
IN1: Percentage of refugees living in areas that are upgraded to meet acceptable space standards.
884,041 (in-dividual) 1.7 20
SMSD reports, UNHCR regis-tration data
SMSD partners Quarterly
IN2: Percentage of site development and improvement works identified through community consultations and/or referrals.
NA NA 50 4Ws, SOPs SMSD part-ners / SMSD Sector
Monthly
IN3: Percentage of site development daily laborers who are women or persons with disabilities.
NA 15 20 4Ws SMSD partners / SMSD Sector Monthly
IN4: Percentage of refugees living within 15 minutes of key infrastructure: secondary health facilities, markets, e-voucher shops, food distribution, LPG distribution, and a CiC/law enforcement (GoB) facility.
NA 20 50 SMSD reports, UNHCR regis-tration data
SMSD Sector Quarterly
SECTOR OBJECTIVE 3 : Promote meaningful community representation and accountability of the humanitarian community to the host community and Rohingya refugees through feedback mechanisms and community dialogue to mitigate tensions.
INDICATOR IN NEED BASELINE TARGET DATA SOURCE REPORTING ENTITY
FREQUENCY
IN1: Percentage of camps with operational camp representation systems.
29 (camp) 15 60 4W SMSD Part-ners / SMSD Sector
Monthly
IN2: Percentage of camps with representation systems that include the participation of women, youth, and persons with disabilities.
34 (camp) 15 100 4W SMSD Part-ners / SMSD Sector
Monthly
IN3: Percentage of camps with operational community feedback and referral mechanisms.
34 (camp) 100 100 4W SMSD Part-ners / SMSD Sector
Monthly
PROTECTION (INCLUDING CP AND GBV)
SECTOR OBJECTIVE 1 : Ensure safe, voluntary and dignified return of Rohingya refugees to Myanmar and respect for Rohingya refugees’ basic needs, while widening continuous joint registration (as part of the Govern-ment-UNHCR registration exercise) and documentation for all Rohingya refugees in order to ensure effective, targeted protection and assistance and work toward sustainable solutions.
INDICATOR IN NEED BASELINE TARGET DATA SOURCE REPORTING ENTITY
FREQUENCY
IN1: Number of individuals supported with legal aid and related services, including victims of trafficking and exploitation.
1,354,041 17,757 21,500 5W General Pro-tection Monthly

09
ANNEXES
IN2: Number of situational protection reports produced by the Protection Working Group (PWG), based on common Protection Monitoring Framework and/or ad hoc assessments (e.g. rapid protection Assessments, Border Monitoring, Camp Protection Profiles, etc.), with recommendations on programming and advocacy priorities.
NA 14 18 Monthly Sitrep General Pro-tection Monthly
IN3: Number of individuals among service providers, local authorities and community representatives trained on mediation and other alternative dispute resolution mechanisms.
NA NA 250 5W General Pro-tection Monthly
IN4: Percentage of refugees for whom data disaggregated by sex, age, location and specific needs is available and updated.
884,041 (in-dividual) 100 100 UNHCR
Registration UNHCR Reg-istration Monthly
SECTOR OBJECTIVE 2 : Promote a community-based approach to the response, support community protection mechanisms, and facilitate meaningful access to specialized services for persons at heightened risk who have diverse needs and vulnerabilities. This is with the aim of mitigating exposure to risks, strengthening the resil-ience of affected communities in order to build capacity for return and reintegration, and placing communities at the centre of the response, as well as by ensuring active and effective communication between humanitarian actors and communities of concern.
INDICATOR IN NEED BASELINE TARGET DATA SOURCE
REPORTING ENTITY
FREQUEN-CY
IN1: Number of community-led initiatives supported by humanitarian actors.
884,041 (individual)v 36,871 36,000 5W
General Pro-tection / Child Protection
Monthly
IN2: Number of people reached by community-led messaging on key protection risks and related mitigation measures.
1,354,041 1,354,041 1,354,041 5W General Protec-tion / Child Pro-tection
Monthly
IN3: Percentage of camps with established Protection Emergency Response Units whose members are trained and activated.
34
(camp) 100 100 PWG Re-
ports Protection Work-ing Group Monthly
IN4: Percentage of community-based child protection network members who report increased confidence in their ability to prevent and respond to child protection risks.
1,060 (indi-vidual) 100 80 CPSS
report Child Protection
SECTOR OBJECTIVE 3 : Support system strengthening together with the Government and local partners, includ-ing local women-led organizations and disabled persons organizations, mitigating potential tensions within and between the Rohingya refugee and host communities.
INDICATOR IN NEED BASELINE TARGET DATA SOURCE REPORTING ENTITY
FREQUENCY
IN1: Number of initiatives that work to mitigate potential tensions within and between refugees and the host community.
NA 27 30 5W General Protec-tion Monthly
IN2: Percentage of community groups led by women and girls. 34 (camp) 50 50 5W General Protec-
tion Monthly
IN3: Number of individuals from service providers and authorities trained on protection including gender.
NA 9,435 11,100 5W + Training reports
General Pro-tection, Child Protection
Monthly
10
ANNEXES
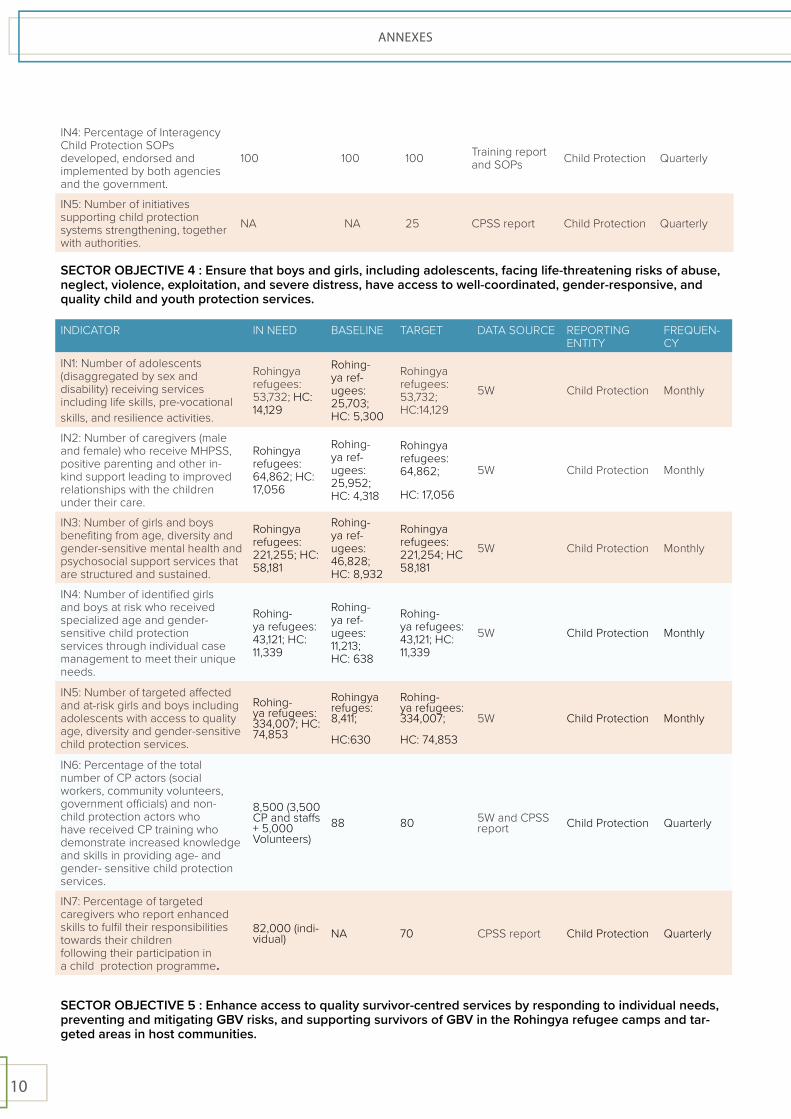
IN4: Percentage of Interagency Child Protection SOPs developed, endorsed and implemented by both agencies and the government.
100 100 100 Training report and SOPs Child Protection Quarterly
IN5: Number of initiatives supporting child protection systems strengthening, together with authorities.
NA NA 25 CPSS report Child Protection Quarterly
SECTOR OBJECTIVE 4 : Ensure that boys and girls, including adolescents, facing life-threatening risks of abuse, neglect, violence, exploitation, and severe distress, have access to well-coordinated, gender-responsive, and quality child and youth protection services.
INDICATOR IN NEED BASELINE TARGET DATA SOURCE REPORTING ENTITY
FREQUEN-CY
IN1: Number of adolescents (disaggregated by sex and disability) receiving services including life skills, pre-vocational skills, and resilience activities.
Rohingya refugees: 53,732; HC: 14,129
Rohing-ya ref-ugees: 25,703; HC: 5,300
Rohingya refugees: 53,732; HC:14,129
5W Child Protection Monthly
IN2: Number of caregivers (male and female) who receive MHPSS, positive parenting and other in-kind support leading to improved relationships with the children under their care.
Rohingya refugees: 64,862; HC: 17,056
Rohing-ya ref-ugees: 25,952; HC: 4,318
Rohingya refugees: 64,862;
HC: 17,056
5W Child Protection Monthly
IN3: Number of girls and boys benefiting from age, diversity and gender-sensitive mental health and psychosocial support services that are structured and sustained.
Rohingya refugees: 221,255; HC: 58,181
Rohing-ya ref-ugees: 46,828; HC: 8,932
Rohingya refugees: 221,254; HC 58,181
5W Child Protection Monthly
IN4: Number of identified girls and boys at risk who received specialized age and gender-sensitive child protection services through individual case management to meet their unique needs.
Rohing-ya refugees: 43,121; HC: 11,339
Rohing-ya ref-ugees: 11,213; HC: 638
Rohing-ya refugees: 43,121; HC: 11,339
5W Child Protection Monthly
IN5: Number of targeted affected and at-risk girls and boys including adolescents with access to quality age, diversity and gender-sensitive child protection services.
Rohing-ya refugees: 334,007; HC: 74,853
Rohingya refuges: 8,411;
HC:630
Rohing-ya refugees: 334,007;
HC: 74,853
5W Child Protection Monthly
IN6: Percentage of the total number of CP actors (social workers, community volunteers, government officials) and non-child protection actors who have received CP training who demonstrate increased knowledge and skills in providing age- and gender- sensitive child protection services.
8,500 (3,500 CP and staffs + 5,000 Volunteers)
88 80 5W and CPSS report Child Protection Quarterly
IN7: Percentage of targeted caregivers who report enhanced skills to fulfil their responsibilities towards their children following their participation in a child protection programme.
82,000 (indi-vidual) NA 70 CPSS report Child Protection Quarterly
SECTOR OBJECTIVE 5 : Enhance access to quality survivor-centred services by responding to individual needs, preventing and mitigating GBV risks, and supporting survivors of GBV in the Rohingya refugee camps and tar-geted areas in host communities.
11
ANNEXES
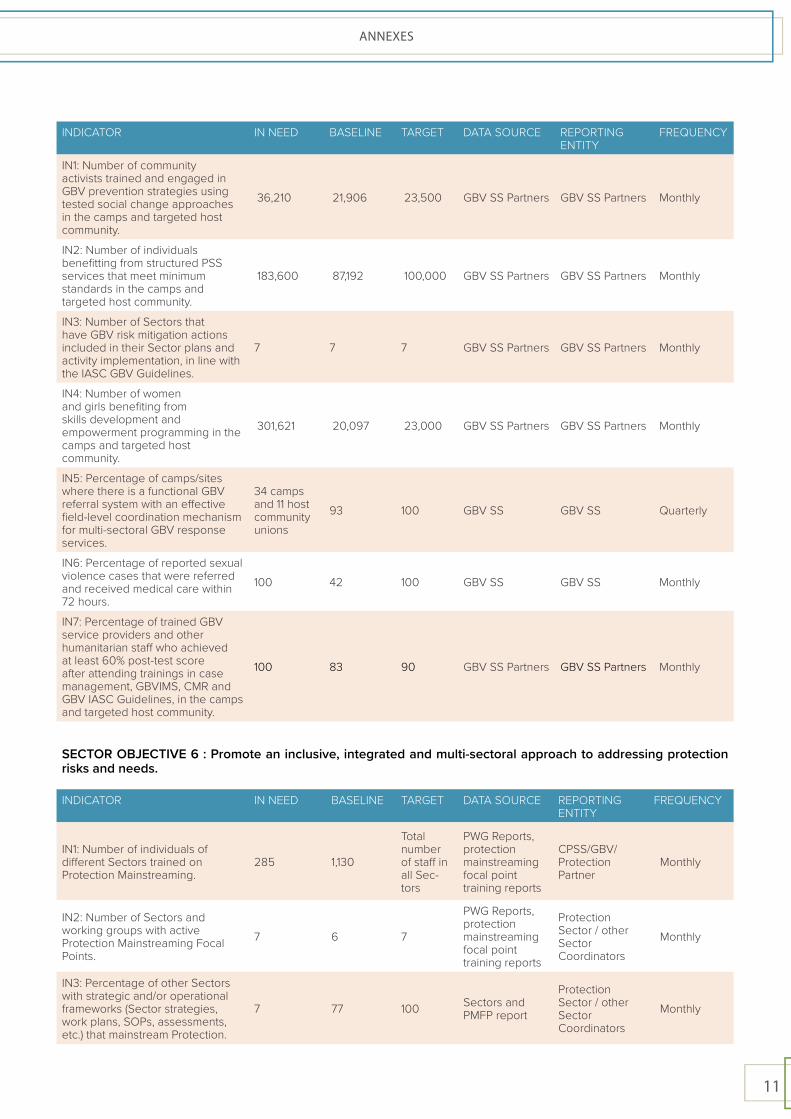
INDICATOR IN NEED BASELINE TARGET DATA SOURCE REPORTING ENTITY
FREQUENCY
IN1: Number of community activists trained and engaged in GBV prevention strategies using tested social change approaches in the camps and targeted host community.
36,210 21,906 23,500 GBV SS Partners GBV SS Partners Monthly
IN2: Number of individuals benefitting from structured PSS services that meet minimum standards in the camps and targeted host community.
183,600 87,192 100,000 GBV SS Partners GBV SS Partners Monthly
IN3: Number of Sectors that have GBV risk mitigation actions included in their Sector plans and activity implementation, in line with the IASC GBV Guidelines.
7 7 7 GBV SS Partners GBV SS Partners Monthly
IN4: Number of women and girls benefiting from skills development and empowerment programming in the camps and targeted host community.
301,621 20,097 23,000 GBV SS Partners GBV SS Partners Monthly
IN5: Percentage of camps/sites where there is a functional GBV referral system with an effective field-level coordination mechanism for multi-sectoral GBV response services.
34 camps and 11 host community unions
93 100 GBV SS GBV SS Quarterly
IN6: Percentage of reported sexual violence cases that were referred and received medical care within 72 hours.
100 42 100 GBV SS GBV SS Monthly
IN7: Percentage of trained GBV service providers and other humanitarian staff who achieved at least 60% post-test score after attending trainings in case management, GBVIMS, CMR and GBV IASC Guidelines, in the camps and targeted host community.
100 83 90 GBV SS Partners GBV SS Partners Monthly
SECTOR OBJECTIVE 6 : Promote an inclusive, integrated and multi-sectoral approach to addressing protection risks and needs.
INDICATOR IN NEED BASELINE TARGET DATA SOURCE REPORTING ENTITY
FREQUENCY
IN1: Number of individuals of different Sectors trained on Protection Mainstreaming.
285 1,130
Total number of staff in all Sec-tors
PWG Reports, protection mainstreaming focal point training reports
CPSS/GBV/Protection Partner
Monthly
IN2: Number of Sectors and working groups with active Protection Mainstreaming Focal Points.
7 6 7
PWG Reports, protection mainstreaming focal point training reports
Protection Sector / other Sector Coordinators
Monthly
IN3: Percentage of other Sectors with strategic and/or operational frameworks (Sector strategies, work plans, SOPs, assessments, etc.) that mainstream Protection.
7 77 100 Sectors and PMFP report
Protection Sector / other Sector Coordinators
Monthly

12
ANNEXES
IN4: Percentage of Sector partners that have at least one trained PSEA and child safeguarding focal point.
100 100 100
Training Reports by PSEA Coordinator, CPSS and other Sector Coordinator
Protection Sector / other Sector Coordinators
Monthly
EDUCATIONSECTOR OBJECTIVE 1 : Ensure access to gender-responsive learning opportunities in an enabling, protective environment for crisis-affected children.
INDICATOR IN NEED BASELINE TARGET DATA SOURCE
REPORTING ENTITY
FREQUEN-CY
IN1: Number of crisis-affected girls and boys (aged 4 to 24 in host community and 3 to 24 in Rohingya refugee population) accessing learning opportunities in facilities and schools supported by Education Sector partners.
Rohing-ya ref-ugees: 515,052 (49% girls / 51% boys); HC: 200,119 (54% girls / 46% boys)
Rohingya refugees: 353,828 (174,333 girls and 179,495 boys); HC: 43,950 (24,642 girls and 19,308 boys)
451,548 5W Education Sec-tor Partners Monthly
IN2: Number of government and non-formal schools in the host community benefitting from rehabilitation.
NA
113 host community facilities (49 gov-ernment schools/ colleges, 42 private schools, 5 madrassas and 7 shared facilities
230 5W Education Sec-tor Partners Monthly
IN3: Number of learning facilities, including learning centres, community-based and cross-sectoral structures with sex-segregated accessible WASH facilities in the Rohingya refugee camps and host community.
NA
6,236 learning fa-cilities (3,326 learn-ing centres, 2,843 communi-ty-based learn-ing facilities and 67 cross- Sec-toral shared learn-ing facilities)
7,000 5W Education Sec-tor Partners Monthly
IN4: Number of learning facilities in refugee camps constructed or rehabilitated by Education Sector partners.
NA 633 7,000 5W Education Sec-tor Partners Monthly
SECTOR OBJECTIVE 2 : Provide education to crisis affected girls and boys within government-approved frame-works for teaching and learning.
INDICATOR IN NEED BASELINE TARGET DATA SOURCE REPORTING ENTITY
FREQUENCY
IN1: Number of crisis-affected host community and Rohingya refugee girls and boys aged 3 to 24 years old receiving education and play materials, supplies and equipment aligned with Education Sector standards and other guidelines such as INEE minimum standards.
NA
Refugees: 322,758 (157,762 girls, 164,996 boys); HC: 9,995 (5,109 girls, 4,886 boys) ; Total: 332,753
451,548 5W Education Sector Partners Monthly
13
ANNEXES
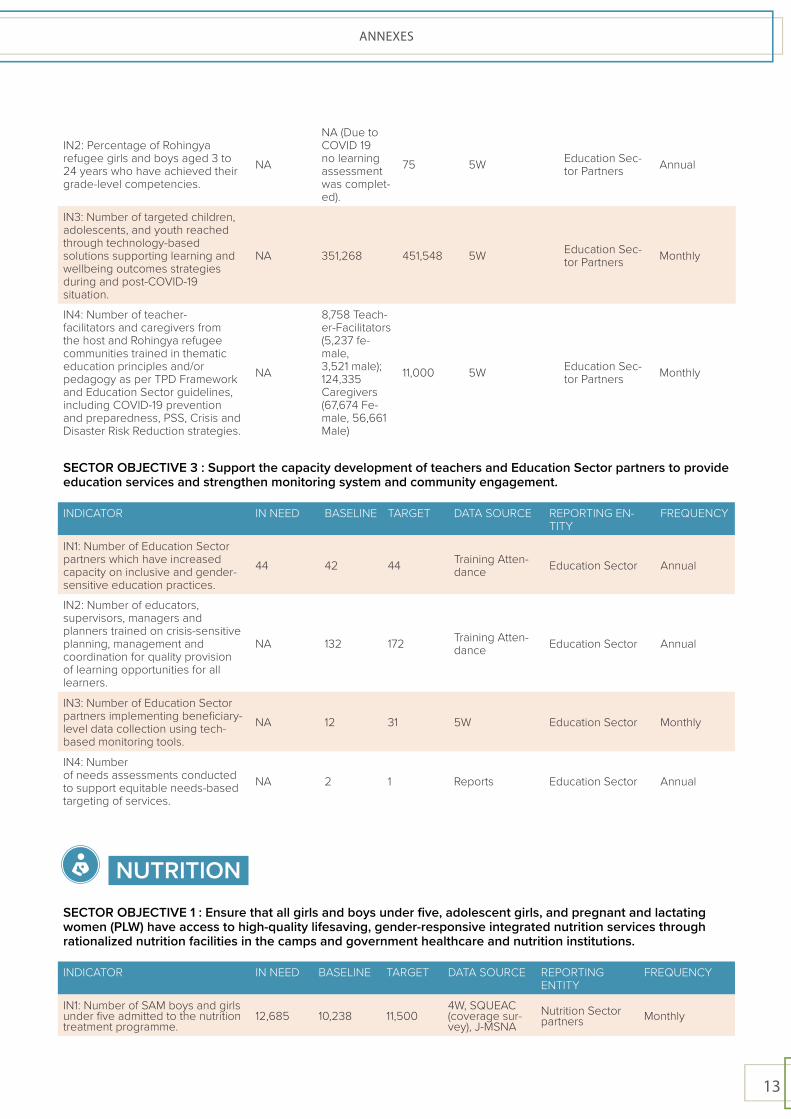
IN2: Percentage of Rohingya refugee girls and boys aged 3 to 24 years who have achieved their grade-level competencies.
NA
NA (Due to COVID 19 no learning assessment was complet-ed).
75 5W Education Sec-tor Partners Annual
IN3: Number of targeted children, adolescents, and youth reached through technology-based solutions supporting learning and wellbeing outcomes strategies during and post-COVID-19 situation.
NA 351,268 451,548 5W Education Sec-tor Partners Monthly
IN4: Number of teacher-facilitators and caregivers from the host and Rohingya refugee communities trained in thematic education principles and/or pedagogy as per TPD Framework and Education Sector guidelines, including COVID-19 prevention and preparedness, PSS, Crisis and Disaster Risk Reduction strategies.
NA
8,758 Teach-er-Facilitators (5,237 fe-male, 3,521 male); 124,335 Caregivers (67,674 Fe-male, 56,661 Male)
11,000 5W Education Sec-tor Partners Monthly
SECTOR OBJECTIVE 3 : Support the capacity development of teachers and Education Sector partners to provide education services and strengthen monitoring system and community engagement.
INDICATOR IN NEED BASELINE TARGET DATA SOURCE REPORTING EN-TITY
FREQUENCY
IN1: Number of Education Sector partners which have increased capacity on inclusive and gender-sensitive education practices.
44 42 44 Training Atten-dance Education Sector Annual
IN2: Number of educators, supervisors, managers and planners trained on crisis-sensitive planning, management and coordination for quality provision of learning opportunities for all learners.
NA 132 172 Training Atten-dance Education Sector Annual
IN3: Number of Education Sector partners implementing beneficiary-level data collection using tech-based monitoring tools.
NA 12 31 5W Education Sector Monthly
IN4: Number of needs assessments conducted to support equitable needs-based targeting of services.
NA 2 1 Reports Education Sector Annual
NUTRITIONSECTOR OBJECTIVE 1 : Ensure that all girls and boys under five, adolescent girls, and pregnant and lactating women (PLW) have access to high-quality lifesaving, gender-responsive integrated nutrition services through rationalized nutrition facilities in the camps and government healthcare and nutrition institutions.
INDICATOR IN NEED BASELINE TARGET DATA SOURCE REPORTING ENTITY
FREQUENCY
IN1: Number of SAM boys and girls under five admitted to the nutrition treatment programme.
12,685 10,238 11,500 4W, SQUEAC (coverage sur-vey), J-MSNA
Nutrition Sector partners Monthly

14
ANNEXES
IN2: Number of MAM boys and girls admitted to the nutrition treatment programme.
51,704 50,885 46,500 4W, SQUEAC (coverage sur-vey), J-MSNA
Nutrition Sector partners Monthly
IN3: Number of MAM PLW admitted to the nutrition treatment programme.
8,151 2,635 7,500 4W, SQUEAC (coverage sur-vey), J-MSNA
Nutrition Sector partners Monthly
IN4: Percentage of Integrated Nutrition Facilities staff who are trained in CMAM, MIYCF, CMAMI, MHPSS and other cross cutting issues.
75 75 75 Training reports Nutrition Sector partners Quarterly
SECTOR OBJECTIVE 2 : Ensure that all boys and girls, and PLW have uninterrupted access and use of preventive nutrition services; benefiting from optimal maternal and child feeding practices and improved dietary diversity and meal frequencies through nutrition-specific and nutrition-sensitive community interventions, including during any emergency outbreak.
INDICATOR IN NEED BASELINE TARGET DATA SOURCE REPORTING ENTITY
FREQUENCY
IN1: Number of mother and caregivers who received IYCF one-on-one counselling sessions.
46,558 43,998 41,902 4W Nutrition Sector partners Monthly
IN2: Number of children under five who received a dose of vitamin A as per the age group.
160,500 160,026 160,500 4W Nutrition Sector partners Monthly
IN3: Number of children under five in Rohingya camps and host communities who benefitted from Blanket Supplementary Feeding Programme (BSFP).
145,000 168,573 145,000 4W Nutrition Sector partners Monthly
IN4: Number of pregnant and lactating women in Rohingya camps and host communities who benefitted from BSFP.
42,000 43,998 42,000 4W Nutrition Sector partners Monthly
SECTOR OBJECTIVE 3 : Enhance capacities of all partners to understand and apply localization principles and optimize staffing for the implementation of quality integrated nutrition services in the Rohingya refugee and host communities, while ensuring that all services are gender-responsive, transparent, accessible, evidence-based, and inclusive.
INDICATOR IN NEED BASELINE TARGET DATA SOURCE REPORTING ENTITY
FREQUENCY
IN1: Percentage of women in coordination boards of the Nutrition Sector.
50 35,783 50 Meeting min-utes, Terms of reference (TORs)
Nutrition Sector Annually
IN2: Number of mobile Rapid Re-sponse Teams (RRT). 50 50 50 Sector reports Nutrition Sector Twice per
year
IN3: Number of INFs that are tied down. 46 46 46 Sector reports Nutrition Sector Annually
IN4: Number of surveys, assessments, evaluations, and programme missions for Sector performance monitoring and information management systems that provide timely and quality data and evidence to guide nutrition policy and advocacy strategies, programme design, and impact analysis.
4 1 4 Sector reports Nutrition Sector As conducted

15
ANNEXES
COMMUNICATIONS WITH COMMUNITIESSECTOR OBJECTIVE 1 : Support Government, operational Sectors and humanitarian actors in ensuring adoption of strategic, and community-centric communication and community engagement approaches on key humanitarian concerns, integrating gender, inclusion and protection considerations.
INDICATOR IN NEED BASELINE TARGET DATA SOURCE REPORTING ENTITY
FREQUENCY
IN1: Number of Rohingya refugee and host community members reached through CwC services.
1,354,041 803,098 900,000 4W CwC WG
Secretariat Bi-annually
IN2: Percentage of Rohingya refugee and host community members who reported that CwC content/messages are accessible and understandable, disaggregated by sex, age and other diverse characteristics.
100 84 90 MSNA ISCG Bi-annually
IN3: Percentage of Rohingya refugee and host community members who feel informed about the kimnd of aid and services available to them, disaggregated by sex, age and other diverse characteristics
100 39 75 MSNA ISCG Bi-annually
SECTOR OBJECTIVE 2 : Improve participation of affected people, following minimum standards for the referral and response to community feedback, and through increased use of collective data analysis.
INDICATOR IN NEED BASELINE TARGET DATA SOURCE REPORTING ENTITY
FREQUENCY
IN1: Number of agencies/Sector partners following the common technical standards for Referral of Community Feedback.
148 NA 50 4W, Sector reports
Sectors/CwC WG Secre-tariat
Bi-annually
IN2: Percentage of refugee and host community members who reported that they have no barriers to using feedback mechanisms, disaggregated by sex, age and other diverse characteristics.
100 83 90 MSNA ISCG Secretariat Bi-annually
IN3: Number of Information Service Centres/Info Hubs following CwC Standard Operating Procedures (SOPs).
104 104 104 Service Moni-toring, Survey
SMSD / CwC WG Bi-annually
SECTOR OBJECTIVE 3 : Reinforce coordination, advocacy and technical support across different Sectors and stakeholders.
INDICATOR IN NEED BASELINE TARGET DATA SOURCE REPORTING ENTITY
FREQUENCY
IN1: Number of agencies, Sectors and platforms that used services and tools produced by CwC Working Group members.
148 70 90 4W Common ser-vice / CwC part-ners
Bi-annually
IN2: Number of trainings/orientations on CwC, accountability and humanitarian principles organized for humanitarian staff/volunteers.
NA 1,118 1,500 4W Common ser-vice / CwC part-ners
Bi-annually
16
ANNEXES
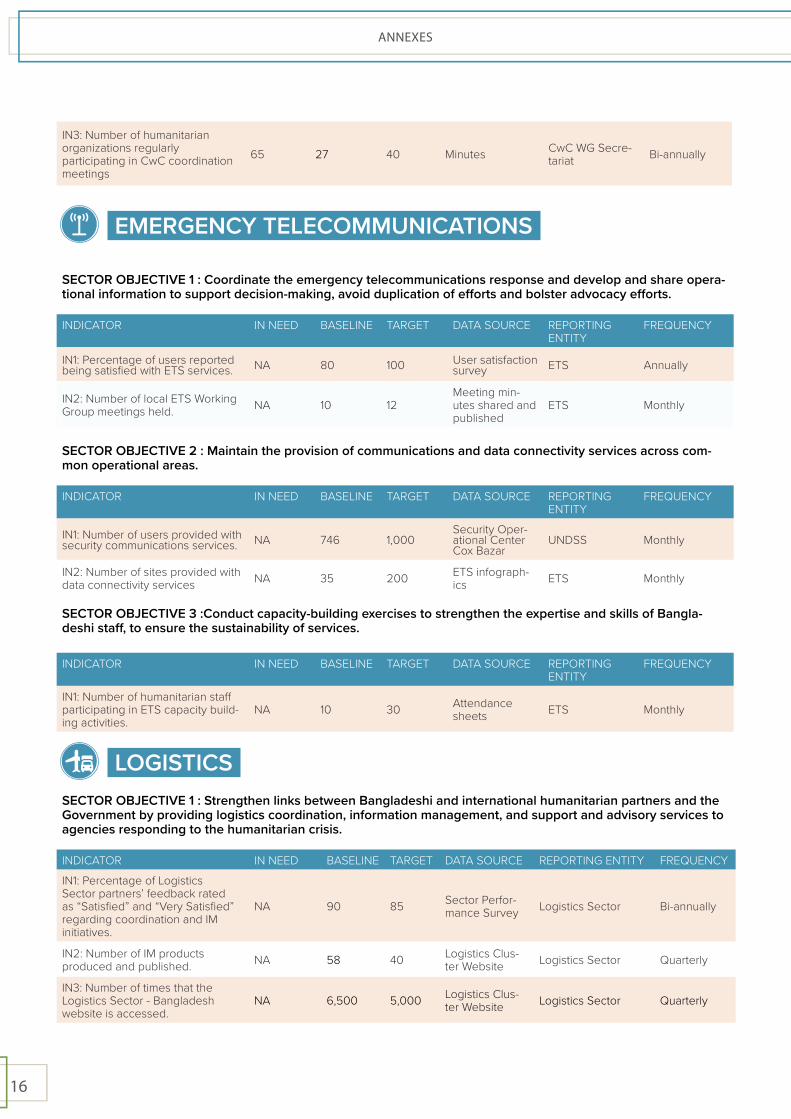
IN3: Number of humanitarian organizations regularly participating in CwC coordination meetings
65 27 40 Minutes CwC WG Secre-tariat Bi-annually
EMERGENCY TELECOMMUNICATIONS
SECTOR OBJECTIVE 1 : Coordinate the emergency telecommunications response and develop and share opera-tional information to support decision-making, avoid duplication of efforts and bolster advocacy efforts.
INDICATOR IN NEED BASELINE TARGET DATA SOURCE REPORTING ENTITY
FREQUENCY
IN1: Percentage of users reported being satisfied with ETS services. NA 80 100 User satisfaction
survey ETS Annually
IN2: Number of local ETS Working Group meetings held. NA 10 12
Meeting min-utes shared and published
ETS Monthly \SECTOR OBJECTIVE 2 : Maintain the provision of communications and data connectivity services across com-mon operational areas.
INDICATOR IN NEED BASELINE TARGET DATA SOURCE REPORTING ENTITY
FREQUENCY
IN1: Number of users provided with security communications services. NA 746 1,000
Security Oper-ational Center Cox Bazar
UNDSS Monthly
IN2: Number of sites provided with data connectivity services NA 35 200 ETS infograph-
ics ETS Monthly
SECTOR OBJECTIVE 3 :Conduct capacity-building exercises to strengthen the expertise and skills of Bangla-deshi staff, to ensure the sustainability of services.
INDICATOR IN NEED BASELINE TARGET DATA SOURCE REPORTING ENTITY
FREQUENCY
IN1: Number of humanitarian staff participating in ETS capacity build-ing activities.
NA 10 30 Attendance sheets ETS Monthly
LOGISTICSSECTOR OBJECTIVE 1 : Strengthen links between Bangladeshi and international humanitarian partners and the Government by providing logistics coordination, information management, and support and advisory services to agencies responding to the humanitarian crisis.
INDICATOR IN NEED BASELINE TARGET DATA SOURCE REPORTING ENTITY FREQUENCY
IN1: Percentage of Logistics Sector partners’ feedback rated as “Satisfied” and “Very Satisfied” regarding coordination and IM initiatives.
NA 90 85 Sector Perfor-mance Survey Logistics Sector Bi-annually
IN2: Number of IM products produced and published. NA 58 40 Logistics Clus-
ter Website Logistics Sector Quarterly
IN3: Number of times that the Logistics Sector - Bangladesh website is accessed.
NA 6,500 5,000 Logistics Clus-ter Website Logistics Sector Quarterly
17
ANNEXES
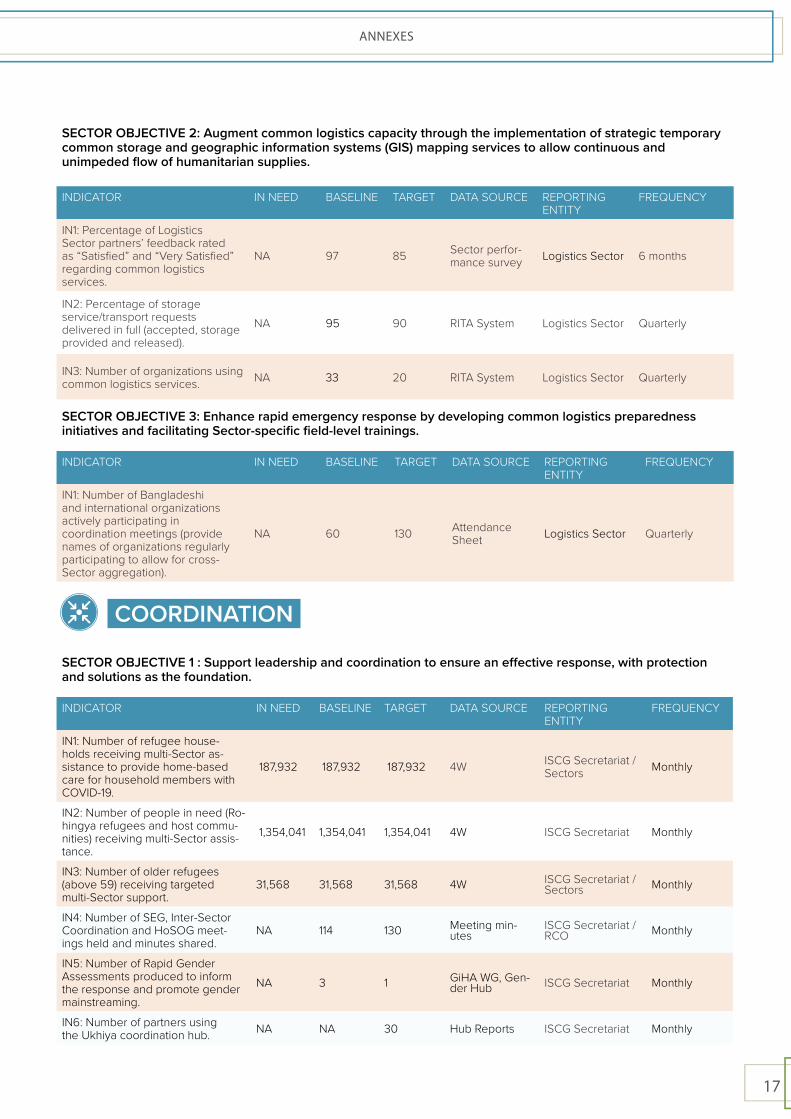
SECTOR OBJECTIVE 2: Augment common logistics capacity through the implementation of strategic temporary common storage and geographic information systems (GIS) mapping services to allow continuous and unimpeded flow of humanitarian supplies.
INDICATOR IN NEED BASELINE TARGET DATA SOURCE REPORTING ENTITY
FREQUENCY
IN1: Percentage of Logistics Sector partners’ feedback rated as “Satisfied” and “Very Satisfied” regarding common logistics services.
NA 97 85 Sector perfor-mance survey Logistics Sector 6 months
IN2: Percentage of storage service/transport requests delivered in full (accepted, storage provided and released).
NA 95 90 RITA System Logistics Sector Quarterly
IN3: Number of organizations using common logistics services. NA 33 20 RITA System Logistics Sector Quarterly
SECTOR OBJECTIVE 3: Enhance rapid emergency response by developing common logistics preparedness initiatives and facilitating Sector-specific field-level trainings.
INDICATOR IN NEED BASELINE TARGET DATA SOURCE REPORTING ENTITY
FREQUENCY
IN1: Number of Bangladeshi and international organizations actively participating in coordination meetings (provide names of organizations regularly participating to allow for cross-Sector aggregation).
NA 60 130 Attendance Sheet Logistics Sector Quarterly
COORDINATION
SECTOR OBJECTIVE 1 : Support leadership and coordination to ensure an effective response, with protection and solutions as the foundation.
INDICATOR IN NEED BASELINE TARGET DATA SOURCE REPORTING ENTITY
FREQUENCY
IN1: Number of refugee house-holds receiving multi-Sector as-sistance to provide home-based care for household members with COVID-19.
187,932 187,932 187,932 4W ISCG Secretariat / Sectors Monthly
IN2: Number of people in need (Ro-hingya refugees and host commu-nities) receiving multi-Sector assis-tance.
1,354,041 1,354,041 1,354,041 4W ISCG Secretariat Monthly
IN3: Number of older refugees (above 59) receiving targeted multi-Sector support.
31,568 31,568 31,568 4W ISCG Secretariat / Sectors Monthly
IN4: Number of SEG, Inter-Sector Coordination and HoSOG meet-ings held and minutes shared.
NA 114 130 Meeting min-utes
ISCG Secretariat / RCO Monthly
IN5: Number of Rapid Gender Assessments produced to inform the response and promote gender mainstreaming.
NA 3 1 GiHA WG, Gen-der Hub ISCG Secretariat Monthly
IN6: Number of partners using the Ukhiya coordination hub. NA NA 30 Hub Reports ISCG Secretariat Monthly
18
ANNEXES
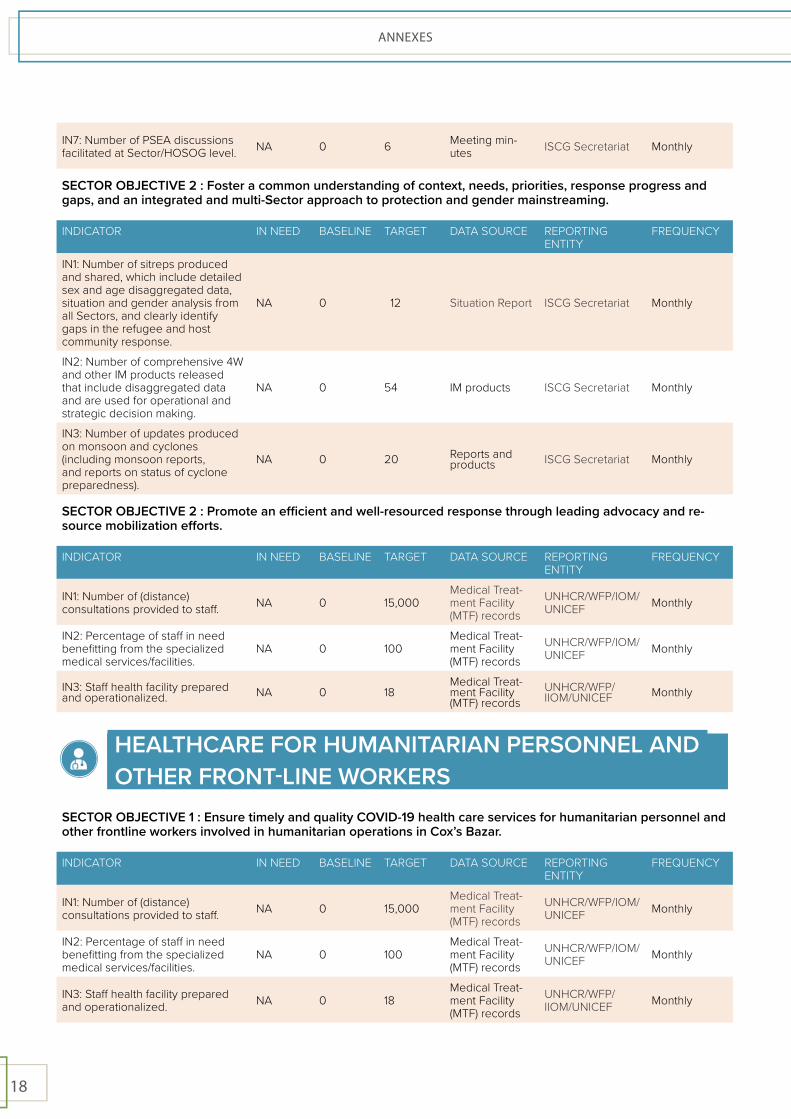
IN7: Number of PSEA discussions facilitated at Sector/HOSOG level. NA 0 6 Meeting min-
utes ISCG Secretariat Monthly
SECTOR OBJECTIVE 2 : Foster a common understanding of context, needs, priorities, response progress and gaps, and an integrated and multi-Sector approach to protection and gender mainstreaming.
INDICATOR IN NEED BASELINE TARGET DATA SOURCE REPORTING ENTITY
FREQUENCY
IN1: Number of sitreps produced and shared, which include detailed sex and age disaggregated data, situation and gender analysis from all Sectors, and clearly identify gaps in the refugee and host community response.
NA 0 12 Situation Report ISCG Secretariat Monthly
IN2: Number of comprehensive 4W and other IM products released that include disaggregated data and are used for operational and strategic decision making.
NA 0 54 IM products ISCG Secretariat Monthly
IN3: Number of updates produced on monsoon and cyclones (including monsoon reports, and reports on status of cyclone preparedness).
NA 0 20 Reports and products ISCG Secretariat Monthly
SECTOR OBJECTIVE 2 : Promote an efficient and well-resourced response through leading advocacy and re-source mobilization efforts.
INDICATOR IN NEED BASELINE TARGET DATA SOURCE REPORTING ENTITY
FREQUENCY
IN1: Number of (distance) consultations provided to staff. NA 0 15,000
Medical Treat-ment Facility (MTF) records
UNHCR/WFP/IOM/UNICEF Monthly
IN2: Percentage of staff in need benefitting from the specialized medical services/facilities.
NA 0 100 Medical Treat-ment Facility (MTF) records
UNHCR/WFP/IOM/UNICEF Monthly
IN3: Staff health facility prepared and operationalized. NA 0 18
Medical Treat-ment Facility (MTF) records
UNHCR/WFP/IIOM/UNICEF Monthly
HEALTHCARE FOR HUMANITARIAN PERSONNEL AND OTHER FRONT-LINE WORKERS
SECTOR OBJECTIVE 1 : Ensure timely and quality COVID-19 health care services for humanitarian personnel and other frontline workers involved in humanitarian operations in Cox’s Bazar.
INDICATOR IN NEED BASELINE TARGET DATA SOURCE REPORTING ENTITY
FREQUENCY
IN1: Number of (distance) consultations provided to staff. NA 0 15,000
Medical Treat-ment Facility (MTF) records
UNHCR/WFP/IOM/UNICEF Monthly
IN2: Percentage of staff in need benefitting from the specialized medical services/facilities.
NA 0 100 Medical Treat-ment Facility (MTF) records
UNHCR/WFP/IOM/UNICEF Monthly
IN3: Staff health facility prepared and operationalized. NA 0 18
Medical Treat-ment Facility (MTF) records
UNHCR/WFP/IIOM/UNICEF Monthly
19
ANNEXES
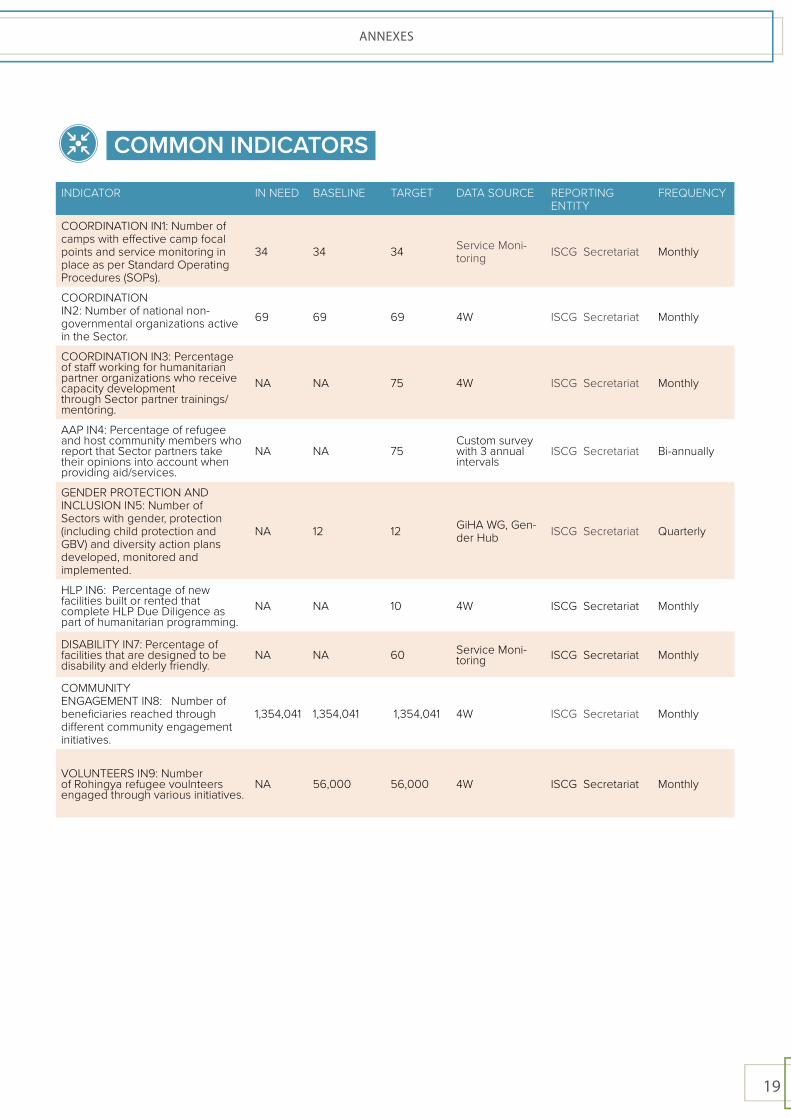
COMMON INDICATORS
INDICATOR IN NEED BASELINE TARGET DATA SOURCE REPORTING ENTITY
FREQUENCY
COORDINATION IN1: Number of camps with effective camp focal points and service monitoring in place as per Standard Operating Procedures (SOPs).
34 34 34 Service Moni-toring ISCG Secretariat Monthly
COORDINATION IN2: Number of national non-governmental organizations active in the Sector.
69 69 69 4W ISCG Secretariat Monthly
COORDINATION IN3: Percentage of staff working for humanitarian partner organizations who receive capacity development through Sector partner trainings/mentoring.
NA NA 75 4W ISCG Secretariat Monthly
AAP IN4: Percentage of refugee and host community members who report that Sector partners take their opinions into account when providing aid/services.
NA NA 75 Custom survey with 3 annual intervals
ISCG Secretariat Bi-annually
GENDER PROTECTION AND INCLUSION IN5: Number of Sectors with gender, protection (including child protection and GBV) and diversity action plans developed, monitored and implemented.
NA 12 12 GiHA WG, Gen-der Hub ISCG Secretariat Quarterly
HLP IN6: Percentage of new facilities built or rented that complete HLP Due Diligence as part of humanitarian programming.
NA NA 10 4W ISCG Secretariat Monthly
DISABILITY IN7: Percentage of facilities that are designed to be disability and elderly friendly.
NA NA 60 Service Moni-toring ISCG Secretariat Monthly
COMMUNITY ENGAGEMENT IN8: Number of beneficiaries reached through different community engagement initiatives.
1,354,041 1,354,041 1,354,041 4W ISCG Secretariat Monthly
VOLUNTEERS IN9: Number of Rohingya refugee voulnteers engaged through various initiatives.
NA 56,000 56,000 4W ISCG Secretariat Monthly
20
ANNEXES
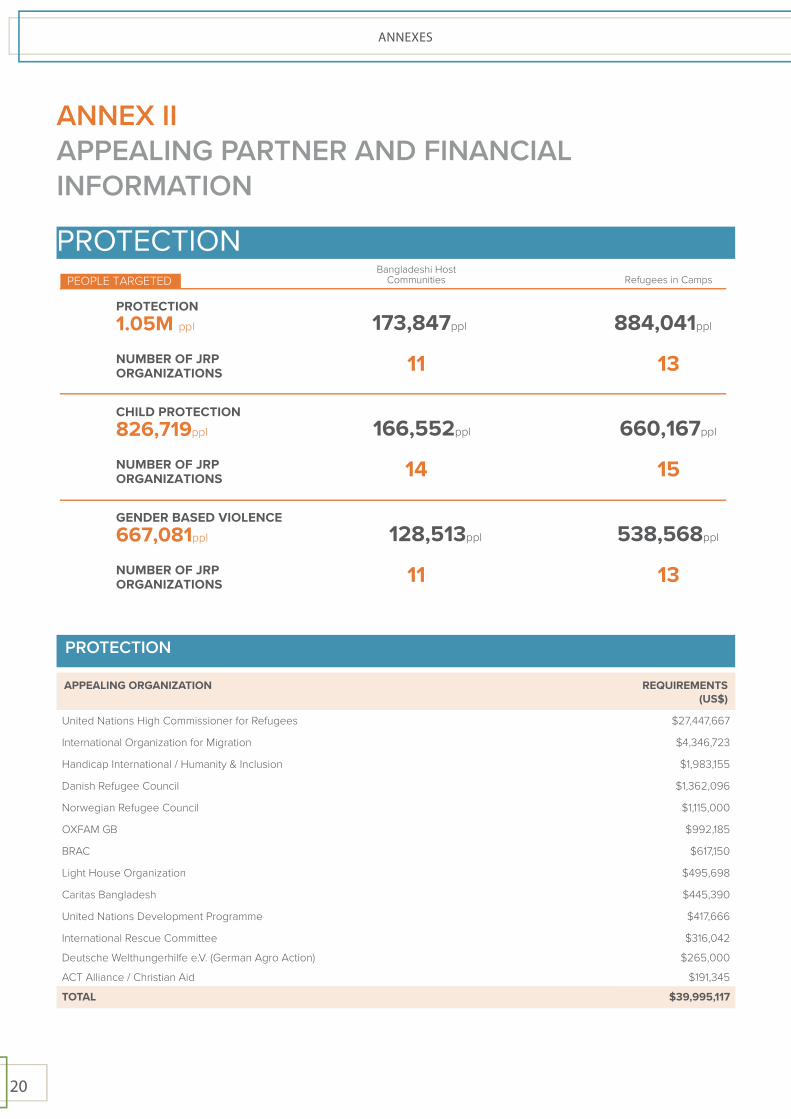
PROTECTION
PROTECTION
APPEALING ORGANIZATION REQUIREMENTS (US$)
United Nations High Commissioner for Refugees $27,447,667
International Organization for Migration $4,346,723
Handicap International / Humanity & Inclusion $1,983,155
Danish Refugee Council $1,362,096
Norwegian Refugee Council $1,115,000
OXFAM GB $992,185
BRAC $617,150
Light House Organization $495,698
Caritas Bangladesh $445,390
United Nations Development Programme $417,666
International Rescue Committee $316,042
Deutsche Welthungerhilfe e.V. (German Agro Action) $265,000
ACT Alliance / Christian Aid $191,345
TOTAL $39,995,117
PROTECTION1.05M ppl
11 13
PEOPLE TARGETED
NUMBER OF JRPORGANIZATIONS
173,847ppl
Bangladeshi HostCommunities Refugees in Camps
884,041ppl
CHILD PROTECTION826,719ppl
14 15NUMBER OF JRPORGANIZATIONS
166,552ppl 660,167ppl
GENDER BASED VIOLENCE667,081ppl
11 13NUMBER OF JRPORGANIZATIONS
128,513ppl 538,568ppl
ANNEX IIAPPEALING PARTNER AND FINANCIAL INFORMATION
21
ANNEXES
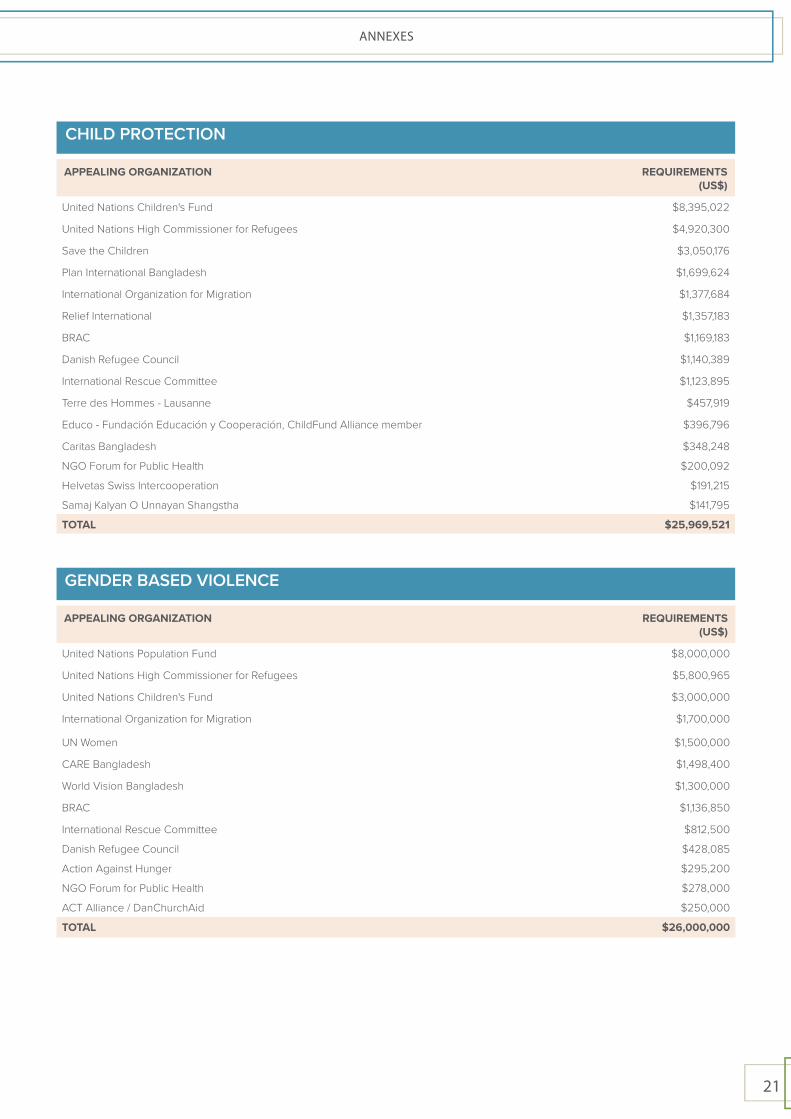
CHILD PROTECTION
APPEALING ORGANIZATION REQUIREMENTS (US$)
United Nations Children's Fund $8,395,022
United Nations High Commissioner for Refugees $4,920,300
Save the Children $3,050,176
Plan International Bangladesh $1,699,624
International Organization for Migration $1,377,684
Relief International $1,357,183
BRAC $1,169,183
Danish Refugee Council $1,140,389
International Rescue Committee $1,123,895
Terre des Hommes - Lausanne $457,919
Educo - Fundación Educación y Cooperación, ChildFund Alliance member $396,796
Caritas Bangladesh $348,248
NGO Forum for Public Health $200,092
Helvetas Swiss Intercooperation $191,215
Samaj Kalyan O Unnayan Shangstha $141,795
TOTAL $25,969,521
GENDER BASED VIOLENCE
APPEALING ORGANIZATION REQUIREMENTS (US$)
United Nations Population Fund $8,000,000
United Nations High Commissioner for Refugees $5,800,965
United Nations Children's Fund $3,000,000
International Organization for Migration $1,700,000
UN Women $1,500,000
CARE Bangladesh $1,498,400
World Vision Bangladesh $1,300,000
BRAC $1,136,850
International Rescue Committee $812,500
Danish Refugee Council $428,085
Action Against Hunger $295,200
NGO Forum for Public Health $278,000
ACT Alliance / DanChurchAid $250,000
TOTAL $26,000,000
22
ANNEXES
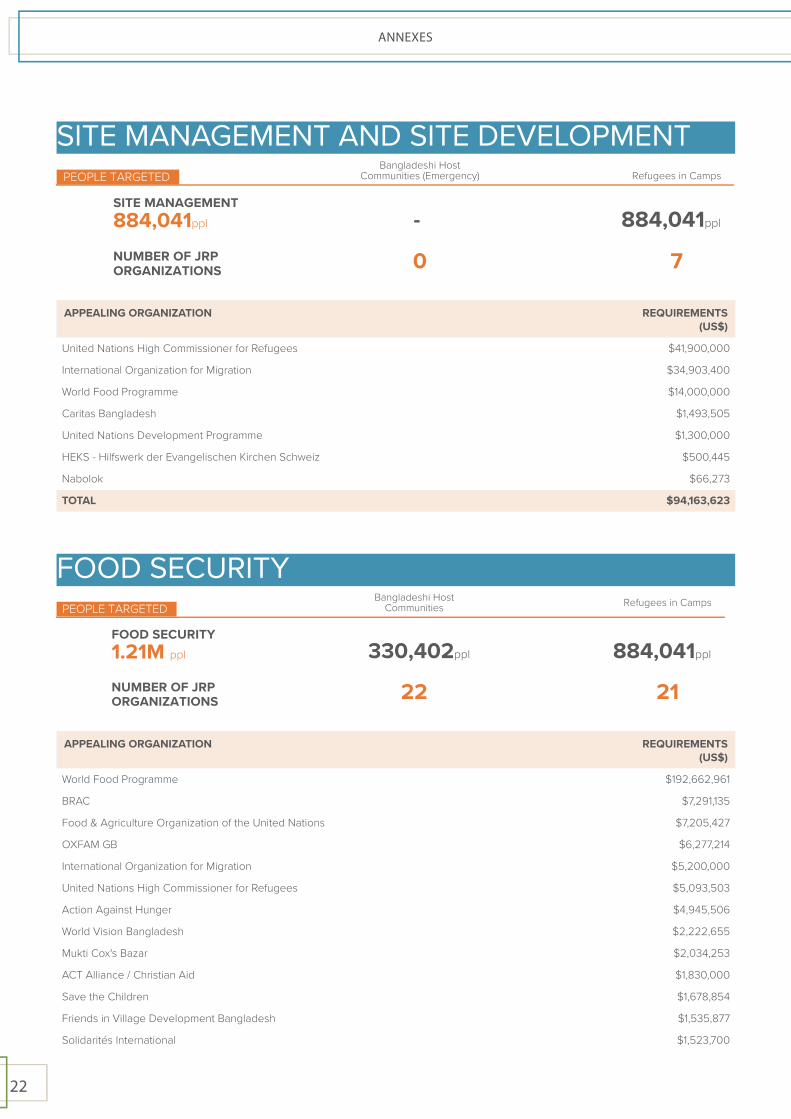
SITE MANAGEMENT AND SITE DEVELOPMENT
APPEALING ORGANIZATION REQUIREMENTS (US$)
United Nations High Commissioner for Refugees $41,900,000
International Organization for Migration $34,903,400
World Food Programme $14,000,000
Caritas Bangladesh $1,493,505
United Nations Development Programme $1,300,000
HEKS - Hilfswerk der Evangelischen Kirchen Schweiz $500,445
Nabolok $66,273
TOTAL $94,163,623
FOOD SECURITY
FOOD SECURITY1.21M ppl
22 21
PEOPLE TARGETED
NUMBER OF JRPORGANIZATIONS
330,402ppl
Bangladeshi HostCommunities Refugees in Camps
884,041ppl
APPEALING ORGANIZATION REQUIREMENTS (US$)
World Food Programme $192,662,961
BRAC $7,291,135
Food & Agriculture Organization of the United Nations $7,205,427
OXFAM GB $6,277,214
International Organization for Migration $5,200,000
United Nations High Commissioner for Refugees $5,093,503
Action Against Hunger $4,945,506
World Vision Bangladesh $2,222,655
Mukti Cox's Bazar $2,034,253
ACT Alliance / Christian Aid $1,830,000
Save the Children $1,678,854
Friends in Village Development Bangladesh $1,535,877
Solidarités International $1,523,700
SITE MANAGEMENT884,041ppl
0 7
PEOPLE TARGETED
NUMBER OF JRPORGANIZATIONS
-
Bangladeshi HostCommunities (Emergency) Refugees in Camps
884,041ppl

23
ANNEXES
APPEALING ORGANIZATION REQUIREMENTS (US$)
International Rescue Committee $1,185,868
Helvetas Swiss Intercooperation $1,107,120
Relief International $1,066,652
Danish Refugee Council $876,616
COAST Trust $815,000
UN Women $782,328
Faith in Action $686,000
ACT Alliance / DanChurchAid $670,938
Caritas Bangladesh $352,077
Hilfswerk der Evangelischen Kirchen Schweiz $165,693
TOTAL $247,209,377
EDUCATION
EDUCATION450,974ppl
16 26
PEOPLE TARGETED
NUMBER OF JRPORGANIZATIONS
60,051ppl
Bangladeshi HostCommunities Refugees in Camps
390,923ppl
APPEALING ORGANIZATION REQUIREMENTS (US$)
United Nations Children's Fund $44,444,895
United Nations High Commissioner for Refugees $15,039,470
World Food Programme $7,500,000
Plan International Bangladesh $3,999,998
BRAC $3,000,000
Save the Children $2,450,000
United Nations Population Fund $2,163,000
Norwegian Refugee Council $1,500,000
Educo - Fundación Educación y Cooperación, ChildFund Alliance member $729,994
International Rescue Committee $600,000
Handicap International / Humanity & Inclusion $500,000
ACT Alliance / DanChurchAid $373,915
Jaago Foundation $352,566
Safollomoy Samaj Kollyan Unnayan Sangstha $339,725
Voluntary Service Overseas $308,294
UN Women $200,000
Samaj Kalyan O Unnayan Shangstha $199,450
Mukti Cox's Bazar $198,531
Friends in Village Development Bangladesh $186,304

24
ANNEXES
APPEALING ORGANIZATION REQUIREMENTS (US$)
Prantic Unnayan Society $183,981
Allama Fazlullah Foundation $182,717
Unite Theatre for Social Action $170,929
Association For Mass Advancement Network $150,000
Reaching People in Need $127,000
Integrated Social Development Effort Bangladesh $52,500
Caritas Bangladesh $44,440
TOTAL $84,997,709
HEALTH
APPEALING ORGANIZATION REQUIREMENTS (US$)
United Nations High Commissioner for Refugees $30,642,029
United Nations Children's Fund $19,626,880
International Organization for Migration $19,239,456
World Health Organization $16,000,000
United Nations Population Fund $15,768,625
Save the Children $5,572,300
Friendship $5,227,000
International Rescue Committee $4,464,010
Relief International $4,172,716
BRAC $3,779,347
Handicap International / Humanity & Inclusion $3,088,280
CARE Bangladesh $1,050,598
Community Development Association $894,715
Médecins du Monde $762,546
Peace Winds Japan $715,400
Health and Education for All $515,342
Food for the Hungry International $500,000
Terre des Hommes - Lausanne $499,650
Green Hill $444,500
Light House Organization $428,276
MedGlobal $400,000
HEALTH1.36M ppl
17 22
PEOPLE TARGETED
NUMBER OF JRPORGANIZATIONS
472,003ppl
Bangladeshi HostCommunities Refugees in Camps
884,041ppl

25
ANNEXES
APPEALING ORGANIZATION REQUIREMENTS (US$)
Action Against Hunger $366,849
Reaching People in Need $310,179
ACT Alliance / Christian Aid $279,459
ORBIS International $211,967
TOTAL $134,960,124
NUTRITION
NUTRITION415,570ppl
4 7
PEOPLE TARGETED
NUMBER OF JRPORGANIZATIONS
121,400ppl
Bangladeshi HostCommunities Refugees in Camps
294,170ppl
APPEALING ORGANIZATION REQUIREMENTS (US$)
World Food Programme $18,446,420
United Nations Children's Fund $12,869,100
United Nations High Commissioner for Refugees $6,500,000
Concern Worldwide $2,349,105
Action Against Hunger $1,700,000
BRAC $278,467
Save the Children $219,668
TOTAL $42,362,760
SHELTER AND NON FOOD ITEMS
APPEALING ORGANIZATION REQUIREMENTS (US$)
United Nations High Commissioner for Refugees $47,250,000
International Organization for Migration $45,979,507
BRAC $7,609,163
Caritas Bangladesh $5,009,441
SHELTER & NFI1.16M ppl
7 14
PEOPLE TARGETED
NUMBER OF JRPORGANIZATIONS
281,831ppl
Bangladeshi HostCommunities Refugees in Camps
884,041ppl
26
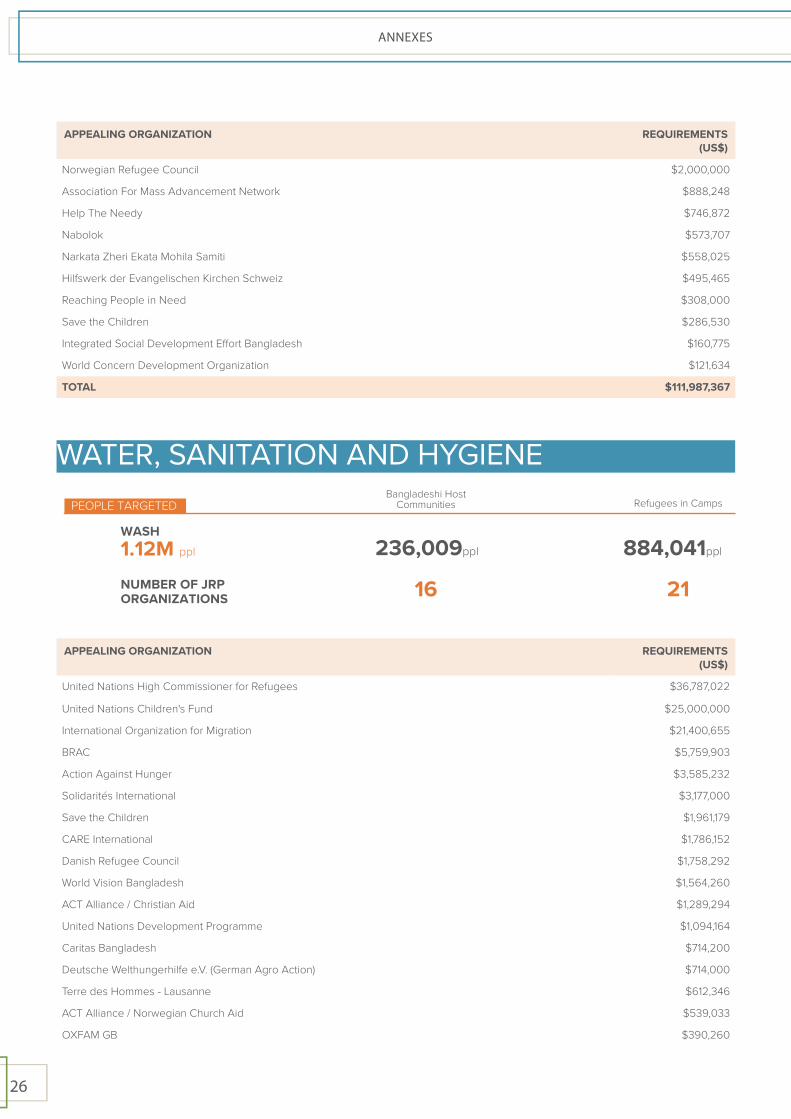
ANNEXES
APPEALING ORGANIZATION REQUIREMENTS (US$)
Norwegian Refugee Council $2,000,000
Association For Mass Advancement Network $888,248
Help The Needy $746,872
Nabolok $573,707
Narkata Zheri Ekata Mohila Samiti $558,025
Hilfswerk der Evangelischen Kirchen Schweiz $495,465
Reaching People in Need $308,000
Save the Children $286,530
Integrated Social Development Effort Bangladesh $160,775
World Concern Development Organization $121,634
TOTAL $111,987,367
WATER, SANITATION AND HYGIENE
WASH1.12M ppl
16 21
PEOPLE TARGETED
NUMBER OF JRPORGANIZATIONS
236,009ppl
Bangladeshi HostCommunities Refugees in Camps
884,041ppl
APPEALING ORGANIZATION REQUIREMENTS (US$)
United Nations High Commissioner for Refugees $36,787,022
United Nations Children's Fund $25,000,000
International Organization for Migration $21,400,655
BRAC $5,759,903
Action Against Hunger $3,585,232
Solidarités International $3,177,000
Save the Children $1,961,179
CARE International $1,786,152
Danish Refugee Council $1,758,292
World Vision Bangladesh $1,564,260
ACT Alliance / Christian Aid $1,289,294
United Nations Development Programme $1,094,164
Caritas Bangladesh $714,200
Deutsche Welthungerhilfe e.V. (German Agro Action) $714,000
Terre des Hommes - Lausanne $612,346
ACT Alliance / Norwegian Church Aid $539,033
OXFAM GB $390,260

27
ANNEXES
APPEALING ORGANIZATION REQUIREMENTS (US$)
Hilfswerk der Evangelischen Kirchen Schweiz $385,897
Association for Aid and Relief Japan $346,500
Nabolok $288,004
TEARFUND $287,607
Reaching People in Need $259,000
TOTAL $109,700,000
COMMUNICATIONS WITH COMMUNITIES
CWC1.13M ppl
9 9
PEOPLE TARGETED
NUMBER OF JRPORGANIZATIONS
402,438ppl
Bangladeshi HostCommunities Refugees in Camps
728,864ppl
APPEALING ORGANIZATION REQUIREMENTS (US$)
United Nations Children's Fund $2,597,516
International Organization for Migration $2,307,238
Action Against Hunger $2,041,102
International Rescue Committee $1,206,737
BRAC $965,811
Hilfswerk der Evangelischen Kirchen Schweiz $306,359
Association For Mass Advancement Network $164,550
OXFAM GB $155,576
ACT Alliance / Christian Aid $148,000
Rehabilitation Centre for Prostitutes And Rootless Children $106,790
TOTAL $9,999,679
EMERGENCY TELECOMMUNICATIONSAPPEALING ORGANIZATION REQUIREMENTS
(US$)
World Food Programme $2,500,000
TOTAL $2,500,000
28
ANNEXES
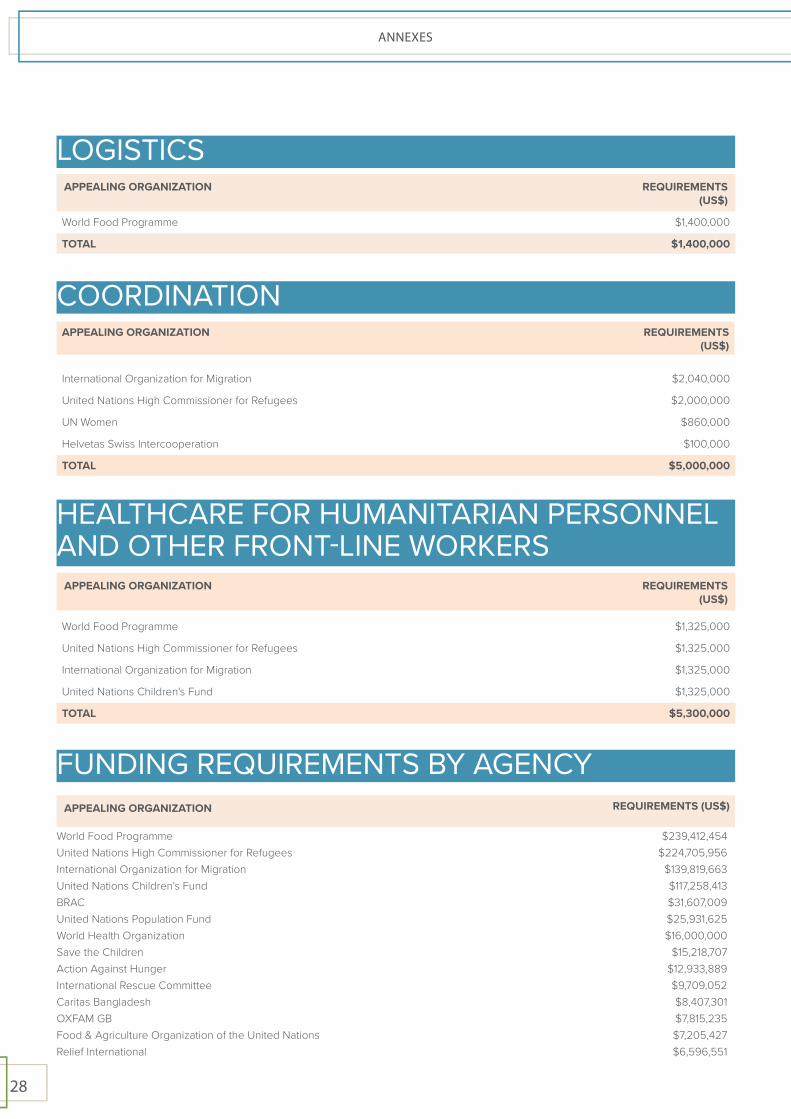
LOGISTICSAPPEALING ORGANIZATION REQUIREMENTS
(US$)
World Food Programme $1,400,000
TOTAL $1,400,000
COORDINATIONAPPEALING ORGANIZATION REQUIREMENTS
(US$)
International Organization for Migration $2,040,000
United Nations High Commissioner for Refugees $2,000,000
UN Women $860,000
Helvetas Swiss Intercooperation $100,000
TOTAL $5,000,000
HEALTHCARE FOR HUMANITARIAN PERSONNEL AND OTHER FRONT-LINE WORKERS
APPEALING ORGANIZATION REQUIREMENTS (US$)
World Food Programme $1,325,000
United Nations High Commissioner for Refugees $1,325,000
International Organization for Migration $1,325,000
United Nations Children's Fund $1,325,000
TOTAL $5,300,000
FUNDING REQUIREMENTS BY AGENCYAPPEALING ORGANIZATION REQUIREMENTS (US$)
World Food Programme $239,412,454 United Nations High Commissioner for Refugees $224,705,956 International Organization for Migration $139,819,663 United Nations Children's Fund $117,258,413 BRAC $31,607,009 United Nations Population Fund $25,931,625 World Health Organization $16,000,000 Save the Children $15,218,707 Action Against Hunger $12,933,889 International Rescue Committee $9,709,052 Caritas Bangladesh $8,407,301 OXFAM GB $7,815,235 Food & Agriculture Organization of the United Nations $7,205,427 Relief International $6,596,551
29
ANNEXES
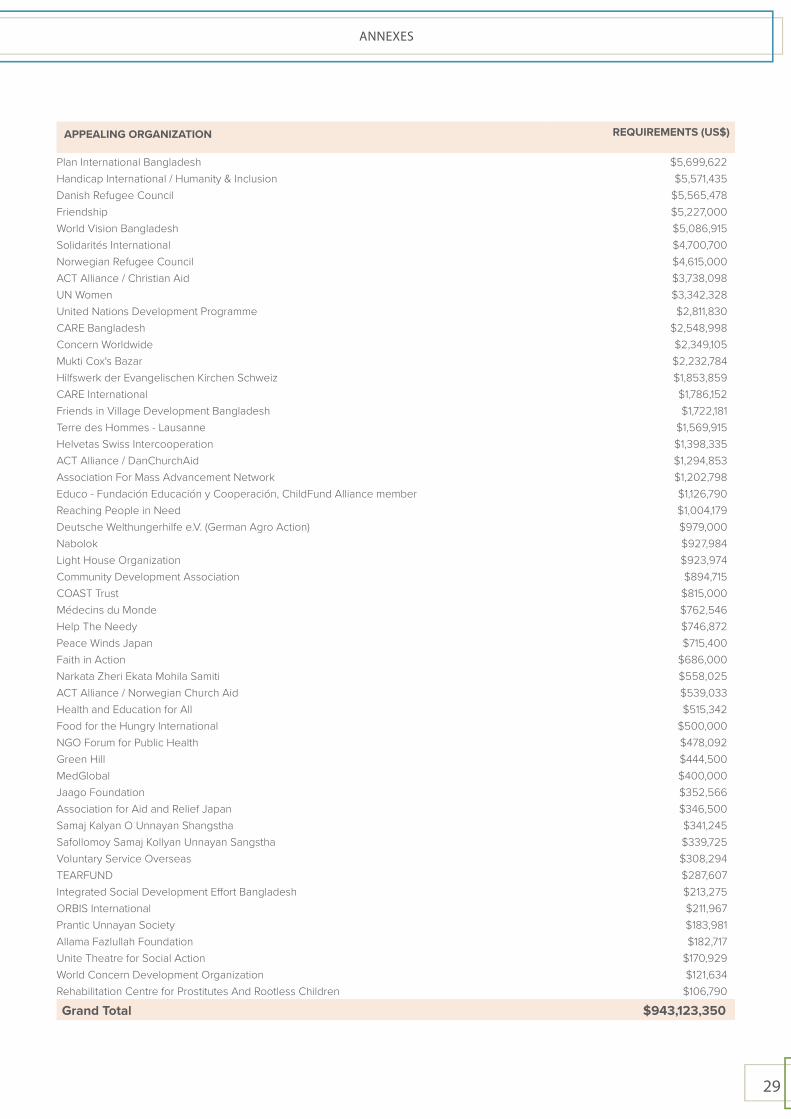
APPEALING ORGANIZATION REQUIREMENTS (US$)
Plan International Bangladesh $5,699,622 Handicap International / Humanity & Inclusion $5,571,435 Danish Refugee Council $5,565,478 Friendship $5,227,000 World Vision Bangladesh $5,086,915 Solidarités International $4,700,700 Norwegian Refugee Council $4,615,000 ACT Alliance / Christian Aid $3,738,098 UN Women $3,342,328 United Nations Development Programme $2,811,830 CARE Bangladesh $2,548,998 Concern Worldwide $2,349,105 Mukti Cox's Bazar $2,232,784 Hilfswerk der Evangelischen Kirchen Schweiz $1,853,859 CARE International $1,786,152 Friends in Village Development Bangladesh $1,722,181 Terre des Hommes - Lausanne $1,569,915 Helvetas Swiss Intercooperation $1,398,335 ACT Alliance / DanChurchAid $1,294,853 Association For Mass Advancement Network $1,202,798 Educo - Fundación Educación y Cooperación, ChildFund Alliance member $1,126,790 Reaching People in Need $1,004,179 Deutsche Welthungerhilfe e.V. (German Agro Action) $979,000 Nabolok $927,984 Light House Organization $923,974 Community Development Association $894,715 COAST Trust $815,000 Médecins du Monde $762,546 Help The Needy $746,872 Peace Winds Japan $715,400 Faith in Action $686,000 Narkata Zheri Ekata Mohila Samiti $558,025 ACT Alliance / Norwegian Church Aid $539,033 Health and Education for All $515,342 Food for the Hungry International $500,000 NGO Forum for Public Health $478,092 Green Hill $444,500 MedGlobal $400,000 Jaago Foundation $352,566 Association for Aid and Relief Japan $346,500 Samaj Kalyan O Unnayan Shangstha $341,245 Safollomoy Samaj Kollyan Unnayan Sangstha $339,725 Voluntary Service Overseas $308,294 TEARFUND $287,607 Integrated Social Development Effort Bangladesh $213,275 ORBIS International $211,967 Prantic Unnayan Society $183,981 Allama Fazlullah Foundation $182,717 Unite Theatre for Social Action $170,929 World Concern Development Organization $121,634 Rehabilitation Centre for Prostitutes And Rootless Children $106,790
Grand Total $943,123,350

www.humanitarianresponse.info/en/operations/bangladesh
www.facebook.com/RohingyaResponseISCG
www.twitter.com/Rohingya_ISCG

31
ANNEXES
www.humanitarianresponse.info/en/operations/bangladesh
www.facebook.com/RohingyaResponseISCG
www.twitter.com/Rohingya_ISCG


