15


Annexure - I
(Refer to Para 3.2.1)Project-wise coal requirement and linkage thereof
Unit (Capacity)Coal Requirement as per DPR
(MMtPA)Source as envisaged in
DPR Allotted Coal Block Linkage with CIL FSA Quantity (MMtPA)
RTPS U # 1 & 2 (2 x 600)
Although the coal quantity as per DPR was 7.23, the same was reduced to 3.89 considering the grade of coal as per FSA.
Barjora (North), Khagra-Joydev, Pandaveshwar, Samla mines & Mugma blocks of ECL.
SaharpurJamarpani (Not developed so far)
RTPS-I – BCCL (August 2013) U# 1 =1.76
RTPS-II – CCL (September 2013) U# 2 = 2.133
KTPS U # 1 & 2 (2 x 500) 4.69
Sheregara/ Ganeshpur blocks in North Karanpura in Central Coalfields limited (CCL).
- MCL (December 2012) U# 1 & 2 =4.62
DSTPS U # 1 & 2 (2 x 500) 3.9 Not stated in DPR. -
DSTPS I - CCL (September 2013) U# 1=1.975
DSTPS II - BCCL (July 2013) U# 2=1.756
CTPS U # 7 & 8 (2 x 250) 2.19
Existing sources of BCCL & CCL coal fields and middlings from nearby washeries at Dugdha.
Gondulpara (not developed so far) CCL (December 2012)
U# 7=1.03
U# 8 = FSA not done
BTPS ‘A’ (1 x 500) 2.03 CCL - CCL (September 2013) 1.97
MTPS U # 7 & 8 (2 x 500) 3.85 Barjora (North), Khagra-
Joydev & Kasta (East).
Barjora (North) [Production started since March 2011- Average receipt of coal- 1.7 MMTPA], Khagra-Joydev [not developed so far], [Kasta (East) surrendered]
Short term MoU (October 2011) with ECL for 0.97 MMTPA FSA not done.
MTPS U # 5 & 6 (2 x 250) 2.08 Mines of ECL and
BCCL
Combined linkage for MTPS Units # 1 to 6 with ECL, BCCL and MCL for a quantity of 5.6 MMt. Considering capacity of the units FSA quantity arised at 2.09 MMt(5.6/1340MW X 500 MW)
2.09
Total (MMtPA) 22.63 17.334
35

Annexure-II (Refer Para No.- 3.2.2)
Statement showing delay in tendering and execution of the contracts as on March 2014
Plant/Stati
on Name of
the package
Name of the
contrac-tor
Mode of Tendering
Date of Award
From NIT to Tender opening(Days)
From Tender opening
to Techno commer-
cial approval & price
bid opening (Days)
Total time taken from
NIT to approval of
techno commercial evaluation
Delay in techno
commercial
evalua-tion
(Days)
From Techno
commercial approval &
price bid opening to approval of
CA for placement
of order (Days)
Total time taken from NIT to
approval for
placement of order (Days)
Delay in tenderingfrom NIT
(Days)
Awardedprice (Rs in
Crore)
Contractual Time for
completion (in
Months)
Scheduled date of
completion
Actual date of completion
Delay in completion
from scheduled to actual (in
months)
A B C D E F G H=F+G I=H-133 J K=F+G+J L=K-161 M N O P Q R S T U
Norms as per Works & Procurement Manual of DVC -
49 days 84 days 133 days 28 days 161 days Unit # 1
Unit # 2
Unit # 1
Unit # 2
Unit # 1 Unit # 2 Unit #
1 Unit #
2
MTPS PHII (2x500)
MPP BHEL Nomination January 2007
Negotiation 3538 39 42 March2010
June 2010
August2011
August 2012 17 26
CHP
Elecon Engineering Company Ltd.
ICB July 2007 66 22 88 -45 34 122 -39 378.51 26 September 2009 Pending 54
PWS Larsen & Toubro Ltd.
ICB January 2008 49 30 79 -54 65 144 -17 93.23 20 September 2009 May 2012 32.5
Railways RITES Nomination December2012
Nomination/Single Tender 158.55 30 June 2015 Pending NA
KTPS (2X500)
MPP BHEL ICB June 2007 64 Single bid and finalised in consultation with CEA 3280.52 35 38 June
2010 Septem-ber 2010
July 2013 Pending 37 42
CHP Larsen & Toubro Ltd.
ICB March 2008 77 53 130 -3 32 162 1 329.88 27 30 June
2010 Septem-ber 2010
April 2013
June 2013 34 33
PWS Kirloskar Brothers Ltd.
ICB April 2008 85 43 128 -5 55 183 22 166.77 22 February 2010 Pending 49
Railways RITES Nomination October 2008
Nomination/Single Tender 188.05 30 April 2011 Pending 35
36
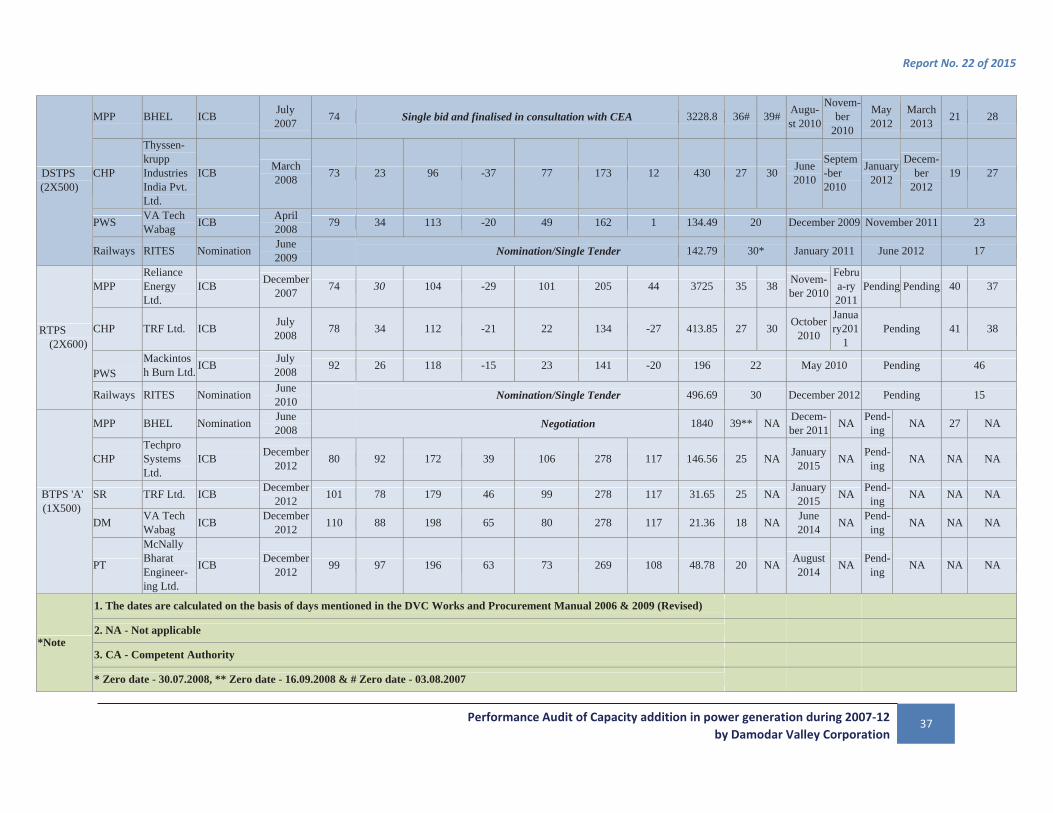
DSTPS (2X500)
MPP BHEL ICB July 2007 74 Single bid and finalised in consultation with CEA 3228.8 36# 39# Augu-
st 2010
Novem-ber
2010
May 2012
March 2013 21 28
CHP
Thyssen-krupp Industries India Pvt. Ltd.
ICB March 2008 73 23 96 -37 77 173 12 430 27 30 June
2010
Septem-ber 2010
January2012
Decem-ber
2012 19 27
PWS VA Tech Wabag ICB April
2008 79 34 113 -20 49 162 1 134.49 20 December 2009 November 2011 23
Railways RITES Nomination June 2009
Nomination/Single Tender 142.79 30* January 2011 June 2012 17
RTPS (2X600)
MPP Reliance Energy Ltd.
ICB December2007 74 30 104 -29 101 205 44 3725 35 38 Novem-
ber 2010
Februa-ry 2011
Pending Pending 40 37
CHP TRF Ltd. ICB July 2008 78 34 112 -21 22 134 -27 413.85 27 30 October
2010
January201
1 Pending 41 38
PWS
Mackintosh Burn Ltd. ICB July
2008 92 26 118 -15 23 141 -20 196 22 May 2010 Pending 46
Railways RITES Nomination June 2010
Nomination/Single Tender 496.69 30 December 2012 Pending 15
BTPS 'A' (1X500)
MPP BHEL Nomination June 2008
Negotiation 1840 39** NA Decem-ber 2011 NA Pend-
ing NA 27 NA
CHP Techpro Systems Ltd.
ICB December2012 80 92 172 39 106 278 117 146.56 25 NA January
2015 NA Pend-ing NA NA NA
SR TRF Ltd. ICB December2012 101 78 179 46 99 278 117 31.65 25 NA January
2015 NA Pend-ing NA NA NA
DM VA Tech Wabag ICB December
2012 110 88 198 65 80 278 117 21.36 18 NA June 2014 NA Pend-
ing NA NA NA
PT
McNally Bharat Engineer-ing Ltd.
ICB December2012 99 97 196 63 73 269 108 48.78 20 NA August
2014 NA Pend-ing NA NA NA
*Note
1. The dates are calculated on the basis of days mentioned in the DVC Works and Procurement Manual 2006 & 2009 (Revised)
2. NA - Not applicable
3. CA - Competent Authority
* Zero date - 30.07.2008, ** Zero date - 16.09.2008 & # Zero date - 03.08.2007
37

Annexure III (Refer to Para 3.2.3)
Delay in commissioning of projects in comparison to CERC norms as well as Corporation's own target as on March 2014
Name of project Capacity (MW)
Greenfield/Extension/
Replacement Projects
Investment Approval
Time frame
COD as per
CERCRegulations
(in months)
ScheduledCOD as per
CERCRegulations
ScheduledCOD Fixed
by theCorporation
Delay from
CERC COD to
ScheduledCOD
Actual COD
AnticipatedCOD
Delays from
scheduledCOD (in months)
Delays from scheduled COD as
per CERCRegulation (in
months)
A B C D E F = (C + D) G H = (G - F) I J = (I -
G) K = (I - F)
10th plan spill over
MTPS U#5 250 Extension August
2005 31 March 2008 January 2007 0 February
2008 13 -1
MTPS U#6 250 Extension August
2005 35 July 2008 March 2007 0 September2008 18 2
CTPS U#7 250 Extension August
2005 31 March 2008 January 2007 0 November
2011 58 44
CTPS U#8 250 Extension August
2005 35 July 2008 March 2007 0 July 2011 52 36
11th plan projects
MTPS U#7 500 Extension August
2006 42 February 2010 March 2010 0 August
2011 17 18
MTPS U#8 500 Extension August
2006 48 August 2010 June 2010 0 August
2012 26 24
DSTPS U#1 500 Greenfield April
2007 44 December 2010
August 2010 0 May 2012 21 17
DSTPS U#2 500 Greenfield April
2007 50 June 2011 November 2010 0 March
2013 28 21
KTPS U#1 500 Greenfield August
2006 44 April 2010 June 2010 2 Months July 2013 37 41
KTPS U#2 500 Greenfield August
2006 50 October 2010
September 2010 0 June 2014 45 44
RTPS PH-I U#1 600 Greenfield April
2007 44 December 2010
November 2010 0 July 2014 44 43
RTPS PH-I U#2 600 Greenfield April
2007 50 June 2011 February 2011 0 March 2015 49 45
BTPS 'A' 500 Replacement August 2006 42 February
2010 December
2011 22 Months October 2014 34 56
38

Annexure-IV
(Refer Para No.-3.2.2) Statement of cost estimation and awarded value of the contracts
Plant/ Station
Name of the package
Name of the contractor
DepartmentalEstimate (` in
Crore)
Awardedprice (` in
Crore)
Deviation from
Departmental estimate (` in
Crore)
Deviation from
Departmental estimate (%)
Reasons for delay in tendering
Reasons for variation in Departmental estimate and awarded price
A B C D E F G H I MTPS PH-II
(2x500) MPP BHEL 3538.00 CHP Elecon
Engineering Company Ltd.
320.00 378.51 58.51 18.28 No Delay Reduced completion period, and evaluated price is not as per fair price and evaluated price was not considered
properly. PWS Larsen &
Toubro Ltd. 90.00 93.23 3.23 3.59 No Delay No reason for variation
Railways RITES 158.55 KTPS (2X500)
MPP BHEL 3464.00 3280.52 -183.48 -5.30 Single bid in consultancy with CEA CHP Larsen &
Toubro Ltd. 266.31 329.88 63.57 23.87 No Delay Linked with commonwealth games and re-tendering takes
2-3 months extra. PWS
Kirloskar Brothers Ltd.
125.70 166.77 41.07 32.67 The quote price is higher than estimated cost of the qualified bidders hence, snap bid was called for
and delayed the process.
The quoted price was higher than estimated cost of the qualified bidders hence, snap bid was called for and delayed the process. To maintain the stringent time
scheduled, and probable time and cost overrun due to sharp rise in price.
Railways RITES 188.05 DSTPS (2X500)
MPP BHEL 3440.00 3228.80 -211.20 -6.14 In consultancy with CEA Single bid in consultancy with CEA CHP
Thyssenkrupp Industries India Pvt. Ltd.
295.53 430.00 134.47 45.50 Extension of bid submission date
Offer price of L1 was 66% higher than the estimated cost, then snap bid was asked from the bidders during snap bid the L1 price was 46.17%. Finally the work was awarded
to L1 with negotiated price of 45.50 % higher than estimated cost. Reasons for higher quoted price accepted were re-tendering will hamper the time schedule of the
COD, the cost of borrowed earth of Rs 7.5 crore was not included in the estimate, steel price was hiked around 25-
30 % during last 3 months. PWS VA Tech
Wabag 145.22 134.49 -10.73 -7.39 No Delay Quoted price was compared with MTPS PH-II. No
reasons mentioned Railways RITES 142.79
39
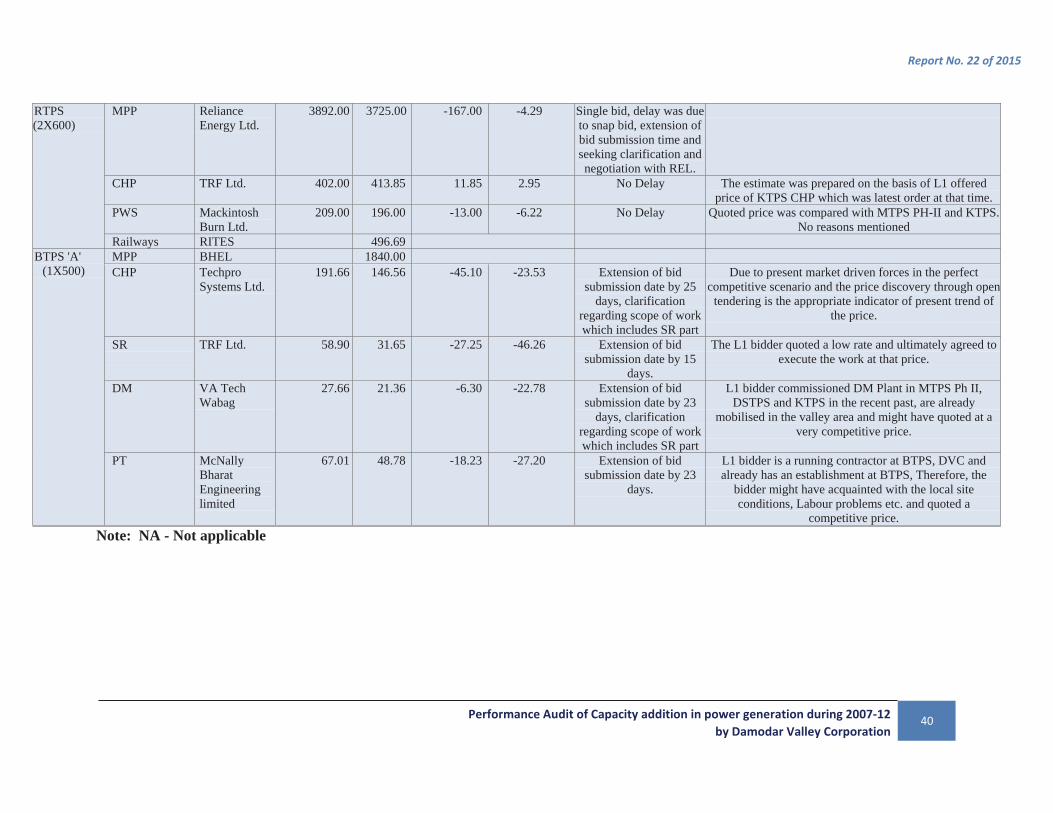
Note: NA - Not applicable
RTPS (2X600)
MPP Reliance Energy Ltd.
3892.00 3725.00 -167.00 -4.29 Single bid, delay was due to snap bid, extension of bid submission time and seeking clarification and negotiation with REL.
CHP TRF Ltd. 402.00 413.85 11.85 2.95 No Delay The estimate was prepared on the basis of L1 offered price of KTPS CHP which was latest order at that time.
PWS Mackintosh Burn Ltd.
209.00 196.00 -13.00 -6.22 No Delay Quoted price was compared with MTPS PH-II and KTPS. No reasons mentioned
Railways RITES 496.69 BTPS 'A'
(1X500) MPP BHEL 1840.00 CHP Techpro
Systems Ltd. 191.66 146.56 -45.10 -23.53 Extension of bid
submission date by 25 days, clarification
regarding scope of work which includes SR part
Due to present market driven forces in the perfect competitive scenario and the price discovery through open
tendering is the appropriate indicator of present trend of the price.
SR
TRF Ltd. 58.90 31.65 -27.25 -46.26 Extension of bid submission date by 15
days.
The L1 bidder quoted a low rate and ultimately agreed to execute the work at that price.
DM VA Tech Wabag
27.66 21.36 -6.30 -22.78 Extension of bid submission date by 23
days, clarification regarding scope of work which includes SR part
L1 bidder commissioned DM Plant in MTPS Ph II, DSTPS and KTPS in the recent past, are already
mobilised in the valley area and might have quoted at a very competitive price.
PT McNally Bharat Engineering limited
67.01 48.78 -18.23 -27.20 Extension of bid submission date by 23
days.
L1 bidder is a running contractor at BTPS, DVC and already has an establishment at BTPS, Therefore, the
bidder might have acquainted with the local site conditions, Labour problems etc. and quoted a
competitive price.
40

Annexure- V(Refer para no-3.2.2)
Statement showing the Delay analysis by the management
Plant/station Name of
the package
Name of the Contractor Whether committee formed for
Delay analysis
Whether the committee submitted
Delay analysis report
Action taken on the Delay
analysis report
Contractual Time for
completion (in
Months)
Scheduled date of completion
Actual date of completion
Delay in completion from scheduled to actual/as on March
2014 (in months)
A B C D E F G H I J K L M N
Unit # 1
Unit # 2 Unit # 1 Unit # 2 Unit # 1 Unit # 2 Unit # 1 Unit # 2
MTPS PHII (2x500)
MPP BHEL YES Submitted NA 39 42 March 2010 June 2010 August2011
August2012 17 26
CHP Elecon Engineering Company Ltd. YES Report is under
process NA 26 September 2009 Pending 54
PWS Larsen & Toubro Ltd. YES Approved LD not imposed 20 September 2009 May 2012 32.5
KTPS (2X500)
MPP BHEL YES Submitted NA 35 38 June 2010 September2010 July 2013 Pending 37 42
CHP Larsen & Toubro Ltd. YES Final Report is under process NA 27 30 June 2010 September
2010April2013 June2013 34 33
PWS Kirloskar Brothers Ltd. YES Report is under process NA 22 February 2010 Pending 49
DSTPS (2X500)
MPP BHEL YES Report is on the verge of submission
NA 36# 39# August 2010 November2010 May2012 March
2013 21 28
CHP Thyssenkrupp Industries India Pvt. Ltd. YES Approved LD imposed 27 30 June 2010 September
2010January
2012December
2012 19 27
PWS VA Tech Wabag YES Report is placed for approval NA 20 December 2009 November 2011 23
RTPS (2X600)
MPP Reliance Energy Ltd. No NA NA 35 38 November2010
February2011 Pending Pending 40 37
CHP TRF Ltd. No NA NA 27 30 October2010
January2011 Pending 41 38
PWS Mackintosh Burn Ltd. No NA NA 22 May 2010 Pending 46
BTPS 'A' (1X500)
MPP BHEL YES Interim delay analysis report submitted
NA 39** NA December 2011 NA Pending NA 27 NA
CHP Techpro Systems Ltd. No NA NA 25 NA January2015 NA Pending NA NA NA
SR TRF Ltd. No NA NA 25 NA January2015 NA Pending NA NA NA
DM VA Tech Wabag No NA NA 18 NA June 2014 NA Pending NA NA NA PT McNally Bharat
Engineering Limited No NA NA 20 NA August2014 NA Pending NA NA NA
Note NA - Not applicable
** Zero date - 16.09.2008 & # Zero date - 03.08.2007
41

42
Annexure VI (Refer to Para 3.4)
Statement of approved cost and actual cost as on March 2014` in crore
Name of the projectOriginal approved
costActual cost as on 31st March 2014 Cost over run Percentage
A B C D=C-B EMTPS U # 7 & 8 4,617 5,363 746DSTPS U# 1 & 2 4,457 5,862 1,405KTPS U# 1 & 2 4,212 6,676 2,464Sub Total (Completed projects) 13,286 17,901 4,615 35RTPS U # 1 & 2 4,122 6,597 2,475BTPS 'A' 2,260 2,481 221Sub Total (Under construction) 6,382 9,078 2,696 42Grand Total (Completed + Under construction) 19,668 26,979 7,311 37Note: Working capital margin has not been considered in the cost
contd…
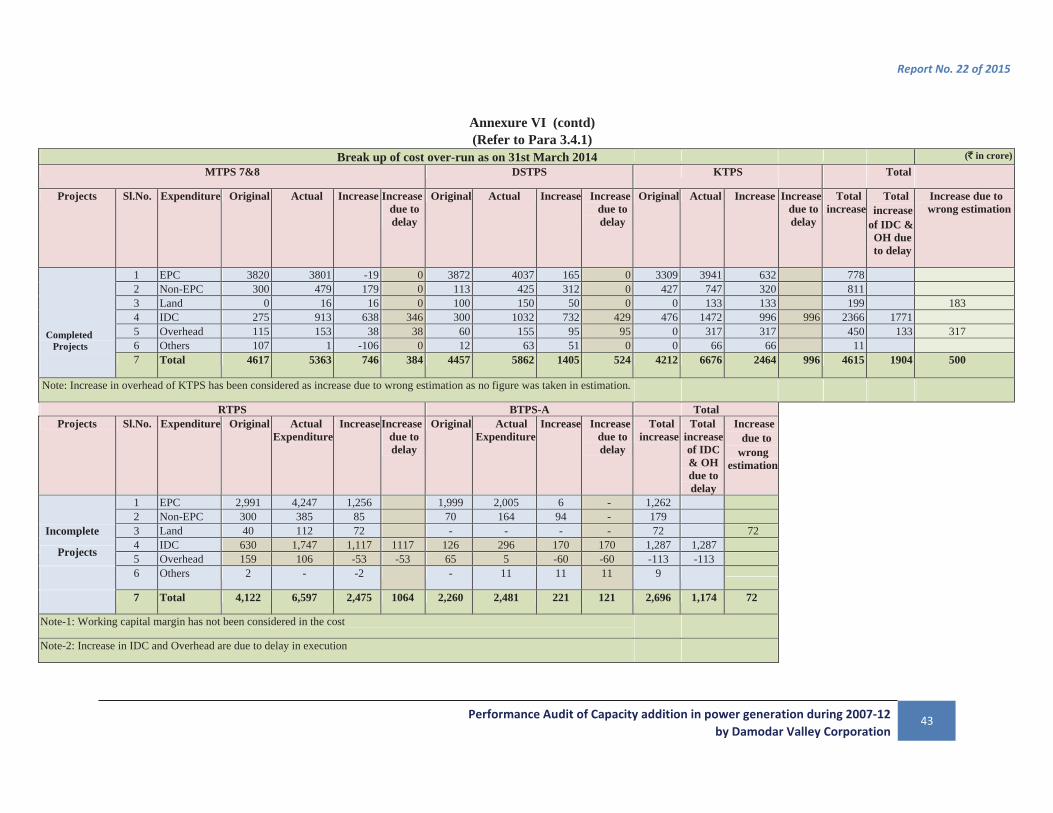
Annexure VI (contd) (Refer to Para 3.4.1)
Break up of cost over-run as on 31st March 2014 (` in crore)
MTPS 7&8 DSTPS KTPS Total
Projects Sl.No. Expenditure Original Actual Increase Increase due to delay
Original Actual Increase Increase due to delay
Original Actual Increase Increase due to delay
Total increase
Total increase
of IDC & OH due to delay
Increase due to wrong estimation
Completed Projects
1 EPC 3820 3801 -19 0 3872 4037 165 0 3309 3941 632 778 2 Non-EPC 300 479 179 0 113 425 312 0 427 747 320 811 3 Land 0 16 16 0 100 150 50 0 0 133 133 199 183 4 IDC 275 913 638 346 300 1032 732 429 476 1472 996 996 2366 1771 5 Overhead 115 153 38 38 60 155 95 95 0 317 317 450 133 317 6 Others 107 1 -106 0 12 63 51 0 0 66 66 11
7 Total 4617 5363 746 384 4457 5862 1405 524 4212 6676 2464 996 4615 1904 500
Note: Increase in overhead of KTPS has been considered as increase due to wrong estimation as no figure was taken in estimation.
RTPS BTPS-A Total Projects Sl.No. Expenditure Original Actual
ExpenditureIncreaseIncrease
due to delay
Original Actual Expenditure
Increase Increase due to delay
Total increase
Total increase of IDC & OH due to delay
Increase due to
wrong estimation
Incomplete
1 EPC 2,991 4,247 1,256 1,999 2,005 6 - 1,262 2 Non-EPC 300 385 85 70 164 94 - 179 3 Land 40 112 72 - - - - 72 72
Projects 4 IDC 630 1,747 1,117 1117 126 296 170 170 1,287 1,287 5 Overhead 159 106 -53 -53 65 5 -60 -60 -113 -113
6 Others 2 - -2 - 11 11 11 9
7 Total 4,122 6,597 2,475 1064 2,260 2,481 221 121 2,696 1,174 72
Note-1: Working capital margin has not been considered in the cost
Note-2: Increase in IDC and Overhead are due to delay in execution
43

Annexure VII(Refer to Para 3.4.2)
Statement of Power allocation vis-à-vis surplus (figures in MW) Name of the Units Capacity
MWRetained by DTL
Other SEBs DVC load Surplus
A B C D E F = B-(C+D+E)
Completed Projects
10th Plan spill over projects
MTPS 5&6 500 100 250 150 0CTPS 7&8 500 300 200 0 0
11th Plan Projects
MTPS 7&8 1000 120 400 180 300 DSTPS 1&2 1000 0 400 150 450 KTPS 1 500 0 150 125 225 Total 3500 520 1400 605 975
Incomplete Projects 11th Plan ProjectsKTPS 2 500 0 150 125 225 RTPS 1&2 1200 400 400 400 BTPS A 500 200 200 100
Total 2200 0 750 725 725 Grand Total 5700 520 2150 1330 1700
44
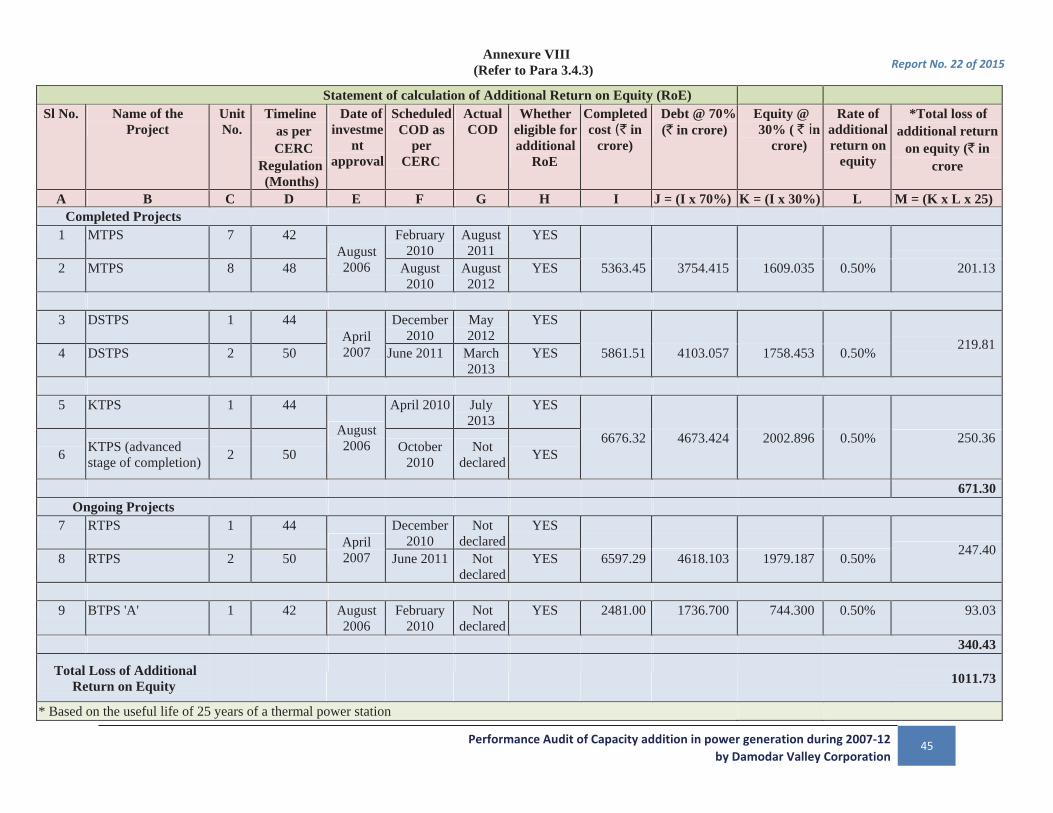
Annexure VIII(Refer to Para 3.4.3)
Statement of calculation of Additional Return on Equity (RoE)Sl No. Name of the
ProjectUnit No.
Timeline as per CERC
Regulation(Months)
Date of investme
nt approval
ScheduledCOD as
perCERC
Actual COD
Whethereligible foradditional
RoE
Completed cost (` in
crore)
Debt @ 70%(` in crore)
Equity @ 30% ( ` in
crore)
Rate of additional return on
equity
*Total loss of additional return
on equity (` in crore
A B C D E F G H I J = (I x 70%) K = (I x 30%) L M = (K x L x 25)Completed Projects
1 MTPS 7 42August 2006
February 2010
August 2011
YES
2 MTPS 8 48 August 2010
August 2012
YES 5363.45 3754.415 1609.035 0.50% 201.13
3 DSTPS 1 44
April 2007
December 2010
May 2012
YES
219.814 DSTPS 2 50 June 2011 March 2013
YES 5861.51 4103.057 1758.453 0.50%
5 KTPS 1 44
August 2006
April 2010 July 2013
YES
250.366 KTPS (advanced
stage of completion) 2 50 October 2010
Not declared YES
6676.32 4673.424 2002.896 0.50%
671.30Ongoing Projects
7 RTPS 1 44April 2007
December 2010
Not declared
YES
247.408 RTPS 2 50 June 2011 Not declared
YES 6597.29 4618.103 1979.187 0.50%
9 BTPS 'A' 1 42 August
2006 February
2010 Not
declaredYES 2481.00 1736.700 744.300 0.50% 93.03
340.43
Total Loss of Additional Return on Equity 1011.73
* Based on the useful life of 25 years of a thermal power station
45

Annexure – IX (Refer Para 3.4.4.1)
Performance of the Units commissioned under 11th Plan
Unit CommercialOperation
Date
Installed Capacity
(MW)
Available time hours Actual Power Generation in(MKWH)
Capacity Utilisation per MW of installed capacity
Percentage of Capacity utilisation to Installed
capacity
A B C D E F = E x 1000/D G = F/C x 100Year 2011-12 2012-13 2013-14 2011-12 2012-13 2013-14 2011-12 2012-13 2013-14 2011-12 2012-13 2013-14
MTPS # 7 August 2011 500 5832 8760 8760 1333.670 3264.000 2994.455 228.68 372.60 341.83 45.74 74.52 68.37MTPS # 8 August 2012 500 5472 8760 1739.630 2005.019 317.91 228.88 63.58 45.78DSTPS # 1 May 2012 500 7704 8760 2319.188 2638.225 301.04 301.17 60.21 60.23DSTPS # 2 March 2013 500 648 8760 86.141 1791.050 132.93 204.46 26.59 40.89KTPS # 1 July 2013 500 6168 1501.022 243.36 48.67
46

Annexure-X (Refer Para 3.4.4.1)
Forced outages and loss due to non-recovery of fixed cost thereof
Year 2011-12 2012-13 2013-14
TotalUnits MTPS
# 7MTPS
# 7MTPS
# 8DSTPS
# 1DSTPS
# 2MTPS
# 7MTPS
# 8DSTPS
# 1DSTPS
# 2KTPS
# 1Description of the
troubleLoss in
hrsLoss in
hrsLoss in
hrsLoss in
hrsLoss in
hrs Loss in hrs Loss in hrs Loss in hrs Loss in hrs Loss in hrs
Boiler Tube leakage 85.37 319.30 272.22 696.93 0 85.83 101.98 140.85 494.28 245.460TG & Aux. 74 3.03 246.47 37.00 0 76.35 488.56 0 0 62.553Elect. Sys Trouble 886.74 106.74 37.29 344.430 0 0 2058.71 181.98 120.87 255.170C & I Trouble 5.93 7.62 0 75.880 0 0 4.9 6.32 4.25 7.500Operation/Furnace/ flame
13.88 20.05 4.80 11.850 0 25.93 12.82 6.18 8.95
AHP 0.000 0 0 0 74.083Misc./Others 710.17 0.95 39.03 122.030 0 30.7 0 15.88 131.16 357.050Total loss in hours 1776.09 457.69 599.81 1288.120 0 218.81 2666.97 351.21 759.51 1001.816 9120.026
PLF (%) 45.74 74.52 63.58 60.21 23.16 68.367 45.777 60.23 40.89 48.671Total loss in MU 406.191783 170.535294 190.679599 387.788526 0 74.79691635 610.429428 105.766892 155.281820 243.7969327 2345.27Fixed cost (`) /unit 1.82 1.82 1.82 2.37 2.37 1.82 1.82 2.37 2.37 2.4Loss in ` (Loss in MU x Fixed cost/Unit)
739269045 310374235 347036870 919058807 0 136130388 1110981560 250667533 368017912 585112638 4766648988
47
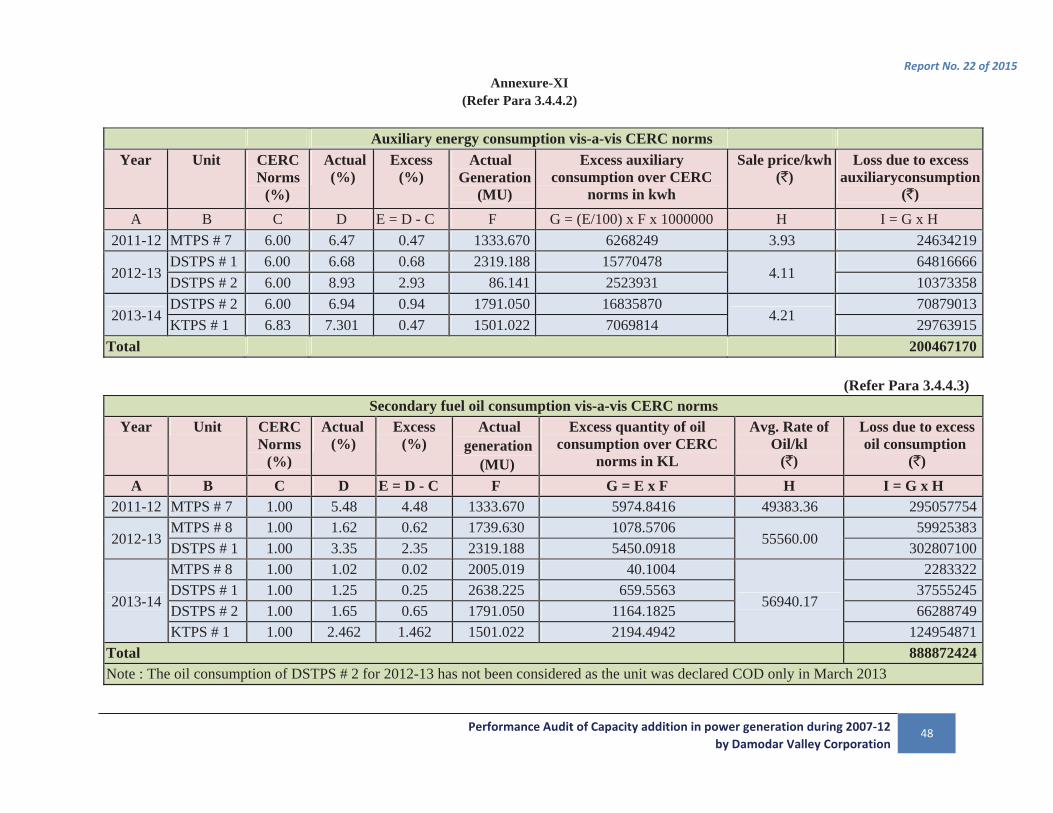
Annexure-XI
(Refer Para 3.4.4.2)
Auxiliary energy consumption vis-a-vis CERC normsYear Unit CERC
Norms(%)
Actual (%)
Excess (%)
ActualGeneration
(MU)
Excess auxiliary consumption over CERC
norms in kwh
Sale price/kwh (`)
Loss due to excess auxiliaryconsumption
(`)A B C D E = D - C F G = (E/100) x F x 1000000 H I = G x H
2011-12 MTPS # 7 6.00 6.47 0.47 1333.670 6268249 3.93 24634219
2012-13DSTPS # 1 6.00 6.68 0.68 2319.188 15770478
4.1164816666
DSTPS # 2 6.00 8.93 2.93 86.141 2523931 10373358
2013-14DSTPS # 2 6.00 6.94 0.94 1791.050 16835870
4.2170879013
KTPS # 1 6.83 7.301 0.47 1501.022 7069814 29763915Total 200467170
(Refer Para 3.4.4.3)
Secondary fuel oil consumption vis-a-vis CERC normsYear Unit CERC
Norms(%)
Actual (%)
Excess (%)
Actual generation
(MU)
Excess quantity of oil consumption over CERC
norms in KL
Avg. Rate of Oil/kl
(`)
Loss due to excess oil consumption
(`)A B C D E = D - C F G = E x F H I = G x H
2011-12 MTPS # 7 1.00 5.48 4.48 1333.670 5974.8416 49383.36 295057754
2012-13MTPS # 8 1.00 1.62 0.62 1739.630 1078.5706
55560.0059925383
DSTPS # 1 1.00 3.35 2.35 2319.188 5450.0918 302807100
2013-14
MTPS # 8 1.00 1.02 0.02 2005.019 40.1004
56940.17
2283322DSTPS # 1 1.00 1.25 0.25 2638.225 659.5563 37555245DSTPS # 2 1.00 1.65 0.65 1791.050 1164.1825 66288749KTPS # 1 1.00 2.462 1.462 1501.022 2194.4942 124954871
Total 888872424Note : The oil consumption of DSTPS # 2 for 2012-13 has not been considered as the unit was declared COD only in March 2013
48


![Letterhead for the City's correspondenceresource.capetown.gov.za › documentcentre › Documents... · Solid waste services [refer sector plan in Annexure G, SFA1 and SFA3] The Solid](https://static.documents.pub/doc/80x56/5f1d81875ece78446e4a68d5/letterhead-for-the-citys-co-a-documentcentre-a-documents-solid-waste-services.jpg)


