34
ANNIE CHIANG PORTFOLIO 2012-15
| Date post: | 22-Jul-2016 |
| Category: |
Documents |
| Upload: | annie-chiang |
| View: | 225 times |
| Download: | 2 times |

ANNIE CHIANG PORTFOLIO 2012-15


TABLE OF CONTENTSDESIGNBACK ON TRACK: A MODULAR POST OFFICETHE CIVIC CENTER FOR THE STUDY OF ARCHITECTURETHE BUCKS ARENA AND RECREATION CENTER
BUILDA VENEER CHAIR: LIKE FABRIC HANGING BETWEEN A FRAMEDON’T LEAVE ME: A COLLABORATION OF DANCE, SPACE, AND MUSIC
RESEARCHSTELLAR APARTMENTS: COMPARISON OF ENERGY PERFORMANCE

“The role of the designer is that of a very good, thoughtful host anticipating the needs of his guests.” – Charles Eames

DESIGN

HighwayRailwayPost O�ce
C L A C K A M A S
C O L U M B I A
T I L L A M O O K
Y A M H I L L
P O L K
L I N C O L N
B E N T O N
L A N E
M A R I O N
L I N N
C O O S
D O U G L A S
C U R R Y
J O S E P H I N E
L A K E
K L A M A T H
C R O O K
D E S C H U T E S
J E F F E R S O N W H E E L E R
W A S C O
S H E R M A N
G I L L I A M
M O R R O WU M A T I L L A
U N I O N
W A L L O W A
B A K E R
G R A N T
M A L H E U RH A R N E Y
W A S H I N G T O N
J A C K S O N
C L A T S O P
M U L T N O M A H
H O O D
R I V E R
St. Helens
Tillamook
Albany
Oregon City
Hood River
Madras
Prineville
Coquille
Grants Pass
Lakeview
Burns
Pendleton
Baker City
Canyon City
Vale
SALEM
Medford
Elgin
Milton-Freewater
Weston
Pilot Rock
The DallesParkdale
Gardiner
MoroPortland
White City
Roseburg
Dallas
ForestGrove Hillsboro
Astoria
Klamath Falls
Condon
Fossil
HeppnerLa Grande
Enterprise
Corvallis
McMinnville
EugeneBend
Newport
Gold Beach
To S
poka
ne
To R
eddi
ng
To S
eattl
e
To A
ltura
s
To Black Butte
To Boise
To Bieber
To Alturas
UP
LRY
MH
WURR
UP
BNSF(UP)
KNOR
CBRL
CORP
WPRR
UP
PCC
BNSF(UP)UP
UP
BNSF(UP)
INPR
PNWR
BNSF (UP)
CORP
BNSF
UPUP
UP
PNWR
WVR
AERC
PCC
CBRL
UP (WPRR)
PNWR
UP
CORP
WPRR
CORP
OPR
BNSF
UP
BNSF (UP)
WYCO
UP (BNSF)
WURR
PNWR
BNSF
BNSF(UP)
BNSF
CBRL
POTB
COP
AERC
CORP
HLSC
WPRR
PN
WR
PNW
R
WCTR
UP
UP
LPN
UP (PNWR)
State of Oregon
OREGON RAILROADS
Oregon City
PortlandForestGrove Hillsboro
Banks
McMinnville
UP
UP
UP
PNWR
UP
BNSF
UP
PNWR
BNSF (UP)
PNWR
PNWR
OPR
POTB
PTRC
PNWR
PTTo Spokane
To HoodRiver
0 30 60 9015Miles
0 5 102.5Miles
Legend
BNSF
Oregon Short Lines
Union Pacific
BNSF Railway Co.
Albany & Eastern
Portland Enlargement Area
W A S H I N G T O N
To S
eattl
e
See PortlandEnlargement Area
UP
AERC
INPRHLSCCORPCOP City of Prineville
Central Oregon & PacificHampton Railway
Klamath Northern
PCCOPRMHLRYLPNKNOR
Longview Portland & Northern
Port of Tillamook Bay
Idaho Northern & Pacific
Lake RailwayMount HoodOregon PacificPalouse River & Coulee City
POTBPNWRPTPTRCWPRRWCTRWVR
Portland & Western
Wyoming & Colorado
Peninsula Terminal Co.Portland Terminal RailroadWillamette & PacificWCTU RailwayWillamette Valley Railway
WYCO(Oregon Eastern Division)
WASHINGTON
IDAHO
CALIFORNIA NEVADA
Wallowa Union RailroadWURR
CBRL Coos Bay Rail Link
REVISED 7/7/2010
IN THE YEAR 2012:212,530 Fleet Vehicles1.28 Billion Miles Traveled129.5 Million Rural and City Delivery Points25.5% of Total USPS Vehicle Fuel Use is Postal-Owned148.8 Million Gasoline Gallon Equivalents of Petroleum Consumed
REDUCTION OF USPS DEPENDENCE ON OIL:Postal-Owned Vehicles Run on ElectricityFewer Vehicles Running Longer DistancesUse of Railway for Long Distances
DESIGN
BACK ON TRACK:
HighwayRailwayPost O�ce
C L A C K A M A S
C O L U M B I A
T I L L A M O O K
Y A M H I L L
P O L K
L I N C O L N
B E N T O N
L A N E
M A R I O N
L I N N
C O O S
D O U G L A S
C U R R Y
J O S E P H I N E
L A K E
K L A M A T H
C R O O K
D E S C H U T E S
J E F F E R S O N W H E E L E R
W A S C O
S H E R M A N
G I L L I A M
M O R R O WU M A T I L L A
U N I O N
W A L L O W A
B A K E R
G R A N T
M A L H E U RH A R N E Y
W A S H I N G T O N
J A C K S O N
C L A T S O P
M U L T N O M A H
H O O D
R I V E R
St. Helens
Tillamook
Albany
Oregon City
Hood River
Madras
Prineville
Coquille
Grants Pass
Lakeview
Burns
Pendleton
Baker City
Canyon City
Vale
SALEM
Medford
Elgin
Milton-Freewater
Weston
Pilot Rock
The DallesParkdale
Gardiner
MoroPortland
White City
Roseburg
Dallas
ForestGrove Hillsboro
Astoria
Klamath Falls
Condon
Fossil
HeppnerLa Grande
Enterprise
Corvallis
McMinnville
EugeneBend
Newport
Gold Beach
To S
poka
ne
To R
eddi
ng
To S
eattl
e
To A
ltura
s
To Black Butte
To Boise
To Bieber
To Alturas
UP
LRY
MH
WURR
UP
BNSF(UP)
KNOR
CBRL
CORP
WPRR
UP
PCC
BNSF(UP)UP
UP
BNSF(UP)
INPR
PNWR
BNSF (UP)
CORP
BNSF
UPUP
UP
PNWR
WVR
AERC
PCC
CBRL
UP (WPRR)
PNWR
UP
CORP
WPRR
CORP
OPR
BNSF
UP
BNSF (UP)
WYCO
UP (BNSF)
WURR
PNWR
BNSF
BNSF(UP)
BNSF
CBRL
POTB
COP
AERC
CORP
HLSC
WPRR
PN
WR
PNW
R
WCTR
UP
UP
LPN
UP (PNWR)
State of Oregon
OREGON RAILROADS
Oregon City
PortlandForestGrove Hillsboro
Banks
McMinnville
UP
UP
UP
PNWR
UP
BNSF
UP
PNWR
BNSF (UP)
PNWR
PNWR
OPR
POTB
PTRC
PNWR
PTTo Spokane
To HoodRiver
0 30 60 9015Miles
0 5 102.5Miles
Legend
BNSF
Oregon Short Lines
Union Pacific
BNSF Railway Co.
Albany & Eastern
Portland Enlargement Area
W A S H I N G T O N
To S
eattl
e
See PortlandEnlargement Area
UP
AERC
INPRHLSCCORPCOP City of Prineville
Central Oregon & PacificHampton Railway
Klamath Northern
PCCOPRMHLRYLPNKNOR
Longview Portland & Northern
Port of Tillamook Bay
Idaho Northern & Pacific
Lake RailwayMount HoodOregon PacificPalouse River & Coulee City
POTBPNWRPTPTRCWPRRWCTRWVR
Portland & Western
Wyoming & Colorado
Peninsula Terminal Co.Portland Terminal RailroadWillamette & PacificWCTU RailwayWillamette Valley Railway
WYCO(Oregon Eastern Division)
WASHINGTON
IDAHO
CALIFORNIA NEVADA
Wallowa Union RailroadWURR
CBRL Coos Bay Rail Link
REVISED 7/7/2010
IN THE YEAR 2012:212,530 Fleet Vehicles1.28 Billion Miles Traveled129.5 Million Rural and City Delivery Points25.5% of Total USPS Vehicle Fuel Use is Postal-Owned148.8 Million Gasoline Gallon Equivalents of Petroleum Consumed
REDUCTION OF USPS DEPENDENCE ON OIL:Postal-Owned Vehicles Run on ElectricityFewer Vehicles Running Longer DistancesUse of Railway for Long Distances
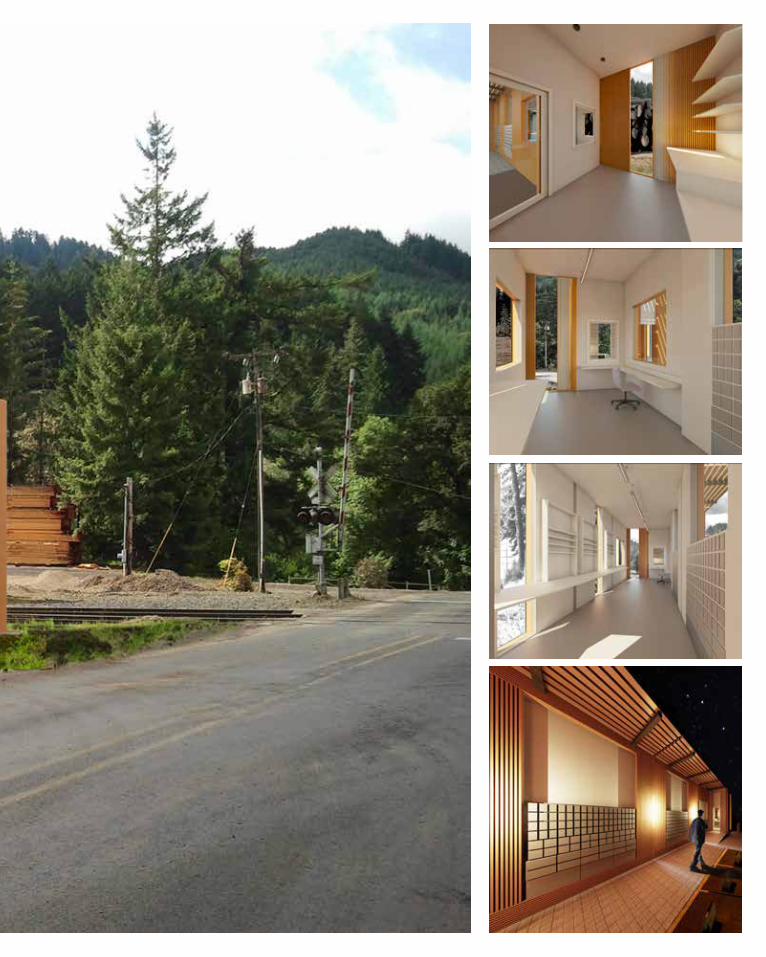
A MODULAR POST OFFICE
The USPS is the largest civilian vehicular fleet in the world, with over 212,000 postal-owned vehicles. In light of them being behind on their goals to reduce petroleum fuel use, the United States Postal Service needs long-term solutions to their dependence on oil.
Freight rail is a very fuel efficient way of transporting goods in the United States and was used widely across the nation to transport mail from 1832 to 1977 until the popularity of the automobile. The USPS can benefit from revisiting Rail Mail and making use of an existing under utilized infrastructure.

HighwayRailwayPost O�ce
C L A C K A M A S
C O L U M B I A
T I L L A M O O K
Y A M H I L L
P O L K
L I N C O L N
B E N T O N
L A N E
M A R I O N
L I N N
C O O S
D O U G L A S
C U R R Y
J O S E P H I N E
L A K E
K L A M A T H
C R O O K
D E S C H U T E S
J E F F E R S O N W H E E L E R
W A S C O
S H E R M A N
G I L L I A M
M O R R O WU M A T I L L A
U N I O N
W A L L O W A
B A K E R
G R A N T
M A L H E U RH A R N E Y
W A S H I N G T O N
J A C K S O N
C L A T S O P
M U L T N O M A H
H O O D
R I V E R
St. Helens
Tillamook
Albany
Oregon City
Hood River
Madras
Prineville
Coquille
Grants Pass
Lakeview
Burns
Pendleton
Baker City
Canyon City
Vale
SALEM
Medford
Elgin
Milton-Freewater
Weston
Pilot Rock
The DallesParkdale
Gardiner
MoroPortland
White City
Roseburg
Dallas
ForestGrove Hillsboro
Astoria
Klamath Falls
Condon
Fossil
HeppnerLa Grande
Enterprise
Corvallis
McMinnville
EugeneBend
Newport
Gold Beach
To S
poka
ne
To R
eddi
ng
To S
eattl
e
To A
ltura
s
To Black Butte
To Boise
To Bieber
To Alturas
UP
LRY
MH
WURR
UP
BNSF(UP)
KNOR
CBRL
CORP
WPRR
UP
PCC
BNSF(UP)UP
UP
BNSF(UP)
INPR
PNWR
BNSF (UP)
CORP
BNSF
UPUP
UP
PNWR
WVR
AERC
PCC
CBRL
UP (WPRR)
PNWR
UP
CORP
WPRR
CORP
OPR
BNSF
UP
BNSF (UP)
WYCO
UP (BNSF)
WURR
PNWR
BNSF
BNSF(UP)
BNSF
CBRL
POTB
COP
AERC
CORP
HLSC
WPRR
PN
WR
PNW
R
WCTR
UP
UP
LPN
UP (PNWR)
State of Oregon
OREGON RAILROADS
Oregon City
PortlandForestGrove Hillsboro
Banks
McMinnville
UP
UP
UP
PNWR
UP
BNSF
UP
PNWR
BNSF (UP)
PNWR
PNWR
OPR
POTB
PTRC
PNWR
PTTo Spokane
To HoodRiver
0 30 60 9015Miles
0 5 102.5Miles
Legend
BNSF
Oregon Short Lines
Union Pacific
BNSF Railway Co.
Albany & Eastern
Portland Enlargement Area
W A S H I N G T O N
To S
eattl
e
See PortlandEnlargement Area
UP
AERC
INPRHLSCCORPCOP City of Prineville
Central Oregon & PacificHampton Railway
Klamath Northern
PCCOPRMHLRYLPNKNOR
Longview Portland & Northern
Port of Tillamook Bay
Idaho Northern & Pacific
Lake RailwayMount HoodOregon PacificPalouse River & Coulee City
POTBPNWRPTPTRCWPRRWCTRWVR
Portland & Western
Wyoming & Colorado
Peninsula Terminal Co.Portland Terminal RailroadWillamette & PacificWCTU RailwayWillamette Valley Railway
WYCO(Oregon Eastern Division)
WASHINGTON
IDAHO
CALIFORNIA NEVADA
Wallowa Union RailroadWURR
CBRL Coos Bay Rail Link
REVISED 7/7/2010
IN THE YEAR 2012:212,530 Fleet Vehicles1.28 Billion Miles Traveled129.5 Million Rural and City Delivery Points25.5% of Total USPS Vehicle Fuel Use is Postal-Owned148.8 Million Gasoline Gallon Equivalents of Petroleum Consumed
REDUCTION OF USPS DEPENDENCE ON OIL:Postal-Owned Vehicles Run on ElectricityFewer Vehicles Running Longer DistancesUse of Railway for Long Distances
Grumman LLV
Walk-In EVI
17mpg53.9mi/17mpg = 3.17 gallons
90 miles per charge33.4kWh = 1 GGE53.9/90 = 0.6 mi99 kWh/33.4kWh = 2.96 GGEs2.96 x 0.6 = 1.78 GGEs
From Eugene to Swisshome53.9mi
3.17 GGEs
1.78 GGEs
0.13 GGEs
Freight Rail
469mpg1.13gal of Diesel = 1 GGE0.115 gallons x 1.13 GGEs = GGEs
https://www.aar.org/keyissues/Documents/Background-Papers/The-Environmental-Bene�ts-of-Rail.pdf
http://www.fueleconomy.gov/feg/bymodel/1988_Grumman_Allied_Industries_LLV.shtmlhttp://www.evi-usa.com/LinkClick.aspx?�leticket=Er2c6QQx-Mo%3d&tabid=62
http://en.wikipedia.org/wiki/Gasoline_gallon_equivalent
20 m
in b
y ca
r
30 m
in b
y ca
r
50 m
in b
y ca
r
20 m
in b
y ra
il
30 m
in b
y ra
il
40 m
in b
y ra
il
60 m
in b
y ra
il
Noti carrier routeDeadwood carrier routeSwisshome carrier routeHighwaysCoos Bay RailwayPost O�ce
Coos Bay Rail travels about 40mph.A single car can travel about 55mph.Loss of time between rail and car is about 10 minutes.
10 mi
Site
Post O�ce
Coos Bay Railway
Highway
10 mi
This project was awarded the 2014 AIA-SWO Design Award. More Info at:www.aiaswo.org/design-awards


Ceiling12' - 0"
Roof13' - 0"
Finished Floor1' - 0"
Section A1/4” =1’ - 0”
9' - 11 9/16"
West Elevation1/4” = 1’-0”
Ceiling12' - 0"
Roof13' - 0"
Finished Floor1' - 0"
Section B1/4” =1’ - 0”
A
B
PUBLICSPACE
WORKROOMDESK AND STORAGE
RESTROOM
1/4” =1’ - 0”8'
- 2
1/2"
5' -
0"5'
- 1"
9' -
9"
6' - 11 7/16"

PUBLIC AREA BUILT-IN
WORK AREA BUILT-IN
WORK AREA BUILT-IN DESK
PO BOX WALL HALF WINDOW WALL
HALF WALL WITH DOOR
SERVICE WINDOW TO EXTERIOR
EXTE
RIO
R PA
NEL
SIN
TERI
OR
PAN
ELS
FULL PARTITION - 11’x10’ HALF PARTITION - 11’ x 5’
A B C D Overhang
COM
PON
ENTS
EXPLODED AXON
Box Car Dimension - 50’ x 10’ x 13’
Modules - 5 (10’ x 10’ x 13’)
O�set for More Light and Space Variety
North Elevation1/4” = 1’-0”
EXPLODED AXON
Box Car Dimension - 50’ x 10’ x 13’
Modules - 5 (10’ x 10’ x 13’)
O�set for More Light and Space Variety
The module is based on the dimensions of a standard boxcar. The module is a 10’x10’x13’ steel frame with panels that fit onto the frame. Five of the modules can easily fit on a rail car. This modular Post Office is prefabricated off-site and easily transported to its site by rail. The module will also be sited within close proximity of the rail track to take advantage of rail delivery and pick up. The proposal offers the idea of connecting a larger network of rural post offices within a 10 mile radius of an existing railway. The modules can be positioned face to face or offset by half of a module to create more opportunities for light and varying spaces.
The design incorporates removable façade panels of varying transparency gradients. The spatial organization of the module is based on the linear organization of a historic sorting rail car. The main circulation is through the center of the module and the programmatic functions are positioned on the edges of the module. A space for the public is positioned on one end allowing for flexible service to the public: either inside or outside the building depending on weather conditions.

DESIGN
CIVIC CENTER FOR THE STUDY OF ARCHITECTURE

1
2
3
4
5
A B C D E F G H
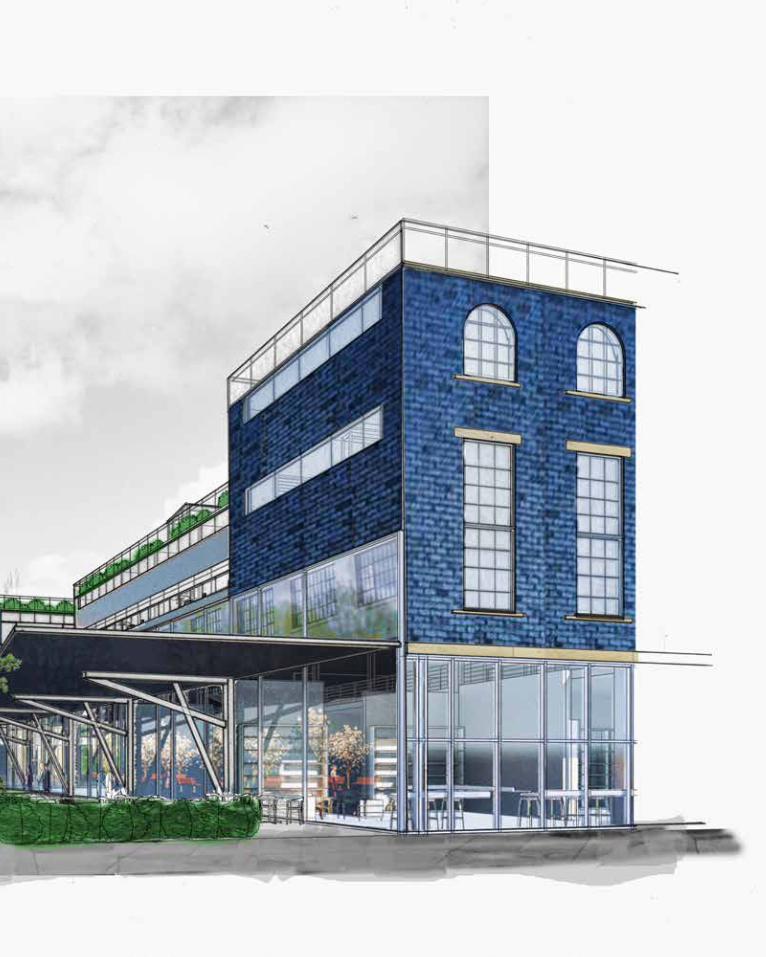
The study of architecture is relatively restricted to those who pursue the profession and is often misrepresented and misunderstood by the public. “Good Design” is often thought of as inaccessible and not affordable. Design no longer has a strong connection to the people it is supposed to work for.
A civic center for architecture aims to bridge that gap between designers and the public. It is an opportunity to educate the public about design and the breadth of various disciplines involved in the study of architecture, but it is also an opportunity to reconnect designers back to the communities they are ultimately serving.


Passive Analysis of the Civic Center for the Study of Architecture
BAND OF SUN ANALYSIS
During the summer the south canopy blocks a lot of the sun
canopy on the roof terrace also provides a shaded area for visitors. Solar pv as sun shades can take advantage of thesummer sun.
During the winter the clerestories allow for deep penetration of sunlight into the rooms.The canopy on the roof terrace also still allows for sunlight to come through. The office walls are madeof concrete to take advantage of the winter sun.
PASSIVE COOLING
PASSIVE HEATING
Cross Ventilation:
Prevailing winds arecoming from thenorthwest direction.
Inlet windows willbe placed on westfacade. Outlets on southeast.
7mph is the wind speedthat should be used to accomodate for mostwinds coming from anydirection.
Portland, OR USAHDD of 4798Summer Design DB: 85 degrees F (Table B.5 p.1526)
MDR: 23 (Table B.5 p.1526)
With a 13.3 Btu/h sf cross-ventilation capacity, and a wind velocity of 7mph, I would need to design for an inlet area of 1% of floor area which is about 163.6 sf16363 sf x 0.01 = 163.6 sfOutlet area would also have to be 164 sf.
When the outside is 79 degrees F, the indoor temperature will be 82 degrees F.
If I use casement windows instead of double hung, that will give me a total window area of 164 sf/0.9 = 182.2 sf for both inlet and outlet windows
7mph is the wind speed that should be used to accomodate for most winds.Assuming wind coming at a diagonal to windows, in an urban setting, assume 0.3.
V=C Av
V = 182.2sf x 0.3 x (7x88) = 33,674.7 cfm33,674.7 cfm x 0.45 city center = 15,154 cfm= 1.1 x 15,151.8 x (82-79) = 50,008 Btu/hHalf as much gain with twice as much operable area
Night Ventilation of Mass:MDR: 2323 degrees / 12 hours = 1.9 degrees/h
Average low of summer: 62 degreesMax 85 - MDR 23 = 62 degrees F
According to Table B.3 pg 1521, Portland has a HDD of 4798.
Based on Table 8.3, 4.8 Btu/DDF sf is the max overall heat loss.
The ratio of south glass sf/ total floor sf: 1130/16363 = 0.069 south glass sf: 1130sftotal floor sf: 16363 sf
LCR: 4.8/0.069 = 69.6
Total Mass Area: 16363sf
mass/south glass ratio: 16363sf/1130sf = 14.5
Total Floor Area: 16363 sfSouth glass to Floor Area: 0.069System: DG-CLCR: 69.6SSF: 34%
2,055,193
32726245445
196356
77.3 88360.2 8075.4 150539.6 79.673.5 200937.6 7971.6 243045.1 78.269.7 278432.8 7767.8 303487.8 75.865.9 325202.2 74.564 344021.3 73.162 363603.8 71.664 249671.3 70.665.9 154202.4 7067.8 71462.66 69.769.7 -245.09 69.771.6 -62391.8 70
271033070
2,710,330
2541640 12.9
Design Changes:After analysing the results of implementing different passive strategies to my building, I chose the followingdesign changes that would suit my building in Portland best.
1. Shading south facing windows2. Adding south facing roof monitors3. Cooling with cross ventilation and night ventilation of mass4. Heating with direct gain systems and thermal mass
About the building: About the climate:The Civic Center for the Study of Architecture is designed for the daily passerby. Located next to a park, the �rst �oor is an extension of the public space and acts as a pavilion. It is essentially a museum for the public about the study of architecture. The building housesgalleries and offices and aims to use the building as an educational tool in itself.
ANNIE CHIANGARCH 510JREYNOLDS
BEFORE
AFTER
June 21 = 90 - 45.52 + 23.5 = 67.98 Dec 21 = 90 - 45.52 - 23.5 = 20.98
Dec 21 = 90 - 45.52 - 23.5 = 20.98
Thermal Mass
Roof Terrace
4th Floor
Structure is made of concrete and steelExposed concrete on �oor and ceiling, and shear walls.
Ground floor glazing opens up completely on nice days in Portland and creates high visibility to welcome visitors and passersby. It also serves for cross ventilation during business hours.
The structure is made of concrete and steel. Exposed concrete in the floor, ceiling, and shear walls serve as thermal mass for passive heating and cooling. All service spaces and critical vertical circulation are located on the north party wall.

Dec 21 = 90 - 45.52 - 23.5 = 20.98June 21 = 90 - 45.52 + 23.5 = 67.98
Passive Analysis of the Civic Center for the Study of Architecture
BAND OF SUN ANALYSIS
During the summer the south canopy blocks a lot of the sun
canopy on the roof terrace also provides a shaded area for visitors. Solar pv as sun shades can take advantage of thesummer sun.
During the winter the clerestories allow for deep penetration of sunlight into the rooms.The canopy on the roof terrace also still allows for sunlight to come through. The office walls are madeof concrete to take advantage of the winter sun.
PASSIVE COOLING
PASSIVE HEATING
Cross Ventilation:
Prevailing winds arecoming from thenorthwest direction.
Inlet windows willbe placed on westfacade. Outlets on southeast.
7mph is the wind speedthat should be used to accomodate for mostwinds coming from anydirection.
Portland, OR USAHDD of 4798Summer Design DB: 85 degrees F (Table B.5 p.1526)
MDR: 23 (Table B.5 p.1526)
With a 13.3 Btu/h sf cross-ventilation capacity, and a wind velocity of 7mph, I would need to design for an inlet area of 1% of floor area which is about 163.6 sf16363 sf x 0.01 = 163.6 sfOutlet area would also have to be 164 sf.
When the outside is 79 degrees F, the indoor temperature will be 82 degrees F.
If I use casement windows instead of double hung, that will give me a total window area of 164 sf/0.9 = 182.2 sf for both inlet and outlet windows
7mph is the wind speed that should be used to accomodate for most winds.Assuming wind coming at a diagonal to windows, in an urban setting, assume 0.3.
V=C Av
V = 182.2sf x 0.3 x (7x88) = 33,674.7 cfm33,674.7 cfm x 0.45 city center = 15,154 cfm= 1.1 x 15,151.8 x (82-79) = 50,008 Btu/hHalf as much gain with twice as much operable area
Night Ventilation of Mass:MDR: 2323 degrees / 12 hours = 1.9 degrees/h
Average low of summer: 62 degreesMax 85 - MDR 23 = 62 degrees F
According to Table B.3 pg 1521, Portland has a HDD of 4798.
Based on Table 8.3, 4.8 Btu/DDF sf is the max overall heat loss.
The ratio of south glass sf/ total floor sf: 1130/16363 = 0.069 south glass sf: 1130sftotal floor sf: 16363 sf
LCR: 4.8/0.069 = 69.6
Total Mass Area: 16363sf
mass/south glass ratio: 16363sf/1130sf = 14.5
Total Floor Area: 16363 sfSouth glass to Floor Area: 0.069System: DG-CLCR: 69.6SSF: 34%
2,055,193
32726245445
196356
77.3 88360.2 8075.4 150539.6 79.673.5 200937.6 7971.6 243045.1 78.269.7 278432.8 7767.8 303487.8 75.865.9 325202.2 74.564 344021.3 73.162 363603.8 71.664 249671.3 70.665.9 154202.4 7067.8 71462.66 69.769.7 -245.09 69.771.6 -62391.8 70
271033070
2,710,330
2541640 12.9
Design Changes:After analysing the results of implementing different passive strategies to my building, I chose the followingdesign changes that would suit my building in Portland best.
1. Shading south facing windows2. Adding south facing roof monitors3. Cooling with cross ventilation and night ventilation of mass4. Heating with direct gain systems and thermal mass
About the building: About the climate:The Civic Center for the Study of Architecture is designed for the daily passerby. Located next to a park, the �rst �oor is an extension of the public space and acts as a pavilion. It is essentially a museum for the public about the study of architecture. The building housesgalleries and offices and aims to use the building as an educational tool in itself.
ANNIE CHIANGARCH 510JREYNOLDS
BEFORE
AFTER
June 21 = 90 - 45.52 + 23.5 = 67.98 Dec 21 = 90 - 45.52 - 23.5 = 20.98
Dec 21 = 90 - 45.52 - 23.5 = 20.98
Thermal Mass
Roof Terrace
4th Floor
Structure is made of concrete and steelExposed concrete on �oor and ceiling, and shear walls.
During the summer in Portland, prevailing winds are coming from the northwest direction. Inlet windows are placed on west facade. Outlets on southeast. 7mph is the wind speed that should be used to accommodate for most winds coming from any direction.
During the summer the south canopy blocks a lot of the sun coming into the ground floor and prevents overheating. The canopy on the roof terrace also provides a shaded area for visitors. Solar PV as sun shades can take advantage of the summer sun.
During the winter the clerestories allow for deep penetration of sunlight into the rooms. The canopy on the roof terrace also still allows for sunlight to come through. The office walls are made of concrete to take advantage of the winter sun.
WIND & LIGHT

SummerfestGrounds
Historic Third Ward
Kilbourn Town
EastTown
The name of the city of Milwaukee comes from the Patowatomi word Minwaking meaning gathering place by the water. This site at the south peninsula has been left undeveloped for decades and is prime real estate to host events by the water, act as spill over space for Summerfest (the largest summer music festival in the world), and revitalize the neighborhood by activating the site all times of the year.
Milwaukeeans are active. This arena and recreation center holds a large sporting goods store with a climbing wall that spans two stories and a three-fl oor fi tness center. Accessible from the street, the recreation center is embedded into the arena, surrounding the visitors in the game experience once inside. The ground fl oor is dedicated to shops such as a kayak and canoe rental store, a Bucks team store, and a donor’s club space that could be rented out for private events.
The building itself acts as an entertainment screen for those who view it from the outside. The enclosure is made of a translucent shade screen that hides or reveals the inside of the building based on the light projected on, behind, or through it. At night, the spectators inside the building become the spectator sport for those outside the building.
DESIGN
THE BUCKS ARENA & RECREATION CENTER
The name of the city of Milwaukee comes from the Patowatomi word Minwaking meaning gathering place by the water. This site at the south peninsula has been left undeveloped for decades and is prime real estate to host events by the water, act as spill over space for Summerfest (the largest summer music festival in the world), and revitalize the neighborhood by activating the site all times of the year. Milwaukeeans are active. This arena and recreation center holds a large sporting goods store with a climbing wall that spans two stories and a three-floor fitness center. Accessible from the street, the recreation center is embedded into the arena, surrounding the visitors in the game experience once inside. The ground floor is dedicated to shops such as a kayak and canoe rental store, a Bucks team store, and a donor's club space that could be rented out for private events. The building itself acts as an entertainment screen for those who view it from the outside. The enclosure is made of a translucent shade screen that hides or reveals the inside of the building based on the light projected on, behind, or through it. At night, the spectators inside the building become the spectator sport for those outside the building.

SummerfestGrounds
Historic Third Ward
Kilbourn Town
EastTown
The name of the city of Milwaukee comes from the Patowatomi word Minwaking meaning gathering place by the water. This site at the south peninsula has been left undeveloped for decades and is prime real estate to host events by the water, act as spill over space for Summerfest (the largest summer music festival in the world), and revitalize the neighborhood by activating the site all times of the year.
Milwaukeeans are active. This arena and recreation center holds a large sporting goods store with a climbing wall that spans two stories and a three-fl oor fi tness center. Accessible from the street, the recreation center is embedded into the arena, surrounding the visitors in the game experience once inside. The ground fl oor is dedicated to shops such as a kayak and canoe rental store, a Bucks team store, and a donor’s club space that could be rented out for private events.
The building itself acts as an entertainment screen for those who view it from the outside. The enclosure is made of a translucent shade screen that hides or reveals the inside of the building based on the light projected on, behind, or through it. At night, the spectators inside the building become the spectator sport for those outside the building.
DESIGN
THE BUCKS ARENA & RECREATION CENTER
SummerfestGrounds
Historic Third Ward
Kilbourn Town
EastTown
The name of the city of Milwaukee comes from the Patowatomi word Minwaking meaning gathering place by the water. This site at the south peninsula has been left undeveloped for decades and is prime real estate to host events by the water, act as spill over space for Summerfest (the largest summer music festival in the world), and revitalize the neighborhood by activating the site all times of the year.
Milwaukeeans are active. This arena and recreation center holds a large sporting goods store with a climbing wall that spans two stories and a three-fl oor fi tness center. Accessible from the street, the recreation center is embedded into the arena, surrounding the visitors in the game experience once inside. The ground fl oor is dedicated to shops such as a kayak and canoe rental store, a Bucks team store, and a donor’s club space that could be rented out for private events.
The building itself acts as an entertainment screen for those who view it from the outside. The enclosure is made of a translucent shade screen that hides or reveals the inside of the building based on the light projected on, behind, or through it. At night, the spectators inside the building become the spectator sport for those outside the building.

600 ft300 ft
150 ftRETAIL ART RESIDENTIAL EVENTSBARS FITNESS GREEN SPACE 600 ft
300 ft150 ftMARKET600 ft
300 ft150 ft 600 ft
300 ft150 ft
P
P
P
P
B
B
B
B
B
B
B
B
B
B
B B
B
BB
B
B
> 45mph < 25mph
N
S
CITY
WATER
N
S
CITY
WATER
N
S
CITY
WATER
N
S
CITY
WATER
446’ - 0”
480’ - 0”55’ - 0”
20’ - 0”
VELUX Electric Venting Skylight
Installed within the Bucks logo on the roof are various operable skylights that are connected to an automated system that open up to the night sky for night ventilation during the summer
2' - 0"
5' - 0"
RETAIL AND RESTAURANTS LEASABLE OFFICE AREA MAIN CIRCULATION VIEWS
15’-0”
60’-0”
95’-0”

SummerfestGrounds
Historic Third Ward
Kilbourn Town
EastTown
The name of the city of Milwaukee comes from the Patowatomi word Minwaking meaning gathering place by the water. This site at the south peninsula has been left undeveloped for decades and is prime real estate to host events by the water, act as spill over space for Summerfest (the largest summer music festival in the world), and revitalize the neighborhood by activating the site all times of the year.
Milwaukeeans are active. This arena and recreation center holds a large sporting goods store with a climbing wall that spans two stories and a three-fl oor fi tness center. Accessible from the street, the recreation center is embedded into the arena, surrounding the visitors in the game experience once inside. The ground fl oor is dedicated to shops such as a kayak and canoe rental store, a Bucks team store, and a donor’s club space that could be rented out for private events.
The building itself acts as an entertainment screen for those who view it from the outside. The enclosure is made of a translucent shade screen that hides or reveals the inside of the building based on the light projected on, behind, or through it. At night, the spectators inside the building become the spectator sport for those outside the building.
600 ft300 ft
150 ftRETAIL ART RESIDENTIAL EVENTSBARS FITNESS GREEN SPACE 600 ft
300 ft150 ftMARKET600 ft
300 ft150 ft 600 ft
300 ft150 ft
P
P
P
P
B
B
B
B
B
B
B
B
B
B
B B
B
BB
B
B
> 45mph < 25mph
N
S
CITY
WATER
N
S
CITY
WATER
N
S
CITY
WATER
N
S
CITY
WATER
446’ - 0”
480’ - 0”55’ - 0”
20’ - 0”
VELUX Electric Venting Skylight
Installed within the Bucks logo on the roof are various operable skylights that are connected to an automated system that open up to the night sky for night ventilation during the summer
2' - 0"
5' - 0"
RETAIL AND RESTAURANTS LEASABLE OFFICE AREA MAIN CIRCULATION VIEWS
15’-0”
60’-0”
95’-0”
The proposal offers a place of activity all year round for Milwaukee, WI. It adds to the plethora of activities one can do by the water. It also makes for an active space that caters to visitors and residents alike.

“Measure twice, cut once.”

BUILD

BUILD
A VENEER CHAIR: LIKE FABRIC HANGING BETWEEN A FRAME
ANNIE CHIANG
AALTO - PAIMIO ARMCHAIR
WEGNER - SHELL CHAIR
PRECEDENTS
WEGNER - PAPA BEAR CHAIR
WEGNER - PP240
JUHL- 136
PROCESS
CONCEPTS
WEGNER- TUB CHAIR

ANNIE CHIANG
AALTO - PAIMIO ARMCHAIR
WEGNER - SHELL CHAIR
PRECEDENTS
WEGNER - PAPA BEAR CHAIR
WEGNER - PP240
JUHL- 136
PROCESS
CONCEPTS
WEGNER- TUB CHAIR
Inspired by the famous Danish furniture designers, I was given the opportunity to design a chair made of veneer that was honest to the material and expressed fine craftsmanship. Veneer is a malleable material that can make curvy, organic forms, but it also can make rigid, structural forms. My goal was to make a comfortable lounge chair that explores this dichotomy in these unique material properties.
In my design, the legs express the “rigid” and the seat expresses the “organic”. The legs are made of layers of ash and beech, the seat is made of layers of maple and ash. Dowels connect the seat to the legs, with the seat literally hanging in space between the frame of the legs. The effect: like fabric hanging between a frame.


Photo Credit: Frank Cerri

“...dance is about the approachability and malleability of structures: How do we all occupy space? And how do we co-occupy it?” - Bob Hicks Oregon Artswatch
BUILD
DON’T LEAVE ME: A COLLABORTION OF SPACE, DANCE, + MUSIC
For more visit:https://www.youtube.com/watch?v=MDkAMqYys2g
Photo Credit: Michael Kevin Daly
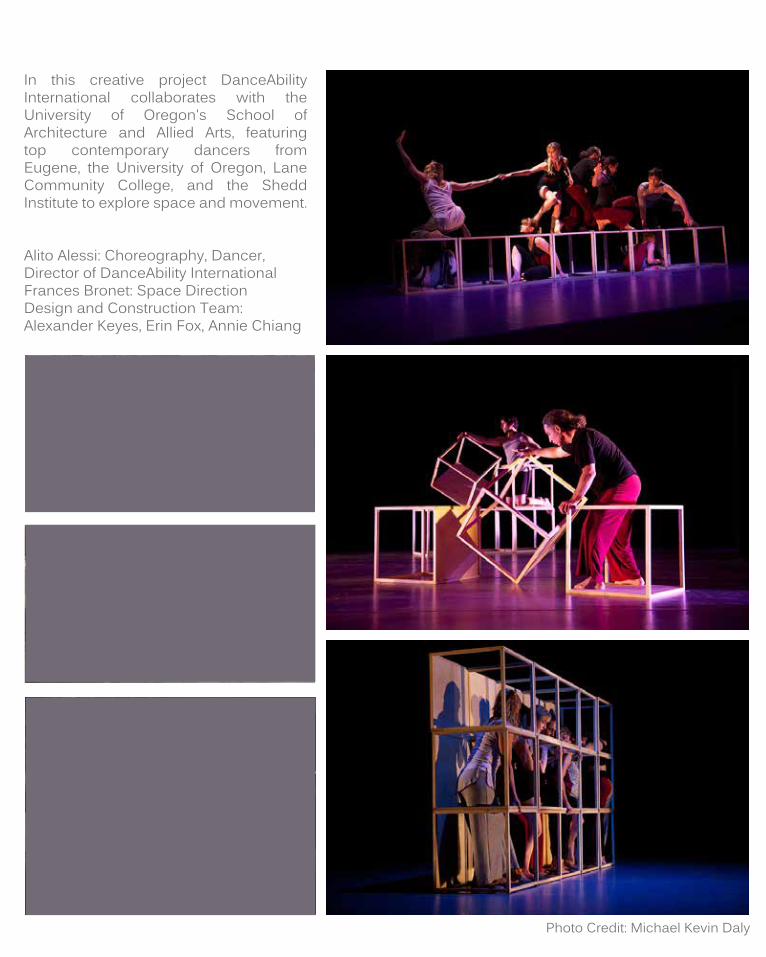
In this creative project DanceAbility International collaborates with the University of Oregon's School of Architecture and Allied Arts, featuring top contemporary dancers from Eugene, the University of Oregon, Lane Community College, and the Shedd Institute to explore space and movement.
Alito Alessi: Choreography, Dancer, Director of DanceAbility InternationalFrances Bronet: Space DirectionDesign and Construction Team:Alexander Keyes, Erin Fox, Annie Chiang
Photo Credit: Michael Kevin Daly

“To create, one must first question everything.” – Eileen Gray

RESEARCH

RESEARCH
STELLAR APARTMENTS: A STUDY of ENERGY P E R F O R M A N C E
SEP74%
OCT55%
NOV50%
DEC51%
JAN59%
FEB64%
MAR69%
APR77%
MAY90%
JUN97%
JUL0%
AUG0%
SEP0%
OCT0%
NOV30%
DEC30%
JAN44%
*INDICATES MONTHS THERMOSTAT WAS BROKEN IN A PASSIVE HOUSE UNIT
OUTD
OOR
TEMP
ERAT
URE
(
TOTA
L MON
THLY
HEA
T US
E (kW
h)
MONTH AND YEAR
ºF)
0
10
20
30
40
50
60
70
80
90
0
500
1000
1500
2000
2500
3000
3500
4000
4500
111
713
1303
2122
1343
943
385
232
28 885
6 47
260
1286 13061399
424
1598
2604
4323
3284
2590
1241
996
286224
7 0 34
247
1830 1856
2483
SEP 2013 OCT 2013 NOV 2013 DEC2013* JAN 2014* FEB 2014* MAR 2014* APR 2014* MAY 2014 JUN 2014 JUL 2014 AUG 2014 SEP 2014 OCT 2014 NOV 2014 DEC 2014 JAN 2015
77.7
70.5 º F
52.3º F
11.5º F
º F
26.2ºF
= PASSIVE HOUSE = EARTH ADVANTAGE
The Stellar Apartments What is Passive House?Passive House is a certifi cation that boasts 70% better than code for overall energy performance. From the wall section on the left, the Passive House building has a much thicker wall that consists of more exterior insulation than the Earth Advantage building.
How did December compare to June?
Earth Advantage is a certifi cation that boasts 10% better than code in overall energy performance. From the wall section on the left, you can see that the Earth Advantage wall is similar to conventional light frame wood construction with insulation between studs.
How did December compare to June?
What is Earth Advantage?
The Stellar Apartments is a 54-building multi-family affordable housing development in west Eugene owned by St. Vincent De Paul Society of Lane County. Two buildings were built as a pilot to test Passive House against Earth Advantage. The two buildings are built side by side with the same amount of units and the same design in fl oor plans. The difference is in the construction of the building envelope. This difference in envelope creates an opportunity to analyze and compare the energy consumption between Passive House and Earth Advantage over the course of 2 years.
Methodology:Each unit in the PH and EA buildings has a monitoring system at the panel box by PowerWise Systems called Site Sage, measuring end-use energy: space heating, ERV (PH only), water heater, washer, dryer, refrigerator, range, interior temperature, relative humidity, and outdoor weather conditions. We verifi ed the SiteSage monitoring system data with handheld sensors for temperature, humidity, and VOCs. We also installed CO2 monitors to verify correlation of VOCs to ventilation effectiveness. Each month’s data are downloaded from SiteSage to an Excel fi le for the various analyses.
Initial Findings:Over the fi rst year, fi ndings show that occupants of the PH units are using approximately 59% less space heating energy than occupants in the EA units and in the transitional season (September/October) there was a lag time of about a week or so before the PH occupants turned on their space heating. The overall energy use “pie” averages are similar between PH and EA except for space heating and plug loads, however occupant behavior indicates strong potential for savings. Early measurements of carbon dioxide levels in both buildings show good ventilation effectiveness.
SAVINGS
Student Researchers: Annie Chiang, Ryan Dirks, Lindsay Rasmussen, Eric Schmidt, Ashley Tuffo, Matthew Roberts, Gabrielle Steffel, Karen Tse, Ayush Vaidya
Faculty Advisor: Alison Kwok
Total Monthly Heating Energy Use Comparisons for 2013-15
December 2013 Energy Use in Passive House
June 2014 Energy Use in Passive House
December 2013 Energy Use in Earth Advantage
June 2014 Energy Use in Earth Advantage
Annual Energy Pie of End Use Appliances
Passive House Earth Advantage
The Stellar Apartments is the nation’s first passive house certified multi-family affordable housing development. It is a 54-building development in west Eugene owned by St. Vincent De Paul Society of Lane County. Two buildings were built as a pilot to test Passive House against Earth Advantage. The two buildings are built side by side with the same amount of units and the same design in floor plans. The difference is in the construction of the building envelope. This difference in envelope creates an opportunity to analyze and compare the energy consumption between Passive House and Earth Advantage over the course of 2 years.
Each unit in the PH and EA buildings has a monitoring system at the panel box by PowerWise Systems called Site Sage, measuring end-use energy: space heating, ERV (PH only), water heater, washer, dryer, refrigerator, range, interior temperature, relative humidity, and outdoor weather conditions. Each month’s data are downloaded from SiteSage to an Excel file for the various analyses.
SEP74%
OCT55%
NOV50%
DEC51%
JAN59%
FEB64%
MAR69%
APR77%
MAY90%
JUN97%
JUL0%
AUG0%
SEP0%
OCT0%
NOV30%
DEC30%
JAN44%
*INDICATES MONTHS THERMOSTAT WAS BROKEN IN A PASSIVE HOUSE UNIT
OUTD
OOR
TEMP
ERAT
URE
(
TOTA
L MON
THLY
HEA
T US
E (kW
h)
MONTH AND YEAR
ºF)
0
10
20
30
40
50
60
70
80
90
0
500
1000
1500
2000
2500
3000
3500
4000
4500
111
713
1303
2122
1343
943
385
232
28 885
6 47
260
1286 13061399
424
1598
2604
4323
3284
2590
1241
996
286224
7 0 34
247
1830 1856
2483
SEP 2013 OCT 2013 NOV 2013 DEC2013* JAN 2014* FEB 2014* MAR 2014* APR 2014* MAY 2014 JUN 2014 JUL 2014 AUG 2014 SEP 2014 OCT 2014 NOV 2014 DEC 2014 JAN 2015
77.7
70.5 º F
52.3º F
11.5º F
º F
26.2ºF
= PASSIVE HOUSE = EARTH ADVANTAGE
The Stellar Apartments What is Passive House?Passive House is a certifi cation that boasts 70% better than code for overall energy performance. From the wall section on the left, the Passive House building has a much thicker wall that consists of more exterior insulation than the Earth Advantage building.
How did December compare to June?
Earth Advantage is a certifi cation that boasts 10% better than code in overall energy performance. From the wall section on the left, you can see that the Earth Advantage wall is similar to conventional light frame wood construction with insulation between studs.
How did December compare to June?
What is Earth Advantage?
The Stellar Apartments is a 54-building multi-family affordable housing development in west Eugene owned by St. Vincent De Paul Society of Lane County. Two buildings were built as a pilot to test Passive House against Earth Advantage. The two buildings are built side by side with the same amount of units and the same design in fl oor plans. The difference is in the construction of the building envelope. This difference in envelope creates an opportunity to analyze and compare the energy consumption between Passive House and Earth Advantage over the course of 2 years.
Methodology:Each unit in the PH and EA buildings has a monitoring system at the panel box by PowerWise Systems called Site Sage, measuring end-use energy: space heating, ERV (PH only), water heater, washer, dryer, refrigerator, range, interior temperature, relative humidity, and outdoor weather conditions. We verifi ed the SiteSage monitoring system data with handheld sensors for temperature, humidity, and VOCs. We also installed CO2 monitors to verify correlation of VOCs to ventilation effectiveness. Each month’s data are downloaded from SiteSage to an Excel fi le for the various analyses.
Initial Findings:Over the fi rst year, fi ndings show that occupants of the PH units are using approximately 59% less space heating energy than occupants in the EA units and in the transitional season (September/October) there was a lag time of about a week or so before the PH occupants turned on their space heating. The overall energy use “pie” averages are similar between PH and EA except for space heating and plug loads, however occupant behavior indicates strong potential for savings. Early measurements of carbon dioxide levels in both buildings show good ventilation effectiveness.
SAVINGS
Student Researchers: Annie Chiang, Ryan Dirks, Lindsay Rasmussen, Eric Schmidt, Ashley Tuffo, Matthew Roberts, Gabrielle Steffel, Karen Tse, Ayush Vaidya
Faculty Advisor: Alison Kwok
Total Monthly Heating Energy Use Comparisons for 2013-15
December 2013 Energy Use in Passive House
June 2014 Energy Use in Passive House
December 2013 Energy Use in Earth Advantage
June 2014 Energy Use in Earth Advantage
Annual Energy Pie of End Use Appliances
Passive House Earth Advantage
This project was awarded the 6th Annual Graduate Student Research Forum Poster Session Award. More Info at: http://gradforum.uoregon.edu/
Research Team led by Professor Alison Kwok:Annie Chiang, Karen Tse, Gabrielle Steffel, Ayush Vaidya, Matthew Roberts, Ryan Dirks, Ashley Tuffo, Eric Schmidt, Lindsay Rasmussen.

SEP74%
OCT55%
NOV50%
DEC51%
JAN59%
FEB64%
MAR69%
APR77%
MAY90%
JUN97%
JUL0%
AUG0%
SEP0%
OCT0%
NOV30%
DEC30%
JAN44%
*INDICATES MONTHS THERMOSTAT WAS BROKEN IN A PASSIVE HOUSE UNIT
OUTD
OOR
TEMP
ERAT
URE
(
TOTA
L MON
THLY
HEA
T US
E (kW
h)
MONTH AND YEAR
ºF)
0
10
20
30
40
50
60
70
80
90
0
500
1000
1500
2000
2500
3000
3500
4000
4500
111
713
1303
2122
1343
943
385
232
28 885
6 47
260
1286 13061399
424
1598
2604
4323
3284
2590
1241
996
286224
7 0 34
247
1830 1856
2483
SEP 2013 OCT 2013 NOV 2013 DEC2013* JAN 2014* FEB 2014* MAR 2014* APR 2014* MAY 2014 JUN 2014 JUL 2014 AUG 2014 SEP 2014 OCT 2014 NOV 2014 DEC 2014 JAN 2015
77.7
70.5 º F
52.3º F
11.5º F
º F
26.2ºF
= PASSIVE HOUSE = EARTH ADVANTAGE
The Stellar Apartments What is Passive House?Passive House is a certifi cation that boasts 70% better than code for overall energy performance. From the wall section on the left, the Passive House building has a much thicker wall that consists of more exterior insulation than the Earth Advantage building.
How did December compare to June?
Earth Advantage is a certifi cation that boasts 10% better than code in overall energy performance. From the wall section on the left, you can see that the Earth Advantage wall is similar to conventional light frame wood construction with insulation between studs.
How did December compare to June?
What is Earth Advantage?
The Stellar Apartments is a 54-building multi-family affordable housing development in west Eugene owned by St. Vincent De Paul Society of Lane County. Two buildings were built as a pilot to test Passive House against Earth Advantage. The two buildings are built side by side with the same amount of units and the same design in fl oor plans. The difference is in the construction of the building envelope. This difference in envelope creates an opportunity to analyze and compare the energy consumption between Passive House and Earth Advantage over the course of 2 years.
Methodology:Each unit in the PH and EA buildings has a monitoring system at the panel box by PowerWise Systems called Site Sage, measuring end-use energy: space heating, ERV (PH only), water heater, washer, dryer, refrigerator, range, interior temperature, relative humidity, and outdoor weather conditions. We verifi ed the SiteSage monitoring system data with handheld sensors for temperature, humidity, and VOCs. We also installed CO2 monitors to verify correlation of VOCs to ventilation effectiveness. Each month’s data are downloaded from SiteSage to an Excel fi le for the various analyses.
Initial Findings:Over the fi rst year, fi ndings show that occupants of the PH units are using approximately 59% less space heating energy than occupants in the EA units and in the transitional season (September/October) there was a lag time of about a week or so before the PH occupants turned on their space heating. The overall energy use “pie” averages are similar between PH and EA except for space heating and plug loads, however occupant behavior indicates strong potential for savings. Early measurements of carbon dioxide levels in both buildings show good ventilation effectiveness.
SAVINGS
Student Researchers: Annie Chiang, Ryan Dirks, Lindsay Rasmussen, Eric Schmidt, Ashley Tuffo, Matthew Roberts, Gabrielle Steffel, Karen Tse, Ayush Vaidya
Faculty Advisor: Alison Kwok
Total Monthly Heating Energy Use Comparisons for 2013-15
December 2013 Energy Use in Passive House
June 2014 Energy Use in Passive House
December 2013 Energy Use in Earth Advantage
June 2014 Energy Use in Earth Advantage
Annual Energy Pie of End Use Appliances
Passive House Earth Advantage
Over the first year, findings show that occupants of the PH units are using approximately 59% less space heating energy than occupants in the EA units. The overall energy use “pie” averages are similar between PH and EA except for space heating and plug loads, however occupant behavior indicates strong potential for savings. Early measurements of carbon dioxide levels in both buildings show good ventilation effectiveness.
SEP74%
OCT55%
NOV50%
DEC51%
JAN59%
FEB64%
MAR69%
APR77%
MAY90%
JUN97%
JUL0%
AUG0%
SEP0%
OCT0%
NOV30%
DEC30%
JAN44%
*INDICATES MONTHS THERMOSTAT WAS BROKEN IN A PASSIVE HOUSE UNIT
OUTD
OOR
TEMP
ERAT
URE
(
TOTA
L MON
THLY
HEA
T US
E (kW
h)
MONTH AND YEAR
ºF)
0
10
20
30
40
50
60
70
80
90
0
500
1000
1500
2000
2500
3000
3500
4000
4500
111
713
1303
2122
1343
943
385
232
28 885
6 47
260
1286 13061399
424
1598
2604
4323
3284
2590
1241
996
286224
7 0 34
247
1830 1856
2483
SEP 2013 OCT 2013 NOV 2013 DEC2013* JAN 2014* FEB 2014* MAR 2014* APR 2014* MAY 2014 JUN 2014 JUL 2014 AUG 2014 SEP 2014 OCT 2014 NOV 2014 DEC 2014 JAN 2015
77.7
70.5 º F
52.3º F
11.5º F
º F
26.2ºF
= PASSIVE HOUSE = EARTH ADVANTAGE
The Stellar Apartments What is Passive House?Passive House is a certifi cation that boasts 70% better than code for overall energy performance. From the wall section on the left, the Passive House building has a much thicker wall that consists of more exterior insulation than the Earth Advantage building.
How did December compare to June?
Earth Advantage is a certifi cation that boasts 10% better than code in overall energy performance. From the wall section on the left, you can see that the Earth Advantage wall is similar to conventional light frame wood construction with insulation between studs.
How did December compare to June?
What is Earth Advantage?
The Stellar Apartments is a 54-building multi-family affordable housing development in west Eugene owned by St. Vincent De Paul Society of Lane County. Two buildings were built as a pilot to test Passive House against Earth Advantage. The two buildings are built side by side with the same amount of units and the same design in fl oor plans. The difference is in the construction of the building envelope. This difference in envelope creates an opportunity to analyze and compare the energy consumption between Passive House and Earth Advantage over the course of 2 years.
Methodology:Each unit in the PH and EA buildings has a monitoring system at the panel box by PowerWise Systems called Site Sage, measuring end-use energy: space heating, ERV (PH only), water heater, washer, dryer, refrigerator, range, interior temperature, relative humidity, and outdoor weather conditions. We verifi ed the SiteSage monitoring system data with handheld sensors for temperature, humidity, and VOCs. We also installed CO2 monitors to verify correlation of VOCs to ventilation effectiveness. Each month’s data are downloaded from SiteSage to an Excel fi le for the various analyses.
Initial Findings:Over the fi rst year, fi ndings show that occupants of the PH units are using approximately 59% less space heating energy than occupants in the EA units and in the transitional season (September/October) there was a lag time of about a week or so before the PH occupants turned on their space heating. The overall energy use “pie” averages are similar between PH and EA except for space heating and plug loads, however occupant behavior indicates strong potential for savings. Early measurements of carbon dioxide levels in both buildings show good ventilation effectiveness.
SAVINGS
Student Researchers: Annie Chiang, Ryan Dirks, Lindsay Rasmussen, Eric Schmidt, Ashley Tuffo, Matthew Roberts, Gabrielle Steffel, Karen Tse, Ayush Vaidya
Faculty Advisor: Alison Kwok
Total Monthly Heating Energy Use Comparisons for 2013-15
December 2013 Energy Use in Passive House
June 2014 Energy Use in Passive House
December 2013 Energy Use in Earth Advantage
June 2014 Energy Use in Earth Advantage
Annual Energy Pie of End Use Appliances
Passive House Earth Advantage

[email protected] I anniechiang.weebly.com I 626.374.0536


