41
1999 Annual Report

1999Annual Report

19 9 9 A N N U A L R E P O R T

D E A R S H A R E H O L D E R :
1999 was another record year for Ann Taylor. We achieved a considerable milestone, as our annual sales surpassed $1 billion,
and our earnings exceeded last year’s all-time high, reaching $2.08* per share. These results are gratifying. They continue to
affirm our strategic direction and, most importantly, our unwavering focus on delighting our clients.
Two years ago, we introduced our strategic plan. Our goal was straightforward: we wanted to improve our ability to consistently
and efficiently deliver on our clients’ expectations. To do this, we needed to develop a deeper understanding of our clients,
strengthen our business processes across the organization, and cultivate an inspirational, team-oriented culture. These efforts
were designed to bring greater consistency to our sales and earnings growth. They would ideally position our Company
to leverage the core equities of the Ann Taylor brand.
In our letter to you last year, we were pleased to report that the first stage of the plan was working. Our improved profitability
reflected our increasingly effective infrastructure and our clients’ positive response to the changes we were making.
Over this past year, we have continued to make progress toward our strategic initiatives, and our success
has continued to build. We are developing the resources, alignment and talent we need to capitalize on our growing knowledge
about our clients. And we are driving our business with an increasingly unified, Company-wide approach.
As we execute the next level of our plan, we will intensify our on-going client-centered initiatives. We will also apply our business
process discipline to managing our growth, as we prioritize and continue to capitalize on the vast opportunities inherent in the
Ann Taylor brand.
*On a diluted basis, before extraordinary item of $0.03 per share.

P A G E 3 1 9 9 9 A N N U A L R E P O R T
1999Annual Report

F I N A N C I A L H I G H L I G H T S
In 1999, sales increased 18.9% over the previous year. This was a result of comparable store sales increases throughout the year, and our
store expansion program which added over 40 new stores to our growing fleet. We earned net income of $65.5 million, or $2.08 per share
on a diluted basis before extraordinary item—a 44.4% increase over last year.
We have continued to achieve annual increases in our gross margin rate through the integration of our sourcing and merchandising functions
and through refinement of our product lifecycle processes.
We also continue to operate more efficiently and effectively throughout the Company. Our process improvements are enabling us to leverage
our selling, general and administrative expenditures as we increase sales. This also allows us to support our strategic growth initiatives,
including marketing, information systems and our Internet e-commerce site development.
Our corporate refinancing project also benefited earnings. In the summer of 1999, we called for the redemption of two debt instruments we
had outstanding, and replaced them with an issue of new deep-discount convertible debentures due 2019. As a result, we reduced our annual
interest expense by approximately $13 million, reduced our long-term obligations by approximately $87 million and increased shareholders’
equity by $96.6 million.
Cash flow was strong throughout the year. We invested $53.4 million in capital expenditures, returned nearly $90 million to shareholders—
buying back over 3 million shares of our common stock through a share repurchase program—and ended the year with $35 million in the
bank. For the third year in a row, we had no need for any borrowings under our revolving credit facility.
Ann Taylor is on solid financial ground. This provides a strong foundation for us to execute the next level of our strategic plan.

P A G E 5 1 9 9 9 F I N A N C I A L H I G H L I G H T S
Financial Highlights
F Y 9 7 F Y 9 8 F Y 9 9
G R O S S M A R G I N
F Y 9 7 F Y 9 8 F Y 9 9
C O M PA R A B L E S T O R E S A L E S
47.3%
50.0%50.6%
7.9%
-5.5%
8.4%
F Y 9 7 F Y 9 8 F Y 9 9
S G & A E X P E N S E A SA P E R C E N T O F S A L E S
39.5%
38.4%38.1%

Strategic Initiatives
S T R AT E G I C I N I T I AT I V E S
Our plans for Ann Taylor’s growth concentrate on two highly synergistic strategic initiatives. We are committed to developing
uniquely meaningful relationships with our clients and, simultaneously, to leveraging our brand to best fulfill their lifestyle needs.
The ultimate goal of these initiatives remains absolutely steadfast. We want each of our Associates’ actions, every day, to focus
on delighting our clients.
What will set us apart will be our ability to interpret these concepts in the most salient way to our clients, and to execute this
vision consistently across all aspects of our business.

P A G E 7 S T R A T E G I C I N I T I A T I V E S
B U I L D I N G C L I E N T R E L AT I O N S H I P S
Our relationships with our clients are the heart of our business. Ann Taylor clients are exceptionally loyal to our brand. We are pursuing an
integrated program of initiatives to continuously strengthen this bond.
L E A R N I N G F R O M O U R C L I E N T S
The first step in enhancing our relationships with our clients, and truly delighting them, is to listen to them. Women’s lifestyles are evolving
rapidly. Modern women know what they want, and they are very clear about what they expect from us. We have launched a series of programs
to add to our learning from our on-going quantitative and qualitative market research.
We inaugurated the Ann Taylor Client Advisory Panel in 1999. This is a strategically selected group of clients who provide us with on-going,
in-depth information about issues ranging from the effectiveness of their personal wardrobes, to feedback about our seasonal offerings.
Our communication and growing relationships with these women are already proving invaluable to our merchandise planning.
In 1999, we also initiated a comprehensive study of our clients’ in-store shopping patterns. This detailed, statistical information is providing
us with insights into how to enhance our service environment.
Information technology will also aid us in understanding our clients’ needs. In 1999, we completed our advanced merchandising information
system, which we told you about last year. Among other things, this system will provide us with the ability to better analyze our clients’
preferences on a regional and individual store basis, and to more precisely customize our assortments to meet their preferences. We piloted
the new system with four merchandise categories at the end of the year, and will roll it out to all of our product teams in the spring of 2000.
E N H A N C I N G O U R C L I E N T I N T E R A C T I O N S
Our Store Associates, the Ann Taylor front line, have significant opportunities to influence our relationships with our clients, every day. During
1999 we developed and piloted an intensive training program. It is designed to elevate all of our Store Associates’ wardrobing knowledge and
client relationship skills to measurably high standards. As we discussed last year, this will augment our position as our clients’ style authority.
We will spearhead the first module of this groundbreaking initiative later this year.
To improve all aspects of our clients’ experiences in our stores, we are reevaluating and evolving our store environment and operational
processes, working toward reducing transaction time, and enhancing our store design and product presentation standards.
Our relationships with our clients, however, reach far beyond the walls of our stores. We continuously refine our direct marketing
strategies to speak to our clients with a combination of vehicles to which they best respond. We are also expanding the capabilities of
our 1-800-DIAL-ANN information telephone service, as it has become a valuable resource for our clients.
The Internet represents an excellent opportunity for Ann Taylor to deepen our relationships with our clients. We conducted rigorous research
and analysis of potential strategies for an Ann Taylor Web site. We have determined that we have potential for substantial additional sales,
brand-building activities and enhanced client service and communication through our own e-commerce site. We will finalize our Internet entry
strategy during the upcoming year.
All of our relationship-building initiatives, whether delivered in person, through the mail or over the Internet, must be fully integrated with the
Ann Taylor brand identity. We are committed to maintaining consistency in our clients’ perception of what we stand for, and how we are
relevant to their lifestyles.

O U R L E A D I N G L I F E S T Y L E B R A N D P O S I T I O N I N G
The Ann Taylor client is a woman of style and substance. Pleasing her has always been about helping her create a modern, yet classic
wardrobe. Each season we provide new designs that coordinate with those from previous seasons. Over the years, we have continued to
evolve a much fuller interpretation of wardrobing. Now, we not only provide complementary designs from season to season, and from head
to toe, but collections that include highly versatile coordinating pieces that fulfill our clients’ needs across her wardrobe, spanning the
spectrum from her most refined to her most relaxed apparel needs.
Ann Taylor has built a reputation as an important resource for the professional woman. Over the past several years, as many workplaces have
become more casual, our wardrobing strategy has enhanced our position as the authority for our clients’ work apparel needs. Our growing
knowledge of our clients’ evolving lifestyles has led us to expand our refined separates offerings and enrich our tops assortment. Thus, even
as her career clothes become less structured, the Ann Taylor woman can continue to feel polished and perfectly put together—leveraging her
wardrobe purchases for professional and personal occasions.
Quality, fit and value are still of paramount importance. In our partnerships with our suppliers, we have raised our standards and created new
systems to ensure we consistently exceed our clients’ expectations in all of these areas.
M A R K E T I N G
Ann Taylor’s marketing program has become a powerful tool to communicate our brand identity on a national level. Our aspirational imagery
reflects Ann Taylor’s modern, feminine style and relevance to our clients’ multi-faceted lives.
In 1999, we heightened our communication with our clients and built brand awareness with our increased outdoor advertising presence, direct
mail and an on-going national magazine campaign. Simultaneously, we are reinforcing the effect of our brand imagery with unified in-store
graphics and dynamic visual merchandising.
P R O D U C T E X T E N S I O N S
Product extensions continue to be a fertile area for us to develop as we go forward. In 2000, our new Ann Taylor Beauty division will be piloting
color cosmetics in a select test group of our stores. Our clients’ response to our research suggests that this will be a natural addition to our
wardrobing concept, improving our ability to save our clients time and further coordinating the Ann Taylor look.
A N N TA Y L O R L O F T
Ann Taylor Loft is the second expression of the Ann Taylor brand. Our Ann Taylor Loft stores leverage our reputation and expand our brand
to a client with a more relaxed lifestyle in the upper-moderate-priced segment.
Since first introducing Ann Taylor Loft stores to regional malls and shopping centers in 1998, we have developed a fleet of over 40 Loft stores
in these environments. Loft continues to provide us with a considerable growth opportunity.
O U R S T O R E S
We continue to make it more convenient for our clients to shop with Ann Taylor. In 2000, we plan to add approximately 15 Ann Taylor stores
and 70 Ann Taylor Loft stores, a total square footage increase of approximately 20%. Going forward, we see significant opportunities for our
store expansion program, and are exploring new store size and location formats. For example, we recently added a new flagship location on
Michigan Avenue in Chicago, and are evaluating a flagship store strategy to bring the fullest expression of the Ann Taylor brand closer to more
of our clients.

P A G E 9 S T R A T E G I C I N I T I A T I V E S
Style and Substance

At Our Best

P A G E 1 1 A T O U R B E S T
H E L P I N G P E O P L E B E AT T H E I R B E S T
In order to best delight our external clients, we need to create the right environment for our Associates—our internal clients—to achieve their
potential and be at their best. This is what will drive our success as a company. We are also committed to working together to support our
communities at large.
I N T E R N A L C L I E N T S
Across the business, we have been cultivating the most talented team in the industry. Our Associate development efforts have been focused
on emphasizing each of our Associates’ individual strengths, and putting them in positions where they can best utilize these strengths.
Over the past two years, we also have been steadily improving our corporate culture to foster teamwork and encourage a collaborative
environment. The values and practices that guide our behavior continue to exert a positive influence on our daily interactions. Our values have
become the cornerstone of our evolution.
Our comprehensive, interactive internal communications plan is designed to ensure that all of our Associates understand the core equities of
our business, our clients’ profiles, our strategic initiatives and our values and practices.
In 1999 we also inaugurated the Ann Taylor Learning Center to support our Associates with training classes that help develop their personal
management skills, as well as educate them about our Ann Taylor heritage, our corporate culture and our values. In 2000, we will introduce
multimedia CD-ROM-based technology to our stores, so that all of our Field Associates can also benefit from our training initiatives.
We are uniting as a team. And as we grow, we find that talented Associates are seeking us out more and more, and that our quality selection
process continues to help us make optimal hiring decisions.
This past year, we reached an exciting stage in the execution of our strategic plan—certainly the most rewarding for us thus far. It is now
evolving from a series of senior management-driven initiatives, to becoming an integral, unifying goal behind all of our work together at Ann
Taylor. Progress is being driven at all levels of the organization.
This couldn’t happen without exceptional talent, enthusiasm, flexibility and pure hard work. As we have said every year, we truly appreciate
our Associates’ abilities and efforts.
O U R C O M M U N I T I E S
Last year we took our commitment to fighting breast cancer a step further. We partnered with Muzak and Arista Records to create an Ann
Taylor CD featuring top female recording artists. We also included a pink ribbon and self-examination instructions with each CD. All net profits
from the sale of this CD are being donated to the National Breast Cancer Coalition—a grass-roots advocacy organization dedicated to
increasing breast cancer research, awareness and education.
We are continuing our relationship with the Susan G. Komen Breast Cancer Foundation as well. Once again, we were proud to be a platinum
sponsor of the New York Race for the Cure. We were particularly proud that over one thousand of our New York metropolitan area Associates
participated, earning Ann Taylor the largest corporate team award for the fourth year in a row. We also sponsored our fourth annual reception
honoring breast cancer survivors at our flagship store on Madison Avenue. And Associates in cities across the country joined our clients in
participating in local Race for the Cure events.
Throughout the year, our Associates have dedicated their time and energy to food and clothing drives, fundraising events for a welfare-to-
workforce mentoring program and parties for hospitalized children. We care about helping people be at their best.
In 2000, we plan to expand the scope of our charitable efforts. We are doing research with both our internal and external clients to determine
the issues that are most important for us to support, together.

L O O K I N G A H E A D
Having progressively realigned our business processes toward a cross-functionally integrated structure, evolved our corporate
culture to support efficiency and high performance, and clearly focused our efforts on delighting our clients, we are feeling
a real sense of accomplishment, as a Company. It is truly gratifying that both our Associates and our clients are responding
to these changes.
This is not to say that we have “finished” any element of the plan. We have plenty of room for improvement in all of our
processes, functions and focus, as well as in our Company culture. Our strategic plan must also be flexible. As with any change,
we need to continue to learn from preliminary results and make adjustments as we proceed.
2000 will be the fourth year of our original five-year strategic plan. We are pleased with our progress, as we continue to execute
our current initiatives. As we broaden our plan for the next five years, we will build on these accomplishments. We are excited
to embark on the next stage of our growth toward fulfilling Ann Taylor’s extraordinary potential.
J. Patr ick Spainhour
Chairman and Chief Executive Off icer
Patr icia DeRosa
President and Chief Operating Off icer

M A N A G E M E N T ’ S D I S C U S S I O N A N D A N A LY S I S
O F F I N A N C I A L C O N D I T I O N A N D R E S U L T S O F O P E R A T I O N S
AnnTaylor Stores Corporation (the “Company”), through its subsidiaries, is a leading national specialty retailer of better quality women’s apparel,
shoes and accessories sold primarily under the Ann Taylor brand name. Unless the context indicates otherwise, all references to the Company
include the Company and its subsidiaries.
S A L E S
The following table sets forth certain sales and store data for the periods indicated:
Fiscal Year
1999 1998 1997
Net sales ($000).............................................................................................. $ 1,084,519 $ 911,939 $ 781,028
Total net sales increase (decrease) percentage ................................................ 18.9% 16.8% (2.1)%
Comparable store sales increase (decrease) percentage.................................. 8.4% 7.9% (5.5)%
Net sales per average square foot................................................................... $ 502 $ 474 $ 445
Total store square footage at end of period ..................................................... 2,280,000 2,038,000 1,808,000
Number of
New stores ............................................................................................... 47 45 27
Expanded stores....................................................................................... 8 8 9
Closed stores ........................................................................................... 7 4 12
Total stores open at end of period................................................................... 405 365 324
The Company’s net sales do not show significant seasonal variation, although net sales in the fourth quarter have historically been moderately
higher than in the other quarters. As a result, the Company has not had significant overhead and other costs generally associated with large
seasonal variations.
R E S U L T S O F O P E R A T I O N S
The following table sets forth income statement data expressed as a percentage of net sales for the periods indicated:
Fiscal Year
1999 1998 1997
Net sales ........................................................................................................ 100.0% 100.0% 100.0%
Cost of sales .................................................................................................. 49.4 50.0 52.7
Gross profit .................................................................................................... 50.6 50.0 47.3
Selling, general and administrative expenses ................................................... 38.1 38.4 39.5
Retirement of assets ....................................................................................... — 0.4 —
Amortization of goodwill .................................................................................. 1.0 1.2 1.4
Operating income ........................................................................................... 11.5 10.0 6.4
Interest income ............................................................................................... 0.4 0.2 0.1
Interest expense ............................................................................................. 1.1 2.2 2.7
Other expense, net ......................................................................................... 0.1 — —
Income before income taxes and extraordinary loss ........................................ 10.7 8.0 3.8
Income tax provision....................................................................................... 4.6 3.7 2.3
Income before extraordinary loss..................................................................... 6.1 4.3 1.5
Extraordinary loss ........................................................................................... 0.1 — —
Net income..................................................................................................... 6.0% 4.3% 1.5%
P A G E 1 3

F I S C A L 1 9 9 9 C O M P A R E D T O F I S C A L 1 9 9 8
The Company’s net sales increased to $1,084,519,000 over $911,939,000 in Fiscal 1998, an increase of $172,580,000, or 18.9%. Comparable
store sales for Fiscal 1999 increased 8.4%, compared to an increase of 7.9% in Fiscal 1998. The sales increase was primarily attributable to the
opening of new stores, the expansion of existing stores and the net increase in comparable store sales in 1999. Management believes that the
increase in comparable store sales was the result of improved customer acceptance of the Company’s product offerings and merchandise
assortment.
Gross profit as a percentage of net sales increased to 50.6% in 1999 from 50.0% in 1998. This increase in gross margin reflects a higher initial
markup rate, reflecting on-going improvements achieved by the Company’s sourcing division, offset in part by a higher markdown rate on goods
that were sold below full price.
Selling, general and administrative expenses were $413,058,000, or 38.1% of net sales, in 1999, compared to $349,955,000, or 38.4% of
net sales, in 1998. The decrease in selling, general and administrative expenses as a percentage of net sales was primarily attributable to
increased leverage on fixed expenses resulting from increased comparable store sales and improved operating efficiencies. The benefits of
this leverage were partially offset by an increase in marketing expenditures in support of the Company’s strategic initiatives to enhance the
Ann Taylor brand and increased investment in infrastructure, including the Company’s stores organization, to support the planned expansion of
the Company’s Ann Taylor Loft business.
Operating income increased to $124,407,000, or 11.5% of net sales, in 1999 from $91,587,000, or 10.0% of net sales, in 1998. Amortization
of goodwill was $11,040,000, or 1.0% of net sales, in 1999 compared to $11,040,000, or 1.2% of net sales, in 1998. Operating income without
giving effect to such amortization was $135,447,000, or 12.5% of net sales, in 1999 and $102,627,000, or 11.2% of net sales, in 1998.
Interest income was $4,378,000 in 1999 compared to $2,241,000 in 1998. The increase was primarily attributable to interest income earned on
increased cash on hand for the portion of the fiscal year prior to execution by the Company, in the second half of 1999, of the securities
repurchase program described below under “Liquidity and Capital Resources.”
Interest expense was $11,814,000 in 1999 compared to $20,358,000 in 1998. The decrease in interest expense was primarily attributable
to the redemption during the second quarter of 1999 of the preferred securities issued by AnnTaylor Finance Trust, the Company’s special
purpose finance trust, and the 83/4% Notes issued by the Company’s wholly owned subsidiary AnnTaylor, Inc. (“Ann Taylor”), described below
under “Liquidity and Capital Resources.” This reduction in interest expense was offset in part by interest expense on the Convertible
Subordinated Debentures due 2019 (the “Convertible Debentures”) issued by the Company during the second quarter of 1999, also described
below under “Liquidity and Capital Resources.” The weighted average interest rate on the Company’s outstanding indebtedness at January 29,
2000 was 3.88% compared to 8.60% at January 30, 1999.
The income tax provision was $50,221,000, or 43.4% of income before income taxes and extraordinary loss, in the 1999 period, compared to
$33,579,000, or 46.1% of income before income taxes in 1998. The effective tax rates for both periods were higher than the statutory rates,
primarily as a result of non-deductible goodwill expense.
On July 22, 1999, the Company applied the proceeds received from the issuance of the Convertible Debentures to the redemption of Ann Taylor’s
outstanding 83/4% Notes. This resulted in an extraordinary charge to earnings in Fiscal 1999 of $962,000, net of income tax benefit, or $0.03
per share on a diluted basis.
As a result of the foregoing factors, the Company had net income of $64,531,000, or 6.0% of net sales, for 1999, compared to net income
of $39,324,000, or 4.3% of net sales, for 1998.
F I S C A L 1 9 9 8 C O M P A R E D T O F I S C A L 1 9 9 7
The Company’s net sales increased to $911,939,000 in Fiscal 1998 over $781,028,000 in Fiscal 1997, an increase of $130,911,000, or 16.8%.
Comparable store sales for Fiscal 1998 increased 7.9%, compared to a decrease of 5.5% in Fiscal 1997. The sales increase was primarily
attributable to the opening of new stores, the expansion of existing stores and the net increase in comparable store sales in 1998. Management
believes that the net increase in comparable store sales was the result of improved customer acceptance of the Company’s product offerings
and merchandise assortment.
P A G E 1 4

Gross profit as a percentage of net sales increased to 50.0% in 1998 from 47.3% in 1997. As discussed in Note 1 to the Consolidated Financial
Statements, the Company elected in Fiscal 1998 to change the method by which the Company accounts for inventory, from the retail method
to the average cost method. The effect of this accounting change on Fiscal 1998 net income was an increase of $1,272,000, or $0.04 per share
on a diluted basis. Under the retail method, gross margin as a percentage of net sales would have been approximately 49.8%. The increase in
gross margin reflects continued merchandise margin improvements resulting from the maturation of the Company’s sourcing organization since
the acquisition of the Company’s sourcing joint venture in September 1996, as well as a reduction in markdowns as a percentage of sales.
Selling, general and administrative expenses were $349,955,000, or 38.4% of net sales, in 1998, compared to $308,232,000, or 39.5% of net
sales, in 1997. The decrease in selling, general and administrative expenses as a percentage of net sales was primarily attributable to increased
leverage on fixed expenses resulting from increased comparable store sales. The benefits of this leverage were partially offset by an increase in
the provision for management performance bonus expense, and an increase in marketing expenditures in support of the Company’s strategic
initiatives to enhance the Ann Taylor brand.
Operating income increased to $91,587,000, or 10.0% of net sales, in 1998 from $50,000,000, or 6.4% of net sales, in 1997. Operating income
in 1998 was reduced by $3,633,000, or 0.4% of net sales, for the retirement of certain assets in connection with the renovation of the Company’s
corporate offices. Amortization of goodwill was $11,040,000, or 1.2% of net sales, in 1998 compared to $11,040,000, or 1.4% of net sales, in
1997. Operating income without giving effect to such amortization was $102,627,000, or 11.2% of net sales, in 1998 and $61,040,000, or 7.8%
of net sales, in 1997.
Interest income was $2,241,000 in 1998 compared to $1,157,000 in 1997. The increase was primarily attributable to interest income earned on
increased cash on hand.
Interest expense was $20,358,000 in 1998 compared to $21,146,000 in 1997. The decrease in interest expense was primarily attributable
to a decrease in the Company’s outstanding long-term debt, resulting in part from the prepayment in July 1997 of a $24,500,000 term
loan. The weighted average interest rate on the Company’s outstanding indebtedness at January 30, 1999 was 8.60% compared to
8.59% at January 31, 1998.
The income tax provision was $33,579,000, or 46.1% of income before income taxes, in the 1998 period, compared to $17,466,000, or 59.3%
of income before income taxes and extraordinary loss, in 1997. The effective tax rates for both periods were higher than the statutory rates,
primarily as a result of non-deductible goodwill expense. Without giving effect to such non-deductible goodwill amortization, the Company’s
effective income tax rate was 40% of income before income taxes in the 1998 period, compared to 43% before income taxes and extraordinary
loss in the 1997 period. The decrease in the effective income tax rate resulted primarily from the implementation of additional state tax planning
and from an increase in the amount of income earned outside the United States by the Company’s non-U.S. sourcing subsidiaries.
As a result of the foregoing factors, the Company had net income of $39,324,000, or 4.3% of net sales, for 1998, compared to net income of
$11,824,000, or 1.5% of net sales, for 1997.
C H A N G E S I N F I N A N C I A L P O S I T I O N
Accounts receivable decreased to $67,092,000 at the end of 1999 from $71,049,000 at the end of 1998, a decrease of $3,957,000, or 5.6%.
This decrease was primarily attributable to construction allowance receivables, which decreased $4,079,000 to $8,406,000 in 1999.
Merchandise inventories increased to $140,026,000 at January 29, 2000 from $136,748,000 at January 30, 1999, an increase of $3,278,000,
or 2.4%. The increase in merchandise inventories is primarily due to inventory purchased for new store square footage. Merchandise inventories
at January 29, 2000 and January 30, 1999 included approximately $22,959,000 and $32,329,000, respectively, of inventory associated with the
Company’s sourcing division, which is principally finished goods in transit from factories. Total square footage increased to approximately
2,280,000 square feet at January 29, 2000 from approximately 2,038,000 square feet at January 30, 1999. Merchandise inventory on a per
square foot basis, excluding inventory associated with the Company’s sourcing division, was approximately $51 at the end of 1999 as well as
1998. Inventory turned 4.8 times in 1999 compared to 5.0 times in 1998, excluding inventory associated with the Company’s sourcing division.
Inventory turnover is determined by dividing cost of sales by the average of the cost of inventory at the beginning and end of the period (excluding
inventory associated with the sourcing division).
P A G E 1 5

L I Q U I D I T Y A N D C A P I T A L R E S O U R C E S
The Company’s primary source of working capital is cash flow from operations. The following table sets forth material measures of the
Company’s liquidity:
Fiscal Year
(dollars in thousands) 1999 1998 1997
Cash provided by operating activities . . . . . . . . . . . . . . . . . . . . . . . . . . . . . $ 98,299 $ 75,535 $ 71,589
Working capital . . . . . . . . . . . . . . . . . . . . . . . . . . . . . . . . . . . . . . . . . . . . . $ 151,368 $ 168,708 $ 122,181
Current ratio . . . . . . . . . . . . . . . . . . . . . . . . . . . . . . . . . . . . . . . . . . . 2.26:1 2.30:1 2.39:1
Debt to equity ratio . . . . . . . . . . . . . . . . . . . . . . . . . . . . . . . . . . . . . . .22:1 .24:1 .28:1
Cash provided by operating activities, as presented on the consolidated statements of cash flows, increased in 1999 principally as a result of
earnings, noncash charges and decreases in net long-term assets and receivables, partially offset by decreases in accounts payable and
accrued liabilities and increases in deferred income taxes, prepaid expenses and other current assets and merchandise inventories.
Ann Taylor’s principal credit facility is a bank credit facility that it entered into in June 1998 with a syndicate of lenders (the “Credit Facility”).
Ann Taylor uses the Credit Facility for the issuance of commercial and standby letters of credit and to provide funds for other general corporate
purposes. The lenders’ commitment under the Credit Facility was originally $150,000,000. The Credit Facility had an original maturity date of
June 30, 2000, subject to extension upon the satisfaction of certain conditions. Effective September 3, 1999, Ann Taylor elected to reduce the
commitment of the lenders under the Credit Facility by $25,000,000 to $125,000,000 and extended the term of the Credit Facility
to June 30, 2001.
Loans outstanding under the Credit Facility at any time may not exceed $50,000,000. The Company did not make any borrowings under the
loan provisions of the Credit Facility during Fiscal 1999, and there were no loans outstanding at fiscal year end. The outstanding loan balance
is required to be reduced to zero for the thirty-day period commencing January 1 each year. This cleandown period was achieved for January
2000. Maximum availability for loans and letters of credit under the Credit Facility is governed by a monthly borrowing base, determined by
the application of specified advance rates against certain eligible assets. Based on this calculation, the maximum amount available for loans and
letters of credit under the Credit Facility at January 29, 2000 was $125,000,000. Commercial and standby letters of credit outstanding under
the Credit Facility at January 29, 2000 were approximately $69,649,000.
Amounts outstanding under the Credit Facility bear interest at a rate equal to, at Ann Taylor’s option, the lead lender’s Base Rate or Eurodollar
Rate, plus a margin ranging from 0.25% to 1.00% and from 1.25% to 2.00%, respectively. In addition, Ann Taylor is required to pay the lenders
a quarterly commitment fee on the unused revolving loan commitment amount at a rate ranging from 0.375% to 0.5% per annum. Fees for
outstanding commercial and standby letters of credit range from 0.625% to 1.0% and from 1.25% to 2.0%, respectively.
The Credit Facility contains financial and other covenants, including limitations on indebtedness, liens and investments, restrictions on dividends
or other distributions to stockholders and maintenance of certain financial ratios including a specified fixed charge ratio and specified levels
of net worth.
The lenders have been granted a pledge of the common stock of Ann Taylor and certain of its subsidiaries, and a security interest in substantially
all other tangible and intangible assets, including accounts receivable, trademarks, inventory, store furniture and fixtures, of Ann Taylor and its
subsidiaries, as collateral for Ann Taylor’s obligations under the Credit Facility.
During the second quarter of Fiscal 1999, the Company completed the issuance of an aggregate of $199,072,000 principal amount at maturity
of its Convertible Debentures. The Convertible Debentures were sold at an original issue price of $552.56 per $1,000 principal amount at maturity
of Debenture. The net proceeds of the sale were applied to the redemption, described below, of the $100,000,000 outstanding 83/4%
Subordinated Notes due 2000 (the “83/4% Notes”) issued by Ann Taylor. Cash interest is payable on the principal amount at maturity of the
Convertible Debentures at the rate of 0.55% per annum. This interest rate and the accrual of original issue discount represent a yield to maturity
on the Convertible Debentures of 3.75%. The Convertible Debentures are convertible at the option of the holders thereof initially into 12.078
shares of the Company’s common stock per $1,000 principal amount at maturity of Debenture. The Convertible Debentures may be redeemed
at the Company’s option on or after June 18, 2004. The Company’s obligations with respect to the Convertible Debentures are guaranteed on
a subordinated basis by Ann Taylor.
P A G E 1 6

On July 22, 1999, Ann Taylor redeemed all of its outstanding 83/4% Notes, at a redemption price of 101.375% of principal amount, plus accrued
unpaid interest to the redemption date. The redemption of the 83/4% Notes resulted in an extraordinary charge to earnings in the second quarter
and fiscal year of $962,000, or $0.03 per share on a diluted basis, net of income tax benefit.
On June 29, 1999, the Company’s special purpose financing vehicle, AnnTaylor Finance Trust, redeemed all of its outstanding 81/2% Company
Obligated Mandatorily Redeemable Convertible Preferred Securities (“preferred securities”). All but $100,000 liquidation amount of the preferred
securities were tendered for conversion into an aggregate of 5,116,717 shares of Company common stock prior to the redemption date, at a
conversion price of $19.65 per share of common stock, or 2.545 shares of common stock per $50 liquidation amount of the security.
The 5,116,717 shares of Company common stock issued represented approximately 16% of the Company’s outstanding common stock as of
the date of issuance. Holders of preferred securities that were not tendered for conversion received a cash payment equal to 105.95% of the
liquidation amount of the preferred securities redeemed, plus accrued distributions.
Ann Taylor and its wholly owned subsidiary, AnnTaylor Distribution Services, Inc., are parties to a $7,000,000 seven-year mortgage loan maturing
in Fiscal 2002. The loan is secured by the Company’s distribution center land and building in Louisville, Kentucky. The mortgage loan
bears interest at 7.5% and is payable in monthly installments of approximately $130,000. The mortgage loan balance at January 29, 2000
was $3,950,000.
The Company’s capital expenditures totaled $53,409,000, $45,131,000 and $22,945,000, in Fiscal 1999, 1998 and 1997, respectively. Capital
expenditures were primarily attributable to the Company’s store expansion, renovation and refurbishment programs, as well as the investment
the Company made in certain information systems and, in Fiscal 1999 and 1998, the Company’s corporate offices. The Company expects its
total capital expenditure requirements in Fiscal 2000 will be approximately $78,000,000, including capital for new store construction for a
planned square footage increase of approximately 460,000 square feet, or 20%, as well as capital to support continued investments in
information systems. The actual amount of the Company’s capital expenditures will depend in part on the number of stores opened, expanded
and refurbished and on the amount of construction allowances the Company receives from the landlords of its new or expanded stores.
On September 9, 1999, the Company announced a securities repurchase program authorized by its Board of Directors, pursuant to which
the Company was authorized to purchase up to $40,000,000 of the Company’s common stock and/or Convertible Debentures, through open
market purchases and privately negotiated transactions. In January 2000, the Board of Directors authorized a $50,000,000 increase in the
securities repurchase program, bringing the total amount of securities that may be repurchased under the program to $90,000,000. In the third
and fourth quarters of 1999, the Company repurchased an aggregate of 3,012,500 shares of its common stock, for an aggregate repurchase
price of $89,900,000 (exclusive of brokerage commissions), pursuant to this program. All of the repurchased shares became treasury shares
and may be used for general corporate and other purposes. No Convertible Debentures were repurchased.
Dividends and distributions from Ann Taylor to the Company are restricted by the Credit Facility.
In order to finance its operations and capital requirements, the Company expects to use internally generated funds, trade credit and funds
available to it under the Credit Facility. The Company believes that cash flow from operations and funds available under the Credit Facility are
sufficient to enable it to meet its on-going cash needs for its business, as presently conducted, for the foreseeable future.
Effective February 1, 1998, the Company elected to change its method of inventory valuation from the retail method to the average cost method.
The Company believes the average cost method, which traces each inventory unit and its cost, is a preferable method for matching the cost of
merchandise with the revenues generated. The retail method does not provide for individual unit cost information. The cumulative effect of this
accounting change on February 1, 1998 was not material. The effect of this accounting change on Fiscal 1998 net income was an increase of
$1,272,000, or $0.04 per share on a diluted basis. It is not possible to determine the effect of the change on income in fiscal periods ending
prior to February 1, 1998 as no cost information was available.
In June 1998, the Financial Accounting Standards Board (“FASB”) issued Statement of Financial Accounting Standards (“SFAS”) No. 133,
“Accounting for Derivative Instruments and Hedging Activities” as amended by SFAS No. 137, “Accounting for Derivative Instruments and
Hedging Activities - Deferral of Effective Date of FASB Statement No. 133.” This statement establishes accounting and reporting standards
for derivative instruments embedded in other contracts, and for hedging activities. This statement is effective for all fiscal quarters for fiscal years
beginning after June 15, 1999. Management is currently evaluating the impact of this statement and believes its adoption will not affect the
Company’s consolidated financial position, results of operations or cash flows.
P A G E 1 7

S T A T E M E N T R E G A R D I N G F O R W A R D - L O O K I N G D I S C L O S U R E S
Sections of this Annual Report, including the preceding Management’s Discussion and Analysis of Financial Condition and Results of Operations,
contain various forward-looking statements, within the meaning of the Private Securities Litigation Reform Act of 1995, with respect to the
financial condition, results of operations and business of the Company. Examples of forward-looking statements are statements that use the
words “expect,” “anticipate,” “plan,” “intend,” “project,” “believe” and similar expressions. These forward-looking statements involve certain risks
and uncertainties, and no assurance can be given that any of such matters will be realized. Actual results may differ materially from those
contemplated by such forward-looking statements as a result of, among other things, failure by the Company to predict accurately customer
fashion preferences; a decline in the demand for merchandise offered by the Company; competitive influences; changes in levels of store traffic
or consumer spending habits; effectiveness of the Company’s brand awareness and marketing programs; lack of sufficient customer acceptance
of the Ann Taylor Loft concept in the upper-moderate-priced women’s apparel market; general economic conditions that are less favorable than
expected or a downturn in the retail industry; the inability of the Company to locate new store sites or negotiate favorable lease terms for
additional stores or for the expansion of existing stores; lack of sufficient consumer interest in an Ann Taylor Internet Website; a significant change
in the regulatory environment applicable to the Company’s business; an increase in the rate of import duties or export quotas with respect to
the Company’s merchandise; financial or political instability in any of the countries in which the Company’s goods are manufactured; or an
adverse outcome of the litigation referred to in Note 5 to the Consolidated Financial Statements of the Company as of January 29, 2000, that
materially and adversely affects the Company’s financial condition. The Company assumes no obligation to update or revise any such forward-
looking statements, which speak only as of their date, even if experience or future events or changes make it clear that any projected financial
or operating results implied by such forward-looking statements will not be realized.
Q U A N T I T A T I V E A N D Q U A L I T A T I V E D I S C L O S U R E A B O U T M A R K E T R I S K
The Company maintains the majority of its cash and cash equivalents in financial instruments with original maturities of three months or less.
These financial instruments are subject to interest rate risk and will decline in value if interest rates increase. Due to the short duration of these
financial instruments, a change of 100 basis points in interest rates would not have a material effect on the Company’s financial condition.
The Company’s outstanding long-term debt as of January 29, 2000 bears interest at fixed rates; therefore, the Company’s results of
operations would only be affected by interest rate changes to the extent that fluctuating rate loans are outstanding under the Credit Facility.
As of January 29, 2000, the Company has no such amounts outstanding. Future borrowings would be affected by interest rate changes;
however, the Company does not believe that a change of 100 basis points in interest rates would have a material effect on the Company’s
financial condition.
P A G E 1 8

A N N T A Y L O R S T O R E S C O R P O R A T I O N
C O N S O L I D A T E D S T A T E M E N T S O F I N C O M E
F O R T H E F I S C A L Y E A R S E N D E D J A N U A R Y 2 9 , 2 0 0 0 , J A N U A R Y 3 0 , 1 9 9 9 A N D J A N U A R Y 3 1 , 1 9 9 8
Fiscal Years Ended
(in thousands, except per share amounts) January 29, 2000 January 30, 1999 January 31, 1998
Net sales ............................................................................................ $ 1,084,519 $ 911,939 $ 781,028
Cost of sales ...................................................................................... 536,014 455,724 411,756
Gross profit ........................................................................................ 548,505 456,215 369,272
Selling, general and administrative expenses ....................................... 413,058 349,955 308,232
Retirement of assets ........................................................................... — 3,633 —
Amortization of goodwill ...................................................................... 11,040 11,040 11,040
Operating income ............................................................................... 124,407 91,587 50,000
Interest income ................................................................................... 4,378 2,241 1,157
Interest expense ................................................................................. 11,814 20,358 21,146
Other expense, net ............................................................................. 1,257 567 548
Income before income taxes and extraordinary loss ............................ 115,714 72,903 29,463
Income tax provision........................................................................... 50,221 33,579 17,466
Income before extraordinary loss......................................................... 65,493 39,324 11,997
Extraordinary loss (net of income tax benefit of $641, $0 and $130,
respectively) .................................................................................. 962 — 173
Net income......................................................................................... $ 64,531 $ 39,324 $ 11,824
Basic earnings per share:
Basic earnings per share before extraordinary loss ........................ $ 2.25 $ 1.53 $ 0.47
Extraordinary loss per share .......................................................... 0.03 — 0.01
Basic earnings per share............................................................... $ 2.22 $ 1.53 $ 0.46
Diluted earnings per share:
Diluted earnings per share before extraordinary loss ...................... $ 2.08 $ 1.44 $ 0.47
Extraordinary loss per share .......................................................... 0.03 — 0.01
Diluted earnings per share ............................................................ $ 2.05 $ 1.44 $ 0.46
See accompanying notes to consolidated financial statements.
P A G E 1 9
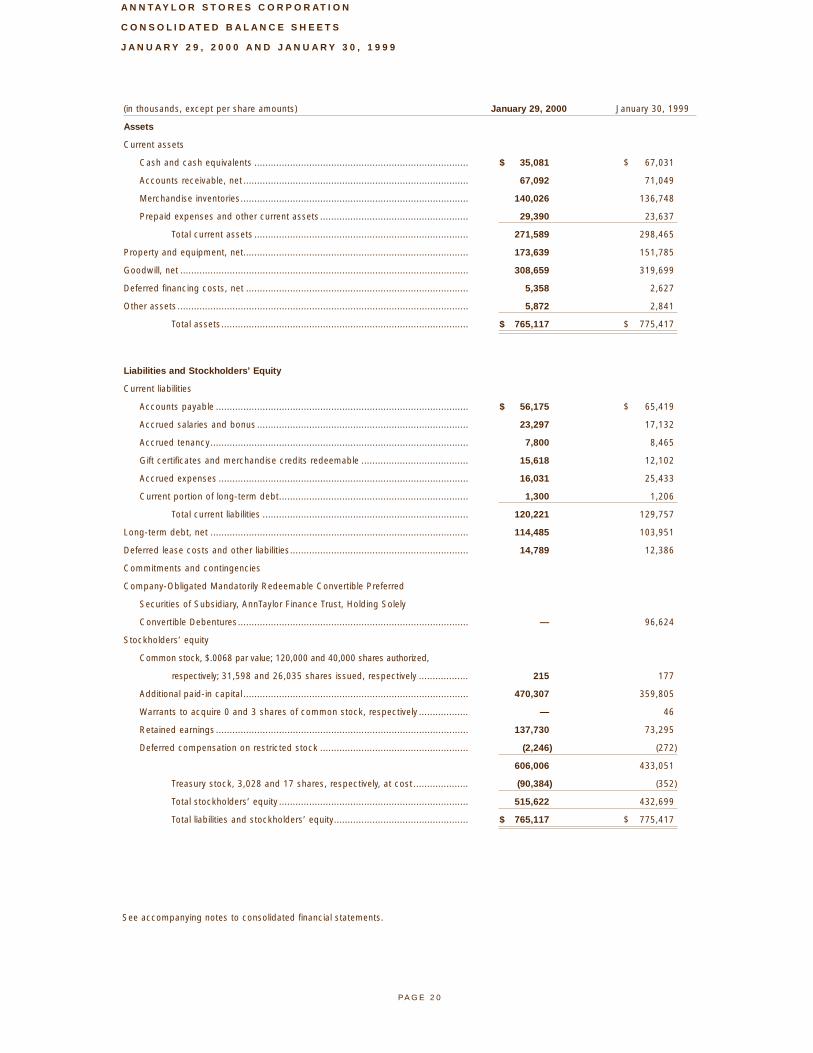
A N N T A Y L O R S T O R E S C O R P O R A T I O N
C O N S O L I D A T E D B A L A N C E S H E E T S
J A N U A R Y 2 9 , 2 0 0 0 A N D J A N U A R Y 3 0 , 1 9 9 9
(in thousands, except per share amounts) January 29, 2000 January 30, 1999
Assets
Current assets
Cash and cash equivalents .............................................................................. $ 35,081 $ 67,031
Accounts receivable, net .................................................................................. 67,092 71,049
Merchandise inventories................................................................................... 140,026 136,748
Prepaid expenses and other current assets ...................................................... 29,390 23,637
Total current assets .............................................................................. 271,589 298,465
Property and equipment, net.................................................................................. 173,639 151,785
Goodwill, net ......................................................................................................... 308,659 319,699
Deferred financing costs, net ................................................................................. 5,358 2,627
Other assets .......................................................................................................... 5,872 2,841
Total assets.......................................................................................... $ 765,117 $ 775,417
Liabilities and Stockholders’ Equity
Current liabilities
Accounts payable ............................................................................................ $ 56,175 $ 65,419
Accrued salaries and bonus ............................................................................. 23,297 17,132
Accrued tenancy.............................................................................................. 7,800 8,465
Gift certificates and merchandise credits redeemable ....................................... 15,618 12,102
Accrued expenses ........................................................................................... 16,031 25,433
Current portion of long-term debt..................................................................... 1,300 1,206
Total current liabilities ........................................................................... 120,221 129,757
Long-term debt, net .............................................................................................. 114,485 103,951
Deferred lease costs and other liabilities................................................................. 14,789 12,386
Commitments and contingencies
Company-Obligated Mandatorily Redeemable Convertible Preferred
Securities of Subsidiary, AnnTaylor Finance Trust, Holding Solely
Convertible Debentures.................................................................................... — 96,624
Stockholders’ equity
Common stock, $.0068 par value; 120,000 and 40,000 shares authorized,
respectively; 31,598 and 26,035 shares issued, respectively .................. 215 177
Additional paid-in capital .................................................................................. 470,307 359,805
Warrants to acquire 0 and 3 shares of common stock, respectively .................. — 46
Retained earnings ............................................................................................ 137,730 73,295
Deferred compensation on restricted stock ...................................................... (2,246) (272)
606,006 433,051
Treasury stock, 3,028 and 17 shares, respectively, at cost .................... (90,384) (352)
Total stockholders’ equity ..................................................................... 515,622 432,699
Total liabilities and stockholders’ equity................................................. $ 765,117 $ 775,417
See accompanying notes to consolidated financial statements.
P A G E 2 0

A N N T A Y L O R S T O R E S C O R P O R A T I O N
C O N S O L I D A T E D S T A T E M E N T S O F S T O C K H O L D E R S ’ E Q U I T Y
F O R T H E F I S C A L Y E A R S E N D E D J A N U A R Y 2 9 , 2 0 0 0 , J A N U A R Y 3 0 , 1 9 9 9 A N D J A N U A R Y 3 1 , 1 9 9 8
Additional RestrictedCommon Stock Warrants Treasury Stock
(in thousands) Shares Amount Capital Shares Amount Earnings Awards Shares Amount
Balance at February 1, 1997....... 25,598 $ 174 $ 349,545 3 $ 46 $ 22,613 $ (1,590) 12 $ (206)
Net income ................................ — — — — — 11,824 — — —
Exercise of stock options
and related tax benefit .......... 48 — 890 — — — — 1 (10)
Amortization of discount on
preferred securities ............... — — — — — (233) — — —
Activity related to common
stock issued as
employee incentives ............. 12 — 212 — — — 853 — (11)
Balance at January 31, 1998 ...... 25,658 174 350,647 3 46 34,204 (737) 13 (227)
Net income ................................ — — — — — 39,324 — — —
Exercise of stock options
and related tax benefit .......... 373 3 9,061 — — — — 3 (106)
Amortization of discount on
preferred securities ............... — — — — — (233) — — —
Activity related to common
stock issued as
employee incentives ............. 4 — 97 — — — 465 1 (19)
Balance at January 30, 1999 ...... 26,035 177 359,805 3 46 73,295 (272) 17 (352)
Net income ................................ — — — — — 64,531 — — —
Exercise of stock options
and related tax benefit .......... 352 2 10,039 — — — — 1 (55)
Amortization of discount on
preferred securities ............... — — — — — (96) — — —
Activity related to common
stock issued as
employee incentives ............. 94 1 3,850 — — — (1,974) — —
Exercise and expiration
of warrants ........................... — — 28 (3) (46) — — (3) 18
Repurchase of common stock .... — — — — — — — 3,013 (89,995)
Conversion of preferred
securities .............................. 5,117 35 96,585 — — — — — —
Balance at January 29, 2000 ...... 31,598 $ 215 $ 470,307 — $ — $ 137,730 $ (2,246) 3,028 $ (90,384)
P A G E 2 1
See accompanying notes to consolidated financial statements.
Paid-In Retained Stock

A N N TA Y L O R S T O R E S C O R P O R AT I O N
C O N S O L I D AT E D S TAT E M E N T S O F C A S H F L O W S
F O R T H E F I S C A L Y E A R S E N D E D J A N U A R Y 2 9 , 2 0 0 0 , J A N U A R Y 3 0 , 1 9 9 9 A N D J A N U A R Y 3 1 , 1 9 9 8
Fiscal Years Ended
(in thousands) January 29, 2000 January 30, 1999 January 31, 1998
Operating activities:
Net income .................................................................................... $ 64,531 $ 39,324 $ 11,824
Adjustments to reconcile net income to net cash
provided by operating activities:
Extraordinary loss ..................................................................... 1,603 — 303
Provision for loss on accounts receivable .................................. 1,032 1,476 1,795
Depreciation and amortization................................................... 30,347 28,783 27,803
Amortization of goodwill............................................................ 11,040 11,040 11,040
Amortization of deferred compensation ..................................... 1,877 465 1,065
Non-cash interest ..................................................................... 3,026 1,290 1,419
Deferred income taxes.............................................................. (3,843) 3,966 (2,687)
Loss on disposal of property and equipment............................. 1,219 4,175 248
Changes in assets and liabilities:
Decrease (increase) in receivables ....................................... 2,925 (12,314) 1,599
Decrease (increase) in merchandise inventories ................... (3,278) (39,514) 3,003
Decrease (increase) in prepaid expenses and
other current assets ...................................................... (5,680) (5,581) 1,894
Decrease in other non-current assets and
liabilities, net ................................................................. 3,131 679 2,861
Increase (decrease) in accounts payable and accrued
liabilities ........................................................................ (9,631) 41,746 9,422
Net cash provided by operating activities ........................................ 98,299 75,535 71,589
Investing activities:
Purchases of property and equipment ............................................ (53,409) (45,131) (22,945)
Net cash used by investing activities............................................... (53,409) (45,131) (22,945)
Financing activities:
Proceeds from issuance of Convertible Debentures......................... 110,000 — —
Redemption of 8 3/4% Notes ........................................................... (101,375) — —
Redemption of Company-Obligated Mandatorily Redeemable
Convertible Preferred Securities ................................................ (100) — —
Repayment of term loan ................................................................. — — (24,500)
Term loan prepayment penalty ........................................................ — — (184)
Payments of mortgage ................................................................... (1,206) (1,119) (416)
Repurchase of common stock ........................................................ (89,995) — —
Proceeds from exercise of stock options ........................................ 9,986 9,036 869
Payment of financing costs............................................................. (4,150) (2,659) (69)
Net cash provided by (used by) financing activities.......................... (76,840) 5,258 (24,300)
Net increase (decrease) in cash ............................................................ (31,950) 35,662 24,344
Cash, beginning of year........................................................................ 67,031 31,369 7,025
Cash, end of year................................................................................. $ 35,081 $ 67,031 $ 31,369
Supplemental disclosures of cash flow information:
Cash paid during the year for interest ............................................. $ 9,405 $ 18,582 $ 19,251
Cash paid during the year for income taxes .................................... $ 51,222 $ 33,934 $ 17,220
See accompanying notes to consolidated financial statements.
P A G E 2 2

A N N T A Y L O R S T O R E S C O R P O R A T I O N
N O T E S T O C O N S O L I D A T E D F I N A N C I A L S T A T E M E N T S
1 . S U M M A R Y O F S I G N I F I C A N T A C C O U N T I N G P O L I C I E S
The Company is a leading national specialty retailer of better quality women’s apparel, shoes and accessories sold principally under the
Ann Taylor brand name.
Basis of Presentation
The consolidated financial statements include the accounts of AnnTaylor Stores Corporation (the “Company”) and its subsidiaries, including
AnnTaylor, Inc. (“Ann Taylor”). The Company has no material assets other than the common stock of Ann Taylor and conducts no business other
than the management of Ann Taylor. All intercompany accounts have been eliminated in consolidation.
Certain Fiscal 1998 and 1997 amounts have been reclassified to conform to the Fiscal 1999 presentation.
Fiscal Year
The Company follows the standard fiscal year of the retail industry, which is a 52 or 53 week period ending on the Saturday closest to
January 31 of the following calendar year. All fiscal years presented include 52 weeks.
Revenue Recognition
The Company records revenue as merchandise is sold. The Company’s policy with respect to gift certificates is to record revenue as the
certificates are redeemed for merchandise. Prior to their redemption, the certificates are recorded as a liability.
Cash Equivalents
Cash and short-term highly liquid investments with original maturities of three months or less are considered cash or cash equivalents.
Merchandise Inventories
Merchandise inventories are stated at the lower of average cost or market. Effective February 1, 1998, the Company elected to change
its method of inventory valuation from the retail method to the average cost method. The Company believes the average cost method is a
preferable method for matching the cost of merchandise with the revenues generated. This is principally because the average cost method traces
each individual unit sold during a period and its individual cost, while the retail method estimates the cost value of the inventory sold, instead of
using the actual cost of each individual unit. The cumulative effect of this accounting change on February 1, 1998 was not material. The effect
of this accounting change on Fiscal 1998 net income was an increase of $1,272,000, or $0.04 per share on a diluted basis. It is not possible to
determine the effect of the change on income in any previously reported fiscal years as no cost information was available.
The majority of the Company’s inventory represents finished goods available for sale.
Property and Equipment
Property and equipment are recorded at cost. Depreciation and amortization are computed on a straight-line basis over the estimated useful
lives of the assets (3 to 40 years) or, in the case of leasehold improvements, over the lives of the respective leases, if shorter.
Deferred Financing Costs
Deferred financing costs are being amortized using the interest method over the term of the related debt. Accumulated amortization at January
29, 2000 and January 30, 1999 was $1,628,000 and $3,119,000, respectively.
Finance Service Charge Income
Income from finance service charges relating to customer receivables, which is deducted from selling, general and administrative expenses,
amounted to $8,650,000 for Fiscal 1999, $8,422,000 for Fiscal 1998 and $8,568,000 for Fiscal 1997.
Goodwill and Other Long-Lived Assets
Goodwill relating to the 1989 acquisition of Ann Taylor by the Company is being amortized on a straight-line basis over 40 years. Goodwill relating
to the acquisition, in 1996, of the operations comprising the Company’s sourcing division, is being amortized on a straight-line basis over 25
years. Accumulated amortization at January 29, 2000 and January 30, 1999 was $109,931,000 and $98,891,000, respectively.
The Company evaluates its long-lived assets for impairment annually or whenever events or changes in circumstances indicate that the carrying
value may not be recoverable. The Company compares the carrying value of its long-lived assets to an estimate of their expected future
P A G E 2 3

cash flows (undiscounted and without interest charges) to evaluate the reasonableness of the carrying value and remaining depreciation or
amortization period. If the sum of the expected future cash flows is less than the carrying amount of the asset, an impairment loss is recognized.
Advertising
Costs associated with the production of advertising, such as printing and other costs, are expensed as incurred. Costs associated with
communicating advertising that has been produced, such as magazine ads, are expensed when the advertising first takes place. Costs of direct
mail catalogs and postcards are expensed when the advertising arrives in customers’ homes. Advertising costs were $25,700,000, $17,800,000
and $10,500,000 in Fiscal 1999, 1998 and 1997, respectively.
Income Taxes
The Company accounts for income taxes in accordance with Statement of Financial Accounting Standards No. 109, “Accounting for Income
Taxes,” which requires an asset and liability method of accounting for deferred income taxes. Under the asset and liability method, deferred tax
assets and liabilities are recognized, and income or expense is recorded, for the estimated future tax consequences attributable to differences
between the financial statement carrying amounts of existing assets and liabilities and their respective tax bases.
Use of Estimates
The preparation of financial statements in conformity with generally accepted accounting principles requires management to make estimates and
assumptions that affect the reported amount of assets and liabilities and disclosures of contingent assets and liabilities at the date of the financial
statements and the reported amounts of revenue and expenses during the reported period. Actual results could differ from these estimates.
Recent Accounting Pronouncements
In June 1998, the Financial Accounting Standards Board (“FASB”) issued Statement of Financial Accounting Standards (“SFAS”) No. 133,
“Accounting for Derivative Instruments and Hedging Activities” as amended by SFAS No. 137, “Accounting for Derivative Instruments and
Hedging Activities—Deferral of Effective Date of FASB Statement No. 133.” This statement establishes accounting and reporting standards
for derivative instruments embedded in other contracts, and for hedging activities. This statement is effective for all fiscal quarters for fiscal years
beginning after June 15, 1999. Management is currently evaluating the impact of this statement and believes its adoption will not affect the
Company’s consolidated financial position, results of operations or cash flows.
2 . L O N G - T E R M D E B T
The following table summarizes long-term debt outstanding at January 29, 2000 and January 30, 1999:
January 29, 2000 January 30, 1999
Carrying Estimated Carrying Estimated(in thousands) Amount Fair Value Amount Fair Value
Mortgage........................................................................................ $ 3,950 $ 3,950 $ 5,157 $ 5,157
83⁄4% Notes .................................................................................... — — 100,000 101,875
Convertible Debentures, net............................................................ 111,835 84,606 — —
Total debt ................................................................................. 115,785 88,556 105,157 107,032
Less current portion........................................................................ 1,300 1,300 1,206 1,206
Total long-term debt ................................................................. $ 114,485 $ 87,256 $ 103,951 $ 105,826
In accordance with the requirements of Statement of Financial Accounting Standards No. 107, “Disclosures about Fair Value of Financial
Instruments,” the Company determined the estimated fair value of its financial instruments using quoted market information, as available.
As judgement is involved, the estimates are not necessarily indicative of the amounts the Company could realize in a current market exchange.
Ann Taylor’s principal credit facility is a bank credit facility that it entered into in June 1998 with a syndicate of lenders (the “Credit Facility”).
Ann Taylor uses the Credit Facility for the issuance of commercial and standby letters of credit and to provide funds for other general corporate
purposes. The lenders’ commitment under the Credit Facility was originally $150,000,000. The Credit Facility had an original maturity date of
June 30, 2000, subject to extension upon the satisfaction of certain conditions. Effective September 3, 1999, Ann Taylor elected to reduce
the commitment of the lenders under the Credit Facility by $25,000,000 to $125,000,000 and extended the term of the credit agreement to
June 30, 2001.
P A G E 2 4

Loans outstanding under the Credit Facility at any time may not exceed $50,000,000. The Company did not make any borrowings under the
loan provisions of the Credit Facility during Fiscal 1999, and there were no loans outstanding at fiscal year end. The outstanding loan balance is
required to be reduced to zero for the thirty-day period commencing January 1 each year. This cleandown period was achieved for January 2000.
Maximum availability for loans and letters of credit under the Credit Facility is governed by a monthly borrowing base, determined by the
application of specified advance rates against certain eligible assets. Based on this calculation, the maximum amount available for loans and
letters of credit under the Credit Facility at January 29, 2000 was $125,000,000. Commercial and standby letters of credit outstanding under
the Credit Facility at January 29, 2000 were approximately $69,649,000.
Amounts outstanding under the Credit Facility bear interest at a rate equal to, at Ann Taylor’s option, the lead lender’s Base Rate or Eurodollar
Rate, plus a margin ranging from 0.25% to 1.00% and from 1.25% to 2.00%, respectively. In addition, Ann Taylor is required to pay the lenders
a quarterly commitment fee on the unused revolving loan commitment amount at a rate ranging from 0.375% to 0.5% per annum. Fees for
outstanding commercial and standby letters of credit range from 0.625% to 1.0% and from 1.25% to 2.0%, respectively.
The Credit Facility contains financial and other covenants, including limitations on indebtedness, liens and investments, restrictions on dividends
or other distributions to stockholders and maintenance of certain financial ratios including a specified fixed charge coverage ratio and specified
levels of net worth.
The lenders have been granted a pledge of the common stock of Ann Taylor and certain of its subsidiaries, and a security interest in substantially
all other tangible and intangible assets, including accounts receivable, trademarks, inventory, store furniture and fixtures, of Ann Taylor and its
subsidiaries, as collateral for Ann Taylor’s obligations under the Credit Facility.
During the second quarter of Fiscal 1999, the Company completed the issuance of an aggregate of $199,072,000 principal amount at maturity
of its Convertible Subordinated Debentures due 2019 (“Convertible Debentures”). The Convertible Debentures were sold at an original issue price
of $552.56 per $1,000 principal amount at maturity of Debenture. The net proceeds of the sale were applied to the redemption, described below,
of the $100,000,000 outstanding 83/4% Subordinated Notes due 2000 (the “83/4% Notes”) issued by Ann Taylor. Cash interest is payable on the
principal amount at maturity of the Convertible Debentures at the rate of 0.55% per annum. This interest rate and the accrual of original issue
discount represent a yield to maturity on the Convertible Debentures of 3.75%. The Convertible Debentures are convertible at the option of
the holders thereof initially into 12.078 shares of the Company’s common stock per $1,000 principal amount at maturity of Debenture. The
Convertible Debentures may be redeemed at the Company’s option on or after June 18, 2004. The Company’s obligations with respect to
the Convertible Debentures are guaranteed on a subordinated basis by Ann Taylor.
On July 22, 1999, Ann Taylor redeemed all of its outstanding 83/4% Notes, at a redemption price of 101.375% of principal amount, plus accrued
unpaid interest to the redemption date. The redemption of the 83/4% Notes resulted in an extraordinary charge to earnings in the second quarter
and fiscal year of $962,000, or $0.03 per share on a diluted basis, net of income tax benefit.
Ann Taylor and its wholly owned subsidiary AnnTaylor Distribution Services, Inc. are parties to a $7,000,000 seven-year mortgage loan maturing
in Fiscal 2002. The loan is secured by the Company’s distribution center land and building in Louisville, Kentucky. The mortgage loan bears
interest at 7.5% and is payable in monthly installments of approximately $130,000. The mortgage loan balance at January 29, 2000 was
$3,950,000.
The aggregate principal payments for the next five years of all long-term obligations at January 29, 2000 are as follows:
Fiscal Year (in thousands)
2000................................................................................................................................................................................. $ 1,300
2001................................................................................................................................................................................. 1,400
2002................................................................................................................................................................................. 1,250
2003................................................................................................................................................................................. —
2004................................................................................................................................................................................. —
Total ........................................................................................................................................................................... $ 3,950
P A G E 2 5

3 . P R E F E R R E D S E C U R I T I E S
In April and May of Fiscal 1996, the Company completed the sale of an aggregate of $100,625,000 of 81/2% Company-Obligated Mandatorily
Redeemable Convertible Preferred Securities (the “preferred securities”) issued by its financing vehicle, AnnTaylor Finance Trust, a Delaware
business trust (the “Trust”). On June 29, 1999, AnnTaylor Finance Trust redeemed all of the outstanding preferred securities. All but $100,000 of
the liquidation amount of the preferred securities were tendered for conversion into an aggregate of 5,116,717 shares of Company common
stock prior to the redemption date, at a conversion price of $19.65 per share of common stock, or 2.545 shares of common stock per $50
liquidation amount of the security. Holders of preferred securities that were not tendered for conversion received 105.95% of the liquidation
amount of the preferred securities redeemed, plus accrued distributions.
4 . A L L O W A N C E F O R D O U B T F U L A C C O U N T S
A summary of activity in the allowance for doubtful accounts for the fiscal years ended January 29, 2000, January 30, 1999 and
January 31, 1998 is as follows:
Fiscal Years Ended
(in thousands) January 29, 2000 January 30, 1999 January 31, 1998
Balance at beginning of year .......................................................... $ 820 $ 812 $ 811
Provision for loss on accounts receivable ....................................... 1,032 1,476 1,795
Accounts written off ....................................................................... (1,186) (1,468) (1,794)
Balance at end of year ................................................................... $ 666 $ 820 $ 812
5 . C O M M I T M E N T S A N D C O N T I N G E N C I E S
Rental Commitments
The Company occupies its retail stores and administrative facilities under operating leases, most of which are non-cancelable. Some leases
contain renewal options for periods ranging from one to ten years under substantially the same terms and conditions as the original leases. Most
of the store leases require payment of a specified minimum rent, plus a contingent rent based on a percentage of the store’s net sales in excess
of a specified threshold. In addition, most of the leases require payment of real estate taxes, insurance and certain common area and
maintenance costs in addition to the future minimum lease payments shown below.
Future minimum lease payments under non-cancelable operating leases at January 29, 2000 are as follows:
Fiscal Year (in thousands)
2000................................................................................................................................................................................. $ 95,655
2001................................................................................................................................................................................. 94,422
2002................................................................................................................................................................................. 91,391
2003................................................................................................................................................................................. 85,413
2004................................................................................................................................................................................. 81,065
2005 and thereafter .......................................................................................................................................................... 288,433
Total ........................................................................................................................................................................... $ 736,379
Rent expense for the fiscal years ended January 29, 2000, January 30, 1999 and January 31, 1998 was as follows:
Fiscal Years Ended
(in thousands) January 29, 2000 January 30, 1999 January 31, 1998
Minimum rent................................................................................. $ 72,763 $ 66,358 $ 59,495
Percentage rent ............................................................................. 3,131 2,414 1,671
Total ........................................................................................ $ 75,894 $ 68,772 $ 61,166
P A G E 2 6

Litigation
The Company has been named as a defendant in several legal actions arising from its normal business activities. Although the amount of any
liability that could arise with respect to these actions cannot be accurately predicted, in the opinion of the Company, any such liability will not
have a material adverse effect on the financial position, results of operations or liquidity of the Company.
In addition, the Company, Ann Taylor, certain directors and former officers and directors of the Company and Ann Taylor, Merrill Lynch & Co.
(“ML&Co.”) and certain affiliates of ML&Co. have been named as defendants in a purported class action lawsuit filed in April 1996 by certain
alleged stockholders, alleging that the Company and the other defendants engaged in a fraudulent scheme and course of business that operated
a fraud or deceit on purchasers of the Company’s common stock during the period from February 3, 1994 through May 4, 1995.
On November 9, 1998, the District Court issued an order granting the defendants’ motion to dismiss the amended complaint with prejudice for
its failure to plead fraud with particularity. On or about December 15, 1998, the plaintiffs filed a notice of appeal to the United States Court of
Appeals for the Second Circuit, seeking review of the District Court’s order. The Court heard oral argument on this appeal on September 15,
1999. ML&Co., its affiliates and the two directors who previously served on the Company’s Board of Directors as representatives of certain
affiliates of ML&Co. (the “settling defendants”) reached a settlement with the plaintiffs which provides, among other things, for the
establishment of a settlement fund in the amount of $3,000,000 plus interest. On or about December 14, 1999, the District Court entered an
Order and Final Judgment approving this partial settlement, dismissing the amended complaint with prejudice as to the settling defendants, and
barring and enjoining any future claims by, among others, the remaining defendants against the settling defendants for contribution. The appeal
as against the remaining defendants, including the Company, is pending before the Second Circuit Court of Appeals. As a result, any liability that
may arise from this action cannot be predicted at this time. The Company believes that the amended complaint is without merit and intends to
continue to defend the action vigorously.
6 . N E T I N C O M E P E R S H A R E
Basic earnings per share is calculated by dividing net income by the weighted average number of common shares outstanding during the period.
Diluted earnings per share assumes the issuance of additional shares of common stock, that are issuable by the Company upon the conversion
of all outstanding warrants, stock options and convertible securities. Basic and diluted earnings per share calculations follow:
(in thousands, except Fiscal Years Ended
per share amounts) January 29, 2000 January 30, 1999 January 31, 1998
Per Share Per Share Per ShareIncome Shares Amount Income Shares Amount Income Shares Amount
Basic Earnings per Share
Income available to common
stockholders before
extraordinary loss............ $65,493 29,021 $2.25 $39,324 25,715 $1.53 $11,997 25,628 $0.47
Effect of Dilutive Securities
Warrants............................... — 1 — 3 — 3
Stock options ....................... — 269 — 166 — 62
Preferred securities ............... 1,123 2,083 5,189 5,122 — —
Convertible Debentures ....... 1,570 1,475 — — — —
Diluted Earnings per Share
Income available to common
stockholders before
extraordinary loss............ $68,186 32,849 $2.08 $44,513 31,006 $1.44 $11,997 25,693 $0.47
Conversion of the preferred securities into common stock is not included in the computation of diluted earnings per share for the fiscal year
ended January 31, 1998 due to the antidilutive effect of the conversion as of that date.
P A G E 2 7

7 . E N T E R P R I S E - W I D E O P E R A T I N G I N F O R M A T I O N
In Fiscal 1998, the Company adopted Statement of Financial Accounting Standards No. 131, “Disclosure About Segments of an Enterprise and
Related Information,” which establishes annual and interim reporting standards for an enterprise’s operating segments and related disclosures
about its products, services, major customers and the material countries in which the entity holds assets and reports revenues.
The Company is a specialty retailer of women’s apparel, shoes and accessories. Given the economic characteristics of the store formats, the
similar nature of the products sold, the type of customer and method of distribution, the operations of the Company are aggregated into one
reportable segment. The Company believes that the customer base for its stores consists primarily of relatively affluent, fashion-conscious
women from the ages of 25 to 55, and that the majority of its customers are working women with limited time to shop.
8 . P R O P E R T Y A N D E Q U I P M E N T
Property and equipment consist of the following:
Fiscal Years Ended
(in thousands) January 29, 2000 January 30, 1999
Land and building............................................................................................................. $ 8,774 $ 8,683
Leasehold improvements.................................................................................................. 110,573 93,168
Furniture and fixtures........................................................................................................ 169,521 153,395
Construction in progress .................................................................................................. 23,518 11,059
312,386 266,305
Less accumulated depreciation and amortization .............................................................. 138,747 114,520
Net property and equipment ....................................................................................... $ 173,639 $ 151,785
9 . O T H E R E Q U I T Y A N D S T O C K O P T I O N P L A N S
Common Stock
During 1999, the number of authorized shares of common stock was increased from 40,000,000 to 120,000,000.
Preferred Stock
At January 29, 2000, January 30, 1999 and January 31, 1998, there were 2,000,000 shares of preferred stock, par value $0.01, authorized
and unissued.
Repurchase Program
During the third quarter of Fiscal 1999, the Company’s Board of Directors authorized a program under which the Company was authorized to
purchase up to $40,000,000 of the Company’s common stock and/or Convertible Debentures through open market purchases and/or in privately
negotiated transactions. On January 10, 2000, the Board of Directors increased the amount of securities that could be purchased under the
program to $90,000,000. As of January 29, 2000, 3,012,500 shares of the Company’s common stock had been repurchased for an aggregate
purchase price of $89,900,000 (exclusive of brokerage commissions), completing the securities repurchase program. All of the repurchased
shares became treasury shares and may be used for general corporate or other purposes. No Convertible Debentures were purchased.
Associate Discount Stock Purchase Plan
In Fiscal 1999, the Company established an Associate Discount Stock Purchase Plan (the “Plan”) through which participating eligible employees
may purchase shares of the Company’s common stock semiannually, at a price equal to the lower of 85% of the closing price of the Company’s
common stock on the grant date or the purchase date of each semiannual stock purchase period. Participating employees pay for their
stock purchases under the Plan by authorizing limited payroll deductions of up to a maximum of 15% of their compensation. No shares of
common stock will be issued pursuant to the Plan until Fiscal 2000. At January 29, 2000, there were 250,000 shares available for future issuance
under this Plan.
P A G E 2 8

Stock Option Plans
In 1989 and 1992, the Company established stock option plans. At January 29, 2000, 22,547 shares of common stock were reserved for
issuance under the 1989 plan and 2,299,305 shares of common stock were reserved for issuance under the 1992 plan. Under the terms of both
plans, the exercise price of any option may not be less than 100% of the fair market value of the common stock on the date of grant.
Stock options granted prior to 1994 generally vest over a five-year period, with 20% becoming exercisable immediately upon grant of the option
and 20% per year for the next four years. Stock options granted since 1994 generally vest either (i) over a four-year period, with 25% becoming
exercisable on each of the first four anniversaries of the grant, or (ii) in seven or nine years with accelerated vesting upon the achievement of
specified earnings or stock price targets within a five-year period. All stock options granted under the 1989 plan and the 1992 plan expire ten
years from the date of grant. At January 29, 2000, there were no shares under the 1989 plan and 446,300 shares under the 1992 plan available
for future grant.
The Company accounts for the stock options in accordance with Accounting Principles Board Opinion No. 25, under which no compensation
costs have been recognized for stock option awards. Had compensation costs of option awards been determined under a fair value alternative
method as stated in Statement of Financial Accounting Standards No. 123, “Accounting for Stock-Based Compensation,” the Company would
have been required to prepare a fair value model for such options and record such amount in the financial statements as compensation expense.
Pro forma net income before extraordinary loss and net income per share before extraordinary loss on a diluted basis after taking into account
such expense would have been $63.9 million and $2.03, respectively for Fiscal 1999, $38.4 million and $1.41, respectively for Fiscal 1998 and
$11.0 million and $0.43, respectively, for Fiscal 1997. For purposes of this calculation, the Company arrived at the fair value of each stock grant
at the date of grant by using the Black Scholes option pricing model with the following weighted average assumptions used for grants for the
fiscal years ended January 29, 2000, January 30, 1999 and January 31, 1998: risk-free interest rate of 4.9%, 5.4% and 6.2%, respectively;
expected life of 4.0 years, 4.0 years and 5.0 years, respectively; and expected volatility of 49.1%, 59.4% and 67.9%, respectively.
The following summarizes stock option transactions for the fiscal years ended January 29, 2000, January 30, 1999 and January 31, 1998:
Option Weighted NumberPrices Average Price of Shares
Outstanding Options February 1, 1997 ........................................ $6.80 - $44.125 $ 22.69 1,664,085
Granted................................................................................. $14.25 - $22.75 $ 20.60 590,000
Exercised .............................................................................. $6.80 - $20.00 $ 15.45 (47,436)
Canceled............................................................................... $11.50 - $39.75 $ 25.11 (585,557)
Outstanding Options January 31, 1998........................................ $6.80 - $44.125 $ 21.20 1,621,092
Granted................................................................................. $14.00 - $36.25 $ 17.52 306,574
Exercised .............................................................................. $6.80 - $36.25 $ 19.09 (373,544)
Canceled............................................................................... $6.80 - $42.50 $ 23.68 (162,224)
Outstanding Options January 30, 1999........................................ $6.80 - $44.125 $ 20.67 1,391,898
Granted................................................................................ $22.813 - $47.688 $ 43.56 882,500
Exercised ............................................................................. $6.80 - $42.50 $ 18.65 (351,737)
Canceled.............................................................................. $11.00 - $44.25 $ 25.41 (123,980)
Outstanding Options January 29, 2000 .................................... $11.50 - $47.688 $ 31.98 1,798,681
At January 29, 2000, January 30, 1999 and January 31, 1998 there were exercisable 558,321 options, 696,596 options and 450,776 options,
respectively, which have weighted average exercise prices of $20.74 per share, $19.76 per share and $19.02 per share, respectively.
In 1994, the Company’s 1992 stock option plan was amended and restated to include restricted stock and unit awards. A unit represents the
right to receive the cash value of a share of common stock on the date the restrictions on the unit lapse. The restrictions on grants generally
lapse over a four-year period from the date of the grant. In the event a grantee terminates employment with the Company, any restricted stock
or restricted units remaining subject to restrictions are forfeited. During 1997, 1998 and 1999, certain executives were awarded restricted
P A G E 2 9

common stock and, in some cases, restricted units. The resulting unearned compensation expense, based upon the market value on the date
of grants, was charged to stockholders’ equity and is being amortized over the restricted period.
1 0 . E X E C U T I V E C O M P E N S A T I O N
In 1996, J. Patrick Spainhour, the Chairman and Chief Executive Officer of the Company, was granted 75,000 shares of restricted common stock.
The resulting unearned compensation expense of $1,171,875, based upon the market value on the date of the grant, was charged to
stockholders’ equity and was amortized over the restricted period applicable to these shares. In 1999, Mr. Spainhour was granted an
additional 25,000 shares of restricted stock which will vest on March 8, 2000. This restricted stock award resulted in unearned compensation
expense of $829,688, based on the market value of the common stock on the date of the grant. The unearned compensation expense was
charged to stockholders’ equity and is being amortized over the restricted period applicable to these shares. In addition to the restricted stock,
Mr. Spainhour was awarded a non-qualified stock option award to purchase 250,000 shares of common stock at the current market price, as
well as “super-incentive” non-qualified performance-vesting stock options to purchase 100,000 shares of common stock. The “super-incentive”
non-qualified performance vesting stock options will become exercisable upon achievement of various earnings per share targets between March
2000 and March 2002. Additionally, as of December 9, 1996, the President and Chief Operating Officer of the Company received a grant of
30,000 restricted shares of common stock and 20,000 restricted units. The resulting unearned compensation expense of $592,500, based on
the market value of the common stock on the date of the grant, was charged to stockholders’ equity and was amortized over the restricted
period applicable to these shares.
1 1 . E X T R A O R D I N A R Y I T E M S
On July 22, 1999, the Company applied the proceeds received from the issuance of its Convertible Debentures to redeem the outstanding 83/4%
Notes. This resulted in an extraordinary charge to earnings in Fiscal 1999 of $962,000, net of income tax benefit of $641,000.
On July 2, 1997, the Company used available cash to prepay $24,500,000, the outstanding balance of its term loan due September 1998, which
resulted in an extraordinary charge to earnings in Fiscal 1997 of $173,000, net of income tax benefit of $130,000.
1 2 . N O N R E C U R R I N G C H A R G E S
Retirement of Assets
In the fourth quarter of Fiscal 1998, the Company recorded a $3,633,000 non-cash pre-tax charge for the retirement of certain assets.
This charge related to the write-off of the net book value of assets relinquished during the renovation of the Company’s corporate offices.
1 3 . I N C O M E T A X E S
The provision for income taxes for the fiscal years ended January 29, 2000, January 30, 1999 and January 31, 1998 consists of the following:
Fiscal Years Ended
(in thousands) January 29, 2000 January 30, 1999 January 31, 1998
Federal:
Current .................................................................................... $ 41,682 $ 21,589 $ 14,427
Deferred................................................................................... (3,033) 2,748 (1,917)
Total federal ....................................................................... 38,649 24,337 12,510
State and local:
Current .................................................................................... 11,856 7,869 5,538
Deferred................................................................................... (809) 1,217 (769)
Total state and local ........................................................... 11,047 9,086 4,769
Foreign:
Current .................................................................................... 525 156 187
Deferred................................................................................... — — —
Total foreign ....................................................................... 525 156 187
Total ........................................................................................ $ 50,221 $ 33,579 $ 17,466
P A G E 3 0

The reconciliation between the provision for income taxes and the provision for income taxes at the federal statutory rate for the fiscal years ended
January 29, 2000, January 30, 1999 and January 31, 1998 is as follows:
Fiscal Years Ended
(in thousands) January 29, 2000 January 30, 1999 January 31, 1998
Income before income taxes and extraordinary loss........................ $ 115,714 $ 72,903 $ 29,463
Federal statutory rate ..................................................................... 35% 35% 35%
Provision for income taxes at federal statutory rate......................... $ 40,500 $ 25,516 $ 10,312
State and local income taxes, net of federal
income tax benefit.................................................................... 6,278 4,660 3,800
Non-deductible amortization of goodwill ......................................... 3,500 3,500 3,500
Earnings of foreign subsidiaries ...................................................... 79 (188) (314)
Other ............................................................................................. (136) 91 168
Provision for income taxes ............................................................. $ 50,221 $ 33,579 $ 17,466
The tax effects of significant items comprising the Company’s deferred tax assets (liabilities) as of January 29, 2000 and January 30, 1999
are as follows:
(in thousands) January 29, 2000 January 30, 1999
Current:
Inventory .................................................................................................................... $ 2,071 $ 128
Accrued expenses...................................................................................................... 2,306 3,812
Real estate ................................................................................................................. (2,050) (1,686)
Other.......................................................................................................................... — —
Total current ..................................................................................................................... $ 2,327 $ 2,254
Noncurrent:
Accrued expenses...................................................................................................... $ 763 $ —
Depreciation and amortization..................................................................................... (2,936) (5,510)
Rent expense ............................................................................................................. 5,168 4,786
Other.......................................................................................................................... 327 276
Total noncurrent ............................................................................................................... $ 3,322 $ (448)
Income taxes provided reflect the current and deferred tax consequences of events that have been recognized in the Company’s financial
statements or tax returns. U.S. federal income taxes are provided on unremitted foreign earnings except those that are considered permanently
reinvested, which at January 29, 2000 amounted to approximately $6,852,000. However, if these earnings were not considered permanently
reinvested, under current law, the incremental tax on such undistributed earnings would be approximately $2,137,000.
P A G E 3 1

1 4 . R E T I R E M E N T P L A N S
Savings Plan
Ann Taylor maintains a defined contribution 401(k) savings plan for substantially all full-time employees of Ann Taylor and its subsidiaries.
Participants may contribute to the plan an aggregate of up to 10% of their annual earnings. Ann Taylor makes a matching contribution of 50%
with respect to the first 3% of each participant’s annual earnings contributed to the plan. Ann Taylor’s contributions to the plan for Fiscal 1999,
Fiscal 1998 and Fiscal 1997 were $697,000, $592,000 and $519,000, respectively.
Pension Plan
Substantially all full-time employees of Ann Taylor and its subsidiaries are covered under a noncontributory defined benefit pension plan. Through
December 31, 1997, the pension plan was a “cash balance pension plan,” under which each participant accrued a benefit based on
compensation and years of service with Ann Taylor. As of January 1, 1998, the plan was amended and the formula to calculate benefits was
changed to a career average formula. The new career average formula was used to determine the funding status of the plan beginning in Fiscal
1997. Ann Taylor’s funding policy for the plan is to contribute annually the amount necessary to provide for benefits based on accrued service
and projected pay increases. Plan assets consist primarily of cash, equity and fixed income securities.
In Fiscal 1998, the Company adopted Statement of Financial Accounting Standards No. 132, “Employers’ Disclosures about Pensions
and Other Postretirement Benefits,” which standardizes the disclosure requirements for pension and other postretirement benefits,
eliminates certain disclosures, and requires additional information on the changes in the benefit obligations and fair value of plan assets.
The following table provides information for the Pension Plan at January 29, 2000, January 30, 1999 and January 31, 1998:
Fiscal Years Ended
(in thousands) January 29, 2000 January 30, 1999 January 31, 1998
Change in benefit obligation:
Benefit obligation, beginning of year ......................................... $ 4,642 $ 3,820 $ 3,413
Service cost ............................................................................. 1,129 669 571
Interest .................................................................................... 340 292 250
Plan amendments .................................................................... — — 81
Actuarial loss (gain) .................................................................. 19 348 (103)
Benefits paid............................................................................ (1,176) (487) (392)
Benefit obligation, end of year .................................................. 4,954 4,642 3,820
Change in plan assets:
Fair value of plan assets, beginning of year............................... 7,486 5,128 4,745
Actual return on plan assets ..................................................... 763 1,205 907
Employer contribution (refund) .................................................. 2,416 1,640 (132)
Benefits paid............................................................................ (1,176) (487) (392)
Fair value of plan assets, end of year........................................ 9,489 7,486 5,128
Funded status (fair value of plan assets less
benefit obligation)..................................................................... 4,535 2,844 1,308
Unrecognized net actuarial gain ..................................................... (1,621) (1,675) (1,361)
Unrecognized prior service cost ..................................................... 63 69 75
Prepaid benefit cost ....................................................................... $ 2,977 $ 1,238 $ 22
P A G E 3 2

Net pension cost includes the following components:
Fiscal Years Ended
(in thousands) January 29, 2000 January 30, 1999 January 31, 1998
Service cost................................................................................... $ 1,129 $ 669 $ 571
Interest cost................................................................................... 340 292 250
Expected return on assets ............................................................. (776) (481) (409)
Amortization of prior gains ............................................................. (22) (61) (42)
Amortization of prior service cost ................................................... 6 6 6
Net periodic pension cost .............................................................. $ 677 $ 425 $ 376
For the fiscal years ended January 29, 2000, January 30, 1999 and January 31, 1998, the following actuarial assumptions were used:
Fiscal Years Ended
January 29, 2000 January 30, 1999 January 31, 1998
Discount rate ................................................................................. 8.25% 6.75% 7.50%
Long-term rate of return on assets ................................................. 9.00% 9.00% 9.00%
Rate of increase in future compensation......................................... 4.00% 4.00% 4.00%
1 5 . Q U A R T E R L Y F I N A N C I A L D A T A ( U N A U D I T E D )
Quarter
(in thousands, except per share amounts) First Second Third Fourth
Fiscal 1999
Net sales ........................................................................................ $ 249,400 $ 265,747 $ 272,289 $ 297,083
Gross profit .................................................................................... 131,337 125,905 149,875 141,388
Income before extraordinary loss .................................................... 14,755 13,373 21,448 15,917
Extraordinary loss ........................................................................... — 962 — —
Net income..................................................................................... $ 14,755 $ 12,411 $ 21,448 $ 15,917
Basic earnings per share before extraordinary loss.......................... $ 0.56 $ 0.47 $ 0.68 $ 0.53
Extraordinary loss per share............................................................ — 0.03 — —
Basic earnings per share ................................................................ $ 0.56 $ 0.44 $ 0.68 $ 0.53
Diluted earnings per share before extraordinary loss........................ $ 0.51 $ 0.42 $ 0.65 $ 0.50
Extraordinary loss per share............................................................ — 0.03 — —
Diluted earnings per share .............................................................. $ 0.51 $ 0.39 $ 0.65 $ 0.50
Fiscal 1998
Net sales ........................................................................................ $ 198,170 $ 223,393 $ 227,535 $ 262,841
Gross profit .................................................................................... 101,334 104,934 124,418 125,529
Net income..................................................................................... $ 6,419 $ 7,044 $ 14,074 $ 11,787
Basic earnings per share ................................................................ $ 0.25 $ 0.27 $ 0.55 $ 0.46
Diluted earnings per share .............................................................. $ 0.25 $ 0.27 $ 0.50 $ 0.42
The sum of the quarterly per share data may not equal the annual amounts due to changes in the weighted average shares and share
equivalents outstanding.
P A G E 3 3

M A N A G E M E N T ’ S R E P O R T O N F I N A N C I A L I N F O R M A T I O N
Management is responsible for the preparation, integrity and consistency of the consolidated financial statements and all other information
presented in this Annual Report. The consolidated financial statements have been prepared in accordance with generally accepted accounting
principles and necessarily include certain amounts based on Management’s informed judgements and best estimates.
In fulfilling its responsibility for the reliability of financial information, Management has established and maintains accounting systems and
procedures appropriately supported by internal accounting controls. In Management’s estimation, the cost of these controls does not exceed
the expected benefits being derived. Such controls include, but are not limited to, the selection and training of qualified personnel, an
organizational structure providing for division of responsibility, communication of requirements for compliance with approved accounting, control
and business practices, and an internal audit function. Although no system can ensure that all errors or irregularities have been eliminated,
Management believes that the internal accounting controls in place provide reasonable assurance that assets are safeguarded against loss,
transactions are executed in accordance with Management’s authorization and the financial records are reliable for preparing
the consolidated financial statements.
The Audit Committee of the Board of Directors is comprised solely of directors who are not officers or employees of the Company. The
Committee is responsible for recommending to the Board of Directors the selection of independent auditors. It meets periodically with
Management, the independent auditors and Ann Taylor’s internal auditors to ensure that they are carrying out their responsibilities. The
Committee is also responsible for performing an oversight role by reviewing and monitoring the financial, accounting and auditing procedures of
the Company. In addition to reviewing the Company’s financial reports, Deloitte & Touche LLP, independent auditors, have full and free access
to the Audit Committee with and without Management’s presence.
P A G E 3 4

I N D E P E N D E N T A U D I T O R S ’ R E P O R T
To the Stockholders of ANNTAYLOR STORES CORPORATION:
We have audited the accompanying consolidated balance sheets of AnnTaylor Stores Corporation and its subsidiaries, as of January 29, 2000
and January 30, 1999 and the related consolidated statements of income, stockholders’ equity and cash flows for each of the three fiscal years
in the period ended January 29, 2000. These financial statements are the responsibility of the Company’s management. Our responsibility is to
express an opinion on these financial statements based on our audits.
We conducted our audits in accordance with auditing standards generally accepted in the United States of America. Those standards require
that we plan and perform the audit to obtain reasonable assurance about whether the financial statements are free of material misstatement. An
audit includes examining, on a test basis, evidence supporting the amounts and disclosures in the financial statements. An audit also includes
assessing the accounting principles used and significant estimates made by management, as well as evaluating the overall financial statement
presentation. We believe that our audits provide a reasonable basis for our opinion.
In our opinion, such consolidated financial statements present fairly, in all material respects, the financial position of the Company and its
subsidiaries at January 29, 2000 and January 30, 1999 and the results of their operations and their cash flows for each of the three fiscal years
in the period ended January 29, 2000 in conformity with accounting principles generally accepted in the United States of America.
As discussed in Note 1 to the consolidated financial statements, during the fiscal year ended January 30, 1999, the Company changed its
method of inventory valuation to the average cost method from the retail method.
New York, New York
March 6, 2000
P A G E 3 5

M A R K E T F O R R E G I S T R A N T ’ S C O M M O N E Q U I T Y
A N D R E L A T E D S T O C K H O L D E R M A T T E R S
The Company’s common stock is listed and traded on the New York Stock Exchange under the symbol ANN. The number of holders of record
of common stock at February 25, 2000 was 580. The following table sets forth the high and low closing sale prices for the common stock on
the New York Stock Exchange during Fiscal 1999 and Fiscal 1998.
Market Price
High Low
Fiscal Year 1999
Fourth quarter ........................................................................................................................ $ 46 5⁄16 $ 22 1⁄4
Third quarter .......................................................................................................................... 45 321⁄2
Second quarter ...................................................................................................................... 50 7⁄16 34 1⁄2
First quarter ........................................................................................................................... 52 13⁄16 33 1⁄8
Fiscal Year 1998
Fourth quarter ........................................................................................................................ $ 41 9⁄16 $ 28 3⁄4
Third quarter .......................................................................................................................... 29 5⁄8 19 3⁄8
Second quarter ...................................................................................................................... 23 1⁄2 16 1⁄8
First quarter ........................................................................................................................... 16 1⁄2 11 13⁄16
The Company has never paid dividends on the common stock and does not intend to pay dividends in the foreseeable future. As a holding
company, the ability of the Company to pay dividends is dependent upon the receipt of dividends or other payments from its subsidiaries,
including Ann Taylor. The payment of dividends by Ann Taylor to the Company is subject to certain restrictions under Ann Taylor’s Credit Facility
described under “Management’s Discussion and Analysis of Financial Condition and Results of Operations—Liquidity and Capital Resources.”
The payment of cash dividends on the common stock by the Company is also subject to certain restrictions contained in the Company’s
guarantee of Ann Taylor’s obligations under the Credit Facility. Any determination to pay cash dividends in the future will be at the discretion of
the Company’s Board of Directors and will be dependent upon the Company’s results of operations, financial condition, contractual restrictions
and other factors deemed relevant at that time by the Company’s Board of Directors.
P A G E 3 6

F I V E - Y E A R S E L E C T E D F I N A N C I A L D A T A
All fiscal years for which financial information is set forth below had 52 weeks, except the fiscal year ended February 3, 1996, which had
53 weeks. In Fiscal 1997, the Company adopted Statement of Financial Accounting Standards No. 128, “Earnings per Share” and all prior year
per share information has been recalculated.
Fiscal Years Ended
(in thousands, except per share amounts) Jan. 29, 2000 Jan. 30, 1999 Jan. 31, 1998 Feb. 1, 1997 Feb. 3, 1996
Income Statement Information:
Net sales . . . . . . . . . . . . . . . . . . . . . . . . . . . . . $ 1,084,519 $ 911,939 $ 781,028 $ 798,117 $ 731,142
Studio shoe stores closing expense . . . . . . . . . . — — — 3,600 —
Employment contract separation
expense . . . . . . . . . . . . . . . . . . . . . . . . . . . — — — 3,500 —
Retirement of assets . . . . . . . . . . . . . . . . . . . . . — 3,633 — — —
Income (loss) before extraordinary
loss . . . . . . . . . . . . . . . . . . . . . . . . . . . . . . $ 65,493 $ 39,324 $ 11,997 $ 8,667 $ (876)
Extraordinary loss (net of income tax
benefit of $641 and $130) . . . . . . . . . . . . . . 962 — 173 — —
Net income (loss) . . . . . . . . . . . . . . . . . . . . . . . $ 64,531 $ 39,324 $ 11,824 $ 8,667 $ (876)
Basic earnings (loss) per share before
extraordinary loss . . . . . . . . . . . . . . . . . . . . $ 2.25 $ 1.53 $ 0.47 $ 0.36 $ (0.04)
Extraordinary loss per share . . . . . . . . . . . . . . . . 0.03 — 0.01 — —
Basic earnings (loss) per share . . . . . . . . . . . . . . $ 2.22 $ 1.53 $ 0.46 $ 0.36 $ (0.04)
Diluted earnings (loss) per share before
extraordinary loss . . . . . . . . . . . . . . . . . . . . $ 2.08 $ 1.44 $ 0.47 $ 0.36 $ (0.04)
Extraordinary loss per share . . . . . . . . . . . . . . . . 0.03 — 0.01 — —
Diluted earnings (loss) per share . . . . . . . . . . . . . $ 2.05 $ 1.44 $ 0.46 $ 0.36 $ (0.04)
Weighted average shares outstanding. . . . . . . . . 29,021 25,715 25,628 23,981 23,067
Weighted average shares outstanding,
assuming dilution. . . . . . . . . . . . . . . . . . . . . 32,849 31,006 25,693 24,060 23,167
Balance Sheet Information (at end of period):
Working capital . . . . . . . . . . . . . . . . . . . . . . . $ 151,368 $ 168,708 $ 122,181 $ 118,850 $ 86,477
Goodwill, net . . . . . . . . . . . . . . . . . . . . . . . . . 308,659 319,699 330,739 341,779 313,525
Total assets . . . . . . . . . . . . . . . . . . . . . . . . . . 765,117 775,417 683,661 688,139 678,709
Total debt . . . . . . . . . . . . . . . . . . . . . . . . . . . 115,785 105,157 106,276 131,192 272,458
Preferred securities . . . . . . . . . . . . . . . . . . . . — 96,624 96,391 96,158 —
Stockholders’ equity. . . . . . . . . . . . . . . . . . . . 515,622 432,699 384,107 370,582 325,688
P A G E 3 7

B O A R D O F D I R E C T O R S
Gerald S. Armstrong
Managing Director, Arena Capital Partners, LLC
James J. Burke, Jr.
Managing Partner, Stonington Partners, Inc.
Wesley E. Cantrell
Chairman and Chief Executive Officer, Lanier WorldWide, Inc.
Patricia DeRosa
Ann Taylor President and Chief Operating Officer
Robert C. Grayson
Management Consultant
Ronald W. Hovsepian
Vice President of Business Development, IBM Corporation
Rochelle B. Lazarus
Chairman and Chief Executive Officer, Ogilvy & Mather Worldwide
Hanne M. Merriman
Retail Consultant
J. Patrick Spainhour
Ann Taylor Chairman and Chief Executive Officer
P A G E 3 8

A N N T A Y L O R E X E C U T I V E S
J. Patrick Spainhour*
Chairman and Chief Executive Officer
Patricia DeRosa*
President and Chief Operating Officer
Barry Erdos*
Executive Vice President—Chief Financial Officer and Treasurer
Katherine Lawther Kril l
Executive Vice President—General Merchandise Manager—Ann Taylor Loft
Melissa T. LaBau
Executive Vice President—Retail Operations
Dwight Meyer
Executive Vice President—Sourcing
Catherine Sadler
Executive Vice President—Marketing
Jocelyn F.L. Barandiarán*
Senior Vice President —General Counsel and Secretary
Mary Blodgett
Senior Vice President—Director of Ann Taylor Stores
Gerri Feemster Bostick
Senior Vice President—Human Resources
Andra B. Ehrenkranz
Senior Vice President—AnnTaylor.com Division
Joann Fielder
Senior Vice President—Design Development —Ann Taylor Stores
Mitchell Gross
Senior Vice President—Design Development —Ann Taylor Loft
Diane Holtz
Senior Vice President—General Merchandise Manager—Ann Taylor Stores
Wollaston B. Morin
Senior Vice President— Information Services
Daniel F. Mulhern
Senior Vice President—Director of Ann Taylor Loft Stores
Valerie Richardson
Senior Vice President—Real Estate and Development
Anthony M. Romano
Senior Vice President—Logistics
Lorin Thomas-Tavel
Senior Vice President—Strategic Client Relationships
James M. Smith*
Vice President —Controller and Assistant Treasurer
*AnnTaylor Stores Corporation Executive Officer
P A G E 3 9

S H A R E H O L D E R I N F O R M A T I O N
Corporate Offices
142 West 57th Street, New York, NY 10019
Telephone: (800) 677-6788 or (212) 541-3300
Annual Meeting
The 2000 Annual Meeting of Stockholders is scheduled for 9:00 A.M. on Thursday, May 18, 2000 at The Plaza Hotel, Fifth Avenue at 59th Street,
New York, New York.
10-K Report
A copy of the Company’s Annual Report on Form 10-K (exclusive of exhibits) for the fiscal year ended January 29, 2000 is available without
charge upon written request to Investor Relations Department, AnnTaylor Stores Corporation, 142 West 57th Street, New York, NY 10019 or by
calling (800) 934-6668, Mailbox 9595.
Investor Inquiries
Shareholder inquiries and requests for other quarterly or annual information may be made in writing to Investor Relations Department, AnnTaylor
Stores Corporation, 142 West 57th Street, New York, NY 10019 or by calling (800) 934-6668, Mailbox 9595.
Stock Exchange Listing
The common stock of AnnTaylor Stores Corporation is listed for trading on the New York Stock Exchange (Trading Symbol: ANN).
Registrar and Transfer Agent
Questions about shares registered in your name, change of name or address, lost stock certificates and related matters should be directed to
the Company’s Common Stock Registrar and Transfer Agent:
Continental Stock Transfer & Trust Company
2 Broadway, New York, NY 10004
(212) 509-4000
www.continentalstock.com
Counsel
Skadden, Arps, Slate, Meagher & Flom
Wilmington, DE
Independent Public Accountants
Deloitte & Touche LLP
New York, NY
www.deloitte&touche.com
P A G E 4 0


