160
ANNUAL REPORT 2017 2018

ANNUALREPORT
20172018

Service Excellence Honesty and Integrity Respect Social Responsibility
To be a major player in Energy Sector development, nationally and regionally.
To meet the needs of our customers in a sufficiently profitable and environmentally sound way through providing reliable and safe power supply of acceptable quality.
MISSION
CORE VALUES
VISION
Keepingcustomers
informed andeducated
Continuouslydelivering
value
Being there when our customers need us
Delivering secure,
affordable and sustainable
solutions
OUR ENERGY GOES INTO:

Directors’ Responsibility Statement 66
Independent Auditor’s Report 67
Directors’ Report 70
Statement of Comprehensive Income 74
Statement of Financial Position 75
Statement of Changes in Equity 76
Statement of Cash Flows 77
Notes to the Financial Statements 78 -154
1
CONTENTSOVERVIEWAbout This Report 2
The Ministry in Charge of EEC 5
From EEC to Customer 6
Highlights - Key Indicators 8
Facts and Figures 10
Key Statistics 11
Technical Performance 12
GOVERNANCE Board of Directors 14
Executive Management 16
BUSINESS REVIEWChairperson’s Statement 18
Managing Director’s Report 21
Operations Report 25
Customer Service Report 35
Human Capital Report 42
Sustainability Report 52
Corporate Social Investment 59
FINANCIAL STATEMENTS

OVERVIEW | ABOUT THIS REPORT
ESWATINI ELECTRICITY COMPANY | ANNUAL REPORT 2017/18
2
ABOUT THIS REPORT
mong the major changes experienced in the
Company was the change of name and re-
branding from the Swaziland Electricity Company
(SEC) to EEC. Other than that, there have been no
significant changes in terms of size, structure, ownership
and supply chain.
Our external auditors have provided a realistic scrutiny of
our financial performance. This report follows a reporting
framework that is in line with best practice. It links our
strategic objectives, governance and financial performance
with the societal, sustainability and economic context in
which EEC operates.
We aim to provide our stakeholders with greater and better
insight into how we implement our strategy and how this
impacts society. While our approach in compiling this
Annual Report is guided by global standards, we seek
to apply the universal principles in a manner that makes
sense to our local environment. We will continue to mature
this format of reporting in future years.
CORE BUSINESS
EEC is a power generating, transmitting and distributing
company that operates in the Kingdom of Eswatini. It is
a public company accountable to Their Majesties and the
people of Eswatini. This is given life through a variety of
clearly defined laws, codes and moral obligations. The
company is wholly owned by the Government of the
Kingdom of Eswatini. The Ministry of Natural Resources
and Energy is the shareholder representative. There
are regular and formal interactions between EEC and
the Ministry to discuss governance and strategic issues.
EEC operations are largely supported by over 85 sub-
contractors owned by emaSwati, who, in turn, provide
employment to close to a thousand people. We currently
have over 200 000 customers who include agricultural,
industrial, commercial and residential households.
In 2007 EEC transformed from being the Swaziland
Electricity Board (SEB) to become a company governed
under the Swaziland Companies Act 2009. In 2018 the
company was renamed EEC in line with the official change
This Annual Report sets out how Eswatini Electricity
Company (EEC) performed in the 2017/18 financial
year ended 31 March 2018. This report fulfils one
of our key responsibilities being accountable to
all our stakeholders, namely, the shareholder,
customers, employees, business partners and the
general public. This is an important principle which
speaks to our long-lived ethos to be a model and
transparent corporate citizen. To create value for
our stakeholders, it is essential for us to know what
issues are important to them. To ascertain that,
we have carried out what may be described as a
materiality analysis and included it in this report. We
focus on those aspects that are of great significance
to our strategy and stakeholders.
A

of name for the country from the Kingdom of Swaziland
to the Kingdom of Eswatini. Other pieces of legislation
at play in EEC is the Eswatini Electricity Company Act,
2007; The Electricity Act, 2007; Companies Act 2009;
The Energy Regulatory Act, 2007, as well as the Public
Enterprises Unit (Control and Monitoring) Act, 1989.
HUMAN CAPITAL
As a sustainability-focused company, EEC always
places high priority on the development of human talent
by investing in local specialists whose skills are up to
global standards. Human resources is the decisive factor
for the success and growth of any company. In the
year under review, EEC had a staff complement of 674
permanent employees and an additional 36 contracted
employees. The EEC employee body is highly unionised
with 85% subscribed to formal bargaining representation.
The Swaziland Electricity Supply Maintenance and
Allied Workers Union (SESMAWU) had 559 members,
representing 89% of non-managerial employees.
Meanwhile the National Electricity Supply Maintenance
and Allied Staff Association (NESMASA) had 25
members.
To that end, EEC has devised human resource systems
geared towards enabling its employees at all levels to
excel in a conducive and empowering environment. This is
in line with the country’s Vision 2022 for skills development,
training and creation of sustainable jobs. In addition, the
employees are evaluated, rewarded and compensated
based on their performances. The growth opportunities
have created a unique position for EEC to be among the
employers of choice in the Kingdom of Eswatini.
In order to continuously enhance results and reach our
goals, EEC has adopted processes and management
tools focused on standardising procedures and
operations, prioritising critical processes and rigid cost
control. The targets for each employee and team from
all areas and at each level of the hierarchy are defined
annually in accordance with the guidelines set by the
Board of Directors.
METHOD
A majority of the quantitative information contained in this
report has been specifically measured. Any information
that has been obtained by other means (for instance by
estimation or extrapolation) is identified as such. To a
considerable extent, all quantitative information in this
report is accompanied by comparative information from
prior years. In order to mirror the broad societal role of
EEC, the Board of Directors consists of external members
with a wide range of experience and knowledge from their
previous and current roles in areas such as engineering,
public administration, corporate governance and finance.
Through the efforts of our Board, Executives, a number
of other professional employees and consultants, we
have captured a summary of what can be considered
international best practice. This was an attempt to
capture ongoing discussions from various platforms and
synthesise them into best practice.
Highlights of 2017/18
The implementation of new processes and technologies has
resulted in continued operating efficiency gains throughout
the company’s operations. Based on the strategic initiatives
to drive operational efficiency, management continues to
monitor and implement austerity measures. Further, the
company is monitoring its financial liabilities and there is
no reason to believe that it will not be able to settle them
as they arise.
• EEC made revenue amounting to E2.25 billion
compared to E 1.8 billion in 2017; that is an increase
of 25%.
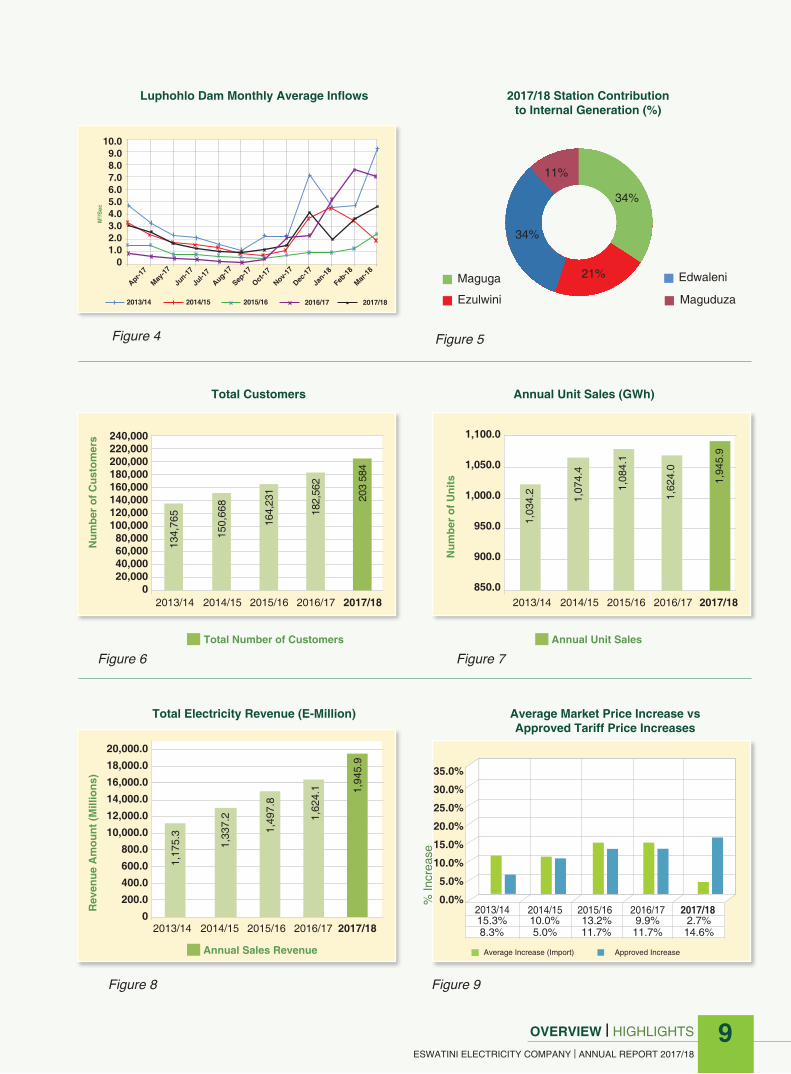
• The number of customers increased by 12% from
182,562 in March 2017 to a total of 203,584 customers
in March 2018.
• Operating profit stands at E603 million in 2018
compared to E148 million in 2017.
• Total non-current assets were E3.033 billion in 2018
compared to E2.839 billion in 2017.
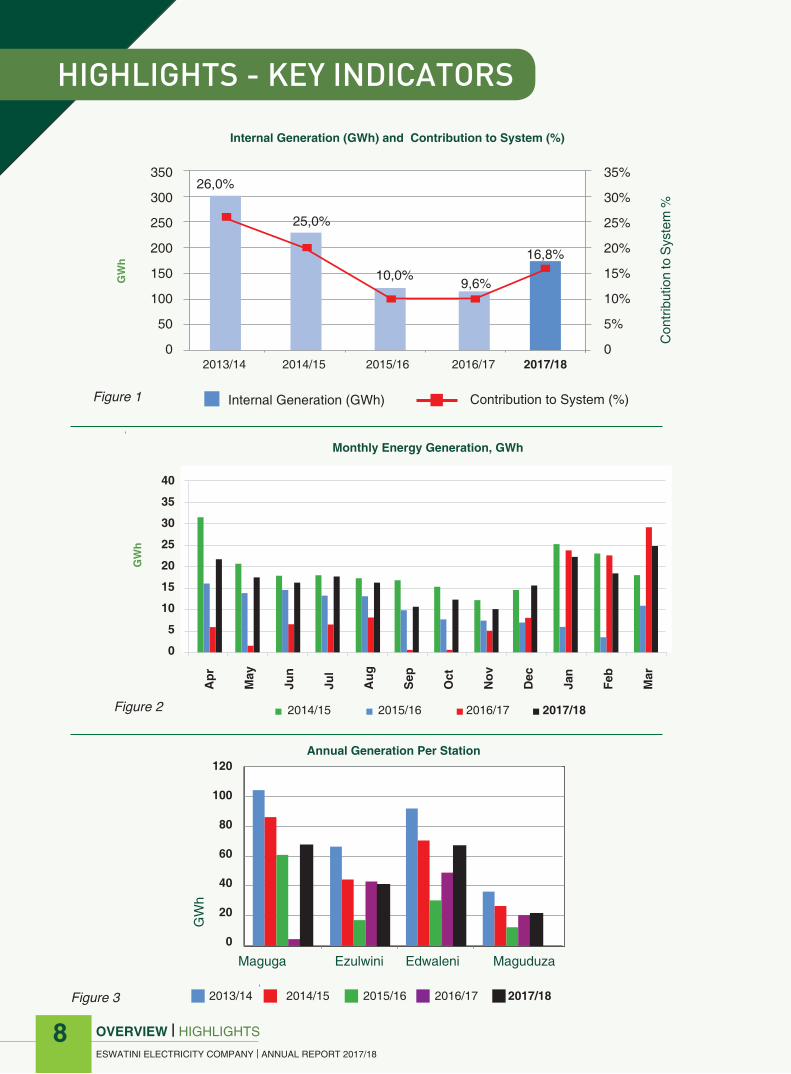
• Internal generation production increased from
118.9GWh in 2017 to 207.8GWh, as at 31 March
2018. On average, internal generation contributes
20% of the total annual energy demand for the
country and the balance is imported.
• Maguga Hydro Power has improved its contribution to
34.3% compared to 4% in the previous year.
• There was a significant increase of electricity traded
in the SAPP Markets (DAM) from 6% to 14% due to
favourable prices and availability.
• There was improvement in EEC’s safety record in the
2017/18 period. The number of reportable injuries fell
by a further 4.76% and the number of minor public
injuries fell by 100% when compared to 2016/17.
• The company also identified a strategic plan to
transition from Occupational Health and Safety
Management Standard (OHSAS 18001:2007) to ISO
45001:2018.
OVERVIEW | ABOUT THIS REPORT
ESWATINI ELECTRICITY COMPANY | ANNUAL REPORT 2017/18
3


The Honourable Minister of Natural Resources and Energy Senator Jabulile Mashwama
Ministry of Natural Resources and Energy Principal Secretary Mrs Winnie Stewart
THE MINISTRY IN CHARGE
OVERVIEW | THE MINISTRY IN CHARGE
ESWATINI ELECTRICITY COMPANY | ANNUAL REPORT 2017/185

FROM EEC TO CUSTOMER
OVERVIEW | FROM EEC TO CUSTOMER
ESWATINI ELECTRICITY COMPANY | ANNUAL REPORT 2017/18
6
Taking Responsibility for Energy,
our People and the Environment
Balanced Scorecard Objectives
We understand our impact on the environment and act
responsibly
We offer free information on energy saving methods
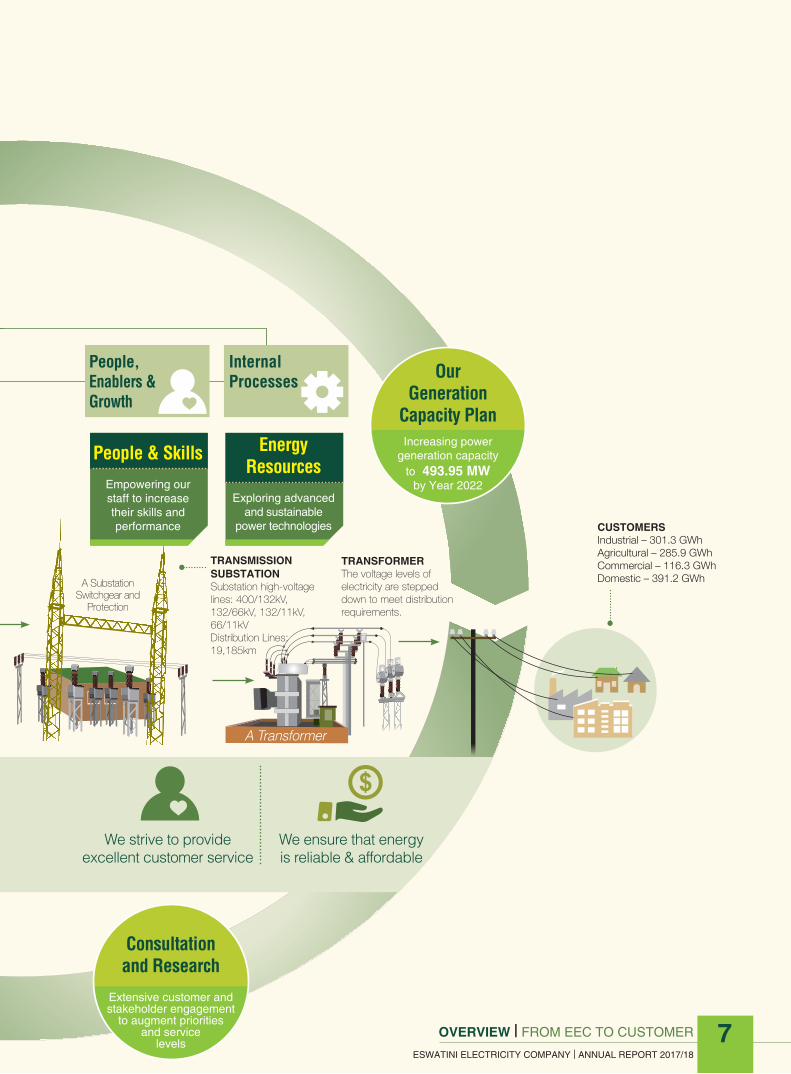
Our Five-Year
PlanMaintaining and enhancing
services to efficientlymeet customers’
priorities
POWER GENERATIONOutput: Total electricity generated – 119.0 GWh
TRANSMISSION HIGH VOLTAGE LINESAlternating Current (AC ) - 400kV - 146.83 kmAlternating Current (AC ) - 132kV - 296 kmAlternating Current (AC ) - 66kV - 969.68 km
Funding
Dependent on customer
affordability and our financeability
Resources
Managing our resources profitably
and sustainably
Power Station
Customer Benefits
Financial Results
OVERVIEW | FROM EEC TO CUSTOMER
ESWATINI ELECTRICITY COMPANY | ANNUAL REPORT 2017/18
7
Balanced Scorecard Objectives
We ensure that energy is reliable & affordable
People, Enablers & Growth
Internal Processes
We strive to provideexcellent customer service
Consultationand Research
Extensive customer andstakeholder engagement
to augment prioritiesand service
levels
Our Generation
Capacity PlanIncreasing power
generation capacity to 493.95 MW
by Year 2022
TRANSFORMERThe voltage levels of electricity are stepped down to meet distribution requirements.
TRANSMISSION SUBSTATIONSubstation high-voltage lines: 400/132kV, 132/66kV, 132/11kV, 66/11kVDistribution Lines: 19,185km
CUSTOMERS Industrial – 301.3 GWhAgricultural – 285.9 GWhCommercial – 116.3 GWhDomestic – 391.2 GWh
People & Skills
Empowering ourstaff to increasetheir skills andperformance
Energy Resources
Exploring advancedand sustainable
power technologies
A Substation Switchgear and
Protection
A Transformer
HIGHLIGHTS - KEY INDICATORS
OVERVIEW | HIGHLIGHTS
ESWATINI ELECTRICITY COMPANY | ANNUAL REPORT 2017/18
8
2015/16 2016/17 2017/182014/152013/14
350
300
250
200
150
100
50
0
35%
30%
25%
20%
15%
10%
5%
0
9,6%
16,8%
10,0%
Internal Generation (GWh) Contribution to System (%)
Con
tribu
tion
to S
yste
m %
GW
hG
Wh
26,0%
25,0%
Internal Generation (GWh) and Contribution to System (%)
Figure 1
Figure 2
Figure 3
Apr
May
Jun
Jul
Aug
Sep
Oct
Nov
Dec
Jan
Feb
Mar
40
35
30
25
20
15
10
5
0
Monthly Energy Generation, GWh
2014/15 2015/16 2016/17 2017/18
120
100
80
60
40
20
0
2013/14
Ezulwini Edwaleni MaguduzaMaguga
2014/15 2015/16 2016/17
GW
h
Annual Generation Per Station
2017/18
OVERVIEW | HIGHLIGHTS
ESWATINI ELECTRICITY COMPANY | ANNUAL REPORT 2017/18
OVERVIEW | HIGHLIGHTS
ESWATINI ELECTRICITY COMPANY | ANNUAL REPORT 2017/18
9
Total Customers
Total Number of Customers
Total Electricity Revenue (E-Million)
Annual Sales Revenue
Annual Unit Sales (GWh)
Num
ber
of U
nits
Annual Unit Sales
1,100.0
1,050.0
1,000.0
950.0
900.0
850.0
Average Market Price Increase vsApproved Tariff Price Increases
35.0%
30.0%
25.0%
20.0%
15.0%
10.0%
5.0%
0.0%
Average Increase (Import) Approved Increase
15.3% 10.0% 9.9% 2.7%13.2%8.3% 5.0% 11.7% 11.7% 14.6%
% In
crea
se
Figure 4 Figure 5
Figure 6 Figure 7
Figure 8 Figure 9
1,08
4.1
1,62
4.0
1,9
45.9
1,07
4.4
1,03
4.2
2017/18 Station Contribution to Internal Generation (%)
Ezulwini
Maguga Edwaleni
Maguduza
2013/14 2014/15 2015/16 2016/17 2017/18
2013/14 2014/15 2015/16 2016/17 2017/18
Rev
enue
Am
ount
(Mill
ions
)
20,000.018,000.016,000.014,000.012,000.010,000.0
800.0600.0400.0200.0
0
1,6
24.1
1,49
7.8
1,9
45.9
1,33
7.2
1,17
5.3
2013/14 2014/15 2015/16 2016/17 2017/18
Num
ber
of C
usto
mer
s 240,000220,000200,000180,000160,000140,000120,000100,00080,00060,00040,00020,000
0
164,
231
182,
562
203
584
150,
668
134,
765
2013/14 2014/15 2015/16 2016/17 2017/18
10.09.08.07.06.05.04.03.02.01.0
0
2014/15 2016/17 2017/182015/162013/14
M3 /S
ecLuphohlo Dam Monthly Average Inflows
34%
11%
34%
21%Apr-1
7
May-17
Jun-17
Jul-1
7
Aug-17
Sep-17
Oct-17
Nov-17
Dec-17
Jan-18
Feb-18
Mar-18

FACTS AND FIGURES
OVERVIEW | FACTS AND FIGURES
ESWATINI ELECTRICITY COMPANY | ANNUAL REPORT 2017/18
10
2018 2017 2016 2015 2014 E’000 E’000 E’000 E’000 E’000 INCOME STATEMENT
Energy Sales (GWh) 1 094.8 1 058.4 1 084.1 1 074.4 1 034.6
Revenue 2 253 819 1 786 407 1 586 476 1 474 681 1 264 528
Other Income (excluding grant armotisation) 12 105 13 933 20 528 13 400 18 000
2 265 924 1 800 340 1 607 004 1 488 081 1 282 528
Operating Expenses 1 517 340 1 524 483 1 468 894 1 234 967 1 087 938
Depreciation 131 591 133 327 117 318 116 118 104 458
Amortisation of Grants (15 408) (43 084) (27 349) (12 613) (10 456)
Net Finance Cost 21 913 35 450 34 448 26 840 22 921
Other (Gains)/Losses 28 992 37 273 (70 100) 2 703 23 845
Share of Profit in Joint Venture (31 850) (40 273) (48 965) (43 413) (27 318)
Taxation 76 285 9 015 38 505 22 523 2 570
Total Costs 1 728 863 1 656 191 1 512 751 1 347 125 1 203 958
Profit 537 061 144 149 94 253 140 956 140 956
BALANCE SHEET Property, Plant and Equipment 2 233 996 2 056 047 1 839 759 1 750 822 1 525 748
Capital Work in Progress 75 953 40 233 69 861 68 138 54 654
Investment in Joint Venture 324 182 361 174 407 485 312 404 261 888
Derivative Financial Instruments 24 273 32 256 55 218 42 396 59 018
Investment in Sinking Fund 209 156 183 925 187 023 58 120 30 000
Other Assets 27 788 4 810 6 242 28 206 23 064
Retirement Benefits Assets 3 557 4 141 7 181 6 432 796
Ubombo Sugar Ltd Electricity Prepayment 70 000 80 000 90 000 100 000 110 000
Embedded Derivative Asset 63 959 76 796 84 366 38 725 2 538
Current Assets 608 073 336 931 279 083 305 339 328 041
Total Assets 3 640 937 3 176 313 3 026 218 2 720 582 2 395 747
Current Liabilities (480 435) (552 069) (444 189) (377 419) (297 692)
3 160 506 2 624 244 2 582 029 2 343 163 2 098 055
FUNDS EMPLOYED Borrowings 241 527 261 175 323 652 311 970 352 119
Embedded Derivative Liability 145 116 148 055 163 038 151 871 122 230
Deferred Grant Income 299 916 306 971 282 661 251 834 192 687
Other Deferred Income 27 788 4 810 6 242 28 206 23 064
Derivative Financial Instruments 785 1 059 1 412 2 662 3 310
Deferred Tax Liability 289 680 237 261 239 710 184 391 156 169
Shareholder’s Funds 2 155 694 1 664 913 1 565 314 1 412 229 1 248 476
3 160 506 2 624 244 2 582 029 2 343 163 2 098 055
2018
KEY STATISTICS
OVERVIEW | FACTS AND FIGURES
ESWATINI ELECTRICITY COMPANY | ANNUAL REPORT 2017/18
OVERVIEW | KEY STATISTICS
ESWATINI ELECTRICITY COMPANY | ANNUAL REPORT 2017/18
11
2017 2016 2015 2014
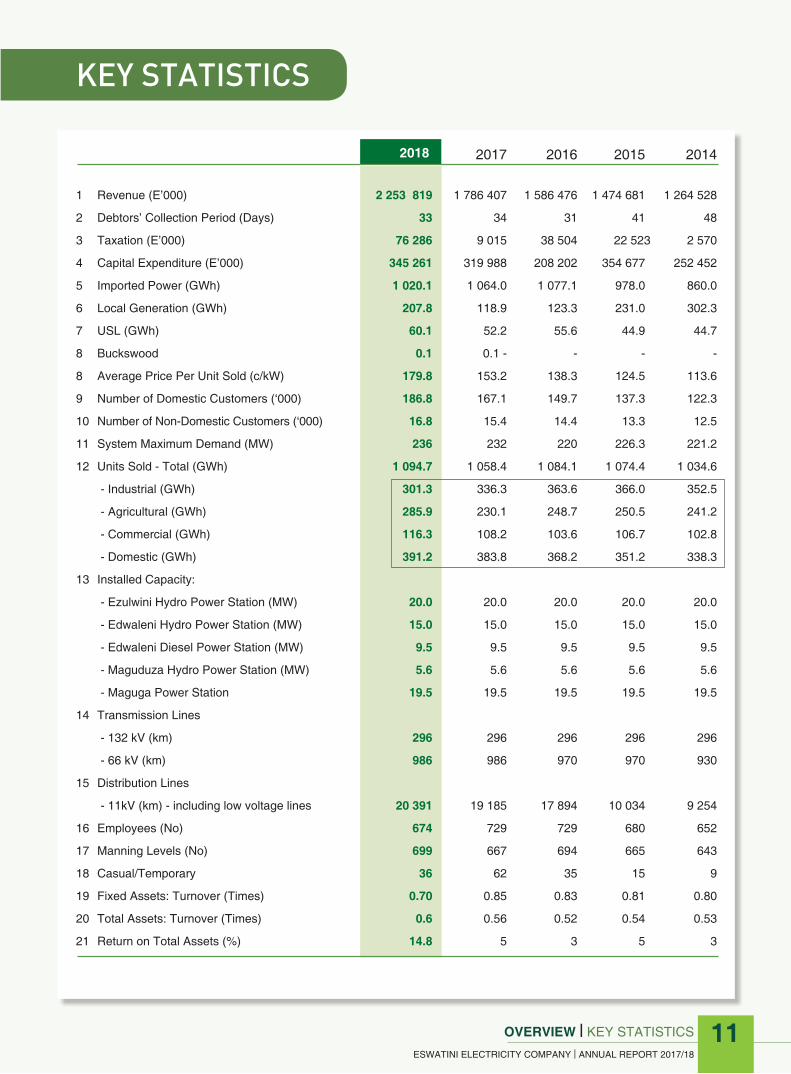
1 Revenue (E’000) 2 253 819 1 786 407 1 586 476 1 474 681 1 264 528
2 Debtors’ Collection Period (Days) 33 34 31 41 48
3 Taxation (E’000) 76 286 9 015 38 504 22 523 2 570
4 Capital Expenditure (E’000) 345 261 319 988 208 202 354 677 252 452
5 Imported Power (GWh) 1 020.1 1 064.0 1 077.1 978.0 860.0
6 Local Generation (GWh) 207.8 118.9 123.3 231.0 302.3
7 USL (GWh) 60.1 52.2 55.6 44.9 44.7
8 Buckswood 0.1 0.1 - - - -
8 Average Price Per Unit Sold (c/kW) 179.8 153.2 138.3 124.5 113.6
9 Number of Domestic Customers (‘000) 186.8 167.1 149.7 137.3 122.3
10 Number of Non-Domestic Customers (‘000) 16.8 15.4 14.4 13.3 12.5
11 System Maximum Demand (MW) 236 232 220 226.3 221.2
12 Units Sold - Total (GWh) 1 094.7 1 058.4 1 084.1 1 074.4 1 034.6
- Industrial (GWh) 301.3 336.3 363.6 366.0 352.5
- Agricultural (GWh) 285.9 230.1 248.7 250.5 241.2
- Commercial (GWh) 116.3 108.2 103.6 106.7 102.8
- Domestic (GWh) 391.2 383.8 368.2 351.2 338.3
13 Installed Capacity:
- Ezulwini Hydro Power Station (MW) 20.0 20.0 20.0 20.0 20.0
- Edwaleni Hydro Power Station (MW) 15.0 15.0 15.0 15.0 15.0
- Edwaleni Diesel Power Station (MW) 9.5 9.5 9.5 9.5 9.5
- Maguduza Hydro Power Station (MW) 5.6 5.6 5.6 5.6 5.6
- Maguga Power Station 19.5 19.5 19.5 19.5 19.5
14 Transmission Lines
- 132 kV (km) 296 296 296 296 296
- 66 kV (km) 986 986 970 970 930
15 Distribution Lines
- 11kV (km) - including low voltage lines 20 391 19 185 17 894 10 034 9 254
16 Employees (No) 674 729 729 680 652
17 Manning Levels (No) 699 667 694 665 643
18 Casual/Temporary 36 62 35 15 9
19 Fixed Assets: Turnover (Times) 0.70 0.85 0.83 0.81 0.80
20 Total Assets: Turnover (Times) 0.6 0.56 0.52 0.54 0.53
21 Return on Total Assets (%) 14.8 5 3 5 3
2018

TECHNICAL PERFORMANCE
OVERVIEW | TECHNICAL PERFORMANCE
ESWATINI ELECTRICITY COMPANY | ANNUAL REPORT 2017/18
12
2018 2017 2016 2015 2014 1 System Requirements (GWh) Sent Out 1 289.9 1 217.2 1 256.0 1 255.4 1 205.22 Units Sold (GWh) 1 094.71 1 058.4 1 084.1 1 074.4 1 034.63 System Losses (%) 14.9 14.2 13.7 14.4 14.24 EEC Internal Generation (GWh) 208.0 119.0 123.3 231.0 302.35 EEC Internal Generation (%) 16.1 9.6 9.8 19 256 System Maximum Demand (MW) 236 232 220 226.8 221.2
Ratios and Statistics 1 Net Income to Revenue (%) 23.8 8.1 5.9 9.6 6.2 2 Operating Income to Revenue 26.8 8.3 7.5 10.0 6.1 3 Return on Equity 24.9 8.7 6.0 10.0 6.3 4 Return on Capital Employed 19.3 5.5 3.7 6.0 3.7 5 Return on Total Assets 14.8 4.5 3.1 5.2 3.3
Debt Management Ratios 1 Debt/Equity 0.2 0.2 0.2 0.2 0.3 2 Annual Debt Service (Times) 18.4 22.0 17.1 16.1 12.3
Liquidity Ratios 1 Current Ratio 1.3 0.6 0.6 0.8 1.1 2 Acid Test Ratio 1.2 0.5 0.5 0.7 0.9
Training 1 Training Expenditure (E’000) 7 216 8 199 9 797 12 731 8 954
Other 1 Consumer Price Index (%) 5.0 6.0 7.8 4.7 5.1 2 EEC Tariff Increase (%) 14.6 11.7 11.7 5.0 8.3

OVERVIEW | TECHNICAL PERFORMANCE
ESWATINI ELECTRICITY COMPANY | ANNUAL REPORT 2017/18

GOVERNANCE | BOARD OF DIRECTORS
ESWATINI ELECTRICITY COMPANY | ANNUAL REPORT 2017/1814
BOARD OF DIRECTORS
MR S’THOFENI GININDZA (Chairperson)
Business Leadership – Stanford University, USA
MA Economics – Ottawa, Canada BA Economics – UNISWA
CHIEF VELAMUVA MASEKO (Non–Executive Director)
N3 & N4 Pulp and Paper Technology – Pretoria Technikon
Member of Usuthu Royal Trust – Tibiyo Taka Ngwane
Member of Senate (2008-2013)
PRINCESS LOMAJUBA (Non–Executive Director)
BSc – Western Kentucky University (USA)
Associate Degree in Science (Hotel
Management) – Vincent’s University
(USA)
ServSafe Food Protection Certification
– Vincent’s University Junior College
(USA)
MR MESHACK KUNENE (Managing Director)
B. Eng (Electrical and Electronics Engineering) – UK
Electricity Distribution Management – Sweden
Executive Development Programme (Stanford University) – USA
Member of the South African Institute of Electrical Engineers (MSAIEE)

GOVERNANCE | BOARD OF DIRECTORS
ESWATINI ELECTRICITY COMPANY | ANNUAL REPORT 2017/18
15
MR VUSI DLAMINI (Non–Executive Director)
Masters Degree (Economics of Education) – University of London
BA Degree – University of Swaziland
MS LINDIWE DLAMINI (Non–Executive Director)
MSc (Geography, Archaeology & Environment) – University of Witwatersrand
BSc Honours (Environmental Management) – University of South Africa
BSc Chemical Engineering – University of Cape Town
MR DUMISANI DLAMINI(Non–Executive Director)
Masters in Accounting and Finance – University of Stirling (UK) Bachelor of Commerce (B.com)
University of Swaziland Diploma in Accounting & Business
Studies – University of Botswana and Swaziland
ACCA and Research Attachment – De Montfort University (UK)
Short-Term Insurance – The Insurance Institute of South Africa
MR VELAPHI DLAMINI(Legal Counsel & Company Secretary)
Admitted Attorney Certificate in Conflict Management Certificate in Legislative Drafting LLB – UNISWA BA Law – UNISWA International Environmental Law
- Certificate from the University of Witwatersrand Climate Change and Energy Law
- Certificate from the University of Witwatersrand
MS DUDU NYEMBE (Non–Executive Director)
MBA – University of Pretoria (GIBS) Association of Certified Chartered
Accountants (ACCA) (Professional Level)
Bachelor of Commerce (B.Com) Accounting – University of Swaziland
MR JOSEPH SHILUBANE (Non–Executive Director)
Human Resource Management Training – UNISA
Management Development Programme – SBL
Trainer Development Programme – Maccauvlei
Mech. Eng. Technician – City & Guilds Exective Development Programme (WBS)

B. Eng (Electrical and Electronics Engineering) – UK
Electricity Distribution Management – Sweden
Executive Development Programme (Stanford University) – USA
Member of the South African Institute of Electrical Engineers (MSAIEE)
MSc Electrical Engineering – University of Cape Town
MBA Marketing – Regent Busi-ness School, RSA
Higher National Diploma (HND) – Electrical and Electronics Engineering, UK
Ordinary National Diploma (OND) – Engineering, UK
Management of Electric Power Utilities, Sweden
Member of The Institution of Engineering and Technology (MIET), UK
Masters in Investment & Risk Finance – UK
BCompt. Honours (Accounting Sciences) – UNISA
Post-Graduate Diploma in Accounting Sciences – UNISA
Bachelor of Commerce – UNISWA
Chartered Accountant Swaziland – CA (SD)
Chartered Accountant South Africa – CA (SA)
Executive Development Programme (INSEAD)
B.Comm Management Sciences – UNISWA
Leadership Development Programme – GIBS
Certified Global Remuneration Practitioner (GRP)
Leading Change (LCOR) – Harvard
Member IPM (SD)
MR LAWRENCE NSIBANDZEGeneral Manager Finance
MS NONCEDO MAMBAGeneral Manager
Corporate Services
MR MESHACK KUNENEManaging Director
MR LUKE MSWANEGeneral Manager
Resources & Strategy
GOVERNANCE | EXECUTIVE MANAGEMENT
ESWATINI ELECTRICITY COMPANY | ANNUAL REPORT 2017/1816
ResponsibilitiesCorporate Strategy & Vision, Capital Allocation and Team Building.
ResponsibilitiesResearch & Development, Coordination of IPP Projects, Power System Planning, Corporate Strategy.
ResponsibilitiesFinance, Information Technology and Procurement.
ResponsibilitiesFacilities Management, Human Capital Management & Development and Employee Relations.
EXECUTIVE MANAGEMENT

BA (Honours) – Accounting and Finance – UK
Master of Business Administration – UK
Executive Development Programme (INSEAD)
Fellow Association of Certified Chartered Accountants (FCCA) – UK
Registered Accountant (SD)
MBA – University of Pretoria (GIBS)
B.Comm Accounting – UNISWA Fellow Certified Chartered
Accountant (FCCA) Chartered Accountant Swaziland –
CA (SD) Fellow Certified Internal Auditor
(FCIA)
Masters in Engineering (Engineering Management) – University of Pretoria – SA
MBA - University of Stellenbosch – SA
BSc Engineering – University of the Witwatersrand SA
BSc & CDE – UNISWA Supervisory Development
Programme – Maccuavlei Middle Management
Development Programme – University of Johannesburg – SA
MBA – University of Pretoria (GIBS)
BSc Electrical Engineering – University of Cape Town
BSc Physics and Maths – UNISWA
Executive Development Programme (INSEAD)
MR ERNEST MKHONTAGeneral Manager
Operations
MR VUSI GAMAGeneral Manager Customer Service
MR PATRICK MATHUNJWAGeneral Manager Support Services
MS ELIZABETH MABUZAHead of Audit
GOVERNANCE | EXECUTIVE MANAGEMENT
ESWATINI ELECTRICITY COMPANY | ANNUAL REPORT 2017/18
17
ResponsibilitiesSHERQ Management, GIS and Survey, Fleet Management, Outsourced Services.
ResponsibilitiesEvaluation of controls in governance and risk management processes.
ResponsibilitiesSystem Operation, Generation, Transmission and Distribution.
ResponsibilitiesCustomer Service, Key Accounts, Marketing & Commercial Services and Billing & Revenue Protection.

Mr S’thofeni Ginindza
CHAIRPERSON’SSTATEMENTMr S’thofeni Ginindza
Chairman
BUSINESS REVIEW | CHAIRPERSON’S STATEMENT
ESWATINI ELECTRICITY COMPANY | ANNUAL REPORT 2017/1818
As a long-term player in the Kingdom
of Eswatini, we will continue with
our efforts to provide quality service,
strengthen partnerships with all
stakeholders and all with whom we
have come into contact.

he past year has been momentous for our country and its people; we reached the 50-year milestone since independence. This is
a significant moment to take stock of progress made over the years and look ahead to future plans aimed at fulfilling our country’s vision to bring about an export-driven, knowledge-based and industrialised economy. This vision, which we all embrace, seeks to ensure inclusive economic growth and a better life for all the people.
Coming as it does in this landmark period, I find honour in presenting our Annual Report for the year ended 31 March 2018. The information relating to our financial performance reflects significant achievements, not just for our company but the country as a whole.
New IdentityEmboldened by His Majesty King Mswati III’s pro-nouncement during the 50/50 Double Celebrations on 19th April 2018 that the country would henceforth revert to its original identity as the Kingdom of Eswatini, we have embraced the renewed momentum for growth by changing our name to Eswatini Electricity Company (EEC). At EEC, we embrace the new identity and we see it as a powerful tool for national cohesion, growth and development. We believe this is a crucial step for emaSwati to appreciate the true measure of their strength, including their ability to adapt to the severe economic and social headwinds sweeping through the continent. This change presents opportunities that can have a domino-effect on us to improve confidence in the country’s economy and spur sustainable and inclusive growth.
EEC’s Financial PositionJudging from our inspiring performance in the year under review, we have every reason to look to the
future with optimism. We are ready to play our part in renewed efforts to boost the country’s economy. Our fundamental purpose has always been to help power economic growth and raise the living standards of the people of Eswatini.
To that end, EEC is in a strong financial position, with assets valued at E3 billion, representing 7% increase from the previous year.
In line with our strategy to grow the company, improve efficiencies and reduce unnecessary costs, we were able to realise E2.25 billion in revenue this year. This represents an increase of 25% compared to the E1.8 billion in 2017. This is attributable to the efficiency measures we implemented, aimed at ensuring that we draw maximum returns from all the available resources. We are proud of the great team we have at all levels.
Additional savings came from a cash-flow manage-ment strategy that yielded 10% savings in total operational costs.
The increase in tariffs by 14.65% coupled with new connections also contributed to our stable financial position. We attracted a 12% increase in our customer base and in doing so, reached over 200,000 users. The increase in capital contribution revenue contributed significantly to the net profit figures.
Costs of sales stood at E1.353 billion in 2018 compared to E1.388 billion in 2017, showing a decrease of 2.5%. This is attributable to a strategic decision taken by EEC to purchase power from the Southern African Power Pool (SAPP) Day Ahead Market at prices lower than conventional bilateral rates from ESKOM.
BUSINESS REVIEW | CHAIRPERSON’S STATEMENT
ESWATINI ELECTRICITY COMPANY | ANNUAL REPORT 2017/18
Emboldened by His Majesty King Mswati III’s pronouncement during the 50/50 Double Celebrations on 19th April 2018 that the country would henceforth revert to its original identity as the Kingdom of Eswatini, we have embraced the renewed momentum for growth by changing our name to Eswatini Electricity Company (EEC).
“
“
T
19

BUSINESS REVIEW | CHAIRPERSON’S STATEMENT
ESWATINI ELECTRICITY COMPANY | ANNUAL REPORT 2017/18
20
Profit for the year under review stands at E537 million compared to E144 million in 2017. This shows an increase of 273% and it was made possible by the combination of tariffs hike and savings in total costs.
Rural ElectrificationThe year has seen massive expansion of the distribution network to communities that previously had no access to electricity. These projects can be attributed to funding from the Ministry of Natural Resources and Energy under the Rural Electrification Programme sponsored by the Republic of China on Taiwan, the Regional Development Programme supported by the Tinkhundla Ministry and Micro Projects. In the year under review we also constructed a new transmission line from River Bank to St. Philip’s. The cumulative distance covered by the electricity delivery infrastructure shows an overall increase from 19 323 to 20 391. This represents over 1 000 km of new lines.
Technological AdvancementsDespite the impressive financial performance, EEC, like many other companies in the region, faced a tough year. The industry as a whole is experiencing uncertain future characterised by continual drought, and challenging global, regional and local economic environments. Climate change has already increased the number and strength of some of the extreme events such as heat waves, severe storms and droughts. The heat and drought deplete already scarce water resources and contribute to billions of Emalangeni in direct losses to our economic sectors, particularly agriculture. Moreover, the world of electricity is experiencing costly, instant and ubiquitous technological advancements. These eventualities compel us to dig deep into our resources to innovate at rapid speed if we are to be in sync with the global changes.
Our survival is premised on the conscious decision we took to be highly disciplined whilst not losing focus on our priority to have reliable, safe, efficient and accessible operations. We continue to evolve and tackle the challenges that face our industry head-on. Our strategy focuses on improved performance and accountability at all levels of the business, cost reduction, customer value and more active management of our resources.
This is why our business is well positioned and in good operating shape. EEC has placed a premium investment in skills development of our personnel. The long standing expertise supporting our operations is highly regarded, and the Board of Directors’ fiduciary oversight has become the benchmark among clients and business associates.
There is no room for complacency and as a company we will continue to diversify our sources of energy portfolio. The world is changing and so should we. The energy mix is changing with growing emphasis on renewable energy and the green economy. EEC stands ready to provide leadership in the Kingdom of Eswatini in terms of energy security. We will continue to seek out and support start-ups, entrepreneurs and technology companies with the potential to advance both low-carbon energy and industrial efficiency.
Conclusion
As a long-term player in the Kingdom of Eswatini, we
will continue with our efforts to provide quality service,
strengthen partnerships with all stakeholders and all
with whom we have come into contact. Our Managing
Director, Mr Meshack Kunene, and the entire responsive
and dedicated employees will continue to implement the
EEC forward-looking strategy with determination.
On behalf of the Board of Directors, Management and
Employees, I wish to thank Their Majesties for their
guidance and support as they helped us to adapt positively
and with purpose to the changing needs of society.
MR. S’THOFENI GININDZAChairperson
CHAIRPERSON’S STATMENT - continued

GOVERNANCE | MANAGING DIRECTOR’S REPORT
ESWATINI ELECTRICITY COMPANY | ANNUAL REPORT 2017/18
21
MANAGINGDIRECTOR’SREPORT
Mr Meshack KuneneManaging Director
Despite the challenging economic
environment we operate in, I am
happy to indicate that our forward-
looking investment approach
resulted in improvements in our
overall performance.

MANAGING DIRECTOR’S REPORT- continued
BUSINESS REVIEW | MANAGING DIRECTOR’S REPORT
ESWATINI ELECTRICITY COMPANY | ANNUAL REPORT 2017/18
22
he year 2017-18 was a mixed bag of triumphs and challenges for Eswatini Electricity Company (EEC). The focus was on mainly improving
our performance and building resilience in a way that prioritised creating value for our stakeholders, particularly customers.
Despite the challenging economic environment we operate in, I am happy to indicate that our forward-looking investment approach resulted in improvements in our overall performance.
While the country is showing signs of recovery from an incessant drought that reached its peak in the 2015 and 2016 period, the serious aftermaths continue to hamper efforts for growth in all sectors of the economy. Indeed, the serious effects of climate change and the attendant extreme weather patterns such as drought, severe storms, flooding, high speed winds and heatwaves continued to hit us hard. As we all are aware, EEC is heavily dependent on hydro-power. These weather patterns, particularly the drought, always have a negative effect on our power production, forcing us to rely heavily on imported electricity to meet demand.
Drought and Economic Slump
EEC owns and operates four hydro-power stations whose ability to generate electricity depends on good amounts
of rainfall. Three of these hydro-power stations, namely Ezulwini, Edwaleni and Maguduza are operated on the Lusushwana and Usuthu River Basins catchment area and the fourth one is under the Komati Basin Water Authority (KOBWA); Maguga Dam. Both catchment systems are on the way to full recovery following the dry spell. Maguga Power Station was out of the grid for nine of 12 months in the 2016/17 financial year. Not only did this curtail EEC revenue, it also came at a heavy cost to business and domestic customers as we were compelled to engage in regular load management programmes to limit system demand that may have led to high import costs.
The agriculture sector, which is one of the biggest contributors to the economy, was also dealt a heavy blow by the drought. The generalised weakness of the agriculture sector had a telling effect across most other segments of the economy. All these factors contributed to the tough operating environment for EEC considering that energy used in agricultural activities account for a significant share of our revenue. A typical example was the Ingwavuma River that supplies agricultural water to Nsoko in the South-East of the country. This river completely dried out and there was no activity in the area.
To compound matters, the world economy is stuttering along and struggles to sustain its growth momentum. As a result of these global factors and the drought in the Kingdom of Eswatini, the domestic economy is
“
“
I am extremely proud of the EEC team that has brought about this transformation over the past two years, and our customers with whom we share a long-term and trusted relation- ship. We hope not to lose sight of the fact that the environment we operate in remains uncertain, so we must maintain our focus, discipline and commitment to excellence.
T
more subdued. The fluctuation of the Lilangeni against the US Dollar adds to the instability of the markets and subsequent strain on EEC. Such currency volatility led to EEC suspending crucial imports from the Mozambican energy utility, Electricidade de Moçambique (EDM). The pricing in the Dollar denominated EDM arrangement continues to be unfavourable due to depreciation of the Lilangeni against the US Dollar.
Forward-Looking Strategy
Despite the challenging economic environment, we have achieved improved results compared to the previous years. The long-term strategy which we adopted and intensified in 2016 is producing tangible results as seen in the improvement of the company’s asset base to over E3 billion. Our operating profit in the year under review also showed an impressive growth of E603 million in 2018 compared to E148 million in 2017. This 307% growth was a result of a combination of factors, among which were the savings from intensifying purchases of electricity from the Day Ahead Spot Market. The latter offers favourable rates when compared to the normal supply from bilateral contracts. Revenue improvements combined with close monitoring and control of operating expenditure and implementation of the listed austerity measures had a positive impact on the company’s bottom line.
Annual units sold grew slightly to 1,094.8 GWh from 1,058.4 GWh from the previous financial year. The slight growth was as a result of increases in domestic and major customer units whilst on the other hand both small commercial and major customers indicated a decline during the 2017-18 financial year compared to the 2016-17 financial year.
I am extremely proud of the EEC team that has brought about this transformation over the past two years, and our customers with whom we share a long-term and trusted relationship. We hope not to lose sight of the fact that the environment we operate in remains uncertain, so we must maintain our focus, discipline and commitment to excellence.
We also need to move at the supersonic speed with which our industry is changing by adapting positively to innovation. One way in which EEC is responding to its mandate of delivering efficient and reliable electricity is through interventions to increase internal generation capacity. Discussions with an Independent Power Producer (IPP) to implement the Lower Maguduza
Hydro project are at an advanced stage. Preparations to construct a 10MW solar plant at Lavumisa are well underway and a contract to conduct a feasibility study for the proposed thermal coal plant at Lubhuku is about to be signed.
The ending of the drought resulted in improved internal generation performance this financial year. The results demonstrate that internal generation production increased from 118.9GWh in 2017 to 207.8GWh, as at the 31st of March 2018. This shows that generation figures for the year ending March 2018 are lower than the capability. They are also lower than what was achieved at the end of the financial year in March 2015, which preceded the drought. On average, internal generation contributes 20% of the total annual energy demand for the country and the balance is imported.
We remain optimistic that the drought situation has been broken with the river flows increasing. Currently, imports from Eskom account for 65% (80% in 2017) of Eswatini’s electricity needs while EEC increased its contribution from 10% to 16% compared to the previous year. Trading from the SAPP markets increased this financial year and accounted for 14% of total imported power (6% in 2017). The increased trading activities mitigated the overall costs of supply by taking advantage of lower electricity prices from the SAPP spot markets.
Major Capital Projects
There clearly is a need to move full steam ahead to increase and diversify our internal generation capacity. Coupled with that, we continue to make major strides in optimising current opportunities whilst developing a range of innovative new partnerships across the energy value chain.
To that end, we have made significant progress in our interaction with IPPs. I am happy to report on the completion of the Dwaleni II – Stonehenge 132kV Line Design, which is targeted at improving capacity in the capital city, Mbabane, and surrounding areas. There is also the LUSIP Phase I along the Usuthu River bank, which is a strategic intervention in a largely agricultural sector. Another milestone is the Lavumisa Solar PV Project to exploit renewable energy. The planned construction of this E120 million plant is progressing well and is earmarked to generate 10 MW of electricity. Moreover, the goal to increase power generation within the Kingdom of Eswatini is bolstered by a thermal project earmarked to produce about 300 MW.
BUSINESS REVIEW | MANAGING DIRECTOR’S REPORT
ESWATINI ELECTRICITY COMPANY | ANNUAL REPORT 2017/18
23

MANAGING DIRECTOR’S REPORT- continued
Innovating the Customer Experience
EEC remains focused on satisfying customer needs by building on trust, relationships and excellence. We believe in constant engagement with our customers and in redefining the customer experience. We also leverage on technology to improve the Outage Management System (OMS) and overall activity in social media platforms to reach out to our customers. We will continue to improve our Call and Service Centres to meet the dynamic needs of our customers. With technological innovations changing the way we live, work and play on a daily basis, EEC will continue to leverage on the latest technology to enhance customer satisfaction.
It is through such interventions that our customer base continues to grow year on year. EEC’s customer base rose from 182,562 in March 2017 to a total of 203,584 in March 2018. This shows a 12% growth from the previous financial year. A bulk of the customers are in the domestic sector. We continue to take bold action to increase coverage of rural and remote areas as electricity is a great catalyst to fulfil the country’s development agenda.
The Board of Directors has instructed us to improve equitable access to electricity and make sure that customers get value for money. We are working on packages designed to help the indigent, pensioners, the elderly and those living below minimum wage to gain access to electricity.
EEC places a high premium on the safety of the dedicated men and women who work hard, sometimes in challenging weather conditions to keep the lights on. In 2017/18, we continued to see an overall improvement in
our safety performance. The number of reportable injuries fell by a further 4.76% and the number of minor public injuries fell by 100% when compared to 2016-17. We have also made significant improvements in the number of near misses reported (up by over 20%) and have also started to capture man hours free of incidents. Our safety performance has continued to improve following a period of significant organisational strategy change.
The company is committed to upholding health and safety. We rely on a powerful tool: safety and health programs that focus on prevention, identifying and fixing the hazards before they cause harm. This is a shared responsibility of management, the labour formations and contractors. Together we have established strong systems to ensure security and safety for our employees as reflected in the ISO certifications of the integrated management systems we have secured. This extends to our commitment to be good stewards of the environment.
Call to Action
The country continues to lose millions of Emalangeni each year due to vandalism, electricity theft and copper theft. Such acts hamper economic development and negatively affect the quality of life of the people.
MR. MESHACK KUNENEManaging Director
BUSINESS REVIEW | MANAGING DIRECTOR’S REPORT
ESWATINI ELECTRICITY COMPANY | ANNUAL REPORT 2017/18
24

SUMMARYGENERATION SYSTEM DEMAND FOR THE YEAR UNDER REVIEWRIVER FLOWS AT GS15SYSTEM PERFORMANCE IMPROVEMENTNETWORK EXTENSIONSAPP PARTICIPATION
26263031343434
OPERATIONSREPORT
BUSINESS REVIEW | OPERATIONS REPORT
ESWATINI ELECTRICITY COMPANY | ANNUAL REPORT 2017/18
25
- EFFECTIVE DELIVERY OF ENERGY, THROUGH RELIABLE AND EFFICIENT PROCESSES
Distribution Lines
Internal Power Generated
System Max. Demand
20,391KM
236 MW
16%

OPERATIONS REPORT- continued
Summary
he financial year under review had less challenges for the Operations Division regarding hydro power generation as it was a relatively wet year. Following improved dam levels, the resumption of activity at Maguga Hydro Power Station increased internal generation to better levels compared to the previous financial year. As a result, EEC
did not implement load management programmes to curtail system demand due to the availability of water for internal generation.
The foreign exchange rate level continues to be a challenge with respect to energy for those imports that are dollar denominated. This has meant that EEC’s Power Supply Agreement with Mozambican energy utility, Electricidade de Moçambique (EDM) remains suspended as the costs continued to surpass the selling price. The river flows remained encouraging during the financial year and internal generation was sustained at all hydro power stations to mitigate peak loads.
However, the improvement in weather conditions came with another challenge. The increase in inclement weather led to an increase in network outages affecting both the transmission and distribution lines. The company is preparing budgets to implement the Network Master Plan designed to increase network reliability through infrastructure development projects. Improvement of the quality of supply is among the top priorities for the Operations Division.
Generation
EEC owns and operates four hydro power stations. Three of these are operated on the Usuthu River Basin catchment area and the fourth from the Komati Basin Water Authority (Maguga Dam). The effects of drought began to show waning signs this financial year, as the results demonstrate that internal generation production increased from 118.9GWh in 2017 to 207.8GWh, as at the 31 March 2018.
Figure 1 above shows the generation levels month-on-month for the last five financial years. The impact of the 2016/17 drought is seen up to December 2016. Improvement on weather conditions and the resulting benefits to local generation are seen throughout 2017/18, with March 2018 recording the highest local generation output for the year.
Apr
May
Jun
Jul
Aug
Sep
Oct
Nov
Dec
Jan
Feb
Mar
40
35
30
25
20
15
10
5
0
Monthly Energy Generation, GWh
2014/15 2015/16 2016/17 2017/18
Figure 1: Monthly Generation for the last five years
BUSINESS REVIEW | OPERATIONS REPORT
ESWATINI ELECTRICITY COMPANY | ANNUAL REPORT 2017/18
26
T

Figure 2 shows that the cumulative generation figures for the year ending March 2018 are lower than the capability and lower than what was achieved at the end of the year in March 2015, which preceded the drought. It also shows an improving generation performance as the hydro power production ramped up, from December 2017 to March 2018. We remain optimistic that the current drought situation has been broken with the river flows increasing.
Apr
May
Jun
Jul
Aug
Sep
Oct
Nov
Dec
Jan
Feb
Mar
350
300
250
200
150
100
50
0
2014/15 2015/16 2016/172013/14 2017/18
GW
h
Cumulative Energy Generated (GWh)
Figure 2: Year on Year Cumulative Generation GWh for the last five years
BUSINESS REVIEW | OPERATIONS REPORT
ESWATINI ELECTRICITY COMPANY | ANNUAL REPORT 2017/18
27
An EEC Technician inspecting a 10 MVA transformer

OPERATIONS REPORT- continued
BUSINESS REVIEW | OPERATIONS REPORT
ESWATINI ELECTRICITY COMPANY | ANNUAL REPORT 2017/18
28
Figure 3 shows the contribution by each hydro power site under EEC operations. Maguga Hydro Power has improved its contribution to 34.3% compared to 4% in the previous year. This was due to an increase in the level of the dam following better summer rainfall than in the previous year. The overall performance for internal generation improved in the current financial year due to more favourable rain conditions and the high level of plant performance.
Figure 4 shows a year-on-year production per hydro power station. The graphs indicate that there was progressive decline in generation production between 2013 and 2018, though the latest financial year saw a better performance. The graphs in Figure 4 show that 2013/14 was the best year for internal electricity generation than the year under review. Maguga Hydro Power contributed significantly once again this financial year.
Figure 3: Internal Generation Contribution by Power Station
Ezulwini
Maguga Edwaleni
Maguduza
2017/18 Plant Contribution toInternal Generation (GWh, %)
34%
11%
34%
21%
Figure 4: Annual Generation According to Hydro Power Station
120
100
80
60
40
20
0
2013/14
Ezulwini Edwaleni MaguduzaMaguga
2014/15 2015/16 2016/17
GW
h
Annual Generation Per Station
2017/18

BUSINESS REVIEW | OPERATIONS REPORT
ESWATINI ELECTRICITY COMPANY | ANNUAL REPORT 2017/18
29
350
300
250
200
150
100
50
0
GW
hInternal Generation (GWh) & Contribution to System (%)
2006
/07
2007
/08
2008
/09
2009
/10
2010
/11
2011
/12
2012
/13
2013
/14
2014
/15
2015
/16
2016
/17
2017
/18
173.
1
150.
1 246.
1
288.
1 334.
0
278.
5
240.
115.6%14.0%
21.0%
24.3%
29.5%
25.7% 22.1%
25.1%
18.4%
GWh Contribution to System (%)
9.8% 9.8%
16.3%
302.
6
321.
0
123.
3
118.
9
207.
8
35%
30%
25%
20%
15%
10%
5%
0%
Con
tribu
tion
to S
yste
m %
Figure 5: Trends showing contribution of internal generation to energy demand
Figure 5 shows the trend for the contribution to annual energy demand by internal generation. The trend follows the weather climatic conditions and it is useful as an input to generation planning for the following year. On average, internal generation contributes 20% of the total annual energy demand for the country and the balance is imported.
Table 1 below demonstrates the total monthly electricity usage for the country by source. The imports from EDM continued to be temporarily suspended due to the escalation of prices and owing to the depreciation of the Lilangeni against the US Dollar.
Table 1 Monthly Electricity Usage and Demand
MONTH ESKOM (MWh)
EDM (MWh)
DAM (MWh)
EEC (MWh)
USL (MWh)
Buckswood (MWh)
Total Energy (MWh)
Maximum Demand (MW)
Apr-17 59,635.64 25,264.20 21,908.06 2,166.78 13.54 108,988.22 223.33
May-17 60,149.13 12,765.30 17,728.28 8,463.38 12.57 99,118.66 204.19
Jun-17 56,501.77 18,735.70 16,525.09 8,819.70 11.63 100,593.89 201.75
Jul-17 49,789.81 25,311.70 17,869.61 9,106.65 8.82 102,086.59 205.09
Aug-17 50,776.64 25,441.40 16,668.87 8,734.57 13.97 101,635.45 200.09
Sep-17 73,190.98 7,876.00 10,860.02 8,025.08 12.89 99,964.97 215.10
Oct-17 85,499.53 2,785.00 12,368.79 7,260.10 15.20 107,928.62 221.18
Nov-17 72,962.97 10,042.20 10,384.25 6,790.56 16.47 100,196.44 216.47
Dec-17 86,287.61 3,538.00 15,707.35 737.95 12.89 106,283.80 218.46
Jan-18 92,778.15 4,440.00 24,222.57 0.00 0.00 121,440.72 236.06
Feb-18 74,061.29 16,227.00 18,521.23 0.00 0.00 108,809.52 233.70
Mar-18 56,848.27 29,834.30 24,995.32 0.00 0.00 111,677.89 232.68
TOTAL 818,481.9 182,260.0 207,759.4 60,104.7 117.98 1,268,723.98 236.06
OPERATIONS REPORT- continued
BUSINESS REVIEW | OPERATIONS REPORT
ESWATINI ELECTRICITY COMPANY | ANNUAL REPORT 2017/18
30
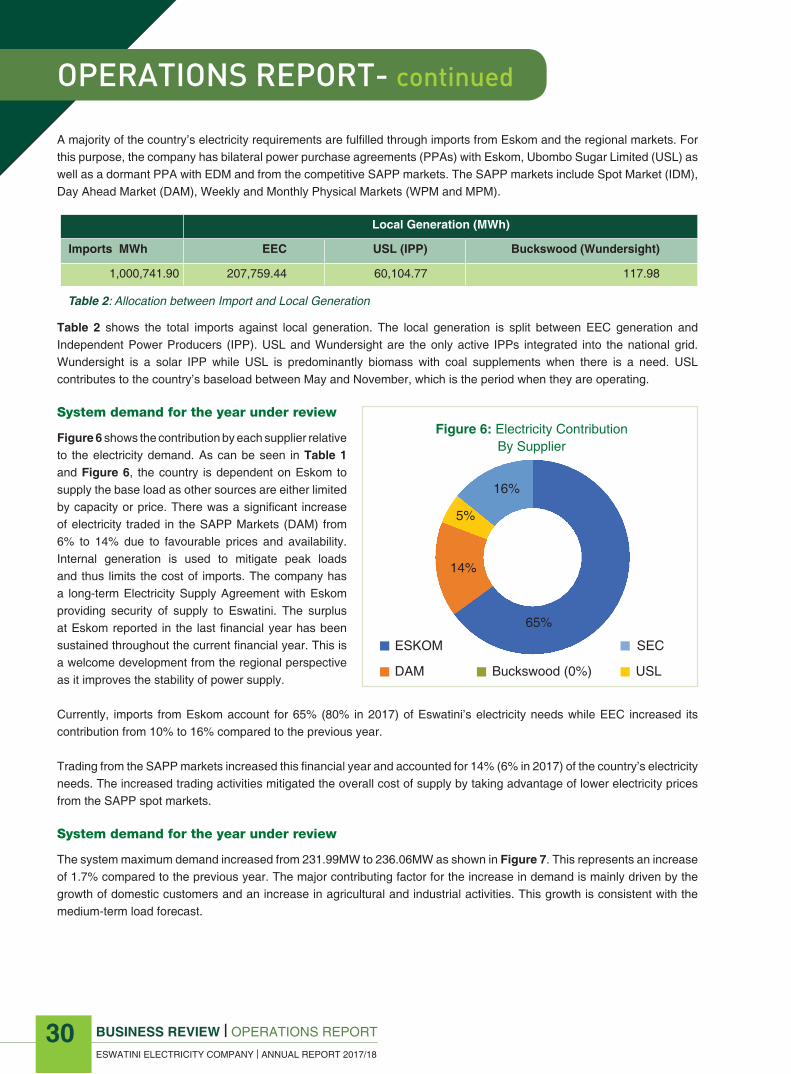
A majority of the country’s electricity requirements are fulfilled through imports from Eskom and the regional markets. For this purpose, the company has bilateral power purchase agreements (PPAs) with Eskom, Ubombo Sugar Limited (USL) as well as a dormant PPA with EDM and from the competitive SAPP markets. The SAPP markets include Spot Market (IDM), Day Ahead Market (DAM), Weekly and Monthly Physical Markets (WPM and MPM).
Table 2 shows the total imports against local generation. The local generation is split between EEC generation and Independent Power Producers (IPP). USL and Wundersight are the only active IPPs integrated into the national grid. Wundersight is a solar IPP while USL is predominantly biomass with coal supplements when there is a need. USL contributes to the country’s baseload between May and November, which is the period when they are operating.
System demand for the year under review
Figure 6 shows the contribution by each supplier relative to the electricity demand. As can be seen in Table 1 and Figure 6, the country is dependent on Eskom to supply the base load as other sources are either limited by capacity or price. There was a significant increase of electricity traded in the SAPP Markets (DAM) from 6% to 14% due to favourable prices and availability. Internal generation is used to mitigate peak loads and thus limits the cost of imports. The company has a long-term Electricity Supply Agreement with Eskom providing security of supply to Eswatini. The surplus at Eskom reported in the last financial year has been sustained throughout the current financial year. This is a welcome development from the regional perspective as it improves the stability of power supply.
Currently, imports from Eskom account for 65% (80% in 2017) of Eswatini’s electricity needs while EEC increased its contribution from 10% to 16% compared to the previous year.
Trading from the SAPP markets increased this financial year and accounted for 14% (6% in 2017) of the country’s electricity needs. The increased trading activities mitigated the overall cost of supply by taking advantage of lower electricity prices from the SAPP spot markets.
System demand for the year under review
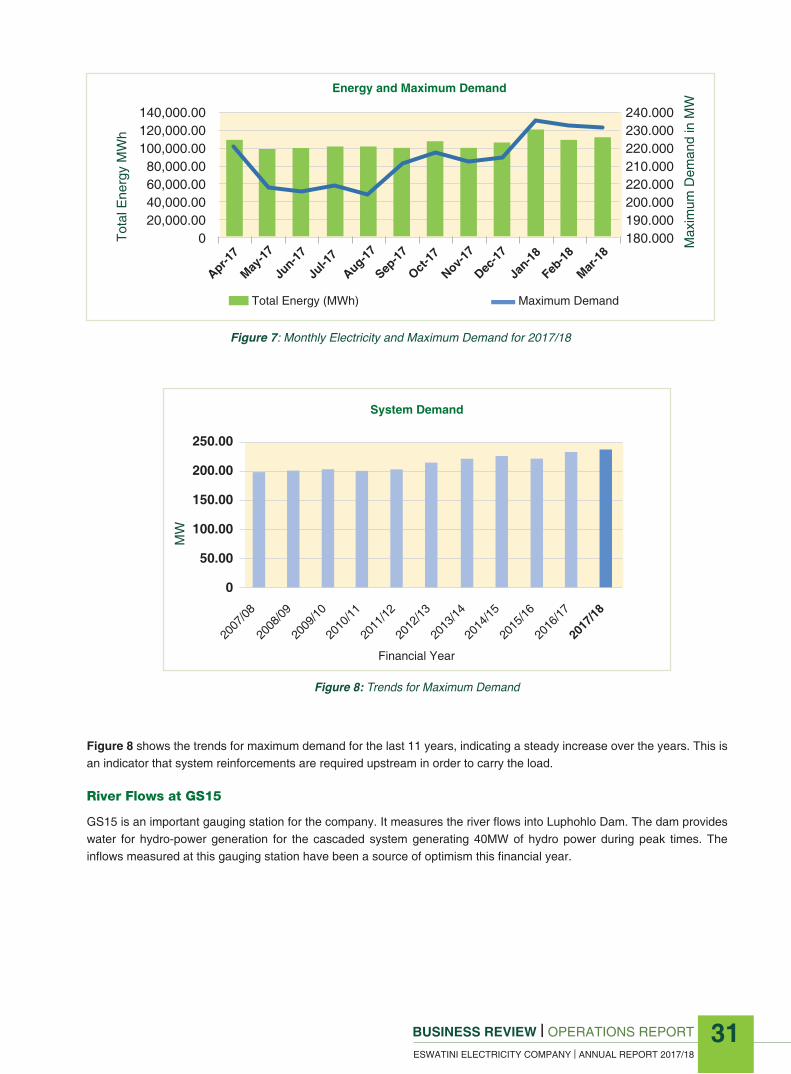
The system maximum demand increased from 231.99MW to 236.06MW as shown in Figure 7. This represents an increase of 1.7% compared to the previous year. The major contributing factor for the increase in demand is mainly driven by the growth of domestic customers and an increase in agricultural and industrial activities. This growth is consistent with the medium-term load forecast.
Local Generation (MWh)
Imports MWh EEC USL (IPP) Buckswood (Wundersight)
1,000,741.90 207,759.44 60,104.77 117.98
Table 2: Allocation between Import and Local Generation
Figure 6: Electricity Contribution By Supplier
SECESKOM
USLBuckswood (0%)DAM
5%
14%
65%
16%
BUSINESS REVIEW | OPERATIONS REPORT
ESWATINI ELECTRICITY COMPANY | ANNUAL REPORT 2017/18
BUSINESS REVIEW | OPERATIONS REPORT
ESWATINI ELECTRICITY COMPANY | ANNUAL REPORT 2017/18
31
Apr-17
May-17
Jun-17
Jul-1
7
Aug-17
Sep-17
Oct-17
Nov-17
Dec-17
Jan-18
Feb-18
Mar-18
140,000.00120,000.00100,000.0080,000.0060,000.0040,000.0020,000.00
0
240.000230.000220.000210.000220.000200.000190.000180.000
Energy and Maximum Demand
Tota
l Ene
rgy
MW
h
Max
imum
Dem
and
in M
W
Total Energy (MWh) Maximum Demand
Figure 7: Monthly Electricity and Maximum Demand for 2017/18
Figure 8: Trends for Maximum Demand
MW
System Demand
2007
/08
2008
/09
2009
/10
2010
/11
2011
/12
2012
/13
2013
/14
2014
/15
2015
/16
2016
/17
2017
/18
250.00
200.00
150.00
100.00
50.00
0
Financial Year
Figure 8 shows the trends for maximum demand for the last 11 years, indicating a steady increase over the years. This is an indicator that system reinforcements are required upstream in order to carry the load.
River Flows at GS15
GS15 is an important gauging station for the company. It measures the river flows into Luphohlo Dam. The dam provides water for hydro-power generation for the cascaded system generating 40MW of hydro power during peak times. The inflows measured at this gauging station have been a source of optimism this financial year.

OPERATIONS REPORT- continued
BUSINESS REVIEW | OPERATIONS REPORT
ESWATINI ELECTRICITY COMPANY | ANNUAL REPORT 2017/18
32
Figure 9 shows the trends for Lusushwana River flows at GS15. The trends indicate that the river flows improved in the year under review compared to previous years despite that the flows were lower at the end of the financial year.
Figure 10 shows the trends for the level at Luphohlo Dam. The dam level follows the season and its operation over the years, which have not changed significantly. The priority is to conserve water for the high season in order to maintain generation at full capacity during peak times.
10.0
9.0
8.0
7.0
6.0
5.0
4.0
3.0
2.0
1.0
0
2013/14 2015/16 2016/172014/152012/13
Apr-17
May-17
Jun-17
Jul-1
7
Aug-17
Sep-17
Oct-17
Nov-17
Dec-17
Jan-18
Feb-18
Mar-18
Luphohlo Monthly FIows (m3/s)
Figure 9: Luphohlo Flow Trends at GS15
A view of Luphohlo Dam at Siphocosini

BUSINESS REVIEW | OPERATIONS REPORT
ESWATINI ELECTRICITY COMPANY | ANNUAL REPORT 2017/18
BUSINESS REVIEW | OPERATIONS REPORT
ESWATINI ELECTRICITY COMPANY | ANNUAL REPORT 2017/18
33
Luphohlo Dam % Volume
% V
olum
e
100
80
60
40
20
0
Apr-17
May-17
Jun-17
Jul-1
7
Aug-17
Sep-17
Oct-17
Nov-17
Dec-17
Jan-18
Feb-18
Mar-18
2013/14 2015/16 2016/172014/152012/13
Figure 10: Luphohlo Dam Profile
The trend for 2017-18 at Maguga Dam in Figure 11 shows that the level has been falling until November 2016 and began to rise again as the summer rains arrived. The level rose to about 90% at the end of the financial year, which has been consistent with the performance of the hydro power station at this site.
Maguga Dam % Volume
% V
olum
e
100
80
60
40
20
0
Apr-17
May-17
Jun-17
Jul-1
7
Aug-17
Sep-17
Oct-17
Nov-17
Dec-17
Jan-18
Feb-18
Mar-18
2016/17 2017/182015/16
Figure 11: Maguga Dam Level Trends

OPERATIONS REPORT- continued
BUSINESS REVIEW | OPERATIONS REPORT
ESWATINI ELECTRICITY COMPANY | ANNUAL REPORT 2017/18
34
System Performance Improvement Projects
Our organisation continues to improve the performance of the system. In the year under review, a number of capital projects were implemented in order to improve system reliability and operational effectiveness. During the year under review, the company began implementation of the transmission reinforcement project between Big Bend and Maloma T. About E18 million was spent on the project. The first phase of the project is between Big Bend and Ncandweni, which is to be followed by Ncandweni to Maloma T.
The line will be constructed on galvanised steel monopoles for reliability. Although the capital costs are higher for steel structures, their maintenance intervals are longer and lower in costs. This project further reinforces the communication systems through the introduction of an optical fibre link between Big Bend and Maloma T. This will also improve the performance of communication and information technology systems, and enhance the company’s position in the telecommunications infrastructure industry. Designs and environmental studies for the second 132kV line to reinforce the Western grid at Stonehenge were completed. Network Extension
The year has seen more activities on the distribution network extension projects to communities that previously had no access to electricity. These projects can be attributed to funding from the Ministry of Natural Resources and Energy under the Rural Electrification Programme sponsored by the Republic of China on Taiwan, Regional Development Programme under the Tinkhundla Ministry, and Micro Projects. The projects include a new transmission line from River Bank to St Philip’s. The table (right) shows the cumulative distance covered by the electricity delivery infrastructure. There was an overall increase from 19 323 to 20 391, which is over 1 000km of new lines.
SAPP Participation
EEC continues to participate in the Southern African Power Pool (SAPP), where it is also recognised as an operating member. Besides the semi-annual meetings, the company benefited from SAPP-sponsored training for electricity traders on the Day Ahead Market and Intra-Day Market, Weekly Physical Market and Monthly Physical Market. The company also sent a delegate to a planners training workshop. The SAPP Capacity Building programme continues to benefit utilities in the region, particularly on markets and transmission planning.
Description Overall Distance Covered (km)
Transmission Lines - 132kV Transmission Lines (km) 296
- 66kV Transmission Lines (km) 986
Distribution Lines - 11kV Lines (km) 11,186
- Low Voltage Lines (km) 9,205
20,391
Table 3: Network Line Statistics
Table 3 shows the overall extent of the network.
A side view of Maguga Dam

BUSINESS REVIEW | CUSTOMER SERVICE REPORT
ESWATINI ELECTRICITY COMPANY | ANNUAL REPORT 2017/18
35
MAJOR CUSTOMERS’ CONTRIBUTION COMPARED TO DOMESTIC AND SMALL COMMERCIAL CUSTOMERSCUSTOMER QUOTATIONSCALL CENTRECUSTOMER EDUCATIONDEBT MANAGEMENTVENDINGSYSTEM LOSSES & METER INSPECTIONCUSTOMER FEEDBACK
36
40404141414141
CUSTOMERSERVICE
REPORT- BUILDING STRONGER RELATIONSHIPS
WITH OUR STAKEHOLDERS
Turnover for the Year
Annual Unit Sales
Total Customers
3.56%
203 584
1,095 GWh

CUSTOMER SERVICE REPORT- continued
BUSINESS REVIEW | CUSTOMER SERVICE REPORT
ESWATINI ELECTRICITY COMPANY | ANNUAL REPORT 2017/18
36
1. MAJOR CUSTOMERS’ CONTRIBUTION COMPARED TO DOMESTIC AND SMALL COMMERCIAL CUSTOMERS
bout 1% of EEC’s customer base (major customers) contributed 57% of the sales revenue (E1 114M) in the year under review whereas 92% of the customers (domestic customers) contributed only 30% of the revenue (E583M). Small commercial customers, who form 8% of the customer base, contributed 13% of the sales revenue (E249M).
a. GROWTH IN NUMBERS
As of the end of the year under review, EEC had a total of 203 584 customers, which represents 12% growth from the previous financial year. Figure 1 below shows the total number of customers over the years.
Major customers grew slightly to 1 177 in the 2017/18 financial year from 1 161 in 2016/17. This represents a 1.3% growth. Small commercial and domestic customers grew by 7.6% and 12.1%, respectively. On the overall, domestic customers have grown significantly over the last five years by 52.7% from 122 428 to 187 052, while small commercial customers grew by 36.6% from 11 240 to 15 355. Major customers grew by 7.2% from 1 097 to 1 177, as shown in Figure 2.
Figure 1: Customer Growth in Past 5 years
250,000
200,000
150,000
100,000
50,000
0
Num
ber o
f Cus
tom
ers
Total Number of Customers
2014 2015 2016 2017 2018
203,584182,251164,213150,668134,765No. of Customers
A

BUSINESS REVIEW | CUSTOMER SERVICE REPORT
ESWATINI ELECTRICITY COMPANY | ANNUAL REPORT 2017/18
b. GROWTH IN SALES UNITS
Annual units sold grew slightly to 1 094.8 GWh from 1 058.4 GWh recorded in the previous financial year. The slight growth was as a result of an increase in domestic and major customer units whilst, on the other hand, small commercial customers showed a decline during the 2017/18 financial year compared to 2016/17. Figure 3 below shows the growth in units over the past years.
BUSINESS REVIEW | CUSTOMER SERVICE REPORT
ESWATINI ELECTRICITY COMPANY | ANNUAL REPORT 2017/18
37
Number of Customers by Customer Tariff Category
Num
ber
of C
usto
mer
s
Domestic
2014
2015
2016
2017
2018
122,428
137,335
149,744
167,822
187,052
11,240
12,203
13,320
14,268
15,355
1,097
1,130
1,149
1,161
1,177
MajorSmall Commercial
200,000180,000160,000140,000120,000100,00080,00060,00040,00020,000
0
Figure 2: Number of Customers per Category
Figure 3: Annual Unit Sales Growth in GWh
1,100.00
1,090.00
1,080.00
1,070.00
1,060.00
1,050.00
1,040,00
1,030.00
1,020.00
1,010.00
1,000.00
GW
h
Annual Unit Sales (GWh)
2014 2015 2016 2017 2018
1,0951,0581,0841,0741,034Annual Unit Sales
Unit sales grew by 2.0% in the domestic category from 383 GWh in 2016/17 to 391 GWh in 2017/18. There was a drop in the small commercial customer bracket of 0.8% whilst the major customer category increased by 5.2%. Figure 4 shows a decrease in small commercial customer sales whilst the major customer and domestic customer categories increased in the financial year under review.

CUSTOMER SERVICE REPORT- continued
BUSINESS REVIEW | CUSTOMER SERVICE REPORT
ESWATINI ELECTRICITY COMPANY | ANNUAL REPORT 2017/18
38
Unit sales grew by 15.8% in the domestic customer category in the last five years and by 9.6% in the small commercial customer category. Meanwhile, the major customer category declined by 0.4%.
c. GROWTH IN SALES REVENUE
The overall sales revenue for the financial year 2017/18 was E1 946 million, which reflects an increase of 19.8% from the E1 624 million recorded in 2016/17. Figure 5 shows the trend in sales revenue over the years.
Unit Sales by Customer Category
Num
ber
of U
nits
(E-M
illio
n)
Domestic
2014
2015
2016
2017
2018
338,070,927
352,183,804
368,241,191
383,794,670
391,466,452
97,909,804
103,395,067
103,624,834
108,195,361
107,333,003
598,259,226
618,543,650
612,250,402
566,407,802
595,967,804
MajorSmall Commercial
700,000,000
600,000,000
500,000,000
400,000,000
300,000,000
200,000,000
100,000,000
-
Figure 4: Units sold per Customer Category
Figure 5: Annual Unit Sales Revenue
250,000,000
200,000,000
150,000,000
100,000,000
50,000,000
0
Ann
ual S
ales
Annual Sales Revenue (E-Million)
2014 2015 2016 2017 2018
1,945,949,2591,624,163,2921,499,300,9591,338,141,4581,175,261,338Annual Sales Revenue (E)

BUSINESS REVIEW | CUSTOMER SERVICE REPORT
ESWATINI ELECTRICITY COMPANY | ANNUAL REPORT 2017/18
Major customer sales grew by 20.1% from E926 million in 2016/17 to E1 113 million in 2017/18. This is attributable mainly to the tariff increase. Domestic customer sales revenue grew by 21.0% from E481 million to E582 million in 2017/18. This is mainly attributable to growth in the number of customers by about 20 230. Small commercial customers also contributed 16.8% from E214 million to E250 million in the year under review. Figure 6 below shows the sales revenue growth by tariff category.
BUSINESS REVIEW | CUSTOMER SERVICE REPORT
ESWATINI ELECTRICITY COMPANY | ANNUAL REPORT 2017/18
39
Sales Revenue by Customer Category
SalesRevenue (E)
Domestic
301,465,640
351,405,823
413,175,665
481,222,864
582,507,502
140,632,659
163,415,068
184,468,140
213,974,794
249,600,962
733,163,038
823,320,566
901,657,15
926,785,063
1,113,840,795
Major
1,200,000,000
1,000,000,000
800,000,000
600,000,000
400,000,000
200,000,000
-Small Commercial
2014
2015
2016
2017
2018
Excellent Customer Service is central to our operations
CUSTOMER SERVICE REPORT- continued
BUSINESS REVIEW | CUSTOMER SERVICE REPORT
ESWATINI ELECTRICITY COMPANY | ANNUAL REPORT 2017/18
40
2. CUSTOMER QUOTATIONS
A total of 21 791 quotations were processed by EEC in the 2017/18 financial year. The Manzini region had more quotations compared to the other regions. On average, each region had about 5 000 quotations processed. The increase in the number of quotations was as a result of accessible funding from Micro-projects, the Rural Development Fund, Ministry of Natural Resources and Energy as well as the Republic of China (Taiwan). Some customers self-fund their projects, more especially business and domestic customers who urgently need supply and cannot wait for the process of funded schemes as well as those who cannot form group schemes. The turn-around time in processing quotations has drastically improved after engaging more staff at the EEC Service Centres.
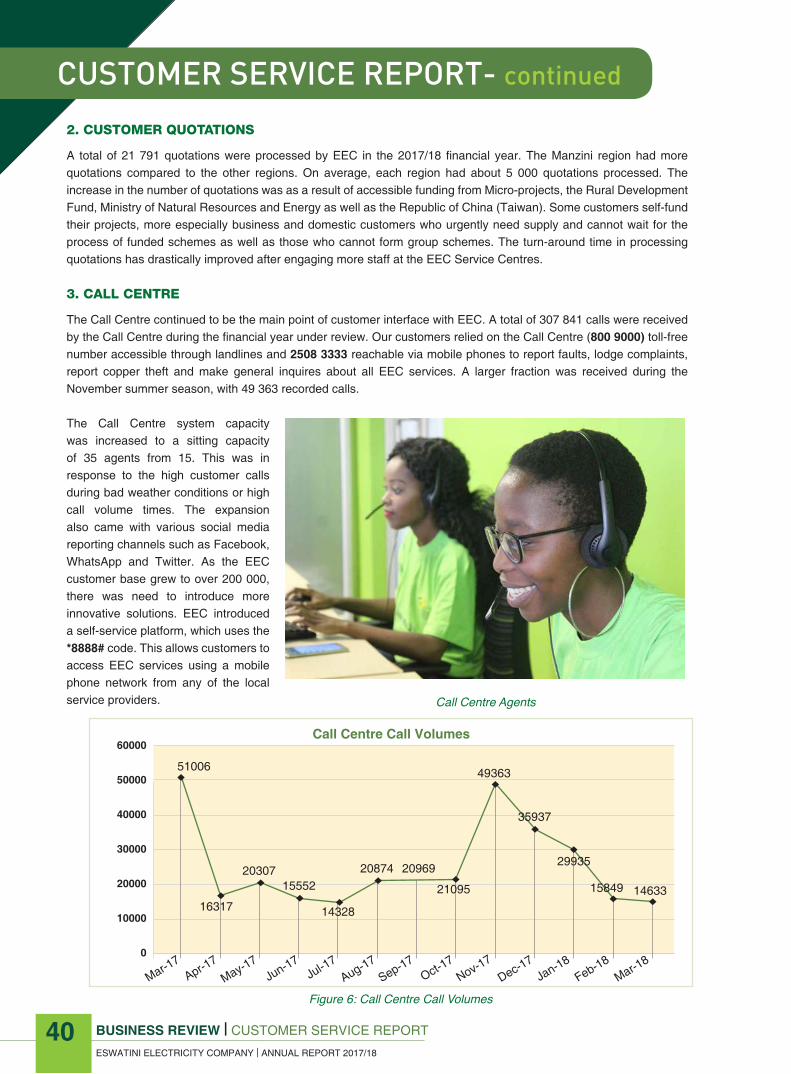
3. CALL CENTRE
The Call Centre continued to be the main point of customer interface with EEC. A total of 307 841 calls were received by the Call Centre during the financial year under review. Our customers relied on the Call Centre (800 9000) toll-free number accessible through landlines and 2508 3333 reachable via mobile phones to report faults, lodge complaints, report copper theft and make general inquires about all EEC services. A larger fraction was received during the November summer season, with 49 363 recorded calls.
The Call Centre system capacity was increased to a sitting capacity of 35 agents from 15. This was in response to the high customer calls during bad weather conditions or high call volume times. The expansion also came with various social media reporting channels such as Facebook, WhatsApp and Twitter. As the EEC customer base grew to over 200 000, there was need to introduce more innovative solutions. EEC introduced a self-service platform, which uses the *8888# code. This allows customers to access EEC services using a mobile phone network from any of the local service providers.
Figure 6: Call Centre Call Volumes
Call Centre Call Volumes60000
50000
40000
30000
20000
10000
0
Jan-18Feb-18
Mar-18
Dec-17Nov-17
Oct-17
Sep-17Jul-17
Aug-17Jun-17
May-17Apr-1
7Mar-1
7
51006 49363
2030715552
20874 20969
14633
35937
29935
1584921095
1432816317
Call Centre Agents
BUSINESS REVIEW | CUSTOMER SERVICE REPORT
ESWATINI ELECTRICITY COMPANY | ANNUAL REPORT 2017/18
4. CUSTOMER EDUCATION
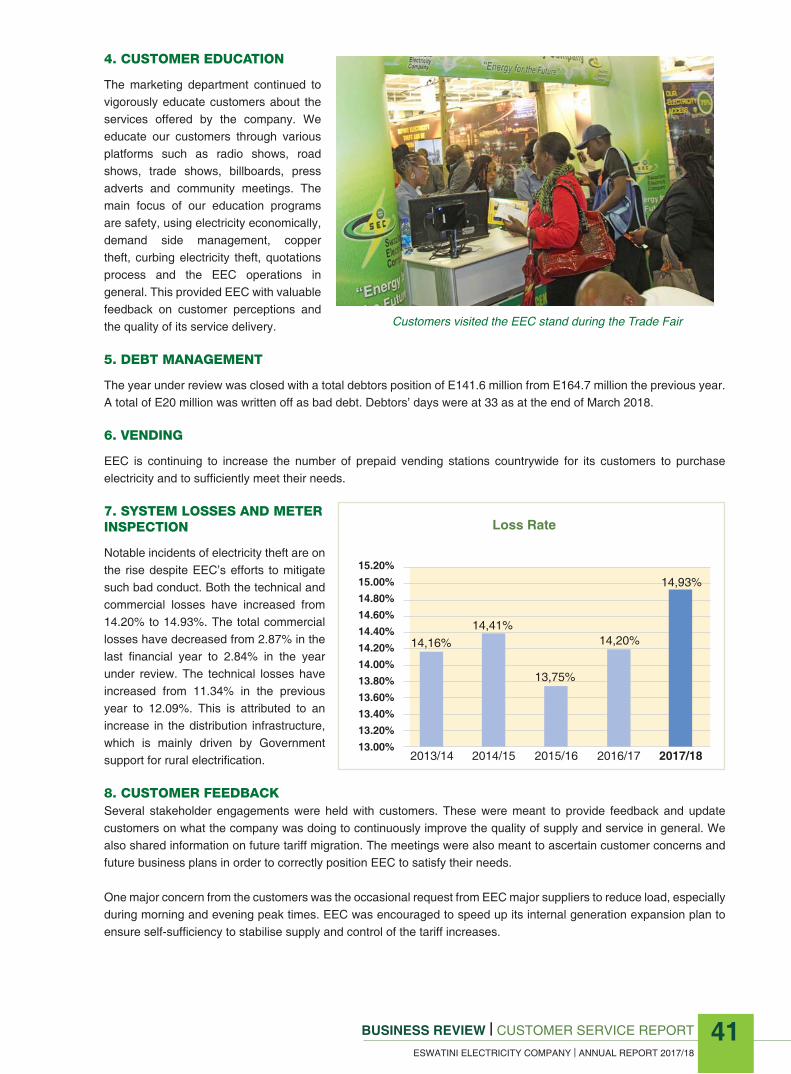
The marketing department continued to vigorously educate customers about the services offered by the company. We educate our customers through various platforms such as radio shows, road shows, trade shows, billboards, press adverts and community meetings. The main focus of our education programs are safety, using electricity economically, demand side management, copper theft, curbing electricity theft, quotations process and the EEC operations in general. This provided EEC with valuable feedback on customer perceptions and the quality of its service delivery.
5. DEBT MANAGEMENT
The year under review was closed with a total debtors position of E141.6 million from E164.7 million the previous year. A total of E20 million was written off as bad debt. Debtors’ days were at 33 as at the end of March 2018.
6. VENDING
EEC is continuing to increase the number of prepaid vending stations countrywide for its customers to purchase electricity and to sufficiently meet their needs.
7. SYSTEM LOSSES AND METER INSPECTION
Notable incidents of electricity theft are on the rise despite EEC’s efforts to mitigate such bad conduct. Both the technical and commercial losses have increased from 14.20% to 14.93%. The total commercial losses have decreased from 2.87% in the last financial year to 2.84% in the year under review. The technical losses have increased from 11.34% in the previous year to 12.09%. This is attributed to an increase in the distribution infrastructure, which is mainly driven by Government support for rural electrification.
8. CUSTOMER FEEDBACKSeveral stakeholder engagements were held with customers. These were meant to provide feedback and update customers on what the company was doing to continuously improve the quality of supply and service in general. We also shared information on future tariff migration. The meetings were also meant to ascertain customer concerns and future business plans in order to correctly position EEC to satisfy their needs.
One major concern from the customers was the occasional request from EEC major suppliers to reduce load, especially during morning and evening peak times. EEC was encouraged to speed up its internal generation expansion plan to ensure self-sufficiency to stabilise supply and control of the tariff increases.
BUSINESS REVIEW | CUSTOMER SERVICE REPORT
ESWATINI ELECTRICITY COMPANY | ANNUAL REPORT 2017/18
41
15.20%15.00%14.80%14.60%14.40%14.20%14.00%13.80%13.60%13.40%13.20%13.00%
14,16%14,41%
14,20%
14,93%
13,75%
2013/14 2014/15 2015/16 2016/17 2017/18
Loss Rate
Customers visited the EEC stand during the Trade Fair

HIGHLIGHTSLOWLIGHTSTALENT MANAGEMENTHUMAN CAPITAL DEVELOPMENTHR ADMINISTRATIONHR MAINTENANCETURNOVEREMPLOYEE RELATIONS & WELLNESS
4345454647495051
HUMAN CAPITAL
REPORT
BUSINESS REVIEW | HUMAN CAPITAL REPORT
ESWATINI ELECTRICITY COMPANY | ANNUAL REPORT 2017/18
42
- EFFECIENCY THROUGH RESPONSIBLE AND PRODUCTIVE HUMAN RESOURCES
Wellness Members
PermanentEmployees
Peer Educators Trained
340
38
674

HIGHLIGHTS:
HUMAN CAPITAL PHILOSOPHY PROJECTS:• Performance Management: As a learning organisation we continue to drive a high performance culture through
the Balanced Scorecard (BSC) performance management system. HR delivered training of line management and change agents on the BSC and further rolled out the 2017/18 corporate scorecard cascading and performance contracting.
• Pay Scales Alignment: Following the issuance of PEU Circular 3/2016, the Corporate Service Division will ensure that pay scales are reviewed and redesigned to align to the provisions of the circular, alive to the market and in line with best practice. This presents an opportunity to further address and manage various remuneration landscape issues within EEC.
• Performance Bonus Scheme Review: EEC is on a pay for performance remuneration regime and adopted a performance bonus scheme. Having experienced challenges, a review to align the scheme to incorporate performance was undertaken. The new performance bonus scheme is aligned to the requirements of the PEU guidelines on bonus payment.
• Talent Retention – Scarce Skills: The EEC Attraction & Retention Incentive Scheme (SECARIS) policy and procedure were developed and approved. This is in a bid to enhance the organisation’s ability to compete in the relevant labour market in attracting and retaining critical, specialised and scarce skills.
• Review of HR Policies: The review of HR policies with the relevant stakeholders was undertaken to ensure that policies are assessed for effectiveness and relevance, updated, controls reviewed for effectiveness, aligned to legislative, operational changes and requirements.
EMPLOYEE RELATIONS • Cost of Living Negotiations: Successfully concluded the cost of living negotiations at the major index by June
2017.
• Stakeholder Fora: Coordinated management team-building sessions with both organised labour formations as well as senior management.
• Review of Collective Agreements: Every two years, collective agreements are reviewed by management and organised labour (SESMAWU and NESMASA).
EMPLOYEE WELLNESS• EEC Wellness Programme – EEC was awarded by SWABCHA for the following:
− Best innovating wellness programme− Best female wellness champion of the year− Best focal person of the year− Best wellness programme of the year
BUSINESS REVIEW | HUMAN CAPITAL REPORT
ESWATINI ELECTRICITY COMPANY | ANNUAL REPORT 2017/18
43

HUMAN CAPITAL REPORT- continued
BUSINESS REVIEW | HUMAN CAPITAL REPORT
ESWATINI ELECTRICITY COMPANY | ANNUAL REPORT 2017/18
44
• EEC Wellness Aerobathon Team - won three trophies including being the overall winners of the 2017 Aerobathon championships.
• Peer Educators Training: Successfully conducted training of 38 EEC peer educators to empower them to coordinate and deliver more effective wellness programme activities organisation-wide.
• Pre-retirement Training: Successfully conducted the pre-retirement training of 38 employees who fall within the 5 and less years of service before retirement (55 years and above).
• Employee Wellness: Full health screening for EEC employees at all sites. This is a voluntary testing and screening drive where 350 employees (52% of total employees) participated compared to last year’s 240.
• Company sponsored gym membership: A total of 330 employees joined the company sponsored gym membership physical fitness programme in 2017/18 compared to 264 employees in 2016/17. o Edwaleni Power Station gym facilities: Gym equipment was installed at Edwaleni Power Station, which is one
of EEC’s remote sites. This is part of the wellness initiatives to promote physical fitness.
HUMAN CAPITAL DEVELOPMENT:• Company sponsored studies: 14 employees successfully completed their programmes; these included three (3)
postgraduate diplomas, five (5) undergraduate degrees, five (5) national diplomas in electrical engineering, and one professional qualification (ACCA).
• Technical trainees: 15 technical trainees engaged in 2015 successfully completed their 2-year traineeship programme in May 2017 and were immediately absorbed into the operations division to meet the manpower requirements.
• Newly approved further study programmes (2017): EEC will be sponsoring 13 employees to pursue further studies at various institutions; these include five (5) full-time and eight (8) part-time programmes.
PROPERTY & FACILITIES MANAGEMENT:• Call Centre Upgrade: The Call Centre capacity was upgraded from a 16-agent seater capacity to a 34-agent
seater per shift. The upgrade is meant to improve capacity to handle abnormal customer calls.
Employees commemorating the World Women’s Day

BUSINESS REVIEW | HUMAN CAPITAL REPORT
ESWATINI ELECTRICITY COMPANY | ANNUAL REPORT 2017/18
2. LOWLIGHTS:
• Turnover of Critical Skills: The business suffered a loss of key operational personnel, who resigned due to various reasons, including seeking professional/career growth during the year under review.
• Job Evaluation Project: An organisation-wide job evaluation project has been deferred.
• Legal Proceedings: The Human Resources Division was compelled to resort to legal proceedings to recover bonding costs from two former employees.
• IR Issues: Four EEC employees were dismissed after undergoing disciplinary processes; matters referred to the Industrial Court on appeal.
• Disputes: In respect of the non-payment of bonuses for 2015/16, a dispute was lodged to CMAC by organised labour and the matter was referred to the Industrial Court for determination. The matter remains pending at the reporting date.
• Illegal Strike Action: The union participated in an illegal strike action over the 2016/17 bonuses, which lasted for two days.
3. TALENT MANAGEMENT:
a) Promotions: Upward mobility is part of EEC’s value propositions in recognising and incentivising high performance. In 2017/18, a total of 21 employees (17 males and 4 females) compared to 7 the previous year, were promoted and appointed to positions of high responsibility as illustrated in Table 1 below:
b) Technical Trainees/Technical Interns/GITs/EITs/Engineering Trainees (including UWC students): As at March 2018, there were 26 Trainees in the organisation, who formed part of the talent pool subject to successful completion of their training programmes.
BUSINESS REVIEW | HUMAN CAPITAL REPORT
ESWATINI ELECTRICITY COMPANY | ANNUAL REPORT 2017/18
45
Table 1- Recruitment & Promotions
Division 2016/2017 2017/2018
Female Male Total Female Male TotalMD’s Office 0 0 0 2 0 2
Corporate Services 0 0 0 1 1 2
Support Services 0 0 0 0 0 0
Finance 1 2 3 3 1 4
Research & Development 0 0 0 0 0 0
Operations 1 2 3 8 0 8
Customer Service 0 1 1 3 2 5
Total 2 5 7 17 4 21

HUMAN CAPITAL REPORT- continued
BUSINESS REVIEW | HUMAN CAPITAL REPORT
ESWATINI ELECTRICITY COMPANY | ANNUAL REPORT 2017/18
46
Table 2 -
Talent Pipeline 2016/2017 2017/2018
Engineer in Training 1 0
Technical Trainees 15 10
Technical Interns 0 9
Engineering Trainees 7 6
Graduate in Training 2 1
TOTAL 25 26
EEC Trainee Talent Pool
Female
0 5 10 15 20 25
2017
/201
820
16/2
017 Female
Male
Male
Fig. 1
4. HUMAN CAPITAL DEVELOPMENT 2017/18
a) For the period under review, the Lilangeni invested in the training of employees decreased by 4%. This was in line with budget monitoring and suspension of company sponsored training due to financial challenges emanating from the drought impact. Resources were mainly prioritised to address compliance, safety trainings as well as critical operational training requirements.
Period 2016/2017 2017/2018
Headcount 667 674
Total Annual Costs 8,199,391.64 7,883,300.52
*Average Training costs/employee E 12,311.40 E 11,696.29
Increase/Decrease in costs -15% -4%
*Assuming training was accessed by all full-time employees
Table 3

BUSINESS REVIEW | HUMAN CAPITAL REPORT
ESWATINI ELECTRICITY COMPANY | ANNUAL REPORT 2017/18
47
5. HR ADMINISTRATION 2017/2018:
Manning Levels: Full-time Employee (FTE) Headcount/Manpower: The below table shows a breakdown of the staff complement
by division and gender.
b) Human Capital Investment:
As at 31st March 2018, there were 37 permanent employees fully sponsored by the organisation to further their studies part-time and full-time at various institutions. These employees formed part of the talent pool in terms of succession planning and future job requirements. Seven (7) of these employees were sponsored to pursue leadership programmes, 19 to further their technical skills and 11 on other generic programmes, including undergraduate and professional qualifications.
SponsoredProgrammes
2016/2017 2017/2018
Leadership Technical Generic Leadership Technical Generic
M F M F M F M F M F M FFulltimeStudy
0 1 19 4 0 0 - 1 16 2 - -
Part TimeStudy
6 3 0 1 10 14 5 1 - 1 3 8
Total 10 24 24 7 19 11
20181614121086420
Human Capital Investment Male To Female PerProgramme Type
L 16/17
6
4
T 16/17
19
5
Male Female
G 16/17
10
14
L 17/18
5
2
T 17/18
16
3
G 17/18
3
8
Table 5
Division 2016/2017 2017/2018
Female Male Total Female Male TotalMD’s Office 6 6 12 6 7 13Corporate Services 11 12 23 15 10 25Support Services 11 18 29 20 6 26Finance 27 16 43 25 17 42
Operations 378 56 434 389 54 443Customer Service 59 56 115 59 58 117
Research & Strategy 7 4 11 5 3 8
Total 499 168 667 519 155 674
Fig 2
Table 4

HUMAN CAPITAL REPORT- continued
BUSINESS REVIEW | HUMAN CAPITAL REPORT
ESWATINI ELECTRICITY COMPANY | ANNUAL REPORT 2017/18
48
Table 5 above shows a 1.01% increase in the manning levels between 2016/17 and 2017/18. The company’s full-time employees as at 31st March 2018 stood at 674; of these, 77% are male, which is an increase from the previous year’s 75%.
a) Casuals/Fixed Term Period :
b) Age Profile Analysis: 32.07% of EEC employees are within the 30-39 age bracket.
Table 6
Division 2016/2017 2017/2018
Female Male Total Female Male TotalMD’s Office 0 0 0 0 0 0Corporate Services 16 9 25 23 5 28Support Services 1 0 1 1 1 2Finance 0 0 0 3 0 3
Operations 26 4 30 2 2 4Customer Service 12 23 35 20 36 56
Research & Development 0 0 0 0 0 0
Total 55 36 91 49 44 93
Table 7
Age brackets years 2016/2017 2017/2018
Female Male Total Female Male Total(20 – 29) 90 67 157 96 67 163
(30 – 39) 202 55 257 190 56 246(40 – 49) 177 59 236 176 61 237
(50 – 59) 95 13 108 105 16 121
Total 564 194 758 567 200 674
Table 8
Category >1 yr 1-5yrs 6-10yrs 11-15yrs 16+yrsMale 11 153 74 40 239
Female 3 28 47 12 67
Total 14 181 121 52 306

BUSINESS REVIEW | HUMAN CAPITAL REPORT
ESWATINI ELECTRICITY COMPANY | ANNUAL REPORT 2017/18
BUSINESS REVIEW | HUMAN CAPITAL REPORT
ESWATINI ELECTRICITY COMPANY | ANNUAL REPORT 2017/18
49
6. HR MAINTENANCE:
a) Recruitment: The below table indicates the breakdown of recruitment by division and gender.
b) Internal vs. External Recruitment: The below table indicates the breakdown of internal and external recruitment by division and gender.
The recruitment reflected in the Operations Division is as a result of the technical trainees, who successfully completed their programme after two years and were immediately absorbed into various vacant positions as well as providing resources to be deployed to the new Elangeni depot upon completion.
Table 9
Division 2016/2017 2017/2018
Female Male Total Female Male TotalMD’s Office 1 1 2 0 1 1Corporate Services 1 1 2 1 1 2Support Services 0 0 0 3 0 3Finance 2 2 4 4 1 5
Research & Development 0 0 0 2 0 2Operations 20 6 26 22 2 24
Customer Service 13 20 33 4 4 8
Total 37 30 67 36 9 45
Length of Service
Total
16+yrs
11-
15yrs
6-10yrs
1-5yrs
>1yr
Female
100 200 300 400 500 600
Male
Fig 3
The graph depicts a gradual purposeful gender diversification approach in the company’s recruitment.

HUMAN CAPITAL REPORT- continued
BUSINESS REVIEW | HUMAN CAPITAL REPORT
ESWATINI ELECTRICITY COMPANY | ANNUAL REPORT 2017/18
50
7. TURNOVER:
Turnover for the 2017/18 period doubled compared to the previous year and stood at a rate of 3.56%.
Table 10
Division 2016/2017 2017/2018
Male Female Total
Male Female Total Int. Ex. Int. Ex. Int. Ex. Int. Ex.
MD’s Office 1 0 1 0 2 0 0 0 1 1Corporate Services 1 0 1 0 2 1 0 1 0 2Support Services 0 0 0 0 0 0 3 0 0 0Finance 0 2 1 1 4 4 0 1 0 5
Operations 0 0 0 0 0 2 0 0 0 2Customer Service 12 23 12 23 56 12 23 12 23 56
Research & Development 0 0 0 0 0 0 0 0 0 0
Total 55 36 55 36 93 55 36 55 36 93
800
700
600
500
400
300
200
100
0
Annual Turnover
587
88
18.4
Manning Levels/yr
VE#
% Turnover
2009/2010
2010/2011
2011/2012
2012/2013
Period/Year
2013/2014
2014/2015
2015/2016
2016/2017
2017/2018
571
25
5.59
18.4 5.95 2.9 3.44 5.02 2.8 1.9 1.73 3.56 0
587
0
2.9
640
0
3.44
637
0
5.02
603
0
2.8
637
0
1.9
694
0
1.73
674
0
3.56
Man
ning
Lev
els
Table 8
Financial year Manning Levels /yr
Turnover (Resignation/Retirement /Dismissal/
Deceased)
VE # % Turnover
2013/2014 637 32 0 5.02
2014/2015 603 17 0 2.8
2015/2016 673 8 0 1.9
2016/2017 694 12 0 1.73
2017/2018 674 24 0 3.56
Table 11
Fig. 4
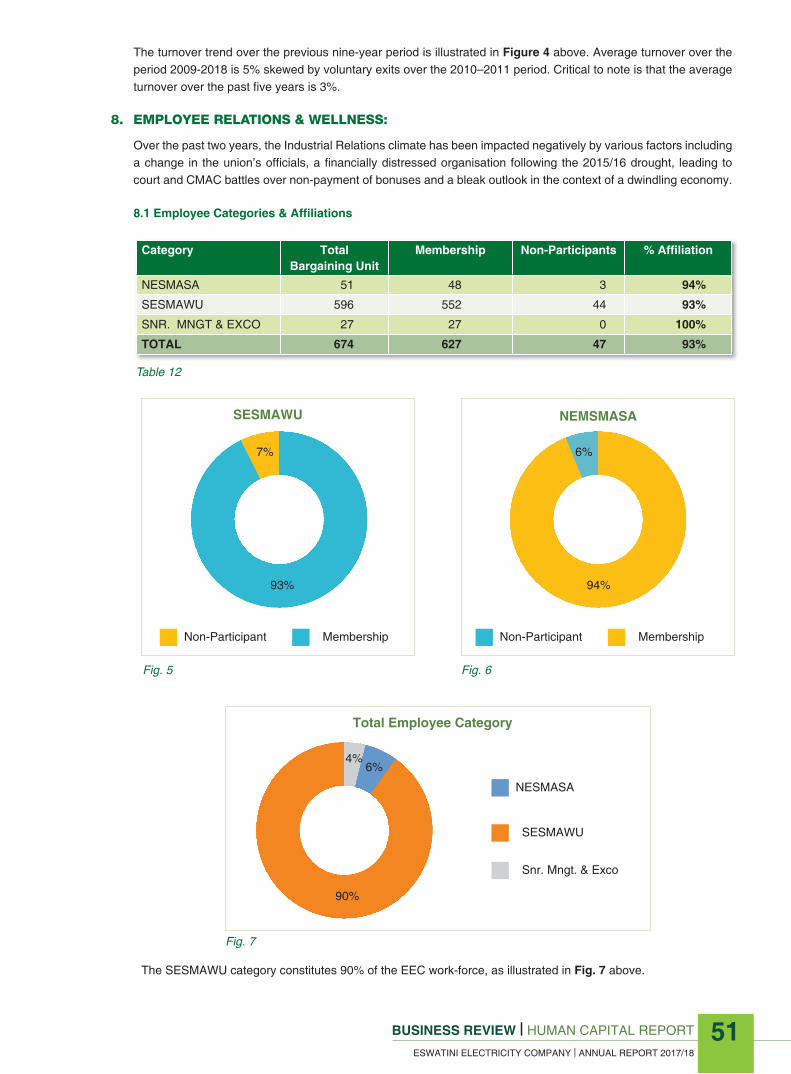
BUSINESS REVIEW | HUMAN CAPITAL REPORT
ESWATINI ELECTRICITY COMPANY | ANNUAL REPORT 2017/18
BUSINESS REVIEW | HUMAN CAPITAL REPORT
ESWATINI ELECTRICITY COMPANY | ANNUAL REPORT 2017/18
51
The turnover trend over the previous nine-year period is illustrated in Figure 4 above. Average turnover over the period 2009-2018 is 5% skewed by voluntary exits over the 2010–2011 period. Critical to note is that the average turnover over the past five years is 3%.
8. EMPLOYEE RELATIONS & WELLNESS:
Over the past two years, the Industrial Relations climate has been impacted negatively by various factors including a change in the union’s officials, a financially distressed organisation following the 2015/16 drought, leading to court and CMAC battles over non-payment of bonuses and a bleak outlook in the context of a dwindling economy.
8.1 Employee Categories & Affiliations
The SESMAWU category constitutes 90% of the EEC work-force, as illustrated in Fig. 7 above.
Table 8
Category Total Bargaining Unit
Membership Non-Participants % Affiliation
NESMASA 51 48 3 94%
SESMAWU 596 552 44 93%
SNR. MNGT & EXCO 27 27 0 100%
TOTAL 674 627 47 93%
Table 12
Fig. 5
SESMAWU
7%
Non-Participant Membership
93%
Fig. 6
NEMSMASA
6%
Non-Participant Membership
94%
Fig. 7
Total Employee Category
NESMASA
SESMAWU
90%
4%6%
Snr. Mngt. & Exco

SUSTAINABILITYREPORT
- KEEPING EVERY EMPLOYEE SAFE, FOCUSED AND MOTIVATED
NOSA Grading Audit
Employees Fatalities
Energyy saved during Earth Hour 2018
3 Star
22.9MWh
0
OVERALL PERFORMANCEOUR APPROACH: 6 ACCIDENT PREVENTION CARDINAL RULESSAFETY FOR LEADERSHIP TRAININGCONTRACTOR MANAGEMENTSUSTAINABILITY REPORT
5354
55
5555
NOSA INTEGRATED FIVE STAR SYSTEMINTEGRATED MANAGEMENT SYSTEMSENVIRONMENT MANAGEMENT EARTH HOUR 2018AWARENESS RAISINGSECURITY MANAGEMENT
55
56
56575758
BUSINESS REVIEW | SUSTAINABILITY REPORT
ESWATINI ELECTRICITY COMPANY | ANNUAL REPORT 2017/18
52
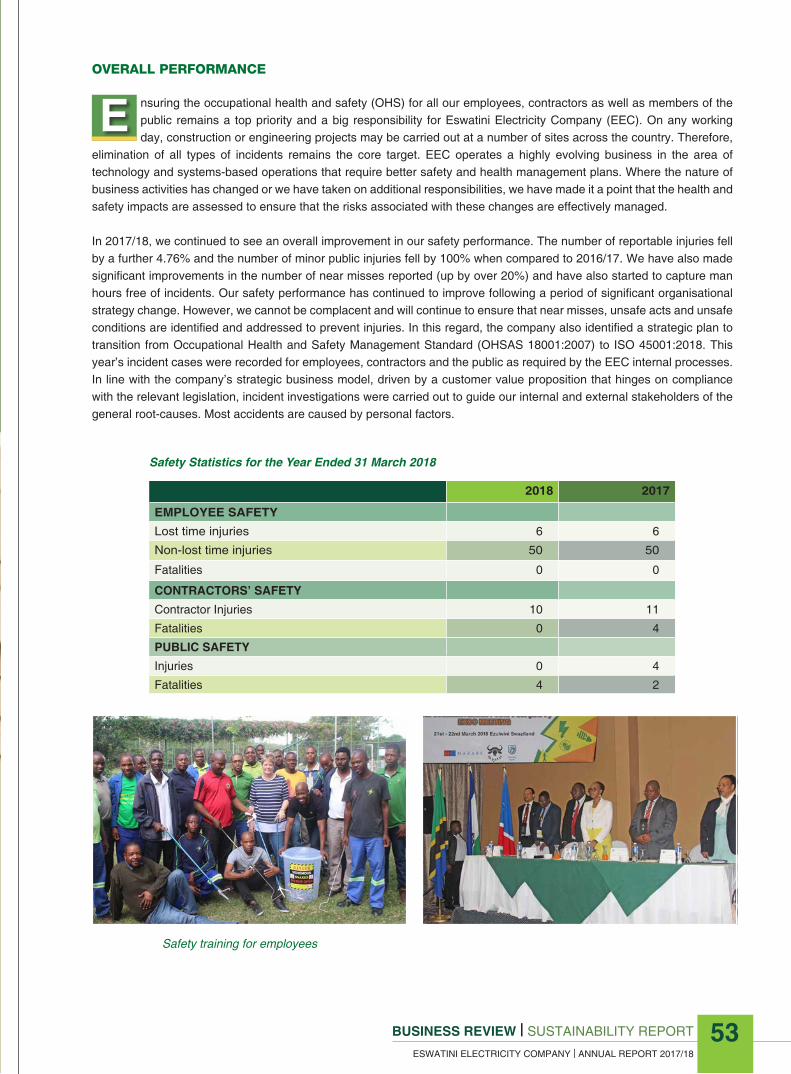
BUSINESS REVIEW | SUSTAINABILITY REPORT
ESWATINI ELECTRICITY COMPANY | ANNUAL REPORT 2017/18
53
OVERALL PERFORMANCE
nsuring the occupational health and safety (OHS) for all our employees, contractors as well as members of the public remains a top priority and a big responsibility for Eswatini Electricity Company (EEC). On any working day, construction or engineering projects may be carried out at a number of sites across the country. Therefore,
elimination of all types of incidents remains the core target. EEC operates a highly evolving business in the area of technology and systems-based operations that require better safety and health management plans. Where the nature of business activities has changed or we have taken on additional responsibilities, we have made it a point that the health and safety impacts are assessed to ensure that the risks associated with these changes are effectively managed.
In 2017/18, we continued to see an overall improvement in our safety performance. The number of reportable injuries fell by a further 4.76% and the number of minor public injuries fell by 100% when compared to 2016/17. We have also made significant improvements in the number of near misses reported (up by over 20%) and have also started to capture man hours free of incidents. Our safety performance has continued to improve following a period of significant organisational strategy change. However, we cannot be complacent and will continue to ensure that near misses, unsafe acts and unsafe conditions are identified and addressed to prevent injuries. In this regard, the company also identified a strategic plan to transition from Occupational Health and Safety Management Standard (OHSAS 18001:2007) to ISO 45001:2018. This year’s incident cases were recorded for employees, contractors and the public as required by the EEC internal processes. In line with the company’s strategic business model, driven by a customer value proposition that hinges on compliance with the relevant legislation, incident investigations were carried out to guide our internal and external stakeholders of the general root-causes. Most accidents are caused by personal factors.
E
2018 2017
EMPLOYEE SAFETYLost time injuries 6 6
Non-lost time injuries 50 50
Fatalities 0 0
CONTRACTORS’ SAFETYContractor Injuries 10 11
Fatalities 0 4
PUBLIC SAFETYInjuries 0 4
Fatalities 4 2
Safety Statistics for the Year Ended 31 March 2018
Safety training for employees

SUSTAINABILITY REPORT- continued
BUSINESS REVIEW | SUSTAINABILITY REPORT
ESWATINI ELECTRICITY COMPANY | ANNUAL REPORT 2017/18
54
OUR APPROACH: 6 ACCIDENT PREVENTION CARDINAL RULES
In previous annual reports, we highlighted that the company was experiencing too many avoidable injuries. We recognise the importance of human factors as contributors to incidents and will continue to focus on improving our business culture and staff behaviour as a key objective. In 2017/18, the company came up with the top six (6) incident prevention cardinal rules.
Typically, the avoidable incidents that we experience include slips, trips and falls on the same level, or handling, lifting and carrying. These are all incidents that should not happen if safe working practices and company procedures are followed and reasonable precautions taken, particularly in adverse weather conditions.
The company frowns at work-place injuries as they impact on employee health and well-being. These also affect the operating efficiency of the business. Operational efficiency is one of the main objectives that the company seeks to accomplish as part of its strategic plan.
The Disabling Injury Frequency Rate (DIFR) for 2017-18 slightly increased from 1.63 to 1.86.
Safety Statistics for the last 5 years
21,81,61,41,2
10,80,60,40,2
02013/2014 2014/2015
1,3
1,86
2015/2016 2016/2017 2017/2018
DIFR INDEX
1,58 1,63

BUSINESS REVIEW | SUSTAINABILITY REPORT
ESWATINI ELECTRICITY COMPANY | ANNUAL REPORT 2017/18
55
SAFETY FOR LEADERSHIP TRAININGWe are also keen to encourage behavioural based interventions by managers and the employees, hence we have set up a number of training sessions and an awareness section. To drive this, we need visible leadership and a just culture, which includes senior managers involvement in accident investigation, increased communication on risk assessment and targeted training for managers’ and employees to heighten personal safety awareness. This year, the company had 90% safety training also duplicated for managers in order to instil the same culture as required from all the employees.
CONTRACTOR MANAGEMENTEEC continues to place great emphasis on monitoring contract partners’ performance and the oversight of procedures that promote and share good practices across the outsourced business activities. This is achieved without detracting from the legal responsibility of each outsourced service partner to have its own governance arrangements and to manage its own occupational health and safety performance. We also encourage continuous improvement in the performance of all partners via a business support coordinated by the Outsourced Services unit wherein a team comprising various specialists conducts quarterly performance evaluations. We share information, issue safety-alerts and generally oversee the management of OHS to a consistently high standard across all activities undertaken by or on behalf of EEC.
SUSTAINABILITY REPORT• Reinforcing the Safety Culture EEC has a new strategy objective, namely; “To increase safety”. The company recognises that safety is more than a set of activities focused on accident prevention. Rather, it is a way of thinking about how you work, and should be at the heart of every successful company. Weaving safety into the company’s mission, policies and procedures is a great way to demonstrate its importance and ensure its effectiveness. Here we aim to maintain exemplary standards of health and safety performance to ensure employees’ health and safety at work as well as that of others who may work at or visit our premises. We define exemplary performance as having in place effective management arrangements that ensure the wellbeing of our staff and minimise the losses (financial and reputational) to our business from ill-health and injury. This requires that we seek out, adopt and update best practices relevant and proportionate to the risks we and our staff face, as well as follow our own guidance for relevant activities.
NOSA INTEGRATED FIVE STAR SYSTEMDuring the year under review, EEC underwent through the NOSA Integrated Five Star System Grading Protocol. This is in line with management’s commitment to ensuring good safety and health for all, including environmental protection while executing the company’s daily duties. The audit addressed the management of operational risks relating to Occupational Safety, Health and the Environment. Contractors, temporary labourers, entire premises, off-site and on-site installations owned by external parties were included. The audit evaluated the effort and experience for the agreed period: 01 March 2017 to 28 February 2018. The systems were measured against risk, legal requirements, corporate standards, best operating practices and the NOSA Integrated Five Star System.
The auditors determined whether the company had identified and assessed all the relevant HSE risks to its operations. They further reviewd whether the systems were in place to address the company’s HSE risks. They determined the level of conformance to the management system with regards to relevant legislation, risk exposure, company standards and procedures and the NOSA Integrated Five Star System. This helped in determining the effectiveness of the implemented HSE system in meeting the specified objectives. The audit further determined the status of the auditee’s HSE programme by providing a recommended outcome.
NOSA Auditing session in one of the EEC premises

SUSTAINABILITY REPORT- continued
BUSINESS REVIEW | SUSTAINABILITY REPORT
ESWATINI ELECTRICITY COMPANY | ANNUAL REPORT 2017/18
56
The final outcome of the audit is that EEC was awarded 3-stars, equivalent to an effort of 72.74% and a DFIR of 1.86 under the CMB253N NOSA standard with integrated OHSAS 18001:2007 requirements.
INTEGRATED MANAGEMENT SYSTEMSEEC continues to implement internationally adopted management system standards: ISO 9001, ISO 14001 and OHSAS 18001, towards ultimate business success. The standards respectively ensure the management of EEC’s quality, environmental and occupational health and safety issues. Towards continual improvement, two of the standards (ISO 9001 and ISO 14 001) were revised in 2015. This has seen the company undertaking a transition process towards fulfilling the requirements of the revised standards. The transition began with a gap analysis and awareness training across EEC’s hierarchical structures. This was subsequently followed by the training of internal auditors. The internal auditors were then tasked with testing the company’s performance against the revised standard requirements and the maintained OHSAS 18001, in preparation for EEC’s external evaluation and re-certification in July 2018.
The occupational health and safety management system standard, OHSAS 18001, was all together revised to a new standard ISO 45001:2018. However, the company has taken a decision to transition to the new version in 2019. It has begun implementing a few measures towards this journey, such as revising its occupational health and safety policy in alignment with ISO 45001:2018. The company looks forward to not only continuously maintaining certification to these international standards, but also ensuring that the management systems contributed significantly to the EEC vision and achievement of strategies for business success.
In addition, the company also implemented the regional occupational health and safety management system, NOSA. Through the NOSA’s 5-star grading system, EEC aims to reduce the number of critical incidents emanating from its activities. With the management system practices engraved in EEC’s culture, the company surely envisions an improved safety, health, environmental and quality performances in the foreseeable future.
ENVIRONMENT MANAGEMENT EEC remains committed to making a positive contribution to society through continuous supply of clean energy to its customers. The company strives to minimise environmental effects resulting from its business operations, through a well-developed environmental management system that is integrated in its business system. EEC currently implements and ensures that it conforms to an internationally recognised standard, ISO 140001:2015. This standard has enabled the company to be proactive in identifying significant risks and minimising negative impacts on the environment. As part of its practices, EEC conducts site environmental assessments and monitors the consumption of natural resources such as water and electricity, among many other activities. Through such best practices, EEC manages its environmental commitments such as compliance obligations, waste minimisation, pollution and resource management. This has ensured that, to date, certification to ISO 14001 has never been revoked.
• Environmental AssessmentsThe environment unit continuously undertakes assessments for new capital projects. For existing projects, the unit inspects and conducts site audit to determine compliance with the national environmental legislations. Monitoring is ongoing on the new Elangeni depot and staff house project as well as in the Ncandweni 132kV line. Issues of concern are raised and always addressed by the project teams. To date, the company has not received any fines from the Eswatini Environment Authority.
• Environment Excellence Award In 2016, EEC received the Green Parastatal Award for best environmental practices in Eswatini. The year 2018 has
again seen the company being honoured with this prestigious award, proving once again that EEC fully commits to and considers environmental protection in its day to day activities.
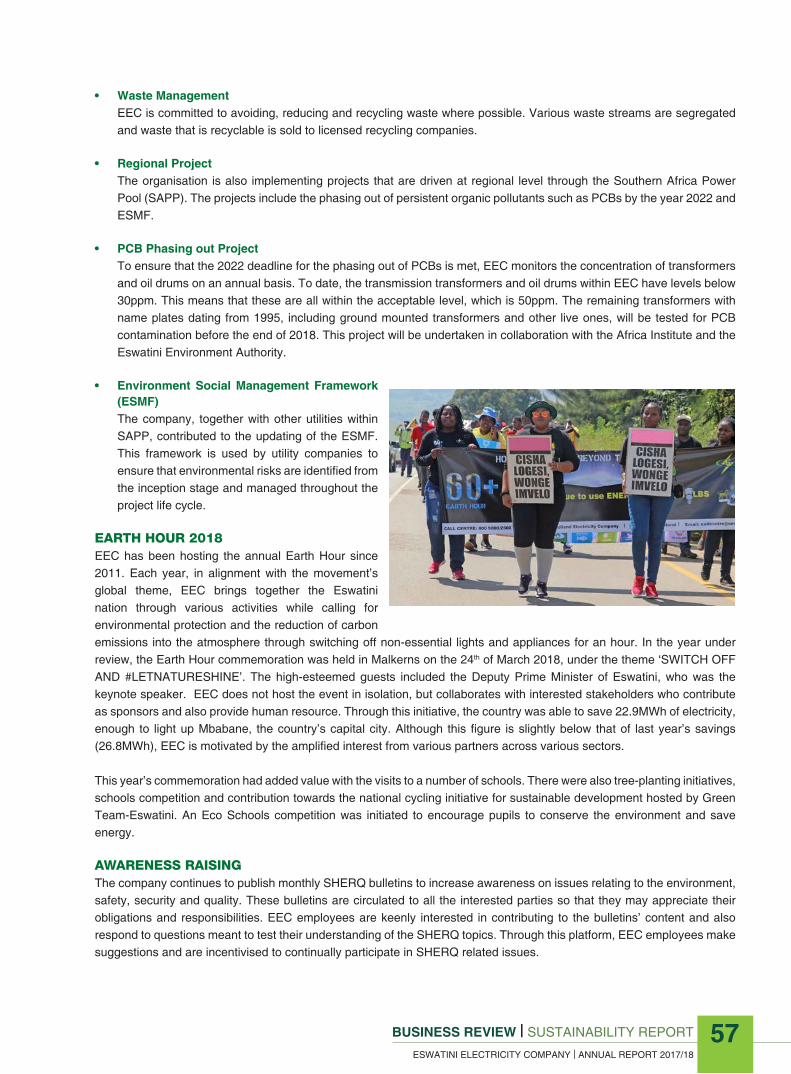
BUSINESS REVIEW | SUSTAINABILITY REPORT
ESWATINI ELECTRICITY COMPANY | ANNUAL REPORT 2017/18
57
• Waste Management EEC is committed to avoiding, reducing and recycling waste where possible. Various waste streams are segregated
and waste that is recyclable is sold to licensed recycling companies.
• Regional Project The organisation is also implementing projects that are driven at regional level through the Southern Africa Power
Pool (SAPP). The projects include the phasing out of persistent organic pollutants such as PCBs by the year 2022 and ESMF.
• PCB Phasing out Project To ensure that the 2022 deadline for the phasing out of PCBs is met, EEC monitors the concentration of transformers
and oil drums on an annual basis. To date, the transmission transformers and oil drums within EEC have levels below 30ppm. This means that these are all within the acceptable level, which is 50ppm. The remaining transformers with name plates dating from 1995, including ground mounted transformers and other live ones, will be tested for PCB contamination before the end of 2018. This project will be undertaken in collaboration with the Africa Institute and the Eswatini Environment Authority.
• Environment Social Management Framework (ESMF)
The company, together with other utilities within SAPP, contributed to the updating of the ESMF. This framework is used by utility companies to ensure that environmental risks are identified from the inception stage and managed throughout the project life cycle.
EARTH HOUR 2018EEC has been hosting the annual Earth Hour since 2011. Each year, in alignment with the movement’s global theme, EEC brings together the Eswatini nation through various activities while calling for environmental protection and the reduction of carbon emissions into the atmosphere through switching off non-essential lights and appliances for an hour. In the year under review, the Earth Hour commemoration was held in Malkerns on the 24th of March 2018, under the theme ‘SWITCH OFF AND #LETNATURESHINE’. The high-esteemed guests included the Deputy Prime Minister of Eswatini, who was the keynote speaker. EEC does not host the event in isolation, but collaborates with interested stakeholders who contribute as sponsors and also provide human resource. Through this initiative, the country was able to save 22.9MWh of electricity, enough to light up Mbabane, the country’s capital city. Although this figure is slightly below that of last year’s savings (26.8MWh), EEC is motivated by the amplified interest from various partners across various sectors.
This year’s commemoration had added value with the visits to a number of schools. There were also tree-planting initiatives, schools competition and contribution towards the national cycling initiative for sustainable development hosted by Green Team-Eswatini. An Eco Schools competition was initiated to encourage pupils to conserve the environment and save energy.
AWARENESS RAISINGThe company continues to publish monthly SHERQ bulletins to increase awareness on issues relating to the environment, safety, security and quality. These bulletins are circulated to all the interested parties so that they may appreciate their obligations and responsibilities. EEC employees are keenly interested in contributing to the bulletins’ content and also respond to questions meant to test their understanding of the SHERQ topics. Through this platform, EEC employees make suggestions and are incentivised to continually participate in SHERQ related issues.

SUSTAINABILITY REPORT- continued
BUSINESS REVIEW | SUSTAINABILITY REPORT
ESWATINI ELECTRICITY COMPANY | ANNUAL REPORT 2017/18
58
SECURITY MANAGEMENT Crimes that affected EEC in the 2017/18 financial year included copper theft (underground and overhead equipment), power theft, house breaking and vandalism of network equipment. Vandalism and theft of padlocks on feeders (gang link switches) is the latest crime that has gained momentum. Actions taken to combat crime include, but are not limited to:• Increasing the number of security guards manning key EEC sites, including buildings and substations. • Copper conductor is gradually being replaced with copper-cladded conductor, especially for earthing purposes. • Revival of community policing has been emphasised.• Electronic security systems continue to be installed at various sites of the company to deny intruders easy entry.
These systems are also used as post incident aids during investigations.Patrols and raids have been conducted at various sites with help from the national police to identify and arrest the offenders. We remain grateful for the continued cooperation from law enforcement agencies. As a result, we have been able to swiftly apprehend offenders and have them successfully prosecuted.
EEC hosted the SAPP crime prevention working group on the 1st and 2nd of February 2018, where crimes affecting the different utilities in the region were discussed. The Royal Eswatini Police Service was also invited for cross border cooperation discussions.

BACKGROUNDBRIEF DETAILS OF SUPPORTED PROJECTS
6262
CORPORATE SOCIAL INVESTMENT REPORT
- WE REMAIN ABSOLUTELY COMMITTED TO EMPOWER COMMUNITIES THROUGHOUT THE KINGDOM
Education
Social & Economic Development
Safety and Security
Health
Total Expenditure
on CSI Projects
E820.2K
E357.8K
E34,3K
E32,8K
E1,245,265
BUSINESS REVIEW | SUSTAINABILITY REPORT
ESWATINI ELECTRICITY COMPANY | ANNUAL REPORT 2017/18
BUSINESS REVIEW | CORPORATE SOCIAL INVESTMENT
ESWATINI ELECTRICITY COMPANY | ANNUAL REPORT 2017/18
59

CORPORATE SOCIAL INVESTMENT REPORT
BUSINESS REVIEW | CORPORATE SOCIAL INVESTMENT
ESWATINI ELECTRICITY COMPANY | ANNUAL REPORT 2017/18
60
BACKGROUND
e define Corporate Social Investment (CSI) as any socio-economic development activity undertaken by the company not for purposes of generating business income. It is the manner in which our company generates stakeholder value while creating a positive impact on the communities and minimising adverse effects on the
environment.
CSI is an integral part of EEC’s business as outlined in our core values and in consistence with the Eswatini Electricity Act of 2007. As upheld by the corporate governance and triple bottom line guiding principles, EEC desires to embrace the broader community as key stakeholders in its business. We realise that the organisation may only be sustainable in the long term if it remains relevant to the needs and aspirations of the community from which it derives its business.
Key priority areasEEC is committed to creating value for all related stakeholders, where possible, by delivering programmes in the following priority areas: 1. Education2. Health 3. Safety & Security4. Environment and 5. Social & economic development CSI Disbursements Despite the economic, social and environmental challenges faced in the reporting year, our Company managed to fulfil its obligations of being a responsible corporate citizen. A number of communities, groups and schools benefitted from our CSI programme. Disbursements for the reporting period were as follows;
W
Summary of Spending:
Priority Area: Amount (E’000): Actual Spent
Education 820,299.35 65%
Social & Economic Development 357,838.20 29%
Safety and Security 34,328.00 3%
Health 32,800.00 3%
Environment 0 0%
Total 1,245,265.55
BRIEF DETAILS OF SOME OF THE SUPPORTED PROJECTS:
Malkerns Valley Rotary Club – FundraisingEEC has supported Malkerns Valley Rotary Club in raising funds for their flagship project, the Hawane Camp, which targets adolescents living with HIV. These youngsters receive counselling and revel in group activities that build their sense of self-worth. They are taught coping mechanisms and also engage in fun activities that build their morale. The main source of funding to maintain the Hawane Camp is the Taste of Swaziland - an annual food festival in which local food enterprises showcase their skills and offer wholesome family entertainment to the public. EEC was one of the main sponsors of this event.
Over 40 adolescents have benefited from the Hawane Camp, having been referred by medical or social professionals who diagnose their state of body and mind as a danger to their normal functioning in society. The camp results have far exceeded expectations. Parents, teachers and caregivers report dramatic changes in attitude and behaviour. The family atmosphere brightens, school results improve and some even start to influence peers in matters of status acceptance.

BUSINESS REVIEW | CORPORATE SOCIAL INVESTMENT
ESWATINI ELECTRICITY COMPANY | ANNUAL REPORT 2017/18
61
Mnyokane Anglican Primary School – Re-painting During the reporting financial year, we repainted Mnyokane Anglican Primary School next to Maguga Dam. Our employees sacrificed their time to do the painting work.
Emcozini High School – Construction of Ablution Facilities State of the art ablution facilities were constructed at Emcozini High School in the Manzini region. The project will benefit both the school with over 500 pupils and the entire community. The latter often use the school hall for development meetings and social gatherings such as weddings.
Sugarcane Growers’ Competition We supported the Smallholder Sugarcane Growers’ competi-tion hosted by Eswatini Sugar Association (ESA).
The competition was held at Mavela Farmers Association in Dvokolwako. EEC donated a 5-ton tipping trailer as a prize for the overall winner.
The original state of Mnyokane Primary School
Emcozini High School ablution block
The presentation of the trailer
EEC participants during the walk
King’s Golf Cup EEC supports the King’s Golf Cup charity tournament – an annual event that draws golfers from all spheres of life.
Swaziland Breast and Cervical Cancer Network – Brave the Breast Fundraising Walk About 64 EEC employees partici-pated in the Brave the Breast Challenge, a fundraising initiative by the Swaziland Breast and Cervical Cancer Network (SBCCN).

CORPORATE SOCIAL INVESTMENT REPORT - continued
BUSINESS REVIEW | CORPORATE SOCIAL INVESTMENT
ESWATINI ELECTRICITY COMPANY | ANNUAL REPORT 2017/18
62
Mahamba Gorge Hiking Expedition EEC joined a long list of other organisations in support of the Mahamba Gorge Hiking Expedition in Nhlangano. Over 60 EEC employees participated in the event meant to benefit underprivileged communities.
Emthonjeni High School This is one of the biggest CSI projects undertaken by our company in collaboration with Motraco. We constructed a computer laboratory at Emthonjeni High School situated next to Dwaleni Power Station. The project involved building the laboratory structure and furnishing it with desktop computers and all related equipment such as air-conditioning.
Timphisini Primary School – Wiring Material This was in response to a request from Timphisini Primary School for wiring materials for 12 classrooms. It was another joint venture between EEC and Motraco.
Donation of IT equipment to Dvokolwako High School

EECSelf Service
Accessible Through All Local Mobile Networks
Faults Report and make follow-ups on faults.
Tokens Retrieve recently purchased tokens.
Applications Track progress on your application submitted to EEC.
Quotations Get the validity and payment balances of your quotation.
Enquiries Get the status of your general queries.
Billing Check and e-mail your post-paid bill.
/Eswatini Electricity Company
Through this platform our customers can access the following services:
*8888#
DIAL
[email protected](STANDARD RATES APPLY)
TOLL FREE: 2508 3333
CONVENIENCE AT YOUR FINGERTIPS
1
2
3
4
5
6

BUSINESS REVIEW | CORPORATE SOCIAL INVESTMENT
ESWATINI ELECTRICITY COMPANY | ANNUAL REPORT 2017/18
64
ANNUAL

FINANCIAL STATEMENTS | CONTENTS
ESWATINI ELECTRICITY COMPANY | ANNUAL REPORT 2017/18
BUSINESS REVIEW | CORPORATE SOCIAL INVESTMENT
ESWATINI ELECTRICITY COMPANY | ANNUAL REPORT 2017/18
FINANCIALSTATEMENTS
for the year ended 31 March 2018
CONTENTS PageDirectors’ Responsibility Statement 66
Independent Auditor’s Report 67
Directors’ Report 70
Statement of Comprehensive Income 74
Statement of Financial Position 75
Statement of Changes in Equity 76
Statement of Cash Flows 77
Notes to the Financial Statements 78-154
65

Directors’ Responsibility Statementfor the year ended 31 March 2018
FINANCIAL STATEMENTS | DIRECTORS’ RESPONSIBILITY STATEMENT
ESWATINI ELECTRICITY COMPANY | ANNUAL REPORT 2017/18
66
The directors of the Company are responsible for the preparation and fair presentation of the financial statements of
Eswatini Electricity Company Limited comprising the statement of financial position as at 31 March 2018, the statements
of comprehensive income, changes in equity and cash flows for the year then ended, the notes to the financial statements,
which include a summary of significant accounting policies and other explanatory notes, and the directors’ report, in
accordance with International Financial Reporting Standards and in a manner required by the Swaziland Companies Act.
The directors are also responsible for such internal control as the directors determine is necessary to enable the preparation
of financial statements that are free from material misstatement, whether due to fraud or error, and for maintaining adequate
accounting records and an effective system of risk management as well as the preparation of the supplementary schedules
included in these financial statements.
The directors have made an assessment of the company’s ability to continue as a going concern and have no reason to
believe the company will not be a going concern in the year ahead.
The auditor is responsible for reporting on whether the financial statements are presented fairly in accordance with the
International Financial Reporting Standards, and in a manner required by the Swaziland Companies Act.
Approval of the financial statements
The financial statements of Eswatini Electricity Company Limited as identified in the first paragraph were approved by the
board of directors on 10 August 2018 and are signed on its behalf by:
.............................................................. ................................................................Director Director

Independent Auditor’s Report To the Shareholder and Board of Directors of Eswatini Electricity Company Limited
FINANCIAL STATEMENTS | INDEPENDENT AUDITOR’S REPORT
ESWATINI ELECTRICITY COMPANY | ANNUAL REPORT 2017/18
67
Opinion
We have audited the financial statements of Eswatini Electricity Company Limited, (the company), set out on pages 70
to 154, which comprise the statement of financial position as at 31 March 2018, and the statements of comprehensive
income, changes in equity and cash flows for the year then ended, and notes to the financial statements, including a
summary of significant accounting policies and the directors’ report.
In our opinion, the financial statements present fairly, in all material respects, the financial position of the company as at
31 March 2018, and its financial performance and cash flows for the year then ended in accordance with International
Financial Reporting Standards and the requirements of the Swaziland Companies Act.
Basis for Opinion
We conducted our audit in accordance with International Standards on Auditing (ISAs). Our responsibilities under those
standards are further described in the Auditors’ Responsibilities for the Audit of the Financial Statements section of our
report. We are independent of the Company in accordance with the Swaziland Institute of Accountants Code of Professional
Conduct (SIA Code) and other independence requirements applicable to performing audits of financial statements in the
Kingdom of Eswatini. We have fulfilled our other ethical responsibilities in accordance with the SIA Code and in accordance
with other ethical requirements applicable to performing audits in Kingdom of Eswatini. The SIA Code is consistent with
the International Ethics Standards Board for Accountants Code of Ethics for Professional Accountants (Parts A and B).
We believe that the audit evidence we have obtained is sufficient and appropriate to provide a basis for our opinion.
Other matter
We draw your attention to the “Management Commentary on internal control deficiencies” paragraph on the Directors’
Report. There were several significant internal control deficiencies noted in the procurement process which management
is currently investigating and has already started addressing by implementing corrective action.
Other Information
The directors are responsible for the other information. The other information comprises the Directors’ responsibility
statement and the supplementary schedule attached to the financial statements which we obtained prior to the date of this
report and the Annual Report, which is expected to be made available to us after that date. Other information does not
include the financial statements and our auditors’ report thereon.
Our opinion on the financial statements does not cover the other information and we do not express an audit opinion or any
form of assurance conclusion thereon.
In connection with our audit of the financial statements, our responsibility is to read the other information and, in doing so,
consider whether the other information is materially inconsistent with the financial statements or our knowledge obtained
in the audit, or otherwise appears to be materially misstated. If, based on the work we have performed on the other
information obtained prior to the date of this auditors’ report, we conclude that there is a material misstatement of this other
information, we are required to report that fact. We have nothing to report in this regard.

Independent Auditor’s Report - continuedfor the year ended 31 March 2018
Responsibilities of the Directors for the Financial Statements
The directors are responsible for the preparation and fair presentation of the financial statements in accordance with
International Financial Reporting Standards and the requirements of the Swaziland Companies Act, and for such internal
control as the directors determine is necessary to enable the preparation of financial statements that are free from material
misstatement, whether due to fraud or error.
In preparing the financial statements, the directors are responsible for assessing the company’s ability to continue as a going
concern, disclosing, as applicable, matters related to going concern and using the going concern basis of accounting unless
the directors either intend to liquidate the company or to cease operations, or have no realistic alternative but to do so.
Auditor’s Responsibilities for the Audit of the Financial Statements
Our objectives are to obtain reasonable assurance about whether the financial statements as a whole are free from
material misstatement, whether due to fraud or error, and to issue an auditors’ report that includes our opinion. Reasonable
assurance is a high level of assurance, but is not a guarantee that an audit conducted in accordance with ISAs will always
detect a material misstatement when it exists. Misstatements can arise from fraud or error and are considered material if,
individually or in the aggregate, they could reasonably be expected to influence the economic decisions of users taken on
the basis of these financial statements.
As part of an audit in accordance with ISAs, we exercise professional judgement and maintain professional scepticism
throughout the audit. We also:
• Identify and assess the risks of material misstatement of the financial statements, whether due to fraud or error, design
and perform audit procedures responsive to those risks, and obtain audit evidence that is sufficient and appropriate
to provide a basis for our opinion. The risk of not detecting a material misstatement resulting from fraud is higher than
for one resulting from error, as fraud may involve collusion, forgery, intentional omissions, misrepresentations, or the
override of internal control.
• Obtain an understanding of internal control relevant to the audit in order to design audit procedures that are appropriate
in the circumstances, but not for the purpose of expressing an opinion on the effectiveness of the company’s internal
control.
• Evaluate the appropriateness of accounting policies used and the reasonableness of accounting estimates and related
disclosures made by the directors.
• Conclude on the appropriateness of the directors’ use of the going concern basis of accounting and based on the
audit evidence obtained, whether a material uncertainty exists related to events or conditions that may cast significant
doubt on the company’s ability to continue as a going concern. If we conclude that a material uncertainty exists, we
are required to draw attention in our auditors’ report to the related disclosures in the financial statements or, if such
disclosures are inadequate, to modify our opinion. Our conclusions are based on the audit evidence obtained up to the
date of our auditors’ report. However, future events or conditions may cause the company to cease to continue as a
going concern.
• Evaluate the overall presentation, structure and content of the financial statements, including the disclosures, and
whether the financial statements represent the underlying transactions and events in a manner that achieves fair
presentation.
FINANCIAL STATEMENTS | INDEPENDENT AUDITOR’S REPORT
ESWATINI ELECTRICITY COMPANY | ANNUAL REPORT 2017/18
68

Independent Auditor’s Report - continuedfor the year ended 31 March 2018
• Obtain sufficient appropriate audit evidence regarding the financial information of the entities or business activities
within the company to express an opinion on the financial statements. We are responsible for the direction, supervision
and performance of the audit. We remain solely responsible for our audit opinion.
We communicate with the directors regarding, among other matters, the planned scope and timing of the audit and
significant audit findings, including any significant deficiencies in internal control that we identify during our audit.
We also provide the directors with a statement that we have complied with relevant ethical requirements regarding
independence, and to communicate with them all relationships and other matters that may reasonably be thought to bear
on our independence, and where applicable, related safeguards.
KPMG Chartered Accountants (Kingdom of Eswatini)
Per Vusi Nkabindze
Chartered Accountant (SD)
Partner
16 August 2018
Umkhiwa House
Lot 195, Karl Grant Street
Mbabane
Eswatini
FINANCIAL STATEMENTS | INDEPENDENT AUDITOR’S REPORT
ESWATINI ELECTRICITY COMPANY | ANNUAL REPORT 2017/18
69
Directors’ Report for the year ended 31 March 2018
1. Nature of business
The Eswatini Electricity Company Limited is engaged in the business of generation, transmission and distribution of
electricity in the country. Customers include agricultural, industrial, commercial and residential households.
The Eswatini Electricity Company Limited is governed by the four enabling pieces of legislation namely; The
Electricity Company Act, 2007, The Energy Regulatory Act, 2007, The Electricity Act, 2007 as well as the Public
Enterprises Unit (Control and Monitoring) Act, 1989.
2. Business issues
The company has performed well during the financial year ended 31 March 2018, the good performance is
derived from, amongst other things, the tariff increase of 14.65% that was granted in terms of the Multi- year price
determination which has caused an increase in revenue. The final 14.65% increase has been effected in April 2018,
which will then be followed by the application of the next tariff for the year 2018/19.
The company made significant savings in cost of sales. It had budgeted for an increase of 12 % on cost of sales
but received an increase of electricity of 5.7 % from Eskom, hence the savings. The company also strengthened its
purchasing initiatives by buying electricity from Southern African Power Pool (SAPP) where the electricity is cheaper
compared to Eskom, leading to significant savings for the company.
The company continued with her drive to intensify austerity measures within the area of operations and support
services. It continued to control operational costs without compromising the projects’ quality. However, the company
is also going ahead with implementing strategic initiatives that will require relevant expenditure towards network
stability with implementing improvement programs and development of new projects.
Due to the above improvements within the operations of EEC, there has been an improvement in the cash-flows.
The company has been operating for quite some time with an overdraft due to the drought that prevailed within
Southern Africa in the previous year. Even though the company is not out of the woods yet, it is showing a lucrative
cash position which will assist in the funding of projects in the pipeline.
The company remains profitable as it has almost tripled its profits compared to the previous year and also shows an
improved position on the asset base because of the capital infrastructure that is completed every year whereby new
customers are connected to the network.
In light of controls monitoring, management is reviewing controls within the Procurement division to ensure that the
processes and procedures are followed accordingly. No deviations from laid down procedures will be tolerated.
Improvements relating to supplier approval, monitoring, tender process management and compliance will be
enshrined to the new procurement procedure that will be fully aligned to Swaziland Public Procurement Regulatory
Authority regulations and to Best Industry practises.
The drive relating to the enhancement of Independent Power Producers (IPPs) continues towards harnessing and
encouraging self-generation within the Kingdom of Eswatini. The company continues to support Independent Power
Producers by granting and signing memorandum of understanding (MoU’s) and power purchase agreements.
EEC maintains her good work in terms of keeping a clean and safe environmental. The company also celebrated the
Earth hour where the public and other stakeholders are educated on how to manage and preserve electricity.
FINANCIAL STATEMENTS | DIRECTORS’ REPORT
ESWATINI ELECTRICITY COMPANY | ANNUAL REPORT 2017/18
70

Directors’ Report - continuedfor the year ended 31 March 2018
2. Business issues
Revenue and expenditure
Electricity sales turnover for the period under review amounted to E1 946 million representing an increase of 19.8%
from the previous year’s figure of E1 624 million. Actual energy sold during the year was 1 095 GWh (2017: 1 058
GWh) resulting in an increase in energy sales of 3.5%.
The 19.8% increase in electricity revenue for the year is mainly due to the tariff increase applied during the year of
14.65% (2017: 11.7%). Costs of sales for the year were E1 353 million (2017: E1 388 million). The decreased cost
of sales was attributable to the increase in internal generation due to the improved rainfall received during the year.
3. Technical performance
Internal generation by the Company for the year stood at 208 GWh representing 16.1% of total units sent out, an
increase from the previous year’s figure (119 GWh) by 74.8%. Local generation from Ubombo Sugar Limited (USL)
stood at 60.4 GWh (2017: 53 GWh). The Company’s imports were 1 020 GWh (2017: 1 064 GWh) and the cost of
these imports was E934 million (2017: E975 million). The decreased cost of imports was as a result of increased
internal generation by the Company. Wheeling charges decreased to E33 million (2017: E37 million) which was in
line with the decreased imports made by the Company.
Total units sent out during the period were 1 288 GWh (2017: 1 234 GWh) and units sold were 1 095 GWh (2017: 1
058 GWh) resulting in system losses of 14.93% (2017: 14.2%). Management continues to focus on reducing system
losses as a means of improving revenue considering that the economy is stagnant.
4. Capital expenditure
Capital projects total cost incurred during the year amounted to E309.5 million (2017: E349 million). Most of the
capital projects were to improve the distribution network. E280 million (2017: E249 million) of total capital projects
were funded by customers and grants.
5. Cash flow for the year
Cash and cash equivalents at the end of the financial year increased to E 314 million from E37 million the previous
year.
6. Joint venture
During the year under review the joint venture company declared a seventh dividend. The company’s net share
of the dividends was US$ 1.6 million (E21 822 080), (2017: US$ 1.8 million (E27 247 500)). As per the financing
agreement related to this investment, 50% of the dividend was remitted to European Investment Bank (“EIB”) after
deducting 20% withholding tax as per the Mozambican tax code.
7. Corporate governance issues
In compliance with good corporate governance principles, the company has operated and maintained the following
Board Committees: Audit and Risk Committee, Finance Committee, Remuneration Committee, Ethics Committee,
and the Technical Committee. These Committees remained effective throughout the financial year.
FINANCIAL STATEMENTS | DIRECTORS’ REPORT
ESWATINI ELECTRICITY COMPANY | ANNUAL REPORT 2017/18
71

7. Corporate governance issues - continued
Environmental Responsibility
In compliance with the relevant legislation, all projects undertaken by the company are carried out after full compliance
with the Environmental Act of 2002. Hazardous substances are disposed-off in full compliance with safety standards
and environmental requirements as stipulated by the act.
Social Responsibility
The Company continued to support various corporate social responsibilities through its involvement in the
electrification of schools and has made various contributions to charity initiatives. The Company also has an
employee wellness program set up to encourage employees to live a healthy lifestyle.
8. Share capital
The share capital of the company amount to E433 493 841 made up of 433 493 841 shares of E1 each.
9. Dividend
The Directors approved a dividend of E 12 468 900 (2017: Nil) in respect of the financial year ended 31 March 2018.
10. Subsequent events
Subsequent to 31 March 2018, the company effected a tariff award of 14.65% that was agreed on by Eswatini
Energy Regulator Authority (ESERA).
11. Going concern
The Directors are of the opinion that the company will be a going concern for the next 12 months; hence an
assessment of the going concern and the ability of the company to continue trading has been made. Based on
the strategic initiatives to drive operational efficiency, management continues to monitor and implement austerity
measures. Further, the company is monitoring the financial liability obligations and there is no reason to believe that
it will not be able to meet its financial obligations as they arise.
12. Management commentary on internal control deficiencies
Management follows a zero tolerance to fraud and is committed to world class standards of internal controls.
Management noted that there were lapses in internal controls within the procurement process and corrective
measures are being implemented.
13. Directors
The Directors are appointed by the Minister responsible for Natural Resources and Energy. The following directors served on the board during period under review:
Directors’ Report - continuedfor the year ended 31 March 2018
FINANCIAL STATEMENTS | DIRECTORS’ REPORT
ESWATINI ELECTRICITY COMPANY | ANNUAL REPORT 2017/18
72

Non-Executive Directors
Chairperson Appointed Mr S’thofeni Ginindza 01 February 2016
Directors
Mr Dumisani Dlamini 27 July 2015
Ms Duduzile Dlamini-Nyembe 27 July 2015
Mr Vusi Dlamini 14 January 2016
Ms Lindiwe Dlamini 01 February 2016
Princess Lomajuba 01 September 2016
Chief Velamuva Maseko 01 September 2016
Mr Joseph Shilubane 03 October 2016
Executive Director
Managing Director Mr Meshack Kunene 01 January 2016 (confirmed 1 February 2017)
Secretary Mr Velaphi Dlamini 01 December 2013
14. Bankers
The following financial institutions were the company’s bankers during the year:
Standard Bank Swaziland Limited Nedbank (Swaziland) Limited
P O Box 667 P O Box 70
Mbabane Mbabane
First National Bank of Swaziland Swaziland Building Society SwaziBank
P O Box A267 P O Box 300 P O Box 285
Eveni Mbabane Mbabane
15. EEC’s Business and Postal Address
Business address Postal address
Eluvatsini House P O Box 258
Mhlambanyatsi Road Mbabane
Mbabane H100
Eswatini Eswatini
16. Auditors
The company’s auditors are:
Business address Postal address KPMG KPMG
Umkhiwa House P O Box 331
Lot 195 Karl Grant Street Mbabane
Mbabane H100
Eswatini Eswatini
Directors’ Report - continuedfor the year ended 31 March 2018
FINANCIAL STATEMENTS | DIRECTORS’ REPORT
ESWATINI ELECTRICITY COMPANY | ANNUAL REPORT 2017/18
73

FINANCIAL STATEMENTS | STATEMENT OF COMPREHENSIVE INCOME
ESWATINI ELECTRICITY COMPANY | ANNUAL REPORT 2017/18
74
Statement of Comprehensive Incomefor the year ended 31 March 2018
2018 2017 Note E E Revenue 4 2 253 819 366 1 786 407 666
Cost of sales 5 (1 353 020 883) (1 388 005 201)
Gross profit 900 798 483 398 402 465
Other income 6 27 513 989 57 017 851
Administrative expenses 7 (295 910 560) (269 804 355)
Other losses 8 (28 992 311) (37 273 489)
Operating profit 603 409 601 148 342 472
Finance costs 9 (30 827 941) (39 215 066)
Finance income 9 8 914 775 3 764 170
Finance costs-net 9 (21 913 166) (35 450 896)
Share of profit of joint venture 12 31 850 337 40 273 000
Profit before income tax 613 346 772 153 164 576
Income tax charge 10 (76 285 980) (9 015 440)
Profit for the year 537 060 792 144 149 136
Other comprehensive income
Items that are or may be reclassified to profit or loss
Foreign exchange losses on translation of foreign joint venture 13 (41 564 840) (52 523 567)
Income tax relating to these items 10 8 312 969 10 504 714
Items that will not be reclassified to profit or loss
Re-measurement of defined benefit asset 17 (770 858) (3 490 020)
Income tax relating to these items 10 211 986 959 756
Other comprehensive loss for the year – net of tax (33 810 743) (44 549 117)
Total comprehensive income for the year 503 250 049 99 600 019

FINANCIAL STATEMENTS | STATEMENT OF FINANCIAL POSITION
ESWATINI ELECTRICITY COMPANY | ANNUAL REPORT 2017/18
75
Statement of Financial Positionas at 31 March 2018
2018 2017 Note E E AssetsNon-current assets Property, plant and equipment 11 2 309 949 856 2 096 280 154Investment in joint venture 12 324 182 749 361 174 850Other assets 14.2 27 788 133 4 810 441USL electricity prepayment 15 70 000 000 80 000 000Derivative financial instruments 23(d) 24 273 139 32 256 125Investment in sinking fund 23(d) 209 156 723 183 925 579Retirement benefit asset 17 3 557 147 4 141 368Embedded derivative asset 23(d) 63 959 981 76 796 820 3 032 867 728 2 839 385 337 Current assets Inventories 16 56 217 784 80 388 924Trade and other receivables 14.1 198 179 954 164 735 959USL electricity prepayment 15 10 000 000 10 000 000Current income tax assets 20.1 29 532 788 44 774 958Cash and cash equivalents 14.3 314 143 180 37 031 215 608 073 706 336 931 056 Total assets 3 640 941 434 3 176 316 393 Equity and liabilities Equity attributable to owners of the company Ordinary shares 18 433 493 841 433 493 841Foreign exchange translation reserves 13 85 917 611 119 169 482Retained earnings 1 636 283 210 1 112 250 190 2 155 694 662 1 664 913 513Liabilities Non-current liabilities Deferred grant income 19.1 299 916 135 306 971 569Other deferred income 19.2 27 788 133 4 810 441Borrowings 14.5 241 526 680 261 175 981Embedded derivative liability 23(d) 145 115 866 148 055 476Derivative financial instruments 23(d) 784 850 1 059 077Deferred income tax liabilities 20.2 289 679 973 237 261 118 1 004 811 637 959 333 662Current liabilities Borrowings 14.5 42 288 350 41 126 570Trade and other payables 14.4 368 461 590 427 461 519Provisions for other employee benefits 21 29 178 675 31 157 567Deferred revenue 19.3 40 506 520 52 323 562
480 435 135 552 069 218
Total liabilities 1 485 246 772 1 511 402 880
Total equity and liabilities 3 640 941 434 3 176 316 393

Statement of Changes in Equityfor the year ended 31 March 2018
Foreign exchange Share translation Retained Note capital reserves earnings TotaI E E E E Balance at 1 April 2017 433 493 841 119 169 482 1 112 250 190 1 664 913 513 Total comprehensive income for the year - (33 251 871) 536 501 920 503 250 049Profit for the year - - 537 060 792 537 060 792Other comprehensive loss for the year - (33 251 871) (558 872) (33 810 743)Dividends to equity holders of the company 18.1 - - (12 468 900) (12 468 900) Balance at 31 March 2018 433 493 841 85 917 611 1 636 283 210 2 155 694 662
Balance at 1 April 2016 433 493 841 161 188 335 970 631 318 1 565 313 494 Total comprehensive income for the year - (42 018 853) 141 618 872 99 600 019Profit for the year - - 144 149 136 144 149 136Other comprehensive loss for the year - (42 018 853) (2 530 264) (44 549 117)Dividends to equity holders of the company 18.1 - - - - Balance at 31 March 2017 433 493 841 119 169 482 1 112 250 190 1 664 913 513
FINANCIAL STATEMENTS | STATEMENT OF CHANGES IN EQUITY
ESWATINI ELECTRICITY COMPANY | ANNUAL REPORT 2017/18
76

Statement of Cash Flowsfor the year ended 31 March 2018
FINANCIAL STATEMENTS | STATEMENT OF CASH FLOWS
ESWATINI ELECTRICITY COMPANY | ANNUAL REPORT 2017/18
77
2018 2017 Note E E Cash flows from operating activities Cash generated by operations 22 676 647 578 325 665 416Tax (paid)/recouped 20.1 (100 000) 150 000Interest received 9 8 914 775 3 764 170Interest paid 9 (13 332 555) (14 880 770)Dividends paid 14.4 (7 568 298) -Employer contributions to plan asset 17 (7 784) (65 146)Government grant received towards drought - 20 000 000 Net cash generated by operating activities 664 553 716 334 633 670 Cash flows from investing activities Additions to property, plant and equipment to maintain operating capacity 11 (345 261 288) (319 987 697)Proceeds from disposal of property, plant and equipment 11 - -Funds invested in sinking fund-financial asset 23(d) (40 052 800) (46 272 000)Grants received 19 8 353 109 39 024 466Dividends received from Motraco Joint Venture 12 21 822 080 27 247 500Share of Motraco dividends paid to EIB 9 (10 462 000) (13 675 320) Net cash utilised in investing activities (365 600 899) (313 663 051) Cash flows from financing activities Borrowings raised 22.1 8 556 462 -
Repayment of borrowings 22.1 (30 062 900) (30 506 790) Net cash utilised in financing activities (21 506 438) (30 506 790) Net increase/(decrease) in cash and cash equivalents 277 446 379 (9 536 171) Cash and cash equivalents at beginning of the year 36 696 801 46 232 972 Cash and cash equivalents at end of the year 14.3 314 143 180 36 696 801

Notes to the Financial Statementsfor the year ended 31 March 2018
FINANCIAL STATEMENTS | NOTES TO THE FINANCIAL STATEMENTS
ESWATINI ELECTRICITY COMPANY | ANNUAL REPORT 2017/18
78
1 Basis of preparation
Reporting entity
Eswatini Electricity Company Limited is a company incorporated and domiciled in the Kingdom of Eswatini. The registered address of the company is detailed in the directors’ report. The Company’s primary business is detailed in the directors’ report.
(a) Statement of compliance The financial statements have been prepared in accordance with International Financial Reporting Standards (IFRS).
The financial statements comply with IFRS as issued by the International Accounting Standards Board (IASB).
(b) Basis of measurement The financial statements have been prepared on the historical cost basis except for the following items in the statement
of financial position:
• Derivative financial instruments – measured at fair value.
• Embedded derivative asset and liability – measured at fair value
• Defined benefit pension plans – plan assets measured at fair value
(c) Functional and presentation currency These financial statements are presented in Eswatini Lilangeni, which is the Company’s functional currency. All
financial information presented in Emalangeni has been rounded to the nearest one Lilangeni, except as otherwise stated.
(d) Use of estimates and judgements The preparation of the financial statements in conformity with IFRS requires management to make judgements,
estimates and assumptions that affect the application of accounting policies and the reported amounts of assets, liabilities, income and expenses. Actual results may differ from these estimates.
Estimates and underlying assumptions are reviewed on an ongoing basis. Revisions to accounting estimates are
recognised prospectively.
Judgements
Information about critical judgements in applying accounting policies that have the most significant effect on the
amounts recognised in the financial statements are included in note 3.
Assumptions and estimation uncertainties
Information about assumptions and estimation uncertainties that have a significant risk of resulting in a material
adjustment in the company’s next financial statements are included in note 3.
2. Summary of significant accounting policies
The principal accounting policies applied in the preparation of these financial statements are set out below. These
policies have been consistently applied to all the years presented, unless otherwise stated.

Notes to the Financial Statements - continuedfor the year ended 31 March 2018
FINANCIAL STATEMENTS | NOTES TO THE FINANCIAL STATEMENTS
ESWATINI ELECTRICITY COMPANY | ANNUAL REPORT 2017/18
79
New Standards and Interpretations not yet adoptedA number of new standards and amendments to standards and interpretations issued but not yet effective for 31 March 2018 year end, and have not been applied in preparing these financial statements. The company intends to adopt and apply these standards on their respective effective dates.
Number Effective date Executive summary ImpactAmendment to IAS 7 – Cash flow statements Statement of cash flows on disclosure initiative
Annual periods beginning on or after 1 January 2017 (published Feb 2016)
This amendment to IAS 7 introduces additional disclosure that will enable users of financial statements to evaluate changes in liabilities arising from financing activities. The amendment responds to requests from investors for information that helps them better understand changes in an entity’s debt. The amendment will affect every entity preparing IFRS financial statements. However, the information required should be readily available. Preparers should consider how best to present the additional information to explain the changes in liabilities arising from financing activities.
The company has applied this standard in the preparation of the financial statements with all changes in liabilities arising from financing activities being incorporated in the present-ation of the statement of cash flows (See note 22.1). Comparatives are not required for the first year of adoption of this standard, and the company has elected to present only the current year disclosure.
Number Effective date Executive summary and ImpactIFRS 16 – Leases
Annual periods beginning on or after 1 January 2019
This standard will replace the IAS 17 Leases as well as the related interpretations and sets out the principles for the recognition, measurement, presentation and disclosure of leases for both parties to a contract, being the lessee (customer) and the lessor (supplier).The core principle of this standard is that the lessee and lessor should recognise all rights and obligations arising from leasing arrangements on statement of financial position.The most significant change pertaining to the accounting treatment for operating leases is from the lessees’ perspective.IFRS 16 eliminates the classification of leases as either operating or finance leases as is required by IAS 17 and introduces a single lessee accounting model, where a right of use (ROU) asset together with a liability for the future payments is to be recognised for all leases with a term of more than 12 months, unless the underlying asset is of low value.A lessor hence continues to classify its leases as operating leases or finance leases and accounts for these as it currently done in terms of IAS 17. In addition, the standard requires lessors to provide enhanced disclosures about its leasing activities and, in particular, about its exposure to residual value risk and how it is managed.The company has established an IFRS 16 working company and detailed project plan, identifying key responsibilities and milestones of the project. The company is in the process of determining the estimated impact as well as discussing the system requirements to accommodate IFRS 16’s principles. The standard will be applied prospectively as allowed.
2. Summary of significant accounting policies
2.1 Changes in accounting policy and disclosures
New and amended standards adopted by the companyThe following standards have been adopted by the company for the first time for the financial year ending 31 March 2018:

Notes to the Financial Statements - continuedfor the year ended 31 March 2018
FINANCIAL STATEMENTS | NOTES TO THE FINANCIAL STATEMENTS
ESWATINI ELECTRICITY COMPANY | ANNUAL REPORT 2017/18
80
2. Significant accounting policies (continued)
2.1 Changes in accounting policy and disclosures (continued)
New Standards and Interpretations not yet adopted (continued)
Number Effective date Executive summary and ImpactIFRS 9 – Financial Instruments
Annual periods beginning on or after 1 January 2018
This standard replaces the guidance in IAS 39. It includes requirements on the classification and measurement of financial assets and liabilities; it also includes an expected credit losses model that replaces the current incurred loss impairment model.
The adoption of IFRS 9 will require a review of the current classification of financial assets and liabilities. The categories for financial assets changed from IAS 39 to IFRS 9. The IAS 39 held-to-maturity, loans and receivables and available-for-sale categories have been replaced by fair value through other comprehensive income, fair value through profit or loss and measured at amortised cost. A preliminary assessment of EEC’s business model indicates that items classified as loans and receivables are likely to be classified as measured at amortised cost. The remaining classification categories are still being finalised.
The hedge accounting requirements are not expected to have a significant impact on the financial results of the company. The company has determined that the application of an expected credit loss model is likely to result in an earlier recognition of credit losses, in particular on post-paid, interconnect and enterprise business unit receivables. A preliminary impact assessment which is being finalised by management indicated that the application of the expected credit loss model is unlikely to result in material adjustments. The company has determined that retrospective restatement would require the application of hindsight. The company has therefore decided not to restate comparatives. Differences in the carrying amounts of financial assets and financial liabilities resulting from the adoption of IFRS 9 generally will be recognised in retained earnings and reserves as at 1 April 2018.
IFRS 15 –
Revenue
from Contracts
with Customers
Annual periods
beginning on or
after 1 January
2018
The FASB and IASB issued their long awaited converged standard on revenue
recognition on 29 May 2014. It is a single, comprehensive revenue recognition model
for all contracts with customers to achieve greater consistency in the recognition
and presentation of revenue. Revenue is recognised based on the satisfaction of
performance obligations, which occurs when control of good or service transfers to a
customer.
IFRS 15 also includes comprehensive disclosure requirements that will provide users
with information about the nature, amount, timing and uncertainty of revenue and cash
flows arising from the entity’s contracts with customers.
The company has performed a preliminary assessment of the impact of IFRS 15 and
it does not expect a significant change in the recognition and measurement of its
revenue from adoption of this standard.
The impact on earnings is being finalised by management to enable a retrospective
transitional approach to be adopted and initial indications are that, after all the items
discussed above are taken into account, it is not expected to be significant.

Notes to the Financial Statements - continuedfor the year ended 31 March 2018
FINANCIAL STATEMENTS | NOTES TO THE FINANCIAL STATEMENTS
ESWATINI ELECTRICITY COMPANY | ANNUAL REPORT 2017/18
81
2. Significant accounting policies (continued)
2.1 Changes in accounting policy and disclosures (continued)
New Standards and Interpretations not yet adopted (continued)
Number Effective date Executive summary and ImpactIFRIC 22 – Foreign currency Transactions and Advance Consider-ations
Annual periods beginning on or after 1 January2018
The IFRIC provides guidance on how to determine the date of the transaction for the purpose of determining the exchange rate to use on initial recognition of the related asset, expense or income (or part of it) on the de-recognition of a nonmonetary asset or non-monetary liability arising from the payment or receipt of advance consideration in a foreign currency. The IFRIC will be applied prospectively. IFRIC will not materially impact the annual financial statements.
IFRIC 22 –
Uncertainty
over Income
Tax
Treatment
Annual periods
beginning on or
after 1 January
2019
This Interpretation clarifies how to apply the recognition and measurement
requirements in IAS 12 when there is uncertainty over income tax treatments. In such
a circumstance, an entity shall recognise and measure its current or deferred tax asset
or liability applying the requirements in IAS 12 based on taxable profit (tax loss), tax
bases, unused tax losses, unused tax credits and tax rates determined by applying this
interpretation. This interpretation addresses: whether an entity considers uncertain tax
treatments separately; the assumptions an entity makes about the examination of tax
treatments by taxation authorities; how an entity determines taxable profit (tax loss),
tax bases, unused tax losses, unused tax credits and tax rates; and how an entity
considers changes in facts and circumstances. The IFRIC will be applied prospectively.
Note 20.2 and note 26.2 provides instances where the company has some uncertainty
on the treatment of certain tax positions. The standard will impact the entity in the tax
treatment of those items disclosed in those notes.
IAS 28 –
Investment
in Associates
and Joint
Ventures
Annual periods
beginning on or
after
1 January 2019
This amendment clarifies that an entity should apply IFRS 9 including its impairment
requirements, to long-term interests in an associate or joint venture that form part
of the net investment in the associate or joint venture only when the equity method
is not applied. The amendments will be applied retrospectively. The amendment is
not expected to have a significant impact on the annual financial statements, as the
company applies the equity method in accounting for its joint venture investment in
Motraco (note 12).

Notes to the Financial Statements - continuedfor the year ended 31 March 2018
FINANCIAL STATEMENTS | NOTES TO THE FINANCIAL STATEMENTS
ESWATINI ELECTRICITY COMPANY | ANNUAL REPORT 2017/18
82
2. Significant accounting policies (continued)
2.2 Joint venture
Joint ventures are contractual arrangements whereby two or more parties undertake an economic activity that is subject to joint control.
Investments in joint ventures are accounted for using the equity method of accounting and are initially recognised at cost in the financial statements of the company.
The company’s share of its joint ventures post acquisition profits or losses are recognised in profit or loss, and its share of post-acquisition movement in reserves is recognised in reserves. The cumulative post acquisition movements are adjusted against the carrying amount of the investment. When the Company’s share of losses in joint venture equals or exceeds its interest in the joint venture, including any other un-securable receivables, the Company does not recognise further losses, unless it has incurred obligations or made payments on behalf of the joint venture.
When the financial statements of the joint venture are prepared as of a date different from that of the parent’s financial statements, adjustments shall be made for the effects of significant transactions or events that occur between that date and the date of the parent’s financial statements. However, the difference between the end of the reporting period of the joint venture and that of the parent shall be no more than three months.
Unrealised gains on transactions between the Company and its joint ventures are eliminated to the extent of the Company’s interest in the joint ventures. Unrealised losses are also eliminated, unless the transaction provides evidence of an impairment of the asset transferred. Accounting policies of joint ventures have been changed where necessary to ensure consistency with the policies adopted by the Company.
2.3 Foreign currency translation
(a) Functional and presentation currency
Items included in the financial statements are measured using the currency of the primary economic environment in which the entity operates (‘the functional currency’). The financial statements are presented in ‘Emalangeni’ (E), which is the company’s presentation currency.
(b) Transactions and balances
Foreign currency transactions are translated into the functional currency using the exchange rates prevailing at the dates of the transactions or valuation where items are re-measured. Foreign exchange gains and losses resulting from the settlement of such transactions and from the translation at year-end exchange rates of monetary assets and liabilities denominated in foreign currencies are recognised in profit or loss, except when deferred in other comprehensive income as qualifying cash flow hedges and qualifying net investment hedges.
(c) Joint venture translations
The value of the joint venture in foreign currency is translated at year end and differences in translation are recognised in other comprehensive income and accumulated in the foreign exchange translation reserves.
2.4 Property, plant and equipment
Items of property, plant and equipment are stated at cost less accumulated depreciation and impairment losses. Where parts of an item of property, plant and equipment have different useful lives, they are accounted for as separate items of property, plant and equipment.

Notes to the Financial Statements - continuedfor the year ended 31 March 2018
FINANCIAL STATEMENTS | NOTES TO THE FINANCIAL STATEMENTS
ESWATINI ELECTRICITY COMPANY | ANNUAL REPORT 2017/18
83
2. Significant accounting policies (continued)
2.4 Property, plant and equipment (continued)
Freehold land is not depreciated.
Buildings on freehold land, plant, equipment and motor vehicles are depreciated on a straight line basis over their current anticipated useful lives.
The rates of depreciation used are based on the following estimated current useful lives:
Canal, weirs, conduits and valves 50 yearsDam and spillway 50 yearsPower station civil works 50 yearsBuildings and staff housing 40 yearsGeneration plant 40 yearsLeasehold buildings 30 yearsSubstations, transformers and switchgear 25 yearsDistribution and transmission 25 yearsRadio and communication equipment 10 yearsComputer equipment 3 yearsMotor vehicles 5 yearsOffice furniture and equipment 10 years
The costs of improvements to leasehold buildings are written off over the lesser of the periods of the leases or their useful lives.
The basis of depreciation, useful lives and residual values are assessed annually.
The costs of distribution and transmission assets are stated after deducting customer’s contributions up to 30 June 2009.
Work-in-progress on capital projects is included at cost and is not depreciated until the relevant asset is available for use. Borrowing costs incurred in financing work-in-progress on qualifying capital projects are included in the cost of the project until the project is substantially completed.
The Company recognises in the carrying amount of an item of property, plant and equipment the cost of replacing part of such an item when that cost is incurred if it is probable that the future economic benefits embodied with the item will flow to the Company and the cost of the item can be measured reliably. All other costs are recognised in profit or loss as an expense.
Profits and losses on disposals are determined by comparing proceeds with the carrying amount. These gains and losses are included in profit or loss within other income.
2.5 Impairment of assets
Assets are tested for impairment whenever events or changes in circumstances indicate that the carrying amount may not be recoverable. An impairment loss is recognised for the amount by which the asset’s carrying amount exceeds its recoverable amount. The recoverable amount is the higher of an asset’s fair value less costs of disposal and value in use. For the purposes of assessing impairment, assets are grouped at the lowest levels for which there are separately identifiable cash inflows which are largely independent of the cash inflows from other assets or groups of assets (cash-generating units). Non-financial assets other than goodwill that suffered an impairment are reviewed for possible reversal of the impairment at the end of each reporting period.

Notes to the Financial Statements - continuedfor the year ended 31 March 2018
FINANCIAL STATEMENTS | NOTES TO THE FINANCIAL STATEMENTS
ESWATINI ELECTRICITY COMPANY | ANNUAL REPORT 2017/18
84
2. Significant accounting policies (continued)
2.6 Share capital
Shares are classified as equity when there is no contractual obligation to transfer cash or other financial assets. Incremental costs directly attributable to the issue of equity instruments are shown in equity as a deduction from the proceeds, net of tax.
2.7 Financial assets
The Company classifies its financial assets in the following categories:• at fair value through profit or loss• loans and receivables
ClassificationThe classification depends on the purpose for which the financial assets were acquired. Management determines the classification of its financial assets at initial recognition.
Recognition and derecognitionRegular purchases and sales of financial assets are recognised on the trade-date, the date on which the company commits to purchase or sell the asset. Financial assets are derecognised when the rights to receive cash flows from the financial assets have expired or have been transferred and the company has transferred substantially all the risks and rewards of ownership.
MeasurementAt initial recognition, the company measures a financial asset at its fair value plus, in the case of a financial asset not at fair value through profit or loss, transaction costs that are directly attributable to the acquisition of the financial asset. Transaction costs of financial assets carried at fair value through profit or loss are expensed in profit or loss.
Loans and receivables are subsequently carried at amortised cost using the effective interest method.
Financial assets at fair value through profit or loss are subsequently carried at fair value. Gains or losses arising from changes in the fair value are recognised in profit or loss.
Interest income from financial assets at fair value through profit or loss is included in the net gains/ (losses). Interest on available-for-sale securities, held-to-maturity investments and loans and receivables calculated using the effective interest method is recognised in the statement of profit or loss as part of revenue from continuing operations.
ImpairmentThe company assesses at the end of each reporting period whether there is objective evidence that a financial asset or company of financial assets is impaired. A financial asset or a company of financial assets is impaired and impairment losses are incurred only if there is objective evidence of impairment as a result of one or more events that occurred after the initial recognition of the asset (a ‘loss event’) and that loss event (or events) has an impact on the estimated future cash flows of the financial asset or company of financial assets that can be reliably estimated.
Assets carried at amortised costFor loans and receivables, the amount of the loss is measured as the difference between the asset’s carrying amount and the present value of estimated future cash flows (excluding future credit losses that have not been incurred) discounted at the financial asset’s original effective interest rate. The carrying amount of the asset is reduced and the amount of the loss is recognised in profit or loss. As a practical expedient, the company may measure impairment on the basis of an instrument’s fair value using an observable market price.
If, in a subsequent period, the amount of the impairment loss decreases and the decrease can be related objectively to an event occurring after the impairment was recognised (such as an improvement in the debtor’s credit rating), the reversal of the previously recognised impairment loss is recognised in profit or loss. Impairment testing of trade receivables is described in note 23(c).

Notes to the Financial Statements - continuedfor the year ended 31 March 2018
FINANCIAL STATEMENTS | NOTES TO THE FINANCIAL STATEMENTS
ESWATINI ELECTRICITY COMPANY | ANNUAL REPORT 2017/18
85
2. Significant accounting policies (continued)
2.7 Financial assets
Income recognitionInterest income is recognised using the effective interest method. When a receivable is impaired, the company reduces the carrying amount to its recoverable amount, being the estimated future cash flow discounted at the original effective interest rate of the instrument, and continues unwinding the discount as interest income. Interest income on impaired receivables is recognised using the original effective interest rate.
2.8 Revenue recognition
Revenue comprises the fair value of the consideration received or receivable for the sale of electricity and electricity related services such as electricity connections in the ordinary course of the company’s activities. Revenue is shown net of estimated returns, rebates and discounts.
The Company recognises revenue when the amount of revenue can be reliably measured, it is probable that future economic benefits will flow to the entity and specific criteria have been met for each of the Company’s activities as described below. The amount of revenue is not considered to be reliably measured until all contingencies relating to the sale have been resolved. The Company bases its estimates on historical results, taking into consideration the type of customer, the type of transaction and the specifics of each arrangement. The specific accounting policies for the company’s main types of revenue are explained in note 4.
Deferred contributions from customers towards infrastructure relate to fees for connection received in advance from prospective electricity customers. These fees are recognised as revenue when the connections are completed.
2.9 Dividend distributions
Dividend distribution to the company’s shareholder is recognised as a liability in the Company’s financial statements in the period in which the dividends are approved by the company’s shareholder.
Dividend income is recognised when the right to receive payment is established.
2.10 Inventories
Inventories are stated at the lower of cost and net realisable value. Net realisable value is the estimated selling price in the ordinary course of business, less the estimated costs of completion and selling expenses. Cost is determined on the weighted average basis and includes expenditure incurred in acquiring inventories and bring them to their existing location and condition.
2.11 Provisions
Provisions are recognised when the company has a present legal or constructive obligation as a result of past events, it is probable that an outflow of resources will be required to settle the obligation, and a reliable estimate of the amount can be made. Where the company expects a provision to be reimbursed, for example under an insurance contract, the reimbursement is recognised as a separate asset but only when the reimbursement is virtually certain.
Provisions are determined by discounting the expected future cash flows at a pre-tax rate that reflects current market assessments of the time value of money and the risks specific to the liability. The unwinding of the discount is recognised as a finance cost.

Notes to the Financial Statements - continuedfor the year ended 31 March 2018
FINANCIAL STATEMENTS | NOTES TO THE FINANCIAL STATEMENTS
ESWATINI ELECTRICITY COMPANY | ANNUAL REPORT 2017/18
86
2. Significant accounting policies (continued)
2.12 Taxation
Deferred income taxes
Deferred income tax is provided in full, using the liability method, on temporary differences arising between the tax bases of assets and liabilities and their carrying amounts in the financial statements. Currently enacted tax rates are used in the determination of deferred income tax. Deferred tax assets are recognised to the extent that it is probable that future taxable profits will be available against which the temporary differences can be utilised. Deferred tax liabilities and deferred tax assets are recognised for all temporary difference arising from the following differences:
i) The excess of book values of fixed assets over their written down values for tax purposes;ii) The excess of book values of finance leases over their written down values for tax purposes;iii) Income and expenditure in the financial statements of the current year dealt with in other years for tax purposes;iv) The unrealised foreign exchange gains/or losses on Motraco which represent a potential future dividend income to be
declared by Motraco;v) A deferred tax asset will also arise from tax losses to the extent to which the company expects to utilise the tax losses
against future taxable profits; andvi) The company entity also recognises deferred tax from temporary differences arising from provisions, prepayments,
retirement benefit assets, deferred income, and embedded derivatives.
Deferred income tax assets and liabilities are offset when there is a legally enforceable right to offset current tax assets against current tax liabilities and when the deferred income taxes assets and liabilities relate to income taxes levied by the same taxation authority on either the same taxable entity or different taxable entities where there is an intention to settle the balances on a net basis.
Current tax
The charge for the current tax is the amount of income taxes payable in respect of the taxable profits for the current period. It is calculated using tax rate that have been enacted or substantially enacted by the statement of financial position date.
• Taxation is recognised in profit or loss except to the extent that it relates to items recognised in Other Comprehensive Income.
• Taxation is calculated based on tax laws enacted at reporting date.• The policy in respect of the offsetting of deferred tax assets and liabilities.
Management periodically evaluates positions taken in tax returns with respect to situations in which applicable tax regulation is subject to interpretation, and establishes provisions where appropriate on the basis of amounts expected to be paid to the tax authorities.
2.13 Cash and cash equivalents
For the purpose of presentation in the statement of cash flows, cash and cash equivalents includes cash on hand, deposits held at call with financial institutions, other short-term, highly liquid investments with original maturities of three months or less that are readily convertible to known amounts of cash and which are subject to an insignificant risk of changes in value, and bank overdrafts. Bank overdrafts are shown within borrowings in current liabilities in the statement of financial position.
Cash and cash equivalents does not include other assets which include restricted cash for rural electrification projects funded by the Government of Eswatini and the Chinese Government.

Notes to the Financial Statements - continuedfor the year ended 31 March 2018
FINANCIAL STATEMENTS | NOTES TO THE FINANCIAL STATEMENTS
ESWATINI ELECTRICITY COMPANY | ANNUAL REPORT 2017/18
87
2. Significant accounting policies (continued)
2.14 Trade receivables
Trade receivables are recognised initially at fair value and subsequently measured at amortised cost using the effective interest method, less allowance for impairment. An allowance for impairment of trade receivables is established when there is objective evidence that the Company will not be able to collect all amounts due according to the original terms of receivables. The amount of the allowance is the difference between the asset’s carrying amount and the present value of estimated future cash flows, discounted at the effective interest rate. The amount of the allowance is recognised in profit or loss.
2.15 Borrowings
Borrowings are initially recognised at fair value, which is usually evidenced by the fair value of the consideration received, net of transaction costs incurred, when they become party to the contractual provisions. Borrowings are subsequently stated at amortised cost using the effective interest rate method; any difference between the proceeds (net of transaction value) and the redemption value is recognised in profit or loss over the period of the borrowings.
For below market interest rate loans, the borrowings are initially recognised at fair value and subsequently amortised using the effective interest rate method. The difference between the below market interest rate and the effective interest rate is recognised in the statement of comprehensive income.
Borrowings are derecognised when they are extinguished, that is when the obligation is discharged, cancelled or expires.
Borrowings are classified as current liabilities unless the company has an unconditional right to defer settlement of the liability for at least 12 months after the reporting period.
2.16 Employee benefits
a) Short-term employee benefits
The cost of all short-term employee benefits is recognised during the period in which the employee renders the related service. The provision for employee entitlements to salaries and annual leave represent the amount that the Company has a present obligation to pay, as a result of employees’ services provided up to the statement of financial position date. The provision has been calculated at undiscounted amounts based on current salary rates.
b) Pension obligations
A defined contribution plan is a pension plan under which the Company pays fixed contributions into the plan. The Company operates a defined contribution plan. The Company pays contributions to a privately administered pension plan on a mandatory, contractual or voluntary basis. Once the contributions have been paid, the Company has no further payment obligations. The regular contributions constitute net periodic costs for the year in which they are due and as such are included in staff costs.
c) Defined benefit plans
A defined benefit plan is a pension plan that is not a defined contribution plan. The company’s net obligation in respect of defined benefit it plans is calculated separately for each plan by estimating the amount of future benefit that employees have earned in the current and prior periods, discounting that amount and deducting the fair value of any plan assets.
The calculation of defined benefit obligations is performed annually by a qualified actuary using the projected unit credit method. When the calculation results in a potential asset for the company the recognised asset is limited to the present value of economic benefits available in the form of any future refunds from the plan or reductions in future contributions to the plan. To calculate the present value of economic benefits, consideration is given to any applicable minimum funding requirements.

Notes to the Financial Statements - continuedfor the year ended 31 March 2018
FINANCIAL STATEMENTS | NOTES TO THE FINANCIAL STATEMENTS
ESWATINI ELECTRICITY COMPANY | ANNUAL REPORT 2017/18
88
2. Significant accounting policies (continued)
2.16 Employee benefits (continued)
c) Defined benefit plans (continued)
Re-measurements of the net defined benefit liability, which comprise actual gains and losses, the return on plan assets (excluding interest) and the effect of the asset ceiling (if any, excluding interest), are recognised immediately in other comprehensive income. The company determines the net interest expense (income) on the net defined benefit liability (asset) for the period by applying the discount rate used to measure the defined benefit obligation at the beginning of the annual period to the then-net defined benefit liability (asset), taking into account any changes in the net defined benefit liability (asset) during the period as a result of contributions and benefit payments. Net interest expense and other expenses related to defined benefit plans are recognised in profit or loss.
When the benefits of a plan are changed or when a plan is curtailed, the resulting change in benefit that relates to past service or the gain or loss on curtailment is recognised immediately in profit or loss. The company recognises gains and losses on the settlement of a defined benefit plan when the settlement occurs.
d) Termination benefits
Termination benefits are payable whenever an employee’s employment is terminated before the normal retirement date or whenever an employee accepts voluntary redundancy in exchange for these benefits. The Company recognises termination benefits when it is demonstrably committed to either terminate the employment of current employees according to a detailed formal plan without possibility of withdrawal or to provide termination benefits as a result of an offer made to encourage voluntary redundancy. Benefits falling due more than 12 months after statement of financial position date are discounted to the present value.
e) Performance bonus
The bonus provision can be recognised provided the amount can be reliable measured at the reporting date. The company recognises a provision where it is contractually obliged or where there is a past practice that has created a constructive obligation to make bonus payments.
Liabilities for bonus plans are expected to be settled within 12 months and are measured at the amounts expected to be paid when they are settled.
Notes to the Financial Statements - continuedfor the year ended 31 March 2018
FINANCIAL STATEMENTS | NOTES TO THE FINANCIAL STATEMENTS
ESWATINI ELECTRICITY COMPANY | ANNUAL REPORT 2017/18
89
2. Significant accounting policies (continued)
2.17 Grants received
Grants, including non-monetary grants at fair value, are recognised when there is reasonable assurance that the Company will comply with the conditions attached to the grant and that the grant will be received.
Property, plant and equipment acquired from the proceeds of grants is depreciated in accordance with the Company’s property, plant and equipment accounting policy. Grants utilised to acquire property, plant and equipment are initially recognised as deferred income and subsequently recognised in profit or loss on a systematic and rational basis over the useful lives of the assets.
Government and donor grants
Grants received by the Company from Government and donors to acquire assets are shown as deferred income and the relevant assets are brought to account at their actual cost.
The company recognises non-monetary grants received from Government at nominal value.
Rural electrification fund
Funds contributed by Government, donors and consumers to rural electricity projects are held in the Rural Electrification Fund until expended, at which time these funds are transferred to consumer contributions and netted off against the cost of related distribution or transmission assets.
Counterparty fund
Contributions received from interest differential on the Kingdom of Eswatini loan No. 4 and the European Investment Bank loan and interest received on deposits are held in the Counterparty Fund until expended. Capital items funded from the Counterparty Fund are transferred to grants received and the relevant assets are brought to account at their actual cost.
2.18 Transfers from customers
Accounting policy for transfers received before 1 July 2009
Cash contributions made by the Company’s customers to fund part of the installation equipment required to connect them to the electricity network were deducted in arriving at the carrying amount of the installation equipment. Profit or loss effect of the capital contributions is consequently recognised by way of a reduced depreciation expense.
Cash contributions made by the Company’s customers to fund part of the installation equipment required to connect them to the electricity network are recognised as revenue in profit or loss on completion of the connections. Electricity connection contributions for assets not yet completed are deferred and recognised as a liability in the statement of financial position. An asset constructed or acquired for which the company receives a cash contribution is initially recognised at cost. A physical asset contributed by a customer is initially recognised at fair value. Contributions received after 01 July 2009 are recognised in the statement of comprehensive income as revenue (refer to IFRIC 18 below).
IFRIC 18, ‘Transfers of assets from customers’ (effective 1 July 2009)
This Interpretation clarifies the accounting treatment for transfers of property, plant and equipment received from customers. This Interpretation applies to agreements with customers in which the entity receives cash from a customer when that amount of cash must be used only to construct or acquire an item of property, plant and equipment and the entity must then use the item of property, plant and equipment either to connect the customer to a network or to provide the customer with on-going access to a supply of goods and services, or both.

Notes to the Financial Statements - continuedfor the year ended 31 March 2018
FINANCIAL STATEMENTS | NOTES TO THE FINANCIAL STATEMENTS
ESWATINI ELECTRICITY COMPANY | ANNUAL REPORT 2017/18
90
2. Significant accounting policies (continued)
2.19 Offsetting financial assets and financial liabilities
Financial assets and financial liabilities are offset and the net amount reported in the statement of financial position when there is a legally enforceable right to offset the recognised amounts and there is an intention to settle on a net basis, or realise the asset and settle the liability simultaneously.
None of the financial assets or liabilities have been offset in the statement of financial position. None of the financial instruments are subject to offsetting arrangements.
2.20 Derivative financial instruments and hedging activities
Derivatives are initially recognised at fair value on the date a derivative contract is entered into and are subsequently re-measured at their fair value. The method of recognising the resulting gain or loss depends on whether the derivative is designated as a hedging instrument, and if so, the nature of the item being hedged.
The full fair value of a derivative is classified as a non-current asset or liability when the remaining hedged item is more than 12 months and as a current asset or liability when the remaining maturity of the hedged item is less than 12 months.
As at 31 March 2018 the company has not applied any hedge accounting.
Embedded derivative
In order to determine whether the hybrid instrument meet the definition of an embedded derivative, the company considers:a) whether a host contract exists;b) whether some of the cash flows that otherwise would be required by the host contract have been modified according
to a specified index or variable, and as a result financial risks have effectively shifted between the parties; andc) whether the portion of the hybrid instrument that causes the modification in the cash flows attached to the contract
meets the definition of a derivative.
An embedded derivative is required to be separated from the host contract and accounted for as a stand-alone derivative at fair value through profit or loss if the economic characteristics and risks of the embedded derivative are not closely related to the economic characteristics and risks of the host contract.
2.21 Trade payables
Trade payables are obligations to pay for goods or services that have been acquired in the ordinary course of business from suppliers. Accounts payable are classified as current liabilities if payment is due within one year or less (or in the normal operating cycle of the business if longer). If not, they are presented as non-current liabilities. Trade payables are recognised initially at fair value and subsequently measured at amortised cost using the effective interest method.

Notes to the Financial Statements - continuedfor the year ended 31 March 2018
FINANCIAL STATEMENTS | NOTES TO THE FINANCIAL STATEMENTS
ESWATINI ELECTRICITY COMPANY | ANNUAL REPORT 2017/18
91
3 Critical accounting estimates and judgements
The Company makes estimates and assumptions that affect the reported amounts of assets and liabilities within the financial year. Estimates and judgments are continually evaluated and are based on historical experience and other factors, including expectations of future events that are believed to be reasonable under the circumstances. The major area where management has used its judgment and accounting estimates are with regards to:
(a) Provision for post-employment benefits disclosed under note 17An actuary was appointed to perform the valuation to determine the Company’s obligation in this regard. The assumptions and judgments used by the actuary were considered by the Company and were deemed reasonable in light of the prevailing and anticipated future economic conditions.
(b) Valuation of embedded derivative –Motraco EIB LoanThe Company has used estimated future cash flows and market interest rates to estimate the value of the embedded derivative related to the EIB Motraco Equity Loan (note 23(d)). The estimates used are management’s best estimates. The key inputs and estimates have been outlined below:
Valuation dateThe valuation date is 31 March 2018.
Maturity dateThe maturity date of the EIB loan which is 10 June 2019.
Company valueThe equity valuation of Motraco was performed for the period ended 31 October 2014. A risk-free growth rate was then applied to the equity value of Motraco values to determine the equity values as at 31 March 2018. The USD Zero swap curve was applied. Dividend forecasts were used to future company values and then derive a forward dividend yield term structure. It was assumed that the dividends beyond the forecasted period (2030) would grow at a perpetuity growth rate of 2%.
VolatilityThe volatilities of the suitable proxy companies was calculated and adjusted for country specific risk by applying a factor determined by comparing the volatilities of the respective proxy country’s main stock index and the volatility of the South African main stock index (JSE ALLSHARE). The historical share price data was sourced from McGregor BFA and applied equally weighted technique to calculate the volatilities.
(c) Valuation of embedded derivative –Public Service Pension Fund LoanThe Company has used estimated market interest rates to estimate the value of the embedded derivative related to the Public Service Pension Fund Loan (Note 23(d)). The estimates used are management’s best estimates. The key inputs and estimates have been outlined below:
Valuation dateThe valuation date is 31 March 2018.
Maturity dateThe maturity date of the PSPF loan is 15 September 2021.
Embedded Derivative valuationThe valuation uses a swap-curve (interest rate curve) to estimate the value of the embedded derivative liability which represents an estimate of the present value of the PSPF loan cash-flows that will be dependent on the prime rate.

Notes to the Financial Statements - continuedfor the year ended 31 March 2018
FINANCIAL STATEMENTS | NOTES TO THE FINANCIAL STATEMENTS
ESWATINI ELECTRICITY COMPANY | ANNUAL REPORT 2017/18
92
3 Critical accounting estimates and judgements - (continued)
(d) Valuation of embedded derivative –400kV integration project loanThe Company has used estimated market interest rates to estimate the value of the embedded derivative related to the 400kV integration Loan (note 23(d)). The estimates used are management’s best estimates. The key inputs and estimates have been outlined below:
Valuation dateThe valuation date is 31 March 2018.
Maturity dateThe maturity date of the 400 kV integration loan is 15 October 2020.
Embedded Derivative valuationThe valuation uses a swap-curve (interest rate curve) to estimate the value of the embedded derivative liability which represents an estimate of the present value of the 400kV integration loan cash-flows that will be dependent on the market interest rate.
(e) Valuation of embedded derivative –The Electricity Wheeling AgreementThe Company has used estimated US inflation forecasts and the wheeling electricity charges to estimate the value of the embedded derivative related to the Electricity Wheeling Agreement (note 23(d)). The estimates used are management’s best estimates. The key inputs and estimates have been outlined below:
Valuation dateThe valuation date is 31 March 2018.
Maturity dateThe maturity date of the electricity wheeling agreement is 31 September 2024.
Embedded Derivative valuationThe valuation uses a swap-curve (inflation rate curve) to estimate the value of the embedded derivative liability which represents an estimate of the present value of the electricity wheeling charges cash-flows that will be dependent on the US inflation rate.
(f) Estimated impairment of trade and receivables The Company tests annually whether trade and other receivables suffered any impairment in accordance with the accounting policy stated in note 2.5. The recoverable amounts of trade and other receivables have been determined based on discount cash inflows. These calculations require the use of estimates (note 23(c)).
(g) DepreciationThe Company charges depreciation as an expense on items of property, plant and equipment (note 11) based on the useful lives of the different items of property, plant and equipment. The useful lives are management’s best estimates. Management reviews the useful lives of assets on an annual basis.
(h) Income taxesThe Company recognises liabilities for anticipated tax based on estimates of whether additional taxes will be due. Where the final tax income of these matters is different from the amounts that were initially recorded, such differences will impact the current and deferred income tax assets and liabilities in the period in which such determination is made.
(i) Capital contributions revenueCapital contributions from customers are recognised as revenue to the extent the contributions have been utilised in the constructions of these assets and other related electricity connection costs have been incurred. The amounts which have not been utilised towards these new electricity connections are recognised as deferred revenue. The pre IFRIC 18 contributions were recognised net of the cost of the constructed assets and amortised over the useful lives of the these assets. Refer to (g) above for the estimation of depreciation.

Notes to the Financial Statements - continuedfor the year ended 31 March 2018
FINANCIAL STATEMENTS | NOTES TO THE FINANCIAL STATEMENTS
ESWATINI ELECTRICITY COMPANY | ANNUAL REPORT 2017/18
93
3 Critical accounting estimates and judgements - (continued)
(j) Prepaid revenueThe assumption is that the customer buying pattern is consistent from month to month and that most sales takes place during the third and fourth weeks of the month. An assumption was also made that the percentage of active buying consumer index indicates a close to constant trend with a lowest of 79% and a highest of 85% which suggest a consistent buying behaviour of customers. Another noted pattern which was observed and used as part of the assumptions is that the combined sales for weeks 3 and 4 of every month always being higher than that of week 1 and 2 of that month. The average ratio is 50% to 50% respectively. The ratio of 50:50 is used to calculate the estimated prepaid revenue.
The table below shows the sensitivity analysis of deferred revenue due to the change in the customer’s electricity consumption patterns which is the key input variable to the deferred revenue model used by the company to estimate the amount of revenue earned and deferred derived from prepaid customers. The current consumption pattern assumption is that 50% of the March 2018 revenue is deferred; therefore the sensitivity analysis shows the impact of the change in this assumed spending pattern. The other input variables are assumed to be constant.
Deferred revenue 2018
Balance Effect of 5% Effect of 5% increase on decrease on Balance profit or loss profit or loss E E E
Deferred revenue (19.3) 26 082 310 1 304 116 (1 304 116)
26 082 310 1 304 116 (1 304 116)
Deferred revenue 2017
Balance Effect of 5% Effect of 5% increase on decrease on Balance profit or loss profit or loss E E E
Deferred revenue (19.3) 33 691 350 1 684 568 (1 684 568)
33 691 350 1 684 568 (1 684 568)
Notes to the Financial Statements - continuedfor the year ended 31 March 2018
FINANCIAL STATEMENTS | NOTES TO THE FINANCIAL STATEMENTS
ESWATINI ELECTRICITY COMPANY | ANNUAL REPORT 2017/18
94
3 Critical accounting estimates and judgements - (continued)
(k) Sinking Fund 1 valuationThe fixed USD payments towards the sinking fund are discounted by the USD swap curve, as sourced from Bloomberg. The EUR amount receivable at maturity is converted to a USD amount by applying the FX Forward rate, as sourced from Bloomberg. The USD amount is then discounted by the USD swap curve. Finally, the fair value of the swap is determined as the difference between the sum of the discounted USD cash flows and the discounted EUR (after conversion to USD) amount. (Note 23(d)). The estimates used are management’s best estimates. The key inputs and estimates have been outlined below:
Valuation dateThe valuation date is 31 March 2018.
Maturity dateThe maturity date of the sinking fund is 5 June 2019.
Sinking Fund 1 valuationThe valuation uses a swap-curve (USD Swap curve) to estimate the value of the sinking fund asset which represents an estimate of the present value of the cash-flows that will be dependent on the US/ZAR exchange rate to settle the EIB loan in 10 June 2019.
(l) Sinking Fund 2 valuationThe fixed ZAR payments towards the sinking fund are discounted by the ZAR swap curve, as sourced from the Bond Exchange of South Africa, a subsidiary of the JSE. The USD amount receivable at maturity is converted to a ZAR amount by applying the FX Forward rate, as sourced from Bloomberg. The ZAR amount is then discounted by the ZAR swap curve. Finally, the fair value of the swap is determined as the difference between the sum of the discounted ZAR cash flows and the discounted USD (after conversion to ZAR) amount. (Note 29A). The estimates used are management’s best estimates. The key inputs and estimates have been outlined below:
Valuation dateThe valuation date is 31 March 2018.
Maturity dateThe maturity date of the sinking fund is 5 June 2019.
Sinking Fund 2 valuationThe valuation uses a swap-curve (ZAR Swap curve) to estimate the value of the sinking fund asset which represents an estimate of the present value of the cash-flows that will be dependent on the US/ZAR exchange rate to settle the EIB/Motraco embedded derivative liability in 10 June 2019.

FINANCIAL STATEMENTS | NOTES TO THE FINANCIAL STATEMENTS
ESWATINI ELECTRICITY COMPANY | ANNUAL REPORT 2017/18
95
2018 2017 E E 4 Revenue
4.1 The analysis of electricity revenue per customer categories is as follows:
• Domestic and Small Commercial 830 813 464 690 409 644• Irrigation, Industrial, and Large Commercial 1 113 840 795 930 539 315• Other 1 295 000 3 214 333• Contributions from customers towards infrastructure 307 870 107 162 244 374
2 253 819 366 1 786 407 666
4.2 The analysis of electricity by service revenue nature is as follows:
• Revenue from sale of electricity 1 945 949 259 1 624 163 292• Contributions from customers towards infrastructure 307 870 107 162 244 374
2 253 819 366 1 786 407 666
Revenue is recognised for the major business activities using the methods outlined below: Electricity revenue – all customers Timing of recognition: The company supplies electricity to domestic, commercial, industrial and agricultural customers
in the Kingdom. Electricity revenue is recognised based on usage by the customer. Measurement of revenue: For post-paid electricity customers, revenue is measured at the fair value receivable from
the customers at time of billing. Prepaid customers prepay for their electricity, thus revenue usage is measured at the fair value already received from the customers.
Contributions from customers towards infrastructure Timing of recognition: The company charges infrastructure costs to customers for connections to the electricity grid.
Revenue from customer contributions is recognised when the customer has been fully connected to the electricity grid and the lines energised.
Measurement of revenue: Revenue is measured at the fair value of the amount received or receivable from the customer for the service.
Critical judgements Electricity revenue comprises prepaid electricity revenue from domestic and small commercial customers. The
Company utilises an internally generated model to establish an estimate of the revenue and unearned portion of revenue received in advance.
The company recognised E 26 082 310 (2017: E 33 691 350) as revenue from the revenue received in advance with a corresponding unearned revenue liability. E 33 691 350 (2017: E26 118 736) previously not recognised revenue (unearned revenue) has now been recognised in the current year. Note 3(j) explains further the critical judgements made and rationale behind.
Notes to the Financial Statements - continuedfor the year ended 31 March 2018
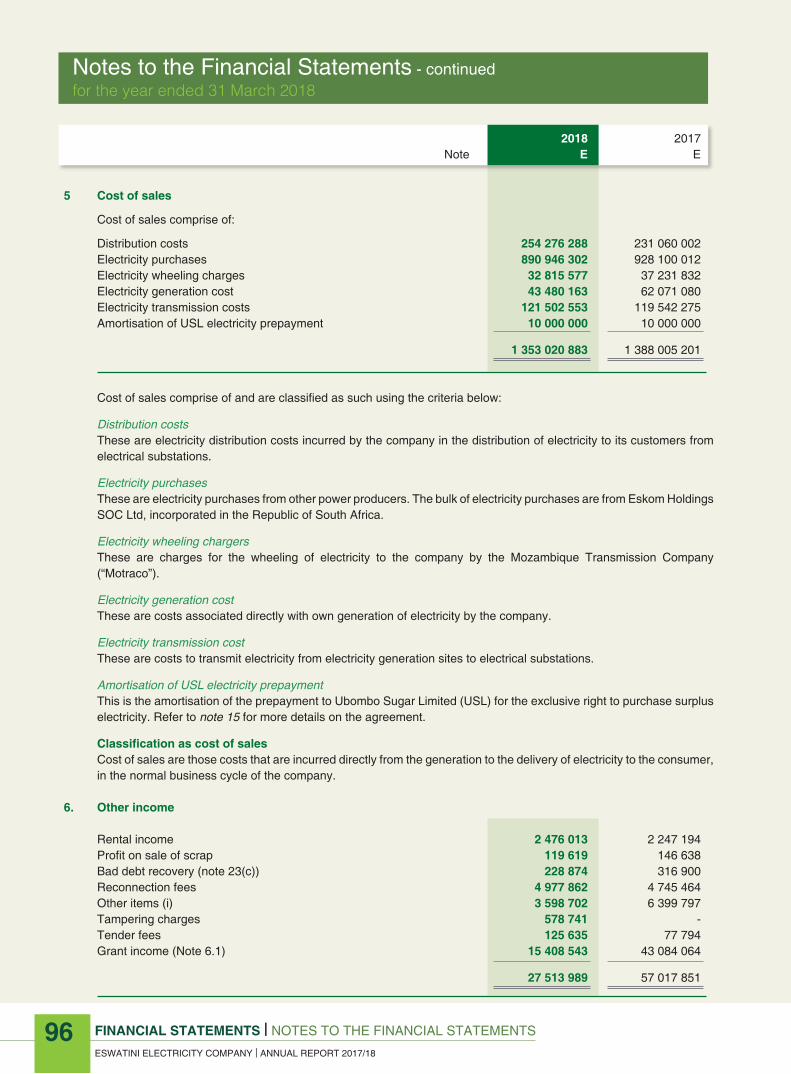
FINANCIAL STATEMENTS | NOTES TO THE FINANCIAL STATEMENTS
ESWATINI ELECTRICITY COMPANY | ANNUAL REPORT 2017/18
96
Notes to the Financial Statements - continuedfor the year ended 31 March 2018
2018 2017 Note E E 5 Cost of sales
Cost of sales comprise of: Distribution costs 254 276 288 231 060 002 Electricity purchases 890 946 302 928 100 012 Electricity wheeling charges 32 815 577 37 231 832 Electricity generation cost 43 480 163 62 071 080 Electricity transmission costs 121 502 553 119 542 275 Amortisation of USL electricity prepayment 10 000 000 10 000 000 1 353 020 883 1 388 005 201
Cost of sales comprise of and are classified as such using the criteria below: Distribution costs These are electricity distribution costs incurred by the company in the distribution of electricity to its customers from
electrical substations. Electricity purchases These are electricity purchases from other power producers. The bulk of electricity purchases are from Eskom Holdings
SOC Ltd, incorporated in the Republic of South Africa. Electricity wheeling chargers These are charges for the wheeling of electricity to the company by the Mozambique Transmission Company
(“Motraco”). Electricity generation cost These are costs associated directly with own generation of electricity by the company. Electricity transmission cost These are costs to transmit electricity from electricity generation sites to electrical substations. Amortisation of USL electricity prepayment This is the amortisation of the prepayment to Ubombo Sugar Limited (USL) for the exclusive right to purchase surplus
electricity. Refer to note 15 for more details on the agreement. Classification as cost of sales Cost of sales are those costs that are incurred directly from the generation to the delivery of electricity to the consumer,
in the normal business cycle of the company. 6. Other income
Rental income 2 476 013 2 247 194 Profit on sale of scrap 119 619 146 638 Bad debt recovery (note 23(c)) 228 874 316 900 Reconnection fees 4 977 862 4 745 464 Other items (i) 3 598 702 6 399 797 Tampering charges 578 741 - Tender fees 125 635 77 794 Grant income (Note 6.1) 15 408 543 43 084 064
27 513 989 57 017 851

FINANCIAL STATEMENTS | NOTES TO THE FINANCIAL STATEMENTS
ESWATINI ELECTRICITY COMPANY | ANNUAL REPORT 2017/18
97
2018 2017 E E
6 Other income (continued)
6.1 Grant income (ii)
Grants received from Government towards the Sinking Fund (note 19.1) - 8 370 000
Grants realised during the year (note 19.2) 15 408 543 14 714 064
Grants received to defray operating expenditure - 20 000 000
15 408 543 43 084 064
(i) Other items Other items includes equipment hire to external parties, Motraco O&M fees, quotation fees and other incidental
miscellaneous income.
(ii) Grant income This is grant income received from the Government of the Kingdom of Eswatini, or from other funders through the
government. There are no unfulfilled conditions or other contingencies attaching to these grants. The company has not
benefitted directly from any other forms of Government assistance other than the investment towards sinking.
Deferral and presentation of grants
Grants received from Government towards the Sinking Fund: This is a Government grant towards the sinking fund. It is recognised at the fair value of the amount received, and recognised when it is received. The grant is a contribution by the Government towards the cross-currency swap agreement that the company entered into. Note 23(d) provides further details on the agreement.
Government grants relating to rural electrification project: Grants relating the rural electrification project are recognised as a liability under deferred grant income (note 19.1) and amortised to profit or loss over the expected useful lives of the related assets.
Grants to defray operating expenditure: Grants received to fund expenditure are deferred and recognised in profit or
loss over the period necessary to match them with the costs that they are intended to compensate.
7 Material other expense items
The company has identified the items below needing separate disclosure for better understanding of the performance of the company. These items are included in “administrative expenses” on the statement of comprehensive income.
Auditors remuneration (Note 7.1) 1 021 223 1 219 133 Depreciation on property, plant and equipment (Note 7.2) 21 053 714 27 758 561 Net impairment charges on electricity receivable (Note 23(b)) 2 898 042 7 882 857 Director expenses 873 225 829 763 Motor vehicle expenses 23 765 721 24 709 268 Repairs and maintenance 94 859 394 83 044 744 Travelling and disbursements expenses 12 178 558 10 962 208 Employee benefit expense (Note 7.3) 83 584 862 97 893 279 Other expenses 55 675 821 15 504 542
Total administrative expenses 295 910 560 269 804 355
Notes to the Financial Statements - continuedfor the year ended 31 March 2018

Notes to the Financial Statements - continuedfor the year ended 31 March 2018
2018 2017 Note E E 7 Material other expense items (continued)
7.1 Auditors remuneration 1 021 223 1 219 133 • Current year audit fees - 244 735 • Prior year audit fees 1 021 223 974 398 7.2 Depreciation expense (Note 11) 131 591 586 133 327 552 • Included in cost of sales 110 537 872 105 568 991 • Included in administrative expenses 21 053 714 27 758 561 7.3 Employee benefit expense 239 255 822 254 333 762 • Included in cost of sales 155 670 960 156 440 483 • Included in administrative expenses 83 584 862 97 893 279 Employee benefit costs can alternatively be presented as below: Salaries and wages 238 671 601 247 202 995 Pension costs - defined benefit plan (Note 17) 584 221 3 039 509 Other employment benefits and costs - 4 091 258 Total employee benefit expense 239 255 822 254 333 762 8 Other (losses)/gains Fair value (losses)/gains – Embedded derivative (Note 23(d)) (9 897 229) 7 413 336 EIB embedded derivative (Note 23(d)) 2 785 950 14 199 616 PSPF Loan embedded derivative (Note 23(d)) 16 337 514 960 EIB 400kV loan embedded derivative (Note 23(d)) 137 323 267 624 Electricity wheeling agreement embedded derivative (Note 23(d)) (12 836 839) (7 568 864) Net foreign exchange losses - foreign transactions (11 054 447) (25 746 910) Net fair value losses on derivatives (22 530 415) (71 978 839) Foreign currency swaps (Note 23(d)) (7 982 986) (22 961 827) Interest rate swaps (Note 23(d)) 274 227 352 588 Sinking fund fair value loss (Note 23(d)) (14 821 656) (49 369 600) Net Foreign Exchange gains on foreign loans (Note 14.5) 14 489 780 53 038 924 Other losses – net (28 992 311) (37 273 489)
FINANCIAL STATEMENTS | NOTES TO THE FINANCIAL STATEMENTS
ESWATINI ELECTRICITY COMPANY | ANNUAL REPORT 2017/18
98

FINANCIAL STATEMENTS | NOTES TO THE FINANCIAL STATEMENTS
ESWATINI ELECTRICITY COMPANY | ANNUAL REPORT 2017/18
99
2018 2017 E E
9 Finance income and costs
Finance costs
Cash interest paid (13 332 555) (18 775 843)
• Interest – Bank overdraft (1 221 575) (3 895 073)
• Interest – Other foreign currency denominated loans (1 952 519) (2 404 606)
• Interest – Local currency denominated loans (10 158 461) (12 476 164)
Non-cash interest
• Interest in foreign currency denominated EIB loan which contains
an embedded derivative (7 033 386) (6 763 903)
EIB share of interest
• Interest – EIB share of Motraco Dividend (10 462 000) (13 675 320)
(30 827 941) (39 215 066)
Finance income
Interest on short term bank deposits 6 349 290 1 890 972
Interest on accounts receivable 2 565 485 1 873 198
8 914 775 3 764 170
Finance costs – net (21 913 166) (35 450 896)
Finance income Interest income is presented as finance income where it is earned from financial assets that are held for cash
management purposes. Interest income from outstanding debtors is also included as finance income.
Finance costs Finance cost is interest charged on borrowings.
Notes to the Financial Statements - continuedfor the year ended 31 March 2018

Notes to the Financial Statements - continuedfor the year ended 31 March 2018
2018 2017 E E 10 Income tax expense
The statutory tax rate of 27.5% (2016: 27.5%) was used to calculate
the current tax charge and a statutory rate of 27.5% (2015: 27.5%) was used for deferred tax liabilities calculation.
- Current tax - Kingdom of Eswatini normal taxation (Note 20.1) 15 342 170 - - Deferred tax (Note 20.2) 60 943 810 9 015 440 - Current year deferred tax 60 080 369 2 449 029 - Prior year deferred tax adjustment 863 441 6 566 411 Income tax expense 76 285 980 9 015 440 The tax on the Company’s profit before tax differs from the theoretical amount that would arise using the weighted average tax rate applicable to the Company’s profit as follows: Profit before tax 613 346 772 153 164 576 Tax calculated at company tax rate 168 670 361 41 160 503 Tax effects of: Legal fees 518 993 294 815 Donations 257 371 206 481 Utilisation of prior year assessed losses - 27 877 394 Net income from joint venture (8 758 843) (11 075 075) Grant amortised (4 237 349) (4 035 533) Fair value adjustment on embedded derivatives 2 721 738 (2 038 667) Withholding tax on Motraco unremitted earnings 914 547 1 242 725 Prior year deferred tax adjustment 863 441 - Contributions from customers towards infrastructure (84 664 279) (44 617 203)
Tax charge 76 285 980 9 015 440 Other comprehensive income: Foreign exchange losses on translation of Motraco Investment Before tax (refer to note 13) (41 564 840) (52 523 567) Deferred tax effect (refer to note 20.2) 8 312 969 10 504 714
After tax (33 251 871) (42 018 853) Actuarial re-measurements Before tax (refer note 17) (770 858) (3 490 020) Deferred tax effect (refer to note 20.2) 211 986 959 756
After tax (558 872) (2 530 264) Total tax charge on statement of comprehensive income 67 761 025 (2 449 029)
10.1 Withholding tax on Motraco unremitted earnings
The Company has recognised deferred tax on the unremitted earnings of the joint venture company (note 13) because there is a 20% withholding tax payable when these earnings are distributed by the joint venture company. The Withholding tax on Motraco’s unremitted earnings represents a reconciling item in the tax reconciliation because the withholding tax liability will be due to the Mozambican tax authorities.
FINANCIAL STATEMENTS | NOTES TO THE FINANCIAL STATEMENTS
ESWATINI ELECTRICITY COMPANY | ANNUAL REPORT 2017/18
100

FINANCIAL STATEMENTS | NOTES TO THE FINANCIAL STATEMENTS
ESWATINI ELECTRICITY COMPANY | ANNUAL REPORT 2017/18
101
Notes to the Financial Statements - continuedfor the year ended 31 March 2018
11
Pro
pert
y, p
lant
and
equ
ipm
ent
C
arry
ing
Net
car
ryin
g
Acc
umul
ated
am
ount
at
D
epre
ciat
ion
Am
ount
at
Cos
t at
Dep
reci
atio
n A
s at
31
Mar
ch 2
018
1 A
pril
2017
A
dditi
ons
Dis
posa
ls
Tran
sfer
s fo
r the
yea
r 31
Mar
. 201
8 31
Mar
. 201
8 31
Mar
. 201
8
E E
E E
E E
E E
Dam
and
Spi
llway
12
122
586
-
- -
(723
639
) 11
398
947
36
181
968
(2
4 78
3 02
1)
Pow
er s
tatio
n ci
vil w
orks
-
- -
- -
-
1 74
6 85
2
(1 7
46 8
52)
Free
hold
land
2
153
839
- -
- -
2 15
3 83
9
2 15
3 83
9
- B
uild
ings
and
sta
ff ho
usin
g 82
947
656
-
- 3
37 8
91
(2 5
10 9
51)
80
774
596
103
668
690
(2
2 89
4 09
4)
Leas
ehol
d bu
ildin
gs
1 32
1 99
4 -
- -
(600
354
) 7
21 6
40
3 07
6 04
9
(2 3
54 4
09)
Can
al, w
eirs
, con
duits
and
val
ves
9 67
4 82
6 -
- -
(625
135
) 9
049
691
28 3
57 8
14
(19
308
123)
G
ener
atio
n pl
ant
78 8
25 2
00
- -
- (2
198
039
) 76
627
161
10
8 56
7 11
4 (3
1 93
9 95
3)
Sub
stat
ions
, tra
nsfo
rmer
s an
d
434
728
642
- -
603
611
(26
622
045)
40
8 71
0 20
8 69
6 76
2 89
5 (2
88 0
52 6
87)
Dis
tribu
tion
and
trans
mis
sion
1
389
281
655
- -
282
730
923
(74
801
955)
1
597
210
623
2
154
470
097
(5
57 2
59 4
74)
Mot
or v
ehic
les
11 7
15 6
40
- -
21
255
951
(7 4
32 5
85)
25
539
006
80
076
337
(5
4 53
7 33
1)
Rad
io a
nd c
omm
unic
atio
n eq
uipm
ent
12 4
84 7
11
- -
- (2
641
997
) 9
842
714
89 6
12 6
72
(79
769
958)
C
ompu
ter e
quip
men
t 16
615
476
-
- 3
523
372
(12
478
094)
7
660
754
152
756
905
(145
096
151
) S
ite w
orks
and
road
s, s
ervi
tude
s,
furn
iture
, sm
all p
lant
, too
ls a
nd
inst
rum
ents
4
174
674
- -
1 08
8 86
9 (9
56 7
92)
4 30
6 75
1 50
690
904
(4
6 38
4 15
3)C
apita
l wor
k-in
-pro
gres
s 40
233
255
34
5 26
1 28
8 -
(309
540
617
) -
75 9
53 9
26
75
953
926
-
2
096
280
154
345
261
288
- -
(131
591
586
) 2
309
949
856
3 58
4 07
6 06
2 (1
274
126
206
)

Notes to the Financial Statements - continuedfor the year ended 31 March 2018
FINANCIAL STATEMENTS | NOTES TO THE FINANCIAL STATEMENTS
ESWATINI ELECTRICITY COMPANY | ANNUAL REPORT 2017/18
102
11
Pro
pert
y, p
lant
and
equ
ipm
ent (
cont
inue
d)
C
arry
ing
Net
car
ryin
g
amou
nt a
t
am
ount
at
Cos
t at
A
s at
31
Mar
ch 2
018
31 M
ar. 2
017
Add
ition
s Tr
ansf
ers
31 M
ar. 2
018
31 M
ar. 2
018
Cap
ital w
ork-
in-p
rogr
ess
com
pris
es:-
- R
ural
Ele
ctrifi
catio
n P
roje
ct
15 3
42 4
91
8 36
0 89
2 (1
5 46
8 49
4)
8 23
4 88
9 8
234
889
- Oth
er c
apita
l pro
ject
s 21
732
041
33
6 90
0 39
6 (2
94 0
72 1
23)
64 5
60 3
14
64 5
60 3
14M
icro
wav
e ra
dio
proj
ect
2 65
8 03
7 -
- 2
658
037
2 65
8 03
7S
ipho
fane
ni a
nd S
iteki
sub
stat
ions
50
0 68
6 -
- 50
0 68
6 50
0 68
6
40
233
255
34
5 26
1 28
8 (3
09 5
40 6
17)
75 9
53 9
26
75 9
53 9
26
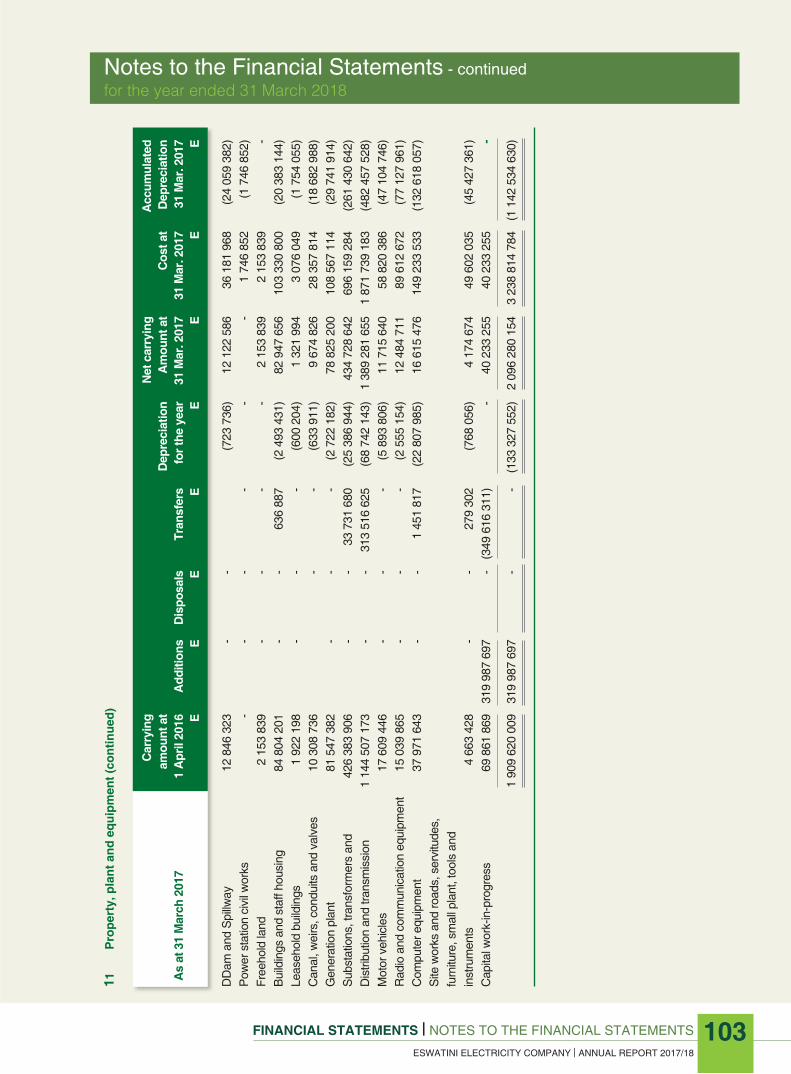
FINANCIAL STATEMENTS | NOTES TO THE FINANCIAL STATEMENTS
ESWATINI ELECTRICITY COMPANY | ANNUAL REPORT 2017/18
103
Notes to the Financial Statements - continuedfor the year ended 31 March 2018
11
Pro
pert
y, p
lant
and
equ
ipm
ent (
cont
inue
d)
C
arry
ing
Net
car
ryin
g
Acc
umul
ated
am
ount
at
D
epre
ciat
ion
Am
ount
at
Cos
t at
Dep
reci
atio
n A
s at
31
Mar
ch 2
017
1 A
pril
2016
A
dditi
ons
Dis
posa
ls
Tran
sfer
s fo
r the
yea
r 31
Mar
. 201
7 31
Mar
. 201
7 31
Mar
. 201
7
E E
E E
E E
E E
DD
am a
nd S
pillw
ay
12 8
46 3
23
- -
(7
23 7
36)
12 1
22 5
86
36 1
81 9
68
(24
059
382)
Pow
er s
tatio
n ci
vil w
orks
-
- -
- -
- 1
746
852
(1 7
46 8
52)
Free
hold
land
2
153
839
- -
- -
2 15
3 83
9 2
153
839
-B
uild
ings
and
sta
ff ho
usin
g 84
804
201
-
- 63
6 88
7 (2
493
431
) 82
947
656
10
3 33
0 80
0 (2
0 38
3 14
4)Le
aseh
old
build
ings
1
922
198
- -
- (6
00 2
04)
1 32
1 99
4 3
076
049
(1 7
54 0
55)
Can
al, w
eirs
, con
duits
and
val
ves
10 3
08 7
36
-
- (6
33 9
11)
9 67
4 82
6 28
357
814
(1
8 68
2 98
8)G
ener
atio
n pl
ant
81 5
47 3
82
- -
- (2
722
182
) 78
825
200
10
8 56
7 11
4 (2
9 74
1 91
4)S
ubst
atio
ns, t
rans
form
ers
and
42
6 38
3 90
6 -
- 33
731
680
(2
5 38
6 94
4)
434
728
642
696
159
284
(261
430
642
)D
istri
butio
n an
d tra
nsm
issi
on
1 14
4 50
7 17
3 -
- 31
3 51
6 62
5 (6
8 74
2 14
3)
1 38
9 28
1 65
5 1
871
739
183
(482
457
528
)M
otor
veh
icle
s 17
609
446
-
- -
(5 8
93 8
06)
11 7
15 6
40
58 8
20 3
86
(47
104
746)
Rad
io a
nd c
omm
unic
atio
n eq
uipm
ent
15 0
39 8
65
- -
- (2
555
154
) 12
484
711
89
612
672
(7
7 12
7 96
1)C
ompu
ter e
quip
men
t 37
971
643
-
- 1
451
817
(22
807
985)
16
615
476
14
9 23
3 53
3 (1
32 6
18 0
57)
Site
wor
ks a
nd ro
ads,
ser
vitu
des,
fu
rnitu
re, s
mal
l pla
nt, t
ools
and
in
stru
men
ts
4 66
3 42
8 -
- 27
9 30
2 (7
68 0
56)
4 17
4 67
4 49
602
035
(4
5 42
7 36
1)C
apita
l wor
k-in
-pro
gres
s 69
861
869
31
9 98
7 69
7 -
(349
616
311
) -
40 2
33 2
55
40 2
33 2
55
-
1 90
9 62
0 00
9 31
9 98
7 69
7 -
- (1
33 3
27 5
52)
2 09
6 28
0 15
4 3
238
814
784
(1 1
42 5
34 6
30)
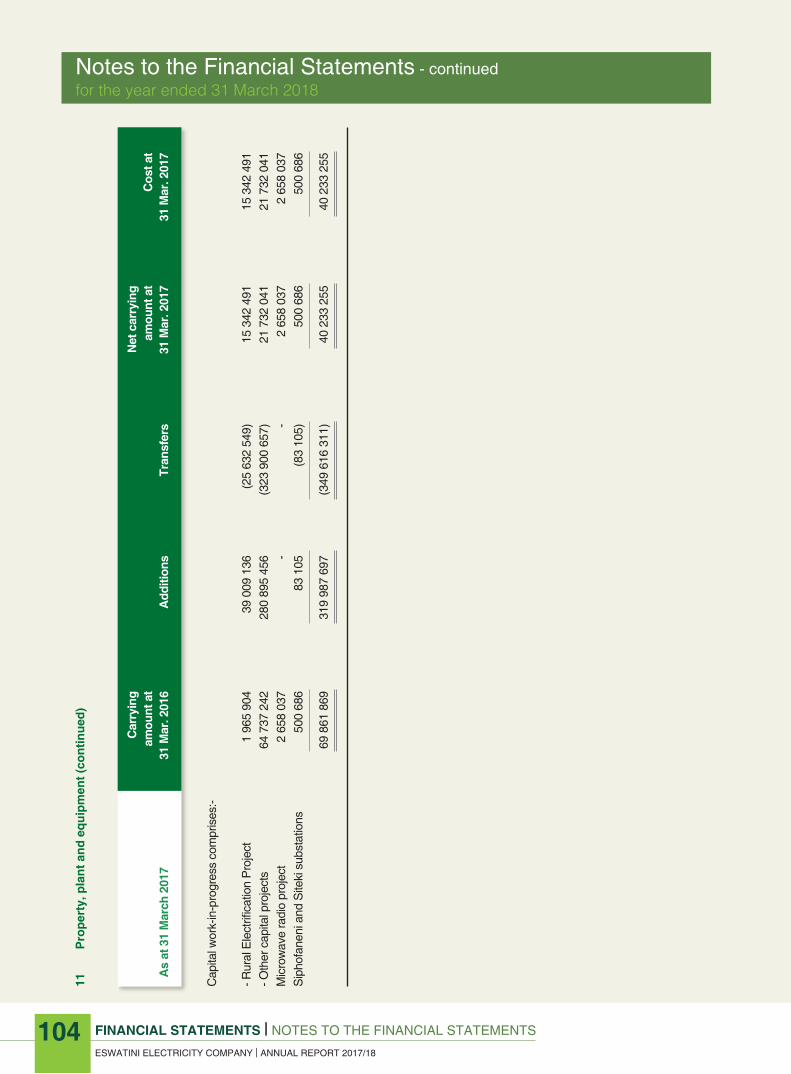
Notes to the Financial Statements - continuedfor the year ended 31 March 2018
FINANCIAL STATEMENTS | NOTES TO THE FINANCIAL STATEMENTS
ESWATINI ELECTRICITY COMPANY | ANNUAL REPORT 2017/18
104
11
Pro
pert
y, p
lant
and
equ
ipm
ent (
cont
inue
d)
C
arry
ing
Net
car
ryin
g
amou
nt a
t
am
ount
at
Cos
t at
A
s at
31
Mar
ch 2
017
31 M
ar. 2
016
Add
ition
s Tr
ansf
ers
31 M
ar. 2
017
31 M
ar. 2
017
Cap
ital w
ork-
in-p
rogr
ess
com
pris
es:-
- R
ural
Ele
ctrifi
catio
n P
roje
ct
1 96
5 90
4 39
009
136
(2
5 63
2 54
9)
15 3
42 4
91
15 3
42 4
91- O
ther
cap
ital p
roje
cts
64 7
37 2
42
280
895
456
(323
900
657
) 21
732
041
21
732
041
Mic
row
ave
radi
o pr
ojec
t 2
658
037
- -
2 65
8 03
7
2 65
8 03
7S
ipho
fane
ni a
nd S
iteki
sub
stat
ions
50
0 68
6 83
105
(8
3 10
5)
500
686
500
686
69 8
61 8
69
319
987
697
(349
616
311
) 40
233
255
40
233
255

FINANCIAL STATEMENTS | NOTES TO THE FINANCIAL STATEMENTS
ESWATINI ELECTRICITY COMPANY | ANNUAL REPORT 2017/18
105
Notes to the Financial Statements - continuedfor the year ended 31 March 2018
2018 2017 E E
11 Property, plant and equipment (continued)
Included in the entity’s property, plant and equipment are assets with
zero net book values which are still being used by the entity. Summarised
details of these assets are as follows:
Cost 438 946 839 359 968 325
Accumulated depreciation (438 946 839) (359 968 325)
Net carrying amount - -
Distribution and transmission assets are stated after deducting net customers’ contributions of E145 889 167 (2017:
E157 337 913). These are assets that were capitalised before the promulgation of IFRIC 18 – Transfer of assets from customers.
Land costing E23 288 (2017: E23 288) on which buildings costing E443 520 (2017: E443 520) have been erected, has
not yet been registered in the name of the Company.
Buildings costing E173 307 (2017: E173 307) have been erected on land which has not yet been acquired by the
Company but which the Kingdom of Eswatini Government has consented to transfer to the Company. The Government
is in the process of transferring the land in question to the Company.
Parts of the Luphohlo-Ezulwini and Maguga Dam hydro-electric schemes are situated on land owned by the Swazi
Nation. The Company has authority to use land on which the hydro-electric schemes are situated.
As a condition of a loan, the Company has undertaken to retain title to and possession of all assets acquired under
the 400 kV Integration Project until the loan is fully repaid by 15 October 2020. The encumbered assets amount to
E222 606 220 (2017: E222 606 220).
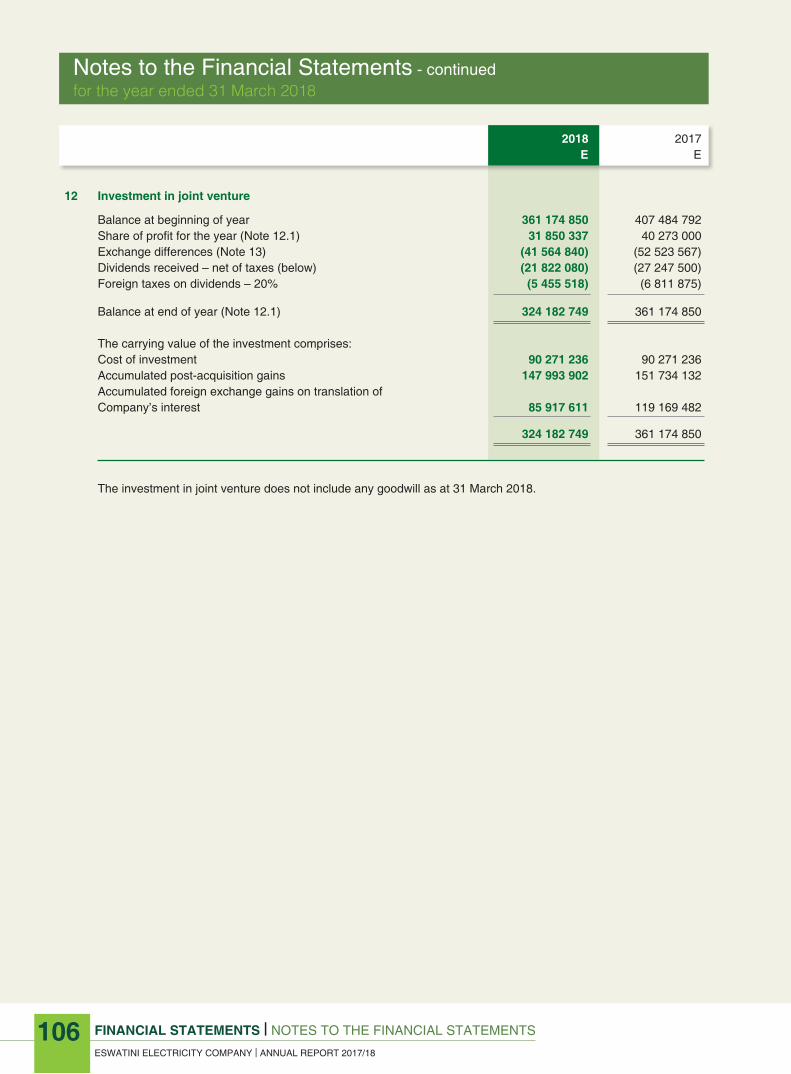
Notes to the Financial Statements - continuedfor the year ended 31 March 2018
2018 2017 E E 12 Investment in joint venture
Balance at beginning of year 361 174 850 407 484 792 Share of profit for the year (Note 12.1) 31 850 337 40 273 000 Exchange differences (Note 13) (41 564 840) (52 523 567) Dividends received – net of taxes (below) (21 822 080) (27 247 500) Foreign taxes on dividends – 20% (5 455 518) (6 811 875)
Balance at end of year (Note 12.1) 324 182 749 361 174 850 The carrying value of the investment comprises: Cost of investment 90 271 236 90 271 236 Accumulated post-acquisition gains 147 993 902 151 734 132 Accumulated foreign exchange gains on translation of Company’s interest 85 917 611 119 169 482 324 182 749 361 174 850
The investment in joint venture does not include any goodwill as at 31 March 2018.
FINANCIAL STATEMENTS | NOTES TO THE FINANCIAL STATEMENTS
ESWATINI ELECTRICITY COMPANY | ANNUAL REPORT 2017/18
106
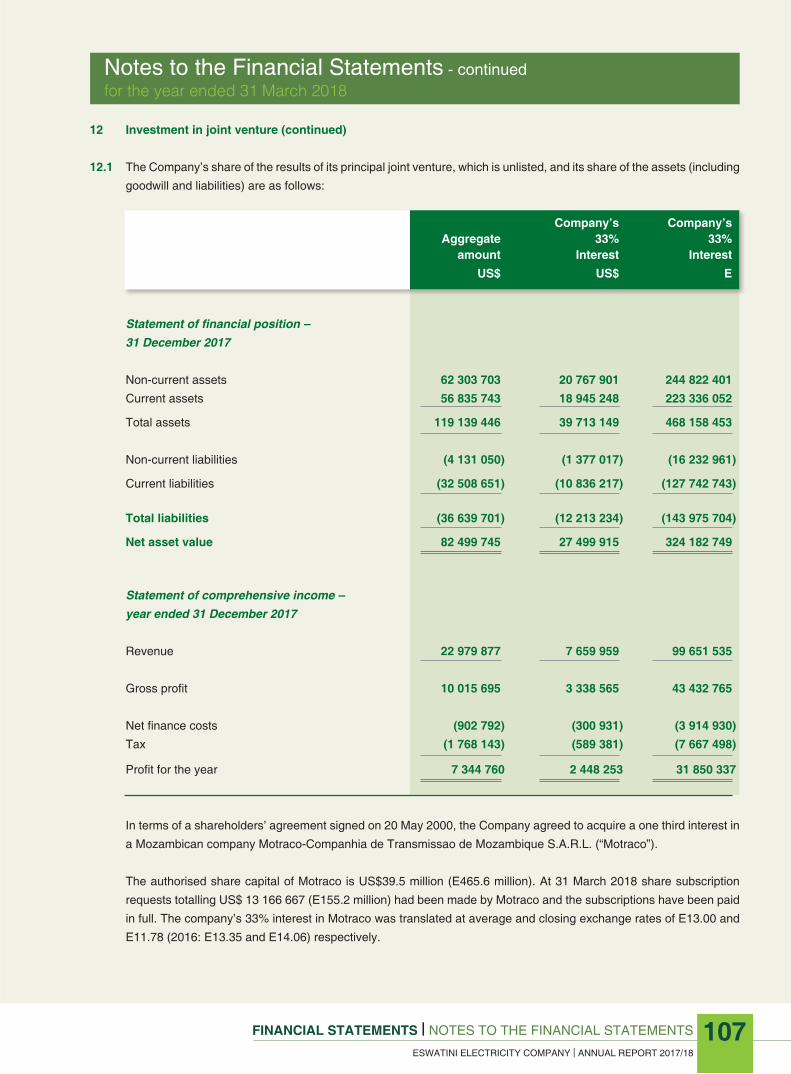
FINANCIAL STATEMENTS | NOTES TO THE FINANCIAL STATEMENTS
ESWATINI ELECTRICITY COMPANY | ANNUAL REPORT 2017/18
107
Notes to the Financial Statements - continuedfor the year ended 31 March 2018
12 Investment in joint venture (continued)
12.1 The Company’s share of the results of its principal joint venture, which is unlisted, and its share of the assets (including
goodwill and liabilities) are as follows:
Company’s Company’s Aggregate 33% 33% amount Interest Interest US$ US$ E
Statementoffinancialposition– 31 December 2017
Non-current assets 62 303 703 20 767 901 244 822 401 Current assets 56 835 743 18 945 248 223 336 052
Total assets 119 139 446 39 713 149 468 158 453
Non-current liabilities (4 131 050) (1 377 017) (16 232 961)
Current liabilities (32 508 651) (10 836 217) (127 742 743)
Total liabilities (36 639 701) (12 213 234) (143 975 704)
Net asset value 82 499 745 27 499 915 324 182 749
Statementofcomprehensiveincome–
year ended 31 December 2017
Revenue 22 979 877 7 659 959 99 651 535
Gross profit 10 015 695 3 338 565 43 432 765
Net finance costs (902 792) (300 931) (3 914 930) Tax (1 768 143) (589 381) (7 667 498)
Profit for the year 7 344 760 2 448 253 31 850 337
In terms of a shareholders’ agreement signed on 20 May 2000, the Company agreed to acquire a one third interest in
a Mozambican company Motraco-Companhia de Transmissao de Mozambique S.A.R.L. (“Motraco”).
The authorised share capital of Motraco is US$39.5 million (E465.6 million). At 31 March 2018 share subscription
requests totalling US$ 13 166 667 (E155.2 million) had been made by Motraco and the subscriptions have been paid
in full. The company’s 33% interest in Motraco was translated at average and closing exchange rates of E13.00 and
E11.78 (2016: E13.35 and E14.06) respectively.

Notes to the Financial Statements - continuedfor the year ended 31 March 2018
FINANCIAL STATEMENTS | NOTES TO THE FINANCIAL STATEMENTS
ESWATINI ELECTRICITY COMPANY | ANNUAL REPORT 2017/18
108
12 Investment in joint venture (continued)
Company’s Compnay’s Aggregate 33% 33% amount Interest Interest US$ US$ E
Statementoffinancialposition– 31 December 2016
Non-current assets 70 084 743 23 361 581 311 907 476 Current assets 50 367 678 16 789 225 224 157 996 Total assets 120 452 421 40 150 806 536 065 472 Non-current liabilities (10 869 163) (3 623 054) (48 372 485) Current liabilities (28 428 279) (9 476 091) (126 518 137) Total liabilities (39 297 442) (13 099 145) (174 890 622) Net asset value 81 154 979 27 051 661 361 174 850
Statementofcomprehensiveincome– year ended 31 December 2016
Revenue 23 429 017 7 809 672 109 851 534
Gross profit 12 457 714 4 152 571 58 410 432
Net finance costs (2 170 213) (723 404) (10 175 469) Tax (1 698 119) (566 040) (7 961 963)
Profit for the year 8 589 382 2 863 127 40 273 000
2018 2017 E E
13 Foreign currency translation reserve
Opening balance 119 169 482 161 188 335 Foreign exchange loss – Joint Venture (Note 12) (41 564 840) (52 523 567) Tax effect 8 312 969 10 504 714
Other comprehensive income (33 251 871) (42 018 853)
Closing balance 85 917 611 119 169 482

FINANCIAL STATEMENTS | NOTES TO THE FINANCIAL STATEMENTS
ESWATINI ELECTRICITY COMPANY | ANNUAL REPORT 2017/18
109
Notes to the Financial Statements - continuedfor the year ended 31 March 2018
14 Financial assets and liabilities The company holds the following financial instruments:
Assets at Financial assets Notes Assets at FVPL amortised cost Total E E E 2018 Trade and other receivables* 14.1 - 186 046 910 186 046 910 Other assets 14.2 - 27 788 133 27 788 133 Investment in sinking fund 23(d) 209 156 723 - 209 156 723 Derivative financial instruments 23(d) 24 273 139 - 24 273 139 Embedded derivative asset 23(d) 63 959 981 - 63 959 981 Cash and cash equivalents 14.3 - 314 143 180 314 143 180
297 389 843 527 978 223 825 368 066 2017 Trade and other receivables* 14.1 - 160 778 587 160 778 587 Other assets 14.2 - 4 810 441 4 810 441 Investment in sinking fund 23(d) 183 925 579 - 183 925 579 Derivative financial instruments 23(d) 32 256 125 - 32 256 125 Embedded derivative asset 23(d) 76 796 820 - 76 796 820 Cash and cash equivalents 14.3 - 37 031 215 37 031 215
292 978 524 202 620 243 495 598 767
*excludes prepayments
Derivatives Liabilities at Financial liabilities Notes at FVPL amortised cost Total E E E
2018 Trade and other payables 14.4 - 368 461 590 368 461 590 Borrowings 14.5 - 283 815 030 283 815 030 Derivative financial instruments 23(d) 145 115 866 - 145 115 866 Embedded derivative liability 23(d) 784 850 - 784 850
145 900 716 652 276 620 798 177 336 2017 Trade and other payables 14.4 - 427 461 519 427 461 519 Borrowings 14.5 - 302 302 551 302 302 551 Derivative financial instruments 23(d) 1 059 077 - 1 059 077 Embedded derivative liability 23(d) 148 055 476 - 148 055 476
149 114 553 729 764 070 878 878 623 The company’s exposure to various risks associated with the financial instruments is discussed in note 23. The
maximum exposure to credit risk at the end of the reporting period is the carrying amount of each class of financial assets mentioned above.

Notes to the Financial Statements - continuedfor the year ended 31 March 2018
FINANCIAL STATEMENTS | NOTES TO THE FINANCIAL STATEMENTS
ESWATINI ELECTRICITY COMPANY | ANNUAL REPORT 2017/18
110
2018 2017 E E 14 Financial assets and liabilities (continued) 14.1 Trade and other receivables
Electricity receivables 138 215 861 132 992 455 Related party electricity receivables (Note 27) 28 979 834 22 800 244 Provision for impairment of electricity receivables (iv) (9 833 170) (27 170 447) Net electricity receivable 157 362 525 128 622 252 Capital contribution debtors 35 487 878 33 646 383 Staff debtors 430 815 377 375 Projects prepayments 3 054 975 3 058 462 Other sundry debtors (ii) 32 260 077 37 623 475 Provision for impairment of other receivables (42 549 360) (42 549 360) Financial assets at amortised cost 186 046 910 160 778 587 Prepayments 12 133 044 3 957 372 Total trade and other receivable 198 179 954 164 735 959
(i) Classification as trade and other receivables Trade receivables are amounts due from customers for goods and services performed in the ordinary course of
business. Loans and other receivables are non-derivative financial assets with fixed or determinable payments that are not quoted in an active market. If collection of the amounts is expected in one year or less they are classified as current assets. If not, they are presented as non-current assets. Electricity receivables are generally due for settlement within 30 days and therefore are all classified as current.
(ii) Other sundry debtors These amounts generally arise from transactions outside the main business operating activities of the company.
Collateral is not normally obtained. All sundry receivables are due within 12 months and are classified as current.
(iii) Fair values of trade and other receivables Due to the short-term nature of the current receivables, their carrying amount at amortised cost is considered to be the
same as their fair value.
(iv) Impairment risk exposure Information about the impairment of trade and other receivables, their credit quality and the company’s exposure to
credit risk, foreign currency risk and interest rate risk can be found in note 23(c).

FINANCIAL STATEMENTS | NOTES TO THE FINANCIAL STATEMENTS
ESWATINI ELECTRICITY COMPANY | ANNUAL REPORT 2017/18
111
Notes to the Financial Statements - continuedfor the year ended 31 March 2018
2018 2017 E E 14 Financial assets and liabilities (continued) 14.2 Other assets
Rural electrification funds (i) 24 389 481 570 012
Probec call account (ii) 149 472 781 019
Lubovane mini-hydro feasibility study (iii) 3 249 180 3 459 410
27 788 133 4 810 441
Classification as other assets Other assets comprise restricted cash balances and counterparty funds at bank contributed by the Government of
Eswatini and the Republic of China through the Government of Eswatini for the Rural Electrification Project and other
projects. This restricted cash is strictly meant for the projects as prescribed by the donors, and cannot be used for any
other purpose by the company.
Fair values Due to the short-term nature of the other assets, their carrying amount at amortised cost is considered to be the same
as their fair value.
(i) Rural electrification fund
The analysis of the balance on the fund at 31 March 2018 is as follows:
Cumulative contributions received from the Government of Eswatini 18 471 800 18 471 800
Cumulative contributions received from Republic of China through
the Government of Eswatini for the Rural electrification project 289 709 069 257 716 621
Total contributions received 308 180 869 276 188 421
Total interest received to date 8 955 712 8 775 582
Deduct costs of projects capitalised to date (292 747 100) (284 393 991)
24 389 481 570 012
The analysis of movements of the fund bank balances during the year is as follows:
Fund balance at beginning of year 570 012 549 530
Add interest received for the year 180 130 346 565
To finance capital expenditure (Note 19.1) (8 353 109) (39 024 466)
Fund received from the Republic of China through the Government of
Eswatini for the rural electrification project 31 992 448 38 698 383
Fund balance at the end of the year 24 389 481 570 012

Notes to the Financial Statements - continuedfor the year ended 31 March 2018
2018 2017 E E 14 Financial assets and liabilities (continued) 14.2 Other assets (continued)
(i) Probec call account Fund balance at beginning of year 781 019 2 342 236 Add interest received for the year 6 775 33 940 Expenditure incurred during the year (992 322) (1 595 157) Funds received from Government of Eswatini 354 000 -
149 472 781 019
This relates to money received by the Company from the Government of Eswatini to assist low income Companies in the country with improved access to sustainable and affordable electricity. (i) Lubovane Mini-hydro Feasibility Study Balance at beginning of the year 3 459 410 3 350 614 Contributions received from the Ministry of Natural Resources and Energy 35 121 - Interest on deposits 108 649 108 796 Funds utilised (354 000)
3 249 180 3 459 410
This relates to money received by the Company from the Government of Eswatini to assist towards funding a feasibility
study for hydro power generation at the Lubovane Dam and the Lower Maguga Dam.
FINANCIAL STATEMENTS | NOTES TO THE FINANCIAL STATEMENTS
ESWATINI ELECTRICITY COMPANY | ANNUAL REPORT 2017/18
112

FINANCIAL STATEMENTS | NOTES TO THE FINANCIAL STATEMENTS
ESWATINI ELECTRICITY COMPANY | ANNUAL REPORT 2017/18
113
Notes to the Financial Statements - continuedfor the year ended 31 March 2018
2018 2017 E E 14 Financial assets and liabilities (continued) 14.3 Cash and cash equivalents
Cash at bank 22 221 062 36 757 854
Short-term bank deposits 291 792 618 143 861
Petty cash 129 500 129 500
314 143 180 37 031 215
Reconciliation of cash flow statement
The above figures reconcile to the amount of cash shown in the
statement of cash flows at the end of the financial year as follows:
Cash and cash equivalents 314 143 180 37 031 215
Bank overdrafts (Note 14.5) - (334 414)
314 143 180 36 696 801
Classification as cash equivalents
Term deposits are presented as cash equivalents if they have a
maturity of three months or less from the date of acquisition and
are repayable with 24 hours’ notice with no loss of interest.
14.4 Trade and other payables
Trade payables and accrued expenses 287 805 303 338 182 325
Electricity connections contributions deposit 68 187 387 81 710 896
Dividends payable 12 468 900 7 568 298
368 461 590 427 461 519
Trade and other accrued expenses Trade and other payables arise from the normal course of business. Normal terms with suppliers are usually unsecured
and payable within 30 days.
Dividend accrual This is a dividend accrual for dividends declared but not paid in favour of the shareholder.
Fair values of trade and other payables The carrying amounts of trade and other payables are considered to be the same as their fair values, due to their short-
term nature.

Notes to the Financial Statements - continuedfor the year ended 31 March 2018
14 Financial assets and liabilities (continued) 14.5 Borrowings
2018 2017 Current Non-current Total Current Non-current Total E E E E E E
Secured Bank overdrafts - - - 334 414 - 334 414Borrowings (i) 40 218 890 225 212 023 265 430 913 40 792 156 249 935 800 290 727 956Lease liabilities (ii) 2 069 460 5 074 476 7 143 936 - - -
Total secured 42 288 350 230 286 499 272 574 849 41 126 570 249 935 800 291 062 370 Unsecured Government of Eswatini (ii) - 11 240 181 11 240 181 - 11 240 181 11 240 181Total unsecured - 11 240 181 11 240 181 - 11 240 181 11 240 181 Total borrowings 42 288 350 241 526 680 283 815 030 41 126 570 261 175 981 302 302 551 Secured liabilitiesOf the borrowings above, the Government of Eswatini has guaranteed E 44 024 516 (2017: E 57 120 816). Refer to note 23(a)(iii) below for further details.
Borrowings of E 124 958 810 (2017: E 116 256 684) are secured by the company’s position in Motraco. Refer to note 23(a)(iii) for further details on this loan.
Other borrowings are secured by various agreements and covenants the company entered into with the counterparties, including encumbrances on certain assets. See note 23(a)(iii) for further details on these loans and covenant details.
Unsecured liabilitiesThe E11.2 million was paid by the Government of the Kingdom of Eswatini during the construction of the Maguga Dam Hydroelectric Project. The amount is payable to the government. The loan does not bear any interest and is unsecured. It is uncertain what rate of interest might be charged in future as no such rate was specified in the agreement. However, the company is in the process of negotiating with the government for this amount to be treated as a grant. The outcome of those negotiations are not certain at this point in time.
Compliance with loan covenantsThe company has complied with all financial covenants of its borrowing facilities during the 2018 and 2017 reporting periods.
Fair values of borrowingsThe fair values of the borrowings are not materially different to their carrying amounts, since the interest payable on those borrowings is either close to current market rates or the borrowings are of a short-term nature. Interest on most borrowings is linked to the prevailing market borrowing rate.
Risk exposuresDetails of the company’s exposure to risks arising from current and non-current borrowings are set out in note 23.
FINANCIAL STATEMENTS | NOTES TO THE FINANCIAL STATEMENTS
ESWATINI ELECTRICITY COMPANY | ANNUAL REPORT 2017/18
114

FINANCIAL STATEMENTS | NOTES TO THE FINANCIAL STATEMENTS
ESWATINI ELECTRICITY COMPANY | ANNUAL REPORT 2017/18
115
Notes to the Financial Statements - continuedfor the year ended 31 March 2018
14
Fina
ncia
l ass
ets
and
liabi
litie
s (c
ontin
ued)
14.5
B
orro
win
gs (c
ontin
ued)
(i)
Mov
emen
t sch
edul
e
Fore
ign
Ope
ning
inte
rest
ex
chan
ge
Clo
sing
Am
ount
re
paid
ad
just
men
t ad
just
men
t ba
lanc
e
E
E E
E E
A
s at
31
Mar
ch 2
018
Fo
reig
n cu
rren
cy
E
IB –
Mot
raco
Pro
ject
loan
– 2
3(a)
(iii)
* 11
6 25
6 68
4 -
17 4
95 3
86
(8 7
93 2
60)
124
958
810
E
IB –
400
kV
Inte
grat
ion
Pro
ject
loan
– 2
3(a)
(iii)
40 3
39 0
51
(6 1
44 6
57)
1 31
8 40
7 (4
290
078
) 31
222
722
E
IB –
400
kV
Inte
grat
ion
loan
(Pha
se 1
) – 2
3(a)
(iii)
* 16
781
765
(3
207
641
) 63
4 11
1 (1
406
442
) 12
801
794
173
377
500
(9 3
52 2
98)
19 4
47 9
04
(14
489
780)
16
8 98
3 32
6
Lo
cal c
urre
ncy
S
waz
iland
Dev
elop
men
t and
Sav
ings
Ban
k - 2
3(a)
(iii)
52 2
07 3
47
(10
078
381)
4
910
242
- 47
039
208
D
BS
A 4
00 k
V In
tegr
atio
n P
roje
ct -
23(a
)(iii)
5
143
109
(1 1
82 9
49)
448
219
- 4
408
379
P
ublic
Ser
vice
Pen
sion
Fun
d - 2
3(a)
(iii)
60 0
00 0
00
(19
800
000)
4
800
000
- 45
000
000
117
350
456
(31
061
330)
10
158
461
-
96 4
47 5
87
To
tal l
ong
term
bor
row
ings
29
0 72
7 95
6 (4
0 41
3 62
8)
29 6
06 3
65
(14
489
780)
26
5 43
0 91
3
*
This
loan
con
tain
s an
em
bedd
ed d
eriv
ativ
e lia
bilit
y. R
efer
to n
ote
23(d
).

Notes to the Financial Statements - continuedfor the year ended 31 March 2018
FINANCIAL STATEMENTS | NOTES TO THE FINANCIAL STATEMENTS
ESWATINI ELECTRICITY COMPANY | ANNUAL REPORT 2017/18
116
14
Fina
ncia
l ass
ets
and
liabi
litie
s (c
ontin
ued)
14.5
B
orro
win
gs (c
ontin
ued)
(i)
Mov
emen
t sch
edul
e (c
ontin
ued)
Fo
reig
n
O
peni
ng
in
tere
st
exch
ange
C
losi
ng
A
mou
nt
repa
id
adju
stm
ent
adju
stm
ent
bala
nce
E E
E E
E
A
s at
31
Mar
ch 2
017
Fo
reig
n cu
rren
cy
E
IB –
Mot
raco
Pro
ject
loan
– 2
3(a)
(iii)
* 12
9 84
4 03
3 -
20 4
39 2
23
(34
026
572)
11
6 25
6 68
4
EIB
– 4
00 k
V In
tegr
atio
n P
roje
ct lo
an –
23(
a)(ii
i) 58
631
568
(6
332
599
) 1
649
346
(13
609
264)
40
339
051
E
IB –
400
kV
Inte
grat
ion
loan
(Pha
se 1
) – 2
3(a)
(iii)*
24
758
382
(3
328
789
) 75
5 26
0 (5
403
088
) 16
781
765
213
233
983
(9 6
61 3
88)
22 8
43 8
29
(53
038
924)
17
3 37
7 50
0
Lo
cal c
urre
ncy
S
waz
iland
Dev
elop
men
t and
Sav
ings
Ban
k - 2
3(a)
(iii)
59 7
22 6
26
(13
435
375)
5
920
096
- 52
207
347
D
BS
A 4
00 k
V In
tegr
atio
n P
roje
ct -
23(a
)(iii)
5
877
838
(1 2
61 0
47)
526
319
- 5
143
109
P
ublic
Ser
vice
Pen
sion
Fun
d - 2
3(a)
(iii)
75 0
00 0
00
(21
016
438)
6
016
438
- 60
000
000
140
600
464
(35
712
860)
12
462
853
-
117
350
456
Tota
l lon
g te
rm b
orro
win
gs
353
834
447
(45
374
248)
35
306
682
(5
3 03
8 92
4)
290
727
956
*
This
loan
con
tain
s an
em
bedd
ed d
eriv
ativ
e lia
bilit
y. R
efer
to n
ote
23(d
).

FINANCIAL STATEMENTS | NOTES TO THE FINANCIAL STATEMENTS
ESWATINI ELECTRICITY COMPANY | ANNUAL REPORT 2017/18
117
Notes to the Financial Statements - continuedfor the year ended 31 March 2018
2018 2017 E E 14 Financial assets and liabilities (continued) 14.5 Borrowings (continued) (ii) Finance leases
The company leases various plant and equipment as disclosed in
note 7, under various finance lease agreements. Under the agreements,
the ownership of the assets passes to the company at no significant
additional cost at upon settlement of the amounts owed.
Total liability 7 143 936 -
Less due within 1 year (2 069 460) -
Due after 12 months but not later than 5 years 5 074 476 -
Finance lease liabilities – minimum lease payments
Not later than 1 year 2 704 681 -
Later than 1 year and not later than 5 years 5 652 273 -
Total lease payments 8 356 954 -
Future finance charges on finances (1 213 018) -
Present value of future finances liabilities 7 143 936 -

14 Financial assets and liabilities (continued) 14.6 Recognised fair value measurements Recurring fair value measurements Level 1 Level 2 Level 3 Total 31 March 2018 E E E E
Financial assets Derivative financial instruments - 209 156 723 - 209 156 723 Sinking fund - 24 273 139 - 24 273 139 Embedded derivative - 63 959 981 - 63 959 981
Total financial assets - 297 389 843 - 297 389 843 31 March 2017 Derivative financial instruments - 183 925 579 - 183 925 579 Sinking fund - 32 256 125 - 32 256 125 Embedded derivative - 76 796 820 - 76 796 820
Total financial assets - 292 978 524 - 292 978 524
Recurring fair value measurements Level 1 Level 2 Level 3 Total 31 March 2018 E E E E
Financial liabilities Derivative financial instruments - 784 850 - 784 850 Embedded derivative - 630 367 144 485 498 145 115 865
Total financial liabilities - 1 415 217 144 485 498 145 900 715 31 March 2017 Derivative financial instruments - 1 059 077 - 1 059 077 Embedded derivative - 784 027 147 271 448 148 055 475
Total financial liabilities - 1 843 104 147 271 448 149 114 552
There were no transfers between levels 1, 2 and 3 for recurring fair value measurements during the year.
Level 1: The fair value of financial instruments traded in active markets (such as publicly traded derivatives, and trading and available-for-sale securities) is based on quoted market prices at the end of the reporting period. The quoted market price used for financial assets held by the company is the current bid price.
Level 2: The fair value of financial instruments that are not traded in an active market (for example, over-the-counter derivatives) is determined using valuation techniques which maximise the use of observable market data and rely as little as possible on entity-specific estimates. If all significant inputs required to fair value an instrument are observable, the instrument is included in level 2.
Level 3: If one or more of the significant inputs is not based on observable market data, the instrument is included in level 3.
Specific valuation techniques used to value financial instruments include: • the fair value of interest rate swaps is calculated as the present value of the estimated future cash flows
based on observable yield curves • the fair value of foreign currency swaps is determined using forward exchange rates at the reporting date • the fair value of the remaining financial instruments is determined using discounted cash flow analysis. All of the resulting fair value estimates are included in level 2 except for certain derivative contracts, where the fair
values have been determined based on present values and the discount rates used were adjusted for counterparty or own credit risk (included in level 3).
Notes to the Financial Statements - continuedfor the year ended 31 March 2018
FINANCIAL STATEMENTS | NOTES TO THE FINANCIAL STATEMENTS
ESWATINI ELECTRICITY COMPANY | ANNUAL REPORT 2017/18
118

FINANCIAL STATEMENTS | NOTES TO THE FINANCIAL STATEMENTS
ESWATINI ELECTRICITY COMPANY | ANNUAL REPORT 2017/18
119
Notes to the Financial Statements - continuedfor the year ended 31 March 2018
2018 2017 E E 15 USL electricity prepayment
Ubombo Sugar Limited Power Purchase Agreement Prepayment 80 000 000 90 000 000
Current 10 000 000 10 000 000 Non-Current 70 000 000 80 000 000
Total prepayment 80 000 000 90 000 000
Opening balance 90 000 000 100 000 000 Amortisation (10 000 000) (10 000 000)
Closing balance 80 000 000 90 000 000
Eswatini Electricity Company Limited has purchased an exclusive right to buy surplus electricity from Ubombo Sugar Limited (USL). The total cost of that exclusive right amounts to E150 000 000. As at 31 March 2018 the entity had paid E150 000 000 (2017: E150 000 000) to Ubombo Sugar Limited. The contract period is 15 years, that is, up to 30 April 2026. However, either party can elect to terminate the contract early after 8 years with a portion of E150 000 000 being refunded based on the number of years of the 15 that were not taken up. USL has issued a guarantee provided by its parent company, Illovo Sugar Limited for an amount of E150 000 000.
USL has lodged a performance security in favour of EEC to the value of E150 000 000. This was achieved by issuing
mortgage bond sureties over USL Property up to the total value of the payment received. For every year that elapses
the performance security can be reduced to the unamortised portion of the E150 000 000.
16 Inventory
2018 2017
Stores 70 180 236 91 287 129
Write-down for obsolete stock (13 962 452) (10 898 205)
Net realisable value 56 217 784 80 388 924
Assigning costs to inventories The costs of individual items of inventory are determined using weighted average costs.
Amounts recognised in profit or loss The Company sold scrapped inventory to independent retailers and staff amounting to E119 619 (2017: E146 628).
The amount received has been included as “other income” in profit or loss.
Write-downs of inventories to net realisable value amounted to E3 064 247 (2017: E 3 226 571). These were recognised
as an expense during the year ended 31 March 2018 and included in ‘cost of sales’ in profit or loss.
Inventory issues which are part of the total repairs and maintenance amount to E60 026 017 (2017: E55 009 017)
and were recognised in profit or loss in “cost of sales”. Inventory is written-down to net realisable value as a result
of technical obsolesce due to technical developments in the energy industry relating to energy equipment. Inventory
written down is recognised in profit or loss in the year under review.

Notes to the Financial Statements - continuedfor the year ended 31 March 2018
FINANCIAL STATEMENTS | NOTES TO THE FINANCIAL STATEMENTS
ESWATINI ELECTRICITY COMPANY | ANNUAL REPORT 2017/18
120
2018 2017 E E 17. Employee retirement benefits obligation Retirement benefit asset (3 557 147) (4 141 368) The amount of employee retirement benefit obligation recognised in the statement of financial position is determined as follows: Present value of plan obligations 78 362 518 81 114 208 Fair value of plan assets (81 919 665) (85 255 576) Present value of overfunded obligations (3 557 147) (4 141 368) Unrecognised actuarial loss - - Asset in the statement of financial position (3 557 147) (4 141 368) The Company makes contributions to a defined benefit plan. The defined benefit plan provides pension benefits for former employees of the Company that are now pensioners. The movements in asset recognised in the statement of financial position are as follows: Asset at beginning of year (4 141 368) (7 180 877) Contributions to the fund (7 784) - Amounts recognised in profit or loss (178 853) - Amounts recognised in other comprehensive income 770 858 3 039 509 Asset in the statement of financial position (3 557 147) (4 141 368)
The defined net benefit gain of E178 853 (in 2017 it was an expense of: E3 039 509) has been recognised under
administrative expenses in the statement of comprehensive income.
Basis for recognition of asset The plan has a surplus and has been recognised on the basis that future economic benefits are available to the entity
in the form of a reduction in future contributions, per the fund rules.

FINANCIAL STATEMENTS | NOTES TO THE FINANCIAL STATEMENTS
ESWATINI ELECTRICITY COMPANY | ANNUAL REPORT 2017/18
121
Notes to the Financial Statements - continuedfor the year ended 31 March 2018
2018 2017 E E 17 Employee retirement benefits obligation (continued)
Movement in the defined benefit obligation over the year is as follows:
Beginning of year 81 114 208 84 421 115
Current service cost - 72 155
Interest cost 6 176 306 7 270 031
Total amount recognised in profit or loss 6 176 306 7 342 186
Re-measurements arising from:
Financial assumptions 1 705 616 1 362 784
Other sources (1 488 514) (2 768 658)
Total amount recognised in other comprehensive income 217 102 (1 405 874)
Other movements
Contributions by plan participants 2 362 19 765
Benefits paid (9 147 460) (9 262 984)
End of year 78 362 518 81 114 208
The movement in the fair value of plan assets of the year is as follows:
Beginning of year 85 255 576 91 601 992
Interest income 6 504 595 7 918 760
Total amount recognised in profit or loss 6 504 595 7 918 760
Re-measurements arising from:
Return on planned assets excluding interest income (553 756) (4 895 894)
Total amount recognised in other comprehensive income (553 756) (4 895 894)
Other movements
Employer contributions 7 784 65 146
Employee contributions 2 362 19 765
Benefits paid (9 147 460) (9 262 984)
Expenses/other scheme payments (149 436) (191 209)
End of the year 81 919 665 85 255 576

FINANCIAL STATEMENTS | NOTES TO THE FINANCIAL STATEMENTS
ESWATINI ELECTRICITY COMPANY | ANNUAL REPORT 2017/18
122
2018 % E 17. Employee retirement benefits obligation (continued) The principal actuarial assumptions for defined benefit obligations as at reporting date (expressed as weighted averages): Discount rate at 31 March 8.06% 8.84% Expected return on plan assets at 31 March 8.06% 8.84% Future salary increases * * Future pension increases 2.00% 2.00% Inflation * *
* Not relevant due to the ages of the active members. Plan assets are comprised as follows: 2018 % 2017 %
E E E
Managed funds 82 022 184 100.1 85 404 110 100.1 Net current liabilities (102 519) (0.1) (148 534) (0.1)
81 919 665 100 85 255 576 100
2018 2017 E E
The managed funds comprises of the following; African Alliance - Offshore 11 667 694 12 485 705 African Alliance - High Income Fund 29 895 555 - African Alliance - Equity fund - 28 327 846 Fincorp 5 657 545 5 657 545 African Alliance- Lilangeni Fund 2 194 753 5 366 236 Greystone Private Equity 35 251 787 29 067 263 SBC Shares 26 124 408 24 001 800 Standard Bank of Swaziland 138 617 257 117 374 986 Investment in transit - 5 000 000 African Alliance – Umnotfo Fund 16 613 072 18 699 206 Conversion paid- net curtailment and settlements (184 102 406) (160 725 011)
81 919 665 85 255 576
The expected return on plan assets is determined by considering the expected returns available on the assets
underlying the current investments. Expected yields on fixed interest investments are based on gross redemption yields as at the reporting date.
The actuarial position of the fund as at year end was as follows: Present value of defined benefit obligation 78 362 518 81 114 208 Fair value of plan assets (81 919 665) (85 255 576)
Surplus (3 557 147) (4 141 368)
Notes to the Financial Statements - continuedfor the year ended 31 March 2018

FINANCIAL STATEMENTS | NOTES TO THE FINANCIAL STATEMENTS
ESWATINI ELECTRICITY COMPANY | ANNUAL REPORT 2017/18
123
Notes to the Financial Statements - continuedfor the year ended 31 March 2018
17 Employee retirement benefits obligation (continued)
The actuarial position of the defined obligation for the past three financial periods before the earliest comparative as
disclosed above as required by IAS 19 par 120A are as follows:
2017 2016 2015
E E E
Present value of defined benefit obligation 81 114 208 84 421 115 188 025 295
Fair value of plan assets (85 255 576) (91 601 992) (204 456 913)
(Surplus) (4 141 368) (7 180 877) (16 431 618)
Members will retire at the normal retirement age. Any member above this age at the valuation date is deemed to have
retired.
There has been no changes in demographic assumptions from the previous valuation.
The sensitivity of the defined benefit obligation to changes in the weighted principal assumptions is:
Increase/(decrease) of benefit obligation
Assumption change E % impact E % impact
2018 2017
Base 78 362 518 81 114 208
Discount rate (+1%) 73 446 547 (6.27%) 76 096 840 (6.19)
Discount rate (-1%) 83 920 385 7.09% 86 781 497 6.99
Post retirement mortality (+2 years) 74 083 570 (5.46%) 77 016 213 5.05
Post retirement mortality (-2 years) 82 599 674 5.41% 85 127 678 4.95
Pension increase (+1%) 84 211 930 7.46% 87 121 259 7.41
Pension decrease (-1%) 73 124 327 (6.68%) 75 734 570 (6.63)
The above sensitivity analyses are based on a change in an assumption while holding all other assumptions constant.
In practice, this is unlikely to occur, and changes in some of the assumptions may be correlated. When calculating the
sensitivity of the defined benefit obligation to significant actuarial assumptions the same method (present value of the
defined benefit obligation calculated with the projected unit credit method at the end of the reporting period) has been
applied as when calculating the defined benefit liability recognised in the statement of financial position.
The methods and types of assumptions used in preparing the sensitivity analysis did not change compared to the prior
period.

FINANCIAL STATEMENTS | NOTES TO THE FINANCIAL STATEMENTS
ESWATINI ELECTRICITY COMPANY | ANNUAL REPORT 2017/18
124
2018 2017 E E 18 Share capital The share capital of the Company consists of the following: Authorised 433 493 841 ordinary shares at E1 each 433 493 841 433 493 841 Issued
433 493 841 ordinary shares at E1 each 433 493 841 433 493 841
All authorised shares have been issued to the Government of the Kingdom of Eswatini, represented by the Minister of Natural Resources and Energy.
18.1 Dividends The following dividends were approved by a directors resolution during the year: Dividends 12 468 900 -
19 Deferred income The entity has three types of deferred income, which are presented on the face of the Statement of Financial Position as follows: 19.1 Deferred grant income
19.2 Other deferred income 19.3 Deferred revenue 19.1 Deferred grant income Deferred income comprises unutilised balances of rural electrification contributed by Eswatini Government and Republic of China through the Government of Eswatini for the Rural Electrification Project. Amount Non-current Balance at beginning of year 306 971 569 282 661 167 Grants realised in statement of comprehensive income (Note 6.1) (15 408 543) (14 714 064) Rural electrification grant received (Note 14.2) 8 353 109 39 024 466
299 916 135 306 971 569
Deferral and presentation The deferred grant income is deferred and included as a non-current liability, and credited to profit and loss on a
straight-line basis over the expected useful lives of the related assets.
There are no critical estimates and no judgements related to this deferred grant income balance.
Notes to the Financial Statements - continuedfor the year ended 31 March 2018

FINANCIAL STATEMENTS | NOTES TO THE FINANCIAL STATEMENTS
ESWATINI ELECTRICITY COMPANY | ANNUAL REPORT 2017/18
125
Notes to the Financial Statements - continuedfor the year ended 31 March 2018
2018 2017 E E 19 Deferred income (continued) 19.2 Other deferred income
Other deferred income comprises unutilised balances of rural electrification contributed by Eswatini Government and
Republic of China through the Government of Eswatini for the Rural Electrification Project and other projects.
Rural electrification funds (Note 14.2) 24 389 481 570 012
Probec call account (Note 14.2) 149 472 781 019
Lubovane Mini-hydro feasibility study (Note 14.2) 3 249 180 3 459 410
27 788 133 4 810 441
Deferral and presentation The deferred grant income is deferred and included as a non-current liability, and depleted as the funds are being used
for the expenses of the related project.
No critical estimates no judgements related to this deferred grant income balance.
19.3 Deferred revenue
Deferred electricity revenue (i) 26 082 310 33 691 350
Deferred contributions from customers towards infrastructure (ii) 14 424 210 18 632 212
40 506 520 52 323 562
(i) Deferred electricity revenue
Deferred electricity revenue comprises unearned prepaid electricity revenue from domestic and small commercial
customers. The Company utilises an internally generated model to establish an estimate of unearned revenue from
prepaid customers.
(ii) Deferred contributions from customers towards infrastructure Deferred contributions from customers towards infrastructure relate to fees for connection received in advance from
prospective electricity customers. These fees are recognised as revenue when the connections are completed.
See note 3(g) for critical judgements and estimates relating to this balance.
20 Income taxes
20.1 Current income tax asset
Opening balance (44 774 958) (44 624 958)
Income tax charge (refer to note 10) 15 342 170 -
Tax paid (100 000) (150 000)
Closing balance (29 532 788) (44 774 958)

Notes to the Financial Statements - continuedfor the year ended 31 March 2018
FINANCIAL STATEMENTS | NOTES TO THE FINANCIAL STATEMENTS
ESWATINI ELECTRICITY COMPANY | ANNUAL REPORT 2017/18
126
2018 2017 E E 20 Income taxes (continued) 20.2 Deferred income tax Deferred income tax assets and liabilities are offset when there is a
legally enforceable right to offset current tax assets against current tax liabilities and when the deferred income taxes relate to the same fiscal authority. The offset amounts are as follows:
Deferred tax assets: - Deferred tax asset to be recovered after more than 12 months (41 941 058) (84 642 110) (41 941 058) (84 642 110) Deferred tax liabilities: - Deferred tax liability to be recovered after more than 12 months 331 621 031 321 903 228
331 621 031 321 903 228
Deferred tax liabilities (net) 289 679 973 237 261 118 The gross movement on the deferred income tax account is as follows:
Beginning of year 237 261 118 239 710 147 Profit or loss charge (note 10) 60 080 369 9 015 440 Prior period – deferred tax adjustment 863 441 - Other comprehensive income charge (note 10) (8 524 955) (11 464 469) End of year 289 679 973 237 261 118 Non-current tax (asset)/liability Deferred tax liabilities Accelerated tax depreciation 275 699 119 250 068 571 Prepayments 4 176 705 1 929 354 Retirement benefit asset 978 215 1 138 876 Withholding tax on Motraco unremitted earnings 46 782 303 54 180 723 Unrealised forex gains on translation of foreign loans 3 984 689 14 585 704 331 621 031 321 903 228 Deferred tax assets Assessed loss - (26 542 354) Provisions for other employee benefits ( 8 024 136) (9 867 507) Doubtful debt allowance (14 405 196) (19 172 947) Deferred revenue (10 179 537) (8 305 365) Unrealised fair value adjustments on derivative financial instruments (7 155 620) (19 794 181) Finance leases (1 964 583) - Unrealised actuarial valuation losses (211 986) (959 756) (41 941 058) (84 642 110) Deferred tax liabilities (net) 289 679 973 237 261 118

FINANCIAL STATEMENTS | NOTES TO THE FINANCIAL STATEMENTS
ESWATINI ELECTRICITY COMPANY | ANNUAL REPORT 2017/18
127
Notes to the Financial Statements - continuedfor the year ended 31 March 2018
20
Def
erre
d ta
xatio
n (c
ontin
ued)
20.2
Def
erre
d ta
xatio
n (c
ontin
ued)
Th
e m
ovem
ent i
n de
ferr
ed ta
x as
sets
and
liab
ilitie
s du
ring
the
year
, with
out t
akin
g in
to c
onsi
dera
tion
the
offs
ettin
g of
bal
ance
s w
ithin
the
sam
e ta
x ju
risdi
ctio
n is
as fo
llow
s:
Unre
alis
ed
Unre
alis
ed
fair
Valu
e W
ithol
ding
tax
Unre
alis
ed
Acce
lera
ted
Retir
emen
t
actu
aria
l Ad
just
men
ts o
n on
Mot
raco
fo
rex
gain
s on
tax
bene
fit
valu
atio
n d
eriv
ativ
e fin
anci
al
unre
mitt
ed
trans
latio
n of
D
efer
red
tax
liabi
litie
s de
prec
iatio
n Pr
epay
men
ts
asse
t ga
ins
inst
rum
ents
ea
rnin
gs
fore
ign
loan
s To
tal
E E
E E
E E
E
At 1
Apr
il 20
16
219
095
326
1 11
8 04
3 1
974
741
1 01
1 22
3 22
584
812
63
442
711
-
309
226
856
C
harg
e to
pro
fit o
r los
s 30
973
245
81
1 31
1 (8
35 8
65)
(1 0
11 2
23)
(22
584
812)
(9
261
988
) 14
585
704
12
676
372
A
t 31
Mar
ch 2
017
250
068
571
1 92
9 35
4 1
138
876
- -
54 1
80 7
23
14 5
85 7
04
321
903
228
(C
redi
ted)
/cha
rged
to
pr
ofit o
r los
s 25
630
548
2
247
351
(160
661
) -
- (7
398
420
) (1
0 60
1 01
5)
9 71
7 80
3
A
t 31
Mar
ch 2
018
275
699
119
4 17
6 70
5 97
8 21
5 -
- 46
782
303
3
984
689
331
621
031
Unr
ealis
ed
Pr
ovis
ions
Un
real
ised
fair
valu
e
fo
r oth
er
Dou
btfu
l
actu
aria
l
ad
just
men
ts o
n
em
ploy
ee
debt
valu
atio
n
Def
erre
d de
rivat
ive
finan
cial
D
efer
red
tax
asse
ts
bene
fits
allo
wan
ce
Tax
loss
es
loss
es
Fina
nce
leas
es
Rev
enue
in
stru
men
ts
Tota
l
E
E E
E E
E E
E
A
t 1 A
pril
2016
(9
664
861
) (1
7 00
5 16
1)
(27
953
061)
-
- (7
182
653
) (7
710
973
) (6
9 51
6 70
9)
Cha
rge
to p
rofit
or l
oss
(202
646
) (2
167
786
) 1
410
707
(959
756
) -
(1 1
22 7
12)
(12
083
208)
(1
5 12
5 40
1)
A
t 31
Mar
ch 2
017
(9 8
67 5
07)
(19
172
947)
(2
6 54
2 35
4)
(959
756
) -
(8 3
05 3
65)
(19
794
181)
(8
4 64
2 11
0)
(Cre
dite
d)/c
harg
ed
to
pro
fit o
r los
s 1
843
371
4 76
7 75
1 26
542
354
74
7 77
0 (1
964
583
) (1
874
172
) 12
638
561
42
701
052
A
t 31
Mar
ch 2
018
(8 0
24 1
36)
(14
405
196)
-
(211
986
) (1
964
583
) (1
0 17
9 53
7)
(7 1
55 6
20)
(41
941
058)
D
efer
red
inco
me
tax
asse
ts a
re re
cogn
ised
for t
ax lo
ss c
arry
-forw
ards
to th
e ex
tent
that
the
real
isat
ion
of th
e re
late
d ta
x be
nefit
thro
ugh
the
futu
re ta
xabl
e pr
ofits
is
pro
babl
e. T
he e
ntity
has
rec
ogni
sed
a de
ferr
ed ta
x as
set f
or a
ccum
ulat
ed a
sses
sed
loss
es o
f EN
il (2
017:
E93
mill
ion)
incu
rred
as
at th
e en
d of
the
year
. The
co
mpa
ny h
as a
n un
reco
gnis
ed d
efer
red
tax
asse
t on
an a
sses
sed
loss
of E
430
mill
ion
(201
7: E
430
mill
ion)
, for
whi
ch th
e ta
x ou
tcom
e is
unc
erta
in a
s it
is u
nder
co
nten
tion
with
the
tax
auth
oriti
es. T
his
wou
ld h
ave
resu
lted
in th
e re
cogn
ition
of a
def
erre
d ta
x as
set o
f E11
8 m
illio
n (2
017:
E11
8 m
illio
n).
Th
e C
ompa
ny h
as re
cogn
ised
def
erre
d ta
x on
the
unre
mitt
ed e
arni
ngs
of th
e jo
int v
entu
re c
ompa
ny (n
ote
13) b
ecau
se th
ere
is a
20%
with
hold
ing
tax
paya
ble
whe
n th
ese
earn
ings
are
dis
tribu
ted
by th
e jo
int v
entu
re c
ompa
ny.

Notes to the Financial Statements - continuedfor the year ended 31 March 2018
FINANCIAL STATEMENTS | NOTES TO THE FINANCIAL STATEMENTS
ESWATINI ELECTRICITY COMPANY | ANNUAL REPORT 2017/18
128
2018 2017 E E 21 Provisions for other employee benefits Leave pay provision (21.1) 6 717 431 6 867 812 Performance bonus provision (21.2) 20 000 000 17 500 000 Long term service awards provision (21.3) 1 316 806 1 258 386 Provision for staff training (21.4) 1 144 438 5 531 369
29 178 675 31 157 567 21.1 Leave pay provision
The leave pay provision relates to vested leave pay to which employees are entitled. The provision arises as employees render services that increase their entitlement to future compensated leave. The provision is utilised when employees, who are entitled to leave pay, leave the employment of the Company or when accrued entitlement is utilised, by taking day(s) off.
Opening balance 6 867 812 6 026 556 Provisions used/paid (455 708) (330 508) Current year provision 305 327 1 171 764
Closing balance 6 717 431 6 867 812
21.2 Performance bonus provision
The bonus provision consists of performance-based bonuses, which are determined with reference to the overall
company performance with regard to a set of pre-determined key measures. Bonuses are payable annually. Note 38 provides further details on the prior periods bonus provision raised of E16 million.
Opening balance 1 7 500 000 16 000 000 Provisions used (17 746 103) - Prior year under provision/(unused amounts reversed) 246 103 (16 000 000) Current year provision 20 000 000 17 500 000
Closing balance 20 000 000 17 500 000
21.3 Long term service awards provision
Provision is made for payments in accordance with the entity’s policy on long term service awards. The long term
service awards provision consists of one month basic salary or a portion thereof, which is determined by reference to the number of years of service. The cash flow is expected to occur within the next 12 months from year end.
Opening balance 1 258 386 944 238 Provisions used (1 265 737) (1 009 988) Prior year under provision 7 351 65 750 Current year provision 1 316 806 1 258 386
Closing balance 1 316 806 1 258 386

FINANCIAL STATEMENTS | NOTES TO THE FINANCIAL STATEMENTS
ESWATINI ELECTRICITY COMPANY | ANNUAL REPORT 2017/18
129
Notes to the Financial Statements - continuedfor the year ended 31 March 2018
2018 2017 E E 21 Provisions for other employee benefits (continued) 21.5 Provision for staff training
Opening balance 5 531 369 12 174 155 Interest subsidy usage/provision used to date (5 428 260) (8 010 735) Interest subsidy provision raised for the year 1 041 329 1 367 949
1 144 438 5 531 369
This is a provision to record the loan interest subsidy received but not spent from the European Investments Bank (EIB) on the interest rate of 5.57% applicable to the Euro 10 million loan acquired for the 400 KV Integration Project. In terms of the agreement the difference of 2.5% between the interests calculate and paid of 3% and interest charged of 5.57 on the loan is not to be paid to EIB, but is to be used by the company for staff training and development. The prior year provision amounts are cumulative from inception of the loan whilst the utilisation relates to the 5 years from 2011 to 2015. Current year figures represent utilisation for the period from 1 April 2017 to 31 March 2018.
Notes 2018 2017
E E
22 Cash flow information
Profit before income tax 613 346 772 153 164 576
Adjustment for non-cash items and separately disclosable items:
Grant amortisation 19.1 (15 408 543) (14 714 064) Share of profits of joint venture company 12 (31 850 337) (40 273 000) Defined benefit plan expense 17 6 000 3 039 509 Depreciation 11 131 591 586 133 327 552 Amortisation 15 10 000 000 10 000 000 Fair value gains on derivative financial instruments 8 22 530 415 71 978 839 Fair value adjustment - embedded derivatives 8 9 897 229 (7 413 336) Non cash interest on EIB loan 9 7 033 386 6 763 903 Unrealised foreign exchange (losses)/gains - loans and other transactions 8 (3 309 991) (42 601 283) Finance cost on local and foreign denominated loans 9 13 332 555 14 880 770 Interest income 9 (8 914 775) (3 764 170) Interest charge – EIB dividend portion 9 10 462 000 -
758 716 297 284 389 296
Changes in working capital: (82 068 719) 41 276 120 Change in trade and other receivables (33 443 996) (28 870 530) Change in inventories 24 171 140 (38 933 138) Change in provisions for other employee benefits (1 978 892) (3 987 382) Change in deferred revenue (11 817 042) 3 065 023 Change in trade and other payables (58 999 929) 110 002 147
Cash generated by operations 676 647 578 325 665 416

Notes to the Financial Statements - continuedfor the year ended 31 March 2018
FINANCIAL STATEMENTS | NOTES TO THE FINANCIAL STATEMENTS
ESWATINI ELECTRICITY COMPANY | ANNUAL REPORT 2017/18
130
2018 E 22 Cash flow information (continued) 22.1 Reconciliation of cash flows arising from financing activities related to borrowings
Borrowings at the beginning of the year 302 302 551 - Current 41 126 570 - Non-current 261 175 981 Cash flows (33 604 106) - Proceeds from borrowings 8 556 462 - Interest on borrowings (excluding overdrafts) (12 097 668) - Repayment of borrowings (30 062 900) Effects of changes in foreign exchange rates (14 489 780) Interest accrued 29 606 365 Borrowings at the end of the year 283 815 030
- Current 42 288 350 - Non-current 241 526 680
23 Financial risk management
The company’s activities expose it to a variety of financial risks including credit risk, liquidity risk and market risk. The company’s overall risk management programme focuses on the unpredictability of financial markets and seeks to minimise potential adverse effects on the financial performance of the company. The company uses derivative financial instruments to hedge certain risk exposures.
Risk management is carried out by management under policies approved by the Board of Directors. Management identifies, evaluates and hedges financial risks in close co-operation with the Company operating units. The Board provides written principles for overall risk management, as well as written policies covering specific areas such as interest rate risk, credit risk and investing excess liquidity.
Risk Exposure arising from Measurement Management Market risk – foreign exchange
Future commercial transactions Recognised financial assets and liabilities not denominated in Emalangeni
Cash flow forecasting Sensitivity analysis
Cross currency swaps
Market risk – interest rate
Long-term borrowings at variable rates
Sensitivity analysis Interest rate swaps
Market risk – security prices
Investments in equity securities Sensitivity analysis Portfolio diversion
Credit risk Cash and cash equivalents, trade receivables, derivative financial instruments
Aging analysis Credit ratings
Diversification of bank deposits, credit limits and letters of credit Investment guidelines for excess liquidity
Liquidityt risk Borrowings and other liabilities Rolling cash flow forecasts
Availability of committed credit lines and borrowings facilities

FINANCIAL STATEMENTS | NOTES TO THE FINANCIAL STATEMENTS
ESWATINI ELECTRICITY COMPANY | ANNUAL REPORT 2017/18
131
Notes to the Financial Statements - continuedfor the year ended 31 March 2018
23 Financial risk management (continued)
(a) Market risk
(i) Foreign exchange risk Foreign exchange risk is the risk that the value of financial instrument will fluctuate as a result of changes in foreign
exchange rates.
ExposureThe Company is exposed to foreign exchange risk arising from various currency exposures, primarily with the Euro. Foreign
exchange risk arises when from future long term repayments recognised as liabilities.
To manage the foreign currency exchange risk exposure arising from foreign denominated long term loans the Company
uses cross currency swaps.
A change of +/-10% in exchange rates at the reporting date would have increased/(decreased) profit or loss and foreign
borrowings by the amounts shown below:
Sensitivity analysis:
Borrowings 2018
E E Equity Profit or loss
Increase in exchange rate by 10% (4 402 452) (4 402 452)
Decrease in exchange rate by 10% 4 402 452 4 402 452
Borrowings 2017
Equity Profit or loss
Increase in exchange rate by 10% (5 710 751) (5 710 751)
Decrease in exchange rate by 10% 5 710 751 5 710 751
The company conducts business transactions in three major currencies: being the South African Rand, Euro and US dollar.
This by implication means that there is an exposure to currency risk arising from adverse movements in foreign exchange
rates.

Notes to the Financial Statements - continuedfor the year ended 31 March 2018
FINANCIAL STATEMENTS | NOTES TO THE FINANCIAL STATEMENTS
ESWATINI ELECTRICITY COMPANY | ANNUAL REPORT 2017/18
132
23
Fina
ncia
l ris
k m
anag
emen
t (co
ntin
ued)
(a)
Mar
ket r
isk
(con
tinue
d)
(i)
Fore
ign
exch
ange
risk
(con
tinue
d)
The
effe
ct o
f exc
hang
e ra
te fl
uctu
atio
ns o
n th
e co
mpa
ny’s
pro
fit o
r los
s is
ana
lyse
d as
follo
ws:
Eff
ect o
f 7%
Bor
row
ings
201
8
Bal
ance
in
Rat
e at
Eff
ect o
f 12%
de
crea
se in
fore
ign
year
S
ZL
incr
ease
in
the
profi
t
cu
rren
cy
end
+12%
-7
%
Equ
ival
ent
profi
t or
loss
pr
ofit o
r lo
ss
Eur
o
E
E
Eur
o
Eur
opea
n In
vest
men
t Ban
k-E
urop
ean
Inve
stm
ent B
ank
– 40
0kV
Inte
grat
ion
Pro
ject
Loa
n 2
152
000
14.5
087
16.2
497
13.4
931
31 2
22 7
22
3 7
46 7
27
(2 1
85 5
90)
Eur
opea
n In
vest
men
t Ban
k –
400k
V In
tegr
atio
n P
roje
ct
Loan
(Pha
se 1
) 88
2 35
3 14
.508
7 16
.249
7 13
.493
1 12
801
794
1
536
215
(8
96 1
26)
Eur
opea
n In
vest
men
t Ban
k-M
otra
co P
roje
ct lo
an
8 61
2 68
1 14
.508
7 16
.249
7 13
.493
1 12
4 95
8 81
0 1
4 99
5 05
7
(8 7
47 1
16)
11 6
47 0
34
16
8 98
3 32
6 20
277
999
(1
1 82
8 83
2)
Effe
ct o
f 7%
Bor
row
ings
201
7
Bal
ance
in
Rat
e at
Effe
ct o
f 12%
de
crea
se in
fore
ign
year
S
ZL
incr
ease
in
the
profi
t
cu
rren
cy
end
+12%
-7
%
Equ
ival
ent
profi
t or l
oss
profi
t or l
oss
E
uro
E
E
Eur
o
Eur
opea
n In
vest
men
t Ban
k –
400k
V In
tegr
atio
n P
roje
ct L
oan
2 82
7 00
0 14
.264
5 15
.976
2 13
.266
0 40
325
742
4
838
975
(2 8
22 7
60)
Eur
opea
n In
vest
men
t Ban
k –
400k
V In
tegr
atio
n P
roje
ct
Loan
(Pha
se 1
) 1
176
471
14.2
645
15.9
762
13.2
660
16 7
81 7
65
2 01
3 77
1 (1
174
701
)E
urop
ean
Inve
stm
ent B
ank
– M
otra
co P
roje
ct lo
an
8 15
0 07
1 14
.264
5 15
.976
2 13
.266
0 11
6 25
6 68
4 13
950
480
(8
137
842
)
12 1
53 5
42
17
3 36
4 19
1 20
803
226
(1
2 13
5 30
3)
Amou
nts
reco
gnis
ed in
pro
fit o
r los
sA
mou
nts
reco
gnis
ed in
pro
fit o
r los
s in
rela
tion
to e
xcha
nge
rate
s flu
ctua
tions
are
dis
clos
ed in
not
e 9.

FINANCIAL STATEMENTS | NOTES TO THE FINANCIAL STATEMENTS
ESWATINI ELECTRICITY COMPANY | ANNUAL REPORT 2017/18
133
Notes to the Financial Statements - continuedfor the year ended 31 March 2018
23 Financial risk management (continued)
(a) Market risk (continued)
(i) Foreign exchange risk (continued)
The table below shows the sensitivity analysis of the value of the Motraco EIB loan embedded derivative (refer to note 23(d)) due to the change in the value of Motraco which is the key input to the valuation of the embedded derivative. The other input variables are assumed to be constant.
The effect of exchange rate fluctuations on the Company’s profit or loss is analysed as follows:
Investment in Motraco 2018
Effect of 14% Effect of 8% Balance increase on decrease on in foreign Rate at SZL the profit the profit currency year end +14% -8% equivalent or loss or lossUSD USD E E Investment in Motraco 27 499 915 11.7885 13.4389 10.8454 324 182 748 45 385 585 (25 934 620)
27 499 915 324 182 748 45 385 585 (25 934 620)
Investment in Motraco 2017
Effect of 14% Effect of 8% Balance increase on decrease on in foreign Rate at SZL the profit the profit currency year end +14% -8% equivalent or loss or lossUSD USD E E Investment in Motraco 27 051 662 13.3513 15.2205 12.2832 361 174 851 50 564 970 (28 893 876)
27 051 662 361 174 851 50 564 970 (28 893 876)
Amounts recognised in profit or lossAmounts recognised in profit or loss in relation to exchange rates fluctuations are disclosed in note 9.
The table below shows the sensitivity analysis of the value of the cross-currency swap/sinking fund transaction (refer to note 23(d)) due to the change in the underlying foreign exchange rates as at year-end. For Transaction 1, the sensitivity is presented based on a change in the USD/EUR exchange rate, and for Transaction 2, the sensitivity is presented based on a change in the USD/ZAR exchange rate.
The effect of exchange rate fluctuations on the Company’s profit or loss is analysed as follows:
Derivatives 2018
Effect of 10% Effect of 10% Balance increase on decrease on in foreign 10% 10% on the profit the profit currency increase decrease or loss or lossEUR EUR EUR EUR E E Sinking fund – Transaction 1 6 566 301 6 784 668 6 324 782 13 057 895 (12 725 402)Sinking fund – Transaction 2 7 849 651 7 138 131 8 629 881 33 385 (1 204 959)
14 415 952 13 091 280 (13 930 361)
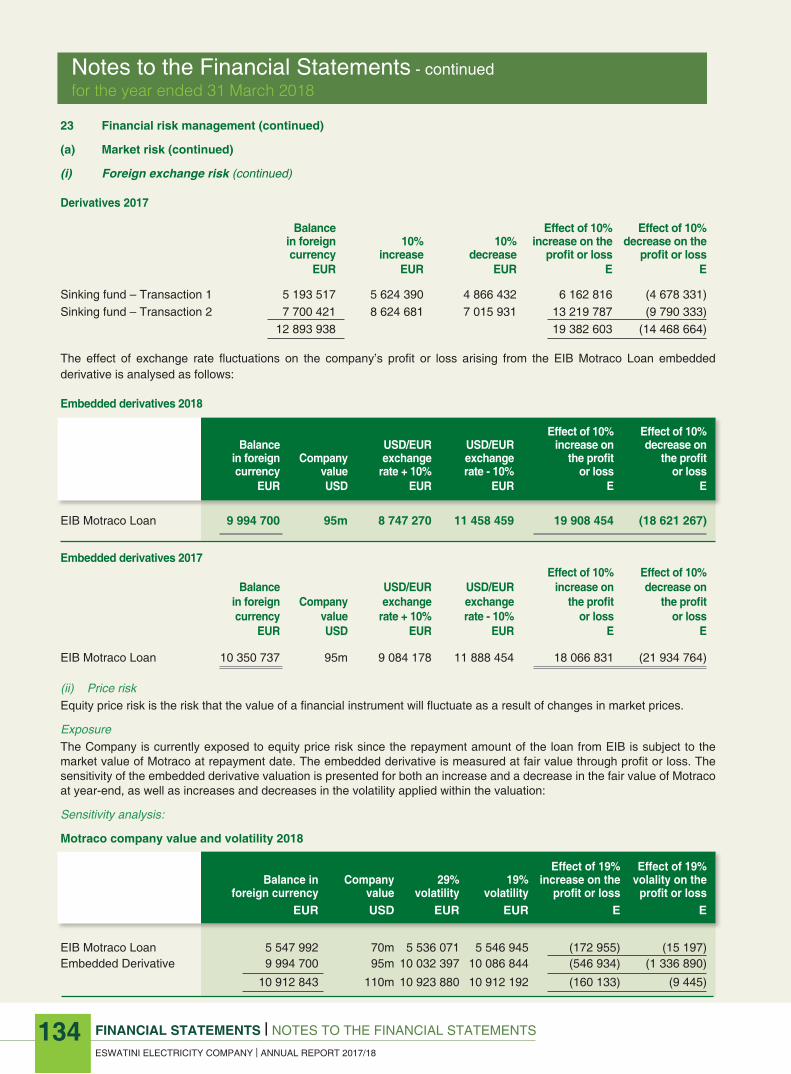
Notes to the Financial Statements - continuedfor the year ended 31 March 2018
FINANCIAL STATEMENTS | NOTES TO THE FINANCIAL STATEMENTS
ESWATINI ELECTRICITY COMPANY | ANNUAL REPORT 2017/18
134
23 Financial risk management (continued)
(a) Market risk (continued)
(i) Foreign exchange risk (continued)
Derivatives 2017 Balance Effect of 10% Effect of 10% in foreign 10% 10% increase on the decrease on the currency increase decrease profit or loss profit or loss EUR EUR EUR E E
Sinking fund – Transaction 1 5 193 517 5 624 390 4 866 432 6 162 816 (4 678 331)Sinking fund – Transaction 2 7 700 421 8 624 681 7 015 931 13 219 787 (9 790 333) 12 893 938 19 382 603 (14 468 664)
The effect of exchange rate fluctuations on the company’s profit or loss arising from the EIB Motraco Loan embedded derivative is analysed as follows:
Embedded derivatives 2018
Effect of 10% Effect of 10% Balance USD/EUR USD/EUR increase on decrease on in foreign Company exchange exchange the profit the profit currency value rate + 10% rate - 10% or loss or loss EUR USD EUR EUR E E
EIB Motraco Loan 9 994 700 95m 8 747 270 11 458 459 19 908 454 (18 621 267)
Embedded derivatives 2017 Effect of 10% Effect of 10% Balance USD/EUR USD/EUR increase on decrease on in foreign Company exchange exchange the profit the profit currency value rate + 10% rate - 10% or loss or loss EUR USD EUR EUR E E
EIB Motraco Loan 10 350 737 95m 9 084 178 11 888 454 18 066 831 (21 934 764)
(ii) Price riskEquity price risk is the risk that the value of a financial instrument will fluctuate as a result of changes in market prices.
ExposureThe Company is currently exposed to equity price risk since the repayment amount of the loan from EIB is subject to the market value of Motraco at repayment date. The embedded derivative is measured at fair value through profit or loss. The sensitivity of the embedded derivative valuation is presented for both an increase and a decrease in the fair value of Motraco at year-end, as well as increases and decreases in the volatility applied within the valuation:
Sensitivity analysis:
Motraco company value and volatility 2018
Effect of 19% Effect of 19% Balance in Company 29% 19% increase on the volality on the foreign currency value volatility volatility profit or loss profit or loss EUR EUR USD EUR EUR E E
EIB Motraco Loan 5 547 992 70m 5 536 071 5 546 945 (172 955) (15 197) Embedded Derivative 9 994 700 95m 10 032 397 10 086 844 (546 934) (1 336 890)
10 912 843 110m 10 923 880 10 912 192 (160 133) (9 445)
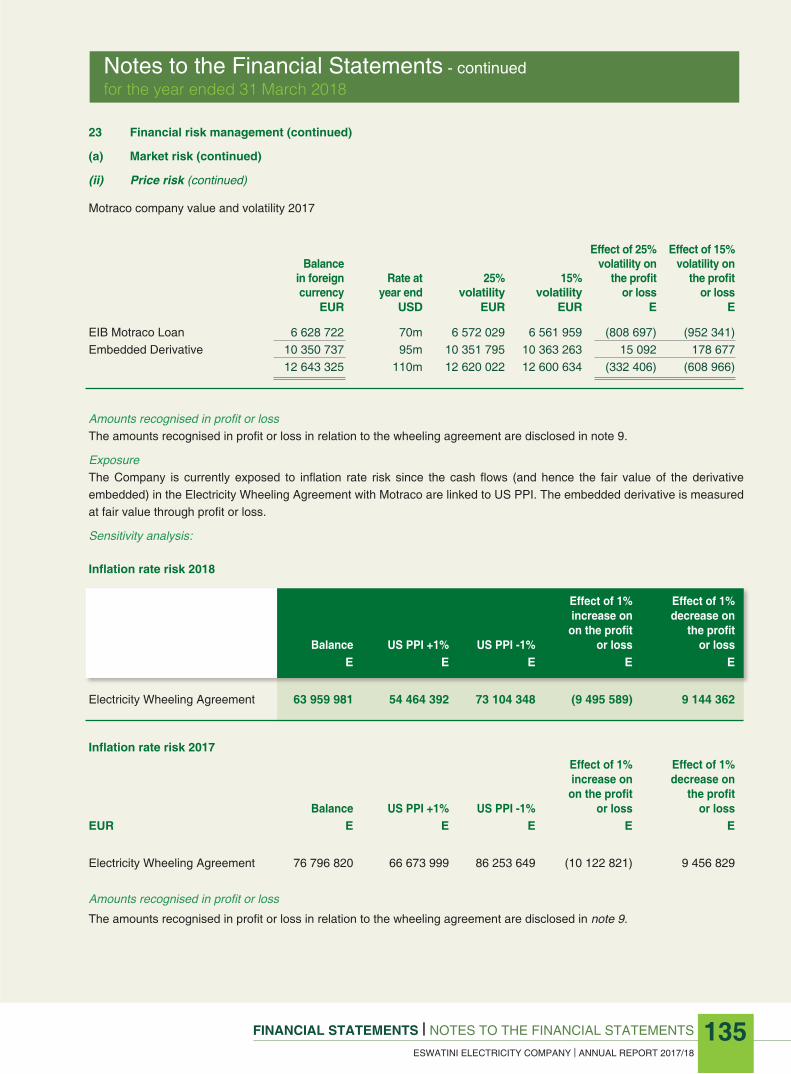
FINANCIAL STATEMENTS | NOTES TO THE FINANCIAL STATEMENTS
ESWATINI ELECTRICITY COMPANY | ANNUAL REPORT 2017/18
135
Notes to the Financial Statements - continuedfor the year ended 31 March 2018
23 Financial risk management (continued)
(a) Market risk (continued)
(ii) Price risk (continued)
Motraco company value and volatility 2017
Effect of 25% Effect of 15% Balance volatility on volatility on in foreign Rate at 25% 15% the profit the profit currency year end volatility volatility or loss or loss EUR USD EUR EUR E E EIB Motraco Loan 6 628 722 70m 6 572 029 6 561 959 (808 697) (952 341)Embedded Derivative 10 350 737 95m 10 351 795 10 363 263 15 092 178 677 12 643 325 110m 12 620 022 12 600 634 (332 406) (608 966)
Amounts recognised in profit or lossThe amounts recognised in profit or loss in relation to the wheeling agreement are disclosed in note 9.
ExposureThe Company is currently exposed to inflation rate risk since the cash flows (and hence the fair value of the derivative embedded) in the Electricity Wheeling Agreement with Motraco are linked to US PPI. The embedded derivative is measured at fair value through profit or loss.
Sensitivity analysis:
Inflation rate risk 2018
Effect of 1% Effect of 1% increase on decrease on on the profit the profit Balance US PPI +1% US PPI -1% or loss or lossEUR E E E E E
Electricity Wheeling Agreement 63 959 981 54 464 392 73 104 348 (9 495 589) 9 144 362
Inflation rate risk 2017 Effect of 1% Effect of 1% increase on decrease on on the profit the profit Balance US PPI +1% US PPI -1% or loss or lossEUR E E E E E
Electricity Wheeling Agreement 76 796 820 66 673 999 86 253 649 (10 122 821) 9 456 829
Amounts recognised in profit or lossThe amounts recognised in profit or loss in relation to the wheeling agreement are disclosed in note 9.

Notes to the Financial Statements - continuedfor the year ended 31 March 2018
FINANCIAL STATEMENTS | NOTES TO THE FINANCIAL STATEMENTS
ESWATINI ELECTRICITY COMPANY | ANNUAL REPORT 2017/18
136
23 Financial risk management (continued)
(a) Market risk (continued)
(iii) Cash flow and fair value interest rate risk
Cash flow and interest rate risk is the risk that the value and cash flow of a financial instrument will fluctuate due to changes
in market interest rates.
ExposureAs the Company has significant interest-bearing assets and liabilities, as some of the Company’s income and operating cash flows are dependent of changes in the market interest rates and this has an impact on the company’s profits. The Company has swaps in place to hedge against fluctuating interest rates on borrowings.
The Company’s interest rate risk arises from long-term borrowings. Borrowings issued at variable rates expose the Company to cash flow interest rate risk. Borrowings and long-term loans issued at fixed rates expose the Company to fair value interest rate risk. Currently there are loans issued at fixed interest rate and as such the Company is exposed to both fair value and cash flow interest rate risk.
During 2018 and 2017, the Company’s borrowings at variable rates were denominated in the Kingdom of Eswatini Lilangeni
and Euros.
The table below gives an indication of the Company’s monetary sensitivity to changes in interest rates.
2018 Cash at bank Borrowings Other Assets E E E
Base amounts 314 143 180 283 815 030 27 788 133Interest plus 1% 317 284 612 286 653 180 27 510 252Interest less 1% 311 001 748 280 976 880 28 066 014 2017 Cash at bank Borrowings Other Assets E E E
Base amounts 36 696 801 302 289 242 4 810 441Interest plus 1% 37 063 769 305 312 134 4 858 545Interest less 1% 36 329 833 299 266 350 4 762 337
Instruments used by the companyThe company has a number of borrowings from finance providers. See below for more information on the significant borrowings by the company, and the terms and interest rates charged on them:
(A) European Investment Bank – Motraco Project LoanOn 15 July 1999, the Company signed an €8 200 000 loan agreement with the European Investment Bank (EIB). The purpose of this loan was to enable the Company to finance a significant part of its investment in the shares of Companhia de Transmissão de Moçambique, S.A.R.L. (Motraco). Motraco is a joint venture between Electricidade de Moçambique (EDM), Eswatini Electricity Company (EEC) and Eskom of South Africa.
This loan does not have a fixed interest rate. However, in terms of article 3.01 of the agreement the company is required to pay 50% of any dividends received from the investment in Motraco to the EIB. This loan contains an embedded derivative (note 23(d)(E)).
The loan amount payable on 10 June 2019 is €9 200 000.The Company is charging the interest to profit or loss on an annual basis and crediting it to the loan. In the current year, E10.5 million (2017: E13.4 million). See note 8 for disclosure of amounts recognised in profit or loss.

FINANCIAL STATEMENTS | NOTES TO THE FINANCIAL STATEMENTS
ESWATINI ELECTRICITY COMPANY | ANNUAL REPORT 2017/18
137
Notes to the Financial Statements - continuedfor the year ended 31 March 2018
23 Financial risk management (continued)
(a) Market risk (continued)
(B) European Investment Bank – 400kV Integration Project Loan
The original loan amount was €10 000 000, and the term of the loan is 20 years. Final redemption of this loan is on 15 October 2020.
The agreement states that the interest rate should be the greater of 3% and a rate determined by subtracting the 3.06% interest rate subsidy from the standard rate of interest applicable at the date the loan was issued. Consequently, interest is accrued on the loan at an effective interest rate of 5.57%.
An embedded interest rate floor existed in the loan which was required to be separately accounted for. See part on derivative below (note 23 (d)(E)).
(C) European Investment Bank – 400KV Integration Project Loan Phase 1
The amount received for this loan was €5 000 000. The term of the loan is 17 years commencing on 02 July 2001. Final redemption of this loan is on 16 November 2020.
Interest is at a rate of 3% per annum, fixed.
(D) Swazi Bank Capital Projects Loan
The loan amount was E80 000 000. The term of the loan is 7 years. The final redemption date is 30 November 2020.
Interest which is at a rate of prime minus 1% per annum, and is payable quarterly.
(E) Development Bank of Southern Africa (DBSA) Loan
The amount received for this loan was E13 225 135. The term of the loan is 20 years commencing from 05 March 2003 with a two years grace period.
Interest which is at a rate of 6 months ZAR-JIBAR-SAFEX plus 135 basis points for the risk margin. The Company has an option to convert the rate from the floating rate to fixed rate of interest. The fixed rate of interest is determined at the DBSA base rate plus 135 basis points. The DBSA base rate is market related rate.
(F) The Public Service Pension Fund loan
This loan was secured for the purposes of funding capital projects which will promote and facilitate economic growth and development in Eswatini.
The loan bears interest at a floating rate; at the prime rate then prevailing from time to time minus 2.8% per annum; such said floating rate being subject to a fixed interest range with a floor of 8% per annum and a cap of 12% per annum. The loan is repayable in 10 equal instalments of E15 million starting 31 December 2011.
This loan contains an embedded derivative (note 23 (d)).
Amounts recognised in profit or loss
See note 9 for interest expense recognised in profit or loss in relation to the above mentioned loans.

FINANCIAL STATEMENTS | NOTES TO THE FINANCIAL STATEMENTS
ESWATINI ELECTRICITY COMPANY | ANNUAL REPORT 2017/18
138
Notes to the Financial Statements - continuedfor the year ended 31 March 2018
23 Financial risk management (continued)
(a) Market risk (continued)
(iii) Cash flow and fair value interest rate risk
Sensitivity analysisProfit or loss is sensitive to higher/lower interest income from borrowings as a result of changes in interest rates. See below
the impact of the changes in rates on variable rate loans.
Decrease/(increase) of interest expense
2018 2017 E E
Increase rates – 50 basis points (482 238) (586 752)Decrease rates – 50 basis points 482 238 586 752
Sensitivity to changes in interest rates on cash and cash equivalents and other assets sensitive to interest rates is as follows:
Decrease/(increase) of interest income
2018 2017 E E
Increase rates – 50 basis points 1 709 657 (209 208)Decrease rates – 50 basis points (1 709 657) 209 208
(b) Credit risk
Credit risk is the risk that a counterparty to a financial instrument will fail to discharge an obligation and cause the Company to incur a financial loss.
ExposureThe Company has exposure to credit risk, which is the risk that a counterparty will be unable to pay amounts in full when due. Key areas where the Company is exposed to credit risk are:
- Trade and other receivables- Derivative financial instruments- Cash and cash equivalents- Deposits with banks and other financial institutions.
The Company structures the levels of credit risk it accepts by placing limits on its exposure to a single counterparty, or Company’s counterparties. Such risks are subject to an annual or more frequent review.
The major concentration of credit risk arises from the Company’s receivables and investment securities in relation to the nature of customers and issuers. No collateral is required in respect of financial assets. Reputable financial institutions are used for investing and cash handling purposes.
Quality control and risk department makes regular reviews to assess the degree of compliance with the Company procedures on credit and the overall control environment.
The maximum exposure to credit risk is represented by the carrying value of each financial asset in the statement of financial position.
To manage the credit risk on accounts receivables the company has mechanisms in place which include credit vetting procedures, robust debt collecting methods and pre-approved credit limits. As part of credit risk management the company has fully converted its domestic and small commercial customers to pre-paid credit electricity metering system.

FINANCIAL STATEMENTS | NOTES TO THE FINANCIAL STATEMENTS
ESWATINI ELECTRICITY COMPANY | ANNUAL REPORT 2017/18
139
Notes to the Financial Statements - continuedfor the year ended 31 March 2018
23 Financial risk management (continued)
(b) Credit risk (continued)
i) Credit quality of financial assets
The credit quality of financial assets that are neither past due nor impaired is assessed by reference to internal credit risk
ratings. The entity’s financial assets, according to internal credit risk ratings, are as follows:
Derivatives designated Trade Cash and as fair value and other Other cash hedging receivables assets equivalents instruments Total E E E E E
As at 31 March 2018 Counterparties without external credit ratings:- - Low Risk 119 071 343 27 788 133 314 143 180 233 429 862 694 432 518- General Credit risk 1 410 844 - - - 1 410 844- High risk 19 263 231 - - - 19 263 231
139 745 418 27 788 133 314 143 180 233 429 862 715 106 593
As at 31 March 2017 Counterparties without external credit ratings:- - Low Risk 115 095 093 4 810 441 37 031 215 216 181 704 373 118 453- General Credit Risk 35 003 058 - - - 35 003 058- High Risk 14 637 808 - - - 14 637 808
164 735 959 4 810 441 37 031 215 216 181 704 422 759 319
The credit risk rating of financial assets is based on the following:
Low risk - This category is utilised for fully performing accounts that are classified as current and a month due. All accounts for the Government of Eswatini are included in this category. All financial institutions in Eswatini regulated by the Central Bank of Eswatini are also included in this category.
General risk - This category is for all customer accounts that are 60-91 days, where a moderate risk taken, exclusive of Government of Eswatini accounts. Capital contribution debtors are part of this category.
High risk - This category is for all high risk customers and comprises all customers that are over 91 days due exclusive of Government of Eswatini accounts.

FINANCIAL STATEMENTS | NOTES TO THE FINANCIAL STATEMENTS
ESWATINI ELECTRICITY COMPANY | ANNUAL REPORT 2017/18
140
Notes to the Financial Statements - continuedfor the year ended 31 March 2018
23 Financial risk management (continued)
(b) Credit risk (continued)
ii) Impaired trade receivables Individual receivables which are known to be uncollectible are written off by reducing the carrying amount directly. The other receivables are assessed collectively to determine whether there objective evidence that an impairment has been incurred but not yet is been identified. For these receivables the estimated impairment losses are recognised in a separate provision for impairment.
The company considers that there is evidence of impairment if any of the following indicators are present:• significant financial difficulties of the debtor• probability that the debtor will enter bankruptcy or financial reorganisation, and• default or delinquency in payments (more than 30 days overdue).
As of 31 March 2018, electricity receivables of E9 833 170 (2017: E27 170 447) and other receivables E42 549 360 (2017: E42 549 360) were impaired and provided for. The individually impaired trade and other receivables were mainly relating to domestic, industrial, commercial and irrigation customers which are in unexpectedly difficult economic situations.
The ageing analysis of these trade and other receivables is as follows:
Electricity receivables Other receivables
2018 2017 2018 2017 E E E E 0 - 3 months - - - - 3 months 9 833 170 27 170 447 42 549 360 42 549 360
9 833 170 27 170 447 42 549 360 42 549 360 Impairment losses are recognised in profit or loss within administrative expenses. Subsequent recoveries of amounts previously written off are credited against administrative expenses. Movements in the provision for impairment of trade receivables that are assessed for impairment collectively are as follows:
Electricity receivables Other receivables
2018 2017 2018 2017 E E E E At 1 April 27 170 447 26 235 916 42 549 360 35 601 034 Provision for trade and other receivables impairment 2 898 042 934 531 - 6 948 326 Trade and other receivables written off during the year as uncollectible (20 235 319) - - -
At 31 March 9 833 170 27 170 447 42 549 360 42 549 360
See note 7 for disclosure on amounts recognised in the income statement relating to impairment of trade receivables.

FINANCIAL STATEMENTS | NOTES TO THE FINANCIAL STATEMENTS
ESWATINI ELECTRICITY COMPANY | ANNUAL REPORT 2017/18
141
Notes to the Financial Statements - continuedfor the year ended 31 March 2018
23 Financial risk management (continued)
(b) Credit risk (continued)
iii) Past due but not impaired receivables Electricity receivables and other receivables that are less than three months past due are not considered impaired. As of 31 March 2018, Electricity and other receivables of E8 225 593 and ENil (2017: E2 950 953 and E Nil) respectively were past due but not impaired. These relate to a number of independent clients for whom there is no recent history of default and though they delay, they eventually settle their debts. The ageing analysis of these trade and other receivables that are past due but not impaired is as follows:
Electricity receivables Other receivables
2018 2017 2018 2017 E E E E 1 - 2 months 5 063 191 2 950 953 - - 3 months 3 162 402 - - -
8 225 593 2 950 953 - - (c) Liquidity risk
Cash flow forecasting is performed by the company. The Company monitors rolling forecasts of the company’s liquidity requirements to ensure it has sufficient cash to meet operational needs while maintaining sufficient headroom on its undrawn committed borrowing facilities at all times so that the company does not breach borrowing limits or covenants (where applicable) on any of its borrowing facilities. Such forecasting takes into consideration the company’s debt financing plans, covenant compliance, compliance with internal ratio targets and, if applicable external regulatory or legal requirements.
i) Financing arrangementsThe company had access to the following undrawn borrowing facilities at the end of the reporting period:
2018 2017 E E Floating rate
Expiring within one year 60 000 000 74 000 000 Expiring beyond one year - - 60 000 000 74 000 000
See note 7 for disclosure on amounts recognised in the income statement relating to impairment of trade receivables.
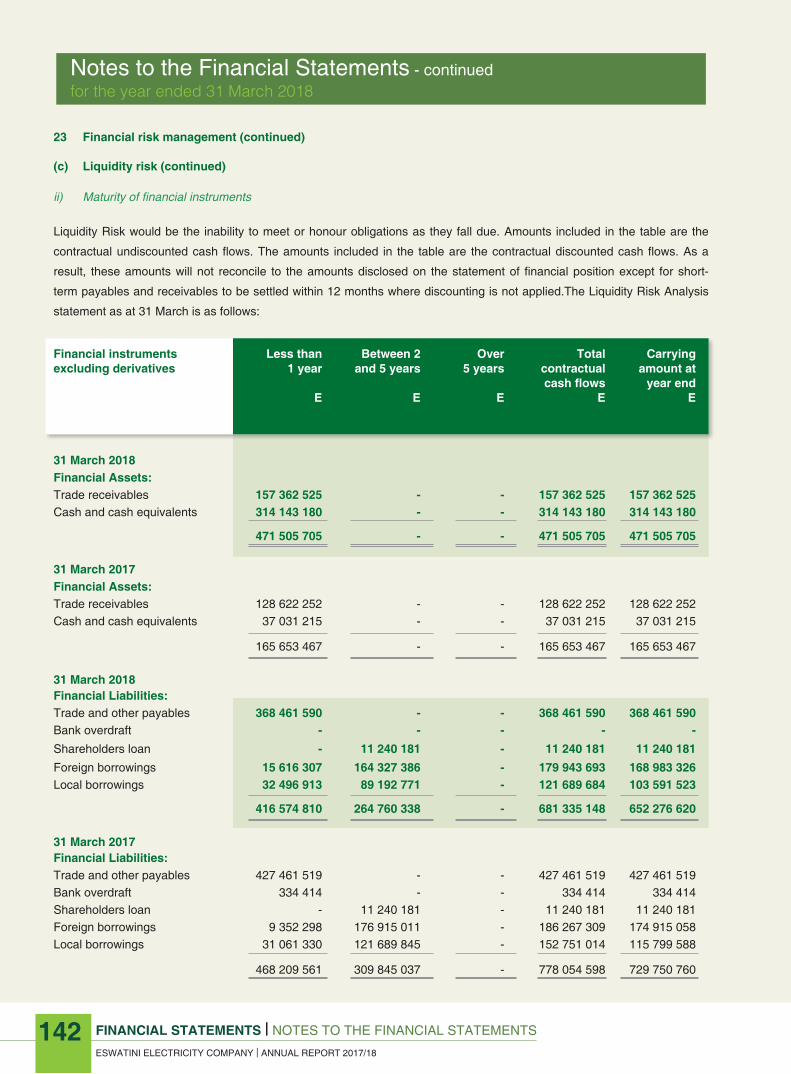
FINANCIAL STATEMENTS | NOTES TO THE FINANCIAL STATEMENTS
ESWATINI ELECTRICITY COMPANY | ANNUAL REPORT 2017/18
142
Notes to the Financial Statements - continuedfor the year ended 31 March 2018
23 Financial risk management (continued)
(c) Liquidity risk (continued)
ii) Maturity of financial instruments
Liquidity Risk would be the inability to meet or honour obligations as they fall due. Amounts included in the table are the
contractual undiscounted cash flows. The amounts included in the table are the contractual discounted cash flows. As a
result, these amounts will not reconcile to the amounts disclosed on the statement of financial position except for short-
term payables and receivables to be settled within 12 months where discounting is not applied.The Liquidity Risk Analysis
statement as at 31 March is as follows:
Financial instruments Less than Between 2 Over Total Carryingexcluding derivatives 1 year and 5 years 5 years contractual amount at cash flows year end E E E E E
31 March 2018 Financial Assets: Trade receivables 157 362 525 - - 157 362 525 157 362 525Cash and cash equivalents 314 143 180 - - 314 143 180 314 143 180 471 505 705 - - 471 505 705 471 505 705 31 March 2017 Financial Assets: Trade receivables 128 622 252 - - 128 622 252 128 622 252Cash and cash equivalents 37 031 215 - - 37 031 215 37 031 215 165 653 467 - - 165 653 467 165 653 467 31 March 2018 Financial Liabilities: Trade and other payables 368 461 590 - - 368 461 590 368 461 590Bank overdraft - - - - -Shareholders loan - 11 240 181 - 11 240 181 11 240 181Foreign borrowings 15 616 307 164 327 386 - 179 943 693 168 983 326Local borrowings 32 496 913 89 192 771 - 121 689 684 103 591 523 416 574 810 264 760 338 - 681 335 148 652 276 620 31 March 2017 Financial Liabilities: Trade and other payables 427 461 519 - - 427 461 519 427 461 519Bank overdraft 334 414 - - 334 414 334 414Shareholders loan - 11 240 181 - 11 240 181 11 240 181Foreign borrowings 9 352 298 176 915 011 - 186 267 309 174 915 058Local borrowings 31 061 330 121 689 845 - 152 751 014 115 799 588 468 209 561 309 845 037 - 778 054 598 729 750 760
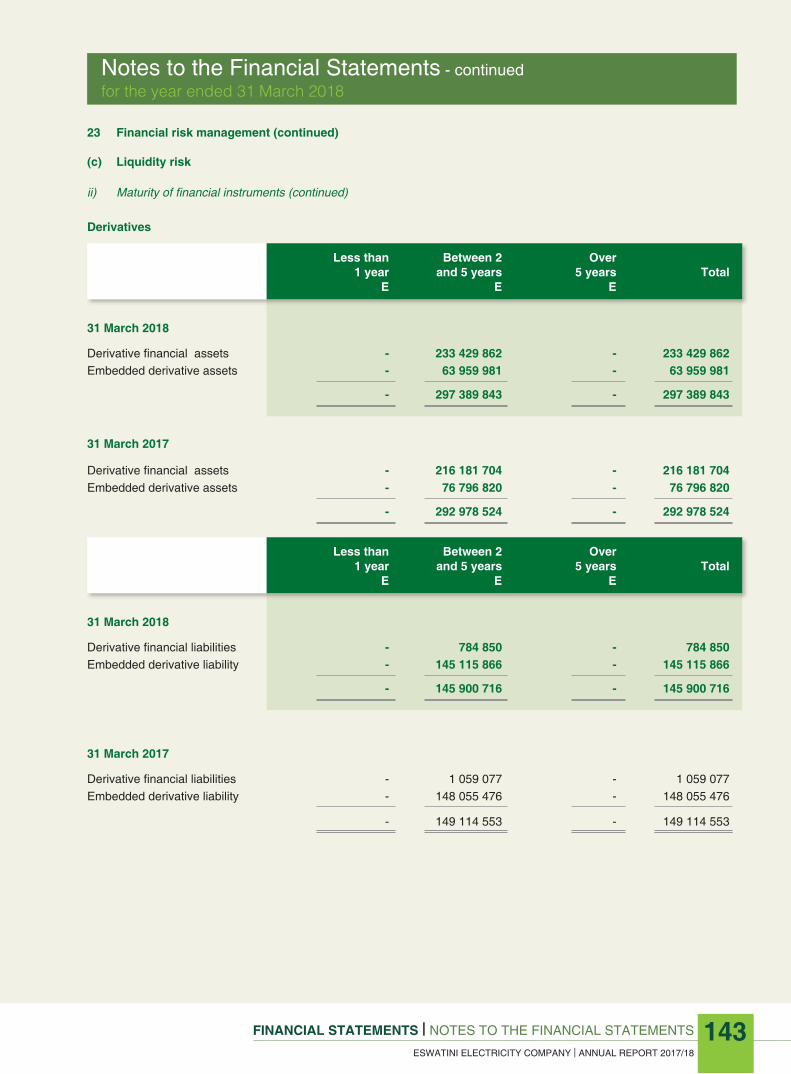
FINANCIAL STATEMENTS | NOTES TO THE FINANCIAL STATEMENTS
ESWATINI ELECTRICITY COMPANY | ANNUAL REPORT 2017/18
FINANCIAL STATEMENTS | NOTES TO THE FINANCIAL STATEMENTS
ESWATINI ELECTRICITY COMPANY | ANNUAL REPORT 2017/18
143
Notes to the Financial Statements - continuedfor the year ended 31 March 2018
23 Financial risk management (continued)
(c) Liquidity risk
ii) Maturity of financial instruments (continued)
Derivatives
Less than Between 2 Over 1 year and 5 years 5 years Total E E E 31 March 2018 Derivative financial assets - 233 429 862 - 233 429 862Embedded derivative assets - 63 959 981 - 63 959 981 - 297 389 843 - 297 389 843
31 March 2017
Derivative financial assets - 216 181 704 - 216 181 704Embedded derivative assets - 76 796 820 - 76 796 820 - 292 978 524 - 292 978 524 Less than Between 2 Over 1 year and 5 years 5 years Total E E E 31 March 2018 Derivative financial liabilities - 784 850 - 784 850Embedded derivative liability - 145 115 866 - 145 115 866 - 145 900 716 - 145 900 716
31 March 2017 Derivative financial liabilities - 1 059 077 - 1 059 077Embedded derivative liability - 148 055 476 - 148 055 476 - 149 114 553 - 149 114 553

FINANCIAL STATEMENTS | NOTES TO THE FINANCIAL STATEMENTS
ESWATINI ELECTRICITY COMPANY | ANNUAL REPORT 2017/18
144
Notes to the Financial Statements - continuedfor the year ended 31 March 2018
23 Financial risk management (continued)
(d) Derivatives
Derivatives are only used for economic hedging purposes and not as speculative investments. However, where derivatives
do not meet the hedging criteria, they are classified as ‘held for trading’ for accounting purposes below. The company has the
following derivative financial instruments:
2018 2017
E E
Non-current assets
Derivative financial instruments – foreign currency swaps (A) 24 273 139 32 256 125Investment in sinking fund (B) 209 156 723 183 925 579Embedded derivative assets (C) 63 959 981 76 796 820
297 389 843 292 978 524 Non-current liabilities
Derivative financial instruments – interest rate swaps (D) 784 850 1 059 077Embedded derivative liabilities (E) 145 115 866 148 055 476
145 900 716 149 114 553
Classification of derivativesDerivatives are classified as held for trading and accounted for at fair value through profit or loss unless they are designated as hedges. They are presented as current assets or liabilities if they are expected to be settled within 12 months after the end of the reporting period.
Fair value measurementFor information about the methods and assumptions used in determining the fair value of derivatives please refer to A, B, C, D & E below.
Changes in fair valueAll changes in fair value in derivative instruments are recorded in profit or loss. Note 8 discloses the amount of fair value gains and losses recognised for changes in fair value.
A – Derivative financial assets
At 31 March 2018, Borrowings included an amount of E44 024 516 (2017: E57 120 816) in respect of a long term loan due in foreign currency, which has been hedged using the cross currency and interest rate swap. The company has not applied hedge accounting in respect of the transactions.
The Company entered into a range of derivative instruments, foreign currency swaps and interest rate swaps, arrangement with Standard Corporate and Merchant Bank and to hedge against foreign exchange risk on its foreign currency based commitment with the European Investment Bank.
Movement in the fair value the foreign currency swap is below:
Fair value at the beginning of the year 32 256 125 55 217 952Fair value loss (note 8) (7 982 986) (22 961 827) Fair value at the end of the year 24 273 139 32 256 125

FINANCIAL STATEMENTS | NOTES TO THE FINANCIAL STATEMENTS
ESWATINI ELECTRICITY COMPANY | ANNUAL REPORT 2017/18
FINANCIAL STATEMENTS | NOTES TO THE FINANCIAL STATEMENTS
ESWATINI ELECTRICITY COMPANY | ANNUAL REPORT 2017/18
145
Notes to the Financial Statements - continuedfor the year ended 31 March 2018
23 Financial risk management (continued)
(d) Derivatives
B – Investment in sinking fund
During the year ended 31 March 2014 the company entered into a cross-currency swap agreement with First National Bank (FNB) to establish a sinking fund to finance future full and final settlements to the European Investment Bank (EIB) for a loan amount of EUR 9.2 million and an estimated additional liability of USD 13.7 million arising from the EIB loan agreement both
payable on 10 June 2019.
As part of the agreement with FNB to fund the EUR 9.2 million loan and the additional estimated liability of USD 13.7 Million the Company will also make annual payments to the sinking fund of USD 1.6 million beginning 30 June 2014 (6 equal annual instalments) and semi-annual payments of E13.652 million beginning 30 May 2014 (11 equal semi-annual instalments)
respectively. These annual payments follow an initial lump sum payment of E30 million on 31 March 2014.
The fair value is adjusted to defer the difference between the fair value at initial recognition and the transaction price. After initial recognition, the entity shall recognise the deferred difference as a gain or loss only to the extent that it arises from a change in a factor that market participants would take into account when pricing the asset or liability. The cross currency swap was taken for the European Investment bank – Motraco project loan and an additional estimated liability as a result of
the EIB loan both payable 10 June 2019.
Movement in the fair value the sinking is below:
2018 2017
E E
Fair value at the beginning of the year 183 925 579 187 023 179Government grant towards sinking fund (note 6.1) - 8 370 000Additions – cash invested 40 052 800 37 902 000Fair value loss (note 8) 14 821 656) (49 369 600) Fair value at the end of the year 209 156 723 183 925 579
C – Embedded derivative asset
On 1 September 1999, the Eswatini Electricity Company Limited (“the EEC”) entered into an Electricity Wheeling Agreement with the Motraco-Mozambique Transmission Company (“Motraco”) in connection with the wheeling of electricity by Motraco to the EEC at a new substation called Edwaleni II. The duration of the agreement is 25 years commencing from the end of the month when the Commercial Operation Date of the last asset required for the supply of wheeling services to the EEC occurs, that is, was 1 September 1999.
The prices to be charged by Motraco and to be paid by the EEC for electricity wheeled consists of fixed and variable charge for wheeling, variable charge for emergency wheeling, surcharge and reactive power rates.
The Company’s objectives when managing capital are to safeguard the Company’s ability to continue as a going concern in order to provide returns and benefits for shareholders and to maintain an optimal capital structure to reduce the cost of capital.
The annual escalation of the wheeling charges by US inflation results in a variation of cash flows over the life of the contract, since the fixed charges payable will change depending on movements in the US inflation index. This result in a shifting of the risk associated with increases in prices from Motraco to the EEC thereby resulting in an embedded derivative.

FINANCIAL STATEMENTS | NOTES TO THE FINANCIAL STATEMENTS
ESWATINI ELECTRICITY COMPANY | ANNUAL REPORT 2017/18
146
Notes to the Financial Statements - continuedfor the year ended 31 March 2018
23 Financial risk management (continued)
(d) Derivatives (continued)
C – Embedded derivative asset (continued)
The value of the embedded derivative as presented below:
2018 2017
E E
Fair value at beginning of the year 76 796 820 84 365 684Fair value loss (note 8) (12 836 839) (7 568 864) Fair value at end of the year 63 959 981 76 796 820
D – Derivative financial liabilities – interest rate swaps
At 31 March 2018, the main floating rates are at 6 months ZAR – JIBAR-SAFEX minus 135 basis points. Gains and losses are recognised in profit or loss since the swaps are used as a fair value hedge. The interest rate swap was taken for the Development Bank of Southern Africa 400kV integration project loan. The interest rate swap exchanges fixed interest cash-flows for floating rate. The nominal value of the interest rate swap is ZAR 784 850 (2017: ZAR 1 059 077) with a maturity date 15 October 2020. The company has not applied hedge accounting in respect of the transactions.
Movement in the fair value the derivative is below:
2018 2017
E E
Fair value at beginning of the year 1 059 077 1 411 665Fair value loss (note 8) (274 227) (352 588) Fair value at end of the year 784 850 1 059 077 E – Embedded derivative liabilities
Embedded Derivative liabilities Embedded derivative liability - EIB loan 209 405 147 271 448Embedded derivative liability - Public Service Pension Fund Loan 420 963 437 300Embedded derivative liability - 400 kV integration project EIB Loan 144 485 498 346 728
145 115 866 148 055 476
Embedded derivative liability – EIB motraco project loanThe value of the embedded derivative liability represents an estimate of the present value of the EIB loan cash outflows that will be dependent on the market value of Motraco when the Company settles the EIB loan on 10 June 2019. To estimate the market value of Motraco on 10 June 2019 for purposes of determining the embedded derivative, the company has applied the discounted cash flow method. Discount rates used were market related rates. The value of the embedded derivative will be reassessed at each statement of financial position date until 10 June 2019. Changes in the fair value of the embedded derivative liability are recognised in profit or loss.
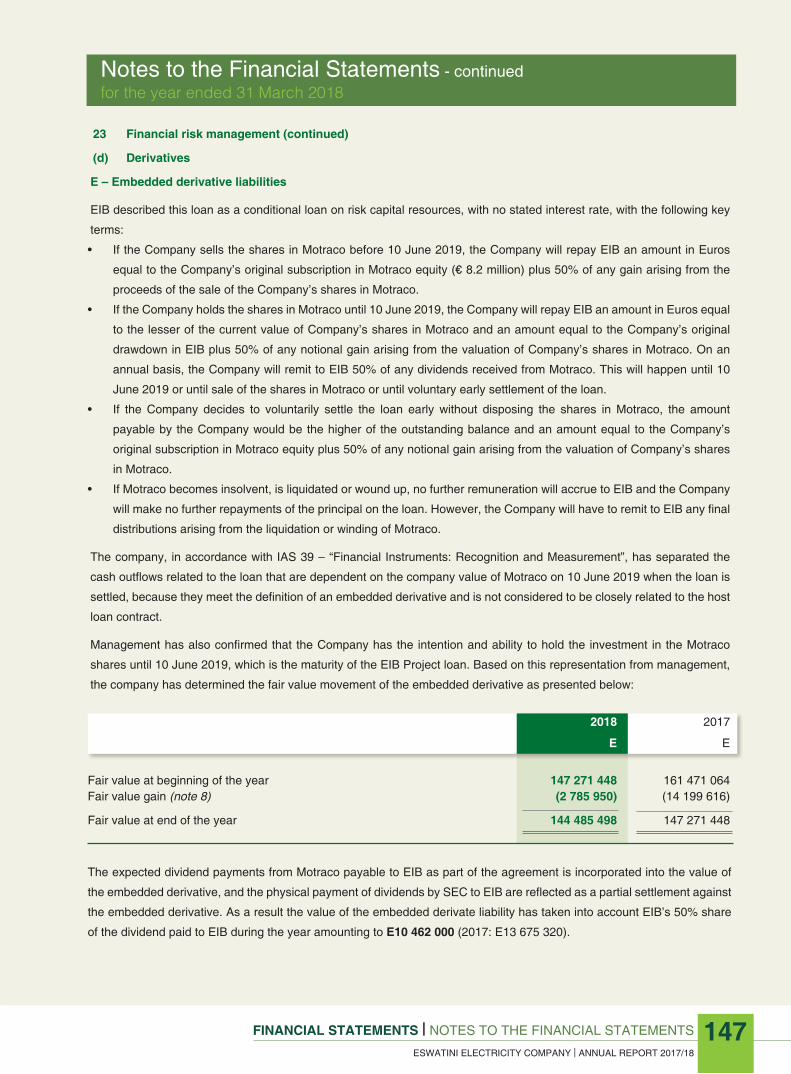
FINANCIAL STATEMENTS | NOTES TO THE FINANCIAL STATEMENTS
ESWATINI ELECTRICITY COMPANY | ANNUAL REPORT 2017/18
FINANCIAL STATEMENTS | NOTES TO THE FINANCIAL STATEMENTS
ESWATINI ELECTRICITY COMPANY | ANNUAL REPORT 2017/18
147
Notes to the Financial Statements - continuedfor the year ended 31 March 2018
23 Financial risk management (continued)
(d) Derivatives E – Embedded derivative liabilities
EIB described this loan as a conditional loan on risk capital resources, with no stated interest rate, with the following key
terms:
• If the Company sells the shares in Motraco before 10 June 2019, the Company will repay EIB an amount in Euros
equal to the Company’s original subscription in Motraco equity (€ 8.2 million) plus 50% of any gain arising from the
proceeds of the sale of the Company’s shares in Motraco.
• If the Company holds the shares in Motraco until 10 June 2019, the Company will repay EIB an amount in Euros equal
to the lesser of the current value of Company’s shares in Motraco and an amount equal to the Company’s original
drawdown in EIB plus 50% of any notional gain arising from the valuation of Company’s shares in Motraco. On an
annual basis, the Company will remit to EIB 50% of any dividends received from Motraco. This will happen until 10
June 2019 or until sale of the shares in Motraco or until voluntary early settlement of the loan.
• If the Company decides to voluntarily settle the loan early without disposing the shares in Motraco, the amount
payable by the Company would be the higher of the outstanding balance and an amount equal to the Company’s
original subscription in Motraco equity plus 50% of any notional gain arising from the valuation of Company’s shares
in Motraco.
• If Motraco becomes insolvent, is liquidated or wound up, no further remuneration will accrue to EIB and the Company
will make no further repayments of the principal on the loan. However, the Company will have to remit to EIB any final
distributions arising from the liquidation or winding of Motraco.
The company, in accordance with IAS 39 – “Financial Instruments: Recognition and Measurement”, has separated the
cash outflows related to the loan that are dependent on the company value of Motraco on 10 June 2019 when the loan is
settled, because they meet the definition of an embedded derivative and is not considered to be closely related to the host
loan contract.
Management has also confirmed that the Company has the intention and ability to hold the investment in the Motraco
shares until 10 June 2019, which is the maturity of the EIB Project loan. Based on this representation from management,
the company has determined the fair value movement of the embedded derivative as presented below:
2018 2017
E E
Fair value at beginning of the year 147 271 448 161 471 064Fair value gain (note 8) (2 785 950) (14 199 616) Fair value at end of the year 144 485 498 147 271 448
The expected dividend payments from Motraco payable to EIB as part of the agreement is incorporated into the value of
the embedded derivative, and the physical payment of dividends by SEC to EIB are reflected as a partial settlement against
the embedded derivative. As a result the value of the embedded derivate liability has taken into account EIB’s 50% share
of the dividend paid to EIB during the year amounting to E10 462 000 (2017: E13 675 320).

FINANCIAL STATEMENTS | NOTES TO THE FINANCIAL STATEMENTS
ESWATINI ELECTRICITY COMPANY | ANNUAL REPORT 2017/18
148
Notes to the Financial Statements - continuedfor the year ended 31 March 2018
23 Financial risk management (continued)
(d) Derivatives (continued)
E – Embedded derivative liabilities (continued)
Embedded derivative liability – Public Service Pension Fund LoanInterest is accrued on the loan at the rate at which the interest is payable, being at prime less 2.8% should this fall within the
range of 8% to 12%. Where the floating interest rate is outside of the collar, interest is accrued at a rate of 8% or 12% as is
applicable. On 11 September 2009, when the loan was obtained the prime interest rate was 10% and hence the applicable
floating interest rate on the PSPF loan was 7.2%. Since the applicable floating interest rate was outside of the collar range of
8% and 12% at inception, the embedded interest rate collar is considered to be in-the-money at inception thereby resulting in
an embedded derivative that is not closely related to the host loan contract.
The value of the embedded derivative as presented below:
2018 2017
E E
Fair value at beginning of the year 437 300 952 260Fair value gain (note 8) (16 337) (514 960) Fair value at end of the year 420 963 437 300
The value of the embedded derivative liability represents an estimate of the present value of the PSPF loan cash outflows that will be dependent on the prime rate. Changes in the value of the embedded derivative liability are recognised in profit or loss.
Embedded derivative liability - 400 kV integration project EIB LoanThe loan was granted in accordance with the provisions of the Second Financial Protocol to the Fourth APC-EC Convention of Lome. The Finance Contract specifies that interest on the loan is payable at a rate that is the greater of:• 3% per annum; or• the standard interest rate applicable at the date the loan was issued less an interest rate subsidy of 3.06%. At the time of
draw down on the loan, the standard interest rate was 5.57%. After having deducted the subsidy of 3.06%, this resulted in interest being payable at a rate of 2.51%.
The interest rate floor embedded in the funding agreement ensures that the interest rate that will ultimately be fixed on draw down of the loan (determined as the EIB standard rate less 3.06%) does not fall below 3%. In situations where the EIB standard interest rate decreases below 6.06%, the interest rate floor will be triggered, resulting in a modification of the cash flows on the loan compared to those that would have been payable had the interest rate been fixed based on the EIB standard interest rate thereby resulting in an embedded derivative.
2018 2017
E E
Fair value at beginning of the year 346 728 614 352Fair value loss (note 8) (137 323) (267 624) Fair value at end of the year 209 405 346 728 The value of the embedded derivative liability represents an estimate of the present value of the EIB loan cash outflows that will be dependent on the changes in the interest rate payable on the loan.

FINANCIAL STATEMENTS | NOTES TO THE FINANCIAL STATEMENTS
ESWATINI ELECTRICITY COMPANY | ANNUAL REPORT 2017/18
FINANCIAL STATEMENTS | NOTES TO THE FINANCIAL STATEMENTS
ESWATINI ELECTRICITY COMPANY | ANNUAL REPORT 2017/18
149
Notes to the Financial Statements - continuedfor the year ended 31 March 2018
24 Capital management
The company’s objectives when managing capital are to:• safeguard their ability to continue as a going concern, so that they can continue to provide the essential service
to the kingdom to benefit all stakeholders, and
• ensure that EEC is sustainable over the long term.
The government as the sole shareholder and the board have the responsibility to ensure that the company is adequately capitalised and that the business is attractive to investors.
EEC’s funding consists of equity investments by the shareholder, funds generated from operations and funds borrowed on local and foreign debt markets with strong government support.
There were no changes to EEC’s approach to capital management during the financial year. EEC manages the following capital reserves:
Notes 2018 2017
E E
Share capital 22 433 492 841 433 492 841 Accumulated profit 1 636 283 210 1 112 250 190 Net Debt Total borrowings 283 815 030 302 302 551Less: Cash and cash equivalents (note 14.3) (314 143 180) (36 696 801) Net (holdings of cash)/ debt (30 328 150) 265 605 750
Total equity 2 155 694 662 1 664 913 512 Total capital 2 125 366 512 1 930 519 262 Gearing ratio 0% 14%
During 2018, the Company’s strategy was to maintain the gearing ratio (before interest accrual is taken into account) within
25%.
DividendsSee note 18.1 for dividends declared by the company to the shareholder.
Loan covenantsUnder the terms of the major borrowing facilities, the company is required to comply with the following financial covenants:
• The company has to maintain a ratio of at least 1:3 of its own funds to borrowings, and
• A ratio of at least 1.5:1 of its annual debt service coverage.
The company has complied with all loan covenants at the relevant measurement dates.

FINANCIAL STATEMENTS | NOTES TO THE FINANCIAL STATEMENTS
ESWATINI ELECTRICITY COMPANY | ANNUAL REPORT 2017/18
150
Notes to the Financial Statements - continuedfor the year ended 31 March 2018
2018 2017 E E 25 Commitments
25.1 Capital Commitments
Capital expenditure approved at reporting date but not yet incurred is as follows: Approved capital expenditure 144 475 027 62 556 700
This expenditure will be financed from debt and internally generated funds and is expected to be incurred and due for completion within the next three years.
Details of capital commitments are as follows:- 25.1.1 Network upgrades The Company has an approved capital expenditure budget of E144 million (2017: E62 million) to cater for routine
additions to the network during the 2017/2018 financial year, and all this capital expenditure will be financed from current resources and external borrowings.
25.2 Right of use for electricity wheeling on 400kV line The Company has committed to a fixed monthly charge of US $ 118 820 (2017: US$ 112 018) for right of use of the
400kV line. These monthly charges are being funded from internal resources. The right of use for electricity escalates annually by US inflation.
25.3 Motraco wheeling agreement In terms of an electricity wheeling agreement between Motraco and Eswatini Electricity Company, the Company
pledged shares to the value of US$ 2 million to Motraco as security that the electricity wheeling service at Edwaleni II will not discontinue. On the fourth anniversary date of Eswatini Electricity Company taking supply at Edwaleni II and every year thereafter, the amount of such secured shares shall be reduced by US$ 200 000.
25.4 Power Purchase Agreement In terms of the power purchase agreement with Ubombo Sugar Limited, (“USL”) the company paid E150 million for
an exclusive right to purchase all excess power guaranteed by USL up to 2026 at a base price agreed in 2011. This commitment will be funded from internally generated resources.

FINANCIAL STATEMENTS | NOTES TO THE FINANCIAL STATEMENTS
ESWATINI ELECTRICITY COMPANY | ANNUAL REPORT 2017/18
151
Notes to the Financial Statements - continuedfor the year ended 31 March 2018
25 Commitments (continued)
25.5 Supply of energy
Eswatini Electricity Company entered into long-term agreements with, ESKOM, a supplier for electricity purchases.
In January 2011 the company signed a Power Purchase Agreement with USL until 2026. The agreement provides
for an exclusive right to the Company to purchase excess electricity from USL. The company is obliged to take
excess electricity from USL.
26 Contingencies
2018 2017
E E
26.1 Litigations Legal cases pending with potential liability for claims were in process
against the Company at year end. The Company is disputing these claims and has indicated that it intends to defend any legal action which may be instituted. On the basis of the evidence available it appears that no obligation is present and the claims are therefore disclosed as a contingent liability.
25.3 million 18.9 million
26.2 Tax losses
Tax losses amounting to E430 million (2017: 430 million) were under dispute with the tax regulator during the
reporting period. These losses have not been used in the current year deferred tax computation. SEC envisages
that these losses will be recouped once the dispute is resolved.
27 Related party transactions
The Company is wholly owned and controlled by the Government of Eswatini, which own 100% of its shares.
The related party disclosure is required in terms of IAS 24, Related Parties Disclosures.

FINANCIAL STATEMENTS | NOTES TO THE FINANCIAL STATEMENTS
ESWATINI ELECTRICITY COMPANY | ANNUAL REPORT 2017/18
152
Notes to the Financial Statements - continuedfor the year ended 31 March 2018
27 Related party transactions (continued)
The related parties of Eswatini Electricity Company Limited consist mainly of Government departments, state-owned
enterprises, subsidiaries of Eswatini Electricity Company Limited, as well as key management personnel and members
of board of directors of Eswatini Electricity Company Limited or its shareholder and close family members of these
related parties.
In addition, related parties comprise a joint venture company, Motraco, and post-retirement benefit plans for the
benefit of employees.
The following transactions were carried out with related parties:
2018 2017
E E
27.1 Government grant funding Contributions received for drought relief - 20 000 000 Contributions received for Sinking Fund (Note 6) - 8 370 000 Contributions received for Rural Electrification Projects (Note 19.1) 31 992 448 39 024 466
31 992 448 67 394 466 27.2 Purchases of goods and services Swaziland Energy Regulatory Authority Fees 26 489 694 11 530 481 Joint venture, Motraco, wheeling charges (Note 5) 32 815 577 37 231 832 Employee pension fund gains/losses (Note 17) 584 221 3 039 509 59 889 492 51 801 822 Goods and services are bought from related parties on an arm’s length basis at market-related prices. 27.3 Year-end balances arising from transactions (i) Receivables from related parties Government Departments (Note 14.1) 28 979 834 22 800 244 The Government departments include government ministries and parastatals. Interest receivable on financial market instruments is in accordance with normal market practice. (ii) Allowance for impairment of related party receivables T here is no allowance for impairment, nor bad debts written off during the year that relates to related parties.

FINANCIAL STATEMENTS | NOTES TO THE FINANCIAL STATEMENTS
ESWATINI ELECTRICITY COMPANY | ANNUAL REPORT 2017/18
FINANCIAL STATEMENTS | NOTES TO THE FINANCIAL STATEMENTS
ESWATINI ELECTRICITY COMPANY | ANNUAL REPORT 2017/18
153
Notes to the Financial Statements - continuedfor the year ended 31 March 2018
2018 2017 E E 27 Related party transactions (continued)
27.3 Year-end balances arising from transactions (continued)
(iii) Payables to related parties:
Shareholder, including Government Departments
-PEU Management Fess 16 498 042 19 135 795
- Swaziland Energy Regulatory Authority 26 489 694 -
- Shareholders loan 11 240 181 11 240 181
Joint venture, Motraco
- Electricity wheeling charges 2 534 127 2 740 612
Employee Pension Fund (contributions) 7 784 65 146
The provision of funds to the Eswatini Electricity Company Limited by the Government of Eswatini is based on long
term agreement that enable the Company to obtain financing below the normal market interest rate (prime lending
rate). However, interest on this loan was not set in the agreement and thus assumed to be nil. See note 14.5 for more
on the terms of this loan.
27.4 Transactions with key management personnel
Key management are those charged with planning, directing and controlling the activities of the company, directly
or indirectly. Transactions with key management personnel include salaries, bonuses, gratuities and director’s fees.
Compensation paid to key management is shown below:
Board and related fees 873 225 829 762
Executive Management:
Short term employee benefits 10 939 054 6 965 966
Gratuity-net paid - -
10 939 054 6 965 966
28 Subsequent events
The company was involved in litigation over 2016 bonus to the amount of E16 million, for which the courts subsequently
ruled in the favour of the company. There was no provision recognised for this amount in the financial statements as
at 31 March 2018.

FINANCIAL STATEMENTS | NOTES TO THE FINANCIAL STATEMENTS
ESWATINI ELECTRICITY COMPANY | ANNUAL REPORT 2017/18
154
Notes to the Financial Statements - continuedfor the year ended 31 March 2018
2018 2017 Note E E Revenue from sale of electricity 4 1 945 949 259 1 624 163 292Cost of sales (1 104 150 115) (1 156 945 199) Gross profit 841 799 144 467 218 093 Other income 27 513 989 57 017 851Distribution costs (254 276 288) (231 060 002)Administrative costs (295 910 560) (269 804 355) Gains/(loss) from core operating activities 319 126 285 23 371 587 Capital contribution revenue 4 307 870 107 162 244 374Share of profit from Motraco 31 850 337 40 273 000Finance costs – net 9 (21 913 166) (35 450 896)Forex and embedded derivatives (losses)/gains and defined benefit gains and losses (23 586 791) (37 273 489) Net gains from non-electricity operations 294 220 487 129 792 989 Profit before tax 613 346 772 153 164 576Tax charged (76 285 980) (9 015 440) Net profit for the year 537 060 792 144 149 136
The following information is disclosed to assist stakeholders better appreciate the performance of the entity from its core
business of generating, transmitting and distributing electricity. It shows the performance of the entity from its operating
activities.

FINANCIAL STATEMENTS | NOTES TO THE FINANCIAL STATEMENTS
ESWATINI ELECTRICITY COMPANY | ANNUAL REPORT 2017/18
155
Notes

Notes
FINANCIAL STATEMENTS | NOTES TO THE FINANCIAL STATEMENTS
ESWATINI ELECTRICITY COMPANY | ANNUAL REPORT 2017/18
156

ELECTRIFICATION IN ESWATINI
0 4.5 9 18 27 36Kilometers
Depot Boundaries
Plantations
Coverage - Electricity lines within 1km
No Coverage
Protected Areas
N

ESWATINI ELECTRICITY COMPANY
Eluvatsini House, Mhlambanyatsi Road, MbabaneP.O. Box 258, Mbabane, Eswatini
Tel: +268 2409 4000Fax: +268 2404 2335
Website: www.eec.co.szE-mail: [email protected]


