36
2012-13 Annual Accountability Report STATE UNIVERSITY SYSTEM of FLORIDA Board of Governors UNIVERSITY OF SOUTH FLORIDA TAMPA
2012-13 Annual Accountability Report
STATE UNIVERSITY SYSTEM of FLORIDA Board of Governors
UNIVERSITY OF SOUTH FLORIDA
TAMPA
1
Annual Accountability Report
2012-2013
UNIVERSITY OF SOUTH FLORIDA - TAMPA
FINAL BOT APPROVED 12-5-2013
TABLE OF CONTENTS EXECUTIVE SUMMARY DASHBOARD p. 2 KEY ACHIEVEMENTS p. 5 NARRATIVE p. 6
DATA TABLES SECTION 1. FINANCIAL RESOURCES p. 14 SECTION 2. PERSONNEL p. 18 SECTION 3. ENROLLMENT p. 19 SECTION 4. UNDERGRADUATE EDUCATION p. 21 SECTION 5. GRADUATE EDUCATION p. 30 SECTION 6. RESEARCH & ECONOMIC DEVELOPMENT p. 33

2
Annual Accountability Report
2012-2013
UNIVERSITY OF SOUTH FLORIDA - TAMPA
FINAL BOT APPROVED 12-5-2013
Dashboard
Headcount Enrollments
Fall 2012
% Total
2007-2012 % Change
Degree Programs Offered 2012 Carnegie Classifications
TOTAL 41,212 100% 6% TOTAL (as of Spring 2013) 230 Basic:
Research Universities (very high research activity) White 23,552 57% -4% Baccalaureate 83
Hispanic 6,834 17% 39% Master’s & Specialist’s
103 Undergraduate Instructional Program:
Balanced arts & sciences, professions, high graduate Black 6,426 16% 34% Research Doctorate
Doctorate 40
Other 4,400 11% -5% Professional Doctorate 4 Graduate Instructional Program:
Comprehensive doctoral with medical/veterinary Full-Time 29,324 71% 14% Faculty
(Fall 2012) Full-Time
Part- Time Part-Time 11,888 29% -9%
Size and Setting: Large four-year, primarily
nonresidential Undergraduate 30,432 74% 4% TOTAL 1,459 600
Graduate 9,125 22% 15% Tenure & Ten. Track T. Track
990 74 Community Engagement:
Curricular Engagement and Outreach and Partnerships Unclassified 1,655 4% -11% Non-Tenured Faculty 469 526
DEGREE PRODUCTIVITY AND PROGRAM EFFICIENCY
6,140
7,617
0
1,000
2,000
3,000
4,000
5,000
6,000
7,000
8,000
2008-09 2012-13
Bachelor's Degrees Awarded
248 268
295 259
0
50
100
150
200
250
300
350
2008-09 2012-13
Graduate Degrees Awarded
Master's Doctoral
54%
17%
12%
43%
13%
14%
0% 10% 20% 30% 40% 50% 60%
Pell
Hispanic
Black
2008-09 2012-13
Bachelor's Degrees by Group
46%
62% 59%
68%
53%
64%
40%
45%
50%
55%
60%
65%
70%
2009 2010 2011 2012 2013*
6yr FTIC 4yr AA Transfers 5yr Other Transfers
Graduation Rates by Student Type
LAST YEAR OF COHORT
COHORT SIZES FOR COHORTS ENDING IN 2013
51%
63%
46%
53%
0%
25%
50%
75%
FTIC AATransfers
OtherTransfers
TOTAL
2012-13 Bachelor's Degrees Without Excess Hours
* Based on 2013 preliminary data

3
Annual Accountability Report
2012-2013
UNIVERSITY OF SOUTH FLORIDA - TAMPA
FINAL BOT APPROVED 12-5-2013
Dashboard DEGREES AWARDED IN PROGRAMS OF STRATEGIC EMPHASIS
RESEARCH AND COMMERCIALIZATION ACTIVITY
RESOURCES
112
435
500
803
1,987
85
321
432
414
1,323
0 500 1,000 1,500 2,000 2,500
Education(Critical)
Security
Global
Health(Critical)
STEM
2008-09 2012-13
Bachelor's Degrees Awarded in Areas of Strategic Emphasis
37
79
110
697
837
50
41
138
497
528
0 200 400 600 800 1000
Security
Global
Education(Critical)
Health(Critical)
STEM
2008-09 2012-13
Graduate Degrees Awarded in Areas of Strategic Emphasis
79% 78% 68%
$385.0 $395.0 $443.2
$0
$200
$400
$600
2007-08 2008-09 2009-10 2010-11 2011-12
EXTERNAL INTERNAL (State & Univ.)
Total R&D Expenditures ($ Millions) with Percent Funded Externally
$1.83 $1.30
$17.41
$1.39 $1.24
0
10
20
30
40
50
60
$0
$5
$10
$15
$20
2007-08 2008-09 2009-10 2010-11 2011-12
Lic
ense
s E
xecu
ted
Lic
ensi
ng
Rev
enu
e ($
M)
Licensing Revenue Licenses Executed
Technology Transfer: Licenses and Licensing Revenue
2008-09 2009-10 2010-11 2011-12 2012-13
TOTAL $11,273 $10,970 $11,278 $11,619 $10,455
TUITION $3,388 $3,620 $4,156 $4,835 $5,358
STATE $7,885 $7,351 $7,122 $6,784 $5,097
70% 67% 63% 58% 49%
$11,273 $10,970 $11,278 $11,619 $10,455
$0
$5,000
$10,000
$15,000
Appropriated Funding Per Actual US FTE
Note: Tuition is the appropriated budget authority, not the amount actually collected. This tuition data does not include non-instructional local fees. State includes General Revenues, Lottery and Other Trust funds (i.e., Federal Stimulus for 2009-10 and 2010-11 only). State funded financial aid programs that follow the student are included in tuition data. Student FTE are actual (not funded) and based on the national definition.
4
Annual Accountability Report
2012-2013
UNIVERSITY OF SOUTH FLORIDA - TAMPA
FINAL BOT APPROVED 12-5-2013
Dashboard POST-GRADUATION METRICS
69% 68%
0%
20%
40%
60%
80%
2010-11GRADUATES
2011-12GRADUATES
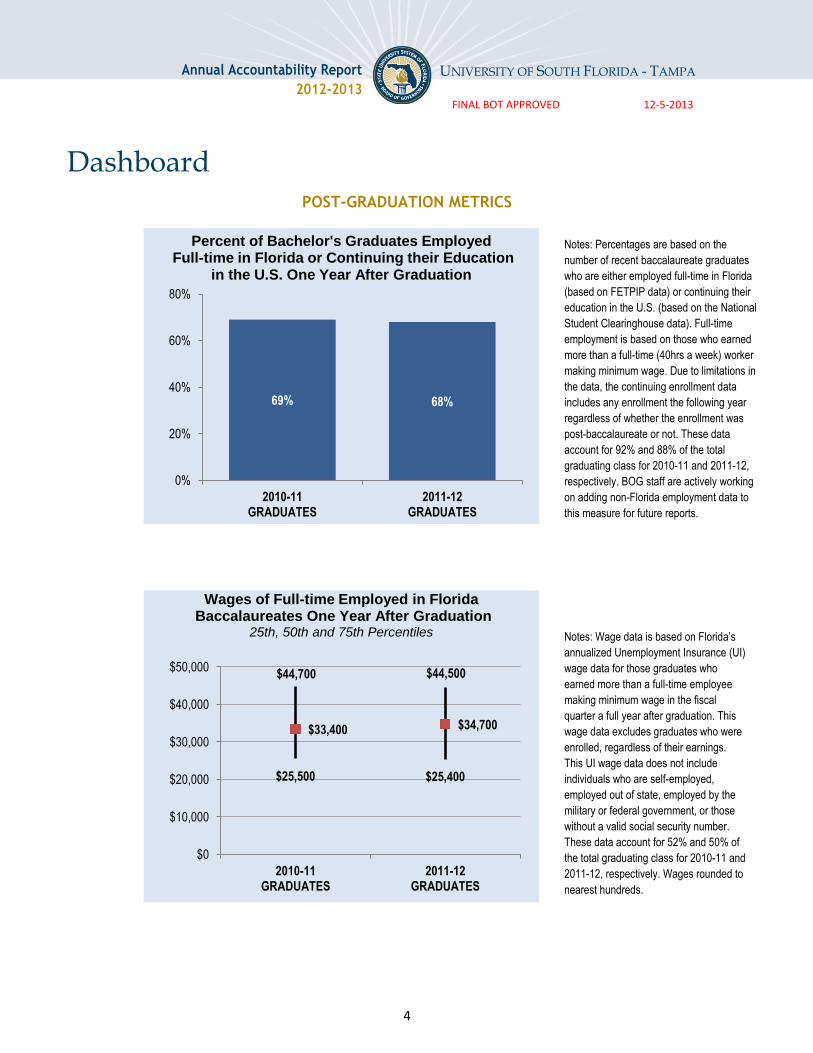
Percent of Bachelor's Graduates Employed Full-time in Florida or Continuing their Education
in the U.S. One Year After Graduation
$25,500 $25,400
$33,400 $34,700
$44,700 $44,500
$0
$10,000
$20,000
$30,000
$40,000
$50,000
2010-11GRADUATES
2011-12GRADUATES
Wages of Full-time Employed in Florida Baccalaureates One Year After Graduation
25th, 50th and 75th Percentiles
Notes: Percentages are based on the
number of recent baccalaureate graduates
who are either employed full-time in Florida
(based on FETPIP data) or continuing their
education in the U.S. (based on the National
Student Clearinghouse data). Full-time
employment is based on those who earned
more than a full-time (40hrs a week) worker
making minimum wage. Due to limitations in
the data, the continuing enrollment data
includes any enrollment the following year
regardless of whether the enrollment was
post-baccalaureate or not. These data
account for 92% and 88% of the total
graduating class for 2010-11 and 2011-12,
respectively. BOG staff are actively working
on adding non-Florida employment data to
this measure for future reports.
Notes: Wage data is based on Florida’s
annualized Unemployment Insurance (UI)
wage data for those graduates who
earned more than a full-time employee
making minimum wage in the fiscal
quarter a full year after graduation. This
wage data excludes graduates who were
enrolled, regardless of their earnings.
This UI wage data does not include
individuals who are self-employed,
employed out of state, employed by the
military or federal government, or those
without a valid social security number.
These data account for 52% and 50% of
the total graduating class for 2010-11 and
2011-12, respectively. Wages rounded to
nearest hundreds.

5
Annual Accountability Report
2012-2013
UNIVERSITY OF SOUTH FLORIDA - TAMPA
FINAL BOT APPROVED 12-5-2013
Key Achievements (2012 –2013)
STUDENT AWARDS/ACHIEVEMENTS 1. USF is a top producer of Fulbright Scholars, with the largest total among 50 universities in 32
states coming from USF in 2013. 2. A USF first was secured this year by Christie Campla—named a National Institutes of Health
Oxford-Cambridge Scholar. Campla, who specializes in cellular and molecular biology, will focus on improving methods for drug preservation and delivery.
3. USF celebrated three Tillman Military Scholars: Richard Mendez served in Iraq and Afghanistan as an Army Ranger; Anthony DeSantis served as a U.S. Marine Corps captain in Iraq; Alicia Irvin served as an Army Military Police platoon leader in Iraq. All are studying medicine.
FACULTY AWARDS/ACHIEVEMENTS
1. Autar Kaw, a USF mechanical engineering professor, was named a 2012 U.S. Professor of the Year by the Carnegie Foundation for the Advancement of Teaching. Kaw was one of four recipients of the award that is considered the nation’s highest honor for undergraduate teaching.
2. Fifteen USF faculty members were named American Association for the Advancement of Science (AAAS) fellows, the fourth most fellows of any organization in 2012.
3. Two USF faculty members earned Alfred P. Sloan Foundation research fellowships. Cameron Ainsworth is a member of the USF College of Marine Science team studying the Deepwater Horizon oil spill. Jiangfeng Zhou’s physics research focuses on light-generating structures.
PROGRAM AWARDS/ACHIEVEMENTS 1. USF World received one of only five Sen. Paul Simon Awards for Comprehensive
Internationalization, presented by the National Association of International Educators. 2. The USF graduate entrepreneurship program was named one of the top entrepreneurship
programs in the nation by The Princeton Review and Entrepreneur magazine. 3. USF’s industrial/organizational psychology program was ranked first among its peers for research
productivity, according to an Auburn University study.
RESEARCH AWARDS/ACHIEVEMENTS 1. Two USF inventions were selected to be featured at the first ever National Innovation Expo at the
U.S. Patent and Trademark Office. The Rolling Dance Chair and SkateCase are just two of USF’s hundreds of licensed technologies, which make USF the No. 1 patent-producer in the State University System.
2. Following a nine-year study, USF researchers identified a gene linked to age-related hearing loss, which could aid tens of millions of Americans who suffer from the ailment.
3. The USF-housed Florida Institute of Oceanography and U.S. Coast Guard 7th District forged an alliance to better engage the marine science research community on disaster responses following the Deepwater Horizon oil spill.
INSTITUTIONAL AWARDS/ACHIEVEMENTS 1. USF’s graduation rate continued to climb, reaching a record-high 63 percent in 2013. That’s a six-
percentage point increase in just one year. 2. The university ranked among the country’s “best values” in public higher education by Kiplinger’s
Personal Finance magazine, coming in at No. 57 nationwide. 3. USF surpassed its $600 million goal for the USF: Unstoppable campaign, raising more than $75
million for student scholarships, $34 million for faculty chairs and more than $300 million to support academic program enhancements.
6
Annual Accountability Report
2012-2013
UNIVERSITY OF SOUTH FLORIDA - TAMPA
FINAL BOT APPROVED 12-5-2013
Narrative
STRENGTHEN QUALITY AND REPUTATION OF ACADEMIC PROGRAMS AND UNIVERSITIES
At USF, student success is rightly placed at the center of the university’s mission, as a permanent institutional priority. That focus has paid off.
In 2012, USF’s graduation rate for the 2006 cohort climbed to a record 57 percent, reflecting the third-highest growth rate of all research institutions in the nation. Then in 2013, that rate jumped to 63 percent for the 2007 cohort. In just a year, USF’s graduation rate jumped a full six percentage points—a result of a myriad of new USF initiatives designed to ensure that students maximize their time at USF. These include a strengthened advising system, new audit degree and automated course tracking systems, redesigned gatekeeper courses, expanded on-campus employment opportunities, new living and learning communities, an expansion of a Learning Commons in the library and a revolutionary new Science, Math, and Research Technology (SMART) Lab, which offers a new active-learning approach to critical mathematics courses.
On the front end, USF’s admissions standards are higher than ever. The students who enrolled at USF in fall 2012, the Class of 2016, had average SAT scores of 1209 and high school GPAs of 3.94, the highest in USF’s history. USF is dedicated to ensuring each of these students graduates on time with a degree that will lead to a productive career.
While they are at USF, they will benefit from high-quality academic programs led by nationally recognized faculty. One standout is Dr. Autar Kaw, a USF mechanical engineering professor who was named a 2012 U.S. Professor of the Year by the Carnegie Foundation for the Advancement of Teaching and Council for Advancement and Support of Education (CASE). This is considered the highest honor for an undergraduate educator.
Meanwhile, USF students are also being nationally and internationally recognized for their accomplishments. In just two years, USF students have been awarded nearly 100 competitive national awards—the most among the entire State University System. Recipients of these awards are students with the strongest combination of academic achievements, extracurricular accomplishments, and potential for success in rigorous academic studies. Typically, winners represent less than one percent of applicants.
Many USF graduate level programs continue to be ranked among the best according to the 2014 U.S.
News and World Report Graduate School Rankings. Newly ranked USF graduate programs in the top 50
include Industrial and Organizational Psychology (No. 4), Public Health (No. 21), Library and Information
Studies (No. 24), and Industrial/Manufacturing Engineering (No. 42). Previously ranked USF graduate
programs that continue to hold a ranking in the top 50 include Audiology (No. 12), Criminology (No. 22),
Rehabilitation Counseling (No. 30), and Speech-Language Pathology (No. 45).
INCREASE DEGREE PRODUCITIVITY AND PROGRAM EFFICIENCY
USF’s productivity and efficiency has never been stronger. This is best evidenced by the recent Board of Governors 2012-13 performance funding awards, with USF receiving the highest amount (tied with the University of Central Florida) in recognition of its degree cost-efficiency, high percentage of graduates employed after graduation, and the high wages of graduates.
7
Annual Accountability Report
2012-2013
UNIVERSITY OF SOUTH FLORIDA - TAMPA
FINAL BOT APPROVED 12-5-2013
Access to that high-quality higher education is growing significantly, equipping more and more students from a variety of different backgrounds with the skills they need for a successful lifetime career. In the last decade, USF’s degree production has doubled, increasing to a record 10,950 in 2012-13. That includes students from 120 different countries, making USF one of the 40 most diverse public universities in the country and the second most diverse institution in the State University System of Florida. USF is a leader in awarding baccalaureate degrees to traditionally underrepresented groups and minority students, recognized in 2012 by Diverse magazine as 28th among all U.S. colleges or universities in awarding undergraduate degrees to minorities. Forty-three percent of USF undergraduate students receive a federal Pell Grant (IPEDS, 2011-12). USF is a leader in online education, named by the Guide to Online Schools as 25th best overall among top schools offering high-quality, affordable online programs, based on data compiled by the National Center for Education Statistics—the primary federal entity for collecting and analyzing data related to education. USF currently offers 26 fully online programs at the undergraduate and graduate levels, and nearly 60 percent of all USF students take at least one online course. USF is also proud to be one of the most veteran-friendly campuses in the country, named No. 4 nationwide by Military Times Edge in 2012. USF is one of only 16 universities in the nation selected as a Tillman Partnership University of the Pat Tillman Foundation, a selection based on innovative veteran-specific support services and a proven culture of community for military families.
USF continues to focus on initiatives that will result in improvements and/or cost savings for re-investment. These include consolidated business operations; digitization of forms, trainings, student tracking tools and other data; restructuring of certain departments; expanded use of in-house services; maximizing classroom and office space and more. In the past year, USF has also terminated or placed on inactive status three under-performing degree programs.
INCREASE THE NUMBER OF DEGREES AWARDED IN S.T.E.M. AND OTHER PROGRAMS OF STRATEGIC EMPHASIS
USF is committed to responding to the existing, evolving, and emerging needs and opportunities of the
state economy. As a result, the university’s total degrees awarded in areas of strategic emphasis,
including STEM fields and others, such as health sciences, grew by 7 percent in 2012-13, up to 51
percent of the total USF degrees awarded.
USF’s STEM offerings are growing in key high-demand areas. In 2013, USF’s Board of Trustees
approved the creation of a new two-year physician assistant program, which will produce nationally
certified and state licensed PAs who will help meet the critical health needs of Florida.
The university’s total degrees awarded specifically in STEM fields grew by 7 percent in 2012-13, up to 50
percent of the total USF degrees awarded in areas of strategic emphasis.
Recognizing another state need in an area of strategic emphasis, USF launched a new initiative in 2012-
13 to expand its efforts in cybersecurity. This was supported by the 2013 Legislature and Florida
Governor, who included in the state budget proviso language that called for a plan to create the Florida
Center for Cybersecurity, housed at USF. That plan was approved unanimously by the Board of
Governors at its meeting Nov. 21 at Florida International University. It will now be transmitted to the
Florida Legislature and Gov. Rick Scott for further consideration.
8
Annual Accountability Report
2012-2013
UNIVERSITY OF SOUTH FLORIDA - TAMPA
FINAL BOT APPROVED 12-5-2013
Narrative Scholarship, Research and Innovation STRENGTHEN QUALITY AND REPUTATION OF SCHOLARSHIP, RESEARCH AND INNOVATION
As one of four public universities in Florida classified by the Carnegie Foundation for the Advancement of Teaching in the top tier of research universities, USF research produces practical knowledge and products that directly benefit Florida’s critical needs and boost the economy. USF has become a leader in the study and treatment of brain disease; veterans’ reintegration and resilience; sustainability; infectious disease; and photovoltaic technologies. Put simply, USF research is making a major impact on the state of Florida.
USF is No. 2 in research activity among its sister institutions in the State University System, second only to the University of Florida, and that activity is growing. In FY 2013, USF was awarded a record $413.6 million in research contracts and grants. In FY 2012, USF had a record $451.2 million in total research expenditures, a 14 percent increase from FY 2011
USF researchers are increasingly recognized nationally and internationally. During 2012-2013, USF faculty were awarded 74 AAU, TARU, NRC and other highly prestigious awards, including the Carnegie Foundation/CASE U.S. Professor of the Year, the only two Sloan research fellowships awarded in Florida, three NSF CAREER awards, five NAI fellowships, and four Core Fulbrights, to name a few. In 2012, USF was in the top 10 of all institutions worldwide for Fellows of the American Association for the Advancement of Science, with a record 15 USF professors elected for the prestigious, AAU-recognized honor. The university founded and is home to the National Academy of Inventors (NAI), which boasts more than 2,000 inventor members and fellows spanning more than 100 U.S. universities and governmental and nonprofit research institutions and is growing rapidly. The USF chapter of the NAI has more than 270 faculty, staff, student, and alumni members who collectively hold more than 1,400 U.S. patents.
One exceptional research example is the USF Pediatric Epidemiology Center. The center, a data and technology coordinating hub for nearly every major Type 1 diabetes clinical trial worldwide, has become the epicenter for global juvenile diabetes research under the direction of Jeffrey Krischer. Krischer’s research has brought nearly $500 million in funding to USF from the National Institutes of Health, the most of any researcher in the country.
Meanwhile, USF students are increasingly afforded opportunities to help bring innovation to life, maximizing their academic experiences. The Princeton Review and Entrepreneur magazine in 2012 ranked USF’s interdisciplinary entrepreneurship program among the top 25 programs in the nation—the only Florida program included.
INCREASE RESEARCH AND COMMERCIALIZATION ACTIVITY
USF has worked hard to cultivate a spirit of entrepreneurship and innovation on campus, aggressively pursuing out-of-state grants and research contracts, promoting interdisciplinary collaboration, and working to bring scientific discoveries to the market.
The USF Technology Transfer Office/Patents and Licensing continues to thrive in transferring university technologies to the marketplace through license/option agreements. In 2013, 75 license/option agreements were negotiated, which reflects a 44 percent increase from the previous year. This increase places USF in the top 25 in the U.S. when compared to other individual universities reporting to the
9
Annual Accountability Report
2012-2013
UNIVERSITY OF SOUTH FLORIDA - TAMPA
FINAL BOT APPROVED 12-5-2013
Association of University Technology Managers (AUTM). USF also fostered the formation of nine start-up companies in 2013. This number of start-up companies places USF in the top 15 in the U.S. when compared to other individual universities reporting to AUTM.
The USF Research Park on the Tampa campus links researchers to businesses in need of research partnership. Occupancy of the Research Park, the core complex of which opened only eight years ago, is at 97 percent. There are currently 45 resident and eight affiliate companies focused on the business commercialization of biotechnology and life sciences research.
The Research Park is home to USF CONNECT, a network of innovation-based companies, research, government resources, and businesses development tools. This includes the USF Research Foundation and Tampa Bay Technology Incubator (TBTI), which provides a range of support services to help companies grow. To date, the incubator has worked with more than 65 companies, creating some 350 jobs in Tampa Bay and facilitating more than 130 partnerships with USF faculty.
USF CONNECT collaborated with community partners to obtain a $1 million grant awarded from the U.S. Department of Commerce to USF and Tampa Bay WaVE (WaVE). The FirstWaVE Venture Center (Center) and FirstWaVE Accelerator Program (Accelerator) were launched in late 2012. WaVE moved into the16,000-square-foot office space located in the heart of downtown Tampa in early January 2013. Since then, numerous events have been held at the Center, now home to 14 resident companies, including the Florida Next Foundation. WaVE, USF CONNECT, and other community leaders are working with Florida Next to find a solution to the early stage capital gap in Tampa Bay and Florida. In addition, the Accelerator officially launched its first call for applications with an announcement on January 15. USF CONNECT now co-resides in the space with Tampa Bay WaVE, holding office hours at the center periodically.
USF start-up companies are automatically granted status as an Affiliate company in TBTI. Seasoned, successful entrepreneurs are linked with university researchers to support innovations with the sound business practices necessary to create a viable company. Additionally, connections are made to investors and other sources of funding that provide the essential capital for business growth.
Many companies in TBTI hire USF students as interns, and these internships frequently lead into full-time jobs with the company after graduation. Additionally, students benefit from hands-on experiences in both the labs and the business offices, learning new skills, developing a network of contacts and enhancing their résumés.
To help prepare the next generation of researchers and entrepreneurs to fill emerging jobs and earn graduate degrees, USF is committed to providing undergraduates research opportunities across all disciplines. Through the Office for Undergraduate Research and individual departments, thousands of USF students gain valuable hands-on research experience and critical internship training each semester. The enhanced training and partnerships help create a highly skilled workforce, develop new jobs, bring new technologies to society faster, and introduce a sense of business to the university setting.
Other programs, such as the Capstone Learning Experience Courses, are designed to bring together knowledge from a certain discipline into a culminated learning experience for deeper understanding of the discipline by requiring a project, paper, proposal, or performance. Additionally, the Information Systems Decision Science Program (ISDS), located in the College of Business, partners with industry sponsors to give students new skills and experiences in doing "real world" projects while working with the industry sponsors.

10
Annual Accountability Report
2012-2013
UNIVERSITY OF SOUTH FLORIDA - TAMPA
FINAL BOT APPROVED 12-5-2013
INCREASE COLLABORATION AND EXTERNAL SUPPORT FOR RESEARCH ACTIVITY
USF research enjoys broad support in the local and state community. Of USF’s total $413.6 million in external research funding in 2013, nearly half (46 percent) came from private partnerships in the community, most from private or corporate partners.
A significant private partnership is the College of Marine Science and the BP Gulf of Mexico Research Initiative, which continues to provide funding for researching the effects of the BP oil spill of 2010. Other local and state private partnerships include: Florida Education Fund, Florida Healthy Kids Corporation, Tampa Bay Workforce Alliance and H. Lee Moffitt Cancer Center and Research Institute.
USF Sponsored Research utilizes a global software tool for identifying appropriate funding opportunities for USF faculty members, known as Pivot. Pivot allows for the most comprehensive search for funding sources and identifies researchers’ expertise from within or outside of the organizations. It provides global and local connections that strengthen research by exploring new avenues for funding and collaboration—for faculty, staff researchers, and graduate students.
As one of three universities participating in the Florida High Tech Corridor Council’s (FHTCC) Matching Grants Research Program (MGRP), USF is able to foster collaboration with private industry partners and increase research activity. Using FHTCC funds, Florida-based technology companies sponsoring research with the university are able to leverage their R&D budgets to increase the capabilities of the project.
This year, USF has continued to grow external support with industry partners participating in the MGRP.
The program experienced a 10 percent increase in the number of research projects during 2013. Projects covered several different technology sectors, including aviation and aerospace, microelectronics and sustainable energy. The MGRP also saw a 70 percent increase in student engagements as it related to the projects.
An example of a collaboration utilizing FHTCC matching funds was the partnership between USF’s College of Engineering and Northrop Grumman Corp. USF research provided a detailed investigation into analytics software used to handle “Big Data” problems in the defense industry. An evaluation on usability and integration was used to determine the cost that is required to combine different analytics software.

11
Annual Accountability Report
2012-2013
UNIVERSITY OF SOUTH FLORIDA - TAMPA
FINAL BOT APPROVED 12-5-2013
Narrative Community and Business Engagement STRENGTHEN QUALITY AND REPUTATION OF COMMITMENT TO COMMUNITY AND BUSINESS ENGAGEMENT
USF is dedicated to making an impact on state, national and global scales, both for the betterment of its student body and of the external community. This focus has garnered accolades for USF’s external engagement, including being ranked 78th nationally out of more than 1,500 higher education institutions for social mobility, research and civic engagement, according to Washington Monthly. The university was also acknowledged with a place on the 2013 President’s Higher Education Community Service Honor Roll. The Honor Roll recognizes higher education institutions that reflect the values of community service and achieve meaningful outcomes in their communities. Locally, USF makes an impact through the activities of its Center for Leadership and Civic Engagement (CLCE), which through various events and initiatives challenges students to be effective, ethical and engaged leaders. These include the annual Community Plunge, Ghandi Day of Service and the intensive daylong Stampede of Service, which has grown to become the largest community service event in USF’s history, serving more than 60 organizations in the Tampa Bay community.
As a global example, USF’s Ghana Scholars Program was selected by the Institute of International
Education (IIE) for the 2013 Andrew Heiskell Honorable Mention Award for international partnerships,
recognizing strategic, comprehensive, and innovative international partnership efforts. The program is
designed to promote the exchange of ideas and address the need for capacity-building among the
faculty at the Universities of Ghana and Cape Coast.
INCREASE LEVELS OF COMMUNITY AND BUSINESS ENGAGEMENT
Students and faculty at USF are encouraged to seek opportunities beyond campus to share and gain knowledge. This begins with community service and internships, and then leads to successful careers and partnerships. One resource at USF for this purpose is the newly established Job Shop, which represented a highlight of the 2012-13 academic year. This center, on the first floor of the USF Library, helps students research prospective employers, apply for jobs and internships, and provides a new space for Career Services Staff to coach students on interview skills, resume writing and job-search strategies. In 2012-13, the Job Shop’s staff conducted 50 presentations and participated in 24 outreach events, resulting in contact with more than 2,100 students. In the external community, the Small Business Development Center at USF provides resources to thousands of entrepreneurs, business owners and executives each year in 10 west-central counties in Florida. Services include accounting, business planning, financing and taxes, technology transfer and web strategies. According to its surveys, more than 300 of the center’s clients have reported opening new businesses, while those with existing enterprises reported sales revenues increasing by more than $100 million since working with the center. Additionally, about 4,100 jobs were saved.
12
Annual Accountability Report
2012-2013
UNIVERSITY OF SOUTH FLORIDA - TAMPA
FINAL BOT APPROVED 12-5-2013
INCREASE COMMUNITY AND BUSINESS WORKFORCE
USF has been recognized by the Board of Governors as the top producer of graduates who continue
their education or are employed in Florida, earning $2.6 million of the $20 million available in
performance funding to the State University System in 2012-13—the highest amount awarded. One of
the metrics used in performance funding identified 52 percent of USF bachelor’s graduates employed in
Florida one year after graduation (FETPIP, 2010-11). Further, of the SUS institutions, USF graduates
were found to have the 3rd highest median full-time wages of undergraduates employed in Florida one
year after graduation (FETPIP, 2010-11).
USF views local and state employers as educational partners in the development and preparation of its
students, rather than merely consumers of graduates. Employers serve on university advisory boards,
speak to classes and student groups, serve as judges for case-study projects, become involved in
targeted research projects, sponsor academic challenges, offer experiential learning opportunities, attend
career fairs, hold employer information sessions and conduct on-campus interviews. This has laid the
groundwork for an effective employer-employee pipeline at USF.
By actively listening to needs of employers and finding ways to embed those needs into its educational
efforts, USF has built a reputation for producing students that are not only academically prepared but
workforce-ready. This is also true of employers, who embrace USF’s discoveries and innovations, often
offering their companies as “testing grounds” for students and faculty.
USF Career Services staff members, joined by their academic colleagues, work closely with employers
to connect them with the graduates they need through online job postings, career fairs, on-campus
interviews and various on-campus events. The Career Services Employer Relations staff assists
employers in developing a customized campus recruitment plan that works for their needs and leverages
their investment in reaching candidates.
The university views all employers, from small organizations to large corporations, as viable partners
offering valuable employment opportunities for its graduates. USF’s success is grounded in purposeful
engagement built on collaboration, accommodation, mutual respect and the commitment of all
stakeholders to train and employ talented USF graduates in the Tampa Bay and Florida.
13
Annual Accountability Report
2012-2013
UNIVERSITY OF SOUTH FLORIDA - TAMPA
FINAL BOT APPROVED 12-5-2013
Data Tables
FINANCIAL RESOURCES
Table 1A. Education and General Revenues
Table 1B. Education and General Expenditures
Table 1C. Funding per Student FTE
Table 1D. Other Budget Entities
Table 1E. Voluntary Support of Higher Education
Table 1F. Tuition Differential Fee
PERSONNEL
Table 2A. Personnel Headcount
ENROLLMENT
Table 3A. Full-time Equivalent (FTE) Enrollment
Table 3C. Enrollment by Method of Instruction
UNDERGRADUATE EDUCATION
Table 4A. Baccalaureate Degree Program Changes in AY 2011-2012
Table 4B. Retention Rates
Table 4C. Full-time, First-Time-in-College (FTIC) Six-Year Graduation Rates
Table 4D. Full- and Part-time FTIC Graduation Rates
Table 4E. AA Transfers Graduation Rates
Table 4F. Other Transfers Graduation Rates
Table 4G. Baccalaureate Degrees Awarded
Table 4H. Baccalaureate Degrees Awarded in Areas of Strategic Emphasis
Table 4I. Baccalaureate Degrees Awarded to Underrepresented Groups
Table 4J. Baccalaureate Degrees Without Excess Credit Hours
Table 4K. Undergraduate Course Offerings
Table 4L. Faculty Teaching Undergraduates
Table 4M. Student/Faculty Ratio
Table 4N. Licensure/Certification Exam: Nursing (NCLEX)
GRADUATE EDUCATION
Table 5A. Graduate Degree Program Changes in AY 2011-2012
Table 5B. Graduate Degrees Awarded
Table 5C. Graduate Degrees Awarded in Areas of Strategic Emphasis
Table 5D. Licensure/Certification Exams for Graduate Programs
RESEARCH & ECONOMIC DEVELOPMENT
Table 6A. Research and Development Expenditures
Table 6B. Centers of Excellence

14
Annual Accountability Report
2012-2013
UNIVERSITY OF SOUTH FLORIDA - TAMPA
FINAL BOT APPROVED 12-5-2013
Section 1 – Financial Resources
TABLE 1A. University Education and General Revenues
2009-10 Actual
2010-11 Actual
2011-12 Actual
2012-13 Actual
2013-14 Estimates
MAIN OPERATIONS
Recurring State Funds $207,299,394 $229,483,736 $207,040,644 $197,695,445 $201,869,224
Non-Recurring State Funds $1,337,683 $2,579,803 $2,291,870 -$42,137,455 $3,190,000
Tuition $101,141,238 $109,884,700 $114,807,477 $118,200,604 $130,311,476
Tuition Differential Fee $6,856,219 $12,831,890 $19,548,371 $29,072,717 $29,499,995
Misc. Fees & Fines $3,479,158 $3,096,769 $2,875,073 $2,568,555 $3,216,655
Phosphate Research TF $7,304,874 $7,330,654 $7,337,035 $0 $0
Federal Stimulus Funds $15,853,697 $15,169,662 $0 $0 $0
SUBTOTAL $343,272,263 $380,377,214 $353,900,470 $305,399,866 $368,087,350
HEALTH SCIENCE CENTER / MEDICAL SCHOOL
Recurring State Funds $61,549,150 $61,824,195 $63,127,971 $65,793,008 $70,505,598
Non-Recurring State Funds $0 $1,175,000 $250,000 $0 $1,250,000
Tuition $29,988,216 $32,942,009 $41,065,438 $48,203,644 $49,938,942
Tuition Differential Fee $501,511 $947,321 $1,703,379 $2,956,633 $3,274,040
Misc. Fees & Fines $1,331 $1,280 $2,568 $41,978 $0
Phosphate Research TF $0 $0 $0 $0 $0
Federal Stimulus Funds $4,569,090 $4,351,772 $0 $0 $0
SUBTOTAL $96,609,298 $101,241,577 $106,149,356 $116,995,263 $124,968,580
TOTAL $439,881,561 $481,618,791 $460,049,826 $422,395,129 $493,055,930
Recurring State Funds: State recurring funds include general revenue and lottery education & general (E&G) appropriations and any administered funds provided by the state, including annual adjustments of risk management insurance premiums for the estimated year. This does not include technical adjustments or transfers made by universities after the appropriation. Please note: for estimated 2012-13 this figure includes the non-recurring $300 M system budget reduction. - Source: For actual years, SUS Final Amendment Packages; for estimated year the 2012-13 Allocation Summary and Workpapers (Total E&G general revenue & lottery minus non-recurring) and Board of Governors staff calculations for risk management insurance adjustments. Non-Recurring State Funds: State non-recurring funds include general revenue and lottery education & general appropriations and any administered funds provided by the state. This does not include technical adjustments or transfers made by Universities after the appropriation - Source: non-recurring appropriations section of the annual Allocation Summary and Workpapers document and all other non-recurring budget amendments allocated later in the fiscal year. Tuition: Actual resident & non-resident tuition revenues collected from students, net of fee waivers. - Source: Operating Budget, Report 625 – Schedule I-A. Tuition Differential Fee: Actual tuition differential revenues collected from undergraduate students - Source: Operating Budget, Report 625 – Schedule I-A. Miscellaneous Fees & Fines: Other revenue collections include items such as application fees, late registration fees, library fines, miscellaneous revenues. This is the total revenue from Report 625 minus tuition and tuition differential fee revenues. This does not include local fees - Source: Operating Budget, Report 625 – Schedule I-A. Phosphate Research Trust Fund: State appropriation for the Florida Industrial and Phosphate Research Institute at the University of South Florida (for history years through 2011-12); beginning 2012-13 the Phosphate Research Trust Fund is appropriated through Florida Polytechnic University. Other Operating Trust Funds- For UF-IFAS and UF-HSC, actual revenues from the Incidental Trust Funds and Operations & Maintenance Trust Fund are provided by the University of Florida. Source: Final Amendment Package. Federal Stimulus Funds: Non-recurring American Recovery and Reinvestment Act funds appropriated by the state - Source: SUS Final Amendment Package.
15
Annual Accountability Report
2012-2013
UNIVERSITY OF SOUTH FLORIDA - TAMPA
FINAL BOT APPROVED 12-5-2013
Section 1 – Financial Resources (continued)
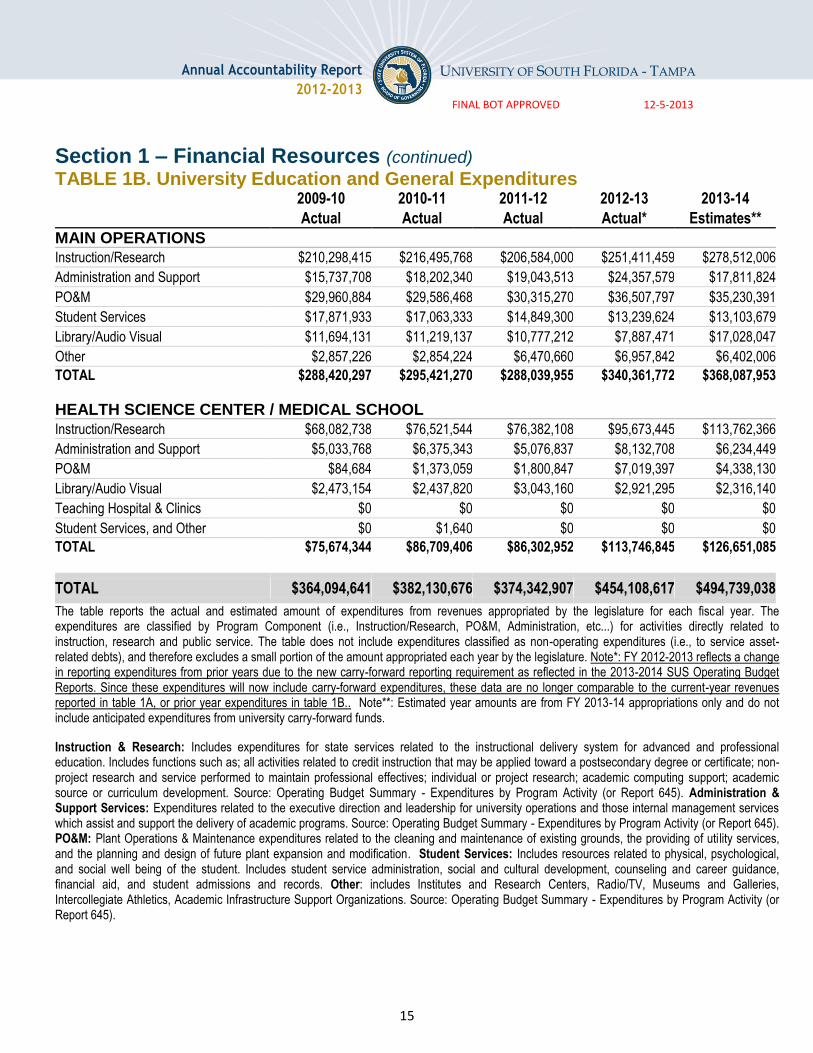
TABLE 1B. University Education and General Expenditures
2009-10 2010-11 2011-12 2012-13 2013-14
Actual Actual Actual Actual* Estimates**
MAIN OPERATIONS
Instruction/Research $210,298,415 $216,495,768 $206,584,000 $251,411,459 $278,512,006
Administration and Support $15,737,708 $18,202,340 $19,043,513 $24,357,579 $17,811,824
PO&M $29,960,884 $29,586,468 $30,315,270 $36,507,797 $35,230,391
Student Services $17,871,933 $17,063,333 $14,849,300 $13,239,624 $13,103,679
Library/Audio Visual $11,694,131 $11,219,137 $10,777,212 $7,887,471 $17,028,047
Other $2,857,226 $2,854,224 $6,470,660 $6,957,842 $6,402,006
TOTAL $288,420,297 $295,421,270 $288,039,955 $340,361,772 $368,087,953
HEALTH SCIENCE CENTER / MEDICAL SCHOOL
Instruction/Research $68,082,738 $76,521,544 $76,382,108 $95,673,445 $113,762,366
Administration and Support $5,033,768 $6,375,343 $5,076,837 $8,132,708 $6,234,449
PO&M $84,684 $1,373,059 $1,800,847 $7,019,397 $4,338,130
Library/Audio Visual $2,473,154 $2,437,820 $3,043,160 $2,921,295 $2,316,140
Teaching Hospital & Clinics $0 $0 $0 $0 $0
Student Services, and Other $0 $1,640 $0 $0 $0
TOTAL $75,674,344 $86,709,406 $86,302,952 $113,746,845 $126,651,085
TOTAL $364,094,641 $382,130,676 $374,342,907 $454,108,617 $494,739,038
The table reports the actual and estimated amount of expenditures from revenues appropriated by the legislature for each fiscal year. The expenditures are classified by Program Component (i.e., Instruction/Research, PO&M, Administration, etc...) for activities directly related to instruction, research and public service. The table does not include expenditures classified as non-operating expenditures (i.e., to service asset-related debts), and therefore excludes a small portion of the amount appropriated each year by the legislature. Note*: FY 2012-2013 reflects a change in reporting expenditures from prior years due to the new carry-forward reporting requirement as reflected in the 2013-2014 SUS Operating Budget Reports. Since these expenditures will now include carry-forward expenditures, these data are no longer comparable to the current-year revenues reported in table 1A, or prior year expenditures in table 1B.. Note**: Estimated year amounts are from FY 2013-14 appropriations only and do not include anticipated expenditures from university carry-forward funds.
Instruction & Research: Includes expenditures for state services related to the instructional delivery system for advanced and professional education. Includes functions such as; all activities related to credit instruction that may be applied toward a postsecondary degree or certificate; non-project research and service performed to maintain professional effectives; individual or project research; academic computing support; academic source or curriculum development. Source: Operating Budget Summary - Expenditures by Program Activity (or Report 645). Administration & Support Services: Expenditures related to the executive direction and leadership for university operations and those internal management services which assist and support the delivery of academic programs. Source: Operating Budget Summary - Expenditures by Program Activity (or Report 645). PO&M: Plant Operations & Maintenance expenditures related to the cleaning and maintenance of existing grounds, the providing of utility services, and the planning and design of future plant expansion and modification. Student Services: Includes resources related to physical, psychological, and social well being of the student. Includes student service administration, social and cultural development, counseling and career guidance, financial aid, and student admissions and records. Other: includes Institutes and Research Centers, Radio/TV, Museums and Galleries, Intercollegiate Athletics, Academic Infrastructure Support Organizations. Source: Operating Budget Summary - Expenditures by Program Activity (or Report 645).
16
Annual Accountability Report
2012-2013
UNIVERSITY OF SOUTH FLORIDA - TAMPA
FINAL BOT APPROVED 12-5-2013
Section 1 – Financial Resources (continued)
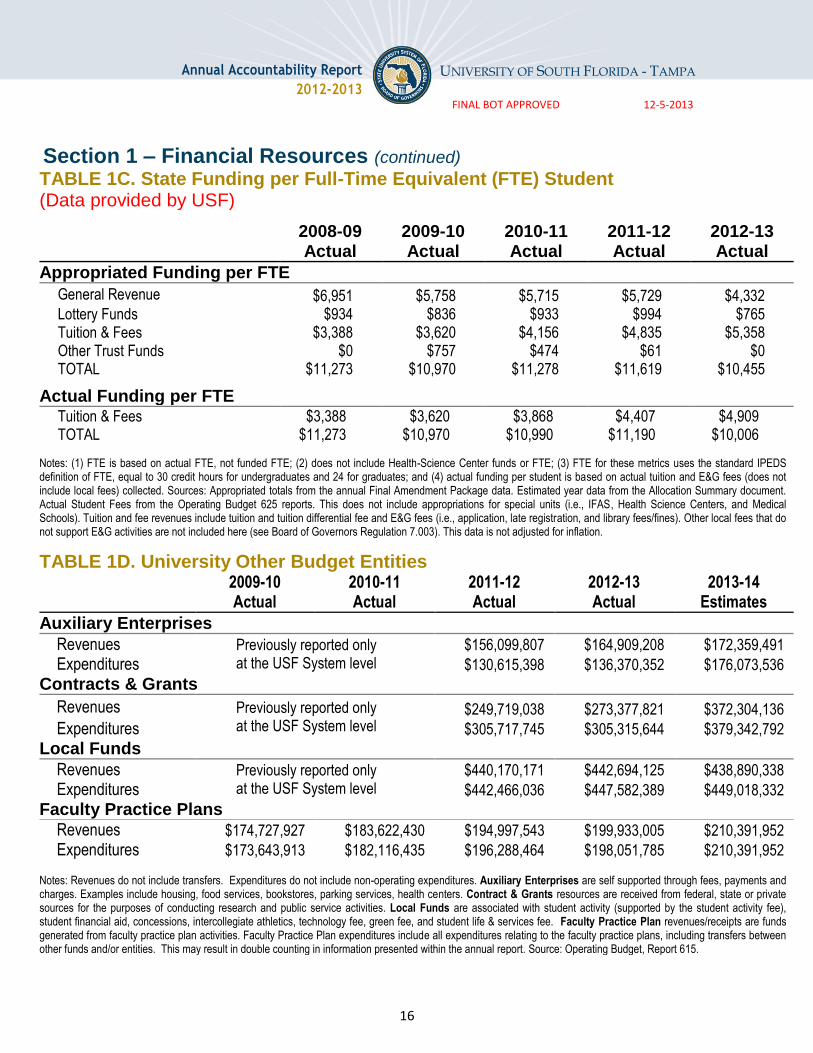
TABLE 1C. State Funding per Full-Time Equivalent (FTE) Student (Data provided by USF)
2008-09 Actual
2009-10 Actual
2010-11 Actual
2011-12 Actual
2012-13 Actual
Appropriated Funding per FTE
General Revenue $6,951 $5,758 $5,715 $5,729 $4,332 Lottery Funds $934 $836 $933 $994 $765 Tuition & Fees $3,388 $3,620 $4,156 $4,835 $5,358 Other Trust Funds $0 $757 $474 $61 $0 TOTAL $11,273 $10,970 $11,278 $11,619 $10,455
Actual Funding per FTE
Tuition & Fees $3,388 $3,620 $3,868 $4,407 $4,909 TOTAL $11,273 $10,970 $10,990 $11,190 $10,006
Notes: (1) FTE is based on actual FTE, not funded FTE; (2) does not include Health-Science Center funds or FTE; (3) FTE for these metrics uses the standard IPEDS definition of FTE, equal to 30 credit hours for undergraduates and 24 for graduates; and (4) actual funding per student is based on actual tuition and E&G fees (does not include local fees) collected. Sources: Appropriated totals from the annual Final Amendment Package data. Estimated year data from the Allocation Summary document. Actual Student Fees from the Operating Budget 625 reports. This does not include appropriations for special units (i.e., IFAS, Health Science Centers, and Medical Schools). Tuition and fee revenues include tuition and tuition differential fee and E&G fees (i.e., application, late registration, and library fees/fines). Other local fees that do not support E&G activities are not included here (see Board of Governors Regulation 7.003). This data is not adjusted for inflation.
TABLE 1D. University Other Budget Entities
2009-10 Actual
2010-11 Actual
2011-12 Actual
2012-13 Actual
2013-14 Estimates
Auxiliary Enterprises
Revenues Previously reported only at the USF System level
$156,099,807 $164,909,208 $172,359,491
Expenditures $130,615,398 $136,370,352 $176,073,536
Contracts & Grants
Revenues Previously reported only at the USF System level
$249,719,038 $273,377,821 $372,304,136
Expenditures $305,717,745 $305,315,644 $379,342,792
Local Funds
Revenues Previously reported only at the USF System level
$440,170,171 $442,694,125 $438,890,338
Expenditures $442,466,036 $447,582,389 $449,018,332
Faculty Practice Plans
Revenues $174,727,927 $183,622,430 $194,997,543 $199,933,005 $210,391,952
Expenditures $173,643,913 $182,116,435 $196,288,464 $198,051,785 $210,391,952 Notes: Revenues do not include transfers. Expenditures do not include non-operating expenditures. Auxiliary Enterprises are self supported through fees, payments and charges. Examples include housing, food services, bookstores, parking services, health centers. Contract & Grants resources are received from federal, state or private sources for the purposes of conducting research and public service activities. Local Funds are associated with student activity (supported by the student activity fee), student financial aid, concessions, intercollegiate athletics, technology fee, green fee, and student life & services fee. Faculty Practice Plan revenues/receipts are funds generated from faculty practice plan activities. Faculty Practice Plan expenditures include all expenditures relating to the faculty practice plans, including transfers between other funds and/or entities. This may result in double counting in information presented within the annual report. Source: Operating Budget, Report 615.
17
Annual Accountability Report
2012-2013
UNIVERSITY OF SOUTH FLORIDA - TAMPA
FINAL BOT APPROVED 12-5-2013
Section 1 – Financial Resources (continued)
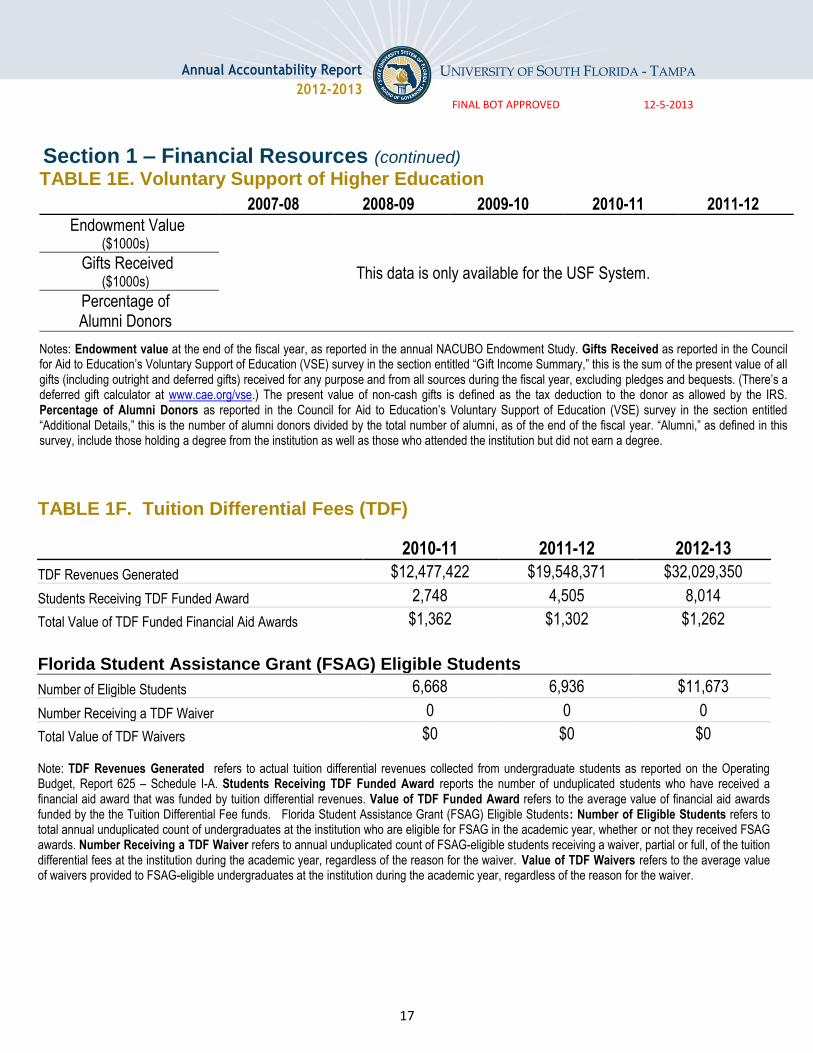
TABLE 1E. Voluntary Support of Higher Education
2007-08 2008-09 2009-10 2010-11 2011-12
Endowment Value ($1000s)
This data is only available for the USF System. Gifts Received
($1000s)
Percentage of Alumni Donors
Notes: Endowment value at the end of the fiscal year, as reported in the annual NACUBO Endowment Study. Gifts Received as reported in the Council for Aid to Education’s Voluntary Support of Education (VSE) survey in the section entitled “Gift Income Summary,” this is the sum of the present value of all gifts (including outright and deferred gifts) received for any purpose and from all sources during the fiscal year, excluding pledges and bequests. (There’s a deferred gift calculator at www.cae.org/vse.) The present value of non-cash gifts is defined as the tax deduction to the donor as allowed by the IRS. Percentage of Alumni Donors as reported in the Council for Aid to Education’s Voluntary Support of Education (VSE) survey in the section entitled “Additional Details,” this is the number of alumni donors divided by the total number of alumni, as of the end of the fiscal year. “Alumni,” as defined in this survey, include those holding a degree from the institution as well as those who attended the institution but did not earn a degree.
TABLE 1F. Tuition Differential Fees (TDF)
2010-11 2011-12 2012-13
TDF Revenues Generated $12,477,422 $19,548,371 $32,029,350
Students Receiving TDF Funded Award 2,748 4,505 8,014
Total Value of TDF Funded Financial Aid Awards $1,362 $1,302 $1,262
Florida Student Assistance Grant (FSAG) Eligible Students
Number of Eligible Students 6,668 6,936 $11,673
Number Receiving a TDF Waiver 0 0 0
Total Value of TDF Waivers $0 $0 $0 Note: TDF Revenues Generated refers to actual tuition differential revenues collected from undergraduate students as reported on the Operating Budget, Report 625 – Schedule I-A. Students Receiving TDF Funded Award reports the number of unduplicated students who have received a financial aid award that was funded by tuition differential revenues. Value of TDF Funded Award refers to the average value of financial aid awards funded by the the Tuition Differential Fee funds. Florida Student Assistance Grant (FSAG) Eligible Students: Number of Eligible Students refers to total annual unduplicated count of undergraduates at the institution who are eligible for FSAG in the academic year, whether or not they received FSAG awards. Number Receiving a TDF Waiver refers to annual unduplicated count of FSAG-eligible students receiving a waiver, partial or full, of the tuition differential fees at the institution during the academic year, regardless of the reason for the waiver. Value of TDF Waivers refers to the average value of waivers provided to FSAG-eligible undergraduates at the institution during the academic year, regardless of the reason for the waiver.

18
Annual Accountability Report
2012-2013
UNIVERSITY OF SOUTH FLORIDA - TAMPA
FINAL BOT APPROVED 12-5-2013
Section 2 – Personnel
TABLE 2A. Personnel Headcount (in Fall term only)
2008 2009 2010 2011 2012
Full-time Employees
Tenured Faculty 660 683 691 684 661
Tenure-track Faculty 318 297 309 338 329
Non-Tenure Track Faculty 416 444 466 457 469
Instructors Without Faculty Status 0 0 0 0 0
Graduate Assistants/Associates 0 0 0 0 0
Non-Instructional Employees 3,694 3,740 3,915 4,100 3,964
FULL-TIME SUBTOTAL 5,079 5,164 5,381 5,579 5,423
Part-time Employees
Tenured Faculty 55 57 53 45 55
Tenure-track Faculty 22 21 25 19 19
Non-Tenure Track Faculty 132 132 137 190 526
Instructors Without Faculty Status 0 0 3 0 0
Graduate Assistants/Associates 1,746 1,835 2,034 2,026 1,988
Non-Instructional Employees 118 156 143 209 778
PART-TIME SUBTOTAL 2,073 2,201 2,392 2,489 3,366
TOTAL 7,152 7,365 7,773 8,068 8,789
Note: This table is based on the annual IPEDS Human Resources Survey, and provides full- and part-time medical and non-medical staff by faculty status and primary function/occupational activity. Tenured and Tenure-Track Faculty include those categorized within instruction, research, or public service. Non-Tenure Track Faculty includes adjunct faculty (on annual and less than annual contracts) and faculty on multi-year contracts categorized within instruction, research, or public service. Instructors Without Faculty Status includes postdoctoral research associates, and individuals hired as a staff member primarily to do research on a 3-year contract without tenure eligibility categorized within instruction, research, or public service. Non-Instructional Employees includes all executive, administrative and managerial positions regardless of faculty status; as well as, other support and service positions regardless of faculty status. Note: The universities vary on how they classify adjuncts (some include them as non-tenure track faculty while others do not consider them faculty and report them as instructors without faculty status) and part-time non-instructional employees.
19
Annual Accountability Report
2012-2013
UNIVERSITY OF SOUTH FLORIDA - TAMPA
FINAL BOT APPROVED 12-5-2013
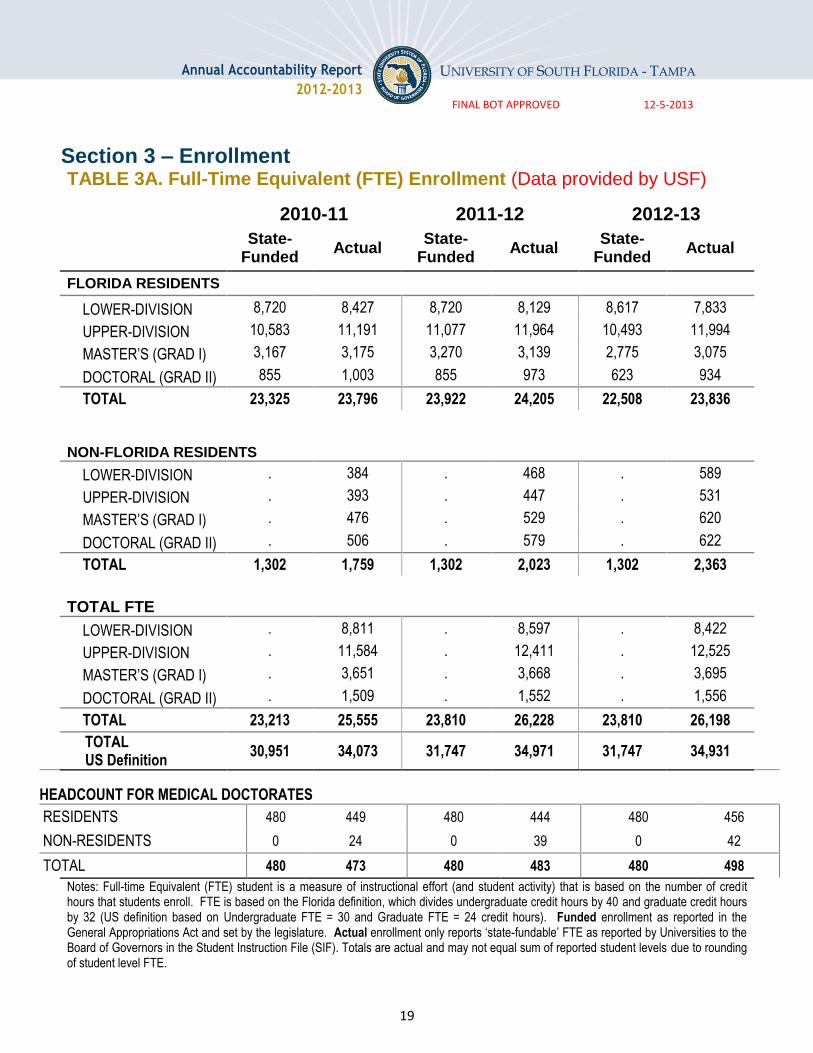
Section 3 – Enrollment
TABLE 3A. Full-Time Equivalent (FTE) Enrollment (Data provided by USF)
2010-11 2011-12 2012-13
State-
Funded Actual
State- Funded
Actual State-
Funded Actual
FLORIDA RESIDENTS
LOWER-DIVISION 8,720 8,427 8,720 8,129 8,617 7,833
UPPER-DIVISION 10,583 11,191 11,077 11,964 10,493 11,994
MASTER’S (GRAD I) 3,167 3,175 3,270 3,139 2,775 3,075
DOCTORAL (GRAD II) 855 1,003 855 973 623 934
TOTAL 23,325 23,796 23,922 24,205 22,508 23,836
NON-FLORIDA RESIDENTS
LOWER-DIVISION . 384 . 468 . 589
UPPER-DIVISION . 393 . 447 . 531
MASTER’S (GRAD I) . 476 . 529 . 620
DOCTORAL (GRAD II) . 506 . 579 . 622
TOTAL 1,302 1,759 1,302 2,023 1,302 2,363
TOTAL FTE
LOWER-DIVISION . 8,811 . 8,597 . 8,422
UPPER-DIVISION . 11,584 . 12,411 . 12,525
MASTER’S (GRAD I) . 3,651 . 3,668 . 3,695
DOCTORAL (GRAD II) . 1,509 . 1,552 . 1,556
TOTAL 23,213 25,555 23,810 26,228 23,810 26,198
TOTAL US Definition
30,951 34,073 31,747 34,971 31,747 34,931
HEADCOUNT FOR MEDICAL DOCTORATES
RESIDENTS 480 449 480 444 480 456
NON-RESIDENTS 0 24 0 39 0 42
TOTAL 480 473 480 483 480 498
Notes: Full-time Equivalent (FTE) student is a measure of instructional effort (and student activity) that is based on the number of credit hours that students enroll. FTE is based on the Florida definition, which divides undergraduate credit hours by 40 and graduate credit hours by 32 (US definition based on Undergraduate FTE = 30 and Graduate FTE = 24 credit hours). Funded enrollment as reported in the General Appropriations Act and set by the legislature. Actual enrollment only reports ‘state-fundable’ FTE as reported by Universities to the Board of Governors in the Student Instruction File (SIF). Totals are actual and may not equal sum of reported student levels due to rounding of student level FTE.
20
Annual Accountability Report
2012-2013
UNIVERSITY OF SOUTH FLORIDA - TAMPA
FINAL BOT APPROVED 12-5-2013
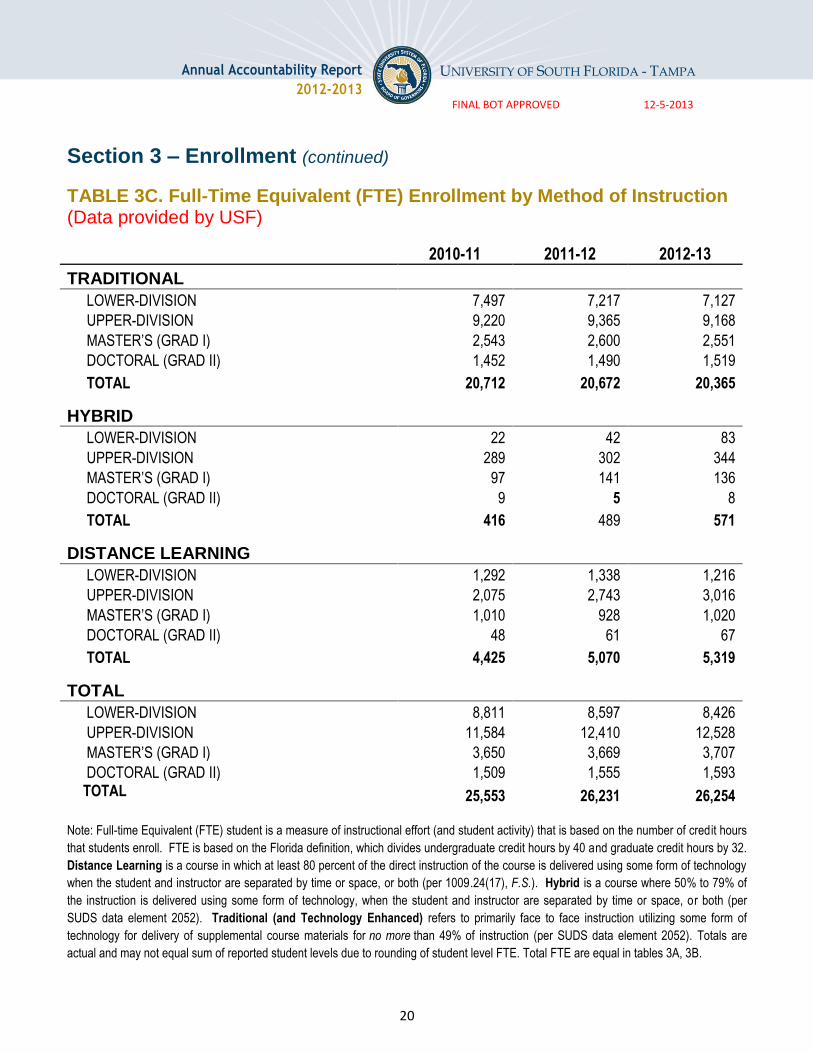
Section 3 – Enrollment (continued)
TABLE 3C. Full-Time Equivalent (FTE) Enrollment by Method of Instruction (Data provided by USF)
2010-11 2011-12 2012-13
TRADITIONAL
LOWER-DIVISION 7,497 7,217 7,127
UPPER-DIVISION 9,220 9,365 9,168
MASTER’S (GRAD I) 2,543 2,600 2,551
DOCTORAL (GRAD II) 1,452 1,490 1,519
TOTAL 20,712 20,672 20,365
HYBRID LOWER-DIVISION 22 42 83
UPPER-DIVISION 289 302 344
MASTER’S (GRAD I) 97 141 136
DOCTORAL (GRAD II) 9 5 8
TOTAL 416 489 571
DISTANCE LEARNING
LOWER-DIVISION 1,292 1,338 1,216
UPPER-DIVISION 2,075 2,743 3,016
MASTER’S (GRAD I) 1,010 928 1,020
DOCTORAL (GRAD II) 48 61 67
TOTAL 4,425 5,070 5,319
TOTAL
LOWER-DIVISION 8,811 8,597 8,426
UPPER-DIVISION 11,584 12,410 12,528
MASTER’S (GRAD I) 3,650 3,669 3,707
DOCTORAL (GRAD II) 1,509 1,555 1,593 TOTAL 25,553 26,231 26,254
Note: Full-time Equivalent (FTE) student is a measure of instructional effort (and student activity) that is based on the number of credit hours
that students enroll. FTE is based on the Florida definition, which divides undergraduate credit hours by 40 and graduate credit hours by 32.
Distance Learning is a course in which at least 80 percent of the direct instruction of the course is delivered using some form of technology
when the student and instructor are separated by time or space, or both (per 1009.24(17), F.S.). Hybrid is a course where 50% to 79% of
the instruction is delivered using some form of technology, when the student and instructor are separated by time or space, or both (per
SUDS data element 2052). Traditional (and Technology Enhanced) refers to primarily face to face instruction utilizing some form of
technology for delivery of supplemental course materials for no more than 49% of instruction (per SUDS data element 2052). Totals are
actual and may not equal sum of reported student levels due to rounding of student level FTE. Total FTE are equal in tables 3A, 3B.

21
Annual Accountability Report
2012-2013
UNIVERSITY OF SOUTH FLORIDA - TAMPA
FINAL BOT APPROVED 12-5-2013
Section 4 – Undergraduate Education
TABLE 4A. Baccalaureate Degree Program Changes in AY 2012-13
Title of Program
Six-digit
CIP
Code
Degree
Level
Date of
UBOT
Action
Starting
or Ending
Term
Comments
New Programs
Behavioral Healthcare 44.0000 B 6/14/2012 Fall 1012
Terminated Programs
None
Inactive Programs
None
New Programs Considered By University But Not Approved
None
Note: This table does not include new majors or concentrations added under an existing degree program CIP Code. This table reports the new and terminated program changes based on Board action dates between May 5, 2012 and May 4, 2013. New Programs are proposed new degree programs that have been completely through the approval process at the university and, if appropriate, the Board of Governors. Does not include new majors or concentrations added under an existing degree program CIP Code. Terminated Programs are degree programs for which the entire CIP Code has been terminated and removed from the university’s inventory of degree programs. Does not include majors or concentrations terminated under an existing degree program CIP Code if the code is to remain active on the academic degree inventory. Inactive Programs are degree programs for which enrollments have been temporarily suspended for the entire CIP Code, but the program CIP Code has not been terminated. Does not include majors or concentrations suspended under an existing degree program CIP Code if the code is to remain active on the academic degree inventory and new enrollments in any active major will be reported. New Programs Considered by University But Not Approved includes any programs considered by the university board of trustees, or any committee of the board, but not approved for implementation. Also include any programs that were returned prior to board consideration by the university administration for additional development, significant revisions, or re-conceptualization; regardless of whether the proposal was eventually taken to the university board for approval. Count the returns once per program, not multiple times the proposal was returned for revisions, unless there is a total re-conceptualization that brings forward a substantially different program in a different CIP Code.
22
Annual Accountability Report
2012-2013
UNIVERSITY OF SOUTH FLORIDA - TAMPA
FINAL BOT APPROVED 12-5-2013
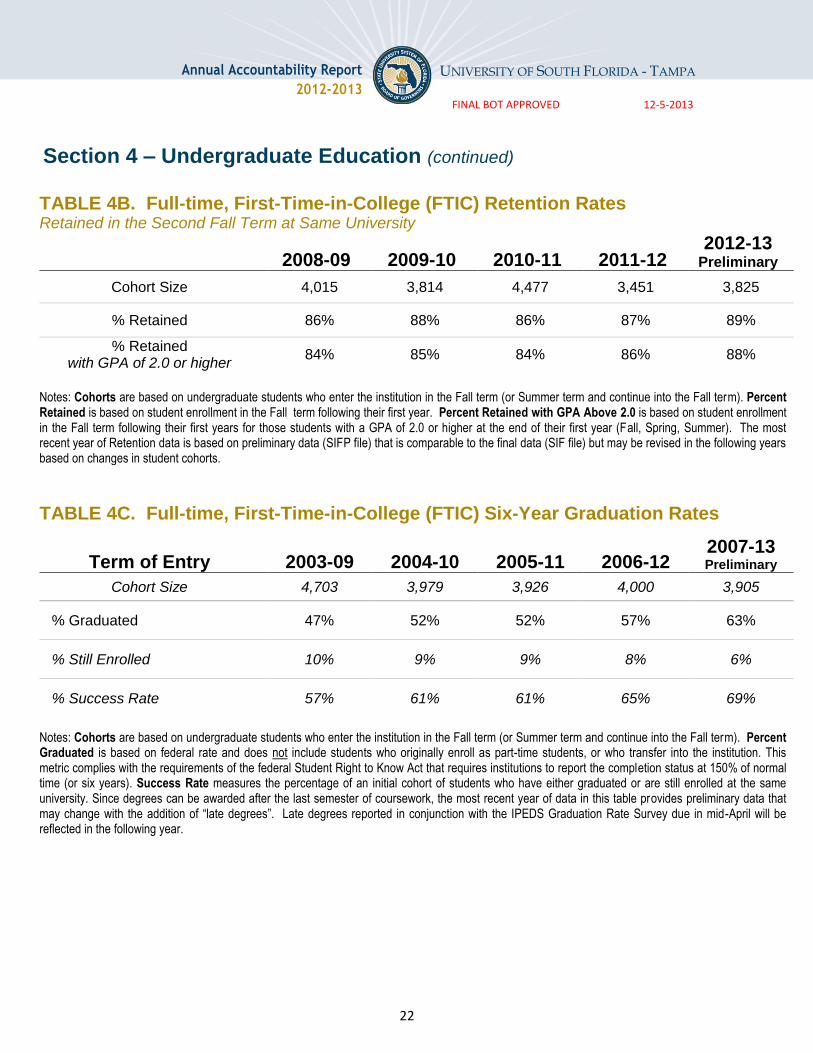
Section 4 – Undergraduate Education (continued)
TABLE 4B. Full-time, First-Time-in-College (FTIC) Retention Rates Retained in the Second Fall Term at Same University
2008-09 2009-10 2010-11 2011-12
2012-13 Preliminary
Cohort Size 4,015 3,814 4,477 3,451 3,825
% Retained 86% 88% 86% 87% 89%
% Retained with GPA of 2.0 or higher
84% 85% 84% 86% 88%
Notes: Cohorts are based on undergraduate students who enter the institution in the Fall term (or Summer term and continue into the Fall term). Percent Retained is based on student enrollment in the Fall term following their first year. Percent Retained with GPA Above 2.0 is based on student enrollment in the Fall term following their first years for those students with a GPA of 2.0 or higher at the end of their first year (Fall, Spring, Summer). The most recent year of Retention data is based on preliminary data (SIFP file) that is comparable to the final data (SIF file) but may be revised in the following years based on changes in student cohorts.
TABLE 4C. Full-time, First-Time-in-College (FTIC) Six-Year Graduation Rates
Term of Entry 2003-09 2004-10 2005-11 2006-12 2007-13 Preliminary
Cohort Size 4,703 3,979 3,926 4,000 3,905
% Graduated 47% 52% 52% 57% 63%
% Still Enrolled 10% 9% 9% 8% 6%
% Success Rate 57% 61% 61% 65% 69%
Notes: Cohorts are based on undergraduate students who enter the institution in the Fall term (or Summer term and continue into the Fall term). Percent Graduated is based on federal rate and does not include students who originally enroll as part-time students, or who transfer into the institution. This metric complies with the requirements of the federal Student Right to Know Act that requires institutions to report the completion status at 150% of normal time (or six years). Success Rate measures the percentage of an initial cohort of students who have either graduated or are still enrolled at the same university. Since degrees can be awarded after the last semester of coursework, the most recent year of data in this table provides preliminary data that may change with the addition of “late degrees”. Late degrees reported in conjunction with the IPEDS Graduation Rate Survey due in mid-April will be reflected in the following year.
23
Annual Accountability Report
2012-2013
UNIVERSITY OF SOUTH FLORIDA - TAMPA
FINAL BOT APPROVED 12-5-2013
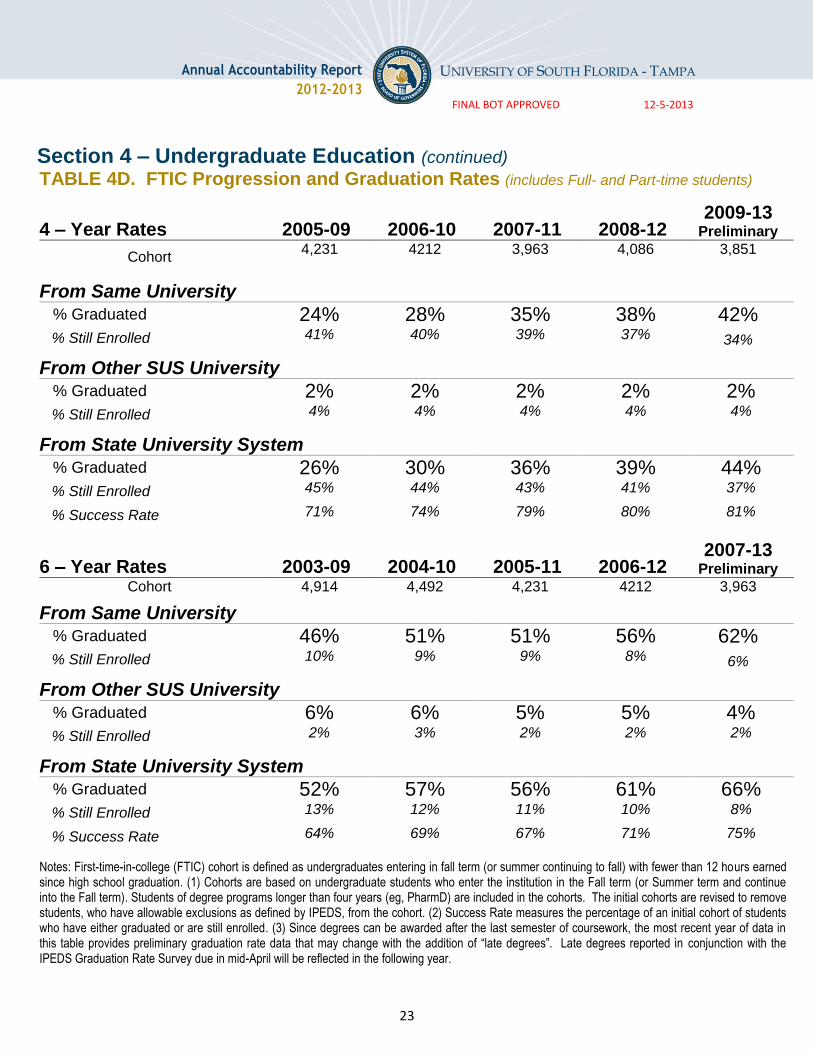
Section 4 – Undergraduate Education (continued)
TABLE 4D. FTIC Progression and Graduation Rates (includes Full- and Part-time students)
4 – Year Rates 2005-09 2006-10 2007-11 2008-12
2009-13 Preliminary
Cohort 4,231 4212 3,963 4,086 3,851
From Same University
% Graduated 24% 28% 35% 38% 42% % Still Enrolled 41% 40% 39% 37% 34%
From Other SUS University
% Graduated 2% 2% 2% 2% 2% % Still Enrolled 4% 4% 4% 4% 4%
From State University System
% Graduated 26% 30% 36% 39% 44% % Still Enrolled 45% 44% 43% 41% 37%
% Success Rate 71% 74% 79% 80% 81%
6 – Year Rates 2003-09 2004-10 2005-11 2006-12
2007-13 Preliminary
Cohort 4,914 4,492 4,231 4212 3,963
From Same University
% Graduated 46% 51% 51% 56% 62% % Still Enrolled 10% 9% 9% 8% 6%
From Other SUS University
% Graduated 6% 6% 5% 5% 4% % Still Enrolled 2% 3% 2% 2% 2%
From State University System
% Graduated 52% 57% 56% 61% 66% % Still Enrolled 13% 12% 11% 10% 8%
% Success Rate 64% 69% 67% 71% 75%
Notes: First-time-in-college (FTIC) cohort is defined as undergraduates entering in fall term (or summer continuing to fall) with fewer than 12 hours earned since high school graduation. (1) Cohorts are based on undergraduate students who enter the institution in the Fall term (or Summer term and continue into the Fall term). Students of degree programs longer than four years (eg, PharmD) are included in the cohorts. The initial cohorts are revised to remove students, who have allowable exclusions as defined by IPEDS, from the cohort. (2) Success Rate measures the percentage of an initial cohort of students who have either graduated or are still enrolled. (3) Since degrees can be awarded after the last semester of coursework, the most recent year of data in this table provides preliminary graduation rate data that may change with the addition of “late degrees”. Late degrees reported in conjunction with the IPEDS Graduation Rate Survey due in mid-April will be reflected in the following year.
24
Annual Accountability Report
2012-2013
UNIVERSITY OF SOUTH FLORIDA - TAMPA
FINAL BOT APPROVED 12-5-2013
Section 4 – Undergraduate Education (continued)
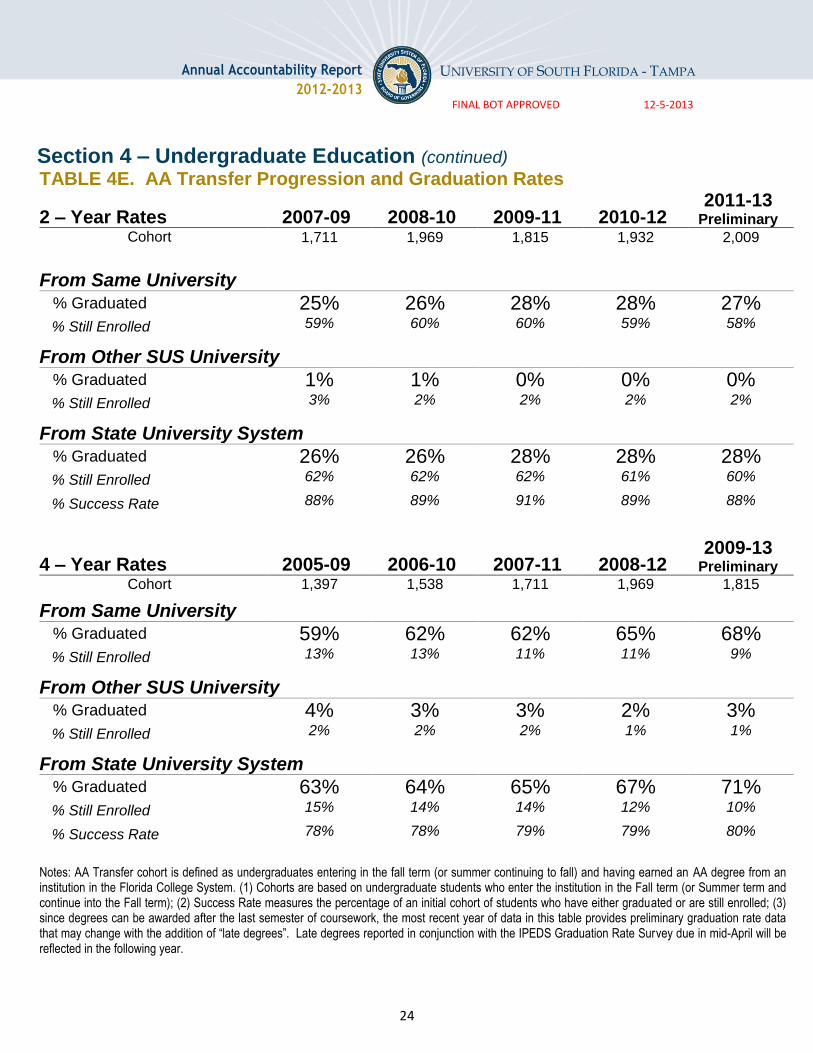
TABLE 4E. AA Transfer Progression and Graduation Rates
2 – Year Rates 2007-09 2008-10 2009-11 2010-12
2011-13 Preliminary
Cohort
1,711 1,969 1,815 1,932 2,009
From Same University
% Graduated 25% 26% 28% 28% 27% % Still Enrolled 59% 60% 60% 59% 58%
From Other SUS University
% Graduated 1% 1% 0% 0% 0% % Still Enrolled 3% 2% 2% 2% 2%
From State University System
% Graduated 26% 26% 28% 28% 28% % Still Enrolled 62% 62% 62% 61% 60%
% Success Rate 88% 89% 91% 89% 88%
4 – Year Rates 2005-09 2006-10 2007-11 2008-12
2009-13 Preliminary
Cohort 1,397 1,538 1,711 1,969 1,815
From Same University
% Graduated 59% 62% 62% 65% 68% % Still Enrolled 13% 13% 11% 11% 9%
From Other SUS University
% Graduated 4% 3% 3% 2% 3% % Still Enrolled 2% 2% 2% 1% 1%
From State University System
% Graduated 63% 64% 65% 67% 71% % Still Enrolled 15% 14% 14% 12% 10%
% Success Rate 78% 78% 79% 79% 80%
Notes: AA Transfer cohort is defined as undergraduates entering in the fall term (or summer continuing to fall) and having earned an AA degree from an institution in the Florida College System. (1) Cohorts are based on undergraduate students who enter the institution in the Fall term (or Summer term and continue into the Fall term); (2) Success Rate measures the percentage of an initial cohort of students who have either graduated or are still enrolled; (3) since degrees can be awarded after the last semester of coursework, the most recent year of data in this table provides preliminary graduation rate data that may change with the addition of “late degrees”. Late degrees reported in conjunction with the IPEDS Graduation Rate Survey due in mid-April will be reflected in the following year.

25
Annual Accountability Report
2012-2013
UNIVERSITY OF SOUTH FLORIDA - TAMPA
FINAL BOT APPROVED 12-5-2013
Section 4 – Undergraduate Education (continued)
TABLE 4F. Other Transfer Progression and Graduation Rates
5 – Year Rates 2004-09 2005-10 2006-11 2007-12 2008- 13 Preliminary
Cohort Size
2026 2064 2,139 2,364 1,877
From Same University
% Graduated 53% 52% 58% 57% 64% % Still Enrolled 7% 7% 7% 6% 6%
From Other SUS University
% Graduated 3% 3% 4% 3% 2% % Still Enrolled 1% 1% 1% 1% 1%
From State University System
% Graduated 56% 55% 62% 61% 66% % Still Enrolled 8% 8% 8% 8% 6%
% Success Rate 64% 62% 70% 68% 73%
Notes: (1) Cohorts are based on undergraduate students who enter the institution in the Fall term (or Summer term and continue into the Fall term); (2) Success Rate measures the percentage of an initial cohort of students who have either graduated or are still enrolled; (3) since degrees can be awarded after the last semester of coursework, the most recent year of data in this table provides preliminary graduation rate data that may change with the addition of “late degrees”. Late degrees reported in conjunction with the IPEDS Graduation Rate Survey due in mid-April will be reflected in the following year.

26
Annual Accountability Report
2012-2013
UNIVERSITY OF SOUTH FLORIDA - TAMPA
FINAL BOT APPROVED 12-5-2013
Section 4 – Undergraduate Education (continued)
TABLE 4G. Baccalaureate Degrees Awarded
2008-09 2009-10 2010-11 2011-12 2012-13
Degree Count 6,140 6,723 6,845 7,780 7,617
Note: Table 4G represents the counts of distinct baccalaureate degrees. In those cases where baccalaureate degrees are awarded under two different degree CIPs, a distinction is made between “dual degrees” and “dual majors.” Dual degrees are counted as separate degrees (i.e., counted twice), and include those cases where the second major differs substantially from the first because either the college is different, the degree designation is different (e.g., BA, BS, BBA, BFA, etc.), or the degree CIP is in a different 2-digit range (e.g., 51* vs. 52*); in these cases, the second degree CIP receives a “degree fraction” of 1.0. If these conditions do not apply, the second major is considered a dual major, and the degree associated with it is not counted a second time; in these cases, each dual major degree CIP receives a degree fraction of .5 apiece. The calculation of degree fractions is made according to each institution’s criteria. In those rare cases where there are three or more awarded baccalaureate degree CIPs, analogous logic is extended to cover the additional degree CIPs and their corresponding degree fractions.
TABLE 4H. Baccalaureate Degrees Awarded in Programs of Strategic Emphasis
2008-09 2009-10 2010-11 2011-12 2012-13 Science, Technology, Engineering, and Math
1,323 1,472 1,554 1,844 1,987
Health Professions *only disciplines in critical need
414 432 439 683 803
Security and Emergency Services
321 356 383 394 435
Globalization 432 454 490 560 500
Education *only disciplines in critical need
85 91 109 132 112
SUBTOTAL 2,575 2,805 2,975 3,613 3,837
Percentage of All Baccalaureate
Degrees (includes second majors) 42% 42% 43% 46% 49%
Notes: This is a count of baccalaureate majors for specific Programs of Strategic Emphasis, as determined by the Board of Governors staff with consultation with business and industry groups and input from universities. A student who has multiple majors in the subset of targeted Classification of Instruction Program codes will be counted twice (i.e., double-majors are included). * This data represents select disciplines within these five areas and does not reflect all degrees awarded within the general field (of education or health). The Board of Governors will review Board staff recommendations to update this list at their November 2013 meeting. Any changes from that meeting will be incorporated into subsequent Accountability Reports. Note: The denominator used in the percentage includes second majors that are not reported in the degree count in table 4G.

27
Annual Accountability Report
2012-2013
UNIVERSITY OF SOUTH FLORIDA - TAMPA
FINAL BOT APPROVED 12-5-2013
Section 4 – Undergraduate Education (continued)
TABLE 4I. Baccalaureate Degrees Awarded to Underrepresented Groups
2008-09 2009-10 2010-11 2011-12 2012-13
Non-Hispanic Black
Number of Degrees 786 795 845 881 884
Percentage of Degrees 14% 13% 13% 11% 12%
Hispanic
Number of Degrees 759 830 1,013 1,312 1,285
Percentage of Degrees 13% 13% 16% 17% 17%
Pell-Grant Recipients
Number of Degrees 2,578 2,806 3,130 3,859 4,039
Percentage of Degrees 43% 42% 46% 50% 54%
Note: Non-Hispanic Black and Hispanic do not include students classified as Non-Resident Alien or students with a missing race code. Students who earn two distinct degrees in the same term are counted twice – whether their degrees are from the same six-digit CIP code or different CIP codes. Students who earn only one degree are counted once – even if they completed multiple majors or tracks. Percentage of Degrees is based on the number of baccalaureate degrees awarded to non-Hispanic Black and Hispanic students divided by the total degrees awarded - excluding those awarded to non-resident aliens and unreported. Pell-Grant recipients are defined as those students who have received a Pell grant from any SUS Institution within six years of graduation - excluding those awarded to non-resident aliens, who are only eligible for Pell grants in special circumstances. Percentage of Degrees is based on the number of baccalaureate degrees awarded to Pell recipients, as shown above, divided by the total degrees awarded - excluding those awarded to non-resident aliens. Notes on Trends: In 2007, the US Department of Education re-classified the taxonomy for self-reported race/ethnicity categories and allowed universities a two-year phase-in process before all institutions were required to report based on the new categories for the 2010-11 academic year. This reclassification will impact trends.
28
Annual Accountability Report
2012-2013
UNIVERSITY OF SOUTH FLORIDA - TAMPA
FINAL BOT APPROVED 12-5-2013
Section 4 – Undergraduate Education (continued)
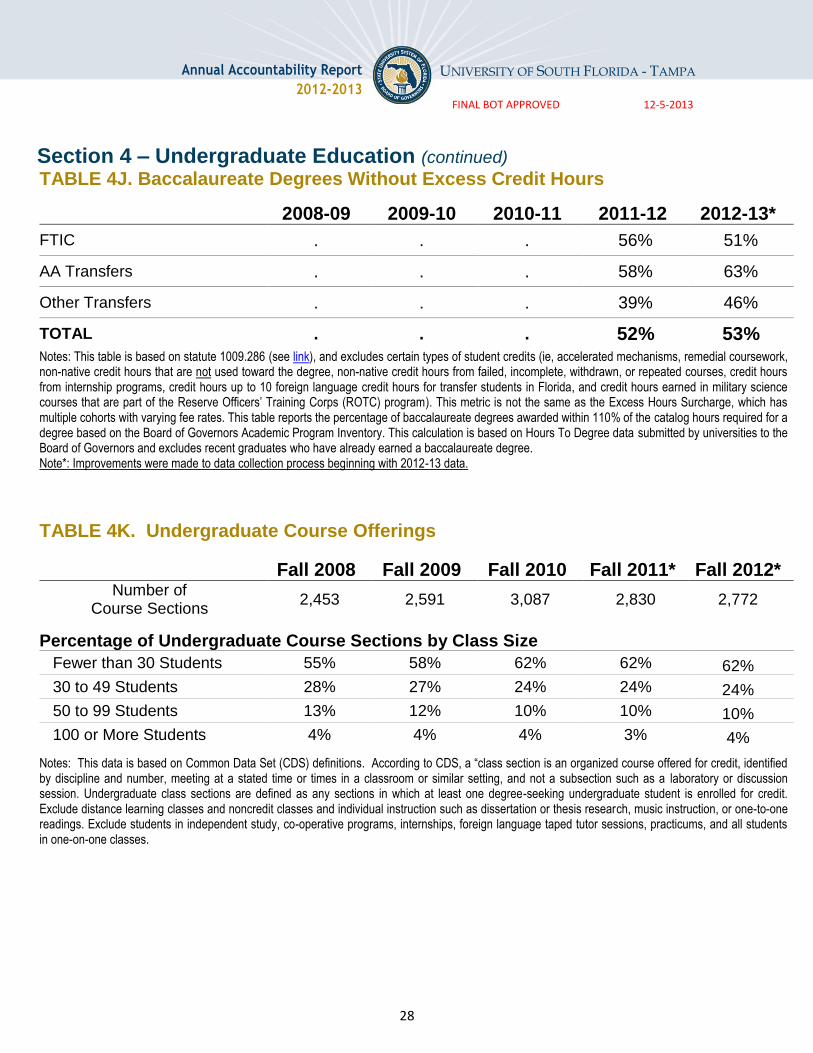
TABLE 4J. Baccalaureate Degrees Without Excess Credit Hours
2008-09 2009-10 2010-11 2011-12 2012-13*
FTIC . . . 56% 51%
AA Transfers . . . 58% 63%
Other Transfers . . . 39% 46%
TOTAL . . . 52% 53% Notes: This table is based on statute 1009.286 (see link), and excludes certain types of student credits (ie, accelerated mechanisms, remedial coursework, non-native credit hours that are not used toward the degree, non-native credit hours from failed, incomplete, withdrawn, or repeated courses, credit hours from internship programs, credit hours up to 10 foreign language credit hours for transfer students in Florida, and credit hours earned in military science courses that are part of the Reserve Officers’ Training Corps (ROTC) program). This metric is not the same as the Excess Hours Surcharge, which has multiple cohorts with varying fee rates. This table reports the percentage of baccalaureate degrees awarded within 110% of the catalog hours required for a degree based on the Board of Governors Academic Program Inventory. This calculation is based on Hours To Degree data submitted by universities to the Board of Governors and excludes recent graduates who have already earned a baccalaureate degree. Note*: Improvements were made to data collection process beginning with 2012-13 data.
TABLE 4K. Undergraduate Course Offerings
Fall 2008 Fall 2009 Fall 2010 Fall 2011* Fall 2012*
Number of Course Sections
2,453 2,591 3,087 2,830 2,772
Percentage of Undergraduate Course Sections by Class Size
Fewer than 30 Students 55% 58% 62% 62% 62%
30 to 49 Students 28% 27% 24% 24% 24%
50 to 99 Students 13% 12% 10% 10% 10%
100 or More Students 4% 4% 4% 3% 4%
Notes: This data is based on Common Data Set (CDS) definitions. According to CDS, a “class section is an organized course offered for credit, identified by discipline and number, meeting at a stated time or times in a classroom or similar setting, and not a subsection such as a laboratory or discussion session. Undergraduate class sections are defined as any sections in which at least one degree-seeking undergraduate student is enrolled for credit. Exclude distance learning classes and noncredit classes and individual instruction such as dissertation or thesis research, music instruction, or one-to-one readings. Exclude students in independent study, co-operative programs, internships, foreign language taped tutor sessions, practicums, and all students in one-on-one classes.
29
Annual Accountability Report
2012-2013
UNIVERSITY OF SOUTH FLORIDA - TAMPA
FINAL BOT APPROVED 12-5-2013
Section 4 – Undergraduate Education (continued)
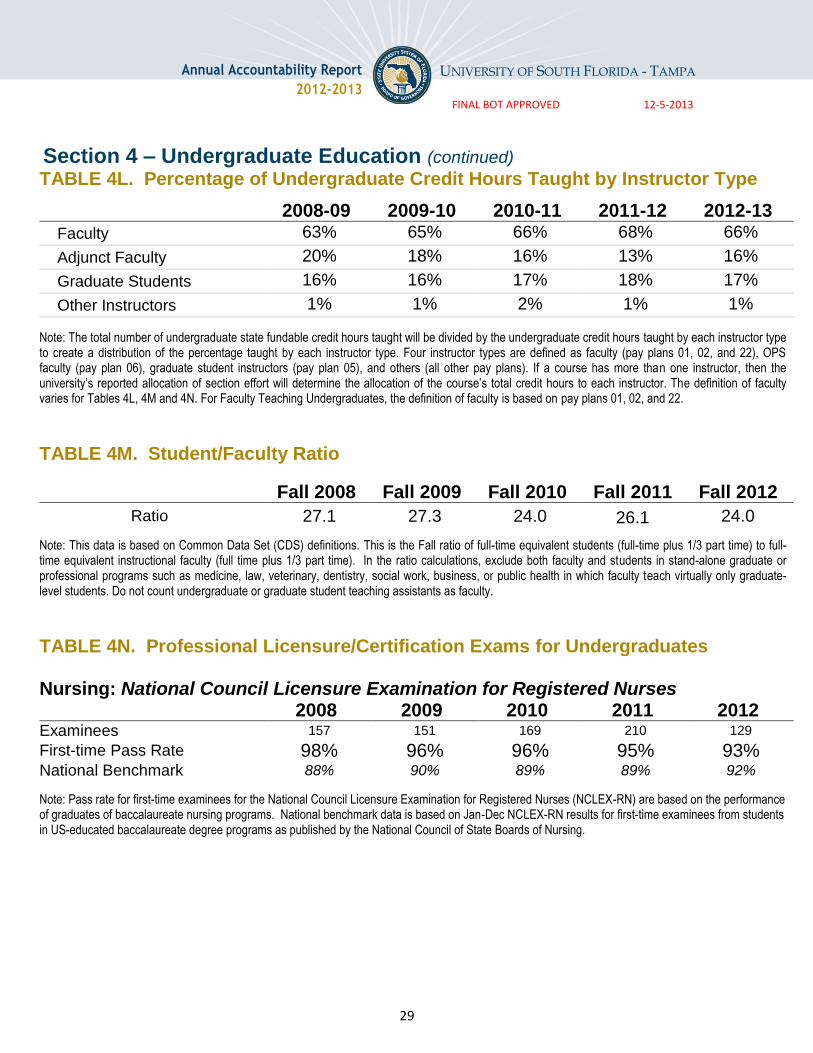
TABLE 4L. Percentage of Undergraduate Credit Hours Taught by Instructor Type
2008-09 2009-10 2010-11 2011-12 2012-13
Faculty 63% 65% 66% 68% 66%
Adjunct Faculty 20% 18% 16% 13% 16%
Graduate Students 16% 16% 17% 18% 17%
Other Instructors 1% 1% 2% 1% 1%
Note: The total number of undergraduate state fundable credit hours taught will be divided by the undergraduate credit hours taught by each instructor type to create a distribution of the percentage taught by each instructor type. Four instructor types are defined as faculty (pay plans 01, 02, and 22), OPS faculty (pay plan 06), graduate student instructors (pay plan 05), and others (all other pay plans). If a course has more than one instructor, then the university’s reported allocation of section effort will determine the allocation of the course’s total credit hours to each instructor. The definition of faculty varies for Tables 4L, 4M and 4N. For Faculty Teaching Undergraduates, the definition of faculty is based on pay plans 01, 02, and 22.
TABLE 4M. Student/Faculty Ratio
Fall 2008 Fall 2009 Fall 2010 Fall 2011 Fall 2012
Ratio 27.1 27.3 24.0 26.1 24.0
Note: This data is based on Common Data Set (CDS) definitions. This is the Fall ratio of full-time equivalent students (full-time plus 1/3 part time) to full-time equivalent instructional faculty (full time plus 1/3 part time). In the ratio calculations, exclude both faculty and students in stand-alone graduate or professional programs such as medicine, law, veterinary, dentistry, social work, business, or public health in which faculty teach virtually only graduate-level students. Do not count undergraduate or graduate student teaching assistants as faculty.
TABLE 4N. Professional Licensure/Certification Exams for Undergraduates
Nursing: National Council Licensure Examination for Registered Nurses
2008 2009 2010 2011 2012 Examinees 157 151 169 210 129
First-time Pass Rate 98% 96% 96% 95% 93% National Benchmark 88% 90% 89% 89% 92%
Note: Pass rate for first-time examinees for the National Council Licensure Examination for Registered Nurses (NCLEX-RN) are based on the performance of graduates of baccalaureate nursing programs. National benchmark data is based on Jan-Dec NCLEX-RN results for first-time examinees from students in US-educated baccalaureate degree programs as published by the National Council of State Boards of Nursing.
30
Annual Accountability Report
2012-2013
UNIVERSITY OF SOUTH FLORIDA - TAMPA
FINAL BOT APPROVED 12-5-2013
Section 5 – Graduate Education
TABLE 5A. Graduate Degree Program Changes in AY 2012-13
Title of Program
Six-digit
CIP
Code
Degree
Level
Date of
UBOT
Action
Starting
or Ending
Term
Date of
Board of
Governors Action
Comments
New Programs
Physician Assistant 51.0912 M 3/21/2013 Summer 2015 Tampa
Sport and Entertainment Management
31.0504 M 3/21/2013 Fall 2013 Tampa
Applied Behavior Analysis 42.2814 R 12/8/2012 Fall 2013 6/21/2012 Tampa
Terminated Programs
None
Inactive Programs
None
New Programs Considered By University But Not Approved
None
Note: This table does not include new majors or concentrations added under an existing degree program CIP Code. This table reports the new and terminated program changes based on Board action dates between May 5, 2012 and May 4, 2013. New Programs are proposed new degree programs that have been completely through the approval process at the university and, if appropriate, the Board of Governors. Does not include new majors or concentrations added under an existing degree program CIP Code. Terminated Programs are degree programs for which the entire CIP Code has been terminated and removed from the university’s inventory of degree programs. Does not include majors or concentrations terminated under an existing degree program CIP Code if the code is to remain active on the academic degree inventory. Inactive Programs are degree programs for which enrollments have been temporarily suspended for the entire CIP Code, but the program CIP Code has not been terminated. Does not include majors or concentrations suspended under an existing degree program CIP Code if the code is to remain active on the academic degree inventory and new enrollments in any active major will be reported. New Programs Considered by University But Not Approved includes any programs considered by the university board of trustees, or any committee of the board, but not approved for implementation. Also include any programs that were returned prior to board consideration by the university administration for additional development, significant revisions, or re-conceptualization; regardless of whether the proposal was eventually taken to the university board for approval. Count the returns once per program, not multiple times the proposal was returned for revisions, unless there is a total re-conceptualization that brings forward a substantially different program in a different CIP Code.
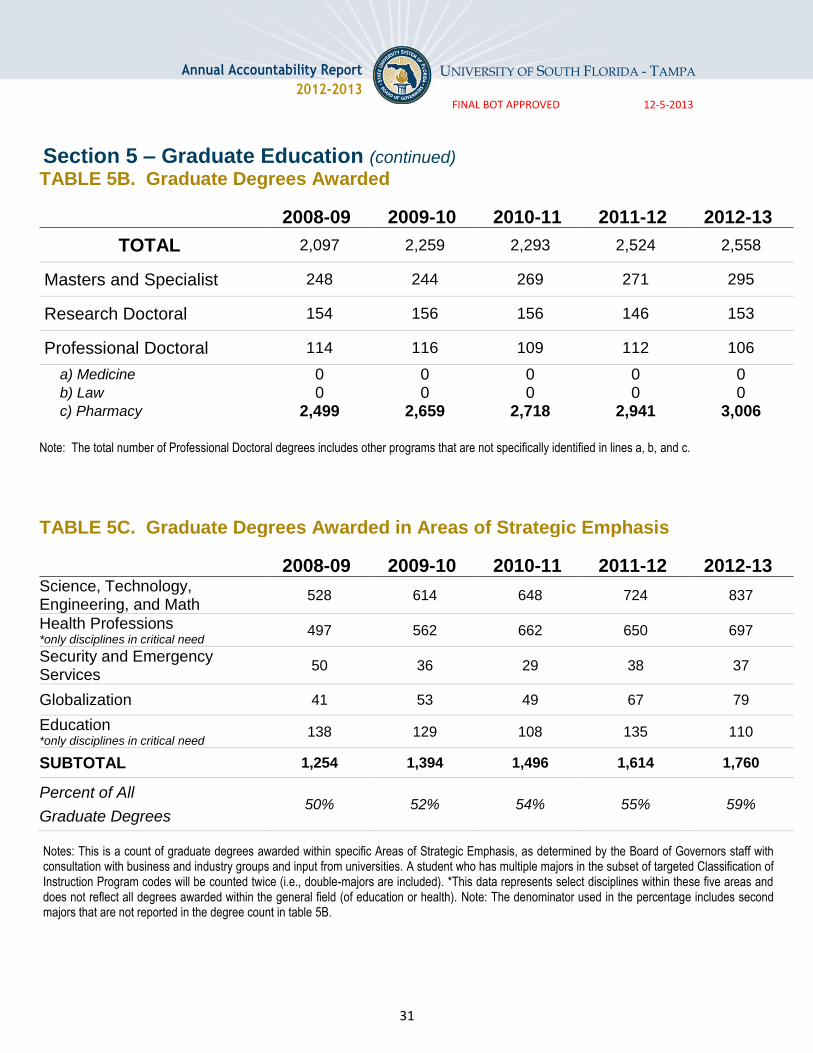
31
Annual Accountability Report
2012-2013
UNIVERSITY OF SOUTH FLORIDA - TAMPA
FINAL BOT APPROVED 12-5-2013
Section 5 – Graduate Education (continued)
TABLE 5B. Graduate Degrees Awarded
2008-09 2009-10 2010-11 2011-12 2012-13
TOTAL 2,097 2,259 2,293 2,524 2,558
Masters and Specialist 248 244 269 271 295
Research Doctoral 154 156 156 146 153
Professional Doctoral 114 116 109 112 106
a) Medicine 0 0 0 0 0 b) Law 0 0 0 0 0 c) Pharmacy 2,499 2,659 2,718 2,941 3,006
Note: The total number of Professional Doctoral degrees includes other programs that are not specifically identified in lines a, b, and c.
TABLE 5C. Graduate Degrees Awarded in Areas of Strategic Emphasis
2008-09 2009-10 2010-11 2011-12 2012-13
Science, Technology, Engineering, and Math
528 614 648 724 837
Health Professions *only disciplines in critical need
497 562 662 650 697
Security and Emergency Services
50 36 29 38 37
Globalization 41 53 49 67 79
Education *only disciplines in critical need
138 129 108 135 110
SUBTOTAL 1,254 1,394 1,496 1,614 1,760
Percent of All
Graduate Degrees 50% 52% 54% 55% 59%
Notes: This is a count of graduate degrees awarded within specific Areas of Strategic Emphasis, as determined by the Board of Governors staff with consultation with business and industry groups and input from universities. A student who has multiple majors in the subset of targeted Classification of Instruction Program codes will be counted twice (i.e., double-majors are included). *This data represents select disciplines within these five areas and does not reflect all degrees awarded within the general field (of education or health). Note: The denominator used in the percentage includes second majors that are not reported in the degree count in table 5B.
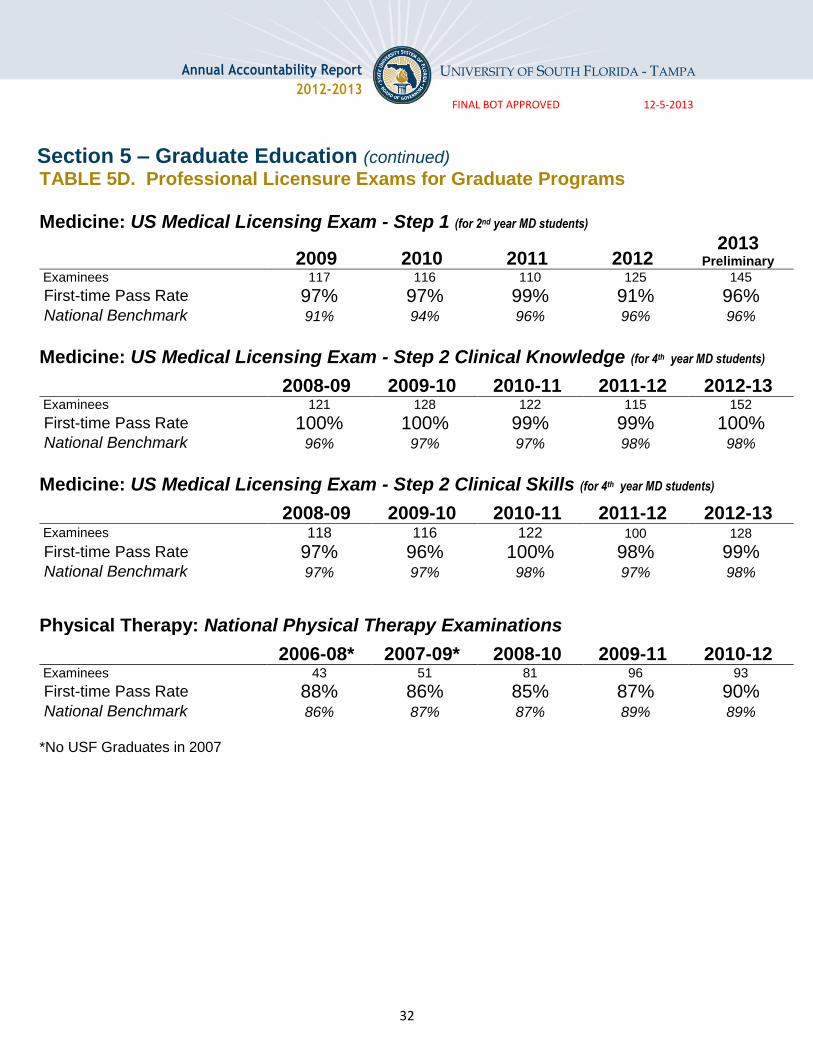
32
Annual Accountability Report
2012-2013
UNIVERSITY OF SOUTH FLORIDA - TAMPA
FINAL BOT APPROVED 12-5-2013
Section 5 – Graduate Education (continued)
TABLE 5D. Professional Licensure Exams for Graduate Programs
Medicine: US Medical Licensing Exam - Step 1 (for 2nd year MD students)
2009 2010 2011 2012
2013 Preliminary
Examinees 117 116 110 125 145
First-time Pass Rate 97% 97% 99% 91% 96% National Benchmark 91% 94% 96% 96% 96%
Medicine: US Medical Licensing Exam - Step 2 Clinical Knowledge (for 4th year MD students)
2008-09 2009-10 2010-11 2011-12 2012-13
Examinees 121 128 122 115 152
First-time Pass Rate 100% 100% 99% 99% 100% National Benchmark 96% 97% 97% 98% 98%
Medicine: US Medical Licensing Exam - Step 2 Clinical Skills (for 4th year MD students)
2008-09 2009-10 2010-11 2011-12 2012-13
Examinees 118 116 122 100 128
First-time Pass Rate 97% 96% 100% 98% 99% National Benchmark 97% 97% 98% 97% 98%
Physical Therapy: National Physical Therapy Examinations
2006-08* 2007-09* 2008-10 2009-11 2010-12
Examinees 43 51 81 96 93
First-time Pass Rate 88% 86% 85% 87% 90% National Benchmark 86% 87% 87% 89% 89%
*No USF Graduates in 2007
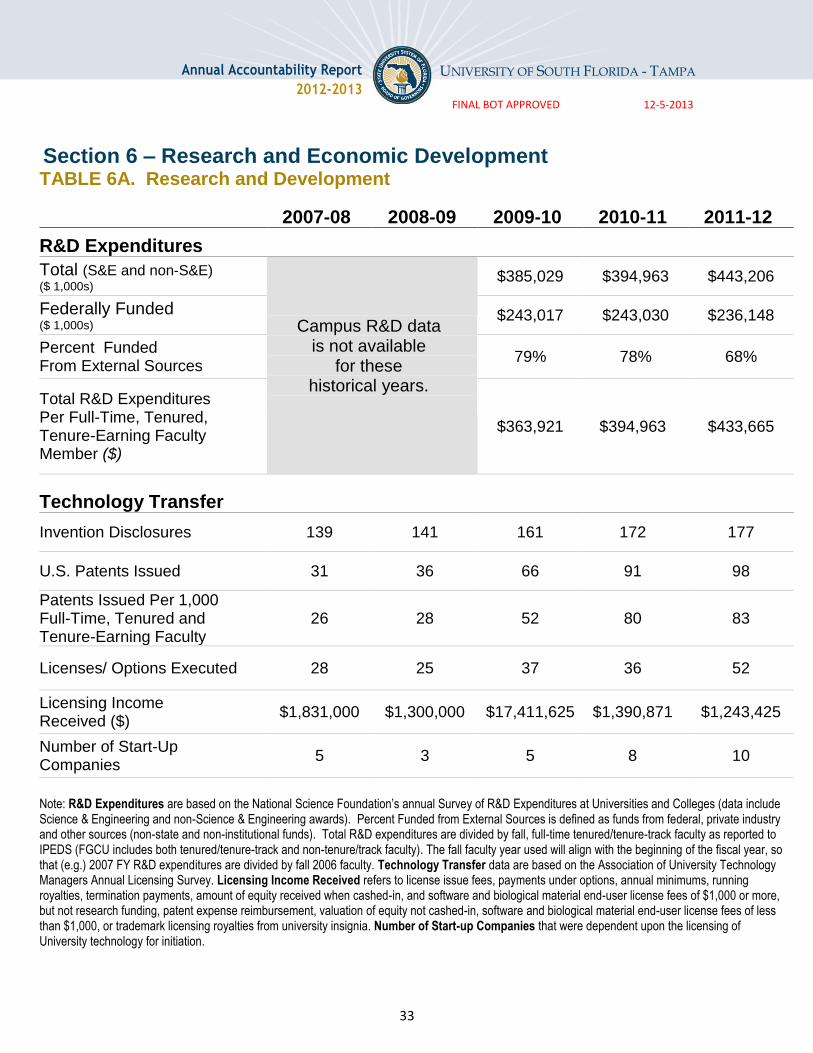
33
Annual Accountability Report
2012-2013
UNIVERSITY OF SOUTH FLORIDA - TAMPA
FINAL BOT APPROVED 12-5-2013
Section 6 – Research and Economic Development
TABLE 6A. Research and Development
2007-08 2008-09 2009-10 2010-11 2011-12
R&D Expenditures
Total (S&E and non-S&E) ($ 1,000s)
Campus R&D data is not available
for these historical years.
$385,029 $394,963 $443,206
Federally Funded ($ 1,000s)
$243,017 $243,030 $236,148
Percent Funded From External Sources
79% 78% 68%
Total R&D Expenditures Per Full-Time, Tenured, Tenure-Earning Faculty Member ($)
$363,921 $394,963 $433,665
Technology Transfer
Invention Disclosures 139 141 161 172 177
U.S. Patents Issued 31 36 66 91 98
Patents Issued Per 1,000 Full-Time, Tenured and Tenure-Earning Faculty
26 28 52 80 83
Licenses/ Options Executed 28 25 37 36 52
Licensing Income Received ($)
$1,831,000 $1,300,000 $17,411,625 $1,390,871 $1,243,425
Number of Start-Up Companies
5 3 5 8 10
Note: R&D Expenditures are based on the National Science Foundation’s annual Survey of R&D Expenditures at Universities and Colleges (data include Science & Engineering and non-Science & Engineering awards). Percent Funded from External Sources is defined as funds from federal, private industry and other sources (non-state and non-institutional funds). Total R&D expenditures are divided by fall, full-time tenured/tenure-track faculty as reported to IPEDS (FGCU includes both tenured/tenure-track and non-tenure/track faculty). The fall faculty year used will align with the beginning of the fiscal year, so that (e.g.) 2007 FY R&D expenditures are divided by fall 2006 faculty. Technology Transfer data are based on the Association of University Technology Managers Annual Licensing Survey. Licensing Income Received refers to license issue fees, payments under options, annual minimums, running royalties, termination payments, amount of equity received when cashed-in, and software and biological material end-user license fees of $1,000 or more, but not research funding, patent expense reimbursement, valuation of equity not cashed-in, software and biological material end-user license fees of less than $1,000, or trademark licensing royalties from university insignia. Number of Start-up Companies that were dependent upon the licensing of University technology for initiation.

34
Annual Accountability Report
2012-2013
UNIVERSITY OF SOUTH FLORIDA - TAMPA
FINAL BOT APPROVED 12-5-2013
Section 6 – Research and Economic Development (continued)
TABLE 6B. Centers of Excellence
Name of Center: CENTER FOR DRUG DISCOVERY AND INNOVATION Cumulative
(since inception
to June 2013)
Fiscal Year
2012-13 Year Created: FY 2007
Research Effectiveness
Only includes data for activities directly associated with the Center. Does not include the non-Center activities for faculty who are associated with the Center.
Number of Competitive Grants Applied For 160 27
Value of Competitive Grants Applied For ($) $111,119,864 $36,950,210
Number of Competitive Grants Received 57 14
Value of Competitive Grants Received ($) $28,428,541 $11,159,368
Total Research Expenditures ($) $18,156,103 $2,703,320
Number of Publications in Refereed Journals
From Center Research 172 25
Number of Invention Disclosures 42 14
Number of Licenses/Options Executed 3 1
Licensing Income Received ($) $163,071 $0
Collaboration Effectiveness
Only reports on relationships that include financial or in-kind support.
Collaborations with Other Postsecondary Institutions 62 10
Collaborations with Private Industry 94 25
Collaborations with K-12 Education Systems/Schools 48 0
Undergraduate and Graduate Students Supported
with Center Funds 67 20
Economic Development Effectiveness
Number of Start-Up companies
with a physical presence, or employees, in Florida 0 0
Jobs Created By Start-Up Companies
Associated with the Center 3 3
Specialized Industry Training and Education 14 0
Private-sector Resources Used to Support
the Center's Operations 0 0
Narrative Comments on next page.
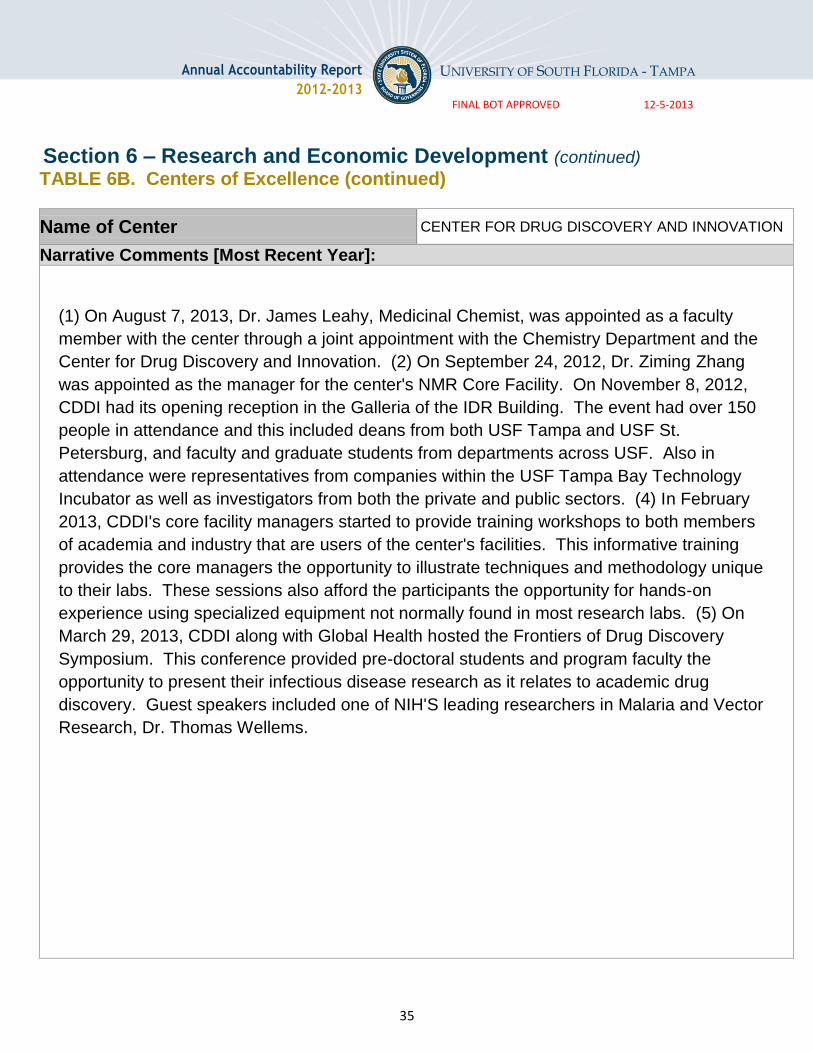
35
Annual Accountability Report
2012-2013
UNIVERSITY OF SOUTH FLORIDA - TAMPA
FINAL BOT APPROVED 12-5-2013
Section 6 – Research and Economic Development (continued)
TABLE 6B. Centers of Excellence (continued)
Name of Center CENTER FOR DRUG DISCOVERY AND INNOVATION
Narrative Comments [Most Recent Year]:
(1) On August 7, 2013, Dr. James Leahy, Medicinal Chemist, was appointed as a faculty
member with the center through a joint appointment with the Chemistry Department and the
Center for Drug Discovery and Innovation. (2) On September 24, 2012, Dr. Ziming Zhang
was appointed as the manager for the center's NMR Core Facility. On November 8, 2012,
CDDI had its opening reception in the Galleria of the IDR Building. The event had over 150
people in attendance and this included deans from both USF Tampa and USF St.
Petersburg, and faculty and graduate students from departments across USF. Also in
attendance were representatives from companies within the USF Tampa Bay Technology
Incubator as well as investigators from both the private and public sectors. (4) In February
2013, CDDI's core facility managers started to provide training workshops to both members
of academia and industry that are users of the center's facilities. This informative training
provides the core managers the opportunity to illustrate techniques and methodology unique
to their labs. These sessions also afford the participants the opportunity for hands-on
experience using specialized equipment not normally found in most research labs. (5) On
March 29, 2013, CDDI along with Global Health hosted the Frontiers of Drug Discovery
Symposium. This conference provided pre-doctoral students and program faculty the
opportunity to present their infectious disease research as it relates to academic drug
discovery. Guest speakers included one of NIH'S leading researchers in Malaria and Vector
Research, Dr. Thomas Wellems.


