DOI: 10.1007/s11099-012-0079-6 PHOTOSYNTHETICA 51 (1): 63-74, 2013 63 Annual and monthly carbon balance in an intensively managed Mediterranean olive orchard M. NARDINO *,+ , F. PERNICE ** , F. ROSSI * , T. GEORGIADIS * , O. FACINI * , A. MOTISI ** , and A. DRAGO *** Institute of Biometeorology, National Research Council, Via P. Gobetti 101, 40129 Bologna, Italy * Department DEMETRA, University of Palermo, Viale delle Scienze 13, 90128 Palermo, Italy ** Regione Sicilia, Viale Regione Siciliana 2771, 90145 Palermo, Italy *** Abstract At present, research activities on the role of orchard systems in sequestering atmospheric CO 2 remain scarce. This paper aimed to contribute to assessing the carbon balance of a Mediterranean olive (Olea europea) orchard. The net ecosystem exchange, the ecosystem respiration and the gross primary production were computed for two consecutive years through eddy covariance, and the different biomass accumulation terms were also inferred in the same period through an inventorial method. The net carbon exchange ranged from 13.45 t(C) ha 1 year 1 to 11.60 t(C) ha 1 year 1 . Very similar values [12.2 and 11.5 t(C) ha 1 year –1 ] were found with the direct carbon accumulation inventory. The intensive farming management (irrigation included) and the young age of the plants (12–16 years old), still in an active growing phase, led the olive plantation to be a higher carbon sink with respect to other evergreen orchards reported in the literature. Additional key words: carbon balance; eddy covariance; net ecosystem exchange; olive orchard. Introduction The potential role of crops in meeting carbon reduction goals such as in the Kyoto Protocol and, in the road ahead, to improving knowledge about the attitude of evergreen orchard ecosystems in absorbing atmospheric carbon dioxide is still an open issue. Photosynthetic carbon uptake data are essential for proper implemen- tation of Life Cycle Assessment (LCA), now used to quantify the environmental impacts of greenhouse gas in the whole production chains (Grunberg et al. 2010 Kilpelainen et al. 2011). Describing the dynamics of ecosystem functioning is also crucial for assessing ecosystem services (Watanabe and Ortega 2011), for estimating and simulating ex- change drivers (Beringer et al. 2011) and, to a great extent, for understanding climate regulation and climate change. In recent years, the Fluxnet network has recorded many studies of exchanges of carbon dioxide, water and heat with a latitude distribution between 70°N–30°S, principally in temperate conifer and broadleaved deci- duous and evergreen forests, short crops, grasslands, wetlands and the tundra. The net carbon and water exchanges in such agricultural systems as orchards have been so far mainly studied with carbon stock methods and, hence, following monitoring procedures that often lack validation. The carbon balance assessment in managed agricultural systems is still biased by many uncertainties because very few micrometeorological towers operate in orchards or other cultivated crops. Agricultural carbon balance assessments are also under the constraints of finding homogeneous extensions to match fetch requirements. Orchards, similarly to all horticultural crops, are ——— Received 27 February 2012, accepted 8 October 2012. + Corresponding author; phone: +39 051 6399001, +39 051 6399029, e-mail: [email protected]Abbreviations: C carbon; CO 2 carbon dioxide; ER ecosystem respiration; F c CO 2 flux; F S storage of CO 2 within the canopy; G soil heat flux; GPP gross primary production; LAI leaf area index; LCA life cycle assessment; LE latent heat flux; H0 sensible heat flux; H 2 O water vapor; IRGA infrared gas analyzer; NEE net ecosystem exchange; NPP net primary production; PPFD photosynthetic photon flux density; R day diurnal ecosystem respiration; R e ecosystem respiration; RLD root length densities; R n net radiation; T air air temperature; u * friction velocity; C(z) change of CO 2 at the height z. Acknowledgments: The research has been carried out in the context of the Project of Relevant National Interest (P.R.I.N) 2008 „Assessment of mass and energy fluxes for the irrigation management of Mediterranean tree crops“ under grant No. 2008CR84NF by Italian Ministry of Research and University (MIUR) and under Regione Siciliana Assessorato Agricoltura e Foreste agreement. The Authors gratefully acknowledge Dr. Giuseppe Dimino and Mr. Antonino Sammartano for their valuable assistance.
Annual and monthly carbon balance in an intensively managed Mediterranean olive orchard M. NARDINO*,+, F. PERNICE**, F. ROSSI*, T. GEORGIADIS*, O. FACINI*, A. MOTISI**, and A. DRAGO*** Institute of Biometeorology, National Research Council, Via P. Gobetti 101, 40129 Bologna, Italy* Department DEMETRA, University of Palermo, Viale delle Scienze 13, 90128 Palermo, Italy** Regione Sicilia, Viale Regione Siciliana 2771, 90145 Palermo, Italy*** Abstract At present, research activities on the role of orchard systems in sequestering atmospheric CO2 remain scarce. This paper aimed to contribute to assessing the carbon balance of a Mediterranean olive (Olea europea) orchard. The net ecosystem exchange, the ecosystem respiration and the gross primary production were computed for two consecutive years through eddy covariance, and the different biomass accumulation terms were also inferred in the same period through an inventorial method. The net carbon exchange ranged from 13.45 t(C) ha1 year1 to 11.60 t(C) ha1 year1. Very similar values [12.2 and 11.5 t(C) ha1 year–1] were found with the direct carbon accumulation inventory. The intensive farming management (irrigation included) and the young age of the plants (12–16 years old), still in an active growing phase, led the olive plantation to be a higher carbon sink with respect to other evergreen orchards reported in the literature. Additional key words: carbon balance; eddy covariance; net ecosystem exchange; olive orchard. Introduction The potential role of crops in meeting carbon reduction goals such as in the Kyoto Protocol and, in the road ahead, to improving knowledge about the attitude of evergreen orchard ecosystems in absorbing atmospheric carbon dioxide is still an open issue. Photosynthetic carbon uptake data are essential for proper implemen-tation of Life Cycle Assessment (LCA), now used to quantify the environmental impacts of greenhouse gas in the whole production chains (Grunberg et al. 2010 Kilpelainen et al. 2011).
Describing the dynamics of ecosystem functioning is also crucial for assessing ecosystem services (Watanabe and Ortega 2011), for estimating and simulating ex-change drivers (Beringer et al. 2011) and, to a great extent, for understanding climate regulation and climate change. In recent years, the Fluxnet network has recorded
many studies of exchanges of carbon dioxide, water and heat with a latitude distribution between 70°N–30°S, principally in temperate conifer and broadleaved deci-duous and evergreen forests, short crops, grasslands, wetlands and the tundra.
The net carbon and water exchanges in such agricultural systems as orchards have been so far mainly studied with carbon stock methods and, hence, following monitoring procedures that often lack validation. The carbon balance assessment in managed agricultural systems is still biased by many uncertainties because very few micrometeorological towers operate in orchards or other cultivated crops. Agricultural carbon balance assessments are also under the constraints of finding homogeneous extensions to match fetch requirements.
Orchards, similarly to all horticultural crops, are ———
Received 27 February 2012, accepted 8 October 2012. +Corresponding author; phone: +39 051 6399001, +39 051 6399029, e-mail: [email protected] Abbreviations: C carbon; CO2 carbon dioxide; ER ecosystem respiration; Fc CO2 flux; FS storage of CO2 within the canopy; G soil heat flux; GPP gross primary production; LAI leaf area index; LCA life cycle assessment; LE latent heat flux; H0 sensible heat flux; H2O water vapor; IRGA infrared gas analyzer; NEE net ecosystem exchange; NPP net primary production; PPFD photosynthetic photon flux density; Rday diurnal ecosystem respiration; Re ecosystem respiration; RLD root length densities; Rn net radiation; Tair air temperature; u* friction velocity; C(z) change of CO2 at the height z. Acknowledgments: The research has been carried out in the context of the Project of Relevant National Interest (P.R.I.N) 2008 „Assessment of mass and energy fluxes for the irrigation management of Mediterranean tree crops“ under grant No. 2008CR84NF by Italian Ministry of Research and University (MIUR) and under Regione Siciliana Assessorato Agricoltura e Foreste agreement. The Authors gratefully acknowledge Dr. Giuseppe Dimino and Mr. Antonino Sammartano for their valuable assistance.
M. NARDINO et al.
64
strongly affected by human actions. Different locally adopted management and farming techniques are capable of strongly influencing plant physiology and conse-quently modifying carbon exchange efficiency. Geno-typic differences among cultivars with different geo-graphic origins may add variability to the photosynthetic response within the same species, as observed in olive trees by Bacelar et al. (2009).
Biodiversity is much lower than in natural forests, thus affecting soil biological activity and respiration; nutrients are supplied and not limited; and agricultural management practices such as pruning reduce plant to plant competition for light and water. When the orchard is irrigated, as it is the case in many Mediterranean areas, the summer water stress that may strongly reduce carbon assimilation from the canopy is avoided or strongly limited (Smith 2004). Unlike annual crops, orchards for fruit production are able to sequester C for a lifetime period of at least 20–25 consecutive years, with small annual fluctuations (Liguori et al. 2009). The role of orchards as efficient atmospheric carbon sinks is also favoured by vigorous growth (although dependent on the adopted rootstocks and the practiced soil management) and by high leaf area densities.
The information characterising orchard abilities to sequester carbon must also consider evergreen and deciduous fruit trees: it is intuitive that evergreen species (such as olive, orange, and lemon) may constitute a better C sink due to their year round activity. For intensive deciduous orchards, Tagliavini et al. (2008) have observed in apple an NPP value of 4.7 t(C) ha–1 year–1, and Montanaro et al. (2008) observed a value of 5.1 t(C) ha–1 year –1 in peach. Rossi et al. (2007) measured a net
ecosystem exchange (NEE) of 3.09 t(C) ha–1 year–1 during the vegetative period in a kiwifruit field. For evergreen species, Liguori et al. (2009) reported a net primary production (NPP) of 6.9 t(C) ha–1 year –1 for the low density traditional orange orchard system and 7.1 t(C) ha–1 year –1 for the high density intensive system. In these orange orchards, NEE was calculated as 2.4 t(C) ha–1 year –1 and 3.3 t(C) ha–1 year –1, respectively.
The farming community now accepts the concept of high quality production for certain crops, characterised by strong linkages with the territory and by providing several innovative paths for growing traditional crops. Several major technological changes have been adopted in the olive management systems over the last decades. The traditional low density (lower than 100 trees/ha), rain fed orchard, with low inputs of fertilizer and pesticides and manual harvests, has been gradually replaced by intensive (200–400 trees/ha) drip irrigated systems, with reduced tillage and intensive mechanised cultivation (Villalobos et al. 2006). Such a technological innovation has increased single tree ecophysiological activity and structural orchard carbon sequestration potential, driving toward positive repercussions in productivity (Pernice et al. 2009).
Our case study was an intensive advanced production model, where for centuries soil and climate characteristics have provided the best environmental conditions for olive growth in this important Mediterranean region. This crop has been historically part of the agronomical, social and economic substrate of the area as one of the most important agricultural product, prominent for landscape added value and profit to farmers.
Materials and methods Site: The measurements were carried out in an olive orchard (cv. Nocellara del Belice) located in Castel-vetrano (37°38’40’’N, 12°50’47’’E, Italy). The site is part of the Italian CARBOITALY network (http://www. europe-fluxdata.eu/newtcdc2/ carboitaly_home.aspx) within the European CARBOEUROPE frame (http:// www.carboeurope.org/).
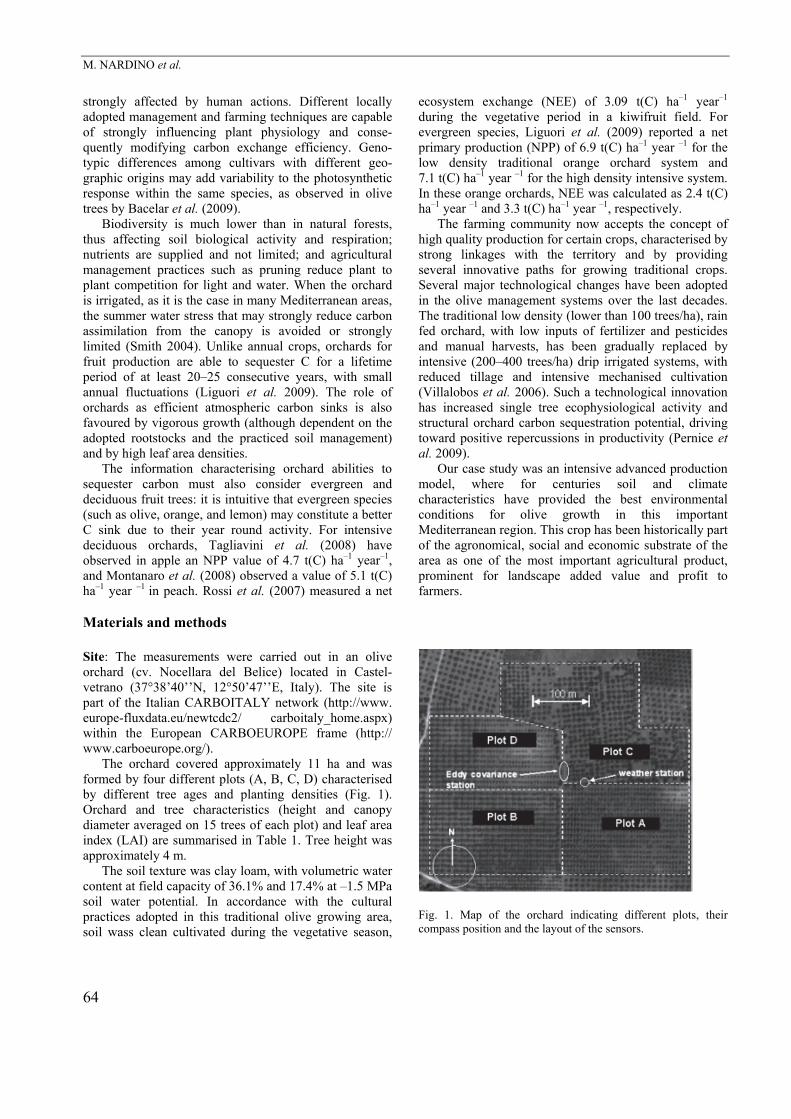
The orchard covered approximately 11 ha and was formed by four different plots (A, B, C, D) characterised by different tree ages and planting densities (Fig. 1). Orchard and tree characteristics (height and canopy diameter averaged on 15 trees of each plot) and leaf area index (LAI) are summarised in Table 1. Tree height was approximately 4 m.
The soil texture was clay loam, with volumetric water content at field capacity of 36.1% and 17.4% at –1.5 MPa soil water potential. In accordance with the cultural practices adopted in this traditional olive growing area, soil wass clean cultivated during the vegetative season,
Fig. 1. Map of the orchard indicating different plots, their compass position and the layout of the sensors.
OLIVE ORCHARD NET ECOSYSTEM EXCHANGE
65
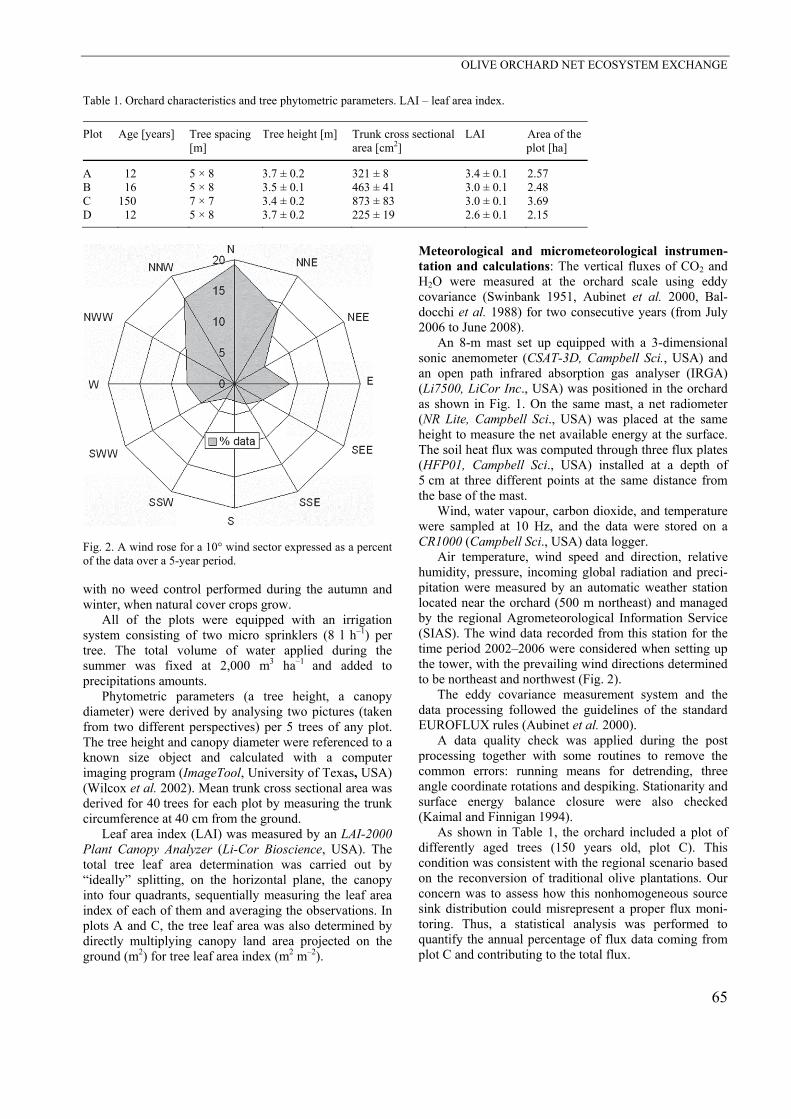
Table 1. Orchard characteristics and tree phytometric parameters. LAI – leaf area index.
Fig. 2. A wind rose for a 10° wind sector expressed as a percent of the data over a 5-year period. with no weed control performed during the autumn and winter, when natural cover crops grow.
All of the plots were equipped with an irrigation system consisting of two micro sprinklers (8 l h–1) per tree. The total volume of water applied during the summer was fixed at 2,000 m3 ha–1 and added to precipitations amounts.
Phytometric parameters (a tree height, a canopy diameter) were derived by analysing two pictures (taken from two different perspectives) per 5 trees of any plot. The tree height and canopy diameter were referenced to a known size object and calculated with a computer imaging program (ImageTool, University of Texas, USA) (Wilcox et al. 2002). Mean trunk cross sectional area was derived for 40 trees for each plot by measuring the trunk circumference at 40 cm from the ground.
Leaf area index (LAI) was measured by an LAI-2000 Plant Canopy Analyzer (Li-Cor Bioscience, USA). The total tree leaf area determination was carried out by “ideally” splitting, on the horizontal plane, the canopy into four quadrants, sequentially measuring the leaf area index of each of them and averaging the observations. In plots A and C, the tree leaf area was also determined by directly multiplying canopy land area projected on the ground (m2) for tree leaf area index (m2 m–2).
Meteorological and micrometeorological instrumen-tation and calculations: The vertical fluxes of CO2 and H2O were measured at the orchard scale using eddy covariance (Swinbank 1951, Aubinet et al. 2000, Bal-docchi et al. 1988) for two consecutive years (from July 2006 to June 2008).
An 8-m mast set up equipped with a 3-dimensional sonic anemometer (CSAT-3D, Campbell Sci., USA) and an open path infrared absorption gas analyser (IRGA) (Li7500, LiCor Inc., USA) was positioned in the orchard as shown in Fig. 1. On the same mast, a net radiometer (NR Lite, Campbell Sci., USA) was placed at the same height to measure the net available energy at the surface. The soil heat flux was computed through three flux plates (HFP01, Campbell Sci., USA) installed at a depth of 5 cm at three different points at the same distance from the base of the mast.
Wind, water vapour, carbon dioxide, and temperature were sampled at 10 Hz, and the data were stored on a CR1000 (Campbell Sci., USA) data logger.
Air temperature, wind speed and direction, relative humidity, pressure, incoming global radiation and preci-pitation were measured by an automatic weather station located near the orchard (500 m northeast) and managed by the regional Agrometeorological Information Service (SIAS). The wind data recorded from this station for the time period 2002–2006 were considered when setting up the tower, with the prevailing wind directions determined to be northeast and northwest (Fig. 2).
The eddy covariance measurement system and the data processing followed the guidelines of the standard EUROFLUX rules (Aubinet et al. 2000).
A data quality check was applied during the post processing together with some routines to remove the common errors: running means for detrending, three angle coordinate rotations and despiking. Stationarity and surface energy balance closure were also checked (Kaimal and Finnigan 1994).
As shown in Table 1, the orchard included a plot of differently aged trees (150 years old, plot C). This condition was consistent with the regional scenario based on the reconversion of traditional olive plantations. Our concern was to assess how this nonhomogeneous source sink distribution could misrepresent a proper flux moni-toring. Thus, a statistical analysis was performed to quantify the annual percentage of flux data coming from plot C and contributing to the total flux.
M. NARDINO et al.
66
As remarked by Aubinet et al. (2000), the major errors in calculating fluxes may occur during the noctur-nal stable atmospheric conditions. To minimise this effect, the storage of CO2 within the canopy was esti-mated with the time change in the CO2 concentration measured at the top of the mast (Greco and Baldocchi 1996):
ΔzΔt
ΔC(z)FΔS
(1)
where C(z) is the change in CO2 at the height z, t is the time period, and z is the height of measurement.
To avoid underestimating the nocturnal surface exchanges (Moncrieff et al. 1996, Aubinet et al. 2000, Falge et al. 2001), the night data were carefully inspected to detect invalid values (i.e., negative values of carbon dioxide flux or values of respiration outside of the trend). Such a procedure was preferred over the more usually adopted correction based on an established threshold u* (friction velocity) value because of the regular structure of the orchard orography and the sparse arrangement of trees.
Data quality check procedures and some occasional failure of the system led to a data coverage of 66% of the whole period. Therefore, a procedure of data gap filling was adopted to compute the annual and monthly NEE. When the gaps were smaller than three consecutive hours, data were linearly interpolated. In all the other cases, the non linear regression method was applied (Falge et al. 2001). Missing values of CO2 flux (Fc) were calculated using the regression relationships established between Fc and measured temperature (nightime) and radiation (daytime) on monthly bases.
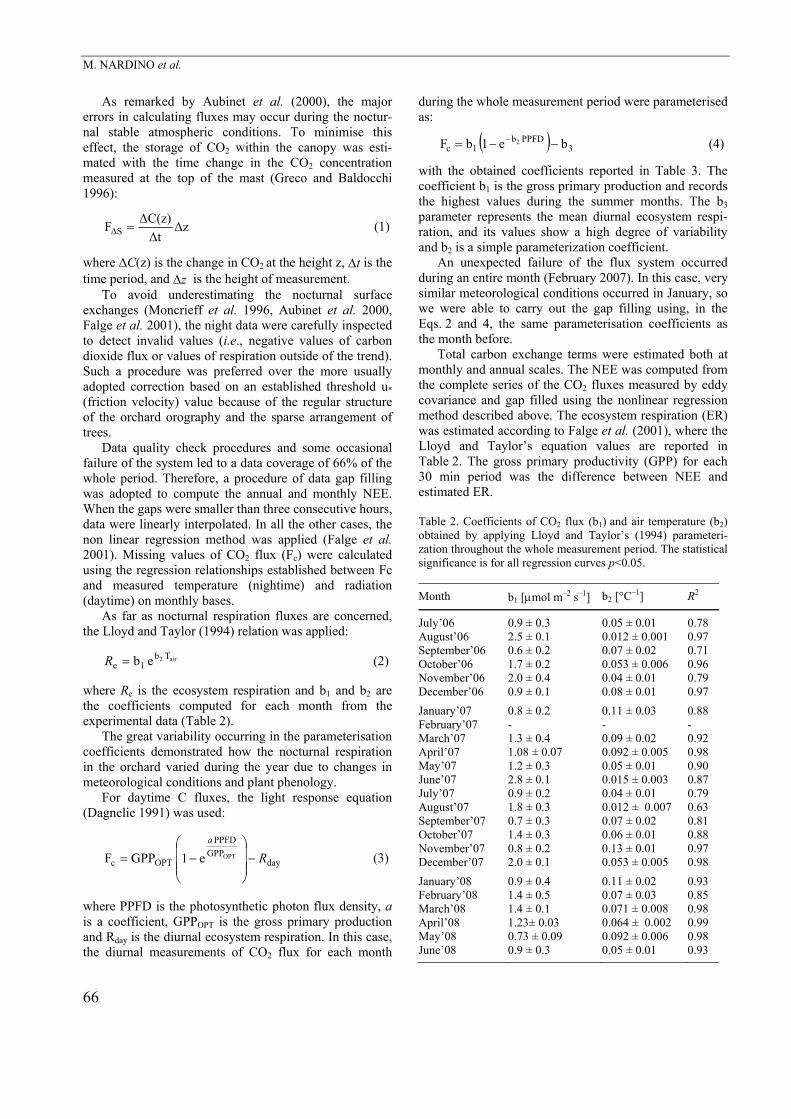
As far as nocturnal respiration fluxes are concerned, the Lloyd and Taylor (1994) relation was applied:
air2 Tb1e ebR
(2)
where Re is the ecosystem respiration and b1 and b2 are the coefficients computed for each month from the experimental data (Table 2).
The great variability occurring in the parameterisation coefficients demonstrated how the nocturnal respiration in the orchard varied during the year due to changes in meteorological conditions and plant phenology.
For daytime C fluxes, the light response equation (Dagnelie 1991) was used:
dayGPP
PPFD
OPTcOPTe1GPPF R
a
(3)
where PPFD is the photosynthetic photon flux density, a is a coefficient, GPPOPT is the gross primary production and Rday is the diurnal ecosystem respiration. In this case, the diurnal measurements of CO2 flux for each month
during the whole measurement period were parameterised as:
3PPFDb
1c be1bF 2
(4)
with the obtained coefficients reported in Table 3. The coefficient b1 is the gross primary production and records the highest values during the summer months. The b3 parameter represents the mean diurnal ecosystem respi-ration, and its values show a high degree of variability and b2 is a simple parameterization coefficient.
An unexpected failure of the flux system occurred during an entire month (February 2007). In this case, very similar meteorological conditions occurred in January, so we were able to carry out the gap filling using, in the Eqs. 2 and 4, the same parameterisation coefficients as the month before.
Total carbon exchange terms were estimated both at monthly and annual scales. The NEE was computed from the complete series of the CO2 fluxes measured by eddy covariance and gap filled using the nonlinear regression method described above. The ecosystem respiration (ER) was estimated according to Falge et al. (2001), where the Lloyd and Taylor’s equation values are reported in Table 2. The gross primary productivity (GPP) for each 30 min period was the difference between NEE and estimated ER. Table 2. Coefficients of CO2 flux (b1) and air temperature (b2)
obtained by applying Lloyd and Taylor’s (1994) parameteri-zation throughout the whole measurement period. The statistical significance is for all regression curves p<0.05.
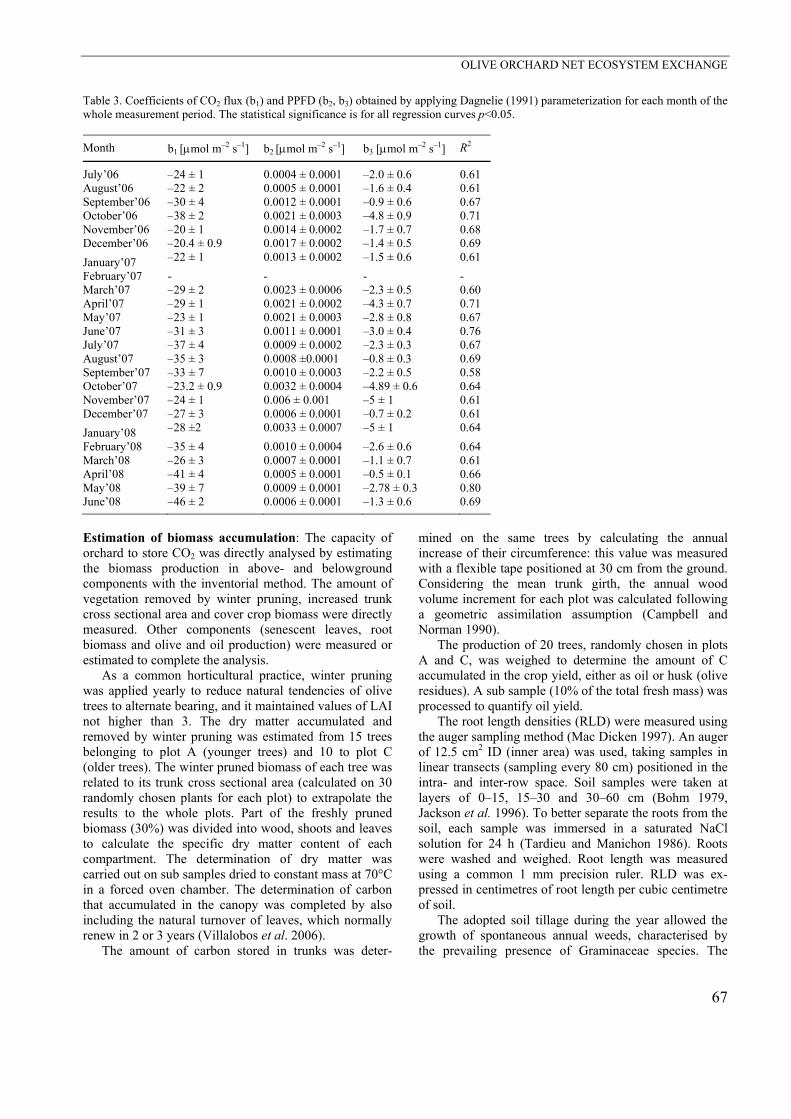
Table 3. Coefficients of CO2 flux (b1) and PPFD (b2, b3) obtained by applying Dagnelie (1991) parameterization for each month of the whole measurement period. The statistical significance is for all regression curves p<0.05.
Estimation of biomass accumulation: The capacity of orchard to store CO2 was directly analysed by estimating the biomass production in above- and belowground components with the inventorial method. The amount of vegetation removed by winter pruning, increased trunk cross sectional area and cover crop biomass were directly measured. Other components (senescent leaves, root biomass and olive and oil production) were measured or estimated to complete the analysis.
As a common horticultural practice, winter pruning was applied yearly to reduce natural tendencies of olive trees to alternate bearing, and it maintained values of LAI not higher than 3. The dry matter accumulated and removed by winter pruning was estimated from 15 trees belonging to plot A (younger trees) and 10 to plot C (older trees). The winter pruned biomass of each tree was related to its trunk cross sectional area (calculated on 30 randomly chosen plants for each plot) to extrapolate the results to the whole plots. Part of the freshly pruned biomass (30%) was divided into wood, shoots and leaves to calculate the specific dry matter content of each compartment. The determination of dry matter was carried out on sub samples dried to constant mass at 70°C in a forced oven chamber. The determination of carbon that accumulated in the canopy was completed by also including the natural turnover of leaves, which normally renew in 2 or 3 years (Villalobos et al. 2006).
The amount of carbon stored in trunks was deter-
mined on the same trees by calculating the annual increase of their circumference: this value was measured with a flexible tape positioned at 30 cm from the ground. Considering the mean trunk girth, the annual wood volume increment for each plot was calculated following a geometric assimilation assumption (Campbell and Norman 1990).
The production of 20 trees, randomly chosen in plots A and C, was weighed to determine the amount of C accumulated in the crop yield, either as oil or husk (olive residues). A sub sample (10% of the total fresh mass) was processed to quantify oil yield.
The root length densities (RLD) were measured using the auger sampling method (Mac Dicken 1997). An auger of 12.5 cm2 ID (inner area) was used, taking samples in linear transects (sampling every 80 cm) positioned in the intra- and inter-row space. Soil samples were taken at layers of 0–15, 15–30 and 30–60 cm (Bohm 1979, Jackson et al. 1996). To better separate the roots from the
soil, each sample was immersed in a saturated NaCl solution for 24 h (Tardieu and Manichon 1986). Roots were washed and weighed. Root length was measured using a common 1 mm precision ruler. RLD was ex-pressed in centimetres of root length per cubic centimetre of soil.
The adopted soil tillage during the year allowed the growth of spontaneous annual weeds, characterised by the prevailing presence of Graminaceae species. The
M. NARDINO et al.
68
accumulation of C in this covercrop was calculated by measuring its LAI (LI-COR LAI 2000, LiCor Inc., USA) and then harvesting its entire biomass (including roots) in
6 randomly chosen sampling areas (6 m2 each, 3 in plot A and 3 in plot C). Covercrops were weighted and dried to constant mass at 70 °C in a forced oven chamber.
Results
Flux calculation: The meteorological data of the site, typical of a Mediterranean area, are reported in Fig. 3. The homogeneity of the surface was the main basic constraint for a correct application of the eddy co-variance. The olive orchard was selected based on its area (11 ha) and of the better vegetation homogeneity of the
surrounding area (mainly olive orchards), the very flat terrain and the satisfaction of the fetch requirements.
A footprint analysis was carried out over a one year period (July 2006–June 2007) following the methodology proposed by Schuepp et al. (1990). Fig. 4 shows the upwind distances most likely contributed to our measured
Fig. 3. Trend of two years of measurements of (A) daily mean air temperature, (B) daily cumulative precipi-tation, and (C) daily incom-ing radiation.
total fluxes. The fetch of the surface confirmed that the measurements were entirely within a well developed olive crop boundary layer and, thus, correctly expressed the local fluxes (Barkza et al. 2009). A large number of the dots concentrated in the northeast (NE) wind direction sector, where the centenary trees were located. To assess their relative contribution to total flux quantification, a further two year classification of wind direction was carried out (Table 4). Approximately 35% of wind events came from the NE direction, while 65% came from all other directions, where younger trees were grown. Within these percentages, the amount of daily data was only 22% for the NE direction. This allowed us to consider the relative contribution of old and less physiologically active trees as scarcely important to the total computation of orchard C flux (about 7.5% of the total). Olea europea has been commonly grown in the Medi-
terranean basin, where prolonged droughts occur mainly in the summer. This species has developed a series of physiological mechanisms, some of them common to several plants of the Mediterranean macchia, to tolerate drought stress and grow under hot and arid conditions. Although irrigated, this species has also shown low energy partitions in term of the latent heat flux of evapo-transpiration. During a typical day of a summer month (variations that were not relevant were found during the complete analysis), the percentage of available energy used for turbulent water exchange was slightly less than 20%, while approximately 53% was spent for surface atmosphere heat exchange and 17% was stored in the soil. Similarly as shown by Sofo et al. (2008), the adapta-tion to a high temperature and a low water consumption was also shown here. The orchard did not show any decreasing trends in daily photosynthesis, manifesting a
OLIVE ORCHARD NET ECOSYSTEM EXCHANGE
69
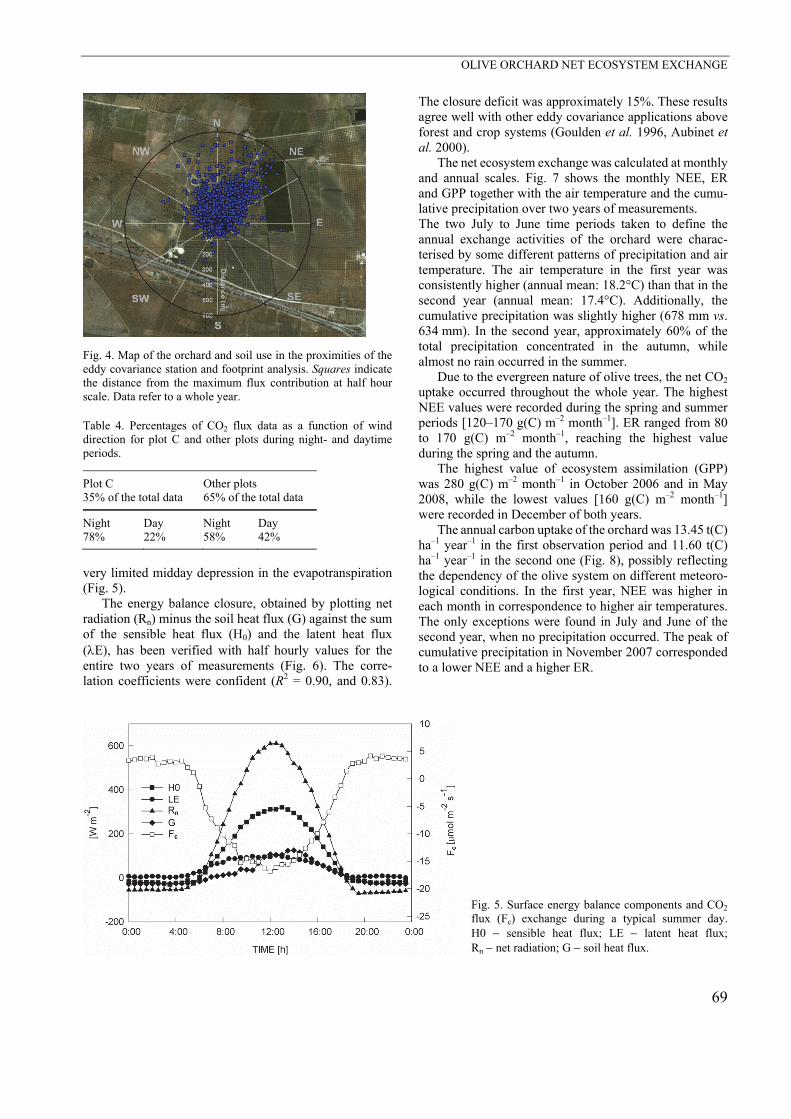
Fig. 4. Map of the orchard and soil use in the proximities of the eddy covariance station and footprint analysis. Squares indicate the distance from the maximum flux contribution at half hour scale. Data refer to a whole year. Table 4. Percentages of CO2 flux data as a function of wind direction for plot C and other plots during night- and daytime periods.
Plot C Other plots 35% of the total data 65% of the total data
Night Day Night Day 78% 22% 58% 42%
very limited midday depression in the evapotranspiration (Fig. 5).
The energy balance closure, obtained by plotting net radiation (Rn) minus the soil heat flux (G) against the sum of the sensible heat flux (H0) and the latent heat flux (E), has been verified with half hourly values for the entire two years of measurements (Fig. 6). The corre-lation coefficients were confident (R2 = 0.90, and 0.83).
The closure deficit was approximately 15%. These results agree well with other eddy covariance applications above forest and crop systems (Goulden et al. 1996, Aubinet et al. 2000).
The net ecosystem exchange was calculated at monthly and annual scales. Fig. 7 shows the monthly NEE, ER and GPP together with the air temperature and the cumu-lative precipitation over two years of measurements. The two July to June time periods taken to define the annual exchange activities of the orchard were charac-terised by some different patterns of precipitation and air temperature. The air temperature in the first year was consistently higher (annual mean: 18.2°C) than that in the second year (annual mean: 17.4°C). Additionally, the cumulative precipitation was slightly higher (678 mm vs. 634 mm). In the second year, approximately 60% of the total precipitation concentrated in the autumn, while almost no rain occurred in the summer.
Due to the evergreen nature of olive trees, the net CO2 uptake occurred throughout the whole year. The highest NEE values were recorded during the spring and summer periods [120–170 g(C) m–2 month–1]. ER ranged from 80 to 170 g(C) m–2 month–1, reaching the highest value during the spring and the autumn.
The highest value of ecosystem assimilation (GPP) was 280 g(C) m–2 month–1 in October 2006 and in May 2008, while the lowest values [160 g(C) m–2 month–1] were recorded in December of both years.
The annual carbon uptake of the orchard was 13.45 t(C) ha–1 year–1 in the first observation period and 11.60 t(C) ha–1 year–1 in the second one (Fig. 8), possibly reflecting the dependency of the olive system on different meteoro-logical conditions. In the first year, NEE was higher in each month in correspondence to higher air temperatures. The only exceptions were found in July and June of the second year, when no precipitation occurred. The peak of cumulative precipitation in November 2007 corresponded to a lower NEE and a higher ER.
Fig. 5. Surface energy balance components and CO2
flux (Fc) exchange during a typical summer day. H0 sensible heat flux; LE latent heat flux; Rn net radiation; G soil heat flux.
M. NARDINO et al.
70
Fig. 6. Energy balance closure during two years of measurements. The linear regression (solid line) equation is Rn – G = 1.17 (H0 + E) – 8.04 (R2 = 0.90) for the first year (A) and Rn – G = 1.12 (H0 + E) – 4.02 (R2 = 0.83) for the second year (B). H0 – sensible heat flux; E – latent heat flux; Rn – net radiation; G – soil heat flux; R2 – square correlation coefficient.
Fig. 7. Monthly trends during two years of measurement: (A) mean air temperature, (B) cumulated precipitation, (C) sum of net ecosystem exchange (NEE), (D) sum of ecosystem respiration (ER) and (E) sum of gross primary production (GPP).
OLIVE ORCHARD NET ECOSYSTEM EXCHANGE
71
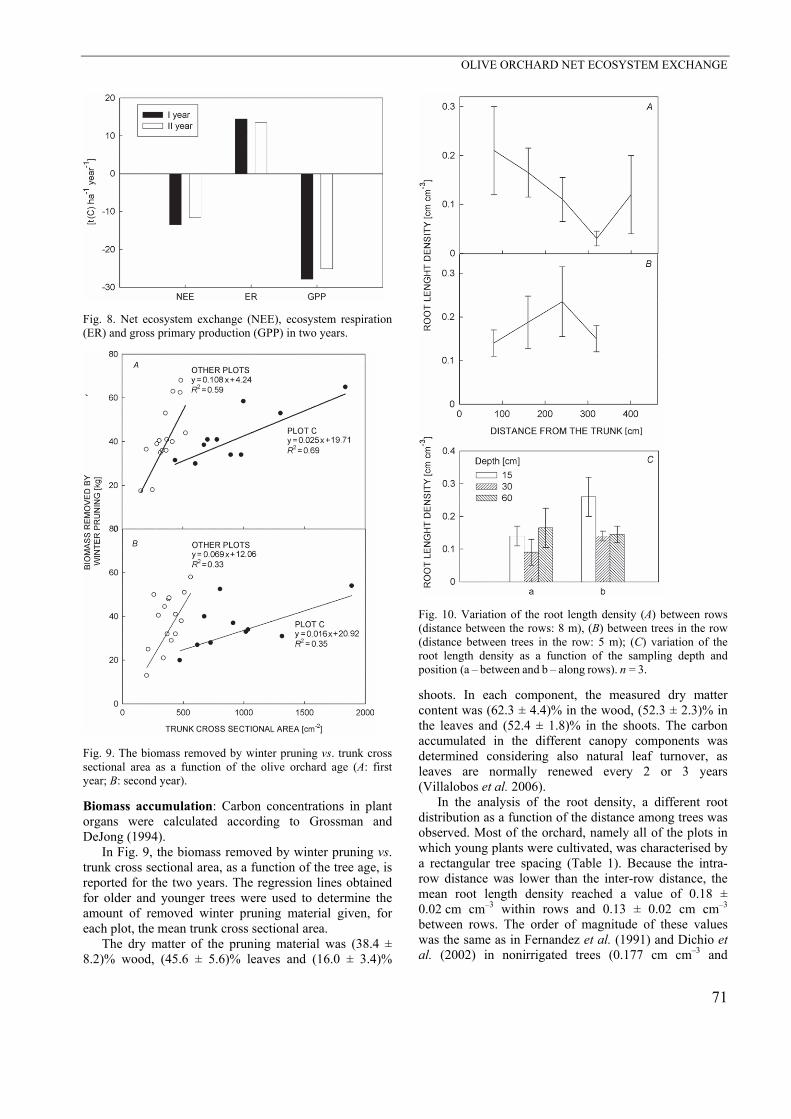
Fig. 8. Net ecosystem exchange (NEE), ecosystem respiration (ER) and gross primary production (GPP) in two years.
Fig. 9. The biomass removed by winter pruning vs. trunk cross sectional area as a function of the olive orchard age (A: first year; B: second year).
Biomass accumulation: Carbon concentrations in plant organs were calculated according to Grossman and DeJong (1994).
In Fig. 9, the biomass removed by winter pruning vs. trunk cross sectional area, as a function of the tree age, is reported for the two years. The regression lines obtained for older and younger trees were used to determine the amount of removed winter pruning material given, for each plot, the mean trunk cross sectional area.
The dry matter of the pruning material was (38.4 ± 8.2)% wood, (45.6 ± 5.6)% leaves and (16.0 ± 3.4)%
Fig. 10. Variation of the root length density (A) between rows (distance between the rows: 8 m), (B) between trees in the row (distance between trees in the row: 5 m); (C) variation of the root length density as a function of the sampling depth and position (a – between and b – along rows). n = 3.
shoots. In each component, the measured dry matter content was (62.3 ± 4.4)% in the wood, (52.3 ± 2.3)% in the leaves and (52.4 ± 1.8)% in the shoots. The carbon accumulated in the different canopy components was determined considering also natural leaf turnover, as leaves are normally renewed every 2 or 3 years (Villalobos et al. 2006).
In the analysis of the root density, a different root distribution as a function of the distance among trees was observed. Most of the orchard, namely all of the plots in which young plants were cultivated, was characterised by a rectangular tree spacing (Table 1). Because the intra-row distance was lower than the inter-row distance, the mean root length density reached a value of 0.18 ± 0.02 cm cm–3 within rows and 0.13 ± 0.02 cm cm–3 between rows. The order of magnitude of these values was the same as in Fernandez et al. (1991) and Dichio et al. (2002) in nonirrigated trees (0.177 cm cm–3 and
M. NARDINO et al.
72
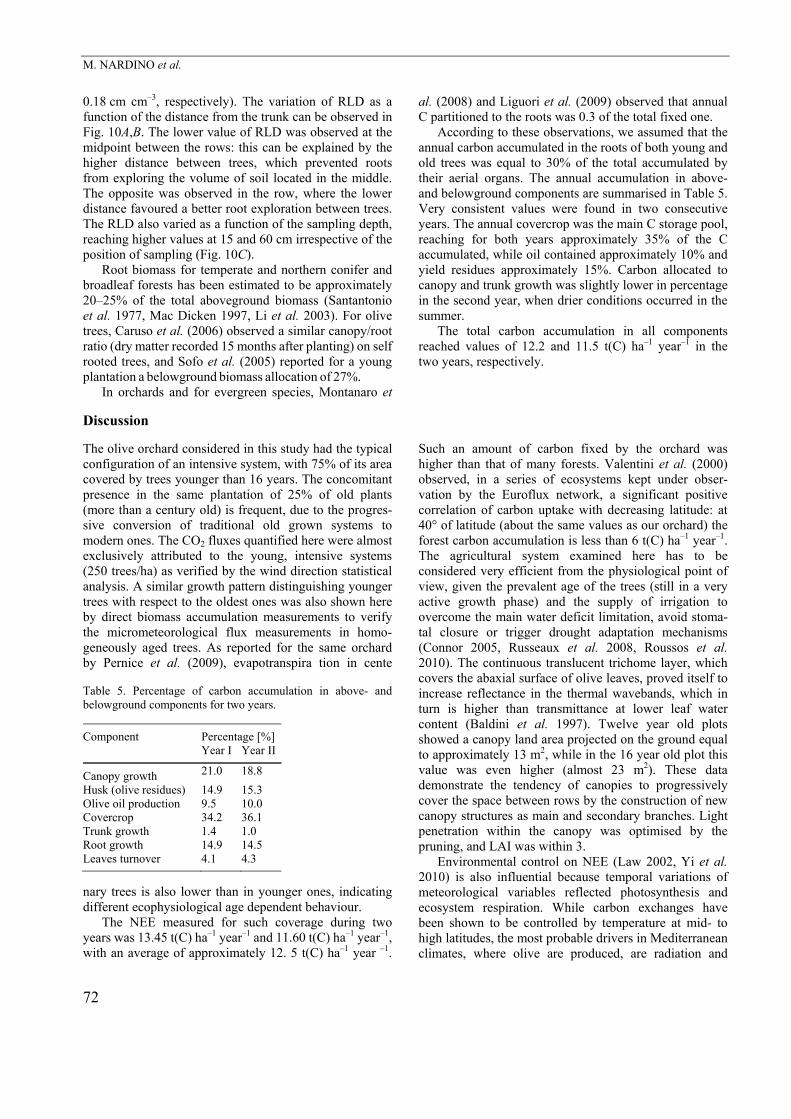
0.18 cm cm–3, respectively). The variation of RLD as a function of the distance from the trunk can be observed in Fig. 10A,B. The lower value of RLD was observed at the midpoint between the rows: this can be explained by the higher distance between trees, which prevented roots from exploring the volume of soil located in the middle. The opposite was observed in the row, where the lower distance favoured a better root exploration between trees. The RLD also varied as a function of the sampling depth, reaching higher values at 15 and 60 cm irrespective of the position of sampling (Fig. 10C).
Root biomass for temperate and northern conifer and broadleaf forests has been estimated to be approximately 20–25% of the total aboveground biomass (Santantonio et al. 1977, Mac Dicken 1997, Li et al. 2003). For olive
trees, Caruso et al. (2006) observed a similar canopy/root ratio (dry matter recorded 15 months after planting) on self rooted trees, and Sofo et al. (2005) reported for a young
plantation a belowground biomass allocation of 27%. In orchards and for evergreen species, Montanaro et
al. (2008) and Liguori et al. (2009) observed that annual C partitioned to the roots was 0.3 of the total fixed one.
According to these observations, we assumed that the annual carbon accumulated in the roots of both young and old trees was equal to 30% of the total accumulated by their aerial organs. The annual accumulation in above- and belowground components are summarised in Table 5. Very consistent values were found in two consecutive years. The annual covercrop was the main C storage pool, reaching for both years approximately 35% of the C accumulated, while oil contained approximately 10% and yield residues approximately 15%. Carbon allocated to canopy and trunk growth was slightly lower in percentage in the second year, when drier conditions occurred in the summer.
The total carbon accumulation in all components reached values of 12.2 and 11.5 t(C) ha–1 year–1 in the two years, respectively.
Discussion
The olive orchard considered in this study had the typical configuration of an intensive system, with 75% of its area covered by trees younger than 16 years. The concomitant presence in the same plantation of 25% of old plants (more than a century old) is frequent, due to the progres-sive conversion of traditional old grown systems to modern ones. The CO2 fluxes quantified here were almost exclusively attributed to the young, intensive systems (250 trees/ha) as verified by the wind direction statistical analysis. A similar growth pattern distinguishing younger trees with respect to the oldest ones was also shown here by direct biomass accumulation measurements to verify the micrometeorological flux measurements in homo-geneously aged trees. As reported for the same orchard by Pernice et al. (2009), evapotranspira tion in cente Table 5. Percentage of carbon accumulation in above- and belowground components for two years.
nary trees is also lower than in younger ones, indicating different ecophysiological age dependent behaviour.
The NEE measured for such coverage during two years was 13.45 t(C) ha–1
year–1 and 11.60 t(C) ha–1
year–1, with an average of approximately 12. 5 t(C) ha–1 year –1.
Such an amount of carbon fixed by the orchard was higher than that of many forests. Valentini et al. (2000) observed, in a series of ecosystems kept under obser-vation by the Euroflux network, a significant positive correlation of carbon uptake with decreasing latitude: at 40° of latitude (about the same values as our orchard) the forest carbon accumulation is less than 6 t(C) ha–1 year–1. The agricultural system examined here has to be considered very efficient from the physiological point of view, given the prevalent age of the trees (still in a very active growth phase) and the supply of irrigation to overcome the main water deficit limitation, avoid stoma-tal closure or trigger drought adaptation mechanisms (Connor 2005, Russeaux et al. 2008, Roussos et al. 2010). The continuous translucent trichome layer, which covers the abaxial surface of olive leaves, proved itself to increase reflectance in the thermal wavebands, which in turn is higher than transmittance at lower leaf water content (Baldini et al. 1997). Twelve year old plots showed a canopy land area projected on the ground equal to approximately 13 m2, while in the 16 year old plot this value was even higher (almost 23 m2). These data demonstrate the tendency of canopies to progressively cover the space between rows by the construction of new canopy structures as main and secondary branches. Light penetration within the canopy was optimised by the pruning, and LAI was within 3.
Environmental control on NEE (Law 2002, Yi et al. 2010) is also influential because temporal variations of meteorological variables reflected photosynthesis and ecosystem respiration. While carbon exchanges have been shown to be controlled by temperature at mid- to high latitudes, the most probable drivers in Mediterranean climates, where olive are produced, are radiation and
OLIVE ORCHARD NET ECOSYSTEM EXCHANGE
73
water, similar to subtropical and tropical areas (Nemani et al. 2003). A very high number of summer sunny days was, in fact, recorded in our site, with a high net radiation and PAR values.
The scarcity of information on the NEE of fruit tree orchards, olive included, does not allow a comparative analysis between the various species and orchard manage-ment techniques because of the different methodologies adopted (Almagro et al. 2010, Smith et al. 2010).
Here, a micrometeorological based approach was coupled with a biomass based inventorial method. The two independent approaches gave very similar results. The differences between the two records ranged between 9.3% and 0.9% in two years and they were easily explainable with intrinsic biases in the estimation of the aboveground:belowground biomass ratio and in the varia-bility of applied winter pruning intensity among years.
Eddy covariance has now become a well tested tech-nique, if carefully employed, to assess water and carbon exchanges from plant systems and it is able to give reliable information at the orchard scale and at variable temporal scales. Data obtained through this method complement small scale data at the leaf level for understanding the dynamics of the whole orchard as a soil-plant canopy-covercrop system. Ecophysiological traits related to orchard-atmosphere exchanges may be derived at the daily to monthly scale level, providing a dynamic overview within the seasonal growth patterns. On the contrary, the classic inventorial method, although
reliable, is applied only at a larger temporal scale and proves to constitute a sound control for the carbon storage values, as verified here.
The interannual and seasonal variability of the carbon balance terms has been already observed for forest ecosystems (Carrara et al. 2004). As occuring for leaf photosynthesis of the same species (Bongi et al. 1987), NEE showed a temporal dependency on air temperature, evidenced by the higher value (13.45 t C ha–1 year–1) reached in the first year, when the mean annual temperature was 0.8 °C higher. Even if a fixed amount of additional water was provided through irrigation, the precipitation regime was also confirmed to be a carbon exchange driver in Mediterranean olive orchards. This evidence should be taken into account when addressing agrometeorological information to irrigation strategies (Perez-Lopez et al. 2007, Pernice et al. 2009, Rossi 2011).
The role of croplands in the European carbon budget and the potential for carbon sequestration studies are crucial because they can be included in the emission reduction targets (Smith 2004). The results reported here contribute to the assessment of the sink capacity of an important and largely expanding food crop. The relevant amount of NEE quantified is largely supporting the opportunity to couple LCA - calculated greenhouse gas emissions (Liu et al. 2010) with carbon uptakes in order to provide complete assessment of the environmental impacts of orchards.
References
Almagro, M., Lopez, J., Boix-Fayos, C., Albaladejo, J., Martinez-Mena, M.: Belowground carbon allocation patterns in a dry Mediterranean ecosystem: A comparison of two models. Soil Biol. Biochem. 42: 1549-1557, 2010.
Aubinet, M., Grelle, A., Ibrom, A., et al.: Estimates of the annual net carbon and water exchange of forests: The EURO-FLUX methodology. Adv. Ecol. Res. 30: 113-175, 2000.
Bacelar, E.A., Moutinho-Peras, J.M., Gocalves, B.C. et al.: Physiological responses of different olive genotypes to drought conditions. Acta Physiol. Plant. 31: 611-621, 2009.
Baldini, E., Facini, O., Nerozzi, F. et al.: Leaf characteristics and optical responses of different woody species. Trees 12: 73-81, 1997.
Baldocchi, D.D., Hicks, B.B., Meyers, T.P.: Measuring biosphere-atmosphere exchange of biologically related gases with micrometeorological methods. Ecology 69: 1331-1340, 1988.
Barkza, Z., Kern, A., Haszpra, L., Klijun, N.: Spatial representa-tiveness of tall tower eddy covariance measurements using remote sensing and footprint analysis. Agr. Forest Meteorol. 149: 795-807, 2009.
Beringer, J., Hutley, L.B., Hacker, J.M., Neininger, B., U, K.T.P.: Pattern and processes of carbon, water and energy cycles across northern Australian landscape: from point to region. Agr. Forest Meteorol. 151: 1409-1416, 2011.
Bohm, W.: Methods of Studying Root Systems. Pp. 188-188. Springer Press., New York 1979.
Bongi, G., Mencuccini, M., Fonatanazza G.: Photosynthesis of
olive leaves: effect of light flux density, leaf age, temperature, peltate, and H2O vapor pressure deficit on gas exchange. J. Amer. Soc. Hort. Sci. 112: 143-165, 1987.
Campbell, J.S., Norman, J.M.: The description and measurement of plant canopy structure. – In: Russel, G., Marshall, B, Jarvis, P. (ed.): Plant structures. Their Growth, Form and Function. Soc. Exp. Biol. Seminar Series 31: 1-19, 1990.
Carrara, A., Janssens, I.A., Yuste, J.C., Ceulemans, R.: Seasonal changes in photosynthesis, respiration and NEE of a mixed temperate forest. Agr. Forest Meteorol. 126: 15-31, 2004.
Caruso, T., Motisi, A., Buffa R. et al.: [Mechanisms involved in controlling the growth of the olive through the use of rootstock.] Frutticoltura 3: 51-55, 2006. [In Italian]
Connor, D.J.: Adaptation of olive (Olea europea L.) to water-limited environments. Austr. J. Agr. Res. 56: 1181-1189, 2005.
Dichio, B., Romano, M., Nuzzo, V., Xiloyannis C.: Soil water availability and relationship between canopy and root in young olive trees (cv. Coratina). Acta Hort. 586: 255-258, 2002.
Falge, E., Baldocchi, D.D., Olson, R.J. et al.: Gap filling strategies for defensible annual sums of net ecosystem exchange. Agr. Forest Meteorol. 107: 43-69, 2001.
Fernandez, J.E., Moreno, F., Cabrera, F. et al.: Drip irrigation, soil characteristics and the root distribution and root activity
M. NARDINO et al.
74
of olive trees. Plant Soil 133: 239-251, 1991. Goulden, M.L., Munger, J.W., Fan, S.M. et al.: Measurements
of carbon storage by long-term eddy correlation: methods and a critical assessment of accuracy. Global Change Biol. 2: 169-182, 1996.
Greco, S., Baldocchi, D.D.: Seasonal variations of CO2 and water vapor exchange rates over a temperate deciduous forest. Global Change Biol. 2: 183-197, 1996.
Grossman, Y.L., DeJong, T.M.: PEACH: A simulation model of reproductive and vegetative growth in peach trees. Tree Physiol. 14: 329-345, 1994.
Grunberg, J., Nieberg, H., Schmidt, T.G.: [Carbon footprints of food: a critical reflection.] Landbauforschung Volkenrode 60: 53-72, 2010. [In German]
Jackson, R.B., Canadell, J., Ehleringer, J.R. et al.: A global analysis of root distributions for terrestrial biomes. Oecologia 108: 389-411, 1996.
Kaimal, J.C., Finnigan, J.J.: Atmospheric Boundary Layers Flows - Their Structure and Measurement. Pp. 289-289. Oxford Univ. Press, New York 1994.
Kilpeläinen, A., Alam, A., Strandman, H., Kellomäki, S.: Life cycle assessment tool for estimating net CO2 exchange of forest production. Global Change Biol. Bioenergy 3: 461-471, 2011.
Law, B.E., Falge, E., Gu, L. et al.: Environmental controls over carbon dioxide and water vapour exchange of terrestrial vegetation. Agr. Forest Meteorol. 113: 97-120, 2002.
Li, Z., Kurz, W.A., Apps, M.J., Beukema, S.J.: Belowground biomass dynamics in the Carbon Budget Model of the Canadian Forest Sector: recent improvement and implications for the estimation of NPP and NEP. Can. J. Forest Res. 33: 126-136, 2003.
Liguori, G., Gugliuzza, G., Inglese, P.: Evaluating carbon fluxes in orange orchards in relation to planting density. J. Agr. Sci. 147: 637-645, 2009.
Liu, Y.X., Langer, V., Hogh-Jensen, H., Hegelyng H.: Life Cycle Assessment of fossil energy use and greenhouse gas emissions in Chinese pear production. – J. Clean Prod. 18:1423-1430, 2010.
Lloyd, J., Taylor, J.A.: On the temperature dependence of soil respiration. Funct. Ecol. 8: 315-323, 1994.
Mac Dicken, K.: A Guide to Monitoring Carbon Storage in Forestry and Agroforestry Projects. Pp. 89-89. Winrock Int. Inst., Arlington 1997.
Moncrieff, J.B., Malhi, Y., Leuning, R.: The propagation of errors in long-term measurements of land-atmosphere fluxes of carbon and water. Global Change Biol. 2: 231-240, 1996.
Montanaro, G., Dichio, B., Tuzio, A.C. et al.: [The role of fruit multifunctional systems: physiological parameters, management resource and storage of atmospheric carbon.] Rivista Frutticolt. Ortofloricolt. 2: 14-18, 2008. [In Italian]
Nemani, R.R., Keeling, C.D., Hashimoto, H. et al.: Climate-driven increases in global terrestrial net primary production from 1982 to 1999. Science 300: 1560-1563, 2003.
Perez-Lopez, D., Ribas, F., Moriana, A., et al.: The effect of irrigation schedules on the water relations and growth of a young olive (Olea europea L.) orchard. Agr. Water Manage. 89: 297-304, 2007.
Pernice, F., Motisi, A., Rossi, F. et al.: Micrometeorological and sap flow measurements of water vapour exchanges in olive: scaling up from canopy to orchard. Acta Hort. 846: 159-166, 2009.
Rossi, F.: Information systems as a tool in operational agrometeorology: applications to irrigation water management in Emilia Romagna- Italy. In: Attri, S.D., Rathore, L.S., Sivakumar, M.V-K., Dash, S.K. (ed.): Challenges and Opportunities in Agrometeorology. Pp. 299-310. Springer Publ., New York 2011.
Rossi F., Facini O., Georgiadis T., Nardino M.: Seasonal CO2 fluxes and energy balance in a kiwifruit orchard. Ital. J. Agromet. 1: 44-56, 2007.
Roussos, P.A., Denaxa, N.K., Damvakaris, T. et al.: Effect of alleviating products with different mode of action on physiology and yield of olive under drought. Sci. Hort. 1125: 700-711, 2010.
Russeaux, M.C., Bendetti, J.P, Searles, P.S.: Leaf-level responses of olive trees (Olea europaea) to the suspension of irrigation during the winter in an arid region of Argentina. Sci. Hort. 115: 135-141, 2008.
Santantonio, D., Hermann, R.K., Overton, W.S.: Root biomass studies in forest ecosystems. Pedobiologia 17: 1-31, 1977.
Schuepp, P.H., Leclerc, M.Y., Macpherson, J.I., Desjardins, R.L.: Footprint prediction of scalar fluxes from analytical solutions of the diffusion equation. Bound. Layer Meteorol. 50: 355-373, 1990.
Smith, P.: Carbon sequestration in croplands: the potential in Europe and the global context. Eur. J. Agron. 20: 229-236, 2004.
Smith, P., Lanigan, G., Kutsch, W.L., et al.: Measurements necessary for assessing the net eco system carbon budget of croplands. Agr. Ecosyst. Environ. 139: 302-315, 2010.
Sofo, A., Nuzzo, V., Palese, M.A. et al.: Net CO2 storage in Mediterranean olive and peach orchards. Sci. Hort. 107: 17-24, 2005.
Sofo, A., Manfreda, S., Fiorentino, M. et al.: The olive tree: a paradigm for drought tolerance in Mediterranean climates. Hydrol. Earth Syst. Sci. 12: 293-301, 2008.
Swinbank, W.C.: The measurement of vertical transfer of heat and water vapour by eddies in the lower atmosphere. J. Meteorol. 8: 135-145, 1951.
Tagliavini, M., Panzacchi, P., Ceccon, C., et al.: Fluxes of carbon in Italian orchards. Proc. 1st Symposium Hort. Europe, Vienna 2008.
Tardieu, F., Manichon, H.: [Characterization of the radical capture of water in corn crop. A method to study the vertical and horizontal distribution of roots.] Agronomie 6: 415-425, 1986. [In French]
Valentini, R., Matteucci, G., Dolman, A.J. et al.: Respiration as the main determinant of carbon balance in European forests. Nature 404: 861-865, 2000.
Villalobos, F.J., Testi, L., Hidalgo, J. et al.: Modelling potential growth and yield of olive (Olea europaea L.) canopies. Eur. J. Agron. 24: 296-303, 2006.
Watanabe, M.D.B., Ortega, E.: Ecosystem services and biogeochemical cycles on a global scale: valuation of water, carbon and nitrogen processes. Environ. Sci. Policy 14: 594-604, 2011.
Wilcox, D., Dove, B., McDavid, D., Greer, D.: Image Tool for Windows. Version 3.0. University Texas Health Sci. Center, San Antonio 2002.
Yi,C., Ricciuto, D., Li, R. et al.: Climate control of terrestrial carbon exchange across biomes and continents. Environ. Res. Lett. 5, 2010. doi:10.1088/1748-9326/5/3/034007.