Report No. NPS D-982 Annual Data Summary YELLOWSTONE NATIONAL PARK 2001 National Park Service Gaseous Air Pollutant Monitoring Network AIR RESOURCES DIVISION RESEARCH AND MONITORING BRANCH 12795 West Alameda Parkway P.O. Box 25287 Lakewood, Colorado 80225 Telephone: (303) 969-2820 Fax: (303) 969-2822
Transcript
Report No. NPS D-982
Annual Data Summary
YELLOWSTONE NATIONAL PARK
2001
National Park ServiceGaseous Air Pollutant Monitoring Network
AIR RESOURCES DIVISIONRESEARCH AND MONITORING BRANCH
12795 West Alameda ParkwayP.O. Box 25287
Lakewood, Colorado 80225Telephone: (303) 969-2820
Fax: (303) 969-2822
This Annual Data Summary was prepared under NPS Contract CX-1270-96-007 by:
Air Resource Specialists, Inc.1901 Sharp Point Drive, Suite E
Fort Collins, Colorado 80525Telephone: (970) 484-7941
Fax: (970) 484-3423
For additional copies of this report or reports for other NPS units, contact:
National Park Service Air Resources DivisionInformation Management Centerc/o Air Resource Specialists, Inc.1901 Sharp Point Drive, Suite E
Fort Collins, Colorado 80525Telephone: (970) 484-7941
The National Park Service Air Resources Division (ARD) recognizes the level of effortrequired by individual park units, site operators, auditors, cooperating state and local agencies,and ARD contractors. ARD sincerely appreciates the contributions of all participants in assistingwith the collection, validation, and reporting of these air quality and meteorological data.
At Yellowstone National Park, ARD specifically recognizes Susan Ross for performingthe technical and administrative skills required to help produce the data presented within thisreport.
i
TABLE OF CONTENTS Section Page 1.0 INTRODUCTION 1-1 1.1 The National Park Service Gaseous Pollutant Monitoring Network 1-1 1.2 Yellowstone National Park 1-3 2.0 DATA SUMMARY 2-1 2.1 Overview 2-1 2.2 Ozone Data Summary 2-7 2.3 Meteorological Data Summary 2-23 2.4 Dry Deposition Data Summary 2-27 3.0 NATIONAL PARK SERVICE AIR RESOURCES DIVISION DATA SOURCES 3-1 3.1 Guide to Attached Data Disks 3-1 3.2 Other Sources for Retrieving National Park Service Gaseous Pollutant Data 3-1 4.0 GLOSSARY 4-1 4.1 Definitions and Computational Procedures for National Park Service 4-1 Quick Look Annual Summary Statistics Table 4.2 Air Quality Glossary 4-4 4.3 Glossary of Units 4-6
LIST OF FIGURES AND TABLES Page Map of National Park Service Gaseous Pollutant Monitoring Network 1-2 Ozone and Sulfur Dioxide Monitoring Sites Site Specifications 1-4 Data Collection Statistics 2-2 First Quarter Data Stackplot 2-3 Second Quarter Data Stackplot 2-4 Third Quarter Data Stackplot 2-5 Fourth Quarter Data Stackplot 2-6
ii
LIST OF FIGURES AND TABLES (Continued) Page Ozone Quick Look Annual Summary Statistics 2-8 Ozone Annual Frequency Distribution 2-9 Ozone Daily 1-Hour Maximum Concentrations and National Ambient 2-10 Air Quality Standards Comparison Attainment Status with EPA Proposed Primary Ozone Standards 2-11 Ten Highest 1-Hour Average Ozone Concentrations 2-12 Episodes with 1-Hour Ozone Concentrations > 100ppb and > 124 ppb 2-13 Episodes with 8-Hour Ozone Concentrations >84 ppb 2-14 Ozone Rank Listings of Second Highest 1-Hour Average Concentrations, Maximum 2-15 8-Hour Average Concentrations, and Annual Sum60 Exposure Index for All NPS Monitoring Sites Plot of Maximum Ozone Concentration Comparison for Three Years 2-16 Map of National Park Service Gaseous Pollutant Monitoring Network, 2-17 Second Highest Hourly Ozone Concentration Quarterly Diurnal Ozone Plots 2-18 Annual Diurnal Ozone Plot 2-19 Quarterly Ozone Pollutant Roses 2-20 Annual Ozone Pollutant Rose 2-21 Ozone Precision Check Data Summary 2-22
Summary of Selected Meteorological Data 2-24 Quarterly Wind Roses 2-25 Annual Wind Rose 2-26 Quarterly and Annual Average Concentrations 2-28 Weekly Concentrations Report 2-29 Three Year Comparison of Maximum and Average Concentrations 2-30
iii
LIST OF FIGURES AND TABLES (Continued) Page Average Particulate Nitrate Concentrations 2-31 Nitric Acid Concentrations 2-32 Average Total Nitrate Concentrations 2-33 Average Ammonium Concentrations 2-34 Average Particulate Sulfate Concentrations 2-35 Average Sulfur Dioxide Concentrations 2-36 SO4/SO2 Ratio 2-37 Data Disk Contents 3-2 NPS IMC and AIRS Invalid Data Codes 3-3
1-1
1.0 INTRODUCTION
1.1 THE NATIONAL PARK SERVICE GASEOUS POLLUTANTMONITORING NETWORK
Gaseous air pollutants, including ozone and sulfur dioxide, are of concern to theNational Park Service (NPS). Pollutants like these can affect park unit biological resources aswell as the health of park unit residents and visitors. The NPS established a gaseous pollutantmonitoring program for several pollutants linked to effects on NPS resources. This programwas designed to meet certain resource management objectives.
The primary objective of this monitoring program is to establish the status and trends ofpark unit air quality conditions and to determine if a park unit is exceeding the National AmbientAir Quality Standards established by the U.S. Environmental Protection Agency (EPA) toprotect public health and welfare. In addition, such monitoring is designed to detect changes ortrends in pollution levels over time. A monitoring station may also be established if there isdocumented biological injury due to air pollution in a park unit. Information on ambient airpollution levels is an important part of research on effects of air pollutants on NPS resources,and can help confirm suspected causes of observed effects.
Other monitoring objectives call for the collection of data to support the National ParkService's required involvement in both the development of state air quality control plans, and theevaluation of permit applications for new or expanding air pollution sources wishing to locatenear park units. The Clean Air Act gives federal land managers and superintendents anaffirmative responsibility to protect air quality related values in Class I areas and to assesswhether new sources will have an adverse impact on park unit resources and values.Information on air quality levels in NPS units can also be used to evaluate the performance ofatmospheric models that simulate how pollutants are transported into park units and predictimpacts on the park unit caused by air pollution sources.
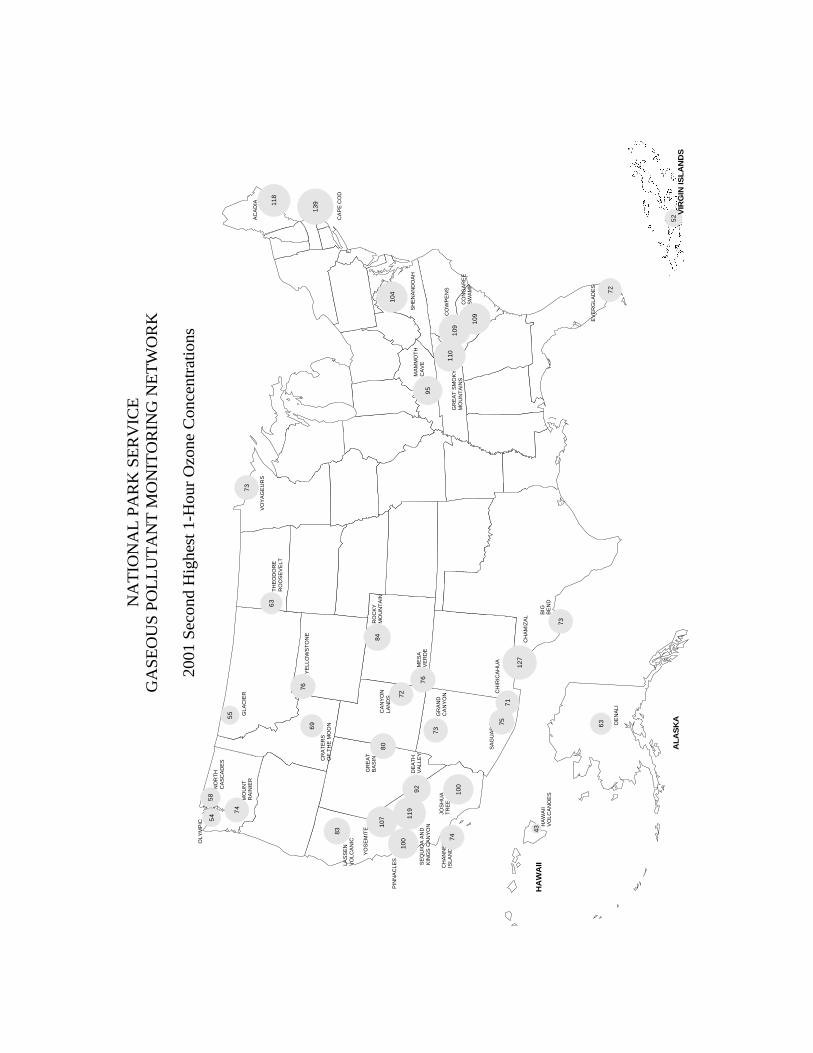
The National Park Service Gaseous Pollutant Monitoring Network site locations andmeasured parameters collected in this reporting year are shown on the map on the followingpage. During this reporting period, 45 monitoring sites in 36 units of the National Park Systemhad some combination of ozone, sulfur dioxide, meteorological, and CASTNet dry depositionmonitoring. Monitoring methods and quality assurance procedures used in the national parknetwork meet the applicable 40 CFR Part 58 EPA requirements. This allows for the directcomparison of NPS collected data with that collected by the EPA, and state and local airpollution control agencies. Data collected by this network are incorporated in the EPAAerometric Information Retrieval System (AIRS) database which is a national database of all airquality data collected throughout the country. These data are also stored in the NPS AirResources Division’s Information Management Center (IMC) that allows for easy access andanalysis of data.
This report includes a variety of data summaries for data collected at an individualmonitoring site at a national park unit during this reporting period. These summaries highlight theaverage range and frequency of the data collected during the year. A PC-compatible diskettecontaining a digital copy of all data collected during the year and data summary productsincluded in this report is available. Individual reports are generated for each site wheremonitoring was conducted in the national park network.
Aca
dia
(2)
Cap
e C
od
SH
EN
AN
DO
AH
MA
MM
OT
HC
AV
E
GR
EA
T S
MO
KY
MO
UN
TA
INS
(4
)C
owpe
ns
Con
gare
e S
wam
p
EV
ER
GL
AD
ES
VO
YA
GE
UR
ST
heod
ore
Roo
seve
lt
RO
CK
YM
OU
NT
AIN
YE
LL
OW
ST
ON
E
ME
SA
VE
RD
E
CA
NY
ON
LA
ND
S
BIG
BE
ND
Cha
miz
al
CH
IRIC
AH
UA
Sag
uaroG
RA
ND
CA
NY
ON
GR
EA
TB
AS
IN
CR
AT
ER
SO
F T
HE
MO
ON
GL
AC
IER
NO
RT
HC
AS
CA
DE
S
OL
YM
PIC
MO
UN
TR
AIN
IER
LA
SS
EN
VO
LC
AN
IC
YO
SE
MIT
E
PIN
NA
CL
ES
SE
QU
IOA
AN
DK
ING
S C
AN
YO
N (
3)
DE
AT
HV
AL
LE
Y
JOS
HU
AT
RE
E
HA
WA
IIV
OL
CA
NO
ES
(3
)
DE
NA
LI
Cha
nnel
Isla
nds
Yuko
nF
lats
NA
TIO
NA
L P
AR
K S
ER
VIC
EG
AS
EO
US
PO
LL
UT
AN
T M
ON
ITO
RIN
G N
ET
WO
RK
2001
Mon
itor
ing
Sit
es
HA
WA
II
AL
AS
KA
Ozo
ne
an
d M
ete
oro
log
y
En
ha
nce
d G
ase
ou
s a
nd
Me
teo
rolo
gy
Ozo
ne,
Sulfu
r D
ioxi
de a
nd M
ete
oro
logy
Para
mete
rs M
on
ito
red
Op
era
tor
Ozo
ne
On
ly
Ozo
ne
an
d S
ulfu
r D
ioxi
de
DE
NA
LI
Aca
dia
Na
tion
al P
ark
Se
rvic
e
Oth
er
Ag
en
cy
VIR
GIN
ISL
AN
DS
Me
teo
rolo
gy
On
ly
CA
ST
Ne
t F
ilte
r P
ack
Lan Administrator
1-2
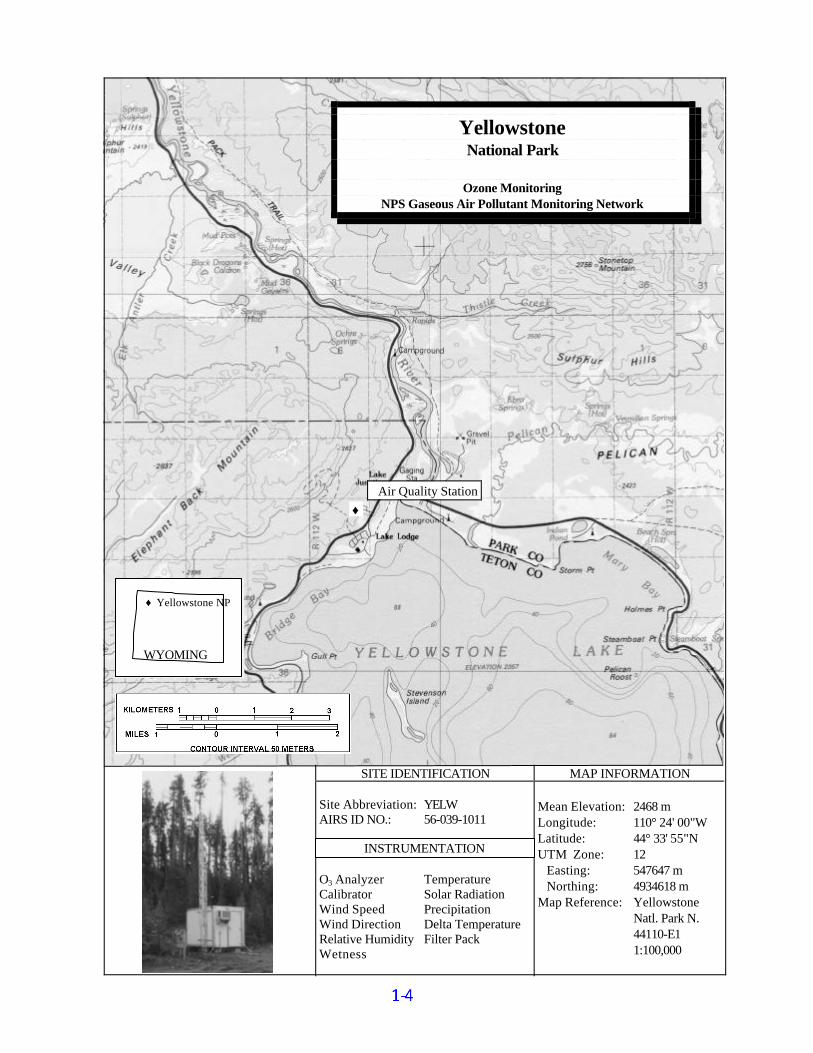
1.2 YELLOWSTONE NATIONAL PARK
Yellowstone National Park, a Class I area, is primarily located in northwestern Wyomingwith portions extending into southwestern Montana and southeastern Idaho. Its location and sitespecifications are presented on the following page.
Yellowstone National Park was created by an act of Congress in 1872 and became theworld's first national park. It was "dedicated and set apart as a public park or pleasuring ground forthe benefit and enjoyment of the people" and "for the preservation, from injury or spoilation, of alltimber, mineral deposits, natural curiosities, or wonders...and their retention in their naturalcondition." In 1972, Yellowstone became the first American area to be designated as a BiosphereReserve by the United Nations Educational, Social, and Cultural Organization (UNESCO). In1978, UNESCO designated Yellowstone a World Heritage Site.
The park is situated on a large mountainous plateau in the northern Rocky Mountains.Elevations range from 5,200 feet to over 11,000 feet and average 8,000 feet. Yellowstone ischaracterized by several broad, forested, volcanic plateaus surrounded by the Absaroka MountainRange on the east, the Gallatin Mountain Range on the north, and the Red Mountains on the south.Lakes such as Yellowstone, Shoshone, Lewis, and Heart are prominent features in the park, as arethe Yellowstone, Snake, Lewis, Madison, Gibbon, Firehole, Gardner, and Lamar rivers. The parkcontains the world's largest and most active geothermal areas. Approximately 120 thermal areas innine major basins have been identified. These areas include geysers, hot springs, mud pots, andfumaroles.
The Yellowstone and Lamar river valleys are covered by dry grasslands and sagebrushsteppe communities with Douglas fir found on the north-facing slopes. These treeless areas makeup nearly 20 percent of the park. The mountains and high plateaus are generally covered by coniferforests or moist meadows. Lodgepole pine occupies approximately 80 percent of the forested areaof Yellowstone.
Yellowstone is home to such wildlife species as black bear, elk, bison, moose, pronghornantelope, mule deer, bighorn sheep, coyote, mountain lion, badger, porcupine, snowshoe hare, riverotter, marten, long-tailed weasel, red squirrel, beaver, golden eagle, osprey, trumpeter swan,harlequin duck, American white pelican, loon, sandhill crane, great gray owl, Steller's jay, redcrossbill, sagebrush lizard, rubber boa, Arctic grayling, and cutthroat trout.
Human occupation in the greater Yellowstone area began at least 10,000 years ago.American Indian hunting and gathering camps, trails, and obsidian quarries are among thearcheological sites found. Also found within the greater Yellowstone area are Euro-Americanarcheologic sites such as roads, building foundations and dumps. A number of historic structures,such as Old Faithful Inn, have been designated as National Historic Landmarks.
1-3
Yellowstone National Park
Ozone Monitoring
NPS Gaseous Air Pollutant Monitoring Network
Air Quality Station
SITE IDENTIFICATION MAP INFORMATION Site Abbreviation: AIRS ID NO.: O3 Analyzer Calibrator Wind Speed Wind Direction Relative Humidity Wetness
YELW 56-039-1011 Temperature Solar Radiation Precipitation Delta Temperature Filter Pack
Mean Elevation: Longitude: Latitude: UTM Zone: Easting: Northing: Map Reference:
2468 m 110° 24' 00"W 44° 33' 55"N 12 547647 m 4934618 m Yellowstone Natl. Park N. 44110-E1 1:100,000
INSTRUMENTATION
♦
WYOMING
♦ Yellowstone NP
Lan Administrator
1-4
2.0 DATA SUMMARY
2.1 OVERVIEW
Based on the site specifications during this annual reporting period, data summaries andstatistics are provided in this section.
Michelle M Likes
2-1
Data Collection StatisticsYellowstone National Park
Notes: The percent valid is calculated against the number possible.Automatic zeros and spans are performed daily on most ambient gas analyzers, therefore, noambient data can be collected during this time. As a result, the maximum percent valid forambient gas data typically can not be greater than 95.8.
Performance Goals: Quarterly Criteria:100% of sites, >= 85% valid data capture 90% of sites, >= 90% valid data capture 80% of sites, >= 95% valid data capture
Monthly Criteria:100% of sites, >= 60% valid data capture 90% of sites, >= 75% valid data capture 80% of sites, >= 85% valid data capture
Final Validation 05/07/2002
Lan Administrator
2-2
0
350
700
1050
1400
SOL
(w/m
2)
0
350
700
1050
1400
SOL
(w/m
2)
-30
-10
10
30
50
TM
P(de
gC)
0
10
20
30
40
RN
F(m
m/h
r)
0
4
8
12
16
SWS(
m/s
)
0
90
180
270
360
VW
D(d
eg)
0
25
50
75
100
RH
(%)
0
25
50
75
100
O3(
ppb)
01/0
1/01
01/0
8/01
01/1
5/01
01/2
2/01
01/2
9/01
02/0
5/01
02/1
2/01
02/1
9/01
02/2
6/01
03/0
5/01
03/1
2/01
03/1
9/01
03/2
6/01Date
First Quarter 2001Final Validation
2- 3
Yellowstone National Park - Near Water Tower
0
350
700
1050
1400
SOL
(w/m
2)
0
350
700
1050
1400
SOL
(w/m
2)
-30
-10
10
30
50
TM
P(de
gC)
0
10
20
30
40
RN
F(m
m/h
r)
0
4
8
12
16
SWS(
m/s
)
0
90
180
270
360
VW
D(d
eg)
0
25
50
75
100
RH
(%)
0
25
50
75
100
O3(
ppb)
04/0
1/01
04/0
8/01
04/1
5/01
04/2
2/01
04/2
9/01
05/0
6/01
05/1
3/01
05/2
0/01
05/2
7/01
06/0
3/01
06/1
0/01
06/1
7/01
06/2
4/01Date
Second Quarter 2001Final Validation
2- 4
Yellowstone National Park - Near Water Tower
0
350
700
1050
1400
SOL
(w/m
2)
0
350
700
1050
1400
SOL
(w/m
2)
-30
-10
10
30
50
TM
P(de
gC)
0
10
20
30
40
RN
F(m
m/h
r)
0
4
8
12
16
SWS(
m/s
)
0
90
180
270
360
VW
D(d
eg)
0
25
50
75
100
RH
(%)
0
25
50
75
100
O3(
ppb)
07/0
1/01
07/0
8/01
07/1
5/01
07/2
2/01
07/2
9/01
08/0
5/01
08/1
2/01
08/1
9/01
08/2
6/01
09/0
2/01
09/0
9/01
09/1
6/01
09/2
3/01
09/3
0/01Date
Third Quarter 2001Final Validation
2- 5
Yellowstone National Park - Near Water Tower
0
350
700
1050
1400
SOL
(w/m
2)
0
350
700
1050
1400
SOL
(w/m
2)
-30
-10
10
30
50
TM
P(de
gC)
0
10
20
30
40
RN
F(m
m/h
r)
0
4
8
12
16
SWS(
m/s
)
0
90
180
270
360
VW
D(d
eg)
0
25
50
75
100
RH
(%)
0
25
50
75
100
O3(
ppb)
10/0
1/01
10/0
8/01
10/1
5/01
10/2
2/01
10/2
9/01
11/0
5/01
11/1
2/01
11/1
9/01
11/2
6/01
12/0
3/01
12/1
0/01
12/1
7/01
12/2
4/01
12/3
1/01Date
Fourth Quarter 2001Final Validation
2- 6
Yellowstone National Park - Near Water Tower
2.2 OZONE DATA SUMMARY
Michelle M Likes
2-7
Ozo
ne Q
uick
Loo
k A
nnua
l Sum
mar
y St
atis
tics
Yel
low
ston
e N
atio
nal P
ark
Fina
l Val
idat
ion
01/0
1/20
01 -
12/
31/2
001
STA
TIS
TIC
MA
Y-
SEP
AN
NU
AL
DE
CN
OV
OC
TSE
PA
UG
JUL
JUN
MA
YA
PR
MA
RFE
BJA
N
DA
ILY
1-H
R M
AX
IMU
M78
7855
5361
6070
6564
7868
6155
53
NO
. OF
DA
YS
(153
)(3
65)
(31)
(30)
(31)
(30)
(31)
(31)
(30)
(31)
(30)
(31)
(28)
(31)
AV
ER
AG
E D
AIL
Y M
AX
IMU
M54
5146
4349
5156
5153
5958
5348
46
NO
. OF
DA
YS
(153
)(3
65)
(31)
(30)
(31)
(30)
(31)
(31)
(30)
(31)
(30)
(31)
(28)
(31)
MA
XIM
UM
DA
ILY
ME
AN
6464
4845
5053
5250
5464
5954
4946
NO
. OF
DA
YS
(153
)(3
62)
(31)
(30)
(31)
(30)
(31)
(31)
(30)
(31)
(30)
(29)
(27)
(31)
AV
ER
AG
E D
AIL
Y M
EA
N45
4443
3742
4246
4244
4952
4745
42
NO
. OF
DA
YS
(153
)(3
62)
(31)
(30)
(31)
(30)
(31)
(31)
(30)
(31)
(30)
(29)
(27)
(31)
MA
X P
EA
K:M
IN R
AT
IO5.
429
5.42
91.
279
2.18
81.
968
3.13
33.
500
4.25
02.
269
5.42
91.
632
2.78
91.
457
1.56
3
NO
. OF
DA
YS
(153
)(3
62)
(31)
(30)
(31)
(30)
(31)
(31)
(30)
(31)
(30)
(29)
(27)
(31)
AV
ER
AG
E P
EA
K:M
IN R
AT
IO1.
807
1.52
01.
135
1.46
21.
404
1.75
61.
930
1.87
21.
661
1.81
21.
323
1.37
81.
206
1.25
3
NO
. OF
DA
YS
(153
)(3
62)
(31)
(30)
(31)
(30)
(31)
(31)
(30)
(31)
(30)
(29)
(27)
(31)
MA
X 9
AM
-4PM
AV
ER
AG
E68
6848
4853
5759
5561
6863
5750
47
NO
. OF
DA
YS
(151
)(3
61)
(31)
(30)
(30)
(29)
(31)
(31)
(30)
(30)
(30)
(30)
(28)
(31)
MO
NT
HL
Y 9
AM
-4PM
AV
ER
AG
E48
4744
3844
4650
4648
5355
4946
42
NO
. OF
DA
YS
(151
)(3
61)
(31)
(30)
(30)
(29)
(31)
(31)
(30)
(30)
(30)
(30)
(28)
(31)
MA
X 7
AM
-7PM
AV
ER
AG
E65
6548
4652
5556
5258
6562
5651
46
NO
. OF
DA
YS
(152
)(3
63)
(31)
(30)
(30)
(29)
(31)
(31)
(30)
(31)
(30)
(31)
(28)
(31)
MO
NT
HL
Y 7
AM
-7PM
AV
ER
AG
E47
4643
3743
4448
4446
5154
4945
42
NO
. OF
DA
YS
(152
)(3
63)
(31)
(30)
(30)
(29)
(31)
(31)
(30)
(31)
(30)
(31)
(28)
(31)
MO
NT
HL
Y M
EA
N45
4443
3742
4246
4244
4952
4845
42
NO
. OF
HO
UR
S(3
478)
(828
5)(7
09)
(685
)(7
05)
(681
)(7
10)
(703
)(6
83)
(701
)(6
86)
(689
)(6
31)
(702
)
SUM
0 E
XPO
SUR
E I
ND
EX
1551
0236
6888
3054
825
062
2982
528
849
3242
729
461
3016
334
202
3579
432
774
2829
029
493
NO
. OF
HO
UR
S(3
478)
(828
5)(7
09)
(685
)(7
05)
(681
)(7
10)
(703
)(6
83)
(701
)(6
86)
(689
)(6
31)
(702
)
SUM
60 E
XPO
SUR
E I
ND
EX
1198
517
146
-
-
121
6016
0437
310
9988
4947
9924
1 -
-
NO
. OF
HO
UR
S(1
90)
(273
)(0
)(0
)(2
)(1
)(2
6)(6
)(1
8)(1
39)
(77)
(4)
(0)
(0)
SUM
80 E
XPO
SUR
E I
ND
EX
-
-
-
-
-
-
-
-
-
-
-
-
-
-
NO
. OF
HO
UR
S(0
)(0
)(0
)(0
)(0
)(0
)(0
)(0
)(0
)(0
)(0
)(0
)(0
)(0
)
W12
6 E
XPO
SUR
E I
ND
EX
1748
334
991
1616
814
1847
2437
3565
2221
2749
6510
6259
3525
1975
1473
NO
. OF
HO
UR
S(3
478)
(828
5)(7
09)
(685
)(7
05)
(681
)(7
10)
(703
)(6
83)
(701
)(6
86)
(689
)(6
31)
(702
)
Con
cent
ratio
ns in
par
ts p
er b
illio
n (p
pb)
* St
atis
tics
defi
ned
in th
e Q
uick
Loo
k su
bsec
tion
of th
e G
loss
ary
Exp
osur
es in
par
ts p
er b
illio
n-ho
urs
(ppb
-hr)
Fin
al V
alid
atio
n5/7
/02
Lan Administrator
2-8
Fre
quen
cy D
istri
butio
n
Peri
od%
Obs
.#
Obs
.O
bs.
1030
5070
9095
Min
.A
vera
ging
Mon
itori
ng S
easo
n: 0
4/01
/01
- 10/
31/0
1
Geo
.S
tdv.
Mea
nG
eo.
Mea
nA
rith
.M
ax.
2nd
Obs
.M
ax.
99
Yel
low
ston
e N
atio
nal P
ark
1
23
4
Perc
entil
e5
0.04
40.
050
0.05
40.
058
0.06
20.
066
4869
0.03
91.
140.
0534
0.05
390.
076
0.07
80.
072
991-
Hou
r
Con
cent
ratio
ns in
par
ts p
er m
illio
n (p
pm)
Rec
ords
for
this
rep
ort a
re s
elec
ted
in a
ccor
danc
e w
ith
the
AIR
S G
eo-C
omm
on f
ile
crit
eria
. The
se c
rite
ria
are
base
d on
the
stat
e-sp
ecif
icM
onit
orin
g Se
ason
def
ined
in A
IRS.
1
The
min
imum
obs
erva
tion
valu
e (M
in. O
bs.)
is th
e m
inim
um d
aily
max
imum
reco
rded
dur
ing
the
Mon
itori
ng S
easo
n.T
he p
erce
ntil
es a
nd o
ther
sta
tist
ics
are
deri
ved
from
the
dail
y m
axim
ums.
4 5
The
per
cent
of
vali
d ob
serv
atio
ns (
% O
bs.)
is th
e pe
rcen
tage
of
vali
d da
ys to
the
num
ber
of p
ossi
ble
mon
itor
ing
days
dur
ing
the
Mon
itor
ing
Seas
on. A
val
id d
ay is
def
ined
as
a da
y w
ith
9 or
mor
e va
lid
obse
rvat
ions
bet
wee
n 9:
00 a
.m. a
nd 9
:00
p.m
..32T
he n
umbe
r of
obs
erva
tion
s (#
Obs
.) in
clud
es a
ll v
alid
obs
erva
tion
s re
cord
ed w
ithi
n th
e M
onit
orin
g S
easo
n.
5/8/
2002
Lan Administrator
2-9
Fina
l Val
idat
ion
Ozo
ne S
tand
ards
Rep
ort a
ndD
aily
Max
imum
1-H
our C
once
ntra
tions
(ppm
)
Yel
low
ston
e N
atio
nal P
ark
Day
Dec
-01
Nov
-01
Oct
-01
Sep-
01A
ug-0
1Ju
l-01
Jun-
01M
ay-0
1A
pr-0
1M
ar-0
1Fe
b-01
Jan-
01
01/0
1/20
01 -
12/
31/2
001
1T
TS
TF
SW
SM
TS
M.0
45.0
42.0
61.0
55.0
57.0
51.0
59.0
61.0
59.0
54.0
43.0
432
FF
MW
SM
TS
TF
ST
.046
.043
.052
.056
.060
.043
.052
.053
.058
.055
.047
.046
3S
ST
TS
TF
MW
SM
W.0
55.0
45.0
50.0
58.0
58.0
42.0
54.0
54.0
64.0
56.0
46.0
474
SS
WF
MW
ST
TS
TT
.042
.048
.057
.058
.060
.050
.042
.065
.062
.054
.044
.048
5M
MT
ST
TS
WF
MW
F.0
44.0
51.0
53.0
49.0
56.0
58.0
52.0
60.0
61.0
57.0
43.0
476
TT
FS
WF
MT
ST
TS
.046
.042
.058
.039
.059
.054
.054
.069
.058
.056
.051
.048
7W
WS
MT
ST
FS
WF
S.0
44.0
40.0
55.0
43.0
61.0
54.0
45.0
72.0
59.0
51.0
40.0
478
TT
ST
FS
WS
MT
SM
.047
.044
.055
.039
.056
.047
.051
.060
.053
.052
.043
.046
9F
FM
WS
MT
ST
FS
T.0
49.0
45.0
52.0
44.0
50.0
43.0
56.0
56.0
51.0
55.0
47.0
5210
SS
TT
ST
FM
WS
MW
.051
.048
.046
.049
.055
.042
.061
.066
.055
.052
.050
.049
11S
SW
FM
WS
TT
ST
T.0
49.0
48.0
45.0
53.0
53.0
44.0
53.0
68.0
57.0
56.0
51.0
4612
MM
TS
TT
SW
FM
WF
.042
.047
.041
.048
.062
.053
.050
.068
.053
.049
.050
.048
13T
TF
SW
FM
TS
TT
S.0
43.0
42.0
46.0
45.0
60.0
50.0
47.0
66.0
57.0
53.0
48.0
4714
WW
SM
TS
TF
SW
FS
.041
.040
.045
.044
.056
.048
.047
.060
.061
.056
.050
.042
15T
TS
TF
SW
SM
TS
M.0
43.0
39.0
47.0
47.0
56.0
51.0
59.0
44.0
62.0
55.0
48.0
4316
FF
MW
SM
TS
TF
ST
.043
.035
.049
.051
.054
.057
.064
.059
.058
.061
.049
.039
17S
ST
TS
TF
MW
SM
W.0
44.0
39.0
46.0
44.0
55.0
52.0
51.0
67.0
66.0
53.0
51.0
4218
SS
WF
MW
ST
TS
TT
.045
.035
.051
.048
.070
.054
.063
.063
.064
.051
.054
.043
19M
MT
ST
TS
WF
MW
F.0
45.0
45.0
46.0
54.0
54.0
51.0
62.0
62.0
58.0
49.0
51.0
4320
TT
FS
WF
MT
ST
TS
.047
.053
.049
.058
.055
.058
.053
.061
.052
.041
.052
.042
21W
WS
MT
ST
FS
WF
S.0
46.0
48.0
55.0
59.0
56.0
57.0
46.0
60.0
53.0
53.0
51.0
4722
TT
ST
FS
WS
MT
SM
.045
.047
.046
.050
.052
.053
.054
.047
.054
.053
.048
.049
23F
FM
WS
MT
ST
FS
T.0
45.0
35.0
53.0
61.0
60.0
59.0
42.0
51.0
50.0
49.0
4624
SS
TT
ST
FM
WS
MW
.043
.047
.043
.054
.056
.053
.053
.041
.056
.050
.047
.049
25S
SW
FM
WS
TT
ST
T.0
48.0
40.0
46.0
50.0
65.0
48.0
43.0
61.0
50.0
47.0
5326
MM
TS
TT
SW
FM
WF
.048
.030
.042
.054
.051
.044
.049
.051
.065
.052
.048
.046
27T
TF
SW
FM
TS
TT
S.0
48.0
38.0
48.0
57.0
52.0
61.0
47.0
50.0
60.0
60.0
55.0
5028
WW
SM
TS
TF
SW
FS
.047
.040
.047
.060
.050
.044
.048
.068
.054
.052
.048
29T
ST
FS
WS
MT
SM
.045
.039
.049
.051
.055
.047
.055
.076
.066
.055
.047
30F
MW
SM
TS
TF
ST
.045
.043
.049
.052
.058
.051
.055
.078
.051
.056
.046
31S
TT
FW
W.0
39.0
56.0
44.0
52.0
56.0
41
Vio
latio
ns
Val
id D
ays
0M
axim
um30
.055 0
30.0
53 0
30.0
61 0
29.0
60 0
31.0
70 0
30.0
65 0
30.0
64 0
31.0
78 0
30.0
68 0
31.0
6128
.055 0
31.0
53 0
Fin
al V
alid
atio
n5/9
/02
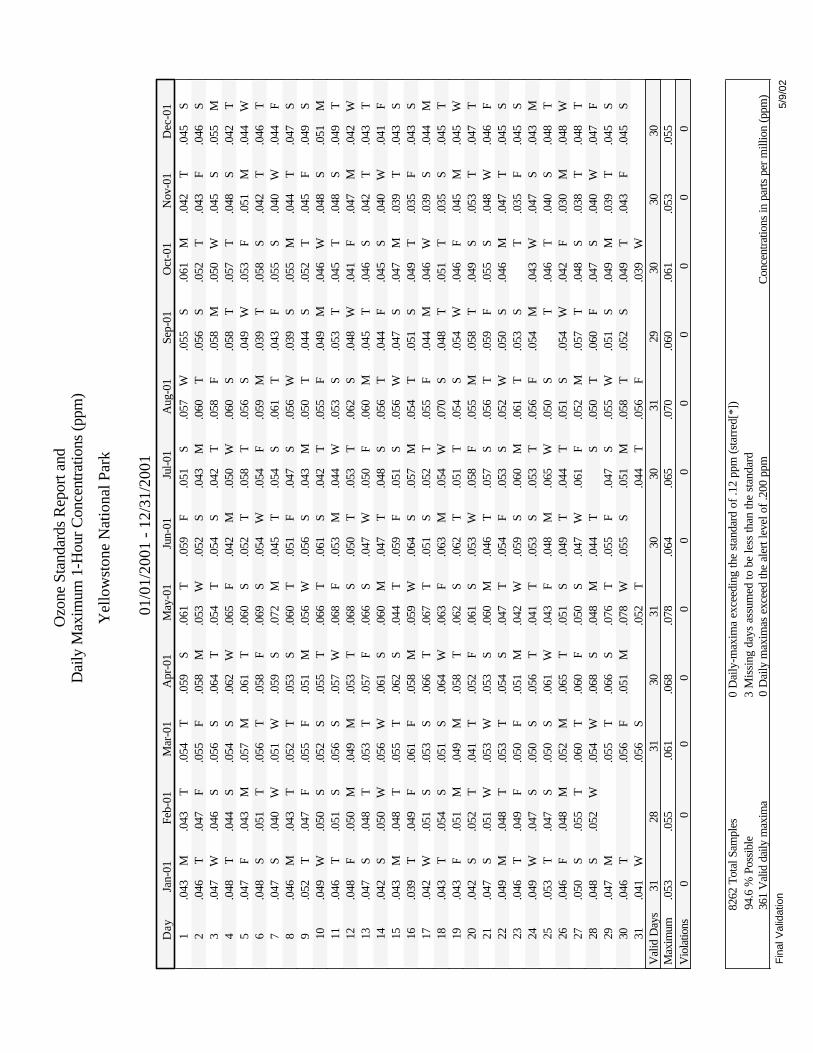
8262
Tot
al S
ampl
es94
.6 %
Pos
sibl
e36
1 V
alid
dai
ly m
axim
aC
once
ntra
tions
in p
arts
per
mill
ion
(ppm
)
0 D
aily
-max
ima
exce
edin
g th
e st
anda
rd o
f .1
2 pp
m (
star
red[
*])
3 M
issi
ng d
ays
assu
med
to b
e le
ss th
an th
e st
anda
rd0
Dai
ly m
axim
as e
xcee
d th
e al
ert l
evel
of
.200
ppm
Lan Administrator
2-10
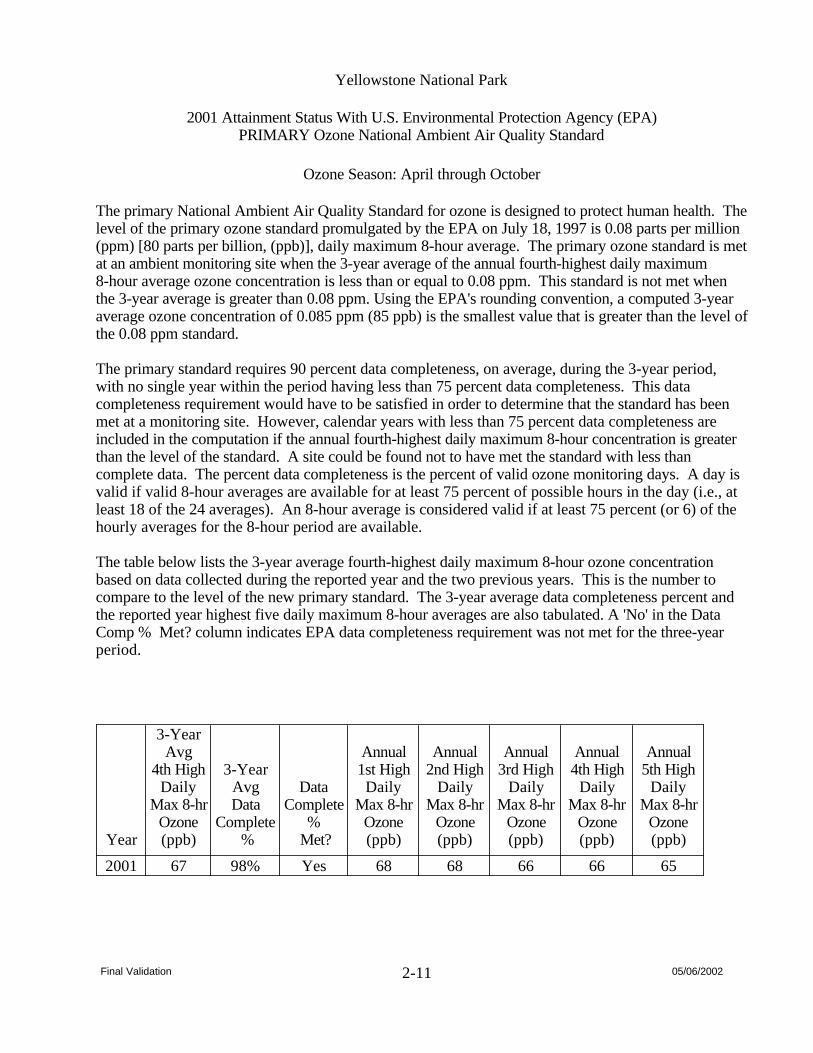
2001 Attainment Status With U.S. Environmental Protection Agency (EPA)PRIMARY Ozone National Ambient Air Quality Standard
Ozone Season: April through October
The primary National Ambient Air Quality Standard for ozone is designed to protect human health. Thelevel of the primary ozone standard promulgated by the EPA on July 18, 1997 is 0.08 parts per million (ppm) [80 parts per billion, (ppb)], daily maximum 8-hour average. The primary ozone standard is metat an ambient monitoring site when the 3-year average of the annual fourth-highest daily maximum 8-hour average ozone concentration is less than or equal to 0.08 ppm. This standard is not met when the 3-year average is greater than 0.08 ppm. Using the EPA's rounding convention, a computed 3-year average ozone concentration of 0.085 ppm (85 ppb) is the smallest value that is greater than the level ofthe 0.08 ppm standard.
The primary standard requires 90 percent data completeness, on average, during the 3-year period, with no single year within the period having less than 75 percent data completeness. This data completeness requirement would have to be satisfied in order to determine that the standard has been met at a monitoring site. However, calendar years with less than 75 percent data completeness are included in the computation if the annual fourth-highest daily maximum 8-hour concentration is greater than the level of the standard. A site could be found not to have met the standard with less than complete data. The percent data completeness is the percent of valid ozone monitoring days. A day is valid if valid 8-hour averages are available for at least 75 percent of possible hours in the day (i.e., at least 18 of the 24 averages). An 8-hour average is considered valid if at least 75 percent (or 6) of the hourly averages for the 8-hour period are available.
The table below lists the 3-year average fourth-highest daily maximum 8-hour ozone concentration based on data collected during the reported year and the two previous years. This is the number to compare to the level of the new primary standard. The 3-year average data completeness percent and the reported year highest five daily maximum 8-hour averages are also tabulated. A 'No' in the Data Comp % Met? column indicates EPA data completeness requirement was not met for the three-year period.
Yellowstone National Park
Year
3-YearAvg
4th HighDaily
Max 8-hrOzone(ppb)
3-YearAvgData
Complete %
DataComplete
% Met?
Annual1st HighDaily
Max 8-hrOzone(ppb)
Annual2nd High
DailyMax 8-hr
Ozone(ppb)
Annual3rd High
DailyMax 8-hr
Ozone(ppb)
Annual4th High
DailyMax 8-hr
Ozone(ppb)
Annual5th High
DailyMax 8-hr
Ozone(ppb)
2001 67 98% Yes 68 68 66 66 65
Final Validation 2-11 05/06/2002
ConcentrationValue Date Hour (ppb)
Ozone Analyzer
10 Highest Daily 1-Hour Average Maximum ConcentrationsYellowstone National Park
Final Validation01/01/2001 - 12/31/2001
Ozone AnalyzerOzone Analyzer 1 05/30/2001 0 78
Ozone Analyzer 2 05/29/2001 22 76
Ozone Analyzer 3 05/07/2001 11 72
Ozone Analyzer 4 08/18/2001 16 70
Ozone Analyzer 5 05/06/2001 18 69
Ozone Analyzer 6 04/28/2001 18 68
Ozone Analyzer 7 05/11/2001 16 68*
Ozone Analyzer 8 05/12/2001 16 68
Ozone Analyzer 9 05/17/2001 17 67
Ozone Analyzer 10 04/17/2001 14 66**
** This value was also recorded on one or more days later in the reported period.* This value was also recorded during one or more hours later in the day.
Final Validation 07/16/2002
Lan Administrator
2-12
Episodes with 1-Hour Ozone Concentrations > 100 ppb and > 124 ppb
> 100 ppb
No. Hours Max
_
_Beginning
Hour >124 ppb (ppb)Site Date
01/01/2001 - 12/31/2001FINAL VALIDATION
Yellowstone National Park
No values greater than or equal 100 ppb during this period
Note: The primary and secondary national ambient air standard for ozone that applied in 1996 is 0.12 ppm over a one hour period not to be exceeded more than once per year. (A value greater than .12 ppm, 124 ppb, or 235 ug/m³ exceeds the standard.) (40 CFR 50.9 with reference to Appendix D and H.)
Total 0 0
Final Validation 5/6/022-13
Start and End Time ofDaily Maximum8-Hour Average > 84 ppb (hr)
Daily Maximum8-Hour Average
(ppb)
Number of 8-HourAverages > 84 ppb
During the DaySite Date
01/01/2001 - 12/31/2001FINAL VALIDATION
Yellowstone National ParkEpisodes with 8-Hour Average Ozone Concentrations > 84 ppb
No values exceeded 84 ppb during this periodDays with 8-hour average concentrations > 84 ppb0
Note: This table presents episodes of high ozone based on running 8-hour averages. In 1997, the EPA published new primary and secondary national ambient air quality standards for ozonebased on 8-hour average ozone concentrations. Attainment of the new primary standard is reached if the annual fourth highest daily maximum 8-hour ozone concentration, averaged over three years, does not exceed 0.08 ppm (84 ppb or 157 ug/m³).
Final Validation
7/9/022-14
Ozone Rank Listings of Second Highest 1-Hour Average Concentrations, 4th Highest8-Hour Average Concentrations, and Annual SUM60 Exposure Index for All NPS Monitoring Sites
Average of Valid O3 in ppb(Bar is equal to +/- one standard deviation)Maximum of Valid O3 in ppb
( Indicates Data Exceeds Plot Scale) Minimum of Valid O3 in ppb
Final Validation 05-06-2002
Yellowstone National ParkNear Water Tank
Quarterly DiurnalOzone Plots
2001
2-18
ppb
Hour
#Samples
0
20
40
60
80
100
120
140
0
364 364
2
364 363
4
362 361
6
361 361
8
358 361
10
363 360
12
351 350
14
346 357
16
360 363
18
362 363
20
364 363
22
364 0
Average of Valid O3 in ppb(Bar is equal to +/- one standard deviation)Maximum of Valid O3 in ppb
( Indicates Data Exceeds Plot Scale) Minimum of Valid O3 in ppb
Final Validation 05-06-2002
Yellowstone National ParkNear Water Tank
Annual DiurnalOzone Plot
2001
2-19
N NNE
NE
ENE
E
ESE
SE
SSES
SSW
SW
WSW
W
WNW
NW
NNW
10%
20%
CALM1.43%
95.0% Collected 93.6% Valid2160 Possible /2052 Collected /2022 Valid(includes WS and WD)
FIRST QUARTER (JAN-MAR)
N NNE
NE
ENE
E
ESE
SE
SSES
SSW
SW
WSW
W
WNW
NW
NNW
10%
20%
CALM0.58%
94.7% Collected 94.7% Valid2184 Possible /2068 Collected /2068 Valid(includes WS and WD)
SECOND QUARTER (APR-JUN)
N NNE
NE
ENE
E
ESE
SE
SSES
SSW
SW
WSW
W
WNW
NW
NNW
10%
20%
CALM0.27%
90.4% Collected 85.3% Valid2208 Possible /1995 Collected /1884 Valid(includes WS and WD)
THIRD QUARTER (JUL-SEP)
N NNE
NE
ENE
E
ESE
SE
SSES
SSW
SW
WSW
W
WNW
NW
NNW
10%
20%
CALM0.33%
95.1% Collected 95.1% Valid2208 Possible /2100 Collected /2099 Valid(includes WS and WD)
FOURTH QUARTER (OCT-DEC)
Final Validation 06-26-2002
Yellowstone National Park
Quarterly Ozone Pollutant Rose
2001
Ozone (ppb)
0-19
20-39
40-59
60-79
80-99
100-119
120-139
140+
2-20
N NNE
NE
ENE
E
ESE
SE
SSES
SSW
SW
WSW
W
WNW
NW
NNW
10%
20%
CALM
0.66%
93.8% Collected 92.2% Valid
8760 Possible /8215 Collected /8073 Valid
(includes WS and WD)
Yellowstone National Park
Annual Ozone Pollutant Rose
2001
Final Validation 06-26-2002
Ozone (ppb)
0-19
20-39
40-59
60-79
80-99
100-119
120-139
140+
2-21
CalendarQuarter
Final Validation
Precision checks are required by the Environmental Protection Agency (EPA) of all monitoringinstruments collecting data which are to be submitted to the EPA Aerometric Information RetrievalSystem (AIRS). A precision check is performed by challenging the pollutant analyzer with a knownconcentration of gas (between 0.08 and 0.10 ppm for ozone and sulfur dioxide) from the pollutanttransfer standard. This precision check must be performed at least every 14 days of monitoringoperation. The percent difference between the analyzer and the transfer standard is then calculated.¹According to NPS Standard Operating Procedures, the pollutant analyzer must respond within 10% ofthe transfer standard. The table below gives the number of precision checks performed during eachquarter, the average² of all the individual precision check percent differences for the quarter, and theupper and lower 95% probability limits³ for precision checks. The probability limits represent theinterval having a 95% chance of containing the true average percent difference. The quarterly averagepercent difference and probability limits should ideally be within +/- 10%.
Average Percent Difference is the mean of all individual precision check percent differencesduring the quarter.
Upper/Lower 95% Probability Limits=(Average Percent Difference) +/- (1.96)(StandardDeviation of precision check percent differences in the quarter.)
analyzer - transfer std transfer std
1
7/10/02Final Validation 2-22
2.3 METEOROLOGICAL DATA SUMMARY
Michelle M Likes
2-23
Summary of Selected Meteorological Data
Yellowstone National Park
Final Validation
Parameter Value Units Number Std Dev
01/01/2001 - 12/31/2001
SCALAR WIND SPEED
1.6 m/s 8735 0.9 Average
6.4 m/s Maximum
Percent calm = 0.73
AMBIENT TEMPERATURE
2.0 degC 8731 10.4 Average
27.8 degC Maximum
-28.9 degC Minimum
RELATIVE HUMIDITY
64 percent 8735 22 Average
99 percent Maximum
7 percent Minimum
PRECIPITATION (Rainfall or Snow melt)
.6 mm/hr 630 .9 Average non-zero rate
7.4 mm/hr Maximum non-zero rate
.1 mm/hr Minimum non-zero rate
408.3 mm Accumulated during period
SOLAR RADIATION
11,989,644 joules/m2day 359 7,962,293 Average Daily Total
27,129,600 joules/m2day Maximum Daily Total
361,600 joules/m2day Minimum Daily Total
Note: Calms are included in the average scalar wind speed and are defined as winds less than 0.5 m/s (1.0 mph).
NA indicates instrument not available.
Solar radiation terms are based on the calculation of the total amount of solar energy incident on a unit area during each day. The maximum and minimum daily totals are selected from the list of daily totals.The totals for all days are then added and divided by the number of days to yield the average daily total. Only days with 24 valid values are included in these statistics.
Final Validation 05/07/20022-24
N NNE
NE
ENE
E
ESE
SE
SSES
SSW
SW
WSW
W
WNW
NW
NNW
10%
20%
CALM1.67%
100.0% Collected 100.0% Valid2160 Possible /2159 Collected /2159 Valid(includes WS and WD)
FIRST QUARTER (JAN-MAR)
N NNE
NE
ENE
E
ESE
SE
SSES
SSW
SW
WSW
W
WNW
NW
NNW
10%
20%
CALM0.55%
99.6% Collected 99.6% Valid2184 Possible /2175 Collected /2175 Valid(includes WS and WD)
SECOND QUARTER (APR-JUN)
N NNE
NE
ENE
E
ESE
SE
SSES
SSW
SW
WSW
W
WNW
NW
NNW
10%
20%
CALM0.25%
94.9% Collected 89.7% Valid2208 Possible /2096 Collected /1980 Valid(includes WS and WD)
THIRD QUARTER (JUL-SEP)
N NNE
NE
ENE
E
ESE
SE
SSES
SSW
SW
WSW
W
WNW
NW
NNW
10%
20%
CALM0.36%
99.9% Collected 99.9% Valid2208 Possible /2205 Collected /2205 Valid(includes WS and WD)
FOURTH QUARTER (OCT-DEC)
Final Validation 06-26-2002
Yellowstone National Park
Quarterly Wind Rose
2001
Scalar Wind Speed (m/s)
CALM < .5
0.5-0.9
1.0-3.9
4.0-6.9
7.0-9.9
10.0-12.9
13.0-15.9
16.0-18.9
19.0+
2-25
N NNE
NE
ENE
E
ESE
SE
SSES
SSW
SW
WSW
W
WNW
NW
NNW
10%
20%
CALM
0.72%
98.6% Collected 97.2% Valid
8760 Possible /8635 Collected /8519 Valid
(includes WS and WD)
Yellowstone National Park
Annual Wind Rose
2001
Final Validation 06-26-2002
Scalar Wind Speed (m/s)
CALM < .5
0.5-0.9
1.0-3.9
4.0-6.9
7.0-9.9
10.0-12.9
13.0-15.9
16.0-18.9
19.0+
2-26
2-27
2.4 DRY DEPOSITION DATA SUMMARY
Clean Air Status and Trends Network (CASTNet)Dry Deposition Monitoring
In 1995, the National Park Service (NPS) and the Environmental Protection Agency(EPA) entered a partnership to jointly measure dry deposition in park units, mostly in theWest. A portion of the 1997, 1998, and 1999 data collected from this partnership ispresented in this section.
Atmospheric deposition of acidic species takes two pathways: wet deposition and drydeposition. Wet deposition is the result of precipitation events (rain, snow, or fog) thatremove particles and gases from the atmosphere. Dry deposition is less event driven, butstill involves the transfer of particles and gases from the atmosphere to surfaces andplants. Wet deposition has been well documented for many years. In the national parks,the National Acidic Deposition Program (NADP) measures and reports wet deposition(see the web site at http://nadp.sws.uiuc.edu for further information). Dry deposition ismuch harder to measure and a smaller network of monitoring stations is involved. Themethod used to measure dry deposition is sometimes called the "inferential method"because air quality concentration data are combined with meteorological measurementsand land use functions to compute deposition velocities. The CASTNet programprovides long-term estimates of total acidic deposition by adding dry deposition values towet deposition values.
This annual summary report presents the air quality concentration portion of the drydeposition inferential method, which is the only currently available data set. These datawere compiled from the analyses of filters collected by CASTNet deposition filter packsystems in the parks. The filter pack analyses yielded weekly average concentrations ofparticulate sulfate (SO4
+),sulfur dioxide (SO2), and nitric acid (HNO3). In some cases, the positive ions Na+, K+,Ca2+, and Mg2+ were also measured from the filter samples. These concentration data forthe individual ionic species are presented as weekly bar charts and summarized byquarter and by year in this report. Concentration data can be used to compare sites and toindicate the amount of acidic species available for deposition. As with the continuousanalyzer data, the filter pack concentration data are included on a computer diskette thataccompanies this report.
Estimated dry deposition values derived from EPA modeling will be reported at a latertime to complete the inferential analyses. When available, these modeling results will beposted on the NPS Air Resources Division Internet web site athttp://www.aqd.nps.gov/ard1 or on the EPA CASTNet site(http://www.epa.gov/ardpublc/acidrain/castnet/about.html). Initial CASTNet results haveshown that dry deposition can be a significant portion of total acidic deposition.
Yellowstone National Park1/1/2001 12/31/2001-
Quarterly and Annual Average Concentrations
CASTNet Dry Deposition Monitoring
Quarter NH HNO SO p-SO Total NO SO /SO No.Valid Samples (ug/m )
p-NO (ug/m )
33 3 4 4 2 4 2
Ratio (ug/m ) (ug/m ) (ug/m ) (ug/m ) 33 3 3 3 3
1 0.3570.241 1.1830.7350.5559 0.318 0.621
2 0.2970.227 0.8970.8060.56413 0.340 0.899
3 0.3230.439 0.9490.7530.61113 0.179 0.794
4 0.2010.215 0.5690.4700.38213 0.171 0.826
0.246Annual Average
Standard Deviation
0.5260.284 0.6880.289 0.876
0.182 0.2250.135 0.2480.103 0.517
0.785
Total No. Filters
48
No. Invalidated
0
Data Capture
100.0%
No. Valid Hours
8010.0
Data Recovery Table
5/23/20022-28
Yellowstone National ParkCASTNet Dry Deposition Monitoring Weekly Concentrations Report
Three Year Comparison of Maximum and Average Concentrations
Yellowstone National Park
Maximum Concentration (ug/m3 ) Average Concentration (ug/m3 )
2-30
0.0
0.1
0.2
0.3
0.4
0.5
0.6
1999 2000 2001
0.0
0.2
0.4
0.6
0.8
1.0
1999 2000 2001
0.0
1.0
2.0
3.0
4.0
5.0
1999 2000 2001
0.0
0.5
1.0
1.5
2.0
2.5
1999 2000 2001
0.0
0.2
0.4
0.6
0.8
1.0
1.2
1.4
1999 2000 2001
0.0
0.2
0.4
0.6
0.8
1.0
1999 2000 2001
HA
WA
II
ALA
SKA
0.24
0.15
0.18
1.200.27
0.25
0.69
0.56
1.50
0.35
1.25
0.70
0.39
0.100.
440.
290.
36
0.46
0.67
0.48
0.37
0.06
1.31
0.28
##
####
##
####
####
##
##
####
##
####
####
##
##
##
##
##
##
##
##
Haw
aii
Ala
ska
BIB
E
NO
CA
MO
RA
OL
YM
GL
AC
YE
LL
RO
MO
YO
SEPI
NN
LA
VO
JOT
R
SEK
IM
EV
E
CA
NY
SHE
N
AC
AD
GR
CA
DE
NA
CH
IR
HA
VO
EV
ER
TH
RO
VO
YA
GR
BA
DE
VA
Ave
rage
Par
ticul
ate
Nitr
ate
(p-N
O3)
Con
cent
ratio
ns (
ug/m
3) f
or E
ntir
e Y
ear
2001
CA
STN
et D
ry D
epos
ition
Mon
itori
ng S
ites
/ Nat
iona
l Par
k Se
rvic
e U
nits
0.48
##G
RSM
0.58
Vir
gin
Isla
nds
##
VII
S 0.83
Key
:B
IBE
BIB
E
CA
NY
CA
NY
CH
IRC
HIR
DE
VA
DE
VA
GL
AC
GL
AC
GR
BA
GR
BA
GR
CA
GR
CA
JOT
RJO
TR
LA
VO
LA
VO
ME
VE
ME
VE
MO
RA
MO
RA
NO
CA
NO
CA
PIN
NP
INN
RO
MO
RO
MO
SE
KI
SE
KI
SH
EN
SH
EN
VO
YA
VO
YA
YE
LL
YE
LL
YO
SE
YO
SE
Big
Ben
d N
PB
ig B
end
NP
Can
yonl
ands
NP
Can
yonl
ands
NP
Chi
rica
hua
NM
Chi
rica
hua
NM
Dea
th V
alle
y N
PD
eath
Val
ley
NP
Gla
cier
NP
Gla
cier
NP
Gre
at B
asin
NP
Gre
at B
asin
NP
Gra
nd
Can
yon
NP
Gra
nd
Can
yon
NP
Josh
ua
Tre
e N
PJo
shu
a T
ree
NP
Las
sen
Vol
cani
c N
PL
asse
n V
olca
nic
NP
Mes
a V
erd
e N
PM
esa
Ver
de
NP
Mou
nt
Rai
nie
r N
PM
oun
t R
ain
ier
NP
Nor
th C
asca
des
NP
Nor
th C
asca
des
NP
Pin
nacl
es N
MP
inna
cles
NM
Roc
ky
Mou
nta
in N
PR
ock
y M
oun
tain
NP
Seq
uoi
a N
PS
equ
oia
NP
Sh
enan
doa
h N
PS
hen
and
oah
NP
Voy
ageu
rs N
PV
oyag
eurs
NP
Yel
low
ston
e N
PY
ello
wst
one
NP
Yos
emit
e N
PY
osem
ite
NP
AC
AD
AC
AD
VII
SV
IIS
DE
NA
DE
NA
OL
YM
OL
YM
EV
ER
EV
ER
TH
RO
TH
RO
GR
SM
GR
SM
Aca
dia
NP
Aca
dia
NP
Den
ali N
PD
enal
i NP
Eve
rgla
des
NP
Eve
rgla
des
NP
Gre
at S
mok
ies
NP
Gre
at S
mok
ies
NP
Oly
mpi
c N
PO
lym
pic
NP
Th
. Roo
seve
lt N
PT
h. R
oose
velt
NP
Vir
gin
Isla
nds
NP
Vir
gin
Isla
nds
NP
HA
VO
HA
VO
Hav
aii
Vol
cano
s N
PH
avai
i V
olca
nos
NP
0.06##Y
UFL
YU
FL
YU
FL
Yu
kon
Fla
ts N
WR
Yu
kon
Fla
ts N
WR
Lan Administrator
2-31
HA
WA
II
AL
ASK
A
0.28
0.24
0.40
0.26
1.130.
57
0.28
0.67
1.11
1.92
1.19
2.70
0.68
0.69
0.10
1.55
1.04
0.97
1.03
2.58
0.52
0.73
0.06
0.36
0.66
##
####
##
##
##
####
##
##
####
##
####
####
##
##
##
##
##
##
##
##
Ala
ska
Haw
aii
BIB
E
NO
CA
MO
RA
OL
YM
GL
AC
YE
LL
RO
MO
YO
SE
PIN
N
LA
VO
JOT
R
SEK
IM
EV
E
CA
NY
SHE
N
AC
AD
GR
CA
DE
NA
CH
IR
HA
VO
EV
ER
TH
RO
VO
YA
GR
BA
DE
VA
Key
:
Ave
rage
Nit
ric
Aci
d (H
NO
3) C
once
ntra
tion
s (u
g/m
3) f
or E
ntir
e Y
ear
2001
CA
STN
et D
ry D
epos
ition
Mon
itori
ng S
ites
/ Nat
iona
l Par
k Se
rvic
e U
nits
BIB
EB
IBE
CA
NY
CA
NY
CH
IRC
HIR
DE
VA
DE
VA
GL
AC
GL
AC
GR
BA
GR
BA
GR
CA
GR
CA
JOT
RJO
TR
LA
VO
LA
VO
ME
VE
ME
VE
MO
RA
MO
RA
NO
CA
NO
CA
PIN
NP
INN
RO
MO
RO
MO
SE
KI
SE
KI
SH
EN
SH
EN
VO
YA
VO
YA
YE
LL
YE
LL
YO
SEY
OSE
Big
Ben
d N
PB
ig B
end
NP
Can
yonl
ands
NP
Can
yonl
ands
NP
Chi
rica
hua
NM
Chi
rica
hua
NM
Dea
th V
alle
y N
PD
eath
Val
ley
NP
Gla
cier
NP
Gla
cier
NP
Gre
at B
asin
NP
Gre
at B
asin
NP
Gra
nd C
anyo
n N
PG
rand
Can
yon
NP
Josh
ua T
ree
NP
Josh
ua T
ree
NP
Las
sen
Vol
can
ic N
PL
asse
n V
olca
nic
NP
Mes
a V
erd
e N
PM
esa
Ver
de
NP
Mou
nt
Rai
nie
r N
PM
oun
t R
ain
ier
NP
Nor
th C
asca
des
NP
Nor
th C
asca
des
NP
Pin
nacl
es N
MP
inna
cles
NM
Roc
ky
Mou
nta
in N
PR
ock
y M
oun
tain
NP
Seq
uoi
a N
PS
equ
oia
NP
Shen
ando
ah N
PSh
enan
doah
NP
Voy
ageu
rs N
PV
oyag
eurs
NP
Yel
low
ston
e N
PY
ello
wst
one
NP
Yos
emit
e N
PY
osem
ite
NP
AC
AD
AC
AD
VII
SV
IIS
DE
NA
DE
NA
OL
YM
OL
YM
EV
ER
EV
ER
TH
RO
TH
RO
GR
SM
GR
SM
Aca
dia
NP
Aca
dia
NP
Den
ali
NP
Den
ali
NP
Eve
rgla
des
NP
Eve
rgla
des
NP
Gre
at S
mok
ies
NP
Gre
at S
mok
ies
NP
Oly
mpi
c N
PO
lym
pic
NP
Th
. Roo
seve
lt N
PT
h. R
oose
velt
NP
Vir
gin
Isla
nds
NP
Vir
gin
Isla
nds
NP
2.48
##G
RSM
Vir
gin
Isla
nds
##
VII
S 0.06
HA
VO
HA
VO
Hav
aii
Vol
cano
s N
PH
avai
i V
olca
nos
NP
0.10
YU
FL
##
YU
FL
YU
FL
Yu
kon
Fla
ts N
WR
Yu
kon
Fla
ts N
WR
Lan Administrator
2-32
HA
WA
II
ALA
SKA
0.52
0.39
0.57
0.84
2.310.83
0.53
1.35
1.65 3.39
1.53
3.90
1.37
1.06
0.20
1.96
1.32
1.31
1.48
3.21
0.98
1.09
0.12
1.66
0.93
##
####
##
####
####
##
##
####
##
####
####
##
##
##
##
##
##
##
##
Haw
aii
Ala
ska
BIB
E
NO
CA
MO
RA
OL
YM
GL
AC
YE
LL
RO
MO
YO
SEPI
NN
LA
VO
JOT
R
SEK
IM
EV
E
CA
NY
SHE
N
AC
AD
GR
CA
DE
NA
CH
IR
HA
VO
EV
ER
TH
RO
VO
YA
GR
BA
DE
VA
Ave
rage
Tot
al N
itrat
e (T
otal
NO
3) C
once
ntra
tions
(ug
/m3)
for
Ent
ire
Yea
r 20
01
CA
STN
et D
ry D
epos
ition
Mon
itori
ng S
ites
/ Nat
iona
l Par
k Se
rvic
e U
nits
2.92
##G
RSM
Vir
gin
Isla
nds
##
VII
S 0.89
Key
:
BIB
EB
IBE
CA
NY
CA
NY
CH
IRC
HIR
DE
VA
DE
VA
GL
AC
GL
AC
GR
BA
GR
BA
GR
CA
GR
CA
JOT
RJO
TR
LA
VO
LA
VO
ME
VE
ME
VE
MO
RA
MO
RA
NO
CA
NO
CA
PIN
NP
INN
RO
MO
RO
MO
SE
KI
SE
KI
SH
EN
SH
EN
VO
YA
VO
YA
YE
LL
YE
LL
YO
SE
YO
SE
Big
Ben
d N
PB
ig B
end
NP
Can
yonl
ands
NP
Can
yonl
ands
NP
Chi
rica
hua
NM
Chi
rica
hua
NM
Dea
th V
alle
y N
PD
eath
Val
ley
NP
Gla
cier
NP
Gla
cier
NP
Gre
at B
asin
NP
Gre
at B
asin
NP
Gra
nd
Can
yon
NP
Gra
nd
Can
yon
NP
Josh
ua
Tre
e N
PJo
shu
a T
ree
NP
Las
sen
Vol
cani
c N
PL
asse
n V
olca
nic
NP
Mes
a V
erd
e N
PM
esa
Ver
de
NP
Mou
nt
Rai
nie
r N
PM
oun
t R
ain
ier
NP
Nor
th C
asca
des
NP
Nor
th C
asca
des
NP
Pin
nacl
es N
MP
inna
cles
NM
Roc
ky
Mou
nta
in N
PR
ock
y M
oun
tain
NP
Seq
uoi
a N
PS
equ
oia
NP
Sh
enan
doa
h N
PS
hen
and
oah
NP
Voy
ageu
rs N
PV
oyag
eurs
NP
Yel
low
ston
e N
PY
ello
wst
one
NP
Yos
emit
e N
PY
osem
ite
NP
AC
AD
AC
AD
VII
SV
IIS
DE
NA
DE
NA
OL
YM
OL
YM
EV
ER
EV
ER
TH
RO
TH
RO
GR
SM
GR
SM
Aca
dia
NP
Aca
dia
NP
Den
ali N
PD
enal
i NP
Eve
rgla
des
NP
Eve
rgla
des
NP
Gre
at S
mok
ies
NP
Gre
at S
mok
ies
NP
Oly
mpi
c N
PO
lym
pic
NP
Th
. Roo
seve
lt N
PT
h. R
oose
velt
NP
Vir
gin
Isla
nds
NP
Vir
gin
Isla
nds
NP
HA
VO
HA
VO
Hav
aii
Vol
cano
s N
PH
avai
i V
olca
nos
NP
0.16##Y
UFL
YU
FL
YU
FL
Yu
kon
Fla
ts N
WR
Yu
kon
Fla
ts N
WR
Lan Administrator
2-33
HA
WA
II
ALA
SKA
0.26
0.22
0.30
0.260.
24
0.29
0.55
0.39
0.78
0.36
0.57
0.83
0.43
0.120.
350.
36
0.36
0.50
0.41
0.29
##
##
##
##
##
####
##
##
####
##
####
####
##
##
##
##
Ala
ska
Haw
aii
BIB
E
NO
CA
MO
RA
GL
AC
YE
LL
RO
MO
YO
SE
PIN
NLA
VO
JOT
R
SEK
IM
EV
E
CA
NY
GR
CA CH
IR
HA
VO
TH
RO
VO
YA
GR
BA
DE
VA
Ave
rage
Am
mon
ium
(N
H4)
Con
cent
ratio
ns (
ug/m
3) f
or E
ntir
e Y
ear
2001
CA
STN
et D
ry D
epos
ition
Mon
itori
ng S
ites
/ Nat
iona
l Par
k Se
rvic
e U
nits
0.29
0.60
0.10
0.43
##
##
##
##
OL
YM
AC
AD
DE
NA
EV
ER
1.37
##G
RSM
1.66##
SHE
N
Vir
gin
Isla
nds
##VII
S
0.20
Key
:
BIB
EB
IBE
CA
NY
CA
NY
CH
IRC
HIR
DE
VA
DE
VA
GL
AC
GL
AC
GR
BA
GR
BA
GR
CA
GR
CA
JOT
RJO
TR
LA
VO
LA
VO
ME
VE
ME
VE
MO
RA
MO
RA
NO
CA
NO
CA
PIN
NP
INN
RO
MO
RO
MO
SE
KI
SE
KI
SH
EN
SH
EN
VO
YA
VO
YA
YE
LL
YE
LL
YO
SE
YO
SE
Big
Ben
d N
PB
ig B
end
NP
Can
yonl
ands
NP
Can
yonl
ands
NP
Chi
rica
hua
NM
Chi
rica
hua
NM
Dea
th V
alle
y N
PD
eath
Val
ley
NP
Gla
cier
NP
Gla
cier
NP
Gre
at B
asin
NP
Gre
at B
asin
NP
Gra
nd
Can
yon
NP
Gra
nd
Can
yon
NP
Josh
ua
Tre
e N
PJo
shu
a T
ree
NP
Las
sen
Vol
cani
c N
PL
asse
n V
olca
nic
NP
Mes
a V
erd
e N
PM
esa
Ver
de
NP
Mou
nt
Rai
nie
r N
PM
oun
t R
ain
ier
NP
Nor
th C
asca
des
NP
Nor
th C
asca
des
NP
Pin
nacl
es N
MP
inna
cles
NM
Roc
ky
Mou
nta
in N
PR
ock
y M
oun
tain
NP
Seq
uoi
a N
PS
equ
oia
NP
Sh
enan
doa
h N
PS
hen
and
oah
NP
Voy
ageu
rs N
PV
oyag
eurs
NP
Yel
low
ston
e N
PY
ello
wst
one
NP
Yos
emit
e N
PY
osem
ite
NP
AC
AD
AC
AD
VII
SV
IIS
DE
NA
DE
NA
OL
YM
OL
YM
EV
ER
EV
ER
TH
RO
TH
RO
GR
SM
GR
SM
Aca
dia
NP
Aca
dia
NP
Den
ali N
PD
enal
i NP
Eve
rgla
des
NP
Eve
rgla
des
NP
Gre
at S
mok
ies
NP
Gre
at S
mok
ies
NP
Oly
mpi
c N
PO
lym
pic
NP
Th
. Roo
seve
lt N
PT
h. R
oose
velt
NP
Vir
gin
Isla
nds
NP
Vir
gin
Isla
nds
NP
HA
VO
HA
VO
Hav
aii
Vol
cano
s N
PH
avai
i V
olca
nos
NP
0.07##
YU
FL
YU
FL
YU
FL
Yu
kon
Fla
ts N
WR
Yu
kon
Fla
ts N
WR
Lan Administrator
2-34
HA
WA
II
ALA
SKA
CA
STN
et D
ry D
epos
ition
Mon
itori
ng S
ites
/ Nat
iona
l Par
k Se
rvic
e U
nits
0.64
0.72
0.95
1.04
1.190.
63
0.69
1.33
0.95
1.39
1.00
1.45
2.81
1.28
1.99
1.06
1.00
1.02
2.23
5.13
1.28
1.01
0.32
2.56
0.81
Ave
rage
Par
ticul
ate
Sulf
ate
(p-S
O4)
Con
cent
ratio
ns (
ug/m
3) f
or E
ntir
e Y
ear
2001
##
####
##
####
####
##
##
####
##
####
####
##
##
##
##
##
##
##
##
Ala
ska
Haw
aii
BIB
E
NO
CA
MO
RA
OL
YM
GL
AC
YE
LL
RO
MO
YO
SEPI
NNLA
VO
JOT
R
SEK
IM
EV
E
CA
NY
SHE
N
AC
AD
GR
CA
DE
NA
CH
IR
HA
VO
EV
ER
TH
RO
VO
YA
GR
BA
DE
VA
4.95
##G
RSM
Vir
gin
Isla
nds
##
VII
S 1.89
Key
:
BIB
EB
IBE
CA
NY
CA
NY
CH
IRC
HIR
DE
VA
DE
VA
GL
AC
GL
AC
GR
BA
GR
BA
GR
CA
GR
CA
JOT
RJO
TR
LA
VO
LA
VO
ME
VE
ME
VE
MO
RA
MO
RA
NO
CA
NO
CA
PIN
NP
INN
RO
MO
RO
MO
SE
KI
SE
KI
SH
EN
SH
EN
VO
YA
VO
YA
YE
LL
YE
LL
YO
SE
YO
SE
Big
Ben
d N
PB
ig B
end
NP
Can
yonl
ands
NP
Can
yonl
ands
NP
Chi
rica
hua
NM
Chi
rica
hua
NM
Dea
th V
alle
y N
PD
eath
Val
ley
NP
Gla
cier
NP
Gla
cier
NP
Gre
at B
asin
NP
Gre
at B
asin
NP
Gra
nd
Can
yon
NP
Gra
nd
Can
yon
NP
Josh
ua
Tre
e N
PJo
shu
a T
ree
NP
Las
sen
Vol
cani
c N
PL
asse
n V
olca
nic
NP
Mes
a V
erd
e N
PM
esa
Ver
de
NP
Mou
nt
Rai
nie
r N
PM
oun
t R
ain
ier
NP
Nor
th C
asca
des
NP
Nor
th C
asca
des
NP
Pin
nacl
es N
MP
inna
cles
NM
Roc
ky
Mou
nta
in N
PR
ock
y M
oun
tain
NP
Seq
uoi
a N
PS
equ
oia
NP
Sh
enan
doa
h N
PS
hen
and
oah
NP
Voy
ageu
rs N
PV
oyag
eurs
NP
Yel
low
ston
e N
PY
ello
wst
one
NP
Yos
emit
e N
PY
osem
ite
NP
AC
AD
AC
AD
VII
SV
IIS
DE
NA
DE
NA
OL
YM
OL
YM
EV
ER
EV
ER
TH
RO
TH
RO
GR
SM
GR
SM
Aca
dia
NP
Aca
dia
NP
Den
ali N
PD
enal
i NP
Eve
rgla
des
NP
Eve
rgla
des
NP
Gre
at S
mok
ies
NP
Gre
at S
mok
ies
NP
Oly
mpi
c N
PO
lym
pic
NP
Th
. Roo
seve
lt N
PT
h. R
oose
velt
NP
Vir
gin
Isla
nds
NP
Vir
gin
Isla
nds
NP
HA
VO
HA
VO
Hav
aii
Vol
cano
s N
PH
avai
i V
olca
nos
NP
0.24##Y
UFL
YU
FL
YU
FL
Yu
kon
Fla
ts N
WR
Yu
kon
Fla
ts N
WR
Lan Administrator
2-35
HA
WA
II
ALA
SKA
0.29
0.22
1.07
1.86
0.400.
30
0.88
1.34
0.52
0.98
0.62
0.70
0.99
0.67
25.8
00.40
1.06
0.43
1.98
6.20
0.72
0.56
0.43
0.96
0.26
##
####
##
##
##
####
##
##
####
##
####
####
##
##
##
##
##
##
##
##
Haw
aii
Ala
ska
BIB
E
NO
CA
MO
RA
OL
YM
GL
AC
YE
LL
RO
MO
YO
SE
PIN
NLA
VO
JOT
R
SEK
IM
EV
E
CA
NY
SHE
N
AC
AD
GR
CA
DE
NA
CH
IR
HA
VO
EV
ER
TH
RO
VO
YA
GR
BA
DE
VA
Ave
rage
Sul
fur
Dio
xide
(SO
2) C
once
ntra
tions
(ug
/m3)
for
Ent
ire
Yea
r 20
01
CA
STN
et D
ry D
epos
ition
Mon
itori
ng S
ites
/ Nat
iona
l Par
k Se
rvic
e U
nits
4.66
##G
RSM
Vir
gin
Isla
nds
##
VII
S
0.37
Key
:
BIB
EB
IBE
CA
NY
CA
NY
CH
IRC
HIR
DE
VA
DE
VA
GL
AC
GL
AC
GR
BA
GR
BA
GR
CA
GR
CA
JOT
RJO
TR
LA
VO
LA
VO
ME
VE
ME
VE
MO
RA
MO
RA
NO
CA
NO
CA
PIN
NP
INN
RO
MO
RO
MO
SE
KI
SE
KI
SH
EN
SH
EN
VO
YA
VO
YA
YE
LL
YE
LL
YO
SE
YO
SE
Big
Ben
d N
PB
ig B
end
NP
Can
yonl
ands
NP
Can
yonl
ands
NP
Chi
rica
hua
NM
Chi
rica
hua
NM
Dea
th V
alle
y N
PD
eath
Val
ley
NP
Gla
cier
NP
Gla
cier
NP
Gre
at B
asin
NP
Gre
at B
asin
NP
Gra
nd
Can
yon
NP
Gra
nd
Can
yon
NP
Josh
ua
Tre
e N
PJo
shu
a T
ree
NP
Las
sen
Vol
cani
c N
PL
asse
n V
olca
nic
NP
Mes
a V
erd
e N
PM
esa
Ver
de
NP
Mou
nt
Rai
nie
r N
PM
oun
t R
ain
ier
NP
Nor
th C
asca
des
NP
Nor
th C
asca
des
NP
Pin
nacl
es N
MP
inna
cles
NM
Roc
ky
Mou
nta
in N
PR
ock
y M
oun
tain
NP
Seq
uoi
a N
PS
equ
oia
NP
Sh
enan
doa
h N
PS
hen
and
oah
NP
Voy
ageu
rs N
PV
oyag
eurs
NP
Yel
low
ston
e N
PY
ello
wst
one
NP
Yos
emit
e N
PY
osem
ite
NP
AC
AD
AC
AD
VII
SV
IIS
DE
NA
DE
NA
OL
YM
OL
YM
EV
ER
EV
ER
TH
RO
TH
RO
GR
SM
GR
SM
Aca
dia
NP
Aca
dia
NP
Den
ali N
PD
enal
i NP
Eve
rgla
des
NP
Eve
rgla
des
NP
Gre
at S
mok
ies
NP
Gre
at S
mok
ies
NP
Oly
mpi
c N
PO
lym
pic
NP
Th
. Roo
seve
lt N
PT
h. R
oose
velt
NP
Vir
gin
Isla
nds
NP
Vir
gin
Isla
nds
NP
HA
VO
HA
VO
Hav
aii
Vol
cano
s N
PH
avai
i V
olca
nos
NP
0.28##
YU
FL
YU
FL
YU
FL
Yu
kon
Fla
ts N
WR
Yu
kon
Fla
ts N
WR
Lan Administrator
2-36
HA
WA
II
ALA
SKA
2.23
3.25
0.89
0.56
3.012.10
0.79
0.99
1.83
1.42
1.60
2.07
2.84
1.91
0.08
2.64
0.94
2.38
1.13
0.83
1.79
1.82
0.73
2.67
3.09
##
####
##
##
##
####
##
##
####
##
####
####
##
##
##
##
##
##
##
##
Ala
ska
Haw
aii
BIB
E
NO
CA
MO
RA
OL
YM
GL
AC
YE
LL
RO
MO
YO
SE
PIN
N
LA
VO
JOT
R
SEK
IM
EV
E
CA
NY
SHE
N
AC
AD
GR
CA
DE
NA
CH
IR
HA
VO
EV
ER
TH
RO
VO
YA
GR
BA
DE
VA
(Ave
rage
SO
4)/(
Ave
rage
SO
2) R
atio
for
Ent
ire
Yea
r 20
01
CA
STN
et D
ry D
epos
ition
Mon
itori
ng S
ites
/ Nat
iona
l Par
k Se
rvic
e U
nits
1.06
##G
RSM
Vir
gin
Isla
nds
##
VII
S 5.12
Key
:
BIB
EB
IBE
CA
NY
CA
NY
CH
IRC
HIR
DE
VA
DE
VA
GL
AC
GL
AC
GR
BA
GR
BA
GR
CA
GR
CA
JOT
RJO
TR
LA
VO
LA
VO
ME
VE
ME
VE
MO
RA
MO
RA
NO
CA
NO
CA
PIN
NP
INN
RO
MO
RO
MO
SE
KI
SE
KI
SH
EN
SH
EN
VO
YA
VO
YA
YE
LL
YE
LL
YO
SE
YO
SE
Big
Ben
d N
PB
ig B
end
NP
Can
yonl
ands
NP
Can
yonl
ands
NP
Chi
rica
hua
NM
Chi
rica
hua
NM
Dea
th V
alle
y N
PD
eath
Val
ley
NP
Gla
cier
NP
Gla
cier
NP
Gre
at B
asin
NP
Gre
at B
asin
NP
Gra
nd
Can
yon
NP
Gra
nd
Can
yon
NP
Josh
ua
Tre
e N
PJo
shu
a T
ree
NP
Las
sen
Vol
cani
c N
PL
asse
n V
olca
nic
NP
Mes
a V
erd
e N
PM
esa
Ver
de
NP
Mou
nt
Rai
nie
r N
PM
oun
t R
ain
ier
NP
Nor
th C
asca
des
NP
Nor
th C
asca
des
NP
Pin
nacl
es N
MP
inna
cles
NM
Roc
ky
Mou
nta
in N
PR
ock
y M
oun
tain
NP
Seq
uoi
a N
PS
equ
oia
NP
Sh
enan
doa
h N
PS
hen
and
oah
NP
Voy
ageu
rs N
PV
oyag
eurs
NP
Yel
low
ston
e N
PY
ello
wst
one
NP
Yos
emit
e N
PY
osem
ite
NP
AC
AD
AC
AD
VII
SV
IIS
DE
NA
DE
NA
OL
YM
OL
YM
EV
ER
EV
ER
TH
RO
TH
RO
GR
SM
GR
SM
Aca
dia
NP
Aca
dia
NP
Den
ali N
PD
enal
i NP
Eve
rgla
des
NP
Eve
rgla
des
NP
Gre
at S
mok
ies
NP
Gre
at S
mok
ies
NP
Oly
mpi
c N
PO
lym
pic
NP
Th
. Roo
seve
lt N
PT
h. R
oose
velt
NP
Vir
gin
Isla
nds
NP
Vir
gin
Isla
nds
NP
HA
VO
HA
VO
Hav
aii
Vol
cano
s N
PH
avai
i V
olca
nos
NP
0.84##Y
UFL
YU
FL
YU
FL
Yu
kon
Fla
ts N
WR
Yu
kon
Fla
ts N
WR
Lan Administrator
2-37
3-1
3.0 NATIONAL PARK SERVICE AIR RESOURCES DIVISION DATA SOURCES
3.1 GUIDE TO ATTACHED DATA DISKS
Data disks containing ASCII files of the validated hourly data, as shown in the followingtable are available. Please return the enclosed postcard or contact the address below. These datamay be imported into other programs to perform additional data processing and analysis. Thedata format of each file is included within each file. The second table describes the validationcodes used in the data tables to indicate why data are missing or invalid. Wind and pollutantfrequency distribution tables in ASCII format are also included on the diskette if available forthis site.
Data users should acknowledge the National Park Service Air Resources Divisionwhenever using these data or any portion of this report.
3.2 OTHER SOURCES FOR RETRIEVING NATIONAL PARK SERVICEGASEOUS POLLUTANT DATA
The data contained in this report may also be obtained from the following sources:
• National Park Service AIRWeb (http://www.aqd.nps.gov/natnet/ard) - available after last quarter 1997• EPA AIRS database• Data requests directed to:
NPS Air Resources DivisionInformation Management Center
c/o Air Resource Specialists, Inc. 1901 Sharp Point Drive, Suite E Fort Collins, Colorado 80525 Telephone: (970) 484-7941 Fax: (970) 484-3423 E-Mail: [email protected]
3-2
Data Disk Contents Summary
File Name (s) Description
Hourly
ssssyy.DAT All Validated Air Quality Data
ssssyymm.ppp Monthly Data Summary Tables
ssssAN95.Rpp Annual Wind and Pollutant Frequency Distribution
ssssQ195.Rpp Quarter 1 Wind and Pollutant Frequency Distribution
ssssQ295.Rpp Quarter 2 Wind and Pollutant Frequency Distribution
ssssQ395.Rpp Quarter 3 Wind and Pollutant Frequency Distribution
ssssQ495.Rpp Quarter 4 Wind and Pollutant Frequency Distribution
Where:ssss = site codeyy = yearmm = monthppp = air quality data parameter codeAN = AnnualQn = Quarter 1-4R = Wind Frequency distribution table
CASTNet Weekly Species Summary Data
File Name (s) Description
CASTNet
ssssCNyr.ASC Weekly averages
Where:ssss = site codeCN = CASTNetyr = year
asc = ascii file
3-3
NPS IMC AND AIRS INVALID DATA CODES
NPS IMC
VAL CODE REASON
NEW
AIRS CODE
OLD
AIRS CODE AIRS REASON
TO Sample time out of limits AG 9973 Sample time out of limits
IW Instrument warmup AL 9978 Voided by operator
OE Operator error AL 9978 Voided by operator
BM Begin monitoring AM 9979 Miscellaneous void
TL Station temp low AE 9971 Shelter temp outside limits
OS Off scale AM 9979 Miscellaneous void
EM End monitoring AM 9979 Miscellaneous void
LI Local interference AM 9979 Miscellaneous void
TH Station temp high AE 9971 Shelter temp outside limits
IM Instrument malfunction AN 9980 Machine malfunction
IN Interference AO 9981 Bad weather
RF Recording system failure AQ 9983 Collection error
NA No data AU 9987 Monitoring waived
PF Power failure AV 9988 Power Failure
PC Precision check AX 9990 Precision Check
ZS Instrument zero/span check AY 9991 QC Control Points (Zero/Span)
SA System audit AZ 9992 QC Audit
PA Performance audit AZ 9992 QC Audit
MT Maintenance BA 9993 Maintenance/Routine Repairs
OR Out for repair BA 9993 Maintenance/Routine Repairs
CA Calibration BC 9995 Multipoint calibration
SC Station check BF 9998 Precision/zero/span
4-1
4.0 GLOSSARY
4.1 DEFINITIONS AND COMPUTATIONAL PROCEDURES FORNATIONAL PARK SERVICE QUICK LOOK ANNUAL SUMMARY STATISTICS REPORT
The National Park Service Quick Look Annual Summary Statistics Table (Page 2-8)provides ozone summary statistics for various indices computed on a monthly basis for an entireyear. Growing season (generically defined to be May 1 - September 30) and annual statistics arealso presented under the "MAY-SEP" and "ANNUAL" columns, respectively. Allconcentrations are expressed in the units of parts per billion (PPB) and exposures in parts perbillion-hours (PPB-HR). The definitions for each of the statistics appearing on the Quick LookAnnual Summary Table are given below.
(1) Daily 1-Hr Maximum. The maximum 1-hour average concentration recorded duringeach month, the growing season or the year regardless of the number of valid hourlyobservations recorded during a given day. The number in parentheses below thisstatistic, (N), indicates the number of days in the month, growing season, or year withvalid data.
(2) Average Daily Maximum. The average of all Daily 1-Hr Maxima during the monthregardless of the number of Daily 1-Hr Maxima recorded during the month. For the"MAY-SEP" column the average of all the Daily Maxima recorded during the growingseason is given. For the "ANNUAL" column the average of all the Daily Maxima isgiven. N is as in (1) above.
(3) Maximum Daily Mean. The maximum of the valid daily means computed for eachmonth, the growing season ("MAY-SEP" column), and the year ("ANNUAL" column). A valid daily mean is one for which 75% of the observations are available for each day,i.e., 18 hours. N is the number of days during each month, growing season, and year withat least 18 observations.
(4) Average Daily Mean. The average of all valid daily means for the month, the growingseason ("MAY-SEP" column), and the year ("ANNUAL" column). N is as in (3) above.
(5) Max Peak:Min Ratio. The ratio of the Daily 1-Hr Maximum to the Daily 1-HrMinimum. A ratio is computed only if a valid Daily Mean is computed and if the Daily1-Hr Minimum is not equal to zero. N is the number of days with a valid Peak:Min ratio.
(6) Average Peak:Min Ratio. The average of all Peak:Min ratios for the month, growingseason, or year. N is as in (5) above.
(7) Max 9AM-4PM Average. The maximum of all valid 9AM-4PM Averages computedfor the month, growing season, or year. A valid 9AM-4PM Average is one which has75% of the observations available during that time period (i.e., 6 hours. N is the numberof days with valid averages.)
4-2
(8) Monthly 9AM-4PM Average. The average of all valid 9AM-4PM Averages for the month,growing season, or year. N is as in (7) above.
(9) Max 7AM-7PM Average. The maximum of all valid 7AM-7PM Averages computed for themonth, growing season, or year. A valid 7AM-7PM Average is one which has 75% of theobservations available during that time period, i.e., 9 hours. N is the number of days with validaverages.
(10) Monthly 7AM-7PM Average. The average of all valid 7AM-7PM averages for the month,growing season, or year. N is as in (9) above.
(11) Monthly Mean. The average of all 1-Hr ozone concentrations recorded during the month,growing season, or year. A mean is computed regardless of the number of hours with valid data. N is the number of hours with valid observations.
(12) SUM0 Exposure Index. The monthly sum of all hourly ozone concentrations. Units are PPB-HR. The "MAY-SEP" column sums across the months of May through September to give thecumulative exposure for the growing season. The "ANNUAL" column sums across every monthto give the cumulative exposure for the year. N is the number of hours with valid observationsand is the same N as in (11) above.
(13) SUM60 Exposure Index. The monthly sum of all hourly ozone concentrations equaling orexceeding 60 PPB. Units are PPB-HR. The "MAY-SEP" column sums across the months ofMay through September to give the cumulative exposure for the growing season. The"ANNUAL" column sums across every month to give the cumulative exposure for the year. N isthe number of hours equaling or exceeding 60 PPB during the month, growing season, or year.
(14) SUM80 Exposure Index. The monthly sum of all hourly ozone concentrations equaling orexceeding 80 PPB. Units are PPB-HR. The "MAY-SEP" column sums across the months ofMay through September to give the cumulative exposure for the growing season. The"ANNUAL" column sums across every month to give the cumulative exposure for the year. N isthe number of hours equaling or exceeding 80 PPB during the month, growing season, or year.
(15) W126 Exposure Index. The monthly sum of all hourly ozone concentrations where eachconcentration is weighted by a function that gives greater emphasis to the higher hourlyconcentrations while still including the lower ones. This weighting function provides aweighting value that is unique for each hourly ozone concentration. The weighting function, asdescribed by Lefohn, Laurence, and Kohut1 is:
1wi = ________________________
1 + 4403 exp ( -.126ci )
where
4-3
wi = weighting value for hourly concentration i,and
ci = hourly concentration i in PPB.
The graph of weighting value versus ozoneconcentration, in the figure to the left, illustratesthe greater weights given to higher hourly ozoneconcentrations.
Each hour's weighting value is multiplied by itscorresponding hourly concentration. This product
is summed over all the valid hours in each month to calculate the monthly W126 exposure.
Thus, the monthly W126 exposure is:
W 1 2 6 = w ci= 1
n
i i∑
whereW126 = monthly W126 exposure index,wi = weighting value for hourly concentration i,ci = hourly concentration i in PPB, andn = number of hours in the month with valid ozone concentrations.
The "MAY-SEP" column sums across the months of May through September to give the cumulativeexposure for the growing season. The "ANNUAL" column sums across every month to give thecumulative exposure for the year. The exposure units are PPB-HR.
Because each hour contributes to this exposure index, N is the number of hours with valid observationsand is the same N as in (11) and (12) above.
The U.S. Environmental Protection Agency usually considers air quality statistics, such as a mean, to be"valid" (i.e., representative of the parameter being estimated for the time interval in question) only if 75%or more of the total possible observations have been measured during that time interval. Therefore, oneshould exercise caution when comparing these statistics between months and sites, particularly those thatare not averages (e.g., maxima and exposures) whenever the number of valid observations is less than75% of the total possible.
References
1. Lefohn, A.S., J. A. Laurence, and R. J. Kohut. 1988. A Comparison of Indices That Describethe Relationship Between Exposure to Ozone and Reduction in the Yield of Agricultural Crops.Atmospheric Environment 22, 1229-1240.
4-4
4.2 AIR QUALITY GLOSSARY
Acid Deposition: Air pollution produced when acid chemicals are incorporated into rain,snow, fog, or mist.
Aerometric Information Retrieval System (AIRS): A computer-based database ofU.S. air pollution information administered by the EPA Office of Air Quality Planningand Standards (U.S. Environmental Protection Agency).
AIRWeb: Air Resources Web, an air quality information retrieval system for U.S. parksand wildlife refuges developed by the Air Resources Division of the National ParkService and the Air Quality Branch of the Fish and Wildlife Service.
Air Pollutant: An unwanted chemical or other material found in the air.
Air Pollution: Degradation of air quality resulting from unwanted chemicals or othermaterials occurring in the air.
Air Quality: The properties and degree of purity of air to which people and natural andheritage resources are exposed (in the context of national parks).
Air Pollution Control Permitting Process: Process by which facilities are permitted toemit specified types and quantities of air pollutants.
Air Quality Related Values (AQRVs): Values including visibility, flora, fauna, culturaland historical resources, odor, soil, water, and virtually all resources that are dependentupon and affected by air quality. "These values include visibility and those scenic,cultural, biological, and recreation resources of an area that are affected by air quality."(43 Fed. Reg. 15016)
Ambient Air: Air that is accessible to the public.
Class I: Areas of the country set aside under the Clean Air Act to receive the moststringent degree of air quality protection.
Class II: Areas of the country protected under the Clean Air Act but identified forsomewhat less stringent protection from air pollution damage than Class I, except inspecified cases.
Clean Air Act: Originally passed in 1963, our current national air pollution controlprogram is based on the 1970 version of the law. Substantial revisions were made by the1990 Clean Air Act Amendments.
Continuous Sampling Device: An air analyzer that measures air quality componentscontinuously.
4-5
Criteria: Information on health and/or environmental effects of pollution (in the contextof criteria air pollutants).
Criteria Air Pollutant: A group of very common air pollutants regulated by EPA on thebasis of criteria and for which a National Ambient Air Quality Standard is established(SO2, NO2, PM10, Pb, CO, O3).
Emissions: Release of pollutants into the air from a source.
Environmental Protection Agency (EPA): The federal agency responsible forregulating air quality.
Monitoring: Measurement of air pollution.
National Ambient Air Quality Standards (NAAQS): Permissible levels of criteria airpollutant established to protect public health and welfare.
Ozone (O3): A criteria air pollutant that is a strong oxidizing agent, reactive with manyother compounds and surfaces, and a health hazard in high concentrations. Ozone isformed by nitrogen oxides and organic compounds reacting in sunlight.
Source: Any place or object from which air pollutants are released. Sources that arefixed in space are stationary sources; sources that move are mobile sources.
Sulfur Dioxide (SO2): A criteria air pollutant that is a gas produced by burning coal andsome industrial processes.
* Recent updates to this glossary may be found on the NPSARD AIRWeb - http://www.aqd.nps.gov/natnet/ard/glossary.htm.
4-6
4.3 GLOSSARY OF AIR QUALITY UNITS
Units Conversion Table
Parameter Type Multiply By To Obtain
Pollutant ppm 1000 ppb
ppm 1960 µg/m3 Ozone (at 25°C)
ppm 2615 µg/m3 Sulfur Dioxide (at 25°C)
ppb 0.001 ppm
ppb 1.960 µg/m3 Ozone (at 25°C)
ppb 2.615 µg/m3 Sulfur Dioxide (at 25°C)
µg/m3 Ozone (25°C) 0.0005102 ppm
µg/m3 Ozone (25°C) 0.5102 ppb
µg/m3 Sulfur Dioxide (25°C) 0.0003824 ppm
µg/m3 Sulfur Dioxide (25°C) 0.3824 ppb
Wind Speed m/s 2.05 mph
mph 0.489 m/s
Solar Radiation ly/min 697 w/m2
w/m2 0.00143 ly/min
Precipitation mm/hr 0.0394 in/hr
in/hr 25.4 mm/hr
Temperature °C + 17.78 1.8 °F
°F - 32 5/9 °C
Where:ppm = parts per millionppb = parts per billionµg/m3 = micrograms per cubic meter (at 25°C)m/s = meters per secondmps = miles per hourly/min = langleys per minutew/m2 = watts per square metermm/hr = millimeters per hourin/hr = inches per hour°C = degrees centigrade°F = degrees fahrenheit