82
Annual efficiency and finance assessment of Network Rail 2020-21 30 July 2021

Annual efficiency and finance assessment of Network Rail 2020-21 30 July 2021

2
Contents Summary 4
1. Introduction 8
2. Efficiency and financial performance 12
Efficiency 12
Financial performance 16
Budget flexibility 18
Risk funding 19
Headcount and staff costs 20
Expenditure 21
Income 25
Research and development expenditure 26
Productivity 28
Leading indicators of efficient delivery 28
Regulatory finances 32
3. Regional analysis 33
Scotland 33
Southern 42
Wales and Western 48
Eastern 54
North West and Central 59
National functions 66
Wales 71
Annex A: Summary of key financial information 72
Great Britain 72
England and Wales 73
Scotland 74

3
Southern 75
Wales and Western 76
Eastern 77
North West and Central 78
National functions 79
Annex B: Link between efficiency and financial performance 80
Annex C: Progress of research and development projects 81

4
Summary Purpose of this document Network Rail spent around £7.5 billion operating, maintaining and renewing1 the national rail infrastructure in the year ended 31 March 2021 (2020-21), the second year of Control Period 6 (CP6)2. This document explains our assessment of Network Rail's efficiency and wider financial performance in the year, providing detailed support to our recent Network Rail Annual Assessment. It covers Network Rail’s activities across Great Britain as a whole and separately for Scotland, and each of Network Rail’s regions in England and Wales.
Key findings The key findings from our assessment are:
1) Financial underperformance partly due to the adverse impact of Covid-19
Network Rail underperformed its planned income and expenditure by £424 million in 2020-213. As examined in this report, Network Rail’s efficiency improved in the year. However, the Coronavirus (Covid-19) pandemic reduced some items of income and increased some costs, although this was not the only factor that increased costs. For example, Network Rail increased its headcount and suffered some increased materials costs in the year.
Network Rail is not expecting the cost of its engineering activities of maintaining, renewing and enhancing the rail network to be further significantly impacted by Covid-19 across CP6. The pandemic will continue to affect some of Network Rail’s income, including retail income from its managed stations. However, these sources of income are relatively small, as most of Network Rail’s income comes from train operators and governments, and this funding has continued.
2) CP6 efficiency plans are progressing, though cost pressures are mounting
Network Rail has reported £710 million of efficiency improvements in 2020-21, against a target of £570 million. All five of its regions have met or exceeded their individual efficiency targets. As examined in this report, Network Rail has achieved efficiency savings across a range of its core business activities, including improved contracting strategies, reduced activity on renewals due to new technologies and improved workbank planning.
1 This includes network operations (£0.7 billion), support costs (£1.0 billion), maintenance (£1.9 billion) and renewals costs (£3.9 billion). 2 Network Rail’s funding and requirements for CP6 were set out in our 2018 periodic review (PR18). This determined what Network Rail should deliver in respect of operating, maintaining and renewing its network, and the funding needed. CP6 runs from 1 April 2019 to 31 March 2024. 3 Network Rail established a CP6 delivery plan (business plan) to deliver the requirements of our PR18 determination. Network Rail’s CP6 delivery plan included detailed financial assumptions for its income and expenditure in 2020-21. These are summarised in Annex A. We monitor Network Rail’s actual income and expenditure against these assumptions using the Financial Performance Measure (FPM). FPM excludes some items such as interest payments. The FPM measure is explained in our CP6 regulatory accounting guidelines.

5
Network Rail remains confident in its ability to deliver the £3.5 billion of efficiency improvements we required in CP6. In addition to the above, Network Rail has committed to delivering £0.5 billion of further savings and is reviewing how it will deliver these. In total, it is now forecasting to deliver £4.0 billion of savings.
Figure 1: Network Rail’s actual and forecast efficiency, CP6
Key: 2019-20 and 2020-21: delivered, 2021-22 and 2022-23: Blue - projects delivered and waiting for benefits to materialise; Green - business confident in delivery (projects with delivery dates and milestones); Yellow - plans in place but lower confidence in delivery; and Red - commitment to deliver, but no strategic theme assigned, 2023-24: forecast.
Source: ORR analysis of Network Rail data
There is inherent uncertainty in the value of some of the efficiency improvements that Network Rail has calculated. As a result, Network Rail has reported a range from £680 million to £780 million for what it has achieved in the year. We consider this range to be reasonable.
Although there are still some improvements which could be made, we have seen improvements in four of the regions’ readiness to deliver efficiencies across the rest of CP6, and we consider that those regions appear to be sufficiently prepared to deliver the remainder of their CP6 target efficiencies. We remain concerned about the robustness of Scotland’s efficiency plans, though we welcome that the region is working to address our concerns.
However, Network Rail is reporting an increase in its ‘headwinds’4 in 2020-21. These are cost increases that Network Rail considers are largely outside of its control. Our PR18 determination accepted that some cost movements are not controllable in the short to medium term, and Network Rail included £0.6 billion in its CP6 delivery plan for them over the whole of CP6. Network
4 Headwinds (cost increases that Network Rail considers to be outside of its control) in this document are net of tailwinds (these are cost reductions that Network Rail considers are largely outside of its control). But, Network Rail has not identified many tailwinds so far in CP6.

6
Rail is now forecasting headwinds of £1.1 billion. Of this increase, £0.3 billion is due to cost increases relating to the pandemic.
Network Rail is also reporting above-inflation cost increases in some areas. Network Rail has not yet adequately explained to us why there has been such a large increase in these costs. In our view, some of these cost increases could more rightly be considered as controllable, and should therefore be treated as inefficiencies. If these costs were found to be inefficiencies and were reclassified, this would reduce Network Rail’s reported efficiency achieved in the control period to date. However, we are aware that Network Rail takes a prudent approach to measuring its reported efficiency, which may balance out some of the effect of any reclassification. This is a complex and subjective matter, for example, some costs may only be non-controllable in the short-term. Network Rail has acknowledged that it needs to do more to better assure and more clearly report on these cost increases. We will continue to liaise with Network Rail and report on these matters in future assessments.
3) Increased staff costs, particularly at senior management grades
Network Rail employed just over 44,400 staff at the end of 2020-21. This represents a 10 percent increase in headcount in the two years since the end of Control Period 5 (CP5). Senior management grades increased by 27 percent to around 630 staff, whereas non-management grades increased by 8 percent. This increase in headcount has led to an increase in staff costs, which have increased from £2.3 billion at the end of CP5 (2018-19), to £2.6 billion in 2020-21. Excluding bonus payments from both years, this is a 14 percent increase.
Network Rail has attributed the increased headcount to the implementation of Putting Passengers First (PPF, Network Rail’s internal re-organisation to create five regional organisations supported by fewer national functions), increased resourcing of train planners (following the findings of the Glaister inquiry into May 2018 network disruption) and increased internal training and IT resources in its Route Services directorate. It is not clear that the increase in headcount has been efficient. Network Rail is now considering its workforce plans and will better explain the reasons for the recent staff increases, which we will further report on.
We will shortly be commissioning a study, which will look at comparing Network Rail's employment costs (not the number of people employed) to relevant comparators, and will report on the outcome of this study in due course, and take account of it in our 2023 periodic review of Network Rail (PR23).
4) Risk funding is getting tight
We recently published a letter summarising our review of Network Rail’s updated delivery plan for the remaining three years of CP6. Network Rail’s updated delivery plan remains broadly in line with our PR18 final determination. However, we are concerned about the relatively low level of risk funding in Network Rail’s plan for financial risks (£847 million) in years 3 to 5 of CP6. This is because of the financial risks it faces, especially as the economic recovery from Covid-19 is uncertain, and as it has used £1.8 billion of net risk funding in the first two years of CP6. We have concerns with Scotland in particular; the remaining risk funding in Scotland at the end of the

7
financial year was £57 million but it had identified over £100 million of reasonably foreseeable financial risks across the rest of CP6.
5) Lower enhancements expenditure
Network Rail spent £1.6 billion on government-funded enhancements to the rail network in 2020-21. This represents an 11 percent reduction compared to 2019-20 and a 50 percent reduction on the average annual expenditure in CP5. It was also 30 percent lower than Network Rail’s CP6 delivery plan, which Network Rail has attributed to delays in the approval of projects by funders.
6) Forward look: the 2023 Periodic Review of Network Rail and implementing the Williams-Shapps Plan for Rail
In June, we launched the 2023 periodic review process for determining the funding for Network Rail from 2024 to 2029 (Control Period 7, CP7) for operating, maintaining and renewing the network and what, in return, it should be required to deliver from this over the five years. Our process will also provide a framework through which we will hold Network Rail to account for delivering these requirements.
The Williams-Shapps Plan for Rail was published in May 2021. This sets out the UK government's plan to transform the railways in Great Britain. The Williams-Shapps plan sets out an expectation that Great British Railways (once it is set up) will be held to account for delivering the commitments that Network Rail enters into for CP7. This ensures there is clear accountability for delivery, and transparency about whether it is achieving this, and stability for investment during a period of change. The Williams-Shapps plan also sets out additional monitoring and reporting requirements for ORR, for example, in relation to rail sector employment costs and productivity. We are working with the UK government on how we will implement these changes.

8
1. Introduction Introduction and structure of this report 1.1 Our annual efficiency and finance assessments provide a snapshot of how Network Rail is
performing financially at the end of each year. This 2021 publication covers the second year of CP6, April 2020 to March 2021 (2020-21). It provides detailed support for our recent Network Rail Annual Assessment, which also covers Network Rail’s operational performance, including in respect of safety risk, train performance and asset management5.
1.2 Most of the financial information in this report is based on Network Rail’s regulatory financial statements, available on Network Rail’s website. All efficiencies, headwinds and financial risk numbers in this report are on a cash basis. All other financial information in this document is presented in 2020-21 prices, except where stated. Numbers may not sum due to rounding.
1.3 Chapter 2 reports on Network Rail’s efficiency and wider financial performance, on its income and expenditure, and on related matters such as budgetary flexibility.
1.4 Chapter 3 provides an analysis of the financial performance of each of the company’s five regions (Scotland, Southern, Wales and Western, Eastern, and North West and Central) and its national functions.
1.5 Annex A provides detailed financial tables for Network Rail’s activities in Great Britain, for England and Wales, and separately for the regions and national functions. Annex B explains the linkage between the efficiency and financial performance measures used in our assessments. Annex C summarises the progress of Network Rail’s CP6 research and development (R&D) projects.
How we calculate Network Rail’s efficiency and financial performance 1.6 Different measures can be used to report on a company’s financial performance and there
is no single right or wrong measure. Different measures are not exclusive and can be complimentary to provide a more rounded assessment. We consulted on these matters in the development of our PR18 determination and our CP6 regulatory accounting guidelines.
1.7 Our CP6 regulatory accounting guidelines explain how Network Rail is required to report to us in CP6. Our assessments in CP6 focus on two measures:
5 We also publish a detailed annual health and safety report.

9
● Efficiency: This compares the relationship between expenditure on core business activities (operations, support functions, maintenance and renewals) and outputs on a like-for-like basis over time.
● Financial performance: This compares income and expenditure to the financial assumptions underpinning the regions’ CP6 funding6. The financial assumptions in the delivery plan include the efficiency improvements that Network Rail’s regions are expected to achieve in CP6. As such, these baselines are described as being post-efficient. If a region has spent less and / or has received more income than the delivery plan (for what it has delivered), it will report financial outperformance, and vice versa.
1.8 Reporting of efficiency and financial performance over time gives assurance to rail users and funders that Network Rail’s regions are delivering what is expected and, at the same time, provides a reputational incentive for them to become more efficient.
Efficiency 1.9 The priorities for our assessments, and hence for Network Rail’s reporting in CP6, are to:
● drive the best outcomes for the users of the rail network through supporting better value for money;
● enhance comparisons of the performance of regions to assist in benchmarking;
● move away from measures that aim to be technically precise to a more rounded assessment which draws out key messages about the drivers of performance, make a clearer link between expenditure and delivery, and examine how efficiencies are being achieved;
● make better informed forward-looking assessments of the efficiencies that regions will likely deliver across the control period; and
● provide clear and informative messages about efficiency improvements, recognising that different audiences want different levels of technical detail.
1.10 To deliver these priorities we required changes to Network Rail’s reporting in CP6, including:
● greater emphasis on reporting how regions have delivered efficiency improvements;
● more assessment of cost drivers and productivity measures over time and across regions; and
6 It also applies for Network Rail as a whole, and separately for Scotland, and for England and Wales.

10
● a forward-looking view of the efficiencies that Network Rail will likely achieve across CP6. This includes reporting on the progress of regions’ efficiency plans and leading indicators of delivery.
Financial performance 1.11 Network Rail’s financial performance can be calculated in several ways. The factors to be
considered when deciding how to carry out this calculation include:
● what baselines (or budget) we should compare to;
● adjusting for the amount of work undertaken; and
● including or excluding some types of income and expenditure that may be less controllable such as the income and expenditure associated with traction electricity.
1.12 To be as informative as possible, our primary measure of Network Rail’s financial performance, the financial performance measure (FPM) takes each of the above matters into account. FPM compares Network Rail’s income and expenditure to its CP6 delivery plan. It adjusts for the amount of work done and excludes income and expenditure that is not controllable7. Our CP6 regulatory accounting guidelines explain how FPM is calculated.
1.13 Efficiency and financial performance are related but not the same. The relationship between these measures is explained in Annex B.
Regional level financial analysis 1.14 Network Rail started CP5 with 10 regional operating routes which were subsequently
rationalised to eight. Since the start of CP6, Network Rail has again reorganised these routes. Network Rail now has five geographical regions (Scotland, Southern, Wales and Western, Eastern, and North West and Central), together with some national functions, for example, the System Operator. Network Rail still has routes, although there are now 14 of them. The routes are now a sub-geography of the five regions8.
1.15 The re-organisation from routes to regions makes it difficult to compare performance back to our PR18 determination on a geographical basis, since that was undertaken for routes. Network Rail developed a CP6 delivery plan which set out how it intended to deliver the requirements of our PR18 determination within the funding available. It has subsequently revised this delivery plan from being route-based to region-based. So, for the purpose of comparing Network Rail’s financial performance to our PR18 funding assumptions, we use Network Rail’s revised CP6 delivery plan as the funding baseline in this assessment.
1.16 A map of Network Rail’s five regions is shown in Figure 1.1.
7 It excludes some income and expenditure that is not as controllable by Network Rail. This includes network grant, fixed track access charges, traction electricity income and costs, and business rates. 8 This is explained further on the Network Rail website.

11
Figure 1.1 The geography of Network Rail’s regions as at 31 March 2021
Source: Network Rail
1.17 We welcome comments on the content of this report. These should be sent to:
Customer Correspondence Team Office of Rail and Road 25 Cabot Square London E14 4QZ Email: [email protected]

12
2. Efficiency and financial performance
Efficiency 2.1 In determining the funding that Network Rail would need to deliver its required outputs in
CP6, we made an assessment of the efficient level of expenditure that it required. The detailed assumptions on expenditure and efficiency underlying these projections were set out in our 2018 periodic review (PR18).
2.2 Network Rail responded to our PR18 determination by developing a CP6 delivery plan which included £3.5 billion of efficiency improvements, which was consistent overall with our determination. Network Rail’s current five-year efficiency trajectory is shown in Figure 2.1.
Figure 2.1 Network Rail’s actual and forecast efficiency, Great Britain, CP6
Source: ORR analysis of Network Rail data
2.3 Network Rail has reported £710 million of efficiency improvement in 2020-21. This was £140 million ahead of its delivery plan target of £570 million for the year. Figure 2.2 shows regions’ and national functions’ contributions. The national functions’ contribution is shown net of an overlay applied on consolidation to adjust for inherent uncertainty in regional efficiency estimates and ensure the reporting of results and forecasts is prudent. These are examined in Chapter 3.

13
Figure 2.2 Contributions to Network Rail’s improved efficiency, 2020-21
Source: ORR analysis of Network Rail data
2.4 Network Rail’s improved efficiency in 2020-21 has been achieved through a combination of national and regional initiatives. Network Rail aggregates these into nine groups and 22 sub-groups in its reporting to us. The contribution of these to Network Rail’s efficiency improvement in 2020-21 is shown in Figure 2.3.
2.5 Regions’ contributions to efficiency groupings vary according to the type and mix of work they have planned, the size of the region, and local efficiency initiatives. The planning, measurement and delivery of efficiency initiatives has been devolved to the regions, who are responsible for delivering on their efficiency targets, allowing them to tailor efficiency initiatives to deliver the best outcomes for the region. One of the advantages of a regional structure, is that Network Rail can learn from having different approaches in areas like these.

14
Figure 2.3 Initiatives that have contributed to Network Rail’s improved efficiency, 2020-21
Source: ORR analysis of Network Rail data

15
2.6 The biggest efficiencies that Network Rail has delivered in 2020-21 and is aiming to deliver in CP6 are in the following areas:
1. Improved contracting strategies
Improved contracting strategies includes negotiating contracts with improved terms or rates and packaging work differently to get the best outputs from contractors. This includes numerous contracts across various types of work and regions. Network Rail has delivered efficiencies through earlier engagement with suppliers and better packaging of works.
2. Supply chain organisation initiatives
This grouping includes initiatives delivered by the route services function, largely through savings generated from more efficient management of Network Rail’s fleet of vehicles and machinery, as well as delivering economies of scale by centrally negotiating contracts for all Network Rail’s regions, savings which are then passed on to the regions who use these services.
3. Early contractor involvement
Early contractor involvement delivers efficiencies through Network Rail engaging with contractors at earlier stages in the delivery of work and identifying opportunities to make savings through reduced scope, using minimum specification solutions and value engineering.
4. Reduced activity due to new technologies
The introduction of new technologies can reduce the level of renewals required to maintain the condition of assets. This efficiency category includes various projects across the regions that have enabled reduced scope of work whilst maintaining asset condition. These include using new technologies designed to improve automation, accuracy, performance and decision-making.
5. Other initiatives
The largest single change within the ‘Other’ category is efficiencies generated from the reduction in performance-related pay for 2019-20, approved (and therefore recognised) in 2020-21. In total, this generated an efficiency of £124 million and was a significant contribution to the £140 million by which Network Rail exceeded its efficiency target in the year.
Do we agree with Network Rail’s reported efficiency? 2.7 As explained in Chapter 1, we have required substantial changes to Network Rail’s
reporting of efficiency in CP6. An important change was to require Network Rail to report to us on how efficiency improvements are being delivered. Network Rail has worked constructively with us to implement this new approach.

16
2.8 The value of some of Network Rail’s efficiency improvements is relatively straightforward to calculate, for example, where there has been a simple reduction in the unit rate of a supplier contract. So, where Network Rail has demonstrated that it has used the new contract, there is little uncertainty about the value of the efficiency that has been achieved. However, for many business changes that have been implemented to improve efficiency, the value of the efficiency is harder to measure. This results in an inherent uncertainty in the value of the efficiency that has been achieved. Recognising this uncertainty, Network Rail has calculated a central point efficiency of £710 million in 2020-21, with a range from £680 million to £780 million.
2.9 Network Rail’s ‘headwinds’9 have increased over the last year. In Network Rail’s CP6 delivery plan it identified headwinds of £0.6 billion and the latest forecast for the control period is now £1.1 billion. Of this increase, £0.3 billion is due to cost increases relating to Covid-19, which were included in Network Rail’s RF11 forecast (Network Rail’s reforecast of its plans in period 11 of 2020-21). We have some concerns about the classification and reporting of these headwinds and Network Rail’s assurance process. Network Rail is also reporting above-inflation cost increases in some areas. It has not yet adequately explained to us why there has been such a large increase in these costs.
2.10 We are concerned that some of the cost increases reported as headwinds have been included in error, or are not really outside of Network Rail’s control and so should be classified as inefficiencies. If these costs were found to be inefficiencies and were reclassified, this would reduce Network Rail’s reported efficiency achieved in the control period to date. However, we are aware that Network Rail takes a prudent approach to measuring its reported efficiency, which may balance out some of the effect of any reclassification
2.11 This is a complex and subjective area, for example, some costs may not be controllable in the short term, but are in the longer term. It is also a relatively new issue as Network Rail has only started reporting headwinds since the start of CP6. Network Rail has acknowledged that it needs to do more to better assure and more clearly report on these cost increases. We have worked closely with Network Rail over the past year to agree how efficiencies should be calculated and reported, and will continue to do so. As our work in this area is on-going, we will report on this in future assessments.
Financial performance 2.12 Our primary measure of Network Rail’s financial performance, FPM, provides a better
understanding of Network Rail’s financial performance than simple income and expenditure variances and complements the efficiency analysis (see Annex B for how the two can be reconciled). A positive FPM means that Network Rail has outperformed and vice versa.
9 Headwinds (cost increases that Network Rail considers to be outside of its control) in this document are net of tailwinds (these are cost reductions that Network Rail considers are largely outside of its control). But, Network Rail has not identified many tailwinds so far in CP6.

17
2.13 Network Rail spent around £7.5 billion operating, maintaining and renewing the national rail infrastructure in 2020-21. This includes network operations (£0.7 billion), support costs (£1.0 billion), maintenance (£1.9 billion) and renewals costs (£3.9 billion).
2.14 In 2019-20, Network Rail outperformed by £20 million, which means that cumulatively, over the first two years of CP6, Network Rail has underperformed by £404 million against the CP6 delivery plan.
Table 2.1 Network Rail’s financial performance, Great Britain, 2020-21
£ million, 2020-21 prices Actual
Variance to CP6 delivery plan
better / (worse)
Of which out / (under)
performance
Network grant income 6,641 170 0 Franchised track access charges 2,464 (263) (90) Other single till income 496 (227) (227) Total income 9,601 (320) (317) Schedule 4 288 35 22 Schedule 8 (347) 395 395 Network operations 714 (57) (57) Support costs 956 (84) 19 Traction electricity, industry costs and rates 845 100 1 Maintenance 1,892 (172) (157) Total operating expenditure 4,348 217 223 Capex – Renewals 3,910 (314) (307) Capex – Enhancements 1,620 690 (23) Total capital expenditure 5,530 376 (330) Financing costs and other10 1,748 912 0 Total expenditure 11,626 1,505 (107) Financial performance measure (FPM) (424)
Source: Network Rail’s regulatory financial statements
2.15 As shown in Table 2.1, Network Rail financially underperformed against its CP6 delivery plan by £424 million in 2020-21. This shows significantly worse financial performance than 2019-20 and is due to a number of factors, most notably unexpected cost increases and reductions in income, as a result of the pandemic. This was partially offset by outperformance in the Schedule 8 compensation regime. These matters are examined in the income and expenditure sections of this chapter, and in our regional analysis in Chapter 3.
2.16 There are some common drivers of income and expenditure across the network. However, local circumstances (such as weather) and different levels of regional
10 Network Rail still has financing costs despite being reclassified to the public sector because it has legacy private sector debt. This is funded by the Department for Transport (DfT) outside of the PR18 determination.

18
performance (such as local efficiency initiatives) can have an effect. Better understanding and learning from regional comparisons can help all regions to improve their financial performance. Figure 2.4 shows the regional contributions to Network Rail’s financial performance, with national functions’ contributions fully allocated between the regions.
Figure 2.4 Regional contributions to Network Rail’s financial performance, 2020-21
Source: ORR analysis of Network Rail’s regulatory financial statements
Budget flexibility 2.17 Network Rail was reclassified as an arm’s length public sector body in CP5. From the start
of CP6, Network Rail is now subject to Government’s resource (operating) and capital departmental expenditure limits (‘RDEL’ and ‘CDEL’). These restrict Network Rail’s ability to spend money in different years of a control period than initially agreed with the governments, and restrict switching expenditure between resource and capital expenditure. The budget flexibility rules are quite complicated and are explained in our financial framework PR18 document.
2.18 Network Rail has received HM Treasury approval to roll forward £107 million of Department for Transport (DfT) funded capital expenditure to be used later in CP6 across England and Wales. The £107 million variance was largely due to £76 million of capital expenditure being delayed in the later months of the year. There was also an effect from the timing of capital grant funding received for third party work. It will also not be able to use £52 million of resource expenditure (meaning its operational spending), as better than anticipated train performance towards the end of the year (due to benign weather and a further national lockdown) led to higher than anticipated Schedule 8 income prior to the end of the year.
2.19 The Scotland section of Chapter 3 examines this issue in Scotland. As decisions on spending on transport are devolved to the Scottish Government, oversight of the flexibility of grant payments within Scotland falls within the remit of Transport Scotland. Network

19
Rail Scotland was permitted to carry forward £94 million of underspend from 2020-21 to later years in the control period. Included in this figure is £18 million of underspend which exceeded the HM Treasury 10 percent permitted carry forward, but which the Scottish Government agreed to carry forward to 2021-22 on the basis it would be required in that year. A further £10 million underspend of enhancement grant funding that arose after the carry forward cut off was not able to be carried forward and will not be able to be used.
Risk funding 2.20 Network Rail received £3.0 billion of risk funding (in cash prices) for CP6 which increased
Network Rail’s confidence in its CP6 forecasts to 80 percent (P8011). Based on Network Rail’s forecasts from February 2021, this confidence level has reduced to 71 percent. This could reduce further as there are a number of challenges remaining in the control period, including increasing volumes of work in years 3 and 4, and the continuing impact of the pandemic on the rail industry.
2.21 Network Rail’s remaining risk funding for years 3 to 5 of CP6 is £847 million, which is relatively low. We are concerned about this given the financial risks it faces and that it has used £1.8 billion of risk funding in the first two years of CP6.
2.22 The £1.8 billion included £1.4 billion of emerging risk funding and £0.7 billion for other activities, which were offset by £0.3 billion of ‘Crossrail Supplementary Access Charge’ income transferred into the risk fund. This income was part of the PR18 settlement but had a different treatment to other funding. The approach used by Network Rail is consistent with the PR18 settlement and was agreed with DfT. The uses of the risk funding are set out in more detail below.
2.23 £1.4 billion of risk has emerged in the control period to date, detailed as follows:
● £0.3 billion of additional earthworks expenditure, including £150 million in response to the Carmont derailment in 2020;
● £0.3 billion of higher than expected regional and national functions expenditure such as additional weather related expenditure and fatigue management expenditure;
● £0.2 billion of net Covid-19 risks, largely driven by lower than expected property income;
● £0.2 billion of lower than expected charges and other sources of income (such as lower than expected inflationary uplifts on some charges);
● £0.2 billion higher track and signalling rates; and
● £0.1 billion additional business rates.
11 This is a measure of confidence constructed using probability. For example, the 80th percentile cost (also known as the P80) is such that the probability of the final cost being less than P80 is 80 percent.

20
2.24 If not all of the risk fund is needed to fund emerging risks, as set out in PR18, Network Rail is allowed to use it for other activities. A further £0.7 billion has been allocated to other activities in 2020-21, including:
● £0.3 billion on additional renewals and maintenance volumes;
● £0.2 billion on the track worker safety programme; and
● £0.2 billion on performance improvement initiatives.
2.25 The level of risk funding in the Scotland region is a particular concern as its recent RF11 financial forecast had £57 million of risk funding but had identified over £100 million of reasonably foreseeable financial risks across the rest of CP6.
2.26 The remaining financial risk position varies across the regions. In England and Wales, low risk funding in a region can be mitigated to some extent because risk funds can be shared across the four regions through a portfolio risk fund which regions can bid into. This is not the case in Scotland, which is separately funded by Transport Scotland and does not have access to the England and Wales portfolio fund.
2.27 We have asked Network Rail’s regions to set out the ways in which financial risk will be managed over the remainder of CP6, and provide funders and stakeholders with the necessary understanding of the trade-offs and the short and longer term implications (for example, into CP7) of the potential decisions on safety, asset sustainability, performance, income and expenditure. For example, regions could clearly set out the process for switching on or off projects. We will continue to assess this issue as part of our on-going monitoring of Network Rail.
Headcount and staff costs 2.28 Network Rail employed just over 44,400 staff at the end of 2020-21. This represents a 10
percent increase in headcount in the two years since the end of CP5 (2018-19). There was a 6 percent increase in year 1 of CP6 and 4 percent in year 2. Included in the increase is a 27 percent increase in senior management posts to around 630 staff, whereas non-management posts increased by 8 percent12.
2.29 Network Rail has attributed the increased headcount to the implementation of Putting Passengers First (PPF, Network Rail’s internal re-organisation to create five regional organisations supported by fewer national functions), increased resourcing of train planners (following the findings of the Glaister inquiry into May 2018 network disruption) and increased internal training and IT resources in its Route Services directorate. It is not clear that the increase in headcount has been efficient. Network Rail is now considering
12 We have included executive director and Band 1 posts as senior management in our analysis, which includes region-level director roles, as well as route-level director roles, for example, route finance directors. We included Bands 5 to 8 and ‘Other’ (meaning front-line staff) as non-management grades. Bands 2 to 4 (other management) increased by 14 percent in the same period.

21
its workforce plans and will better explain the reasons for the recent staff increases, which we will further report on.
2.30 The increase in headcount has led to an increase in total staff costs, which have increased from £2.3 billion in the last year of CP5 (2018-19) to £2.6 billion in 2020-21. The increase in staff costs, excluding the effect of bonus payments in both years13, is 14 percent14.
2.31 We will shortly be commissioning a study, which will look at comparing Network Rail’s employment costs (not the number of people employed) to relevant comparators, and will report on the outcome of this study in due course, and take account of it in PR23.
Expenditure 2.32 Network Rail spent around £11.6 billion in 2020-21. Figure 2.5 shows the main categories
of Network Rail’s expenditure and these are examined below.
Figure 2.5 Network Rail’s expenditure, 2020-21
Source: ORR analysis of Network Rail data
Operating expenditure 2.33 Operating expenditure relates to Schedule 4 and 8 payments, network operations, support
costs, traction electricity, industry costs and rates, and maintenance. These expenditure items are examined below.
13 It is more comparable to exclude bonus payments in this analysis. Especially because in 2020-21, Network Rail recognised a credit (that is, a reduction) in expenditure, as some bonus payments for 2019-20 that were included in the 2019-20 accounts, were not paid. 14 The increase in staff costs includes pay rises in both years.

22
Schedule 4 and Schedule 8 costs 2.34 The Schedule 4 regime compensates train operators for planned reductions to network
availability. It incentivises Network Rail to plan engineering work early and efficiently to reduce disruption. The Schedule 8 performance regime compensates train operators (and vice versa) for the impact of unplanned service disruption.
2.35 Schedule 4 costs were £288 million in 2020-21, £35 million lower than the delivery plan mostly due to reduced use of disruptive engineering work throughout the year, despite the impact of adverse weather in the summer and during February’s storms. Network Rail outperformed its delivery plan by £22 million, which was lower than the expenditure variance since deferred disruptive engineering work will not impact FPM.
2.36 Schedule 8 generated £347 million of income in 2020-21, £395 million better than the £48 million of costs anticipated in the delivery plan. This resulted in a £395 million financial outperformance. During the year there was a significant reduction in the number of trains running on the network, with on average 78 percent of the pre-pandemic timetable running across the network in 2020-21. Fewer trains, and lower passenger numbers, meant that there was less disruption to the trains which were running, and trains were able to make up lost time more easily. Alongside Network Rail’s on-going efforts to improve train performance, this led to exceptional train punctuality in 2020-21, which in turn meant Network Rail exceeded its performance benchmarks and received significant unanticipated income from train operators through the Schedule 8 regime.
Network operations 2.37 Network operations expenditure relates to activities to operate the rail network. These
include signalling and running Network Rail managed stations.
2.38 Network Rail spent £714 million operating the rail network in 2020-21, £57 million more than its delivery plan and recognised a £57 million underperformance. There was a notable increase in spend on managed stations, mostly to ensure compliance with Covid-19 safety measures, as well as on signallers, where additional staff costs were incurred to ensure the network continued running during the pandemic
Support costs 2.39 Support costs relate to activities that facilitate Network Rail’s core business activities.
These include information management and corporate functions.
2.40 Support costs were £956 million in 2020-21, £84 million more than the delivery plan with £19 million of financial outperformance. The overspend was mostly due to costs associated with Network Rail’s PPF programme, Covid-19 related expenditure and the implementation of the Project Alpha performance improvement scheme in the North West and Central region. This was offset by savings in performance-related pay for 2019-20, recognised in this financial year, which is a financial outperformance.
2.41 The overspend was reported despite positive FPM due to an accounting adjustment to reclassify capital expenditure to operating expenditure, to align the regulatory financial

23
statements with Network Rail’s financial accounts, as discussed in the national functions section (the reclassification does not affect FPM). The below commentary focusses on the underlying variances to the delivery plan, although this adjustment is discussed where material.
Traction electricity, industry costs and rates 2.42 Network Rail purchases electricity to provide power for electrically powered trains. These
costs are largely matched by an equal amount of income from train operators (it retains a minimal amount of the cost for electricity used by itself). Industry rates and other costs include Network Rail’s share of British Transport Police costs, business rates, Rail Safety and Standards Board (RSSB) costs, the ORR licence fee and railway safety levy. Network Rail has limited control over these costs, which are either set by government agencies, or by market prices in the case of traction electricity prices.
2.43 Traction electricity, industry costs and rates were £845 million in 2020-21, £100 million less than the delivery plan due to less electricity being used in the year as fewer trains were running on the network due to travel restrictions during the Covid-19 pandemic. This underspend was offset by reduced traction electricity charges (see the Income section).
Maintenance 2.44 Maintenance expenditure relates to activities that sustain the condition and capability of
the existing infrastructure to the previously assessed standard of performance.
2.45 Network Rail spent £1,892 million maintaining its rail network in 2020-21, £172 million more than its delivery plan. It reported £157 million underperformance for the work done. The most significant increases related to the pandemic and additional costs Network Rail incurred on staff costs, purchase of personal protective equipment (PPE) and fitting protective screens to vehicles to comply with social distancing requirements. There was also additional spend in track maintenance due to changes implemented as part of the PPF re-organisation. All of these increased costs contributed to the underperformance in FPM.
Renewals 2.46 Renewals expenditure relates to activities to replace in whole, or in part, network assets
that have deteriorated so that they can no longer be maintained economically. Renewal of an asset restores the original performance of the asset and can add additional functionality as technology improves.
2.47 Network Rail spent £3,910 million renewing the rail network in 2020-21, £314 million more than the delivery plan. Network Rail financially underperformed by £307 million in its renewals expenditure. Of this underperformance, £320 million was from regionally-managed expenditure, with the largest underperformance from track renewals (£155 million underperformance). Network Rail has attributed these increased costs to various factors, including disruption as a result of the pandemic (particularly to high output

24
renewals), increased costs associated with staff welfare and purchase of PPE, and changes to planned access due to disputes with operators.
Enhancements 2.48 Enhancements are changes to improve network capacity or capability, for example,
enabling more train journeys or higher speeds. This is subject to approvals from DfT and Transport Scotland as relevant under their ‘pipeline’ approaches for releasing funds as individual projects progress.
2.49 Network Rail spent £1,620 million on government-funded enhancements in 2020-21 (excluding enhancements funded by third parties). This represents a reduction in expenditure compared to 2019-20 and a substantial reduction on the annual average expenditure on enhancements in CP5. It was also £690 million (30 percent) lower than the delivery plan, which Network Rail has attributed to delays in the approval of work by funders, although most of the work not completed in 2020-21 has been deferred to later years rather than cancelled.
2.50 Although there was significant underspend in enhancements, there was minimal underperformance recognised in the year. The most significant underperformance was at Gatwick Airport station, where £10 million of financial underperformance has been attributed to additional scope requirements.
Table 2.2 Network Rail’s enhancements expenditure, 2020-21
£ million Actual
expenditure
Delivery plan variance
better/(worse) (Under) / out performance
Trans Pennine Route Upgrade 266 483 3
East West Rail phase 2 207 (10) 1
East Coast Main Line enhancements program 189 65 (9)
Midland Main Line program 166 21 (1)
Thameslink 59 39 4
Gatwick Station 51 (18) (10)
Other Network Rail-funded enhancements 682 110 (11)
Total Network Rail-funded enhancements 1,620 690 (23)
Third party-funded enhancements 409 n/a n/a
Total enhancements 2,029 n/a n/a
Source: Network Rail’s regulatory financial statements
2.51 The financial matters relating to key schemes are:
● Trans Pennine Route Upgrade (£266 million): The Trans Pennine Route Upgrade was the largest enhancement project in the year, although it spent £483 million less

25
than assumed in the delivery plan. This expenditure was in line with a new baseline agreed with DfT for the year, although the delivery plan was not changed.
● East West Rail phase 2 (£207 million): The spend on this project in the year was higher than planned which has caught up on some of the previous year’s underspend. To date, there is a slight outperformance on the work delivered.
● East Coast Main Line enhancements programme (£189 million): Slower progress in this project in the year has partially offset over-delivery in the previous year. £9 million of underperformance has been recognised due to delays caused by national lockdowns and retiming of work to reduce passenger disruption.
● Midlands Main Line program (£166 million): Progress on London to Corby electrification has been slower than planned, leading to £21 million in-year underspend against the delivery plan, although the work done was neutral for FPM.
● Thameslink (£59 million): Expenditure in the year is lower than baseline due to some improvements at London Bridge station not being completed. Financial outperformance in the year has offset underperformance in the previous year, so this enhancement is now reporting neutral FPM for the control period.
● Gatwick Station (£51 million): The Gatwick Airport station improvement has overspent in the year due to acceleration of work to take advantage of a quieter station while travel restrictions have been in place. Financial underperformance of £10 million has been recognised due to additional scope requirements.
● Other Network Rail-funded enhancements (£682 million): Network Rail undertook a number of smaller PR18-specified projects, none of which incurred materially different spend to Network Rail’s delivery plan.
Core Valley Lines 2.52 Part of the rail network in Wales (the Core Valley Lines, CVL) was transferred to the
Welsh Government in March 2020 (before the start of the 2020-21 financial year). Transport for Wales owns the CVL, which Amey Infrastructure Wales Limited manages on its behalf. The transfer resulted in £470 million of property sales income for Network Rail in 2019-20, and an equal and offsetting £470 million deduction from Network Rail’s regulatory asset base (RAB).
2.53 As a result of the transfer, Network Rail’s CP6 financial settlement was reduced as it no longer requires funding for the CVL. Network Rail still supplies some services to the CVL, for which it receives income from Amey Infrastructure Wales Limited.
Income 2.54 Network Rail received £9,601 million of income in 2020-21. Figure 2.6 shows this split by
major income category.
26
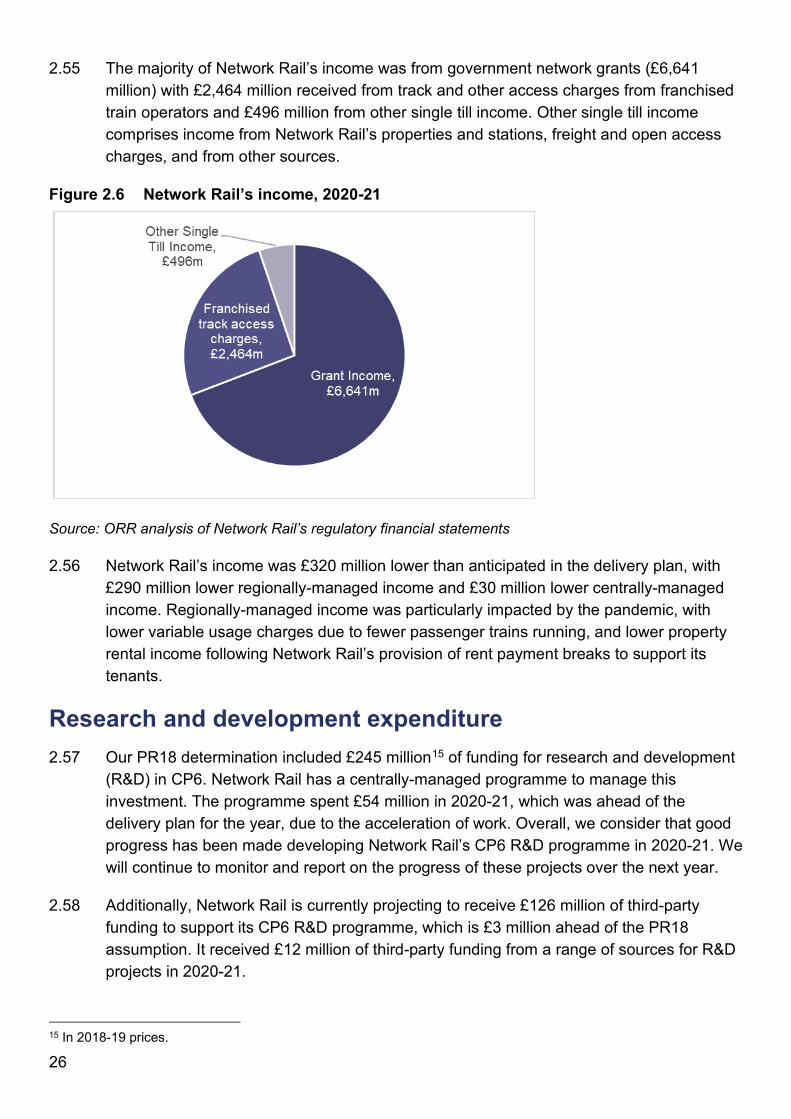
2.55 The majority of Network Rail’s income was from government network grants (£6,641 million) with £2,464 million received from track and other access charges from franchised train operators and £496 million from other single till income. Other single till income comprises income from Network Rail’s properties and stations, freight and open access charges, and from other sources.
Figure 2.6 Network Rail’s income, 2020-21
Source: ORR analysis of Network Rail’s regulatory financial statements
2.56 Network Rail’s income was £320 million lower than anticipated in the delivery plan, with £290 million lower regionally-managed income and £30 million lower centrally-managed income. Regionally-managed income was particularly impacted by the pandemic, with lower variable usage charges due to fewer passenger trains running, and lower property rental income following Network Rail’s provision of rent payment breaks to support its tenants.
Research and development expenditure 2.57 Our PR18 determination included £245 million15 of funding for research and development
(R&D) in CP6. Network Rail has a centrally-managed programme to manage this investment. The programme spent £54 million in 2020-21, which was ahead of the delivery plan for the year, due to the acceleration of work. Overall, we consider that good progress has been made developing Network Rail’s CP6 R&D programme in 2020-21. We will continue to monitor and report on the progress of these projects over the next year.
2.58 Additionally, Network Rail is currently projecting to receive £126 million of third-party funding to support its CP6 R&D programme, which is £3 million ahead of the PR18 assumption. It received £12 million of third-party funding from a range of sources for R&D projects in 2020-21.
15 In 2018-19 prices.

27
Figure 2.7 Network Rail’s actual and planned R&D expenditure, CP6
Source: ORR analysis of Network Rail’s regulatory financial statements and other submissions.
2.59 Network Rail’s R&D programme has 180 projects in its pipeline with 95 projects having commenced. There is a committed spend of £236 million across CP6. These projects include:
● An emergency speed restrictions or temporary speed restrictions design tool that should simplify and standardise the way speed restrictions are implemented and managed.
● Plain Line Pattern Recognition deep learning to target track faults, which should lead to reduced delays and improved asset information.
Projects undertaken in Scotland include:
● A digitised lineside inspections tool for vegetation management, which should lead to improved safety for the workforce and passengers, increased frequency of inspections, identification of high risk sites and better data and asset information.
● Trials of cryogenic blasting, where dry ice is used to remove leaf residue from rails.
2.60 Annex C summarises the progress of Network Rail’s CP6 R&D projects.
Performance innovation fund 2.61 In PR18, we established a £40 million16 performance innovation fund (PIF) to support
innovative projects aimed at driving improvements in train service performance. The fund
16 In 2018-19 prices.

28
provides an incentive for the rail industry as a whole to think creatively about ways to improve train performance, and to improve knowledge sharing about what does and does not work. The PIF is open to bids from across the rail industry with a focus on removing obstacles in current working practices that prevent a more effective focus on performance improvement.
2.62 Over the last year, a number of schemes have been identified across the network, with £22 million of the total £40 million fund being allocated for specific schemes. While the majority of the £22 million has been granted to national schemes, a variety of regional schemes have been authorised, ranging from £3 million for North West and Central region to £1 million for Wales and Western region. The largest number of schemes relate to monitoring and analysing train performance and infrastructure. This includes schemes such as the fitment of a Global Positioning System (GPS) to the High Speed Trains fleet in Network Rail Scotland region, helping to improve data analysis, and a speed restriction analysis tool on the West Coast Mainline South within the North West and Central region.
2.63 Following a slow rate of investment approvals in 2019-20, we welcome greater use of the PIF in 2020-21 to fund schemes to deliver future performance improvements.
Productivity 2.64 Improving productivity is one of the ways for a company to become more efficient.
However, we have made little use of productivity measures in our monitoring of Network Rail’s efficiency in previous control periods. For CP6, we have required Network Rail to develop and share with us regionally disaggregated productivity measures to help better understand the scope for future efficiency improvements.
2.65 Network Rail has developed a number of measures which it is using to improve its understanding of efficiency and where there may be scope to improve, such as time-on-tools. We will continue to engage with Network Rail on the development of these measures, and how they can be used to inform our financial monitoring over the next year.
Leading indicators of efficient delivery 2.66 Poor planning caused a number of problems with Network Rail’s renewals delivery and
efficiency in CP5. So we requested that Network Rail demonstrate it is better prepared to deliver efficiently from the start of CP6. This section provides an update on Network Rail’s preparations to deliver efficiently in 2021-22 (year 3 of CP6) as at the start of the year.
2.67 Chapter 3 provides a regional analysis of these leading indicators. Note that the ‘National’ column in the figures below refers to a national average, not Network Rail’s national functions.

29
Renewals planning 2.68 Effective renewals planning is important because it improves the robustness of the rail
network and reduces costs. It helps to provide a stable profile of work for Network Rail’s supply chain, can avoid more critical work than necessary being squeezed into the final quarter of the year (when weather conditions are most challenging) and prevent slippage of work into the following year.
2.69 For Great Britain, 75 percent of Network Rail’s 2021-22 renewals projects were authorised by the end of 2020-21, which is below its target of 81 percent. This has been particularly impacted by slow track authorisations, which are usually of high value. This indicator is reporting higher than the previous year (69 percent in 2019-20), although authorisations will continue to be monitored heading into the next financial year.
2.70 Based exclusively on this key indicator we would be concerned at the progress made by Network Rail. However, financial authorisation only provides a partial picture of renewals workbank planning. Remits issued and accepted by the supply chain shows progress made at an earlier stage of the planning lifecycle. Network Rail has issued, and its supply chain accepted, 91 percent of planned renewals for 2021-22, meaning further progress than suggested by using financial authorisations alone.
2.71 We consider that Network Rail has made progress in developing its 2021-22 renewals workbank and is in a strong position to continue to deliver efficiently in 2021-22.
Figure 2.8 Percentage (by value) of 2021-22 renewals projects with financial authorisation
Source: Network Rail
Securing engineering access to the railway 2.72 Network Rail exceeded its internal target for booking disruptive access to the network for
planned engineering work in 2021-22. Against a target of 76 percent, it achieved 98 percent of network access booked by the start of the year.

30
2.73 This metric is significantly higher than at the same point in the prior year (76 percent in 2019-20), suggesting Network Rail’s delivery of work in 2021-22 is better planned which should lead to more efficient delivery in the year.
Figure 2.9 Percentage booked of network access required in 2021-22
Source: Network Rail
Maintenance headcount 2.74 Whilst Network Rail’s maintenance headcount is currently at 97 percent of plan, it is below
its target of 99 percent. This difference is not likely to be made up during the year as Network Rail has said it is managing its maintenance workload well at this level.
Figure 2.10 Maintenance headcount compared to 2021-22 requirement
Source: Network Rail
Efficiency planning 2.75 As shown in Table 2.3, across its regions, Network Rail considers that 72 percent of its
regional 2021-22 target efficiency will be achieved from projects that have already been delivered or have clear project plans. The remaining 28 percent have no clear project plans, or have plans in place but low confidence in delivery. This position is similar to the same point in the prior year. Given that all regions delivered on their 2020-21 targets at this level of confidence, this is not of significant concern.

31
Table 2.3 Network Rail’s assessment of the maturity of its 2021-22 efficiency plans (by value)
Eastern NWC Scotland Southern W&W Regional Total
Project delivered, waiting for benefits to be realised 32% 47% 15% 1% 9% 22%
Project in place with delivery plan and milestones 48% 30% 18% 73% 63% 50%
Strategic theme applied, commitment to deliver but no plan in place
15% 17% 58% 18% 27% 22%
Unknown 5% 6% 9% 8% 1% 6%
100% 100% 100% 100% 100% 100% Source: Network Rail
2.76 During the year we conducted a review of a sample of the regions’ year 2 efficiency plans. The purpose of our review was to understand how the regions are planning and reporting on efficiencies, and the robustness of their assurance processes for assessing business changes and calculations. The quality of the evidence received from four of the regions (Southern, Wales and Western, Eastern, and North West and Central) was generally robust and clear, and the quality of documentation has improved from reviews we have undertaken in previous years. However, across all of the regions, there was a lack of consistency in the quality of planning documentation for efficiency initiatives.
2.77 We struggled to get similar assurance from the evidence provided by the Scotland region, and we identified areas of concern with the region’s plans, which it has accepted and is working to address. We have been engaging with Network Rail Scotland more closely since our review, and the region has designed and is beginning to implement an efficiencies action plan to address the concerns we have raised.
2.78 Better planning for delivery of efficiencies will help Network Rail to deliver the increasing efficiency challenge over the remainder of CP6. Better documentation is important to evidence that efficiencies have been delivered and are likely to be delivered in future. Although there are still some improvements which could be made, based on the evidence that we have reviewed, we consider that Southern, Wales and Western, Eastern, and North West and Central appear to be sufficiently prepared to deliver the remainder of their CP6 target efficiencies. Network Rail Scotland’s preparedness remains a concern, which we are monitoring closely.
2.79 Network Rail’s efficiency challenge increases through CP6, and the pandemic has had a significant impact on its business. In particular, we are aware that the regions are facing increased cost pressures on some asset types, and that some planning assumptions made at the start of CP6, including the level of efficiencies that national framework contracts would deliver, were too optimistic.

32
Regulatory finances 2.80 Network Rail’s regulatory asset base (RAB) increased by a net £0.2 billion to £72.7 billion
in 2020-21. The increase was due to indexation, with the renewals added to the RAB offset by the amortisation of existing assets.
2.81 Network Rail no longer issues debt to fund its capital expenditure. However, it continues to hold legacy debt (£53.6 billion) including financial instruments issued to investors before the company’s reclassification to the public sector. It paid £1.7 billion of financing costs on this debt during the year, which is funded by DfT outside of the PR18 determination.

33
3. Regional analysis 3.1 This chapter provides an analysis of the financial performance of each of Network Rail’s
five regions – Scotland, North West and Central, Eastern, Southern, and Wales and Western, and for its national functions. The financial information reported for each region includes its allocation of the national functions’ income and costs. We also provide a separate analysis for Wales. Caution is needed when comparing the relative performance of Network Rail’s regions. This is because financial data in this chapter has not been normalised for differences in the physical, geographical and operational characteristics of each region.
3.2 Annex A provides detailed financial tables for Network Rail’s activities in Great Britain, England and Wales, and separately for its regions and national functions.
3.3 This chapter examines regions’ readiness to deliver efficiently in 2021-22. The leading indicators figures presented in Chapter 2 are also included in the Scotland section below but not in the other regions.
Scotland Efficiency in 2020-21 3.4 Our PR18 determination concluded that Network Rail should improve its efficiency by 7.9
percent in 2020-21 in Scotland. This means that we expected that Network Rail Scotland’s output in 2020-21 would cost 7.9 percent less than what it would have cost, on a like for like basis, in 2018-19.
3.5 The Scotland region exceeded its delivery plan target of £64.1 million for the year and delivered £65.6 million of efficiency improvements. This forms part of Network Rail’s plans to deliver £396 million of efficiency in Scotland in CP6. Network Rail’s delivery plan trajectory for Scotland is shown in Figure 3.1.

34
Figure 3.1 Actual and forecast efficiency, Scotland, CP6
Source: ORR analysis of Network Rail data
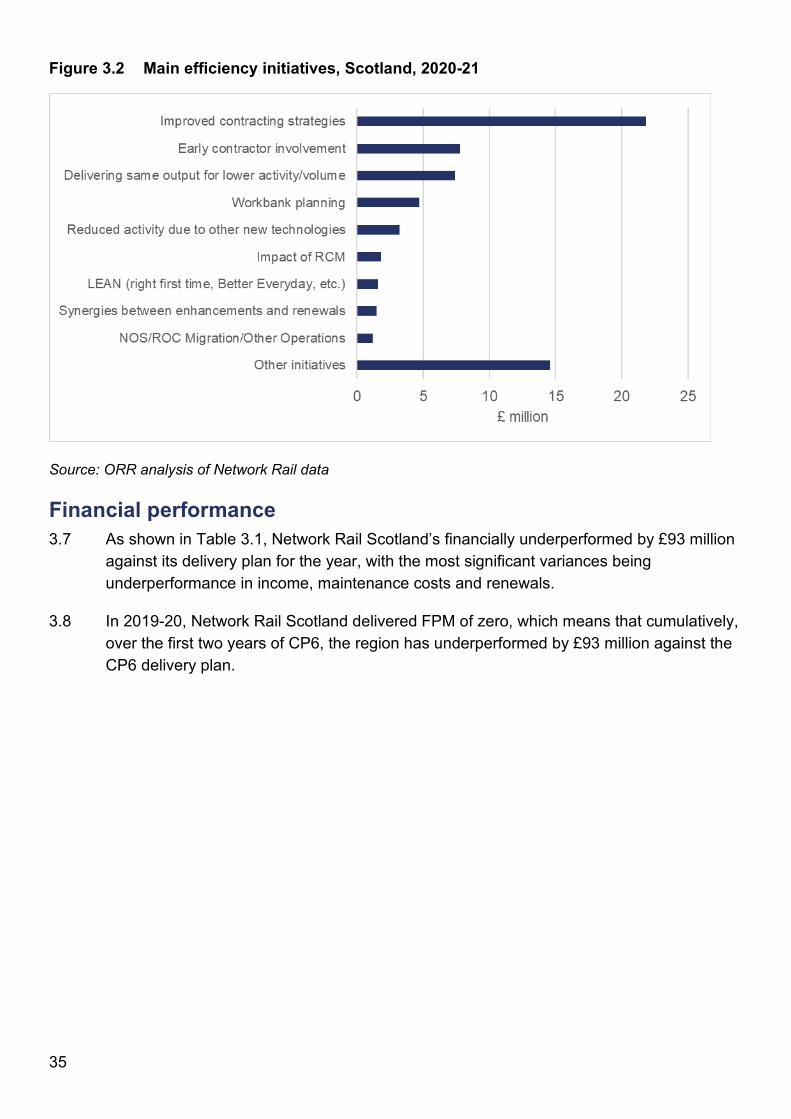
3.6 Figure 3.2 shows the main initiatives that have contributed to Network Rail Scotland’s efficiency improvement in 2020-21. The most significant initiatives were:
● Improved contracting strategies (£21.8 million): Large efficiencies in this grouping have been delivered through successful negotiations with contractors to deliver work at lower rates. There have also been savings delivered through improved access negotiations, made more successful through Network Rail having a stable bank of work leading up to delivery.
● Early contractor involvement (£7.8 million): The Edinburgh Control Signalling Renewal generated £6.8 million of efficiencies in this grouping in 2020-21. Early engagement with contractors has allowed savings to be generated from earlier awarding of work, reducing time spent on preliminary works, and has improved integration between the contractors and Network Rail.
● Delivering same output for lower activity/volume (£7.4 million): This grouping includes efficiencies generated through maintaining a stable workbank and maximising time on site and available equipment, ensuring that as much work as possible is completed in each shift, reducing the amount of time spent setting up and clearing away on sites.
35
Figure 3.2 Main efficiency initiatives, Scotland, 2020-21
Source: ORR analysis of Network Rail data
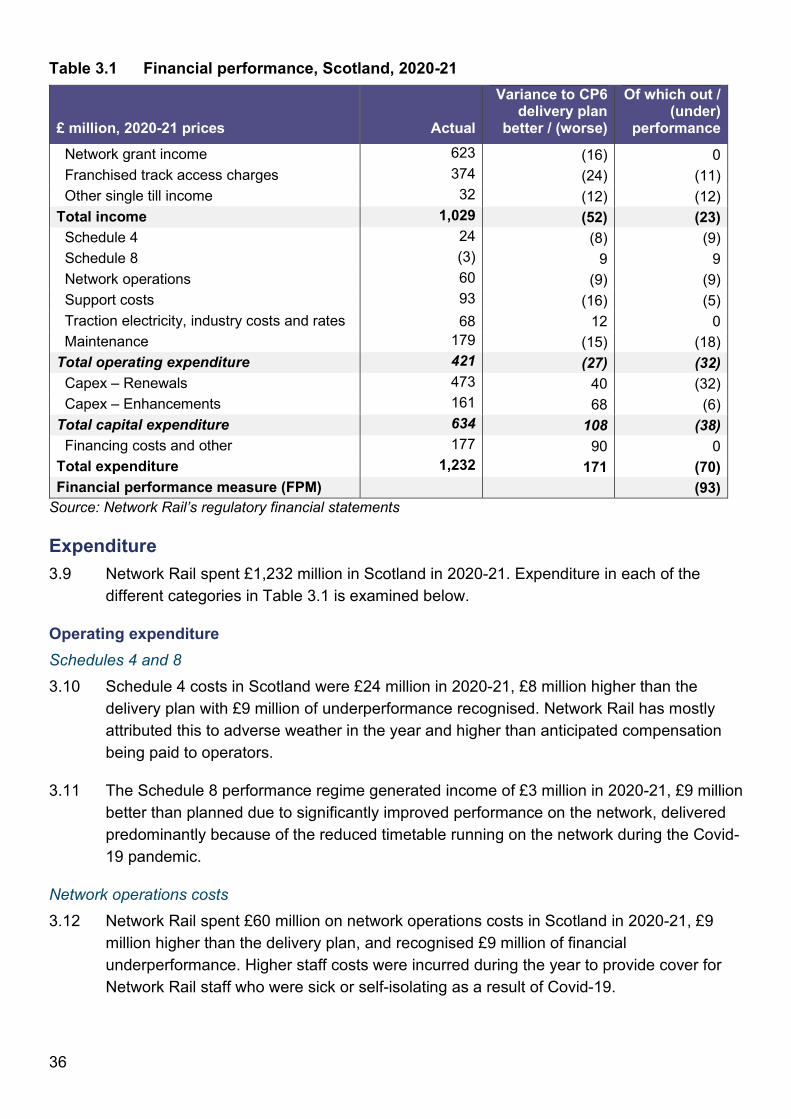
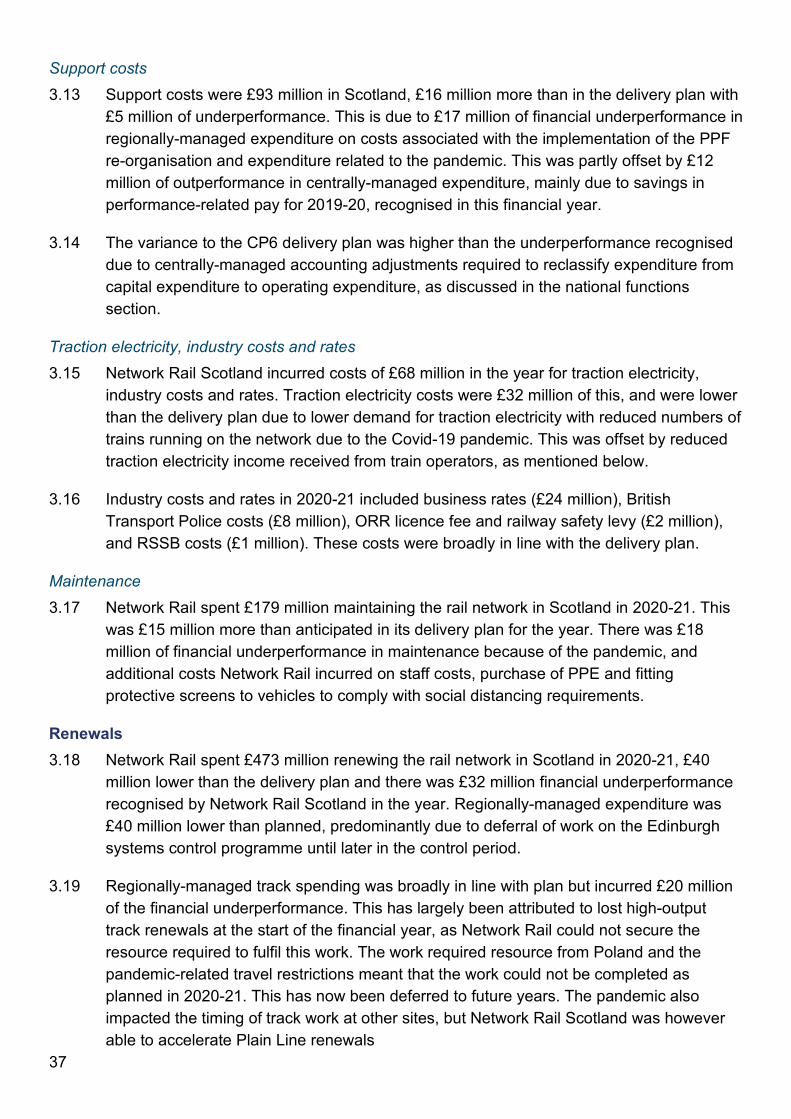
Financial performance 3.7 As shown in Table 3.1, Network Rail Scotland’s financially underperformed by £93 million
against its delivery plan for the year, with the most significant variances being underperformance in income, maintenance costs and renewals.
3.8 In 2019-20, Network Rail Scotland delivered FPM of zero, which means that cumulatively, over the first two years of CP6, the region has underperformed by £93 million against the CP6 delivery plan.
36
Table 3.1 Financial performance, Scotland, 2020-21
£ million, 2020-21 prices Actual
Variance to CP6 delivery plan
better / (worse)
Of which out / (under)
performance Network grant income 623 (16) 0 Franchised track access charges 374 (24) (11) Other single till income 32 (12) (12) Total income 1,029 (52) (23) Schedule 4 24 (8) (9) Schedule 8 (3) 9 9 Network operations 60 (9) (9) Support costs 93 (16) (5) Traction electricity, industry costs and rates 68 12 0 Maintenance 179 (15) (18) Total operating expenditure 421 (27) (32) Capex – Renewals 473 40 (32) Capex – Enhancements 161 68 (6) Total capital expenditure 634 108 (38) Financing costs and other 177 90 0 Total expenditure 1,232 171 (70) Financial performance measure (FPM) (93)
Source: Network Rail’s regulatory financial statements
Expenditure 3.9 Network Rail spent £1,232 million in Scotland in 2020-21. Expenditure in each of the
different categories in Table 3.1 is examined below.
Operating expenditure Schedules 4 and 8 3.10 Schedule 4 costs in Scotland were £24 million in 2020-21, £8 million higher than the
delivery plan with £9 million of underperformance recognised. Network Rail has mostly attributed this to adverse weather in the year and higher than anticipated compensation being paid to operators.
3.11 The Schedule 8 performance regime generated income of £3 million in 2020-21, £9 million better than planned due to significantly improved performance on the network, delivered predominantly because of the reduced timetable running on the network during the Covid-19 pandemic.
Network operations costs 3.12 Network Rail spent £60 million on network operations costs in Scotland in 2020-21, £9
million higher than the delivery plan, and recognised £9 million of financial underperformance. Higher staff costs were incurred during the year to provide cover for Network Rail staff who were sick or self-isolating as a result of Covid-19.
37
Support costs 3.13 Support costs were £93 million in Scotland, £16 million more than in the delivery plan with
£5 million of underperformance. This is due to £17 million of financial underperformance in regionally-managed expenditure on costs associated with the implementation of the PPF re-organisation and expenditure related to the pandemic. This was partly offset by £12 million of outperformance in centrally-managed expenditure, mainly due to savings in performance-related pay for 2019-20, recognised in this financial year.
3.14 The variance to the CP6 delivery plan was higher than the underperformance recognised due to centrally-managed accounting adjustments required to reclassify expenditure from capital expenditure to operating expenditure, as discussed in the national functions section.
Traction electricity, industry costs and rates 3.15 Network Rail Scotland incurred costs of £68 million in the year for traction electricity,
industry costs and rates. Traction electricity costs were £32 million of this, and were lower than the delivery plan due to lower demand for traction electricity with reduced numbers of trains running on the network due to the Covid-19 pandemic. This was offset by reduced traction electricity income received from train operators, as mentioned below.
3.16 Industry costs and rates in 2020-21 included business rates (£24 million), British Transport Police costs (£8 million), ORR licence fee and railway safety levy (£2 million), and RSSB costs (£1 million). These costs were broadly in line with the delivery plan.
Maintenance 3.17 Network Rail spent £179 million maintaining the rail network in Scotland in 2020-21. This
was £15 million more than anticipated in its delivery plan for the year. There was £18 million of financial underperformance in maintenance because of the pandemic, and additional costs Network Rail incurred on staff costs, purchase of PPE and fitting protective screens to vehicles to comply with social distancing requirements.
Renewals 3.18 Network Rail spent £473 million renewing the rail network in Scotland in 2020-21, £40
million lower than the delivery plan and there was £32 million financial underperformance recognised by Network Rail Scotland in the year. Regionally-managed expenditure was £40 million lower than planned, predominantly due to deferral of work on the Edinburgh systems control programme until later in the control period.
3.19 Regionally-managed track spending was broadly in line with plan but incurred £20 million of the financial underperformance. This has largely been attributed to lost high-output track renewals at the start of the financial year, as Network Rail could not secure the resource required to fulfil this work. The work required resource from Poland and the pandemic-related travel restrictions meant that the work could not be completed as planned in 2020-21. This has now been deferred to future years. The pandemic also impacted the timing of track work at other sites, but Network Rail Scotland was however able to accelerate Plain Line renewals

38
Enhancements 3.20 Network Rail Scotland spent £161 million on enhancement projects in the year, £68
million lower than its delivery plan and recognising a £6 million underperformance. The lower than planned spend was due to deferrals of some programmes.
3.21 The most significant underperformance in the year was in the Edinburgh to Glasgow Improvement Programme, where the completion of works was delayed by the lockdown in Scotland due to Covid-19, with some additional platform and staircase works adding increased costs.
Allocation of centrally-managed costs to Scotland 3.22 Costs incurred by Network Rail’s national functions (‘centrally-managed costs’) are re-
charged to regions in proportion to their use of these functions and in accordance with the ORR’s regulatory accounting guidelines. These costs are included in the expenditure and income lines shown in Table 3.1. £355 million was recharged to Scotland which is lower than the delivery plan assumption of £467 million. Centrally-managed costs were lower than planned in the year due to lower than anticipated financing costs being incurred and reductions in planned performance-related pay for national functions staff for the 2019-20 financial year, recognised in 2020-21.
Income 3.23 Network Rail received £1,029 million of income in Scotland in 2020-21. The majority of
this was from Scottish government network grants (£623 million). Network Rail Scotland also received £374 million from track and other access charges and £32 million from other single till income.
3.24 Regionally-managed income was particularly impacted by the pandemic, with variable usage charges £10 million lower than planned due to fewer passenger trains running, and property rental income £11 million lower than planned following Network Rail’s provision of rent payment breaks to support its tenants. Both of these contributed to the financial underperformance in the region.
3.25 Centrally-managed income was lower in the year due to reduced traction electricity charges, although this is offset in lower traction electricity costs.
Risk funding 3.26 As discussed in Chapter 2, the level of risk funding in the Scotland region is a particular
concern as its recent RF11 financial forecast had £57 million of risk funding but had identified over £100 million of reasonably foreseeable financial risks across the rest of CP6. Its funding arrangement with Transport Scotland means that the Scotland region cannot make use of the pooled risk funds available to the England and Wales regions. We recognise that there is a high level of uncertainty around identifying future financial risks. However, difficult decisions may need to be taken if additional financial risks do emerge in Scotland. This also emphasises the need for Scotland to deliver its £360 million of CP6 efficiency improvements.

39
3.27 Network Rail Scotland should set out the ways in which financial risk will be managed over the remainder of CP6, and provide funders and stakeholders with the necessary understanding of the trade-offs and the short and longer term implications (for example, into CP7) of the potential decisions on safety, asset sustainability, performance, income and expenditure. For example, it could clearly set out the process for switching on or off projects.
Grant funding in Scotland 3.28 Oversight of the flexibility of grant payments within Scotland falls within the remit of
Transport Scotland. Network Rail Scotland was permitted to carry forward £94 million of underspend from 2020-21 to later years in the control period. Included in this figure is £18 million of underspend which exceeded the HM Treasury 10 percent permitted carry forward, but which the Scottish Government agreed to carry forward to 2021-22 on the basis it would be required in that year. A further £10 million underspend of enhancement grant funding that arose after the carry forward cut off was not able to be carried forward and will not be able to be used.
Leading indicators of efficient delivery 3.29 This section provides an update on Network Rail Scotland’s preparations to deliver
efficiently in 2021-22. More detail is provided in Chapter 2 on the leading indicators that we use. Note that the ‘National’ column in the figures below refers to a national average, not Network Rail’s national functions.
3.30 Scotland has missed its target on some of its indicators at the end of the year, in particular financial authorisations, but generally is tracking fairly close to target, with financial authorisations having improved after the yearend. The exception to this is its efficiency planning, as discussed below.
Renewals planning 3.31 As explained in Chapter 2, effective renewals planning is important because it improves
the robustness of the rail network and helps to provide a stable profile of work for Network Rail’s supply chain. At the start of 2021-22, 56 percent of renewals projects for 2021-22 (by value) had completed detailed designs and had received financial authorisation for delivery. This was below the internal target of 77 percent and below the 75 percent national average. Network Rail Scotland is behind target in the authorisations of all asset types. A large portion of the outstanding authorisations related to the Carstairs renewal project, which is of particularly high value, but was approved at the start of 2021-22 which improved this position to 69 percent overall.
3.32 Based exclusively on this key indicator we would be concerned at the progress made by Network Rail Scotland as we would expect authorisation of projects to be closer to 100 percent going into the new financial year. However, financial authorisation only provides a partial picture of renewals workbank planning. Remits issued and accepted by the supply chain shows progress made at an earlier stage of the planning lifecycle. Network Rail

40
Scotland has issued, and its supply chain accepted, 98 percent of planned renewals in 2021-22, providing more confidence in its readiness to deliver renewals.
Figure 3.3 Percentage (by value) of 2021-22 renewals projects with financial authorisation
Source: Network Rail
Securing engineering access to the railway 3.33 Network Rail Scotland has slightly missed its internal target for booking disruptive access
for planned engineering work in 2021-22, with 96 percent booked against a target of 100 percent. Whilst Network Rail Scotland was outperforming against this metric during the year, recent decisions to cancel or rearrange year 3 work to keep the railway open for leisure travel have been disruptive.
Figure 3.4 Percentage booked of network access required in 2021-22
Source: Network Rail
Maintenance capacity 3.34 Network Rail Scotland is currently operating with a maintenance staffing level of 101
percent of its overall headcount requirement. The region fell short of its 107 percent target, reflecting a recent reduction in planned headcount as part of cost-controlling measures.

41
Figure 3.5 Maintenance headcount compared to 2021-22 requirement
Source: Network Rail
Efficiency planning 3.35 Network Rail Scotland considers that only 33 percent of its 2021-22 target efficiency will
be achieved from projects that have already been delivered or have clear project plans. The remaining 67 percent of 2021-22 target efficiencies have no clear project plans or have plans in place but low confidence in delivery.
3.36 This contrasts starkly with the same time last year when this metric was at nearly 60 percent and is the worst position across Network Rail’s regions. Part of this shortfall relates to the additional stretch target for 2021-22, discussed above, but it reaffirms our concern with Network Rail Scotland’s ability to deliver on its efficiency target in the later years of CP6. In response to this concern we have stepped up our monitoring of Network Rail Scotland and are requiring more frequent reporting on how the region is implementing improvements.
Table 3.2 Network Rail’s assessment of the maturity of its 2021-22 efficiency plans (by value)
Eastern NWC Scotland Southern W&W Regional Total
Project delivered, waiting for benefits to be realised 32% 47% 15% 1% 9% 22%
Project in place with delivery plan and milestones 48% 30% 18% 73% 63% 50%
Strategic theme applied, commitment to deliver but no plan in place
15% 17% 58% 18% 27% 22%
Unknown 5% 6% 9% 8% 1% 6%
100% 100% 100% 100% 100% 100% Source: Network Rail
3.37 During the year we conducted a review of a sample of Network Rail’s regions’ year 2 efficiency plans. The purpose of our review was to understand how the regions are planning and reporting on efficiencies, and the robustness of their assurance processes

42
for assessing business changes and calculations. The quality of the evidence received from four of the regions (Southern, Wales and Western, Eastern, and North West and Central) was generally robust and clear, and the quality of documentation has improved from reviews we have undertaken in previous years. However, across all of the regions, there was a lack of consistency in the quality of planning documentation for efficiency initiatives.
3.38 We struggled to get similar assurance from the evidence provided by the Scotland region, and we identified areas of concern with the region’s plans, which it has accepted and is working to address. We have been engaging with Network Rail Scotland more closely since our review, and the region has designed and is beginning to implement an efficiencies action plan to address the concerns we have raised.
3.39 Better planning for delivery of efficiencies will help Network Rail to deliver the increasing efficiency challenge over the remainder of CP6. Better documentation is important to evidence that efficiencies have been delivered and are likely to be delivered in future. Network Rail Scotland’s preparedness remains a concern, which we are monitoring closely.
3.40 Network Rail’s efficiency challenge increases through CP6, and the pandemic has had a significant impact on its business. In particular, we are aware that Network Rail Scotland is facing increased cost pressures on some asset types, and that some planning assumptions made at the start of CP6, including the level of efficiencies that national framework contracts would deliver, were too optimistic.
Southern Efficiency in 2020-21
Our PR18 determination concluded that the Southern region should improve its efficiency by 7.8 percent in 2020-2117. This means that we expected that Network Rail’s output in 2020-21 would cost 7.8 percent less than what it would have cost, on a like for like basis, in 2018-19.
The Southern region delivered £120.3 million of efficiency improvements in 2020-21, which is £7.4 million higher than the regions own target of £112.9 million. This forms part of Southern’s plans to deliver £918.1 million of efficiencies in CP6. Network Rail’s delivery plan trajectory for Southern is shown in Figure 3.6.
17 The PR18 final determination set targets for routes not regions. The regional number shown above is an aggregate of the target for the South East route (8.4 percent) and Wessex route (6.8 percent).

43
Actual and forecast efficiency, Southern, CP6
Source: ORR analysis of Network Rail data
The efficiencies delivered this year cover a wide range of activities. These are shown in Figure 3.7 and summarised below.
Main efficiency initiatives, Southern, 2020-21
Source: Network Rail
● Improved contracting strategies (£27.5 million): Southern are working with the supply chain to achieve lower costs through improved contracting. This includes the improved use of framework contracts and lower contract rates. For example, £3.5 million of efficiencies were generated in 2020-21 in track renewals through the Alliance contract.

44
● Earlier contractor involvement (£15.4 million): Early contractor involvement delivers efficiencies through Network Rail engaging with contractors at earlier stages in the delivery of work and identifying opportunities to make savings through reduced scope, using minimum specification solutions and value engineering.
● Impact of rail milling (£9.4 million): This a technique where a specially equipped train travels over a damaged piece of track, removing the damage and extending the life of the asset, which reduces costs.
● Other initiatives (£20.3 million): The largest single change within the ‘Other’ category is efficiencies generated from the reduction in performance-related pay for 2019-20, approved (and therefore recognised) in 2020-21. In total, this generated an efficiency of £12.0 million for Southern.
Financial performance As shown in Table 3.3, Southern financially underperformed by £87 million in 2020-21,
compared to the CP6 delivery plan. This is largely because of the impact of the pandemic on property income, maintenance and renewals underperformance, offset partly by higher than expected Schedule 8 income.
In 2019-20, the Southern region outperformed by £81 million, which means that cumulatively, over the first two years of CP6, the Southern region has underperformed by £6 million against the CP6 delivery plan.
Financial performance, Southern, 2020-21
£ million, 2020-21 prices Actual
Variance to CP6 delivery plan
better / (worse)
Of which out / (under)
performance Network grant income 1,370 (257) 0 Franchised track access charges 619 (61) (6) Other single till income 148 (78) (77) Total income 2,137 (396) (83) Schedule 4 86 (14) 2 Schedule 8 (149) 153 153 Network operations 186 (4) (4) Support costs 198 (1) 15 Traction electricity, industry costs and rates 258 25 1 Maintenance 445 (74) (78) Total operating expenditure 1,024 85 89 Capex – Renewals 972 (200) (83) Capex – Enhancements 193 66 (10) Total capital expenditure 1,165 (134) (93) Financing costs and other 400 223 0 Total expenditure 2,589 174 (4) Financial performance measure (FPM) (87)
Source: Network Rail’s regulatory financial statements

45
Expenditure Southern’s total costs were £2,589 million in 2020-21, £174 million lower than expected in
the region’s delivery plan for the year. Expenditure in each of the different categories in Table 3.3 is examined below.
Operating expenditure Schedules 4 and 8
Schedule 4 costs were £86 million, £14 million higher than the delivery plan, largely due to increased renewals work in the year. The region received £149 million of net income under the Schedule 8 regime in 2020-21 and £153 million of financial outperformance was recognised due to significantly improved performance on the network, delivered predominantly because of the reduced timetable running on the network during the Covid-19 pandemic.
Network operations Network operations expenditure was £186 million, £4 million higher than in the delivery
plan, and £4 million of financial underperformance was reported.
Support costs 3.49 Support costs were £198 million, in line with the delivery plan. This was because £15
million of financial outperformance was offset by centrally-managed accounting adjustments required to reclassify expenditure from capital expenditure to operating expenditure, as discussed in the national functions section (these adjustments are FPM neutral).
Traction electricity, industry costs and rates Traction electricity, industry costs and rates costs were £258 million including traction
electricity (£148 million), business rates (£75 million) and British Transport Police costs (£25 million). Overall expenditure was £25 million lower than the delivery plan largely because of lower than expected traction electricity costs.
Maintenance Maintenance costs were £445 million in 2020-21, £74 million more than the delivery plan
and £78 million of financial underperformance was reported, of which £12 million was attributed to track maintenance expenditure. Network Rail have attributed financial underperformance to the impact of the Covid-19 pandemic which increased costs such as the cost of PPE, additional staff costs due to staff absence, and additional schemes to help maintain asset resilience.
Renewals Renewals costs were £972 million, £200 million higher than the delivery plan and £83
million of financial underperformance was recognised. Financial underperformance was largely driven by earthworks (£42 million) and track (£21 million). Earthworks underperformance was partly caused by landslips brought on by poor weather leading to additional reactive works, as well as higher contractor costs. Track underperformance was

46
partly caused by bringing work forward in the control period, but also due to higher costs brought on by the impact of the pandemic, for example, the cost of PPE and social distancing measures, and increases in the cost of materials, for example, the higher cost of hardwood used for wheel timber renewals.
Enhancements Enhancements costs were £193 million, £66 million lower than the delivery plan, and £10
million of financial underperformance was recognised. The largest areas of expenditure were the Thameslink programme (£58 million) and the upgrade works at Gatwick Airport station (£51 million).
Income The region had a total of £2,137 million of income, which was £396 million lower than
expected. Network grant funding was £257 million lower than the delivery plan, reflecting the lower level of spend Southern incurred in the year. £83 million of financial underperformance was reported, largely because of lower than expected property rental income due to the impact of the pandemic on Network Rail’s tenants which resulted in Network Rail providing rent payment breaks to support its tenants.
Risk funding As discussed in Chapter 2, risk funds are lower than may be necessary to meet financial
risks in the future years of the control period in all regions, in part due to the Covid-19 pandemic. A number of potential risks still remain in the future and greater clarity is required on whether these are currently included in Network Rail’s analysis. We will continue to closely monitor and engage with Network Rail on this. Southern should set out the ways in which risk will be managed over the remainder of CP6, for example, it could clearly set out the process for switching on or off projects.
Leading indicators of efficient delivery This section discusses the Southern region’s preparedness for efficient delivery over the
rest of CP6. More detail is provided in Chapter 2 on the leading indicators that we use. Overall, Southern either exceeded or was very close to delivering its leading indicator targets, apart from for maintenance headcount, as discussed below.
Renewals planning As explained in Chapter 2, effective renewals planning is important because it improves
the robustness of the rail network and helps to provide a stable profile of work for Network Rail’s supply chain. Currently 89 percent of Southern’s 2021-22 projects (by value) have received financial authorisation for delivery, ahead of the region’s target of 79 percent.
Financial authorisation only provides a partial picture of renewals workbank planning while remits issued and accepted by the supply chain shows progress made at an earlier stage of the planning lifecycle. Southern has issued, and its supply chain accepted, 88 percent of planned renewals in 2021-22, which is slightly behind the national average of 91 percent.
47
Securing engineering access to the railway The Southern region has exceeded its own targets for securing engineering access and
has booked all of its expected year 3 access. This is a good achievement and will minimise the disruption to the network from renewals work.
Maintenance capacity Southern has a slight shortfall compared to its required maintenance headcount for 2021-
22. At the end of the year it had 93 percent capacity, which is below its target of 98 percent, reflecting a recent reduction in planned headcount as part of cost-controlling measures. However we note that Southern was behind its own target before the cost-controlling measures were implemented.
Efficiency planning Southern region considered that 74 percent (by value) of the region’s year 3 efficiencies
were either delivered, with the benefits imminent or with project plans in place. This is a good achievement, although it also means that circa 26 percent of Southern’s efficiencies had no detailed plans in place.
During the year we conducted a review of a sample of Southern’s year 2 efficiency plans. The purpose of our review was to understand how the region is planning and reporting on efficiencies, and the robustness of its assurance processes for assessing business changes and calculations. The quality of the evidence received from Southern was generally robust and clear, and the quality of documentation has improved from reviews we have undertaken in previous years, although across all of the regions, there was a lack of consistency in the quality of planning documentation for efficiency initiatives.
3.63 Better planning for delivery of efficiencies will help Network Rail to deliver the increasing efficiency challenge over the remainder of CP6. Better documentation is important to evidence that efficiencies have been delivered and are likely to be delivered in future. Although there are still some improvements which could be made, based on the evidence that we have reviewed, we consider that Southern appears to be sufficiently prepared to deliver the remainder of its CP6 target efficiencies.
3.64 Network Rail’s efficiency challenge increases through CP6, and the pandemic has had a significant impact on its business. In particular, we are aware that the regions are facing increased cost pressures on some asset types, and that some planning assumptions made at the start of CP6, including the level of efficiencies that national framework contracts would deliver, were too optimistic.

48
Wales and Western Efficiency in 2020-21 3.65 Our PR18 determination concluded that Network Rail should improve its efficiency by 7.9
percent in 2020-2118 in the Wales and Western region. This means that to deliver the same level of output, we expected Network Rail’s costs in Wales and Western in 2020-21 to be 7.9 percent lower than in 2018-19, the final year of CP5.
3.66 The Wales and Western region exceeded its delivery plan target of £66.0 million for the year and delivered £76.6 million of efficiency improvements. This forms part of Network Rail’s plans to deliver £533.6 million of efficiency in Wales and Western in CP6. Network Rail’s delivery plan trajectory for Wales and Western is shown in Figure 3.8.
Figure 3.8 Actual and forecast efficiency, Wales and Western, CP6
Source: ORR analysis of Network Rail data
3.67 Figure 3.9 shows the main initiatives that have contributed to Wales and Western’s efficiency improvement in 2020-21. The most significant initiatives were:
● Improved contracting strategies (£17.2 million): The largest efficiency initiative in 2020-21 was from improved contracting strategies in year 2 which made up £17.2 million of total year 2 efficiencies. This came through establishing nominated suppliers, which allowed for early engagement and removed the need for an initial tender process for each project. The region awarded multiple projects to one contractor, removing duplication at various stages, leading to a reduction in overhead costs.
● Optimisation of access (£7.3 million): Wales and Western delivered £7.3 million of efficiency from optimisation of access. This encompasses a number of initiatives to
18 The PR18 final determination set targets for routes not regions. The regional number shown above is an aggregate of the target for the Wales route (7.7 percent) and Western route (8.1 percent).

49
make disruptive track access possessions more efficient. These included using extended possessions to reduce repetition of setup and hand back activities on multiple possessions, and co-ordinating disruptive access requirements across different asset types to minimise the need for additional possessions on the same areas of track.
● Other (£18.8 million): The largest single change within the ‘Other’ category is efficiencies generated from the reduction in performance-related pay for 2019-20, approved (and therefore recognised) in 2020-21. In total, this generated an efficiency of £10.4 million for Wales and Western.
Figure 3.9 Main efficiency initiatives, Wales and Western, 2020-21
Source: ORR analysis of Network Rail data
Financial Performance 3.68 As shown in Table 3.4, Wales and Western financially underperformed by £37 million
compared to its delivery plan, largely due to underperformance of renewals, maintenance and operations costs. This was offset by significant outperformance of Schedule 8 income.
3.69 In 2019-20, the Wales and Western region underperformed by £43 million, which means that cumulatively, over the first two years of CP6, the region has underperformed by £80 million against the CP6 delivery plan.

50
Table 3.4 Financial performance, Wales and Western, 2020-21
£ million, 2020-21 prices Actual
Variance to CP6 delivery
plan better / (worse)
Of which out / (under)
performance Network grant income 914 (14) 0 Franchised track access charges 450 (36) (8) Other single till income 70 (14) (14) Total income 1,434 (64) (22) Schedule 4 31 5 (1) Schedule 8 (46) 52 52 Network operations 92 (10) (10) Support costs 149 (9) 9 Traction electricity, industry costs and rates 86 11 1 Maintenance 275 (19) (20) Total operating expenditure 587 30 31 Capex – Renewals 555 (18) (39) Capex – Enhancements 225 125 (7) Total capital expenditure 780 107 (46) Financing costs and other 330 182 0 Total expenditure 1,697 319 (15) Financial performance measure (FPM) (37)
Source: Network Rail’s regulatory financial statements
Expenditure 3.70 Network Rail spent £1,697 million in Wales and Western in 2020-21. Network Rail’s
expenditure in these categories is examined below.
Operating expenditure Schedules 4 and 8 3.71 Schedule 4 costs in Wales and Western were £31 million in 2020-21, £5 million lower than
the delivery plan with £1 million of financial underperformance recognised. Costs were lower than the delivery plan due to fewer incidences of disruption caused by adverse weather conditions. Reduced train services also contributed to reduced Schedule 4 costs.
3.72 Schedule 8 costs outperformed by £52 million compared to the CP6 delivery plan because of better train performance, as a result of fewer passengers and services due to the impact of the pandemic.
Network operations costs 3.73 Network operations costs were £92 million in 2020-21, £10 million higher than the delivery
plan, and £10 million of financial underperformance was recognised. This overspend was largely due to Covid-19 related expenditure. This included additional staff costs and increased costs at managed stations to adhere to government restrictions.
51
Support costs 3.74 Support costs were £149 million, £9 million higher than the CP6 delivery plan, mainly due
to costs associated with the implementation of the PPF re-organisation and Covid-19 related expenditure. This was partially offset by savings in performance-related pay for 2019-20, recognised in this financial year (this is financial outperformance). Overspend against the delivery plan was reported, despite the financial outperformance, due to centrally-managed accounting adjustments required to reclassify expenditure from capital expenditure to operating expenditure, as discussed in the national functions section (these adjustments are FPM neutral).
Traction electricity, industry costs and rates 3.75 Total traction electricity, industry costs and rates were £86 million. Traction electricity
costs were £39 million in Wales and Western. Traction electricity costs in the year were £14 million lower than the CP6 delivery plan due to lower demand for traction electricity with reduced numbers of trains running on the network due to the Covid-19 pandemic. This was offset by reduced traction electricity income received from train operators, as mentioned below.
3.76 Industry costs and rates in 2020-21 included business rates (£29 million), British Transport Police costs (£10 million), ORR licence fee and railway safety levy (£5 million), and RSSB costs (£2 million).
Maintenance 3.77 Network Rail spent £275 million maintaining the rail network in Wales and Western in
2020-21. The additional spend and underperformance was mainly because of the Covid-19 pandemic and additional costs Network Rail incurred on staff costs, purchase of PPE and fitting protective screens to vehicles to comply with social distancing requirements.
Renewals 3.78 £555 million was spent on renewing the rail network in Wales and Western in 2020-21.
Expenditure on renewals was £18 million higher than the delivery plan, with financial underperformance of £39 million for the work delivered. This extra spend is due to the acceleration of future works and catch up from slippage from the previous year. The financial underperformance relates to the delivery of track and signalling renewals.
Enhancements 3.79 Wales and Western spent £225 million on enhancements, £125 million lower than the
CP6 delivery plan. This is largely due to deferrals of enhancements to later in the control period. For more information, see the enhancements section of Chapter 2. There was financial underperformance of £7 million.
Income 3.80 Network Rail received £1,434 million of income in Wales and Western in 2020-21. The
majority of its income was from government network grants (£914 million), £450 million came from track and other access charges and £70 million from other single till income.

52
3.81 Overall, income was lower than the CP6 delivery plan, predominantly due to lower than expected traction electricity income and property income.
Risk funding As discussed in Chapter 2, risk funds are lower than may be necessary to meet financial
risks in the future years of the control period in all regions, in part due to the pandemic. A number of potential risks still remain in the future and greater clarity is required on whether these are currently included in Network Rail’s analysis. We will continue to closely monitor and engage with Network Rail on this. Wales and Western should set out the ways in which risk will be managed over the remainder of CP6, for example, it could clearly set out the process for switching on or off projects.
Core Valley Lines 3.83 Part of the rail network in Wales (the Core Valley Lines, CVL) was transferred to the
Welsh Government in March 2020. As explained in Chapter 2, this changed Network Rail’s financial settlement for the remainder of CP6 as it will not need as much funding for Wales.
Leading indicators of efficient delivery 3.84 This section provides an update on Wales and Western’s preparations to deliver efficiently
in 2021-22. More detail is provided in Chapter 2 on the leading indicators that we use. Overall Wales and Western has outperformed on all of its leading indicators, except for financial authorisations where it had a challenging target. See below for further detail.
Renewals planning 3.85 As explained in Chapter 2, effective renewals planning is important because it improves
the robustness of the rail network and helps to provide a stable profile of work for Network Rail’s supply chain. Wales and Western region did not meet its target on renewals planning.
3.86 Figure 3.3 above shows the percentage of renewals projects which have financial authorisation. For Wales and Western, 72 percent of renewals projects for 2021-22 (by value) had completed detailed designs and had received financial authorisation for delivery. This was slightly below the 75 percent national average and fell short of its internal target by 19 percentage points. This is because of delays in authorisation of track work, which consists of 44 percent of the Wales and Western’s renewals work bank.
3.87 This level of financial authorisation is concerning. However, financial authorisation only provides a partial picture of renewals workbank planning. We can also consider earlier stages of the planning lifecycle, such as remits issued and accepted by the supply chain. Under this measure, Wales and Western has issued, and its supply chain accepted, 96 percent of planned renewals in 2021-22, providing more confidence in its readiness to deliver renewals.

53
Securing engineering access to the railway 3.88 Wales and Western has achieved its internal target for booking disruptive access for
planned engineering work in 2021-22, with 87 percent booked against a target of 78 percent.
Maintenance capacity 3.89 The region has met its internal target of 100 percent for the maintenance staffing level.
Efficiency planning 3.90 Wales and Western has reported that 72 percent of its 2021-22 target efficiency will be
achieved from projects that have already been delivered or have clear project plans. The remaining 28 percent of 2021-22 target efficiencies have no clear project plans or have plans in place but low confidence in delivery. This is a significant improvement on the same time last year, when this metric was at 47 percent, despite the additional stretch target the region has been set, highlighting the region’s confidence in continuing to outperform our efficiency challenge in CP6.
3.91 During the year we conducted a review of a sample of Wales and Western’s year 2 efficiency plans. The purpose of our review was to understand how the region is planning and reporting on efficiencies, and the robustness of its assurance processes for assessing business changes and calculations. The quality of the evidence received for Wales and Western was generally robust and clear, and the quality of documentation has improved from reviews we have undertaken in previous years, although across all of the regions, there was a lack of consistency in the quality of planning documentation for efficiency initiatives.
3.92 Better planning for delivery of efficiencies will help Network Rail to deliver the increasing efficiency challenge over the remainder of CP6. Better documentation is important to evidence that efficiencies have been delivered and are likely to be delivered in future. Although there are still some improvements which could be made, based on the evidence that we have reviewed, we consider that Wales and Western appears to be sufficiently prepared to deliver the remainder of its CP6 target efficiencies.
3.93 Network Rail’s efficiency challenge increases through CP6, and the pandemic has had a significant impact on its business. In particular, we are aware that the regions are facing increased cost pressures on some asset types, and that some planning assumptions made at the start of CP6, including the level of efficiencies that national framework contracts would deliver, were too optimistic.

54
Eastern Efficiency in 2020-21 3.94 Our PR18 determination concluded that the Eastern region should improve its efficiency
by 8.6 percent in 2020-2119. This means that we expected that Network Rail’s output in 2020-21 would cost 8.6 percent less than it would have cost, on a like for like basis, in 2018-19.
3.95 The Eastern region delivered £183.8 million of efficiency improvements in 2020-21, which is £30.4 million higher than the region’s own target of £153.4 million. This forms part of Eastern’s plans to deliver £1,018.3 million of efficiencies in CP6. Network Rail’s delivery plan trajectory for Eastern is shown in Figure 3.10.
Actual and forecast efficiency, Eastern, CP6
Source: ORR analysis of Network Rail data
The efficiencies delivered this year cover a wide range of activities. These are shown in Figure 3.11 and summarised below.
19 The PR18 final determination set targets for routes not regions. The regional number shown above is an aggregate of the target for the Anglia route (11.9 percent) and LNEEM route (7.1 percent).

55
Main efficiency initiatives, Eastern, 2020-21
Source: ORR analysis of Network Rail data
● Improved contracting strategies (£44.9 million): Eastern are working with the supply chain to achieve lower costs through improved contracting. This includes the improved use of framework contracts and lower contract rates such as in signalling where £32 million of efficiencies were achieved in the year.
● Reduced activities due to other technologies (£31.6 million): The introduction of new technologies can reduce the level of renewals required to maintain the condition of assets. This efficiency category includes various projects that have enabled reduced scope of work whilst maintaining asset condition. These include using new technologies designed to improve automation, accuracy, performance and decision-making.
● Workbank planning (£17.9 million): This is about ensuring that works which have been planned can be completed without unexpected disruption. This includes providing the supply chain with predictable work banks to improve resource planning, leading to improved unit rates.
● Other (£26.7 million): The largest single change within the ‘Other’ category is efficiencies generated from the reduction in performance-related pay for 2019-20, approved (and therefore recognised) in 2020-21. In total, this generated an efficiency of £10.4 million for Eastern.
Financial performance As shown in Table 3.5, Eastern financially underperformed by £167 million in 2020-21,
compared to the CP6 delivery plan. This is largely because of the impact of the pandemic

56
on income, maintenance and renewals underperformance, offset partly by higher than expected Schedule 8 income.
In 2019-20, the Eastern region underperformed by £27 million, which means that cumulatively, over the first two years of CP6, the Eastern region has underperformed by £194 million against the CP6 delivery plan.
Financial performance, Eastern, 2020-21
£ million, 2020-21 prices Actual
Variance to CP6 delivery
plan better / (worse)
Of which out / (under)
performance
Network grant income 2,210 257 0 Franchised track access charges 527 (93) (47) Other single till income 138 (30) (31) Total income 2,875 134 (78) Schedule 4 108 23 (17) Schedule 8 (71) 100 100 Network operations 227 (29) (29) Support costs 258 (17) 19 Traction electricity, industry costs and rates 260 34 (1) Maintenance 566 (55) (50) Total operating expenditure 1,348 56 22 Capex – Renewals 1,115 (50) (118) Capex – Enhancements 764 430 6 Total capital expenditure 1,879 380 (112) Financing costs and other 469 226 0 Total expenditure 3,696 662 (89) Financial performance measure (FPM) (167)
Source: Network Rail’s regulatory financial statements
Expenditure Eastern’s total costs were £3,696 million in 2020-21, £662 million lower than expected in
the region’s delivery plan for the year largely due to lower enhancements expenditure. Expenditure in each of the different categories in Table 3.5 is examined below.
Operating expenditure Schedules 4 and 8
Schedule 4 costs were £108 million, £23 million lower than the delivery plan and £17 million of financial underperformance was reported. The region received £71 million of net income under Schedule 8 in 2020-21 and £100 million of financial outperformance was recognised. This is largely due to there being fewer trains running on the rail network due to the Covid-19 pandemic.
Network operations costs Network operations expenditure was £227 million, £29 million higher the delivery plan and
£29 million of financial underperformance was reported. Financial underperformance was
57
largely caused by the effects of the pandemic, including, for example, additional staff costs to cover absences. The region also invested in performance improvement schemes in the year.
Support costs Support costs were £258 million, £17 million higher than the delivery plan and £19 million
of financial outperformance was reported. Expenditure was higher than expected due to an accounting adjustment which for financial performance purposes is treated as neutral (for more detail see the national functions section below). Financial outperformance was largely due to reductions in performance-related pay.
Traction electricity, industry costs and rates Traction electricity, industry costs and rates costs were £260 million including traction
electricity (£126 million), business rates (£95 million) and British Transport Police costs (£27 million). Overall expenditure was £34 million lower than the delivery plan largely because of lower than expected traction electricity costs.
Maintenance Maintenance costs were £566 million, £55 million more than the delivery plan and £50
million of financial underperformance was reported. The underperformance largely related to increased costs relating to the impact of the pandemic, for example, the additional cost of PPE and fitting vehicles with shields to allow social distancing. There was also additional expenditure on asset resilience and train performance.
Renewals Renewals costs were £1,115 million, £50 million higher than the delivery plan and £118
million of financial underperformance was recognised. Financial underperformance was largely driven by underperformance on track (£74 million), which was caused by issues relating to the impact of the pandemic, changes to the scope of projects, access issues, as well as materials cost increases.
Enhancements Enhancements costs were £764 million, £430 million lower than the delivery plan and £6
million of financial outperformance was recognised. The lower than expected expenditure was due to reduced spending on the Trans Pennine Route Upgrade where expenditure was £483 million lower than expected in the CP6 delivery plan. The largest areas of spend in the year were on the Trans Pennine Route Upgrade (£266 million) and on the East Coast Main Line enhancements programme (£189 million) which are discussed in more detail in Chapter 2.
Income The region had a total of £2,875 million of income, on which £78 million of financial
underperformance was reported. This was largely caused by the impact of the pandemic on the number of train services, which reduced track access charge income, and on property rental income, as Network Rail provided rent payment breaks to support its

58
tenants. The higher level of network grant funding (£257 million more than in the delivery plan) reflects the higher level of spend Network Rail incurred in the year.
Risk funding As discussed in Chapter 2, risk funds are lower than may be necessary to meet financial
risks in the future years of the control period in all regions, in part due to the pandemic. A number of potential risks still remain in the future and greater clarity is required on whether these are currently included in Network Rail’s analysis. We will continue to closely monitor and engage with Network Rail on this. Eastern should set out the ways in which risk will be managed over the remainder of CP6, for example, it could clearly set out the process for switching on or off projects.
Leading indicators of efficient delivery This section discusses the Eastern region’s preparedness for efficient delivery over the
rest of CP6. More detail is provided in Chapter 2 on the leading indicators that we use. Overall, Eastern either exceeded or was very close to delivering on all its leading indicator targets, as discussed below.
Renewals planning As explained in Chapter 2, effective renewals planning is important because it improves
the robustness of the rail network and helps to provide a stable profile of work for Network Rail’s supply chain. Currently 76 percent of Eastern’s 2021-22 projects (by value) have received financial authorisation for delivery, slightly below the region’s target of 78 percent.
Financial authorisation only provides a partial picture of renewals workbank planning while remits issued and accepted by the supply chain shows progress made at an earlier stage of the planning lifecycle. Eastern has issued, and its supply chain accepted, 97 percent of planned renewals in 2021-22, which is ahead of the national average of 91 percent.
Securing engineering access to the railway The Eastern region has exceeded its own targets for securing engineering access and
has booked 89 percent of its expected year 3 access, higher than the region’s target of 60 percent. This is a good achievement and will minimise the disruption to the network from renewals work.
Maintenance capacity Eastern has met its target for recruiting the required maintenance headcount and at the
end of the year was at 96 percent capacity, which is in line with its own target.
Efficiency planning Eastern at the end of the year considered that 80 percent (by value) of the region’s year 3
efficiencies were either delivered, with the benefits imminent or with project plans in place. This is the highest confidence rating across all the regions. This does mean, however, that

59
at the end of the year circa 20 percent of Eastern’s efficiencies had no detailed plans in place.
During the year we conducted a review of a sample of Eastern’s year 2 efficiency plans. The purpose of our review was to understand how the region is planning and reporting on efficiencies, and the robustness of its assurance processes for assessing business changes and calculations. The quality of the evidence received from Eastern was generally robust and clear, and the quality of documentation has improved from reviews we have undertaken in previous years, although across all of the regions, there was a lack of consistency in the quality of planning documentation for efficiency initiatives.
Better planning for delivery of efficiencies will help Network Rail to deliver the increasing efficiency challenge over the remainder of CP6. Better documentation is important to evidence that efficiencies have been delivered and are likely to be delivered in future. Although there are still some improvements which could be made, based on the evidence that we have reviewed, we consider that Eastern appears to be sufficiently prepared to deliver the remainder of its CP6 target efficiencies.
Network Rail’s efficiency challenge increases through CP6, and the pandemic has had a significant impact on its business. In particular, we are aware that the regions are facing increased cost pressures on some asset types, and that some planning assumptions made at the start of CP6, including the level of efficiencies that national framework contracts would deliver, were too optimistic.
North West and Central Efficiency in 2020-21 3.118 Our PR18 determination concluded that Network Rail should improve its efficiency by 7.5
percent in 2020-21 on the London North Western (LNW) route, which is now the North West and Central region. This means that we expected that North West and Central’s output in 2020-21 would cost 7.5 percent less than what it would have cost, on a like for like basis, in 2018-19.
3.119 In 2020-21, North West and Central exceeded its delivery plan efficiency target, delivering £121.8 million of efficiencies against a target of £101.8 million. It is now forecasting to be ahead of target for achieving its CP6 efficiency improvements, reporting a forecast of £682.8 million against a target of £607.5 million. Network Rail’s delivery plan trajectory is shown in Figure 3.12.

60
Figure 3.12 Actual and forecast efficiency, North West and Central, CP6
Source: ORR analysis of Network Rail data
3.120 Figure 3.13 shows the main initiatives that have contributed to North West and Central’s efficiency improvement in 2020-21. The most significant initiatives were:
● Improved contracting strategies (£15.1 million): This grouping included various initiatives relating to procurement, for example, negotiating improved rates on contract extensions, using competitive tender processes to source cheaper rates for required works, and obtaining more competitive rates by using a wider range of contractors for non-railway specific spend (for example, for office space and car parks).
● Supply Chain Organisation initiatives (£13.6 million): Supply Chain Organisation initiatives delivered £13.6 million of efficiencies in 2020-21. These efficiencies were generated through centrally-negotiated contracts with more competitive pricing than anticipated, for example, relating to fleet usage.
● Other initiatives (£45.5 million): The largest single change within the ‘Other’ category is efficiencies generated from the reduction in performance-related pay for 2019-20, approved (and therefore recognised) in 2020-21. In the North West & Central region, this generated an efficiency of £9.2 million. The rest of this category in Figure 3.13 includes other, smaller efficiency groupings.

61
Figure 3.13 Main efficiency initiatives, North West and Central, 2020-21
Source: ORR analysis of Network Rail data
Financial performance 3.121 As shown in Table 3.6, North West and Central financially underperformed by £40 million
compared to its delivery plan, with significant underperformance reported in other single till income and significant outperformance in Schedule 8 income.
3.122 In 2019-20, the North West and Central region outperformed by £9 million, which means that cumulatively, over the first two years of CP6, the region has underperformed by £31 million against the CP6 delivery plan.

62
Table 3.6 Financial performance, North West and Central, 2020-21
£ million, 2020-21 prices Actual
Variance to CP6 delivery plan
better / (worse)
Of which out / (under)
performance Network grant income 1,524 200 0 Franchised track access charges 494 (49) (18) Other single till income 108 (93) (93) Total income 2,126 58 (111) Schedule 4 39 29 46 Schedule 8 (78) 81 81 Network operations 149 (5) (5) Support costs 258 (41) (19) Traction electricity, industry costs and rates 173 18 0 Maintenance 427 (9) 9 Total operating expenditure 968 73 112 Capex – Renewals 795 (86) (35) Capex – Enhancements 277 1 (6) Total capital expenditure 1,072 (85) (41) Financing costs and other 372 191 0 Total expenditure 2,412 179 71 Financial performance measure (FPM) (40)
Source: Network Rail’s regulatory financial statements
Expenditure 3.123 Network Rail spent £2,412 million in North West and Central in 2020-21. Expenditure in
each of the different categories in Table 3.6 is examined below.
Operating expenditure Schedules 4 and 8 3.124 Schedule 4 costs in North West and Central were £39 million in 2020-21, £29 million lower
than the delivery plan, with £46 million of outperformance. Schedule 4 costs outperformed due to easier access to the rail network since fewer trains were running during the year and there were fewer adverse weather events in the region than expected.
3.125 The Schedule 8 performance regime generated net income in North West and Central of £78 million in 2020-21, an £81 million improvement on the delivery plan and delivering equivalent outperformance. Train performance in the year was better than expected, predominantly because of the reduced timetable and fewer passengers on the network during the Covid-19 pandemic.
Network operations costs 3.126 Network Rail spent £149 million on network operations in North West and Central in 2020-
21. This was slightly higher (£5 million) than expected in the delivery plan, with equivalent underperformance, which it attributes to higher than anticipated staff costs incurred to improve resilience in the network during the Covid-19 pandemic.
63
Support costs 3.127 Support costs were £258 million. Network Rail spent £41 million more than its delivery
plan, mainly due to costs associated with the implementation of the PPF re-organisation and Covid-19 related expenditure. This was partially offset by savings in performance-related pay for 2019-20, recognised in this financial year. The region recognised financial underperformance of £19 million for the reasons outlined above.
3.128 The variance to the CP6 delivery plan was higher than the underperformance recognised due to centrally-managed accounting adjustments required to reclassify expenditure from capital expenditure to operating expenditure (these adjustments are FPM neutral), as discussed in the national functions section.
Traction electricity, industry costs and rates 3.129 The total costs for traction electricity, industry costs and rates were £173 million for North
West and Central in 2020-21. This includes traction electricity costs of £79 million, which was lower than Network Rail’s delivery plan, due to lower demand for traction electricity with reduced numbers of trains running on the network due to the Covid-19 pandemic. This was offset by reduced traction electricity income received from train operators, as mentioned below.
3.130 Industry costs and rates in 2020-21 included business rates (£67 million), British Transport Police costs (£19 million), ORR licence fee and railway safety levy (£2 million), and RSSB costs (£4 million).
Maintenance 3.131 Network Rail spent £427 million maintaining the rail network in 2020-21. The region
incurred higher than anticipated reactive maintenance costs in the year, as well as cost increases due to the pandemic, including for the purchase of PPE and increased vehicle hire to maintain social distancing. This has been offset by savings in some areas through lower inspection costs and successful settlement of commercial claims. FPM outperformance was recognised, as some cost increases, such as reactive maintenance, are neutral for FPM.
Renewals 3.132 Network Rail spent £795 million renewing the rail network in the North West and Central
region in 2020-21. It spent £86 million more than its own delivery plan, which relates to overspend in almost all regionally-managed asset classes, in part due to works brought forward from future years whilst the network was quieter during the Covid-19 pandemic.
3.133 Underperformance of £35 million has been recognised, a significant proportion of which (£16 million) was in track. Track renewals, in particular high-output work, suffered disruption and therefore increased costs during the Covid-19 pandemic, with further costs arising from the on-going requirements of social distancing and changes to the mix and complexity of work undertaken.

64
Enhancements 3.134 £277 million was spent on North West and Central region enhancements in the year, £1
million lower than planned. £6 million of underperformance was recognised in some of the region’s smaller enhancement initiatives. East West Rail Phase 2 was the largest project in the region, with a spend of £207 million. For more information on this enhancement, see Chapter 2.
Income 3.135 Network Rail received £2,126 million of income in the North West and Central region in
2020-21. The majority of its income was from network grant income (£1,524 million), with £494 million from franchised track access charges and £108 million from other single till income.
3.136 The higher level of grant funding reflects the higher level of spend Network Rail incurred in the year. Network Rail received £93 million less other single till income in the year, predominately because of lower property rental income following Network Rail’s provision of rent payment breaks to support its tenants. Corresponding financial underperformance in other single till income was delivered, for the same reasons.
Risk funding As discussed in Chapter 2, risk funds are lower than may be necessary to meet financial
risks in the future years of the control period in all regions, in part due to the pandemic. A number of potential risks still remain in the future and greater clarity is required on whether these are currently included in Network Rail’s analysis. We will continue to closely monitor and engage with Network Rail on this. North West and Central should set out the ways in which risk will be managed over the remainder of CP6, for example, it could clearly set out the process for switching on or off projects.
Leading indicators of efficient delivery 3.138 This section provides an update on North West and Central’s preparations to deliver
efficiently in 2021-22. More detail is provided in Chapter 2 on the leading indicators that we use. Overall, North West and Central either exceeded or was very close to delivering on all its leading indicator targets, as discussed below.
Renewals planning 3.139 As explained in Chapter 2, effective renewals planning is important because it improves
the robustness of the rail network and helps to provide a stable profile of work for Network Rail’s supply chain. North West and Central region did not meet its target on renewals planning. Currently 76 percent of renewals projects for 2021-22 by value have completed detailed designs and had received financial authorisation for delivery. This was below the internal target of 79 percent but above the 75 percent national average. This is higher than at the same point last year, so it is showing some improvement.
3.140 Financial authorisation only provides a partial picture of renewals workbank planning while remits issued and accepted by the supply chain shows progress made at an earlier stage

65
of the planning lifecycle. North West and Central has issued, and its supply chain accepted, only 79 percent of planned renewals in 2021-22. The region is working to resolve a system delay in processing updates to this metric, but given recent evidence of strong delivery despite lower reporting, this is not of significant concern, although it will be closely monitored.
Securing engineering access to the railway 3.141 North West and Central has achieved its internal target for booking disruptive access for
planned engineering work in 2021-22, with 109 percent booked against a target of 86 percent. It is possible for regions to exceed this target, which is based on planned hours, where access levels have varied during the year. We have no concerns on North West and Central’s performance against this metric.
Maintenance capacity 3.142 The region is currently operating with a maintenance staffing level of 97 percent of its
overall headcount requirement. Although this is below target, the difference is not likely to be made up during the year as the region has confirmed it is managing its workload well at this level.
Efficiency planning 3.143 North West and Central has reported that 77 percent of its 2021-22 target efficiency will
be achieved from projects that have already been delivered or have clear project plans. The remaining 23 percent of 2021-22 target efficiencies have no clear project plans or have plans in place but low confidence in delivery. This is a significant improvement on the same time last year when this metric was at 47 percent, highlighting the region’s confidence in continuing to outperform our efficiency challenge in CP6.
3.144 During the year we conducted a review of a sample of North West and Central’s year 2 efficiency plans. The purpose of our review was to understand how the region is planning and reporting on efficiencies, and the robustness of its assurance processes for assessing business changes and calculations. The quality of the evidence received from North West and Central was generally robust and clear, and the quality of documentation has improved from reviews we have undertaken in previous years, although across all of the regions, there was a lack of consistency in the quality of planning documentation for efficiency initiatives.
3.145 Better planning for delivery of efficiencies will help Network Rail to deliver the increasing efficiency challenge over the remainder of CP6. Better documentation is important to evidence that efficiencies have been delivered and are likely to be delivered in future. Although there are still some improvements which could be made, based on the evidence that we have reviewed, we consider that North West and Central appears to be sufficiently prepared to deliver the remainder of its CP6 target efficiencies.
3.146 Network Rail’s efficiency challenge increases through CP6, and the pandemic has had a significant impact on its business. In particular, we are aware that the regions are facing

66
increased cost pressures on some asset types, and that some planning assumptions made at the start of CP6, including the level of efficiencies that national framework contracts would deliver, were too optimistic.
National functions 3.147 This section covers the efficiency, financial performance, income and expenditure for
Network Rail’s national functions. These functions include corporate services, network services directorate, property, route services directorate, technical authority and system operator. The cost of these functions is usually referred to as centrally-managed expenditure and is allocated to regions in proportion to their use of each of these functions. Centrally-managed expenditure made up 34 percent of Network Rail’s total expenditure in 2020-21.
3.148 In response to the impact of Covid-19 and to seek opportunities for efficiencies and to optimise delivery of services, Network Rail announced further changes to its structure in January 2021 (after its PPF programme). These new changes, many of which were effective from 1 April 2021, include the consolidation or transfer of centrally-managed functions within Network Rail, such as Network Services and Technical Services.
Efficiency 3.149 Network Rail has plans to deliver £476.3 million of efficiency in its national functions in
CP6. Network Rail’s delivery plan trajectory is shown in Figure 3.14.
Figure 3.14 Actual and forecast efficiency, National functions, CP6
Source: ORR analysis of Network Rail data
3.150 National functions exceeded their delivery plan efficiency targets for the year, delivering £166.2 million of efficiencies against a target of £51.1 million. This exceptionally high level of efficiencies in the year was driven predominantly by two large one-off savings in the two largest efficiency groupings:

67
● Improved contracting strategies (£73.4 million): This includes efficiencies generated from identifying a new concrete sleeper supplier at competitive rates, avoiding the planned building of a concrete sleeper factory, and improvements from changes to IT delivery.
● Other (£64.2 million): The largest single change within the ‘Other’ category is efficiencies generated from the reduction in performance-related pay for 2019-20, approved (and therefore recognised) in 2020-21. In total, this generated an efficiency of £34.7 million for the national functions.
Figure 3.15 Main efficiency initiatives, National functions, 2020-21
Source: ORR analysis of Network Rail data
Financial Performance 3.151 The costs incurred by Network Rail’s national functions are allocated to each of the five
regions and included in the regional numbers discussed above. This section describes the performance of those functions separately, providing an analysis of the costs as a whole and how they are allocated to the regions.
3.152 As shown in Table 3.7, FPM showed £242 million of outperformance, mostly due to outperformance in support costs and Schedules 4 and 8, partly offset by underperformance in other single till income.

68
Table 3.7 Network Rail’s centrally-managed expenditure, 2020-21
£ million, 2020-21 prices Actual
Variance to CP6 delivery plan
better / (worse)
Of which out / (under)
performance
Network grant income 6,641 170 0 Franchised track access charges 523 (154) 0 Other single till income 44 (46) (46) Total centrally-managed income 7,208 (30) (46) Schedule 4 15 37 36 Schedule 8 (49) 59 59 Network operations 21 1 1 Support costs 587 59 162 Traction electricity, industry costs and rates 839 104 5 Maintenance 62 6 12 Total operating expenditure 1,475 266 275 Capex – Renewals 514 (44) 13 Capex – Enhancements 159 (159) 0 Total capital expenditure 673 (203) 13 Financing costs and other 1,748 912 0 Total centrally-managed expenditure 3,896 975 288 Financial Performance Measure (FPM) 242
Source: Network Rail’s regulatory financial statements
Expenditure 3.153 Network Rail spent £3,896 million on centrally-managed functions in 2020-21. Expenditure
in each of the different categories in Table 3.7 is examined below.
Operating expenditure Schedules 4 and 8 3.154 Centrally-managed Schedules 4 & 8 costs relate to centrally-held funding for one-off
incidents which occur in the year, to avoid such incidents distorting regional financial performance.
3.155 There was £15 million of Schedule 4 costs in 2020-21, £37 million better than the anticipated cost, generating £36 million of financial outperformance. Schedule 4 costs outperformed due to more efficient use of access during the year and fewer adverse weather events than expected.
3.156 The Schedule 8 performance regime generated income of £49 million in 2020-21, £59 million better than the delivery plan with £59 million of financial outperformance. Commercial claims settled in the year in Network Rail’s favour, as well as the lower impact from poor weather, contributed to the outperformance.
69
Network operations costs 3.157 Centrally-managed operations expenditure includes costs incurred by Network Rail’s
Network Services function. Network Rail spent £21 million on centrally-managed operations in 2020-21, £1 million better than anticipated with corresponding outperformance.
Support costs 3.158 The largest centrally-managed support costs are for Network Rail’s central IT and
business services function, with other costs including the System Operator, telecoms and route services costs.
3.159 Support costs of £587 million in the year were significantly (£59 million) lower than Network Rail’s delivery plan, generating £162 million of financial outperformance. The underspend in the year relates predominantly to savings in performance-related pay for 2019-20, recognised in 2020-21. Network Rail reported a lower expenditure variance (£59 million) than financial outperformance (£162 million), due to £103 million of accounting adjustments required to reclassify expenditure from capital expenditure to operating expenditure, to align the delivery plan with accounting standards (the reclassification does not affect FPM). These adjustments affect the variances in all the support and renewals sections of this document. Where material we have mentioned this.
Traction electricity, industry costs and rates 3.160 £839 million of traction electricity, industry costs and rates was managed centrally in
2020-21. This includes traction electricity costs of £424 million, £157 million lower than Network Rail’s delivery plan, which was offset within income by lower electricity income received from train operators.
3.161 Industry costs and rates in 2020-21 included business rates (£290 million), British Transport Police costs (£89 million), ORR licence fee and railway safety levy (£19 million), RSSB costs (£12 million), and other industry costs (£5 million)
Maintenance 3.162 Network Rail’s national functions spent £62 million maintaining the rail network in 2020-
21, £6 million lower than its delivery plan and generating a £12 million outperformance. The largest savings and outperformance were generated from the telecoms maintenance function, predominantly through recruitment savings delivered as a result of the PPF re-organisation programme and commercial claims outcomes in Network Rail’s favour.
Renewals 3.163 Network Rail spent £514 million of centrally-managed funding on renewing the rail
network in 2020-21. It spent £44 million more than its delivery plan and recognised £13 million of outperformance in FPM. The main underspend was in safety, technical and engineering renewals with the largest overspend in wheeled plant and machinery, both of which are treated as neutral for FPM. The outperformance recognised reflects the other side to the accounting adjustment described above in support costs.

70
Enhancements 3.164 The £159 million spent on centrally-managed enhancements in the year relates to
spending on Crossrail schemes and new digital signalling schemes, none of which were included in the regulatory baseline.
Income 3.165 Network Rail received £7,208 million of centrally-managed income in 2020-21. The
majority of this income was from network grant income (£6,641 million), with £523 million from franchised track access charges and £44 million from other single till income.
3.166 Centrally-managed income has various variances across grant funding and franchised track access charges which do not impact on FPM. The higher level of grant funding reflects the higher level of centrally-managed spend Network Rail incurred in the year. The Covid-19 pandemic also had an impact on income, with lower property rental income following Network Rail’s provision of rent payment breaks to support its tenants leading to £46 million of underspend and £46 million of underperformance.
Allocation of costs to regions 3.167 Costs incurred by the national functions are allocated to Network Rail’s five regions in
proportion to their use of these functions and in accordance with our regulatory accounting guidelines. Figure 3.16 shows these costs as a portion of the expenditure of each region.
Figure 3.16 Centrally-managed costs as a proportion of total costs, 2020-21
Source: ORR analysis of Network Rail’s regulatory financial statements
3.168 Figure 3.16 shows the proportion of centrally-managed costs in the year as a percentage of total expenditure by region, excluding finance costs as these are wholly centrally-managed and funded by the DfT. The proportion of total expenditure managed by national functions was similar across all regions, with centrally-managed expenditure remaining between 17 percent and 26 percent for all regions. This is broadly consistent with the prior
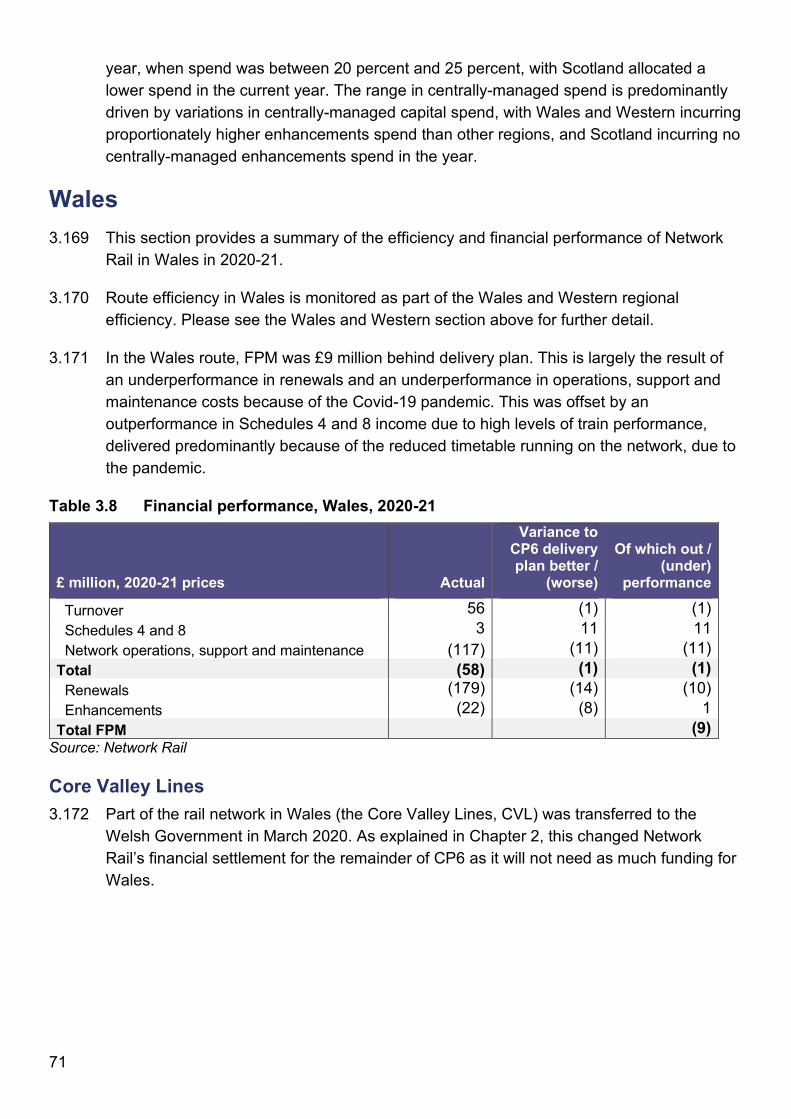
71
year, when spend was between 20 percent and 25 percent, with Scotland allocated a lower spend in the current year. The range in centrally-managed spend is predominantly driven by variations in centrally-managed capital spend, with Wales and Western incurring proportionately higher enhancements spend than other regions, and Scotland incurring no centrally-managed enhancements spend in the year.
Wales 3.169 This section provides a summary of the efficiency and financial performance of Network
Rail in Wales in 2020-21.
3.170 Route efficiency in Wales is monitored as part of the Wales and Western regional efficiency. Please see the Wales and Western section above for further detail.
3.171 In the Wales route, FPM was £9 million behind delivery plan. This is largely the result of an underperformance in renewals and an underperformance in operations, support and maintenance costs because of the Covid-19 pandemic. This was offset by an outperformance in Schedules 4 and 8 income due to high levels of train performance, delivered predominantly because of the reduced timetable running on the network, due to the pandemic.
Table 3.8 Financial performance, Wales, 2020-21
£ million, 2020-21 prices Actual
Variance to CP6 delivery plan better /
(worse)
Of which out / (under)
performance
Turnover 56 (1) (1) Schedules 4 and 8 3 11 11 Network operations, support and maintenance (117) (11) (11) Total (58) (1) (1) Renewals (179) (14) (10) Enhancements (22) (8) 1 Total FPM (9)
Source: Network Rail
Core Valley Lines 3.172 Part of the rail network in Wales (the Core Valley Lines, CVL) was transferred to the
Welsh Government in March 2020. As explained in Chapter 2, this changed Network Rail’s financial settlement for the remainder of CP6 as it will not need as much funding for Wales.

72
Annex A: Summary of key financial information Great Britain
2020-21 2019-20 £ million, 2020-21 prices Actual Delivery plan Variance Actual Income A B C=A-B
Network grant income 6,641 6,471 170 5,276
Franchised track access charges 2,464 2,727 (263) 2,584 Other single till income 496 723 (227) 1,148 Total income 9,601 9,921 (320) 9,008
Operating expenditure A B C=B-A
Network operations 714 657 (57) 659
Support costs 956 872 (84) 664
Traction electricity, industry costs and rates 845 945 100 800
Maintenance 1,892 1,720 (172) 1,742
Schedule 4 compensation payments 288 323 35 304
Schedule 8 compensation payments (347) 48 395 57
Total operating expenditure 4,348 4,565 217 4,226
Capital expenditure A B C=B-A
Renewals 3,910 3,596 (314) 2,917
Enhancements 1,620 2,435 815 1,824
Total capital expenditure 5,530 6,031 501 4,741
Other expenditure A B C=B-A
Financing costs and other 1,696 2,637 941 2,111
Corporation tax 52 23 (29) 0
Total other expenditure 1,748 2,660 912 2,111
Total expenditure 11,626 13,256 1,630 11,078
Other information
RAB 72,689 72,731
Net debt 53,592 53,476
Gearing (net debt/RAB) 73.7% 73.5%
Source: Network Rail’s regulatory financial statements

73
England and Wales 2020-21 2019-20 £ million, 2020-21 prices Actual Delivery plan Variance Actual Income A B C=A-B
Network grant income 6,018 5,832 186 4,803 Franchised track access charges 2,090 2,329 (239) 2,216 Other single till income 464 679 (215) 1,108 Total income 8,572 8,840 (268) 8,127
Operating expenditure A B C=B-A
Network operations 654 606 (48) 607
Support costs 863 795 (68) 582
Traction electricity, industry costs and rates 777 865 88 731
Maintenance 1,713 1,556 (157) 1,578
Schedule 4 compensation payments 264 307 43 283
Schedule 8 compensation payments (344) 42 386 47
Total operating expenditure 3,927 4,171 244 3,828
Capital expenditure A B C=B-A
Renewals 3,437 3,083 (354) 2,581
Enhancements 1,459 2,206 747 1,620
Total capital expenditure 4,896 5,289 393 4,201
Other expenditure A B C=B-A
Financing costs and other 1,525 2,373 848 1,900
Corporation tax 46 20 (26) 0
Total other expenditure 1,571 2,393 822 1,900
Total expenditure 10,394 11,853 1,459 9,929
Other information
RAB 65,118 65,157
Net debt 48,193 48,092
Gearing (net debt/RAB) 74.0% 73.8%
Source: Network Rail’s regulatory financial statements

74
Scotland 2020-21 2019-20 £ million, 2020-21 prices Actual Delivery plan Variance Actual Income A B C=A-B
Network grant income 623 639 (16) 473 Franchised track access charges 374 398 (24) 368 Other single till income 32 44 (12) 40 Total income 1,029 1,081 (52) 881
Operating expenditure A B C=B-A
Network operations 60 51 (9) 52
Support costs 93 77 (16) 82
Traction electricity, industry costs and rates 68 80 12 69
Maintenance 179 164 (15) 164
Schedule 4 compensation payments 24 16 (8) 21
Schedule 8 compensation payments (3) 6 9 10
Total operating expenditure 421 394 (27) 398
Capital expenditure A B C=B-A
Renewals 473 513 40 336
Enhancements 161 229 68 204
Total capital expenditure 634 742 108 540
Other expenditure A B C=B-A
Financing costs and other 171 264 93 211
Corporation tax 6 3 (3) 0
Total other expenditure 177 267 90 211
Total expenditure 1,232 1,403 171 1,149
Other information
RAB 7,571 7,574
Net debt 5,401 5,384
Gearing (net debt/RAB) 71.3% 71.1%
Source: Network Rail’s regulatory financial statements

75
Southern 2020-21 2019-20 £ million, 2020-21 prices Actual Delivery plan Variance Actual Income A B C=A-B
Network grant income 1,370 1,627 (257) 1,284 Franchised track access charges 619 680 (61) 617 Other single till income 148 226 (78) 270 Total income 2,137 2,533 (396) 2,171
Operating expenditure A B C=B-A
Network operations 186 182 (4) 177
Support costs 198 197 (1) 141
Traction electricity, industry costs and rates 258 283 25 235
Maintenance 445 371 (74) 381
Schedule 4 compensation payments 86 72 (14) 76
Schedule 8 compensation payments (149) 4 153 (27)
Total operating expenditure 1,024 1,109 85 983
Capital expenditure A B C=B-A
Renewals 972 772 (200) 708
Enhancements 193 259 66 209
Total capital expenditure 1,165 1,031 (134) 917
Other expenditure A B C=B-A
Financing costs and other 386 617 231 478
Corporation tax 14 6 (8) 0
Total other expenditure 400 623 223 478
Total expenditure 2,589 2,763 174 2,378
Other information
RAB 15,953 15,951
Net debt 12,295 12,103
Gearing (net debt/RAB) 77.1% 75.9%
Source: Network Rail’s regulatory financial statements

76
Wales and Western 2020-21 2019-20 £ million, 2020-21 prices Actual Delivery plan Variance Actual Income A B C=A-B
Network grant income 914 928 (14) 787 Franchised track access charges 450 486 (37) 392 Other single till income 70 84 (12) 559 Total income 1,434 1,498 (63) 1,738
Operating expenditure A B C=B-A
Network operations 92 82 (10) 88
Support costs 149 140 (9) 107
Traction electricity, industry costs and rates 86 97 11 86
Maintenance 275 256 (19) 257
Schedule 4 compensation payments 31 36 5 36
Schedule 8 compensation payments (46) 6 52 (28)
Total operating expenditure 587 617 30 546
Capital expenditure A B C=B-A
Renewals 555 537 (18) 461
Enhancements 225 350 125 387
Total capital expenditure 780 887 107 848
Other expenditure A B C=B-A
Financing costs and other 324 509 185 411
Corporation tax 6 3 (3) 0
Total other expenditure 330 512 182 411
Total expenditure 1,697 2,016 319 1,805
Other information
RAB 13,157 13,160
Net debt 10,239 10,239
Gearing (net debt/RAB) 77.8% 77.8%
Source: Network Rail’s regulatory financial statements

77
Eastern 2020-21 2019-20 £ million, 2020-21 prices Actual Delivery plan Variance Actual Income A B C=A-B
Network grant income 2,210 1,953 257 1,645 Franchised track access charges 527 620 (93) 646 Other single till income 138 168 (30) 154 Total income 2,875 2,741 134 2,445
Operating expenditure A B C=B-A
Network operations 227 198 (29) 201
Support costs 258 241 (17) 182
Traction electricity, industry costs and rates 260 294 34 246
Maintenance 566 511 (55) 514
Schedule 4 compensation payments 108 131 23 109
Schedule 8 compensation payments (71) 29 100 28
Total operating expenditure 1,348 1,404 56 1,280
Capital expenditure A B C=B-A
Renewals 1,115 1,065 (50) 854
Enhancements 764 1,194 430 800
Total capital expenditure 1,879 2,259 380 1,654
Other expenditure A B C=B-A
Financing costs and other 454 688 234 564
Corporation tax 15 7 (8) 0
Total other expenditure 469 695 226 564
Total expenditure 3,696 4,358 662 3,498
Other information
RAB 20,385 20,411
Net debt 14,275 14,316
Gearing (net debt/RAB) 70.0% 70.1%
Source: Network Rail’s regulatory financial statements

78
North West and Central 2020-21 2019-20 £ million, 2020-21 prices Actual Delivery plan Variance Actual Income A B C=A-B
Network grant income 1,524 1,324 200 1,087 Franchised track access charges 494 543 (49) 561 Other single till income 108 201 (93) 125 Total income 2,126 2,068 58 1,773
Operating expenditure A B C=B-A
Network operations 149 144 (5) 141
Support costs 258 217 (41) 152
Traction electricity, industry costs and rates 173 191 18 164
Maintenance 427 418 (9) 426
Schedule 4 compensation payments 39 68 29 62
Schedule 8 compensation payments (78) 3 81 74
Total operating expenditure 968 1,041 73 1,019
Capital expenditure A B C=B-A
Renewals 795 709 (86) 558
Enhancements 277 278 1 224
Total capital expenditure 1,072 987 (85) 782
Other expenditure A B C=B-A
Financing costs and other 361 559 198 447
Corporation tax 11 4 (7) 0
Total other expenditure 372 563 191 447
Total expenditure 2,412 2,591 179 2,248
Other information
RAB 15,623 15,635
Net debt 11,383 11,438
Gearing (net debt/RAB) 72.9% 73.2%
Source: Network Rail’s regulatory financial statements

79
National functions Note: the numbers set out below are included in the above regional financial information.
2020-21 2019-20 £ million, 2020-21 prices Actual Delivery plan Variance Actual Income A B C=A-B
Grant income 6,641 6,471 170 5,276
Franchised track access charges 523 677 (154) 550 Other single till income 44 90 (46) 789 Total income 7,208 7,238 (30) 6,615
Operating expenditure A B C=B-A
Network operations 21 22 1 20
Support costs 587 646 59 451
Traction electricity, industry costs and rates 839 943 104 797
Maintenance 62 68 6 74
Schedule 4 compensation payments 15 52 37 (14)
Schedule 8 compensation payments (49) 10 59 9
Total operating expenditure 1,475 1,741 266 1,337
Capital expenditure A B C=B-A
Renewals 514 470 (44) 441
Enhancements 159 0 (159) 192
Total capital expenditure 673 470 (203) 633
Other expenditure A B C=B-A
Financing costs and other 1,696 2,637 941 2,111
Corporation tax 52 23 (29) 0
Total other expenditure 1,748 2,660 912 2,111
Total expenditure 3,896 4,871 975 4,081
Source: Network Rail’s regulatory financial statements
80
Annex B: Link between efficiency and financial performance Several measures can be used to report on a company’s financial performance and there is no single right or wrong measure. The measures are not exclusive and can be complementary to provide a more rounded assessment. Our assessments focus on two measures; efficiency and the financial performance measure (FPM).
Consistent with general use in economic regulation, we use the term ‘efficiency’ to refer to changes over time of the cost of Network Rail’s core business activities. These are Network Rail’s activities of operating, maintaining and renewing the rail network, and supporting centralised functions such as human resources. These are broadly repeatable activities, which makes them easier to compare over time.
We use the term ‘financial performance’ to assess both core business activities and wider activities that generate income and expenditure such as enhancements to the network. Financial performance is a comparison of income and expenditure to the financial assumptions in a baseline such as in a business plan or regulatory determination. Other things being equal, if Network Rail has achieved the expected level of efficiency improvements in a business plan, it will report neither out or under-performance against that plan. However, in the real world, other things do result in differences between the reporting of efficiency and FPM. These include:
● items of income and expenditure that are included in FPM but not efficiency reporting. These include expenditure on enhancements, and other single till income;
● external factors that can result in cost increases (‘headwinds’) and cost decreases (‘tailwinds’) such as changes to employment legislation. These external factors are reported separately to efficiency. However, these are all taken into account for FPM, so, for example, a headwind will negatively affect FPM;
● FPM adjusts for future cost increases resulting from business decisions made during the current financial year. For example, the costs of a major re-signalling project may be expected to increase in the next financial year due to a purchase decision made during the current financial year. This will result in negative financial performance being reported during the current financial year (consistent with the accruals accounting concept). Efficiency reporting does not adjust for this; and
● the additional cost of any changes to planned renewals work during a year are recorded as negative FPM, whereas the cost of the work avoided is recorded as FPM neutral. This is because FPM measures performance against the delivery plan and is designed to discourage regions’ from making late changes to planned work during the year.

81
Annex C: Progress of research and development projects Network Rail uses the rail industry readiness level (RIRL) as a measure of how ready a new product or system is for deployment. As shown in Figure C1, most of Network Rail’s CP6 research and development (R&D) projects are in RIRL stages 1 to 3 with a further 37 projects in stages 4 to 6. 16 projects are European R&D programmes, which sit outside the RIRL. Overall, we consider that good progress has been made developing Network Rail’s CP6 R&D programme in 2020-21. We will continue to monitor and report on the progress of projects through RIRL levels over the next year.
Figure C1: Rail industry readiness levels of Network Rail’s R&D projects
Key Stage Description RIRL 1 to 3 Conception, Opportunity
Development and Proof of Concept
Identification of need and potential benefits, quantification of that benefit, verification of demand, proof of concept
RIRL 4 Validation Technology verified and tested against user requirements, market testing and/or laboratory validation
RIRL 5 to 6 System Demonstrator and Operational transition
Prototype demonstrated and developed, supplied to required standard. Commercial agreements progressed
RIRL 7 Initial Deployment First of Class asset deployment for operational usage, low rate of production ramping up
RIRL 8 to 9 Roll Out and Whole Life Management
Full rate production, on-going continuous improvement, reliability and growth
Source: Network Rail

82
© Office of Rail and Road 2021
This publication is licensed under the terms of the Open Government Licence v3.0 except where otherwise stated. To view this licence, visit nationalarchives.gov.uk/doc/open-government-licence/version/3.
Where we have identified any third-party copyright information you will need to obtain permission from the copyright holders concerned.
This publication is available at orr.gov.uk
Any enquiries regarding this publication should be sent to us at orr.gov.uk/contact-us


