ANNUAL ENDOWMENT REPORT FISCAL YEAR ENDED JUNE 30, 2011 University of California, Berkeley Foundation UC Davis Foundation University of California, Irvine Foundation The UCLA Foundation University of California, Merced Foundation UC Riverside Foundation UC San Diego Foundation The University of California, San Francisco Foundation UC Santa Barbara Foundation UC Santa Cruz Foundation
Transcript
ANNUAL ENDOWMENT REPORT
FISCAL YEAR ENDED JUNE 30, 2011
University of California, Berkeley Foundation
UC Davis Foundation
University of California, Irvine Foundation
The UCLA Foundation
University of California, Merced Foundation
UC Riverside Foundation
UC San Diego Foundation
The University of California, San Francisco Foundation
UC Santa Barbara Foundation
UC Santa Cruz Foundation
ANNUAL ENDOWMENT REPORT - FISCAL YEAR ENDED JUNE 30, 2011
2 Data Sources and Responsibilities .................................2
3 Consolidated Endowment Review ..................................3 3.1 Total University Endowment Assets by Donor
Designation to Regents and Foundation ...............4 3.2 Total Managed Endowment Assets by
Foundation.............................................................5 3.3 Managed Endowment Funds by Asset Class ........6 3.4 Endowment Fund Investment Performance ..........7 3.5 Gift and Recurring Charges ...................................8 3.6 Endowment Spending Policies ..............................9 3.7 Total Foundation Gift Assets................................10
4 Individual Foundation Reports ......................................11
University of California, Berkeley Foundation......12 UC Davis Foundation...........................................17 University of California, Irvine Foundation ...........22 The UCLA Foundation .........................................26 University of California, Merced Foundation........30 UC Riverside Foundation.....................................34 UC San Diego Foundation ...................................38
The University of California, San Francisco Foundation...........................................................42
UC Santa Barbara Foundation.............................46 UC Santa Cruz Foundation..................................50
5 Consultant of The Regents Report ...............................54 5.1 Investment Performance Summary .....................55 5.2 Policy Compliance ...............................................60 5.3 Analysis and Recommendations..........................63
6 Appendix .......................................................................64 6.1 10-Year Foundation Investment Performance.....65 6.2 10-Year Benchmark and Active Performance .....66 6.3 Investment Policies ..............................................67 6.4 Glossary ...............................................................68
ANNUAL ENDOWMENT REPORT - FISCAL YEAR ENDED JUNE 30, 2011
MERCER 1
1 Introduction BACKGROUND The history of reporting total University and Foundation endowments dates back to October 1978 when The Regents’ Committee on Educational Policy adopted a policy for University Support Groups. In subsequent years, The Regents charged the Treasurer’s Office with obtaining pertinent information regarding the UC Foundations’ investments and presenting an annual report to The Regents. The annual report includes the investment philosophy, policies and performance of each Foundation’s endowment assets, as well as the performance of The Regents’ endowment assets. In compliance with The Regents Policy 6201 Investment Policy for the University of California Campus Foundations, this report incorporates the investment review by the General Investment Consultant to The Regents.
PURPOSE The Regents’ policy on Support Groups articulates the permissible activities by affiliated fund-raising organizations to be:
“Gifts to a University Support Group for the benefit of the University may be accepted and administered only in accordance with University policies and, except as otherwise specified in this policy, may not be invested as endowments and shall be transferred to the University in an expeditious manner to fulfill the intentions of the donor for allocation and disbursement by the University.”
The Treasurer’s Office is the designated recipient and investment manager of The Regents’ endowment assets. However, in October 1978, The Regents included an exception in this policy for Foundations only that states:
“A Campus Foundation may hold and invest endowments and funds functioning as endowments on a long-term basis. Such investments must be consistent with the terms of the gift instrument. Investment operations shall be conducted in accordance with prudent, sound practices to insure that gift assets are protected and enhanced and that a reasonable return is achieved, and with due regard for the fiduciary responsibilities of the Foundation’s governing board….”
As a result of the above exception, donors can designate either The Regents or the Campus Foundations as the recipient of their gift assets. Foundations may then choose The Regents (the Treasurer’s Office) and/or external investment managers to manage their endowment investments. The Treasurer’s Office acts as a resource to the Foundations and offers its investment management services and counsel on endowment fund management issues. The goal of this report is to provide The Regents with a comprehensive overview of the University’s endowment assets.
ANNUAL ENDOWMENT REPORT - FISCAL YEAR ENDED JUNE 30, 2011
MERCER 2
2 Data Sources and Responsibilities This report was prepared by Mercer Investment Consulting, Inc. (Mercer). Information contained herein has been obtained from a range of third party sources. While the information is believed to be reliable, Mercer has not sought to verify it. As such, Mercer makes no representations or warranties as to the accuracy of the information presented and takes no responsibility or liability (including for indirect, consequential or incidental damages), for any error, omission or inaccuracy in the data supplied by any third party. Performance information was provided by State Street Bank. Certain information such as investment policies and gift policies was provided by the individual campus foundations.
DATA SOURCES and RESPONSIBILITIES State Street Bank is the University’s official “book of record” and calculates performance net of fees using the same methodology across all the Foundations. Annual Foundation performance results in this document prior to 2006 were provided by each Foundation and were neither audited nor calculated by the Treasurer’s Office or State Street Bank. Returns for 2006 and later were provided by State Street Bank. On a quarterly basis, State Street Bank reports Foundation performance to The Regents and those quarterly reports serve as official “book of record” to The Regents. Policy benchmark composition was provided by the Foundations. Mercer, as the General Investment Consultant to The Regents, has been directed by the Committee on Investments to review the Foundations’ investments to ensure that they are consistent with industry best practices and in compliance with The Regents Policy 6201 Investment Policy for the University of California Campus Foundations. In this role, Mercer assesses performance and investment policies based on the performance information provided by State Street and the investment policies submitted by the Foundations. Findings are reported quarterly to The Regents. For the purpose of reporting investment performance, each Foundation received the same exhibit formats and guidance, and any inconsistencies in definition and reporting are noted in the charts, tables and discussion. The Mercer Trust – Foundation & Endowment Universe data cannot be reproduced or redistributed without the express written consent of Mercer. PERFORMANCE PRESENTATION This report focuses primarily on the Foundations’ endowment assets and their investment performance. Totals for non-endowed assets and pledges are provided in Section 3 – Total Foundation Gift Assets. Section 4 – Individual Foundation Reports – displays the analysis of endowed assets. The consolidated review by the General Consultant to The Regents is provided in Section 5. The glossary at the end of this report includes definitions for these asset categories. PERFORMANCE COMPARISONS Mercer Trust – Foundation & Endowment Universe: measures returns on 239 endowment and foundation pools. Benchmark: For details regarding each individual Foundation’s benchmark, see Section 6.
ANNUAL ENDOWMENT REPORT - FISCAL YEAR ENDED JUNE 30, 2011
MERCER 3
3 Consolidated Endowment Review The following section contains a summary of the consolidated endowment review. Performance, assets under management and fee information were provided by State Street Bank which is the University’s official “book of record.” Information on assets not included in State Streets performance reporting was provided by The Regents and individual Foundations. Information about gifts and recurring charges, endowment spending and investment statements are based on the Foundations’ specific policies.
3.1 Total University Endowment Assets by Donor
Designation to Regents and Foundation................. 4 3.2 Total Managed Endowment Assets by
Foundation .............................................................. 5 3.3 Managed Endowment Funds by Asset Class ......... 6 3.4 Endowment Fund Investment Performance ........... 7 3.5 Gift and Recurring Charges .................................... 8 3.6 Endowment Spending Policies ............................... 9 3.7 Total Foundation Gift Assets................................. 10
ANNUAL ENDOWMENT REPORT - FISCAL YEAR ENDED JUNE 30, 2011
MERCER 4
3.1 Total University Endowment Assets by Donor Designation to Regents and Foundation
This table outlines the University’s total endowment assets by donor designation to either The Regents for the benefit of the campus or to the campus Foundation. Overall, total endowment assets increased by 21.1% over the last fiscal year, with The Regents’ endowment assets increasing by 16.6% and Foundation endowment assets increasing by 28.4%. These changes incorporate both new gifts accepted during the fiscal year and the return on total endowed assets. The Treasurer’s Office also manages endowment assets of about $1.14 billion for the benefit of systemwide programs and administration, including education and research programs, support services and administration. These assets appear in the table as part of The Regents’ endowment assets.
Regents* Foundation Total Regents* Foundation Total
to Regents and Foundation(Excluding Pledges)(Market Value $000)
June 30, 2011 June 30, 2010
Total University Endowment Assets by Donor Designation
* Includes General Endowment Pool (GEP), Short Term Investment Pool (STIP), and separately invested assets, as well as annuity and life
income funds. Excludes security lending balances and other accounts receivable and payable.
ANNUAL ENDOWMENT REPORT - FISCAL YEAR ENDED JUNE 30, 2011
MERCER 5
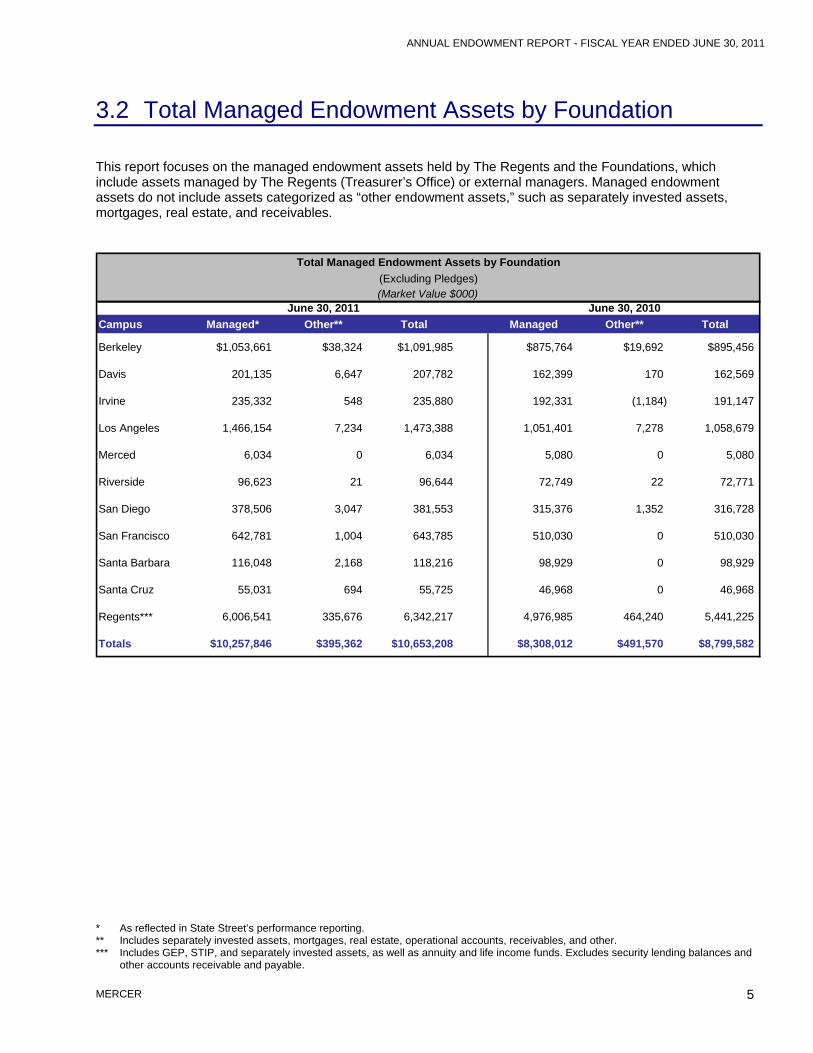
3.2 Total Managed Endowment Assets by Foundation This report focuses on the managed endowment assets held by The Regents and the Foundations, which include assets managed by The Regents (Treasurer’s Office) or external managers. Managed endowment assets do not include assets categorized as “other endowment assets,” such as separately invested assets, mortgages, real estate, and receivables.
Campus Managed* Other** Total Managed Other** Total
Total Managed Endowment Assets by Foundation(Excluding Pledges)(Market Value $000)
* As reflected in State Street’s performance reporting. ** Includes separately invested assets, mortgages, real estate, operational accounts, receivables, and other. *** Includes GEP, STIP, and separately invested assets, as well as annuity and life income funds. Excludes security lending balances and
other accounts receivable and payable.
ANNUAL ENDOWMENT REPORT - FISCAL YEAR ENDED JUNE 30, 2011
MERCER 6
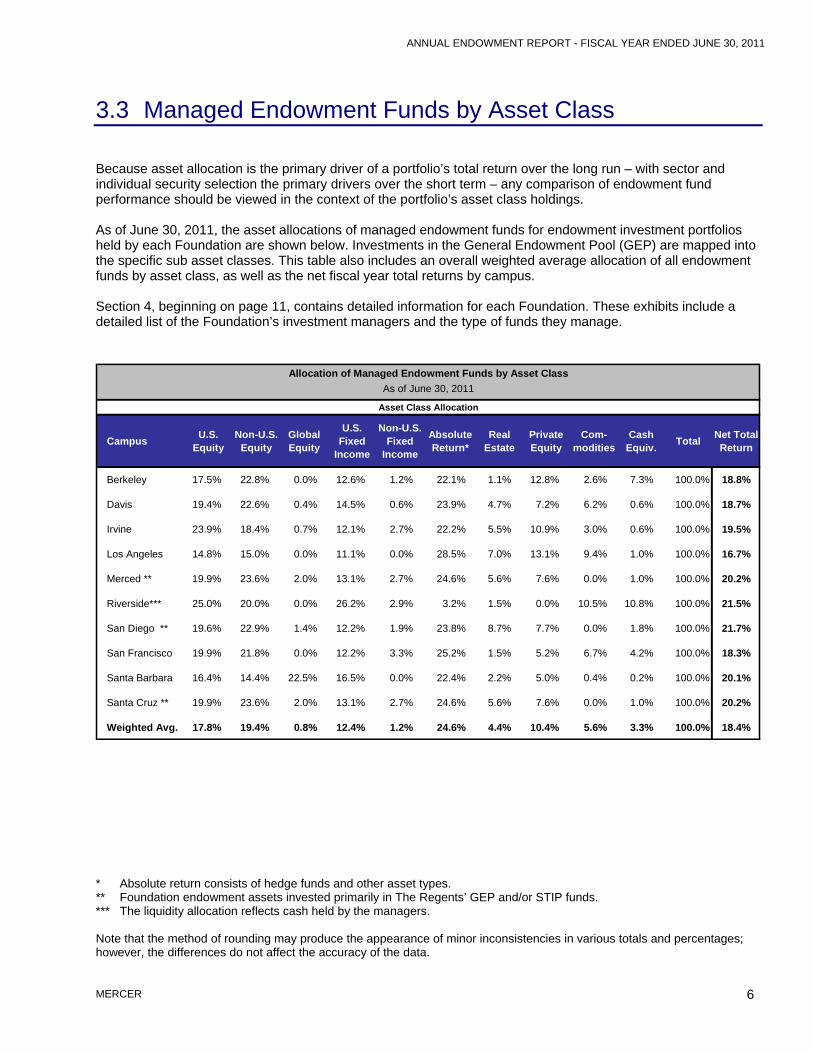
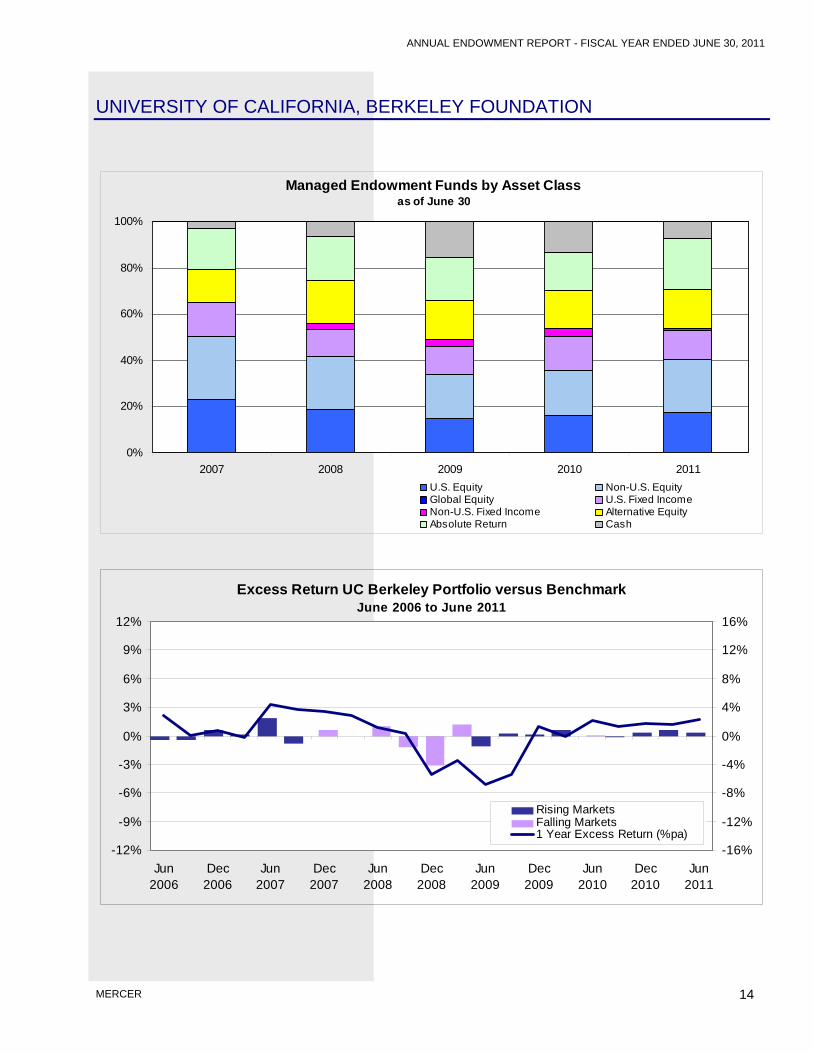
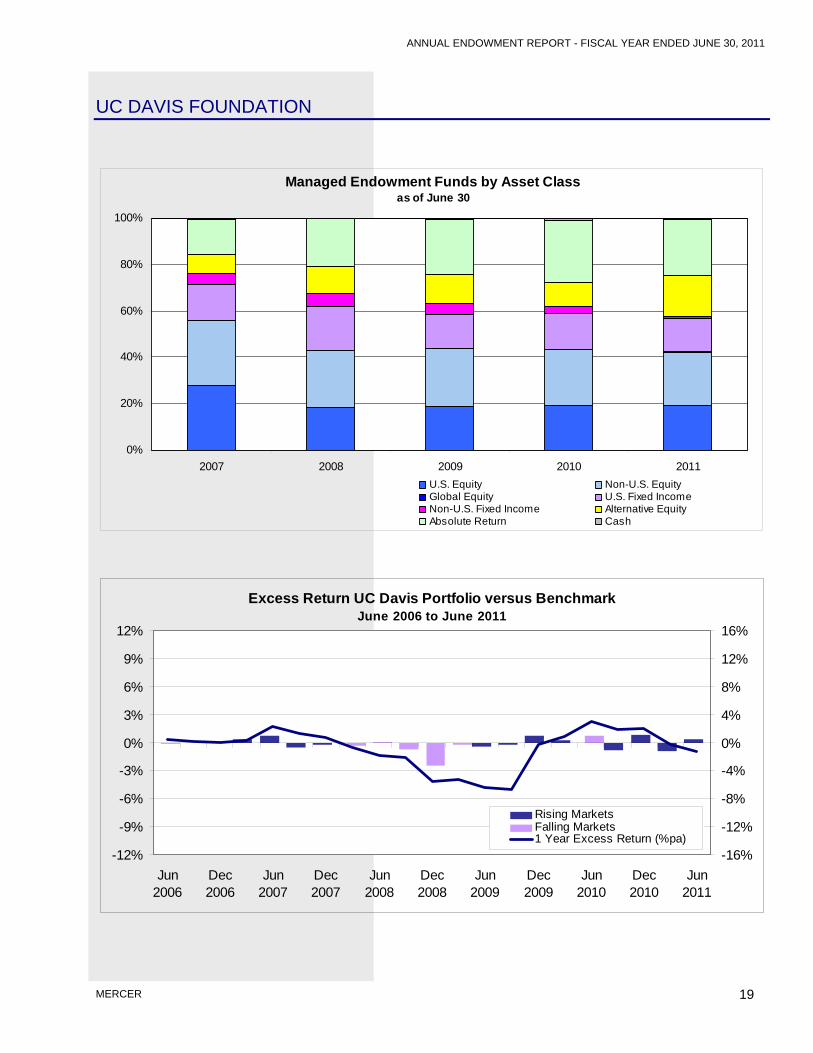
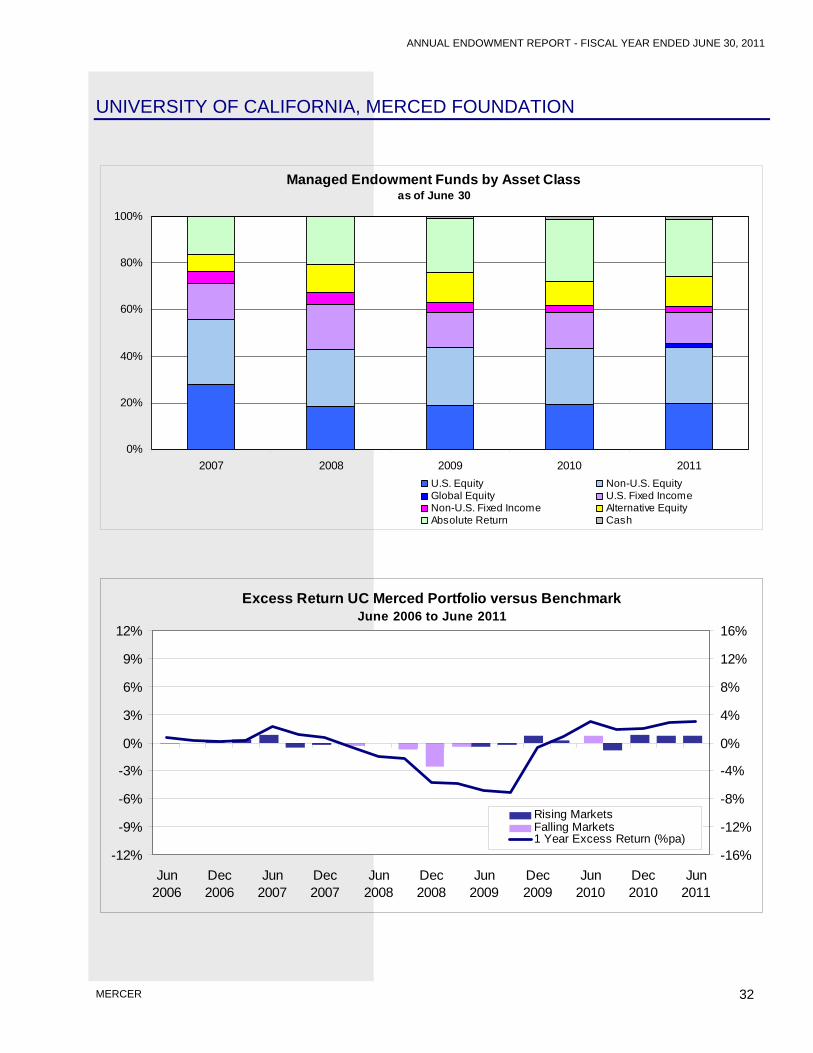
3.3 Managed Endowment Funds by Asset Class Because asset allocation is the primary driver of a portfolio’s total return over the long run – with sector and individual security selection the primary drivers over the short term – any comparison of endowment fund performance should be viewed in the context of the portfolio’s asset class holdings. As of June 30, 2011, the asset allocations of managed endowment funds for endowment investment portfolios held by each Foundation are shown below. Investments in the General Endowment Pool (GEP) are mapped into the specific sub asset classes. This table also includes an overall weighted average allocation of all endowment funds by asset class, as well as the net fiscal year total returns by campus. Section 4, beginning on page 11, contains detailed information for each Foundation. These exhibits include a detailed list of the Foundation’s investment managers and the type of funds they manage.
Allocation of Managed Endowment Funds by Asset ClassAs of June 30, 2011
Weighted Avg. 17.8% 19.4% 0.8% 12.4% 1.2% 24.6% 4.4% 10.4% 5.6% 3.3% 100.0% 18.4% * Absolute return consists of hedge funds and other asset types. ** Foundation endowment assets invested primarily in The Regents’ GEP and/or STIP funds. *** The liquidity allocation reflects cash held by the managers. Note that the method of rounding may produce the appearance of minor inconsistencies in various totals and percentages; however, the differences do not affect the accuracy of the data.
ANNUAL ENDOWMENT REPORT - FISCAL YEAR ENDED JUNE 30, 2011
MERCER 7
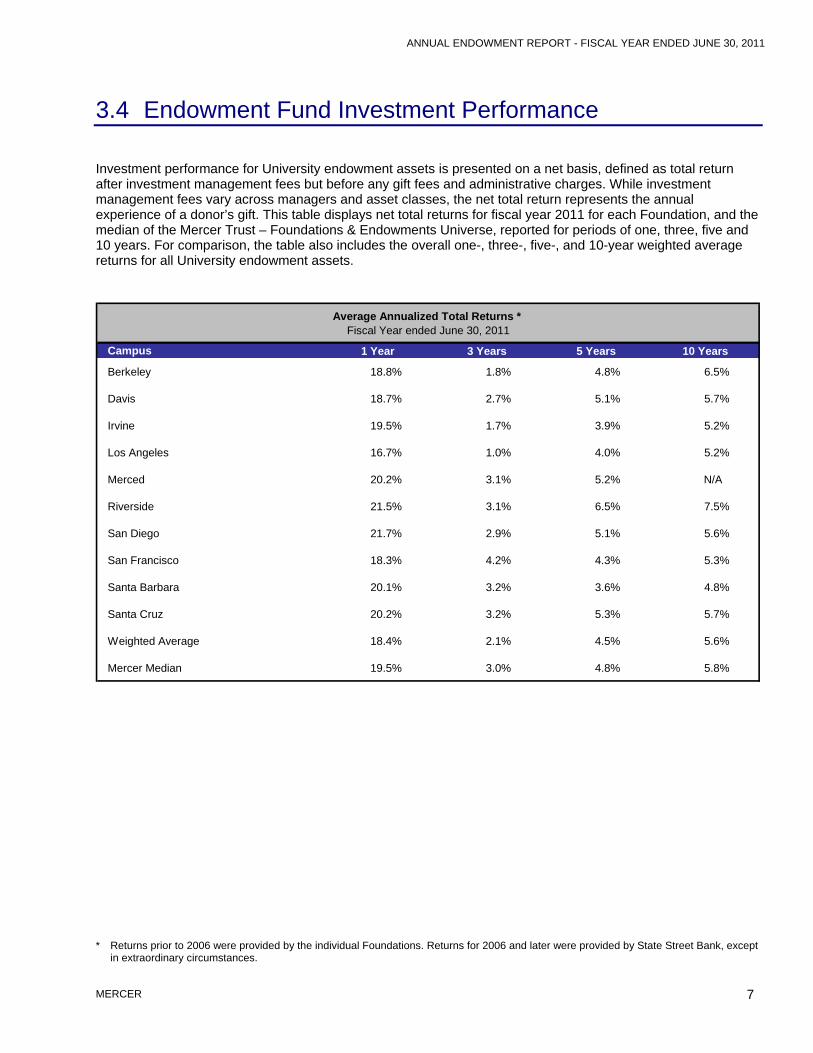
3.4 Endowment Fund Investment Performance Investment performance for University endowment assets is presented on a net basis, defined as total return after investment management fees but before any gift fees and administrative charges. While investment management fees vary across managers and asset classes, the net total return represents the annual experience of a donor’s gift. This table displays net total returns for fiscal year 2011 for each Foundation, and the median of the Mercer Trust – Foundations & Endowments Universe, reported for periods of one, three, five and 10 years. For comparison, the table also includes the overall one-, three-, five-, and 10-year weighted average returns for all University endowment assets.
Campus 1 Year 3 Years 5 Years 10 Years
Berkeley 18.8% 1.8% 4.8% 6.5%
Davis 18.7% 2.7% 5.1% 5.7%
Irvine 19.5% 1.7% 3.9% 5.2%
Los Angeles 16.7% 1.0% 4.0% 5.2%
Merced 20.2% 3.1% 5.2% N/A
Riverside 21.5% 3.1% 6.5% 7.5%
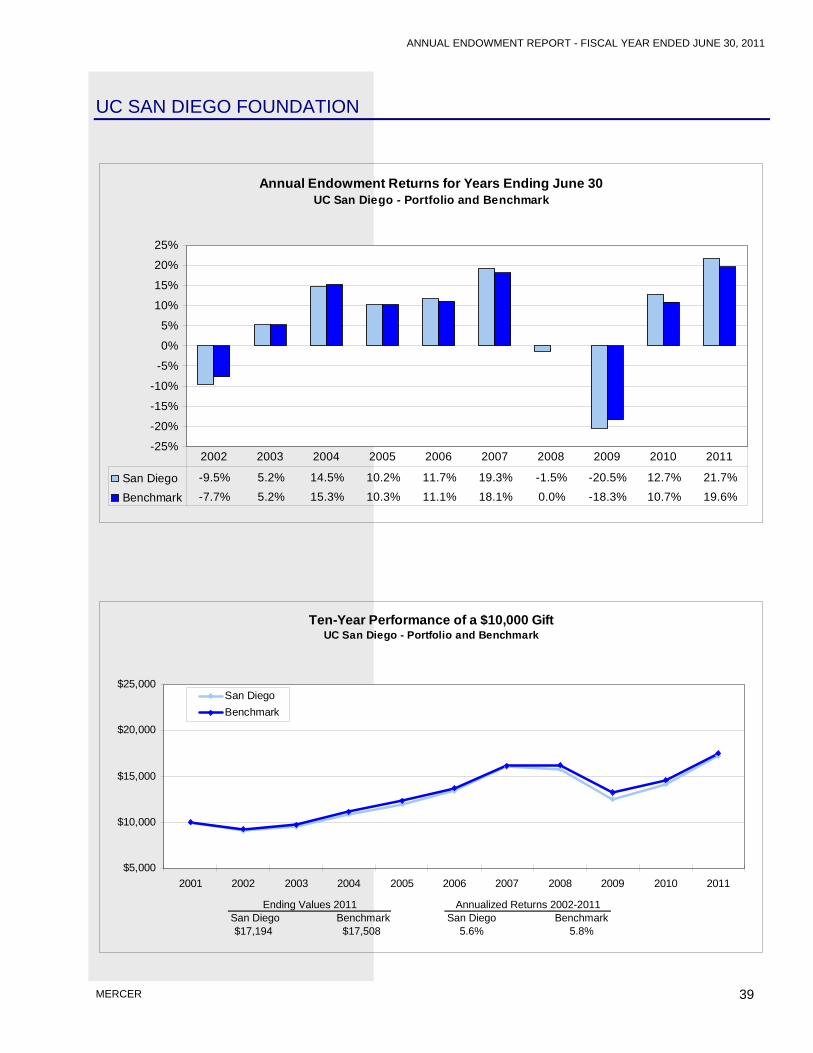
San Diego 21.7% 2.9% 5.1% 5.6%
San Francisco 18.3% 4.2% 4.3% 5.3%
Santa Barbara 20.1% 3.2% 3.6% 4.8%
Santa Cruz 20.2% 3.2% 5.3% 5.7%
Weighted Average 18.4% 2.1% 4.5% 5.6%
Mercer Median 19.5% 3.0% 4.8% 5.8%
Average Annualized Total Returns * Fiscal Year ended June 30, 2011
* Returns prior to 2006 were provided by the individual Foundations. Returns for 2006 and later were provided by State Street Bank, except
in extraordinary circumstances.
ANNUAL ENDOWMENT REPORT - FISCAL YEAR ENDED JUNE 30, 2011
MERCER 8
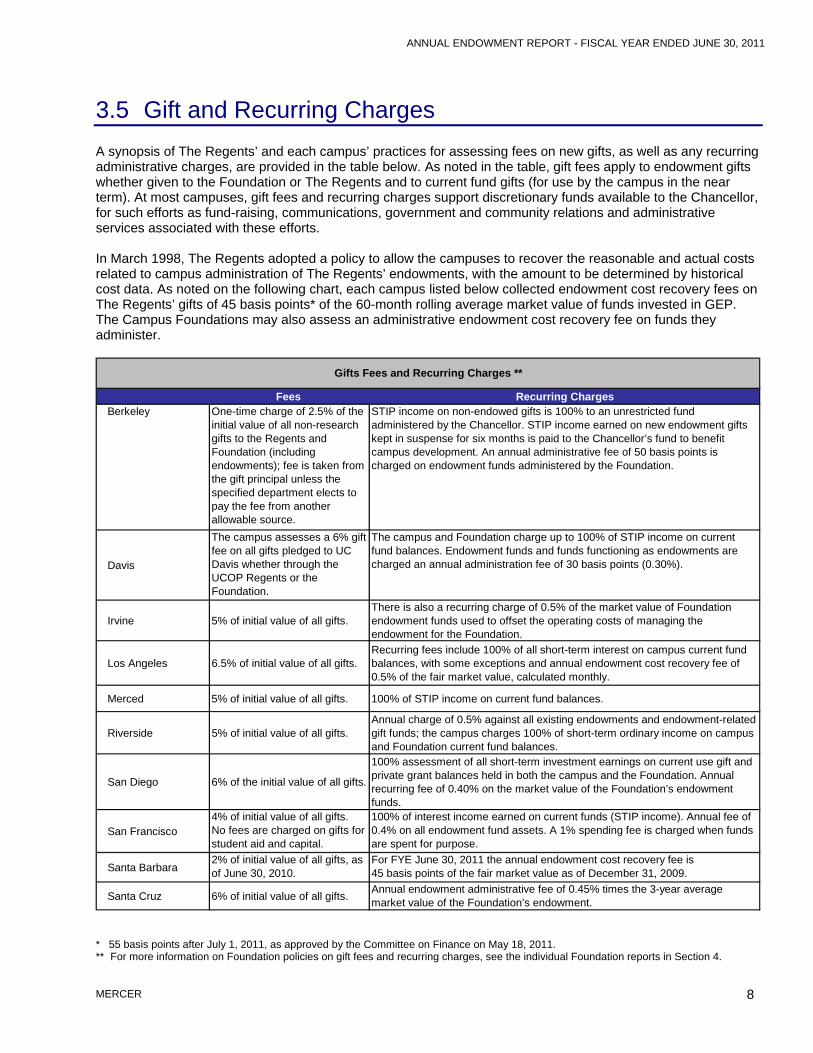
3.5 Gift and Recurring Charges A synopsis of The Regents’ and each campus’ practices for assessing fees on new gifts, as well as any recurring administrative charges, are provided in the table below. As noted in the table, gift fees apply to endowment gifts whether given to the Foundation or The Regents and to current fund gifts (for use by the campus in the near term). At most campuses, gift fees and recurring charges support discretionary funds available to the Chancellor, for such efforts as fund-raising, communications, government and community relations and administrative services associated with these efforts. In March 1998, The Regents adopted a policy to allow the campuses to recover the reasonable and actual costs related to campus administration of The Regents’ endowments, with the amount to be determined by historical cost data. As noted on the following chart, each campus listed below collected endowment cost recovery fees on The Regents’ gifts of 45 basis points* of the 60-month rolling average market value of funds invested in GEP. The Campus Foundations may also assess an administrative endowment cost recovery fee on funds they administer.
Fees Recurring ChargesBerkeley One-time charge of 2.5% of the
initial value of all non-research gifts to the Regents and Foundation (including endowments); fee is taken from the gift principal unless the specified department elects to pay the fee from another allowable source.
STIP income on non-endowed gifts is 100% to an unrestricted fund administered by the Chancellor. STIP income earned on new endowment gifts kept in suspense for six months is paid to the Chancellor’s fund to benefit campus development. An annual administrative fee of 50 basis points is charged on endowment funds administered by the Foundation.
Davis
The campus assesses a 6% gift fee on all gifts pledged to UC Davis whether through the UCOP Regents or the Foundation.
The campus and Foundation charge up to 100% of STIP income on current fund balances. Endowment funds and funds functioning as endowments are charged an annual administration fee of 30 basis points (0.30%).
Irvine 5% of initial value of all gifts.There is also a recurring charge of 0.5% of the market value of Foundation endowment funds used to offset the operating costs of managing the endowment for the Foundation.
Los Angeles 6.5% of initial value of all gifts.Recurring fees include 100% of all short-term interest on campus current fund balances, with some exceptions and annual endowment cost recovery fee of 0.5% of the fair market value, calculated monthly.
Merced 5% of initial value of all gifts. 100% of STIP income on current fund balances.
Riverside 5% of initial value of all gifts.Annual charge of 0.5% against all existing endowments and endowment-related gift funds; the campus charges 100% of short-term ordinary income on campus and Foundation current fund balances.
San Diego 6% of the initial value of all gifts.
100% assessment of all short-term investment earnings on current use gift and private grant balances held in both the campus and the Foundation. Annual recurring fee of 0.40% on the market value of the Foundation’s endowment funds.
San Francisco4% of initial value of all gifts. No fees are charged on gifts for student aid and capital.
100% of interest income earned on current funds (STIP income). Annual fee of 0.4% on all endowment fund assets. A 1% spending fee is charged when funds are spent for purpose.
Santa Barbara2% of initial value of all gifts, as of June 30, 2010.
For FYE June 30, 2011 the annual endowment cost recovery fee is45 basis points of the fair market value as of December 31, 2009.
Santa Cruz 6% of initial value of all gifts. Annual endowment administrative fee of 0.45% times the 3-year average market value of the Foundation’s endowment.
Gifts Fees and Recurring Charges **
* 55 basis points after July 1, 2011, as approved by the Committee on Finance on May 18, 2011. ** For more information on Foundation policies on gift fees and recurring charges, see the individual Foundation reports in Section 4.
ANNUAL ENDOWMENT REPORT - FISCAL YEAR ENDED JUNE 30, 2011
MERCER 9
3.6 Endowment Spending Policies A summary of the endowment spending policies for each university Foundation is shown in the table below. It is important to note that a Foundation choosing to invest in The Regents’ GEP, Private Equity Vintage Year Program, Real Estate Vintage Year Program and/or Absolute Return Unitized Program funds may apply its Foundation spending policy to those gift assets.
Berkeley
The UC Berkeley Foundation payout policy is 5% of the twelve-quarter moving average market value of the endowment. The Trustees at their discretion, may approve an alternative payout percentage within a range of 4.75% - 5.50% for a specific payout year. In fiscal year 2010-11, the actual payout rate is 4.75%.
Davis
The primary objective of the UC Davis Foundation's endowment spending policy is to achieve a proper balance between present and future needs of UC Davis in order to maximize long-term total return. A secondary objective is to achieve a reasonable degree of stability and predictability of current income available to the endowed university operating units. The Foundation has adopted a spending formula consistent with the UC Regents’ General Endowment Pool spending policy. The Foundation’s current approved spending rate is 4.25% of a 60-month rolling average of market value.
Irvine
The endowment fund spending policy allows for allocation of income equivalent to 4.5% of the moving average market value of the endowment portfolio. This average market value is computed using the previous 36 months of portfolio activity. Income earned in excess of the spending rate may be reinvested in endowment principal. Income available for expenditure is calculated according to a predetermined formula.
Los AngelesThe UCLA Foundation Endowment Pool made available for expenditure by fund holders an amount equal to 5.2% of a rolling 36-month average market value in fiscal year 2011, calculated monthly. The spending policy for fiscal 2012 is 5.30% of a rolling 36-month average market value, calculated monthly.
MercedLong-term total return target spending rate of 4.75% of a 60-month (5-year) rolling average market value. A spending rate of 4.75% was adopted in May 2006 for expenditures in fiscal year 2006/2007, 2007/2008, 2008/2009, 2009/2010 and 2010/2011.
RiversideThe endowment fund payout policy for FY 2010-11 is 4.50% of the average endowment fund market value computed using the previous 60 months of portfolio activity the last of which ended on the December 31 of such fiscal year.
San DiegoEndowment spending during fiscal year 2010-11 was calculated using a predetermined formula at an amount equal to 4.25% of the five–year average unit market value of the endowment portfolio. Spending is allocated to fund holders monthly.
San Francisco
The Foundation policy is to distribute 5% of the market value of the endowment pool calculated on a 36-month rolling average of the market value, subject to a 6% cap and a 3.5% floor as a percent of the end of year endowment pool market value. The payout rate is reviewed annually, which may result in modification. The payout is distributed once a year following the close of the fiscal year.
Santa Barbara
The formula for the 2010-2011 Fiscal Year is 4.75% of the 60-month rolling average value of a share of the UC Santa Barbara Foundation LTIP and the UC Regents General Endowment Pool, divided by the UC Santa Barbara Long Term Investment Pool (LTIP) share value as of December 31, 2009 and then multiplied by the total Fair Market Value of each Endowment Fund/Fund Functioning as an Endowment as of December 31, 2009.
Santa Cruz
The UC Santa Cruz Foundation endowment expenditure rate approved June, 2011, is 4.65% times a three-year moving average of December 31 market values. The endowment expenditure formula is reviewed annually and adjusted accordingly with respect to prudent concern for campus needs, donor expectations, and current market conditions. In no event will the corpus be reduced below the amount of the original gift, adjusted by the Gross Domestic Product (GDP) price index, unless specific language of the endowment agreement so allows.
Endowment Spending Policies by Foundation*
* For more information on Foundation spending policies, see the individual Foundation reports in Section 4.
ANNUAL ENDOWMENT REPORT - FISCAL YEAR ENDED JUNE 30, 2011
MERCER 10
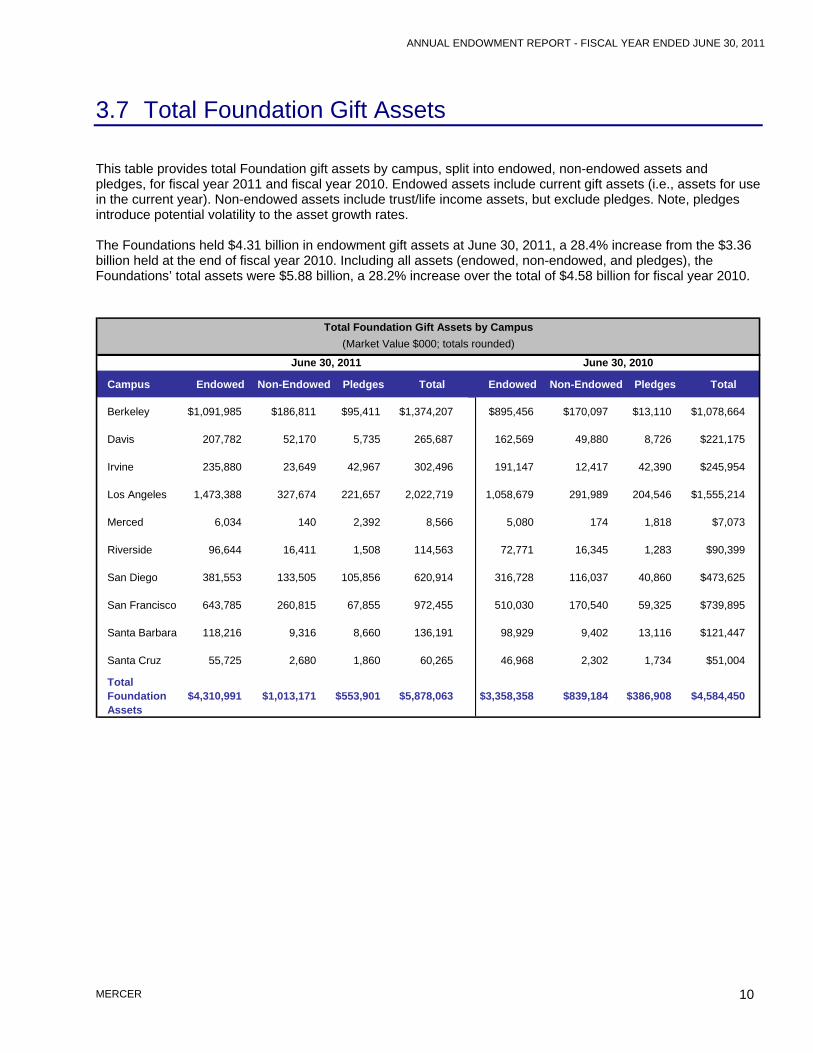
3.7 Total Foundation Gift Assets This table provides total Foundation gift assets by campus, split into endowed, non-endowed assets and pledges, for fiscal year 2011 and fiscal year 2010. Endowed assets include current gift assets (i.e., assets for use in the current year). Non-endowed assets include trust/life income assets, but exclude pledges. Note, pledges introduce potential volatility to the asset growth rates. The Foundations held $4.31 billion in endowment gift assets at June 30, 2011, a 28.4% increase from the $3.36 billion held at the end of fiscal year 2010. Including all assets (endowed, non-endowed, and pledges), the Foundations’ total assets were $5.88 billion, a 28.2% increase over the total of $4.58 billion for fiscal year 2010.
Campus Endowed Non-Endowed Pledges Total Endowed Non-Endowed Pledges Total
ANNUAL ENDOWMENT REPORT - FISCAL YEAR ENDED JUNE 30, 2011
MERCER 11
4 Individual Foundation Reports BENCHMARKS • The most important determinant of fund
performance and risk is the asset allocation policy established by Fund fiduciaries.
• A fund performance benchmark is usually stated in terms of percentages (adding to 100%) of a number of market indexes, such as the Russell 3000 Index for U.S. stocks or the Barclays Capital Index for U.S. bonds. A performance benchmark may change over time as policy changes both the asset mix and the performance objectives, or benchmarks, for each asset class.
• The Foundations provided the asset allocation and benchmark information summarized in Section 6.3. Annual and cumulative benchmark returns were computed based on the Foundations’ reported policy. They are shown in Section 6.1, along with the Foundations’ annual and cumulative returns. In some cases, detailed information on investment policy in earlier years was not available, and the Treasurer approximated benchmark composition based on the available information supplied by the Foundations.
• In addition, the Active Return, or difference between Fund and benchmark return, is shown in Section 6.2. Active return is a measure of the value added by Fund fiduciaries and managers over the policy objective.
The following section of the report contains a summary for each Foundation which includes: - Endowment Investment Objective - Endowment Spending Policy - Policy for Gift Fees and Administrative Expenses
- Actual vs. Target Allocation and Policy Benchmark - Graph showing ten-year of annual fiscal net total
returns for each foundation and benchmark (Merced only has 9 years)
- Graph showing ten-year performance of a
hypothetical $10,000 gift invested with the Foundation and the Benchmark (Merced only has 9 years)
- Graph showing managed endowment funds by asset
class for the last 5 fiscal years - Graph showing the rolling 1-year excess net return
of the foundation versus benchmark for the last 5 years
ANNUAL ENDOWMENT REPORT - FISCAL YEAR ENDED JUNE 30, 2011
Asset Allocation University of California, Berkeley Foundation Portfolio
June 30, 2011
Policy Range
As of March 1, 2011 UCB implemented a new Investment Policy moving to a multi-asset class portfolio approach. The policy targets and ranges are reported on the level of the employed asset categories. UCB is in the process of implementing the new investment structure.
Endowment Investment Objective There are three intersecting goals for the UC Berkeley Foundation endowment pool: 1) Inflation - Adjusted Spending. Generate returns sufficient to meet UCBF's desired payout target over rolling ten year periods, while maintaining real purchasing power, sufficient liquidity and acceptable volatility. 2) Market Returns - Generate results after all relevant expenses, that match or exceed the returns of a representative mix of investable assets over rolling ten year periods.3) Manager Selection - Demonstrate success in selecting investments, as measured by comparing performance after all relevant expenses versus the return and volatility measures of other investable options at the manager and asset class level, over rolling five year periods.Endowment Spending PolicyThe UC Berkeley Foundation payout policy is 5% of the twelve-quarter moving average market value of the endowment. The Trustees at their discretion, may approve an alternative payout percentage within a range of 4.75% - 5.50% for a specific payout year. In fiscal year 2010-11, the actual payout rate is 4.75%.Policy for Gift Fees and Administrative Expenses1) One time charge of 2.5% of the initial value of all non-research gifts to the Regents and Foundation (including endowments). The fee is taken from the gift principal unless the specified department elects to pay the fee from another allowable source. 2) STIP income on non-endowed gifts is 100% to an unrestricted fund administered by the Chancellor. 3) STIP income earned on new endowment gifts kept in suspense for six months is paid to the Chancellor's fund to benefit campus development. 4) An annual administrative fee of 50 basis points is charged on endowment funds administered by the Foundation.
ANNUAL ENDOWMENT REPORT - FISCAL YEAR ENDED JUNE 30, 2011
MERCER 13
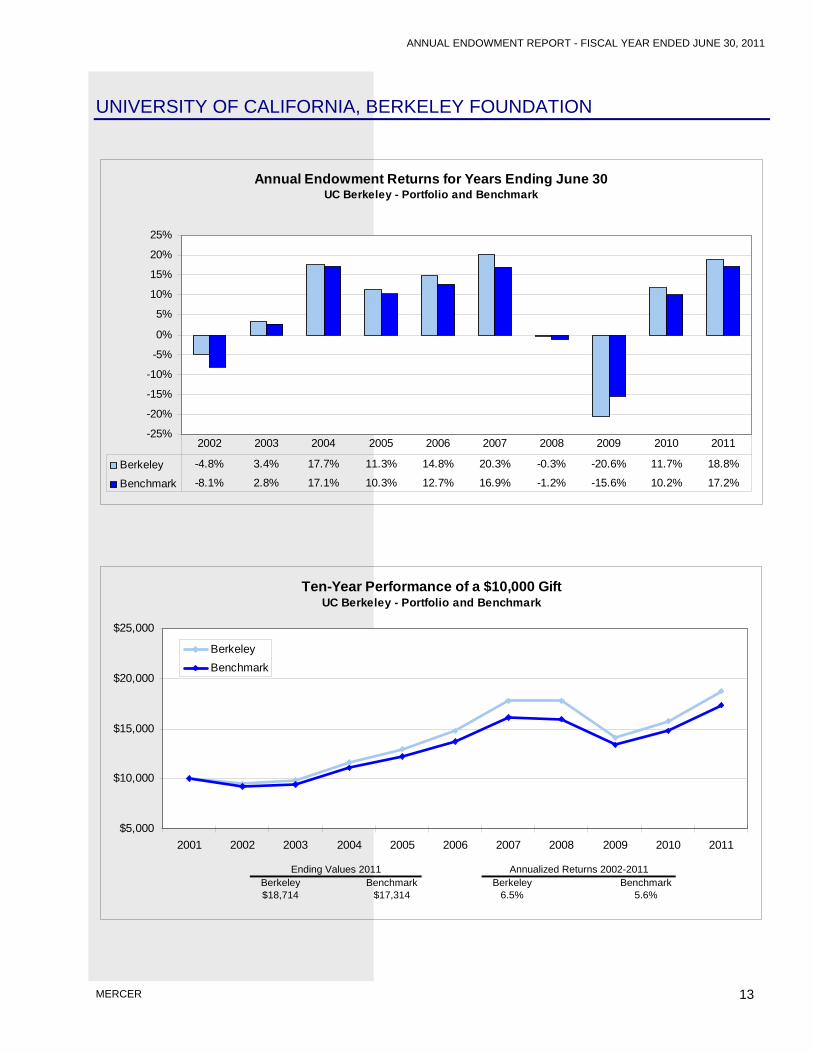
UNIVERSITY OF CALIFORNIA, BERKELEY FOUNDATION
Annual Endowment Returns for Years Ending June 30 UC Berkeley - Portfolio and Benchmark
3) This fund was set up to receive the proceeds from class actions
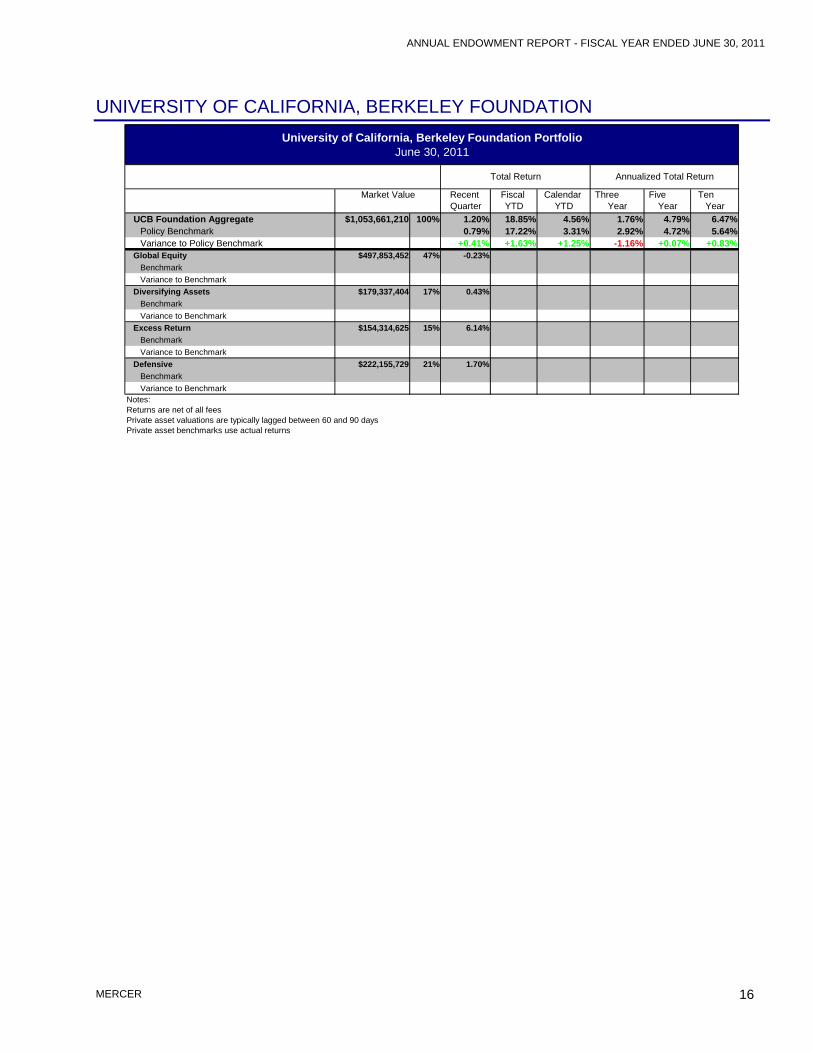
University of California, Berkeley Foundation PortfolioJune 30, 2011
Total Return Annualized Total Return
2) The Liquidity Accounts asset class performance and market value includes Regents STIP, which is also broken out separately under UC Regents Managed Funds to reflect those funds managed by the UC Regents
Market Value Recent Quarter
Fiscal YTD
Calendar YTD
Three Year
Five Year
Ten Year
Notes: Returns are net of all feesPrivate asset valuations are typically lagged between 60 and 90 daysPrivate asset benchmarks use actual returns1) UCBF Investment Committee approved their HY Debt investment as part of their 'Global Equity' strategy, therefore no HY benchmark has been designated
ANNUAL ENDOWMENT REPORT - FISCAL YEAR ENDED JUNE 30, 2011
University of California, Davis Foundation Portfolio
Policy Range
As of January 1, 2011, UCD implemented a new Investment Policy moving to a multi-asset class portfolio approach. The policy targets and ranges are reported on the level of the employed asset categories.
June 30, 2011Asset Allocation
Endowment Investment Objective The Endowment Fund seeks future long-term growth of investments, at an acceptable risk level, sufficient to offset reasonable spending plus normal inflation, thereby preserving the purchasing power of the Fund for future generations. It also seeks partial protection from potentially severe adverse effects of extended deflationary environments. Endowment Spending PolicyThe primary objective of the UC Davis Foundation's endowment spending policy is to achieve a proper balance between present and future needs of UC Davis in order to maximize long-term total return. A secondary objective is to achieve a reasonable degree of stability and predictability of current income available to the endowed university operating units. The Foundation has adopted a spending formula consistent with the UC Regents’ General Endowment Pool spending policy. The Foundation’s current approved spending rate is 4.25% of a 60-month rolling average of market value.Policy for Gift Fees and Administrative ExpensesThe campus assesses a 6% gift fee on all gifts pledged to UC Davis whether through the UCOP Regents or the Foundation. The gift fee will be assessed and collected at the time the gift or pledge payment is received in cash or converted to cash. The gift fee may be paid by 1) deducting the fee from the gift principal2) deducting the fee from funds provided by the donor specifically for purposes of paying the fee3) deducting the fee from the campus account designated for this purpose by the benefitting unit, school, or 4) depositing and holding the complete gift in an interest earning account until sufficient earnings have accrued to pay the fee if the gift is $100,000 or more.The ECRF will be deducted from the amount calculated as described under the spending policy.
ANNUAL ENDOWMENT REPORT - FISCAL YEAR ENDED JUNE 30, 2011
MERCER 18
UC DAVIS FOUNDATION
Ending Values 2011 Annualized Returns 2002-2011Davis Benchmark Davis Benchmark
$17,394 $18,064 5.7% 6.1%
Ten-Year Performance of a $10,000 Gift UC Davis - Portfolio and Benchmark
L/T US Eq Growth $12,754,089 6.34% -0.08% 6.28%RUSSELL 3000 -0.03% 6.35%Variance to Benchmark -0.05% -0.07%
L/T non-US Growth $12,580,518 6.25% 0.95% 4.84%MSCI WORLD EX US (NET) 0.86% 4.72%Variance to Benchmark +0.09% +0.12%
Calendar YTD
Fiscal YTD
Recent Quarter
Total Return
University of California, Davis Foundation PortfolioJune 30, 2011
1) The 10-Year return reflects the actual GEP unitized return as reported by the UC Regents.
Note:Returns are net of all fees.
Five Year
Annualized Total Return
Market Value Ten Year
Three Year
ANNUAL ENDOWMENT REPORT - FISCAL YEAR ENDED JUNE 30, 2011
MERCER 22
Assets ($M)
Actual Allocation
Benchmark Policy
Allocation
Variance from Benchmark
Policy
Policy Range Compliance
(Actual Allocation)
Public Equity $101 43% 44% -1% 34% 54% Yes Public Fixed Income $35 15% 15% 0% 10% 20% Yes All Alternative Inv. $98 42% 41% 1% 21% 61% Yes Liquidity Portfolio $1 1% 0% 1% 0% 2% Yes Total Assets $235 100% 100%
University of California, Irvine Foundation Portfolio
Policy Range
June 30, 2011Asset Allocation
UNIVERSITY OF CALIFORNIA, IRVINE FOUNDATION
Endowment Investment Objective The Irvine Foundation's investment objective for its endowment portfolio is to maximize long-term total return, with a total return objective (net of fees), measured over a full market cycle, of not less than the rate of inflation as measured by the CPI, plus 500 basis points. Ideally, total return should exceed market performance. The investment policy is 22% US Equity, 22% Non-US Equity, 20% Hedge Funds, 15% Fixed Income, 8% Private Equity and Venture Capital, 8% Real Estate, 5% Commodities, and 0% Cash. Endowment Spending PolicyThe endowment fund spending policy allows for allocation of income equivalent to 4.5% of the moving average market value of the endowment portfolio. This average market value is computed using the previous 36 months of portfolio activity. Income earned in excess of the spending rate may be reinvested in endowment principal. Income available for expenditure is calculated according to a predetermined formula. Policy for Gift Fees and Administrative ExpensesThe Irvine Campus charges a one-time fee of 5% of the initial value of all Foundation and Regents’ gifts. The fee may be taken (1) from the principal if specified by the donors(2) by holding gift in a suspense account until fee is earned, or (3) from another acceptable fund source. There is also a recurring charge of 0.5% of the market value of Foundation endowment funds used to offset the operating costs of managing the endowment for the Foundation.All interest earned on the balances of current use private gifts is credited to the Chancellor’s Discretionary Fund and used to support ongoing fundraising efforts at UC Irvine.
ANNUAL ENDOWMENT REPORT - FISCAL YEAR ENDED JUNE 30, 2011
Non-U.S. Developed Equity $22,393,802 10% 1.54% 25.72% 2.88% -2.01% 1.32%MSCI AC WORLD ex US (NET) 0.38% 29.73% 3.80% -0.35% 3.67%Variance to Benchmark +1.16% -4.01% -0.92% -1.66% -2.35%
1) The 10-Year return reflects the actual GEP/STIP unitized return as reported by the UC Regents.
Notes: Returns are net of all fees.Prior to July 1, 2007, Core Fixed Income included Common fund Multi-Strategy and Absolute Return.Private asset valuations are typically lagged between 60 and 90 days.
Recent Quarter
Ten Year
Five Year
Calendar YTD
Three Year
University of California, Irvine Foundation PortfolioJune 30, 2011
Market Value Fiscal YTD
Annualized Total ReturnTotal Return
ANNUAL ENDOWMENT REPORT - FISCAL YEAR ENDED JUNE 30, 2011
MERCER 26
THE UCLA FOUNDATION
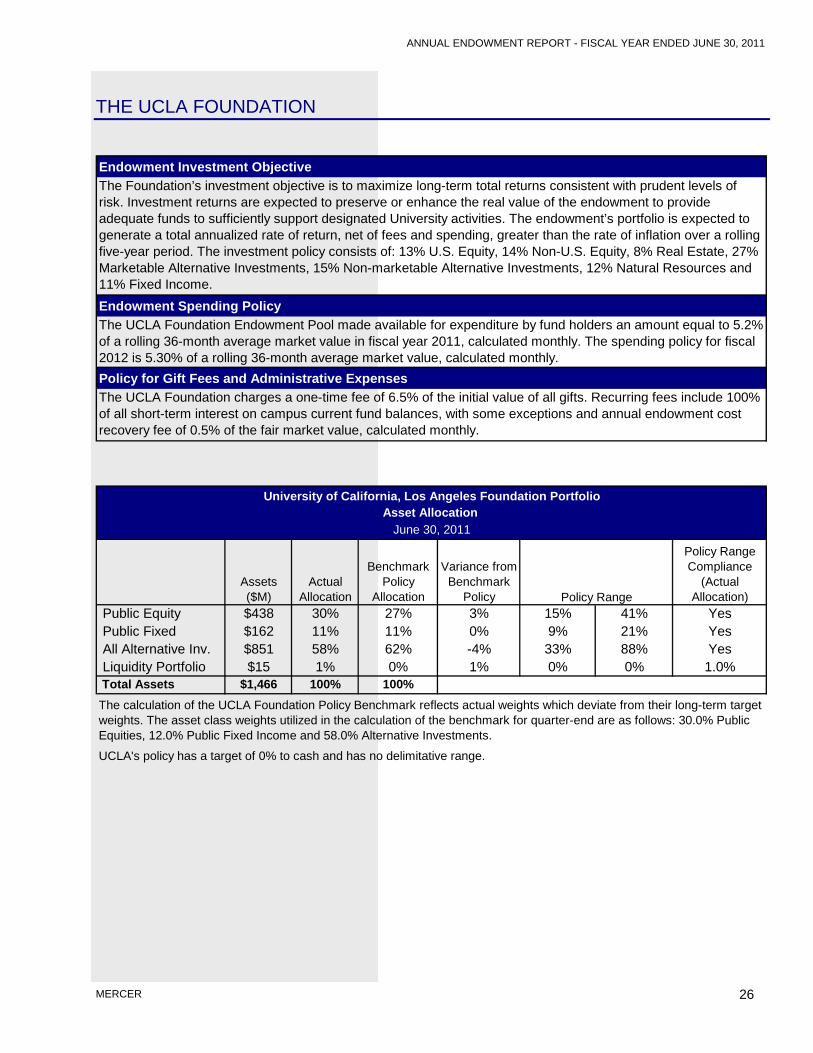
Endowment Investment Objective The Foundation’s investment objective is to maximize long-term total returns consistent with prudent levels of risk. Investment returns are expected to preserve or enhance the real value of the endowment to provide adequate funds to sufficiently support designated University activities. The endowment’s portfolio is expected to generate a total annualized rate of return, net of fees and spending, greater than the rate of inflation over a rolling five-year period. The investment policy consists of: 13% U.S. Equity, 14% Non-U.S. Equity, 8% Real Estate, 27% Marketable Alternative Investments, 15% Non-marketable Alternative Investments, 12% Natural Resources and 11% Fixed Income. Endowment Spending PolicyThe UCLA Foundation Endowment Pool made available for expenditure by fund holders an amount equal to 5.2% of a rolling 36-month average market value in fiscal year 2011, calculated monthly. The spending policy for fiscal 2012 is 5.30% of a rolling 36-month average market value, calculated monthly. Policy for Gift Fees and Administrative ExpensesThe UCLA Foundation charges a one-time fee of 6.5% of the initial value of all gifts. Recurring fees include 100% of all short-term interest on campus current fund balances, with some exceptions and annual endowment cost recovery fee of 0.5% of the fair market value, calculated monthly.
Assets ($M)
Actual Allocation
Benchmark Policy
Allocation
Variance from Benchmark
Policy
Policy Range Compliance
(Actual Allocation)
Public Equity $438 30% 27% 3% 15% 41% Yes Public Fixed $162 11% 11% 0% 9% 21% Yes All Alternative Inv. $851 58% 62% -4% 33% 88% Yes Liquidity Portfolio $15 1% 0% 1% 0% 0% 1.0% Total Assets $1,466 100% 100%
University of California, Los Angeles Foundation Portfolio
Policy Range
The calculation of the UCLA Foundation Policy Benchmark reflects actual weights which deviate from their long-term target weights. The asset class weights utilized in the calculation of the benchmark for quarter-end are as follows: 30.0% Public Equities, 12.0% Public Fixed Income and 58.0% Alternative Investments.
UCLA's policy has a target of 0% to cash and has no delimitative range.
June 30, 2011Asset Allocation
ANNUAL ENDOWMENT REPORT - FISCAL YEAR ENDED JUNE 30, 2011
MERCER 27
THE UCLA FOUNDATION
Ending Values 2011 Annualized Returns 2002-2011Los Angeles Benchmark Los Angeles Benchmark
$16,570 $15,607 5.2% 4.6%
Ten-Year Performance of a $10,000 Gift UCLA - Portfolio and Benchmark
Non-U.S. Developed Equity $128,263,355 9% 0.25% 32.22% 3.83% -0.02% 3.57%MSCI AC WORLD ex US (NET) 0.38% 29.73% 3.80% -0.35% 3.67%Variance to Benchmark -0.13% +2.49% +0.03% +0.33% -0.10%
Global Equity N/ABenchmarkVariance to Benchmark
Emerging Market Equity $91,330,776 6% -1.80% 28.83% -0.63% 7.13% 13.72%MSCI AC WORLD ex US (NET) 0.38% 29.73% 3.80% -0.35% 3.67%Variance to Benchmark -2.18% -0.90% -4.43% +7.48% +10.05%
5) The GEP is not broekn out by investments; therefore, the subasset class information is not shown above. Also, the 10-Year return reflects the actual GEP unitized return as reported by the UC Regents.
2) The HFRX Absolute Return Marketable Blended Index is a 50/50 blend of the HFRX Absolute Return Strategies Index and the HFRX Market Directional Index.3) The Real Estate asset class performance and market value includes the Regents Private Real Estate which is also broken out separately under UC Regents Managed Funds to reflect those funds managed by the UC Regents.
Five Year
1) The 'Misc Assets' line item was moved from Liquidity to Private Equity for the period Q2 2009 and before. The Private Equity asset class performance and market value includes the Regents Vintage Private Equity which is also broken out separately under UC Regents Managed Funds to reflect those funds managed by the UC Regents.
Market Value
4) State Street consistently uses an Internal Rate of Return (IRR) methodology to calculate monthly performance for all UC Foundation Endowments. IRR is an industry accepted approximation of a true Time Weighted Return (TWR), but can be significantly impacted by excessive cash flows (>10% of the fund). In the case of UCLA’s Liquidity portfolio, there are several months where Net Cash Flows (NCF) exceeded the composite’s assets by 100% and more. This significant flow activity is impacting the IRR of the composite and being reflected as a substantial negative return, not indicative of typical short-term performance. Due to a lack of daily valuation data, a TWR calculation is not possible.
Total Return
University of California, Los Angeles Foundation Portfolio
Notes: Returns are net of all fees.Private asset valuations typically lag between 60 and 90 days.
Ten Year
Annualized Total Return
Recent Quarter
Calendar YTD
Three Year
June 30, 2011
Fiscal YTD
ANNUAL ENDOWMENT REPORT - FISCAL YEAR ENDED JUNE 30, 2011
MERCER 30
UNIVERSITY OF CALIFORNIA, MERCED FOUNDATION
Endowment Investment Objective UC Merced Foundation’s investment objectives are: (1) provide investment earnings adequate to secure the benefits promised and the financial obligations created by the endowment, and (2) secure, preserve, and increase the inflation-adjusted value of the Fund.Endowment Spending PolicyLong-term total return target spending rate of 4.75% of a 60-month (5-year) rolling average market value. A spending rate of 4.75% was adopted in May 2006 for expenditures in fiscal year 2006/2007, 2007/2008, 2008/2009, 2009/2010 and 2010/2011.Policy for Gift Fees and Administrative ExpensesThe University expects that funds privately raised shall support the development activities of the Chancellor and his staff. Currently the University policy to effectuate this principle is the following: Upon the receipt of all gifts to UCM or the UCM Foundation, a fee of 5% of the initial value of the gift shall be assessed and deposited in the (1) from the principal if specified by the donor,(2) by holding the gift in a suspense account until fee is earned or (3) from another acceptable fund source. Additionally, all of the STIP income earned on endowments, funds functioning as endowments and non-endowment gifts shall also be deposited into the Chancellor's Discretionary Fund. The Vice President for Administration shall provide for a scheduled annual distribution of income and shall assess initial fees on gifts for deposit in the Chancellor's Discretionary Fund. The Chancellor shall waive the assessment of the off-the-top fee on ongoing interest earnings only in the event that a donor organization has a written policy which prohibits such fees.Any waiver shall be communicated in writing from the Chancellor to the Vice Chancellor for Administration. It is the responsibility of the Vice Chancellor for Advancement to establish an appropriate method for notifying donors to the University and the University Foundation of the fee assessment and its purposes.
Assets ($M)Actual
Allocation
Benchmark Policy
Allocation
Variance from Benchmark
Policy
Policy Range Compliance
(Actual Allocation)
Public Equity $3 46% 46% 0% 36% 56% Yes Public Fixed Income $1 16% 18% -2% 13% 23% Yes All Alternative Inv. $2 38% 37% 1% 27% 47% Yes Liquidity Portfolio $0 1% 0% 1% 0% 10% Yes Total Assets $6 100% 100%
University of California, Merced Foundation Portfolio
Policy Range
The UC Merced Foundation utilizes the GEP Policy Benchmark. Policy Benchmark Allocations shown are the GEP Current Policy Allocation.
June 30, 2011Asset Allocation
ANNUAL ENDOWMENT REPORT - FISCAL YEAR ENDED JUNE 30, 2011
MERCER 31
UNIVERSITY OF CALIFORNIA, MERCED FOUNDATION
Nine-Year Performance of a $10,000 Gift UC Merced - Portfolio and Benchmark
University of California, Merced Foundation PortfolioJune 30, 2011
Three Year
Five Year
Ten Year
Annualized Total Return
Recent Quarter
Calendar YTD
Market Value
ANNUAL ENDOWMENT REPORT - FISCAL YEAR ENDED JUNE 30, 2011
MERCER 34
UC RIVERSIDE FOUNDATION
Assets ($M)
Actual Allocation
Benchmark Policy
Allocation
Variance from Benchmark
Policy
Policy Range Compliance
(Actual Allocation)
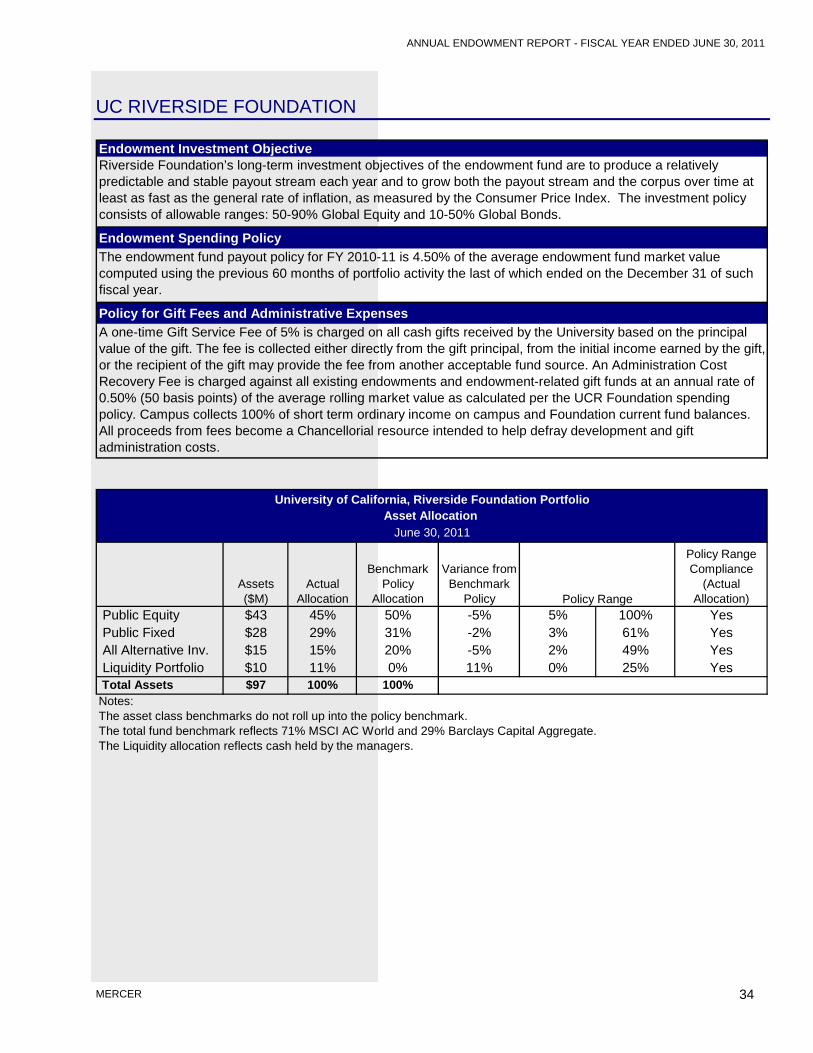
Public Equity $43 45% 50% -5% 5% 100% Yes Public Fixed $28 29% 31% -2% 3% 61% Yes All Alternative Inv. $15 15% 20% -5% 2% 49% Yes Liquidity Portfolio $10 11% 0% 11% 0% 25% Yes Total Assets $97 100% 100%Notes: The asset class benchmarks do not roll up into the policy benchmark.The total fund benchmark reflects 71% MSCI AC World and 29% Barclays Capital Aggregate.The Liquidity allocation reflects cash held by the managers.
University of California, Riverside Foundation Portfolio
Policy Range
June 30, 2011Asset Allocation
Endowment Investment Objective Riverside Foundation’s long-term investment objectives of the endowment fund are to produce a relatively predictable and stable payout stream each year and to grow both the payout stream and the corpus over time at least as fast as the general rate of inflation, as measured by the Consumer Price Index. The investment policy consists of allowable ranges: 50-90% Global Equity and 10-50% Global Bonds.
Endowment Spending PolicyThe endowment fund payout policy for FY 2010-11 is 4.50% of the average endowment fund market value computed using the previous 60 months of portfolio activity the last of which ended on the December 31 of such fiscal year.
Policy for Gift Fees and Administrative ExpensesA one-time Gift Service Fee of 5% is charged on all cash gifts received by the University based on the principal value of the gift. The fee is collected either directly from the gift principal, from the initial income earned by the gift, or the recipient of the gift may provide the fee from another acceptable fund source. An Administration Cost Recovery Fee is charged against all existing endowments and endowment-related gift funds at an annual rate of 0.50% (50 basis points) of the average rolling market value as calculated per the UCR Foundation spending policy. Campus collects 100% of short term ordinary income on campus and Foundation current fund balances. All proceeds from fees become a Chancellorial resource intended to help defray development and gift administration costs.
ANNUAL ENDOWMENT REPORT - FISCAL YEAR ENDED JUNE 30, 2011
MERCER 35
UC RIVERSIDE FOUNDATION
Ten-Year Performance of a $10,000 Gift UC Riverside - Portfolio and Benchmark
2) UC Riverside Foundation has a substantial portion of its cash exposure within the Global Balanced fund. As a result, the 0% reflected in the Liquidity Accounts above is considerably less than the 11% Actual Allocation to Liquidity Portfolio reflected in the Asset Allocation table.
Fiscal YTD
Total Return
Market Value
Notes: Returns are net of all fees1) The UC Riverside policy benchmark is a blend of the MSCI All Country World Index (ACWI) and Barclays Aggregate. The MSCI ACWI is an appropriate component of the policy benchmark because of its exposure to developed and emerging markets, as well as natural resources. The asset class benchmarks do not roll up into the policy benchmark. The Total Plan Aggregate market value excludes "other" endowed assets.
University of California, Riverside Foundation PortfolioJune 30, 2011
Three Year
Annualized Total Return
Recent Quarter
Five Year
Calendar YTD
ANNUAL ENDOWMENT REPORT - FISCAL YEAR ENDED JUNE 30, 2011
MERCER 38
UC SAN DIEGO FOUNDATION
Endowment Investment Objective The U.C. San Diego Foundation’s primary investment goal for its endowment is to maximize long-term total return, utilizing a diversified portfolio consistent with prudent levels of risk. Endowment portfolio performance is expected to preserve or enhance the real value of the endowment and the purchasing power of the spending. The portfolio return goal is to achieve an annualized total net return at least equivalent to, and preferably exceeding, the endowment spending rate plus inflation, over rolling five and ten year periods. The investment policy target asset allocation is 19% U.S. Equity, 24% Non-U.S. Equity, 7.5% Private Equity, 25% Absolute Return, 7.5% Real Estate, 3% Opportunistic, and 14% Fixed Income.
Endowment Spending PolicyEndowment spending during fiscal year 2010-11 was calculated using a predetermined formula at an amount equal to 4.25% of the five–year average unit market value of the endowment portfolio. Spending is allocated to fund holders monthly.Policy for Gift Fees and Administrative ExpensesDuring fiscal year 2010-11, the San Diego campus assessed a one-time fee of 6% on the initial value of all gifts made to either the Foundation or The Regents. There was also a recurring charge of 0.40% annually on the market value of the Foundation’s endowment funds. All of the gift fees and the endowment fees were used to provide funding for the centrally managed fundraising and related operations of the campus. During fiscal 2010-11, the campus assessed all interest earned on the balances of current use gift and private grant funds held by both the Foundation and the campus, which became a chancellorial resource.
Assets ($M)Actual
Allocation
Benchmark Policy
Allocation
Variance from Benchmark
Policy
Policy Range Compliance
(Actual Allocation)
Public Equity $166 44% 43% 1% 35% 55% Yes Public Fixed Income $53 14% 14% 0% 5% 20% Yes All Alternative Inv. $152 40% 43% -3% 30% 55% Yes Liquidity Portfolio $7 2% 0% 2% 0% 2% Yes Total Assets $379 100% 100%
University of California, San Diego Foundation Portfolio
Policy Range
June 30, 2011Asset Allocation
ANNUAL ENDOWMENT REPORT - FISCAL YEAR ENDED JUNE 30, 2011
MERCER 39
UC SAN DIEGO FOUNDATION
Ten-Year Performance of a $10,000 Gift UC San Diego - Portfolio and Benchmark
1) The 10-Year return reflects the actual GEP/STIP unitized return as reported by the UC Regents.
Notes: Returns are net of all fees.Aggregate market value excludes "other" endowed assets.Private asset valuations are typically lagged between 60 and 90 days.
University of California, San Diego Foundation PortfolioJune 30, 2011
Annualized Total Return
Recent Quarter
Calendar YTD
Three Year
Five Year
Ten Year
ANNUAL ENDOWMENT REPORT - FISCAL YEAR ENDED JUNE 30, 2011
MERCER 42
Assets ($M)
Actual Allocation
Benchmark Policy
Allocation
Variance from Benchmark
Policy
Policy Range Compliance
(Actual Allocation)
Public Equity $268 42% 40% 2% 20% 60% Yes Public Fixed Income $100 16% 20% -4% 10% 30% Yes All Alternative Inv. $248 39% 40% -1% 15% 75% Yes Liquidity Portfolio $27 4% 0% 4% 0% 10% Yes Total Assets $643 100% 100%
University of California, San Francisco Foundation Portfolio
Policy Range
June 30, 2011Asset Allocation
THE UNIVERSITY OF CALIFORNIA, SAN FRANCISCO FOUNDATION
Endowment Investment Objective San Francisco Foundation’s primary investment objective for its endowment portfolio is growth of principal sufficient to preserve purchasing power and to provide income to support current and future University activities. Over the long term, it is the goal of the Foundation that the total return on investment assets should equal the rate of inflation, plus the payout rate (which is used to support current activities), plus an amount reinvested to support future activities.Endowment Spending PolicyA portion of the endowment pool will be expended annually. The amount of the distribution will be determined by the payout policy of the Foundation, modified by donors’ wishes where applicable. The Foundation policy is to distribute 5% of the market value of the endowment pool calculated on a 36-month rolling average of the market value, subject to a 6% cap and a 3.5% floor as a percent of the end of year endowment pool market value. The payout rate is reviewed annually, which may result in modification. The payout is distributed once a year following the close of the fiscal year. Undistributed income and gains from investment activities are reinvested in the Endowment Pool.
Policy for Gift Fees and Administrative ExpensesThe University of California, San Francisco Foundation assesses a one-time fee of 4% of the initial value of gifts. The University also assesses a 1% spending fee at the time that funds are spent for purpose. Gifts for student aid and capital gifts are exempted from these fees. An annual administrative fee of 40 basis points is charged on endowment funds administered by the Foundation. In addition, the University assesses a recurring charge of 100% of interest income earned on current funds (STIP income). Fees are used by the University to fund central infrastructure costs, including development and gift and endowment administration.
ANNUAL ENDOWMENT REPORT - FISCAL YEAR ENDED JUNE 30, 2011
MERCER 43
THE UNIVERSITY OF CALIFORNIA, SAN FRANCISCO FOUNDATION
Ending Values 2011 Annualized Returns 2002-2011San Francisco Benchmark San Francisco Benchmark
$16,682 $15,468 5.3% 4.5%
Annual Endowment Returns for Years Ending June 30 UC San Francisco - Portfolio and Benchmark
-25%
-20%
-15%
-10%
-5%
0%
5%
10%
15%
20%
25%
San Francisco -6.8% 0.9% 17.2% 10.1% 11.3% 18.2% -7.5% -16.5% 14.4% 18.3%
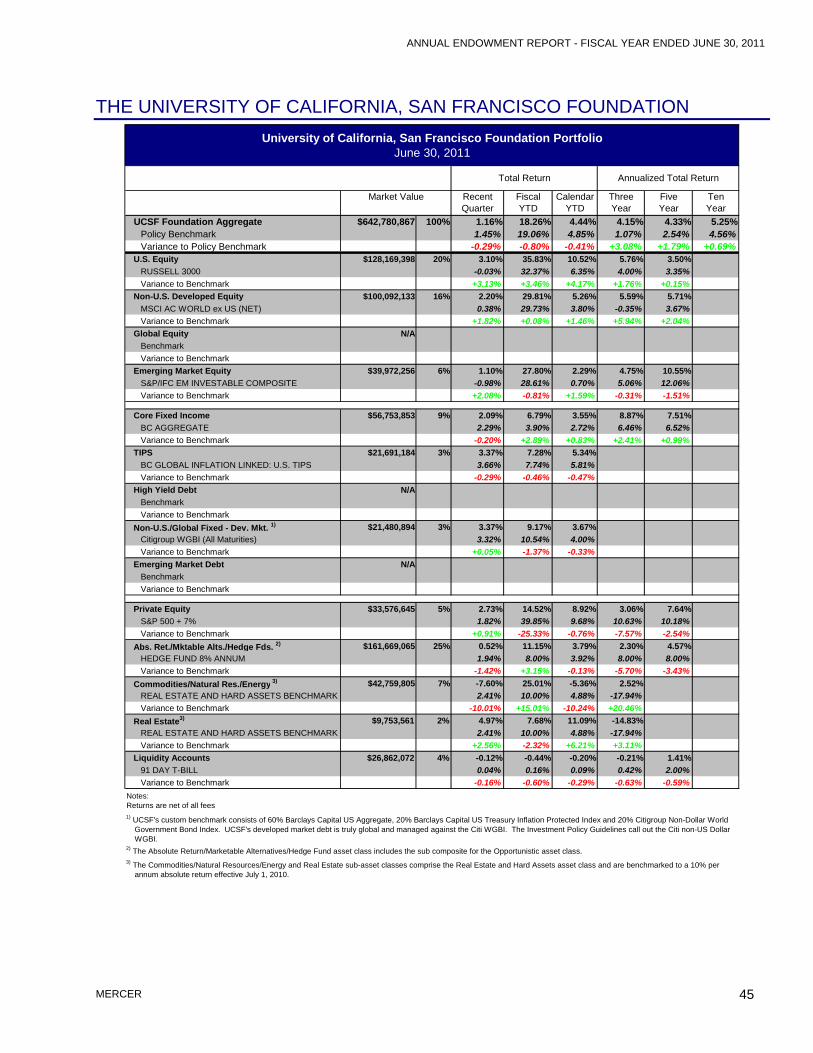
Non-U.S. Developed Equity $100,092,133 16% 2.20% 29.81% 5.26% 5.59% 5.71%MSCI AC WORLD ex US (NET) 0.38% 29.73% 3.80% -0.35% 3.67%Variance to Benchmark +1.82% +0.08% +1.46% +5.94% +2.04%
1) UCSF's custom benchmark consists of 60% Barclays Capital US Aggregate, 20% Barclays Capital US Treasury Inflation Protected Index and 20% Citigroup Non-Dollar World Government Bond Index. UCSF's developed market debt is truly global and managed against the Citi WGBI. The Investment Policy Guidelines call out the Citi non-US Dollar WGBI.
3) The Commodities/Natural Resources/Energy and Real Estate sub-asset classes comprise the Real Estate and Hard Assets asset class and are benchmarked to a 10% per annum absolute return effective July 1, 2010.
Notes: Returns are net of all fees
Three Year
Market Value Five Year
2) The Absolute Return/Marketable Alternatives/Hedge Fund asset class includes the sub composite for the Opportunistic asset class.
Ten Year
Fiscal YTD
Recent Quarter
University of California, San Francisco Foundation PortfolioJune 30, 2011
Annualized Total ReturnTotal Return
ANNUAL ENDOWMENT REPORT - FISCAL YEAR ENDED JUNE 30, 2011
MERCER 46
UC SANTA BARBARA FOUNDATION
Assets ($M)
Actual Allocation
Benchmark Policy
Allocation
Variance from
Benchmark Policy
Policy Range Compliance
(Actual Allocation)
Public Equity $62 53% 40% 13% 35% 55% Yes Public Fixed Income $19 17% 18% -1% 5% 25% Yes All Alternative Inv. $35 30% 42% -12% 30% 50% Yes Liquidity Portfolio $0 0% 0% 0% 0% 10% Yes Total Assets $116 100% 100%The benchmark that is maintained by State Street is the acutal target allocation established by Goldman Sachs.
University of California, Santa Barbara Foundation Portfolio
Policy Range
June 30, 2011Asset Allocation
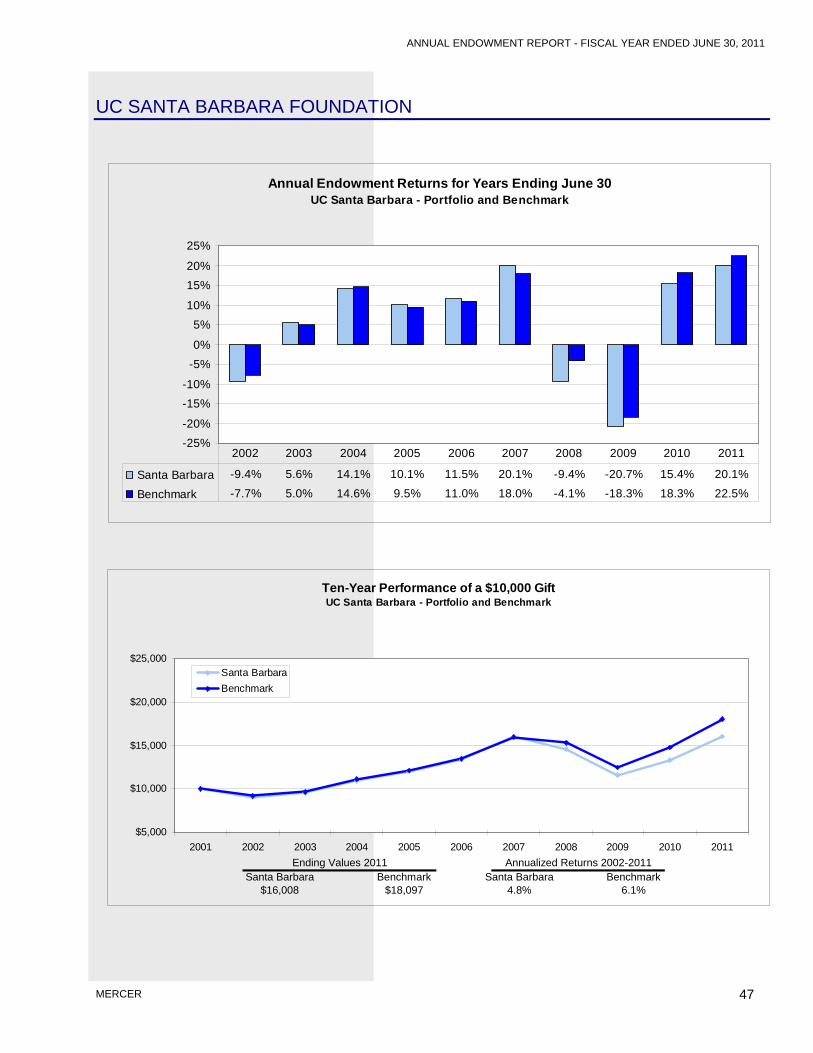
Endowment Investment Objective A. The primary long-term financial objective for the Foundation's Long Term Investment Policy (LTIP) is to preserve the purchasing power of the LTIP’s principal, while providing a relatively stable and growing source of funding for endowment and trust beneficiaries. B. The primary long-term investment objective of the LTIP is to earn an average annual real (i.e., after adjusting for inflation) total return on a risk-adjusted basis that is at least equal to the LTIP’s total spending rate, net of consultant and management fees, over long time periods (i.e., rolling ten-year periods). Over shorter time periods (i.e., rolling five-year periods), the LTIP will seek to meet or exceed an appropriate composite of market indices reflecting the LTIP’s asset allocation policies. Endowment Spending PolicyThe formula for the 2010-2011 Fiscal Year is 4.75% of the 60-month rolling average value of a share of the UC Santa Barbara Foundation LTIP and the UC Regents General Endowment Pool, divided by the UC Santa Barbara LTIP share value as of December 31, 2009 and then multiplied by the total Fair Market Value of each Endowment Fund/Fund Functioning as an Endowment as of December 31, 2009. Policy for Gift Fees and Administrative ExpensesThe UC Santa Barbara Foundation Endowment Cost Recovery Fee for FYE June 30, 2011 was assessed at 45 basis points, applied to the total fund balance as of December 31, 2009 for each fund.
ANNUAL ENDOWMENT REPORT - FISCAL YEAR ENDED JUNE 30, 2011
MERCER 47
UC SANTA BARBARA FOUNDATION
Ending Values 2011 Annualized Returns 2002-2011Santa Barbara Benchmark Santa Barbara Benchmark
$16,008 $18,097 4.8% 6.1%
Annual Endowment Returns for Years Ending June 30 UC Santa Barbara - Portfolio and Benchmark
-25%-20%
-15%-10%
-5%0%
5%10%
15%20%
25%
Santa Barbara -9.4% 5.6% 14.1% 10.1% 11.5% 20.1% -9.4% -20.7% 15.4% 20.1%
U.S. Equity $18,973,871 16% -2.46% 31.14% 5.80% 5.16%S&P 500 0.10% 30.69% 6.02% 3.34%Variance to Benchmark -2.56% +0.45% -0.22% +1.82%
Non-U.S. Developed Equity $8,849,590 8% -0.11% 25.38% 3.49% -3.80%MSCI WORLD EX US (NET) 0.86% 30.33% 4.72% -1.56%Variance to Benchmark -0.97% -4.95% -1.23% -2.24%
Global Equity 1) $26,097,401 22% 1.47% 31.29% 6.47%S&P GLOBAL LARGEMIDCAP 0.36% 30.69% 4.86%Variance to Benchmark +1.11% +0.60% +1.61%
1) The Global Equity strategy has been implemented within the overall context of the total plans US/non-US Equity policy weights, which fall within their respective guidelines. As a result, the inclusion of the Global Equity asset class benchmark within the Policy Benchmark is not necessary.
Market Value
Notes: Returns are net of all fees.
University of California, Santa Barbara Foundation PortfolioJune 30, 2011
Annualized Total Return
Recent Quarter
Calendar YTD
Three Year
Five Year
ANNUAL ENDOWMENT REPORT - FISCAL YEAR ENDED JUNE 30, 2011
MERCER 50
Endowment Investment Objective The UC Santa Cruz Foundation’s investment objective for its endowment portfolio is to maximize long-term total return with a prudent level of risk, to provide inflation protection through reinvestment of an appropriate level of realized and unrealized earnings, and to maximize the real rate of return over the long term. The investment policy matches that of the General Endowment Pool.Endowment Spending PolicyThe UC Santa Cruz Foundation endowment expenditure rate approved June, 2011, is 4.65% times a three-year moving average of December 31 market values. The endowment expenditure formula is reviewed annually and adjusted accordingly with respect to prudent concern for campus needs, donor expectations, and current market conditions. In no event will the corpus be reduced below the amount of the original gift, adjusted by the Gross Domestic Product (GDP) price index, unless specific language of the endowment agreement so allows.Policy for Gift Fees and Administrative ExpensesThe UC Santa Cruz Foundation allocates STIP earnings to uninvested endowment balances when it is earned. The UCSC campus assesses a gift fee of 6% of initial value of gifts. Of the 4.65% endowment expenditures, .45% is allocated for administrative expenses of the Foundation. No additiional annual recurring fee (0%) on the market value of the Foundation’s endowments.
UC SANTA CRUZ FOUNDATION
Assets ($M)
Actual Allocation
Benchmark Policy
Allocation
Variance from
Benchmark Policy
Policy Range Compliance
(Actual Allocation)
Public Equity $25 46% 46% 0% 36% 56% Yes Public Fixed Income $9 16% 18% -2% 13% 23% Yes All Alternative Inv. $21 38% 37% 1% 27% 47% Yes Liquidity Portfolio $1 1% 0% 1% 0% 10% Yes Total Assets $55 100% 100%
University of California, Santa Cruz Foundation Portfolio
Policy Range
The UC Santa Cruz Foundation utilizes the GEP Policy Benchmark. Policy Benchmark Allocations shown are the GEP Current Policy Allocation.
June 30, 2011Asset Allocation
ANNUAL ENDOWMENT REPORT - FISCAL YEAR ENDED JUNE 30, 2011
MERCER 51
UC SANTA CRUZ FOUNDATION
Annual Endowment Returns for Years Ending June 30 UC Santa Cruz - Portfolio and Benchmark
1) The 10-Year return reflects the actual GEP unitized return as reported by the UC Regents.
University of California, Santa Cruz Foundation PortfolioJune 30, 2011
Three Year
Five Year
Ten Year
Annualized Total Return
Recent Quarter
Calendar YTD
Market Value
ANNUAL ENDOWMENT REPORT - FISCAL YEAR ENDED JUNE 30, 2011
MERCER 54
5 Consultant of The Regents Report This section presents Mercer’s review of the investment performance and asset allocation of the University of California Campus Foundations for the periods ending June 30, 2011. The report is based on the investment information provided by State Street and reflects the reconciled and signed-off results of each Foundation.
ANNUAL ENDOWMENT REPORT - FISCAL YEAR ENDED JUNE 30, 2011
MERCER 55
5.1 Investment Performance Summary Uncertainty about the general economic direction, Sovereign debt concerns in Europe, the end of QE2, and the debate over the debt ceiling dominated headlines during the fiscal year. The Fed’s monetary policies stimulated market returns and made low risk assets extremely unattractive by driving real interest rates to negative levels. The stock market experienced a volatile ride, but managed to post solid returns north of 30% for US and international equities while developing markets outperformed emerging markets. Within the fixed income space, emerging market debt, high-yield bonds and international fixed income outpaced US fixed income investments. Natural resource stocks, commodity futures, private equities and REITs contributed to the performance while hedge funds lagged. The ranges of the Campus Foundations’ total return investment performance for periods ending June 30, 2011 are shown in the following graph:
UC Foundations Comparison with Mercer Trust - Foundation & Endowment Universe
Performance after fees for periods ending June 30, 2011
-6%
-4%
-2%
0%
2%
4%
6%
8%
10%
12%
14%
16%
18%
20%
22%
24%
26%
28%
30%
32%
34%
36%
Recent Quarter Calendar YTD 1 Year 3 Years 5 Years 10 Years
UCB UCD UCI UCLA UCM UCR UCSD UCSF UCSB UCSC
Maximum 25th - 50th Percentile 50th - 75th Percentile Minimum
ANNUAL ENDOWMENT REPORT - FISCAL YEAR ENDED JUNE 30, 2011
MERCER 56
Positive returns across all asset classes resulted in a solid performance for the fiscal year and continued to improve investment returns, putting the returns for all observed periods back into positive territory. However, long-term performance is still below market return expectations. On an absolute basis, San Diego and Riverside posted the best result among the Foundations for the fiscal year. Five of the ten Foundations exhibited positive excess returns relative to their respective policy benchmarks for the fiscal year. The outperformance is generally attributed to an overweight in equities and/or superior manager selection. The graph below presents the performance detail for the fiscal year ending June 2011:
Total Performance Ending June 30, 2011
-4.0%
-2.0%
0.0%
2.0%
4.0%
6.0%
8.0%
10.0%
12.0%
14.0%
16.0%
18.0%
20.0%
22.0%
Berkeley Davis Irvine UCLA Merced Riverside San Diego SanFrancisco
SantaBarbara
SantaCruz
Portfolio Return - 1 Year Variance from Benchmark - 1 Year
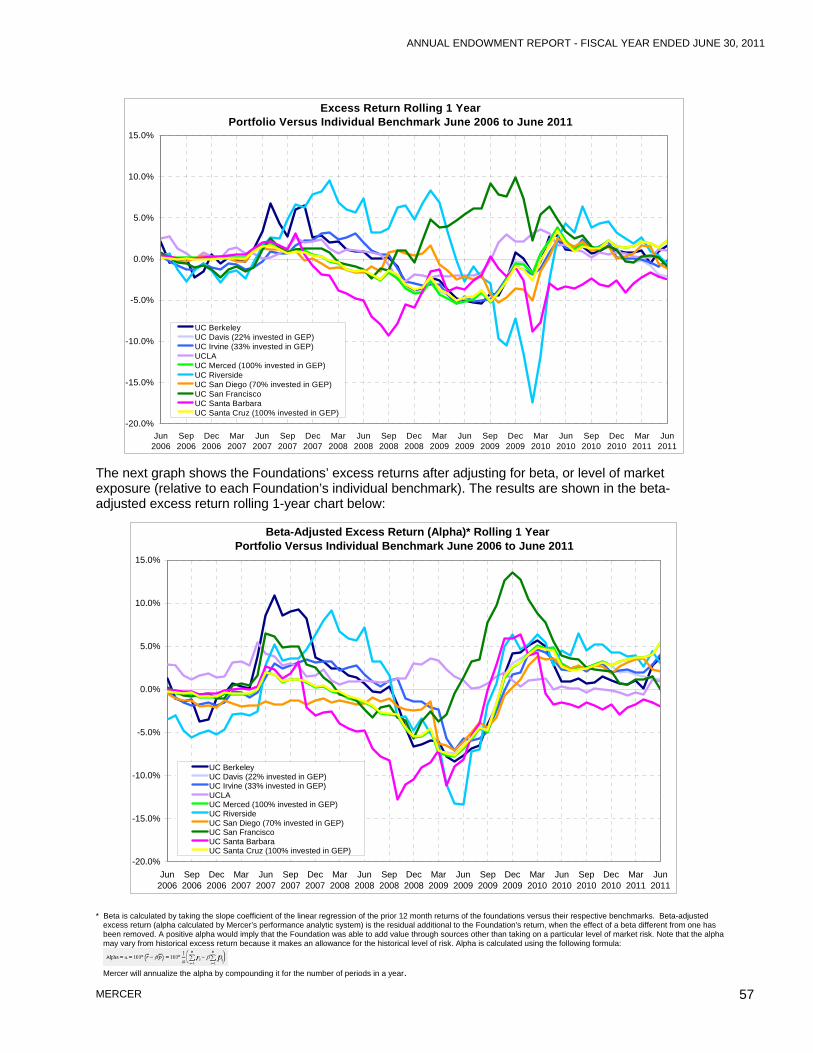
The following graph shows the performance trend of the Foundations’ excess returns over 1-year rolling periods. After a wider divergence of excess returns starting from the early market turmoil in August 2007 through June 2010, the excess returns of the ten foundations are ranging between -2.4% and 2.3% for the 1-year period ending June 2011.
ANNUAL ENDOWMENT REPORT - FISCAL YEAR ENDED JUNE 30, 2011
MERCER 57
Excess Return Rolling 1 YearPortfolio Versus Individual Benchmark June 2006 to June 2011
-20.0%
-15.0%
-10.0%
-5.0%
0.0%
5.0%
10.0%
15.0%
Jun2006
Sep2006
Dec2006
Mar2007
Jun2007
Sep2007
Dec2007
Mar2008
Jun2008
Sep2008
Dec2008
Mar2009
Jun2009
Sep2009
Dec2009
Mar2010
Jun2010
Sep2010
Dec2010
Mar2011
Jun2011
UC BerkeleyUC Davis (22% invested in GEP)UC Irvine (33% invested in GEP)UCLAUC Merced (100% invested in GEP)UC RiversideUC San Diego (70% invested in GEP)UC San FranciscoUC Santa BarbaraUC Santa Cruz (100% invested in GEP)
The next graph shows the Foundations’ excess returns after adjusting for beta, or level of market exposure (relative to each Foundation’s individual benchmark). The results are shown in the beta-adjusted excess return rolling 1-year chart below:
Beta-Adjusted Excess Return (Alpha)* Rolling 1 YearPortfolio Versus Individual Benchmark June 2006 to June 2011
-20.0%
-15.0%
-10.0%
-5.0%
0.0%
5.0%
10.0%
15.0%
Jun2006
Sep2006
Dec2006
Mar2007
Jun2007
Sep2007
Dec2007
Mar2008
Jun2008
Sep2008
Dec2008
Mar2009
Jun2009
Sep2009
Dec2009
Mar2010
Jun2010
Sep2010
Dec2010
Mar2011
Jun2011
UC BerkeleyUC Davis (22% invested in GEP)UC Irvine (33% invested in GEP)UCLAUC Merced (100% invested in GEP)UC RiversideUC San Diego (70% invested in GEP)UC San FranciscoUC Santa BarbaraUC Santa Cruz (100% invested in GEP)
* Beta is calculated by taking the slope coefficient of the linear regression of the prior 12 month returns of the foundations versus their respective benchmarks. Beta-adjusted
excess return (alpha calculated by Mercer’s performance analytic system) is the residual additional to the Foundation's return, when the effect of a beta different from one has been removed. A positive alpha would imply that the Foundation was able to add value through sources other than taking on a particular level of market risk. Note that the alpha may vary from historical excess return because it makes an allowance for the historical level of risk. Alpha is calculated using the following formula: Mercer will annualize the alpha by compounding it for the number of periods in a year.
ANNUAL ENDOWMENT REPORT - FISCAL YEAR ENDED JUNE 30, 2011
MERCER 58
Portfolio Return and Risk for 3 Years Ending June 2011
Over the last 3 years, a majority of the Foundations applied an average beta exposure below 1 which resulted in higher risk-adjusted returns due to the heightened volatility experienced during this period. Next, we analyzed the risk levels taken by the Foundations in achieving their returns. The graphs below are snapshots of each Foundation’s risk-return profile for 3 and 5 years calculated on a monthly basis:
* (Annualized) Risk is defined as the annualized standard deviation calculated using monthly observations.
The stellar performance of this fiscal year resulted in a more favorable risk-return profile in comparison with the prior year, with the Foundations achieving returns that ranged from 3.6% to 6.5% and risks that ranged from 9.6% to 13.4% for the 5-year period. The 3-year period returns increased significantly as all Foundations posted strong positive returns for the fiscal year. However, the annualized 3-year returns remained below the long-term market return expectations. We noted that Santa Barbara took on higher risk but placed above the median. In October 2007, Santa Barbara moved away from the GEP and adopted its own investment strategy, including a 42% allocation to alternative investments. The ongoing funding of the private equity, which takes time to fully implement, resulted in higher tracking error for Santa Barbara. In addition, we evaluated the portfolios’ active risk, which measures how closely the portfolio follows a specified benchmark:
Portfolio Return and Risk for 5 Years Ending June 2011
ANNUAL ENDOWMENT REPORT - FISCAL YEAR ENDED JUNE 30, 2011
MERCER 59
The previous graphs reflect the active risk and excess return of the individual portfolios when compared to their respective benchmarks over 3 and 5 years. We found that San Francisco, when compared to other foundations, achieved superior excess returns of 3.1% for 3 years and 1.8% for 5 years. Riverside realized a superior return, however, with a significant higher active risk at 7.5% for 3 years and 6.2% for 5 years. We want to emphasize that Riverside regularly changes its investment policy targets but uses a blended benchmark (71% MSCI ACWI, 29% Barclays Capital Aggregate) for its total fund calculation, resulting in a notably higher tracking error. For Santa Barbara, we observed a higher-than-average tracking error coupled with an unfavorable excess return of -2.6% for the 3-year and -2.4% for the 5-year period. In comparison to the average of the Foundations that are invested in the GEP, San Diego experienced slightly higher risks and higher returns, while UCLA achieved a better return while taking on the less risk. Santa Barbara (which started to invest outside the GEP in October 2007, and included a significant asset allocation of 42% to alternative investments) has not developed an interim benchmark. Instead, its results are measured against its long-term target benchmark, which is less comparable to institutions that have more realistic policy targets.
ANNUAL ENDOWMENT REPORT - FISCAL YEAR ENDED JUNE 30, 2011
MERCER 60
5.2 Policy Compliance Merced and Santa Cruz are invested 100% in GEP. The other 8 Foundations have implemented their own individual investment policies. As of June 30, 2011, San Diego, Irvine and Davis allocate 70%, 33% and 22% respectively to the GEP. The overview of the Foundations’ asset allocation versus the individual benchmark is presented below. We observed the following benchmark anomalies:
• The calculation of the UCLA benchmark reflects actual weights that deviate from its long-term target.
• Riverside uses a secondary blended benchmark (71% MSCI ACWI and 29% Barclays Capital Aggregate) for its total fund benchmark, which is not reflected in the chart.
Actual Asset Allocation versus Benchmark As of June 30, 2011
ANNUAL ENDOWMENT REPORT - FISCAL YEAR ENDED JUNE 30, 2011
MERCER 61
Berkeley and Davis moved to a strategy-based investment structure and implemented multi-asset class portfolios. The actual asset allocation versus benchmark is presented below:
Actual Allocation versus Benchmark As of June 30, 2011
Global Equities39.5%
Excess Return14.6%
Excess Return15.0%
Diversifying Assets17.0% Diversifying Assets
28.0%
Defensive21.1%
Defensive17.5%
L/T US Eq Growth6.5%
L/T non-US Eq Growth6.5%
Core Endowment45.6%
Core Endowment47.0%
Broad Mkt Exposure22.0%
Broad Mkt Exposure19.0%
Risk Focus19.9%
Risk Focus21.0%
Global Equities47.2%
L/T US Eq Growth6.3%
L/T non-US Eq Growth6.3%
0.0%
10.0%
20.0%
30.0%
40.0%
50.0%
60.0%
70.0%
80.0%
90.0%
100.0%
Berkeley Actual Berkeley Benchmark Davis Actual Davis Benchmark
During the fiscal year, the following Foundations changed their investment policy statements: • UC San Francisco as of May 1, 2010 – reflected in the reporting as of July 1, 2010 • UC San Diego
• as of June 11, 2010 – reflected in the reporting as of July 1, 2010 • as of May 24, 2011 – reflected in the reporting as of June 1, 2011
• UC Los Angeles • as of June 8, 2010 – reflected in the reporting as of July 1, 2010 • as of June 2, 2011 – reflected in the reporting as of June 1, 2011
• UC Irvine as of November 2010 – approved by the Board on February 16, 2011 and retroactively reflected in the reporting as of December 1, 2010
• UC Davis as of January 1, 2011 – approved by the Board on November 19, 2010 – reflected in the reporting as of January 1, 2011
• UC Riverside • as of September 1, 2010 – reflected in the reporting as of September 1, 2010 • as of January 1, 2011 – reflected in the reporting as of January 1, 2011 • as of February 1, 2011 – reflected in the reporting as of February 1, 2011 • as of June 1, 2011 – reflected in the reporting as of June 1, 2011
• UC Berkeley as of March 1, 2011 – approved by Berkeley Endowment Management Company on January 4, 2011, ratified by the University of California, Berkeley Foundation on February 25, 2011, and reflected in the reporting as of March 1, 2011
ANNUAL ENDOWMENT REPORT - FISCAL YEAR ENDED JUNE 30, 2011
MERCER 62
The following table reflects the difference between the asset allocation as of June 30, 2011, and the allocation defined in the investment policy statement for each Foundation. Any exposure outside the individual policy ranges is shaded, and the heat map on the right side shows by how much.
Over-/Underweight to Individual Foundation Policy as of June 30, 2011
UCLA’s policy has a target of 0% to cash and has no definitive range. Berkeley employed a new investment strategy as of March 1, 2011, and is in the process of moving to the new structure.
> 5%+ 4% to + 5%+ 3% to +4%+ 2% to + 3%+ 0% to + 2%Within policy ranges- 0% to -2%- 2% to -3%- 3% to -4%- 4% to -5%< 5%
% Outside the Individual Policy Range
Legend
ANNUAL ENDOWMENT REPORT - FISCAL YEAR ENDED JUNE 30, 2011
MERCER 63
5.3 Analysis and Recommendations Mercer Investment Consulting, Inc. (Mercer) as the General Investment Consultant to The Regents of the University of California has been directed by the Committee on Investments to review the Campus Foundations’ investment policies to ensure that they are consistent with industry best practices. In compliance with the Regents Policy 6201 Investment Policy for the University of California Campus Foundations, Mercer has reviewed for each Foundation:
• Investment policy and asset allocation relative to its policy • Performance by asset class and relative to its benchmarks • Asset allocation target percentages • Ranges for each asset class • Policy benchmarks for each asset class and in total • Investment guidelines for each asset class as applicable
Based on our review of the UC Campus Foundations’ investment policies above, MIC has no issues of concern to address as of June 30, 2011. Mercer supports the Regents’ investment policy for the Campus Foundations. This policy satisfies the Regents’ fiduciary responsibilities and allows the Campus Foundations to manage their assets in a manner consistent with industry best practices. In light of the recently adopted multi-asset class portfolio approach by two foundations, we would recommend an enhancement of the policy to reflect the strategy-based investment structures.
ANNUAL ENDOWMENT REPORT - FISCAL YEAR ENDED JUNE 30, 2011
MERCER 64
6 Appendix
6.1 10-Year Foundation Investment Performance.. 65 6.2 10-Year Benchmark and Active Perfomance.... 66 6.3 Investment Policies ........................................... 67 6.4 Glossary ............................................................ 68
ANNUAL ENDOWMENT REPORT - FISCAL YEAR ENDED JUNE 30, 2011
Returns shown above prior to 2006 were provided by the individual Foundations.Returns for 2006 and later were provided by State Street Bank, except in extraordinary circumstances.
Annual Total Returns - Foundations
10-Year Foundation Investment PerformancePeriods ending June 30
Average Annualized Total Returns - Foundations
Cumulative Total Returns - Foundations
ANNUAL ENDOWMENT REPORT - FISCAL YEAR ENDED JUNE 30, 2011
Returns shown above prior to 2006 were provided by the individual Foundations.Returns for 2006 and later were provided by State Street Bank, except in extraordinary circumstances.1) Arithmetic difference2) Annualized geometric difference
Annual Active Returns (Foundation minus Benchmark) 1
Average Annualized Active Returns (Foundation minus Benchmark) 2
10-Year Benchmark and Active PerformancePeriods ending June 30
Annual Total Returns - Benchmarks
ANNUAL ENDOWMENT REPORT - FISCAL YEAR ENDED JUNE 30, 2011
MERCER 67
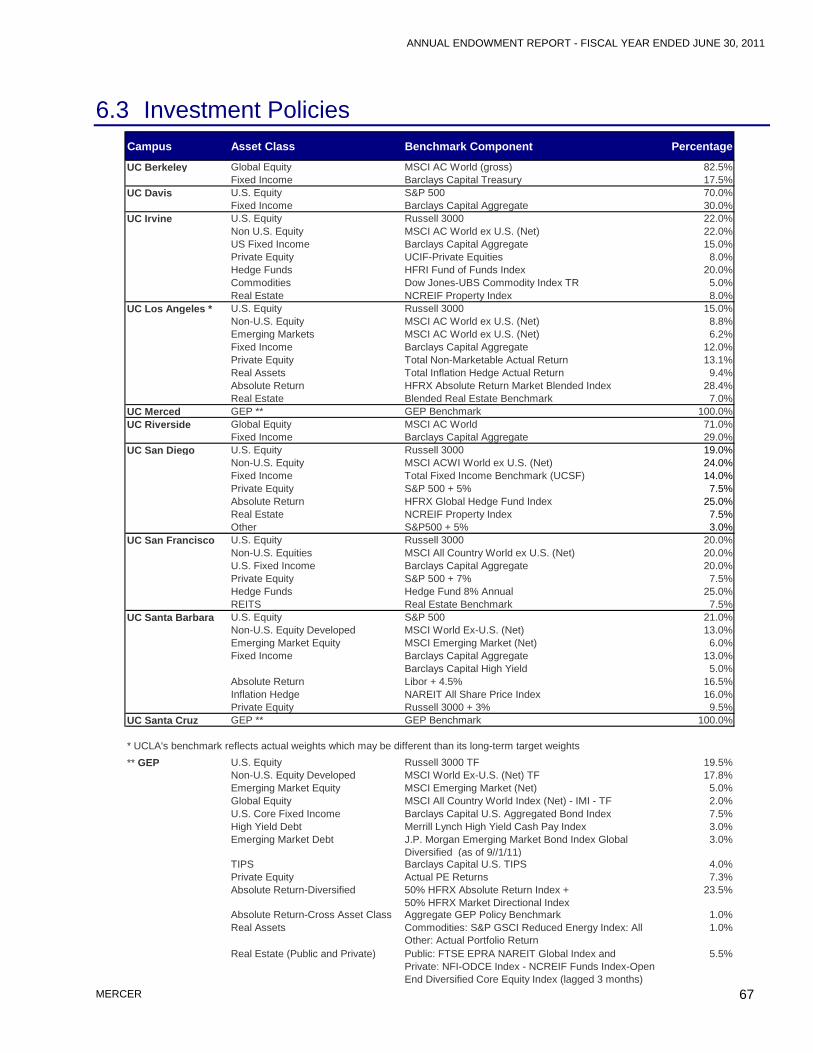
6.3 Investment Policies Campus Asset Class Benchmark Component Percentage
UC Berkeley Global Equity MSCI AC World (gross) 82.5%Fixed Income Barclays Capital Treasury 17.5%
UC Davis U.S. Equity S&P 500 70.0%Fixed Income Barclays Capital Aggregate 30.0%
UC Irvine U.S. Equity Russell 3000 22.0%Non U.S. Equity MSCI AC World ex U.S. (Net) 22.0%US Fixed Income Barclays Capital Aggregate 15.0%Private Equity UCIF-Private Equities 8.0%Hedge Funds HFRI Fund of Funds Index 20.0%Commodities Dow Jones-UBS Commodity Index TR 5.0%Real Estate NCREIF Property Index 8.0%
UC Los Angeles * U.S. Equity Russell 3000 15.0%Non-U.S. Equity MSCI AC World ex U.S. (Net) 8.8%Emerging Markets MSCI AC World ex U.S. (Net) 6.2%Fixed Income Barclays Capital Aggregate 12.0%Private Equity Total Non-Marketable Actual Return 13.1%Real Assets Total Inflation Hedge Actual Return 9.4%Absolute Return HFRX Absolute Return Market Blended Index 28.4%Real Estate Blended Real Estate Benchmark 7.0%
UC Merced GEP ** GEP Benchmark 100.0%UC Riverside Global Equity MSCI AC World 71.0%
Fixed Income Barclays Capital Aggregate 29.0%UC San Diego U.S. Equity Russell 3000 19.0%
Non-U.S. Equity MSCI ACWI World ex U.S. (Net) 24.0%Fixed Income Total Fixed Income Benchmark (UCSF) 14.0%Private Equity S&P 500 + 5% 7.5%Absolute Return HFRX Global Hedge Fund Index 25.0%Real Estate NCREIF Property Index 7.5%Other S&P500 + 5% 3.0%
UC San Francisco U.S. Equity Russell 3000 20.0%Non-U.S. Equities MSCI All Country World ex U.S. (Net) 20.0%U.S. Fixed Income Barclays Capital Aggregate 20.0%Private Equity S&P 500 + 7% 7.5%Hedge Funds Hedge Fund 8% Annual 25.0%REITS Real Estate Benchmark 7.5%
UC Santa Barbara U.S. Equity S&P 500 21.0%Non-U.S. Equity Developed MSCI World Ex-U.S. (Net) 13.0%Emerging Market Equity MSCI Emerging Market (Net) 6.0%
Barclays Capital Aggregate 13.0%Barclays Capital High Yield 5.0%
Absolute Return Libor + 4.5% 16.5%Inflation Hedge NAREIT All Share Price Index 16.0%Private Equity Russell 3000 + 3% 9.5%
UC Santa Cruz GEP ** GEP Benchmark 100.0%
** GEP U.S. Equity Russell 3000 TF 19.5%Non-U.S. Equity Developed MSCI World Ex-U.S. (Net) TF 17.8%Emerging Market Equity MSCI Emerging Market (Net) 5.0%Global Equity MSCI All Country World Index (Net) - IMI - TF 2.0%U.S. Core Fixed Income Barclays Capital U.S. Aggregated Bond Index 7.5%High Yield Debt Merrill Lynch High Yield Cash Pay Index 3.0%Emerging Market Debt J.P. Morgan Emerging Market Bond Index Global
Diversified (as of 9//1/11)3.0%
TIPS Barclays Capital U.S. TIPS 4.0%Private Equity Actual PE Returns 7.3%Absolute Return-Diversified 50% HFRX Absolute Return Index +
50% HFRX Market Directional Index23.5%
Absolute Return-Cross Asset Class Aggregate GEP Policy Benchmark 1.0%Real Assets Commodities: S&P GSCI Reduced Energy Index: All
Other: Actual Portfolio Return1.0%
Real Estate (Public and Private) Public: FTSE EPRA NAREIT Global Index and Private: NFI-ODCE Index - NCREIF Funds Index-Open End Diversified Core Equity Index (lagged 3 months)
5.5%
Fixed Income
* UCLA's benchmark reflects actual weights which may be different than its long-term target weights
ANNUAL ENDOWMENT REPORT - FISCAL YEAR ENDED JUNE 30, 2011
MERCER 68
6.4 Glossary CURRENT ASSETS Assets for use in the near term to support the overall operations of the Foundation, where the donor may, or may not, have restricted their use. These assets typically include cash, accounts receivable, notes receivable, deferred charges, amounts due, prepaid expenses, etc.
In accordance with the Support Group Policy, endowed gifts or restricted assets must be transferred to the University to be spent in accordance with the donors’ terms. However, the existing policy does not specify the timing and/or frequency of transfers. Consequently, the timing/frequency decision varies among the Foundations. ENDOWMENT ASSETS True endowments, established by donor-restricted gifts to provide a permanent source of income, and Funds Functioning as Endowments (FFEs), established by donor-restricted gifts to provide income but principal may also be expended. GENERAL ENDOWMENT POOL (GEP) Established in 1933, and unitized in 1958, the GEP is The Regents’ primary investment vehicle for endowed gift funds. The GEP is comprised of over 4,909 individual endowments that support the University’s mission. The GEP is a balanced portfolio of equities, fixed-income securities, and alternative investments in which all endowment funds participate, unless payout needs require otherwise. NON-ENDOWED ASSETS Current gift and trust/life income assets, excluding pledges. OTHER ENDOWED ASSETS Separately invested assets, mortgages, real estate, operated accounts, receivables, and others. SHORT TERM INVESTMENT POOL (STIP) The STIP is a cash investment pool established in fiscal 1976 by The Regents, in which all University fund groups participate, including retirement and endowment funds as well as campus endowment funds. Cash to meet payrolls, operating expenses, and construction funds of all the campuses and teaching hospitals of the University are the major funds invested in the STIP until expended. Pension, endowment, and defined contribution funds awaiting permanent investment are also invested in the STIP until transferred. The STIP participants are able to maximize returns on their short-term cash balances by taking advantage of the economies of scale of investing in a large cash pool. TRUSTS/LIFE ANNUITIES Assets donated by individuals or organizations, with the institution agreeing to pay a specific level of income to the donor, or designated beneficiary, for his or her lifetime. Subsequent to the beneficiary’s death, the institution gains complete ownership of the donated assets. The donor may or may not have restricted the assets’ purpose.
Services provided by Mercer Investment Consulting, Inc.
This contains confidential and proprietary information of Mercer and is intended for the exclusive use of the parties to whom it was provided by Mercer. Its content may not be modified, sold or otherwise provided, in whole or in part, to any other person or entity, without Mercer’s written permission. The findings, ratings and/or opinions expressed herein are the intellectual property of Mercer and are subject to change without notice. They are not intended to convey any guarantees as to the future performance of the investment products, asset classes or capital markets discussed. Past performance does not guarantee future results. This does not contain investment advice relating to your particular circumstances. No investment decision should be made based on this information without first obtaining appropriate professional advice and considering your circumstances.