CORPORATEGOVERNANCE and approval of annual f inancial statements
The Board subscribes to the principles of transparent
and honest corporate governance as set out in the
Code of Corporate Practices and Conduct in the King
Report (“the Code”), and in all material respects complies
with the requirements thereof. In line with their respective
codes of ethics group companies endeavour at all times
t o maintain the highest standard of integrity in dealing
with their clients, staff, shareholders and suppliers and in
doing so to ensure the largest measure of credibility, trust
and stability.
Group structurePepkor is an investment holding company with invest-
ments in listed and unlisted companies. These operating
companies have independent boards of directors on which
representatives of Pepkor serve in a non-executive capacity.
All Pepkor’s subsidiaries are committed to the principles of
sound corporate governance as contained in the Code, and
as far as practicable comply with all the essential aspects
thereof. Pepkor encourages these companies to comply
fully with the Code, and to disclose any cases in which such
compliance is not possible.
Board of directorsP e p k o r ’s Board consists of eleven directors, six of whom
hold executive positions in the group. The Chairman of the
Board is an executive director. The composition of the
Board provides for proper deliberation of all matters
requiring the Board’s attention thereby ensuring balance of
power and authority. The Board meets at least four times a
year. Particulars of the members of the Board are furnished
on page 21 of the annual report.
Audit committeeThe Pepkor audit committee, normally consisting of three
members, all of whom are non-executive directors, meets
at least twice a year in order to evaluate matters such as
accounting practices, internal control systems, auditing and
financial reporting. The audit committee is also charged
with identifying and reporting to the Board on critical
areas of risk, which includes Y2000 compliance, that have
been identified for the group in collaboration with the
management.
The audit committee functions in terms of a written
mandate from the Board, and the external auditors have
unrestricted access to the committee. Relevant members of
the executive management are also invited to attend
meetings in order to assist the committee in carrying out its
task. The audit committee receives feedback on the activities
of the audit committees of the company’s subsidiaries and
also has access to the minutes of these meetings. It is policy
that all chairmen of the audit committees of the company’s
subsidiaries be directors of P e p k o r.
Remuneration committeeThe remuneration of the executive directors is subject
t o the approval of the executive chairman of the com-
p a n y and the chairman’s salary is determined by non-
executive directors.
Employment equityThe company pursues a policy of equal opportunities and
no discrimination. Since the group’s operations are vested
in separate subsidiary companies, each of which operate in
unique circumstances, those companies implement such
staff development and affirmative action programmes as
are required by their particular circumstances and similarly
provide for employee participation.
Internal controlThe directors accept final responsibility for the internal
control systems of the group. As an investment holding
company the adequacy and effectiveness of internal
financial control is regularly appraised independently by
the audit committees of the subsidiary companies and their
external auditors. It is the management’s responsibility to
ensure that relevant legislation and regulations are
complied with and that adequate internal financial control
systems are developed and maintained in order to provide
reasonable assurance regarding:
page 35
– the completeness and accuracy of the accounting records;
– the integrity and reliability of the annual financial
statements; and
– the safeguarding of the business undertaking’s assets.
The effectiveness of any internal financial control system
depends upon strict observance of prescribed measures. Non-
observance of such measures by staff is always a risk.
Consequently even a strict internal control system can only
provide reasonable assurance as regards financial reporting
and the safeguarding of assets. An evaluation of the group’s
internal financial control systems was made on 30 June 1999,
and on the basis of this evaluation the Board is of the opinion
that the internal control systems in respect of financial
reporting and the safeguarding of assets against unauthorised
use or disposal complied with acceptable criteria.
Year 2000 complianceYear 2000 compliance is dealt with under the Financial
review which is to be found on page 22 of the annual
report.
Approval of annual financialstatementsThe responsibility for preparing and submitting the annual
financial statements was delegated to the management.
The financial statements were prepared in accordance with
generally accepted accounting practice and are in ac-
cordance with the group’s accounting records and policy
which have been applied on a consistent basis.
The directors accept final responsibility for the integrity,
objectivity and reliability of the annual financial statements
and subscribes to the concept of transparency in financial
reporting. The external auditors are responsible for
reporting on the annual financial statements. The directors
are of the opinion that the group has sufficient resources at
its disposal to carry on the undertaking in the foreseeable
future and the annual financial statements have
accordingly been prepared on a going concern basis.
The directors’ report, annual financial statements and
group annual financial statements as set out on pages 37 to
59 have been approved by the Board.
Signed on behalf of the Board of Directors
C H Wiese
Chairman
C Moore
Financial director
25 August 1999
page 36
Report of the independent auditorsto the members of Pepkor LimitedWe have audited the annual financial statements and group
annual financial statements set out on pages 37 to 59 for the
year ended 30 June 1999. These financial statements are the
responsibility of the directors of the company. Our
responsibility is to express an opinion on these financial
statements based on our audit.
ScopeWe conducted our audit in accordance with statements of
South African Auditing Standards. These standards
require that we plan and perform the audit to obtain
reasonable assurance that the financial statements are free
of material misstatement. An audit includes
• examining, on a test basis, evidence supporting the
amounts and disclosures included in the financial
statements;
• assessing the accounting principles used and significant
estimates made by management; and
• evaluating the overall financial statement presentation.
We believe that our audit provides a reasonable basis for
our opinion.
Audit opinionIn our opinion, the financial statements fairly present, in all
material respects, the financial position of the company and
the group at 30 June 1999 and the results of their operations
and cash flows for the year then ended in accordance with
generally accepted accounting practice and in the manner
required by the Companies Act.
PricewaterhouseCoopers Inc.
Registered Accountants and Auditors
Chartered Accountants (SA)
Bellville
25 August 1999
AUDITORS’REPORT
CURRENCY OF ANNUALFINANCIAL STATEMENTS
The annual financial statements are expressed in South African Rand. The approximate Rand cost of a unit of thefollowing currencies at year-end was:
1999 1998
USA Dollar 6,06 5,87Pound Sterling 9,66 9,77Australian Dollar 4,02 3,73German Mark 3,29 3,24Japanese Yen (100) 4,99 4,22
page 37
DIRECTORS’REPORT
Pepkor Limited and its sub sidiaries
Share capitalDuring January 1999, 5 758 782 shares have been issued at
a premium of 1 995 cents per share in settlement of the
purchase price at the acquisition of the shares in Pep
Limited held by minority shareholders, resulting in Pep
Limited becoming a wholly-owned subsidiary.
Full details of the company’s authorised and issued share
capital are set out in the notes to the annual financial
statements.
Business of the groupPepkor Limited is an investment holding company with
investments in subsidiaries and associated companies and
at year-end the company controlled mainly the following
investments:
Subsidiaries– Pep Limited
Pep Stores retailing for cash clothing, footwear,
blankets and household softs/hardware from premises
situated in the Republic of South Africa, Namibia,
Botswana, Lesotho, Swaziland, Zambia, Mozambique
and Ghana.
Power Sales retailing for cash clothing, footwear,
blankets and household textiles from premises situated
i n Zimbabwe.
Pep Manufacturing, manufacturing operations
situated in the Western Cape as well as in Malawi,
allied to the clothing retail.
– Shoprite Holdings Limited
Shoprite Checkers retailing for cash food, clothing and
household softs/hardware from premises situated in
the Republic of South Africa, Botswana, Zambia,
Mozambique and Namibia.
OK Bazaars and Hyperama retailing for cash food,
clothing and household softs/hardware and on credit
in household furniture from premises situated in the
Republic of South Africa, Lesotho and Swaziland.
Shoprite Checkers Properties which owns fixed property
in the Republic of South Africa, Namibia, Zambia
a n d Mozambique strategic to the group’s activities.
– Ackermans Limited
Ackermans retailing for cash clothing, footwear, blankets
and household softs/hardware from premises situated in
the Republic of South Africa, Namibia, Botswana,
Swaziland, Lesotho, Zambia and Mozambique.
– Brown & Jackson plc
Poundstretcher and What Everyone Wants retailing for
cash clothing, toiletries and household softs from
premises situated in the United Kingdom.
Your More Store retailing for cash clothing, footwear,
blankets and household softs/hardware from premises
situated primarily in Scotland.
– Cashbuild Limited
Cashbuild retailing for cash building materials from
premises situated in the Republic of South Africa,
Botswana, Lesotho, Namibia and Swaziland.
– Stuttafords
Stuttafords retailing on credit and for cash, clothing
and household softs/hardware from premises situated
in the Republic of South Africa.
– Best & Less
Best & Less retailing for cash, clothing and household
textiles from premises situated in Australia.
– Sundry
Pepkorfin, which renders certain head office services
in the group.
Associated companies– Retail Apparel Group Limited
Smart Centre, Bee Gee, Guys & Girls, Patrick Daniel
and Arthur Kaplan Jewellers, retailing on credit and
for cash, clothing, footwear, household softs and
jewellery from premises situated in the Republic of
South Africa, Namibia, Mozambique, Lesotho,
Zambia and Botswana.
page 38
Pepkor Limited and its sub sidiaries
Pepkor Limited’s interest in its subsidiaries and associated
companies, as well as their individual activities, is set out in
the annual financial statements.
Group resultsEarningsAfter taking into account the income of associated
companies and outside shareholders’ interest, the group
achieved earnings per share, before exceptional items, of
125,1 cents (1998: 151,8 cents).
Details of the results of Pepkor Limited and the group are
contained in the income statement.
The attributable interest of Pepkor Limited in the taxed
profits and losses, after exceptional items, of its subsidiaries
for the year was as follows:
1999 1998
Total profits R532,8 million R439,0 million
Total losses R345,2 million R145,5 million
DividendsAn interim dividend of 40 cents (1998: 36 cents) per share
w a s paid on 26 March 1999. A final dividend of 10 c e n t s
( 1 9 9 8 : 14 cents) per share is payable on 23 September 1999 to
shareholders registered in the company’s register at the close
of business on Friday, 10 September 1999. This brings the total
dividend for the year to 50 cents (1998: 5 0 cents) per share.
DirectorateThe names of the directors are listed elsewhere in the annual
report. On 1 February 1999 Mr T R Hlongwane was
appointed as a director. Mr J F le Roux resigned as a director
on 30 May 1999, whereas Mr M G Loubser retired as a
director on 30 June 1999.
In terms of the articles of association of the company
M e s s r s J W B a s s o n , J J Fouché, T R Hlongwane and W C
van der Merwe retire as directors of the company at the
annual general meeting, but being eligible offer themselves
for re-election.
At 30 June 1999 the directors of Pepkor Limited held a
direct interest of 0,1% (1998: 0,1%) and an indirect, non-
beneficial interest of 0,4% (1998: 0,7%) of the issued share
capital of the company. Indirect holdings through listed
companies have not been included. No material change in
the shareholding of directors has occurred between the end
of the financial year and the date of this report.
Holding companyThe company’s holding company is Pepgro Limited.
SecretaryThe name and address of the secretary appear elsewhere in
the annual report.
DIRECTORS’REPORT
page 39
ACCOUNTINGPOLICIES
Pepkor Limited and its sub sidiaries for the year ended 30 June 1999
The annual financial statements are prepared on thehistorical cost basis, with the exception of certain
fixed assets which are adjusted for revaluations as detailedb e l o w, and incorporate the following principal policieswhich are in all respects consistent with those of theprevious year:
1. Consolidated annual financial statementsThe consolidated annual financial statements includethe accounts of the company and all its subsidiaries.The excess of cost over net asset value at the date ofacquisition of interests in subsidiaries is written offagainst retained income.
2. Associated companiesAll companies, except subsidiaries, in which the grouphas a long-term interest and where it has the ability toexercise significant influence over financial andoperating decision making, are regarded as associatedcompanies and being equity accounted. The excess ofcost over net asset value at the date of acquisition ofinterests in associated companies is written off againstretained income.
3. Foreign currencyAmounts in foreign currency, resulting from trading,are converted to Rand at the contracted exchange rate.Exchange rate differences which occur at settlemento r conversion are fully accounted for in the incomestatement in the period in which it occurred.
4. Foreign subsidiariesAssets and liabilities of foreign subsidiaries areconverted to Rand at the exchange rates ruling at year-end, whereas their income statement and cash flowstatement items are converted to Rand at weightedaverage rates of exchange during the financial year.Differences arising on conversion are taken directly tonon-distributable reserves.
5. TurnoverTurnover of the group is the total of all sales of thec o m p a n y ’s subsidiaries, after elimination of inter-group sales.
6. IncomeSome subsidiaries sell household furniture on instalmentsale agreement. Profit on instalment sale agreements isaccounted for on the date of sale. Financing income isrecognised as income on the sum of digits method.
7. Deferred taxationDeferred taxation is provided at prevailing rates on thecomprehensive basis on all timing differences, aftertaking into account estimated or assessed losses.Deferred taxation debits are only created to the extentthat it does not result in a net deferred taxation debit.
8. Fixed assetsLand and buildings are regarded as investment pro-perties and reflected at cost or valuation. Land andbuildings are not depreciated.M a c h i n e r y, equipment, vehicles and aircraft are de-preciated at rates appropriate to the various classeso f assets involved, taking into account the estimateduseful life of the individual items.Improvements to leasehold property are carried at costand written off over the period of the lease.Assets obtained in terms of finance lease agreementsare capitalised.Fixed assets are depreciated over the following periods:Machinery: 3 to 10 yearsEquipment: 3 to 10 yearsVehicles: 3 to 5 yearsAircraft: 25 years
9. Bank balancesActual bank balances are reflected. Outstandingcheques are included in accounts payable andprovisions and outstanding deposits in bank balancesand cash.
10.InventoriesInventories are valued at the lower of cost or netrealisable value. Cost for the group is determined onthe following bases:– Raw material
The lower of a predetermined standard cost oractual cost.
– Work in progressDirect costs which include raw material, directlabour and attributable production overheads.
– MerchandiseManufactured in the group’s factories:Direct costs which include raw material, directlabour and attributable production overheads.Purchased from other suppliers:Average cost less an adjustment for obsolete andslow moving inventories.
– Goods in transitInvoice value of raw material and merchandise notyet received.
– Consumable goodsActual cost.
The basis of determining cost by some of the non-RSAsubsidiaries is the last-in-first-out-method, but is ad-justed for the group to the abovementioned bases ofvaluation. The group’s interest in the profit after taxation,resulting from the adjustment originating outside theRSA, is transferred to non-distributable reserves.
page 40
Pepkor Limited and its subsidiaries for the y ear ended 30 June
109 292 110 968 Dividends distributed to ordinary shareholders 110 968 109 292Excess of cost over net asset value onacquisition of interests in subsidiariesand associated companies written off 76 162 511 287Transfer (from)/to non-distributable reserves 7 (42 893) 33 476
462 280 438 539 Retained income at end of the year 378 499 316 570
Earnings per share (cents)– before exceptional items 8.1 125,1 151,8– after exceptional items 8.2 94,1 159,5– headline earnings 8.3 124,1 157,8Dividend (cents per share) 50,0 50,0
– – Net movement in bank balances and cash 685 493 (119 484)
Change in bank balances and cashBalance at beginning of the year 693 555 654 737Net movement 685 493 (119 484)Obtained with take-overs – 162 507Decrease on disposal of operations – (4 205)
Balance at end of the year 1 379 048 693 555
page 43
NOTES TO THE ANNUALFINANCIAL STATEMENTS
Pepkor Limited and its subsidiaries for the y ear ended 30 June
COMPANY GROUP1998 1999 1999 1998
R’000 R’000 R’000 R’000
1. Operating profitDetermined after taking into account thefollowing expenditure:Cost of sales 21 755 624 17 194 650Depreciation of fixed assets 380 769 301 957Operating lease – land and buildings 933 999 727 662
76 112 Directors’ remuneration
87 147 For services as directors14 475 18 259 For full-time management
14 562 18 406(14 486) (18 294) Paid by subsidiaries
Dividends – listed investments 418 507Interest paid on loan against investment – (4 200)
139 793 88 126 222 515 149 111
– 3 2.2 Interest paid 301 748 131 088
(139 793) (88 123) 2.3 Total 79 233 (18 023)
2.4 During the period under review interest in the amount of R88 565 000 has been received in respect of amounts owing by share incentive trusts, whereas these loans did not exist on30 June 1999 any more. A corresponding amountof interest is included in interest paid.
page 44
Pepkor Limited and its subsidiaries for the y ear ended 30 June
COMPANY GROUP1998 1999 1999 1998
R’000 R’000 R’000 R’000
NOTES TO THE ANNUALFINANCIAL STATEMENTS
3. Exceptional itemsNet (loss)/profit on disposal of investments (11 635) 25 192Payment of import levies in respect of previous financial periods (90 894) –Profit at the cancellation of lease agreements 22 084 4 361(Loss)/profit on disposal of land and buildings (1 145) 4 329Provision for store closure written back 15 142 –Impairment write-off on fixed assets – (26 624)
(1 157) – Provision against interest in subsidiariesOther 1 577 (3 512)
4. Income of associated companiesDividends received 6 527 –Attributable (loss)/profit before taxation (4 793) 35 386Attributable exceptional items before taxation (830) –
141 121 The utilisation of the tax relief of 498 738 613 828
calculated at current tax rates on the netcalculated tax losses is dependent on sufficient future taxable income in thecompanies concerned.
5.6 Credits in respect of secondary tax on 5 561 – companies (STC) at year-end 41 036 84 456
695 – The utilisation of the STC relief of 5 130 10 557
calculated at current rates is dependent onthe future distribution of dividends in thecompanies concerned.
The distribution of dividends from reserveswill result in STC at 12,5%. No provision forSTC on dividends from reserves is made asit is not envisaged that dividends will bedeclared from these reserves.
Pepkor Limited and its subsidiaries for the y ear ended 30 June
COMPANY GROUP1998 1999 1999 1998
R’000 R’000 R’000 R’000
NOTES TO THE ANNUALFINANCIAL STATEMENTS
7. Transfer (from)/to non-distributable reservesAttributable retained income of associatedcompanies (36 366) 35 082Foreign currency translation reserve (7 433) –LIFO reserve in respect of non-RSA subsidiaries 873 1 930Capital redemption reserve fund 33 –Surplus on revaluation of land and buildings – (3 536)
(42 893) 33 476
8. Earnings per share8.1 Before exceptional items:
Based on net profit of 274 031 326 995
and the weighted average number of sharesin issue of (’000) 219 057 215 462
8.2 After exceptional items:Based on net profit of 206 166 343 563
and the weighted average number of shares in issue of (’000) 219 057 215 462
8.3 Headline earnings:Based on headline earnings of 271 912 340 037
Net profit 206 166 343 563Attributable exceptional items (refer 3) 67 865 (16 568)(Profit)/loss on sale and scrapping of fixed assets after taxation and outside shareholders’interest (2 119) 13 042
and the weighted average number of sharesin issue of (’000) 219 057 215 462
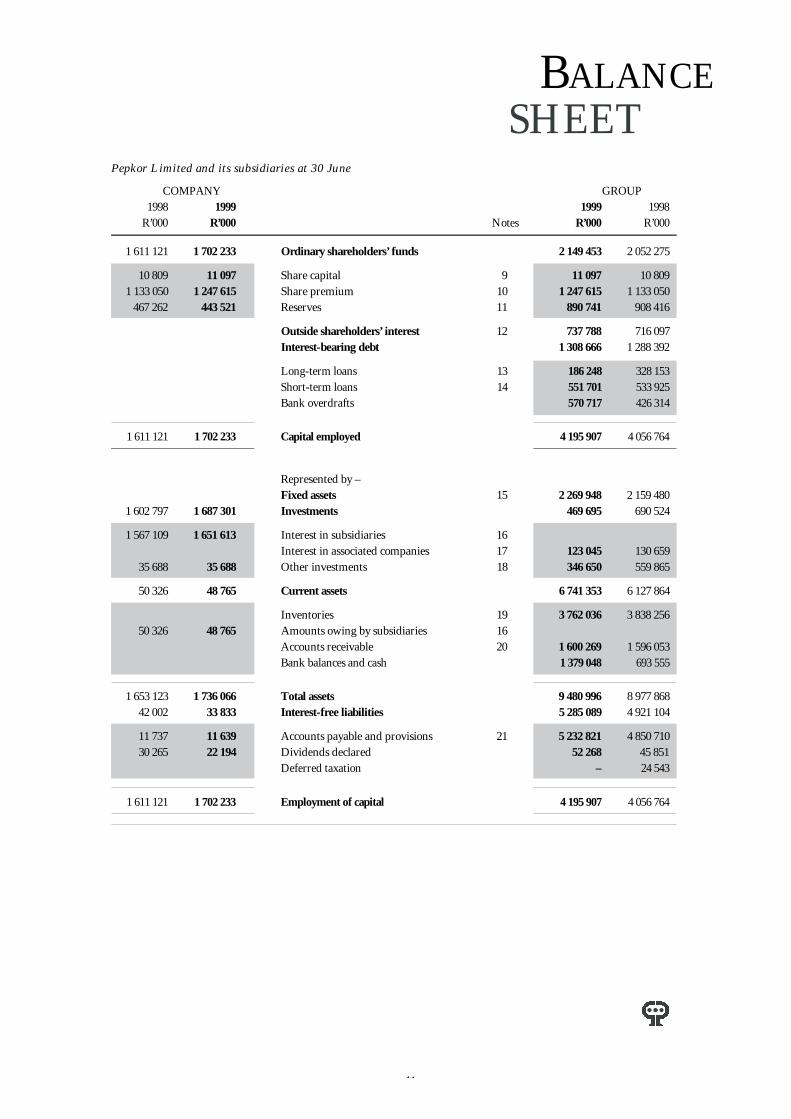
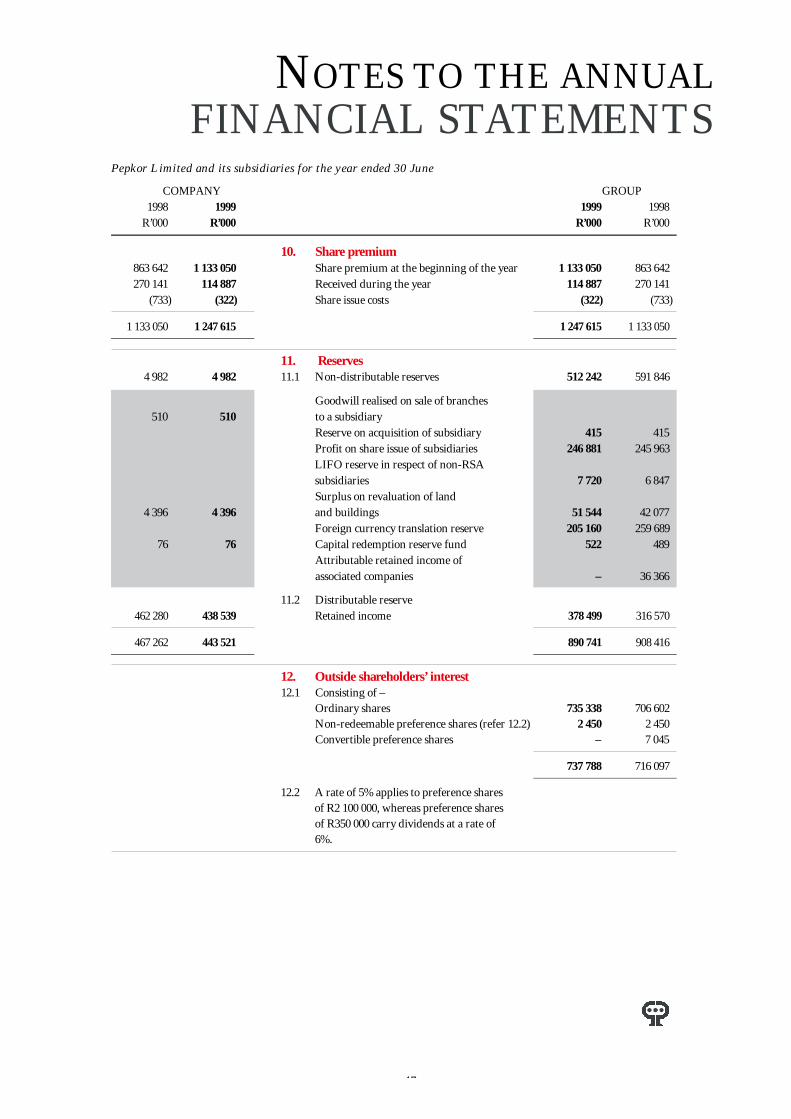
10 809 11 097 shares of 5 cents each 11 097 10 809
9.3 The unissued share capital is under the controlof the directors who may issue it on suchterms and conditions as they in their discretiondeem fit.
page 47
NOTES TO THE ANNUALFINANCIAL STATEMENTS
Pepkor Limited and its subsidiaries for the y ear ended 30 June
COMPANY GROUP1998 1999 1999 1998
R’000 R’000 R’000 R’000
10. Share premium863 642 1 133 050 Share premium at the beginning of the year 1 133 050 863 642270 141 114 887 Received during the year 114 887 270 141
Goodwill realised on sale of branches 510 510 to a subsidiary
Reserve on acquisition of subsidiary 415 415Profit on share issue of subsidiaries 246 881 245 963LIFO reserve in respect of non-RSA subsidiaries 7 720 6 847Surplus on revaluation of land
12.2 A rate of 5% applies to preference shares of R2 100 000, whereas preference sharesof R350 000 carry dividends at a rate of6%.
page 48
Pepkor Limited and its subsidiaries for the y ear ended 30 June
COMPANY GROUP1998 1999 1999 1998
R’000 R’000 R’000 R’000
NOTES TO THE ANNUALFINANCIAL STATEMENTS
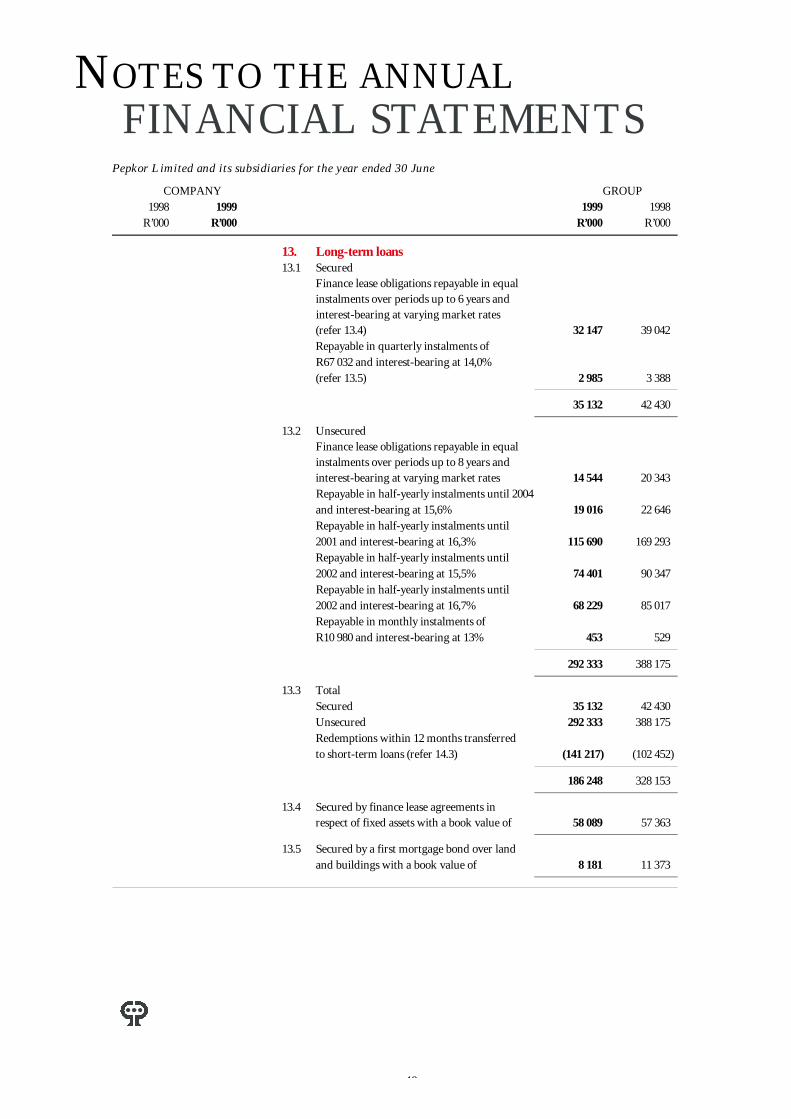
13. Long-term loans13.1 Secured
Finance lease obligations repayable in equalinstalments over periods up to 6 years andinterest-bearing at varying market rates(refer 13.4) 32 147 39 042Repayable in quarterly instalments ofR67 032 and interest-bearing at 14,0% (refer 13.5) 2 985 3 388
35 132 42 430
13.2 UnsecuredFinance lease obligations repayable in equalinstalments over periods up to 8 years andinterest-bearing at varying market rates 14 544 20 343Repayable in half-yearly instalments until 2004and interest-bearing at 15,6% 19 016 22 646Repayable in half-yearly instalments until2001 and interest-bearing at 16,3% 115 690 169 293Repayable in half-yearly instalments until2002 and interest-bearing at 15,5% 74 401 90 347Repayable in half-yearly instalments until2002 and interest-bearing at 16,7% 68 229 85 017Repayable in monthly instalments ofR10 980 and interest-bearing at 13% 453 529
15.1.2 Improvements to leasehold propertyCost 292 357 259 202Amounts written off 100 921 75 732
191 436 183 470
15.1.3 Land and buildingsAt cost 483 089 636 053At valuation 313 090 135 449
796 179 771 502
A register containing details is available forinspection at the registered office of the company.The directors are of the opinion that the market value of land and buildings, which are notdepreciated, exceeds its book value.
15.1.4 Total 2 153 550 2 036 076
page 50
Pepkor Limited and its subsidiaries for the year ended 30 June
COMPANY GROUP1998 1999 1999 1998
R’000 R’000 R’000 R’000
NOTES TO THE ANNUALFINANCIAL STATEMENTS
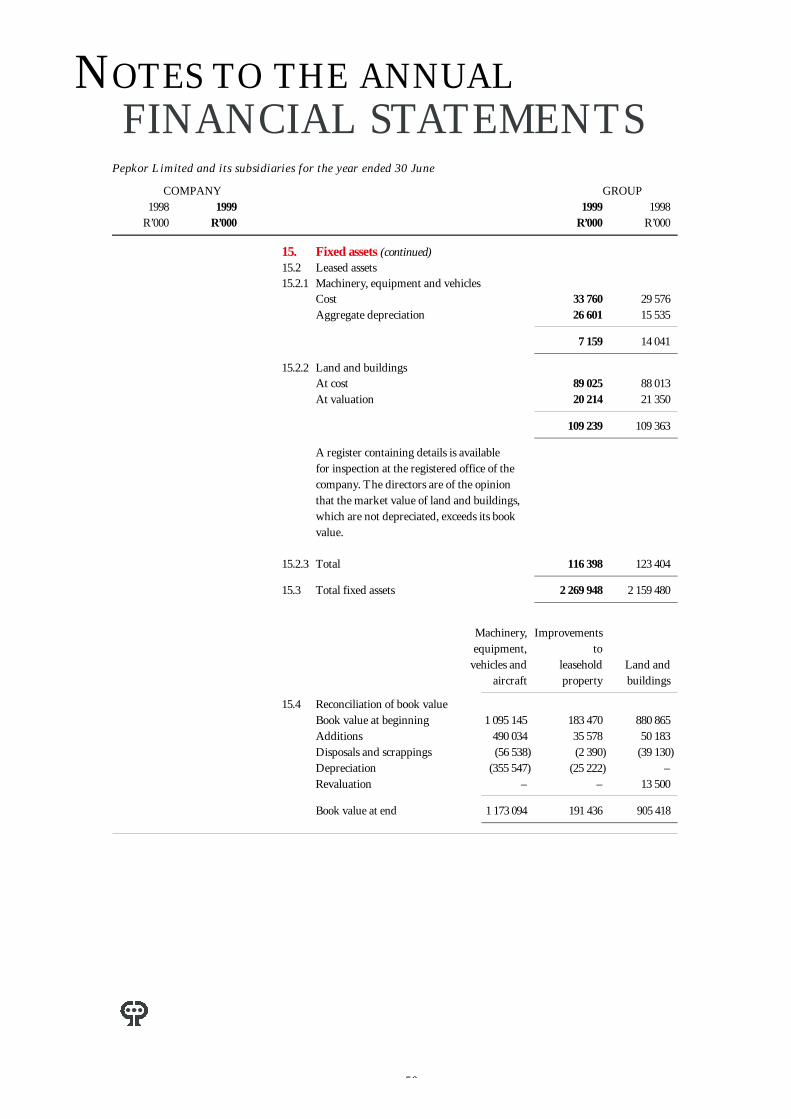
15. Fixed assets (continued)15.2 Leased assets15.2.1 Machinery, equipment and vehicles
15.2.2 Land and buildingsAt cost 89 025 88 013At valuation 20 214 21 350
109 239 109 363
A register containing details is available for inspection at the registered office of the company. The directors are of the opinion that the market value of land and buildings, which are not depreciated, exceeds its book value.
15.2.3 Total 116 398 123 404
15.3 Total fixed assets 2 269 948 2 159 480
Machinery, Improvementsequipment, to
vehicles and leasehold Land andaircraft property buildings
15.4 Reconciliation of book valueBook value at beginning 1 095 145 183 470 880 865Additions 490 034 35 578 50 183Disposals and scrappings (56 538) (2 390) (39 130)Depreciation (355 547) (25 222) –Revaluation – – 13 500
Book value at end 1 173 094 191 436 905 418
page 51
NOTES TO THE ANNUALFINANCIAL STATEMENTS
Pepkor Limited and its subsidiaries for the y ear ended 30 June
COMPANY GROUP1998 1999 1999 1998
R’000 R’000 R’000 R’000
16. Interest in subsidiaries16.1 Consisting of –
947 735 947 735 Shares at cost714 936 797 879 Amounts owing(45 236) (45 236) Provision against interest in subsidiaries
1 617 435 1 700 378(50 326) (48 765) Current accounts transferred to current assets
1 567 109 1 651 613
16.2 The company has granted an option in termsof which 20 202 020 Shoprite Holdings Limited shares can be sold to the company within 2 yearsfor an amount of R228 771 000, which amountescalates annually by approximately 12,0%.
16.3 The company has granted an option in termsof which 2 600 000 Cashbuild Limited sharescan be sold to the company within 4 years foran amount of R10 970 000, which amountescalates annually by approximately 11,3%.
17. Interest in associated companies17.1 Net asset value at acquisition of interest 106 376 108 762
19.2 The following amounts have been includedat net realisable value:Raw material 3 256 913Work in progress 562 94Merchandise 749 291 724 457Goods in transit 485 –Consumable goods 60 –
753 654 725 464
20. Accounts receivableTrade accounts, less provision fordoubtful debts 896 702 1 054 817Other debtors and debit balances,including payments in advance 703 567 541 236
1 600 269 1 596 053
page 53
NOTES TO THE ANNUALFINANCIAL STATEMENTS
Pepkor Limited and its subsidiaries for the y ear ended 30 June
COMPANY GROUP1998 1999 1999 1998
R’000 R’000 R’000 R’000
21. Accounts payable and provisions10 744 10 646 Creditors and accrued expenses 5 188 232 4 821 317
993 993 Taxation payable 44 589 29 393
11 737 11 639 5 232 821 4 850 710
22. Cash flow information22.1 Non-cash items
Depreciation 380 769 301 957(Profit)/loss on sale and scrappingof fixed assets (5 794) 21 837Foreign currency translation differences (54 529) 148 189
320 446 471 983
22.2 Decrease/(increase) in working capitalInventories 76 220 (181 098)Accounts receivable (4 216) (303 785)
134 (98) Creditors and accrued expenses 366 915 368 434
134 (98) 438 919 (116 449)
22.3 Taxation paidTaxation per income statement (40 055) (35 094)
(1) – Increase/(decrease) in taxation payable 15 196 (66 775)Decrease in deferred taxation (24 543) (13 211)
(1) – (49 402) (115 080)
22.4 Investment activitiesAcquisition of fixed assets (575 795) (844 438)Proceeds on disposal of fixed assets 102 707 220 751
122 370 31 910 Decrease in amounts owing by subsidiariesAcquisition of further interests in existing
(153 476) – subsidiaries (2 451) (47 702)Acquisition of shares in associated companies (234) (13 102)Acquisition of unlisted investments (103 312) (13 988)Proceeds on disposal of shares inassociated companies 1 933 42 000Proceeds on disposal of unlisted investments 94 882 130 800Decrease/(increase) in amounts owingby share incentive trusts 216 110 (160 196)Proceeds on disposal of listed investments – 9 609Cost at acquisition of operations – (439 608)Other investment activities (4 982) (203)
(31 106) 31 910 (271 142) (1 116 077)
page 54
Pepkor Limited and its subsidiaries for the y ear ended 30 June
COMPANY GROUP1998 1999 1999 1998
R’000 R’000 R’000 R’000
NOTES TO THE ANNUALFINANCIAL STATEMENTS
23. Contingent liabilities23.1 Guarantees issued in respect of debt of –
23.2 The company also guarantees the obligationsof certain subsidiaries in terms of leaseagreements in respect of land and buildings.
24. Capital commitmentsContracted for 341 426 91 740Not contracted for 519 988 448 421
861 414 540 161
Commitments for the 12 months afterthe accounting date 689 323 520 161Commitments for succeeding years 172 091 20 000
861 414 540 161
Funds to meet this expenditure will beprovided from the company and group’sown resources and by borrowings.
25. Borrowing powersIn terms of the articles of association of the company, the borrowing powers of PepkorLimited are unlimited.
26. Financial instrumentsFinancial instruments, other than derivatives,consist of investments, loans, accounts receivable,bank balances and cash and accounts payableresulting from normal business transactions.Except for the total exposure represented bythe respective balance sheet items, no otherexceptional concentration of risk has beenincluded. Funds are invested at banks withacceptable credit ratings only and accountsreceivable comprise a wide spread client base,which is subject to stringent credit approvaland control.The group is exposed to interest rate risk dueto the extent of borrowings and market relatedinterest rate arrangements, with the exceptionof debt in the amount of R342 065 000, whichbears interest at fixed rates.
page 55
NOTES TO THE ANNUALFINANCIAL STATEMENTS
Pepkor Limited and its subsidiaries for the year ended 30 June
26. Financial instruments (continued)The group has no risk of illiquidity due tounutilised banking facilities and unlimitedborrowing powers.
Derivative instruments, in the form of forwardforeign exchange contracts, are being applied,subject to the risk assessment of management,to hedge against the currency risk in respect offoreign liabilities. Derivative instruments havealso been applied to hedge against interest rate riskin respect of debt of R342 065 000.
The book value of financial instrumentsapproximate the fair values thereof with theexception of listed investments.
27. Related partiesRelated party relationships exist between thecompany, its holding company, subsidiaries,associated companies and the directors of thecompany. All intergroup transactions have beeneliminated in the annual financial statements andthere are no other material transactions withrelated parties. Details of the remuneration of thedirectors and their shareholding, are disclosedelsewhere in the annual financial statements.
28. Retirement benefits28.1 Pension fund/provident fund
The group provides retirement benefits to morethan half of its employees through monthlycontributions to various pension and providentfunds, which contributions are charged to income.
Al funds are subject to the Pension Fund Act,1956, and the pension funds are required to beactuarially valued every 3 years. Except for fourfunds to which no new members are admitted, allfunds are defined contribution plans.
According to the latest actuarial valuations, thefunds are financially sound.
28.2 Medical aidAlthough there are no contractual obligations,certain group companies provide post-retirementmedical benefits by funding a portion of themedical aid contributions of pensioners. Fullprovision for this expense is made with referenceto actuarial valuations in respect of future medicalcontributions. At year-end the total provision forpost-retirement medical benefits amounts to 194 160 165 212
COMPANY GROUP1998 1999 1999 1998
R’000 R’000 R’000 R’000
page 56
Pepkor Limited and its subsidiaries for the y ear ended 30 June
COMPANY GROUP1998 1999 1999 1998
R’000 R’000 R’000 R’000
NOTES TO THE ANNUALFINANCIAL STATEMENTS
29. Share incentive schemes29.1 In terms of the rules of the Pepkor Limited Share
Incentive Trust the trustees are empowered toacquire and allocate shares and to grant shareoptions, which in total may not exceed 5% of theissued share capital of the company.
The movements during the accounting periodNumber of shares were as follows:
321 941 277 574 Balance at beginning of the period(44 367) (257 574) Shares released to employees
277 574 20 000
29.2 In terms of the rules of the Pep Limited ShareIncentive Trust the trustees are empowered toacquire and allocate shares and to grant shareoptions, which in the case of Pepkor Limited,together with the shares held by the PepkorLimited Share Incentive Trust, may not exceed5% of the issued share capital of that company.In the case of Pepgro Limited, a limit of 5% of theissued share capital of that company also applies,added to the shares held by the Pepgro LimitedShare Incentive Trust.
The movements during the accounting periodNumber of shares for shares in Pepkor Limited were as follows:
– – Balance at beginning of the period– 622 560 Shares obtained with delisting of Pep Limited– 5 037 700 Shares acquired– (54 800) Shares released to employees– (74 600) Shares disposed of
– 5 530 860
The movements during the accounting periodNumber of shares for shares in Pepgro Limited were as follows:
– – Balance at beginning of the period– 9 181 346 Shares acquired
– 9 181 346
page 57
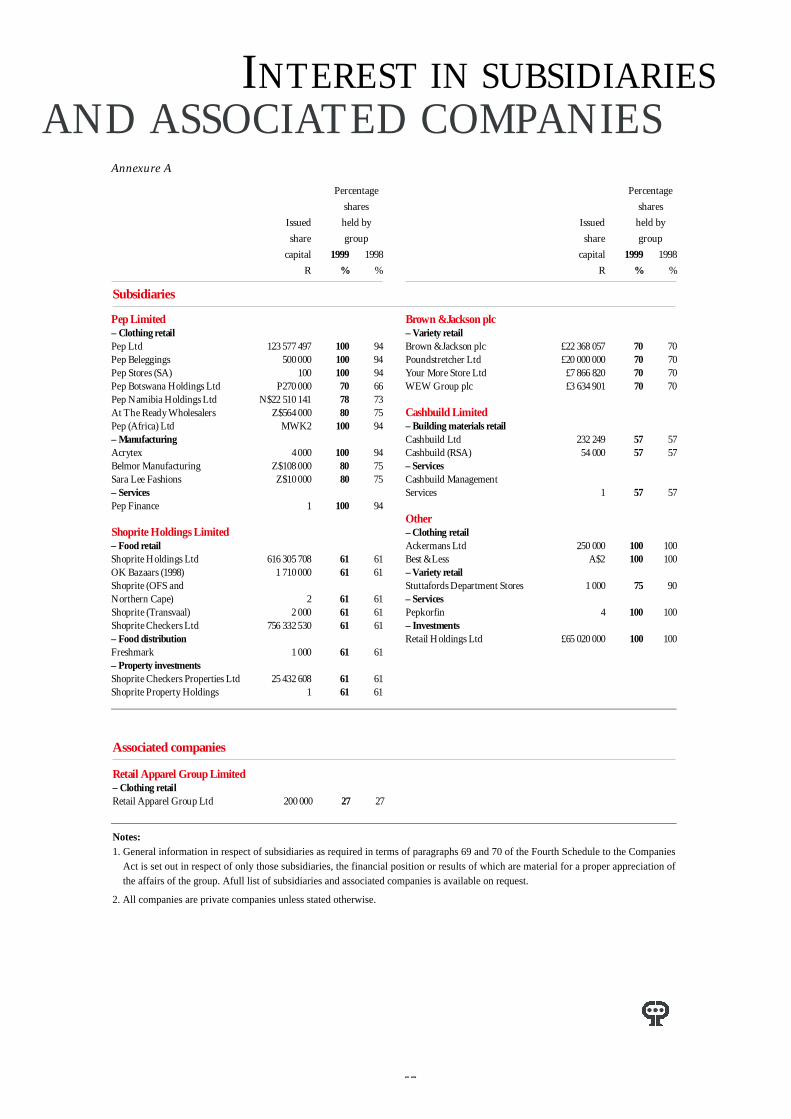
INTEREST IN SUBSIDIARIESAND ASSOCIATED COMPANIES
Annexure A
Percentage
shares
Issued held by
share group
capital 1999 1998
R % %
Percentage
shares
Issued held by
share group
capital 1999 1998
R % %
Brown & Jackson plc– Variety retailBrown & Jackson plc £22 368 057 7 0 7 0Poundstretcher Ltd £20 000 000 7 0 7 0Your More Store Ltd £7 866 820 7 0 7 0WEW Group plc £3 634 901 7 0 7 0
Cashbuild Limited– Building materials retailCashbuild Ltd 232 249 5 7 5 7Cashbuild (RSA) 54 000 5 7 5 7– ServicesCashbuild Management S e r v i c e s 1 5 7 5 7
O t h e r– Clothing retailAckermans Ltd 250 000 1 0 0 1 0 0Best & Less A $ 2 1 0 0 1 0 0– Variety retailStuttafords Department Stores 1 000 7 5 9 0– ServicesP e p k o r f i n 4 1 0 0 1 0 0– InvestmentsRetail Holdings Ltd £65 020 000 1 0 0 1 0 0
Subsidiaries
Associated companies
Pep Limited– Clothing retailPep Ltd 123 577 497 1 0 0 9 4Pep Beleggings 500 000 1 0 0 9 4Pep Stores (SA) 100 1 0 0 9 4Pep Botswana Holdings Ltd P270 000 7 0 6 6Pep Namibia Holdings Ltd N$22 510 141 7 8 7 3At The Ready Wholesalers Z$564 000 8 0 7 5Pep (Africa) Ltd M W K 2 1 0 0 9 4– ManufacturingA c r y t e x 4 000 1 0 0 9 4Belmor Manufacturing Z$108 000 8 0 7 5Sara Lee Fashions Z$10 000 8 0 7 5– ServicesPep Finance 1 1 0 0 9 4
Shoprite Holdings Limited– Food retailShoprite Holdings Ltd 616 305 708 6 1 6 1OK Bazaars (1998) 1 710 000 6 1 6 1Shoprite (OFS and Northern Cape) 2 6 1 6 1Shoprite (Tr a n s v a a l ) 2 000 6 1 6 1Shoprite Checkers Ltd 756 332 530 6 1 6 1– Food distributionF r e s h m a r k 1 000 6 1 6 1– Property investmentsShoprite Checkers Properties Ltd 25 432 608 6 1 6 1Shoprite Property Holdings 1 6 1 6 1
Notes:1. General information in respect of subsidiaries as required in terms of paragraphs 69 and 70 of the Fourth Schedule to the Companies
Act is set out in respect of only those subsidiaries, the financial position or results of which are material for a proper appreciation ofthe affairs of the group. Afull list of subsidiaries and associated companies is available on request.
2. All companies are private companies unless stated otherwise.
Retail Apparel Group Limited– Clothing retailRetail Apparel Group Ltd 200 000 2 7 2 7
page 58
The financial interest of Pepkor Limited in subsidiaries at 30 June
COMPANY
1999 1998
Name of subsidiary R’000 R’000
1. Shares at cost
Pep Limited 373 682 373 682
Grocash Limited 3 775 3 775
Ackermans Limited 85 862 85 862
Pepkor Clothing Industries Limited 27 27
Pepkorfin (Proprietary) Limited 551 551
Stat-Hold (Proprietary) Limited 240 240
Retail Holdings Limited 479 343 479 343
Wilfred Meyersohn & Company (Proprietary) Limited – –
Smart-Hold Limited 4 255 4 255
Grocehold (Proprietary) Limited – –
Cash-Hold Limited – –
Garhold (Proprietary) Limited – –
Big D Discount Hyper Limited – –
W M Twee (Proprietary) Limited – –
947 735 947 735
2. Amounts owing
Pepkorfin (Proprietary) Limited 797 879 714 936
INTEREST INSUBSIDIARIES
Annexure B
page 59
Annexure C
1999 1998
Retail Apparel Group Limited R’000 R’000
1. Effective interest 26,6% 27,2%
2. Abridged balance sheet
Ordinary shareholders’ funds 463 172 456 886
Outside shareholders’ interest 2 227 2 519
Interest-bearing debt 484 861 385 064
Capital employed 950 260 844 469
Fixed assets 75 867 74 534
Investments 10 678 –
Current assets 1 018 399 968 699
Total assets 1 104 944 1 043 233
Interest-free liabilities 154 684 198 764
Employment of capital 950 260 844 469
3. The attributable interest of Pepkor Ltd in –
Profit before taxation 1 734 35 386
Exceptional items before taxation (830) –
Taxation 824 (11 182)
Net profit 1 728 24 204
INTEREST IN SIGNIFICANTASSOCIATED COMPANIES
page 60
ADMINISTRATION
Main bankersABSA Bank
First National Bank
Nedbank
Standard Bank
AttorneysJan S de Villiers & Son
Main brokersBOE Securities (Proprietary) Limited
Transfer secretariesMercantile Registrars Limited
11 Diagonal Street
Johannesburg, 2001
Telephone: (011) 370 5000
Facsimile: (011) 370 5271
Registered office/numberPepkor Limited
Registration number 65/07765/06
Incorporated in South Africa
36 Stellenberg Road
Parow Industria, 7490
Telephone: (021) 933 5137
Facsimile: (021) 931 0848
Company secretaryJ F Pienaar
PO Box 6100
Parow East, 7501
AuditorsPricewaterhouseCoopers Inc.
Project management: De Kock &Kerkhoff Communication ConsultantsDesign, typesetting, page make-up and reproduction: GraphicorPrinting: Hansa Reproprint
Secretarial certificationIn accordance with section 268G(d) of the Companies Act, Act 61 of 1973, as amended (“the Act”), it is hereby
certified that the company has lodged with the Registrar of Companies all such returns as are required of a public
company in terms of the Act and that such returns are true, correct and up to date.