34
Annual General Meeting 25 March 2011 Welcome at the Annual General Meeting of BankNordik
| Date post: | 28-Dec-2015 |
| Category: |
Documents |
| Upload: | juliana-wright |
| View: | 221 times |
| Download: | 5 times |

Annual General Meeting 25 March 2011
Welcome at the Annual General Meeting of BankNordik

Disclaimer
This presentation includes statements regarding future results, which are subject to risks and uncertainties. Consequently, actual results may differ significantly from the results indicated or implied in these statements.
No representation or warranty (expressed or implied) is made as to, and no reliance should be placed on, the fairness, accuracy or completeness of the information contained herein. Accordingly, none of BankNordik, or any of its principal shareholders or subsidiary undertakings or any of such person’s officers or employees or advisors accept any liability whatsoever arising directly or indirectly from the use of this document
Slide 2

Agenda
1. The Board of Director’s report on the Bank’s activities in the past year
2. Submission of audited annual accounts for adoption and Annual Report 2010
3. Decision on distribution of profit in accordance with the adopted annual accounts
4. Election of members to the Board of Directors
5. Election of auditor/auditors
6. Proposals from the Board of Directors Proposals from the Board of Directors
a. Winding-up scheme referred to in the Danish Act No. 721 of 25 June 2010
b. Authorization to the Board of Directors to let the Bank acquire own shares
7. Miscellaneous
Slide 3
1. The Board of Director’s report on the Bank’s activities in the past year
Presented by Klaus Rasmussen,
Chairman of the Board of Directors
Slide 4

2010 – A year of transition
“Our major strategic tasks in 2011 will be to create profitable growth in lending while maintaining a low risk level in our loan portfolio and a cost efficient operation.”

Presentation of the audited annual accounts and the Annual Report 2010
Presented by Janus Petersen, CEO
Slide 6
Annual Report 2010 was made public on 7th March 2011 and has been available at: www.BankNordik.fo/IR BankNordik’s Head Office in Tórshavn Has been sent to the shareholders’ who have
requested it
Slide 7

Strategic milestones reached in 2010
International expansion achieved by the acquisition of Danish and Greenlandic branches
Change of IT platform from local to Nordic IT provider Successful exit from Bank Package I
Slide 8

Highlights: Record high profits, large non-recurring items and large dividend expected in 2012
Profits before tax in 2010 DKK 416m Impairments DKK 167m (+) Other income (Bakkafrost) DKK 380m (-) Other Cost (Bank Package I and II) DKK 62m (+) Non-recurring cost DKK 30m (+) Value adjustments DKK 20m (-)
Total adjusted profits before tax in 2010 DKK 275m Profits before tax forecast 2011 DKK 100-
140m Net profits in Q4 2010 DKK 43m Proposed dividends 2011 DKK 40m Payment of accumulated dividends postponed to 2012 DKK 95m
Slide 9

2010 results deviate from forecast primarily due to divestment of Bakkafrost and increased impairments
Pre tax profit Forecast: DKK 150-190m Adjusted: Q1 DKK 470-510m
Q3 DKK 360-400m AR 2010 result : DKK 416m
Income from net insurance activities Forecast: Increase 25-40% Adjusted: Q3 20-30% AR 2010 result : 31%
Net interest and fee income Forecast: Growth 40-45% Adjusted: Q1 25-35%
Q3 20-30% AR 2010 result: 29%
Impairments Forecast: Same nominal level,
decrease in FO, some impairments in DK/GL
Adjusted Q3: DKK 180-200m AR 2010 result: DKK 167m
Costs Forecast: Increase by 70-75% AR 2010 result : Increase by 87% Adjusted* 74,8%
*(excl. non-recur. Cost DKK 30m)
Bakkafrost Divestment completed
Slide 10

Key figures in AR 2010
Net interest and fee income incl. insurance grows by 30% driven by acquisitions
Costs almost doubled driven by acquisitions and IT conversion
Impairments were significantly higher primarily in Q3 related to lower values of collateral
Net profit trebled because of divestment of Bakkafrost
Loans and advances grew by 25%, while deposits grew by 61%
Highlights DKK 1,000 2010 2009 Index
Net interest and fee income 589.019 455.049 129
Interest and fee income and from insurance, net 643.679 496.928 130
Market value adjustments 20.037 23.915 84
Other operating income 379.409 (10.756)
Staff cost and adm. expenses 408.088 210.778 194
Impairment charges 167.114 128.162 130
Net profit 339.435 111.047 306
Loans and advances 8.674.663 6.937.560 125
Bonds at fair value 3.497.466 1.252.056 279
Intangible assets 439.723 39.312 1119
Assets held for sale 160.794 175.908 91
Total assets 14.258.767 10.267.021 139
Due to credit institutions etc 245.249 1.498.499 16
Deposits and other debt 8.843.972 5.496.550 161
Issued bonds 2.199.843 999.843 220
Total shareholders´ equity 2.042.566 1.663.122 123
Slide 11

Key figures in Q4 2010
Interest and fee income incl. insurance decreased due to funding costs and non-performing loans
Costs higher due to extraordinary items
Impairments – corrections and Amagerbanken
Net profit turned positive again due to lower impairments
Loans and advances stable, while deposits fell
Highlights DKK 1,000 Q4 2010 Q3 2010 Index
Net interest & fee income 147.113 154.488 95
Interest and fee income and insurance, net 164.549 170.807 96
Market value adj. (5.381) (224) 2.402
Other operating income (1.387) (119) 1.166
Staff cost & adm. exp. 111.124 102.091 109
Impairments (17.794) 150.330 (12)
Net profit 43.484 (75.853) (57)
Loans and advances 8.674.663 8.549.425 101
Bonds at fair value 3.497.466 3.463.534 101
Intangible assets 439.723 432.857 102
Assets held for sale 160.794 134.265 120
Total assets 14.258.767 15.716.802 91
Due to credit institutions etc 245.249 787.392 31
Deposits and other debt 8.843.972 9.254.447 96
Issued bonds 2.199.843 2.699.843 81
Total shareholders´ equity 2.042.566 1.979.319 103
Slide 12
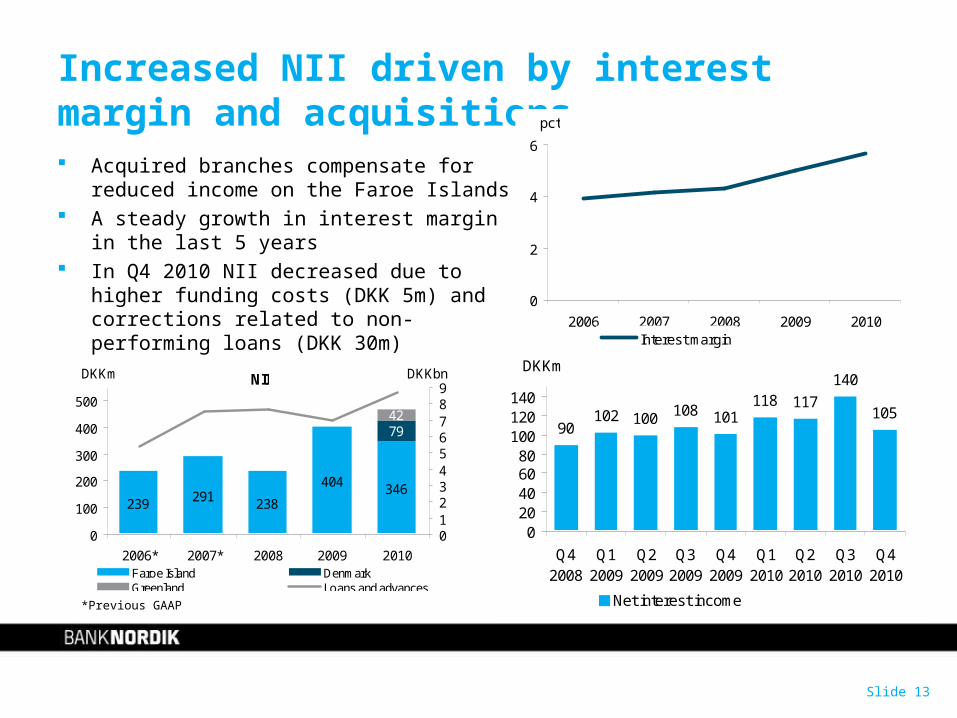
Increased NII driven by interest margin and acquisitions Acquired branches compensate for reduced
income on the Faroe Islands A steady growth in interest margin in the last
5 years In Q4 2010 NII decreased due to higher
funding costs (DKK 5m) and corrections related to non-performing loans (DKK 30m)
*Previous GAAP
0
2
4
6
2006 2007 2008 2009 2010
pct
Interest margin
102 100 101118 117
140
10590
108
020406080
100120140
Q42008
Q12009
Q22009
Q32009
Q42009
Q12010
Q22010
Q32010
Q42010
DKKm
Net interest income
NII
239 291 238
404 346
7942
0
100
200
300
400
500
2006* 2007* 2008 2009 2010
DKKm
0123456789
DKKbn
Faroe Island DenmarkGreenland Loans and advances
Slide 13

Fees and insurance income on a higher level in 2010 than in 2009 due to acquisitions
Slide 14
Higher level of fees in Q4 2010 explained by a year-end correction of DKK 10m
Higher level of insurance income in 2010 explained by first full year consolidation of Icelandic insurance activities
11 1012
27
2015
32
9
16
0
10
20
30
40
Q42008
Q12009
Q22009
Q32009
Q42009
Q12010
Q22010
Q32010
Q42010
DKKm
Net fee income
11
6
13
9
12
16 17
6
12
0
5
10
15
20
Q42008
Q12009
Q22009
Q32009
Q42009
Q12010
Q22010
Q32010
Q42010
DKKm
Net income from insurance

Operating segments, banking
Operating segments DKK mil.
FO 2010
DK 2010
GL 2010
Interest income 501 124 56
Interest expense 155 46 14
Net interest income 346 79 42
Net fee income 49 29 14
Total income 405 109 57
Staff costs and administrative expenses 220 101 38
Dep. and. imp. of property, plant and equipment 11 3 1
Impairment charges on loans and adv. etc. 181 -16 2
Profit before tax -28 21 16
Loans and advances 6295 1562 816
Deposits 5663 2799 482
Total liabilities and equity 10446 3070 816
C/I ratio (%) 107% 81% 72%
C/I ratio (excl. value adjustments and
Imp. on loans and advances etc.) (%) 63% 96% 69%
Growth potential in Denmark
Staff costs and adm. expenses in Denmark high compared to income
Impairments in Faroe Islands increased primarily due to re-valuation of collateral in Q3 2010
Slide 15

Operating segments - insurance
Operating segments DKK 1,000 FO 2010
ICL 2010
Net interest income 3647 8386
Premium income, net of reinsurance 82184 159625
Claims, net of reinsurance 47149 140535
Staff costs and administrative expenses 18283 28279
Dep. and. imp. of property, plant and equipment 304 8161
Profit before tax 20344 9396
Total liabilities and equity 173678 350564
Cost/Income ratio (%) 48% 81%
Cost/Income ratio (excl. value adjustments and
impairments on loans and advances etc.) (%) 48% 103%
Successful business model on the Faroe Islands
Improving results from Icelandic activities
Slide 16

Cost structure changed significantly
Staff costs and administrative expenses 2010 2009 Change
Staff costs:
Salaries 182.903 101.790 80%
Pensions 17.547 9.125 92%
Social security expenses 22.818 8.223 177%
Total staff costs 223.269 119.138 87%
Administrative expenses:
IT 67.531 42.876 58%
Marketing etc 24.688 8.431 193%
Education etc 5.262 5.924 -11%
Advisory services 10.621 8.615 23%
Other expenses 95.751 30.962 209%
Total administrative expenses 203.853 96.808 111%
Total staff costs 223.269 119.138 87%
Employee exp. incl. under the item "Claims, net of reinsurance"-19.034 -5.167
Total administrative expenses 203.853 96.808 111%
Total staff costs and administrative expenses 408.088 210.778 94%
Staff doubled in acquisitions causing increased costs
DKK 30m in one off costs (change in IT provider, name change, acquisitions)
Renewed focus on optimizing cost structure
Slide 17
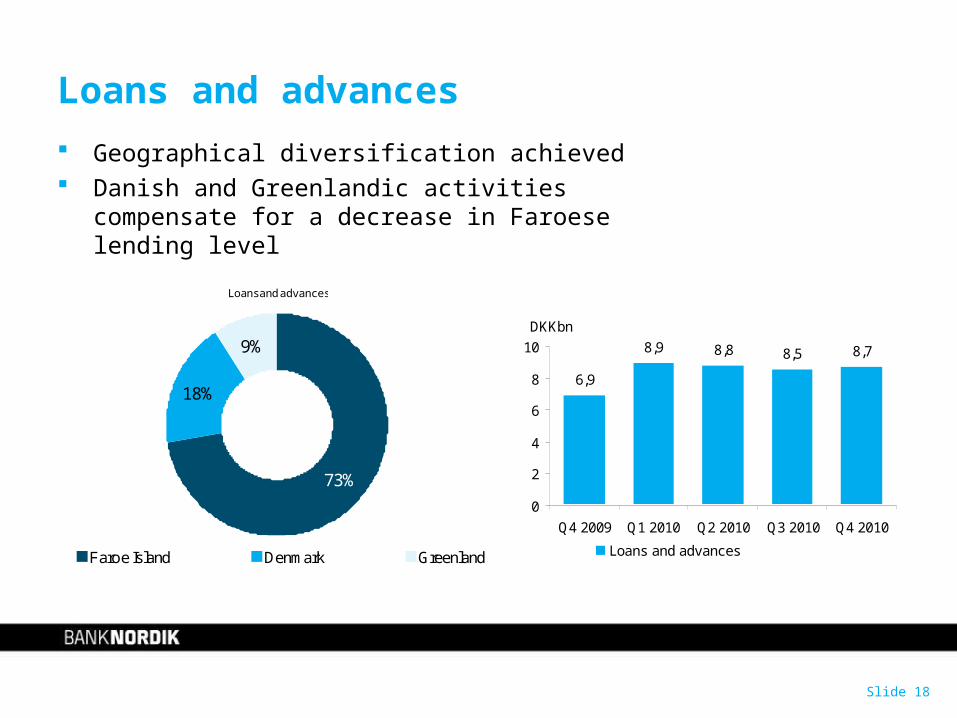
Loans and advances
Geographical diversification achieved Danish and Greenlandic activities compensate for a
decrease in Faroese lending level
Loans and advances
18%
9%
73%
Faroe Island Denmark Greenland
8,9 8,8 8,7
6,9
8,5
0
2
4
6
8
10
Q4 2009 Q1 2010 Q2 2010 Q3 2010 Q4 2010
DKKbn
Loans and advances
Slide 18

Sound risk diversification
No sector larger than 9%
Loan and advances on sector
6%8%
6%
50%
6%7%
5%
3%
9%
Public FisheriesTransport etc Building and constructionTrade, hotels etc ManufacturingProperty adm. OtherRetail
Slide 19

Large liquidity in 2010 due to end of Bank Package I
6,3 5,7
1,6 2,8
0,50,8
0
2
4
6
8
10
Loans and advances Deposits
DKKbn
Faroe Island Denmark Greenland
8,9 8,8 8,89,3
5,5
0
2
4
6
8
10
Q4 2009 Q1 2010 Q2 2010 Q3 2010 Q4 2010
DKKbn
Deposits
Slide 20
Liquidity 2010 2009Loans, advances and impairments in relation to deposits, % 103 131Excess cover relative to statutory liquidity requirements, % 293 276

The Supervisory Diamond
Slide 21
Sum of large exposures < 125%
BN 22.8%
Loan growth < 20% BN 25%
Funding-ratio < 1.25
BN 0.71
Excess liquidity > 50% BN 292,9%
Property exposure < 25% BN 11%

Strategic focus areas 2010-2013
Focus on selected customer segments, pension and insurance
Training and recruitment of employees Optimizing business processes and organization Optimizing liquidity and capital structure Risk management and customer credit rating
Slide 22

Outlook 2011
Focus on C/I ratio and efficiency – cost reduction materializing in the coming tree years
Cost reduction 0-5% in 2011 Pre-tax profit before value adjustment DKK 100-140m Net interest, fee and insurance income is expected to
decrease in the range of 0-5% because of pressure on the interest margin
Impairments DKK 50-100m
Slide 23

2 and 3. Submission of audited annual accounts for adoption and Annual Report 2010 and decision on distribution of profit in accordance with the adopted annual accounts
Slide 24

The Board of Directors proposes that the General Meeting adopt the annual accounts as presented in the Annual Report 2010 and approve the allocation of the DKK 339,435,000 net profit as follows: DKK 40,000,000 are paid out as dividend to the shareholders, DKK 294,176,000 are allocated to “Retained earnings” and DKK 5,258,000 to “Minority interests”.
Slide 25

4. Election of members to the Board of Directors
Slide 26

Klaus Rasmussen (re-election) Education: MSc in Economics and MSc in Business Management and Auditing. Former occupation: State-authorized public accountant. Former owner of and partner in State-authorized public accountant company
Principal occupation: Self-employed with
activities as a professional Board member
Current Board positions held: Chairman of the Board of: P/F Effo, P/F
Vónin, P/F VON and Refa Frøystad Group.Board member of: P/F Effo Finans and
Qalut Vónin A/S
Date of first election to the Board: 2008
Jens Erik Christensen (re-election) Education: MSc in Actuarial Science Former occupation: CEO of Codan A/S and member of the Executive Committee of Royal & SunAlliance. Principal occupation: Self-employed with activities as a professional Board member as well as business development through the investment company Sapere Aude A/S. Current Board positions held:
Chairman of the Board of: Danish Merchant Capital A/S, Your Pension Management Luxembourg SA, Your Pension Savings Association, Luxembourg Board member of: SAS AB, Andersen & Martini A/S, Amrop A/S, Nordic Corporate Investments A/S
Date of first election to the Board: 2007
Keld Søndergaard Holm (re-election) Education: MSc in Economics and HD(F) Former occupation: Consultant at Nykredit – Business Research and Communication, Associate professor and external examiner at Copenhagen Business SchoolPrincipal occupation: Manager of Adverti
Current Board positions held:Board member of: Public Affairs Group, Deputy
chairman, The Copenhagen Institute for Future Studies and Member of precidium of the academy for future studies
Date of first election to the Board: 2008
Nils Suni Sørensen (re-election)Education: BSc in Economics and Business Administration, MBA from Lancaster University Former occupation: CEO of Faroe Seafood Principal occupation: Managing Director of Faroe Petroleum, Faroe Islands; Managing director of Greenland Oil Company A/S Current Board positions held:
Board member of: Faroe Petroleum Faroe Islands, Financing Fund from 1992, Faroe Petroleum plc. UK, Greenland Oil Company A/S
Date of first election to the Board: 2010
Slide 27

5. Election of auditor/auditors
Slide 28

The Board of Directors proposes re-election of NOTA, Løggilt grannskoðanarfelag P/F and PwC Denmark as external auditors.
Slide 29

6. Proposals from the Board of Directors
Slide 30
a. Winding-up scheme referred to in the Danish Act No. 721 of 25 June 2010
In 2011 the General Meetings of all Danish and Faroese banks are required to decide on the possible future use of the Danish State’s winding-up scheme administered by Finansiel Stabilitet A/S.
In case a distressed bank does not comply with the Financial Business Act’s capital adequacy requirement and the bank has been given a deadline by the Danish FSA to comply with this requirement, the distressed bank may choose to be wound up under the Finansiel Stabilitet A/S. Finansiel Stabilitet A/S will then set up a subsidiary company to take over all assets of the distressed bank.
BankNordik's Board of Directors proposes that, in line with the majority of Danish banks, that the General Meeting state that it does not want at present to consider to be wound up by Finansiel Stabilitet A/S under the Act on Financial Stability - in other words that the General Meeting decide not to decide on whether they will use the scheme or not.
Slide 31

b. Authorization to the Board of Directors to let the Bank acquire own shares
The Board of Directors requests that the General Meeting renews, until the next ordinary general meeting, the following authority to allow the Bank to acquire its own shares:
“The General Meeting authorises the Board of Directors – until the next Annual General Meeting – to permit the Bank – by way of ownership or pledge - to acquire own shares up to a total nominal value corresponding to 10% of the Bank’s share capital in accordance with Article 48 in the Companies Act. When the Bank acquires own shares by way of ownership, the share price shall not deviate from the market price by more than 10%.”
Slide 32

7. Miscellaneous
Slide 33

Thank you for attending BankNordik’s Annual General Meeting 2011


