34
Hamburg, March 31, 2015 ANNUAL GENERAL MEETING
Hamburg, March 31, 2015ANNUAL GENERAL MEETING

DISCLAIMER
Beiersdorf Annual General Meeting 2015
Some of the statements made in this presentation contain forward-looking information that involve a number of risks and uncertainties. Such statements are based on a number of assumptions, estimates, projections or plans that are inherently subject to significant risks, as well as uncertainties and contingencies that are subject to change. Actual results can differ materially from those anticipated in the Company´s forward-looking statements as a result of a variety of factors, including those set forth from time to time in the Company´s press releases and reports and those set forth from time to time in the Company´s analyst calls and discussions. We do not assume any obligation to update the forward-looking statements contained in this presentation.
This presentation does not constitute an offer to sell or a solicitation or offer to buy any securities of the Company, and no part of this presentation shall form the basis of or may be relied upon in connection with any contract or commitment. This presentation is being presented solely for your information and is subject to change without notice.
March 31, 2015 | Page 2
AGENDA
March 31, 2015Beiersdorf Annual General Meeting 2015
Results for Financial Year 2014
Blue Agenda
Key Financial Figures
Outlook 2015
| Page 3

HIGHLIGHTS OF 2014
March 31, 2015Beiersdorf Annual General Meeting 2015
Sales and earnings up in 2014
Innovation power and competitiveness significantly increased
Position strengthened in Europe and extended in emerging markets
Market share increases in core categories
| Page 4
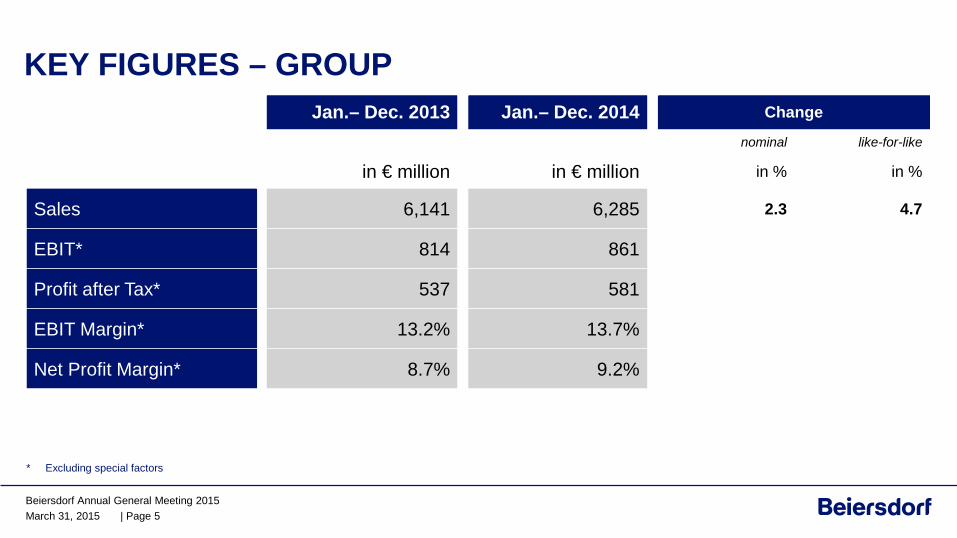
Jan.– Dec. 2013 Jan.– Dec. 2014 Change
nominal like-for-like
in € million in € million in % in %
Sales 6,141 6,285 2.3 4.7
EBIT* 814 861
Profit after Tax* 537 581
EBIT Margin* 13.2% 13.7%
Net Profit Margin* 8.7% 9.2%
KEY FIGURES – GROUP
March 31, 2015
* Excluding special factors
Beiersdorf Annual General Meeting 2015| Page 5
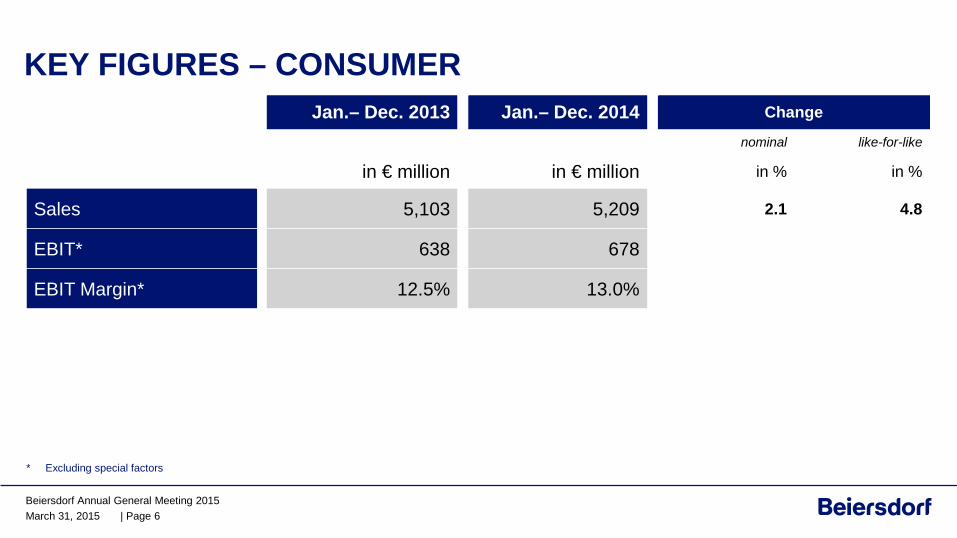
Jan.– Dec. 2013 Jan.– Dec. 2014 Change
nominal like-for-like
in € million in € million in % in %
Sales 5,103 5,209 2.1 4.8
EBIT* 638 678
EBIT Margin* 12.5% 13.0%
KEY FIGURES – CONSUMER
March 31, 2015
* Excluding special factors
Beiersdorf Annual General Meeting 2015| Page 6

Jan.– Dec. 2013 Jan.– Dec. 2014 Change Share
like-for-like
in € million in € million in % in %
Western Europe 2,196 2,244 1.6 43.1
Eastern Europe 591 555 3.6 10.6
North America 334 349 4.6 6.7
Latin America 616 624 7.1 12.0
A/A/A 1,366 1,437 9.6 27.6
Total Consumer 5,103 5,209 4.8 100.0
CONSUMER SALES BY REGION
March 31, 2015Beiersdorf Annual General Meeting 2015
| Page 7

Jan.– Dec. 2013 Jan.– Dec. 2014 Change
nominal like-for-like
in € million in € million in % in %
Sales 1,038 1,076 3.6 4.4
EBIT* 176 183
EBIT Margin* 16.9% 17.0%
KEY FIGURES – tesa
March 31, 2015
* Excluding special factors
Beiersdorf Annual General Meeting 2015| Page 8
AGENDA
March 31, 2015Beiersdorf Annual General Meeting 2015
Results for Financial Year 2014
Blue Agenda
Key Financial Figures
Outlook 2015
| Page 9

BLUE AGENDA
March 31, 2015Beiersdorf Annual General Meeting 2015
| Page 10
1 Brands
Innovations2
3 Markets
4 People
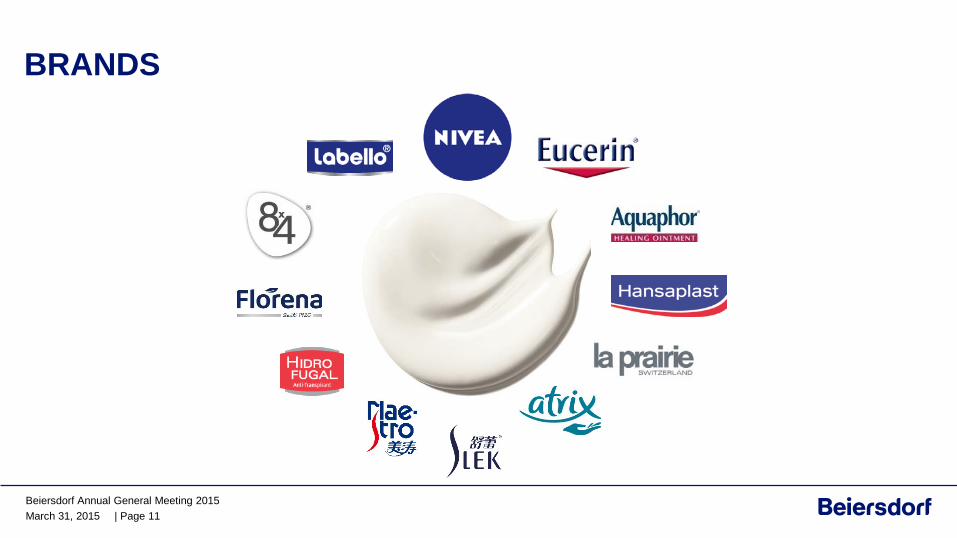
BRANDS
March 31, 2015Beiersdorf Annual General Meeting 2015
| Page 11

BRANDS
March 31, 2015Beiersdorf Annual General Meeting 2015
| Page 12

NIVEA – OUR ICONIC BRAND
March 31, 2015Beiersdorf Annual General Meeting 2015
| Page 13
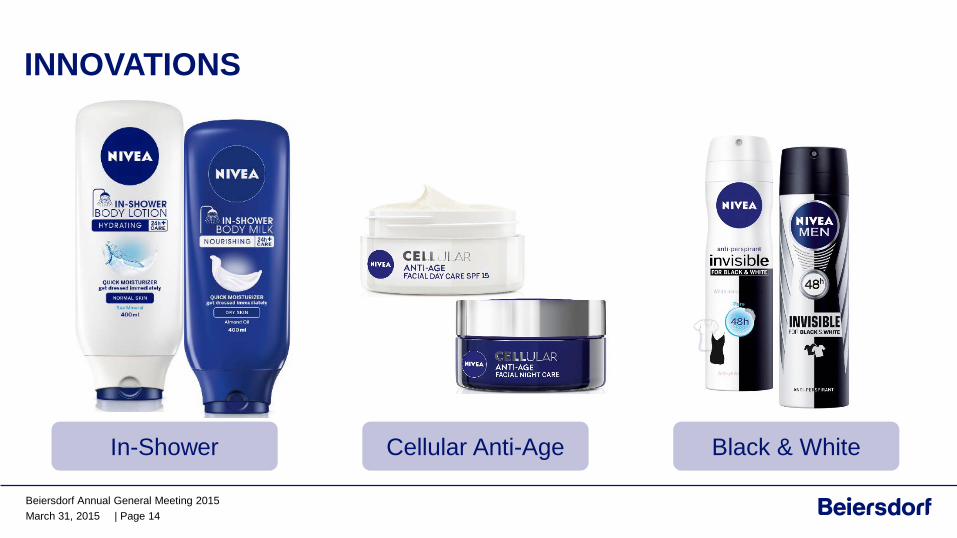
INNOVATIONS
March 31, 2015
In-Shower Cellular Anti-Age Black & White
Beiersdorf Annual General Meeting 2015| Page 14

INNOVATIONS
March 31, 2015Beiersdorf Annual General Meeting 2015
NIVEA Q10 plus Serum Pearls
Breakthrough in anti-aging research
Revolutionary pearl technology and a highly effective serum
More than 15 years expertise in Q10 anti-aging
| Page 15
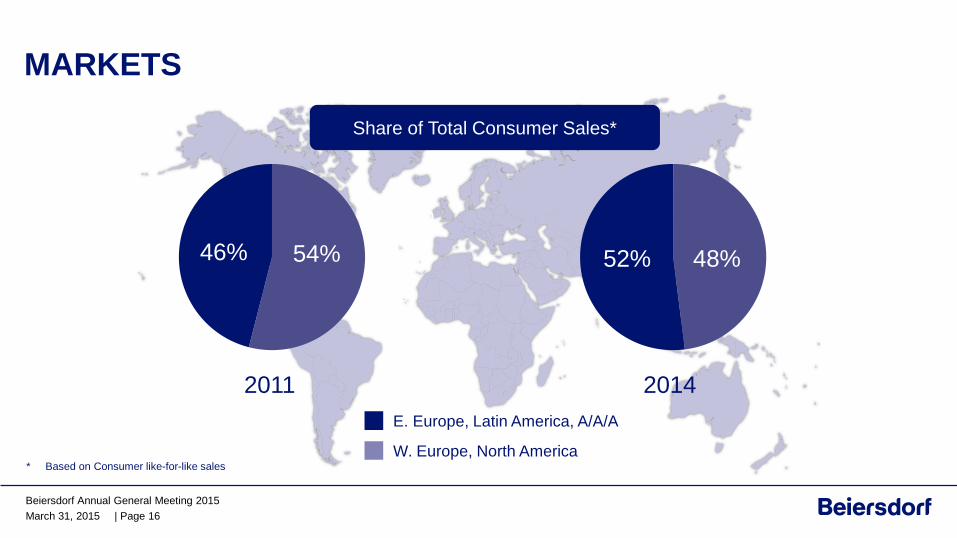
MARKETS
March 31, 2015
* Based on Consumer like-for-like sales
E. Europe, Latin America, A/A/A
W. Europe, North America
46%52% 48%
2011 2014
46% 54%
Beiersdorf Annual General Meeting 2015
Share of Total Consumer Sales*
| Page 16
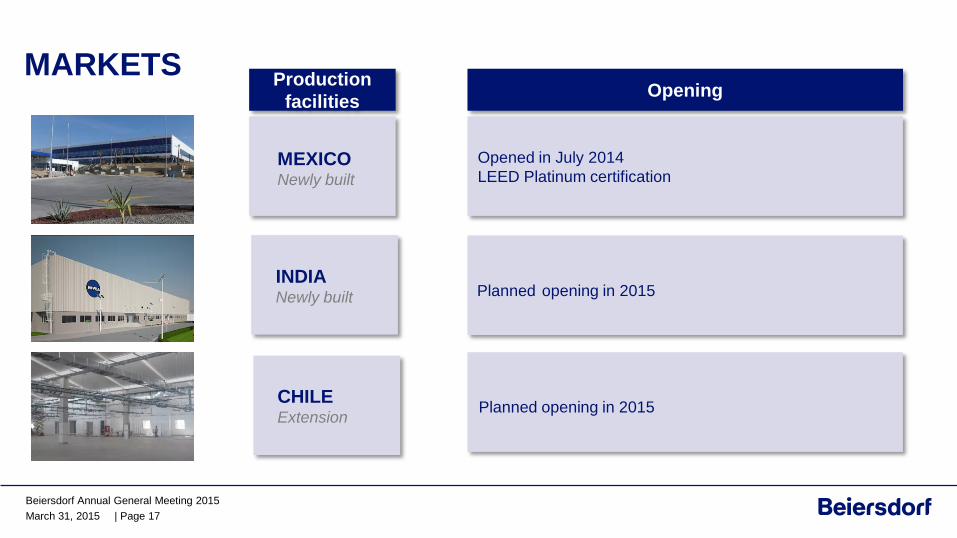
MARKETS
March 31, 2015Beiersdorf Annual General Meeting 2015
MEXICONewly built
Opened in July 2014LEED Platinum certification
INDIANewly built
CHILEExtension Planned opening in 2015
Production facilities Opening
Planned opening in 2015
| Page 17
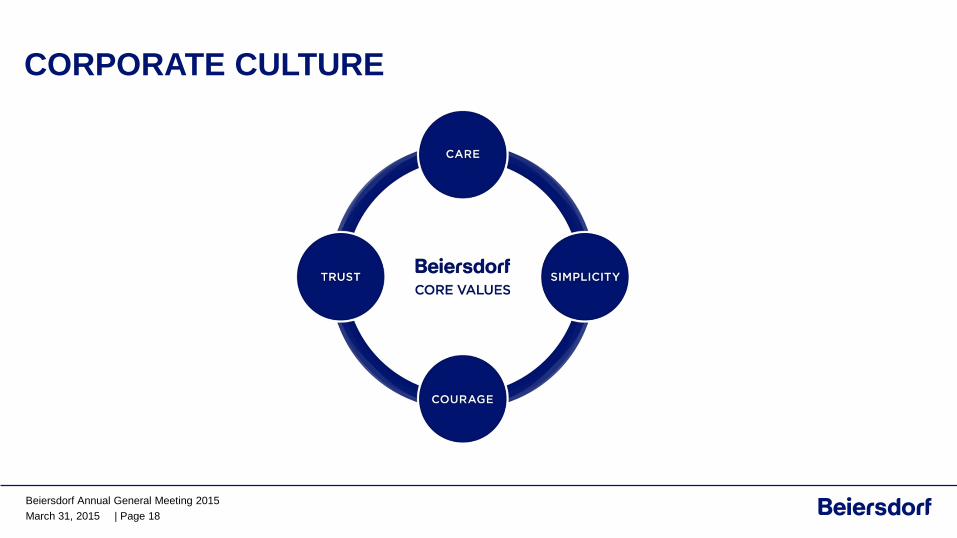
CORPORATE CULTURE
March 31, 2015Beiersdorf Annual General Meeting 2015
| Page 18

OUTLOOK 2015
March 31, 2015
Sales development on a like-for-like basis Profit development on an operating basis
Consumer Sales growth 3–5% Slight increase in EBIT margin
tesa Sales growth 3–5% EBIT margin slightly below previous year
Beiersdorf Group Sales growth 3–5% Slight increase in EBIT margin
2014 data for reference (excluding special factors): Consumer EBIT margin 13.0% tesa EBIT margin 17.0% Group EBIT margin 13.7% Group profit after tax 9.2%
Beiersdorf Annual General Meeting 2015| Page 19

AGENDA
March 31, 2015Beiersdorf Annual General Meeting 2015
Results for Financial Year 2014
Blue Agenda
Key Financial Figures
Outlook 2015
| Page 20

NOMINAL VERSUS LIKE-FOR-LIKE GROWTH
• Nominal growth includes exchange rates as well as structural effects from acquisitions and divestments
• Like-for-like growth: growth adjusted for currency and structural effects
• A weaker (stronger) euro tends to lead to higher (lower) nominal growth for Beiersdorf
March 31, 2015Beiersdorf Annual General Meeting 2015
| Page 21

Jan.– Dec. 2013 Jan.– Dec. 2014 Changenominal like-for-like
in € million in € million in % in %
Sales 6,141 6,285 2.3 4.7
EBIT 820 796
Profit after Tax 543 537
EBIT Margin 13.4% 12.7%
Profit after Tax Margin 8.8% 8.5%
EBIT* 814 861
EBIT Margin* 13.2% 13.7%
Profit after Tax* 537 581
Net Profit Margin* 8.7% 9.2%
Earnings per Share* €2.33 €2.53
KEY FIGURES – GROUP
March 31, 2015
* Excluding special factors
Beiersdorf Annual General Meeting 2015| Page 22

March 31, 2015Beiersdorf Annual General Meeting 2015
| Page 23
-40 -35 -30 -25 -20 -15 -10 -5 0 5 10 15
GBPKRWUSDCHFAEDCNYPLNKZTAUDCLPTRYTHBZARUAHJPYBRLOthersRUB€ million
NET SALES FOREIGN EXCHANGE EFFECTS(weighted FX effects in 2014 in € million)

CONSUMER SALES GROWTH
March 31, 2015Beiersdorf Annual General Meeting 2015
5.7 %6.5 %
6.9 % 7.0 %6.3 %
5.0 %4.2 %
4.8 %
Q1 H1 9M FY Q1 H1 9M FY
(in % on a like-for-like basis)
2013 2014
| Page 24

CONSUMER EBIT
March 31, 2015Beiersdorf Annual General Meeting 2015
178 193
351 367
510 529
638678(in € million/in % of sales, excluding special factors)
13.5% 14.6% 13.3% 13.1% 12.5%
Q1 13 Q1 14 H1 13 9M 13 FY 13H1 14
13.9% 13.5%
9M 14
13.0%
FY 14
| Page 25

Jan.– Dec. 2013 Jan.– Dec. 2014 Change Share
like-for-like
in € million in € million in % in %
Western Europe 2,196 2,244 1.6 43.1
Eastern Europe 591 555 3.6 10.6
North America 334 349 4.6 6.7
Latin America 616 624 7.1 12.0
A/A/A 1,366 1,437 9.6 27.6
Total Consumer 5,103 5,209 4.8 100.0
CONSUMER SALES BY REGION
March 31, 2015Beiersdorf Annual General Meeting 2015
| Page 26
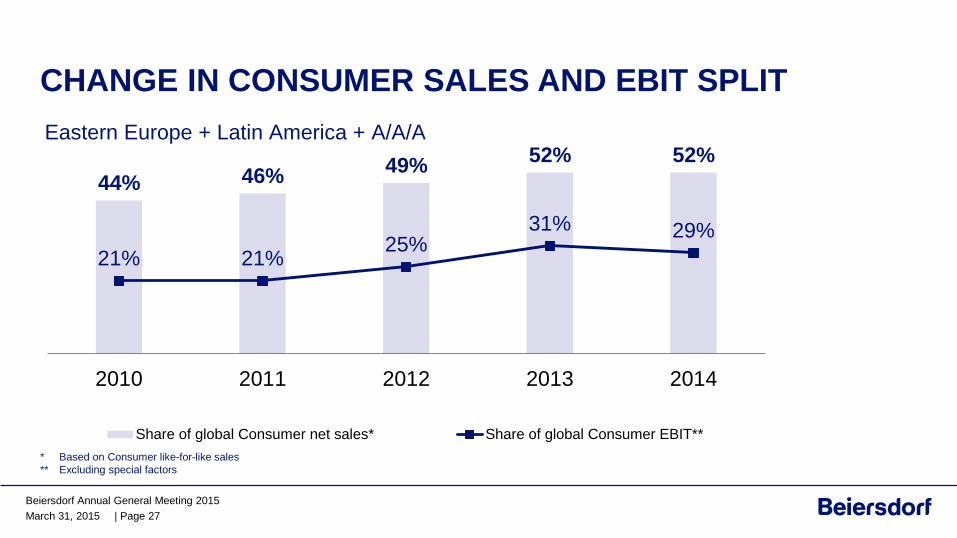
44% 46% 49% 52% 52%
21% 21% 25%31% 29%
2010 2011 2012 2013 2014
Share of global Consumer net sales* Share of global Consumer EBIT**
Eastern Europe + Latin America + A/A/A
March 31, 2015Beiersdorf Annual General Meeting 2015
* Based on Consumer like-for-like sales** Excluding special factors
| Page 27
CHANGE IN CONSUMER SALES AND EBIT SPLIT

Jan.– Dec. 2013 Jan.– Dec. 2014 Change
nominal like-for-like
in € million in € million in % in %
Sales 1,038 1,076 3.6 4.4
EBIT* 176 183
EBIT Margin* 16.9% 17.0%
KEY FIGURES – tesa
March 31, 2015
* Excluding special factors
Beiersdorf Annual General Meeting 2015| Page 28

March 31, 2015Beiersdorf Annual General Meeting 2015
Sales growth in excess of the market.
Continuing high EBIT margin from operations.
All regions contributed to growth.
tesa's sales generated by system solutions for industrial customers and by products for end users.
Innovations and extending the company’s presence in emerging markets are the critical success factors.
455 people employed in the company’s own development laboratories in Germany, the USA, and Asia.
Consumer
Construction
Automotive
tesa BUSINESS SEGMENT IN 2014
| Page 29
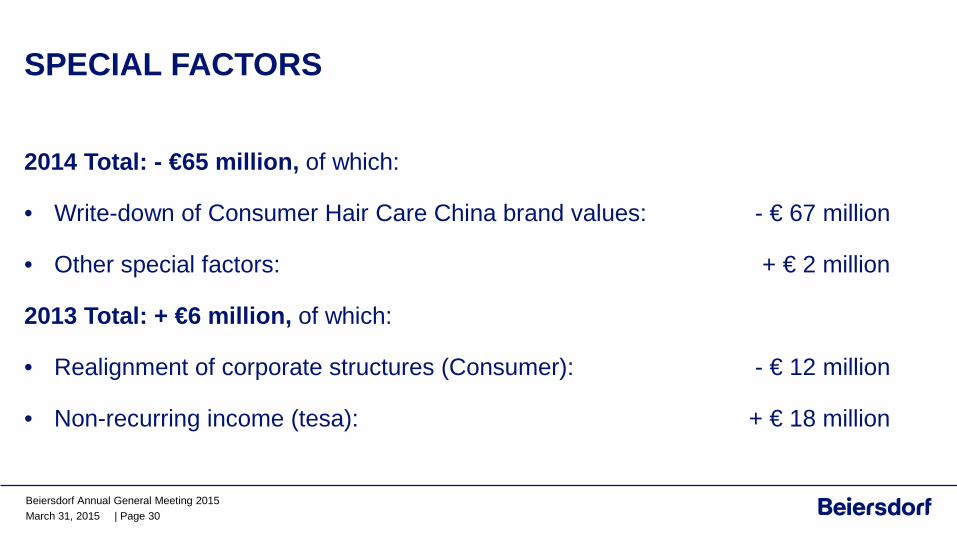
SPECIAL FACTORS
2014 Total: - €65 million, of which:
• Write-down of Consumer Hair Care China brand values: - € 67 million
• Other special factors: + € 2 million
2013 Total: + €6 million, of which:
• Realignment of corporate structures (Consumer): - € 12 million
• Non-recurring income (tesa): + € 18 million
March 31, 2015Beiersdorf Annual General Meeting 2015
| Page 30
March 31, 2015Beiersdorf Annual General Meeting 2015
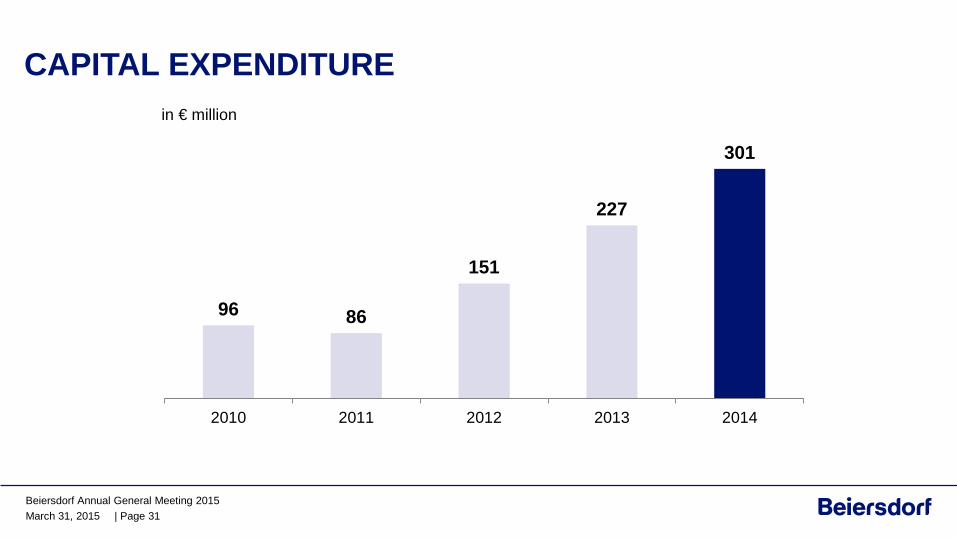
CAPITAL EXPENDITURE
96 86
151
227
301
2010 2011 2012 2013 2014
in € million
| Page 31

AGENDA
March 31, 2015Beiersdorf Annual General Meeting 2015
Results for Financial Year 2014
Blue Agenda
Key Financial Figures
Outlook 2015
| Page 32

OUTLOOK 2015
March 31, 2015
Sales development on a like-for-like basis Profit development on an operating basis
Consumer Sales growth 3–5% Slight increase in EBIT margin
tesa Sales growth 3–5% EBIT margin slightly below previous year
Beiersdorf Group Sales growth 3–5% Slight increase in EBIT margin
2014 data for reference (excluding special factors): Consumer EBIT margin 13.0% tesa EBIT margin 17.0% Group EBIT margin 13.7% Group profit after tax 9.2%
Beiersdorf Annual General Meeting 2015| Page 33

Hamburg, March 31, 2015ANNUAL GENERAL MEETING


