64
ANNUAL INDUSTRIAL ACTION REPORT | 2013

2013 | Annual Industrial Action Report
A | Page
AnnuAl IndustrIAl
ActIon report | 2013

Annual Industrial Action Report | 2013
Page | B

2013 | Annual Industrial Action Report
i | Page
PublisherDepartment of LabourChief Directorate of CommunicationPrivate Bag X117Pretoria0001
ContributorsLabour Market Information and Statistics
Editing, layout and design, photography and distributionMedia Production UnitChief Directorate of CommunicationDepartment of Labour
ISBN978-0-621-42689-2
AnnuAl
IndustrIAl ActIon
report | 2013

Annual Industrial Action Report | 2013
Page | ii
List of figures iiiList of tables iiiAcknowledgement viExecutive summary 1Introduction 3
CHAPTER ONE: Strike activity as measured in the number of work stoppages, working days and hours lost, time-loss and wages lost, 2009 - 2013 5
CHAPTER TWO: Comparative analysis of work stoppages, 2012 and 2013 112.1. Provincial distribution of work stoppages 112.2. Industrial distribution of work stoppages 122.3. Industrial distribution of working days lost 122.4 Working days lost per 1 000 employees by industry 132.5. Industrial distribution of working hours lost 142.6. Industrial distribution of workers involved in work stoppages 152.7. Nature of work stoppages 162.8. Work stoppages by employment size of establishments 172.9. Duration of work stoppages 182.10. Principal cause of strike activity measured in working days lost 192.11. Trade union involvement in work stoppages 202.12. Determinants identified as giving rise to work stoppages in South Africa 222.13. Work stoppage future outlook for 2014 22
CHAPTER THREE: Wage settlements 253.1. Wage settlements concluded in various industries 26
3.1.1. Manufacturing 263.1.2. Finance, Insurance and Business Services 263.1.3. Transport, Storage and Communication 273.1.4. Wholesale and Retail Trade 273.1.5. Community, Social and Personal Services 273.1.6. Agriculture 283.1.7. Mining and Quarrying 293.1.8. Construction 293.1.9. Electricity, Gas and Water 30
3.2. Wage settlements concluded without strike incidents 313.3. Abandoned strike incidents 313.4. Suspended strikes incidents 31
CHAPTER FOUR: Profile of work stoppages, 2013 33
CONCLUSION 45Policy Implications 45References 45ANNEXURE A 47Data Appendix 47ANNEXURE B 49Methodology for monitoring industrial action 49
tABle oF contents

2013 | Annual Industrial Action Report
iii | Page
Figure 1: Trends in the number of work stoppages in South Africa, 2009 - 2013 5Figure 2: Trends in working days lost in South Africa, 2009-2013 6Figure 3: Working days lost per 1 000 employees due to strikes, 2009-2013 6Figure 4: Trends in working hours lost in South Africa, 2009-2013 7Figure 5: Wages lost due to work stoppages in South Africa, 2009-2013 7Figure 6: Percentage distribution of protected and unprotected strikes in South Africa, 2013 8Figure 7: Distribution of work stoppages by industry, 2012 and 2013 12Figure 8: Distribution of work stoppages by their nature, 2012 and 2013 16Figure 9: Percentage distribution of establishments affected by work stoppages by employment size, 2012 and 2013 17Figure 10: Percentage distribution of work stoppages by duration, 2012 and 2013 18
Table 1: Distribution of work stoppages and wages lost by province, 2012 and 2013 11Table 2: Distribution of working days lost by industry, 2012 and 2013 12Table 3: Distribution of working days lost per 1 000 employees by industry, 2012 and 2013 13Table 4: Distribution of working hours lost by industry, 2012 and 2013 14Table 5: Distribution of employees involved in work stoppages by industry, 2012 and 2013 15Table 6: Distribution of working days by principal cause of dispute, 2012 and 2013 19Table 7: Working days lost by trade union 2012 and 2013 20Table 8: Median wage settlements levels in South Africa by industry, 2013 25
lIst oF FIgures
lIst oF tABles

Annual Industrial Action Report | 2013
Page | iv
ACSA Airports Company of South Africa
AGM Annual General Meeting
AMCU Association of Mineworkers and Construction
BAWUSA Bawsi Agricultural Workers Union of South Africa
BCAWU Building Construction and Allied Workers Union
BEMAWU Broadcasting, Electronic, Media and Allied Workers Union
BTR Bus Rapid Transport
CAWUSA Congregated and Allied Workers Union of South Africa
CCRAWUSA Care Centre Catering Retail and Allied Workers Union of South Africa
CCMA Commission for Conciliation, Mediation and Arbitration
CEPPWAWU Chemical, Energy, Paper, Printing, Wood and Allied Workers Union
COSAWU Commercial Services and Allied Workers’ Union
CSAAWU Commercial, Stevedoring, Agricultural and Allied Workers’ Union
COSATU Congress of South African Trade Unions
CPI Consumer Price Index
CPIX Consumer Price Index excluding mortgage interest cost for metropolitan and other urban areas
CWU Communication Workers Union
DENOSA Democratic Nursing Organization of South Africa
DPSA Department of Public Service and Administration
FAWU Food and Allied Workers Union
FMAIWU Federated Mining and Allied Industries Workers Union
FDC Free State Development Corporation
FGWU Food and General Workers Union
GDP Gross Domestic Product
GIWUSA General Industries Workers Union of South Africa
HOSPERSA Health and Other Service Personnel Trade Union of South Africa
HOTELICCA Hotel, Liquor, Catering, Commercial and Allied Workers Union of S.A.
ICCAFWU Independent Catering Commercial Farm Workers Union
ILO International Labour Organization
IMATU Independent Municipal and Allied Trade Union
ITU Inqubelaphambili Trade Union
LMIS Labour Market Information and Statistics
MEWUSA Metal and Electrical Workers’ Union of South Africa
MIBC Metal Industries and Bargaining Council
MTWU Motor Transport Workers Union (South Africa)
MWASA Media Workers Association of South Africa
NAPTOSA National and Professional Teachers’ Organization of South Africa
NEDLAC National Economic, Development and Labour Council
NEHAWU National Education, Health and Allied Workers Union
AcronYMs

2013 | Annual Industrial Action Report
v | Page
NHLS National Health Laboratory Service
NTM National Transport Movement
NUFBSAW National Union of Food Beverages Wine
NUMSA National Union of Metal Workers of South Africa
NUM National Union of Mineworkers
NUPSAW National Union of Public Service and Allied Workers
PRASA Passenger Rail Agency of South Africa
PSA Public Servants Association
PTAWU Professional Transport and Allied Workers Union
PTWU Professional Transport Workers Union
RFEA Road Freight Employee Associated
SACCAWU South African Commercial, Catering and Allied Workers’ Union
SACTWU South African Clothing and Textile Workers Union
SACU South African Communications Union
SACWU South African Chemical Workers Union
SADTU South African Democratic Teachers Union
SAEWA South African Equity Workers Association
SAEPU South African Emergency Personnel’s Union
SAFA South African Football Association
SAFCEC South African Federation of Civil Engineering Contractors
SALGA South African Local Government Association
SAMA South African Medical Association
SAMWU South African Municipal Workers Union
SANC South African Nursing Council
SAPTU South African Parastatal and Tertiary Institutions Union
SATAWU South African Transport and Allied Workers Union
SEIFSA Steel and Engineering Industry Federation of South Africa
SU Solidarity Union
TAWU Transport and Allied Workers Union
TAWUSA Transport and Allied Workers Union of South Africa
TB Tuberculosis
TOWU Transport and Omnibus Workers Union
TSAM Toyota South African Motors
TWU Tirisano Workers Union
UASA United Association of South Africa
UNISA University of South Africa
UTATU United Transport and Allied Trade Union
UNICIMESHAWU United Chemical Industries Mining Electrical State Health and Aligned Workers Unions
WITS Witwatersrand

Annual Industrial Action Report | 2013
Page | vi
The Department of Labour would like to express appreciation for the timely effort by all employers, bargaining councils and associations for providing the Department through the Labour Market Information and Statistics (LMIS) Directorate with strike statistics during 2013. The success and final outcome of this report requires a lot of involvement and assistance from many people and the LMIS Directorate is extremely fortunate to have received this support to enable the completion of this annual report, in particular with the completed LRA 9.2 forms at the end of strike activities. We acknowledge that the completion of the form can be cumbersome at times especially where forms are incomplete and have to be returned to employers for accurate information.
Much appreciation is extended to the LMIS team for ensuring all the necessary information was collected from various media reports, bargaining councils, then analysed and put together into a meaningful report and to those who reviewed this report.
AcknowledgeMent
2013 | Annual Industrial Action Report
1 | Page
According to data collected and analysed in 2013 by the Department of Labour there was a rise in the number of strike incidents but a drop in working days lost in 2013 as compared to 2012. About 114 strike cases were identified and recorded by the Department, however it resulted in a drop of about 1 847 006 working days. The number of strikes recorded is more than strikes recorded in the last five years. It represents an increase of 15.1% between 2012 and 2013.
Working days lost through industrial disputes in 2013 were however lower than working days lost in 2012. Workdays lost decreased by 44.2% from 3 309 884 in 2012 to 1 847 006 in 2013.
Key features of strike incidents in the 2013 report include the following:
yy South Africa has experienced a rise in strikes incidents from 2009 to 2013 with the exception of 2011 where strikes recorded were lower. In 2009, the Department recorded 51 cases of industrial action, 74 cases in 2010, 67 in 2011, 99 in 2012 and 114 industrial incidents in 2013
yy Working days lost were at a decrease to 1 847 006 in 2013 as compared to 3 309 884 in 2012
yy Unlike in 2012, protected strikes in 2013 amounted to 48% as compared to the 54% in 2012
yy The mining industry continued to experience more working days lost (515 971 in 2013) contributing 27.9% of the total days lost. This was followed by the transport and manufacturing industries at 477 355 and 343 222 working days lost respectively
yy In 2013, about R6.7 billion in wages were lost due to the participation of workers in strikes as compared to the R6.6 billion in 2012
yy In terms of work stoppages recorded provincially, Gauteng, Western Cape and KwaZulu-Natal continued to experience more strikes incidents at 97, 66 and 44 respectively
yy The median wage settlement level as reported by Labour Research Services in 2013 was about 8% (this is above the inflation rate)
yy SATAWU and NUM were mostly affected as a result of high member participation during strike actions in 2013 where both recorded 25.7% and 17.4% respectively
yy Wages, bonus and other compensation disputes remains to be the main reason for work stoppages in 2013 at 76.6% working days lost
yy There were more “strikes in company only” in 2013 with the likes of the South African Post Office, Rum-del Construction, Anglo Platinum Thembelani mines and SAA Technicians.
executIve suMMArY

Annual Industrial Action Report | 2013
Page | 2
IntroductIon

2013 | Annual Industrial Action Report
3 | Page
From an economic perspective, statistics are useful to analyse, evaluate and monitor the way the economy is performing and the effectiveness of current and longer term economic policies. From a social perspective, they are useful in the fight for decent work through policies and programmes for job creation, training and retraining schemes, and assistance for vulnerable groups, which may include young people, the aged, women, etc., in finding and securing decent employment1.
Addressing the Annual NeDLac Conference in 2014, the South African Minister of Labour stressed that Government recognises the importance to review the possibility of increasing minimum wages so as to address poverty and inequality, and to expand provision for retirement savings for low income workers. This indeed will capture the social perspective to respond to decent salaries and to ensure that the number of decent jobs continues to grow.
Low wages, rising income inequalities and tough economic conditions have led analysts to predict difficult negotiations2 in 2013, also influenced by hefty wage increases granted in 2012. The 2013 strike season mainly affected the mining, manufacturing and community industries.
The impacts of the strikes have been harsh for South Africa. In the mining industry, union rivalries between Association of Mineworkers and Construction Union (AMCU) and National Union of Mineworkers (NUM) continued to stretch the wage negotiations and also fuel the strikes and stall production. Although mining as a whole makes up about 5% of South Africa’s overall GDP, it makes up approximately 50% of the country’s total exports. Therefore a drop in production is a drop in the country’s export performance. The strikes in the manufacturing sector, e.g., automotive components sector also affected the South African economy. Manufacturing shrank 6.6% over the second quarter of 2013 due to the lower production of motor vehicles, parts and accessories and other transport equipment. As a result, the German automobile company BMW had confirmed that the strikes in South Africa’s automotive sector had killed off its expansion prospects as they considered a location for their new model. The industrial action in the mining, manufacturing and transport industries have all had a bad impact on the economy of the country, while it is battling with high unemployment, in the region of 25%. Experts suggest that 2014 will be no different. These strikes will continue to hurt the South African economy and the investment appeal.
Government has however, played an active role in mitigating the damages resulting from strikes. The Minister of Labour had to step in to speed up proceeding in the petrol attendant’s strikes, which resulted in a settlement. On the other hand, employers have condemned the unions’ attitudes, accusing unions of demanding unreasonable wage increases and resorting to strikes too readily, while unions have pointed out that the employers make huge profits without investing in the workers. Either way, South Africa needs to find a solution for the seemingly failing bargaining structure. Government, unions and business have an important role to play in order to maintain a stable labour force and fair labour practices that will attract investors and inspire economic growth in the long run.
In this 2013 Industrial Action Report, the layout of the report is as follows: Chapter One provides an overview of the strike analysis measuring the number of work stoppages, working days lost, time-loss ratio and working hours lost and wages. The analysis in this chapter is based on a comparative trend analysis over a five year’s period from 2009 to 2013, to examine how strike incidents have occurred and impacted on the South African economy.
Similar trends and patterns across provinces are examined in Chapter Two where strike by industries, employment size, strike duration and trade union involvement in work stoppages in the country between 2012 and 2013 are presented.
Chapter Three presents wage settlements in recognition to the right of workers to strike. It covers settled wages, abandoned without strikes and trade union involvement. Lastly, Chapter Four provides strike information over the twelve months of 2013 in a chronological manner as captured and monitored in the strike database. This will be followed by a brief conclusion and strike monitoring methodology in the Annexure.
1 International Labour Organisation, ILO Stat database, www.ilo.org2 Section 23 of the Bill of Rights in South Africa specifically refers to labour relations. It guarantees workers the right to fair labour
practices, to join or form trade unions and to participate in union activities and strikes.
IntroductIon

Annual Industrial Action Report | 2013
Page | 4| 4
1
2013 | Annual Industrial Action Report
5 | Page
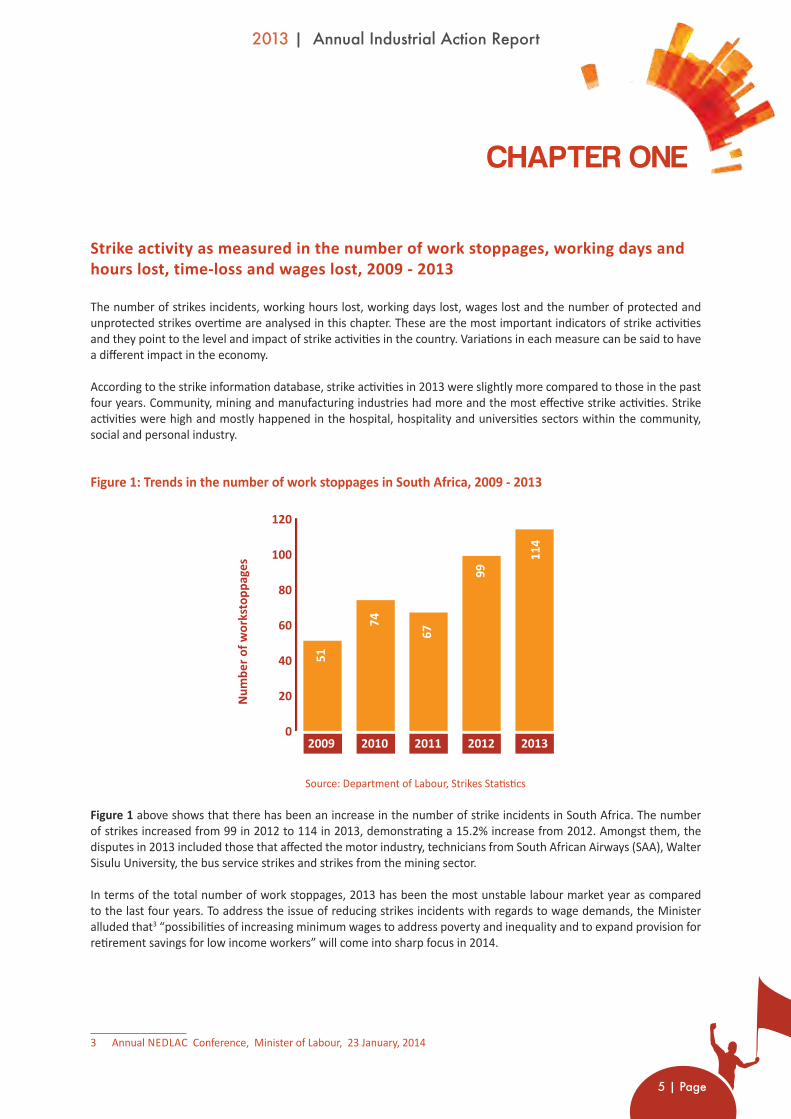
Strike activity as measured in the number of work stoppages, working days and hours lost, time-loss and wages lost, 2009 - 2013
The number of strikes incidents, working hours lost, working days lost, wages lost and the number of protected and unprotected strikes overtime are analysed in this chapter. These are the most important indicators of strike activities and they point to the level and impact of strike activities in the country. Variations in each measure can be said to have a different impact in the economy.
According to the strike information database, strike activities in 2013 were slightly more compared to those in the past four years. Community, mining and manufacturing industries had more and the most effective strike activities. Strike activities were high and mostly happened in the hospital, hospitality and universities sectors within the community, social and personal industry.
Figure 1: Trends in the number of work stoppages in South Africa, 2009 - 2013
Source: Department of Labour, Strikes Statistics
Figure 1 above shows that there has been an increase in the number of strike incidents in South Africa. The number of strikes increased from 99 in 2012 to 114 in 2013, demonstrating a 15.2% increase from 2012. Amongst them, the disputes in 2013 included those that affected the motor industry, technicians from South African Airways (SAA), Walter Sisulu University, the bus service strikes and strikes from the mining sector.
In terms of the total number of work stoppages, 2013 has been the most unstable labour market year as compared to the last four years. To address the issue of reducing strikes incidents with regards to wage demands, the Minister alluded that3 “possibilities of increasing minimum wages to address poverty and inequality and to expand provision for retirement savings for low income workers” will come into sharp focus in 2014.
3 Annual NeDLac Conference, Minister of Labour, 23 January, 2014
cHApter one

Annual Industrial Action Report | 2013
Page | 6
Figure 2: Trends in working days lost4 in South Africa, 2009-2013
Source: Department of Labour, Strikes Statistics
Figure 2 above presents the trends of working days lost due to strikes in South Africa from 2009 to 2013. It shows that there has been a decrease in the total number of working days lost from 3 309 884 in 2012 to 1 847 006 in 2013. This represents a decrease of 44.2% in the total number of working days lost from 2012 despite the total number of stoppages that increased by 54% from 2012 to 2013. The impact was high on the private sector at a contribution of 1 694 084 days lost from the total of 1 847 006 working days lost in the country.
However, an analysis by the Government Communication and Information System (GCIS) Chief Directorate of Policy and Research5 noted that “the overall media view was that in general all parties involved acted responsibly; engaging in protracted negatiations to avoid strikes where possible or to keep them as short as possible if unavoidable; and mostly steering clear of violence and intimidation”.
Figure 3: Working days lost per 1 000 employees due to strikes, 2009-2013
Source: Department of Labour, Strikes Statistics
Using the number of working days lost per 1 000 employees (time-loss ratio),6 this enables a comparison of annual average work stoppages. As shown in Figure 3 above, the working days lost per 1 000 employees due to strikes have decreased from 244 in 2012 to 131 in 2013. This represents a 46.3% decrease in working days lost per 1 000 employees. It also implies that from every 1 000 workers involved in a strike during 2013, 131 days were lost an annaul average. It represents the lowest in the past five years.
4 The working days lost due to strikes implies the total number of workers involved in the strike or lockout multiplies by the length of the work stoppage
5 Insight, A Reflection on 2013 Wage Negotiations6 This indicator allows for international comparison in strike activity. For international comparison, the ratio distinguishes which
country is strike prone when compared to another.
Wor
king
day
s los
t
1 52
6 79
6
20 6
74 7
37
2 80
6 65
6
3 30
9 88
4
0
5 000 000
10 000 000
15 000 000
20 000 000
25 000 000
2009 2010 2011 2012 2013
1 84
7 00
6
Rate
of d
ays
131
119
1 59
3
208
244
0
200
400
600
800
1 000
1 200
1 400
1 600
1 800
2009 2010 2011 2012 2013
2013 | Annual Industrial Action Report
7 | Page
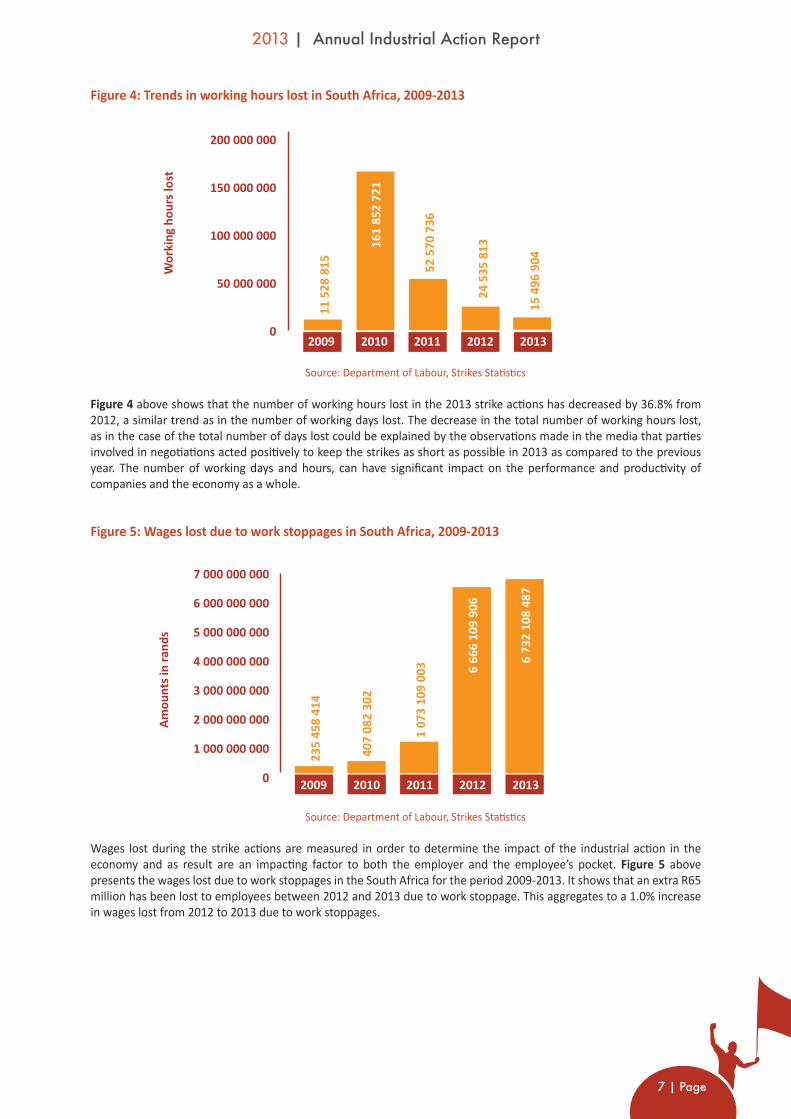
Figure 4: Trends in working hours lost in South Africa, 2009-2013
Source: Department of Labour, Strikes Statistics
Figure 4 above shows that the number of working hours lost in the 2013 strike actions has decreased by 36.8% from 2012, a similar trend as in the number of working days lost. The decrease in the total number of working hours lost, as in the case of the total number of days lost could be explained by the observations made in the media that parties involved in negotiations acted positively to keep the strikes as short as possible in 2013 as compared to the previous year. The number of working days and hours, can have significant impact on the performance and productivity of companies and the economy as a whole.
Figure 5: Wages lost due to work stoppages in South Africa, 2009-2013
Source: Department of Labour, Strikes Statistics
Wages lost during the strike actions are measured in order to determine the impact of the industrial action in the economy and as result are an impacting factor to both the employer and the employee’s pocket. Figure 5 above presents the wages lost due to work stoppages in the South Africa for the period 2009-2013. It shows that an extra R65 million has been lost to employees between 2012 and 2013 due to work stoppage. This aggregates to a 1.0% increase in wages lost from 2012 to 2013 due to work stoppages.
Wor
king
hou
rs lo
st
11 5
28 8
15
161
852
721
52 5
70 7
36
24 5
35 8
13
0
50 000 000
100 000 000
150 000 000
200 000 000
2009 2010 2011 2012 2013
15 4
96 9
04
Amou
nts i
n ra
nds
235
458
414
407
082
302
1 07
3 10
9 00
3 6 66
6 10
9 90
6
0
1 000 000 000
2 000 000 000
3 000 000 000
4 000 000 000
5 000 000 000
6 000 000 000
7 000 000 000
2009 2010 2011 2012 2013
6 73
2 10
8 48
7

Annual Industrial Action Report | 2013
Page | 8
Figure 6: Percentage distribution of protected and unprotected strikes in South Africa, 2013
Source: Department of Labour, Strikes Statistics
Figure 6 above shows that more than half (52.0%) of the strikes in 2013 were unprotected as compared to 48.0% protected strikes. This is unlike in 2012, where protected strikes amounted to 54.0%. According to the Insight, the media observations are that the 2013 strikes were not as violent or as intimidating as the previous years. For example, the media reports on the incidences of violence and intimidation during the petrol attendants strikes recorded just one death claimed to be related to this strikes. In other instances, the media reported that the employers resorted to Labour Courts for protection against violence and intimidation. Furthermore, it should also be noted that unprotected strikes can also lead company owners to start laying off striking workers.
52%48%
Protected
Unprotected
Photograph: Mail and Gaurdian
2013 | Annual Industrial Action Report
9 | Page

Annual Industrial Action Report | 2013
Page | 10
2
2013 | Annual Industrial Action Report
11 | Page
footnotes1 dsddsd2
7 The total for work stoppages in 2013 in Table 1 differs from the total of 114. This is due to national work stoppages that may affect a number of branches or establishments in the nine provinces, being counted as one in the national total but according to workplaces affected in several provinces being counted more than once.
8 Quarter averages have been rounded to the whole number since we cannot have half a work stoppage.
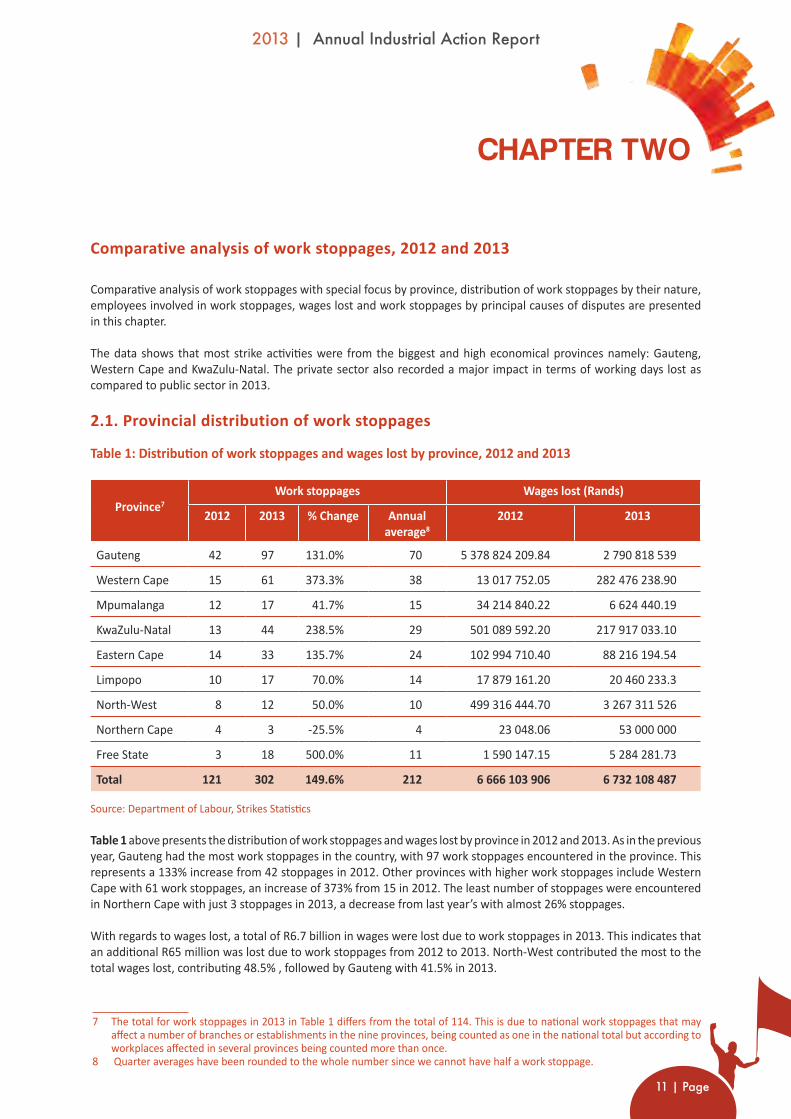
Comparative analysis of work stoppages, 2012 and 2013
Comparative analysis of work stoppages with special focus by province, distribution of work stoppages by their nature, employees involved in work stoppages, wages lost and work stoppages by principal causes of disputes are presented in this chapter.
The data shows that most strike activities were from the biggest and high economical provinces namely: Gauteng, Western Cape and KwaZulu-Natal. The private sector also recorded a major impact in terms of working days lost as compared to public sector in 2013.
2.1. Provincial distribution of work stoppages
Table 1: Distribution of work stoppages and wages lost by province, 2012 and 2013
Province7Work stoppages Wages lost (Rands)
2012 2013 % Change Annual average8
2012 2013
Gauteng 42 97 131.0% 70 5 378 824 209.84 2 790 818 539
Western Cape 15 61 373.3% 38 13 017 752.05 282 476 238.90
Mpumalanga 12 17 41.7% 15 34 214 840.22 6 624 440.19
KwaZulu-Natal 13 44 238.5% 29 501 089 592.20 217 917 033.10
Eastern Cape 14 33 135.7% 24 102 994 710.40 88 216 194.54
Limpopo 10 17 70.0% 14 17 879 161.20 20 460 233.3
North-West 8 12 50.0% 10 499 316 444.70 3 267 311 526
Northern cape 4 3 -25.5% 4 23 048.06 53 000 000
Free State 3 18 500.0% 11 1 590 147.15 5 284 281.73
Total 121 302 149.6% 212 6 666 103 906 6 732 108 487 Source: Department of Labour, Strikes Statistics
Table 1 above presents the distribution of work stoppages and wages lost by province in 2012 and 2013. As in the previous year, Gauteng had the most work stoppages in the country, with 97 work stoppages encountered in the province. This represents a 133% increase from 42 stoppages in 2012. Other provinces with higher work stoppages include Western Cape with 61 work stoppages, an increase of 373% from 15 in 2012. The least number of stoppages were encountered in Northern Cape with just 3 stoppages in 2013, a decrease from last year’s with almost 26% stoppages.
With regards to wages lost, a total of R6.7 billion in wages were lost due to work stoppages in 2013. This indicates that an additional R65 million was lost due to work stoppages from 2012 to 2013. North-West contributed the most to the total wages lost, contributing 48.5% , followed by Gauteng with 41.5% in 2013.
cHApter two

Annual Industrial Action Report | 2013
Page | 12
2.2. Industrial distribution of work stoppages
Figure 7: Distribution of work stoppages by industry, 2012 and 2013
Source: Department of Labour, Strikes Statistics
Figure 7 above shows the distribution of work stoppages by industry in 2012 and 2013. It shows that overall, the community industry had the most stoppages, followed by the mining and manufacturing industries. The community industry encountered 34 stoppages in 2013, an increase of 21.4% from 28 in 2012, while the mining industry had 25 stoppages in 2013, increasing by 31.6% from 19 in 2012 and the manufacturing industry suffering 23 stoppages in 2013, an increase of 27.8% from 18 in 2012. The bus driver strike reportedly left commuters stranded as they had to stand in long queues for taxis and it also affected their pockets as they had to pay higher costs for transport.
2.3. Industrial distribution of working days lost
Table 2: Distribution of working days lost by industry, 2012 and 2013
Industry Working days lost
2012 2013 % Contribution
Agriculture 123 369 64 442 3.5
Mining 2 728 359 515 971 27.9
Manufacturing 188 804 343 222 18.6
Electricity 1 484 3 232 0.2
Construction 10 124 250 243 13.5
Wholesale, retail trade 13210 47 216 2.6
Transport 135 186 477 355 25.8
Financial intermediation 964 20 415 1.1
Community services 108 384 124 910 6.8
Total 3 309 884 1 847 006 100.0
Source: Department of Labour, Strikes Statistics
0
5
10
15
20
25
30
35N
umbe
r of w
ork
stop
ages
Tran
spor
t
Com
mun
ity
Who
lesa
le
Fina
nce
Cons
truc
�on
Elec
tric
ity
Man
ufac
turin
g
Min
ing
Agric
ultu
re
1214
3428
69
31 35 13
2318
2519
5 5
2012
2013
2

2013 | Annual Industrial Action Report
13 | Page
vvv 1
9 We used quarter 3 revised QLFS number of employees by industry to determine the Working days lost per 1 000 employees by industry
Table 2 presents the distribution of working days lost by industry in 2012 and 2013. It shows that there has been a decrease of 44.2% in the total number of working days lost, from 3 309 884 in 2012 to 1 847 006 in 2013. In terms of the percentages contribution to the total number of working days lost, the mining industry (27.9%) contributed the most, followed by the transport industry (25.8%). The strikes experienced in the mining industry were peaceful as compared to the wildcat strikes in 2012. The mining industry experienced the strikes after the unions demanded the basic wage in the gold sector to increase from R4 000 to R7 000 and underground workers wage to go up from R5 000 to R8 000 a month. The mining and transport industries jointly contributed over half (53.7%) of the total working days lost in 2013. The manufacturing industry was also badly affected, contributing 18.6% to the total days lost. The electricity and finance industry lost the least number of working days, in total contributing just 1.3% to the total working days lost between them.
2.4. Working days lost per 1 000 employees by industry
Table 3: Distribution of working days lost per 1 000 employees by industry, 2012 and 2013
Industry Time-loss ratio9
2012 2013
Agriculture 180.1 870.8
Mining 7 642.4 1 222.7
Manufacturing 109.1 193.0
Electricity 15.1 23.3
Construction 9.54 218.6
Wholesale, retail trade 4.52 149.9
Transport 165.6 134.9
Financial intermediation 0.5 229.2
Community services 35.7 6.1
Source: Department of Labour, Strikes Statistics
Table 3 shows the distribution of working days lost per 1 000 employees by industries. The table shows a decrease in the number of working days lost per 1 000 in the mining industry, from a hefty 7 642.4 in 2012 to 1 222.7 in 2013. The decrease can be linked to the impact that the mining sector experienced during the 2012 strike season. The other industry to have decreases in days lost per 1 000 employees are electricity, transport and community services. Agriculture, finance intermediation and construction industries recorded increases in days lost per 1 000 employees in 2013 from 2012. The increase in working days lost per 1 000 employees involved in strikes in the construction industry was due to the large strike that contributed to the devaluation of the domestic currency (Rand) in 2013.

Annual Industrial Action Report | 2013
Page | 14
2.5. Industrial distribution of working hours lost
Table 4: Distribution of working hours lost by industry, 2012 and 2013
Industry Working hours lost
2012 2013 % Contribution
Agriculture 1 106 550 608 090 3.9
Mining 19 789 694 3 630 625 23.4
Manufacturing 1 391 357 3 337 979 21.5
Electricity 10 634 25 856 0.2
Construction 88 495 2 207 375 14.2
Wholesale, retail trade 115 032 458 434 3.0
Transport 1 135 922 3 825 742 24.7
Financial intermediation 7 687 163 480 1.1
Community services 890 441 1 239 324 8.0
Total 24 535 813 15 496 904 100.0
Source: Department of Labour, Strikes Statistics
The distribution of working hours lost due to strikes by industry is shown in Table 4. As with the total number of working days lost, the total number of working hours lost has decreased. A decrease of 36.8% in the total number of working hours lost in 2013 reiterates the observation that those involved in disputes acted swiftly to keep the strikes as short as possible.
In terms of the percentage contribution to the total number of working hours lost, the transport industry contributed the most (24.7%), followed by the mining (23.4%) and manufacturing (21.5%) industries. The least contribution was from the electricity and finance industries, contributing a total of 1.3% between them.
A high percentage of working hours lost from the manufacturing industry was attributed to the big car manufacturers that were affected by the strikes. These companies included Volkswagen, General Motors, Ford, Toyota and Mercedes Benz.

2013 | Annual Industrial Action Report
15 | Page
2.6. Industrial distribution of workers involved in work stoppages
Table 5: Distribution of employees involved in work stoppages by industry, 2012 and 2013
Industry Employees involved
2012 2013 % Contribution
Agriculture 11 078 8 417 2.8
Mining 138 993 204 661 68.9
Manufacturing 56 324 21 718 7.3
Electricity 1 078 1 458 0.5
Construction 2 793 13 083 4.4
Wholesale, retail trade 4 170 1 939 0.7
Transport 12 900 22 331 7.5
Financial intermediation 160 1 066 0.4
Community services 13 877 22 520 7.6
Total 241 391 297 193 100.0
Source: Department of Labour, Strikes Statistics
One of the factors that have a direct impact on the increase in wages lost in 2013 despite the decrease in number of days and hours lost is the numbers of employees involved in work stoppages. The number of employees involved in work stoppages have increased from 241 391 in 2012 to 297 193 in 2013, an increase of 23.1%. The majority of the employees involved (68.9%) in the work stoppages in 2013 were in the mining industry. Other industries that had a noticeable contribution to the total number of employees involved were the community services (7.6%), transport (7.5%) and manufacturing (7.3%) industries.
On the other hand, the financial intermediation, electricity, and retail trade industries recorded the least members who participated in dispute actions in 2013.
Photograph: Miora Rajaonary

Annual Industrial Action Report | 2013
Page | 16
2.7. Nature of work stoppages
Figure 8: Distribution of work stoppages by their nature, 2012 and 2013
Source: Department of Labour, Strikes Statistics
The distribution of the nature of work stoppages comparing 2012 and 2013 is presented in Figure 8. As shown, most of the strikes 81 (71.1%) of the 114 work stoppages in 2013 were “Strike in company only” and 28 strikes (24.6%) were multi-employer strikes. Some of the strikes in company only were realised from the transport, mining, construction, agriculture and manufacturing industries. The year 2013 witnessed a decline in strikes affecting stay away/protests 4 (73%) as compared to 2012. There was no picketing or lock-outs in the 2013 strike season.
Num
ber o
f Wor
k st
opag
es
Strik
e in
com
pany
onl
y
Pick
e�ng
Seco
ndar
y Ac
�on
Stay
aw
ay/
prot
est
Mul
�-em
ploy
er st
rike
Lock
out
5981
0 0 1 1 215
1628
8 00
20
40
60
80
100
4
2012
2013

2013 | Annual Industrial Action Report
17 | Page
2.8. Work stoppages by employment size of establishments
Figure 9: Percentage distribution of establishments affected by work stoppages by employment size, 2012 and 2013
Source: Department of Labour, Strikes Statistics
Figure 9 shows that all establishments were affected by the strikes, regardless of their sizes. However, the smallest establishments with less than 50 employees were the most affected by the strikes in 2013. From the 114 work stoppages in 2013, 30.4% were in the establishments with less than 49 employees, an increase from 26.4% in 2012. Establishments with 50-149 employees were the second most unstable, encountering 19.3% of the 114 work stoppages in 2013, a decrease from 24.3% in 2012. The largest establishments with more than 1 000 employees encountered 19.6% of the 114 work stoppages, also an increase from 14.8% in 2012. This implies that the work stoppages have increased in both the largest and smallest establishments in 2013.
Establishment size
Perc
enta
ges
> 49
50 -1
49
150
-299
300
- 499
500
- 900
> 1
000
30.4
0%26
.40%
19.3
0% 24.3
0%
12.8
0%15
.50%
9.20
%7.
70%
8.70
%11
.40%
19.6
0%14
.80%
0
5
10
15
20
25
30
352012
2013

Annual Industrial Action Report | 2013
Page | 18
2.9. Duration of work stoppages
Figure 10: Percentage distribution of work stoppages by duration, 2012 and 2013
Source: Department of Labour, Strikes Statistics
Figure 10 shows the percentage distribution of work stoppages by duration for years 2012 and 2013. About a quarter (26.3%) of the work stoppages were reasonably short, lasting 1-5 days. In 2013, just 15.1% of the work stoppages lasted for 6-10 days, a difference of 23.4% from 38.5% in 2012. There were reasonably high percentages of work stoppages that lasted for 11-15 days (19.8%), 16-20 days (21.0%) and 21-30 days (14.5%). Amongst those are the Document Warehouse that lasted for 70 days, Rumdel Construction at 57 days and 3D marketing with 52 days.
One chief economist7 reported that production could be recovered for any strike that lasted for one or two days, but it becomes increasingly difficult to achieve this if the strike lasted for 8 or 10 days.
7 Mike Schüssler, the chief economist of economist.co.za, Business Times 2013
Perc
enta
ge w
orks
topa
ges
< 1
day
1 - 5
day
s
6 - 1
0 da
ys
11 -
15 d
ays
16 -
20 d
ays
> 4
0 da
ys
0.0%
0.0%
22.2
% 26.3
%
38.5
%
15.1
%
16.4
% 19.8
%
5.9%
21.0
%
9.1%
14.5
%
1.7%
1.1% 2.1%
2.2%
21- 3
0 da
ys
31 -
40 d
ays0
5
10
15
20
25
30
35
402012
2013
Dura�on

2013 | Annual Industrial Action Report
19 | Page
2.10. Principal cause of strike activity measured in working days lost
Table 6: Distribution of working days by principal cause of dispute, 2012 and 2013
Principal cause 2012 % difference 2013 % % difference
Wages, bonus and other compensation
2 699 411 81.6% 1 378 351 76.6% -5%
Working conditions 74 684 2.3% 34 933 1.9% -0.4%Disciplinary matters 0 0.0% 17 450 1.0% 1.0%Grievances 33 794 1.0% 120 431 6.5% 5.5%Socio-economic and political conditions
71 314 2.2% 30 713 1.7% -0.5%
Secondary action 2 082 0.1% 3 532 0.2% 0.1%Retrenchments/redundancy 0 0.0% 176 0.0% 0.0%Refusal to bargain 13 979 0.4% 1 818 0.1% 0.3%Trade union recognition 1 603 0.0% 67 203 3.6% 3.6%Other compensation combined with other factors
30 364 0.9% 155 095 8.4% 7.5%
Other reasons 382 653 11.7% 37 304 2.0% -9.7%Total 3 309 884 100.0% 1 847 006 100.0% 0.0%
Source: Department of Labour, Strikes Statistics
The main causes of industrial actions are also provided in the LRA 9.2 form and captured in the strike database. Table 6 shows that just as in 2012, wage, bonus and other compensation disputes remained the major reason for work stoppages in 2013. In relation to days lost, 76.6% of the days lost were due to wage, bonus and other compensation disputes. This could be seen in the context of a high number of people claiming higher wage increases to meet their socio-economic needs. This trend has been consistent over the years. Thus, the argument of national minimum wages should be explored and welcomed in the South African economy. Other compensation combined with other factors (8.4%) and grievances (6.5%) were also recorded as other principal causes of stoppages to cause a loss of a notable number of working days.
Photograph: www.thepeoplesrecord.com

Annual Industrial Action Report | 2013
Page | 20
2.11. Trade union involvement in work stoppages
Table 7: Working days lost by trade union 2012 and 2013
2012Working days lost
% 2013Woking days lost
%
AGENCY SHOP 1 0.0 0 0.0
AMCU 4 500 0.1 134 064 7.3
BAWUSA 39 453 1.2 17 222 0.9
BCAWU 0 0.0 24 023 1.3
CCRAWUSA 0 0.0 299 0.01
CEPPWAWU 7 317 0.2 7 668 0.4
COSAWU 303 0.0 0 0.0
CSAAWU 502 0.0 302 0.01
CWU 628 0.0 1 306 0.1
CAWUSA 0 0.0 350 0.01
DENOSA 4 0.0 8 597 0.5
FAWU 100 288 3.0 26 968 1.5
FMAIWU 3 696 0.1 0 0.0
GIWUSA 170 0.0 8 956 0.5
HOSPERSA 208 0.0 157 0.01
HOTeLLIca 675 0.0 0 0.0
HICRAWU 0 0.0 270 0.01
ICCAFAWU 9 095 0.3 0 0.0
IMATU 0 0.0 11 679 0.6
ITU 86 0.0 10 425 0.6
MEWUSA 138 0.0 4 986 0.3
MIBc 296 0.0 0 0.0
MTWU 350 0.0 0 0.0
MWASA 261 0.0 0 0.0
NAPTOSA 54 0.0 0 0.0
NDCAWU 792 0.0 0 0.0
NEHAWU 22 673 0.7 11 8532 6.4
NTM 0 0.0 67 963 3.8
NONe 448 631 13.6 76 934 4.2
NUFBSAW 0 0.0 4 053 0.2
NUM 832 751 25.2 321 598 17.4
NUMSA 107 770 3.3 305 398 16.3
PSA 21 0.0 305 0.01
PTAWU 759 0.0 0 0.0
SACCAWU 22 424 0.7 9 289 0.5
SACTWU 13 385 0.4 0 0.0
SACU 2 0.0 0 0.0

2013 | Annual Industrial Action Report
21 | Page
SACWU 72 0.0 0 0.0
SADTU 0 0.0 1 993 0.1
SAEPU 300 0.0 0 0.0
SAEWA 243 0.0 0 0.0
SAMWU 16 977 0.5 23 471 1.3
SAPTU 1 050 0.0 0 0.0
SAPWU 66 0.0 1 306 0.1
SATAWU 40 366 1.2 466 206 25.2
SS 16 0.0 122 0.01
SOLIDARITY 191 0.0 240 0.01
TAWUSA 392 0.0 20 787 1.1
TAWU 182 0.0 0 0.0
TOWU 1837 0.1 138 319 7.5
TWU 1158 0.0 11 700 0.6
UASA 418 0.0 2 604 0.1
UNICIMESHAWU 22 0.0 0 0.0
Source: Department of Labour, Strikes Statistics
Table 7 depicts working days lost per trade union as a result of work stoppages. Memberships of trade unions proportions reflects a shift where dominance was realised from SATAWU at 25.2%. This was as a result of the national bus strike that too happened during April and May where workers were striking over an 18% wage increase demand. Unlike in 2012, NUM and AMCU had more member participation in strike actions. NUM recorded less members (7.8%) participating in strikes during 2013 as opposed to 2012. Following this, it is possible that members decided to refrain from embarking on strike action because participation amounted to “no work no pay” or they would have to find employment elsewhere.

Annual Industrial Action Report | 2013
Page | 22
2.12. Determinants identified as giving rise to work stoppages in South Africa
It has been acknowledged by all parties in the country that unemployment, poverty and inequality have been a persistent challenge for South Africa, since the inception of the democratic Government. The battle against poverty is ongoing and Government is fighting hard to assist in the eradication of poverty. For example the social grants and no-fee school policy are supporting most families in making strides to exit severe poverty. However, inequality still remains another major challenge. For the workers, this is a case of rising income inequalities between the labourers and the company executives. The findings in this report still confirm that the strikes in 2013 were due to disputes over wages, bonuses and other compensation. Unions claim that the companies report increasing outputs while the workers struggle in poverty to uplift themselves. This implies that workers and unions go into negotiations seeking higher wage increases in order to meet the rising living standards, exacerbated either by the tough domestic or international economic conditions. Therefore, unmet demands for higher wage demands in big or small companies result in strikes because workers understand their legislative right to fight for better socio-economic conditions.
The South African President8 stressed that “we cannot have conflict that destroys the economy (workers loses their jobs)”. This was a plea by the President to mine bosses and trade unions in the mining sector to stop unnecessary strikes leading to job losses.
In the mining sector, the battle lines are drawn between AMCU and NUM as they struggle for members and power. In a gold sector dispute, AMCU have refused to join the strike, leading to speculations that AMCU will wait for NUM to settle, and then call a second-wave strike. This poses a challenge for employers, as they seek one settlement. The battle between AMCU and NUM could undermine future negotiations, in that the focus of the unions is not on the wage outcome, but on the political balance of power following the wage outcomes and thus resulting in more regular or a prolong strikes.
2.13. Work stoppage future outlook for 2014
Most observers caution for continued labour unrest in 2014 for the struggling South African economy. Unions continue to demand high wage increases, while employers complain that such wage increases could push them out of business and into company closures resulting in high unemployment. The struggles for power between AMCU and NUM are predicted to have a negative impact on the stability of the labour force in the mining industry. Based on its contribution to the tax revenue and its employment creation, it is important that the trade union leaders and the mine owners work together for “open negotiations” in order to meet worker’s interests which can minimize strikes in the industry in 2014.
By the end of 2013, Government, Organised Labour and Organised Business were planning a year-end summit to discuss the ways of minimising the collective damage caused by protracted strikes as they look to stabilise the labour force, advance economic growth and assure investor confidence. It is projected that 2014 will probably be a relatively calm year if these directives are well implemented by all parties in the country.
8 President Jacob Zuma, the State of the Nation (SONA), February 2013

2013 | Annual Industrial Action Report
23 | Page

Annual Industrial Action Report | 2013
Page | 24
cHApter tHree
3
2013 | Annual Industrial Action Report
25 | Page
Wage settlements
This chapter reflects on the wage agreements concluded with and without strike incidents, and suspended strikes between the employers, bargaining councils and other employee representatives. This is to allow bargaining processes to assist in bringing about reasonable wage agreements and settlements in striving to meet employee’s needs.
South African bargaining councils experienced peaceful bargaining processes in 2013 as opposed to the 2012 bargaining processeses where it took long to conclude wage negotiations to reach agreements characterised by violent industrial action and work stoppages.
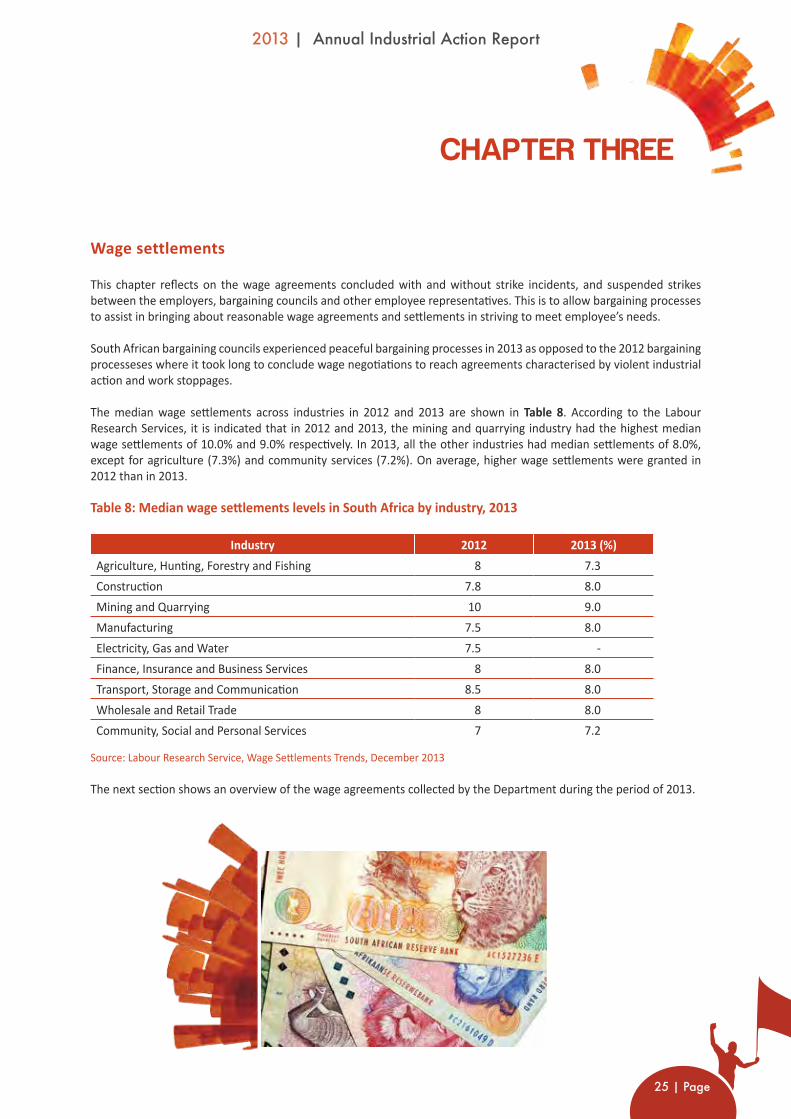
The median wage settlements across industries in 2012 and 2013 are shown in Table 8. According to the Labour Research Services, it is indicated that in 2012 and 2013, the mining and quarrying industry had the highest median wage settlements of 10.0% and 9.0% respectively. In 2013, all the other industries had median settlements of 8.0%, except for agriculture (7.3%) and community services (7.2%). On average, higher wage settlements were granted in 2012 than in 2013.
Table 8: Median wage settlements levels in South Africa by industry, 2013
Industry 2012 2013 (%)Agriculture, Hunting, Forestry and Fishing 8 7.3Construction 7.8 8.0Mining and Quarrying 10 9.0Manufacturing 7.5 8.0Electricity, Gas and Water 7.5 -Finance, Insurance and Business Services 8 8.0Transport, Storage and Communication 8.5 8.0Wholesale and Retail Trade 8 8.0Community, Social and Personal Services 7 7.2
Source: Labour Research Service, Wage Settlements Trends, December 2013
The next section shows an overview of the wage agreements collected by the Department during the period of 2013.
cHApter tHree
Annual Industrial Action Report | 2013
Page | 26
3.1. Wage settlements concluded in various industries
3.1.1. Manufacturing
• On 25 January, NUMSA members at PMP embarked on a protected strike over a wage dispute with Denel as Denel failed to adhere to a collective bargaining agreement signed between the union and its senior management. Employees demanded equal pay for equal work after the employer was offering adjustments on Peromnes Grades 17–13 to move 4% below the average of that particular grade. On 20 February, parties reached consensus where 299 employees would receive adjustments while 302 employees within the 4% did not get adjustments
• Employees in the meat industry downed tools demanding a 15% salary increase while the International Meat Quality Assurance Services was offering 2 - 6% increase. On 12 April, parties came to an agreement to increase salaries by 10%
• In March, NUMSA members from Powertech started a strike demanding extra payment for a production bonus. The employer agreed to include one more unit on the bonus payment, verbally. The inclusion of the unit amounted to an extra R1 300 as bonus payment
• Workers in the leather tanning sector in Cape Town agreed to a 7% pay rise. The deal was in line with a two-year wage agreement reached last year between SACTWU and the tanning sector employers. On 21 April, again parties agreed to increase salaries where the agreement will be effective from 1 April for the period of twelve months, with settlements ranging from 7.4% to 10%
• Employees associated with FAWU at Dairy Belle, downed tools demanding R900 and R800 wage increases across the board while the employer was only offering R250. On 2 February, a consensus was reached by both parties on a R305 increment applicable for the period 1 October 2012 to 30 September 2013
• Workers affiliated with CEPPWAWU at LUFILE Packaging went on strike over a salary increase demand. Both the employer and the union reached a wage deal of 12.5% after employees’ demanded a 35% salary increase
• SACTWU settled its national wage dispute in the cotton textile sector. The settlement provided for a seven percent wage increase, backdated to 1 July 2013. The agreement will benefit about 7 000 cotton textile workers employed in 65 factories
• The minority of employees at SAB Miller participated in the walkout on 1 October. FAWU demanded a 9% wage increase meanwhile SAB Miller offered an average increase of 7%, with 60% of this across the board and 40% of it payable as “non-guaranteed” performance-related pay. On 4 November, parties managed to reach an agreement of 7% plus performance-related pay, back-dated to 1 July, whereas other issues of the provident fund and medical scheme and disability cover would be reviewed at a later stage
• NUMSA members started a strike demanding extra payment as a production bonus on 11 and 12 March. The employer agreed to include one more unit on the bonus payment verbally. The inclusion of the unit amounted to R1 300 extra on the bonus payment
• NUMSA members from the retail motor industry organisation downed tools on 9 September demanding a 10% wage increase for 2013, 2014 and 2015 and 12.5% in all other sectors across the board for workers earning more than R6 000, a night-shift allowance of 20% of the normal rate of pay and an afternoon shift allowance of 15%. In October 2013, a multi-year agreement was reached. According to the settlement reached, workers in the component, manufacturing sector will receive a 10% increase 2013, and 8% increases in both 2014 and 2015.
3.1.2. Finance, Insurance and Business Services
• SAMWU members from Ithala Development Finance Corporation Limited embarked on a strike demanding a wage increase of 7-9%. On 28 May, parties agreed to increase the salaries with effect from 1 April 2013 untill 31 March 2014 by 7-9 % depending on the job grade, 12% increase on the shift allowance depending also on employee’s salaries and R1 300 once off to the employees who participated in the strike.

2013 | Annual Industrial Action Report
27 | Page
3.1.3. Transport, Storage and Communication
• Taxi drivers called for a wage increase from the owners demanding R3 500 a month, boarding allowance of R279.93 to be raised to R350 and not to work more than nine hours a day. The agreement reached in May was to increase the incomes by CPI + 2% that is 5.9 + 2% which add up to 7.9 % increment for the period of one year, 1 July 2013 until 30 June 2014
• In 2012, SATAWU, PTAWU and the Road Freight Employers Association agreed on a three-year deal dating from 1 March 2013 where employees would receive a minimum 8% salary increase and night shift allowance of 7%. This came after employees were demanding 12%. On 14 February 2013, the agreement was amended to include a minimum wage increase of 10% across the board to all employees employed prior to the scheduled new wage deal. A new sub-item added to the agreement which makes provisions for an extended bargaining unit for employees graded up to and including C1 on the Patterson Grading system states thus: A 7% increase across the board for employees who earn R183 008 (current Basic of Conditions of Employment Act threshold) or less per annum and a 6% increase for employees who earn more than the current threshold plus 30% which is R237 910.40 per annum
• On 19 April, SATAWU and other unions embarked on a nationwide bus strike demanding an 18% salary increase, allowances for housing, night-shifts, and long-distance journeys whiles the employer was offering 6.5%. On 13 May, a fifteen-month wage agreement was concluded with a wage agreement of 10% increase from April
• On 7 August, BEMAWU and CWU members demanded a 9.5% rise across the board and a R1 500 allowance for housing, R300 for subsistence and travelling and R55 for meals. SABC management was offering a 7.44% salary increase, with no “movement on other conditions of employment”. Unions claimed increases of over 40% to some executives were affected in the last financial year when the company was bleeding financially. All parties signed an agreement for an 8.5% increase across the board with effect from 1 April 2013 and R1 500 once-off payment after tax
• A wage increase agreement was reached between UASA, SATAWU and South African Airways management after staff at the airways went on a wage increase demand strike. An agreement to a wage increase of 6.5% in workers’ basic salaries, housing allowances and medical contributions was agreed to after an initial wage demand of 9%.
3.1.4. Wholesale and Retail Trade
• The Hospitality, Industrial, Catering Retail and Allied Workers and Professional Caterers Association signed a three year wage agreement of 9% year 1, year 2 of 6% and year 3 was CPI + 2% and CPI. The agreement came after the Bargaining Council negotiated for about 200 outlets like; Wimpy, Nando`s, Pie City, Romans Pizzas, Fedics, King Pie, Chicken Licken, KFC. Compass groups raised their voices in demand of a 12% minimum salaries and 10% across the board increase for those earning above the current minimum salaries, improved hourly rates for Sunday and Public Holiday work, paid sick leave for casual workers, annual bonus, family responsibility leave, and the scrapping of independent waitron category, the abolishment of using labour broking and the conversion of these category of work to full-time position.
3.1.5. Community, Social and Personal Services
• Thousands of workers associated with NEHAWU, DENOSA, HORSEPERSA and SOLIDARITY at Netcare hospitals downed tools demanding wage increases ranging from 12% to 15% while the management was offering only 8%. Netcare Hospitals (Pty) Ltd reached an agreement in March 2013 with HOSPERSA, DENOSA and Solidarity on a 7.2% increase while NEHAWU agreed on 7.25% after their demand of 11%
• On 16 April, UNISA staff associated with NEHAWU and the Academic and Professional Staff Association embarked on a strike demanding a 11.7 % wage increase while the management was offering only 5.6% and later 7%. Both parties agreed to a 7% increase on 19 April
• On 28 February, staff at the University of Technology of Durban went on a strike demanding a 12% increase and R500 increase in the housing subsidy, while management was offering a 5% salary increase and 1.5% in medical and housing subsidy increase. On 27 March, both parties agreed to increase the salaries, P5-P2 employees by 5%, P9-P6 employees by 7% and P16–P10 employees by 9% and 1.5 % increase for medical aid and housing benefits

Annual Industrial Action Report | 2013
Page | 28
• On 19 April, SATAWU, TOWU and South African Bus Association members embarked on a nationwide strike demanding a 18% salary increase, allowances for housing, night-shifts, and long-distance journeys whereas the employer was offering 6.5%. In May 2013, a fifteen-month 10% wage agreement was concluded. All parties agreed on a 9.5% effective from 1 April and a further 0.5% that would kick in later during the year
• A wage agreement was reached between NEHAWU and the Walter Sisulu University staff after officials embarked on a wage strike. Employees went on strike demanding on 18% salary increase and later 8–10% where management was offering 4.25%. A consensus was reached to increase the salaries by 5%. Staffers were also offered a once-off opportunity to migrate to a preferred retirement fund
• A 6% wage agreement was reached between employee’s representatives and Kelly Industrial after a wage strike. This came after officials downed tools over a 6% wage demand
• More than 120 workers at Document Warehouse in Selby, Southern Johannesburg downed tools on 3 July over poor salaries, demanding R10 000 across the board. The employer was offering 8% or R675 plus additional amount ranging from R50-R175 depending on the years of service. Employees were reportedly earning R3 000 a month, while some of them claimed to have been with the company for more than 10 years. Parties managed to reach an agreement to increase earnings by 8% and additional amounts depending on the years of experience
• A group of senior analysts and economists at the Competition Commission of SA engaged on a lunchtime picketing on 2 September. They were demanding better salaries and an end to the alleged victimisation of staff by management. Their initial demand for a wage increase was reduced from 22% to 15%. The offer on the table was 8% with an undertaking by management to do a benchmark study to compare the pay levels of the commission’s staff with those of other state institutions. Finally parties agreed to increase salaries by 7.5 % and a 1% performance linked increase effective from April 2013.
3.1.6. Agriculture
• In 2012 November, employees on the farms at De Doorns, Cape Town downed tools till January 2013 demanding a wage increase of R 150 a day. Through intervention of the Department of Labour, the recalled strike caused the farm owners to agree on the wage hike of R105 per day.
Photograph: www.dailymaverick.co.za
2013 | Annual Industrial Action Report
29 | Page
3.1.7. Mining and Quarrying
• Approximately 500 rock drill operators at Northam Platinum’s Zondereinde mine went on strike in April in demand of wage increase. The workers were demanding a 38% increase in their bonuses whereas the employer was offering an average increase of between 9.0% and 9.5% on wages and an increase in the living out allowance from R1 600 to R1 750 per month. Employees received a return-to-work compensation comprising of an once-off payment equivalent to 50% of their basic wages for the duration of the strike period and R2 000 extra
• During April, NUM members at New Adventure downed tools demanding R30 a day. After two weeks of protesting, a consensus was reached between the two parties that workers be paid R17.60 – R19.60 per hour
• Employees at Exxaro (Arnot, Matla, Leeuwpan, Inyanda and Grootgeluk coal) downed tools demanding payment of performance bonuses. The mining company made an offer of R2 800 to NUM members and it was accepted by the employees
• In May 2013, 400 miners at Granite Miner in Rustenburg went on strike demanding between 131% and 350% salary increase. In practice they wanted R9 000 increase from the current salary of R2 000 and R2 700 a month. The employer made an offer of R1.15 (i.e. 5.9%) an hour. Consensus was reached to give employees R1.20 per hour across the board and they promised to give another 20 cents per hour after 6 months. In percentage terms, it works out to an average of ±15%
• Employees at Lanxess Chrome Mine went on strike demanding annual performance bonus increases as they accused management of solely sharing the bonuses. The mine made an offer of an additional payment which considered efforts of staff doing staff safety and production. The parties agreed to an once-off performance payment to be paid on 23 May 2013. The payment is related to the present and future performance of the mine, as well as safety targets and was to be done in two steps; where workers would receive a bonus of R3 500 on 28 May and an extra 2% bonus in June 2013 on conditions that production targets are met
• On 16 September, about 100 workers employed at Somkhele went on strike following failure to achieve a settlement in wages and employee benefits in KwaZulu-Natal. The workers demanded a 12% increase, R1 400 housing and R2 500 medical aid allowance. In October, a two-year agreement was reached to increase earnings by 8% for 2013/14 for Somkhele’s lowest-paid workers with a further 7.5% increase for 2014/15. Other pay-grades received negotiated increases of 5.5% to 7%. It was further agreed to create forums in order to improve performance and productivity at R930 per month
• About 600 workers at DRD Gold’s Ergo gold operation, near Johannesburg, downed tools on 8 October in a protected strike demanding that all entry-level, category 4 employees be promoted to category 6 and that a skills retention increase allocated to engineering foremen be extended to all foremen. On 10 October, parties reached a two-year wage agreement where entry-level employees in job categories four and five would receive a 10% basic wage increase in year one and 8% in year two. Employees in job categories six and seven would receive 9% in year one (2013) and 7.5% in year two (2014), employees in job categories eight to 15 would receive 8% in year one (2013) and 7.5% in year two (2014)
• Petra Diamonds mine shafts got hit by wage-related work stoppages on 29 August at Cullinan Diamond Mine, East of Pretoria. The wage negotiations commenced in July and the strike action followed a breakdown in talks and a deadlock at the CCMA. NUM claimed that employees were earning about R4 000 a month and were therefore demanding a monthly wage of R8 000. On 18 September, parties came to an agreement after the union accepted a 9.5% salary increase, R650 for medical aid and R650 for housing allowance
• NUM members downed tools on 5 August in a protected strike at Rand Refinery in Germiston after mediation failed at the CCMA where unions were demanding a 20% increase across the board. The employer was only offering 7%. An agreement was concluded on the 8 August to increase salaries by 8%.
3.1.8. Construction
• From 13 March to 29 of April, NUM members employed by Corobrick went on strike demanding 34% salary increases while the employer was offering 7.5%. On 29 April parties agreed to a salary increase of 7.5 %.
Annual Industrial Action Report | 2013
Page | 30
• NUM members at Polokwane Bricks PTY LTD downed tools in February demanding an increase of R10 an hour on their current rates. The employer was offering R1.50 per hour. An agreement was eventually reached where a person who earns R5.50 an hour would earn R7.00.
3.1.9. Electricity, Gas and Water
• On 7 June, both parties Medupi Kusile and ESKOM signed a partnership agreement at its Medupi and Kusile power station construction projects after an outcry for bonus pay. The agreement included a number of issues:
a. A guaranteed minimum wage of R25 for all hourly-paid contract employees and standardised pay rates within industries
b. Normal time hours for the MEIBC are 40 hours per week whilst for BCCEI it is 45 hours per week
c. The monthly project wage allowance will be calculated as follows: Kusile and Medupi project allowance = (minimum wage rate per hour [R25] less current basic rate per hour [R20.50]) x normal time hours per month
d. Overtime is therefore calculated based on the basic rate of pay (excluding Kusile and Medupi Project allowance). Should industry minimum rates supersede the R25 per hour then the industry rate will be applicable
e. For new contractor employees, the R25 per hour minimum wage will only take effect after the completion of eight weeks of employment
f. The payment of this Kusile and Medupi project allowance was to be effective from 12 June 2013 and paid by the applicable payroll dates
g. The standard rate will be R2.50 per kilometre before tax. Employees using transport supplied by the Contractors to travel home will not be entitled to R2.50 per kilometre
h. All employees travelling on a daily basis to and from site with company-supplied bus transport will be paid a commuting allowance. The wage rates and benefits for Full Time Shop Stewards will be standardised across Medupi and Kusile sites, and will be implemented in the July 2013 payroll.
Photograph: Mail and Gaurdian
2013 | Annual Industrial Action Report
31 | Page
3.2. Wage settlements concluded without strike incidents
• Employees secured a 6.5% wage increase and a handful of benefits. Parties including the South African Municipal Workers’ Union and the Independent Municipal and Allied Trade Union have agreed to a three-year wage agreement after workers were demanding 15% from the State’s offer of 4%. The offer entails that in 2013, workers will get the average CPI +1.25% and in 2014 average CPI +1% plus 100% medical aid subsidy for the lowest income workers
• A “compromise” agreement on an above-inflation 9% wage increase for lowest-ranked employees was reached between NUM and De Beer. This came after the worker’s initial wage demand was 13% wage increase, while the company had offered 6%. Apart from the wage negotiations, De Beers intended to phase out the lowest employee ranking, the category-A band over the next three months, and intends to the move up the 25 employees within that grading into the category-B band
• Two of the gold producers Pan African Resources and Village Main Reef reached a settlement agreement with the National Union of Mineworkers and UASA in respect of the Evander and Tau Lekoa gold mines respectively. The settlements are for an 8% increase in the basic wage for Category 4 and 5 employees, including Rock Drill Operators, and a 7.5% increase for Category 6 to 8 employees, Miners and Artisans, and Officials. Through the chamber, gold producers had offered between 6% and 6.5%. NUM initially demanded a 60% increase for entry level workers
• Transnet reached a two-year wage agreement with unions, SATAWU and United Transport and Allied Trade Union-South African Railways and Harbours which will see employees in the bargaining unit receiving an 8.5% across-the-board increase for the current financial year, backdated to 1 April, and a 9% increase for the following year (2014). Employees earning R96 000 per annum would get a 9% increase, middle managers to senior managers 6% and general managers, group executives and CEO’s would get 5.3%
• The Sugar Milling and Refining Employers Association concluded a wage increase of 8% across the board awarded to all employees within the Bargaining Unit successfully in Durban. A further R200 for all A-Band employees and R150 for all Band-B employees, to be effective on 1 November 2013. However, the increase will be effective from 1 April 2013 until 1 March 2014
• A three-year wage agreement was reached between SAMWU, IMATU and SALGA. The agreement entailed a secured pay hike of 6.5% from January 2013, at the average CPI +1.25% and average CPI +1% in 2014 plus a secured 100% medical aid subsidy for the lowest income workers and a handful of allied benefits. Workers were initially demanding 15% whereas the State offered 4%
• Gold and platinum junior Pan African Resources entered into a two-year wage agreement and conditions of employment for employees at its Barberton Mines. The average increase in the Barberton salary and wage bill for the financial years ending June 2014 and June 2015 amounted to approximately 8% a year.
3.3. Abandoned strike incidents
• Employees of the Department of Labour from the Sheltered Employment Factories averted strike action after their wage demands were met. On 16 July, a wage agreement was reached with the employer who agreed to a 6% wage increase plus 1% increase to the provident fund.
3.4. Suspended strike incidents
• Medical services at St Mary’s Hospital in Durban, KwaZulu-Natal, resumed on Monday, 2 December after the Democratic Nursing Organisation of South Africa (DENOSA) temporarily suspended its strike. This action came after hundreds of nurses and other workers embarked on a strike demanding a 6.5% wage increase and that the privately owned hospital should be absorbed by the government to safeguard the employment of hundreds of staff members. The strike at the 200-bed hospital left scores of patients stranded and some had to be transferred to other hospitals. DENOSA halted the strike after approaching the Commission for Conciliation, Mediation and Arbitration to resolve the issues.

Annual Industrial Action Report | 2013
Page | 32
cHApter Four
4

2013 | Annual Industrial Action Report
33 | Page
Profile of work stoppages, 2013
The Department of Labour’s media monitoring system captured identified strikes activities in the last twelve months. Nonetheless, it must be pointed out that not all strike incidents were captured due to other resource limitations. These kind of disputes affected small, medium and big companies in the country.
Below, this annual report provides a profile of strike incidents in a chronological manner in order to allow the readers to have full details of strike incidents as recorded in the Departmental database within the year under review9. From this, employers were requested by law to send the strike LRA 9.2 form seven days after the strike has been concluded.
January 2013
• Casual workers at Clicks stores in Grahamstown downed tools on Saturday, 5 January. Casuals downed tools after they went without pay since December 2012. They alleged they won’t return until they’ve received their wages. Clicks spokesperson said they were aware of the problem and appealed to affected staff to come forward with their details so they can resolve the issue and ensure payment
• Eskom employees at Medupi power station in Lephalale Limpopo Province downed tools on 16 January. It was reported the station went temporarily closed after workers held protest action over various issues including a lack of training and inadequate working conditions and food. On the same morning, Eskom management sent the workers home for safety reasons. As an interim measure, Eskom had to work with contractors to restore the operations to avoid closure as it could result in more pressure on the schedule for the power station’s completion
• Both South African Airways and Passenger Rail Agency of South African (Prasa) employees went on strike on Friday, 18 January. Members went on strike after accusing airline management of refusing National Transport Movement (NTM) recognition as a union. NTM claimed that SAA refused to recognise it even though it had 1 300 members
• Thousands of commuters at Seshego, Limpopo were left stranded after Great North Transport bus drivers aligned to Transport and Allied Workers Union of South Africa (TAWUSA) downed tools on Thursday, 31 January. Drivers were demanding that a senior official be axed. It was reported that more than 150 buses were stationed at the depot and was left stationary. The strike affected commuters from Moletjie and surrounding villages. Great North Transport spokesperson apologised to customers for the huge inconvenience caused.
9 It should be emphasised that the chronological list of labour disputes in Chapter 4 should not be confused with the quantitative data analysis in Chapters 1 and 2. Chapter 2 covers all labour disputes, including those that are pre-arranged between management and employees like cases related to the mourning of the death of miners at the workplace. This chapter also includes protest actions and pickets during lunch-hours and after hours. It also includes protests by workers who were on leave. In all these cases, employers are not expected to submit completed LRA 9.2 Forms, since there can only be a recognised industrial action during office hours and by workers who are expected to be at work. Hence, these cases would not form part of Chapters 1 and 2. The consent of employers on whether an incident is a strike or not is always important to consider before the Department send a form to the employer affected to complete. Chapters 1 and 2 deal with the “actual” strike incidents that were completed and submitted to the Department for capturing. Some industrial action do not come to the knowledge of the Department’s officials; however, since employers are expected to complete the LRA 9.2 Form after experiencing a labour dispute, some employers do complete the LRA 9.2 Form and send it to the Department for capturing even without the knowledge of the officials. This implies that this kind of a labour dispute will not be recorded in Chapter 4 since it was not identified by the Departmental officials.
cHApter Four

Annual Industrial Action Report | 2013
Page | 34
February 2013
• Durban University of Technology staff members associated with the National Education, Health and Allied Workers’ Union and Tertiary Education Union embarked on strike action demanding higher wages. Classes were disrupted at the ML Sultan campus over staff’s demand for a 12% wage increase, twice the offer by management. During the industrial action police had be to be called to monitor the situation after striking workers threatened to further disrupt classes and force lecturers to join them. Strikers urged they would not go back to work until their demands were met.
March 2013
• On 4 March, container depot employees at Port Elizabeth’s South African Container Depots joined their colleagues on a country wide strike for higher wages. South African Container Depots is a shipping company responsible for the import and export of goods. Employees were demanding a 10% wage increase from the employer’s offer of a 5%. Employees were also demanding the company to address the issue of casuals being permanently employed, also that the wage structure be put under a microscope and that their salaries be benchmarked with those of workers in Johannesburg as they are earning more than the ones in Port Elizabeth or Durban and yet doing the same job. South African Container Depot’s regional operations manager indicated negotiations were under way at their Cape Town head office but did not have any details about the negotiations
• About 6 158 workers at Lonmin’s Saffy and Newman shafts in Marikana in Rustenburg went on a one-day illegal work stoppage on 5 March. The strike was allegedly incited by Association of Mineworkers and Construction Union (AMCU) workers who demanded that the National Union of Mineworkers (NUM) offices at the Saffy shaft be moved off the property. The strike began at the Saffy mine where many members of the media were scheduled to visit the site.
• Five Exxaro coal mines Matla, Arnot, Grootgeluk, Leeuwpan and Inyanda were affected by an unprotected strikes dating from 5 March. It is reported the strike was related to different issues at the different mines including non-payment of performance bonuses as the operations missed their performance targets and various grievances. Production had stopped at these mines and Exxaro reported that it was engaging with unions and managing the situation to bring operations to normality. Moreover the mines had implemented contingency plans to continue supplying coal to maintain the functionality of their respective power stations and other customers
• Furious teachers who had not been paid for marking the matric 2012 examination papers blocked the Education Department’s entrance in Polokwane, Limpopo. Angry teachers protested over outstanding pay after the department has failed to keep the promise of a 100% pay rise for the teachers marking matric papers. Protesters also demanded that all temporary teachers be appointed permanently
• About 500 community development workers (CDW) employees in the Randfontein local municipality downed tools over unpaid salaries. Workers claim they have not been paid for February and that nothing has been communicated since. Protesting workers burned tyres and threw rubbish bins in the streets. The affected workers are responsible for cleaning the township of Mohlakeng including churches, taxi ranks and schools. Gauteng Department of Infrastructure Development spokesperson reported the department was not aware of the strike over unpaid wages and will thus investigate and find out where the problem lies
• Walter Sisulu University staff members associated with the National Education Health and Allied Workers Union at Butterworth and Buffalo City campuses embarked on an illegal strike on Monday, 11 March. Workers were demanding that last year’s salary negotiations be reopened after management’s once-off 10% increment from their initial demand of 12%. The strike affected thousands of students as they were unable to attend classes. Management developed a process to address the impasse to implement this process with immediate effect. The university management appealed to striking staff members to assist in resolving the labour impasse as a matter of extreme urgency in order to assist deal with the matter in a proper, procedural way.

2013 | Annual Industrial Action Report
35 | Page
• Nearly 100 miners at the Palaborwa mine went on strike on 13 March, lasting for a week. Miners are demanding additional danger-pay for working underground. It is reported the action by the crews is a significant concern and is in contravention of their obligations to the mine’s policies.
April 2013
• On 4 April contracted workers within the Johannesburg City, Region F marched on the streets of Johannesburg demanding a wage increase. A memorandum was presented to various offices such as Mvula Trust, the Department of Infrastructure and Development in Gauteng. Over an above the wage increase demand the memorandum contained issues such as the reversal of the Region F recruitment system and immediate suspension of operations, ensure posts are advertised in the local media, afford Region F staff and locals enough and adequate time to apply and to adjust Coordinators wages to the same scale
• Rock drill operators at Zondereinde mine in Limpopo, Northam Platinum went on strike after operators were demanding a salary hike. It is reported the operators were demanding a 38% increase in their bonuses. NUM general secretary reported the strike was caused by management’s refusal to comply with an agreement entered into with the union. The agreement was mainly about how to compensate rock drill operators for holes drilled. Northam Platinum said Zondereinde’s management team had constituted a consultative forum and was engaging with employee representatives to try to resume operations
• Thousands of nurses and other workers at Johannesburg’s Charlotte Maxeke Hospital and private hospital staff associated with the National Education Health and Allied Workers’ Union went on strike on 16 April. They were demanding an 11% increase from private hospital group Netcare after rejecting the group’s final offer of an 8% annual increase
• Strikers referred to themselves as not working at “Netcare but at Not Care”. Netcare hospitals nationwide were left without some nurses and kitchen staff. The nurses said their “low” pay showed the hospital group “cared about patients but not about them”. Netcare nurses complain that nurses at government hospitals earn more than they do. A Netcare nurse’s salary starts at R8 000 a month, with about R1 400 deducted for membership of the medical aid. “We cannot qualify for an RDP house but also earn too little to be granted a bond by banks,” said a striking nurse
• Around 200 casual workers at the Post Office’s Witspos branch in Johannesburg went on strike on Tuesday, 16 April. The employees were previously contracted by labour brokers and are now demanding that they be permanently employed by the company. The Post Office’s spokesperson said they received a memorandum from employees, who were representing themselves. The spokesperson indicated that there is a process to seek alternatives of their employment within the organisation. It was reported the services were not affected by the labour dispute and that there wasn’t any apparent impact.

Annual Industrial Action Report | 2013
Page | 36
• Staff at the University of South Africa (UNISA) associated with NEHAWU downed tools on 16 April, however operations were unaffected. Union members embarked on a strike due to pay demands. Members went on strike after rejecting a 5% salary increase tabled by the university from a wage demand of 11.7%. The university spokesperson indicated that they are hoping to resolve the impasse as soon as they possibly can and that “As a university, we respect the bargaining processes and remind striking unions that UNISA’s bargaining forum is always open for further talks”
• South African Transport and Allied Workers’ Union (SATAWU) and Transport and Omnibus Workers Union called for a nation wide strike on 19 April. This came after wage talks between bus companies and unions deadlocked in February. Unions were demanding an 18% salary hike, while employers were offering a 6.5% increase. The nationwide strike left thousands of commuters stranded and affected all public transport modes in the cities. The mayoral committee member for transport, roads and storm water requested employers to assist them by considering how they can accommodate their employees to travel to and from work when public transport is constrained by allowing flexible working hours
• On 22 April, Rea Vaya bus drivers began with a strike pulling away from its Orlando station in Soweto, Johannesburg. As a result, bus commuters in Johannesburg went without transport because of the strike. The strike by bus drivers from Piotrans, the company which operates the Rea Vaya service, related to salary progression and the status of drivers who were shareholders in the company. Workers were demanding an increase of 18% whiles employers had offered 2.5 % i.e. a minimum monthly wage of R6 000 across the industry, a R1 000 housing allowance, and an increase in medical aid contributions. Piotrans advised the city that it would seek an urgent Labour Court interdict to have the strike declared illegal
• Close to 25 000 South African teachers associated with SADTU embarked on nation wide marches on Tuesday 23 and 24 April to Union Buildings in Pretoria and Parliament in Cape Town. The marches were meant to increase the pressure on Basic Education Minister and her Director-General to resign from their positions in defense of collective bargaining and promotion of quality public education. The department’s spokesperson reported that the department has put systems in place to ensure that those embarking on this unprotected strike will be subjected to disciplinary processes.
May 2013
• On 13 May, about 300 Ekurhuleni metro police officers associated with the South African Municipal Workers Union (SAMWU) went on strike. Officers decided to go on strike because they were furious at a number of internal issues and wanted the municipality to sort them out soon. The shop steward reported they have been trying to negotiate with the employer; however they refused to come on board and send junior management to deal with issues. Meanwhile, the municipality said it has applied for a court interdict as the strike is illegal and that legal action will be taken against all metro officers who stopped work and that whoever is participating in such industrial action would have to face the necessary consequences, which means normal pay rules apply and disciplinary action can be taken against strikers

2013 | Annual Industrial Action Report
37 | Page
• On 16 May, about 470 miners staged an illegal strike at the South Africa’s Amplats Operations, a chrome mine owned by chemicals group Lanxess in Rustenburg. The workforce downed tools over bonus claims. It is reported workers who are members of the National Union of Mineworkers (NUM), were entitled to a production-based bonus scheme but were not eligible to payments under any other plans. The interdict ordered striking employees to report for work with immediate effect, however most of the workforce did not complied with the order. It was further reported that the situation around the mine has been tense although without reports of violence
• On Friday, 17 May, thousands of workers at the Mercedes-Benz plant in East London embarked on an unprotected strike. Workers told the Dispatch newspaper reporter that a recognition agreement between the company and NUMSA in 1989 allowed them to embark on an unprotected strike for 72-hours. Workers embarked on the strike bringing production to a halt. The strike brought tension over the company’s mooted plans to outsource its logistics department, which it said were not finalised
• POPCRU members from the South African Police Services gathered for a march in Cape Town and Durban. Staff members were protesting over the safety and security sectoral bargaining council agreement signed in 2011, which had apparently not been implemented. The agreement contains provisions related to pay level upgrades and career path planning for police officials. The protest affected essential support services that includes human resources, finance and supply chain management. Members warned top management to adhere to the agreement or face war
• On 28 May, the world’s fourth-biggest mining company, Glencore Xstrata South African Chrome at the Helena mine in the Bushveld Complex in the Northwest and other three sites were disrupted when about 200 miners embarked on a wildcat strike. The strike started after an employee, a member of the Association of Mineworkers and Construction Union, accused a shift supervisor of assault. It is reported workers related to AMCU who never reported for duty have been dismissed following the strike and had three days to appeal the decision.

Annual Industrial Action Report | 2013
Page | 38
June 2013
• Workers employed by Rumdel Cape/EXR Joint Venture in Durban, downed tools at the road construction site alongside the Umgeni road, demanding a R12 000 project bonus. Metro police said they were trying to contain the protesters under the N2 bridge with the help of the Public Order Policing Unit after the situation went chaotic. One of the workers, who had been part of a handful of those protesting said they had had no joy regarding their unmet demands as they were being sent from pillar to post by SANRAL and Rumdel Cape/EXR Joint Venture. The protest called for angry commuters to abandon their taxi transport and to start walking to work
• On 14 June, up to 3 000 to 4 000 mineworkers staged on an underground sit-in strike at an Anglo American Platinum mine in South Africa’s restive platinum belt, Thembelani shaft in Rustenburg over the suspension of four leaders. It was confirmed the action had been ignited by the suspension of four local unionists “for inappropriate behaviour” that is against the mines behavioural procedure. Workers associated with the Association of Mineworkers and Construction Union (AMCU) at the mine, refused to come out of the ground since the 4am shift started, because they wanted their leadership’s suspension lifted
• Johannesburg Social Housing Company officials went on an industrial action on 26 June. The industrial action was prompted by the lack of leadership at the municipal-owned entity and the refusal by the employer to bargain with organised labour on a number of issues. Organised labour presented items for discussion with the employer, however it deadlocked due to a lack of consensus from the employer’s side. The following issues were raised and referred for conciliation and arbitration: termination of contract with the recruitment agencies in the company, collectively agreed conditions of services, fixed term contract workers, salary progression and re-employment of the CFO who resigned under a cloud of suspicion from the previous employer.
July 2013
• SAMWU workers at Sasolburg went on strike against Metsimaholo Local Municipality on 5 July. This emerged after the local municipality’s enforcement applied a “no-work-no-pay” policy to workers who went on an illegal strike. Striking South African Municipal Workers Union workers trashed the Sasolburg central business district against the local municipality’s enforcement to the deduction of pay. It was reported the Labour Relation Act makes provision for employers to enforce the no-work-no-pay principle if workers engage in an illegal strike. Landlords, tenants and the residents were left stranded when heaps of rubbish piled up. The weekly reporters reported that the municipality was sorry for the inconvenience that the strike has caused residents.

2013 | Annual Industrial Action Report
39 | Page
• NEHAWU members at the Walter Sisulu University went on a strike after university management failed to consider their wage demands. The union working with the National Tertiary Education Union (NTEU) declared a strike after the management refused to accede to a proposed salary increase of between 8% and 10% on a sliding scale.This came after employee’s patience was tested to its limit, following a four-month long marathon negotiations that yielded very little in terms of tangible outcomes. Due to the strike action, student learning was compromised. Over and above their wage demands staff reiterated that other outstanding demands for resolution be addressed which included the following:
- Finalisation of leave buy-out- Harmonisation of conditions of service - Absorption of contract workers- Academic Promotions Policy- Teaching Infrastructure- Harmonisation of remuneration, benefits and policies.
August 2013
• Thousands of SAMWU members at the Sol Plaatjie Municipality brought Kimberley to a standstill on 5 August and trashed the streets, halted service delivery and barricaded the council’s offices with refuse bins. They demanded that the contract workers appointed by the municipality be appointed permanently as per the settlement agreement that was reached on 12 June, 2013. Amongst their demands were an external audit to review the implementation of the wage curve which was backdated from 28 June to 26 July
• Auto workers embarked on a strike on 19 August over a wage increase demand. The affected car makers included Toyota, Nissan, BMW, Volkswagen, Daimler AG, Ford and General Motors. NUMSA, on behalf of members, demanded a 14% salary increase, while the sector was offering a 10% raise plus R1.07 an hour for the first year and then inflation-related increases plus a further R1.07 an hour for each of the following two years. The Chamber of Business director reflected that due to the strike, not only would vehicle manufacturers feel the pinch, but so would their suppliers. “We believe that the unions are not only fighting about the percentage increase but about their position in the labour market” said the director. Due to the strike, millions of rands were lost daily and the reputation of South Africa as a investor market, which takes long to recover
• Nationwide, NUM members in the construction sector downed tools on 26 August over a wage demand. The strike came after workers were demanding a 13% wage increase for the year 2013 and a 14% increase for 2014 whiles the employers tabled a 6% wage increase for 2013 and an inflation-linked increase for the next year. It is reported that about 90 000 members of the NUM did not report for work after negotiations with employers reached an impasse

Annual Industrial Action Report | 2013
Page | 40
• On 25 August, Sun City workers went on an intensified strike action over labour issues. Workers were demanding that all workers who were dismissed for attending workers day events on 1 May be reinstated. They were also calling for the dismissal of management members who instructed that two female workers accused of stealing R400 be searched by security guards. Of the 6 000 workers employed by Sun City, about 3 000 have joined the strike. The striking workers were members of the SA Commercial Catering and Allied Workers’ Union and the SA Transport and Allied Workers’ Union
• SAA technical workers downed tools at the airports on 26 August. The union and management could not agree on a once-off 0.4% payment of monthly salaries after SAA implemented a 6.5% increase. SATAWU lowered its initial demand of 12% to a 6.5% increase plus a 0.4% once-off payment but management had refused to agree to the 0.4%. SATAWU reported that the minimum salary was R4 200. SATAWU’s 1 300 members in the division are responsible for minor repairs on aircraft and ensuring aircraft are fuelled. The affected airlines included SAA, Mango, British Airways and Zimbabwe Airways. SATAWU also reported that most of the employees were based at OR Tambo International in Johannesburg with 80 workers each at Cape Town International Airport and the King Shaka International Airport. According to SATAWU’s spokesperson, the once-off payment would have cost the company less than R3 million “which is not a lot of money”. SAA spokesman said while SAA was willing to have further talks with SATAWU, the 6.5% offer was what the airline could afford.
September 2013
• Employees at Port St Johns Municipality were issued an ultimatum to return to work after they went on a violent stay away. Workers were urged to return to work or face the axe. Municipal workers alleged that the municipality had defaulted on a promise to sort out the grading of salaries and other allowances due to employees. About 12 employees were arrested and charged with assault and for damaging property. An agreement was reached that the municipality would drop charges against the affected employees and lift the suspension of the 14 employees who were suspended at the beginning of the strike. The issue of wage curves10 and the problem of un-procedural appointments were left unattended
• On 2 September, Post Office casual workers at mail processing centres in parts of Gauteng went on strike. This was part of their lobbying campaign to be appointed into permanent part-time positions. The SA Post Office management engaged in talks with representatives of the striking temporary employees to try and address casual worker’s concerns. The SAPO reported the strike resulted in mail delivery delays in some parts of the province although retail outlets had not been affected by the strike
• Hundreds of Johannesburg City Power workers downed tools in the late afternoon of 4 September. They worked during the day and downed tools at 4pm, saying they won’t work after hours. The spokesperson reported that Johannesburg City Power was in the process of introducing shifts to its work rosters to improve service delivery. This was initiated because workers were sometimes needed to attend to outages after normal working hours. Unfortunately, there was a certain level of resistance by some employees
• Free State warders associated with POPCRU from the Mangaung Prison in Bloemfontein started protesting on 12 September. Prison warders who were employed by a security company were angry about the suspension of a fellow employee, said the prison’s contract management company. It was reported that the suspended employee was accused of intimidating and influencing members to protest during wage negotiations
• On 16 September, close to 100 miners at Petmin Limited in KwaZulu-Natal went on strike over pay increase demands. It is reported the strike followed failures to settle negotiations over wages and employee benefits. The company reported that the action continued over days even though the company was negotiating with labour representatives with the hopes to resolve the industrial action
• Workers associated with the General Industry Workers’ Union of SA at Bokoni platinum mine near Burgersfort in Limpopo, went on a protest march over union recognition on 17 September. It is alleged the union has obtained majority members, but the company is employing delaying tactics and is denying workers their right to belong to a trade union of their choice. It is reported that the Commission for Conciliation Mediation and Arbitration (CCMA) had conducted a verification process and concluded that GIWUSA was the majority union
10 A system used to regulate salary scales of local government employees, overtime, shift allowance, etc.

2013 | Annual Industrial Action Report
41 | Page
• Municipal workers affiliated to SAMWU at the City of Cape Town embarked on a strike over allegations of “racism” against workers. Striking workers are also dissatisfied with the changing of work programmes and the effectiveness of the Local Labour Forum. It is said the strike was likely to affect removal of refuse bins in the area. Residents were urged to put out their refuse bins as normal but warned collections might take longer than normal
• Over 2 000 workers at SABMiller’s South Africa, embarked on an indefinite strike on Monday, 30 September. The strike was over wage demands. Workers were demanding a 9.5% wage increase while South African Breweries a subsidiary of the worlds second largest brewer, was offering 7%. The firm reported in a statement it was disappointing that the unions had decided to go on strike over such a small difference in the wage position.
October 2013
• On 7 October parking marshals associated with the SA Transport and Allied Workers Union in Cape Town’s CBD went on a protest march over unfair working conditions. It is alleged they work under horrible conditions and that they are charged for quota shortfalls. They do not earn a salary and make money only if they bring in more than their daily target. They also complained about being forced to rent uniforms and to clean toilets at the office outside of working hours without being paid. Street Parking Solutions is contracted with the City of Cape Town to collect payment from motorists parking in the CBD
• About 600 workers at DRD Gold’s Ergo gold operation near Johannesburg downed tools in a protected strike on 8 October after the JSE-listed company refused to yield to last-minute union demands. It is reported the National Union of Mineworkers made eleventh-hour wage demands that would be more than double DRD’s wage bill
• Samancor Chrome workers associated with the National Union of Metalworkers of South Africa and the National Union of Mineworkers went on strike at smelting operations on 17 October. The strike action was due to wage increase demands. Both the unions engaged on negotiations with the company over its offer to smelter workers. At the end parties reached an agreement over a fair and competitive offer.
November 2013 • Over 7 000 members of the NUM workers at Northam Platinum went on a wage strike on 1 November after the
union had served the employer with notice of its intention to strike. This emerged after NUM’s wage increase demand of R2 100 for core workers and R2 000 for non-core workers and the company responded with 6,5% for non-core and 7% for core workers and living-out allowance to be increased to R3 718 . The NUM rejected these offers. A dispute was raised and elevated to the CCMA and a renowned labour lawyer where they failed to find an amicable solution
• Cape Town farmworkers associated with the trade union, Building and Allied Workers Union of South Africa, employed by the JC Le Roux group on farms near Paarl, Stellenbosch and Piketberg downed tools on Thursday 7 November. Farm workers went on strike over wage increase demands. The group produces and exports table grapes, plums and citrus fruit. The farmer’s spokesperson said: “We are now once again entering a harvest season, which is the time when farmers can generate income which has to sustain them for the rest of the year”. Role players were urged to conduct themselves in a dignified manner and to keep things within the legal framework
• Miners at the Anglo American Platinum Ltd’s Dishaba mine in Limpopo went on an underground strike on 10 November. The strikers were demanding a suspension to the hostage of an Association of Mineworkers and Construction Union shop steward
• All 75 miners at Glencore Chrome in Rustenburg, North West, abandoned work over a sit-in on 14 November. The miners, affiliated to the National Union of Mineworkers protested against having to work extra shifts on weekends, they also wanted wage increases. A meeting between the Department of Mineral Resources, NUMSA and Glencore Mine management took place to help resolve and allow other stakeholders, such as the CCMA and the Labour Department to facilitate further talks

Annual Industrial Action Report | 2013
Page | 42
• About 250 Bawsi Agricultural Workers Union of SA workers at Tiger Brands went on a violent strike on 15 November. Workers remained outside the premises of Langeberg and Ashton Foods factories demanding the release of detained shop stewards. The strike turned violent when workers briefly clashed with the police amidst reports of intimidating non-striking workers
• Workers employed at BHP Billiton Energy SA downed tools at the Klipspruit, Middelburg and Khutala collieries in Mpumalanga from 18 to 20 November. The dispute was about disciplinary procedures and resulted in the company agreeing to drop the procedures. To combat the industrial action the negotiators agreed to give negotiations a chance and those regions would be updated to progress made.
December 2013
• No strikes were identified from the media during December 2013.

2013 | Annual Industrial Action Report
43 | Page

Annual Industrial Action Report | 2013
Page | 44
conclusIon

2013 | Annual Industrial Action Report
45 | Page
Noting from the Minister of Labour’s concerns to understand the logic of pursuing strike action to the point where it damages workers’ interests, the 2013 Annual Industrial Action Report shows an increase from 99 strikes in 2012 to 114 strikes in 2013. In 2012, an average of 22.3% of work stoppages lasted from 11 to 20 days as compared to 2013 where 40.8% of work stoppages lasted from 11 to 20 days. In all cases, wage agreements reached were below the initial demand followed by other negative employment trends such as job losses in the mining sector. While an increase in the number of strikes was recorded, the working days lost between 2012 (3 309 884 strikes) and 2013 (1 847 006 strikes) decreased by 44.2%. Wages were still the main reason for workers to embark on strikes where they were seeking more money to sustain their socio-economic needs. In 2013, about R6.7 billion in wages were lost due to the participation of workers in strikes, as compared to the R6.6 billion in 2012.
During the 2013 period most strikes were noticed from the “early strike season to the end of the winter season”. The strikes data indicates that provinces in urban areas have felt the effect of the strikes with the inclusion of North West. Employment in terms of working days lost in the private sector (91.7%) were mosts affected by labour market unrest. From January to November 2013 a high number of working days lost came from the manufacturing, transport and mining industries where the industries employ workers with low levels of education or no education at all.
Policy Implications
The following policy implications can be stressed from the 2013 strike data analysis:
• The more strikes in the private sector the less the investor’s interest to invest in the sector
• There is a need for organised labour and organised business not to wait until wage agreements lapse, but rather to start with wage negotiations within a reasonable time
• Unions also need to take responsibility to guide and advise workers in shortening the strikes, as they often result in low wage settlement percentages
• In the language of the South African President, we need a prosperous economy where the large majority of people can contribute but “in no way can we have conflict that destroys the economy…”.
1. Insight, A Reflection on 2013 Wage Negotiation2. International Labour Organisation Bulletin of Labour Statistics 1993-2,3. Annexure 1, x14. Mike Schüssler, the chief economist of Economist.co.za Business Times 2013
conclusIon
reFerences

Annual Industrial Action Report | 2013
Page | 46
Annexures

2013 | Annual Industrial Action Report
47 | Page
Data Appendix
The following two supplementary tables contain data not included in the main report:
Table A1: Number of workers involved, working days lost and working hours lost by industry/sector, 2013
Industry/Sector Workers involved
Working days lost
Working hours lost
Electricity, gas and water supply 1 458 3 232 25 856Electricity, gas, steam and hot water supply 1 458 3 232 25 856Collection, purification and distribution of water - - -Wholesale and retail, repair of motor vehicles 1 939 47 216 458 434Hotels and restaurants 56 56 430Retail trade, except of motor vehicles and motor cycles; repair of personal household goods
97 935 7 064
Sale, maintenance and repair of motor vehicles and motor cycles; retail trade in automotive fuel
1 282 23 449 245 956
Wholesale and commission trade, except of motor vehicles and motor cycles
504 22 776 204 984
Manufacturing 21 718 343 222 3 337 979Basic metals, fabricated metal products, machinery and equipment 4 225 65 992 534 231.2Sale, maintenance and repair of motor vehicles and motor cycles; retail trade in automotive fuel
676 13 125 112 505
Electrical machinery and apparatus 465 930 7 440Food products, beverages and tobacco products 1 070 18 849 158 945Other business activities 212 1 908 15 264Other non-metallic mineral products 1 199 19 367 712 099Transport equipment 13 781 219 901 1 769 145Textiles, clothing and leather goodsWood and products of wood and cork 90 3 150 28 350Community, social and personal services 22 520 124 910 1 239 324Education 6578 25 826 198 520Health and social work 4 830 73 071 809 668Other community, social 2 084 5 360 56 398
Public administration and defense activities 5 979 10 038 93 843.50Recruitment agency 333 2 454 22 086Local Authority 1 252 4 738 37 904Hotels and restaurants 811 811 8Post and Telecommunication 653 2 612 20 896
Annexure A

Annual Industrial Action Report | 2013
Page | 48
Industry/Sector Workers involved
Working days lost
Working hours lost
Mining and quarrying 204 661 515 971 3 630 625Coal and lignite 4 652 56 084 636 032Metal ores, except gold and uranium 55 357 140 702 1 274 502.80Other mining and quarrying 2 658 21 264 191 376Gold and uranium ore 141 977 297 700 1 526 735Water Transport 17 221 1 989Transport, storage and communication 22 331 477 355 3 825 742Other Business 122 8 540 68 320Passenger transport 15 241 328 559 2 620 699Public transport 2 123 61 363 490 014.20Air transport 3 740 51 476 426 478Renting of machinery 263 1 315 11 415Post and telecommunications 842 26 102 208 816Construction 13 083 250 243 2 207 375Financial intermediation, insurance, real estate 1 066 20 415 163 480Financial intermediation, except insurance and pension funding 885 17 700 141 760Renting of machinery 181 2 715 21 720
Agriculture, hunting, forestry and fishing 8 417 64 442 608 090Agriculture, hunting and related services 8 417 64 442 608 090
Source: Department of Labour, Strikes Statistics
Table A2: Number of working days lost by nature of organization 2012, 2013
Nature of organisation Working days lost
2012
Working days lost
2013Central Government General 4 178 1323
Government Enterprise 11 218 110 817
Local Government General 17 936 10 666
Private Sector 3 224 726 1 694 085
Provincial Government General 168 30 115
Source: Department of Labour, Strikes Statistics

2013 | Annual Industrial Action Report
49 | Page
B: Methodology for monitoring industrial action
B1. IntroductionThe collection and analysis of industrial action statistics is guided by the guidelines and practices that have been developed by the International Labour Organization (ILO). The point of departure can be found in the ILO Resolution adopted by the Fourteenth International Conference of Labour Statisticians in January 1993, concerning statistics of strikes, lockouts and other action due to labour disputes. This resolution is accommodative rather than prescriptive in its approach. It states that; “Each country should aim at developing a comprehensive programme of statistics of strikes, lockouts and where relevant other action due to labour disputes in order to provide an adequate statistical base for the various users, taking into account the specific national needs and circumstances” (ILO Bulletin of Labour Statistics, 1993-2, Annex I, XI). The Department has been provided with a legislated instrument (Form LRA 9.2) to collect data on labour disputes.
B2. Definitions
Section 213 of the Labour Relations Act, 1995 provides the following definitions: A strike:The partial or complete concerted refusal to work, or the retardation or obstruction of work, by persons who are or have been employed by the same employer or by different employers, for the purpose of remedying a grievance or resolving a dispute in respect of any matter of mutual interest between employer and worker, and every reference to work in this definition includes overtime work, whether it is voluntary or compulsory (s 213).
A lockout:The exclusion by an employer of workers from the employer’s workplace, for the purpose of compelling the workers to accept a demand in respect of any matter of mutual interest between employer and worker, whether or not the employer breaches those workers’ contracts of employment in the course of or for the purpose of that exclusion.
A protest action:The partial or complete concerted refusal to work, or the retardation or obstruction of work, for the purpose of promoting or defending the socio-economic interests of workers, but not for a purpose referred to in the definition of strike”.Barker, F et al (1996) in “South African Labour Glossary” defined the following concepts as follows:
Picketing:Action by employees or other persons to publicize the existence of a labour dispute by patrolling or standing outside or near the location where the dispute is taking place, usually with placards indicating the nature of the dispute. The aim of picketing might simply be to communicate the grievance to the public or it might be to persuade other employees in that workplace not to work and to take their side in the dispute, to deter scab labour, to persuade or pressurize customers not to enter the workplace, to disrupt deliveries or drum up public support.
A secondary strike:A strike in support of a strike by other employees against their employer. The strikers have no issue with their employer, but that employer might be in a strong position (due to there being a close business relationship as either an important customer or supplier) to pressurize the employer who is in dispute.
Annexure B

Annual Industrial Action Report | 2013
Page | 50
Stay away action:Industrial action by a group of employees in the form of absenting themselves from work without permission in support of some socio-political or socio-economic issue which does not relate to their employment situation.
Work stoppage:A work stoppage is made up of a series of events, all relating to the same issue. Work stoppages have two characteristics, type and degree. The type of action is either a strike (action initiated by an employee), or a lockout (action initiated by an employer). The statutory definitions of strikes and lockouts are given in the Labour Relations Act, 1995 as amended.
Industrial action:Action by unions, employees to pressurize the other party in the furtherance of an industrial dispute. It usually refers to strikes and lockouts but could also include picketing, product boycotts, sit-ins, go-slow strikes and other actions which disrupt the production process.
Work hours:It refers to those hours during which an employee is obliged to work.
B3. Coverage
Data collection attempts to cover the entire country, all economic activity and all sectors of the economy, legal and illegal industrial action. The system attempts to cover all industrial action due to labour disputes. The figures in this report are inclusive of all industrial actions which come to the knowledge of the Department, and the methods taken to secure information practically preclude probability of omissions of a serious nature. This is a painstaking exercise, and it is believed that the statistics indicates the conditions of labour disputes in the country with reasonable precision. Since LRA Form 9.2 has been redesigned, the Department is now in a position to cover employees both directly and indirectly involved in industrial actions separately, that is, those who participate directly or indirectly by stopping work. Workers absent from their normal place of work at the time of a strike or stoppage, for reasons such as sick-leave, vacation, business or personal reasons, whether authorized or unauthorized, are excluded from participation in industrial actions and are therefore not counted. The LRA excludes independent contractors from the definition of employee. The LRA further excludes from the scope of coverage certain categories of workers, namely members of the National Defense Force, National Intelligence Agency and South African Secret Service. The coverage by the Department of industrial action, however, includes all of the above, provided they embarked on an industrial action in the period under consideration.
B4. Data collection
In addition to the legal obligation on employers to report industrial action, the Department has introduced an active media monitoring programme. Through this system, media information on industrial action is used to make contact with employers and to encourage voluntary compliance with reporting requirements. Telephone and telefax communication with affected employers ensure a reasonably accurate coverage of all industrial action. The cooperation of private sector employers also speeds up the process of data collection. After completing the form, most employers send it to the Head Office of the Department. Some employers keep blank forms with them to complete and when an industrial action arises they voluntarily complete the forms and send them to the Department.
After receiving the form either directly from the employer or from the provincial office, Head Office staff members check the form to assess if the information provided is sufficient. If the information is insufficient, Department of

2013 | Annual Industrial Action Report
51 | Page
Labour staff contact employers with the aim of getting relevant information, after which the data is captured on a database specifically designed for monitoring industrial action. The form is designed for workers who are both directly and indirectly involved in the industrial action, excluding all those who are on leave. The method of data collection and processing has remained the same ever since. The Department has to rely on the employers affected by disputes for detailed information on such matters as size, length, reason given for striking, etc., which it requires for its records as required by the 1995 Labour Relations Act. No attempt is made to contact other parties to disputes, e.g., unions to verify the information that has been supplied by employers. Hence at this level, employers constitute a principal source of strikes data.
B5. Calculations
Working days lostAll calculations are made on the basis of information recorded on the LRA Form 9.2. After capturing the data, the loss of working days is calculated by multiplying the number of workers involved in each stoppage by the duration of the stoppage in days lost and adding the totals for all stoppages during the reference period. For example, if during the reference period there is one stoppage, involving 2 000 workers and lasting three days, working days lost would be computed as follows:2 000 workers x 3 days =6 000 working days lost
Working hours lostWorking hours lost is the aggregate number of working hours lost stemming from all work stoppages during the reference period. The statistic is calculated by multiplying the number of workers involved in each stoppage by the number of hours of the stoppage and summing the products thus obtained for all stoppages during the period. For example, if during the reference period there is one stoppage, involving 2 000 workers and lasting three hours, working hours lost would be computed as follows:
2 000 workers x 3 hours = 6 000 working hours lost
Estimated working time is computed by multiplying the employment for the period by the number of days typically worked by most employed workers during that period. In some cases, Saturdays (when customarily not worked), Sundays, and established holidays are excluded. It is also to determine the normal hours of work for groups of workers since LRA form 9.2 provides for this. An average eight hour day is used to represent the normal working day in the country.
Time- loss ratioThis is the number of working days lost due to industrial action per 1 000 employees. It is the standard method that has been used to convert working days lost into a strike rate that takes account of the size of total employment. This also enables comparisons to be made across industries and provinces that differ in employment size. For example, a country with 12 488 000 employees and loosing 1 662 000 working days will have a ratio of 133 arrived at as follows: 1 662 000/12 488 000*1 000
MeasurementThe criterion used to identify a single strike, lockout, stoppage or protest action, is the industrial action in question. The Department of Labour has adopted the following International Labour Organisation (ILO) recommendations used to denote one industrial action:• a temporary work stoppage, due to one industrial action, occurring among workers in one establishment at one
time• temporary work stoppages, due to one industrial action, occurring among workers in several establishments at the
same time• temporary work stoppages, due to one industrial action, occurring among workers in one establishment at different
times, in which the period between stoppages is not more than two months• temporary work stoppages, due to one industrial action, occurring among workers in several establishments at
different times, in which the period between stoppages is not more than two months.
While attempts to satisfy the ILO requirements are made, the instrument of data collection (LRA Form 9.2) served as the point of departure, in order to meet the specific needs of the Department.

Annual Industrial Action Report | 2013
Page | 52
LRA Form 9.2 Labour Relations Act, 1995
READ THIS FIRST
WHAT IS THE PURPOSE OF THIS FORM?
An employer must keep a record of any strike, lock-out or protest action involving its employees.
WHO FILLS IN THIS FORM?
The employer/or relevant employer organization.
WHERE DOES THIS FORM GO?
ENQUIRIES:Mhlengi Makhubela-LMISDepartment of LabourPrivate Bag X117Pretoria0001
Tel (012) 309 4004Fax (012) 309 4406E Fax 086 611 6490E-mail: [email protected]
OTHER INSTRUCTIONS
The employer must submit this form within seven days of the completion of the strike, lockout or protest action.
If a strike, lockout or protest action occurs in more than one workplace of single employer then a separate form must be completed for each
RECORD OF STRIKE, LOCKOUT OR PROTEST ACTION
RECORD OF DETAILS OF STRIKE, LOCKOUT OR PROTEST ACTION TO BE KEPT BY EMPLOYER IN TERMS OF SECTION 205(3)(a)
1. EMPLOYER DETAILS
Name:...................................................................................................
Physical address:..................................................................................……….
Province: ..............................................................................................
Tel: .................................................. Fax: ..........................................
E-mail address: .................... .................... .................... ...............…..
Contact person: .................... .................... .................... ................….
Sector/ nature of business: ....................................................................
.............................................................................................................(e.g. food, mining, retail)
Are wages and working conditions normally determined in a bargaining or statutory council or similar industry – level body?
yYes No
Please explain ………………………………………………………
2. EMPLOYEE DETAILS
2.1 Number of workforce
2.2 Number of ordinary days/shifts worked per week...……………… Number of ordinary hours worked per day/shift.........……………..
3. DETAILS OF THE ACTION
3.1 Nature of action
y Strike in company only y Multi-employer strikey Lockout Secondary strikey Stayaway, protest action y Picketingy Other industrial action, please specify ……………………… ................................................................................................

2013 | Annual Industrial Action Report
53 | Page
If the action was a strike did the employer lockout the strikers? (defensive lockout)…………………………. ......
How was the industrial action resolved?.................................…………... ………………………………………….
Was replacement labour used? ............................................................................................................…
Duration
Began: ................................ ............................. Ended: ............................. ............................. (Date) (Time) (Date) (Time)
Duration in workdays (or hours if relevant) ...............................…………………………………………….
Employees
Number of employees directly involved ......................................………………………………………………….. Number of female employees directly1 involved .......................……………………………………………………..
Number of employees indirectly2 involved .....................................…………………………………………………
Number of female employees indirectly2 involved .......................……………………………………………………
Total man hours lost ................................................……. Total wages lost in Rands ……………………………….
Unions
Which unions were involved? (if more than one union, list main union first. If no union please indicate):
.......................................................................................................................................................
....................................................................................................................................................... Compliance with the Act
Was the action in compliance with the Act? (e.g., procedural or un-procedural)y Yes y No y Don’t know
If no, or don’t know, please explain ...........................................................................................……………………
Reasons
Provide reasons for the action:
y Wages only yRefusal to bargainy Bonuses and other compensation ySecondary action from another disputey Retrenchments/Dismissals yGrievancesy Working conditions yDisciplinary matters y Socio-economic/political conditions yOrganisational rightsy Any other reason, please specify ………………………..............................................................…………….
Signature of employer:..........................................................……. Date: …………….
LRA-Form 9.2
1: Workers directly involved are those who went on strike or were locked out as a result of a dispute2: Workers indirectly involved are those not working as a consequence of the initial stoppage of work because necessary supplies or
orders are no longer available.

Annual Industrial Action Report | 2013
Page | 54

2013 | Annual Industrial Action Report
55 | Page

Annual Industrial Action Report | 2013
Page | 56
ISBN 978-0-621-42689-2


