102
ANNUAL REPORT 2018 ANNUAL REPORT 2018

ANNUALREPORT 20 18ANNUALREPORT 20 18


SUMMARYCHAIRMAN’S MESSAGE ..............................................................................................4
THE COMPANY ...........................................................................................................6A- History ............................................................................................................................................................................ 8B- Organization ................................................................................................................................................................. 10C- Board of directors ......................................................................................................................................................... 13D- Governance .................................................................................................................................................................. 14E- Sector ........................................................................................................................................................................... 18F- Positioning ................................................................................................................................................................... 21
HIGHLIGHTS ............................................................................................................22A- New store openings ...................................................................................................................................................... 24B- Fiscal Audit .................................................................................................................................................................. 33C- Cession of «Zaërs » ...................................................................................................................................................... 33
KEY ACHIEVEMENTS ...............................................................................................34
FINANCIAL ANALYSIS ..............................................................................................48A- ANALYSIS OF THE INCOME STATEMENT ...................................................................................................................... 50A.1 Revenue ..................................................................................................................................................................... 51A.2 Gross Margin ............................................................................................................................................................. 54A.3 Operating Expenses ................................................................................................................................................... 55A.4 Gross Operating Profit ................................................................................................................................................ 58A.5 Operating Income ....................................................................................................................................................... 59A.6 Financial Income ........................................................................................................................................................ 60A.7 Non-current income.................................................................................................................................................... 60A.8 Current income and net income ................................................................................................................................. 61B- ANALYSIS OF THE BALANCE SHEET ............................................................................................................................ 62B.1 Fixed Assets ............................................................................................................................................................... 64B.2 Inventories ................................................................................................................................................................. 65B.3 Current Assets ............................................................................................................................................................ 65B.4 Cash and Marketable securities ................................................................................................................................. 65B.5 Long-term liabilities ................................................................................................................................................... 66B.6 Current Liabilities ...................................................................................................................................................... 67C- MAIN RATIOS ................................................................................................................................................................ 68C.1 Liquidity Ratios........................................................................................................................................................... 68C.2 Ratio de liquidité ........................................................................................................................................................ 68C.3 Profitability Ratios ...................................................................................................................................................... 69C.4 Debt Ratios ................................................................................................................................................................. 69D- ALLOCATION OF NET INCOME ..................................................................................................................................... 70E- STOCK PERFORMANCE ................................................................................................................................................ 70
FUTURE PROSPECTS ...............................................................................................72
APPENDICES ...........................................................................................................76
ANNUAL REPORT 2018 3

17 new stores “Car refour ” and “Car re -four Market ”
were opened in the past year. We have now become a s t rong network of 92 s tores that a im to sat is fy and meet in the best pos -s ib le way the expectat ions of our c l i e n t s .
Our pace of expans ion and open-ing of new stores , the qua l i ty and the leve l o f per formance ach ieved by our new stores , the test imonia ls o f sat is fact ion and encouragement that we regu lar -l y rece ive f rom our customers , make us pr ide and represent for the group an inexhaust ib le source of mot ivat ion and dr ive .
DEAR SH AREHOLDERS,
CHAIRMAN’S MESSAGE
A corporate citizen
ANNUAL REPORT 20184

On your behalf, we would l ike to thank all of the 47 mill ion visitors who visited our stores in 2018; for their loyalty and support.
We would also l ike to congratulate all of our 5,732 employees for their dedication and as well as for their sense of responsibil ity and service they demonstrate each and every day.
Thanks to them, we have reached a new development stage as well as an unprecedented level of growth. These results are all the more ex-ceptional amid the difficult macro-economic context that shaped the past years. Indeed, and albeit an overall decline in consumer sen-timent, the ambition and the re-sil ience of our teams were grown; as we do remain aware of all the work that need to be carried and all of the challenges that we have to overcome. Indeed, by working to-gether, we will be able to succeed.In addition, and for several years, we have become aware of our so-cial and environmental responsibil-it ies as well as our role of corpo-rate citizen.
Dedicated teams, an adapted organ-ization, a proactive mindset and a corporate citizenship culture have made it possible to undertake a mul-titude of social and environmental actions aimed at putting the ethics of care and community at the heart of our priorities.
We will continue to invest our efforts in the optimization and the improve-ment of our performance, and the service we provide to our customers, in order to sustain the development and the expansion of the Group. And tomorrow, more than ever, we will ensure that our corporate social and environmental responsibility is em-bedded in all our ventures.
Dear shareholders, the Group’s rev-enue in 2018 stood at 9,032 million dirhams, an increase of 9% com-pared to 2017. Its operating income, for its part, increased by 20% to MAD 427 million.
The Board of Directors, held on March 19, 2019, congratulated the -anagement for its achievements and the relevance of its decisions and strategic orientations.
ANNUAL REPORT 2018 5

ANNUAL REPORT 20186

The group Label’Vie is today one of the leaders of the modern distribution sector in Morocco.In 2018, the group delivered an excellent performance driven by all its business segments as well as by an aggressive development strategy. Revenue stood at MAD 9,032.9 million while share capital stood at MAD 283 million.The group also realized a steady increase of its sales surface across its three different distribution formats and, at the end of 2018, grew to 92 stores in 25 cities in the Kingdom.
THE COMPANY
ANNUAL REPORT 2018 7

I t is in the 80s that the story begins. Three young engineers return to their home country, Morocco, after graduating
with a degree in computer sci-ence, and with a head full of ide-as. Yet, computer science is still very underdeveloped in Morocco and opportunities are scarce. One year later, they decide to take a new career orientation and shift to a sector still unexplored, large-scale distribution. They initiated the journey with great enthusiasm and ambition, but also very little knowledge of the market and its specificities,
and started very soon to have funding issues amidst this very insane project. However, driven by their belief in the project, by the challenge itself and a great ambition, they persuaded their relatives to support them in this venture. It is the beginning of a beautiful story.
On June 13, 1986, the first hyper-market was opened. In the ear-ly 1990s, 3 stores were already opened (2 in Rabat and1 in Cas-ablanca), but the company was still facing difficult times and the 3 founders had not found the best
HISTORY business model yet. At that time, one of the three founding part-ners dropped out.
Zouhair Bennani and Rachid Had-ni were not willing to quit, and strengthened by their experience, they questioned all their deci-sions and achievements in order to move forward. It is with a bet-ter knowledge of the supermarket market and more efforts deployed to design the group’s strategy; that the two founders redefined the identity of the entire venture. They also decided to drop two of their stores in order to refocus on
ANNUAL REPORT 20188

the historic store in Zaërs Road in Rabat and invest in human capi-tal.
It is thanks to this new strategy, along with the injection of new funds that they were able to ac-quire the store Riad 1 in Hay Riad in 1995 and Shems in Agdal in 1999. Everything thereafter happens very fast. In 2001, their new capitalistic model was put in place with the integration of all the stores under the same um-brella brand: Label’Vie. The fol-lowing year, the company opened its capital to national and foreign investment funds. The family business continued to be led by the two founders and friends; but with new global ambitions and higher growth and expansion goals.
In 2003, Label’Vie bought Super-Sol supermarkets in Morocco and the company delivered annual revenue of MAD 100 million dir-hams with 150 employees. Hu-man capital is at the heart of the strategy of the group and despite fierce competition in the sector, Label’Vie has been able to sustain its reputation of a young, dynam-ic and attractive company. More openings of stores happened and the group started to attract inves-tors.
To support its growth prospects and finance its ambitions, the company officially entered the stock market in 2008, and man-
aged to raise 624 million dir-hams. Always full of unflinching ambition, the group tackled new distribution models in the late 2000s. In 2009, Label’Vie signed a franchise agreement with the giant Carrefour, a world leader in the distribution. Two large hyper-markets were then opened in the cities of Salé and Marrakech.
After these successes, Label’Vie S.A. acquired 100% of the shares of Metro Group Cash and Car-ry Morocco on November 15th, 2010. Thanks to this transaction, the Group also acquired 8 stra-tegic stores in 7 Moroccan cities and welcomed around 1,400 new employees.
Today, the company positions it-self across 3 formats, the hyper-cash, the hypermarket and the su-permarket segments where it has become the market leader.
Thanks to a policy of sustained expansion, and a mastery of the business that is improving day by day, the Group achieved in 2017 a turnover of over 8 billion dirhams, and aims to operate more than 100 stores throughout the King-dom at the end of 2019.
“We will sustain this momentum to maintain ourselves as a key player in the mass distribution in Morocco,” says Rachid Had-ni, CEO of Label’Vie Group. Our goal is to continue to improve the lives of our customers by offering
them greater purchasing power and continuous improvement in the quality of our products and services.“
To support this development and provide the best service to its customers, the group has set up training and partnership pro-grams with Moroccan schools and universities to recruit and train employees throughout the coun-try. The company has also devel-oped its own training school, La-bel ‘Ecole, to allow its employees to become more professional and evolve towards new perspectives.
“Human resources have always been at the center of our business and today, thousands of people work and collaborate every day to provide the best service and expertise to our customers. We will continue to bet on our youth,“ said Zouhair Bennani, CEO of the group. Because, what was initial-ly the dream of two young entre-preneurs, proud to return to their home country, and to have a foot-print; has become a Moroccan success story. And without the support of our employees, without the trust of our investors, without the loyalty of our customers, we would not be here. So thank you.“
ANNUAL REPORT 2018 9
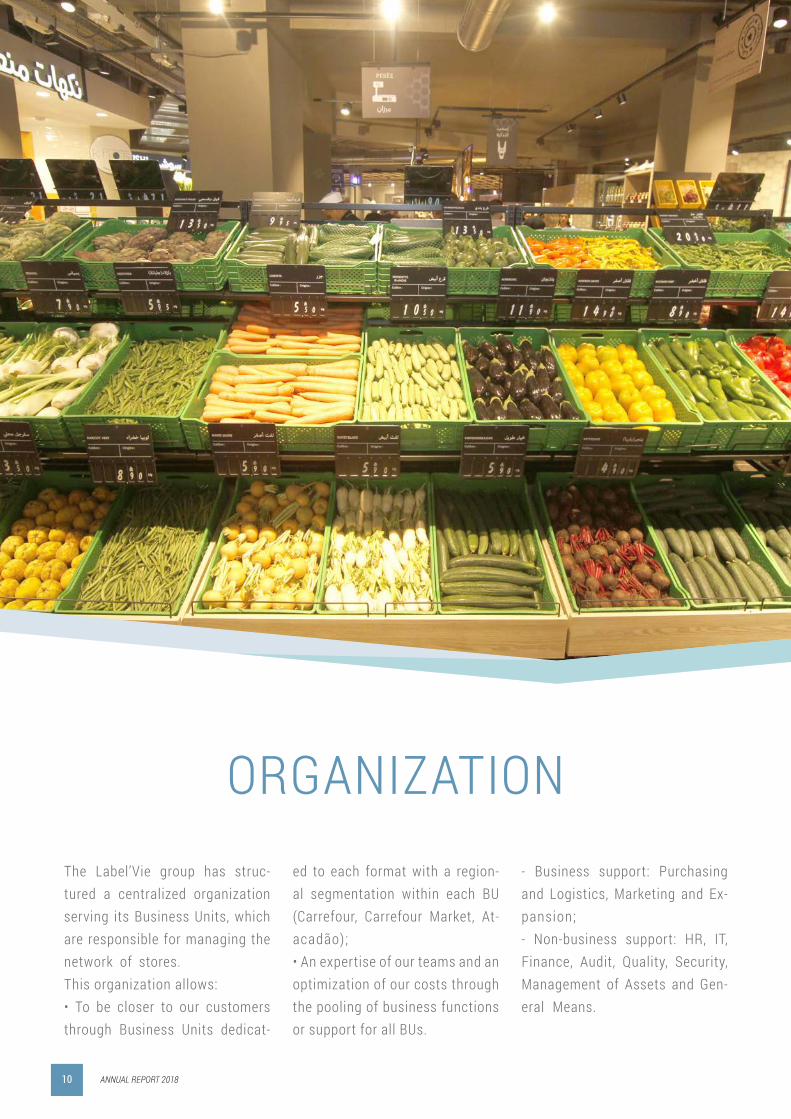
The Label’Vie group has struc-tured a centralized organization serving its Business Units, which are responsible for managing the network of stores.This organization allows:• To be closer to our customers through Business Units dedicat-
ed to each format with a region-al segmentation within each BU (Carrefour, Carrefour Market, At-acadão);• An expertise of our teams and an optimization of our costs through the pooling of business functions or support for all BUs.
ORGANIZATION- Business support: Purchasing and Logistics, Marketing and Ex-pansion;- Non-business support: HR, IT, Finance, Audit, Quality, Security, Management of Assets and Gen-eral Means.
ANNUAL REPORT 201810

The company Label’Vie S.A, par-ent company, which operates the “Supermarkets” under the Carre-four Market - Label’Vie banner, in-cludes the following companies in its scope of consolidation:
- HLV S.A.S, created in 2009, operates the “Hypermarket” for-mats under the CARREFOUR banner ; and owned at 95% by Label’Vie S.A;
- MLV S.A.S, created in 2011 to
operate stores under the MET-RO brand, was converted to At-acadão between 2012 and 2014 and is owned at 95% by Label’Vie S.A;
- Service-LV, specialized in the management of gas stations, operated a total of 12 stations at the end of 2018. Created in 2014 and owned at 100% by the Label’Vie group, the company Service LV did not start its oper-ations until November 2015;
- Mobi Market S.A, created in 2016 and owned by the Label’Vie group at 50%, specializes in the purchase and sale of food and non-food products in the form of self-service stores or other mo-bile supermarkets.
LABEL’VIE SA
95%
MLV SAS
95%
HLV SAS SLV SA
100%
MOBI MARKET
50%
Below, is presented the organizational chart of the Label’Vie Group:
ANNUAL REPORT 2018 11

Below, is presented the organizational chart of the group as of December 31st 2018:
Hafid
Had
niDe
puty
Gen
eral
Man
ager
in
char
ge o
f the
Ca
rrefo
ur M
arke
t BU
Philip
pe A
lleau
me
Depu
ty G
ener
al M
anag
erin
char
ge o
f the
Ca
rrefo
ur B
U
Hich
am Y
acou
biDe
puty
Gen
eral
Man
ager
in ch
arge
of t
heAt
acad
ao B
U
BUSI
NESS
UNI
TS
Amin
e Be
nnis
Head
of F
inan
ce
& Ad
min
istra
tion
Amin
e Be
nsou
daGe
nera
l sec
reta
ry In
hea
d of
asse
ts a
nd p
ublic
re
lation
s
Moh
amed
Ha
lloum
head
of o
rgan
izatio
n an
d in
form
atio
n sy
stem
Ahm
ed A
bbou
head
of h
uman
re
ssou
rces
Noua
l Ben
amar
Depu
ty g
ener
al m
anag
er
in h
ead
of p
rocu
rem
ents
an
d lo
gist
ics
Hich
am K
itane
Head
of l
ogist
ics
Chry
stèle
Ronc
eray
Depu
ty G
ener
al M
anag
er
in ch
arge
of M
arke
ting
Mer
yem
Das
soul
iSp
ecia
l Ass
istan
t to
the G
ener
al
Man
ager
SUPP
ORT
FONC
TION
SBU
SINE
SS F
ONCT
IONS
Moh
amed
Kh
omsi
Head
of
Audi
t, Qu
ality
Co
ntro
l and
Sec
urity
Rach
id H
adni
Gene
ral M
anag
er
Rach
id B
elghi
tiHe
ad o
f Dev
elopm
ent
This structure reinforces the synergies and the collaboration between the different activities of the Group.
ANNUAL REPORT 201812
BOARD OF DIRECTORS
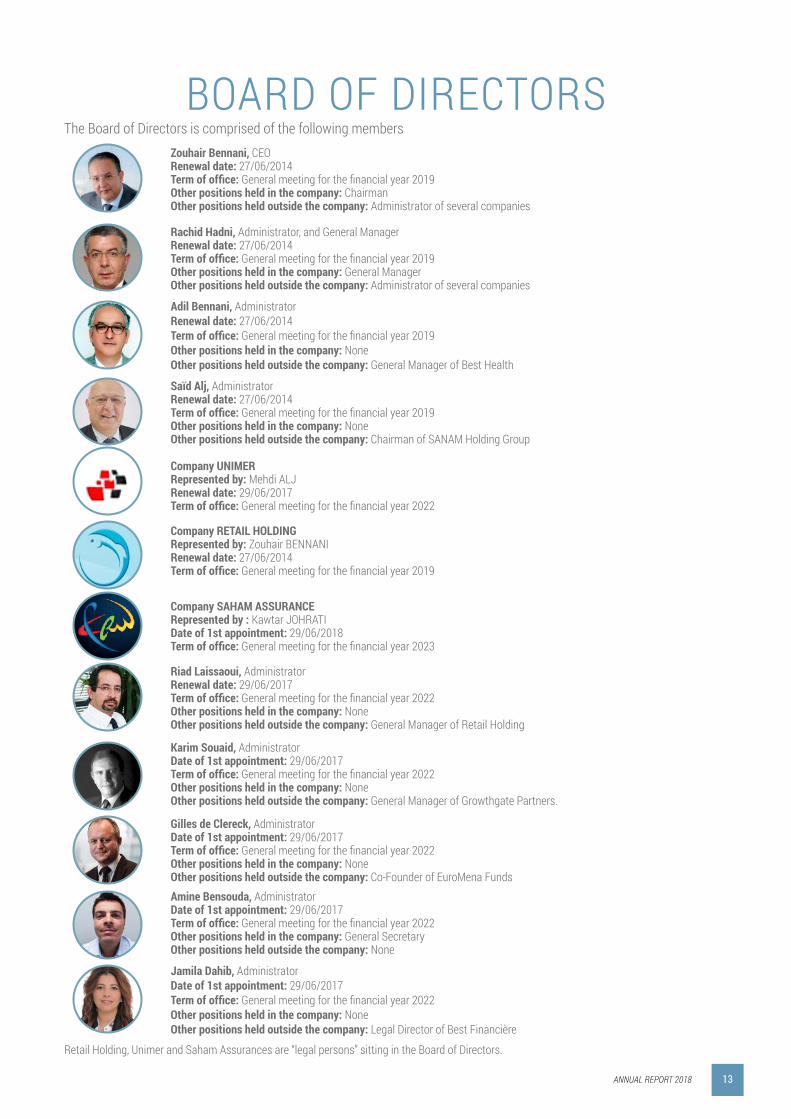
Retail Holding, Unimer and Saham Assurances are “legal persons” sitting in the Board of Directors.
The Board of Directors is comprised of the following members Zouhair Bennani, CEORenewal date: 27/06/2014Term of office: General meeting for the financial year 2019Other positions held in the company: ChairmanOther positions held outside the company: Administrator of several companies
Gilles de Clereck, AdministratorDate of 1st appointment: 29/06/2017Term of office: General meeting for the financial year 2022Other positions held in the company: NoneOther positions held outside the company: Co-Founder of EuroMena Funds
Rachid Hadni, Administrator, and General Manager Renewal date: 27/06/2014Term of office: General meeting for the financial year 2019Other positions held in the company: General ManagerOther positions held outside the company: Administrator of several companies
Amine Bensouda, AdministratorDate of 1st appointment: 29/06/2017Term of office: General meeting for the financial year 2022Other positions held in the company: General SecretaryOther positions held outside the company: None
Saïd Alj, AdministratorRenewal date: 27/06/2014Term of office: General meeting for the financial year 2019Other positions held in the company: NoneOther positions held outside the company: Chairman of SANAM Holding Group
Company RETAIL HOLDINGRepresented by: Zouhair BENNANIRenewal date: 27/06/2014Term of office: General meeting for the financial year 2019
Riad Laissaoui, AdministratorRenewal date: 29/06/2017Term of office: General meeting for the financial year 2022Other positions held in the company: NoneOther positions held outside the company: General Manager of Retail Holding
Karim Souaid, AdministratorDate of 1st appointment: 29/06/2017Term of office: General meeting for the financial year 2022Other positions held in the company: NoneOther positions held outside the company: General Manager of Growthgate Partners.
Company SAHAM ASSURANCERepresented by : Kawtar JOHRATI Date of 1st appointment: 29/06/2018Term of office: General meeting for the financial year 2023
Company UNIMERRepresented by: Mehdi ALJRenewal date: 29/06/2017Term of office: General meeting for the financial year 2022
Adil Bennani, AdministratorRenewal date: 27/06/2014Term of office: General meeting for the financial year 2019Other positions held in the company: NoneOther positions held outside the company: General Manager of Best Health
Jamila Dahib, AdministratorDate of 1st appointment: 29/06/2017Term of office: General meeting for the financial year 2022Other positions held in the company: NoneOther positions held outside the company: Legal Director of Best Financière
ANNUAL REPORT 2018 13

I n order to support its devel-opment, the Group has put in a place a governance sys-tem in order to meet three
main objectives:
• To implement the Group’s strat-egy through medium and long-term committees and short-term monitoring committees;
• To achieve objectives through the management of the Group’s business and support activi -t ies ;
• To be responsive by quickly detecting problems to make the necessary decisions.
These committees were put in
place fol lowing decisions taken at the general meetings of the Label ’Vie Group.
In order to ensure the continu-ous improvement of i ts organ-ization and functioning, the governance system is reviewed a n n u a l l y.
GOVERNANCE
ANNUAL REPORT 201814

COMMITTEES FROM THE BOARD OF DIRECTORSThese committees are responsi-ble for putting in place and mon-itoring the Group’s strategic poli-cy, in particular through:
• The Strategic Committee:Responsible for steering the implementation of the Group’s strategy, the Strategic Commit-tee meets quarterly with some members of the Group’s Board of Directors. It relies on external ex-perts whenever necessary.
• The Audit Committee:The role of the Audit Committee is to assess the role and effec-tiveness of the audit functions and to assess the management and internal control systems put in place by management.Some members of the Board of Directors, the Statutory Auditors and the Audit Director partici-pate in this committee.
THE GENERAL MANAGEMENT C O M M IT T E E SThe General Management chairs several committees to ensure the operational implementation of the Group’s strategy, the man-agement of its performance and the monitoring of priority pro-jects.
• The Executive Committee:This committee meets every month with all the Group’s direc-tors to review the performance indicators, share news and man-
age the Group’s strategic pro-jects .
• The Investment Monitoring C o m m i t t e e :As part of the Group’s devel-opment plan, this committee ensures the validation of new stores by studying their profita-bility and their strategic interest in covering the national territory through the different formats.The Investment Committee is comprised of some members of the Board of Directors, the Ex-pansion Director, the Administra-tive and Financial Director and the Deputy General Managers in charge of BUs.
• The Results Committee:This Committee aims to ensure a detailed review of the results of each BU. It is held monthly in the presence of the General Manag-er, the Deputy General Managers in charge of the BU, the Deputy General Manager in charge of the Marketing Department, the Dep-uty General Manager in charge of Purchasing and Logistics, the Logistics Director, the Adminis-trative Director and Financial and its Management Control team.
• The Pricing Committee:Over the last few years, the Group has built a pricing strat-egy aimed at ensuring the price competitiveness of all our ban-ners while securing profitability.Every month, this committee
meets to monitor the implemen-tation of this strategy and make the necessary decisions. The General Manager, the Deputy General Managers in charge of the BUs, the Deputy General Man-ager in charge of the Marketing Department, the Deputy General Manager in charge of Purchasing and Logistics and the Adminis-trative and Financial Director are involved.
• The Financial Committee:In preparation for the Board of Directors, the Finance Commit-tee meets to share the financial results of the quarterly accounts, to review the main financial indi-cators in terms of WCR and cash flows and to examine the de-tailed situation in terms of back margin.The General Manager, the Deputy General Managers in charge of BUs, the Deputy General Manag-er in charge of Purchasing and Logistics, the Logistics Director, the Administrative and Financial Director and his teams are in-volved: Regulation and Supplier Relations, Finance and Control Management. • Organization and Structure C o m m i t t e e :This committee is held every year to study proposals for the evolution of the organizational structure to support the Group’s development, while ensuring the control of defined payroll ratios.Attendants are the General Man-
ANNUAL REPORT 2018 15

ager, the Human Resources Director, the Organizat ion and Informat ion Systems Director, the Administrat ive and Finan-c ia l Di rector and the Directors with needs.
BUSINESS UNIT COMMITTEES (BU)Each Business Unit has i ts own committees to monitor a l l i ts act iv i t ies and to def ine specif -
ic act ion p lans: results man-agement , rev iew of operat ional act iv i ty and monitor ing of BU’s structur ing projects.
Each BU holds a monthly Man-agement Committee to manage i ts act iv i ty, monitor the per for -mance indicators and repor t on the progress of a l l projects and act ion p lans re lated to the BU.Par t ic ipat ing in th is commit-
tee , the Deputy General Man-ager in charge of the format , the Administrat ive and Finan-c ia l Di rector, the Director of Human Resources , the Organi -zat ion and IS Director, the Dep-uty General Manager in charge of the Market ing Depar tment , the Deputy General Manager in charge of Purchasing and Logist ics , the Logist ics Direc-tor, the Audit , Qual i ty and Safe-
ANNUAL REPORT 201816

ty Director and the various BU D i rectors .
The Management Committee is rel ies on the studies and the action plans defined by the var-ious committees held earl ier in the month:
• Commercial Committee: I t ensures the implementation of commercial pol icy in al l i ts dimensions, including the per-formance of categories, pro-motional performance or the organization of f lagship events of the promotional plan.
• Operational Committee: All the issues relating to the op-eration of the stores are treat-ed: the detai led results and the action plans to be implemented by the stores to achieve the objectives in terms of sales, margin and expenses , the per-formance of support functions (HR, IT, Qual ity and Security) .
• Commercial l ines Com-m i t t e e s : They are organized by depart-ment to analyze the results and define action plans. These committees are held in the presence of the representatives of the various business units: Purchasing, Marketing, Catego-ry Management, Operations and L o g i s t i c s .
• Lines Support Committees: There are three of them. They
deal with topics related to the cash l ine, the markdown and the technical issues of store a s s e t s .
OTHER TRANSVERSAL COM-M I T T E E SThe Group also rel ies on spe-cial ized committees on specif ic topics, including:
• The Assortment Committee: I t is within the framework of this committee that product supply decisions are made. It gathers monthly al l the com-mercial stakeholders (Purchas-ing, Marketing, Exploitation) to meet the needs of the custom-e r. • The Stocks Committee: Inventories are a crucial issue in the retai l sector. This com-mittee ensures monthly moni-toring of inventory indicators and their optimization.
• The Supplier Relations Com-mittee: I t analyzes each month the situation of suppliers in terms of sett lement and recovery of the back margin to enable the Group to launch the necessary actions to maintain healthy re-lat ions with its partners.
• The Quality, Health and Safety Committee: In a context in which the Group is increasing its level of de-mand in these areas in order to
better serve the customer, this committee was set up to re-view the various indicators on a quarterly basis.
The Expansion Committee:In order to secure the network’s sustained development plan, the Deputy General Manag-ers in charge of the BUs make an update with the Expansion team on the prospection of new stores, and this , on a quarterly b a s i s .
ANNUAL REPORT 2018 17

SECTOR
OVERVIEW OF THE MODERN DISTRIBUTION SECTOR IN MO-R O C C OThe landscape of modern distri-bution in Morocco has become more diversified in the recent years, driven by the growth sus-tained by the historical players and the entry of new interna-tional players. These latter ben-efit from the growth of the sec-tor in Morocco to develop new
formats. The sector neverthe-less remains dominated by two main groups:• Marjane Holding, leader in the large formats segment, with a 38% market share;• The Label’Vie group, with 30% market share, is the only player to operate 3 different formats:• Supermarkets, segment in which the group is leader;• Hypermarkets;
• Hypercash, pioneered by the group in Morocco.
EVOLUTION OF MARKET SHARES IN 2018 COMPARED TO 2017The table below details the evo-lution of the number of stores, the sales area and the market share for the different players between December 31, 2017 and December 31, 2018.
ANNUAL REPORT 201818

Below, are presented the different players of the sector:
THE COFARMA GROUP SUBSIDIARY OF AL MADA GROUP (EX SNI)Marjane, Acima and Otop. Marjane, leader in the modern distribution sec-tor, owns 82 stores and operates un-der three brands: Marjane, Acima and Otop.
• Marjane Holding group (subsidiary of AL MADA owned at 100%):The Marjane group operated 38 stores in 2018 in the major cities of the King-dom including Casablanca, Rabat, Meknes, Fez, Tetouan, Tangier, Mar-rakech, Mohammedia, Oujda, Nador, Khouribga, Beni-Mellal, Sidi Slimane, Larache and El Jadida.
• Acima (subsidiary of AL MADA owned at 100%):Acima is present in the neighborhoods of big cities, before expanding to small
and medium-sized cities. The subsidi-ary has a network that has reached 40 stores throughout Morocco.
• OTOP (subsidiary of AL MADA owned at 100%):The Otop group’s hard discount con-cept started with one store in 2017 and grew to 4 stores in 2018.
ASWAK ASSALAM (SUBSIDIARY OF THE GROUP CHAÂBI «YNNA HOL-DING») Subsidiary of the Chaabi group (Ynna Holding), Aswak Assalam has an 8% market share and operates 13 hyper-markets located in Rabat, Marrakech, Agadir, Kenitra, Temara, Tangiers, Ouj-da, Essaouira and Casablanca.
BIM MAROC In 2009, the hard discounter BIM, leader of the Hard Discount food dis-tribution in Turkey, settled in Morocco and quickly established itself on the
market thanks to a very aggressive development and implementation strategy and very competitive prices. . It achieved 14% market share and has 437 stores as of December 31, 2018 compared to 375 last year.
LEADER PRICE Leader Price opened its first store in Morocco in June 2016 in Casablanca and had 5 stores at the end of 2018.
LABEL’VIE GROUPLabel’Vie, listed on the stock mar-ket since 2008, has put in place a new strategic development plan to strengthen its position in the retail sector.
At the end of 2018, Label’Vie had 92 points of sale (187,398 m² of sales area), including 11 Atacadão stores (59,564 m²), 73 Carrefour Market stores (83,034 m²) and 8 Carrefour stores (44,800 m²).
The evolution of the sales area of the LBV group increased by 7.95% and by 0.21% for the Cofarma group.
Operators Type of stores
Number of stores in
2018
Change in number of
stores vs. 2017
Sales surface in
sqm in 2017
Maret share in 2017
Sales surface in sqm in
2018
Change in surface vs.
2017
Maret share in 2018
Cofarma Group 82 +3 289 263 50,4% 289 863 0,21% 46,8%
Marjane Hypermarket 38 +0 236 688 41,3% 236 688 0,00% 38,2%
Acima Supermarket 40 +0 52 375 9,1% 52 375 0,00% 8,5%
Otop Supermarket 4 +3 200 0,0% 800 300,00% 0,1%
Aswak Assalam Hypermarket 13 +0 48 500 8,5% 48 500 0,00% 7,8%
BIM Supermarket 437 +62 56 250 9,8% 87 400 55,38% 14,1%
Leader Price Supermarket 5 +0 2 100 0,4% 2 100 0,00% 0,3%
Yaboy Hypermarket 1 +0 4 000 0,7% 4 000 0,00% 0,6%
Label’Vie Group 92 +17 173 598 30,3% 187 398 7,95% 30,3%
Atacadão Hypercash 11 +0 59 564 10,4% 59 564 0,00% 9,6%
Carrefour Market Supermarket 73 +16 73 734 12,9% 83 034 12,61% 13,4%
Carrefour Hypermarket 8 +1 40 300 7,0% 44 800 11,17% 7,2%
Total 630 573 711 100,0% 619 261 100,0%
ANNUAL REPORT 2018 19

• C a r r e f o u r M a r k e t ( m a n a g e d b y t h e g r o u p L a b e l ’ V i e ) : I n 2 0 1 1 , f o l l o w i n g t h e s i g -n a t u r e o f a f r a n c h i s e a g r e e -m e n t , t h e L a b e l ’ V i e g r o u p c o n v e r t e d i t s e x i s t i n g s u p e r -m a r k e t s i n t o C a r r e f o u r M a r -k e t . A t t h e e n d o f 2 0 1 8 , t h i s s e g m e n t t o t a l e d 7 3 s t o r e s a c r o s s t h e K i n g d o m a n d i s i n c r e a s i n g l y s t r e n g t h e n i n g i t s p o s i t i o n a s t h e n a t i o n a l l e a d e r i n t h e s u p e r m a r k e t s e g m e n t w i t h t h e o p e n i n g o f 1 6 n e w s t o r e s w i t h a s a l e s a r e a o f 9 , 3 0 0 m ² t o r e a c h a t o t a l a r e a o f 8 3 , 0 3 4 m ² .
• C a r r e f o u r H y p e r m a r k e t ( m a n a g e d b y H LV S A S , s u b -s i d i a r y o f t h e g r o u p L a -b e l ’ V i e ) : T h r o u g h a f r a n c h i s e a g r e e -
m e n t , t h e G r o u p a l s o o b -t a i n e d t h e e x c l u s i v i t y o f o p e r a t i n g t h e C a r r e f o u r h y -p e r m a r k e t s b r a n d i n M o -r o c c o . T h e y e a r 2 0 1 8 w a s m a r k e d b y t h e o p e n i n g o f t h e 8 t h « C a r r e f o u r H y p e r m a r k e t » i n Te t o u a n , w i t h a 4 , 5 0 0 m ² o f a d d i t i o n a l s a l e s a r e a . I n 2 0 1 8 , s a l e s a r e a f o r t h i s f o r -m a t t o t a l e d 4 4 , 8 0 0 m ² d i v i d -e d i n t o 8 s t o r e s i n a l l o f t h e c i t i e s o f Ta n g i e r, Te t o u a n , S a l é , M a r r a k e c h , F e z , O u j d a a n d C a s a b l a n c a .
• A t a c a d ã o ( m a n a g e d b y M LV S A S , s u b s i d i a r y o f t h e g r o u p L a b e l ’ V i e ) : I n 2 0 1 2 , t h e L a b e l ’ V i e g r o u p l a u n c h e d t h e H y p e r c a s h c o n -c e p t u n d e r t h e A t a c a d ã o b r a n d i n o r d e r t o b e t t e r
m e e t t h e d e m a n d s o f p r o -f e s s i o n a l s ( e s p e c i a l l y s m a l l r e t a i l e r s ) a n d t o p r e s e n t a n a t t r a c t i v e o f f e r i n t e r m s o f p r i c e s t o t h e M o r o c c a n m i d -d l e c l a s s . A t t h e e n d o f 2 0 1 8 , t h e L a b e l ’ V i e g r o u p h a s 1 1 A t a c a d ã o s t o r e s .
The table below illustrates the structure of the existing stores at the end of 2017 and the openings that took place during the year 2018:
In 2018, were opened 17 new stores, representing an additional 13,800 m² of sales surface, distributed as follows:
Group segments Supermarkets Hypermarkets Hyper Cash Group’s Total
Number of stores as of dec. 2017 57 7 11 75
Sales surface in sqm 73 734 40 300 59 564 173 598
as a % of group’s total 42% 23% 34% 100%
Openings 16 1 0 17
Additional sales surface in sqm 9 300 4 500 0 13 800
Number of stores in 2018 73 8 11 92
Sales surface in sqm 83 034 44 800 59 564 187 398
as a % of group’s total 44% 24% 32% 100%
ANNUAL REPORT 201820

POSITIONINGDuring th is record year in terms of stores opening, Label ’V ie Group was able to strengthen i ts leading posit ion in the su-permarket segment in Moroc-co. With the inaugurat ion of 16 new stores , the group in -creased i ts number of stores to 73 supermarkets , thus adding a total sales area of 83 ,034 m².
The Group has indeed strength-
ened its presence in several cities of the kingdom (Casablanca, Mo-hammedia, Kenitra, Rabat, Tang-ier, Marrakech, Agadir, Nador and Tetouan), which gives it a leading position in the supermarket seg-ment in Morocco.
To further consolidate its position as a multi-format distributor, La-bel’Vie opened a Carrefour Hyper-market in Tetouan in May 2018.
Label’Vie is the only player in Morocco that provides its cus-tomers with 3 different distri-bution formats, thus providing a better offer perfectly in l ine with their expectations while meeting their needs in terms of p roduct -p r ice .
ANNUAL REPORT 2018 21

ANNUAL REPORT 201822

HIGHLIGHTS
ANNUAL REPORT 2018 23

A. NEW STORE OPENINGSIn 2018, the Label’Vie Group strengthened its position on the Moroccan market by opening 17 new stores:• 1 new Carrefour hypermarket located in Tetouan adding new sales area of 4,500 m²;• 16 new supermarkets under the Carrefour Market banner, with an additional sales area of 9,300 m²;
• Hypermarket Carrefour - Tétouan On May 16, 2018, the Label’Vie group opened its first Carrefour hypermarket in the city of Te-touan, bringing the total number of its hypermarkets to two in the northern region and eight in Mo-rocco. The store, which covers an area of 4,500 m², offers its customers a wide range of more than 25,000 products including 4,000 exclusive products, a tra-ditional shelf, a fresh juice stand and much more. The project required a total investment of MMAD 172.
• Carrefour Market Casablanca – Ain SebaaIn March 2018, in Casablanca, the group opened a Carrefour Market in Ain Sebaa. This store has a sales area of 200 m² and required an investment of MMAD 1.8.
• Carrefour Market Casablanca - Moulay RachidIn March 2018, in Casablanca, the group opened a Carrefour Market in Sidi Othmane. This store has a sales area of 200 m² and required an investment of MMAD 1.8.
ANNUAL REPORT 201824
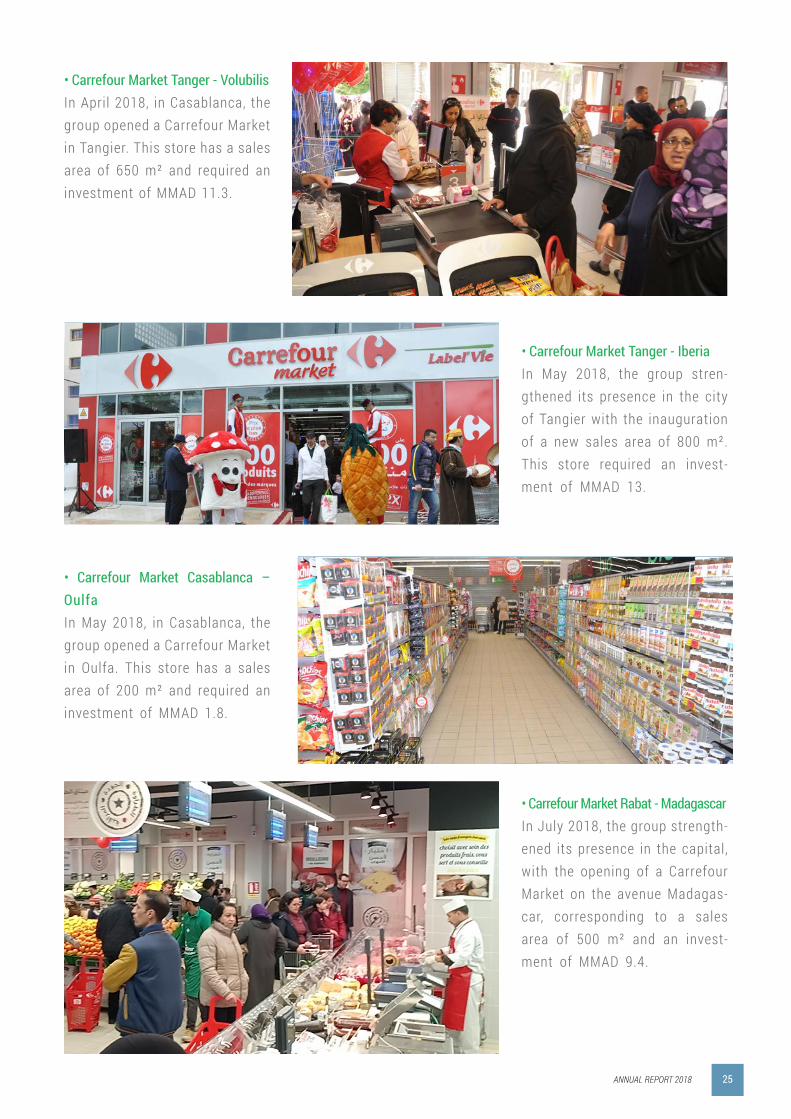
• Carrefour Market Tanger - Volubilis In April 2018, in Casablanca, the group opened a Carrefour Market in Tangier. This store has a sales area of 650 m² and required an investment of MMAD 11.3.
• Carrefour Market Tanger - IberiaIn May 2018, the group stren-gthened its presence in the city of Tangier with the inauguration of a new sales area of 800 m². This store required an invest-ment of MMAD 13.
• Carrefour Market Casablanca – OulfaIn May 2018, in Casablanca, the group opened a Carrefour Market in Oulfa. This store has a sales area of 200 m² and required an investment of MMAD 1.8.
• Carrefour Market Rabat - MadagascarIn July 2018, the group strength-ened its presence in the capital, with the opening of a Carrefour Market on the avenue Madagas-car, corresponding to a sales area of 500 m² and an invest-ment of MMAD 9.4.
ANNUAL REPORT 2018 25

• Carrefour Market Agadir - Hassan 2In September 2018, in Agadir was opened a new Carrefour Market, located on Avenue Hassan II, for an investment of MMAD 13 and a sales area of 800 m².
• Carrefour Market Casablanca – Roches Noires
Also in Casablanca in July 2018, the Group inaugurated a super-market in Roches Noires for an investment of MMAD 1.8 M and a surface of 200m².
• Carrefour Market Mohammedia - SebtaIn October 2018, the Label’Vie group opened a Carrefour Market in Mohammedia with a sales area of 500 m², requiring an invest-ment of MMAD 10.5.
• Carrefour Market Casablanca - Bel-leriveIn October 2018, the group inau-gurated a new Carrefour Market store in Casablanca of 850 m² and which required an invest-ment of MMAD 15.4.
ANNUAL REPORT 201826

• Carrefour Market Tetouan - WilayaIn November 2018, Tetouan ac-quired a new Carrefour Market with a sales area of 900 m², which required an investment of MMAD 15.7.
• Carrefour Market Casablanca - Bé-thuneAlso in October 2018, the pres-ence of the group was strength-ened in Casablanca with a new Carrefour Market, located rue Béthune, with a sales area of 500 m² and which required an invest-ment of MMAD 11.
• Carrefour Market - NadorIn November 2018, the Label’Vie group opened its first Carrefour Market proximity supermarket in Nador for an investment of MMAD 14.8 and a sales area of 1500 m².
ANNUAL REPORT 2018 27

• Carrefour Market Marrakech - Ma-jorelleIn December 2018, the Label’Vie group strengthens its presence in the ocher city by opening a Carrefour Market in the Majorelle district. This 500 m² store re-quired an investment of MMAD 11.
• Carrefour Market Kenitra - MimosaIn December 2018, Kenitra inau-gurates a new Carrefour Market, for an investment of MMAD 10.5 and a sales area of 500 m².
• Carrefour Market Casablanca - Bir AnzaraneTo close the year 2018, the group inaugurates a Carrefour Market located on avenue Bir Anzarane in Casablanca. The 500 m² store required an invest-ment of MMAD 9.5.
ANNUAL REPORT 201828

THE TABLE BELOW HIGHLIGHTS THE EVOLUTION OF OPENINGS BY REGION AS OF DECEMBER 31ST 2018:Regions Format 2016 2017 2018
Rabat- Salé AreaSupermarkets
Hassan Hassan HassanMédina Médina Médina
Riad Riad RiadShem's Shem's Shem's Zaërs Zaërs Zaërs
Sala Al jadida Sala Al jadida Sala Al jadidaSMS SMS SMS
El Manal El Manal El Manal Temara Wifak Temara Wifak Temara Wifak
Bettana BettanaMadagascar
Hypermarkets carrefour salé Carrefour salé Carrefour saléAtacadao Atacadão salé Atacadão salé Atacadão salé
Number of stores 11 12 13
Casablanca AreaSupermarkets
Vélodrome Vélodrome VélodromeAnfa Anfa Anfa
La gironde La gironde La girondeQuartier des hopitaux Quartier des hopitaux Quartier des hopitaux
Lissasfa Lissasfa LissasfaMaarif Maarif Maarif
Mohammedia Kasba Mohammedia Kasba Mohammedia KasbaTaddart Taddart Taddart
Romandie Romandie Romandie Oulfa Oulfa Oulfa
Yacoub el Mansour Yacoub el Mansour Yacoub el MansourVal Fleury Val Fleury Val FleuryAin Sebaa Ain Sebaa Ain Sebaa
Mohammedia Alia Mohammedia Alia Mohammedia AliaGauthier Gauthier Gauthier
Resistance Resistance ResistanceAnfa Place Anfa Place Anfa Place
Ziraoui Ziraoui ZiraouiCasablanca Abdelmoumen Casablanca Abdelmoumen Casablanca Abdelmoumen
Casablanca Bourgogne Casablanca Bourgogne Casablanca BourgogneCasablanca Ain Chok Casablanca Ain Chok
Casablanca Panoramique Casablanca PanoramiqueCasablanca Ain sebaa
Casablanca OulfaCasablanca Roches Noires
Casablanca BetumCasablanca Bellerive
Casablanca Bir AnzaraneMohammedia Avenue Sebta
Moulay rachidHypermarkets Carrefour Bouskoura Carrefour Bouskoura Carrefour Bouskoura
Atacadao Atacadão Ain Sebaa Atacadão Ain Sebaa Atacadão Ain SebaaNumber of stores 22 24 32
Other Areas
Supermarkets
Kénitra Kénitra KénitraMeknes Meknes MeknesSettat Settat Settat
El jadida El jadida El jadidaKhemisset Khemisset KhemissetKenitra 2 Kenitra 2 Kenitra 2
Fes route d'imouzzer Fes route d'imouzzer Fes route d'imouzzerAgadir Agadir Agadir
Marrakech la Fontaine Marrakech la Fontaine Marrakech la FontaineSafi Safi Safi
Plaisance Plaisance PlaisanceAGADIR 2 AGADIR 2 AGADIR 2
SIDI SLIMANE SIDI SLIMANE SIDI SLIMANEBENI MELLAL BENI MELLAL BENI MELLAL
Khénifra Khénifra KhénifraEssaouira Essaouira Essaouira
Carre Eden (Marrakech) Carre Eden (Marrakech) Carre Eden (Marrakech)Berkane Berkane Berkane
Menara Mall (Marrakech) Menara Mall (Marrakech) Menara Mall (Marrakech)Fes Ain Chkef Fes Ain Chkef Fes Ain Chkef
Meknes Moulay Smail Meknes Moulay Smail Meknes Moulay SmailTanger Malabata Tanger Malabata Tanger Malabata
Tanger Ibn Battouta Tanger Ibn BattoutaFès Atlas Fès Atlas
Tetouan Wilaya Tetouan WilayaTanger Volubilis
Tanger IberiaTetouan
Agadir Hassan IINador
Kenitra MimosaMarrakech Majorelle
Hypermarkets
Carrefour Targa (Marrakech) Carrefour Targa (Marrakech) Carrefour Targa (Marrakech)Carrefour Oujda (Oujda) Carrefour Oujda (Oujda) Carrefour Oujda (Oujda)
Carrefour BORJ FES (FES) Carrefour BORJ FES (FES) Carrefour BORJ FES (FES)Carrefour Al mazar (Marrakech) Carrefour Al mazar (Marrakech) Carrefour Al mazar (Marrakech)
Tanger Socco Alto Tanger Socco Alto Tanger Socco AltoTetouan
Atacadao
Atacadão Fes Atacadão Fes Atacadão FesAtacadão Tanger Atacadão Tanger Atacadão Tanger Atacadão Oujda Atacadão Oujda Atacadão Oujda
Atacadão Marrakech Atacadão Marrakech Atacadão MarrakechAtacadão SIDI KACEM Atacadão SIDI KACEM Atacadão SIDI KACEM
Atacadão FKIH BENSALEH Atacadão FKIH BENSALEH Atacadão FKIH BENSALEHAtacadão Agadir Atacadão Agadir Atacadão AgadirAtacadão Taza Atacadão Taza Atacadão Taza
Atacadão Meknes Atacadão Meknes Atacadão MeknesNumber of Stores 36 39 47
Total 69 75 92
2018, record year for openings: the group now manages 92 stores thanks to its policy of proximity and the strong performance of all of its business segments. This growth is the result of the development strategy adopted by the Group since its IPO in 2008.
ANNUAL REPORT 2018 29

El Jadida
Sidi Kacem
Sidi Slimane
Safi
Mohammedia
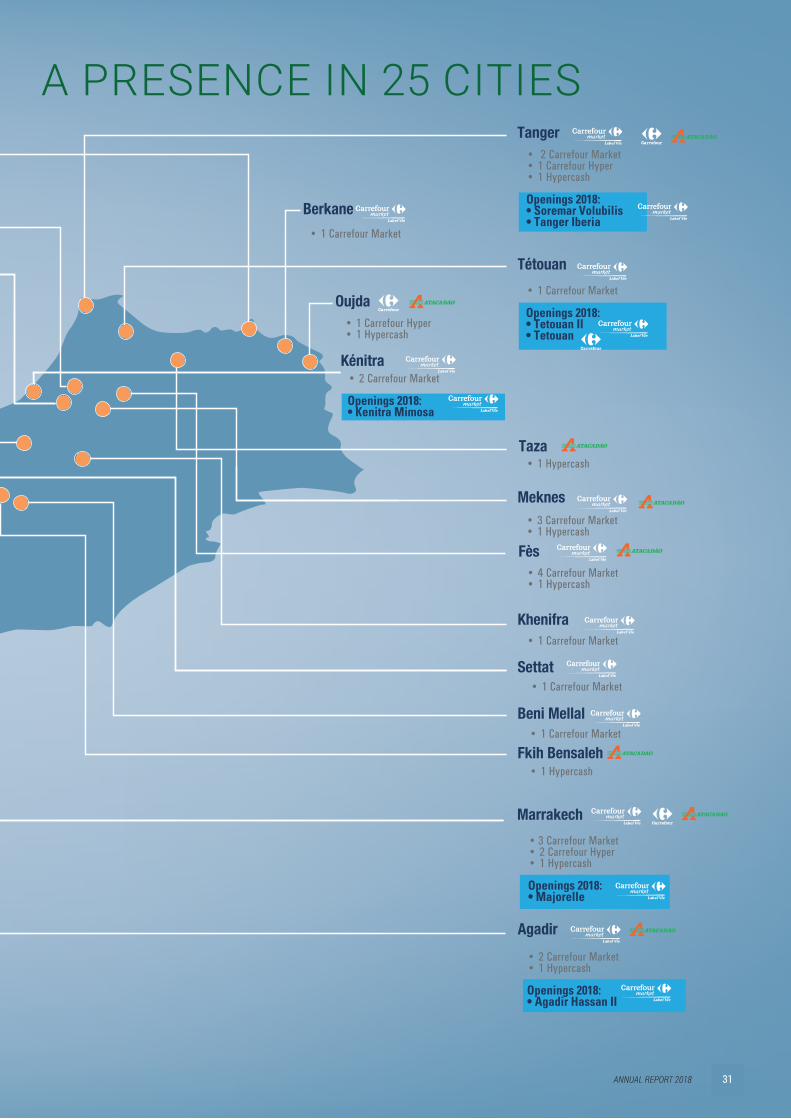
• 1 Carrefour Market
• 1 Carrefour Market
• 1 Carrefour Market
• 1 Carrefour Market
• 1 Carrefour Market
• 1 Carrefour Market
• 2 Carrefour Market
Openings 2018:• Mohammedia Av Sebta
• 20 Carrefour Market• 1 Carrefour Hyper• 1 Hypercash
Openings 2018:• Moulay rachid• Ain Sbaa• Oulfa• Roches Noires• Béthune• Bellerive• Bir Anzarane
• 9 Carrefour Market• 1 Carrefour Hyper• 1 Hypercash
Openings 2018:• Madagascar
Temara Wifak
Rabat-Salé
Casablanca
• 3 Carrefour Market• 2 Carrefour Hyper• 1 Hypercash
Openings 2018:• Majorelle
Settat
Beni Mellal
Fkih Bensaleh
Fès
Agadir
Khémisset
• 2 Carrefour Market• 1 Carrefour Hyper• 1 Hypercash
Openings 2018:• Soremar Volubilis• Tanger Iberia
TangerNador
Khenifra
• 1 Carrefour Hyper• 1 Hypercash
Oujda
Berkane
• 4 Carrefour Market• 1 Hypercash
• 3 Carrefour Market• 1 Hypercash
• 1 Carrefour Market
• 1 Carrefour Market
• 1 Carrefour Market
• 1 Carrefour Market
• 1 Hypercash
• 1 Hypercash
• 2 Carrefour Market• 1 Hypercash
Openings 2018:• Agadir Hassan II
Marrakech
Kénitra• 2 Carrefour Market
Openings 2018:• Kenitra Mimosa
Taza
Meknes
• 1 Carrefour Market
Openings 2018:• Tetouan II• Tetouan
Openings 2018:• 1 Carrefour Market
• 1 Carrefour Market
Tétouan
Essaouira
A MATURE CONCEPT WITH A PRESENCE IN 25 CITIES
ANNUAL REPORT 201830
El Jadida
Sidi Kacem
Sidi Slimane
Safi
Mohammedia
• 1 Carrefour Market
• 1 Carrefour Market
• 1 Carrefour Market
• 1 Carrefour Market
• 1 Carrefour Market
• 1 Carrefour Market
• 2 Carrefour Market
Openings 2018:• Mohammedia Av Sebta
• 20 Carrefour Market• 1 Carrefour Hyper• 1 Hypercash
Openings 2018:• Moulay rachid• Ain Sbaa• Oulfa• Roches Noires• Béthune• Bellerive• Bir Anzarane
• 9 Carrefour Market• 1 Carrefour Hyper• 1 Hypercash
Openings 2018:• Madagascar
Temara Wifak
Rabat-Salé
Casablanca
• 3 Carrefour Market• 2 Carrefour Hyper• 1 Hypercash
Openings 2018:• Majorelle
Settat
Beni Mellal
Fkih Bensaleh
Fès
Agadir
Khémisset
• 2 Carrefour Market• 1 Carrefour Hyper• 1 Hypercash
Openings 2018:• Soremar Volubilis• Tanger Iberia
TangerNador
Khenifra
• 1 Carrefour Hyper• 1 Hypercash
Oujda
Berkane
• 4 Carrefour Market• 1 Hypercash
• 3 Carrefour Market• 1 Hypercash
• 1 Carrefour Market
• 1 Carrefour Market
• 1 Carrefour Market
• 1 Carrefour Market
• 1 Hypercash
• 1 Hypercash
• 2 Carrefour Market• 1 Hypercash
Openings 2018:• Agadir Hassan II
Marrakech
Kénitra• 2 Carrefour Market
Openings 2018:• Kenitra Mimosa
Taza
Meknes
• 1 Carrefour Market
Openings 2018:• Tetouan II• Tetouan
Openings 2018:• 1 Carrefour Market
• 1 Carrefour Market
Tétouan
Essaouira
A MATURE CONCEPT WITH A PRESENCE IN 25 CITIES
ANNUAL REPORT 2018 31

ANNUAL REPORT 201832

B - FISCAL AUDIT In 2018, the group was subjected to a tax audit covering the fiscal years 2014 to 2017 (as well as 2013 for the subsidiary maxi-lv).The audit included the following subsidiaries:
• The parent company La-bel’Vie SA;• The two subsidiaries maxi lv and hypermarche lv.
This audit included the following areas:
• Corporate taxes;• Income taxes;• Value Added taxes (VAT).
The total amount of tax assessed stood at MMAD 32.
C - DIVESTMENT OF THE LAND AND THE REAL ESTATE PROPERTY IN « ZAËRS »The Group’s new strategy prevails separating the core business (re-tail) from real estate and land management. The Label’Vie Group therefore proceeded in 2018 with the sale of «Zaërs» to ARADEI. The sale includes the land held by LBV on the Zaërs site, the real estate component (store) and the average surface area under construction. The operation resulted in capital gains of MMAD 35.
ANNUAL REPORT 2018 33

ANNUAL REPORT 201834

In line with the strategic objectives set in terms of performance and the opening of new sales outlets, the Label ‘Vie Group has seen its main economic and financial indicators soar:
- Revenue jumped by 9.2%;- Net Income soared by 19.7%;- Opening of 17 new stores including a hypermarket.
KEY ACHIEVEMENTS
ANNUAL REPORT 2018 35

AT THE OPERATIONAL LEVELMain indicators :The evolution of the main sales indicators is illustrated in the following table:
T h e ave r a g e b a s ke t o f t h e L a -b e l ’ V i e g ro u p h a s d e c re a s e d f ro m M A D 2 0 8 i n 2 0 1 7 to M A D 1 9 9 i n 2 0 1 8 . At t e n d a n c e h a s i n c re a s e d by 1 4 % , f ro m 4 1 m i l l i o n re c e i p t s i n 2 0 1 7 to 4 7 m i l l i o n re c e i p t s i n 2 0 1 8 , w h i c h a l l o w e d f o r a n i n c re a s e i n t h e vo l u m e o f s a l e s a c ro s s a l l b u s i n e s s s e g m e n t s o f t h e g r o u p .
H U M A N R E SSO U R C E SG i ve n t h e c u r re n t c o n t e x t :T h a n k s to t h e d eve l o p m e n t o f o u r m u l t i - f o r m a t a c t i v i -t i e s , w e h ave a n a n n u a l n e e d f o r re c r u i t i n g a n d i n t e g r a -t i n g a b o u t 2 0 0 0 e m p l oye e s w i t h o p e r a t i o n a l s k i l l s , o u t o f w h i c h 1 0 % a re s p e c i a l i ze d i n m a n a g e m e n t i n t h e f i e l d o f re t a i l d i s t r i b u t i o n . B u t u n f o r -t u n a t e l y, t h e re i s a s c a rc i t y o f o p e r a t i o n a l s k i l l s i n t h e M o -ro c c a n m a r ke t d u e to t h e l a c k
o f t r a i n i n g s t r u c t u re s t a i l o re d f o r t h e s e c to r.
T h e c h a l l e n g e f o r t h e H R d e -p a r t m e n t i s t h e re f o re to d e -s i g n a n d d e p l oy a n H R p o l i c y a d a p t e d to t h e s e s o c i a l a n d s t r u c t u r a l c o n s t r a i n t s .
To m i t i g a t e t h i s c h a l l e n g e , a n d s i n c e 2 0 1 5 , t h e G ro u p ’s H u m a n R e s o u rc e s D e p a r t -m e n t h a s b e e n s t r u c t u re d a ro u n d 3 a re a s , i n o rd e r to m e e t t h e e x p e c t a t i o n s o f e m -p l oye e s a n d t h e re q u i re m e n t s o f t h e b u s i n e s s :
- T h e H R a n d C o r p o r a t e C u l t u re Proximity Depar tment ;- T h e H R D eve l o p m e n t D e p a r t -ment ;- Pe r s o n n e l A d m i n i s t r a t i o n a n d S o c i a l A f f a i r s D e p a r t -m e n t ;R e g a rd i n g t h e G ro u p ’s H R p o -
l i c y, i t i s b u i l t a ro u n d t h e f o l -l o w i n g s t r a t e g i c a re a s :
• C o n s o l i d a t i n g t h e e m p l oye r ’s b r a n d ( i n t e r n a l a n d e x t e r n a l ) ;
• S u p p o r t i n g t h e s t r a t e g i c d eve l o p m e n t o f t h e b u s i n e s s u n i t s i n t h e p e r i o d 2 0 1 8 - 2 0 2 0 ;
• B u i l d i n g L a b e l ‘ Ec o l e to w a rd a c e n t e r o f e xc e l l e n c eT h e t a b l e b e l o w s u m m a r i ze s t h e m a i n a c h i eve m e n t s o f t h e H u m a n R e s o u rc e s D e p a r t -m e n t i n 2 0 1 8 :
2015 2016 2017 2018 CAGR 2018
Number of stores 63 69 75 92 23%
Number of receipts 35 133 190 38 945 863 41 556 817 47 462 985 14%
Total sales (inc. VAT) in MMAD 7 026,28 7 761,84 8 652,59 9 453,25 9%
Average basket (inc. VAT) in MAD 200 199 208 199 -4%
ANNUAL REPORT 201836

Recruitment In 2018, 2,571 employees were recruited (compared to 1,895 in 2017)
Internal mobility In 2018, internal recruitment accounted for 41% of total recruitments (vs. 54.14% in 2017)
Internal recruitment In 2018, we have met management needs internally with a total of 351 employees (vs 237 in 2017) via 186 promotions
Orientation of new managers
8 integration seminars were conducted in 2018 bringing together 84 new recruits
Corporate culture • Organization of a Team Building with the presence of 350 Group executives;• Enhancement of the Facebook page which reached 130,000 subscribers;• Organization of an annual breakfast for the 3 headquarters ;• Distribution of gifts to 2,500 women during the International Women’s Day.
Social and health en-deavors
• 1 Family Day organized and attended by 200 adults and 168 children under 12;• Organization of a day for 63 pregnant women of the Group;• Organization of a day for 103 future dads of the Group;• Organization of an awareness day for 80 diabetic employees of the Group;• Organization of an anti-smoking campaign for all the staff;• Organization of 3 «Sweets» breaks for 456 women of the Label’Vie group;• Organization of the «School Excellence Award» for 9 children sons and daughters of our employees with the highest high-school diploma grades;• Organization of 2 soccer tournaments with the participation of 350 employees.
Training • 715 actions completed in 2018 (+ 18% compared to 2017);• 4,789 participations in 2018 (+ 18% compared to 2017);• 6,713 man / days (participations) in 2018 (+ 8% compared to 2017);1,718 beneficiaries in 2018, i.e. 30% of employees (+ 8% compared to 2017).
Specific training / La-bel ‘Ecole
• 536 training actions carried out in 2018 (+ 33% compared to 2017);• 4,258 participations in 2018 (+ 50% compared to 2017);• 1,404 beneficiaries in 2018 (+ 23% compared to 2017);• 5,203 days / man (participations) in 2018 (+ 46% compared to 2017);• An offer consisting of 22 training cycles;• 62 internal trainers and 121 department managers in the training departments and 22 school stores.
SUPPLY CHAINLogistics is a core element in the Group’s business with many mile-stones achieved during the year 2018:
Automated supply flows and de-tention management toolsAfter covering food flows, the au-tomation of store supply manage-
ment continued with the start of the project on the non-food part of the business. This is a business project aimed at ensuring optimal store ownership at the store level as well as optimizing inventory levels.Regional sourcing of fresh prod-uctsAlways anxious to ensure a
high-quality competitive offer in terms of market products, the Group has been committed for several years to a sourcing policy that keep them close to producers of fresh produce. Regional sourcing projects for fruits and vegetables as well as sea products are now operational and allow for offering the best fresh-ness in our stores.
KEY FIGURES FOR 2018
ANNUAL REPORT 2018 37

MARKETING AND BUSINESS DEVELOPPEMENT• Carrefour strengthens its po-sitions With the opening of 16 new stores in 2018, Carrefour Market increased its sales area by 9,300 m² and strengthened its pres-ence on the Rabat-Casablanca axis, but also in other regions of Morocco, particularly in the north, (Tangier, Tetouan, Nador) and in the south of the country (Marrakech, Agadir).
With these new openings, Carre-four Market operated 73 stores at the end of December 2018.In addition, the Group is also strengthening its position in the hypermarket segment with the inauguration of a new Carrefour in Tetouan with a surface area of 4,500 m². This opening brings the number of Carrefour hyper-markets to two in the northern
region and a total of eight na-t ionwide.
DEPLOYMENT OF NEW VALUE-ADDED SERVICES
We have developed in our store new services, to strengthen our in-store customer service and allow for new growth opportuni-t ies:- Sales of electronic refills in s t o r e s ;- Possibility of payment by for-eign credit card (DCC) in store;- Launch of the Label’Vie Card, available in all hypermarkets (and still in the test phase at 6 Carrefour Market). This card makes it possible to finance the purchases by offering several possibilities of payment:• Payment at the end of the month and without charges;• Payment in 3, 6 or 10 install-m e n t s ;
• Possibility of having a cash re-serve to finance some or all of the purchases.
• Freshness CampaignSince 2017, were launched two communication campaigns fo-cusing on the quality of fruits and vegetables and meats, trac-ing the processes put in place by the group. These achievements were supported by in-store train-ing, increased product dramati-zation and tasting programs. A digital campaign has also been set up to explain to customers the quality process, ranging from selection, sourcing and market-ing to products.
• Internal Campaign 100% ClientsLaunch of an in-house campaign 100% focused on the customer in order to become the reference in terms of customer relations in Morocco and in the retail sec-
ANNUAL REPORT 201838

tor. This campaign is in several parts:- Training all store staff from the manager to the employee;- Creation of media diffusible on screens in the offices and com-mon places of the collaborators;- Creation of a physical booklet available in store for new re-cruits and for continuous train-ing, bringing together the brand’s values and the behavior to be held towards our customers
ITIn the course of 2018, the IT department has made a signif-icant improvement in its tele-communication network in order to increase its performance and reliability. This operation made it possible to improve the oper-ation of the tools made available to the operational staff in the stores, thus contributing to their operational excellence.On the other hand, the scope covered by the continuity plan has been extended beyond the sales and management tools of the logistics chain to cover the management and reporting systems in order to reduce the constraints related to a possible change over the backup site in case of problems.
QUALITY The Label’Vie Group operates within the framework of a qual-ity policy, based on the needs of customers and on Moroccan reg-ulatory requirements relating to
food quality and safety.The main tenets of this policy are listed as follows:• Healthy, fresh and quality prod-ucts that meet the needs of cus-tomers;• Rays that meet the standards of hygiene and food safety;• A guarantee of the cold chain;• Quality control at all stages: from reception to customer;• Experienced and continuously trained staff.
• Control of product quality: Market, private label• Ensure the approval of the prod-ucts Market before shipment to our stores (Fruits & vegetables, meats and sea products);• Ensure the control of import-ed products according to the Group’s requirements;• Set up a control covering sani-tary risks and controlled recipes in order to propose to our cus-tomers products of quality for our MDD (brand of the distribu-tor) ;• Provide Quality support for pur-chases in supplier referencing, implementation of specifications framing the quality of products and their controls.
• Quality control at the store le-vel• Establish a system ensuring the safety of the products distribut-ed by our warehouses and pro-cessed in the workshops of our stores through quality audits and support of the stores by applying
the internal quality requirements and standards of the IFS Group (HACCP);
• Ensure the safety of processed fresh products through micro-biological and physicochemical analyzes carried out by accredit-ed laboratories;
• Respect of environmental re-quirements with the implementa-tion of waste management that groups the collection, transport, recovery and disposal of waste for Carrefour Market Rabat stores .
AT THE SECURITY LEVELThe Safety and Risk Prevention Department contributes to the protection of equipment and as-sets, to the improvement of the safety of the Label’Vie Group’s employees and its service pro-viders, through the creation of a QHS committee (Quality, Hy-giene, Safety) and the implemen-tation of risk prevention actions. This approach has been rein-forced by the Group’s desire to subscribe to a proactive CSR ap-proach and policy.
The Label’Vie Group is also fight-ing against theft and shrinkage by improving its monitoring sys-tem and setting up PCS (Post Control Surveillance) agents.
As part of the continuous im-provement process, the Safety and Risk Prevention Department
ANNUAL REPORT 2018 39

has set up numerous safety projects during 2018:
Component: management «secu-rity-control»:• Assessment of the entire security team;• Diploma course «Fire Safety and Personal Assistance Service (SSIAP 1)»;• Nursery training to prepare future security supervisors for BU BUILD stores;• Periodic training in fire safety and first aid
Component: strengthening safety:• Generalization of the outsourcing of the PCS workstation;• Improved electronic protection;• Investment in safety equipment.
Component: risk prevention:• The Safety and Risk Prevention Department accompanies the ex-pansion of new openings in the work-sites from conception to completion and ensures awareness of risks and the application of preventive meas-ures;• Upgrading evacuation plans;• Planning evacuation drills.
INTERNAL AUDITInternal Audit’s mission is to analyze all the activities of the company in order to give the General Manage-ment and the Board of Directors an assurance on the proper functioning of the processes.
Achievements of 2018: In 2018, the internal audit department
was able to carry out 18 missions relating to material flow, information flows, cash flows and personnel.
These missions, which concern all BUs and central functions, have high-lighted a set of findings classified ac-cording to their degree of criticality.Following these observations, action plans were defined with the managers concerned. The internal audit depart-ment monitors the implementation by the management of the action plans necessary to reduce, or eliminate, the most critical risks inherent in the var-ious findings.
Risk management and risk mapping:Two risk mapping projects were com-pleted in 2018:• The mapping of HRM risks was put in place with HRD following work-shops involving the audit department, the operational staff and an external firm;• The delegation matrix has been up-dated to adapt to the group’s evolu-tion, while ensuring good governance and operational efficiency.
Internal control system:In order to establish an internal con-trol culture, store audits were carried out at the level of the three BUs, re-viewing all the critical processes at the store level (97 verification tests).The internal audit plan for 2019 was prepared on the basis of:• Risk Mapping of the Purchasing cy-cle in 2016;• HRM risk mapping in 2018;• Matrix of delegations of authority;• Incidents identified by security;
• Deficiencies or dysfunctions identi-fied during the 2018 audit missions;• Management requests;• Finalized projects and key proce-dures;• Audit stores.
In order to strengthen the fraud pre-vention system, the Internal Audit Department has planned for 2019 the creation of an anti-fraud system.Regarding risk management, the de-partment plans to implement risk mapping for the «Receipts» and «Lines» processes.
EXPANSIONSThe expansions department is organ-ized into 3 distinct departments:
Prospecting department:A team of prospectors crisscross all Morocco in search of land to build or stores to develop.
Administrative department:A cell is in charge of working with the city authorities to ensure the ac-quisition of various exemptions and authorizations (authorization to build, develop and operate the premises).
Construction works department:Project managers, assisted by MODs and masters of works, manage the construction, planning and technical equipment companies.
At the beginning of fiscal 2018, the Ex-pansion Division was given an excep-tional target of opening 17 stores for the current year and prospecting for a number of other spaces for openings
ANNUAL REPORT 201840

in subsequent years.To ensure this steady pace, the Build-ing Works Department had to prepare, well in advance, framework contracts for almost all construction and equip-ment supply services.
The same department also formalized certain tasks, such as the preparation of a risk assessment checklist before each acquisition and the introduction of a procedure for assessing the per-formance of construction companies. A process for the management of safety, hygiene and the environment inside the building sites has been for-malized. These new processes have made it possible to optimize the quali-ty of the mission accomplished by the
department.Continuing its commitment in terms of energy savings and in addition to the achievements made since 2016, the Direction Expansion finalized the consultations and the award contract for the installation of a photovoltaic power plant. The installation of this plant will be effective in 2019.
CORPORATE SOCIAL RESPONSIBILITYOur Label’Vie Group has always com-bined economic and social vocation. A deep conviction is enshrined in the Group’s DNA: to succeed in the eco-nomic challenge of development, an important social component must be included. At the beginning of 2018, the directives were given to set up a
structured CSR approach with the ob-jective of being labeled CGEM in 2019. This ambition of labeling, in addition to the excellent image associated with it, makes it possible to structure our actions, and to register them in continuity (regular audits scheduled for early April 2019).We hired a spe-cialized firm to monitor our approach to the highest standards of CSR. We then set up a COPIL (Steering Com-mittee) which meets every month to check the progress of the roadmap. Our goal is that by the end of 2019, our 7,000 employees positively im-pact the environment through their training in basic or more technical actions associated with our CSR prin-ciples. Because the accumulation of
ANNUAL REPORT 2018 41

small gestures produces big changes. Our CSR approach manifests itself through five commitments, in or-der to integrate into our strategy and our commercial activities our social, environmental, ethical and labor code concerns. On the basis of a clear, solid and practical day-to-day business culture, good hab-its are anchored more easily and durably.
1st Commitment: Customer Orien-tationCSR thinking is a strategic busi-ness. It involves an invitation to rethink the company in the broader perspective of its relationship with
society. Our definition of CSR is based on the idea that the respon-sibility of our group goes beyond the pursuit of profit and the respect of the law, and that it concerns all the stakeholders of the company.
Innovate to make life easier for the consumerAt Label’Vie, the customer is at the center of all eyes. We are committed to offering him the right to informa-tion, offers tailored to his needs and optimal processing of his claims.
We develop multi-format concepts: Hypercash, Hypermarket and Su-permarket to cover a whole range of
services and products adapted to our many types of customers.On the other hand, a continuous pol-icy of innovation and lower prices ensures the accessibility of our prod-ucts to the greatest number. The cus-tomer experience is facilitated by the implementation of a commitment to guarantee the lowest price for the su-per and hyper formats. This initiative gives customers access to 200 or 300 top brand products at the lowest prices.
Ensure food securityThe good quality and freshness of our products is the first requirement of our customers. To ensure their
ANNUAL REPORT 201842

satisfaction, we provide them with processes guaranteeing this quality, and apply monitoring and approved expertise covering 100% of our activ-ities.
Quarterly audits are conducted by renowned firms to check the com-pliance of our stores with regulato-ry and internal health requirements. The Group has a store support plan with quality engineers in charge of monitoring.
Ensure the excellence of the cus-tomer experienceThe satisfaction of our customers is largely dependent on good claims management. In order to optimize the processing, we have made avail-able several channels (call centers, social networks, stores) with effi-cient organizational procedures for the management of complaints with a maximum delay of 48 hours (More than 300 complaints are processed every month, with a response rate of 100% and a satisfaction rate of 76% in 2018)
Adopting ethical practices and trans-parencyThis axis of our CSR policy implies the protection of personal data. Spe-cifically, access to different informa-tion systems is governed by dedicat-ed authorizations, whose allocation is subject to a secure validation pro-cess. Also, sensitive data is acces-sible only to the specific population that is supposed to process it.
On the other hand, our practices
require a clear and unambiguous communication of rates, offers and promotions to the address of our customers. The advertising and communication used employ the best information tools and the most appropriate channels for each type of need.
2nd Commitment: Valorization of our human capitalOur success as a leading retailer is based on the quality of our inter-actions, with the client, as well as within our teams of women and men committed to their professional and personal success. To ensure the good conduct of this team work, and to maintain good human relations, we are committed to developing our human capital.
Support to our employeesTo ensure that our employees ac-quire the skills that are essential to their career plan, our Label’Vie Group defines each year an adapted train-ing offer for each population. The trainings are thus thought according to the needs of each direction, stud-ied according to the different profes-sional categories.
Guaranteeing Health, Safety and Well-being at WorkOur Group promotes health through a regionally driven occupational medicine system. A work accident risk prevention system has also been designed to identify the risks associ-ated with each workstation.
Our group also develops and main-
tains social spaces for all its employ-ees (canteens, cloakrooms, compa-ny restaurants, rest rooms ...) and organizes relaxation events, such as the Douce’Heure Breaks, compe-titions and team buildings, for more wellbeing in the work.
Say NO to discrimination and YES to equal opportunities!
Performance, skills, these are the essential criteria for internal recruit-ment or promotion. These qualities determine the recruitment and ca-reer management policy we have es-tablished within our Group. In order for our CSR policy to be in synch with gender equality, Label’Vie enhanc-es its career management by con-trolling quotas for women in internal recruitment and promotions.
Finally, we develop pay scales that promote equity in terms of the im-portance of positions, regardless of the type of employee. Permanent monitoring of compensation levels enables us to constantly adapt our salary scales to the reality of differ-ent types of careers and to their evo-lution within the Group.
Finally, in collaboration with our oc-cupational physicians, Label’Vie is working to redeploy certain employ-ees with physical disabilities.
Fostering solidaritySome of our employees may experi-ence difficult situations. In order to provide them with the support and solutions they need to recapture
ANNUAL REPORT 2018 43

their work / life balance, our Group promotes the spirit of solidarity.For 10 years, we have set up a So-cial Assistance Fund (SOC), which is 50% financed by the Group and 50% by its employees. Each employee can voluntarily contribute to their level, and as a member of the fund, they can benefit from social assis-tance in case of disaster, incident or unforeseen life.
Health is the hard core of this in-ternal solidarity drive. Our Label’Vie Group organizes health appoint-ments in partnership with experts in the field, for all employees.
An effective employee is a balanced individual. At the heart of our prior-ities in the area of solidarity is the promotion of parenthood. As a re-sult, several actions aim to increase the work / life balance. We organize days of the pregnant woman, days of the future daddy or the Family Days, real opportunities to awaken to the responsibilities and to the pa-rental blooming.
Children are also honored with the school excellence award, which is part of our solidarity action, and intended to create a positive emu-lation between the children of our employees.
• Average number of women benefit-ing each year from Pregnant Wom-en’s Day: 110 women• Average number of men benefiting from Father’s Day:
140 men• Average number of participants enjoying Family Day each year:More than 800 peopleWe also organize sporting events internally, to reinforce the spirit of belonging, bringing together and co-hesion of teams:• Soccer Tournament: This is an an-nual sporting event organized for our employees from all regions, in the form of team competition.• The Casablanca International Mar-athon: Under the colors of the La-bel’Vie Group, our sports associates participate in all events of the event (the Marathon, Half-Marathon, the relay race and the 10km).
Eliminating all forms of prohibited workOur Group is committed to fight-ing against all forms of prohibited work. From work code irregularities to fighting against forced labor for minors, the rules of procedure and code of ethics developed by our Group involve many clauses.
A certificate attached to the con-tracts with our suppliers and ser-vice providers has been put in place, with the aim of respecting the labor code. We also fight against the re-cruitment of minors, night work for women as well as forced labor against any collaborator.
3rd commitment: Societal develop-mentThe CSR approach of our Group is also embodied in social action. On a small scale, it starts with:
Helping the youthThis initiative is concretized through schools partnerships allowing the implementation of programs profes-sionalizing in alternating mode:• Partnership with the University of Legal, Economic and Social Scienc-es of Settat to obtain a License in Commerce and Distribution (2017-2018 promotion: 30 winners, 2019-2020 promotion: 37 laureates);• Partnership with the Royal Insti-tute of Specialized Technicians in Kenitra breeding to obtain the meat operators certificate (promotion 2016-2018: 11 winners, 7 of whom joined our group, promotion 2018-2020: 18 student apprentices);• Partnership with the University of Science and Technology of Settat to obtain a Master in Commerce & Dis-tribution in Agribusiness (promotion 2018-2020: 18 student apprentices);• Partnership with the University of Science and Technology of Al Hocei-ma to obtain a degree in agri-food sciences and technical techniques - (promotion 2018-2019: 15 student apprentices).• Partnership with IUR Rabat for the training (assistant store managers a dozen graduates per year)
Promote local purchasesTo ensure farmers the opportuni-ty to grow their local business, we commit to our local purchases of 26% for fruits and vegetables, and 4% for the fish market.
Promote local employmentTo ensure that young people can
ANNUAL REPORT 201844

integrate socially rewarding work into their living area, the various ac-tivities of our Group generate direct and indirect employment opportuni-ties through outsourcing.Local employment rate: 75%
Respect the neighborhoodA CSR approach requires a pleasant environment for all, with respect for the environment and basic aspects of citizenship.
In this context, our group has set up many development projects such as the installation of plant walls in some stores, the existence of play-grounds, as well as a better imple-mentation of technical equipment
for the comfort of users.Conduct citizen actionsOur Group is part of a social vision of what a responsible company should be, preserving existing economic players and encouraging the vitality of local commerce while benefiting from efficient and modern service.Several initiatives have been un-dertaken to date in the agricultural sector, the environment, music and sport.
• Moulat Lkheir (the one who does good deeds)Among the flagship projects of our CSR policy, which have a direct im-pact on the environment, we have set up a Social Business system
with the help of our partnerships. Its goal is to help farmers become part of a social climb through an in-tegrated process of potato produc-tion and sales. From seed to sale, Moulat Lkheir aims at the active and transversal participation of all professional actors for a synergistic Social Business.
Moulat Lkheir is the expression of our vision to participate in the im-provement of the social conditions of certain rural families, thanks to a mastery of agricultural upstream and a unique solidarity positioning on the Moroccan market.
Five partnerships with a capital of
ANNUAL REPORT 2018 45

MAD 250,000 were thus created to coordinate the creation and man-agement of the social enterprise, in-cluding a partnership with the well-known brand Mc Cain, expert in the creation of Social Business, agrono-my and potato processing.
The ambitions of this social enter-prise are manifold: to reduce pov-erty in rural areas, to promote girls’ education, to guarantee a stable job for mothers and an attractive and progressive salary.
In the regions of Berrchid and Sa-hel, Moulat Lkheir progresses on an organizational model divided into 4 parts:- coordination of agricultural up-stream;
- the marketing of production;- processing into raw fries for the shelves of our stores;- the social aspects of the mission re-lated to schooling and material help in the fight against precariousness.
With this Social Business project, our Group is part of a social vision of what a responsible company should be, preserving existing economic players and encouraging the vitality of local commerce while enjoying an efficient and modern service.
As a result, in 2018, Moulat Lkheir hired 5 full-time employees, obtained health insurance for employees and their families, and increased their in-come by at least 50%. The Group has also deployed 90 hours of training on
good agricultural practices.• In 2015, the Label’Vie Group also took part in the Sahraouiya Raid un-der the sign of solidarity, an event pro-moting women’s sport and the south-ern regions.• Also in 2018, the group was at the rendez-vous of World Clean Up Day to help clean up Sid el Abed beach, in collaboration with the association Tous pour Harhoura.• The Label’Vie Group also sponsors the Moroccan Philharmonic Orchestra annually to encourage and promote culture and music in the Kingdom and its influence abroad.
4th commitment: Protecting the envi-ronmentIn its practical and ethical dimension, our CSR action is a pathway for envi-
ANNUAL REPORT 201846

ronmental transition, at the heart of a globalized economic context. Our approach is part of an economic alter-native that respects the environment, mobilizing each employee and stake-holder to an awareness of the power and impact of individual actions.The call to the volunteering of every-one, as well as the ability to convert constraints into economic opportuni-ties, establishes an effective and sus-tainable win-win balance.We are committed to:
Developing an environmental mana-gement system (EMS)A firm was mandated for the applica-tion of the Hygiene Health & Environ-ment principles at the construction site level, and a designated SME man-ager.A program started in 2016 allows the implementation of energy saving best practices, the construction of ther-mal insulators and the purchase of non-energy-efficient equipment.
Reducing our energy consumptionThe reduction of energy consumption is an essential element of the environ-mental concerns of any CSR policy. As such, the preference of our Label’Vie Group depends on the choice of nat-ural lighting, through a new economy lever integrated into the design of logistics sites. It consists of glazed facades for natural lighting.In addition, since 2017, the Group has launched an experiment to cover the structures of these stores for a pho-tovoltaic roof that provides energy self-sufficiency. The Atacadao store in Meknes has been the first surface to benefit from it and other facilities
will be expected in stores in the cities of Taza and Marrakech.
In order to avoid leaks in refrigeration systems and to reduce the impacts on global warming, our Group plans several installations of DNI system (intelligent refrigerant level detector), which allows the analysis of the in-stallation from measurements and realize leak tests.
Reducing and recycling wasteThe Group plans to gradually install several waste management systems for all its activities, including the re-covery of cardboard and plastic and the installation of grease traps.
Combating food wasteOur Group is implementing an an-ti-waste food policy through the com-mitment of a specialist supplier in the recovery of bakery products, as well as the recycling of flour for animal feed.The transit flows of the products are optimized, the automation of the orders is installed to avoid the over-stocks and the control of the quanti-ties. At the heart of the stores, prod-uct rotations are monitored.
Protecting biodiversityBiodiversity is today seriously threat-ened by human activities and our Group adopts a strong and proactive policy in terms of sustainable devel-opment:• Promoting sustainable transport by optimizing routes, massifying flows, setting up short circuits, etc. .;• By reducing noise pollution by cover-ing our generators or compressors, by
noise-canceling equipment or by con-cealing them behind insulating walls.
5th Commitment: Business EthicsFrom our Group’s point of view, busi-ness ethics is based on a set of fun-damental values or principles that go beyond the legal requirements of so-ciety and apply to all of our activities.Our partner contracts govern our responsible purchasing with all our suppliers and our Group ensures their daily application.Thanks to our CSR policy, we have in-cluded new criteria in contracts that have an interesting awareness value: buyers act as prescribers of good practices that they then spread along the supply chain.A diligence plan (audits) has already been in operation since 2018, with the establishment of over 3 years of business partnerships with more than 85% of our suppliers.
PREVENTING CORRUPTIONCorruption impacts all countries at different levels. This phenomenon is harmful, not only at the financial level, but also at the social level since cor-ruption often hides other violations of the law. In addition, corruption re-duces citizens’ trust in businesses and causes multiple damages in the absence of intervention. Our Group has thus adopted a Code of Ethics and professional conduct to anchor the value of respect for human values and legal and regulatory provisions. It prescribes respect for professional ethics, integrity and the management of conflicts of interest.
ANNUAL REPORT 2018 47

ANNUAL REPORT 201848

FINANCIAL ANALYSIS
ANNUAL REPORT 2018 49

The group Label’Vie continues to deliver a great performance thanks to a multi-format development plan, as well as a sound Marketing strat-
egy. This strong growth is mainly driven by both the contribution of mature stores (constant scope) and the new contributions from stores
opened between 2017 and 2018.
Below, a detailed financial analysis of the group:
On a non-consolidated basis, La-bel’Vie S.A delivered revenue up 13% YoY from MMAD 3,771 in 2017 to MMAD 4,269 in 2018.
Operating profit increased by MMAD 59 (52%) as operating mar-gin jumped by 1 point (9% vs. 8% in 2017).
Net Income soared by 24% (+MMAD 42). Net margin stood at 6% in 2018 vs. 5% in 2017.
A. ANALYSIS OF THE INCOME STATEMENT Below is the non-consolidated income statement of Label’Vie S.A for the financial years 2017 and 2018. Numbers are shown in thousands of MAD:
Below is the consolidate income statement of Label’Vie S.A for the financial years 2017 and 2018. Numbers are shown in thousands of MAD:
* Mutandis is excluded from the scope of consolidation (less than 5% owned by Label’Vie)
All numbers in kMAD2017 2018 CHANGE
VAL % sales VAL % sales VAL %
Sales of goods (Exc. VAT) 3 326 979 3 755 438 428 458 13%
Sales for the provision of services 443 565 13% 513 910 14% 70 345 16%
Revenue (Exc. VAT) 3 770 545 113% 4 269 348 114% 498 803 13%
Cost of Goods Sold (exc. VAT) 2 854 141 86% 3 213 559 86% 359 418 13%
Gross Margin 916 403 28% 1 055 789 28% 139 386 15%
Reversal of operating provisions 76 940 2% 87 539 2% 10 599 14%
Operating expense 725 282 22% 815 881 22% 90 599 12%
Operating income 268 062 8% 327 447 9% 59 385 22%
Financial income (expense) -40 235 -1% -48 856 -1% -8 621 21%
Non-operating income 240 0% 15 007 0% 14 767 6154%
Corporate Tax -51 477 -2% -74 718 -2% -23 240 45%
Net Income 176 589 5% 218 880 6% 42 291 24%
All numbers in kMAD2017 2018 CHANGE VS 2017
VAL % sales VAL % sales VAL %
Sales of goods (Exc. VAT) 7 531 109 8 217 333 686 224 9,1%
Sales for the provision of services 743 469 9,9% 815 623 9,9% 72 154 9,7%
Revenue (Exc. VAT) 8 274 578 9 032 957 758 378 9,2%
Cost of Goods Sold (exc. VAT) 6 676 079 88,6% 7 246 697 88,2% 570 617 8,5%
Direct margin 855 030 11,4% 970 637 11,8% 115 607 13,5%
Gross margin 1 598 499 21,2% 1 786 260 21,7% 187 761 11,7%
Running costs 995 338 13,2% 1 081 418 13,2% 86 080 8,6%
EBITDA 603 161 8,0% 704 842 8,6% 101 681 16,9%
Operating provisions 248 779 3,3% 278 154 3,4% 29 375 11,8%
Running costs 1 244 117 16,5% 1 359 571 16,5% 115 454 9,3%
Operating income 354 382 4,7% 426 689 5,2% 72 307 20,4%
Financial income (expense) -30 973 -0,4% -24 627 -0,3% 6 346 -20,5%
Current income 323 409 4,3% 402 062 4,9% 78 653 24,3%
Non-operating income -1 222 0,0% -4 151 -0,1% -2 929 >100%
Corporate Tax 81 292 1,1% 109 511 1,3% 28 219 34,7%
Net Income 240 896 3,2% 288 401 3,5% 47 505 19,7%
NIGS 237 862 3,2% 285 236 3,5% 47 374 19,9%
ANNUAL REPORT 201850
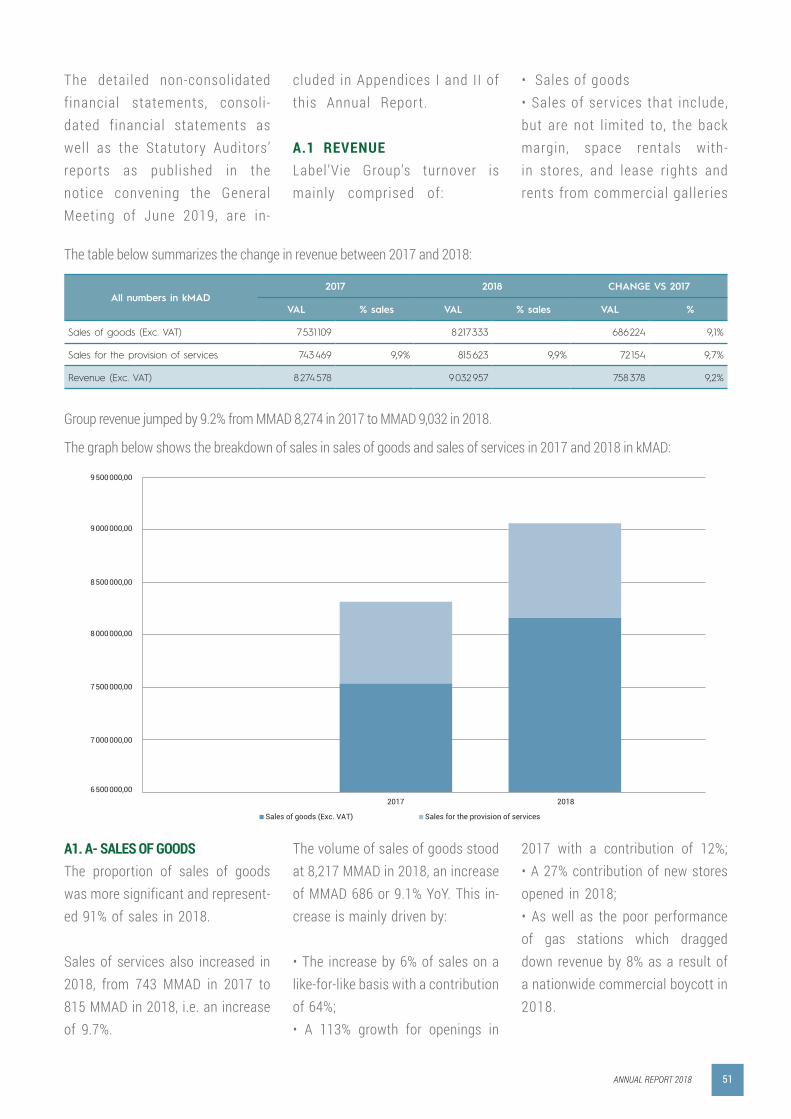
The detailed non-consolidated financial statements, consoli-dated financial statements as well as the Statutory Auditors’ reports as published in the notice convening the General Meeting of June 2019, are in-
cluded in Appendices I and II of this Annual Report.
A.1 REVENUELabel’Vie Group’s turnover is mainly comprised of:
• Sales of goods • Sales of services that include, but are not l imited to, the back margin, space rentals with-in stores, and lease rights and rents from commercial galleries
A1. A- SALES OF GOODSThe proportion of sales of goods was more significant and represent-ed 91% of sales in 2018.
Sales of services also increased in 2018, from 743 MMAD in 2017 to 815 MMAD in 2018, i.e. an increase of 9.7%.
The volume of sales of goods stood at 8,217 MMAD in 2018, an increase of MMAD 686 or 9.1% YoY. This in-crease is mainly driven by:
• The increase by 6% of sales on a like-for-like basis with a contribution of 64%;• A 113% growth for openings in
2017 with a contribution of 12%;• A 27% contribution of new stores opened in 2018;• As well as the poor performance of gas stations which dragged down revenue by 8% as a result of a nationwide commercial boycott in 2018.
Group revenue jumped by 9.2% from MMAD 8,274 in 2017 to MMAD 9,032 in 2018.
The table below summarizes the change in revenue between 2017 and 2018:
The graph below shows the breakdown of sales in sales of goods and sales of services in 2017 and 2018 in kMAD:
All numbers in kMAD2017 2018 CHANGE VS 2017
VAL % sales VAL % sales VAL %
Sales of goods (Exc. VAT) 7 531 109 8 217 333 686 224 9,1%
Sales for the provision of services 743 469 9,9% 815 623 9,9% 72 154 9,7%
Revenue (Exc. VAT) 8 274 578 9 032 957 758 378 9,2%
Sales of goods (Exc. VAT) Sales for the provision of services
6 500 000,00
7 000 000,00
7 500 000,00
8 000 000,00
8 500 000,00
9 000 000,00
9 500 000,00
2017 2018
ANNUAL REPORT 2018 51

The table below illustrates the evolution of sales for different scopes:
Below is the breakdown of sales of goods by segment:
Evolution of sales of goods for different scopes:
Below is highlighted the YoY change in supermarkets revenue per scope:
EVOLUTION OF SALES 2017Pro Format 2018
Growth Contribution
Value % Volume Evolution
Constant Scope 7 166 974 7 608 430 441 456 6,2% 93% 64%
Openings 2017 43 376 128 010 84 634 >100% 2% 12%
Openings 2018 185 130 185 130 NA 2% 27%
Gas Station 320 759 295 763 -24 996 -8 % 4% -4%
GROUP TOTAL 7 531 109 8 217 333 686 224 9,1% 100% 100%
0%
20%
40%
60%
80%
100%
37% 3
2016 2017
8%
24% 25%
35% 34%
4% 4%
SERVICE LV
ATACADÂO
HYPERMARKETS
SUPERMARKETS2017 2018
THE « SUPERMARKETS » SEG-MENT:The Label’Vie Group’s histori-cal segment, created in 1985, is comprised of 73 points of sale as of December 31 2018 and a total sales surface of 83,034 m² sqm. In 2018, 16 new stores were opened: Tangier Volubilis, Tangier Iberia, Rabat Madagascar, Aga-dir Hassan, Mohammedia Sebta, Casablanca Bellerive, Casablan-
ca Bethune, Casablanca Bir An-zarane, Casablanca Black Rock, Casablanca Oulfa, Casablanca Sidi Othmane, Casablanca Ain Sebaa, Tetouan Wilaya, Nador, Majorelle Marrakech, and Kenitra Mimosa.
The “Supermarkets” segment is still maintaining a strong perfor-mance in terms of sales volume growth, up + 11.2%, from MAD 2,795 million in 2017 to MAD 3,096
million in 2018. Sales by the seg-ment “Supermarkets” accounted for 38% of the group’s sales vol-umes in 2018.
This growth was mainly driven by:• Constant scope increased by 6% or MMAD 165 in value;• The contribution of sales from new stores opened in 2017 and 2018 by MMAD 145.
EVOLUTION OF SALES 2017Pro Format 2018
Growth
Value %
Supermarkets 2 785 273 3 096 106 310 833 11,2%
Constant Scope 2 741 897 2 906 919 165 022 6,0%
Openings 2017 43 376 128 010 84 634 195,1%
Openings 2018 - 61 177 61 177 NA
ANNUAL REPORT 201852

Below is highlighted the YoY change in hypermarkets revenue per scope:
THE « HYPERMARKETS » SEG-M E NT :The « Hypermarkets » segment ac-counted for 25% of Label’Vie revenue at the end of 2018, with a total of 8 stores and a total surface of 44,800
sqm as of December 31st 2018.The strong performance achieved by almost all stores as well as the contribution of the new “Tetouan” hypermarket opened in May 2018, yielded an increase in sales of the
“Hypermarket” segment by 13.4% in 2018, i.e. +MMAD 239 in value. Sales on a like-for-like basis also increased by 6.4%, representing an increase in value of MAD 114 million.
THE « HYPERCASH » SEGMENT:The “Hypercash” segment under the brand name “Atacadão” was comprised of 11 stores at the end of 2018 with a
total sales area of 59,564 sqm. This segment accounted for 34% of the La-bel’Vie Group’s total sales in 2018.Sales in the “Hypercash” segment grew
by 6.1% in 2018, from MAD 2,643 million to MAD 2,805 million, and by over 22% over the last two years on a like-for-like basis.
« SERVICE LV » SEGMENT:Label’Vie gas stations accounted for 4%
of total revenue in 2018. Gas stations revenue declined by 8%, as a result of a
nationwide commercial boycott.
The ratio of sales of services to the total revenue of the group re-mained stable compared to the year 2017 and stood at 9.9% in 2018. Sales of services increased by MMAD 72 compared to 2017, from MMAD 743 to MMAD 815 in 2018, an increase of 9.7%. This improvement was mainly
driven by:• The increase in business vol-umes for the total scope;• The improvement of the contrac-tual terms of commercial coopera-tion thanks to a strong bargaining power;• Additional fees charged for the renovation of old sites and the
opening of new stores.Indeed, 16 new «Carrefour Market» were opened in 2018, as well as a Hypermarket in Tetouan, along with the renovation of 10 stored. This is part of the Label’Vie group’s strategy to offer its customers the opportunity to shop in a pleasant and optimal environment.
A1. B- SALES OF SERVICESBelow the evolution of sales of services in 2018 compared to 2017:
EVOLUTION OF SALES 2017Pro Format 2018
Growth
Value %
Hypermarkets 1 781 203 2 019 965 238 762 13,4%
Constant Scope 1 781 203 1 896 012 114 809 6,4%
Openings 2017 - - -
Openings 2018 - 123 954 123 954 NA
EVOLUTION OF SALES 2017Pro Format 2018
Growth
Value %
Hypercash 2 643 874 2 805 498 161 624 6,1%
Constant Scope 2 643 874 2 805 498 161 624 6,1%
Openings 2017 - - -
Openings 2018 - - -
All numbers in kMAD2017 2018 CHANGE VS 2017
VAL % sales VAL % sales VAL %
Sales for the provision of services 743 469 9,9% 815 623 9,9% 72 154 9,71%
Below is highlighted the YoY change in hypercash revenue per scope:
ANNUAL REPORT 2018 53

The gross margin is comprised of:• Direct Margin (difference be-
tween sales and resold purchas-es of goods) ;
• Provision of services sales.
Below is the evolution of the Group’s gross margin in 2018 compared to 2017:
The graph below highlights the evolution of the direct margin and the sales of services between 2017 and 2018:
All numbers in kMAD2017 2018 CHANGE VS 2017
VAL % sales VAL % sales VAL %
Sales of goods (Exc. VAT) 7 531 109 100,0% 8 217 333 100,0% 686 224 9,1%
Sales for the provision of services 743 469 9,9% 815 623 9,9% 72 154 9,7%
Revenue (Exc. VAT) 8 274 578 9 032 957 758 378 9,2%
Cost of Goods Sold (exc. VAT) 6 676 079 88,6% 7 246 697 88,2% 570 617 8,5%
Direct margin 855 030 11,4% 970 637 11,8% 115 607 13,5%
Gross margin 1 598 499 21,2% 1 786 260 21,7% 187 761 11,7%
Gross margin jumped by 11.7% from MMAD 1,598 in 2017 to MMAD 1,786 in 2018. Gross margin as a percent-age of revenue stood at 21.7% in
2018 up by 0.51 points YoY.The change in Gross margin was pri-marily driven by:• A higher revenue as the back
margin and other products yielded +0.05 points; • An improvement in the direct mar-gin by (+0.46 points).
Direct margin was higher thanks to the continuous improvement of pur-chase conditions, the revamp of the pricing strategy, the reduction of man-
agement loss rates and the contribu-tion of the projects initiated in recent years, particularly the market project.The increase of services sales by
MMAD 72 and of the direct margin by MMAD 115 contributed to the im-provement of the gross margin by MMAD 187.
Sales for the provision of services Direct margin
400 000,00
200 000,00
-
600 000,00
800 000,00
1 000 000,00
1 200 000,00
1 400 000,00
1 600 000,00
1 800 000,00
2 000 000,00
2018 2017
815 623
855 029
970 637
743 469
A.2 GROSS MARGIN
ANNUAL REPORT 201854

A.3 OPERATING EXPENSES Consolidated operating expenses in 2018 compared to 2017 are outlined below:
The graph below highlights operating expenses as well as their evolution: Operating expenses in kMAD:
Compared with 2017, consolidat-ed operating expenses increased by 9.3% from MAD 1,244 million in 2017 to MAD 1,359 million in 2018.Operating expenses to sales im-
proved by 0.06 points thanks to the economies of scales achieved.
• By the power station by -0.04 points from 1.83% of sales in 2017 to 1.79% in 2018;
• By the stores on a-like-for-like basis, -0.02. Stores opened be-tween 2017 and 2018 delivered a slight increase due to late sales.
All numbers in kMAD2017 2018 CHANGE VS 2017
VAL % sales VAL % sales VAL %
Cost of goods sold 168 902 2,2% 178 680 2,2% 9 778 5,8%
Other external expenses 469 146 6,2% 519 872 6,3% 50 726 10,8%
Taxes 52 350 0,7% 52 807 0,6% 456 0,9%
Staffing costs 304 939 4,0% 330 059 4,0% 25 120 8,2%
Total running costs 995 338 13,2% 1 081 418 13,2% 86 080 8,6%
Operating allowances 248 805 3,3% 278 154 3,4% 29 349 11,8%
Total operating expenses 1 244 143 16,5% 1 359 571 16,5% 115 428 9,3%
-
400 000
200 000
600 000
800 000
1 000 000
1 200 000
1 400 000
1 600 000
2017 2018
Cost of goods sold Other external expenses Taxes Staffing costs Operating allowanes
168 902
469 146
52 350
304 939
248 805
178 680
278 154
330 059
519 872
52 807
0,0%
4,0%
2,0%
6,0%
8,0%
10,0%
12,0%
14,0%
16,0%
18,0%
2017 2018
Cost of goods sold Other external expenses Taxes Staffing costs Operating allowances
2,2%
6,2%
0,7%
4,0%
3,3%
2,2%
3,4%
4,0%
6,3%
0,6%
ANNUAL REPORT 2018 55

-
400 000
200 000
600 000
800 000
1 000 000
1 200 000
1 400 000
1 600 000
2017 2018
Cost of goods sold Other external expenses Taxes Staffing costs Operating allowanes
168 902
469 146
52 350
304 939
248 805
178 680
278 154
330 059
519 872
52 807
0,0%
4,0%
2,0%
6,0%
8,0%
10,0%
12,0%
14,0%
16,0%
18,0%
2017 2018
Cost of goods sold Other external expenses Taxes Staffing costs Operating allowances
2,2%
6,2%
0,7%
4,0%
3,3%
2,2%
3,4%
4,0%
6,3%
0,6%
COSTS OF GOODS SOLDThe costs of goods sold catego-ry mainly includes:• Purchases of materials, con-sumables, essentially the pack-aging offered in the stores;• Purchases of materials and supplies not held in invento-ry, mainly water and electricity c h a r g e s ;• Purchases of works, studies and services including archiv-
ing, cash transportation, sur-veil lance and security services.In terms of ratio, the expenses related to the item “Costs of goods sold” remained stable be-tween 2017 and 2018 and stood a rate of 2.2%. This stability can be explained by the sound con-trol of expenses thanks to the energy saving plan initiated by the Label’Vie Group in recent years .
In terms of value, the item in-creased by MMAD 9 from MMAD 168 in 2017 to MMAD 178 in 2018. This increase is explained by :• The opening of new stores;• The increase in business vol-umes ;• And the use of biodegradable paper packaging is more expen-sive than plastic bags.
All numbers in kMAD2017 2018 CHANGE VS 2017
VAL % sales VAL % sales VAL %
Rent and leasing 201 183 2,7% 215 472 2,6% 14 289 7,1%
Maintenance, repair and transportation 93 103 1,2% 105 420 1,3% 12 317 13,2%
Marketing and travels 82 200 1,1% 87 950 1,1% 5 750 7,0%
Others 92 660 1,2% 111 030 1,4% 18 371 19,8%
Total other external expenses 469 146 6,2% 519 872 6,3% 50 726 10,8%
• OTHER EXTERNAL CHARGESThe consolidated “Other external charges” break down as follows:
Below, is the explanation of the evolution of the main items of expenses?
Operating expenses as a percentage of revenue:
ANNUAL REPORT 201856

Other external expenses in-creased by 10.8% in 2018, from MMD 469 to MMAD 519 (i.e. MMAD +50 in value). This in-crease is due to higher business volumes and additional charges related to the 2017 and 2018 o p e n i n g s .
The main changes in “other ex-ternal charges” relate to the fol-lowing items:
• Renting and LeasingThis item increased from MMAD 201 in 2017 to MMAD 215 in 2018, an increase of 7.1%, due in part to the new leasing and leas-ing contracts for stores opened in 2017 and 2018. On the other hand, by the triennial revisions of the old lease agreements.
• Maintenance, repair and trans-portation:The item “maintenance, repair and transportation” increased by MMAD 12 in value. This evo-lution is explained by:• Maintenance and service costs
related to the stores open at the end of 2016 and 2017 with a one-year guarantee period ex-p i r ing;• The renovation of 10 stores;• Transportation costs that have increased as a result of changes in the volume of activity.
In terms of ratio, this item went from 1.2% to 1.3% between 2017 and 2018.
• Travels and marketingThis item increased in value by MMAD 5 rising from MMAD 82 to MMAD 87 and stabil ized as a ratio to 1.1% of sales compared to its level in 2017. “Marketing” was positively impacted by the openings of the new stores, which enabled it to benefit from the economies of scale achieved in the design and distribution of leaflets and advertising posters.
• Others“Other” includes mainly tele-phone, insurance and franchise expenses. In terms of ratio, this
item had a slight increase of 0.2 points compared to last year, going from MMAD 92 in 2017 to MMAD 111 in 2018. This in-crease results from the increase in the level of activity.
In general, the ratio of other external expenses increased slightly by 0.1 percentage point compared to its level in 2017. With the expected increase in the sales volume of the stores opened in 2018, the ration to sales should return to its level 2017 level. • TAXESBetween 2017 and 2018, taxes and duties ratio, taxes as a per-centage of sales increased (+0.1 points).
The increase in value is ex-plained in particular by the “Housing Tax and Municipal Ser-vices” l inked to the contractual increase in rents and the new lease agreements for stores opened in 2018.
• STAFFING COSTSFollowing, the evolution of the consolidated staffing costs for the year 2018 vs. 2017:
All numbers in kMAD2017 2018 CHANGE VS 2017
VAL Weight % sales VAL Weight % sales VAL %
Gross wages 257 398 84% 3,4% 279 155 85% 3,4% 21 757 8,5%
Social expenses 46 052 15% 0,6% 48 168 15% 0,6% 2 116 4,6%
Other staffing costs 1 489 0% 0,0% 2 736 1% 0,0% 1 247 83,8%
Total staffing costs 304 939 100% 4,0% 330 059 100% 4,0% 25 120 8%
ANNUAL REPORT 2018 57

Staffing costs increased by 8%, an increase of MAD 25 mill ion compared to the previous year, following the opening of new stores in 2018.
In terms of ratio, staffing costs to sales remained stable be-tween 2017 and 2018 and stood at 4%. The control of load ratios indicates the maturity of all La-bel’Vie Group store formats.
OPERATING ALLOWANCESThis increase is mainly due to the additional endowments in-duced by:
• New investments: buildings, facil it ies and equipment;
• Registration fees for the ac-quisition of land and premises as part of securing future open-ings ;
• Start-up costs generated by the opening of new sites and renovations to old stores.
Operating allowances increased by 11.8% in 2018 compared to the previous year, an increase in value of 29 bil l ion MAD. In terms of ratio, operating allowances to sales rose from 3.3% in 2017 to 3.4% in 2018.
EBITDA increased by 16.9% compared to 2017, r ising from MMAD 603 to MMAD 704 in 2 0 1 8 .
EBITDA margin improved (+0.6 points) compared to 2017 and stood at 8.6% of sales. This in-crease is mainly driven by:• The ramp-up of the Hypercash segment;• The improvement in gross margin (+0.51 points) from
21.2% in 2017 to 21.7% in 2018, this improvement is mainly re-lated to:
• The increase in the services sales ratio of (+0.05 points) ;• And the improvement of the direct margin rate of (+0.46 points) thanks in part icular to:• Improving the avai labi l i ty of products at the point of sale;• Improving the condit ions of p u r c h a s e ;
• Control of stocks and manage-ment losses;
• The economies of scale achieved mainly for the expens-es of the power station and the logist ics which made it possi-ble to stabi l ize the ratio of the operating expenses as a per-centage of sales of the Group to 13.2%.
All numbers in kMAD
2017 2018 CHANGE VS 2017
VAL % sales VAL % sales VAL %
Sales of goods (Exc. VAT) 7 531 109 8 217 333 686 224 9,1%
Sales for the provision of services 743 469 9,9% 815 623 9,9% 72 154 9,7%
Revenue (Exc. VAT) 8 274 578 9 032 957 758 378 9,2%
Direct Margin 855 030 11,4% 970 637 11,8% 115 607 13,5%
Gross Margin 1 598 499 21,2% 1 786 260 21,7% 187 761 11,7%
Running expenses 995 338 13,2% 1 081 418 13,2% 86 080 8,6%
EBITDA 603 161 8,0% 704 842 8,6% 101 681 16,9%
A.4 GROSS OPERATING PROFIT
ANNUAL REPORT 201858

T h e o p e r a t i n g re s u l t i n -c re a s e d by 2 0 . 4 % f ro m M M A D 3 5 4 to M M A D 4 2 6 i n 2 0 1 8 . T h e o p e r a t i n g m a rg i n j u m p e d by ( + 0 . 5 p o i n t s ) to 5 . 2 % v s .
4 . 7 % i n 2 0 1 7 , d r i ve n by :• T h e i m p rove m e n t i n g ro s s m a rg i n r a t e s o f ( + 0 . 5 1 p o i n t s ) ;• T h e e c o n o m i e s o f s c a l e re -
a l i ze d m a i n l y f o r t h e e x p e n s -e s o f t h e p o w e r s t a t i o n a n d t h e c o n t ro l o f t h e c o s t s w h i c h m a d e i t p o s s i b l e to i m p rove t h i s m a rg i n .
Evolution of EBITDA and EBIT (MMAD) Margin evolution (% of sales)
6 0 3
3 5 4
7 0 5
4 2 7
EBITDA EBIT
2 0 1 7
2 0 1 8 8 , 0 %
4 , 7 %
8 , 6 %
5 , 2 %
EBITDA EBIT
2 0 1 7
2 0 1 8
A.5 OPERATING INCOMEThe operating profit of the Label’Vie S.A Group was as follows:
All numbers in kMAD2017 2018 CHANGE VS 2017
VAL % sales VAL % sales VAL %
Operating income 354 356 4,7% 426 689 5,2% 72 333 20,4%
Evolution of consolidated operating income between 2017 and 2018
0
1 0 0 0 0 0
5 0 0 0 0
1 5 0 0 0 0
2 0 0 0 0 0
2 5 0 0 0 0
3 0 0 0 0 0
3 5 0 0 0 0
4 0 0 0 0 0
4 5 0 0 0 0
2 0 1 7 2 0 1 8
426 689
354 356
ANNUAL REPORT 2018 59

A.6 FINANCIAL INCOMEConsolidated financial income was as follows:
A.7 NON-CURRENT INCOME The consolidated non-current income of the group Label’Vie was as follows:
All numbers in kMAD2017 2018 CHANGE VS 2017
VAL % sales VAL % sales VAL %
Financial income 116 143 1,5% 119 051 1,4% 2 908 2,5%
Financial expenses -144 248 -1,9% -142 933 -1,7% 1 315 -0,9%
Gains/losses FX -2 867 0,0% -744 0,0% 2 123 Inf à 0%
Financial income -30 973 -0,4% -24 627 -0,3% 6 346 -20,5%
Financ ia l Income stood at -MM AD 24 .6 in 2018 ( i .e . -0 .3% of revenue) vs . –MM AD 30.9 in 2017 ( i .e . -0 .4% of revenue) . Hencefor th , f inanc ia l income
as a percentage of revenue improved by 0 .1 po int .Th is improvement in f inanc ia l income is dr iven by :• The reduct ion of f inanc ia l
expenses by MM AD 3 ;• The increase in f inanc ia l p roduct by MM AD 3 .F inanc ia l Income should s tand at 0 .3% of revenue by 2019.
-30 000
-35 000
-25 000
-20 000
-15 000
-10 000
-5 000
02 0 1 7 2 0 1 8
-30 973
-24 627
All numbers in kMAD2017 2018 CHANGE VS 2017
VAL % sales VAL % sales VAL %
Non-current income 9 850 0,1% 94 515 1,2% 84 665 >100%
Non-current expenses 11 071 0,1% 98 665 1,2% 87 594 >100%
Non-current result -1 222 0,0% -4 151 -0,1% -2 929 >100%
Evolution of consolidated financial income between 2017 and 2018
ANNUAL REPORT 201860

A.8 CURRENT INCOME AND NET INCOME The following table highlights the evolution of the consolidated Net Income between 2017 and 2018:
EVOLUTION OF THE MAIN INDICATORS OF THE GROUP LABEL’VIE:Below, is highlighted the consolidated evolution of the main indicators between 2017 and 2018:
Consolidated non-current income decreased by kMAD 2.9 from –kMAD 1,222 in 2017 to -kMAD 4,151 in 2018.
It is worth noting that this non-current income takes into ac-c o u n t :- The gain on the divestment of
the Zaërs property (MMAD 35);- Non-current expenses as a result of the fiscal audit (MMAD 32).
Current income jumped by 23% YoY from MMAD 323 in 2017 to MMAD 402 in 2018. Also, cur-rent income increased by 0.6 points to stand at 4.9% of rev-
enue. This improvement was driven by a better performance at the operational level (EBITDA jumped by +0.49 points) and by lower f inancing costs (f inancial
income yielded a +0.11 points increase) .Net Income stood at MMAD 288.4, yielding a 19.7% increase YoY and a Net Margin of 3.5%.
AMOUNTS IN KMAD2017 2018 Growth vs. 2017
VAL % Sales VAL % Sales VAL %
Operating Income 354 382 4,7% 426 689 5,2% 72 307 20,4%
Financial Income -30 973 -0,4% -24 627 -0,3% 6 346 -20,5%
Current Income 323 409 4,3% 402 062 4,9% 78 653 24,3%
Non-Current Income -1 222 0,0% -4 151 0% -2 929 239,7%
Corporate Taxes -81 292 -1,1% -109 511 -1,3% -28 219 34,7%
Net Income 240 896 3,2% 288 401 3,5% 47 505 19,7%
Evolution of current income and net income (MMAD) Margin evolution (% of sales)
3 2 3
2 4 1
4 0 2
+ 2 4 %
2 8 8
Current Income Net Income
2 0 1 7
2 0 1 84 , 3 %
3 , 2 %
4 , 9 %
3 , 5 %
Current Income Net Income
2 0 1 7
2 0 1 8+ 2 0 %
+ 0 , 6 p o i n t
+ 0 , 3 p o i n t
Sales Operating Profit and Operating Margin
7 531,0
8 217,0
2017 2018
in MMAD
+9%
354,4
426,7
2017 2018
in MMAD
+20%
5,2%
4,7%
Current Result and the Rate of the Current Result Net Profit and Net Margin
323,4
402,1
2017 2018
in MMAD
+24%
240,9
288,4
2017 2018
in MMAD
+20%
3,5%
3,2%
4,9%
4,3%
ANNUAL REPORT 2018 61

B. ANALYSIS OF THE BALANCE SHEET The table below presents the balance sheet of the company Label’Vie for the period 2017-2018:ASSETS:
LIABILITIES:
All numbers in kMAD2017 2018 CHANGE
VAL % Total Assets VAL % Total Assets VAL %
Fixed Assets 3 417 412 57% 3 610 280 54% 192 868 6%
CAPEX 4 021 624 67% 4 391 666 65% 370 042 9%
Nil value 495 355 8% 646 698 10% 151 342 31%
Intangibles 194 925 3% 200 568 3% 5 643 3%
PPE 1 688 377 28% 1 899 674 28% 211 297 13%
Financial 1 642 967 27% 1 644 726 24% 1 759 0%
Depreciation -604 213 -10% -781 386 -12% -177 173 29%
Inventory 596 236 10% 691 723 10% 95 487 16%
Merchandise 586 867 10% 681 830 10% 94 963 16%
Consumables 9 370 0% 9 894 0% 524 6%
Current liabilities 1 438 698 24% 1 608 522 24% 169 824 12%
Clients back margin 851 436 14% 868 950 13% 17 514 2%
Clients receipts 252 548 4% 257 743 4% 5 195 2%
Down-payments suppliers 34 097 1% 41 625 1% 7 528 22%
Staffing 8 291 0% 12 695 0% 4 405 53%
Government 239 890 4% 269 114 4% 29 224 12%
Other assets 52 435 1% 158 394 2% 105 959 202%
Marketable securities 10 888 0% 7 048 0% -3 840 -35%
Stocks/mutual funds 10 888 0% 7 048 0% -3 840 -35%
Deposits 0 0% 0 0% 0 0%
Cash 570 905 9% 805 206 12% 234 301 41%
TOTAL ASSETS 6 034 138 100% 6 722 779 100% 688 641 11%
All numbers in kMAD2017 2018 CHANGE
VAL % Total Lia-bilities VAL % Total Liabi-
lities VAL %
Total Equity 1 664 675 28% 1 733 555 26% 68 880 4%
Share capital 283 896 5% 283 896 4% 0 0%
Reserves and Retained earnings 1 204 190 20% 1 230 779 18% 26 589 2%
Net Income 176 589 3% 218 880 3% 42 291 24%
Total Debt 1 941 120 32% 2 169 529 32% 228 409 12%
Long-term debt 3 606 795 60% 3 906 772 58% 299 976 8%
Current liabilities 2 307 343 38% 2 496 008 37% 188 665 8%
Accounts payables 1 452 232 24% 1 591 711 24% 139 478 10%
Staffing and social matters 12 030 0% 10 958 0% -1 072 -9%
Government 180 619 3% 178 177 3% -2 443 -1%
Others 662 461 11% 715 163 11% 52 701 8%
Bank overdrafts and other cash positions 0 0% 320 000 5% 320 000
TOTAL LIABILITIES 6 034 138 100% 6 722 779 100% 688 641 11%
ANNUAL REPORT 201862

The following table presents the consolidated balance sheet for 2017 and 2018:ASSETS:
All numbers in kMAD2017 2018 CHANGE VS 2017
VAL % Total Assets VAL % Total Assets VAL %
Fixed Assets 3 758 822 54% 3 947 855 53% 189 034 5%
CAPEX 4 744 698 68% 5 208 899 69% 464 200 10%
Nil value 753 670 11% 948 283 13% 194 614 26%
Intangibles 394 918 6% 400 341 5% 5 423 1%
PPE 2 211 214 32% 2 473 619 33% 262 405 12%
Financial 1 384 897 20% 1 386 656 18% 1 759 0%
Depreciation -985 877 -14% -1 261 043 -17% -275 167 28%
Inventory 1 285 379 19% 1 478 326 20% 192 947 15%
Merchandise 1 274 192 18% 1 466 528 20% 192 336 15%
Consumables 11 187 0% 11 798 0% 611 5%
Goods in process 0 ND 0 ND ND ND
Current Assets 1 410 276 20% 1 564 838 21% 154 562 11%
Accounts receivables 833 905 12% 827 986 11% -5 918 -1%
Down-payments suppliers 83 931 1% 101 678 1% 17 747 21%
Staffing 9 941 0% 15 233 0% 5 292 53%
Government 428 753 6% 465 268 6% 36 515 9%
Other assets 53 746 1% 154 674 2% 100 927 188%
Marketable securities 50 123 1% 21 278 0% -28 845 -58%
Stocks/mutual funds 50 123 1% 21 278 0% -28 845 -58%
Deposits 0 0% 0 0% 0 0%
Cash 424 648 6% 503 828 7% 79 180 19%
TOTAL ASSETS 6 929 249 100% 7 516 126 100% 586 877 8%
LIABILITIES:
All numbers in kMAD2017 2018 CHANGE VS 2017
VAL % Total Lia-bilities VAL % Total Liabi-
lities VAL %
Total Equity 1 710 979 25% 1 853 543 25% 142 563 8%
Share capital 283 896 4% 283 896 4% 0 0%
Reserves and Retained earnings 1 186 187 17% 1 281 245 17% 95 058 8%
Net Income 240 896 3% 288 401 4% 47 505 20%
Total Debt 2 103 738 30% 2 307 390 31% 203 652 10%
Long-term debt 3 814 717 55% 4 160 933 55% 346 215 9%
Current liabilities 3 114 531 45% 3 355 193 45% 240 662 8%
Accounts payables 2 837 147 41% 3 081 442 41% 244 294 9%
Staffing and social matters 24 026 0% 21 702 0% -2 324 -10%
Government 227 746 3% 225 238 3% -2 508 -1%
Others 25 612 0% 26 812 0% 1 199 5%
Bank overdrafts and other cash positions 0 0% 0 0% 0 0%
TOTAL LIABILITIES 6 929 249 100% 7 516 126 100% 586 877 8%
ANNUAL REPORT 2018 63

B.1 FIXED ASSETSBelow, is shown the YoY change in total fixed assets in 2018;
ALL NUMBERS IN KMAD2017 2018 CHANGE VS 2017
GROSS NET GROSS NET GROSS NET
TOTAL FIXED ASSETS 4 744 698 3 758 822 5 208 899 3 947 855 464 200 189 034
Fixed assets rose by MMAD 189 in 2018 on a net-basis, and by MMAD 464 on a gross-basis, as a result of:
• Acquisitions, constructions and developments related to new sites and investments renewed;
• Investments for new projects planned for 2019.
Fixed assets rose 189 mi l l ion MAD in value in 2018 com-pared to the previous year, an increase of 5%. This increase is broken down as fo l lows:
• Ni l value assetsNil value assets are pr imar i ly comprised of deferred expens-es. Deferred expenses mainly include the expenses re lated to f inancia l and real estate acqui -s i t ions , the expenses re lated to bond issues and secur i t izat ion as wel l as to the costs re lated to renovat ions and star t ing-up
new stores.The rat io of n i l va lue assets to total assets rose by 2 points corresponding to an increase of MMAD 194 in value (+26%) , f rom MMAD 753 in 2017 to MMAD 948 in 2018. This in-crease was mainly dr iven by:• Costs re lated to star t ing-up new stores opened in 2018; • Costs re lated to the renova-t ions of 10 exist ing stores;• Incidental and investment registrat ion fees incurred in 2 0 1 8 .
• Intangible assetsComprised of goodwi l l and l i -censes , intangible assets s l id by 1 point YoY in 2018, f rom MMAD 394 in 2017 to MMAD 400 in 2018.
• Proper ty, p lant and equip-m e n tProper ty, p lant and equipment includes land, bui ld ings , off ice furni ture and technical instal -lat ions and f i t t ings.
ALL NUMBERS IN KMAD2017 2018 CHANGE VS 2017
VAL % Total Assets VAL % Total Assets VAL %
CAPEX 4 744 698 68% 5 208 899 69% 464 200 10%
Nil value 753 670 11% 948 283 13% 194 614 26%
Intangibles 394 918 6% 400 341 5% 5 423 1%
Tangibles 2 211 214 32% 2 473 619 33% 262 405 12%
Financial 1 384 897 20% 1 386 656 18% 1 759 0%
Depreciation -985 877 -14% -1 261 043 -17% -275 167 28%
TOTAL FIXED ASETS 3 758 822 54% 3 947 855 53% 189 034 5%
ALL NUMBERS IN KMAD2017 2018 CHANGE VS 2017
VAL % TOTAL VAL % TOTAL VAL %
Land 178 368 8% 194 874 8% 16 506 9,3%
Construction, technical installations, fitouts 1 826 553 83% 2 186 529 88% 359 977 20%
Assets in progress 206 293 9% 92 216 4% -114 077 -55%
TOTAL PPE 2 211 214 100% 2 473 619 100% 262 405 12%
Below, is the breakdown of consol idated tangible assets compared to 2017 :
Evolution of fixed assets and depreciation in kMAD:The table below shows the breakdown of consolidated fixed assets in 2017 and 2018:
ANNUAL REPORT 201864

B.3 CURRENT ASSETSThe YoY change in current assets in the consolidated balance sheet are detailed below:
B.4 CASH AND MARKETABLE SECURITIES The table below summarizes the change in cash and marketable securities:
Property, plant and equipment increased by 12% in 2018 com-pared to the previous year, from MAD 2,211 million in 2017 to MAD 2,473 million in 2018. This varia-tion can be explained by:
• The purchase of land in Tétouan for the amount of MMAD 57 and the sale of the land of Zaërs for MMAD 40;• Construction and development of a Hypermarket in Tetouan;• 16 Carrefour Market stores
opened in 2018;• Renovation of 10 stores and 3 cellars;• Equipment related to openings and renovations in 2018.
• Financial fixed assets:Financial fixed assets jumped by MAD 1.8 million, mainly related to:• Lease rights for the 2018 open-ings amounting MMAD 0.6;• And the purchase of equity secu-rities for a total amount of MMAD
1.2 broken down as follows:• 600 shares in Moulat Lkheir ; • 300 shares in Aradei Sud ;• Et 300 shares in Laayoune LV.
B.2 INVENTORIESInventories rose by MMAD 192 to stand at MMAD 1,478 yielding an increase of 15% YoY. This in-crease was mainly driven by the additional inventories related to the new stores opened as well as to a growing business overall.
In 2018, accounts receivables increased from MMAD 1,410 to MMAD 1,564 (+MMAD 145), as a result of the overall growth of the business. The receivables to total assets ratio slid by 1 point thanks to the efforts deployed to recover receivables in 2018.The most important changes are
highlighted below:- Advanced payment to suppli-ers : Higher by more than MMAD 28 in value and 21% in terms of ratio, as a result of rising orders for the new stores opened :- By Receivables from govern-ment: These receivables also increased by MMAD 36. This is
explained by higher amounts of VAT to be received in correlation with higher purchases by the company ;- Other receivables: The increase of MMAD 101 resulted from the divestment of Zaërs (payment stil l in process at the end of 2018) .
ALL NUMBERS IN KMAD2017 2018 CHANGE VS 2017
VAL % Total Assets VAL % Total Assets VAL % Accounts receivables 833 905 12% 827 986 11% -5 918 -1%Down-payments suppliers 83 931 1% 101 678 1% 17 747 21%Staffing 9 941 0% 15 233 0% 5 292 53%Government 428 753 6% 465 268 6% 36 515 9%Other assets 53 746 1% 154 674 2% 100 927 188%Total Current Assets 1 410 276 20% 1 564 838 21% 154 562 11%
ALL NUMBERS IN KMAD
2017 2018 CHANGE VS 2017
VAL % Total Assets VAL % Total
Assets VAL %
Marketable securities 50 123 1% 21 278 0% -28 845 -58%
Stocks/mutual funds 50 123 1% 21 278 0% -28 845 -58%
Deposits 0 0% 0 0% 0 0%
Cash 424 648 6% 503 828 7% 79 180 19%
Total cash and marketable securities 474 771 7% 525 106 7% 50 335 11%
ANNUAL REPORT 2018 65

Cash and marketable securities rose by MAD 50 (+11%) to MMAD 525 in 2018 vs. MMAD 474 in 2017.
The cash pos i t ion increased by MM AD 50 YoY as a resu l t o f :• The improvement of the Work ing Cap i ta l by M AD 102 mi l l ion fo l lowing an increase
in net income as we l l as new debt issues ;• Excess work ing cap i ta l o f MM AD 733 h igher than i ts 2017 leve l o f MM AD 47 . Ex -cess work ing cap i ta l s tood at
33 days of sa les , hence s tab le Y o Y ;• The deter iorat ion of o ther cur rent e lements by MM AD 98 fo l lowing the d ivestment of the proper ty of « Zaërs » .
Below is summarized the change in cash YoY:
FINANCIAL INDICATORS2017 2018 Change
Value Days sales Value Days sales Value Days sales
WC 55 918 3 157 777 7 101 859 4
Equity 1 710 979 83 1 853 543 82 142 563 -1
Net Income 240 893 288 401
Dividens paid -80 000 -150 000
Shares issued 396 475 -
Minority Interest 4 044 4 162
Debt 2 103 738 102 2 307 390 102 203 651 1
New CMT 368 920 324 488
Bonds issued -116 600 -
Reimbursements -102 096 -120 837
Long-term debt 3 814 717 186 4 160 932 185 346 215 -1
Net Debt to Equity 42,6% 42,8%
Fixed Assets -3 758 822 -182 -4 003 155 -178 -244 333 4
CAPEX 553 776 519 418
Depreciation -239 536 -275 085
Standardized WCR 685 986 33 732 927 33 46 941 -1
Inventory -1 285 379 -62 -1 478 326 -66
Payables/liabilities 1 971 365 96 2 211 253 98
Other current items -267 133 -13 -365 598 -16 -98 466 -3
CASH AND MARKETABLE SECURITIES 474 771 23 525 106 23 50 335 0
B.5 LONG-TERM LIABILITIES In 2018, long-term liabil it ies were broken down as shown in the table below:
ALL NUMBERS IN KMAD2017 2018 CHANGE VS 2017
VAL % Total Liabilities VAL % Total Liabilities VAL %
Total Equity 1 710 979 25% 1 853 543 25% 142 563 8%
Share capital 283 896 4% 283 896 4% 0 0%
Reserves and Retained earnings 1 186 187 17% 1 281 245 17% 95 058 8%
Net Income 240 896 3% 288 401 4% 47 505 20%
Total Debt 2 103 738 30% 2 307 390 31% 203 652 10%
LONG-TERM DEBT 3 814 717 55% 4 160 933 55% 346 215 9%
ANNUAL REPORT 201866

(1) EquityEquity increased by 8% from MAD 1,710 mill ion in 2017 to MAD 1,853 mill ion in 2018. This was driven by the increase in net
income by MMAD 288 in 2018.
(2) Debt Debt, which is comprised of both bank loans and bonds,
increased by MMAD 203 YoY (issue of MMAD 324 and repay-ment of MMAD 121), from MMAD 2,103 in 2017 to MMAD 2,307 in 2 0 1 8 .
The Group’s current liabilities rose by 8% from MAD3, 114 mil-lion in 2017 to MAD3, 355 million in 2018. This increase is mainly
due to the increase in accounts payables by + MAD244 million as a result of our growing business.The following table breaks down
by maturity the outstanding ac-counts payables of Label’Vie.
B.6 CURRENT LIABILITIES In 2018, current liabilities were broken down as follows:
FINANCIAL INDICATORS2017 2018 EVOLUTION
AMOUNT DAYS’ SALES AMOUNT DAYS’ SALES AMOUNT DAYS’ SALES
Financing Debts 2 103 738 102 2 307 390 102 203 651 1
New CMT 368 920 324 488
Bond Loan -116 600 -
Repayments -102 096 -120 837
ALL NUMBERS IN KMAD2017 2018 CHANGE VS 2017
VAL % TOTAL VAL % TOTAL VAL %
Accounts payables 2 837 147 91% 3 081 442 92% 244 294 9%
Staffing and social matters 24 026 1% 21 702 1% -2 324 -10%
Government 227 746 7% 225 238 7% -2 508 -1%
Others 25 612 1% 26 812 1% 1 199 5%
Total Current Liabilities 3 114 531 100% 3 355 193 100% 240 662 8%
Accounts payables schedule
(A) (B) (C) (D) (E) (F)
«Accounts payable as of closing date
A=B+C+D+E+F»
Outstanding payables not
due
Outstanding payables due in less than 30
days
Outstanding payables due in between 31 to 60 days
Outstanding payables due in between 31 to 60 days
Outstanding payables due in more than
90 days
Closing date 2017 1 450 608 377 158 377 158 449 689 203 085 43 518
Closing date 2018 1 589 793 397 448 381 550 508 734 254 367 47 694
The table below highlights the YoY changes in debt:
ANNUAL REPORT 2018 67

C. MAIN RATIOS This section focuses on the performance, liquidity, profitability and debt ratios of the company.
C.1 PERFORMANCES RATIOSThe following table shows the evolution of the performance ratio in 2018:
(1) The value-added ratioThis ratio is determined by value added over revenue. Value add-ed increased by MMAD 126 YoY, from MMAD 951 in 2017 to MMAD 1,077 in 2018; driven by the im-provement in revenue, margins (direct and back) and by a better control of operational expenses.
(2) Employee performance coef-ficientThe employee performance coef-ficient corresponds to the ration «Value Added» to «Payroll Ex-
penses» ratio and measures the wealth created for every dirham of payroll spent.The ratio improved by MAD 0.15 between 2017 and 2018 from MAD 3.1 to MAD 3.3 in 2018. This increase is related to the im-provement of the added value, the gross margin as well as optimiza-tion of the payroll.
(4) Operating margin Operating margin corresponds to the ratio operating income over revenue.
Operating margin improved by 0.4 point to stand at 4.7% in 2018 vs. 4.3% in 2017, driven by a better control of operating expenses, leading to an increase in operat-ing income, a significant increase in sales volumes and gross mar-gin.In 2018, performance ratios deliv-ered the following:• Value added increased by 0.4% ;• Labor efficiency increased by MAD 0.15;• Operating margin increased by 0.4%.
C.2 LIQUIDITY RATIOS The YoY evolution of liquidity ratios in 2018 is shown in the table below:
ALL NUMBERS IN KMAD 2017 20182018 Vs 2017
Change %
Value-added ratio (1) 11,5% 11,9% 0,4%
Value-added 951 358 1 077 931 126 573 13,3%
Revenue 8 274 578 9 032 957 758 378 9,2%
Employee efficiency (2) 3,12 3,27 0,15
Staffing costs 304 939 330 059 25 120 8,2%
Operating margin (3) 7,3% 7,8% 0,5%
EBE 603 161 704 842 101 681 16,9%
Operational margin (4) 4,3% 4,7% 0,4%
Operating income 354 382 426 689 72 307 20,4%
WORKING CAPITAL ITEMS 2017 Number of days sale 2018 Number of
days saleCHANGE VS
2017Number of days sale
INVENTORY 1 285 379 61 1 478 326 65 192 947 3
Merchadise 1 274 192 61 1 466 528 64 192 336 3
Consumables 11 187 1 11 798 1 611 0
Goods in process 0 0 0 0
CURRENT ASSETS 1 410 276 67 1 564 838 69 154 562 1
Accounts receivables 833 905 40 827 986 36 -5 918 -4
Others 576 372 28 736 852 32 160 480 5
CURRENT LIABILITIES 3 114 531 149 3 355 193 147 240 662 -2
Accounts payables 2 837 147 136 3 081 442 135 244 294 -1
Others 277 384 13 273 752 12 -3 632 -1
WCR 418 876 20 312 029 14 -106 847 -6
ANNUAL REPORT 201868

(1) Inventory turnoverIn 2018, inventory turnover cov-ered 65 days of sale.
(2) Days of Sales OutstandingYoY, days of sales outstanding in-creased by 1 day in 2018. This in-crease was driven by VAT claims
which depend on the volume of sales.Thanks to sizable efforts de-ployed, clients’ day sales out-standing decreased by 4 days.
(3) Days Payable OutstandingDays payable outstanding were
reduced by 2 days from 149 days in 2017 to 147 days in 2018.Accounts payables increased as a result of additional purchases fol-lowing the opening of new stores as well as a better performance pro-forma.
(1) Return on equityI t is the ratio between Net In-come and Total Equity. Return on equity improved YOY. Indeed, the return on equity increased by 1.5 points to stand at 15.7% in 2018 vs. 14.2% in 2017. This
improvement was driven by an increase of Net Income from MMAD 240 to MMAD 288 YoY.
(2) Net profitabil ityThis is the ratio between the Net Income and the balance
sheet total . Net profitabi l i ty in-creased by 0.2% in 2018. This increase is attr ibutable to the improvement in net income in 2 0 1 8 .
In 2018, the group’s net debt in-creased by 9% from MMAD 1,628.9 in 2017 to MMAD 1,782.2 in 2018. This increase was driven by:
- The investments related to the opening of new stores as well as the renovation of 10 stores in 2018;
- -New medium-term loans added in 2018 to finance the ongoing de-velopment of the group.
C.3 PROFITABILITY RATIOS
C.4 DEBT RATIOSThe following table measures the proportion of long-term debt in 2018 versus 2017:
ALL NUMBERS IN KMAD 2017 2018 Change
Return on equity 14,2% 15,7% 1,5
Net profitability 3,4% 3,7% 0,2
ALL NUMBERS IN KMAD 2017 2018 CHANGE VS 2017 %
DMLT 2 103 738 2 307 390 203 652 10%
Long-term debt 2 103 738 2 307 390 203 652 10%
Short-term debt 0 0 0 0%
Cash and liquid assets 474 771 525 106 50 335 11%
Net Debt 1 628 967 1 782 284 153 317 9%
Long-term debt 3 814 717 4 160 933 346 215 9%
DMLT/Long-term debt 55% 55% 0% 1%
Equity 1 710 979 1 853 543 142 563 8%
Net debt-to-equity ratio 95% 96% 1% 1%
Net debt MLT 123% 124% 2% 1%
ANNUAL REPORT 2018 69
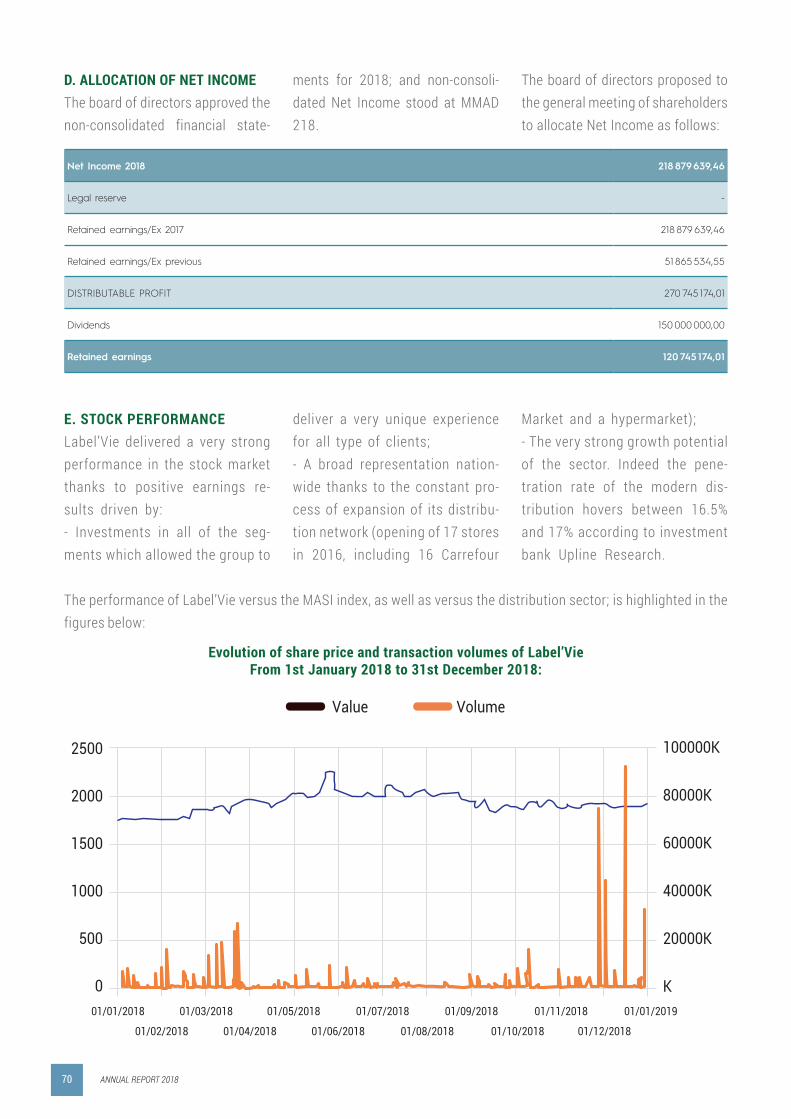
D. ALLOCATION OF NET INCOME The board of directors approved the non-consolidated financial state-
ments for 2018; and non-consoli-dated Net Income stood at MMAD 218.
The board of directors proposed to the general meeting of shareholders to allocate Net Income as follows:
E. STOCK PERFORMANCELabel’Vie delivered a very strong performance in the stock market thanks to positive earnings re-sults driven by:- Investments in all of the seg-ments which allowed the group to
deliver a very unique experience for all type of clients;- A broad representation nation-wide thanks to the constant pro-cess of expansion of its distribu-tion network (opening of 17 stores in 2016, including 16 Carrefour
Market and a hypermarket);- The very strong growth potential of the sector. Indeed the pene-tration rate of the modern dis-tribution hovers between 16.5% and 17% according to investment bank Upline Research.
Evolution of share price and transaction volumes of Label’VieFrom 1st January 2018 to 31st December 2018:
Net Income 2018 218 879 639,46
Legal reserve -
Retained earnings/Ex 2017 218 879 639,46
Retained earnings/Ex previous 51 865 534,55
DISTRIBUTABLE PROFIT 270 745 174,01
Dividends 150 000 000,00
Retained earnings 120 745 174,01
Value Volume
2500
01/01/2018
01/02/2018 01/04/2018 01/06/2018 01/08/2018 01/10/2018 01/12/2018
01/03/2018 01/01/201901/11/201801/09/201801/07/201801/05/2018
2000
1500
1000
500
0
100000K
80000K
60000K
40000K
20000K
K
LBV DISTRIBUTIONMASI
180,0
160,0
140,0
120,0
100,0
80,0
60,0
40,0
avr -
18
mai
- 18
juin -
18
juil -
18
août
- 18
sept
- 18
oct -
18
nov -
18
déc -
18
janv -
19
févr
- 19
mar
s - 19
avr -
19
LBV : 15,3%DISTRIBUTION : 0,0%MASI : -13,9%
Highest YOY : 2350 Dhs
Lower YOY : 1835 Dhs
The performance of Label’Vie versus the MASI index, as well as versus the distribution sector; is highlighted in the figures below:
ANNUAL REPORT 201870

Value Volume
2500
01/01/2018
01/02/2018 01/04/2018 01/06/2018 01/08/2018 01/10/2018 01/12/2018
01/03/2018 01/01/201901/11/201801/09/201801/07/201801/05/2018
2000
1500
1000
500
0
100000K
80000K
60000K
40000K
20000K
K
LBV DISTRIBUTIONMASI
180,0
160,0
140,0
120,0
100,0
80,0
60,0
40,0
avr -
18
mai
- 18
juin -
18
juil -
18
août
- 18
sept
- 18
oct -
18
nov -
18
déc -
18
janv -
19
févr
- 19
mar
s - 19
avr -
19
LBV : 15,3%DISTRIBUTION : 0,0%MASI : -13,9%
Highest YOY : 2350 Dhs
Lower YOY : 1835 Dhs
In 2018, Label’Vie soared by 9.86% outperforming the MASI index which plunged by 8.27%. It outperformed the distribution
sector as well, which yielded - 0 . 2 3 % .Volumes traded stood at MMAD 732 and the total market capital-
ization increased to MMAD 5,533 on 12/31/2018 vs. MMAD 4.968 on 01/02/2018.
LBV Relative Force Vs. Retail Distribution Sector Vs. MASI
ANNUAL REPORT 2018 71

ANNUAL REPORT 201872

PROSPECTS
ANNUAL REPORT 2018 73

PROSPECTSModern Trade has rapidly and profoundly developed in the re-cent years. Even if tradit ional trade remains prominent, we can attest that there is an un-deniable change in consumers’ behaviours and an accrued sen-sibi l i ty to food qual ity. Tradi-t ional trade is more and more chal lenged nowadays by the modern sector, which expands
rapidly over the terr itory. Retai l distr ibution shares wil l undoubtedly increase over the next few years. We can pre-dict promising outcomes in re-gards to its continued growth and consumers’ enthusiasm toward this model , al l s ignif i -cant growth opportunit ies that wil l al low the sector to prevai l over i ts tradit ional competit ion.
PERSPECTIVES FOR LABEL’VIE GROUPThe enduring effor ts from Label ’Vie management have contributed to improve results in a sustainable way. Indeed, lately, the achievements of the group have been:
- The sustained expansion through the implementation of
ANNUAL REPORT 201874

new pol icies to faci l i tate store o p e n i n g s .
- The expansion of the super-market model with new store openings and remodeling.
- The mastering the hypermar-ket model
- The improvement of al l seg-ments profitabi l i ty and produc-t iv i ty
- The improvement of Customer experience through the imple-mentation of qual ity guaranties and offers.
Label ’Vie Group is planning to continue its expansion effor ts with the opening of 16 new stores for a total investment of 605 mil l ion dirhams, result ing in more than 24,000 m² of addi-
t ional sales area and the crea-t ion of 1290 new jobs.
At the end of the f irst semester 2019, 6 of these 16 new stores are already open and running:
• RABAT - HIGH AGDAL:On January 24, 2019, Labe’Vie Group opened its 74th Carrefour Market store in the capital , on a commercial surface area of 500 m 2.
• KENITRA MAAMOURA: On February 21, 2019, the Group opened its 75th supermarket in the city of Kenitra, on a com-mercial surface area of 700m².
• AGADIR EL HOUDA:On March 21, 2019, the Group opened its 76th supermarket in the city of Kenitra, on a com-mercial surface area of 500m².
• MOHAMMEDIA MANSOURIA:On May 30, 2019, the Group opened its 77th Carrefour Mar-ket store in the city of Moham-media, on a commercial area of 725 m².
• CASABLANCA OASIS:On May 30, 2019, the Group opened its 78th store in the city of Casablanca, on a commercial area of 700 m².
• MARRAKECH SEMLALIA:On May 30, 2019, the Group inaugurated its 79th store in the city of Marrakech, on a com-mercial area of 613 m².
ANNUAL REPORT 2018 75

APPENDIX
ANNUAL REPORT 201876

NON-CONSOLIDATED FINANCIAL STATEMENTS
APPENDIX I
ANNUAL REPORT 2018 77

BALANCE SHEET - ASSETS (Normal model)FY 01/01/2018 to 12/31/2018
ASSETS FISCAL YEAR PREVIOUS FISCAL YEAR
BRUT AMORT.-PROV. NET NET
NON-VALUE FIXED ASSETS (A) 646 697 626,40 273 689 223,65 373 008 402,75 305 130 812,50
- PRELIMINARY EXPENSES 32 900,00 32 900,00 0,00 6 580,00
- DIFERRED EXPENSES OVER SEVERAL YEARS 646 664 726,40 273 656 323,65 373 008 402,75 305 124 232,50
- BONDS REDEMPTION PREMIUMS 0,00 0,00 0,00 0,00
INTANGIBLE ASSETS (B) 200 568 128,61 25 540 162,34 175 027 966,27 177 072 998,16
- FIXED ASSETS IN RESEARCH AND DEVELOPPEMENT 0,00 0,00 0,00 0,00
. PATENTS, TRADEMARKS, SIMILAR RIGHTS AND ASSETS 43 828 708,18 25 540 162,34 18 288 545,84 20 333 577,73
. GOODWILL 156 739 420,43 0,00 156 739 420,43 156 739 420,43
. OTHER INTANGIBLE ASSETS 0,00 0,00 0,00 0,00
TANGIBLE ASSETS (C) 1 899 674 275,68 482 156 455,78 1 417 517 819,90 1 292 240 544,91
. LANDS 194 873 623,20 0,00 194 873 623,20 178 368 123,20
. BUILDINGS 700 268 083,02 108 902 335,57 591 365 747,45 489 266 247,65
. MACHINARY, EQUIPMENTS AND TOOLS 431 227 660,06 211 792 357,98 219 435 302,08 195 355 369,55
. TRANSPORT EQUIPMENTS 1 542 053,53 1 293 680,76 248 372,77 368 535,29
. FURNITUR, OFFICE EQUIPMENTS AND MISCELANEOUS 483 288 705,81 160 168 081,47 323 120 624,34 225 108 589,97
. OTHER TANGIBLE ASSETS 0,00 0,00 0,00 0,00
. FIXED ASSETS IN PROGRESS 88 474 150,06 0,00 88 474 150,06 203 773 679,25
FINANCIAL ASSETS (D) 1 644 725 881,62 - 1 644 725 881,62 1 642 967 375,16
. FIXED LOANS 0,00 0,00 0,00 0,00
. OTHER FINANCIAL RECEIVABLES 17 273 194,92 0,00 17 273 194,92 16 714 688,46
. EQUITY INVESTMENTS 1 627 452 686,70 0,00 1 627 452 686,70 1 626 252 686,70
. OTHER LOCKED IN INVESTMENTS 0,00 0,00 0,00 0,00
CONVERSION GAP - ASSETS (E)
. REDUCTION OF NON-PERFORMING LOANS 0,00 0,00
. INCREASE OF FINANCIAL LIABILITIES 0,00 0,00
TOTAL I = (A+B+C+D+E) 4 391 665 912,31 781 385 841,77 3 610 280 070,54 3 417 411 730,73
INVENTORIES (F) 691 723 493,50 - 691 723 493,50 596 236 245,49
. GOODS 681 829 716,99 0,00 681 829 716,99 586 866 502,29
. CONSUMABLE MATERIALS AND SUPPLIES 9 893 776,51 0,00 9 893 776,51 9 369 743,20
. GOODS IN PROCESS 0,00 0,00 0,00 0,00
. INTERMEDIATE GOODS & RESIDUEL GOODS 0,00 0,00 0,00 0,00
. FINISHED GOOD 0,00 0,00 0,00 0,00
CURRENT ASSETS RECEIVABLES (G) 1 607 948 263,07 194 663,41 1 607 753 599,66 1 437 745 079,03
. SUPPLIERS RECEIVABLES, ANDVANCES AND REPAYMENTS 41 625 273,46 0,00 41 625 273,46 34 097 388,36
. COSTUMOR ACCOUNTS RECEIVABLE 1 126 887 516,12 194 663,41 1 126 692 852,71 1 103 984 167,43
. PERSONNEL 12 695 301,02 0,00 12 695 301,02 8 290 617,44
. GOVERNMENT 269 114 268,97 0,00 269 114 268,97 239 890 384,44
. SHAREHOLDERS ACCOUNTS 0,00 0,00 0,00 0,00
. OTHER DEBTORS 133 004 907,62 0,00 133 004 907,62 22 560 007,85
. REPAYMENT AND ACCURED INCOME 24 620 995,88 0,00 24 620 995,88 28 922 513,51
SECURITIES & INVESTMENT VALUES (H) 7 048 081,12 0,00 7 048 081,12 10 887 895,87
CONVERSION GAP - ASSETS (I) 768 256,71 0,00 768 256,71 952 435,02
(ELEMENTS CIRCULANTS) 0,00
TOTAL II (F + G + H + I) 2 307 488 094,40 194 663,41 2 307 293 430,99 2 045 821 655,41
CASHFLOW - ASSETS
. CHECKS 43 682 878,40 0,00 43 682 878,40 26 234 402,20
. BANKS, TREASURY & POSTAL CHECKS 754 238 325,65 0,00 754 238 325,65 537 624 089,85
. FUNDS & CREDENTIALS 7 284 772,87 0,00 7 284 772,87 7 046 427,87
TOTAL III 805 205 976,92 - 805 205 976,92 570 904 919,92
OVERALL TOTAL ( I + II + III ) 7 504 359 983,63 781 580 505,18 6 722 779 478,45 6 034 138 306,06
ANNUAL REPORT 201878

LIABILITIES FISCAL YEAR FREVIOUS FISCAL YEAR
SHAREHOLDERS EQUITY
. CAPITAL STOCK OR PERSONNEL (1) 283 896 200,00 283 896 200,00
. LESS: SHAREOLDERS, UNCALLED SUBSCRIBED CAPITAL
PAID-IN CAPITAL:
. ISSUANCE PREMIUM, MERGER PREMIUM, SHARE PREMIUM 1 150 523 764,19 1 150 523 764,19
. REVALUATION SURPLUS 0,00 0,00
. LEGAL RESERVES 28 389 620,00 25 452 770,00
. OTHER RESERVES 0,00 0,00
. RETAINED EARNINGS (2) 51 865 534,55 28 213 250,84
. NET INCOME PENDING ASSIGNMENT (2) 0,00 0,00
. FISCAL YEAR NET INCOME (2) 218 879 639,46 176 589 133,71
TOTAL SHAREHOLDERS’ EQUITY (A) 1 733 554 758,20 1 664 675 118,74
QUASI-EQUITY (B) 0,00 0,00
. INVESTMENT SUBSIDIES 0,00 0,00
. REGULATED PROVISIONS
FINANCING DEBTS ( C ) 2 169 529 147,05 1 941 119 665,79
. BOND ISSUES 1 500 000 000,00 1 500 000 000,00
. OTHER FINANCING DEBTS 669 529 147,05 441 119 665,79
SUSTAINABLE PROVISIONS / LIABILITIES AND CHARGES (D) 3 687 657,33 1 000 558,60
. PROVISIONS FOR LIABILITIES 3 687 657,33 1 000 558,60
. PROVISIONS FOR CHARGES 0,00 0,00
CONVERSION GAP - LIABILITIES (E) 0,00 0,00
. INCREASE OF NON-PERFORMING LOANS 0,00 0,00
. REDUCTION OF FINANCIAL LIABILITIES 0,00 0,00
TOTAL I (A + B + C + D + E) 3 906 771 562,58 3 606 795 343,13
DEBTS ON CURRENT LIABILITIES (F) 2 491 968 627,11 2 306 076 665,78
. SUPPLIERS AND RELATED ACCOUNTS 1 589 792 508,60 1 450 608 139,37
. CUSTOMER LIABILITIES, ADVANCES AND PREPAYMENTS 1 918 207,45 1 624 124,11
. PERSONNEL 998 841,08 797 340,43
. SOCIAL ORGANIZATIONS 9 958 975,57 11 232 695,94
. GOVERNMENT 178 176 805,69 180 619 308,69
. SHAREHOLDERS ACCOUNTS 161 819,65 131 956,73
. OTHER CREDITORS 695 097 822,10 645 415 533,70
. DEFERRED INCOME LIABILITIES 15 863 646,97 15 647 566,81
OTHER PROVISIONS FOR LIABILITIES AND CHARGES (G) 3 768 256,71 952 435,02
CONVERSION GAP- LIABILITIES (H) 271 032,05 313 862,13
TOTAL II ( F + G + H) 2 496 007 915,87 2 307 342 962,93
CASHFLOW - LIABILITIES
. DISCOUNT LOANS 320 000 000,00 120 000 000,00
. CASH LOANS 0,00 0,00
. BANKS (CREDIT BALANCES) 0,00 -
TOTAL III 320 000 000,00 120 000 000,00
GENERAL TOTAL I + II + III 6 722 779 478,45 6 034 138 306,06
BALANCE SHEET - LIABILITIES (Normal model)FY 01/01/2018 to 12/31/2018
ANNUAL REPORT 2018 79

INCOME AND EXPENSES ACCOUNT (EXCLUDING TAXES)FY 01/01/2018 to 12/31/2018
OPERATIONS TOTALS TOT. PREVI. FISCAL YEAR
FISCAL YEAR (1) PREV. FISCAL YEAR (2) FISCAL YEAR (1+2)
OPERATING REVENUES
. SALES OF GOODS AS IS 3 755 437 686,45 0,00 3 755 437 686,45 3 326 979 242,10
. REVENUES OF SALES OF GOODS AND SERVICES 513 910 286,95 0,00 513 910 286,95 443 565 469,58
TURNOVER 4 269 347 973,40 0,00 4 269 347 973,40 3 770 544 711,68
. PRODUCT INVENTORY VARIATION (+ -)
. SELF-CONSTRUCTED FIXED ASSETS
. OPERATING GRANT
. OTHER OPERATING REVENUES
. RELEASES OF OPERATING.; TRANSFER OF EXPENSES 87 538 800,61 0,00 87 538 800,61 76 940 299,88
TOTAL I 4 356 886 774,01 0,00 4 356 886 774,01 3 847 485 011,56
OPERATING EXPENSES
- RESALE PURCHASES OF MERCHANDISE 3 213 559 041,24 0,00 3 213 559 041,24 2 854 141 463,30
- COSTS OF SUPPLIES AND CONSUMABLE MATERIALS 108 092 016,54 0,00 108 092 016,54 104 126 730,91
- OTHER EXTERNAL EXPENSES 249 272 141,08 77 555,28 249 349 696,36 222 369 313,25
- TAXES AND DUTIES 24 356 649,24 0,00 24 356 649,24 21 650 569,43
- PERSONNEL EXPENSES 255 539 321,26 0,00 255 539 321,26 234 006 721,34
- OTHER OPERATING EXPENSES
- OPERATING ALLOCATION 178 543 367,17 0,00 178 543 367,17 143 128 569,27
TOTAL II 4 029 362 536,53 77 555,28 4 029 440 091,81 3 579 423 367,50
OPERATING RESULT III (I-II) 327 446 682,20 268 061 644,06
FINANCIAL REVENUES
- INCOME FROM EQUITY INVESTMENTS 67 166 221,00 0,00 67 166 221,00 65 430 446,50
- CURRENCY GAINS 2 326 386,97 0,00 2 326 386,97 1 409 914,72
- INTEREST AND OTHER FINANCIAL REVENUES 37 999 887,93 0,00 37 999 887,93 38 486 455,89
- FINANCIAL WRITE-BACK, EXPENSETRANSFERSTOTAL IV 11 936 593,76 0,00 11 936 593,76 9 845 468,70
TOTAL IV 119 429 089,66 0,00 119 429 089,66 115 172 285,81
FINANCIAL EXPENSES
- INTEREST CHARGES 159 998 821,92 0,00 159 998 821,92 149 517 763,52
- EXCHANGE LOSSES 3 152 556,25 0,00 3 152 556,25 3 509 933,07
- OTHER FINANCIAL EXPENSES 4 365 856,07 0,00 4 365 856,07 1 441 006,92
- FINANCIAL ALLOCATIONS 768 256,71 0,00 768 256,71 938 783,88
TOTAL V 168 285 490,95 0,00 168 285 490,95 155 407 487,39
FINACIAL RESULT VI (IV - V) -48 856 401,29 -40 235 201,58
CURRENT RESULT (III+VI) 278 590 280,91 227 826 442,48
ANNUAL REPORT 201880

INCOME AND EXPENSES ACCOUNT (Excluding taxes) (Cont.)FY 01/01/2018 to 12/31/2018
OPERATIONS TOTALS TOT. PREV. FISCAL. YEAR FISCAL YEAR (1) PREV.FISCAL. YEAR (2) FISCAL YEAR (1+2)
CURRENT RESULT (REPORTS) 0,00 0,00 278 590 280,91 227 826 442,48
PRODUITS NON COURANTS
- SALES OF FIXED ASSETS 91 692 579,10 0,00 91 692 579,10 5 129 020,67
- SUBVENTION D’EQUILIBRE/GRANT BALANCE 0,00 0,00 0,00 0,00
- RELEASE OF INVESTMENT GRANT 0,00 0,00 0,00 0,00
- OTHER NON-CURRENT INCOME 698 470,17 998 639,43 1 697 109,60 4 104 443,88
- RELEASE OF NON-CURRENT TRANSFER OF EXPENSES 144 040,96 0,00 144 040,96 0,00
TOTAL VIII 92 535 090,23 998 639,43 93 533 729,66 9 233 464,55
NON-CURRENT EXPENSES
- NET VALUE OF DEPRECIATION FROM SALE OF FIXED ASSETS 55 625 981,25 0,00 55 625 981,25 6 531 794,77
- GRANTS AWARDED 0,00 0,00 0,00 0,00
- OTHER EXPENSES 17 069 677,17 60,00 17 069 737,17 1 461 170,95
- NON-CURRENT ALLOCATIONS TO DEPRECIATION. & PROVISIONS 5 831 139,69 0,00 5 831 139,69 1 000 558,60
TOTAL IX 78 526 798,11 60,00 78 526 858,11 8 993 524,32
NON-CURRENT INCOME (VIII - IX) 15 006 871,55 239 940,23
INCOME BEFORE TAXES (VII+X) 293 597 152,46 228 066 382,71
INCOME TAXES 74 717 513,00 51 477 249,00
RESULTAT NET ( XI - XII) 218 879 639,46 176 589 133,71
TOTAL REVENUES (I+IV+VIII) 4 569 849 593,33 3 971 890 761,92
TOTAL EXPENSES (II+V+IX+XIII) 4 350 969 953,87 3 795 301 628,21
NET INCOME (TOT. REVENUES. - TOT. EXPENSES) 218 879 639,46 176 589 133,71
ANNUAL REPORT 2018 81

STATEMENT OF CASH FLOWS (E.S.G)FY 01/01/2018 to 12/31/2018
I. TABLE OF INCOME DETERMINATION
EXERCICE EXERC.PRECED
1 . SALES OF GOODS AS IS 3 755 437 686,45 3 326 979 242,10
2 - . PURCHASES OF RESOLD GOODS 3 213 559 041,24 2 854 141 463,30
I = GROSS MARGIN ON SALES AS IS 541 878 645,21 472 837 778,80
II + OUTPUT FOR THE FISCAL YEAR: (3 + 4 + 5) 513 910 286,95 443 565 469,58
3 . REVENUES FROM SALES OF GOODS AND SERVICES 513 910 286,95 443 565 469,58
4 . VARIATIONS OF INVENTORY OF GOODS
5 . ISELF-CONSTRUCTED FIXED ASSETS
III - INTAKE FOR THE FINANCIAL YEAR: (6+7) 357 441 712,90 326 496 044,16
6 . COSTS OF SUPPLIES AND CONSUMABLE MATERIALS 108 092 016,54 104 126 730,91
7 . OTHER EXTERNAL EXPENSES 249 349 696,36 222 369 313,25
IV = VALUE-ADDED (I + II - III) 698 347 219,26 589 907 204,22
8 + . OPERATING GRANTS 0,00 0,00
9 - . TAXES AND DUTIES 24 356 649,24 21 650 569,43
10 - . PERSONNEL EXPENSES 255 539 321,26 234 006 721,34
V = GROSS OPERATING SURPLUS (GOS) 418 451 248,76 334 249 913,45
= GROSS OPERATING SHORTFALL (IBE)
11 + . OTHER OPERATING REVENUES 0,00 0,00
12 - . OTHER OPERATING EXPENSES 0,00 0,00
13 + . OPERATING WRITE-BACKS, EXPENSE TRANSFERS 87 538 800,61 76 940 299,88
14 - . OPERATING ALLOCATIONS 178 543 367,17 143 128 569,27
VI = OPERATING INCOME (+ OR -) 327 446 682,20 268 061 644,06
VII ± FINANCIAL RESULT (48 856 401,29) (40 235 201,58)
VII = CURRENT INCOME ( + OR - ) 278 590 280,91 227 826 442,48
IX ± NON-CURRENT INCOME 15 006 871,55 239 940,23
15 - . INCOME TAXES 74 717 513,00 51 477 249,00
X = NET INCOME OF THE FISCAL YEAR (+ OR -) 218 879 639,46 176 589 133,71
II. CASH FLOW (C.A.F) - SELF-FINANCING
1 . NET INCOME OF THE FISCAL YEAR 218 879 639,46 176 589 133,71
- BENEFITS + 218 879 639,46 176 589 133,71
- LOSSES -
2 + . OPERATING ALLOWANCES 178 543 367,17 143 128 569,27
3 + . FINANCIAL ALLOWANCES 0,00 0,00
4 + . NON-CURRENT ALLOWANCES 2 831 139,69 1 000 558,60
5 - . EXTRAORDINARY WRITE-BACKS 144 040,96 0,00
0,00 0,00
8 - . PROCEEDS FROM DISPOSAL OF ASSETS 91 692 579,10 5 129 020,67
9 + . VALEURS NETTES D’AMORTISSEMENT DES IMMOB CEDEES 55 625 981,25 6 531 794,77
I = CASH FLOW FROM OPERATIONS ( C.A.F ) 364 043 507,51 322 121 035,68
10 - PROFIT DISTRIBUTION 150 000 000,00 80 000 000,00
II = SELF FINANCING 214 043 507,51 242 121 035,68
ANNUAL REPORT 201882

FUNDING TABLE FOR THE FISCAL YEARFY 01/01/2018 to 12/31/2018
I TABLE OF INCOME DETERMINATION
MASSES FY (a) Previous FY (b)Change a-b
Employment (c) Resources (d)
1 Permanent Funding 3 906 771 562,58 3 606 795 343,13 299 976 219,45
2 LESS CURRENT ASSETS 3 610 280 070,54 3 417 411 730,73 192 868 339,81
3 FUNCTIONAL WORKING CAPITAL (1-2) (A) 296 491 492,04 189 383 612,40 107 107 879,64
4 CURRENT ASSETS 2 307 293 430,99 2 045 821 655,41 261 471 775,58
5 LESS CURRENT LIABILITIES 2 496 007 915,87 2 307 342 962,93 188 664 952,94
6 BLOCK FUNDING NEED (4-5) (B) (188 714 484,88) (261 521 307,52) 72 806 822,64
7 NET CASH (ASSETS - LIABILITIES) = A-B 485 205 976,92 450 904 919,92 34 301 057,00
II CASH FLOW (C.A.F) - SELF-FINANCING
EXERCICE EXERCICES PRECEDENT
EMPLOIS RESSOURCES EMPLOIS RESSOURCES
I. STABLE RESOURCES FOR THE YEAR (FLOW)
. SELF-FINANCING (A) 214 043 507,51 242 121 035,68
Cash Flow 364 043 507,51 322 121 035,68
Profit Distribution (150 000 000,00) (80 000 000,00)
. DISPOSAL AND REDUCTION OF FIXED ASSETS (B) 91 692 579,10 5 129 020,67
Disposal of Intangible Assets 0,00 0,00
Disposal of Fixed Assets 91 692 579,10 5 129 020,67
Disposal of Financial Fixed Assets 0,00 0,00
Write-Backs of Long Term Receivables 0,00 0,00
INCREASE IN SHAREHOLDERS EQUITY AND QUASI-EQUITY ( C) 0,00 396 474 750,00
. Increase in Capital, Contributions 0,00 396 474 750,00
. Undistributed Dividends - 2009
. INCREASE IN FINANCIAL LIABILITIES (D) 307 874 089,64 341 294 455,32
(Net of Redemption Premiums)
TOTAL I – STABLE RESOURCES (A+B+C+D) 613 610 176,25 985 019 261,67
II. STABLE EMPLOYMENT ON THE YEAR (FLOW)
ACQUISITION AND INCREASE OF FIXED ASSETS ( E) 260 308 547,68 365 244 223,89
Acquisition of Intangible Assets 5 643 117,79 12 416 531,26
. Acquisition of Capital Assets 252 906 923,43 339 588 806,58
. Acquisition of Financial Assets 1 758 506,46 13 238 886,05
. Increase of Non-Performing Loans 0,00 0,00
. REPAYMENT OF SHAREHOLDERS EQUITY (F) 0,00 0,00
REPAYMENT OF FINANCIAL LIABILITIES (G) 79 464 608,38 183 016 353,81
EMPLOYMENT WRITTEN-OFF (H) 166 729 140,55 140 557 881,85
TOTAL II – STABLE EMPLOYMENT (E+F+G+H) 506 502 296,61 688 818 459,55
III. CHANGES IN BLOCK FUNDING NEED(BFG) 72 806 822,64 0,00 104 981 546,16 0,00
IV. CHANGES IN CASH T O T 34 301 057,00 0,00 191 219 255,96 0,00
T O T A L G E N E R A L 613 610 176,25 613 610 176,25 985 019 261,67 985 019 261,67
ANNUAL REPORT 2018 83

STATEMENT A2STATEMENT OF EXEMPTIONS
STATEMENT A3 STATEMENT OF CHANGES IN METHODS
«
FY 01/01/2018 to 12/31/2018
FY 01/01/2018 to 12/31/2018
EXEMPTIONS OF INDICATION JUSTIFICATION OF EXEMPTIONSINFLUENCE OF EXEMPTION ON
THE ASSETS, FINANCIAL SITUATION, AND THE RESULTS
I- EXEMPTIONS FROM PRINCIPLE ACCOUNTING POLICIES N/A
II - EXEMPTION FROM EVALUATION METHODS N/A
III - EXEMPTIONS FROM PREPARATION AND PRESENTATION RULES FINAN-CIAL STATEMENTS N/A
INDICATION OF EXEMPTIONS JUSTIFICATION OF EXEMPTIONSINFLUENCE OF EXEMPTIONON THE ASSETS, FINANCIAL
SITUATION, AND THE RESULTS
Changes Affecting Valuation Methods N/A N/A
Changes Affecting Presentation Rules N/A N/A
ANNUAL REPORT 201884

TABLE OF FIXED ASSETS OTHER THAN FINANCIALFY 01/01/2018 to 12/31/2018
CHANGES AFFECTING PRESENTATION RULES
GROSS AMOUNT AT THE
BEGINNING OF THE FISCAL YEAR
INCREASE DECREASE
GROSS AMOUNT AT THE END OF
THE FISCAL YEARAcquisition
Product of the
company for itself
Transfer Disposal Withdrawal Transfer
FIXED ASSETS WRITTENG-OFF 495 355 140,35 166 729 140,55 - 4 113 345,50 - - 19 500 000,00 646 697 626,40
* Preliminary Costs 32 900,00 32 900,00
* Deferred Expenses over several years 495 322 240,35 166 729 140,55 4 113 345,50 19 500 000,00 646 664 726,40
* Bond Redemption premiums - -
INTAGIBLE ASSETS 194 925 010,82 5 643 117,79 - - - - - 200 568 128,61
* Research and Development Assets - 0,00
* Patents,Trademarks, Similar Rights and assets 38 185 590,39 5 643 117,79 43 828 708,18
* GOODWILL 156 739 420,43 - 156 739 420,43
* Other Intangible Assets - -
TANGIBLE ASSETS 1 688 376 841,54 252 906 923,43 - 145 221 168,06 56 996 143,79 - 129 834 513,56 1 899 674 275,68
* Land *Buildings 178 368 123,20 56 705 500,00 40 200 000,00 194 873 623,20
* Constructions 573 977 398,09 102 365 139,99 39 993 064,11 16 067 519,17 700 268 083,02
* Machinery, Equipment and Tools 373 797 800,22 54 296 182,88 3 652 257,22 518 580,26 431 227 660,06
* Transport Equipment 1 517 485,34 41 800,30 17 232,11 1 542 053,53
* Furniture, Office Supplies and Miscellaneous 356 942 355,44 81 506 694,44 44 870 346,73 30 690,80 483 288 705,81
* Other Tangible Assets - - -
* Tangible Assets in Progress 203 773 679,25 14 697 105,82 162 121,45 129 834 513,56 88 474 150,06
2 378 656 992,71 425 279 181,77 - 149 334 513,56 56 996 143,79 - 149 334 513,56 2 746 940 030,69
ANNUAL REPORT 2018 85

TABLE OF EQUITY INVESTMENTS
TABLE OF ALLOWANCES
FY 01/01/2018 to 12/31/2018
FY 01/01/2018 to 12/31/2018
Issuing Com-pany’s Corpo-
rate Name
LINE OF BUSINESS
Registered Capital
% ofcapitalcontri-bution
Net CarryingAmount
Net CarryingAmount
Extracts from the company’s Recent Financial Statements Products Regis-
teredIn the C.P.C of the exerciseClosing
Date Net Issuing Equity Net Income
HYPERMARCHE LV SAS RETAIL 120 000 000,00 95% 114 000 000,00 114 000 000,00 31/12/2018 168 604 156,62 30 116 708,78
ARADEI CAPITAL HOLDING 811 273 800,00 57% 1 241 000 000,00 1 241 000 000,00 31/12/2018 1 691 576 826,07 64 688 600,57 65 307 331,00
MUTANDIS INVESTMENT FUND 680 405 100,00 5% 56 520 000,00 56 520 000,00 31/12/2018 1 015 377 414,18 69 232 330,27 1 858 890,00
BERKANE PLAZA S A R L
CONSTRUCTION AND PROPERT 100 000,00 67% 67 000,00 67 000,00 31/12/2018
MAXI LV RETAIL 158 200 000,00 95% 157 815 000,00 157 815 000,00 31/12/2018 203 196 178,82 33 215 795,10
SERVICE LV MASS DISTRIBUTION 300 000,00 100% 300 000,00 300 000,00 31/12/2018 15 663 039,11 7 091 737,26
AMETHIS FINANCE SCS SICAR
INVESTMENT FUND 53 679 938,92 53 679 938,92 31/12/2018
MOBIMARKET MOBILE DISTRIBU-TION 5 000 000,00 50% 2 500 000,00 2 500 000,00 31/12/2018 3 566 699,93 (1 805 750,71)
SILAV REAL ESTATE 300 000,00 100% 300 000,00 300 000,00 31/12/2018 300 000,00
RETAIL HOLDING AFRICA RETAIL 255 001 200,00 0% 70 747,78 70 747,78 31/12/2018 246 558 940,33 (456 120,40)
MOULAT EL KHEIR SA
MANAGEMENT BUSINESS, INDUSTRY, AGRICULTURE AND CIVIL OR MILITARY SERVICES
2 600 000,00 23% 600 000,00 600 000,00 31/12/2018 2 220 717,50 (379 282,50)
ARADI SUD REAL ESTATE (FOR RENT PURPOSES) 300 000,00 100% 300 000,00 300 000,00 31/12/2018 300 000,00
LAAYOUNE LV
SUPERMARKET BUYING AND SEL-LING PRODUCTS OF DAILY CONSUMP-TION
300 000,00 100% 300 000,00 300 000,00 31/12/2018 300 000,00
TOTAL 2 033 780 100 1 627 452 686,7 1 627 452 686,7 3 347 663 972,56 201 704 018,37 67 166 221,00
TYPEAmount at the Beginning ofthe fiscal year
ALLOCATIONS RECOVERY Amount at the End of theFiscal YearOperating Financial Non Current Opera-
ting Financial Non Current
1. Allowances for the Depreciation of Capital Assets
2. Regulated Provisions
3. Sustainable Provisions for Liabilities and Charges 1 000 558,60 2 831 139,69 144 040,96 3 687 657,33
SUB TOTAL (A) 1 000 558,60 0,00 0,00 2 831 139,69 0,00 0,00 144 040,96 3 687 657,33
4. Allowances for the Depreciation of Current Assets (excl. Cash) 194 663,41 194 663,41
5. Other Provisions for Liabilities and charges 952 435,02 768 256,71 3 000 000,00 952 435,02 3 768 256,71
6. Allowances for the Depreciation of Cash Accounts
SUB TOTAL (B) 1 147 098,43 0,00 768 256,71 3 000 000,00 0,00 952 435,02 0,00 3 962 920,12
TOTAL (A+B) 2 147 657,03 0,00 768 256,71 5 831 139,69 0,00 952 435,02 144 040,96 7 650 577,45
ANNUAL REPORT 201886

TABLE OF RECEIVABLESFY 01/01/2018 to 12/31/2018
RECEIVABLES TOTAL
BREAKDOWN BY MATURITY OTHER BREAKDOWNS
MORE THANA YEAR
LESS THAN A YEAR
MATURED AND UNRECOVERED
CURREN-CY
AMOUNT
AMOUNTSFROM THE
GOVERNMENT AND
PUBLIC
AMOUNTS FROM
RELATEDCOMPANIES
AMOUNTSREPRE-SENTED
BY BILLS
FROM FIXED ASSETS 17 273 194,92 16 714 688,46 558 506,46 0,00 0,00 0,00 0,00 0,00
* Fixed Loans
* Other Financial Recei-vables 17 273 194,92 16 714 688,46 558 506,46
FROM CURRENT ASSETS 1 607 948 263,07 0,00 1 607 948 263,07 0,00 0,00 269 114 268,97 667 140 116,99 0,00
* Suppliers Receivables, Ad-vances and Prepayments 41 625 273,46 41 625 273,46 49 095,00
* Customers and Related Accounts 1 126 887 516,12 1 126 887 516,12 646 584 317,37
* Personnel 12 695 301,02 12 695 301,02
* Government 269 114 268,97 269 114 268,97 269 114 268,97
* Partner Accounts
* Other Debtors 133 004 907,62 133 004 907,62 20 506 704,62
* Prepayment and Accrued Income 24 620 995,88 24 620 995,88
TABLE OF DEBTS
DEBTS TOTAL
ANALYSIS BY MATURITY OTHER ANALYSESAMOUNTS
REPRESENTEDBY
BILLS OF EXCHANGE
MORE THANA YEAR
LESS THAN A YEAR
MATURED AND NOT
PAID
AMOUNTIN CURRENCY
AMOUNTSTO THE STATE
AND PUBLICBODIES
AMOUNTSTO
RELATEDCOMPANIES
FROM FINANCING 2 169 529 147,05 1 040 923 748,41 1 128 605 398,64
* Bond Issues 1 500 000 000,00 469 800 000,00 1 030 200 000,00
* Other Financial Debts 669 529 147,05 571 123 748,41 98 405 398,64
FROM CURRENT LIABILITIES 2 491 968 627,11 127 657,73 2 491 840 969,38 0,00 106 605 657,63 188 930 544,87 731 170 016,96 832 716 939,79
* Suppliers and Related Accounts 1 589 792 508,60 1 589 792 508,60 106 605 657,63 794 763,61 36 672 052,77 832 716 939,79
* Creditor Customers, Advances and Prepayments
1 918 207,45 1 918 207,45
* Personnel 998 841,08 998 841,08
* Social Organizations 9 958 975,57 9 958 975,57 9 958 975,57
* Government 178 176 805,69 178 176 805,69 178 176 805,69
* Partner Accounts 161 819,65 127 657,73 34 161,92
* Other Receivables 695 097 822,10 695 097 822,10 694 497 964,19
* Accrual and Deferred Income 15 863 646,97 15 863 646,97
FY 01/01/2018 to 12/31/2018
ANNUAL REPORT 2018 87

TABLE OF SECURITIES GIVEN OR RECEIVED
FINANCIAL COMMITMENTS RECEIVED OR GIVEN WITHOUT LEASING TRANSACTIONS
FY 01/01/2018 to 12/31/2018
FY 01/01/2018 to 12/31/2018
SECURITIES RECEIVABLES AND PAYABLES
AMOUNT COVERED BY THE
SECURITYTYPE DATE AND PLACE
OF REGISTRATION ITEM (2)(3)
NET BOOK VALUE OF THE SECURITY
GIVEN ON THE CLOSING DATE
SECURITIES GIVEN 276 989 726,60 (2) (3) RABAT BANKS
SECURITIES RECEIVED N/A
COMMITMENTS GIVEN AMOUNTFISCAL YEAR
AMOUNTPREVIOUS
FISCAL YEAR
* Endorsements and Guarantees
* Commitments in Terms of Pension, Retirement, and Similar Obligations
* Other Commitments Given
TOTAL (1) N/A N/A
(1) Including Liabilities to Related Companies
COMMITMENTS RECEIVED AMOUNTEXERCICE
AMOUNTEXERCICE
PRECEDENT
* Endorsements and Guarantees
- Deposits Received on the Market
* Other Commitments Received
TOTAL (1) N/A N/A
ANNUAL REPORT 201888

CONSOLIDATED FINANCIAL STATEMENTS
APPENDIX 2
ANNUAL REPORT 2018 89

BALANCE SHEET ASSETS (Normal model)FY 01/01/2018 to 12/31/2018
ASSETS FISCAL YEAR PREVIOUS FISCAL YEAR
BRUT AMORT.-PROV. NET NET
NON VALUE FIXED ASSETS (A)
- PRELIMINARY EXPENSES
- DIFERRED EXPENSES OVER SEVERAL YEARS
- BONDS REDEMPTION PREMIUMS
INTANGIBLE ASSETS (B) 1 348 624 171,80 511 849 773,57 836 774 398,23 772 372 832,57
- FIXED ASSETS IN RESEARCH AND DEVELOPPEMENT 948 283 418,51 483 883 435,95 464 399 982,56 397 456 356,64
. PATENTS, TRADEMARKS, SIMILAR RIGHTS AND ASSETS 46 864 666,19 27 966 337,62 18 898 328,57 20 922 534,81
. GOODWILL 353 476 087,10 353 476 087,10 353 476 087,10
. OTHER INTANGIBLE ASSETS 0,00 0,00 517 854,02
TANGIBLE ASSETS (C) 2 473 618 519,46 749 193 477,55 1 724 425 041,91 1 601 551 599,62
. LANDS 194 873 623,20 194 873 623,20 178 368 123,20
. BUILDINGS 718 928 113,75 111 665 182,25 607 262 931,50 505 769 417,11
. MACHINARY, EQUIPMENTS AND TOOLS 729 127 310,61 366 442 656,81 362 684 653,80 343 942 870,78
. TRANSPORT EQUIPMENTS 1 580 627,84 1 311 712,41 268 915,43 372 837,04
. FURNITUR, OFFICE EQUIPMENTS AND MISCELANEOUS 682 540 912,85 240 363 074,59 442 177 838,26 338 228 553,85
. OTHER TANGIBLE ASSETS 54 352 399,57 29 410 851,49 24 941 548,08 28 576 972,59
. FIXED ASSETS IN PROGRESS 92 215 531,65 92 215 531,65 206 292 825,05
FINANCIAL ASSETS (D) 1 386 655 847,95 - 1 386 655 847,95 1 384 897 341,49
. FIXED LOANS 0,00 0,00 0,00
. OTHER FINANCIAL RECEIVABLES 33 818 161,25 33 818 161,25 33 259 654,79
. EQUITY INVESTMENTS 1 352 837 686,70 1 352 837 686,70 1 351 637 686,70
. OTHER LOCKED IN INVESTMENTS
CONVERSION GAP - ASSETS (E)
. REDUCTION OF NON-PERFORMING LOANS
. INCREASE OF FINANCIAL LIABILITIES
TOTAL I = (A+B+C+D+E) 5 208 898 539,21 1 261 043 251,12 3 947 855 288,09 3 758 821 773,68
INVENTORIES (F) 1 488 755 874,78 10 429 908,00 1 478 325 966,78 1 285 379 120,94
. GOODS 1 476 957 832,54 10 429 908,00 1 466 527 924,54 1 274 192 230,32
. CONSUMABLE MATERIALS AND SUPPLIES 11 798 042,24 11 798 042,24 11 186 890,62
. GOODS IN PROCESS
. INTERMEDIATE GOODS & RESIDUEL GOODS
. FINISHED GOOD
CURRENT ASSETS RECEIVABLES (G) 1 568 256 204,76 4 363 976,89 1 563 892 227,87 1 409 147 336,08
. SUPPLIERS RECEIVABLES, ANDVANCES AND REPAY-MENTS
101 677 705,27 0,00 101 677 705,27 83 931 179,37
. COSTUMOR ACCOUNTS RECEIVABLE 832 350 264,41 4 363 976,89 827 986 287,52 833 904 522,08
. PERSONNEL 15 233 247,36 15 233 247,36 9 941 488,02
. GOVERNMENT 465 267 589,72 465 267 589,72 428 752 825,56
. SHAREHOLDERS ACCOUNTS 0,00 0,00 0,00
. OTHER DEBTORS 128 634 783,77 128 634 783,77 22 000 148,06
. REPAYMENT AND ACCURED INCOME 25 092 614,24 25 092 614,24 30 617 173,00
SECURITIES & INVESTMENT VALUES (H) 21 278 193,62 0,00 21 278 193,62 50 122 904,48
CONVERSION GAP - ASSETS (I) 946 135,10 946 135,10 1 129 022,65
(ELEMENTS CIRCULANTS) 0,00 0,00 0,00
TOTAL II (F + G + H + I) 3 079 236 408,26 14 793 884,89 3 064 442 523,37 2 745 778 384,15
CASHFLOW - ASSETS
. CHECKS 71 361 791,28 71 361 791,28 56 467 316,15
. BANKS, TREASURY & POSTAL CHECKS 789 806 533,21 789 806 533,21 475 524 682,46
. CAISSES, REGIES ET ACCREDITIFS 12 659 893,06 12 659 893,06 12 656 415,56
TOTAL III 873 828 217,54 - 873 828 217,54 544 648 414,17
OVERALL TOTAL ( I + II + III ) 9 161 963 165,01 1 275 837 136,01 7 886 126 029,00 7 049 248 572,00
ANNUAL REPORT 201890

LIABILITIES FISCAL YEAR PREV.FISCAL.YEAR
SHAREHOLDERS EQUITY
. CAPITAL STOCK OR PERSONNEL (1) 283 896 200,00 283 896 200,00
. LESS: SHAREOLDERS, UNCALLED SUBSCRIBED CAPITAL
PAID-IN CAPITAL:
. ISSUANCE PREMIUM, MERGER PREMIUM, SHARE PREMIUM 1 150 523 764,19 1 150 523 764,19
. REVALUATION SURPLUS
. LEGAL RESERVES 28 389 620,00 25 452 770,00
. OTHER RESERVES 28 647 711,80 -32 625 558,50
. RETAINED EARNINGS (2) 51 865 534,55 28 213 250,84
. NET INCOME PENDING ASSIGNMENT (2) 0,00 0,00
. FISCAL YEAR NET INCOME (2) 288 401 005,25 240 869 928,58
TOTAL SHAREHOLDERS’ EQUITY (A) 1 831 723 835,79 1 696 330 355,11
QUASI-EQUITY (B) 15 412 646,93 12 405 122,36
. INVESTMENT SUBSIDIES 15 412 646,93 12 405 122,36
FINANCING DEBTS (C) 2 307 390 075,63 2 103 738 229,49
. BOND ISSUES 1 500 000 000,00 1 500 000 000,00
. OTHER FINANCING DEBTS 807 390 075,63 603 738 229,49
SUSTAINABLE PROVISIONS / LIABILITIES AND CHARGES (D) 6 406 151,79 2 243 777,72
. PROVISIONS FOR LIABILITIES 6 406 151,79 2 243 777,72
. PROVISIONS FOR CHARGES
CONVERSION GAP - LIABILITIES (E)
. INCREASE OF NON-PERFORMING LOANS
. REDUCTION OF FINANCIAL LIABILITIES
TOTAL I (A + B + C + D + E) 4 160 932 710,14 3 814 717 484,68
DEBTS ON CURRENT LIABILITIES (F) 3 350 783 860,30 3 113 088 162,93
. SUPPLIERS AND RELATED ACCOUNTS 3 039 239 729,91 2 805 295 834,25
. CUSTOMER LIABILITIES, ADVANCES AND PREPAYMENTS 42 202 075,84 31 851 542,19
. PERSONNEL 7 049 368,37 8 059 194,05
. SOCIAL ORGANIZATIONS 14 652 618,93 15 966 608,42
. GOVERNMENT 225 237 956,54 227 745 578,70
. SHAREHOLDERS ACCOUNTS 161 819,65 131 956,73
. OTHER CREDITORS 4 895 336,14 5 698 830,10
. DEFERRED INCOME LIABILITIES 17 344 954,92 18 338 618,50
OTHER PROVISIONS FOR LIABILITIES AND CHARGES (G) 4 109 121,13 1 129 022,65
CONVERSION GAP - LIABILITIES (H) 300 337,44 313 901,74
TOTAL II ( F + G + H) 3 355 193 318,87 3 114 531 087,32
CHASHFLOW - LIABILITIES
. DISCOUNT LOANS
. CASH LOANS 370 000 000,00 120 000 000,00
. BANKS (CREDIT BALANCES)
TOTAL III 370 000 000,00 120 000 000,00
GENERAL TOTAL I + II + III 7 886 126 029,00 7 049 248 572,00
BALANCE SHEET - LIABILITIES (Normal Model)FY 01/01/2018 to 12/31/2018
ANNUAL REPORT 2018 91

INCOME AND EXPENSES ACCOUNT (EXCLUDING TAXES)FY 01/01/2018 to 12/31/2018
OPERATIONS TOTALS TOT. PREVI. FISCAL YEAR FY (1) PREV.FY (2) FY (1+2)
OPERATING REVENUES
. SALES OF GOODS AS IS 8 217 333 121,08 8 217 333 121,08 7 531 108 977,07
. REVENUES OF SALES OF GOODS AND SERVICES 816 219 280,21 -595 806,67 815 623 473,54 743 469 378,43
TURNOVER 9 033 552 401,29 -595 806,67 9 032 956 594,62 8 274 578 355,50
. PRODUCT INVENTORY VARIATION (+ -)
. SELF-CONSTRUCTED FIXED ASSETS
. OPERATING GRANT
. OTHER OPERATING REVENUES
. RELEASES OF OPERATING.; TRANSFER OF EXPENSES 103 434 347,78 103 434 347,78 95 422 121,41
TOTAL I 9 136 986 749,07 -595 806,67 9 136 390 942,40 8 370 000 476,90
OPERATING EXPENSES
- RESALE PURCHASES OF MERCHANDISE 7 246 696 558,41 7 246 696 558,41 6 667 246 165,37
- COSTS OF SUPPLIES AND CONSUMABLE MATERIALS 182 288 767,43 -158 275,95 182 130 491,48 177 269 014,19
- OTHER EXTERNAL EXPENSES 527 995 812,13 -1 797 355,85 526 198 456,28 478 705 397,95
- TAXES AND DUTIES 52 914 517,00 -1 567,20 52 912 949,80 46 783 316,19
- PERSONNEL EXPENSES 423 549 742,33 423 549 742,33 388 888 616,25
- OTHER OPERATING EXPENSES 60 389,83 60 389,83 6 665 460,45
- OPERATING ALLOCATION 278 153 618,83 278 153 618,83 250 086 632,72
TOTAL II 8 711 659 405,95 -1 957 199,00 8 709 702 206,95 8 015 644 603,11
OPERATING RESULT III (I-II) 425 327 343,12 1 361 392,33 426 688 735,45 354 355 873,79
FINANCIAL REVENUES
- INCOME FROM EQUITY INVESTMENTS 67 166 221,00 67 166 221,00 65 430 446,50
- CURRENCY GAINS 3 171 140,98 3 171 140,98 1 645 467,20
- INTEREST AND OTHER FINANCIAL REVENUES 39 934 237,38 39 934 237,38 39 347 864,94
- FINANCIAL WRITE-BACK, EXPENSE TRANSFERS TOTAL IV 11 950 176,40 11 950 176,40 11 364 302,92
TOTAL IV 122 221 775,76 122 221 775,76 117 788 081,56
FINANCIAL EXPENSES
- INTEREST CHARGES 137 621 208,14 137 621 208,14 141 691 599,22
- EXCHANGE LOSSES 3 915 140,42 3 915 140,42 4 512 712,78
- OTHER FINANCIAL EXPENSES 4 365 856,07 4 365 856,07 1 441 006,92
- FINANCIAL ALLOCATIONS 946 116,14 946 116,14 1 115 352,55
TOTAL V 146 848 320,77 146 848 320,77 148 760 671,47
FINACIAL RESULT VI (IV - V) -24 626 545,01 -24 626 545,01 -30 972 589,91
CURRENT RESULT (III+VI) 400 700 798,11 1 361 392,33 402 062 190,44 323 383 283,88
ANNUAL REPORT 201892

INCOME AND EXPENSES ACCOUNT (EXCLUDING TAXES) (Cont.)FY 01/01/2018 to 12/31/2018
OPERATIONS TOTALS TOT. PREVI. FISCAL YEAR FY (1) PREV.FY (2) FY (1+2)
CURRENT RESULT (REPORTS) 400 700 798,11 1 361 392,33 402 062 190,44 323 383 283,88
- SALES OF FIXED ASSETS
- SUBVENTION D’EQUILIBRE/GRANT BALANCE 91 994 211,48 91 994 211,48 5 329 187,32
- RELEASE OF INVESTMENT GRANT
- OTHER NON-CURRENT INCOME
- RELEASE OF NON-CURRENT TRANSFER OF EXPENSES 1 124 750,06 1 009 071,38 2 133 821,44 4 520 338,01- REPRISES NON COURANTES TRANSFERTS CHARGES 385 296,99 1 447,99 386 744,98 0,00TOTAL VIII 93 504 258,53 1 010 519,37 94 514 777,90 9 849 525,33
NON CURRENT EXPENSES
- NET VALUE OF DEPRECIATION FROM SALE OF FIXED ASSETS 55 817 246,66 55 817 246,66 6 629 530,08
- GRANTS AWARDED
- OTHER EXPENSES 36 615 074,73 1 021,88 36 616 096,61 2 822 534,18
- NON-CURRENT ALLOCATIONS TO DEPRECIATION. & PROVISIONS 6 232 119,82 6 232 119,82 1 619 217,37
TOTAL IX 98 664 441,21 1 021,88 98 665 463,09 11 071 281,63
NON-CURRENT INCOME (VIII - IX) -4 150 685,19 -1 221 756,30
INCOME BEFORE TAXES (VII+X) 397 911 505,25 322 161 527,58
INCOME TAXES 109 510 500,00 81 291 599,00
RESULTAT NET ( XI - XII) 288 401 005,25 240 869 928,58
TOTAL REVENUES (I+IV+VIII) 9 353 127 496,05 8 497 638 083,79
TOTAL EXPENSES (II+V+IX+XIII) 9 064 726 490,81 8 256 768 155,21
NET INCOME GROUP SHARE 285 236 479,66 237 862 404,01
NET INCOME MINORITIES 3 164 525,59 3 007 524,57
TABLE OF CONSOLIDATED CASH FLOWBased on Operating Revenues of Incorporated Companies
HEADINGS 2018 2017
CONSOLIDATED OPERATING INCOME 426 688 735,45 354 355 873,79 CONSOLIDATED OPERATING ALLOCATIONS 278 383 964,48 239 496 431,12 CASH FLOW FROM OPERATIONS OF INCORPORATED COMPANIES 705 072 699,92 593 852 304,90
RECEIVED DIVIDENDS
CHANGES IN OPERATIONAL WORKING CAPITAL REQUIREMENTS 78 001 907,68 146 390 346,08 - INVENTORY 192 946 845,84 123 885 695,16 - OPERATING RECEIVABLES 125 717 293,38 19 548 580,47 - OPERATING LIABILITIES 240 662 231,55 -2 956 070,45 OPERATING CASH FLOW 627 070 792,25 447 461 958,83FINANCIAL EXPENSES 146 848 320,77 148 760 671,47 FINANCIAL REVENUES 122 221 775,76 117 788 081,56 DIVIDENDS RECEIVED FROM EQUITY AFFILIATES - - CORPORATION TAXES EXCLUDING CAPITAL GAINS TAXES 109 510 500,00 81 291 599,00 NON-CURRENT EXPENSES AND REVENUES -37 480 827,18 1 594 303,83 NET CASH FLOW FROM OPERATING ACTIVITIES 455 452 920,06 336 792 073,75ACQUISITION OF ASSETS 520 160 667,85 553 526 249,54 DISPOSAL OF ASSETS 91 994 211,48 5 329 187,32 CHANGES IN LONG-TERM INVESTMENTS 1 758 506,46 13 238 886,05 CASH FLOW FROM INVESTMENT OPERATIONS -429 924 962,83 -561 435 948,27DIVIDENDS PAID TO PARENT COMPANY SHAREHOLDERS -150 000 000,00 -80 000 000,00
CASH DIVIDEND DISTRIBUTION TO MINORITY INTERESTS - -
CAPITAL INCREASE - 396 474 750,00
INCREASE OF FINANCIAL LIABILITIES 324 554 587,35 344 858 154,75
OTHERS - -
SCOPE of Consolidation - -
FINANCIAL DEBT REPAYMENT -120 902 741,21 -194 634 525,77
CASH FLOW FROM FINANCING ACTIVITIES 53 651 846,14 466 698 378,98VARIATION OF CASH FLOW 79 179 803,37 242 054 504,47 CASH FLOW AT THE BEGINING OF THE FISCAL YEAR 424 648 414,17 182 593 909,71 CASH FLOW AT THE END OF THE FISCAL YEAR 503 828 217,54 424 648 414,17
ANNUAL REPORT 2018 93

CONSOLIDATED STATEMENT OF CHANGES IN SHAREHOLDERS EQUITY (GROUP SHARE)
TABLE OF FIXED ASSETS OTHER THAN FINANCIAL
CAPITAL
SHARE AND MERGER
PREMIUMS FY.PREV. (2)
CONSOLI-DATED
RESERVES
NET INCOME GROUP SHARE
GROUP TOTAL
SHAREHOLDERSEQUITY BYMINORITY
SHAREHOLDERS EQUITY
GROUP SHARE
SITUATION AT THE CLOSING DATE OF FISCAL YEAR 2017
283 896 200,00 1 150 523 764,19 33 445 584,70 240 869 928,58 1 708 735 477,47 12 405 122,36 1 696 330 355,11
INCOME APPROPRIATION 240 869 928,58 -240 869 928,58 0,00 0,00
DIVIDENDS PAID -150 000 000,00 -150 000 000,00 -150 000 000,00
MOVEMENT OF CAPITAL 0,00 0,00
OTHER MOVMENT 288 401 005,25 288 401 005,25 3 007 524,56 288 401 005,25
SITUATION AT THE CLOSING DATE OF FISCAL YEAR 2018
283 896 200,00 1 150 523 764,19 124 315 513,28 288 401 005,25 1 847 136 482,71 15 412 646,92 1 831 723 835,79
NATURE
GROSS AMOUNTAT THE
BEGINNING OF THE FISCAL
YEAR
INCREASE DECREASE
GROSS AMOUNTAT THE END OF
THE FISCAL YEARAcquisition
Product of the
company for itself
Transfer Disposal Withdrawal Transfer
FIXED ASSETS - - - - - - - -
*Preliminary Costs - - - - - - -
*Deferred Expenses Over Several Years - - - - - - - -
*’Bond Redemption Premium - - - - - - - -
INTAGIBLE ASSETS 1 148 587 408,44 215 423 417,87 - 4 631 199,52 - - 20 017 854,02 1 348 624 171,80
*Research and Development Assets 753 669 765,45 209 482 453,55 - 4 631 199,52 - - 19 500 000,00 948 283 418,51
* Patents,Trademarks, Similar Rights and assets
40 923 701,87 5 940 964,32 - - - - - 46 864 666,19
*GOODWILL 353 476 087,10 - - - - - - 353 476 087,10
*Other Intangible Assets 517 854,02 - - - - - 517 854,02 -
TANGIBLE ASSETS 2 211 213 714,03 304 737 249,98 - 145 221 168,06 57 712 955,05 6 144,00 129 834 513,56 2 473 618 519,46
* Land *Buildings 178 368 123,20 0,00 - 56 705 500,00 40 200 000,00 - - 194 873 623,20
*Constructions 592 312 084,98 102 690 483,83 - 39 993 064,11 16 067 519,17 - - 718 928 113,75
*Machinery, Equipment and Tools 648 252 964,65 78 027 911,05 - 3 652 257,22 805 822,31 - - 729 127 310,61
* Transport Equipment 1 535 494,77 62 365,18 - - 17 232,11 - - 1 580 627,84
* Furniture, Office Supplies and Miscellaneous
531 413 417,89 106 380 366,38 - 44 870 346,73 123 218,15 - - 682 540 912,85
* Other Tangible Assets 53 038 803,49 1 656 781,94 - - 337 041,86 6 144,00 - 54 352 399,57
* Tangible Assets in Progress 206 292 825,05 15 919 341,61 - - 162 121,45 - 129 834 513,56 92 215 531,65
TOTAL 3 359 801 122,47 520 160 667,85 - 149 852 367,58 57 712 955,05 6 144,00 149 852 367,58 3 822 242 691,26
FY 01/01/2018 to 12/31/2018
ANNUAL REPORT 201894

TABLE OF WRITE-OFFS
Cumulative Since Beginning of fiscal year
Fiscal Year Allocations
Depreciation of Retired Assets
Cumulative Depreciation at the End of fiscal year
1 2 3 4=1+2-3
FIXED ASSETS WRITE-OFFS - - - -
* Preliminary Costs - -
* Deferred Expenses Over Several Years - - - -
* Bond Redemption Premiums - - -
INTANGIBLE ASSETS 376 214 575,87 135 635 197,71 0,00 511 849 773,57
* INTANGIBLE ASSETS. 356 213 408,81 127 670 027,15 483 883 435,95
*Research and Development Assets - 0,00 0,00 -
*Patents, Trademarks, & Similar Rights and Assets 20 001 167,06 7 965 170,56 0,00 27 966 337,62
*Goodwill - 0,00 0,00 -
*Other Intangible Assets - 0,00 0,00 -
TANGIBLE ASSETS 609 662 114,41 141 433 215,53 1 901 852,39 749 193 477,55
* Land 0,00 0,00 0,00 0,00
* Buildings 86 542 667,87 26 079 515,44 957 001,06 111 665 182,25
* Machinery, Equipment and Tools 304 310 093,87 62 734 065,65 601 502,71 366 442 656,81
* Transport Equipment 1 162 657,73 151 061,36 2 006,68 1 311 712,41
* Furniture, Office Equipment and Miscellaneous 193 184 864,04 47 281 914,70 103 704,15 240 363 074,59
* Other Tangible Assets 24 461 830,90 5 186 658,38 237 637,79 29 410 851,49
TOTAL 985 876 690,28 277 068 413,24 1 901 852,39 1 261 043 251,12
FY 01/01/2018 to 12/31/2018
TABLE OF NON-CONSOLIDATED EQUITY INVESTMENTS
Issuing Company’sCorporate
Name
LINE OF BUSINESS
Registered Capital
% ofcapital
contribution
Aggregate Purchase Price
Net Carrying Amount
Extracts from the Company’s Recent Financial Statements
Outputs of the
Fiscal Year Closing With
the I.T.C.Closing Date Net position Net income
MUTANDIS INVESTMENT FUND 680 405 100,00 5% 56 520 000,00 56 520 000,00 31/12/2018 1 015 377 414,18 69 232 330,27 1 858 890,00
BERKANE PLAZA S.A.R.L
Construction And Property Management
100 000,00 67% 67 000,00 67 000,00 31/12/2018 0,00
AMETHIS FINANCE SCS SICAR
INVESTMENT FUND 53 679 938,92 53 679 938,92 31/12/2018 0,00
ARADEI CAPITAL HOLDING 811 273 800,00 57% 1 241 000 000,00 1 241 000 000,00 31/12/2018 1 691 576 826,07 64 688 600,57 65 307 331,00
SILAV REAL ESTATE DEVELOPMENT 300 000,00 100% 300 000,00 300 000,00 31/12/2018 300 000,00 0,00 0,00
RETAIL HOLDING AFRICA
RETAIL 255 001 200,00 0% 70 747,78 70 747,78 31/12/2018 246 558 940,33 -456 120,40 0,00
MOULAT EL KHEIR SA
management of business, industry, agriculture and civil or military services
2 600 000,00 23% 600 000,00 600 000,00 31/12/2018 2 220 717,50 -379 282,50 0,00
ARADI SUD real estate (for rent purposes) 300 000,00 100% 300 000,00 300 000,00 31/12/2018 300 000,00 0,00 0,00
LAAYOUNE LV
SUPERMARKET BUYING AND SELLING PRODUCTS OF DAILY CONSUMPTION
300 000,00 100% 300 000,00 300 000,00 31/12/2018 300 000,00 0,00 0,00
TOTAL 1 352 837 686,70 1 352 837 686,70 2 956 633 898,08 133 085 527,94 67 166 221,00
FY 01/01/2018 to 12/31/2018
ANNUAL REPORT 2018 95

TABLE OF ALLOWANCES
TYPE
Amount at the Beginningof the fiscal
year
ALLOCATIONS RECOVERY Amount at the end of the fiscal
yearOperating Financial Non Current Operating Financial Non
Current
1. Allowances for the Depreciation of Capital Assets
2. Regulated Provisions
3. Sustainable Provisions for Liabilities and Charges 2 243 777,72 1 456 611,59 - 3 232 119,82 141 060,35 -
385 296,99 6 406 151,79
SUB TOTAL (A) 2 243 777,72 1 456 611,59 - 3 232 119,82 141 060,35 - 385 296,99 6 406 151,79
4. Allowances for the Depreciation of Current Assets (excl. Cash)
27 660 244,92 1 491 389,57 - - 14 357 749,60 - - 14 793 884,89
5. Autres provisions pour risques et charges 1 129 022,65 - 946 116,14 3 000 000,00 966 017,66 - 4 109 121,13
6.Allowances for the Depreciation of Cash Accounts
SUB TOTAL (B) 28 789 267,57 1 491 389,57 946 116,14 3 000 000,00 14 357 749,60 966 017,66 - 18 903 006,02
TOTAL (A+B) 31 033 045,29 2 948 001,16 946 116,14 6 232 119,82 14 498 809,95 966 017,66 385 296,99 25 309 157,81
FY 01/01/2018 TO 31/12/2018
TABLE OF RECEIVABLES
RECEIVABLES TOTAL
BREAKDOWN BY MATURITY OTHER BREAKDOWNSAMOUNTSREPRE-SENTED
BY BILLS
MORE THANA YEAR
LESS THAN A YEAR
MATUREDAND
UNRECOVE-RED
CURRENCYAMOUNT
AMOUNTSFROM THE
GOVERNMENT AND
PUBLIC
AMOUNTS FROM
RELATEDCOMPANIES
FROM FIXED ASSETS 33 818 161,25 33 818 161,25 - - - - - -
* Fixed Loans 0,00
* Other Financial Receivables 33 818 161,25 33 818 161,25
FROM CURRENT ASSETS 1 563 892 227,87 - 1 563 892 227,87 - - 465 267 589,72 - -
* Suppliers Receivables, Ad-vances and Prepayments 101 677 705,27 101 677 705,27
* Customers and Related Accounts 827 986 287,52 827 986 287,52
* Personnel 15 233 247,36 15 233 247,36
* Government 465 267 589,72 465 267 589,72 465 267 589,72
* Partner Accounts 0,00 -
* Other Debtors 128 634 783,77 128 634 783,77
* Prepayment and Accrued Income 25 092 614,24 25 092 614,24
FY 01/01/2018 TO 31/12/2018
ANNUAL REPORT 201896

TABLE OF DEBTS
DEBTS TOTAL
BREAKDOWN BY MATURITY OTHER BREAKDOWNSAMOUNTS
REPRESENTED BY
BILLS OF EXCHANGE
MORE THAN A YEAR
LESS THAN A YEAR
MATUREDAND
UNPAID
AMOUNTIN
CURRENCY
AMOUNTSTO THE STATE
AND PUBLICORGANIZATIONS
AMOUNTSTO
RELATEDCOMPANIES
FROM FINANCING 2 307 390 075,63 1 139 239 782,33 1 168 150 293,30 - - - - -
* Bond Issues 1 500 000 000,00 469 800 000,00 1 030 200 000,00
* Other Financial Debts 807 390 075,63 669 439 782,33 137 950 293,30
FROM CURRENT LIABILITIES 3 350 783 860,30 - 3 350 783 860,30 - - 239 890 575,47 - -
* Suppliers and Related Accounts 3 039 239 729,91 3 039 239 729,91
* Creditor Customers, Advances and Prepayments 42 202 075,84 42 202 075,84
* Personnel 7 049 368,37 7 049 368,37
* Social Organizations 14 652 618,93 14 652 618,93 14 652 618,93
* Government 225 237 956,54 225 237 956,54 225 237 956,54
* Partner Accounts 161 819,65 161 819,65
* Other Receivables 4 895 336,14 4 895 336,14
* Accrual and Deferred Income 17 344 954,92 17 344 954,92
FY 01/01/2018 TO 31/12/2018
TABLE OF SECURITIES GIVEN OR RECEIVED
OFF-BALANCE-SHEET COMMITMENTS
SECURITIES RECEIVABLES AND PAYABLES
AMOUNTCOVERED BY THE SECURITY
TYPEDATE AND
PLACE OF RE-GISTRATION
ITEM (2)(3) NET BOOK VALUE OF THE SECURITY GIVEN ON THE CLOSING DATE
SECURITIES GIVEN 281 111 874,34 (2)(3) RABAT BANKS
SECURITIES RECEIVED N/A
COMMITMENTS GIVEN AMOUNT FISCAL YEAR AMOUNT PREVIOUS FISCAL YEAR
* Endorsements and Guarantees* Commitments in Terms of Pension, Retirement, and Similar Obligations* Other commitments Given
N/A N/A
COMMITMENTS RECEIVED AMOUNT FISCAL YEAR AMOUNT PREVIOUS FISCAL YEAR
* Endorsements and Guarantees* Other Commitments Received N/A N/A
FY 01/01/2018 TO 31/12/2018
Exercice du 01/01/2018 Au 31/12/2018
ANNUAL REPORT 2018 97

STATUTORY AUDITORS’ REPORTS
APPENDIX 3
ANNUAL REPORT 201898

ANNUAL REPORT 2018 99

ANNUAL REPORT 2018100


