36
Annual Minnesota Transportation Performance Report 2015 2013

Annual Minnesota Transportation Performance Report2015
2013

Cover photo: David Gonzalez, MnDOT
Annual Minnesota Transportation Performance Report 2015
Prepared by:
Minnesota Department of Transportation
Office of Transportation System Management
395 John Ireland Boulevard
St Paul, MN 55155
October 2016
http://www.dot.state.mn.us/measures/
Front Matter
October 2016
Dear Citizens of Minnesota,
I am pleased to share with you this seventh Annual Minnesota Transportation Performance Report. This 2015 report describes trends in the condition and service levels provided by Minnesota’s transportation systems and tracks progress toward the six objectives laid out in the Minnesota GO Statewide Multimodal Transportation Plan.
2015 performance results illustrate persistent challenges across a number of performance areas. Although state highways are meeting or nearly meeting asset condition targets today, pavement ride quality is expected to decline significantly over the next four years. Traffic fatalities and serious injuries, still low by historical standards, increased sharply in 2015. Metro-area freeway congestion reached an all-time high with 23.4 percent of the system congested at some point on a typical weekday.
These and other results detailed in this report are concerning, and in many cases they point to the need for new and sustained sources of funding for transportation investment. Due to the advanced age of Minnesota’s transportation system and the effects of inflation on purchasing power, MnDOT’s needs are significantly outpacing existing revenue sources. This looming challenge provides an important context for evaluating current performance – absent new sources of sustained revenue, many of the trends reported here are likely to worsen.
That said, this report also points to areas where system performance is being sustained at a high level. State highway bridge condition, although not quite achieving target, improved and is expected to meet targets next year. MnDOT also met its snow and ice clearance time goals 89 percent of the time last winter, the highest frequency ever recorded by that measure. We are proud of these accomplishments and the dedication they reflect.
This year’s report is the first Annual Minnesota Transportation Performance Report to include measures of women and minority involvement in the construction of Minnesota’s highways. These measures (detailed on page 9 of the report) show that more work is needed to further diversify the state’s transportation workforce and the share of MnDOT administered federal highway construction funds going to women and minority owned businesses. Achieving these goals is a key area of focus for MnDOT through an internal initiative focused on earning customer trust.
The success of the transportation system depends on an informed and engaged public. I hope you find this report valuable, and I look forward to working with you to address the challenges detailed in the pages that follow. With your help, we can build and maintain a transportation system that achieves the Minnesota GO vision.
Sincerely,
Charles A. Zelle
Commissioner

ContentsIntroduction .......................................................................................................................................... 1
2015 Performance Highlights .............................................................................................................. 3
2015 Minnesota Transportation Results Scorecard ........................................................................... 5
Public Trust ........................................................................................................................................... 7
Civil Rights: Workforce and Small Business Participation ................................................................. 9
Traveler Safety .................................................................................................................................... 11
Pavement Condition ............................................................................................................................. 13
Bridge Condition .................................................................................................................................. 15
Twin Cities Freeway Congestion ......................................................................................................... 17
Snow & Ice Control .............................................................................................................................. 19
Freight Mode Share ............................................................................................................................. 20
Air Transportation ................................................................................................................................ 22
Twin Cities Transit Ridership ............................................................................................................... 24
Greater Minnesota Transit Ridership .................................................................................................. 25
Bicycle Use ........................................................................................................................................... 26
Pedestrian Accessibility ...................................................................................................................... 27
Fuel Use ............................................................................................................................................... 29
Transportation Systems in Minnesota ................................................................................................ 30
Annual Minnesota Transportation Performance Report: 2015 Page 1
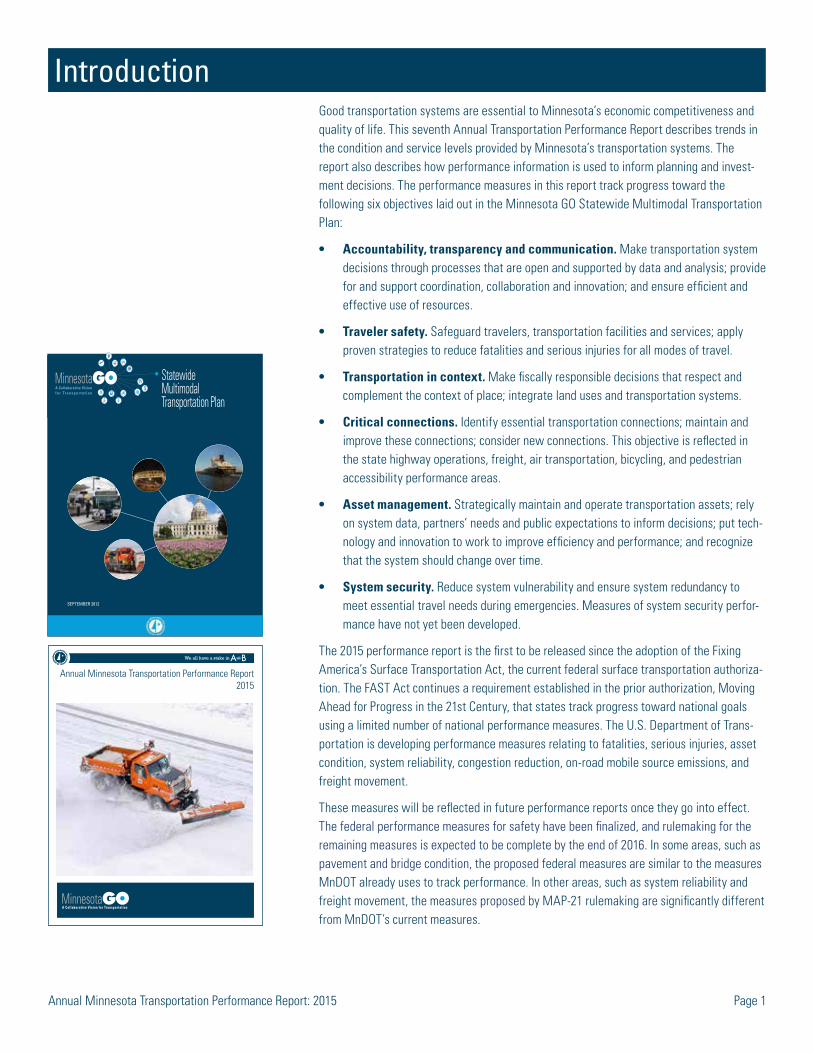
IntroductionGood transportation systems are essential to Minnesota’s economic competitiveness and quality of life. This seventh Annual Transportation Performance Report describes trends in the condition and service levels provided by Minnesota’s transportation systems. The report also describes how performance information is used to inform planning and invest-ment decisions. The performance measures in this report track progress toward the following six objectives laid out in the Minnesota GO Statewide Multimodal Transportation Plan:
• Accountability, transparency and communication. Make transportation system decisions through processes that are open and supported by data and analysis; provide for and support coordination, collaboration and innovation; and ensure efficient and effective use of resources.
• Traveler safety. Safeguard travelers, transportation facilities and services; apply proven strategies to reduce fatalities and serious injuries for all modes of travel.
• Transportation in context. Make fiscally responsible decisions that respect and complement the context of place; integrate land uses and transportation systems.
• Critical connections. Identify essential transportation connections; maintain and improve these connections; consider new connections. This objective is reflected in the state highway operations, freight, air transportation, bicycling, and pedestrian accessibility performance areas.
• Asset management. Strategically maintain and operate transportation assets; rely on system data, partners’ needs and public expectations to inform decisions; put tech-nology and innovation to work to improve efficiency and performance; and recognize that the system should change over time.
• System security. Reduce system vulnerability and ensure system redundancy to meet essential travel needs during emergencies. Measures of system security perfor-mance have not yet been developed.
The 2015 performance report is the first to be released since the adoption of the Fixing America’s Surface Transportation Act, the current federal surface transportation authoriza-tion. The FAST Act continues a requirement established in the prior authorization, Moving Ahead for Progress in the 21st Century, that states track progress toward national goals using a limited number of national performance measures. The U.S. Department of Trans-portation is developing performance measures relating to fatalities, serious injuries, asset condition, system reliability, congestion reduction, on-road mobile source emissions, and freight movement.
These measures will be reflected in future performance reports once they go into effect. The federal performance measures for safety have been finalized, and rulemaking for the remaining measures is expected to be complete by the end of 2016. In some areas, such as pavement and bridge condition, the proposed federal measures are similar to the measures MnDOT already uses to track performance. In other areas, such as system reliability and freight movement, the measures proposed by MAP-21 rulemaking are significantly different from MnDOT’s current measures.
SEPTEMBER 2012
Annual Minnesota Transportation Performance Report2015
2013

Annual Minnesota Transportation Performance Report: 2015 Page 2
Minnesota’s Transportation System
Minnesota’s transportation system — summarized on page 30 — is operated by MnDOT and many other partner agencies. These partner agencies include the Metropolitan Council, other metropolitan and regional planning organizations, city and county governments, the Metropolitan Airports Commission, the Department of Public Safety, railroads, port operators, the Federal Aviation Administration, U.S. Army of Corps of Engineers, local government airports, port authorities, and transit operators.
2015 Minnesota Transportation Results Scorecard
The 2015 Minnesota Transportation Results Scorecard on pages five and six displays key performance measures that MnDOT uses to track system performance. MnDOT has primary responsibility for measures in rows that have the MnDOT logo in the far right column.
Measures with performance targets have a green, yellow or red symbol evaluating results. MnDOT uses performance targets to calculate needed investment levels, stimulate innova-tion and guide decision-making. These targets are set through public planning processes that incorporate numerous factors, including engineering standards and other technical criteria, historical experience and assessments of stakeholder expectations. In a few select cases, the scorecard includes a short description of a measure’s outlook. This is done for measures that MnDOT can predict future performance based on planned investment and well-founded assumptions about factors such as deterioration and usage.
Minnesota’s transportation system made performance gains in several areas in 2015. At the same time, 2015 also saw limited progress on a number of persistent challenges. These mixed results underscore the fluid and complex nature of transportation system perfor-mance. While there are many successes to point to, growing needs and limited resources continue to pose significant challenges and force difficult trade-offs across competing priorities.
Annual Minnesota Transportation Performance Report: 2015 Page 3
2015 Performance Highlights
Performance gains
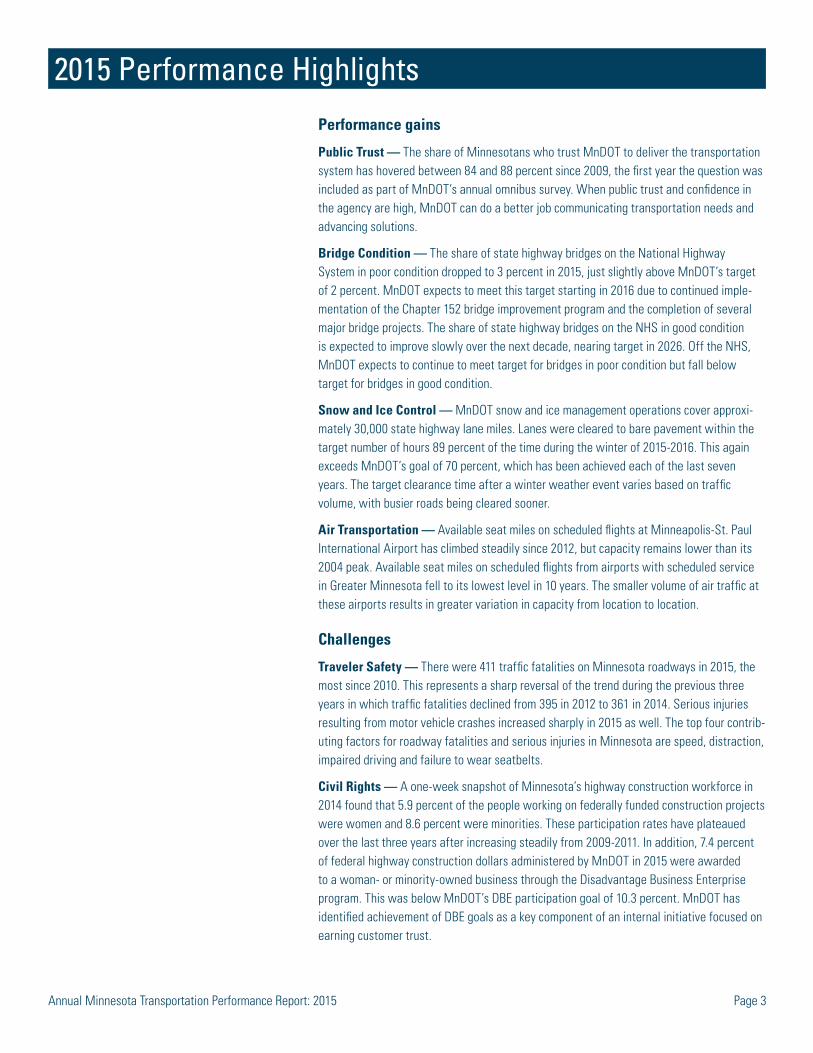
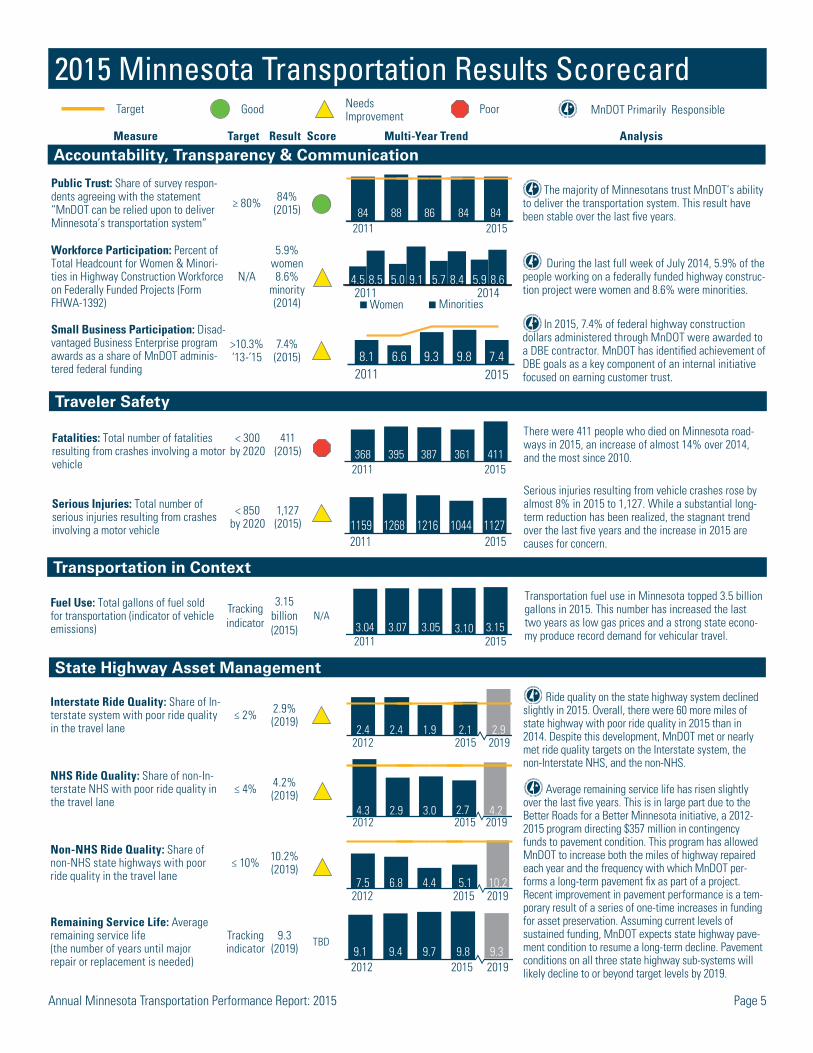
Public Trust — The share of Minnesotans who trust MnDOT to deliver the transportation system has hovered between 84 and 88 percent since 2009, the first year the question was included as part of MnDOT’s annual omnibus survey. When public trust and confidence in the agency are high, MnDOT can do a better job communicating transportation needs and advancing solutions.
Bridge Condition — The share of state highway bridges on the National Highway System in poor condition dropped to 3 percent in 2015, just slightly above MnDOT’s target of 2 percent. MnDOT expects to meet this target starting in 2016 due to continued imple-mentation of the Chapter 152 bridge improvement program and the completion of several major bridge projects. The share of state highway bridges on the NHS in good condition is expected to improve slowly over the next decade, nearing target in 2026. Off the NHS, MnDOT expects to continue to meet target for bridges in poor condition but fall below target for bridges in good condition.
Snow and Ice Control — MnDOT snow and ice management operations cover approxi-mately 30,000 state highway lane miles. Lanes were cleared to bare pavement within the target number of hours 89 percent of the time during the winter of 2015-2016. This again exceeds MnDOT’s goal of 70 percent, which has been achieved each of the last seven years. The target clearance time after a winter weather event varies based on traffic volume, with busier roads being cleared sooner.
Air Transportation — Available seat miles on scheduled flights at Minneapolis-St. Paul International Airport has climbed steadily since 2012, but capacity remains lower than its 2004 peak. Available seat miles on scheduled flights from airports with scheduled service in Greater Minnesota fell to its lowest level in 10 years. The smaller volume of air traffic at these airports results in greater variation in capacity from location to location.
Challenges
Traveler Safety — There were 411 traffic fatalities on Minnesota roadways in 2015, the most since 2010. This represents a sharp reversal of the trend during the previous three years in which traffic fatalities declined from 395 in 2012 to 361 in 2014. Serious injuries resulting from motor vehicle crashes increased sharply in 2015 as well. The top four contrib-uting factors for roadway fatalities and serious injuries in Minnesota are speed, distraction, impaired driving and failure to wear seatbelts.
Civil Rights — A one-week snapshot of Minnesota’s highway construction workforce in 2014 found that 5.9 percent of the people working on federally funded construction projects were women and 8.6 percent were minorities. These participation rates have plateaued over the last three years after increasing steadily from 2009-2011. In addition, 7.4 percent of federal highway construction dollars administered by MnDOT in 2015 were awarded to a woman- or minority-owned business through the Disadvantage Business Enterprise program. This was below MnDOT’s DBE participation goal of 10.3 percent. MnDOT has identified achievement of DBE goals as a key component of an internal initiative focused on earning customer trust.

Annual Minnesota Transportation Performance Report: 2015 Page 4
Pavement Condition — MnDOT has met or nearly met targets for state highway ride quality on Interstates, the non-Interstate NHS and the non-NHS each of the last four years. This result is largely due to the Better Roads for a Better Minnesota initiative, a 2012-2015 program directing $357 million in contingency funds to pavement condition. However, assuming current levels of sustained funding, ride quality is expected to decline steadily through the end of the decade.
Twin Cities Freeway Congestion — The extent of peak period congestion increased in 2015, from 21.1 percent of the system to 23.4 percent. This result represents a higher level of congestion than has been typically been experienced during the last decade. MnDOT expects congestion to remain the same or increase as the region continues to grow. Since 2010, MnDOT’s strategy has shifted from reducing congestion toward providing alterna-tives to congested travel.
Twin Cities Metro Area Transit Ridership — Metro area transit service providers recorded 98.8 million rides in 2015. Although annual transit ridership remains on track to meet the Metropolitan Council’s goal of doubling 2003 ridership levels by 2030, year-over-year growth fell well short of the increase needed to keep pace with the 2030 goal.
Greater Minnesota Transit Ridership — Transit ridership in Greater Minnesota reached a record high in 2015 with 12.2 million rides. Total bus service hours also increased from 1.17 million hours to 1.24 million. This level of service remains well short of the pace needed to meet the legislatively directed targets of 19.8 million passenger trips and 1.9 million hours of service by 2025.
Pedestrian Accessibility — In 2013, MnDOT developed a sidewalk inventory that includes information about condition, width and slope. The inventory showed that 46 percent of state highway sidewalk miles are in compliance with the Americans with Disabil-ities Act design standards. Additionally, only 24 percent of inventoried state highway curb ramps are completely ADA compliant. Although progress on sidewalks and curb ramps has been limited, MnDOT has increased the share of eligible state highway intersections with accessible pedestrian signals to 40 percent. Based on normal signal replacement cycles, MnDOT expects to achieve 100 percent APS compliance by 2030.
Annual Minnesota Transportation Performance Report: 2015 Page 5
Public Trust: Share of survey respon-dents agreeing with the statement “MnDOT can be relied upon to deliver Minnesota’s transportation system”
≥ 80% 84% (2015)
2011 201584 84848688
The majority of Minnesotans trust MnDOT’s ability to deliver the transportation system. This result have been stable over the last five years.
Workforce Participation: Percent of Total Headcount for Women & Minori-ties in Highway Construction Workforce on Federally Funded Projects (Form FHWA-1392)
N/A
5.9% women8.6%
minority(2014)
4.5 8.5 5.0 9.1 5.7 8.4 5.9 8.62011 2014
Women Minorities
During the last full week of July 2014, 5.9% of the people working on a federally funded highway construc-tion project were women and 8.6% were minorities.
Small Business Participation: Disad-vantaged Business Enterprise program awards as a share of MnDOT adminis-tered federal funding
>10.3%‘13-’15
7.4% (2015)
In 2015, 7.4% of federal highway construction dollars administered through MnDOT were awarded to a DBE contractor. MnDOT has identified achievement of DBE goals as a key component of an internal initiative focused on earning customer trust.
Fatalities: Total number of fatalities resulting from crashes involving a motor vehicle
< 300 by 2020
411 (2015)
There were 411 people who died on Minnesota road-ways in 2015, an increase of almost 14% over 2014, and the most since 2010.
Serious Injuries: Total number of serious injuries resulting from crashes involving a motor vehicle
< 850 by 2020
1,127 (2015)
Serious injuries resulting from vehicle crashes rose by almost 8% in 2015 to 1,127. While a substantial long-term reduction has been realized, the stagnant trend over the last five years and the increase in 2015 are causes for concern.
Transportation in Context
2015 Minnesota Transportation Results ScorecardMnDOT Primarily ResponsibleGoodTarget Needs
ImprovementPoor
Measure Target Result Score Multi-Year Trend Analysis
Accountability, Transparency & Communication
Traveler Safety
State Highway Asset Management
Interstate Ride Quality: Share of In-terstate system with poor ride quality in the travel lane
≤ 2% 2.9% (2019)
2.4 2.4 1.9 2.1 2.9201920152012
Ride quality on the state highway system declined slightly in 2015. Overall, there were 60 more miles of state highway with poor ride quality in 2015 than in 2014. Despite this development, MnDOT met or nearly met ride quality targets on the Interstate system, the non-Interstate NHS, and the non-NHS.
Average remaining service life has risen slightly over the last five years. This is in large part due to the Better Roads for a Better Minnesota initiative, a 2012-2015 program directing $357 million in contingency funds to pavement condition. This program has allowed MnDOT to increase both the miles of highway repaired each year and the frequency with which MnDOT per-forms a long-term pavement fix as part of a project. Recent improvement in pavement performance is a tem-porary result of a series of one-time increases in funding for asset preservation. Assuming current levels of sustained funding, MnDOT expects state highway pave-ment condition to resume a long-term decline. Pavement conditions on all three state highway sub-systems will likely decline to or beyond target levels by 2019.
NHS Ride Quality: Share of non-In-terstate NHS with poor ride quality in the travel lane
≤ 4% 4.2% (2019)
Non-NHS Ride Quality: Share of non-NHS state highways with poor ride quality in the travel lane
≤ 10% 10.2% (2019)
Remaining Service Life: Average remaining service life (the number of years until major repair or replacement is needed)
Tracking indicator
9.3 (2019) TBD
9.39.1 9.4 9.7 9.82012 2015 2019
Fuel Use: Total gallons of fuel sold for transportation (indicator of vehicle emissions)
Tracking indicator
3.15 billion (2015)
N/A
201520113.04 3.07 3.05 3.10 3.15
Transportation fuel use in Minnesota topped 3.5 billion gallons in 2015. This number has increased the last two years as low gas prices and a strong state econo-my produce record demand for vehicular travel.
10.27.5 6.8 4.4 5.12012 2015 2019
6.68.1 9.3 9.8 7.42011 2015
4.3 2.9 3.0 2.7 4.22012 2015 2019
368 395 387 361 4112011 2015
1044 11271159 1268 12162011 2015

Annual Minnesota Transportation Performance Report: 2015 Page 6
Critical Connections
State Highway Asset Management
NHS Bridge Condition: Share of NHS bridges in poor condition as a percent of total bridge deck area
≤ 2% 1.1% (2020)
2012 2015 20204.7 3.3 4.5 3.0 1.1
The share of NHS bridges in poor condition dropped to 3% in 2015, just slightly above MnDOT’s target of 2%. The share of non-NHS bridges in poor condition increased but remains well below target. According to 2015 National Bridge Inventory data, Min-nesota has the 13th-lowest percentage of state-owned bridge deck area in poor condition.
MnDOT expects to meet targets for NHS and non-NHS bridges in poor condition starting in 2016 due to the continued implementation of the Chapter 152 bridge improvement program and the completion of several major bridge projects.
Non-NHS Bridge Condition: Share of non-NHS state highway bridges in poor condition as a per-cent of total bridge deck area
≤ 8% 0.7% (2020)
2.1 3.1 1.3 3.1 0.72012 2015 2020
Measure Target Result Score Multi-Year Trend Analysis
Twin Cities Freeway Congestion: % of metro-area freeway miles be-low 45 mph in AM or PM peak
Tracking indicator
23.4% (2015)
2015201121.0 21.4 19.9 21.1 23.4
The extent of peak period congestion reached a new high in 2015, with 23.4% of the system congest-ed. Congestion is expected to increase as economic activity increases and the region continues to grow.
Snow and Ice Control: Frequency of achieving bare lanes within tar-geted number of hours after a winter weather event
≥ 70% 89%(‘15-’16) 88 82 79 87 89
11-12 15-16
MnDOT cleared lanes to bare pavement within the target number of hours 89% of the time during the winter of 2015-2016, the highest frequency ever recorded by this measure. MnDOT has achieved its snow and ice clearance goals each of the last seven years.
Freight Mode Share (by weight): Total domestic shipments to, from or between Minnesota locations in tons
Tracking indicator
696 million (2015)
N/A
Truck-only trips remain the primary means of shipping goods by value, but the share moved by other modes is increasing. Shipments by weight have shifted from water to rail, truck and pipeline. Trucks tend to carry more valuable freight and make last-mile trips, while long-distance shipments of heavier, less valuable goods tend to be made by other modes.
TruckMultiple modes Pipeline
Rail WaterOther
Freight Mode Share (by value): Total domestic shipments to, from or between Minnesota locations in current dollars
Tracking indicator
$552 billion (2015)
N/A
Air Transportation: Number of available seat miles (ASM) offered on scheduled flights from MSP Airport
Tracking indicator
21.1 billion (2015)
N/A
2015201120.4 21.119.4 19.1 19.8
Available seat miles grew for the third straight year to over 21 billion, the highest number of available seat miles since 2007.
Twin Cities Transit Ridership: Boardings recorded by public transit providers serving metro-area coun-ties
145-150 million
by 2030
98.8 million (2015)
Metro-area transit ridership remains on track to meet the Met Council’s goal of doubling 2003 ridership levels by 2030, but year-over-year growth is slowing. Ridership growth is expected to continue as develop-ment occurs along key transitways and transit service improves.
Greater Minnesota Transit Rider-ship: Boardings recorded by public transit providers serving Greater Minnesota
15 million by 2015
12.2 million (2015)
2015201111.5 11.6 11.9 12.1 12.2
Greater Minnesota transit service providers recorded 12.2 million rides in 2015, well short of the 15 million rides needed to meet a legislatively established goal. Continued growth is expected, but not at a pace suffi-cient to reach 2025 goals.
Bicycling: % of survey respondents who bicycled at least once a week during the bicycling season (April - October)
Tracking indicator
21% (2015) N/A
2015201121 20 25 18 21
After a drop in 2014, the percentage of Minnesotans who bicycle at least once a week grew by three percentage points in 2015. This metric has remained relatively steady over the last 10 years.
Pedestrian Accessibility: State highway sidewalk miles that are com-pliant with ADA requirements
Tracking indicator
46% (2013) N/A 336 sidewalk miles (46%) compliant
(only one year of data available)
MnDOT completed a condition and ADA com-pliance assessment of sidewalks along its right of way in 2013. Of 620 miles of sidewalk, 46% were compliant.
20152012
634 658 694 696
20152012
$503 $519 $536 $552
93.9 93.9 94.3 97.6 98.82011 2015
Annual Minnesota Transportation Performance Report: 2015 Page 7
Public Trust Accountability, Transparency & Communication
Measure explanation:
Once a year, MnDOT conducts a survey to measure public attitudes about MnDOT and MnDOT-provided services. Since 2009, this survey has included questions assessing public trust. Respondents are asked to indicate their level of agreement with a small number of statements. For example, survey respondents are asked the extent to which they agree with the statement: “MnDOT can be relied upon to deliver Minnesota’s trans-portation system.”
System definition:
2015 survey results are based on 790 telephone interviews (501 land-line inter-views and 289 cell phone interviews) and 559 web-based surveys from a recruited, representative sample of adult Minnesota residents. Survey participants are identified through random, statistically valid sampling techniques. Geographic quotas and other demographic variables are enforced so that the sample population is representative of the state as a whole. The sample is large enough to produce estimates that are within 5 percent of the actual population data 95 percent of the time.
Why this is important:
Public trust is the lifeblood of an effective public agency. The more trust Minneso-tans have in MnDOT’s ability to deliver the transportation system, the more successful MnDOT will be in communicating needs and advancing solutions.
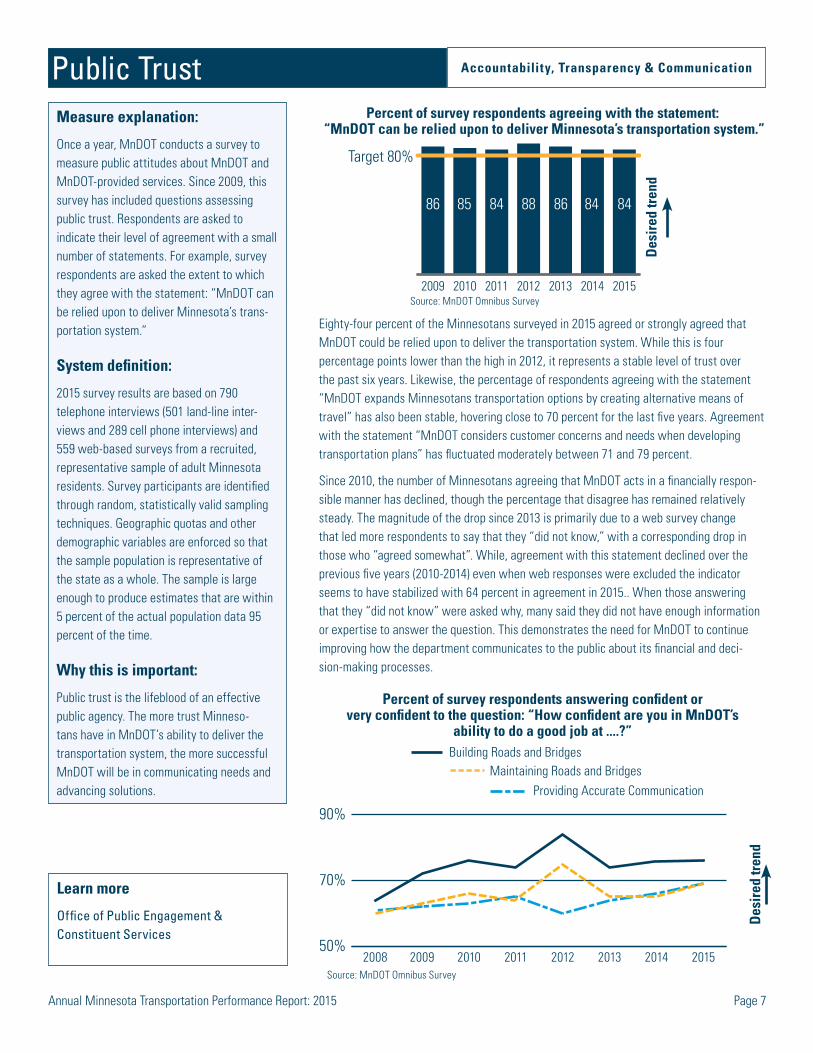
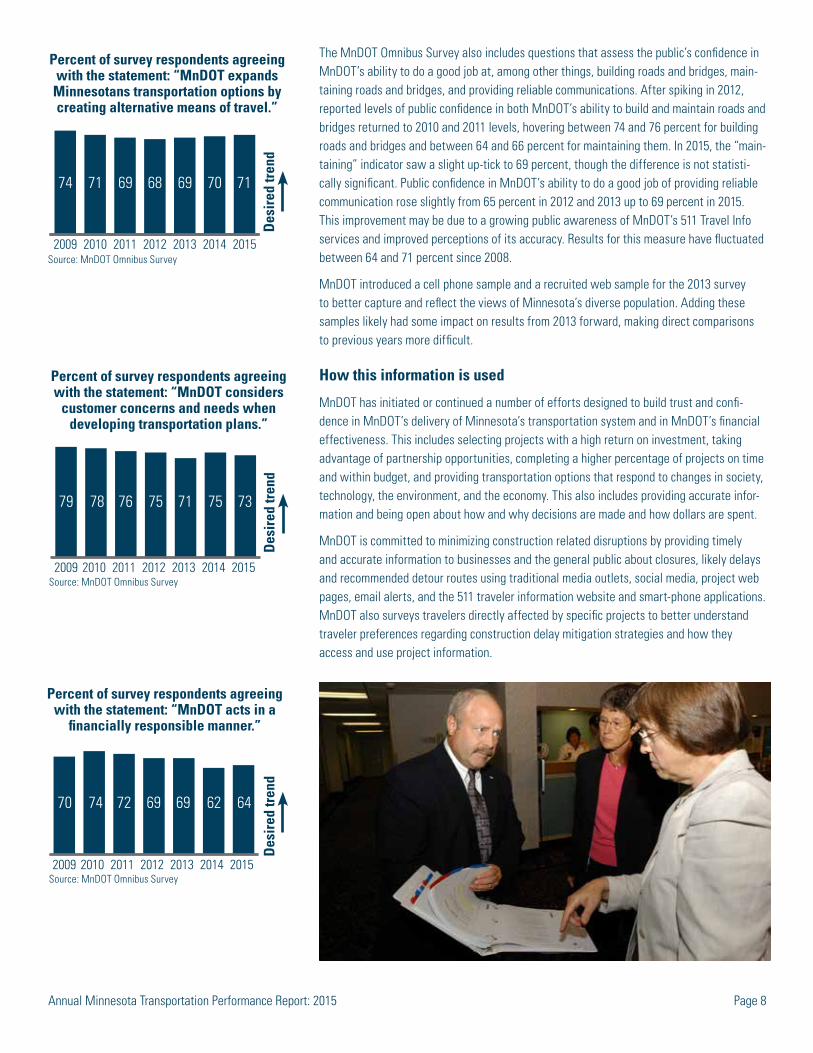
Eighty-four percent of the Minnesotans surveyed in 2015 agreed or strongly agreed that MnDOT could be relied upon to deliver the transportation system. While this is four percentage points lower than the high in 2012, it represents a stable level of trust over the past six years. Likewise, the percentage of respondents agreeing with the statement “MnDOT expands Minnesotans transportation options by creating alternative means of travel” has also been stable, hovering close to 70 percent for the last five years. Agreement with the statement “MnDOT considers customer concerns and needs when developing transportation plans” has fluctuated moderately between 71 and 79 percent.
Since 2010, the number of Minnesotans agreeing that MnDOT acts in a financially respon-sible manner has declined, though the percentage that disagree has remained relatively steady. The magnitude of the drop since 2013 is primarily due to a web survey change that led more respondents to say that they “did not know,” with a corresponding drop in those who “agreed somewhat”. While, agreement with this statement declined over the previous five years (2010-2014) even when web responses were excluded the indicator seems to have stabilized with 64 percent in agreement in 2015.. When those answering that they “did not know” were asked why, many said they did not have enough information or expertise to answer the question. This demonstrates the need for MnDOT to continue improving how the department communicates to the public about its financial and deci-sion-making processes.
Percent of survey respondents agreeing with the statement: “MnDOT can be relied upon to deliver Minnesota’s transportation system.”
2015201420132012201120102009
86 85 8884 848486
Target 80%
Des
ired
tren
d
Source: MnDOT Omnibus Survey
Percent of survey respondents agreeing with the statement: “MnDOT expands
Minnesotans transportation options by creating alternative means of travel.”
2015201420132012201120102009
74 71 69 68 69 70 71
Des
ired
tren
d
Percent of survey respondents agreeing with the statement: “MnDOT considers
customer concerns and needs when developing transportation plans.”
Source: MnDOT Omnibus Survey2015201420132012201120102009
79 78 76 75 71 75 73
Des
ired
tren
d
Percent of survey respondents agreeing with the statement: “MnDOT acts in a
financially responsible manner.”
Source: MnDOT Omnibus Survey2015201420132012201120102009
70 74 72 69 69 62 64
Learn more
Office of Public Engagement & Constituent Services
Des
ired
tren
d
Source: MnDOT Omnibus Survey
Source: MnDOT Omnibus Survey
The MnDOT Omnibus Survey also includes questions that assess the public’s confidence in MnDOT’s ability to do a good job at, among other things, building roads and bridges, main-taining roads and bridges, and providing reliable communications. After spiking in 2012, reported levels of public confidence in both MnDOT’s ability to build and maintain roads and bridges returned to 2010 and 2011 levels, hovering between 74 and 76 percent for building roads and bridges and between 64 and 66 percent for maintaining them. In 2015, the “main-taining” indicator saw a slight up-tick to 69 percent, though the difference is not statisti-cally significant. Public confidence in MnDOT’s ability to do a good job of providing reliable communication rose slightly from 65 percent in 2012 and 2013 up to 69 percent in 2015. This improvement may be due to a growing public awareness of MnDOT’s 511 Travel Info services and improved perceptions of its accuracy. Results for this measure have fluctuated between 64 and 71 percent since 2008.
MnDOT introduced a cell phone sample and a recruited web sample for the 2013 survey to better capture and reflect the views of Minnesota’s diverse population. Adding these samples likely had some impact on results from 2013 forward, making direct comparisons to previous years more difficult.
How this information is used
MnDOT has initiated or continued a number of efforts designed to build trust and confi-dence in MnDOT’s delivery of Minnesota’s transportation system and in MnDOT’s financial effectiveness. This includes selecting projects with a high return on investment, taking advantage of partnership opportunities, completing a higher percentage of projects on time and within budget, and providing transportation options that respond to changes in society, technology, the environment, and the economy. This also includes providing accurate infor-mation and being open about how and why decisions are made and how dollars are spent.
MnDOT is committed to minimizing construction related disruptions by providing timely and accurate information to businesses and the general public about closures, likely delays and recommended detour routes using traditional media outlets, social media, project web pages, email alerts, and the 511 traveler information website and smart-phone applications. MnDOT also surveys travelers directly affected by specific projects to better understand traveler preferences regarding construction delay mitigation strategies and how they access and use project information.
Percent of survey respondents answering confident or very confident to the question: “How confident are you in MnDOT’s
ability to do a good job at ....?”Building Roads and Bridges
Maintaining Roads and BridgesProviding Accurate Communication
50%
70%
90%
20152014201320122011201020092008
Des
ired
tren
d
Annual Minnesota Transportation Performance Report: 2015 Page 8
Eighty-four percent of the Minnesotans surveyed in 2015 agreed or strongly agreed that MnDOT could be relied upon to deliver the transportation system. While this is four percentage points lower than the high in 2012, it represents a stable level of trust over the past six years. Likewise, the percentage of respondents agreeing with the statement “MnDOT expands Minnesotans transportation options by creating alternative means of travel” has also been stable, hovering close to 70 percent for the last five years. Agreement with the statement “MnDOT considers customer concerns and needs when developing transportation plans” has fluctuated moderately between 71 and 79 percent.
Since 2010, the number of Minnesotans agreeing that MnDOT acts in a financially respon-sible manner has declined, though the percentage that disagree has remained relatively steady. The magnitude of the drop since 2013 is primarily due to a web survey change that led more respondents to say that they “did not know,” with a corresponding drop in those who “agreed somewhat”. While, agreement with this statement declined over the previous five years (2010-2014) even when web responses were excluded the indicator seems to have stabilized with 64 percent in agreement in 2015.. When those answering that they “did not know” were asked why, many said they did not have enough information or expertise to answer the question. This demonstrates the need for MnDOT to continue improving how the department communicates to the public about its financial and deci-sion-making processes.
Percent of survey respondents agreeing with the statement: “MnDOT can be relied upon to deliver Minnesota’s transportation system.”
2015201420132012201120102009
86 85 8884 848486
Target 80%
Des
ired
tren
dSource: MnDOT Omnibus Survey
Percent of survey respondents agreeing with the statement: “MnDOT expands
Minnesotans transportation options by creating alternative means of travel.”
2015201420132012201120102009
74 71 69 68 69 70 71
Des
ired
tren
d
Percent of survey respondents agreeing with the statement: “MnDOT considers
customer concerns and needs when developing transportation plans.”
Source: MnDOT Omnibus Survey2015201420132012201120102009
79 78 76 75 71 75 73
Des
ired
tren
d
Percent of survey respondents agreeing with the statement: “MnDOT acts in a
financially responsible manner.”
Source: MnDOT Omnibus Survey2015201420132012201120102009
70 74 72 69 69 62 64
The MnDOT Omnibus Survey also includes questions that assess the public’s confidence in MnDOT’s ability to do a good job at, among other things, building roads and bridges, main-taining roads and bridges, and providing reliable communications. After spiking in 2012, reported levels of public confidence in both MnDOT’s ability to build and maintain roads and bridges returned to 2010 and 2011 levels, hovering between 74 and 76 percent for building roads and bridges and between 64 and 66 percent for maintaining them. In 2015, the “main-taining” indicator saw a slight up-tick to 69 percent, though the difference is not statisti-cally significant. Public confidence in MnDOT’s ability to do a good job of providing reliable communication rose slightly from 65 percent in 2012 and 2013 up to 69 percent in 2015. This improvement may be due to a growing public awareness of MnDOT’s 511 Travel Info services and improved perceptions of its accuracy. Results for this measure have fluctuated between 64 and 71 percent since 2008.
MnDOT introduced a cell phone sample and a recruited web sample for the 2013 survey to better capture and reflect the views of Minnesota’s diverse population. Adding these samples likely had some impact on results from 2013 forward, making direct comparisons to previous years more difficult.
How this information is used
MnDOT has initiated or continued a number of efforts designed to build trust and confi-dence in MnDOT’s delivery of Minnesota’s transportation system and in MnDOT’s financial effectiveness. This includes selecting projects with a high return on investment, taking advantage of partnership opportunities, completing a higher percentage of projects on time and within budget, and providing transportation options that respond to changes in society, technology, the environment, and the economy. This also includes providing accurate infor-mation and being open about how and why decisions are made and how dollars are spent.
MnDOT is committed to minimizing construction related disruptions by providing timely and accurate information to businesses and the general public about closures, likely delays and recommended detour routes using traditional media outlets, social media, project web pages, email alerts, and the 511 traveler information website and smart-phone applications. MnDOT also surveys travelers directly affected by specific projects to better understand traveler preferences regarding construction delay mitigation strategies and how they access and use project information.
Percent of survey respondents answering confident or very confident to the question: “How confident are you in MnDOT’s
ability to do a good job at ....?”Building Roads and Bridges
Maintaining Roads and BridgesProviding Accurate Communication
50%
70%
90%
20152014201320122011201020092008
Des
ired
tren
d

Annual Minnesota Transportation Performance Report: 2015 Page 9
Accountability, Transparency
& Communication
Measure explanation:
The Percent of Total Headcount for Women & Minorities in Hwy Construction Workforce on Federally Funded Projects measures women and minorities as a share of the total number of people employed by contractors on federally funded highway construction projects during the last full week of July each year.
The federal Disadvantaged Business Enter-prises (DBE), state Targeted Group Business (TGB) and State Veterans (VET) programs set goals for certified small business partic-ipation and monitors the performance of contractors towards achieving the goal on applicable MnDOT contracts. The participa-tion goal is a percentage of the total value of the contract. The goal considers the location, scope of work and availability of small business firms.
System definition:
Workforce reporting is based on MnDOT contracts and federally funded contracts administered by local units of government.
DBE Participation is based on federally funded MnDOT contracts, contracts admin-istered by local units of government, and professional/technical contracts.
TGB/VET Small Business Participation is based on MnDOT state-funded construc-tion and professional/technical contracts.
Why this is important:
Workforce and Training programs assist Minnesota in maintaining a competent workforce available to meet highway heavy construction needs, and ensures equal oppor-tunity for employment in the construction trades on state and federally funded projects regardless of race, gender, ethnicity, sexual orientation, age, religion, marital status and status with regard to public assistance.
MnDOT’s Certified Small Business programs operate to create a level playing field to ensure women- and minority-owned busi-nesses have the opportunity to participate in highway construction contracts.
Des
ired
tren
d
The Federal Highway Administration On-the-Job Training policy requires MnDOT to develop apprenticeship and training programs targeted at the development and promotion of women, minorities and disadvantaged persons into journey-level positions. This measure represents the number of trainees employed by contractors working on highway construc-tion each calendar year.
Source: Title VII Report & Highway Construction Training & Disadvantaged Business Enterprise Program Report
70
111127
105
148126
2009 2014
70
70
70 70 70
100
On-the-Job Training Workers
Civil Rights: Workforce and Small Business Participation
Workforce Participation
During the last full week of July in 2014, 5.9 percent of the people working a federally funded highway construction project were women and 8.6 percent were minorities. These participation rates have plateaued over the last three years after increasing steadily from 2009-2011. Looking over the entire 2014 construction season, participation rates for women and minorities were 5.9 percent and 11.2 percent respectively as measured as a share of the hours worked statewide. Women and minority highway construction partici-pation rates are also tracked at the county level to determine compliance with goals estab-lished through state and federal regulations.
Percent of Total Headcount for Women & Minorities in Hwy Construction Workforce on Federally Funded Projects: One Week Snapshot
3.3%
6.1%
3.9%
7.5%
4.5%
8.5%
5.0%
9.1%
5.7%
8.4%
5.9%
8.6%
2009 2010 2011 2012 2013 2014
WomenMinorities
Des
ired
tren
d
5.9%
11.2%
2014
WomenMinorities
Percent of Total Hours for Women & Minorities in Hwy Construction Workforce on Federally Funded Projects: Entire Construction Season
Source: Certified Payroll & EEO-13 Submittals from Contractors based on data submitted as of 4/4/2016
Des
ired
tren
d
Source: Federal-Aid Highway Construction Summary of Employment Data (Form FHWA-1392)

Annual Minnesota Transportation Performance Report: 2015 Page 10
How this information is used
This information is used to monitor program performance and ensure that programs are meeting the needs of the contracting and workforce communities. MnDOT influences workforce diversity and small business partic-ipation rates through training and technical assistance, including free training to women, minorities and disadvantaged persons interested in careers in highway heavy construction. By providing access to resources such as these, the department helps small business compete more effectively on MnDOT contracts.
MnDOT’s Disadvantaged Business Enter-prises Program was established by the federal government to ensure women- and minority- owned businesses have the opportunity to participate in contracts financed in whole or in part by the US Department of Transportation. This measure represents the federal dollars awarded to DBE contractors in each federal fiscal year. In 2015, 7.4 percent of federal dollars for highway construction administered by MnDOT were awarded to a DBE contractor. MnDOT recently identified achievement of annual DBE goals (currently 11.7 percent) as a key component of its wildly important goal of earning customer trust.
MnDOT’s Targeted Group Business Program provides certified TGBs with increased access to contracts funded with state dollars. This measure represents the percentage of state contract dollars awarded to TGB firms in each state fiscal year.
MnDOT’s Veterans Business Program provides verified veteran-owned small businesses with increased access to state contracting opportunities. This measure represents the percentage of state contract dollars awarded to Veteran firms in each state fiscal year.
Learn more
MnDOT Office of Civil Rightshttp://www.dot.state.mn.us/civilrights/contacts.html
Small Business Participation
Des
ired
tren
d
DBE Participation Percent Annual Totals
Source: MnDOT Uniform Report of DBE Awards/Commitments and Payments
2011 2015
10.3%8.8%
7.4%6.6%8.1% 9.3% 9.8%
TGB Participation Percent Annual Totals
Des
ired
tren
d
5.1%*
2013 2014
4.4%
Source: MnDOT Targeted Group Business and Veteran-Owned Small Business Program Report *2013 Participation includes projects let from March 2013 – June 2013
VET Participation Percent Annual Totals
Des
ired
tren
d
2.2% 2.6%
2013 2014Source: MnDOT Targeted Group Business and Veteran-Owned Small Business Program Report
Annual Minnesota Transportation Performance Report: 2015 Page 11
Traveler Safety
Traveler Safety Traveler Safety
Measure explanation:
This measure relies on crash reports provided to the Minnesota Department of Public Safety by local law enforcement agencies. By state law, information on traffic crashes must be reported to DPS if the crashes result in at least $1,000 in property damage, or a motor vehicle occupant, pedestrian, or bicyclist is injured or killed.
System definition:
All state and local roads (142,914 miles).
Why this is important:
On an average day in 2015, at least one motor vehicle occupant, pedestrian, or bicyclist died on Minnesota roadways and more than three sustained life altering injuries. The vision of Minnesota’s Toward Zero Deaths program is to reduce these numbers to zero. Understanding the causes and the locations of crashes is necessary in order to develop effective countermeasures.
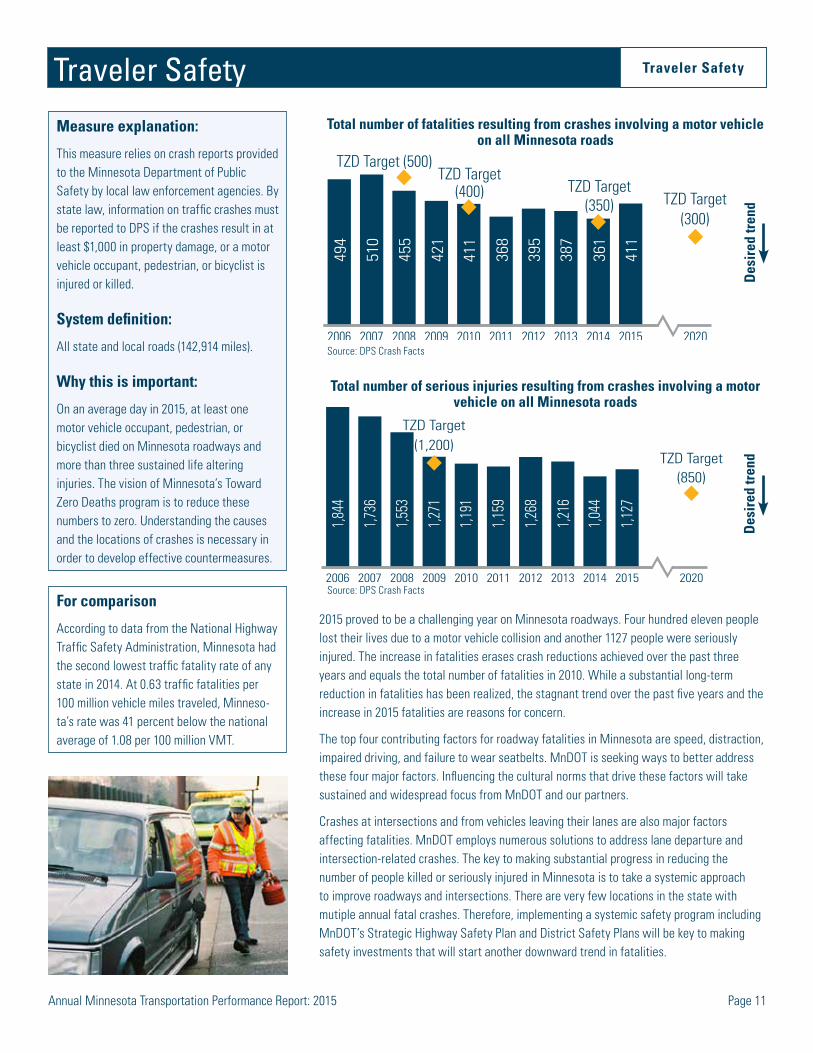
2015 proved to be a challenging year on Minnesota roadways. Four hundred eleven people lost their lives due to a motor vehicle collision and another 1127 people were seriously injured. The increase in fatalities erases crash reductions achieved over the past three years and equals the total number of fatalities in 2010. While a substantial long-term reduction in fatalities has been realized, the stagnant trend over the past five years and the increase in 2015 fatalities are reasons for concern.
The top four contributing factors for roadway fatalities in Minnesota are speed, distraction, impaired driving, and failure to wear seatbelts. MnDOT is seeking ways to better address these four major factors. Influencing the cultural norms that drive these factors will take sustained and widespread focus from MnDOT and our partners.
Crashes at intersections and from vehicles leaving their lanes are also major factors affecting fatalities. MnDOT employs numerous solutions to address lane departure and intersection-related crashes. The key to making substantial progress in reducing the number of people killed or seriously injured in Minnesota is to take a systemic approach to improve roadways and intersections. There are very few locations in the state with mutiple annual fatal crashes. Therefore, implementing a systemic safety program including MnDOT’s Strategic Highway Safety Plan and District Safety Plans will be key to making safety investments that will start another downward trend in fatalities.
Des
ired
tren
d
20202015201420132012201120102009200820072006
361
411
494
510
455
421
411
368
395
387
TZD Target (500)TZD Target
(400) TZD Target(350) TZD Target
(300)
Total number of fatalities resulting from crashes involving a motor vehicle on all Minnesota roads
Source: DPS Crash Facts
Des
ired
tren
d
202020152014201320122011201020092008200720061,0
44
1,127
1,844
1,736
1,553
1,271
1,191
1,159
1,268
1,216
TZD Target(1,200)
TZD Target(850)
Total number of serious injuries resulting from crashes involving a motor vehicle on all Minnesota roads
Source: DPS Crash Facts
Traffic fatality rate on all Minnesota roads (per 100 million VMT)
2015201420132012201120102009200820072006
0.63
0.70
0.87
0.79
0.89
0.74
0.72
0.65
0.69
0.68
Source: DPS Crash Facts
Serious injury rate on all Minnesota roads (per 100 million VMT)
2015201420132012201120102009200820072006
1.83
1.92
3.26
2.71
3.02
2.23
2.10
2.04
2.22
2.13
Source: DPS Crash Facts
Fatal and serious injury crashes by focus area (2006-2015)
Category Focus area 2006 results
2015 results
10 year actual change
10 year percent change
Unbelted occupant 816 452 - 364 - 45%
Driver behaviorImpaired driver 472 262 - 210 - 44%
Inattentive driver* 405 213 - 192 - 47%
Speeding 461 236 - 225 - 49%
Under 21 490 201 - 289 - 59%
Driver characteristic Older than 64 247 228 - 19 - 8%
Unlicensed 196 148 - 48 - 24%
Motorcyclist 322 245 - 77 - 24%
Special user
Special userCommercial vehicle 168 122 - 46 - 27%
Pedestrian 170 140 - 30 - 18%
Bicyclist 70 55 - 15 - 21%
Crash typeLane departure 857 587 - 270 - 32%
Intersection 806 543 - 263 - 33%
Total severe crashes** 1,984 1,308 - 676 - 34%
For comparison
According to data from the National Highway Traffic Safety Administration, Minnesota had the second lowest traffic fatality rate of any state in 2014. At 0.63 traffic fatalities per 100 million vehicle miles traveled, Minneso-ta’s rate was 41 percent below the national average of 1.08 per 100 million VMT.

Annual Minnesota Transportation Performance Report: 2015 Page 12
2015 proved to be a challenging year on Minnesota roadways. Four hundred eleven people lost their lives due to a motor vehicle collision and another 1127 people were seriously injured. The increase in fatalities erases crash reductions achieved over the past three years and equals the total number of fatalities in 2010. While a substantial long-term reduction in fatalities has been realized, the stagnant trend over the past five years and the increase in 2015 fatalities are reasons for concern.
The top four contributing factors for roadway fatalities in Minnesota are speed, distraction, impaired driving, and failure to wear seatbelts. MnDOT is seeking ways to better address these four major factors. Influencing the cultural norms that drive these factors will take sustained and widespread focus from MnDOT and our partners.
Crashes at intersections and from vehicles leaving their lanes are also major factors affecting fatalities. MnDOT employs numerous solutions to address lane departure and intersection-related crashes. The key to making substantial progress in reducing the number of people killed or seriously injured in Minnesota is to take a systemic approach to improve roadways and intersections. There are very few locations in the state with mutiple annual fatal crashes. Therefore, implementing a systemic safety program including MnDOT’s Strategic Highway Safety Plan and District Safety Plans will be key to making safety investments that will start another downward trend in fatalities.
Des
ired
tren
d
20202015201420132012201120102009200820072006
361
411
494
510
455
421
411
368
395
387
TZD Target (500)TZD Target
(400) TZD Target(350) TZD Target
(300)
Total number of fatalities resulting from crashes involving a motor vehicle on all Minnesota roads
Source: DPS Crash Facts
Des
ired
tren
d
20202015201420132012201120102009200820072006
1,044
1,127
1,844
1,736
1,553
1,271
1,191
1,159
1,268
1,216
TZD Target(1,200)
TZD Target(850)
Total number of serious injuries resulting from crashes involving a motor vehicle on all Minnesota roads
Source: DPS Crash Facts
Traffic fatality rate on all Minnesota roads (per 100 million VMT)
2015201420132012201120102009200820072006
0.63
0.70
0.87
0.79
0.89
0.74
0.72
0.65
0.69
0.68
Source: DPS Crash Facts
Serious injury rate on all Minnesota roads (per 100 million VMT)
2015201420132012201120102009200820072006
1.83
1.92
3.26
2.71
3.02
2.23
2.10
2.04
2.22
2.13
Source: DPS Crash Facts
Fatal and serious injury crashes by focus area (2006-2015)
Category Focus area 2006 results
2015 results
10 year actual change
10 year percent change
Unbelted occupant 816 452 - 364 - 45%
Driver behaviorImpaired driver 472 262 - 210 - 44%
Inattentive driver* 405 213 - 192 - 47%
Speeding 461 236 - 225 - 49%
Under 21 490 201 - 289 - 59%
Driver characteristic Older than 64 247 228 - 19 - 8%
Unlicensed 196 148 - 48 - 24%
Motorcyclist 322 245 - 77 - 24%
Special user
Special userCommercial vehicle 168 122 - 46 - 27%
Pedestrian 170 140 - 30 - 18%
Bicyclist 70 55 - 15 - 21%
Crash typeLane departure 857 587 - 270 - 32%
Intersection 806 543 - 263 - 33%
Total severe crashes** 1,984 1,308 - 676 - 34%
Learn more
Toward Zero Deathswww.minnesotatzd.org
MnDOT Office of Traffic, Safety and Technologywww.dot.state.mn.us/trafficeng/safety
Minnesota DPS, Office of Traffic Safetydps.mn.gov/divisions/ots
2014-2019 Minnesota Strategic Highway Safety Planhttp://www.dot.state.mn.us/trafficeng/safety/shsp/Minnesota_SHSP_2014.pdf
Des
ired
tren
dD
esir
ed tr
end
*Note: Severe crashes involving inattentive drivers are likely underreported and should be evaluated with caution. **Note: Crashes may involve multiple focus areas.Source: MnDOT Office of Traffic, Safety and Technology; Transportation Information System (TIS)
How this information is used
MnDOT improves traveler safety in Minnesota through the Toward Zero Deaths partnership with the Minnesota Department of Public Safety and the Minnesota Department of Health. Key TZD strategies can be summarized as the “4Es”:
Engineering – Identifying and improving locations at risk for the types of crashes that are most likely to result in death or serious injury, such as angle crashes at intersections and run-off-the-road crashes in rural areas, and reactively improving locations with a history of crashes.
Enforcement – Ensuring compliance with traffic laws. The Department of Public Safety administers four enforcement mobilization campaigns featuring scheduled enforcement events where the State Patrol and local police focus on a targeted driving behavior for a set number of days.
Education – Helping drivers understand the risks associated with behaviors like not wearing seat belts and drinking and driving. For example, an annual public safety announcement details the importance of seat belt use, and the Share the Road Campaign emphasizes the responsi-bilities of drivers, bicyclists and pedestrians in keeping roads safe for all.
Emergency medical and trauma services – Responding to crashes quickly and transporting crash victims rapidly to the right type of care facility.

Annual Minnesota Transportation Performance Report: 2015 Page 13
State Highway Asset Management
Pavement Condition State Highway Asset Management
Measure explanation:
Ride quality is assessed using MnDOT’s Ride Quality Index, which is a measure of pavement smoothness as perceived by the typical driver. Pavement rated poor can still be driven on, but the ride is sufficiently rough that most people would find it uncomfortable and may reduce their speed.
MnDOT also measures remaining service life as the number of years until a section of pavement will require major repair or replacement.
System definition:
MnDOT measures ride quality on the Inter-state system (1,821 roadway miles), the non-Interstate National Highway System (5,819 roadway miles), and the rest of the state highway system (6,677 roadway miles).
Why this is important:
Smooth pavement enhances mobility, improves fuel economy and reduces the need for vehicle repair and maintenance. Market research shows that Minnesotans’ satisfac-tion with overall state highway maintenance is greatly affected by the smoothness of highway pavements.
Ride quality of the overall state highway system decreased slightly in 2015. Overall, there were 45 fewer miles of highway with good ride quality and 60 more miles of highway with poor ride quality in 2015 than in 2014. The percent of the Interstate system with poor ride quality rose above the target in 2015, but MnDOT met targets on the non-Interstate National Highway System and on non-NHS state highways. Poor pavements on all systems are expected to increase to or beyond target levels over the next four years.
2019201820172016201520142013201220112010
6.8 8.6 7.5 6.8 4.4 5.1 6.5 8.1 9.1 10.2
Target ≤ 10%Percent of Non-NHS State Highways with Poor Ride Quality
2019201820172016201520142013201220112010
3.4 3.9 2.4 2.4 1.9 2.1 1.7 1.7 1.8 2.9
Target ≤ 2%
Percent of Interstate System with Poor Ride Quality
Source: MnDOT 2015 Pavement Condition Annual Report. 2016-2019 results are predicted based on investments in the 2016-2019 STIP.
Percent of Non-Interstate NHS with Poor Ride Quality
2019201820172016201520142013201220112010
3.8 5.1 4.3 2.9 3.0 2.7 3.1 3.3 3.8 4.2
Target ≤ 4%
Source: MnDOT 2015 Pavement Condition Annual Report. 2016-2019 results are predicted based on investments in the 2016-2019 STIP.
Source: MnDOT 2015 Pavement Condition Annual Report. 2016-2019 results are predicted based on investments in the 2016-2019 STIP.
Des
ired
tren
dD
esir
ed tr
end
Des
ired
tren
d
Annual Minnesota Transportation Performance Report: 2015 Page 14
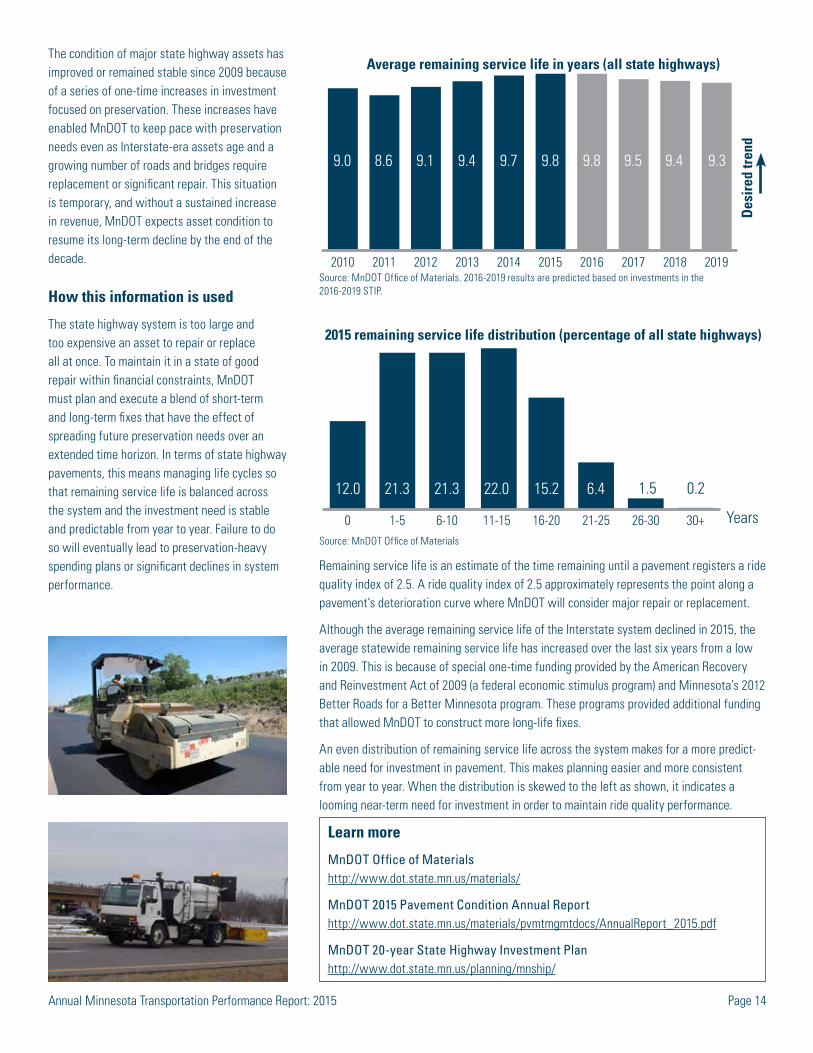
The condition of major state highway assets has improved or remained stable since 2009 because of a series of one-time increases in investment focused on preservation. These increases have enabled MnDOT to keep pace with preservation needs even as Interstate-era assets age and a growing number of roads and bridges require replacement or significant repair. This situation is temporary, and without a sustained increase in revenue, MnDOT expects asset condition to resume its long-term decline by the end of the decade.
Remaining service life is an estimate of the time remaining until a pavement registers a ride quality index of 2.5. A ride quality index of 2.5 approximately represents the point along a pavement’s deterioration curve where MnDOT will consider major repair or replacement.
Although the average remaining service life of the Interstate system declined in 2015, the average statewide remaining service life has increased over the last six years from a low in 2009. This is because of special one-time funding provided by the American Recovery and Reinvestment Act of 2009 (a federal economic stimulus program) and Minnesota’s 2012 Better Roads for a Better Minnesota program. These programs provided additional funding that allowed MnDOT to construct more long-life fixes.
An even distribution of remaining service life across the system makes for a more predict-able need for investment in pavement. This makes planning easier and more consistent from year to year. When the distribution is skewed to the left as shown, it indicates a looming near-term need for investment in order to maintain ride quality performance.
Average remaining service life in years (all state highways)
2019201820172016201520142013201220112010
9.39.0 8.6 9.1 9.4 9.7 9.8 9.8 9.5 9.4
Source: MnDOT Office of Materials. 2016-2019 results are predicted based on investments in the 2016-2019 STIP.
30+26-3021-2516-2011-156-101-50
12.0 21.3 21.3 22.0 15.2 6.4 1.5 0.2
Years
2015 remaining service life distribution (percentage of all state highways)
Source: MnDOT Office of Materials
How this information is used
The state highway system is too large and too expensive an asset to repair or replace all at once. To maintain it in a state of good repair within financial constraints, MnDOT must plan and execute a blend of short-term and long-term fixes that have the effect of spreading future preservation needs over an extended time horizon. In terms of state highway pavements, this means managing life cycles so that remaining service life is balanced across the system and the investment need is stable and predictable from year to year. Failure to do so will eventually lead to preservation-heavy spending plans or significant declines in system performance.
Learn more
MnDOT Office of Materialshttp://www.dot.state.mn.us/materials/
MnDOT 2015 Pavement Condition Annual Reporthttp://www.dot.state.mn.us/materials/pvmtmgmtdocs/AnnualReport_2015.pdf
MnDOT 20-year State Highway Investment Planhttp://www.dot.state.mn.us/planning/mnship/
Des
ired
tren
d
Annual Minnesota Transportation Performance Report: 2015 Page 15
Bridge Condition State Highway Asset Management
Measure explanation:
Bridge condition is calculated from the results of inspections performed at least every two years on all state highway bridges. Ratings combine deck, substructure and superstructure evaluations. Bridges rated “poor” (also termed “structurally deficient”) are safe to drive on, but they are near the point where significant investment in repair or replacement is necessary. Measures are reported as percentages of deck area.
System definition:
Bridges more than 20 feet long on or over state highways – 2,605 bridges on the National Highway System and 1,068 bridges on other routes.
Why this is important:
Bridges are a critical component of the trans-portation network. They are also among the state’s most expensive assets to replace. A small percentage of bridge deck area in poor condition suggests that maintenance, repair and rehabilitation strategies have effectively extended bridge life and limited the need for near-term reconstructions.
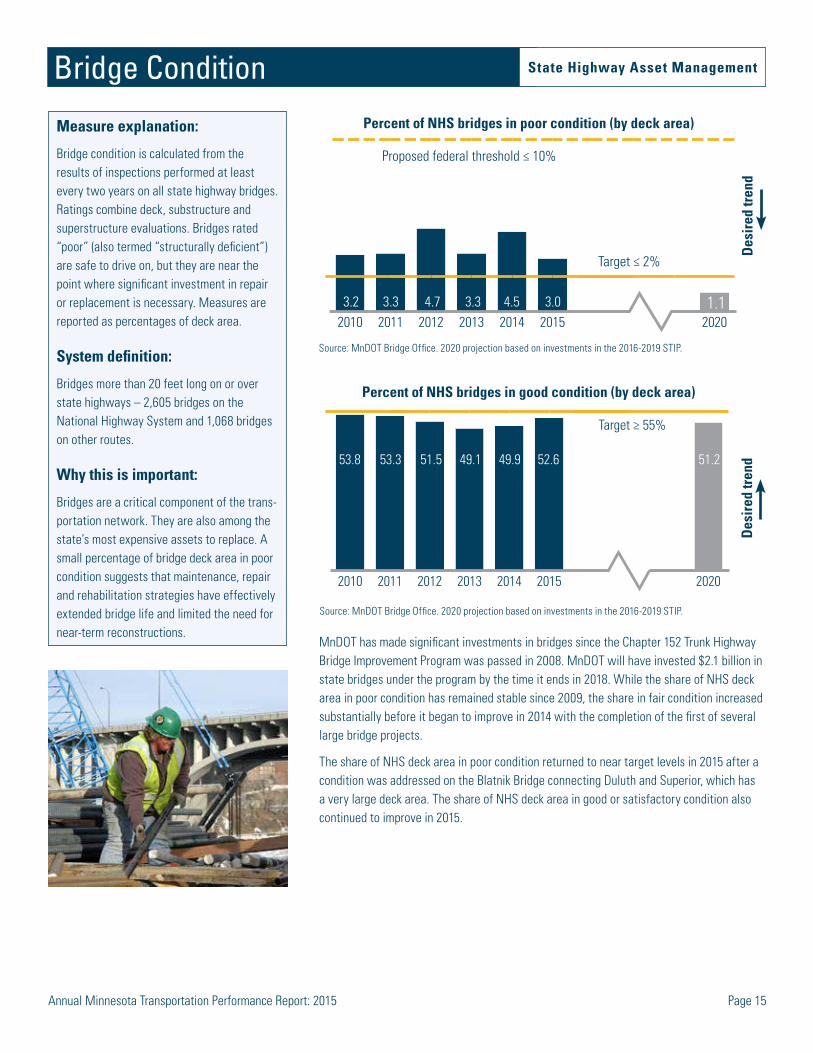
MnDOT has made significant investments in bridges since the Chapter 152 Trunk Highway Bridge Improvement Program was passed in 2008. MnDOT will have invested $2.1 billion in state bridges under the program by the time it ends in 2018. While the share of NHS deck area in poor condition has remained stable since 2009, the share in fair condition increased substantially before it began to improve in 2014 with the completion of the first of several large bridge projects.
The share of NHS deck area in poor condition returned to near target levels in 2015 after a condition was addressed on the Blatnik Bridge connecting Duluth and Superior, which has a very large deck area. The share of NHS deck area in good or satisfactory condition also continued to improve in 2015.
2020201520142013201220112010
?.?9.9 10.9 8.9 8.3
3.2 3.3 4.7 3.3 4.5 3.0 1.1
Target ≤ 2%
Proposed federal threshold ≤ 10%
Percent of NHS bridges in poor condition (by deck area)
Source: MnDOT Bridge Office. 2020 projection based on investments in the 2016-2019 STIP.
Percent of NHS bridges in good condition (by deck area)
2020201520142013201220112010
51.253.8 53.3 51.5 49.1 49.9 52.6 54.654.0
Target ≥ 55%
Source: MnDOT Bridge Office. 2020 projection based on investments in the 2016-2019 STIP.
Des
ired
tren
dD
esir
ed tr
end

Annual Minnesota Transportation Performance Report: 2015 Page 16
All targets for the condition of non-NHS bridges were met again in 2015 by wide margins. This reflects differences in system size, age and use. The cost and disruption of repairing or replacing large, heavily used bridges are also greater compared to bridges that are smaller and less traveled.
How this information is used
MnDOT reports progress against targets for the percent of bridges in poor condition, fair or poor condition, good or satisfactory condition, and good condition. Bridges in good or satisfactory condition generally receive routine mainte-nance, while bridges in fair or poor condition are monitored more closely and eventually scheduled for major repair, rehabilitation or replacement.
A high share of bridges in good or satisfactory condition indicates that MnDOT is effectively managing to limit the need for more expensive and disruptive investments. The good and satis-factory measure is driven more by proactive maintenance and repair than by reconstructions or replacements. Major projects that bring a bridge from poor to good condition are reflected in all of the condition measures.
Learn more
MnDOT Bridge Office
http://www.dot.state.mn.us/bridge/
MnDOT 20-year State Highway Investment Plan
http://www.dot.state.mn.us/planning/mnship/
Des
ired
tren
dD
esir
ed tr
end
Percent of non-NHS bridges in good condition (by deck area)
Source: MnDOT
Source: MnDOT Bridge Office. 2020 projection based on investments in the 2016-2019 STIP.
For comparison:
Minnesota has the 13th lowest percentage of state-owned bridge deck area rated struc-turally deficient, according to 2015 National Bridge Inventory data.
2020201520142013201220112010
44.260.9 60.2 60.0 58.3 58.3 60.5
Target ≥ 50%
2020201520142013201220112010
??.?12.2 14.2 13.9 12.9 13.8 11.9 11.9 11.5
0.72.1 2.0 2.1 3.1 1.3 3.1 1.0 1.0
Target ≤ 8%
Percent of non-NHS bridges in poor condition (by deck area)
Source: MnDOT Bridge Office. 2020 projection based on investments in the 2016-2019 STIP.
Annual Minnesota Transportation Performance Report: 2015 Page 17
Twin Cities Freeway Congestion Critical Connections
Measure explanation:
MnDOT defines congestion as traffic flowing at speeds less than 45 mph. At 45 mph, most vehicles will brake in a traffic stream, resulting in stop-and-go traffic.
System definition:
379 miles of Twin Cities area freeway.
Why this is important:
Traffic congestion creates unsafe driving conditions, increases shipping costs, and reduces the time available to spend on other activities. While some congestion is inevitable, limiting it preserves metro-wide mobility and keeps the Twin Cities competi-tive with peer regions. Given finite resources and the growth in the region’s population, MnDOT’s goals are to manage the growth of congestion, including transportation alterna-tives.
Learn more
MnDOT Metropolitan Freeway System 2015 Congestion Reporthttp://www.dot.state.mn.us/rtmc/reports/2015congestionreport.pdf
Texas Transportation Institute Urban Mobility Reporthttp://mobility.tamu.edu/ums/
Metropolitan Council Transportation Policy Planhttp://www.metrocouncil.org/Transporta-tion.aspx
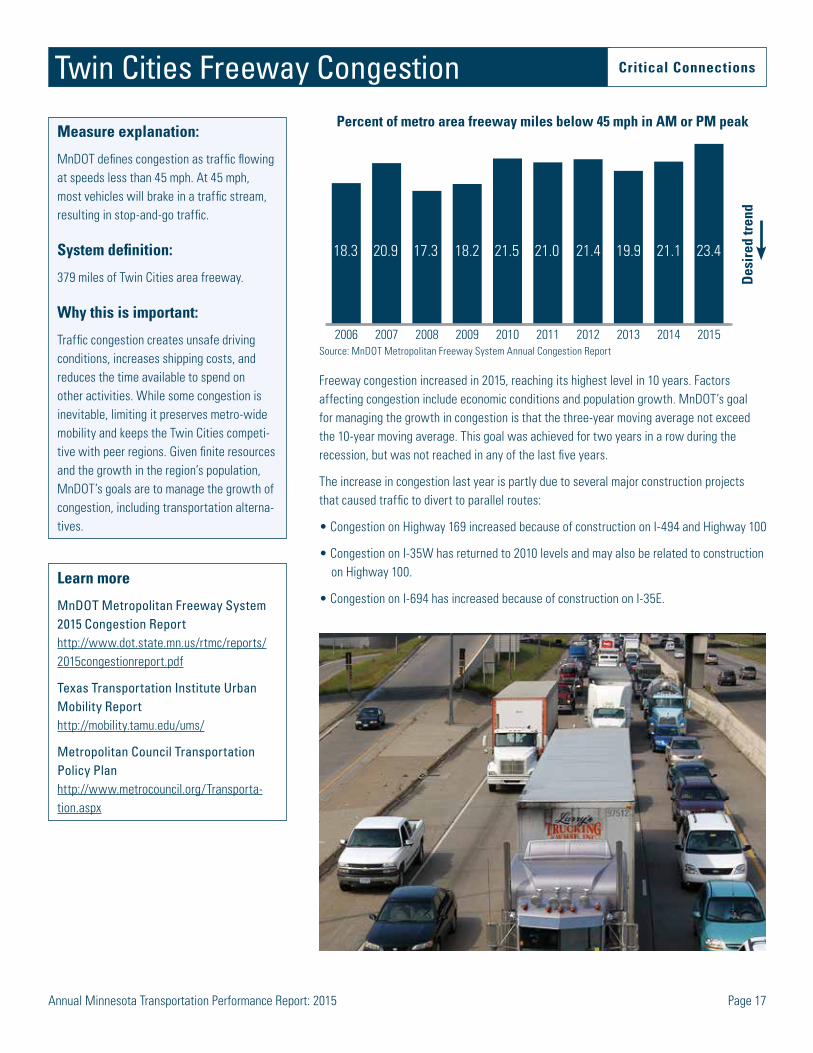
Freeway congestion increased in 2015, reaching its highest level in 10 years. Factors affecting congestion include economic conditions and population growth. MnDOT’s goal for managing the growth in congestion is that the three-year moving average not exceed the 10-year moving average. This goal was achieved for two years in a row during the recession, but was not reached in any of the last five years.
The increase in congestion last year is partly due to several major construction projects that caused traffic to divert to parallel routes:
• Congestion on Highway 169 increased because of construction on I-494 and Highway 100
• Congestion on I-35W has returned to 2010 levels and may also be related to construction on Highway 100.
• Congestion on I-694 has increased because of construction on I-35E.
2015201420132012201120102009200820072006
18.3 20.9 17.3 18.2 21.5 21.0 21.4 19.9 21.1 23.4
Percent of metro area freeway miles below 45 mph in AM or PM peak
Source: MnDOT Metropolitan Freeway System Annual Congestion Report
Des
ired
tren
d
Annual Minnesota Transportation Performance Report: 2015 Page 18
How this information is used
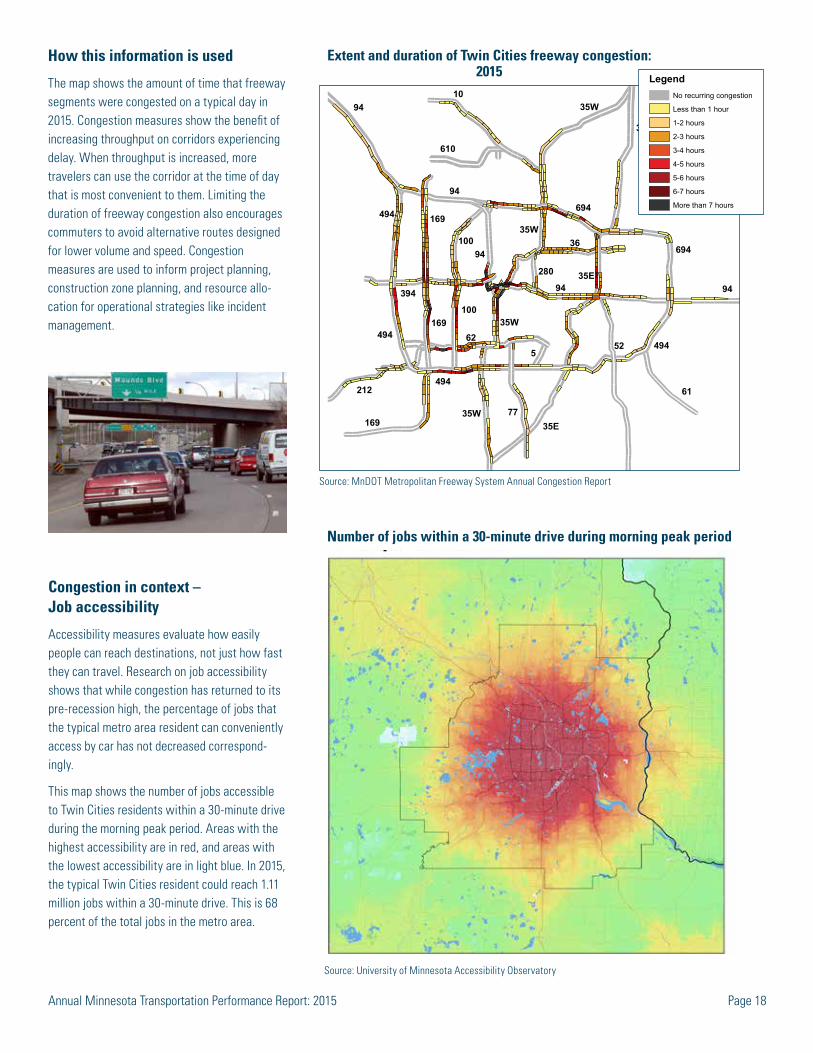
The map shows the amount of time that freeway segments were congested on a typical day in 2015. Congestion measures show the benefit of increasing throughput on corridors experiencing delay. When throughput is increased, more travelers can use the corridor at the time of day that is most convenient to them. Limiting the duration of freeway congestion also encourages commuters to avoid alternative routes designed for lower volume and speed. Congestion measures are used to inform project planning, construction zone planning, and resource allo-cation for operational strategies like incident management.
10
610
35W
35E
94
94
94 94
94
494
494
494
494
35W
35W
35W
35E
35E
36
52
169
169
100
100
625
694
694
77
394
35
280
169
212
52
61
35
LegendNo recurring congestion
Less than 1 hour
1-2 hours
2-3 hours
3-4 hours
4-5 hours
5-6 hours
6-7 hours
More than 7 hours
Extent and duration of Twin Cities freeway congestion: 2015
Source: MnDOT Metropolitan Freeway System Annual Congestion Report
LegendNo recurring congestion
Less than 1 hour
1-2 hours
2-3 hours
3-4 hours
4-5 hours
5-6 hours
6-7 hours
More than 7 hours
Congestion in context – Job accessibility
Accessibility measures evaluate how easily people can reach destinations, not just how fast they can travel. Research on job accessibility shows that while congestion has returned to its pre-recession high, the percentage of jobs that the typical metro area resident can conveniently access by car has not decreased correspond-ingly.
This map shows the number of jobs accessible to Twin Cities residents within a 30-minute drive during the morning peak period. Areas with the highest accessibility are in red, and areas with the lowest accessibility are in light blue. In 2015, the typical Twin Cities resident could reach 1.11 million jobs within a 30-minute drive. This is 68 percent of the total jobs in the metro area.
DRAFT
23
Number of jobs within a 30-minute drive during morning peak period
Source: University of Minnesota Accessibility Observatory
Annual Minnesota Transportation Performance Report: 2015 Page 19
Snow & Ice Control Critical Connections
Measure explanation:
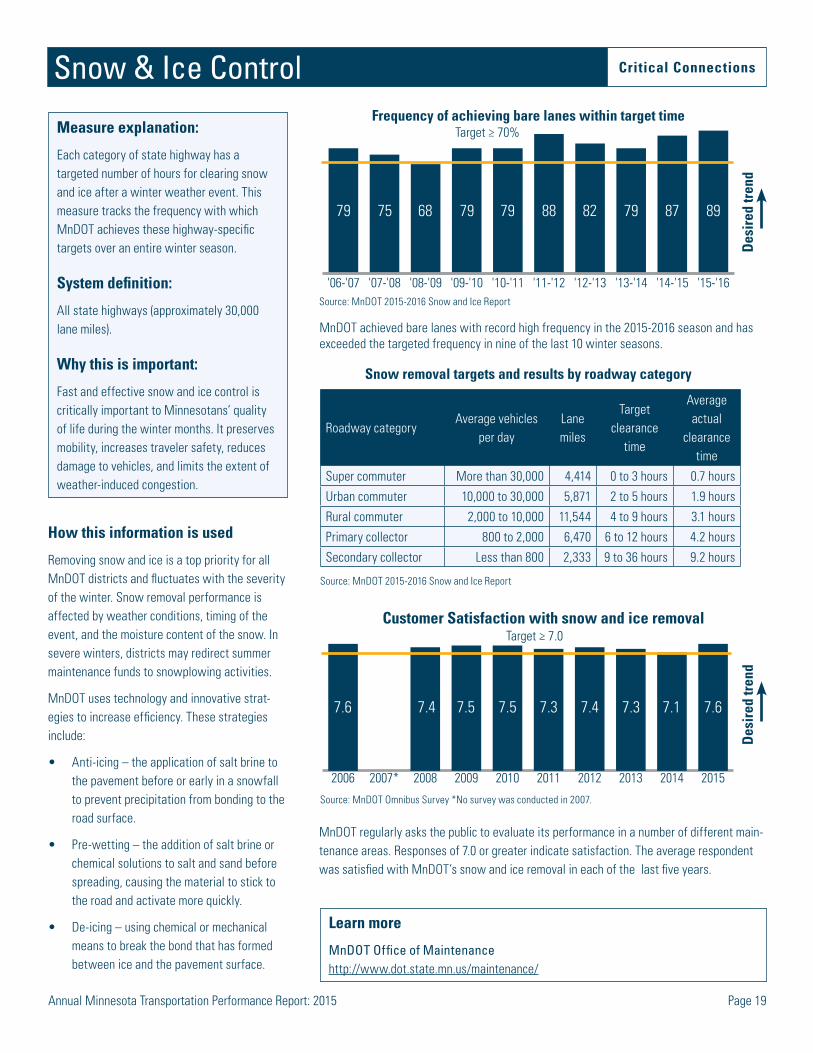
Each category of state highway has a targeted number of hours for clearing snow and ice after a winter weather event. This measure tracks the frequency with which MnDOT achieves these highway-specific targets over an entire winter season.
System definition:
All state highways (approximately 30,000 lane miles).
Why this is important:
Fast and effective snow and ice control is critically important to Minnesotans’ quality of life during the winter months. It preserves mobility, increases traveler safety, reduces damage to vehicles, and limits the extent of weather-induced congestion.
Snow removal targets and results by roadway category
Roadway categoryAverage vehicles
per dayLane miles
Target clearance
time
Average actual
clearance time
Super commuter More than 30,000 4,414 0 to 3 hours 0.7 hours
Urban commuter 10,000 to 30,000 5,871 2 to 5 hours 1.9 hours
Rural commuter 2,000 to 10,000 11,544 4 to 9 hours 3.1 hours
Primary collector 800 to 2,000 6,470 6 to 12 hours 4.2 hours
Secondary collector Less than 800 2,333 9 to 36 hours 9.2 hours
Frequency of achieving bare lanes within target time
'15-'16'14-'15'13-'14'12-'13'11-'12'10-'11'09-'10'08-'09'07-'08'06-'07
79 75 68 79 79 88 82 79 87 89
Target ≥ 70%
MnDOT achieved bare lanes with record high frequency in the 2015-2016 season and has exceeded the targeted frequency in nine of the last 10 winter seasons.
How this information is used
Removing snow and ice is a top priority for all MnDOT districts and fluctuates with the severity of the winter. Snow removal performance is affected by weather conditions, timing of the event, and the moisture content of the snow. In severe winters, districts may redirect summer maintenance funds to snowplowing activities.
MnDOT uses technology and innovative strat-egies to increase efficiency. These strategies include:
• Anti-icing – the application of salt brine to the pavement before or early in a snowfall to prevent precipitation from bonding to the road surface.
• Pre-wetting – the addition of salt brine or chemical solutions to salt and sand before spreading, causing the material to stick to the road and activate more quickly.
• De-icing – using chemical or mechanical means to break the bond that has formed between ice and the pavement surface.
Learn more
MnDOT Office of Maintenancehttp://www.dot.state.mn.us/maintenance/
Des
ired
tren
dD
esir
ed tr
end
Source: MnDOT Omnibus Survey *No survey was conducted in 2007.
Source: MnDOT 2015-2016 Snow and Ice Report
Source: MnDOT 2015-2016 Snow and Ice Report
MnDOT regularly asks the public to evaluate its performance in a number of different main-tenance areas. Responses of 7.0 or greater indicate satisfaction. The average respondent was satisfied with MnDOT’s snow and ice removal in each of the last five years.
201520142013201220112010200920082007*2006
7.6 7.4 7.5 7.5 7.3 7.4 7.3 7.1 7.6
Target ≥ 7.0Customer Satisfaction with snow and ice removal

Annual Minnesota Transportation Performance Report: 2015 Page 20
Freight Mode Share Critical Connections
Measure explanation:
This measure uses the Federal Highway Administration’s Freight Analysis Framework. The current version of the framework uses origin and destination information from the 2012 Commodity Flow Survey as a basis for estimates of freight tonnage and value by origin and destination, commodity and mode.
System definition:
All domestic freight shipments originating or terminating in Minnesota. Imports, exports and through shipments (where both origin and destination are outside the state) are not included.
Why this is important:
A freight network that is competitive across modes helps support a robust economy. Along with information about shipment types, locations and costs, mode share estimates help MnDOT and its partners evaluate the capacity of the freight network to meet the needs of Minnesota’s manufac-turers and consumers. Mode share estimates can also be used to evaluate the effective-ness of policies or programs that promote a particular mode.
Truck-only trips remain the primary means of shipping goods by value, but the share moved by other modes is increasing. Shipments by tons have shifted from water to rail, truck and pipeline. Trucks tend to carry more valuable freight and make the final trip for many items, while long distance shipments of heavier, less valuable goods tend to be made by other modes. Although airplanes carry the highest value goods, they move only a small fraction of total freight volume moving to, from and between Minnesota destinations.
* Results reflect estimated value of discrete freight movements. Since some goods are moved multiple times through the supply chain, the total value of domestic shipments is greater than the value of all goods and services produced in Minnesota as measured with GDP statistics.Source: Federal Highway Administration; Freight Analysis Framework, version 4.1
Value (billions, current dollars)*
Tons (millions)
Total domestic shipments to, from, or between Minnesota locations (excluding international and through shipments)
Other (incl. Air& Unknown)
Pipeline
Multiple modes
Water
Rail
Truck
2015201420132012
634 658 694 696
2015201420132012
$503 $519 $552$538

Annual Minnesota Transportation Performance Report: 2015 Page 21
Learn more
MnDOT Office of Freight and Commercial Vehicle Operations http://www.dot.state.mn.us/ofrw/freight/freight.html
American Association of Railroads http://www.aar.org
Minnesota Regional Railroads Association http://www.minnesotarailroads.com/
Heavy commercial vehicle miles traveled on Minnesota state highways increased in 2013 to its highest level since 2006. Truck shipments are strongly linked to demand for consumer goods.
Minnesota total port shipment tonnage has been level for the last three years. Of the 69 million tons shipped in 2015, 57 million or 83 percent were shipped to or from one of Minne-sota’s four ports on Lake Superior. The most significant commodity shipped from lake ports was taconite at 37 million tons. Other prominent commodities moved out of Lake Superior ports were scrap iron, coal and limestone.
Mississippi River shipments totaled 11.6 million tons in 2015. The Mississippi carries more than half of all agricultural exports from the state. Other important river shipments include fertilizer, cement, steel, salt and coal.
How this information is used
Mode share estimates are just one piece of information MnDOT considers when evaluating freight system performance. Other consider-ations are MnDOT’s estimates of heavy commer-cial trucking and private sector reports of rail and port shipment tonnage. In contrast to the mode share data, these additional indicators include movements in which both trip origin and destination are outside Minnesota.
River PortsLake SuperiorSource: MnDOT Office of Freight and Commercial Vehicle Operations
Source: MnDOT Office of Transportation System Management
Port shipments in Minnesota (millions of tons)
2015201420132012201120102009200820072006
80.4 80.1 75.2
52.3
71.9 70.4 71.7 67.612.9 12.1 8.2
10.8
10.9 10.6 10.7 9.2
67.4 68.0 67.0 41.5 61.0 59.8 61.0 58.4 57.3 57.2
10.7 11.668.0 68.8
Heavy commercial vehicle miles traveled on Minnesota state highways (billions)
2013201220112010200920082007200620052004
2.71 2.71 2.642.74 2.63 2.58 2.59 2.57 2.59 2.71
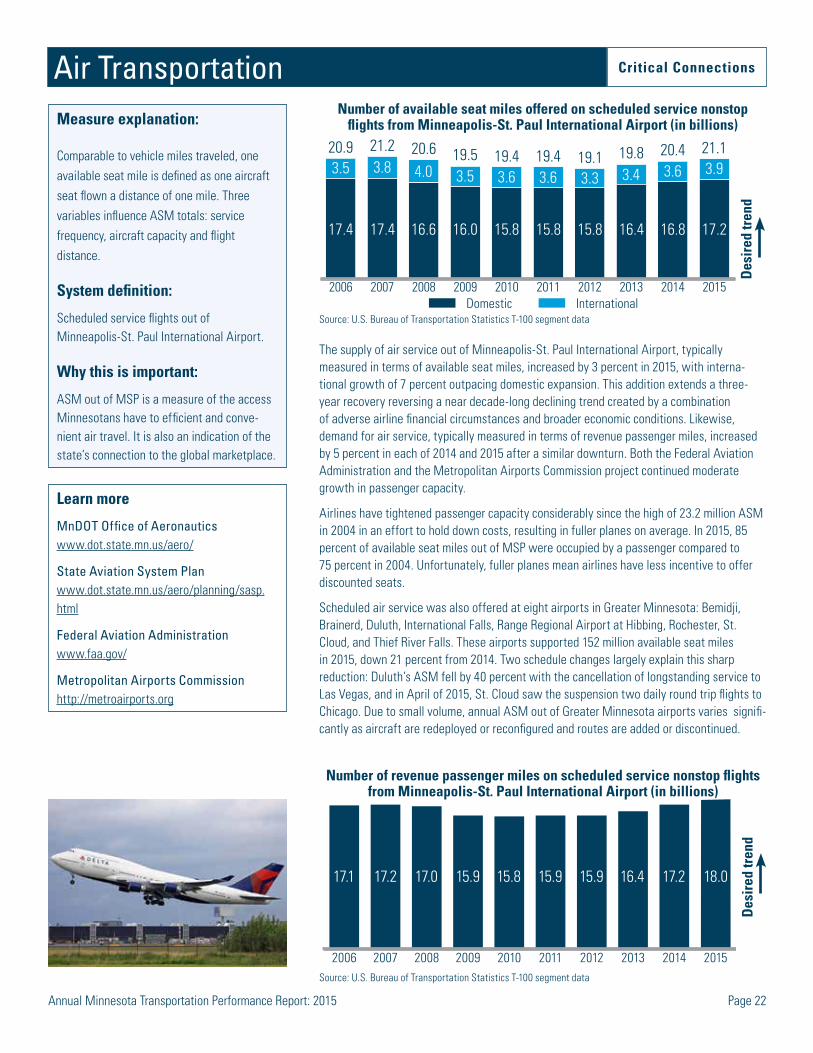
Annual Minnesota Transportation Performance Report: 2015 Page 22
Air Transportation Critical Connections
Measure explanation:
Comparable to vehicle miles traveled, one available seat mile is defined as one aircraft seat flown a distance of one mile. Three variables influence ASM totals: service frequency, aircraft capacity and flight distance.
System definition:
Scheduled service flights out of Minneapolis-St. Paul International Airport.
Why this is important:
ASM out of MSP is a measure of the access Minnesotans have to efficient and conve-nient air travel. It is also an indication of the state’s connection to the global marketplace.
Learn more
MnDOT Office of Aeronauticswww.dot.state.mn.us/aero/
State Aviation System Planwww.dot.state.mn.us/aero/planning/sasp.html
Federal Aviation Administrationwww.faa.gov/
Metropolitan Airports Commissionhttp://metroairports.org
The supply of air service out of Minneapolis-St. Paul International Airport, typically measured in terms of available seat miles, increased by 3 percent in 2015, with interna-tional growth of 7 percent outpacing domestic expansion. This addition extends a three-year recovery reversing a near decade-long declining trend created by a combination of adverse airline financial circumstances and broader economic conditions. Likewise, demand for air service, typically measured in terms of revenue passenger miles, increased by 5 percent in each of 2014 and 2015 after a similar downturn. Both the Federal Aviation Administration and the Metropolitan Airports Commission project continued moderate growth in passenger capacity.
Airlines have tightened passenger capacity considerably since the high of 23.2 million ASM in 2004 in an effort to hold down costs, resulting in fuller planes on average. In 2015, 85 percent of available seat miles out of MSP were occupied by a passenger compared to 75 percent in 2004. Unfortunately, fuller planes mean airlines have less incentive to offer discounted seats.
Scheduled air service was also offered at eight airports in Greater Minnesota: Bemidji, Brainerd, Duluth, International Falls, Range Regional Airport at Hibbing, Rochester, St. Cloud, and Thief River Falls. These airports supported 152 million available seat miles in 2015, down 21 percent from 2014. Two schedule changes largely explain this sharp reduction: Duluth’s ASM fell by 40 percent with the cancellation of longstanding service to Las Vegas, and in April of 2015, St. Cloud saw the suspension two daily round trip flights to Chicago. Due to small volume, annual ASM out of Greater Minnesota airports varies signifi-cantly as aircraft are redeployed or reconfigured and routes are added or discontinued.
Des
ired
tren
dD
esir
ed tr
end
InternationalDomestic
Number of revenue passenger miles on scheduled service nonstop flights from Minneapolis-St. Paul International Airport (in billions)
2015201420132012201120102009200820072006
17.2 18.017.1 17.2 17.0 15.9 15.8 15.9 15.9 16.4
Number of available seat miles offered on scheduled service nonstop flights from Minneapolis-St. Paul International Airport (in billions)
2015201420132012201120102009200820072006
20.4 21.120.9 21.2 20.6 19.5 19.4 19.4 19.1 19.8
16.8 17.217.4 17.4 16.6 16.0 15.8 15.8 15.8 16.4
3.6 3.93.5 3.8 4.0 3.5 3.6 3.6 3.3 3.4
Source: U.S. Bureau of Transportation Statistics T-100 segment data
Source: U.S. Bureau of Transportation Statistics T-100 segment data
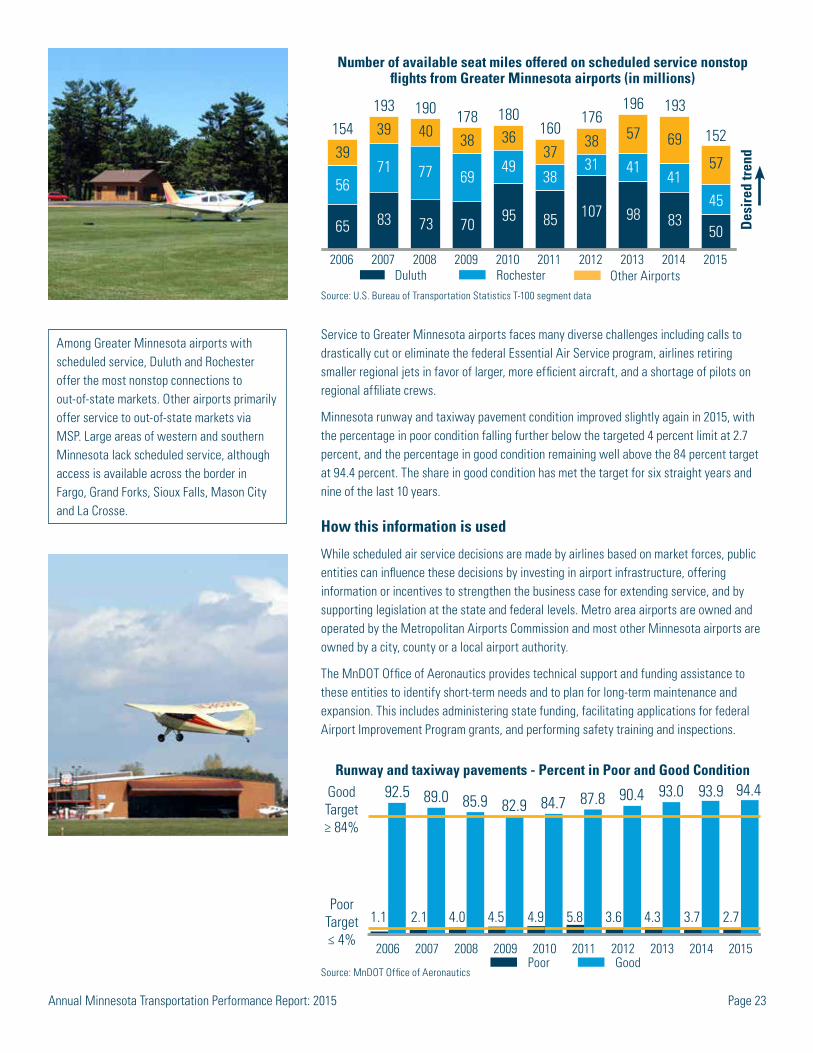
Annual Minnesota Transportation Performance Report: 2015 Page 23
Service to Greater Minnesota airports faces many diverse challenges including calls to drastically cut or eliminate the federal Essential Air Service program, airlines retiring smaller regional jets in favor of larger, more efficient aircraft, and a shortage of pilots on regional affiliate crews.
Minnesota runway and taxiway pavement condition improved slightly again in 2015, with the percentage in poor condition falling further below the targeted 4 percent limit at 2.7 percent, and the percentage in good condition remaining well above the 84 percent target at 94.4 percent. The share in good condition has met the target for six straight years and nine of the last 10 years.
How this information is used
While scheduled air service decisions are made by airlines based on market forces, public entities can influence these decisions by investing in airport infrastructure, offering information or incentives to strengthen the business case for extending service, and by supporting legislation at the state and federal levels. Metro area airports are owned and operated by the Metropolitan Airports Commission and most other Minnesota airports are owned by a city, county or a local airport authority.
The MnDOT Office of Aeronautics provides technical support and funding assistance to these entities to identify short-term needs and to plan for long-term maintenance and expansion. This includes administering state funding, facilitating applications for federal Airport Improvement Program grants, and performing safety training and inspections.
Among Greater Minnesota airports with scheduled service, Duluth and Rochester offer the most nonstop connections to out-of-state markets. Other airports primarily offer service to out-of-state markets via MSP. Large areas of western and southern Minnesota lack scheduled service, although access is available across the border in Fargo, Grand Forks, Sioux Falls, Mason City and La Crosse.
GoodPoor
Number of available seat miles offered on scheduled service nonstop flights from Greater Minnesota airports (in millions)
Runway and taxiway pavements - Percent in Poor and Good Condition
Source: MnDOT Office of Aeronautics
Source: U.S. Bureau of Transportation Statistics T-100 segment data
Des
ired
tren
d
RochesterDuluth Other Airports2015201420132012201120102009200820072006
41
6957
3939 40 38 36
3738 57
4556
71 77 6949
3831 41
835065 83 73 70 95 85 98107
193
152154193 190 178 180
160176
196
2015201420132012201120102009200820072006
2.71.1 2.1 4.0 4.5 4.9 5.8 3.6 4.3 3.7
93.9 94.492.5 89.0 85.9 82.9 84.7 87.8 90.4 93.0Good Target≥ 84%
Poor Target≤ 4%
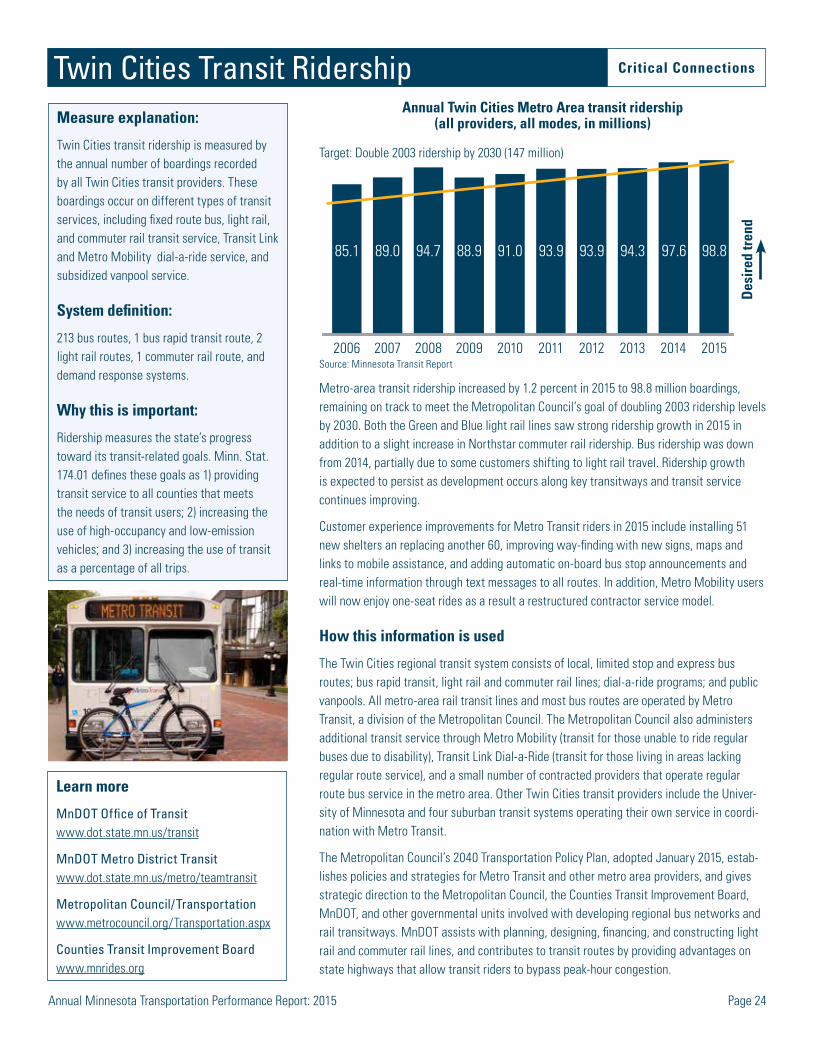
Annual Minnesota Transportation Performance Report: 2015 Page 24
Twin Cities Transit Ridership Critical Connections
Measure explanation:
Twin Cities transit ridership is measured by the annual number of boardings recorded by all Twin Cities transit providers. These boardings occur on different types of transit services, including fixed route bus, light rail, and commuter rail transit service, Transit Link and Metro Mobility dial-a-ride service, and subsidized vanpool service.
System definition:
213 bus routes, 1 bus rapid transit route, 2 light rail routes, 1 commuter rail route, and demand response systems.
Why this is important:
Ridership measures the state’s progress toward its transit-related goals. Minn. Stat. 174.01 defines these goals as 1) providing transit service to all counties that meets the needs of transit users; 2) increasing the use of high-occupancy and low-emission vehicles; and 3) increasing the use of transit as a percentage of all trips.
Metro-area transit ridership increased by 1.2 percent in 2015 to 98.8 million boardings, remaining on track to meet the Metropolitan Council’s goal of doubling 2003 ridership levels by 2030. Both the Green and Blue light rail lines saw strong ridership growth in 2015 in addition to a slight increase in Northstar commuter rail ridership. Bus ridership was down from 2014, partially due to some customers shifting to light rail travel. Ridership growth is expected to persist as development occurs along key transitways and transit service continues improving.
Customer experience improvements for Metro Transit riders in 2015 include installing 51 new shelters an replacing another 60, improving way-finding with new signs, maps and links to mobile assistance, and adding automatic on-board bus stop announcements and real-time information through text messages to all routes. In addition, Metro Mobility users will now enjoy one-seat rides as a result a restructured contractor service model.
How this information is used
The Twin Cities regional transit system consists of local, limited stop and express bus routes; bus rapid transit, light rail and commuter rail lines; dial-a-ride programs; and public vanpools. All metro-area rail transit lines and most bus routes are operated by Metro Transit, a division of the Metropolitan Council. The Metropolitan Council also administers additional transit service through Metro Mobility (transit for those unable to ride regular buses due to disability), Transit Link Dial-a-Ride (transit for those living in areas lacking regular route service), and a small number of contracted providers that operate regular route bus service in the metro area. Other Twin Cities transit providers include the Univer-sity of Minnesota and four suburban transit systems operating their own service in coordi-nation with Metro Transit.
The Metropolitan Council’s 2040 Transportation Policy Plan, adopted January 2015, estab-lishes policies and strategies for Metro Transit and other metro area providers, and gives strategic direction to the Metropolitan Council, the Counties Transit Improvement Board, MnDOT, and other governmental units involved with developing regional bus networks and rail transitways. MnDOT assists with planning, designing, financing, and constructing light rail and commuter rail lines, and contributes to transit routes by providing advantages on state highways that allow transit riders to bypass peak-hour congestion.
Learn more
MnDOT Office of Transitwww.dot.state.mn.us/transit
MnDOT Metro District Transitwww.dot.state.mn.us/metro/teamtransit
Metropolitan Council/Transportationwww.metrocouncil.org/Transportation.aspx
Counties Transit Improvement Boardwww.mnrides.org
Des
ired
tren
d
Annual Twin Cities Metro Area transit ridership (all providers, all modes, in millions)
2015201420132012201120102009200820072006
97.6 98.885.1 89.0 94.7 88.9 91.0 93.9 93.9 94.3
Source: Minnesota Transit Report
Target: Double 2003 ridership by 2030 (147 million)

Annual Minnesota Transportation Performance Report: 2015 Page 25
Greater Minnesota Transit Ridership Critical Connections
Measure explanation:
Greater Minnesota transit ridership is measured by the annual number of boardings recorded by Greater Minnesota transit providers. These boardings occur on different types of transit service, ranging from fixed route service in urban areas to route deviation or dial-a-ride service in small urban and rural settings.
System definition:
47 public transit systems serving 80 counties.
Why this is important:
Ridership measures the state’s progress toward its transit-related goals. Minnesota Stat. 174.01 defines these goals as 1) providing transit service in all counties that meets the needs of transit users, 2) increasing the use of high-occupancy and low-emission vehicles, and 3) increasing the use of transit as a percentage of all trips.
Transit ridership and service hours in Greater Minnesota again grew to record highs in 2015, with 12.2 million boardings and 1.24 million service hours. Service hours are the total number of hours that transit vehicles are available for public service. Ridership and service hours are below legislative targets set prior to the 2011 Greater Minnesota Transit Invest-ment Plan. The targets are to meet 80 percent of Greater Minnesota transit needs by 2015 (15 million passenger trips and 1.6 million service hours) and 90 percent by 2025 (current estimates are 18.8 million passenger trips and 1.9 million service hours).
Given forecast revenues, state and federal funding will be sufficient to continue progress from current levels toward the 2025 target through 2020. However, it will be difficult for some local partners to provide the required local funding match for that expansion. After 2020, state and federal funds will likely not grow enough to continue the expansion toward the 2025 target.
How this information is used
Greater Minnesota’s 47 public transit systems are operated by local governments, joint powers organizations, non-profits, and tribal governments. MnDOT supports them through planning, research, technical assistance, and management of state and federal transit funding programs. Consistent with the Greater Minnesota Transit Investment Plan, MnDOT’s first priority is continuation of financial assistance to systems meeting perfor-mance standards, then expanding transit service into new areas, and finally to expand the frequency, coverage and daily duration of service currently provided.
Learn more
MnDOT Office of Transitwww.dot.state.mn.us/transit
Des
ired
tren
dD
esir
ed tr
end
Annual bus service hours in Greater Minnesota counties (in millions)
2025201520142013201220112010200920082007
2025Target1.90
2015 Target
1.60
1.17 1.241.04 1.01 1.01 1.07 1.08 1.08 1.11
Source: Minnesota Transit Report
Source: Minnesota Transit Report
Annual boardings recorded by public transit providers serving Greater Minnesota counties (in millions)
2025201520142013201220112010200920082007
12.1 12.210.4 11.2 11.1 11.1 11.5 11.6 11.9
2015 Target15.0 M 2025
Target18.8 M

Annual Minnesota Transportation Performance Report: 2015 Page 26
Bicycle Use Critical Connections
Measure explanation:
Once a year MnDOT conducts an omnibus survey that measures public attitudes about MnDOT and various MnDOT services. Since 2006, this survey has included a question asking survey participants how often they rode a bicycle during the last bicycling season (April through October). Answer options are everyday, once a week, a few times/once a month, one time, or never.
System definition:
2015 survey results are based on 790 telephone interviews (501 land-line inter-views and 289 cell phone interviews) and 559 web-based surveys from a recruited, representative sample of adult Minnesota residents. Survey participants are identified through random, statistically valid sampling techniques. Geographic quotas and other demographic variables are enforced so that the sample population is representative of the state as a whole. The sample is large enough to produce estimates that are within 5 percent of the actual population data 95 percent of the time.
Why this is important:
The more often people ride bicycles, the more likely they are to be riding bicycles for a variety of purposes beyond recreation. Some Minnesotans who bicycle at least once a week already see bicycling as their primary mode of transportation; others may choose to bicycle more if network gaps were closed or if key corridors become more bicycle-friendly.
According to MnDOT’s annual omnibus survey, 21 percent of Minnesotans bicycled at least once a week during the non-winter months of 2015. This number is up from 18 percent in 2014, but overall the daily bike ridership has remained very consistent since 2006. With the exception of 2013, once per week ridership has remained relatively steady over the same period.
It is also interesting to note that the number of people who reported they never rode a bike also increased in 2015 to 55 percent after a drop to a low of 45 percent in 2013. The 2015 response is second only to the high of 57 percent in 2008. In addition people reporting they rode about once a month decreased significantly to 17 percent after being constant at 24 percent since 2009.
How this information is used
One of the goals of the Minnesota transportation system (Minn. Stat. Sec. 174.01) is to promote and increase bicycling as an energy-efficient, nonpolluting and healthy form of transportation. Performance measures like the frequency of bicycle riding help MnDOT determine if it is making progress towards these goals and if these efforts are making a difference.
In addition to tracking survey responses, MnDOT is implementing a program to count non-motorized traffic using automated technology similar to what is used to count motor vehicles. In 2015 MnDOT installed four permanent continuous systems on off-road and on-road facilities throughout the state, bringing the total to nine. By the end of 2016, MnDOT expects to have over 20 permanent, non-motorized counting systems in place.
MnDOT leads bicycle system planning at the state level and actively participates in national and regional efforts. The 2016 Statewide Bicycle System Plan was adopted in July. The plan identifies over-arching policy guidance and implementation tools, provide guidance to prioritize investments on the state highway network, and identifies performance measures to evaluate progress. Next steps include developing district-specific bicycle plans.
Learn more
MnDOT Office of Transit, Bike Infowww.dot.state.mn.us/bike/
MN Statewide Bicycle System Planwww.dot.state.mn.us/bike/system-plan.html
MnDOT Annual Omnibus SurveyDonna Koren — [email protected]
Percent of survey respondents who bicycled at least once a week during the bicycling season (April - October)
Des
ired
tren
d
Every Day Once a week
201520142013201220112010200920082007*2006
20 1921 21 21 20
25
1821
4 4 4 3 3 4 4 3 4
16 15 17 18 18 16 21 15 17
Source: MnDOT Omnibus Survey *No survey was conducted in 2007.

Annual Minnesota Transportation Performance Report: 2015 Page 27
Pedestrian Accessibility Critical Connections
Measure explanation:
MnDOT maintains a sidewalk inventory that includes data on sidewalk cross slope, condition and width. A sidewalk segment is deemed to be non-compliant with ADA standards if it is in “Poor” structural condition, has a greater than 2 percent cross slope, or is narrower than four feet. The term “Poor” is applied to sidewalks with a condition rating of 3 (sidewalk has vertical discontinuities more than 1/2 inch) or 4 (sidewalk is crumbling and/or has many cracks).
System definition:
Sidewalks in state highway right of way (620 miles of sidewalk).
Why this is important:
Accessible roadways are a critical component of a transportation system that preserves and enhances the mobility of all Minnesotans regardless of age, income or ability. A poorly designed or maintained sidewalk inhibits mobility, particularly for the elderly and those using a wheelchair or other assistive device. Poor sidewalks may also contribute to an inhospitable pedestrian envi-ronment at an important pedestrian network link. By identifying where poor sidewalk conditions exist, this measure creates the opportunity to target investment toward state highways with the greatest need for pedestrian improvements.
Learn more
MnDOT pedestrian informationwww.dot.state.mn.us/peds/
MnDOT ADA Programwww.dot.state.mn.us/ada
U.S. Department of Justice ADA www.ada.gov
MnDOT completed its sidewalk inventory in 2013 and identified 284 miles of 620 total sidewalk along state highways that comply with the Americans with Disabilities Act. This represents 46 percent of sidewalk-miles along state highways. Driveways with excessive slope are the most common deficiency in the network. MnDOT expects near-term changes in sidewalk condition to be modest due to limited budget and the long life cycle of sidewalks. MnDOT often delays sidewalk improvements until the adjacent roadway needs reconstruction because it is typically more cost effective to replace highways and sidewalks at the same time.
Source: MnDOT Operations Division – Shared Services
MnDOT also evaluates ADA compliance by measuring both the number of curb ramps that meet ADA standards and the percentage of eligible state highway intersections with accessible pedestrian signals, or APS, installed. As of 2014, 24 percent of the curb ramps on the state highway system were completely compliant with current ADA standard and 30 percent were compliant except for detectable warnings. The slight growth in compliant ramps is due in part to MnDOT adding new curb ramps and improving existing curb ramp at many locations that were previously served by one diagonal curb ramp are now served by two perpendicular ramps.
28%18% 30%
2012 2013 2014
Source: MnDOT Operations Division – Shared Services
Percent of state highway curb ramps that are compliant with ADA requirements
Des
ired
tren
dD
esir
ed tr
end
55%41% 46%
Greater MinnesotaDistricts
MetroDistrict
Statewide
Percent of state highway sidewalk miles that are compliant with ADA requirements
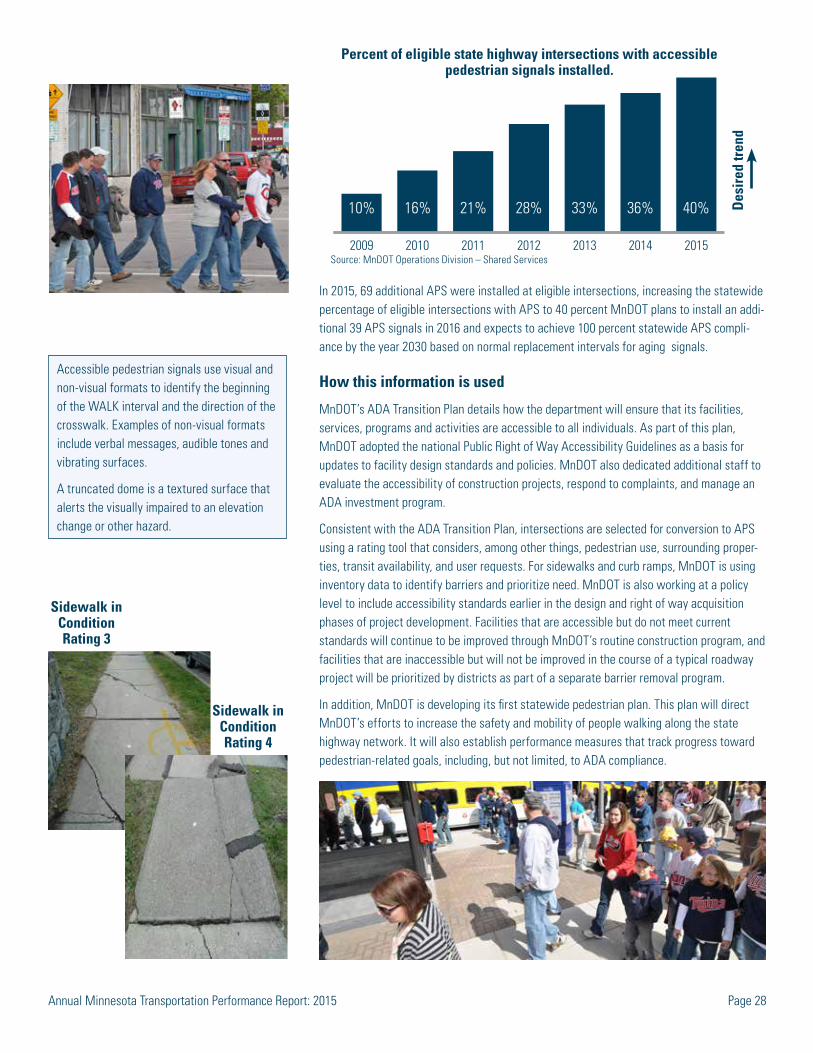
Annual Minnesota Transportation Performance Report: 2015 Page 28
Accessible pedestrian signals use visual and non-visual formats to identify the beginning of the WALK interval and the direction of the crosswalk. Examples of non-visual formats include verbal messages, audible tones and vibrating surfaces.
A truncated dome is a textured surface that alerts the visually impaired to an elevation change or other hazard.
In 2015, 69 additional APS were installed at eligible intersections, increasing the statewide percentage of eligible intersections with APS to 40 percent MnDOT plans to install an addi-tional 39 APS signals in 2016 and expects to achieve 100 percent statewide APS compli-ance by the year 2030 based on normal replacement intervals for aging signals.
How this information is used
MnDOT’s ADA Transition Plan details how the department will ensure that its facilities, services, programs and activities are accessible to all individuals. As part of this plan, MnDOT adopted the national Public Right of Way Accessibility Guidelines as a basis for updates to facility design standards and policies. MnDOT also dedicated additional staff to evaluate the accessibility of construction projects, respond to complaints, and manage an ADA investment program.
Consistent with the ADA Transition Plan, intersections are selected for conversion to APS using a rating tool that considers, among other things, pedestrian use, surrounding proper-ties, transit availability, and user requests. For sidewalks and curb ramps, MnDOT is using inventory data to identify barriers and prioritize need. MnDOT is also working at a policy level to include accessibility standards earlier in the design and right of way acquisition phases of project development. Facilities that are accessible but do not meet current standards will continue to be improved through MnDOT’s routine construction program, and facilities that are inaccessible but will not be improved in the course of a typical roadway project will be prioritized by districts as part of a separate barrier removal program.
In addition, MnDOT is developing its first statewide pedestrian plan. This plan will direct MnDOT’s efforts to increase the safety and mobility of people walking along the state highway network. It will also establish performance measures that track progress toward pedestrian-related goals, including, but not limited, to ADA compliance.
Des
ired
tren
d
2015201420132012201120102009
10% 16% 21% 28% 33% 36% 40%
Percent of eligible state highway intersections with accessible pedestrian signals installed.
Source: MnDOT Operations Division – Shared Services
Sidewalk in Condition Rating 3
Sidewalk in Condition Rating 4
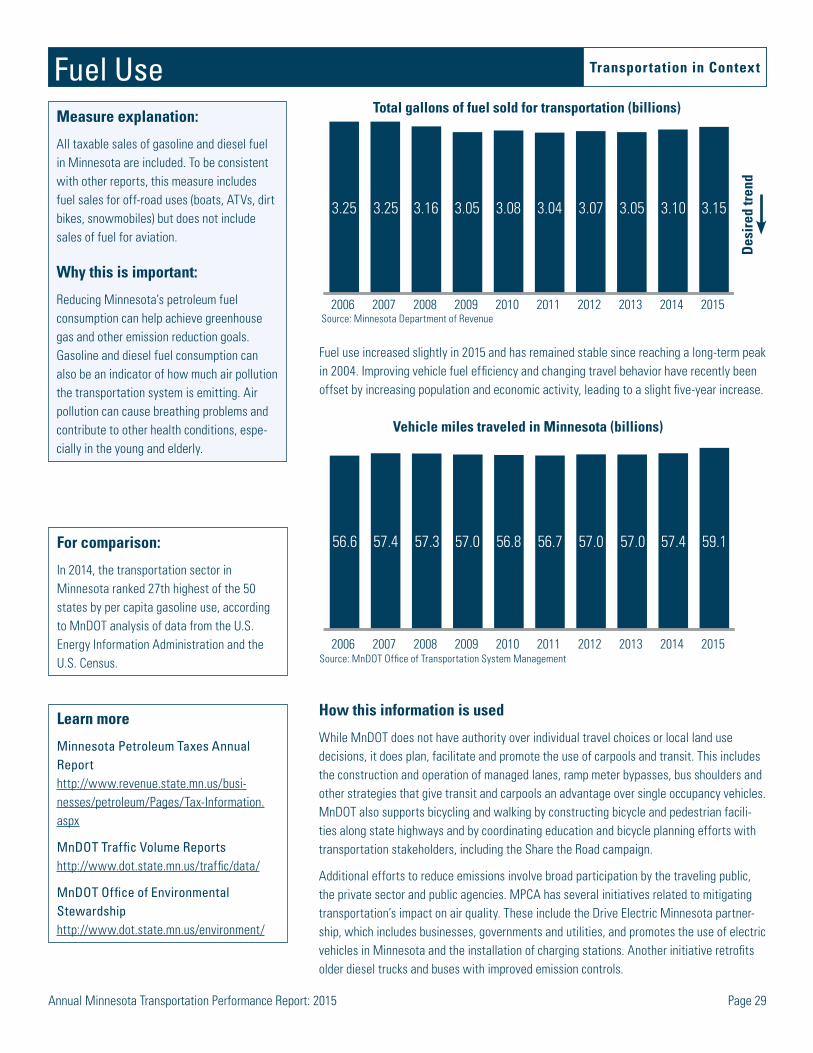
Annual Minnesota Transportation Performance Report: 2015 Page 29
Transportation in Context
Fuel Use Transportation in Context
Measure explanation:
All taxable sales of gasoline and diesel fuel in Minnesota are included. To be consistent with other reports, this measure includes fuel sales for off-road uses (boats, ATVs, dirt bikes, snowmobiles) but does not include sales of fuel for aviation.
Why this is important:
Reducing Minnesota’s petroleum fuel consumption can help achieve greenhouse gas and other emission reduction goals. Gasoline and diesel fuel consumption can also be an indicator of how much air pollution the transportation system is emitting. Air pollution can cause breathing problems and contribute to other health conditions, espe-cially in the young and elderly.
Fuel use increased slightly in 2015 and has remained stable since reaching a long-term peak in 2004. Improving vehicle fuel efficiency and changing travel behavior have recently been offset by increasing population and economic activity, leading to a slight five-year increase.
Source: MnDOT Office of Transportation System Management
How this information is used
While MnDOT does not have authority over individual travel choices or local land use decisions, it does plan, facilitate and promote the use of carpools and transit. This includes the construction and operation of managed lanes, ramp meter bypasses, bus shoulders and other strategies that give transit and carpools an advantage over single occupancy vehicles. MnDOT also supports bicycling and walking by constructing bicycle and pedestrian facili-ties along state highways and by coordinating education and bicycle planning efforts with transportation stakeholders, including the Share the Road campaign.
Additional efforts to reduce emissions involve broad participation by the traveling public, the private sector and public agencies. MPCA has several initiatives related to mitigating transportation’s impact on air quality. These include the Drive Electric Minnesota partner-ship, which includes businesses, governments and utilities, and promotes the use of electric vehicles in Minnesota and the installation of charging stations. Another initiative retrofits older diesel trucks and buses with improved emission controls.
For comparison:
In 2014, the transportation sector in Minnesota ranked 27th highest of the 50 states by per capita gasoline use, according to MnDOT analysis of data from the U.S. Energy Information Administration and the U.S. Census.
Learn more
Minnesota Petroleum Taxes Annual Reporthttp://www.revenue.state.mn.us/busi-nesses/petroleum/Pages/Tax-Information.aspx
MnDOT Traffic Volume Reportshttp://www.dot.state.mn.us/traffic/data/
MnDOT Office of Environmental Stewardshiphttp://www.dot.state.mn.us/environment/
Des
ired
tren
d
Total gallons of fuel sold for transportation (billions)
2015201420132012201120102009200820072006
56.6 57.4 57.057.3 56.8 56.7 57.0 57.0 57.4 59.1
Vehicle miles traveled in Minnesota (billions)
Source: Minnesota Department of Revenue2015201420132012201120102009200820072006
3.25 3.25 3.053.16 3.08 3.04 3.07 3.05 3.10 3.15

Annual Minnesota Transportation Performance Report Page 30
Stre
ets,
road
s an
d hi
ghw
ays
Tran
sit
Rail
Wat
erw
ays
Air
Transportation Systems in MinnesotaCategory
System Size Ownership Funding source MnDOT roleStreets, roads and highways
State Trunk Highways 11,814 miles
State fuel tax, motor vehi-cle sales tax, registration fees, federal funds
Construction, operation, maintenance, management
Streets, roads and highways
County State Aid
Highways30,624 miles Counties own 16 percent of the system by centerline miles and 24 percent by vehicle-miles traveled. State fuel tax, motor vehicle sales tax, registration fees, federal funds, local funds Coordination of projects that impact state trunk highways, administration of state and federal funding (68% of county roads and 15 % of city streets are eligible for state aid funds)
Streets, roads and highways
Other County Roads
14,197 miles Counties own 16 percent of the system by centerline miles and 24 percent by vehicle-miles traveled.
State fuel tax, motor vehicle sales tax, registration fees, federal funds, local funds Coordination of projects that impact state trunk highways, administration of state and federal funding (68% of county roads and 15 % of city streets are eligible for state aid funds)
Streets, roads and highways
Municipal State Aid
Sreets3,505 miles Cities own 16 percent of the system by centerline miles and 16 percent by vehicle-miles traveled.
State fuel tax, motor vehicle sales tax, registration fees, federal funds, local funds Coordination of projects that impact state trunk highways, administration of state and federal funding (68% of county roads and 15 % of city streets are eligible for state aid funds)
Streets, roads and highways
Other City Streets 18,911 miles Cities own 16 percent of the system by centerline miles and 16 percent by vehicle-miles traveled. State fuel tax, motor vehicle sales tax, registration fees, federal funds, local funds Coordination of projects that impact state trunk highways, administration of state and federal funding (68% of county roads and 15 % of city streets are eligible for state aid funds)
Streets, roads and highways
Township 58,686 miles State and local funds Coordination of projects that impact state trunk highways
Streets, roads and highways
Other 5,177 miles
State and local funds Coordination of projects that impact state trunk highways
Streets, roads and highways
Total 142,914 miles State and local funds Coordination of projects that impact state trunk highways
Transit
Twin Cities Area
213 bus routes, 1 bus rapid transit and 2 light rail routes, 1 commuter
rail route, demand response systems
Metropolitan Council (including Metro Transit and contracted operators), Suburban Transit Providers, and University of Minnesota
Construct and maintain transit infrastructure on state roads
Transit
Greater Minnesota
47 public transit systems serving 80
counties
Local governments, joint powers organiza-tions, non-profits, and tribal governments Administration of funding
Rail
Freight 4,444 track-miles21 railroads operate and own track: 4 Class I (82% of network), 1 Class II (1%) 14 Class III (16%) and 2 private (1%)
Private funds for opera-tions, state and private funds for track
Planning and policy, support for infrastructure improvements
Rail
Passenger Rail
Amtrak Empire Builder (Chicago to Seattle) Federally operated on privately owned track Federal funds, fares
Planning, policy, research, federal and state program ad-ministration
Air
Passenger and Cargo
135 airports, 9 with airline service
Airports are owned by cities, counties and airport authorities. Metropolitan Airport Commission owns MSP and eight other airports.
Aircraft registration tax, aircraft sales taxes, airline flight property tax, aviation fuel tax, federal funds, local funds
Collection of aviation taxes, administration of state and federal funds, planning, policy, licensure, inspection, naviga-tion systems, education, and research
Waterways
Great Lakes Four ports on Lake Superior
Local port authorities and private companies provide port operations. Channels (9 ft. draft on rivers, 29 ft. on Great Lakes) are maintained by the U.S. Army Corps of Engineers. Local port authority receipts, state general funds, federal funds Planning and policy, support for infrastructure improvements
Waterways
RiversFour ports on 222 miles of the Mississippi River
systemLocal port authorities and private companies provide port operations. Channels (9 ft. draft on rivers, 29 ft. on Great Lakes) are maintained by the U.S. Army Corps of Engineers. Local port authority receipts, state general funds, federal funds Planning and policy, support for infrastructure improvements
Local port authority re-ceipts, state general funds, federal funds
By share of centerline miles:
By share of vehicle-miles traveled:
Coordination of projects that impact state trunk highways, administration of state and federal funding (68% of county roads and 15% of city streets are eligible for state aid funds)
State fuel tax, motor vehi-cle sales tax, registration fees, federal funds, local funds
State and local fundsCoordination of projects that impact state trunk highways
Motor vehicle sales tax, Counties Transit Improve-ment Board sales tax (in five Metro counties only), state general funds, federal funds, local funds, fares
Planning and policy, support for infrastructure improvements
Local port authorities and private companies provide port operations. Channels (9 ft. draft on rivers, 29 ft. on Great Lakes) are main-tained by the U.S. Army Corps of Engineers.
Other
Township
City
County
State4%
8%
16%
41% 31%
OtherTownship
City
CountyState
2% 0%
58%
16%
24%