Annual movement patterns, nutrition and antler characteristics of moose in Game Management Unit 20D Kalin A. Kellie, Stephen D. DuBois, Thomas F. Paragi and Cameron J. Carroll Final Report to the Military in Fulfillment of: U. S. Army Contract W912CZ-08-D-0012, Delivery Order #7 Federal Aid Project 1.67 1 July 2009–30 June 2011
Transcript
Annual movement patterns, nutrition and antler characteristics
of moose in Game Management Unit 20D
Kalin A. Kellie, Stephen D. DuBois, Thomas F. Paragi and Cameron J. Carroll
Final Report to the Military in Fulfillment of:
U. S. Army Contract W912CZ-08-D-0012, Delivery Order #7
Federal Aid Project 1.67
1 July 2009–30 June 2011
Overview
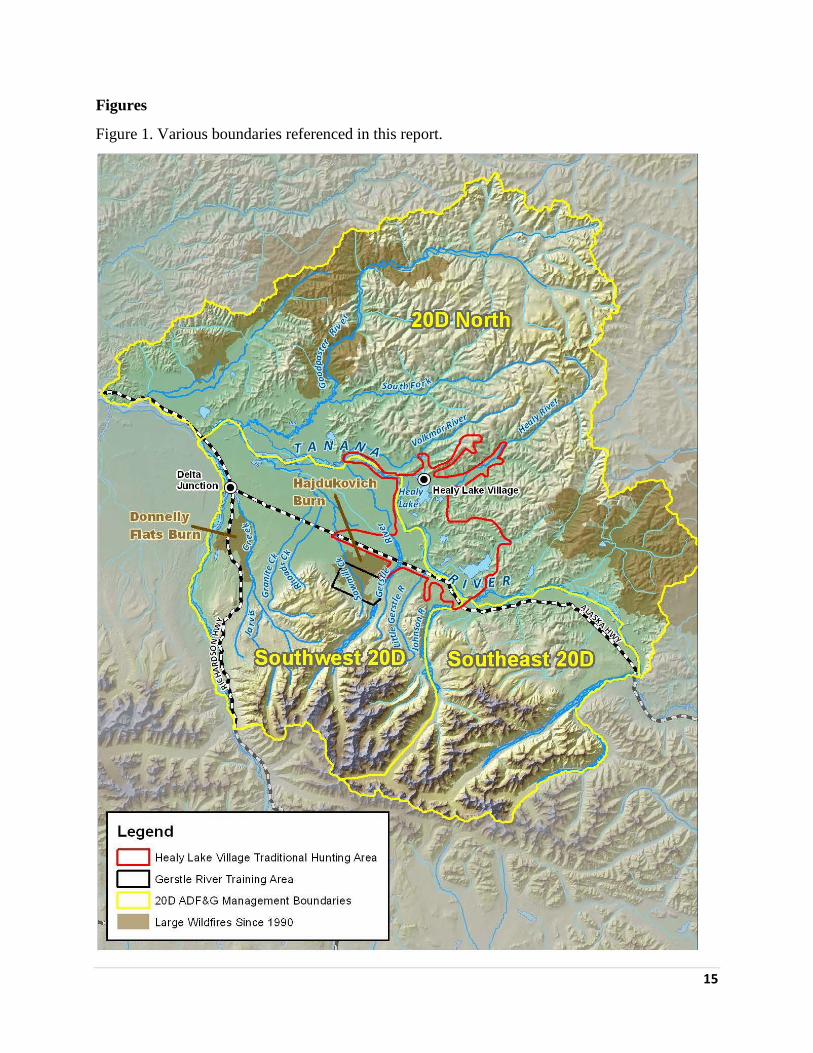
The southwest portion of Game Management Unit (GMU) 20D (Southwest 20D, Fig. 1) is an
important resource to Alaskans because it is easily accessible to hunters and provides a large
harvest of moose each year. Prior to and throughout this study, the moose population in
Southwest 20D was at an elevated density (Gasaway et al. 1992; Dubois 2010). In addition,
twinning rates, a measure of population nutrition, were declining (Boer 1992, Gasaway et al.
1992, DuBois 2010). From 2007-2008 the population was reduced through large harvests of
antlerless moose from 5.5 moose/mi2
in 2006 to 3.8 moose/mi2
in 2008 to reduce density-related
nutritional stress, reduce long-term range damage and increase opportunity for harvest (Boertje
et al. 2007, DuBois 2010). Following this reduction in moose density, additional indices were
needed to document and assess resulting moose nutrition and range condition. Also, managers
lacked information on moose movement patterns and shifts in distribution between population
surveys, twinning surveys and hunting seasons. The Alaska Department of Fish and Game
(ADF&G) prioritized additional moose research in Southwest 20D to improve estimates of
nutrition, population abundance and moose movement relative to harvest and surveys.
The Gerstle River Training Area (GRTA) is a U.S. Army Garrison Alaska (USAGAK) military
operating area within Southwest 20D. Decades ago, the GRTA area was used as a test site for
chemical weapons. Residents of nearby Healy Lake village (Fig. 1) recently voiced concerns
that the weapons testing may have caused long-term contamination of plants and animals
harvested for subsistence. As a result, the USAGAK prioritized research to measure
contamination levels in subsistence foods, including moose. Further, USAGAK prioritized
research to document moose movement patterns around the GRTA and areas that residents of the
Healy Lake village use to hunt moose.
Federal Aid Project 1.67 combined ADF&G and USAGAK priorities for moose research. We
document movements and distribution of moose relative to Southwest 20D, the GRTA, the
Healy Lake village traditional hunting area (HLVTHA), population survey areas, and twinning
survey areas. Contaminant testing was conducted by the U.S. Fish and Wildlife Service
(USFWS) on moose tissue samples (reported elsewhere) obtained during this study. In addition,
we collected several indices to measure moose nutrition and winter range condition following the
reduction in moose density in Southwest 20D. Finally, a correction factor was developed for use
with GSPE surveys to improve the accuracy of moose population estimates. This report
summarizes the research conducted in Southwest 20D under Federal Aid Project 1.67 and 5.20
(browse survey) and fulfills contract W912CZ-08-D-0012, Delivery Order #7 to U.S. Army
Alaska.
Study Area
GMU 20D (5637 mi2; Fig. 1) encompasses the drainages North and South of the Tanana River
from Shaw Creek to the Johnson River (Dubois 2010). Southwest 20D (1502 mi2; Fig 1) is a
2
portion of GMU 20D that encompasses land south of the Tanana River and west of the Johnson
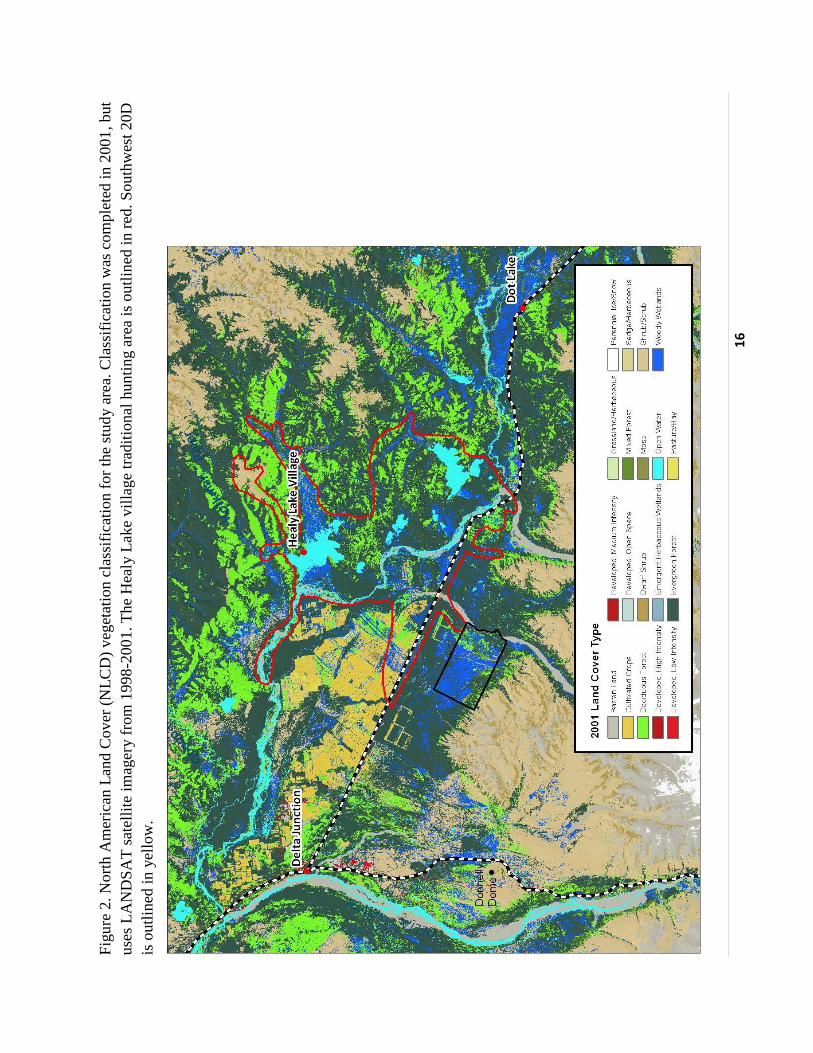
River and includes the town of Delta Junction and large tracts of agricultural land (Fig. 2).
Southwest 20D includes the highest densities of moose in GMU 20D and the most extensive
access for hunting (Dubois 2010). The northern portion of GMU 20D (20D North; 3207 mi2; Fig
1) which extends North from the Tanana River to the boundary of GMU 20D has relatively
lower moose density, is more difficult to access and includes Healy Lake and Healy Lake village
(Dubois 2010). The Gerstle River Training Area (GRTA; 30.5 mi2; Fig 1) is a parcel of military
land located within Southwest 20D adjacent to the west bank of the Gerstle River south of the
Alaska Highway. The HLVTHA (300 mi2; Fig. 1) was delineated by local residents of Healy
Lake Village and includes portions of the Tanana River and the Healy River drainage.
The habitat in GMU 20D is typical of northern boreal forest, with the exception of large plots of
agricultural land that are frequently disturbed (Fig. 2). Two large burn scars from the
Hajdukovich (1994, 34 mi2) and Donnelly Flats (1999, 29 mi
2, Fig. 1) burns were within the
distribution of collared moose (Fig. 3), and the Hajdukovich burn overlaps significantly with the
GRTA (Fig 1.). The habitat of Southwest 20D has been described in detail elsewhere (Lord
2008, Seaton et al. 2011)
Methods
Moose Capture
All moose were darted from a Robinson R-44 Raven II helicopter delivered in a dart (1-cc for
calves, 3-cc for adults) by a Palmer Cap-Chur (Powder Springs, GA) dart gun. Blood and hair
samples from adults and some calves were transferred to Angela Matz (USFWS) for
contaminants testing. We conducted all aspects of this research in accordance with acceptable
methods for field studies adopted by the American Society of Mammalogists (Animal Care and
Use Committee 1998; Alaska Department of Fish and Game Protocol 09-001).
In October 2009 ADF&G we captured male moose in 20D North and Southwest 20D with a
focus on the GRTA (Fig. 3). We targeted large male moose because their movements would best
represent patterns of moose that were legal to harvest (50” antler width or greater) and were
therefore the segment most likely to be harvested for human consumption. Moose that have been
chemically immobilized should not be harvested within 30 days of immobilization to ensure that
no harmful residues remain in meat (Beckmen 2009). Thus, we captured adult males in mid-
October because this period was as close to hunting season that we could immobilize animals
without interfering with hunting or the rut. Southwest 20D (Fig. 2) experiences high rates of
moose harvest and we increased our sample size in this area to correct for sample losses to
hunting during the September 2010 season. We collected body and antler measurements, blood
and hair for contaminants testing, photos of antlers, and a canine tooth for age estimation. All
males were fitted with Telonics (Mesa, AZ) VHF radio-collars with an expandable section
designed to accommodate neck swelling during the rut and a cotton spacer designed to rot and
3
drop the collar 3-4 years after deployment. We used a mixture of 4.0 mg Carfentanil citrate and
120 mg Xylazine for immobilization, administered 36 mL of procaine penicillin G to prevent
infection and 425 mg of Naltrexone and 500 mg of Tolazoline to reverse immobilization. We
determined adult ages using counts of cementum annuli (Gasaway et al. 1978).
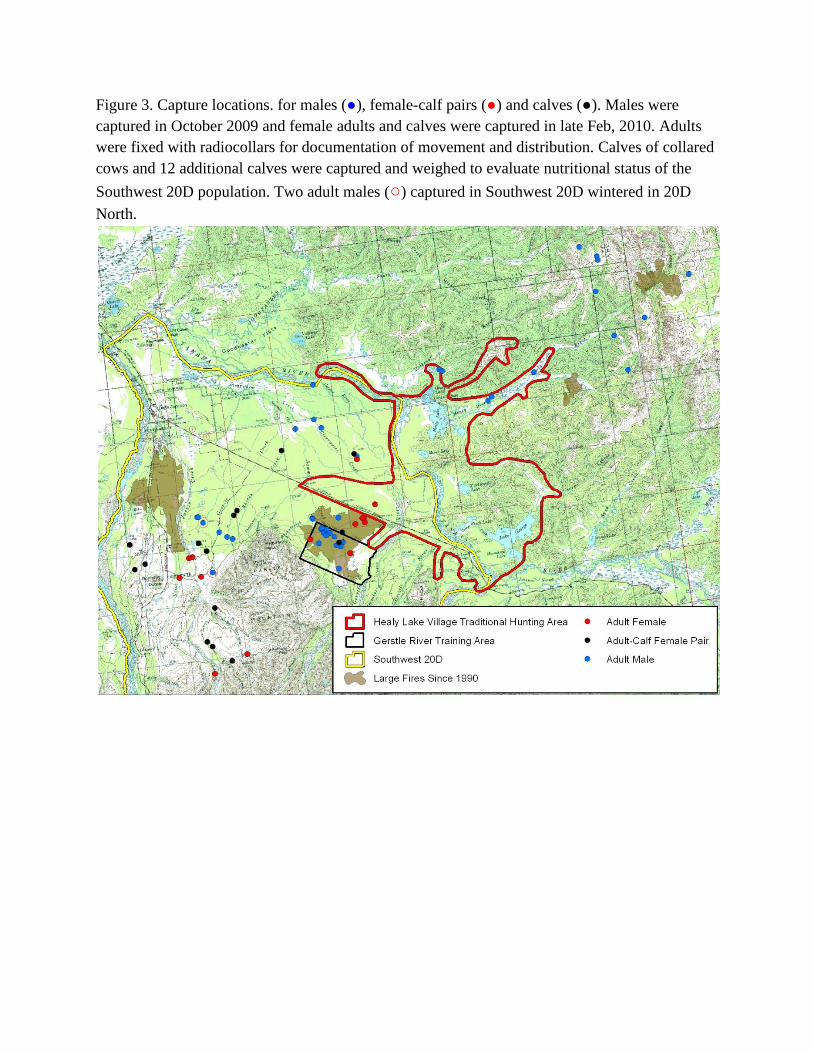
In late February 2010, we captured female-calf pairs and calves in Southwest 20D (Fig. 3). We
chose this time period because it coincided with data collected in other areas of the state and
allowed comparisons of body metrics across populations. Sex and litter size are known to cause
variation in body mass of calves at birth (Keech et al. 2000) and calves do not compensate for
these differences in weight at 9 months (Keech et al. 1999, Boertje et al. 2007). To avoid this
additional variation, we only captured singleton female calves and female-calf pairs where the
dam was accompanied by a single, female calf. We immobilized adult females using a mixture of
4.2 mg Carfentanil citrate and 160 mg Xylazine and calves received a mixture of 1.2 mg
Carfentanil citrate and 60 mg Xylazine. For adult females, we administered 30 ml of procaine
penicillin G to prevent infection followed by 425 mg Naltrexone and 340 mg Tolazoline to
reverse immobilization. For calves, we administered 125mg Naltrexone and 200mg Tolazoline
to reverse immobilization but did not administer any antibiotics. All adult females were fitted
with Telonics (Mesa, AZ) VHF radio-collars and all calves were given a unique ear tag for
identification. We recorded body measurements, collected hair and blood, and pulled a canine
tooth for age estimation of adults. All calves were weighed using a net and tripod assembly and a
500-pound dial scale. Blood serum was sent to Biotracking LLC (Moscow, ID) for analysis using
the pregnancy-specific protein B (PSPB; Sasser et al. 1986).
Browse assessment
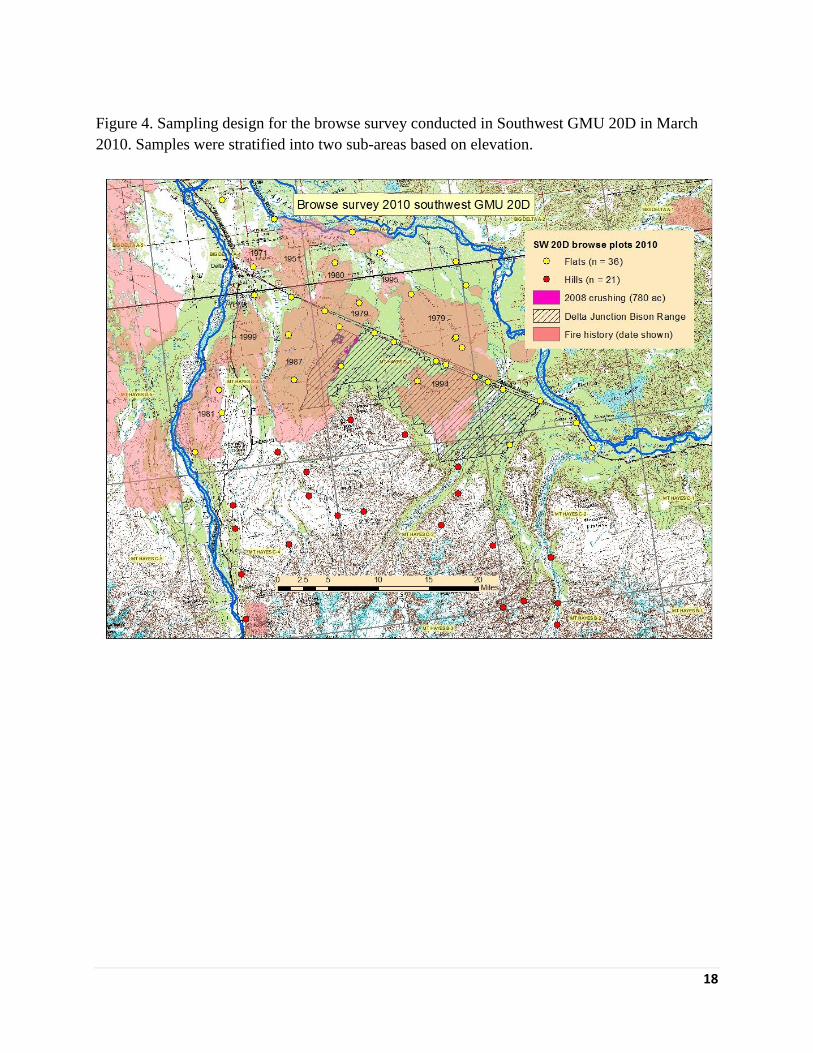
The browse survey was conducted during 5-8 April 2010 according to methods of Seaton et al.
(2011) cooperatively with Federal Aid Project 5.20. The 2010 sampling methods were similar to
a 2007 browse survey in the same study area (Fig. 4) described in Paragi et al. (2008). In 2010
we used a Robinson R-44 helicopter to sample 21 plots in the foothills and 22 plots in the flats.
We accessed an additional 14 plots in the flats using a pickup truck, taking random 15-100 steps
toward a plot from the closest perpendicular distance along a road. We used the same browse
diameter-dry mass relationships as the 2007 survey to estimate browse production and removal
(Paragi et al. 2008).
Monitoring
From capture date until 21 May 2011 radiocollared moose were located twice a month from
fixed-wing aircraft and their location recorded using a Garmin (Olathe, KS) GPSMap 296.
During each flight, we attempted to view every animal and verify the presence of a collar, but on
occasion, dense vegetation obscured the moose. In October 2010, we photographed the antlers
of radiocollared males. During winters 2009-2010 and 2010-2011 from November through
March we recorded the presence or absence of antlers for all male moose that were seen. We also
4
recorded the presence or absence of a calf or yearling for all female moose that were seen. We
investigated all mortalities as soon as possible and determined cause of death.
Sightability
We used radiocollared moose to test observers during the 2009 and 2010 GSPE surveys in
Southwest 20D. During the 2009 survey, only male moose were available but during the 2010
survey both female and male radiocollared moose were used. To measure sightability of moose,
a radiotracking plane verified the presence of a collared moose in a survey unit. After that unit
had been surveyed, the radiotracking plane conferred with the survey plane to determine whether
the collared moose was seen during the survey. Each opportunity to view a collared moose was
considered a sightability trial and all trials were combined to calculate the sightability for that
survey (Gasaway et al. 1986; Kellie and Delong 2006). We used the Delta method (Boertje et al.
2009) to calculate the 2009-2010 sightability correction factor (SCF).
Movements
We calculated minimum convex polygons (MCPs; Mohr 1947) using the Minimum Bounding
Geometry tool in ArcMap 10.0 (ESRI, Redland, CA) to provide basic descriptions of range size
and to provide boundaries for random locations used in habitat comparisons. Ranges were only
calculated for moose where >15 locations were obtained. We obtained range perimeters by
dissolving the MCP ranges of individual moose for particular season/sex/area combinations into
a single polygon from which we drew random points. To examine habitat selection, we
compared vegetation type at moose locations with vegetation type at an equal number of random
locations from within the same range perimeter. We used the National Land Cover Dataset
(NLCD, 2001, http://www.epa.gov/mrlc/nlcd-2001.html; Fig. 2) for vegetation classifications.
We used the GLM function in R (R statistical software, version 2.10.1, 2009), to examine
relationships between age, antler size and study area for adult male moose.
Results
We presented preliminary results from this research to the Delta Fish and Game Advisory
Committee and other members of the public in Delta Junction on 27 April 2011. We also
prepared a poster displaying antlers for 42 males photographed during handling in October 2009
and aerial photos from October 2010 for the 26 of the remaining males.
Moose Measurements and Nutrition
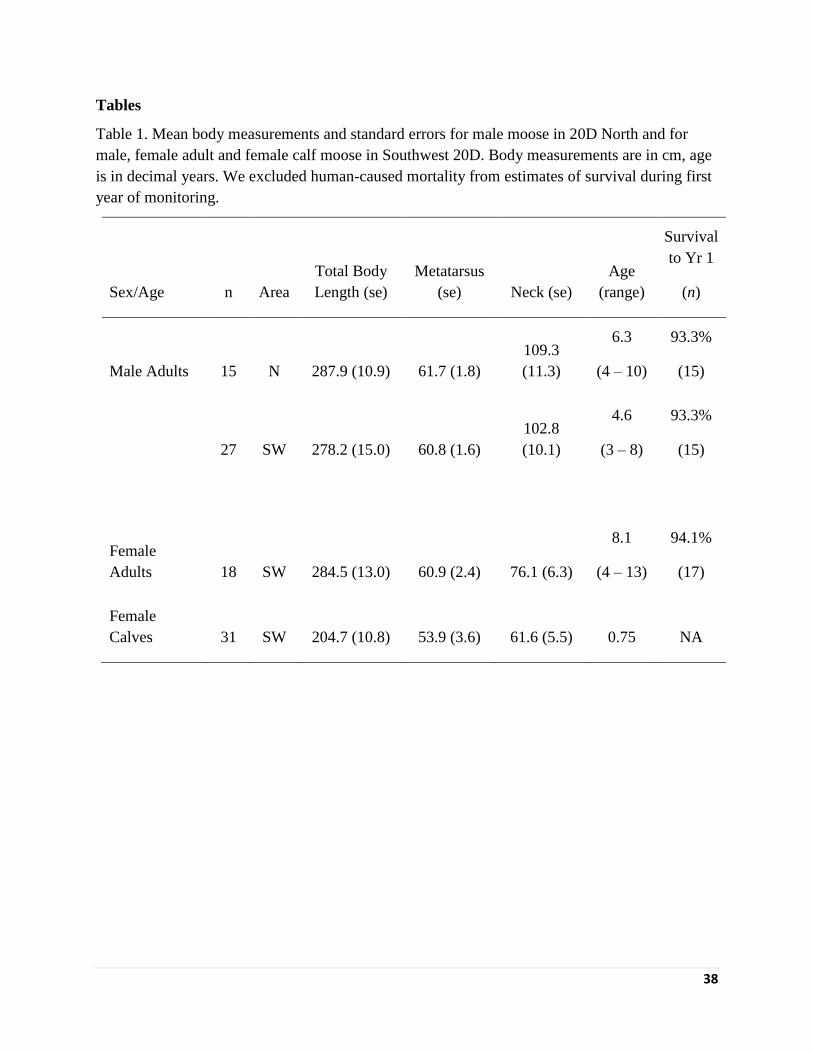
In October 2009, we captured 15 adult males in 20D North and 27 adult males in Southwest
20D. In addition, in late February 2010 we captured 18 female-calf pairs and an additional 13
female calves (Fig. 3). Based on counts of cementum annuli, 20D North males were on average
1.7 years older than males in Southwest 20D. In Southwest 20D, adult females were on average
3.5 years older than adult males (Table 1). Of the 18 cows tested, 4 were not pregnant (22%;
ages: 5, 5, 7 and 11). One of the 4 that tested negative PSPB was the 5-year-old female that died
shortly after capture. Necropsy revealed a large tumor in the cervix that likely prevented
pregnancy from occurring.
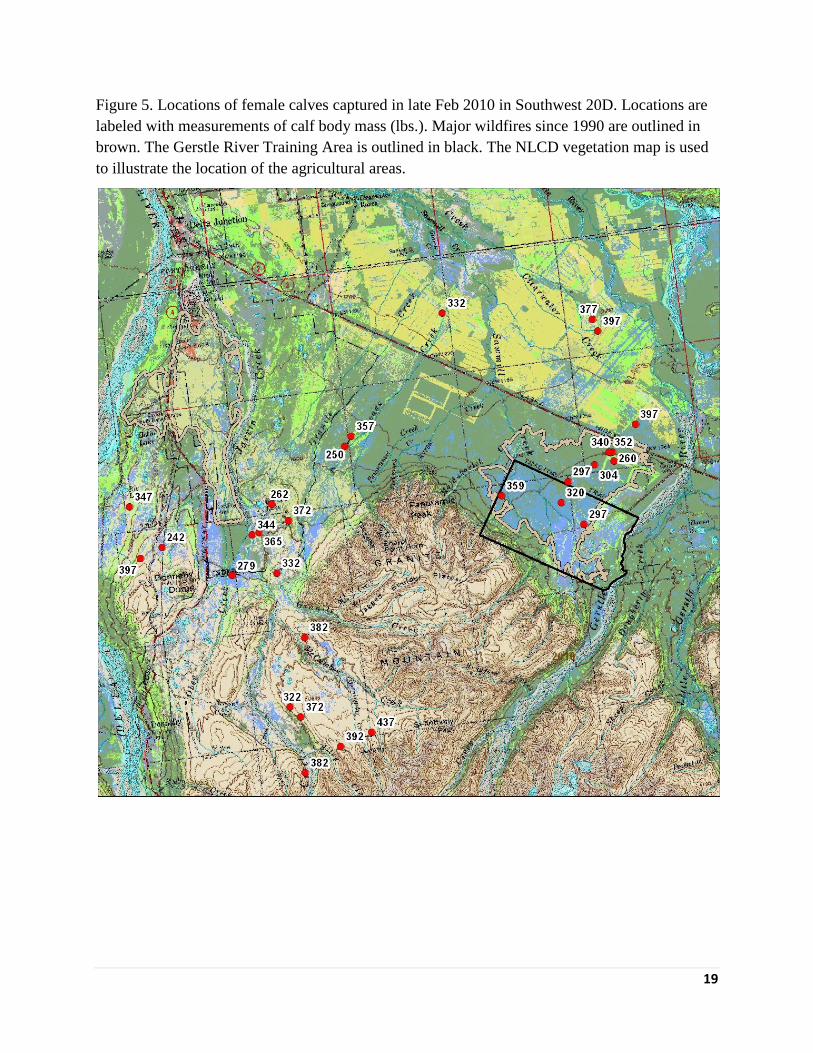
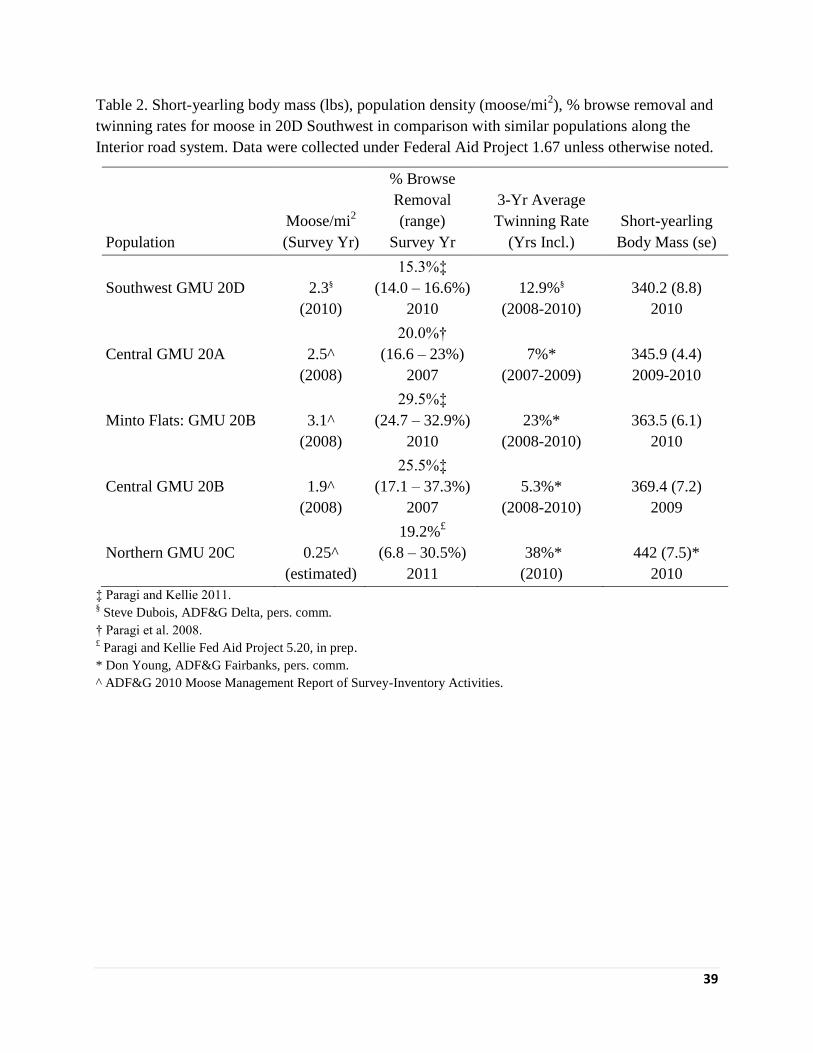
The mean mass of nine-month old calves in Southwest 20D was 340.2 pounds (n = 31; se = 8.8;
Table 2). We focused calf sampling in the flats of Southwest 20D, but also sampled 6 calves in
the hills (Fig. 3). Although sample sizes were inadequate for contrasting among smaller areas
within Southwest 20D, it appears that calves may be smaller in the Hajdukovich burn and in the
lake system just east of Donnelly Dome than in the hills and in the agricultural areas north of the
Alaska Highway (Fig. 5).
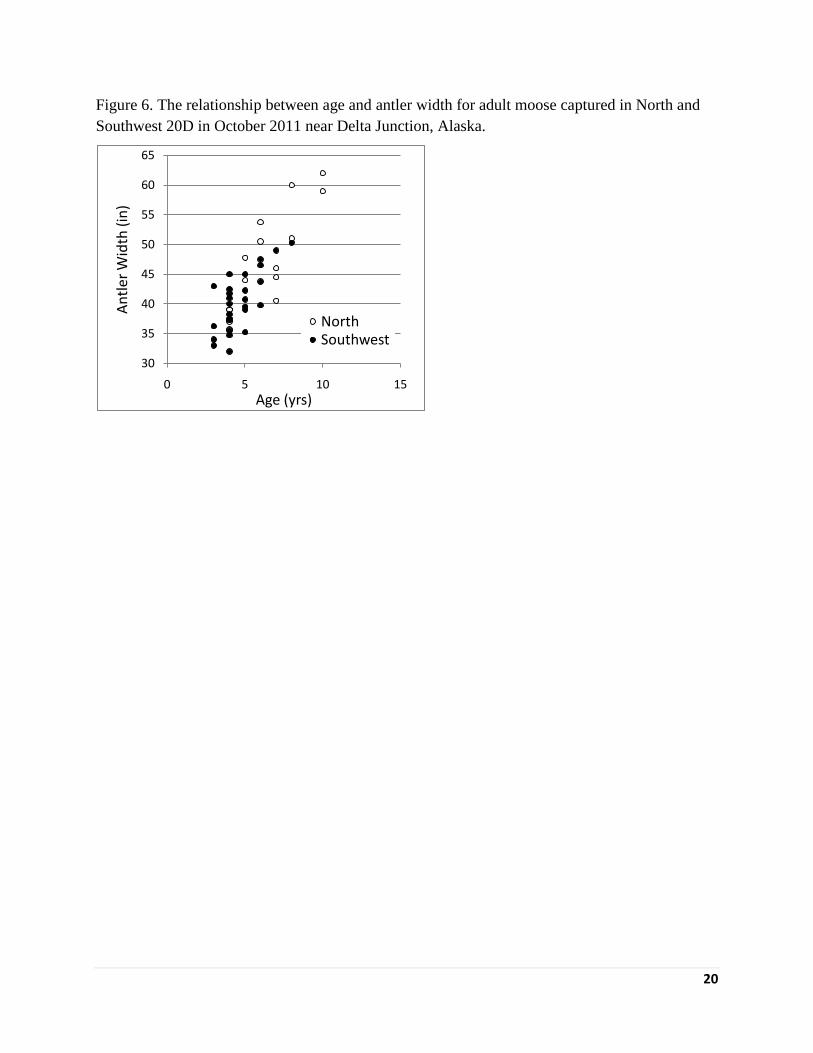
Male moose in 20D North were larger than males in Southwest 20D (Table 1), but this difference
was largely explained by age differences between the two areas rather than developmental
differences caused by nutritional stress in Southwest 20D. For example, antler width increased
with moose age (t = 9.53; P > 0.001) but there was no difference in antler width between study
areas (t = -0.805; P = 0.426) once the relationship with age was considered. The overlap in antler
dimensions of individual males from 20D North and Southwest 20D within age classes illustrates
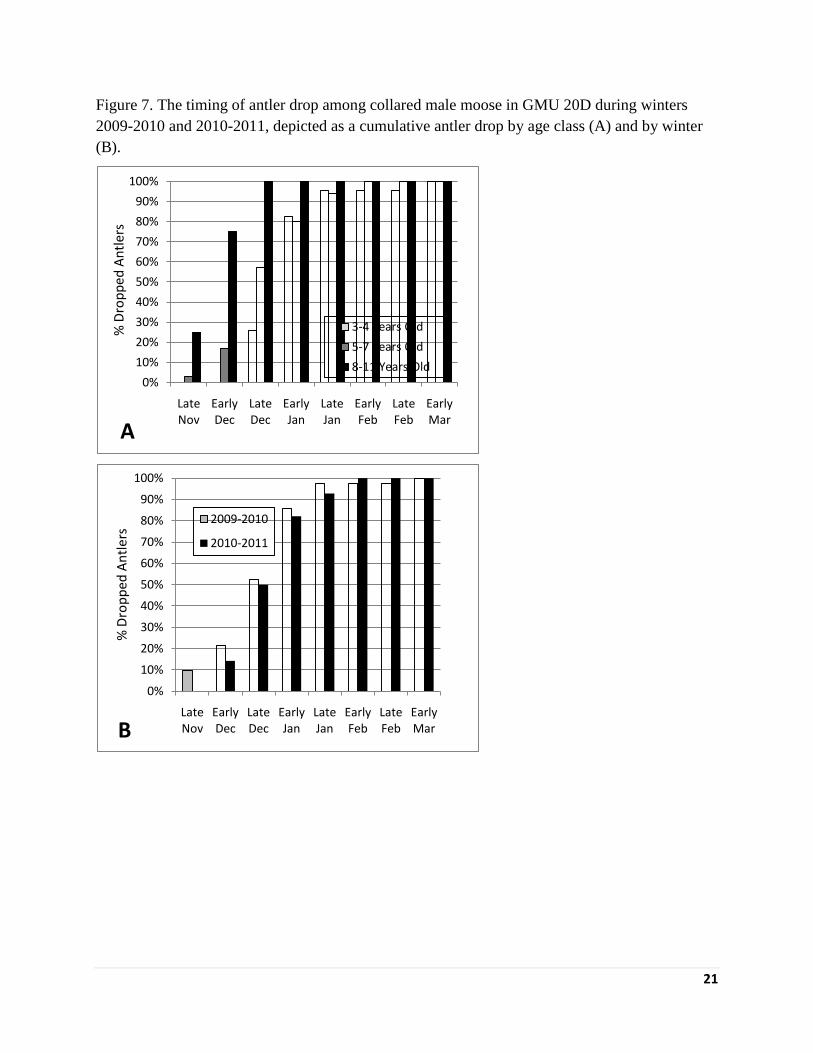
the lack of a nutritional effect (Fig. 6). The same individuals were monitored for antler drop in
2009-2010 as 2010-2011, except for those harvested during the autumn 2010 hunting season.
Median antler drop occurred in late December overall (n = 70) and within years younger males
dropped their antlers later in the winter than older adults (Fig. 7). However, although mean age
was one year later in 2010-2011 (6.4 versus 5.3), antler drop was earlier during the 2009-2010
winter (late December, n = 43) than during the 2010-2011 winter (early January, n = 28; Fig. 7).
Further, only 15 of 28 (54%) individual males dropped their antlers earlier in 2010-2011 when
they were 1 year older.
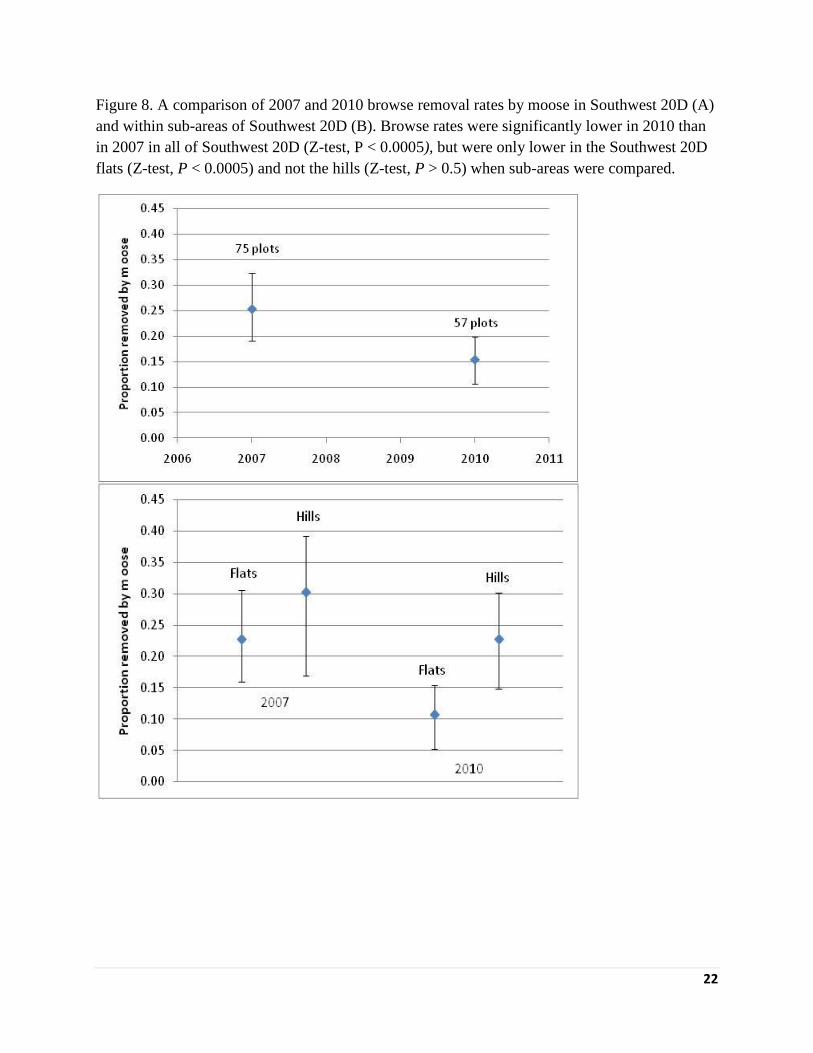
Proportional removal of browse biomass in the study area was lower in 2010 than 2007 (Z-test, P
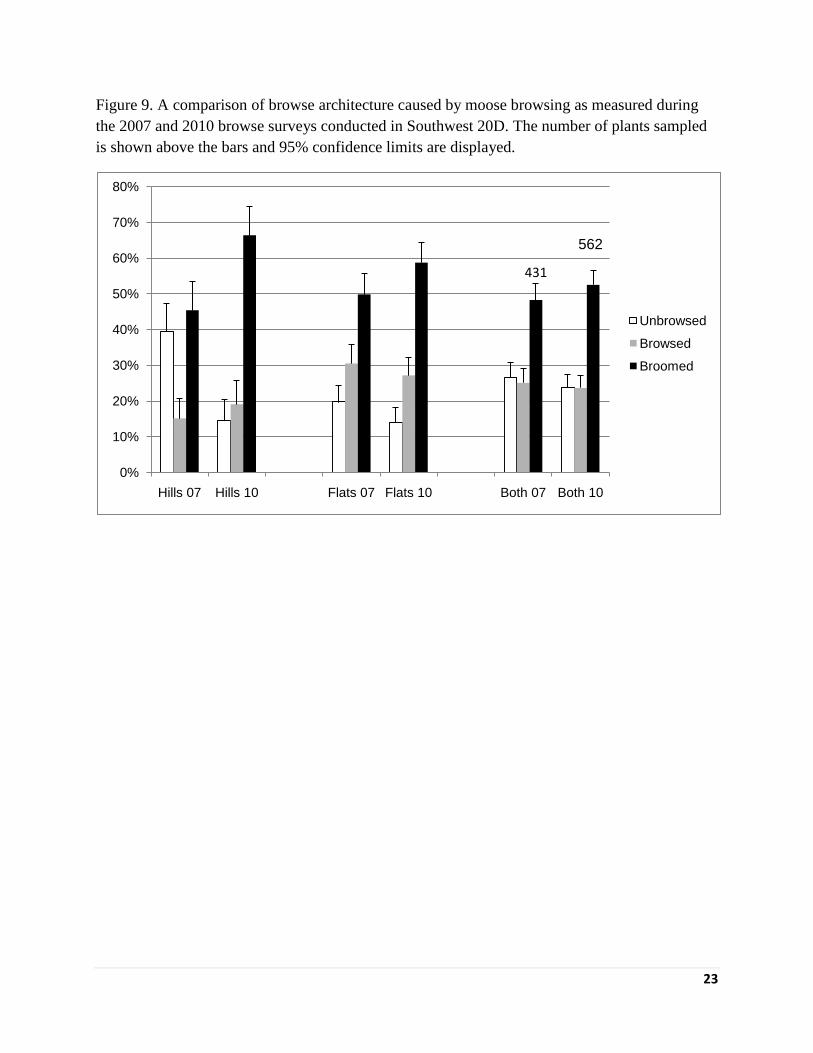
< 0.0005; Fig. 8). Removal declined predominantly in the flats (Fig. 9), coincident with a
decline in moose density by nearly 40% (6.0 to 3.6 /mi2) in the flats of Southwest 20D through
antlerless harvest in the intervening years. Relatively high density of moose likely continued to
occur in the foothills based on a trend toward plant architecture increasingly affected by moose
browsing in the foothills (Fig. 9).
Mortality
Over the course of the study, we lost 1 adult female to bear predation during the calving season,
2 adult males to unknown natural mortality, 1 adult female to capture mortality, 1 adult female to
a vehicle collision, and 12 males during the September 2010 hunting season. All males taken by
hunters were killed in Southwest 20D. Hunters that returned collars and provided contact
information were given movement and capture information for their animals. Natural survival
rates were high (> 93%) for all adults (Table 1).
6
Movements
Males
We conducted a total of 38 radiotracking flights for adult males from 27 October 2009 through
22 May 2011. We obtained 1182 locations for 42 male moose ( = 28 locations/moose). Average
home range size for males was 182.2 km2
(n = 40, se = 49.4, = 29 locations/ moose). The
minimum home range size for an individual male was 28 km2
(n = 33 locations) and the
maximum was 490 km2
(n = 34 locations). The average home range was larger in 20D North (
= 226.2, n = 15, se = 75.8) than in Southwest 20D ( = 155.9, n = 25, se = 46.7), but there was
considerable overlap in range size among individuals from the 2 areas (z = 1.6, P = 0.109, =
0.05).
From hunting season (September) through late winter (March), the majority of adult male moose
from 20D North and Southwest 20D were separated by the Tanana River (Fig. 3). However, two
males captured in Southwest 20D spent their winters in the Volkmar River drainage of 20D
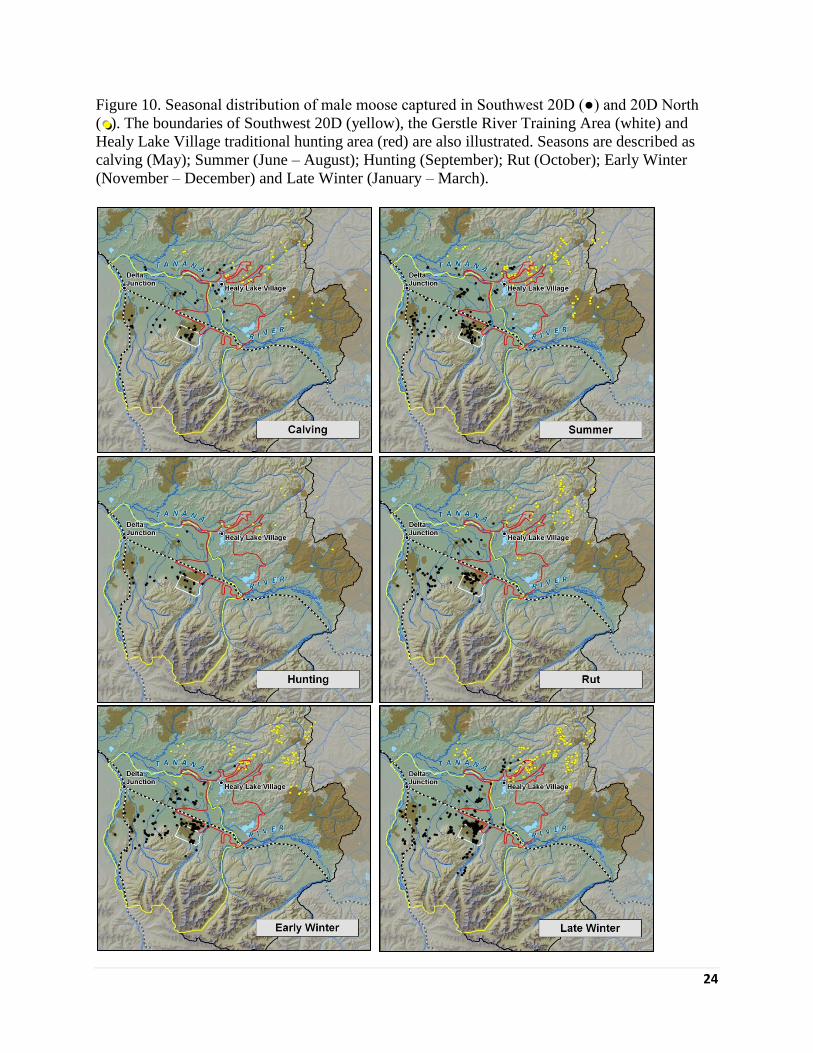
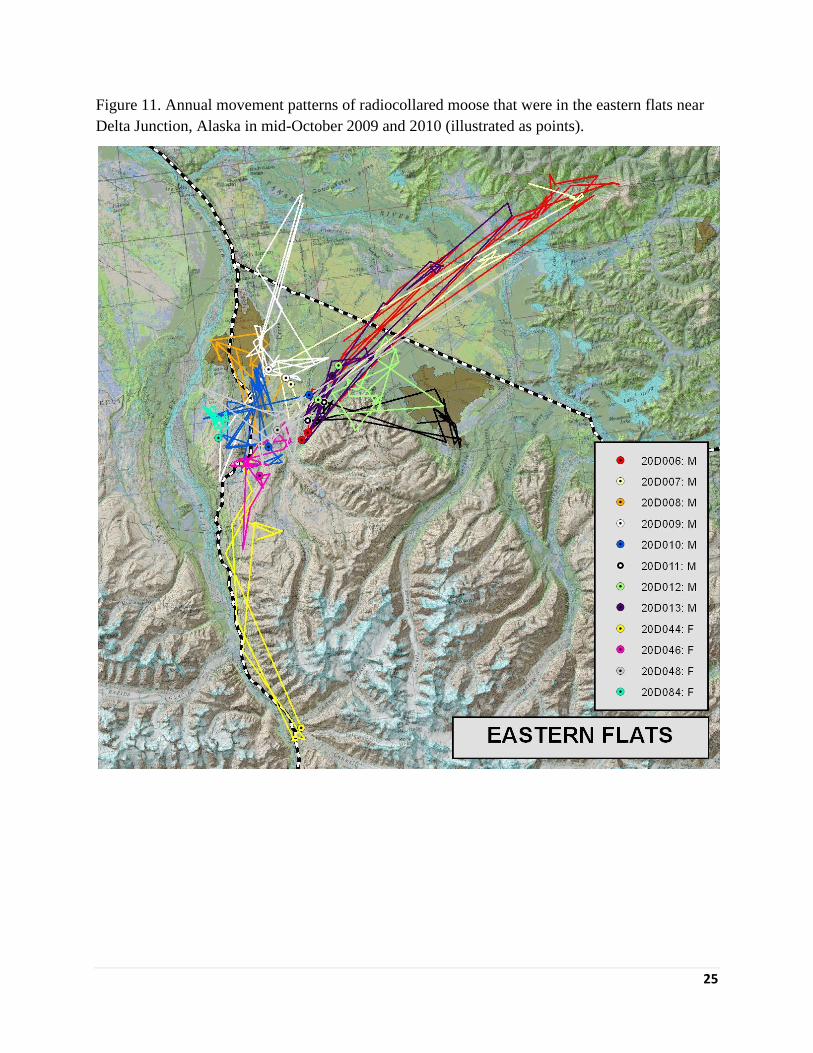
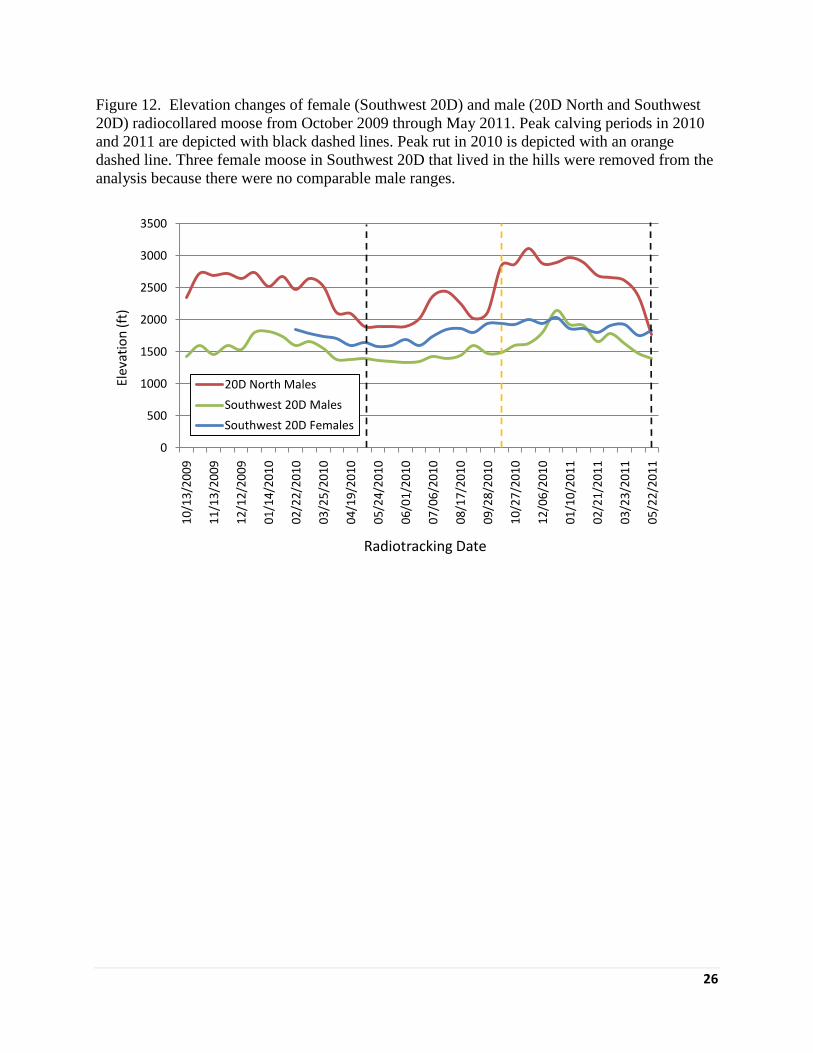
North (Fig. 10), moving out of Southwest 20D in late November (Fig. 11). In general, males
remained at higher elevations for the winter, coming down around mid-March and ascending for
the rut season (Fig. 12). A large portion of the males in Southwest 20D used the low, aquatic
areas surrounding Healy Lake during the calving and summer seasons (Fig. 10), but were not
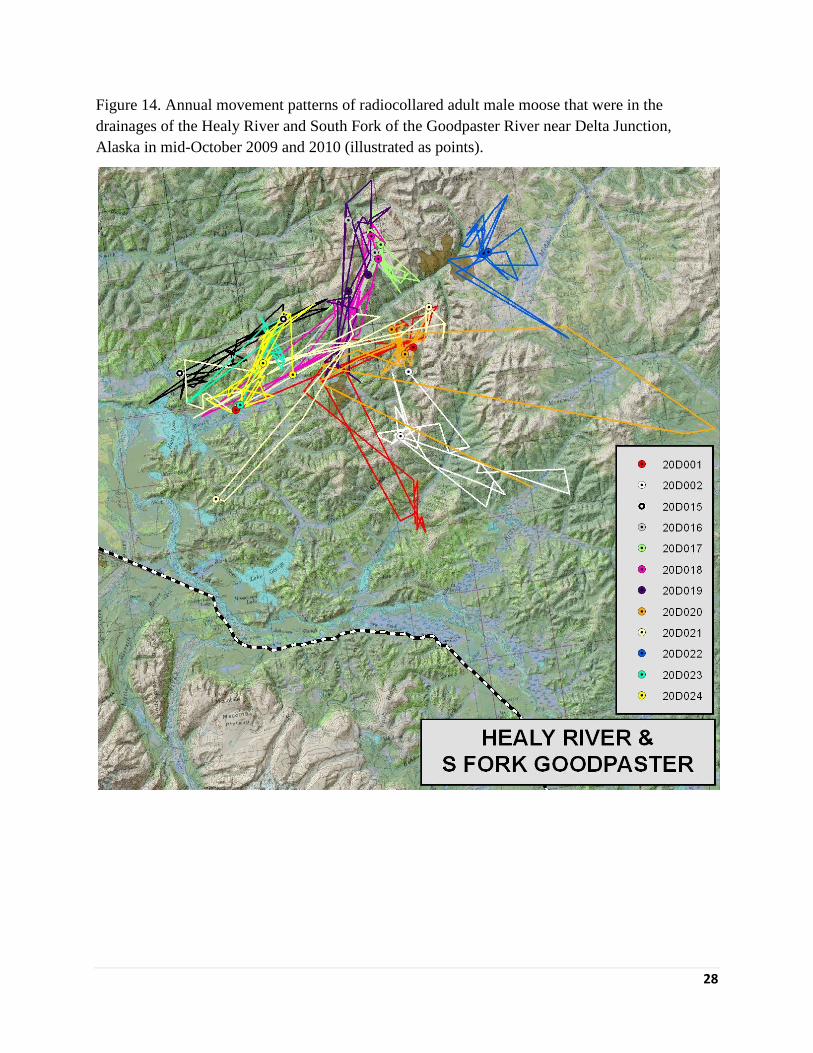
within the HLVTHA during the hunting season (Fig 13). Males captured in October 2009 in the
upper Healy River drainage of 20D North never descended down into the lower Healy Lake area
where they would be most accessible to residents of Healy Lake Village (Fig. 14). Males
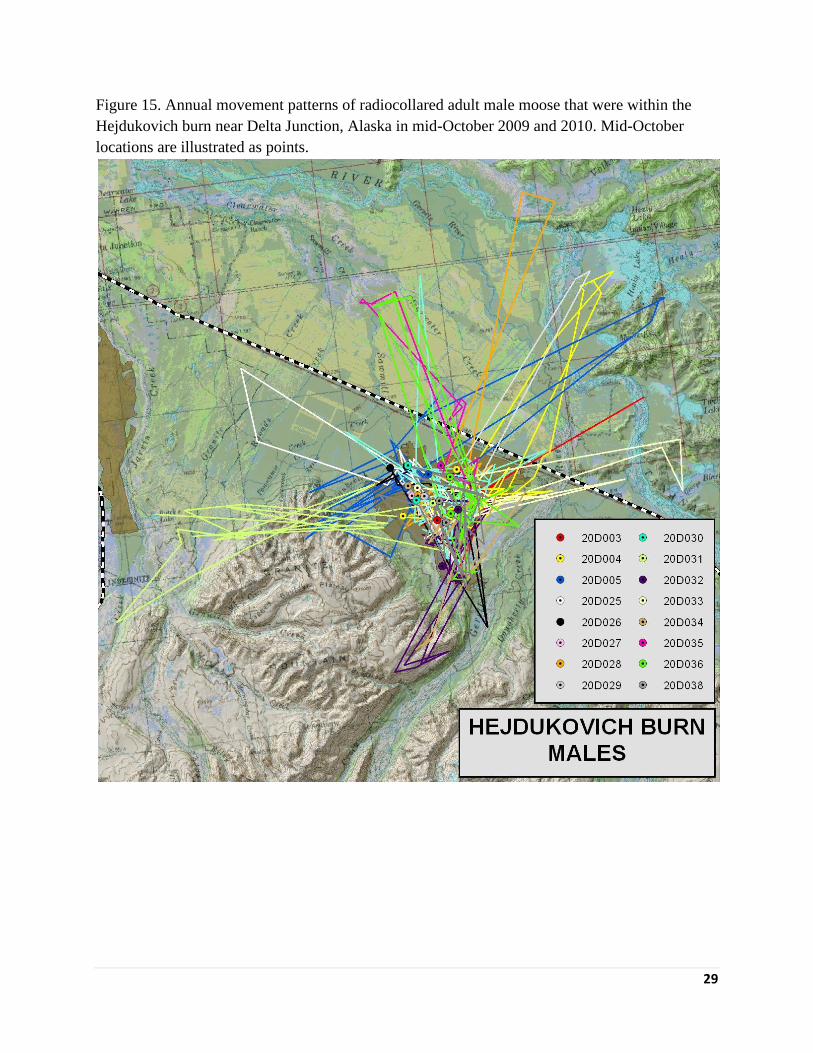
captured near the Hajdukovich burn appeared to concentrate their winter range within the
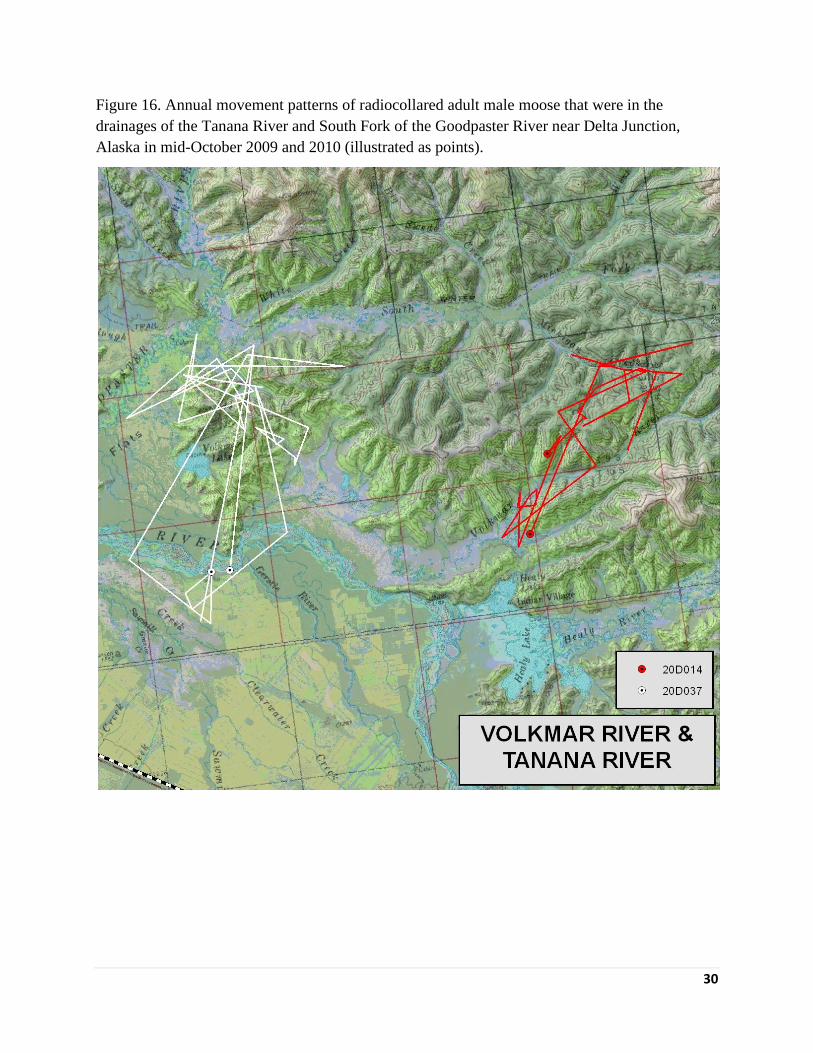
perimeter of that burn (Fig. 15). Two males captured west of the Healy River drainage remained
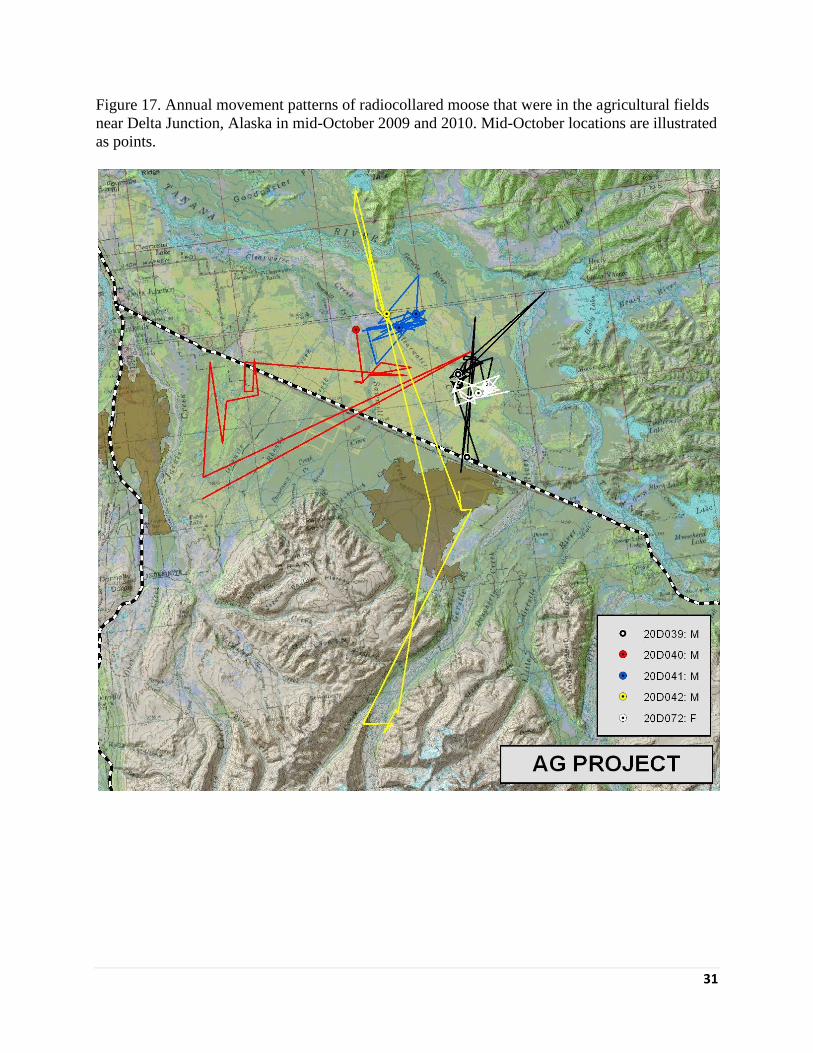
in those general areas throughout the study (Fig. 16). Finally, four males captured on the
agricultural lands in Southwest 20D displayed very different movement strategies and range
sizes (Fig. 17).
Females
We conducted 28 radiotracking flights from 10 March 2010 through 22 May 2011 for adult
female moose. There were 403 locations obtained for 18 moose ( = 21 locations/moose).
Average range size for females was 154.5 km2
(n = 15, se = 19.9, = 25 locations/moose). The
minimum range size for an individual female was 11 km2
(n = 24 locations) and the maximum
range size was 700 km2
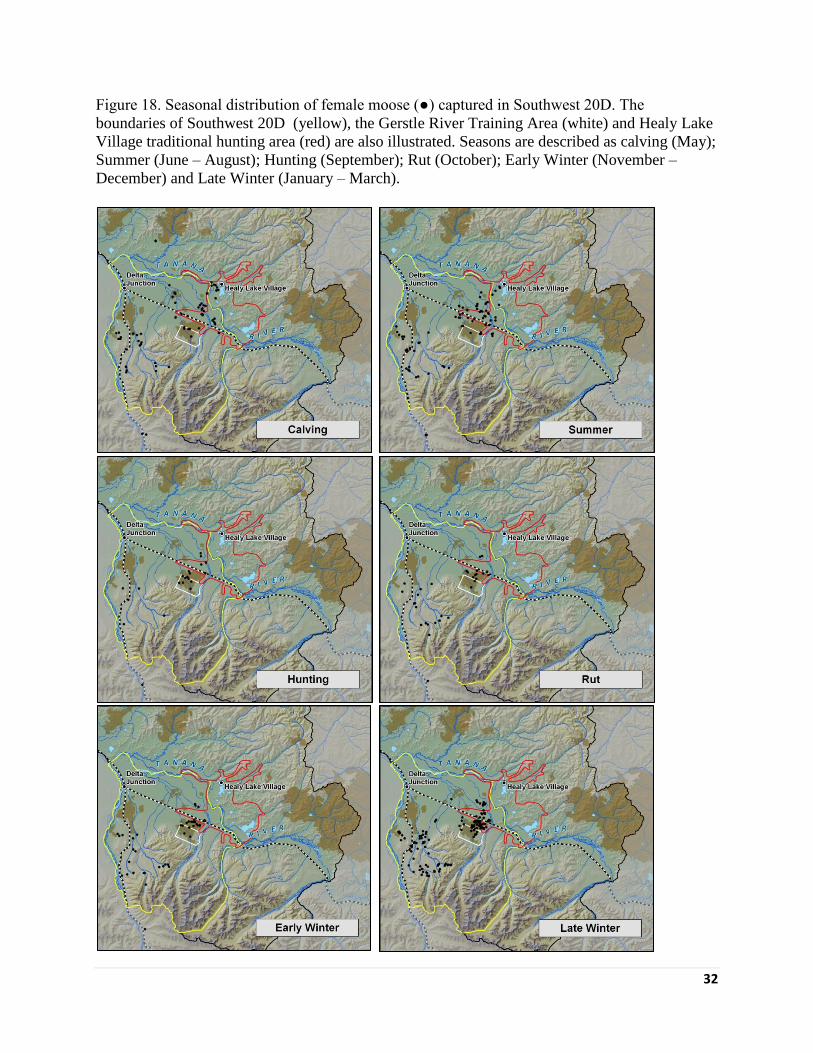
(n = 24 locations). All females were captured in Southwest 20D (Fig. 3)
and generally remained in this area except for use of the low, aquatic areas surrounding Healy
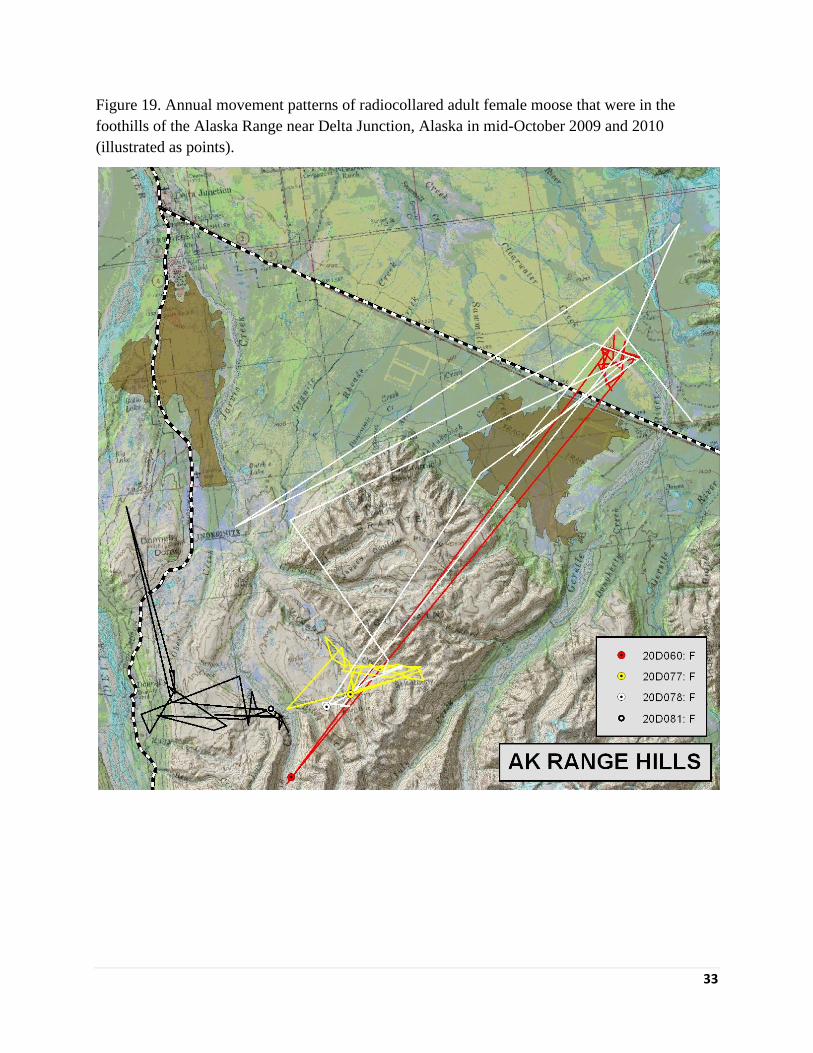
Lake during calving and summer seasons (Fig. 18). Contrary to migration patterns observed in
nearby Central 20A to the east (Fig. 3, Boertje et al. 2007), only 2 of 4 of the Southwest 20D
females captured in the hills descended to the flats during summer (Fig. 19). Females in the flats
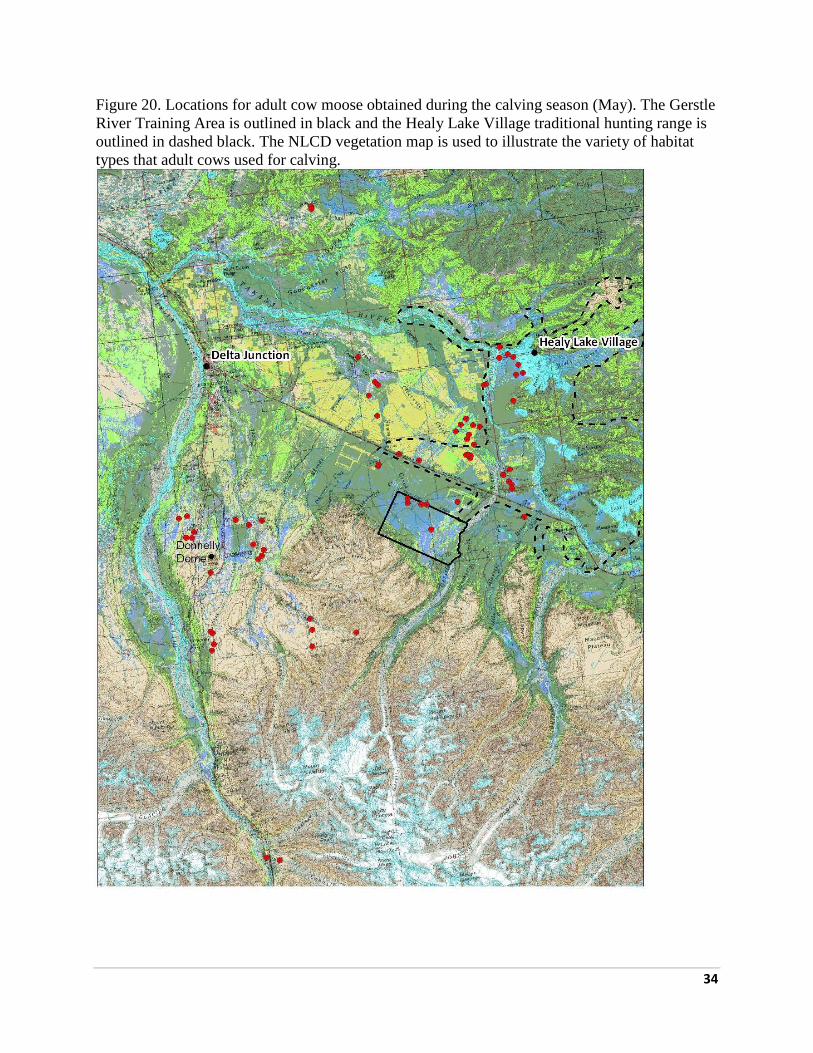
of Southwest 20D used relatively lower elevations for calving (Fig. 12), but within those lower
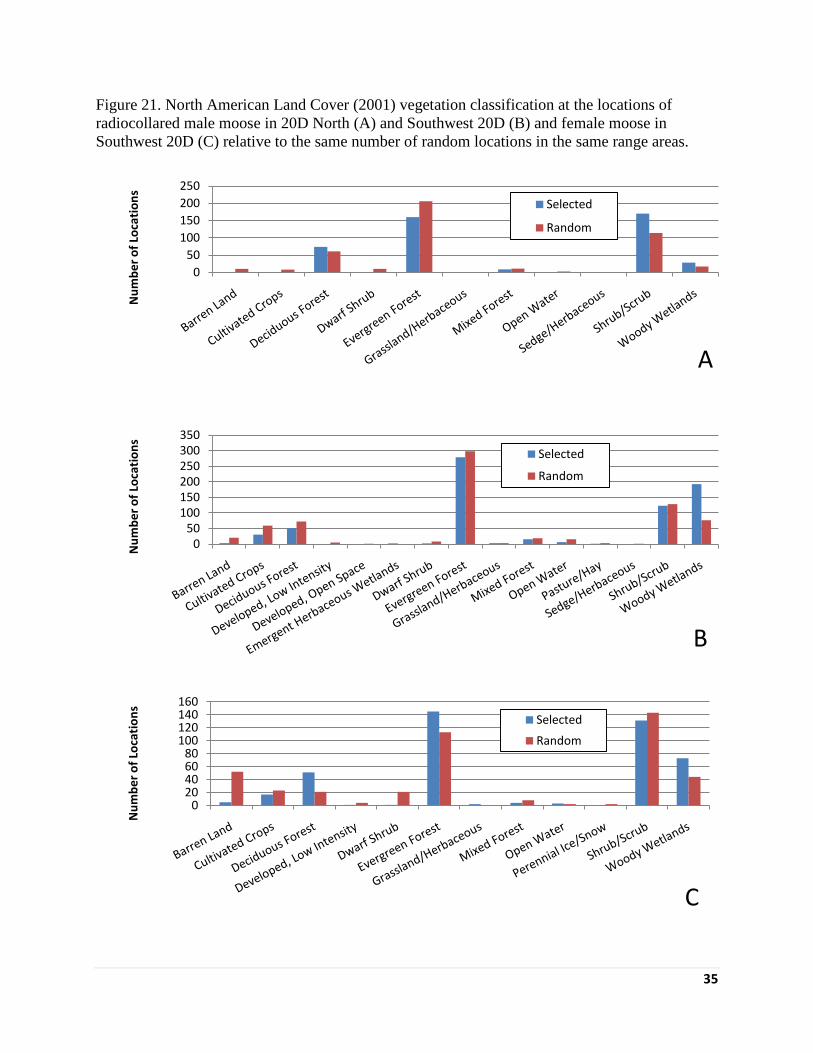
elevations seemed to choose areas with more cover (Fig. 20). Indeed, within their annual
7
movements, females selected both deciduous and evergreen forest types while males chose
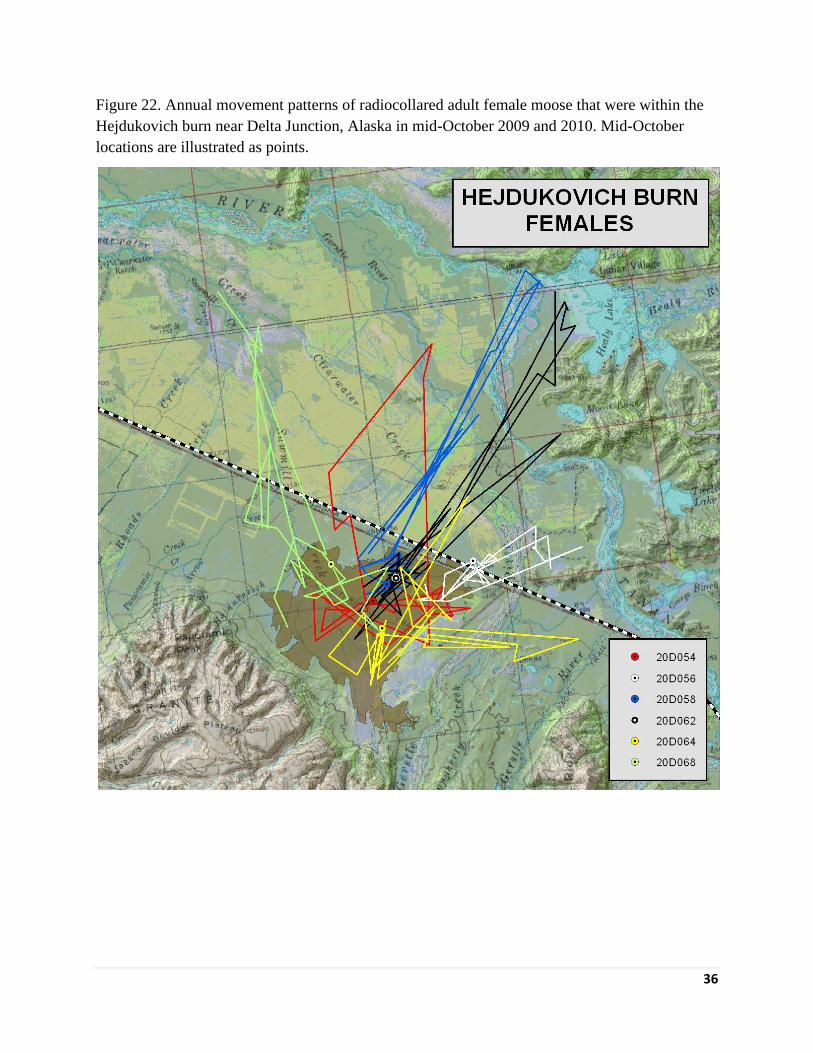
shrub/scrub communities and woody wetlands (Fig. 21). Females captured in the GRTA also
spent the majority of the winter in the Hajdukovich burn, but expanded out into wetland areas
during spring and summer (Fig. 22). The adult female that was captured on the agricultural land
maintained the smallest range of all female moose (Fig. 17). One female that spent time in the
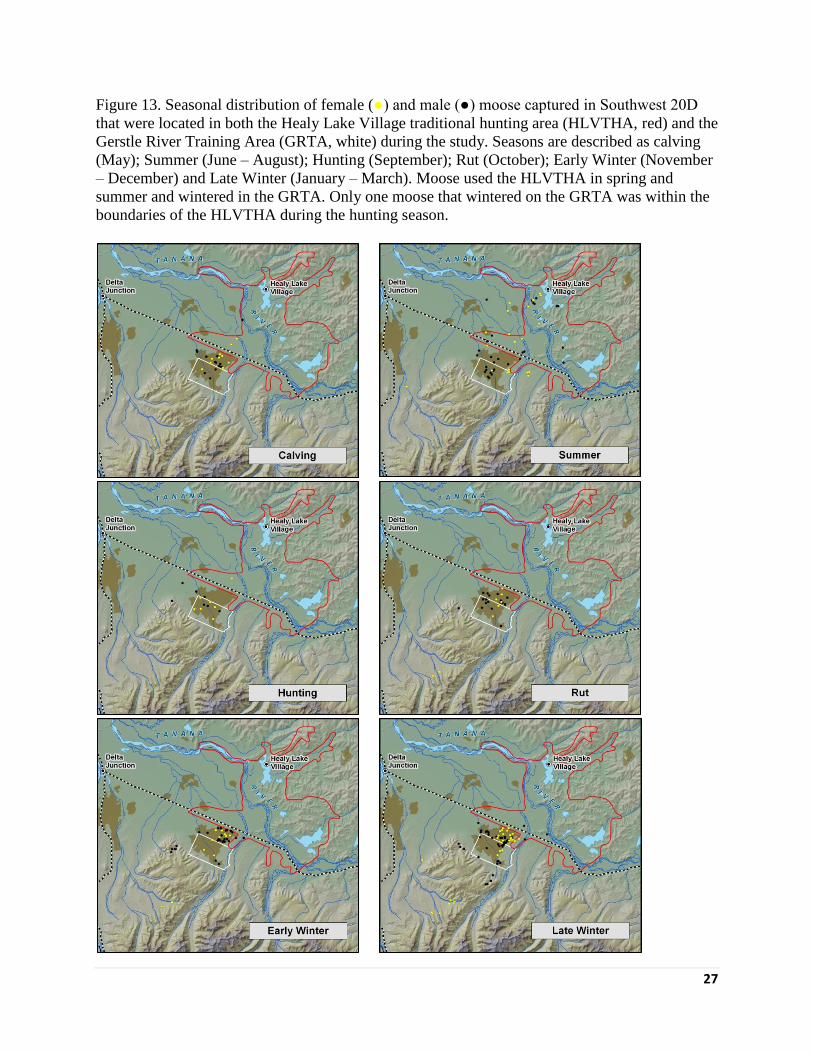
GRTA was within the HLVTHA during hunting season (Fig. 13).
Range Overlap
Eleven moose (4 females, 7 males) were located at least once in both the GRTA and the
HLVTHA (Fig. 13). Most of this overlap occurred during calving and summer seasons. These
moose were originally captured in Southwest 20D and spent the winter south of the Tanana
River. Only one radiocollared moose that used the GRTA was found within the HLVTHA during
the month of September. This female was located just north of the Alaska Highway, but on the
south side of the Tanana River (Fig. 13).
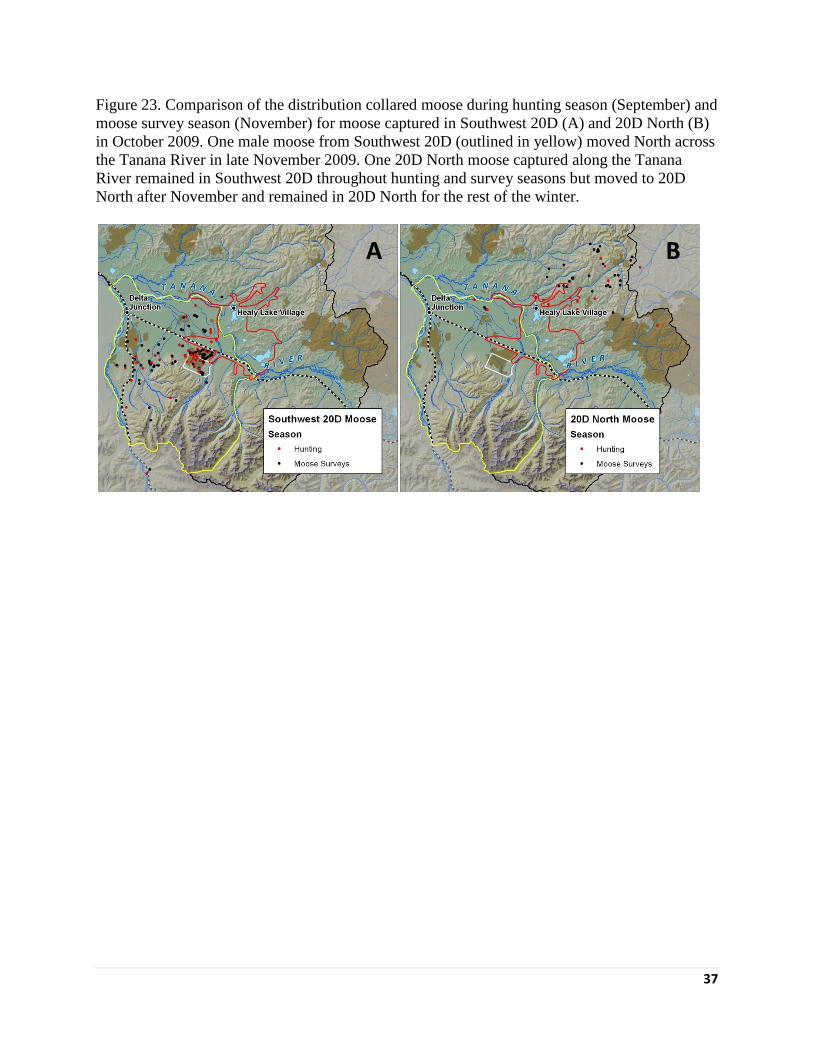
Distributions of moose during the hunting season in September 2009 were very similar to
distributions during the 2010 GSPE survey season in November (Fig. 23). Of 15 males that were
located in Southwest 20D in September and still alive in November, only one moved out of
Southwest 20D in between hunting season and survey season. This male moved out of
Southwest 20D in mid-November. He and 2 others harvested in September 2009 were at the
base of Gerstle Mountain in late autumn, then moved to the hills surrounding the lower Volkmar
River in early winter, and returned to Southwest 20D in spring (Fig. 11).
Sightability
On 13 December, 2009 we conducted 13 sightability trials using 2 different survey teams. Only
male radiocollared moose were available during the 2009 GSPE survey. During 17 – 21
December 2010, an additional 21 sightability trials were conducted using 6 different survey
teams. Too few sightability trials were conducted annually to calculate annual sightability
estimates and so we pooled the trials from 2009 and 2010. Radiocollared moose were seen in 31
of 34 trials, and the 2009-2010 pooled SCF estimate was 1.10 (range 1.00 - 1.20).
Discussion
Nutrition
It was readily apparent when handling adult males that body condition was better in 20D North
than in Southwest 20D. However, small sample sizes and differences in the age structure of
adult males captured in Southwest 20D North versus 20D North prevented nutritional
comparisons of body and antler size. It is likely that observed differences in age structure among
samples of adult moose are the result of harvest regulations. The younger age structure observed
in Southwest 20D versus 20D North (Table 1) probably reflects the intense harvest of older
8
males in Southwest 20D where legal restrictions limit harvest to males with antler widths >50
inches. The older age structure of collared females versus males in Southwest 20D (Table 1)
may only reflect the selective capture of adult females with calves (≥ 4 years old; Boertje et al.
2007). However, regulations for recent, large antlerless harvests specified the taking of adult
females without calves, thus directing the harvest toward females < 4 years old and perhaps
upwardly biasing the age structure of females in the population.
The high natural survival rate of adult males and females in Southwest 20D (Table 1) suggests
that nutrition is not directly affecting the population through mortality. Nevertheless, similarly
high survival rates of adult moose have been documented in nearby 20A (97.1% M >24 mos. and
91.7% for F >47 mos.; Boertje pers. comm.), where nutritional stress is apparent (Boertje et al.
2007). We did not monitor adult females during calving season with enough regularity to detect
all parturition events. However, by correcting the pregnancy rate determined by PSPB analyses
(14 of 18, 77.8%) for the small percentage of births that likely failed (10%; Boertje et al. 2007),
the parturition rate of 67.8% among adult females in Southwest 20D was slightly less than the
lowest pregnancy rate reported among 8 study areas in Alaska (the Tanana Flats: 70%, Boertje et
al. 2007: Table 2). Further, the calf weights measured in Southwest 20D were the lowest among
11 populations in Alaska (Table 2; Boertje et al. 2007: Table 2). Although twinning rates in
Southwest 20D were moderate in comparison with other high-density populations in Interior
Alaska (Table 2), 2-year average twinning rates declined during this study (16.2% in 2008 to
11.4% in 2010; ADF&G unpublished data). Browse removal rates in Southwest 20D measured
some nutritional improvement. The removal rate measured for the 2009- 2010 winter was the
lowest among 5 recent surveys, including Northern 20C where moose density is low and
nutrition is considered to be high based on other indices (Table 2).
Although we have no immediate explanation for the disparity among nutritional indices collected
for Southwest 20D, we suspect that lag times in nutritional improvement may be occurring
following the large, recent reduction in density. These lags could cause nutritional indices to
differ where the measurements reflect different nutritional response times. For example, browse
removal rates estimate range use over a single winter by measuring the percent of stems removed
by the end of winter that grew during the previous summer (Seaton et al. 2011). Thus, this index
indirectly quantifies intraspecific competition for browse during the previous winter and may be
more sensitive to abrupt changes in density. The temporal sensitivity of the browse survey is
underscored by a larger decline in browse removal rates in the flats where the greatest decrease
in moose density occurred (Fig. 8). In contrast, twinning rate or calf weights measured during
the same year are influenced by cumulative effects on dam condition over many years (Mech et
al. 1987, Robertson et al. 1992). Calf weights are a sensitive index to differences in nutrition
among populations (Boertje et al. 2007), but we do not know how many years are needed before
calf weights increase following nutritional improvement among adult females. In Southwest
GMU 20D, no increase in twinning rates was seen 2 years after a significant reduction in moose
density. It is possible that improvements in adult female nutrition have not yet resulted in
9
improved conception rates. In GMU 20A twinning rates responded to reduced density by
increasing from 10% in 1975 to 31% in 1976. This response was 12 years after the initiation of a
10-yr, 8-fold population decline and coincident to a small increase in moose numbers 2 years
after the population reached its lowest density (Gasaway et al. 1983, Boertje et al. 2007).
Indeed, the lag time between declines in density and increases in calf weights and twinning rates
likely depends on the initial state and relative improvement of nutrition in a given moose
population.
Antler drop
The timing of antler drop among collared moose in GMU 20D was consistent with other areas of
Alaska (Van Ballenberghe 1983), and about 2 weeks later than drop rates reported for Canada
(Novak 1981, Hauge and Keith 1981, Oswald 1984). In late November, the majority of males
retained their antlers (Fig. 7b) and would have been correctly classified during GSPE surveys.
This supports the current department recommendation to complete GSPE composition surveys
prior to Dec 5th
(Kellie and Delong 2006).
Older males dropped their antlers earlier than younger males (Fig. 7a), which agrees with prior
observations of a negative relationship between age and drop date (Hauge and Keith 1981,
Oswald 1984). As a result, differences in the age structures between 20D North and Southwest
20D prevented a comparison of drop rates. For individual males, we did not find later drop dates
with increasing age when we compared drop dates during two successive winters. Thus, at the
scale of an individual over a short period of time, we assume that antler casting is somewhat
affected by differences in environmental conditions between years (Fig 7b).
Movements
This study did not find overlap between male moose feeding in the GRTA and available for
harvest in the HLVTHA during the September 2009 hunting season (Fig. 13). Based on our
observations, we surmise that very few of the moose harvested by residents of Healy Lake
Village spent time on the GRTA where they may have been exposed to contamination. There is
a slightly higher probability of harvesting a GRTA moose when harvesting females in September
or antlerless moose in late winter (Fig 13).
GSPE estimates of population abundance obtained in November likely reflect the moose
available for harvest in September (Fig. 10, 18 and 23). Only one moose crossed the boundary
of Southwest 20D between the hunting season and the November survey season (Fig. 23). In
general, adult males in 20D North moved to higher elevations for the rut, but males in Southwest
20D remained at a similar elevation until late December (Fig. 12). If the timing of movements to
higher elevations in Southwest 20D is somewhat variable between winters, differences in habitat
related to elevation could change sightability of males among GSPE surveys. Indeed, similar to
other studies (Thompson 1979, Gasaway et al. 1985, Miquelle et al. 1992, Björneraas et al. 2011)
females in Southwest 20D showed more preference for evergreen forest than males (Fig. 21). If
10
survey intensity is too low (Gasaway et al. 1986) segregation by habitat type could result in
lower sightability of females than males and cause underestimation of females in population and
composition estimates (Peterson and Page 1993, Anderson et al. 1996, McCorquodale 2001).
Sightability
The 1.10 SCF correction factor estimated for Southwest 20D from these sightability trials was
lower than the 1.21 estimate that was developed in GMU 20A and is currently applied to
Southwest 20D GSPE estimates (Boertje et al. 2007, Dubois 2010). The harvest implications of
estimating population size using an SCF of 1.21 versus 1.10 are relatively large. However, given
that the total sample of trials in Southwest 20D is still relatively small (n = 34, 2 years), the SCF
estimate is far less robust than multi-year estimates developed elsewhere (GMU 20A: n = 69, 4
years, Boertje et al. 2009; EMMA: n = 225, 6 years, Keech et al. 2011). We suggest refining the
20D composite SCF by obtaining additional years of data before applying it to population
management.
Recommendations
Conduct additional calf weight measurements in Southwest 20D in 2 years with emphasis on
differentiating between flats and foothills moose. We hypothesize that calf weights in the
flats will increase as the population responds to recent reductions in moose density.
Conduct 1 – 2 more years of sightability trials to obtain a more robust SCF for 20D.
Conduct another browse removal estimate in 3-5 years regardless of change in moose density
to test for change in proportional biomass removal and plant architecture (flats and foothills
that have different accessibility to hunters) and changes in browse species utilization. We
hypothesize that browsing impacts will continue to increase in the foothills and moose may
shift to less palatable species unless winter density is reduced in order to impacts on forage
resources.
Acknowledgments
Jim Cummings (Golden Eagle Outfitters, Delta Junction) piloted the radiotracking flights for this
project. His flexible schedule and knowledge of the area was invaluable to the success of the
study. Troy Cambier (Chena River Aviation, Fairbanks) piloted the helicopter for all captures
and mortality retrievals and assisted with animal handling. Tony Hollis and Tom Seaton
(ADF&G, Fairbanks) assisted with captures in October 2009 and Carl Roberts (ADF&G
Fairbanks) assisted with captures in March 2010. Mike Terwilliger (Quicksilver Air, Fairbanks)
piloted the helicopter for browse surveys, which were conducted with assistance from Tom
Seaton, Jeff Selinger (ADF&G, Soldotna) and Jeff Wells (ADF&G, Fairbanks). John Haddix
conceived this study and facilitated communication with the Army. Jeff Mason and Liz Neipert
(USAGAK, Delta) assisted with moose captures from fixed-wing aircraft. Nate Pamprin
11
(ADF&G, Fairbanks) and Ron Reisgaard (ADF&G, Delta) assisted with radiotracking flights.
This report fulfills contract W912CZ-08-D-0012, Delivery Order #7 to U.S. Army Alaska.
Literature Cited
Anderson, C.. R. Jr. and F. G. Lindzey. 1996. Moose sightability model developed from
helicopter surveys. Wildlife Society Bulletin. 24: 247-259
Animal Care and Use Committee. 1998. Guidelines for the capture, handling, and care of
mammals as approved by the American Society of Mammalogists. Journal of
Mammalogy 79:1416-1431.
Beckmen, K. B. 2009. Division of Wildlife Conservation controlled substance, experimental, and
prescription drug handling instruction manual. ADF&G internal report. Version: 28
January 2009.
Björneraas, K., E. J. Solberg, I. Herfindal, B. Van Moorter, C. M. Rolandsen, J.-P. Tremblay, C.
Skarpe, B.-E. Sæther, R. Eriksen and R. Astrup. 2011. Moose Alces alces habitat use at
multiple temporal scales in a human-altered landscape. Wildlife Biology 17:44-54.
Boer, A. H. 1992. Fecundity of North American Moose (Alces alces): a review. Alces
Suppl(1):1-10.
Boertje, R. D., K. A. Kellie, C. T. Seaton, M. A. Keech, D. D. Young, B. W. Dale, L. G. Adams,
and A. R. Aderman. 2007. Ranking Alaska moose nutrition: signals to begin liberal
antlerless harvests. Journal of Wildlife Management 71:1494-1506.
Boertje, R. D., M. A. Keech, D. D. Young, K. A. Kellie and C. T. Seaton. 2009. Managing for
elevated yield of moose in Interior Alaska. Journal of Wildlife Management 73:314-327.
DuBois, S. D. 2010. In Press. Unit 20D Moose. Pages XXX XXX in P. Harper, editor. Moose
management report of survey and inventory activities 1 July 2007 30 June 2009. Alaska
Department of Fish and Game. Project 1.0. Juneau, Alaska, USA
Gasaway, W. C., D. B. Harkness, R. A. Rausch. 1978. Accuracy of moose age determinations
from incisor cementum layers. Journal of Wildlife Management 42(3):558-563.
Gasaway, W. C., R. O. Stephenson, J. L. Davis, P. E. K. Shepherd and O. E. Burris. 1983.
Interrelationships of wolves, prey and man in Interior Alaska. Wildlife Monographs: 84.
50 pp.
Gasaway, W. C., S. D. DuBois, and S. J. Harbo. 1985. Biases in aerial transect surveys for
moose during May and June. Journal of Wildlife Management 49(3): 777-784.
Gasaway, W. C., S. D. DuBois, D. J. Reed and S. J. Harbo. 1986. Estimating moose population
parameters from aerial surveys. Biological Papers of the University of Alaska, 22.
12
Gasaway, W. C., R. D. Boertje, D. V. Grangard, D.G. Kelleyhouse, R. O. Stephenson, and D. G.
Larsen. 1992. The role of predation in limiting moose at low densities in Alaska and
Yukon and implications for conservation. Wildlife Monographs: 120. 59 pp.
Hauge, T. M. and L. B. Keith. 1981. Dynamics of moose populations in Northeastern Alberta.
Journal of Wildlife Management 45(3): 573-597.
Keech, M. A., R. D. Boertje, R. T. Bowyer and B. W. Dale. 1999. Effects of birth weight on
growth of young moose: do low-weight neonates compensate? Alces 35:51-57.
Keech, M. A., R. T. Bowyer, J. M. Ver Hoef, R. D. Boertje, B. W. Dale and T. R. Stephenson.
Life-history consequences of maternal condition in Alaskan moose. Journal of Wildlife
Management 64(2):450-462.
Keech, M. A., M. S. Lindberg, R. D. Boertje, P. Valkenburg, B. D. Taras, T. A. Boudreau and K.
B. Beckmen. 2011. Effects of Predator Treatments, Individual Traits, and Environment
on Moose Survival in Alaska. In Press. Journal of Wildlife Management.
Kellie, K. A. and R. A. Delong. 2006. Geospatial survey operations manual. Alaska Department
of Fish and Game. Fairbanks, Alaska, USA.
Lord, R. E. 2008. Variable fire severity in Alaska’s boreal forest: implications for forage production and moose utilization patterns. M. S. Thesis, University of Alaska, Fairbanks.
Fairbanks, Alaska.
McCorquodale, S. M. 2001. Sex-specific bias in helicopter surveys of elk: sightability and
dispersion effects. Journal of Wildlife Management. 65: 216-225.
Mech, L. D., R. E. McRoberts, R. O. Peterson and R. E. Page. 1987. Relationship of deer and
moose populations to previous winters' snow. Journal of Animal Ecology. 56: 615-627.
Miquelle, D. G., J.A. Peek and V. Van Ballenberghe. 1992. Sexual segregation in Alaskan
moose. Wildlife Monographs: 122. 57 pp.
Mohr, C.O. 1947. Table of equivalent populations of North American small mammals. American
Midland Naturalist 37:223-249.
Novak, M. 1981. The value of aerial inventories in managing moose populations. Alces 17:282
315.
Oswald, K. 1984. Antler casting in an unhunted moose population in Northeastern Ontario.
Alces 20:283-297.
Paragi, T. F., C. T. Seaton, and K. A. Kellie. 2008. Identifying and evaluating techniques for
wildlife habitat management in Interior Alaska: moose range assessment. Alaska
Department of Fish and Game, Division of Wildlife Conservation. Final Research
– December) and Late Winter (January – March). Moose used the HLVTHA in spring and
summer and wintered in the GRTA. Only one moose that wintered on the GRTA was within the
boundaries of the HLVTHA during the hunting season.
27
Figure 14. Annual movement patterns of radiocollared adult male moose that were in the
drainages of the Healy River and South Fork of the Goodpaster River near Delta Junction,
Alaska in mid-October 2009 and 2010 (illustrated as points).
28
Figure 15. Annual movement patterns of radiocollared adult male moose that were within the
Hejdukovich burn near Delta Junction, Alaska in mid-October 2009 and 2010. Mid-October
locations are illustrated as points.
29
Figure 16. Annual movement patterns of radiocollared adult male moose that were in the
drainages of the Tanana River and South Fork of the Goodpaster River near Delta Junction,
Alaska in mid-October 2009 and 2010 (illustrated as points).
30
Figure 17. Annual movement patterns of radiocollared moose that were in the agricultural fields
near Delta Junction, Alaska in mid-October 2009 and 2010. Mid-October locations are illustrated
as points.
31
Figure 18. Seasonal distribution of female moose (●) captured in Southwest 20D. The boundaries of Southwest 20D (yellow), the Gerstle River Training Area (white) and Healy Lake
Village traditional hunting area (red) are also illustrated. Seasons are described as calving (May);
Summer (June – August); Hunting (September); Rut (October); Early Winter (November – December) and Late Winter (January – March).
32
Figure 19. Annual movement patterns of radiocollared adult female moose that were in the
foothills of the Alaska Range near Delta Junction, Alaska in mid-October 2009 and 2010
(illustrated as points).
33
Figure 20. Locations for adult cow moose obtained during the calving season (May). The Gerstle
River Training Area is outlined in black and the Healy Lake Village traditional hunting range is
outlined in dashed black. The NLCD vegetation map is used to illustrate the variety of habitat
types that adult cows used for calving.
34
Figure 21. North American Land Cover (2001) vegetation classification at the locations of
radiocollared male moose in 20D North (A) and Southwest 20D (B) and female moose in
Southwest 20D (C) relative to the same number of random locations in the same range areas.
250 200 Selected 150
Random 100
50 0
A
350
Nu
mb
er
of
Loca
tio
ns
Nu
mb
er
of
Loca
tio
ns
Nu
mb
er
of
Loca
tio
ns
300 Selected 250
Random 200 150 100
50 0
B
160 140 Selected 120 100 Random
80 60 40 20
0
C
35
Figure 22. Annual movement patterns of radiocollared adult female moose that were within the
Hejdukovich burn near Delta Junction, Alaska in mid-October 2009 and 2010. Mid-October
locations are illustrated as points.
36
Figure 23. Comparison of the distribution collared moose during hunting season (September) and
moose survey season (November) for moose captured in Southwest 20D (A) and 20D North (B)
in October 2009. One male moose from Southwest 20D (outlined in yellow) moved North across
the Tanana River in late November 2009. One 20D North moose captured along the Tanana
River remained in Southwest 20D throughout hunting and survey seasons but moved to 20D
North after November and remained in 20D North for the rest of the winter.
BA
37
Tables
Table 1. Mean body measurements and standard errors for male moose in 20D North and for
male, female adult and female calf moose in Southwest 20D. Body measurements are in cm, age
is in decimal years. We excluded human-caused mortality from estimates of survival during first
year of monitoring.
Survival
Total Body Metatarsus Age to Yr 1
Sex/Age n Area Length (se) (se) Neck (se) (range) (n)