86
Edition Number: 1.0 08/05/2017 ANNUAL NETWORK OPERATIONS REPORT 2016 Main Report
Edition Number: 1.0
08/05/2017
ANNUAL NETWORK OPERATIONS
REPORT 2016
Main Report

EUROCONTROL NMD
Main Report
ANNUAL NETWORK OPERATIONS REPORT 2016
Edition Validity Date: 08/05/2017 Edition: 1.0 Status: Released Issue ii
DOCUMENT CHARACTERISTICS
Document Title Document Subtitle Edition Number Edition Validity Date
ANNUAL
NETWORK
OPERATIONS
REPORT 2016 Main Report 1.0 08/05/2017
Note
This document represents the final edition of the Network Operations Report 2016. The previous version was submitted for consultation with stakeholders.
STATUS AND ACCESSIBILITY
Status Accessible via
Working Draft Intranet
Draft Extranet
Proposed Issue Internet (www.eurocontrol.int)
Released Issue
TLP STATUS
Intended for Detail
Red Highly sensitive, non-disclosable information
Amber Sensitive information with limited disclosure
Green Normal business information
White Public information
© 2017 The European Organisation for the Safety of Air Navigation (EUROCONTROL). This document is published by EUROCONTROL for information purposes. It may be copied in whole or in part, provided that EUROCONTROL is mentioned as the source and the extent justified by the non-commercial use (not for sale). The information in this document may not be modified without prior written permission from EUROCONTROL.

EUROCONTROL NMD
Main Report
ANNUAL NETWORK OPERATIONS REPORT 2016
Edition Validity Date: 08/05/2017 Edition: 1.0 Status: Released Issue iii
Table of Contents
DOCUMENT CHARACTERISTICS ...................................................................................................................... II
TABLE OF CONTENTS ................................................................................................................................. III
LIST OF FIGURES IN MAIN DOCUMENT .......................................................................................................... IV NOTICE ............................................................................................................................................................... VI 1 EXECUTIVE SUMMARY ................................................................................................................................... 7 2 INTRODUCTION & SCOPE............................................................................................................................. 10 3 NETWORK OVERVIEW .................................................................................................................................. 11
3.1 2016 BY MONTH ........................................................................................................................................ 11
3.2 TRAFFIC 2016 ........................................................................................................................................... 15
3.3 DELAYS….. ............................................................................................................................................... 16
ALL AIR TRANSPORT DELAYS (AIRLINE VIEW) ............................................................................ 16 3.3.1
ATFM DELAYS .................................................................................................................................... 18 3.3.2
3.3.2.1 EN-ROUTE ATFM DELAYS ............................................................................................................. 20
3.3.2.2 AIRPORT/TMA ATFM DELAYS ....................................................................................................... 23
3.4 CAPACITY .................................................................................................................................................. 24
3.5 FLIGHT EFFICIENCY .................................................................................................................................... 25
4 TRAFFIC IN DETAIL ....................................................................................................................................... 27
4.1 NETWORK CONTRIBUTORS................................................................................................................. 28
4.2 ROUTING ASPECTS .............................................................................................................................. 29
4.3 EXTRA-EUROPEAN PARTNERS ........................................................................................................... 30
4.4 AIRPORT TRAFFIC EVOLUTION .................................................................................................................... 31
4.5 AIRLINE INDUSTRY ............................................................................................................................... 32
4.6 FLIGHT REDUCTIONS .................................................................................................................................. 35
5 EN-ROUTE PERFORMANCE ANALYSIS ...................................................................................................... 36
5.1 PLANNED EVENTS AND DISRUPTIONS .......................................................................................................... 36
EN-ROUTE PLANNED EVENTS ......................................................................................................... 36 5.1.1
EN-ROUTE DISRUPTIONS ................................................................................................................. 38 5.1.2
5.2 CAPACITY EVOLUTION ................................................................................................................................ 40
5.3 ACC…… .................................................................................................................................................. 42
6 AIRPORTS....................................................................................................................................................... 49
6.1 HOT SPOTS ............................................................................................................................................... 50
6.2 AIRPORT DISRUPTIONS .............................................................................................................................. 53
6.3 NETWORK OPERATIONS SUPPORT ............................................................................................................... 55
GREEK ISLANDS – SUMMER 2016 ................................................................................................... 55 6.3.1
FLIGHT PLAN SUSPENSION REQUESTS ........................................................................................ 56 6.3.2
6.4 AIRPORT CDM IMPLEMENTATION ................................................................................................................ 56

EUROCONTROL NMD
Main Report
ANNUAL NETWORK OPERATIONS REPORT 2016
Edition Validity Date: 08/05/2017 Edition: 1.0 Status: Released Issue iv
6.5 ADVANCED ATC TOWER IMPLEMENTATION .................................................................................................. 57
6.6 INFORMATION EXCHANGE BETWEEN AIRPORTS AND NM - AIRPORT CORNER PROCESS ....... 58
AIRPORTS STRATEGIC INFORMATION PROVISION ..................................................................... 58 6.6.1
PRE-TACTICAL AND TACTICAL AIRPORTS INFORMATION EXCHANGE ................................... 58 6.6.2
6.7 TOWARDS APOC AND AOP-NOP EXCHANGE............................................................................................. 61
7 FLIGHT EFFICIENCY ...................................................................................................................................... 62
7.1 AIRSPACE DESIGN ..................................................................................................................................... 65
7.2 AIRSPACE CHANGES VS. FLIGHT PLANNING ................................................................................................. 66
7.3 ACTUAL TRAJECTORY ................................................................................................................................. 68
7.4 CONDITIONAL ROUTES (CDR) .................................................................................................................... 69
7.5 FREE ROUTE OPERATIONS ......................................................................................................................... 73
7.6 ROUTE AVAILABILITY DOCUMENT (RAD) ..................................................................................................... 74
8 NETWORK MANAGER ................................................................................................................................... 77
8.1 CAPACITY (DELAY REDUCTIONS) ................................................................................................................ 78
8.2 ENVIRONMENT (FLIGHT EFFICIENCY) .......................................................................................................... 79
9 ATFM COMPLIANCE ...................................................................................................................................... 81
9.1 ATFM DEPARTURE SLOTS ......................................................................................................................... 81
9.2 ADHERENCE TO FLIGHT PLAN SUSPENSIONS ............................................................................................... 82
9.3 ATFM EXEMPTIONS ................................................................................................................................... 83
9.4 MISSING FLIGHT PLANS .............................................................................................................................. 84
9.5 MULTIPLE FLIGHTS ..................................................................................................................................... 85
10 REFERENCES ............................................................................................................................................... 86
List of Figures in Main Document
Figure 1: Average daily traffic in 2016 .................................................................................. 11
Figure 2: Monthly ATFM delay in 2016 ................................................................................. 13
Figure 3: Average daily traffic per year ................................................................................. 15
Figure 4: Average departure delay per flight 2012-2016 ....................................................... 16
Figure 5: Breakdown average delay per flight 2016 ............................................................. 16
Figure 6: Average departure delay per flight 2016 ................................................................ 17
Figure 7: Percentage of delayed flights: ATFM & All Causes ............................................... 17
Figure 8: Average daily ATFM delay (2016 vs. 2015) ........................................................... 18
Figure 9: 2008-2016 average daily traffic and delay per flight .............................................. 18
Figure 10: ATFM delays in 2016 .......................................................................................... 19
Figure 11: 2016 average daily en-route ATFM delays .......................................................... 20
Figure 12: 2016 average daily en-route ATFM delay per flight ............................................. 20
EUROCONTROL NMD
Main Report
ANNUAL NETWORK OPERATIONS REPORT 2016
Edition Validity Date: 08/05/2017 Edition: 1.0 Status: Released Issue v
Figure 13: Top 20 en-route ATFM delay locations during 2016 ............................................ 20
Figure 14: Top 20 en-route ATFM delay per flight locations during 2016.............................. 21
Figure 15: 2016 average daily airport/TMA delays ............................................................... 23
Figure 16: Traffic, Delay and Effective capacity.................................................................... 24
Figure 17: Average route extension due to airspace design (RTE – DES) ........................... 25
Figure 18: Yearly evolution of flight-planning indicator (KEP) ............................................... 25
Figure 19: Yearly evolution of the actual trajectory indicator (KEA) ...................................... 26
Figure 20: Main changes to local3 traffic on the European network ...................................... 28
Figure 21: Biggest changes in traffic patterns in 2016 .......................................................... 29
Figure 22: Daily Flight Change in 2016 ................................................................................ 30
Figure 23: European Load Factors (source: AEA) ................................................................ 32
Figure 24: Traffic Development per Market Segment ........................................................... 33
Figure 25: Crude Oil and Fuel Prices Evolution .................................................................... 34
Figure 26: Deflated ticket prices in Europe ........................................................................... 34
Figure 27: Monthly Rate of Operational Cancellations 2015-2016 ........................................ 35
Figure 28: Annual Traffic, delay and capacity evolution ........................................................ 40
Figure 29: ECAC 'Effective Capacity' Evolution per Month (2006-2016) ............................... 41
Figure 30: Monthly en-route delay per flight in Brest ACC .................................................... 45
Figure 31: Monthly en-route delay per flight in Bordeaux ACC ............................................. 46
Figure 32: Monthly en-route delay per flight in Barcelona ACC ............................................ 46
Figure 33: Monthly en-route delay per flight in Maastricht UAC ............................................ 47
Figure 34: Monthly en-route delay per flight in Warsaw ACC ............................................... 47
Figure 35: Monthly en-route delay per flight in Brussels ACC ............................................... 48
Figure 36: Top 20 airport delay locations during 2016 .......................................................... 50
Figure 37: Top 20 airport delay per flight locations during 2016 ........................................... 52
Figure 38: Route efficiency KPI per AIRAC cycle ................................................................. 63
Figure 39: yearly evolution of airspace design indicator ....................................................... 65
Figure 40: Potential yearly savings/ losses in nautical miles (NM) due to airspace design ... 65
Figure 41: Yearly evolution of flight-planning indicator (KEP) ............................................... 66
Figure 42: Yearly savings/ losses in nautical miles (NM) due to improved flight planning efficiency ....................................................................................................................... 67
Figure 43: Yearly evolution of the actual trajectory indicator (KEA) ...................................... 68
Figure 44: Evolution of CDR availability in 2016 ................................................................... 69
Figure 45: Rate of CDR availability (RoCA) in 2016 ............................................................. 69
Figure 46: RAI (%) 2016 per AIRAC cycle ............................................................................ 70
Figure 47: RAU (%) 2016 per AIRAC cycle .......................................................................... 70
Figure 48: Five year RAI evolution ....................................................................................... 70
Figure 49: Five year RAU evolution ...................................................................................... 70
Figure 50: CDR availability vs. usage in 2016 ...................................................................... 71
Figure 51: PFE: 2016 Monthly Distance savings (nautical miles per flight) .......................... 71
Figure 52: PFE: 2016 Monthly time savings (minutes per flight) .......................................... 71
EUROCONTROL NMD
Main Report
ANNUAL NETWORK OPERATIONS REPORT 2016
Edition Validity Date: 08/05/2017 Edition: 1.0 Status: Released Issue vi
Figure 53: PFE 2016 vs. 2015 for planned traffic ................................................................. 72
Figure 54: PFE 2016 vs. 2015 for actual traffic..................................................................... 72
Figure 55: PFE: 2016 Fuel economy and CO2 emissions .................................................... 73
Figure 56: Map – Free Route Airspace Deployment by end 2016. ....................................... 74
Figure 57: NMOC Delay Savings 2016 ................................................................................ 78
Figure 58: ATFM Departure Slot Monitoring for 2015 and 2016 ........................................... 81
Figure 59: Top 20 ADEPs - Flight Plans Suspensions for 2015 and 2016 ............................ 82
Figure 60: ATFM Exemptions for State Aircraft Monitoring for 2016 and 2015 ..................... 83
Figure 61: Missing Flight Plans for 2015 and 2016 ............................................................... 84
Figure 62: Multiple Flight Plans for 2015 and 2016 .............................................................. 85
Notice
Traffic and Delay Comparisons: All traffic and delay comparisons are between the
reporting year (2016) and the previous year, unless otherwise stated.
NM Area: All figures presented in this report are for the geographical area that is within
Network Manager’s responsibility (NM area) unless otherwise stated.
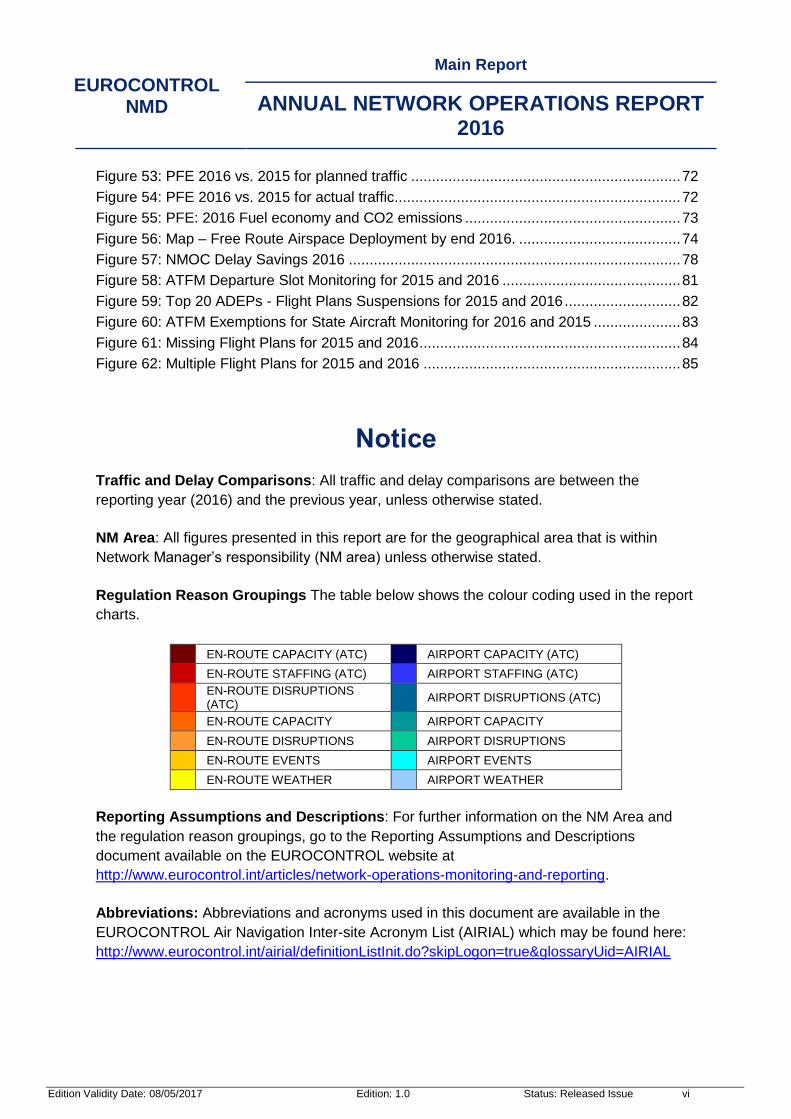
Regulation Reason Groupings The table below shows the colour coding used in the report
charts.
EN-ROUTE CAPACITY (ATC) AIRPORT CAPACITY (ATC)
EN-ROUTE STAFFING (ATC) AIRPORT STAFFING (ATC)
EN-ROUTE DISRUPTIONS (ATC)
AIRPORT DISRUPTIONS (ATC)
EN-ROUTE CAPACITY AIRPORT CAPACITY
EN-ROUTE DISRUPTIONS AIRPORT DISRUPTIONS
EN-ROUTE EVENTS AIRPORT EVENTS
EN-ROUTE WEATHER AIRPORT WEATHER
Reporting Assumptions and Descriptions: For further information on the NM Area and
the regulation reason groupings, go to the Reporting Assumptions and Descriptions
document available on the EUROCONTROL website at
http://www.eurocontrol.int/articles/network-operations-monitoring-and-reporting.
Abbreviations: Abbreviations and acronyms used in this document are available in the
EUROCONTROL Air Navigation Inter-site Acronym List (AIRIAL) which may be found here:
http://www.eurocontrol.int/airial/definitionListInit.do?skipLogon=true&glossaryUid=AIRIAL

EUROCONTROL NMD
Main Report
ANNUAL NETWORK OPERATIONS REPORT 2016
Edition Validity Date: 08/05/2017 Edition: 1.0 Status: Released Issue 7
1 EXECUTIVE SUMMARY
Traffic in the Network Manager (NM) area increased 2.8% in 2016, between the network
base and high forecast i. The 2008 all-time peak of 10.2 million flights was reached again in
2016. The network had its busiest day ever on 9 September with 34,594 flights. The biggest contributors to the network arrival-departure growth were UK, Spain, Italy, Germany, Lisbon FIR, Canary Islands, the Netherlands and France. Tourist traffic flows shifted from the southeast to the southwest of Europe as a result of the political instability in Turkey and in North African countries. Aircraft operators also planned routes that minimised their exposure to relatively high cost airspace. The combination created additional pressure on already congested areas. En-route ATFM delay was 0.86 minutes per flight, which is above the 0.5 minutes per flight SES capacity target. However, there was significantly less delay in 2016 compared to 2008 (0.86 min/flt vs. 1.59 min/flt) that had similar traffic levels. NM has delivered absolute en-route ATFM delay savings (over 15%) through individual flight improvements above its commitment in the Network Performance Plan (NPP). En-route weather and disruptions accounted for much of the ATFM delay increase in 2016. However, ATC capacity and staffing remains the primary reason of en-route ATFM delay. Airline reported delays ‘All-Causes’ (11.1 min/flt) were higher than 2015 due to more en-route ATFM delay and reactionary delay. ATFM airport delay was stable with much of that delay at both Istanbul airports. However, some airlines were able to absorb part of these ATFM departure delays leading to on-time arrival at stand. The Network Operations Plan (NOP) measures agreed with Cyprus and Greece paid dividends. Nicosia, Athens and Makedonia ACCs all had over 70% fewer delays during summer with lower traffic levels. The same applies to ACCs in Portugal and Spain that implemented the measures agreed in the NOP and managed delays despite very high traffic increase. September en-route ATFM delay improved significantly compared to other summer months, and considering it had record traffic levels. Most ACCs faced traffic growth (except in Southeast Europe) but the levels were within the high forecast range. ATC capacity/staffing delays accounted for 0.47 minutes per flight (6% increase). One of the main reasons for high en-route ATFM delays was the inability of some ANSPs to open the maximum number of sectors at peak periods (NOP commitment) during summer. In addition, it is difficult for NM to monitor capacity evolution as some ANSPs do not provide full details on sector configurations and activations. Several ACCs also recorded relatively high staffing delays/flight for more than one summer month, particularly Brussels, Warsaw, Karlsruhe, Nicosia and Lisbon. There was additional ATFM delay due to en-route weather equivalent to 0.16 minutes per flight (50% increase). June was particularly bad for en-route weather. Many ANSPs do not cooperate proactively to mitigate weather impact and react too late leading to a higher delay impact. Several strikes in 2016 caused over 1.2 million minutes of ATFM delay - equivalent of 0.12 minutes per flight - and over 13,000 flight cancellations. NM undertook specific actions to manage disruptions including: disabling RAD restrictions and coordinating with military AMCs in neighbouring States to make off-load routes available; arranging special routes with

EUROCONTROL NMD
Main Report
ANNUAL NETWORK OPERATIONS REPORT 2016
Edition Validity Date: 08/05/2017 Edition: 1.0 Status: Released Issue 8
North African States; including Algeria/Tunisia in IFPS FPL distribution area to help Air Navigation Service Providers (ANSPs) and Aircraft Operators (AOs). NM believes the strike management process is mature given the agreements in place but further network measures could still bring additional benefits. The Euro 2016 football tournament was well prepared and coordinated with NM and created minimal impact on operations. System implementations at Langen and London went well. However, the iTEC system implementation at Prestwick ACC impacted operations over summer. The excellent network cooperation for Bordeaux ACC’s ERATO implementation at year end indicates that close cooperation with NM ensures smooth implementations as was the case with other major projects transitions. Overall, events accounted for 0.08 minutes of ATFM delay per flight. Airport ATFM delays in 2016 decreased by 0.6%. Aerodrome capacity at Istanbul airports and weather continue to be the dominant issues for airport ATFM delays. NM’s attempt to work with Turkish authorities on the delays was postponed due to political events. NM worked with Greek authorities to manage summer delays at holiday destinations. The operational collaboration worked well to ensure airport slot compliance and improved performance for regular aircraft operators to the islands. NM delivered delay savings at all airports in line with the NPP objective (5.4%). NM proposes re-routeing options to AOs on a daily basis but the acceptance rate is poor (7%). NM enabled AO savings of 107,168 nautical miles in 2016 through its actions (RRP/GRRT). Strikes and the traffic flow disruption caused by the Ukraine crisis continue to impact the results with the flight efficiency (FPL) indicator trend being off track for the NM area. The impact of strikes and Ukraine crisis amounted to 1.3 and 3 million nautical miles lost on the FPL indicator in 2016, respectively. Conclusions RP2 is proving to be challenging for the network. It is apparent that the system, while much improved, has to respond better to the traffic demand. The increase in traffic will require extra capacity in order to achieve capacity targets. Several ANSPs have not found ways to resolve the interdependency between capacity and cost effectiveness targets. Social, economic and political issues continue to affect the network. This is affecting flight operations and impacts flight efficiency. ANSPs need to be more responsive to adapt capacity to changing traffic flows as aircraft operators avoid conflict zones and high cost areas. There are several issues that network partners need to address to tackle the current performance problems. These include:
Several ANSPs did not deliver additional capacity for the well-known holiday traffic flows, particularly at weekends and when traffic growth or strategic rerouting is identified in good time.
Staff availability affected capacity provision and the need to achieve cost efficiency targets played a part.
Major ATC system upgrades implementation was successful when rigorous planning took place that involved NM, neighbours and aircraft operators early in the process.

EUROCONTROL NMD
Main Report
ANNUAL NETWORK OPERATIONS REPORT 2016
Edition Validity Date: 08/05/2017 Edition: 1.0 Status: Released Issue 9
Network strike management practices are mature given the agreements in place and other network measures to reduce strike impact are needed.
Proactive network collaboration to optimise delays for weather and other issues could reduce the overall ATFM delays.
EUROCONTROL NMD
Main Report
ANNUAL NETWORK OPERATIONS REPORT 2016
Edition Validity Date: 08/05/2017 Edition: 1.0 Status: Released Issue 10
2 INTRODUCTION & SCOPE
The purpose of this document is to provide an overview of the European ATM network
performance in 2016 in the areas of traffic evolution, capacity offered by the Air Navigation
Service Providers, delays and flight efficiency. Airspace users’ opinion on the network
performance is also included.
The report analyses the annual results in light of the main events that took place in the
course of the year.
The document structure is as follows:
Section 1: Executive Summary.
Section 2: Introduction & Scope.
Section 3: Network Overview contains the annual performance of the European ATM network: traffic, capacity, delays and flight efficiency.
Section 4: Traffic in Detail is a detailed analysis of traffic growth in 2016 in the NM area and adjacent regions.
Section 5: En-Route Performance Analysis is an analysis of network en-route performance: events and disruptions; capacity and ACC performance.
Section 6: Airports is an analysis of the performance of airport operations.
Section 7: Flight Efficiency is an analysis of network flight efficiency.
Section 8: Network Manager is NM’s contribution to achieved performance results.
Section 9: ATFM Compliance provides a view on the compliance to the ATFM Implementing Rule.
Section 10: References.
Annex I: Airspace Users’ View outlines their perspective on how the network performed in 2016.
Annex II: ACC contains a traffic and capacity evolution for each ACC in 2016.
Annex III: Airports contains capacity, delay, arrival/departure punctuality status and a NM performance assessment of each of the significant airports in 2016.

EUROCONTROL NMD
Main Report
ANNUAL NETWORK OPERATIONS REPORT 2016
Edition Validity Date: 08/05/2017 Edition: 1.0 Status: Released Issue 11
3 NETWORK OVERVIEW
3.1 2016 BY MONTH
Figure 1: Average daily traffic in 2016
2016 was marked by significant traffic growth and an increase in en-route ATFM delay1. The average en-route ATFM delay per flight in the NM area was 0.86 minutes, which is above the network SES capacity target of 0.50 minutes per flight. Certain capacity/staffing issues were recurrent throughout the year, some of which had significant impact on the overall performance of the network. Weather and disruption events accounted for much of the delay increase in 2016 in comparison with the previous year. Brest ACC was the main generator of monthly en-route delay, with the exception of the months of September and November. Delays were caused by the ERATO system implementation (December 2015 to May 2016), several French industrial actions and capacity issues. As for the airports, Istanbul/Sabiha Gökcen and Istanbul/Ataturk appeared every month as two of the largest generators of ATFM delays, due to chronic capacity issues.
The performance and main events occurred throughout the months of 2016 are detailed in the following paragraphs. Due to their monthly recurrence, Brest ACC and Istanbul airports capacity issues are omitted from the text.
The year started with a traffic increase of 1.7% in January compared to the same month in 2015. Traffic avoiding Brest ACC due to the implementation of ERATO system resulted in distortion of traffic flows in the neighbouring ACCs (Shannon, Shanwick and Santa Maria). European traffic to/from the Gulf region and the United States increased while traffic to/from
1 NM implemented R20 on 5 April 2016, which included the correction of ATFM delay calculation to remove the effect of REA
message (and its A-CDM equivalent). NM calculates there is, on average, a 15% reduction in delays due to the changes.
1.7% 3.2% 2.5% 2.2% 3.0% 1.5% 2.6% 2.8% 3.5% 2.9% 3.3% 4.6%
0
5000
10000
15000
20000
25000
30000
35000
JAN FEB MAR APR MAY JUN JUL AUG SEP OCT NOV DEC
Avg d
aily
tra
ffic
2015 2016

EUROCONTROL NMD
Main Report
ANNUAL NETWORK OPERATIONS REPORT 2016
Edition Validity Date: 08/05/2017 Edition: 1.0 Status: Released Issue 12
Russia Federation and Egypt continued to decline. Seasonal weather and airport capacity measures in conjunction with technical issues (radar and frequency) impacted airport operations. Industrial action by French public services on 26 January generated 83,400 minutes of ATFM delay with ATFM protective measures in Maastricht and Madrid ACCs generating additional delay. Aircraft operators were requested to implement a 20% flight reduction programme for a number of French airports resulting in approximately 1,000 flights removed from the network.
Traffic in February increased by 3.2%. Traffic continued avoiding Brest ACC which, in conjunction with southerly jetstreams and increased traffic growth between UK and Spain, resulted in traffic increases for Shannon, Shanwick and Santa Maria ACCs. Traffic flow from Europe to/from Tunisia declined compared to February 2015 while the other external flows kept the same trends as in the previous month. En-route ATFM delays increased by 196% mainly due to the ERATO system implementation in Brest ACC. There were additional ATFM delays in Paris, Madrid and Canarias ACCs due to onload traffic from Brest ACC. Other system implementations caused additional ATFM delays in Maastricht, London and Langen ACCs. Seasonal weather impacted operations particularly at London/Heathrow, Amsterdam/Schiphol, Istanbul/Sabiha Gökcen and Istanbul/Ataturk airports.
Traffic in March 2016 increased by 2.5% with strong growth between Europe and both the United States and United Arab Emirates. En-route ATFM delays increased by 387.4% again driven by ERATO implementation in Brest. There were ATC capacity/staffing delays in Brest, Paris, Madrid, Maastricht, Barcelona ACCs and London TMA. Seasonal weather (fog, strong winds and snow) impacted London/Heathrow and London/Gatwick airports. French ATC industrial actions on 20-22 and 31 March and the Brussels airport closure due to a terrorist attack on 22 March resulted in fewer flights and additional delays for the network. Geneva airport completed A-CDM implementation on 16 March and Paris/Charles de Gaulle completed RECAT-EU implementation on 22 March. Traffic in April 2016 increased by 2.2% with strong growth between Europe and the United States. Capacity issues affected operations at Maastricht, Nicosia, Madrid and Paris ACCs. Brussels and to a lesser extent Nicosia and London TMA ACCs recorded delays due to several ATC staffing issues during the month. A French industrial action on 27-29 April resulted in a number of cancellations and high delays in Brest, Paris and Bordeaux ACCs. Maastricht UAC was impacted by the military exercise FRISIAN FLAG. Traffic in May 2016 increased by 3.0% and was the highest May traffic level since 2001. The UK was the top contributor with a record high of 350 extra daily flights. French industrial action on 19 May and on 26 May resulted in delays for Brest, Reims, Paris and Bordeaux ACCs while neighbouring ACCs reported knock-on delays. Communication failures led to en-route disruption delays in Stockholm and Malmo ACCs. Brussels ACC recorded delays due to several ATC staffing issues. There were en-route ATC capacity delays in Maastricht and Bordeaux ACCs. Seasonal weather (fog, strong winds, rain, thunderstorms) impacted operations particularly at Amsterdam/Schiphol, Istanbul/Ataturk and London/Heathrow airports while en-route weather generated significant delays in Maastricht UAC. Milan/Linate airport implemented A-CDM on 3 May. Traffic in June 2016 increased by 1.5% and was at the lower end of the forecast. Although this was the highest June traffic level since 2009, growth was suppressed due to ATC industrial action in France and Italy, as well as at Air France and SAS airlines. En-route

EUROCONTROL NMD
Main Report
ANNUAL NETWORK OPERATIONS REPORT 2016
Edition Validity Date: 08/05/2017 Edition: 1.0 Status: Released Issue 13
weather was the main cause of ATFM delay, generating delays in Maastricht, Langen and Karlsruhe ACCs. French ACCs were heavily affected by the industrial actions while the neighbouring ACCs of Karlsrhue, Barcelona, Madrid and Maastricht were affected by the ATFM measures applied during the action. There were en-route ATC staffing and capacity issues in Maastricht, Langen, Karlsruhe and Barcelona ACCs. Weather impacted operations particularly at Frankfurt Main, London/Heathrow, London/Gatwick, Amsterdam/Schiphol and Zurich airports. Aerodrome capacity issues generated delays at Barcelona, Zurich, Amsterdam/Schiphol and London/Gatwick airports. There were ATFM delays due to ATC system improvements in Prestwick (implementation of iTEC system) and Langen (on-going implementation of PSS) ACCs. The operational impact of the terrorist attack at Istanbul/Atatürk airport on 28 June was 2,261 minutes of ATFM delay and diversions of traffic.
Traffic in July 2016 increased by 2.6% and was the highest ever for the month of July. En-route ATC capacity was the main cause of en-route ATFM delay, mostly in Maastricht, Bordeaux and Marseille ACCs. There were en-route staffing issues in Warsaw, Karlsruhe, Nicosia and Lisbon ACCs. There were ATFM delays due to ATC system improvements in Langen (on-going implementation of PSS) ACC. Capacity reductions in Prestwick ACC due to iTEC training and familiarisation combined with unseasonable weather patterns resulted in en-route ATC capacity and staffing delays. Aerodrome capacity issues generated delays at Barcelona, Paris/Orly, Amsterdam/Schiphol, Zurich and Mikonos airports. Seasonal weather impacted operations particularly at London/Heathrow, Zurich, Amsterdam/Schiphol and Barcelona airports. The EURO 2016 football tournament took place in France between 10 June and 10 July with French airports and ACCs successfully handling at least 3,262 extra flights with a total of 5,870 minutes of ATFM delay. Traffic in August 2016 increased by 2.8%. Security concerns impacted the tourism industry in Turkey. Local Turkish traffic decreased by 12% and charter traffic to/from Turkey decreased by 56%. En-route ATC capacity delays in Barcelona, Maastricht, Marseille and Bordeaux ACCs. There were en-route staffing issues in Warsaw, Karlsruhe, Prestwick, Nicosia and Langen ACCs. En-route weather generated delays in Maastricht, Karlsruhe, Marseille, Reims and Barcelona ACCs. Aerodrome capacity issues generated delays at Amsterdam/Schiphol, Paris/Orly and Barcelona airports. Seasonal weather impacted operations at London/Heathrow, Vienna, Zurich, Porto and Frankfurt airports. ATC capacity
1.7
1.2
1.0
1.7
0.9
1.5
2.7
2.6
1.6
1.3
1.1
0.7
1.4
0.0
0.5
1.0
1.5
2.0
2.5
3.0
DE
C
JA
N
FE
B
MA
R
AP
R
MA
Y
JU
N
JU
L
AU
G
SE
P
OC
T
NO
V
DE
C
Monthly delay (min) per flight
Figure 2: Monthly ATFM delay in 2016

EUROCONTROL NMD
Main Report
ANNUAL NETWORK OPERATIONS REPORT 2016
Edition Validity Date: 08/05/2017 Edition: 1.0 Status: Released Issue 14
issues were experienced at Greek island airports due to high summer demand. Alicante airport implemented Advanced ATC Tower on 23 August. Traffic in September 2016 increased by 3.5%, with the network recording its busiest day ever on 9 September with 34,594 flights. With the same level of traffic as July 2016, delay in September 2016 was half of that of July 2016. There were en-route ATC capacity delays in Maastricht and Bordeaux ACCs, staffing issues in Warsaw and Karlsruhe ACCs. Aerodrome capacity issues at London/Gatwick airport. Seasonal weather affected Maastricht, Marseille, Barcelona, Karlsruhe and London ACCs. Thunderstorms, heavy rain and/or low visibility impacted Palma de Mallorca and London/Heathrow airports. Industrial action in France on 14 and 15 September generated en-route ATFM delays in Marseille, Brest and Paris ACCs. Technical failures in Karlsruhe, Marseille and Brussels ACCs and a system upgrade in Nicosia ACC generated high amount of delay. Traffic in October 2016 increased by 2.9%. This was the highest traffic ever for the month of October. There were en-route ATC capacity delays in Maastricht and Bordeaux ACCs and staffing issues in Warsaw, Karlsruhe and Brest ACCs. Seasonal weather affected Maastricht, Marseille and Barcelona ACCs with heavy rain and/or low visibility affecting London/Heathrow, Amsterdam/Schiphol, London/Gatwick and Zurich airports. Traffic in November 2016 increased by 3.3%. There were en-route events delays in Bordeaux ACC due to the ERATO system implementation. There were en-route ATC capacity delays in Maastricht, Lisbon, Canarias and Langen ACCs while staffing issues occurred in Maastricht and Langen ACCs. Seasonal weather affected Canarias ACC. Strong winds, snow and/or low visibility impacted Amsterdam/Schiphol, London/Heathrow, Stockholm/Arlanda, Warsaw, London/City, Zurich, Oslo, Brussels and Barcelona airports. Paris/Orly airport implemented A-CDM on 15 November. Traffic in December 2016 increased by 4.6%. There were en-route ATC capacity and/or ATC staffing delays in Maastricht, Canarias and Nicosia ACCs. The significant increase of airport ATFM delays was due seasonal weather impacting Amsterdam/Schiphol, London/Heathrow and London/Gatwick airports. Aerodrome capacity issues generated delays at Madrid/Barajas, and Amsterdam/Schiphol airports. The ERATO system was successfully implemented in Bordeaux ACC. On 19 December, Copenhagen airport implemented Airport CDM and Liverpool and Nice airports implemented Advanced ATC Tower.
EUROCONTROL NMD
Main Report
ANNUAL NETWORK OPERATIONS REPORT 2016
Edition Validity Date: 08/05/2017 Edition: 1.0 Status: Released Issue 15
3.2 TRAFFIC 2016
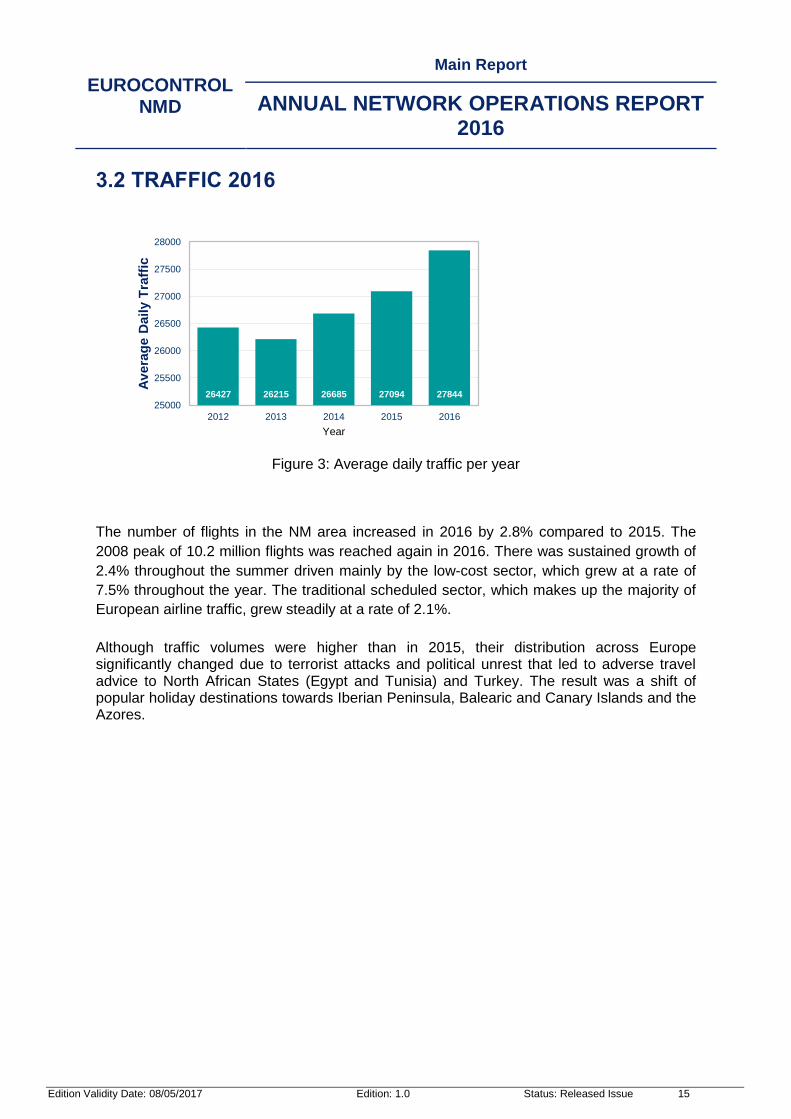
The number of flights in the NM area increased in 2016 by 2.8% compared to 2015. The
2008 peak of 10.2 million flights was reached again in 2016. There was sustained growth of
2.4% throughout the summer driven mainly by the low-cost sector, which grew at a rate of
7.5% throughout the year. The traditional scheduled sector, which makes up the majority of
European airline traffic, grew steadily at a rate of 2.1%.
Although traffic volumes were higher than in 2015, their distribution across Europe significantly changed due to terrorist attacks and political unrest that led to adverse travel advice to North African States (Egypt and Tunisia) and Turkey. The result was a shift of popular holiday destinations towards Iberian Peninsula, Balearic and Canary Islands and the Azores.
Figure 3: Average daily traffic per year
26427 26215 26685 27094 27844
25000
25500
26000
26500
27000
27500
28000
2012 2013 2014 2015 2016
Av
era
ge D
aily T
raff
ic
Year

EUROCONTROL NMD
Main Report
ANNUAL NETWORK OPERATIONS REPORT 2016
Edition Validity Date: 08/05/2017 Edition: 1.0 Status: Released Issue 16
3.3 DELAYS
ALL AIR TRANSPORT DELAYS (AIRLINE VIEW) 3.3.1
This section presents the all air transport delay situation as seen from the airlines by using
the data collected by Central Office for Delay Analysis (CODA) from airlines. Data coverage
is 70% of the commercial flights in the ECAC region for 2016. ATFM delays reported by
airlines may be lower than the NM calculated ATFM delays due to difference in methods:
ATFM delays of NM are the (flight) planned “delays”; the airlines report the ‘actual’
experienced ATFM delay on departure. For instance, a flight with an ATFM delay may also
have a handling delay absorbed within the ATFM delay. For the airline, a part of this delay is
the ATFM delay and the remaining amount is the handling delay.
Figure 4: Average departure delay per flight 2012-2016
Based on airline data,
the average
departure delay per
flight from ‘All-
Causes’ was 11.29
minutes per flight,
this was an increase
of 9% compared to
2015 where the
average delay was
10.40 minutes per
flight. Primary delays
counted for 55% (or
6.16 min/flt), with
reactionary delays
representing the
smaller remaining
share of 45% at (5.10
min/flt).
Figure 5: Breakdown average delay per flight 2016
9.70 9.34 9.70 10.40 11.29
0
5
10
15
20
2012
2013
2014
2015
2016
Avera
ge d
ep
art
ure
dela
y (
min
) p
er
flig
ht
Average departure delay per flight 2012-2016
Average reactionary delay per flight (CODA)
Average delay per flight Other Primary delay All Causes (CODA)
Average ATFM en-route delay per flight (CODA)
Average ATFM en-route delay per flight (NM reported)
0 0
6.16
0,86 0.76
11.29
0
2
4
6
8
10
12
Average En-RouteDelay/Flight
Average En-RouteDelay/Flight
Average primarydelay
Passenger experience
Avera
ge d
ep
art
ure
dela
y p
er
flig
ht
in m
inute
s Breakdown Average Delay per Flight 2016
NM reported En-Route ATFM delay Airline Reported En-Route ATFM Delay
Primary Delay (excl En-Route) Reactionary delay
EUROCONTROL NMD
Main Report
ANNUAL NETWORK OPERATIONS REPORT 2016
Edition Validity Date: 08/05/2017 Edition: 1.0 Status: Released Issue 17
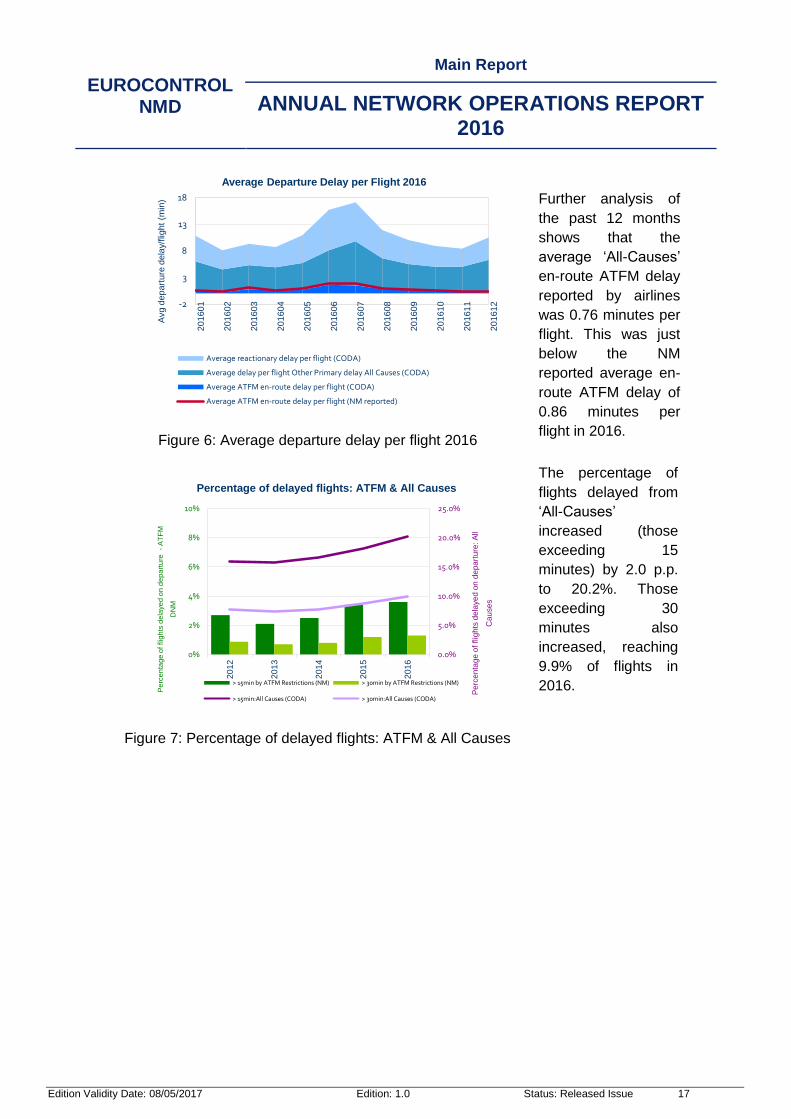
Figure 6: Average departure delay per flight 2016
Further analysis of
the past 12 months
shows that the
average ‘All-Causes’
en-route ATFM delay
reported by airlines
was 0.76 minutes per
flight. This was just
below the NM
reported average en-
route ATFM delay of
0.86 minutes per
flight in 2016.
Figure 7: Percentage of delayed flights: ATFM & All Causes
The percentage of
flights delayed from
‘All-Causes’
increased (those
exceeding 15
minutes) by 2.0 p.p.
to 20.2%. Those
exceeding 30
minutes also
increased, reaching
9.9% of flights in
2016.
-2
3
8
13
18201601
201602
201603
201604
201605
201606
201607
201608
201609
201610
201611
201612
Avg
dep
art
ure
dela
y/f
light
(min
)
Average Departure Delay per Flight 2016
Average reactionary delay per flight (CODA)
Average delay per flight Other Primary delay All Causes (CODA)
Average ATFM en-route delay per flight (CODA)
Average ATFM en-route delay per flight (NM reported)
0.0%
5.0%
10.0%
15.0%
20.0%
25.0%
0%
2%
4%
6%
8%
10%
2012
2013
2014
2015
2016
Pe
rce
nta
ge
of
flig
hts
de
laye
d o
n d
ep
art
ure
: A
ll
Cau
se
s
Pe
rce
nta
ge o
f flig
hts
de
laye
d o
n d
ep
art
ure
-
AT
FM
DN
M
Percentage of delayed flights: ATFM & All Causes
> 15min by ATFM Restrictions (NM) > 30min by ATFM Restrictions (NM)
> 15min:All Causes (CODA) > 30min:All Causes (CODA)

EUROCONTROL NMD
Main Report
ANNUAL NETWORK OPERATIONS REPORT 2016
Edition Validity Date: 08/05/2017 Edition: 1.0 Status: Released Issue 18
ATFM DELAYS 3.3.2
Figure 9: 2008-2016 average daily traffic and delay per flight
The average ATFM delay per flight was 1.53 minutes, an increase of 7.7%
compared to 2015. En-route ATFM delay was 0.86 minutes per flight (17.8%
increase), above the 0.5 minutes per flight SES capacity target. Nevertheless, when
comparing 2016 to 2008 - year with similar traffic levels - there was significantly less
en-route delay (-45.9%). Airport ATFM delay per flight was 0.67 minutes, a
decrease of 3.3% compared to 2015.
2008 2009 2010 2011 2012 2013 2014 2015 2016
ATFM DELAY 2.34 1.60 2.88 1.81 1.11 0.92 1.03 1.42 1.53
EN-ROUTE 1.59 0.96 2.02 1.14 0.63 0.53 0.61 0.73 0.86
AIRPORT 0.75 0.64 0.86 0.67 0.48 0.39 0.42 0.69 0.67
TRAFFIC 27818 26103 26329 27146 26427 26215 26685 27094 27844
25000
25500
26000
26500
27000
27500
28000
0.0
0.5
1.0
1.5
2.0
2.5
3.0
Av
era
ge
Tra
ffic
Av
era
ge
de
lay p
er
flig
ht
(min
s)
Figure 8: Average daily ATFM delay (2016 vs.
2015)
Average daily ATFM delay
increased by 10.4% in 2016
compared to 2015. The
average daily en-route ATFM
delay increased by 21.0% and
the average daily airport
ATFM delay decreased by
0.6%.
19 725 23 871
18 817
18 695
38 543
42 566
0
5000
10000
15000
20000
25000
30000
35000
40000
45000
2015 2016
AT
FM
De
lays
(m
in)
AIRPORT
EN-ROUTE
(48.8%)
(51.2%)
(43.9%)
(56.1%)

EUROCONTROL NMD
Main Report
ANNUAL NETWORK OPERATIONS REPORT 2016
Edition Validity Date: 08/05/2017 Edition: 1.0 Status: Released Issue 19
Figure 10: ATFM delays in 2016
En-route ATC capacity
(22.7%), airport capacity
(19.9%) and airport weather
(18.8%) were the main
reasons for ATFM delay in
2016.
Brest ACC was the main generator of ATFM delay in 2016 contributing to 11.2% of the
average daily ATFM delay, mainly due to en-route ATC capacity issues, en-route events
(ERATO implementation) and en-route ATC disruptions (industrial actions).
ATFM delays generated by Istanbul/Sabiha Gökcen and Istanbul/Ataturk airports contributed
to 12.5% of the average daily ATFM delay in 2016, a decrease of 18.2% compared to 2015.
Both airports suffered from chronic airport capacity and weather issues.
In addition to Brest ACC, en-route ATC capacity affected mainly Maastricht, Barcelona,
Bordeaux, Marseille, Reims, Karlsruhe and Paris ACCs. En-route ATC staffing affected
mainly Brussels, Warsaw, Karlsruhe, Nicosia and Lisbon ACCs especially during the
summer months.
En-route and airport weather combined were the main cause of ATFM delay in 2016 (29.1%
of total ATFM delay). London/Heathrow, Amsterdam/Schiphol, London/Gatwick, Frankfurt
Main, Istanbul/Sabiha Gökcen, Istanbul/Ataturk, and Zurich airports, and Maastricht,
Karlsruhe, Langen and Paris ACCs were all affected by weather.
Several ATC industrial actions in France from January to September generated en-route
ATC disruption delays in all the French ACCs, with additional en-route ATFM delays in the
neighbouring ACCs due to ATFM protective measures. See Planned Events and Disruptions
for more information on disruptions and other events that affected the network throughout
2016.
9675
8448
8022
4347
3464
2913
2148
1019
900
483
423
343
238
142
0 2000 4000 6000 8000 10000
ENROUTE CAPACITY (ATC)
AIRPORT CAPACITY
AIRPORT WEATHER
ENROUTE WEATHER
ENROUTE STAFFING (ATC)
ENROUTE DISRUPTIONS (ATC)
ENROUTE EVENTS
AIRPORT CAPACITY (ATC)
ENROUTE DISRUPTIONS
AIRPORT DISRUPTIONS (ATC)
ENROUTE CAPACITY
AIRPORT STAFFING (ATC)
AIRPORT DISRUPTIONS
AIRPORT EVENTS
Proportion of ATFM delays in 2016

EUROCONTROL NMD
Main Report
ANNUAL NETWORK OPERATIONS REPORT 2016
Edition Validity Date: 08/05/2017 Edition: 1.0 Status: Released Issue 20
3.3.2.1 EN-ROUTE ATFM DELAYS
Figure 11: 2016 average daily en-route ATFM
delays
Figure 12: 2016 average daily en-route ATFM
delay per flight
The 21% increase in the average daily en-route ATFM delay was due to increases in en-
route weather (55.2%), en-route ATC disruptions (42.6%), en-route ATC staffing (22.1%)
and en-route ATC capacity (23. 3%).
Figure 13: Top 20 en-route ATFM delay locations during 2016
Figure 13 shows the top twenty en-route ATFM delay generating locations for 2016 with
respect to total ATFM delays. Figures are in minutes and they represent the average daily
delays for the individual locations.
9675
3464
2913
423
900
2148
4347
9168
2836
2043
479
442
1956
2801
0 5000 10000 15000
ENROUTE CAPACITY (ATC)
ENROUTE STAFFING (ATC)
ENROUTE DISRUPTIONS(ATC)
ENROUTE CAPACITY
ENROUTE DISRUPTIONS
ENROUTE EVENTS
ENROUTE WEATHER
0.35
0.12
0.10
0.02
0.03
0.08
0.16
0.34
0.10
0.08
0.02
0.02
0.07
0.10
0.00 0.10 0.20 0.30 0.40
ENROUTE CAPACITY (ATC)
ENROUTE STAFFING (ATC)
ENROUTE DISRUPTIONS(ATC)
ENROUTE CAPACITY
ENROUTE DISRUPTIONS
ENROUTE EVENTS
ENROUTE WEATHER
4748
2698
1736 1721 1273
1110 1106
998 798
789 787
712 698
557 425 407 326 318 230 217
0
500
1000
1500
2000
2500
3000
3500
4000
4500
5000
0%
5%
10%
15%
20%
BR
ES
T U
/AC
C
MA
AS
TR
ICH
T U
AC
BO
RD
EA
UX
ALL A
CC
KA
RLS
RU
HE
UA
C
MA
RS
EIL
LE
AC
C
BA
RC
ELO
NA
AC
C
PA
RIS
ALL A
CC
LA
NG
EN
AC
C
WA
RS
ZA
WA
AC
C
SC
OT
TIS
H A
CC
BR
US
SE
LS
CA
NA
C
LO
ND
ON
TM
A T
C
RE
IMS
U/A
CC
NIC
OS
IA A
CC
LO
ND
ON
AC
C
MA
DR
ID A
LL A
CC
LIS
BO
A A
CC
/UA
C
CA
NA
RIA
S A
CC
/FIC
BR
EM
EN
AC
C
AT
HIN
AI
CO
NT
RO
L
Avera
ge
en
-ro
ute
AT
FM
de
lay (
min
s)
Pro
po
rtio
n o
f to
tal en
-ro
ute
de
lay
ENROUTE CAPACITY (ATC) ENROUTE STAFFING (ATC) ENROUTE DISRUPTIONS (ATC)
ENROUTE CAPACITY ENROUTE DISRUPTIONS ENROUTE EVENTS
ENROUTE WEATHER PREV YEAR

EUROCONTROL NMD
Main Report
ANNUAL NETWORK OPERATIONS REPORT 2016
Edition Validity Date: 08/05/2017 Edition: 1.0 Status: Released Issue 21
The top twenty delay locations generated 90.7% of en-route ATFM delay in 2016. The top
five locations (Brest, Maastricht, Bordeaux, Karlsruhe and Marseille ACCs) generated 51.0%
of all en-route delay.
All five of the top ACCs have increased their average daily en-route ATFM delay in 2016:
Brest (32.8%), Maastricht (68.3%), Bordeaux (116.7%), Karlsruhe (102.7%) and Marseille
ACCs (137.9%). Prestwick ACC recorded the highest change on the top 20 ACCs, with an
ATFM delay 25 times higher than 2015, mainly due to the new ATM system implementation.
Reims (-50.6%), Nicosia (-74.2%), Lisbon (-51.0%) and Athens (-83.5%) ACCs have
decreased their ATFM delays.
En-route ATC capacity was the main reason of en-route delay per flight for the top five ACCs
(51%) followed by en-route events, en-route ATC disruptions and en-route weather (13%
each).
Figure 14: Top 20 en-route ATFM delay per flight locations during 2016
Most of the top twenty ACCs for the en-route delay locations (Figure 14) have increased
their average en-route ATFM delay per flight in 2016.
Nicosia, Reims, Lisbon and Athens ACCs reduced the average delay per flight while
Spanish ACCs have kept similar levels of delay compared to 2015 while traffic had
increased significantly.
Of the top twenty delay locations, the largest increases in delay were in Bordeaux, Brussels,
Brest, Prestwick and Marseille ACCs.
1.76
0.70 0.63 0.55 0.49 0.49 0.44 0.40 0.38 0.35 0.34 0.30 0.30 0.26 0.24 0.23 0.19 0.19 0.16 0.15
0.0
0.5
1.0
1.5
2.0
2.5
BR
ES
T U
/AC
C
BO
RD
EA
UX
AL
L A
CC
NIC
OS
IA A
CC
MA
AS
TR
ICH
T U
AC
BA
RC
EL
ON
A A
CC
BR
US
SE
LS
CA
NA
C
MA
RS
EIL
LE
AC
C
WA
RS
ZA
WA
AC
C
CA
NA
RIA
S A
CC
/FIC
KA
RLS
RU
HE
UA
C
PA
RIS
AL
L A
CC
SC
OT
TIS
H A
CC
LA
NG
EN
AC
C
RE
IMS
U/A
CC
PA
LM
A A
CC
LIS
BO
A A
CC
/UA
C
LO
ND
ON
TM
A T
C
OS
LO
AT
CC
AT
HIN
AI
CO
NT
RO
L
MA
DR
ID A
LL
AC
C
En
-ro
ute
de
lay p
er
flig
ht
(min
)
ENROUTE CAPACITY (ATC) ENROUTE STAFFING (ATC) ENROUTE DISRUPTIONS (ATC) ENROUTE CAPACITY ENROUTE DISRUPTIONS
ENROUTE EVENTS ENROUTE WEATHER PREV YEAR

EUROCONTROL NMD
Main Report
ANNUAL NETWORK OPERATIONS REPORT 2016
Edition Validity Date: 08/05/2017 Edition: 1.0 Status: Released Issue 22
En-route ATC capacity was the main reason of en-route ATFM delay per flight for the top
five ACCs (51%) followed by en-route events, en-route ATC disruptions and en-route
weather (13% each).
En-route ATC capacity delays were higher than the average ATC capacity delay per flight
(0.35 min/flt) per flight, in Brest (0.91 min/flt) and Barcelona (0.4 min/flt). Bordeaux
(0.34min/flt), Nicosia (0.25min/flt) and Canarias (0.25 min/flt) complete the top five ACCs in
terms of ATC capacity delays in 2016.
En-route staffing affected mainly Brussels (0.37 min/flt), Nicosia (0.32 min/flt) and Warsaw
(0.29 min/flt).
En-route ATC disruptions and En-route events affected mostly Brest (0.77 min/flt) and
Bordeaux (0.28 min/flt).
Maastricht was the most affected ACC by en-route weather in 2016 (0.22 min/flt).
An overview and information on individual ACCs can be found in En-Route Performance
Analysis and in Annex II.
3.3.2.1.1 EN-ROUTE SUMMER DELAYS
Almost 40% of 2016 en-route delay on the network was generated during the months of
June and July, with a en-route delay per flight of 2.7 and 2.6 minutes per flight, respectively.
These numbers were driven by the combination of high traffic growth with important flow
changes from eastern to western Europe (see 4.1 Traffic in Detail) with capacity, staffing and
weather issues affecting especially those ACCs on the Southwest (SW) axis.
The ACCs which suffered the most from capacity (ATC) issues were Brest, Maastricht,
Bordeaux, Barcelona and Reims: these improved their capacity roughly in line with what was
anticipated in the NOP, but this was still below their reference profile. One of the main
reasons for high en-route ATFM delays was the inability of some ANSPs to open the
maximum number of sectors at peak periods (NOP commitment) during summer.
En-route summer weather delay increased by 54% in 2016 compared to summer 2015.
Maastricht and Karlsruhe UACs were the areas most affected by en-route weather,
especially during the summer. ANSPs are for the most part aware of weather events, such
as thunderstorms, but tend to react too late and individually which leads to a higher delay
impact. The weather management process trial launched in 2015 continued during 2016 is
still proving to be insufficient for the purpose of anticipating and planning weather events. In
this respect, NM believes a more collaborative approach is needed as well as better
information on ANSPs plans to tackle individual weather events in good time.

EUROCONTROL NMD
Main Report
ANNUAL NETWORK OPERATIONS REPORT 2016
Edition Validity Date: 08/05/2017 Edition: 1.0 Status: Released Issue 23
As the end of the summer approached there was a significant drop in delay, while the traffic
remained high. Delays in September decreased 58.3% as compared to July even though
these two months had the same traffic, which was also an all-time record. The drop in delay
is the result of lower weather impacts. It is also linked with a slight decrease of traffic in the
ACCs which had had high capacity issues in July (Brest, Maastricht, Bordeaux and
Barcelona) rather than capacity improvements on the same ACCs.
3.3.2.2 AIRPORT/TMA ATFM DELAYS
Airport ATFM delay decreased by 0.6% in 2016 compared to 2015. Airport capacity and
weather contributed to 88.1% of the total Airport delays in 2016. Airport capacity issues at
some airports were the main reason of delay. Even though the airport capacity delays
decreased compared to the 2016 Istanbul/Sabiha Gökcen and Istanbul/Ataturk remained the
main contributors to airport capacity delays. The average daily airport ATFM delay due to
airport weather increased from 7,796 minutes in 2015 to 8,022 minutes in 2016. Adverse
weather conditions particularly impacted airport operations in December when 24% of all
weather delays were generated.
Figure 15: 2016 average daily airport/TMA
delays
ATFM delays due to airport
capacity (-4%), airport events and
airport disruptions decreased.
There were increased ATFM
delays due to airport weather
(+3%), as well as airport
disruptions, airport staffing (ATC)
and airport capacity (ATC).
During 2016 NM continuously provided support and recommendations to major airports
facing local capacity challenges and/or high delay levels. NM gave special attention to some
regions and airports. NM focussed especially on continuous implementation of the Greek
Islands Action Plan and trialled an airport function within the NMOC which provided tactical
support on hot-spot airports (See Greek Islands – Summer 2016).
An overview and information on individual airports can be found in section 6 Airports and in
Annex III.
1019
343
483
8448
238
142
8022
675
126
284
8808
727
401
7796
0 2000 4000 6000 8000 10000
AIRPORT CAPACITY (ATC)
AIRPORT STAFFING (ATC)
AIRPORT DISRUPTIONS (ATC)
AIRPORT CAPACITY
AIRPORT DISRUPTIONS
AIRPORT EVENTS
AIRPORT WEATHER

EUROCONTROL NMD
Main Report
ANNUAL NETWORK OPERATIONS REPORT 2016
Edition Validity Date: 08/05/2017 Edition: 1.0 Status: Released Issue 24
3.4 CAPACITY
In 2016 the effective capacity indicator increased by 0.39% over the whole European ATM
network (an increase of 0.02% for the summer season), when compared to the
corresponding periods of 2015. This minor increase shows that the additional capacity
offered in 2016 was insufficient to accommodate the much higher traffic increase, resulting in
additional delays compared to previous year. Nevertheless, the comparison with 2008, when
traffic levels were similar to 2016, shows that the additional capacity available in the network
contributed to much lower delays in 2016.
The capacity at European level is quantified using the “effective capacity”2 indicator of the
Performance Review Commission (PRC).
2 The "effective capacity” indicator corresponds to the volume of traffic that could be accommodated with an average of 1 min
en-route delay/flt, taking into account all causes. It is described in PRR 5, Annex 6.
Figure 16: Traffic, Delay and Effective capacity

EUROCONTROL NMD
Main Report
ANNUAL NETWORK OPERATIONS REPORT 2016
Edition Validity Date: 08/05/2017 Edition: 1.0 Status: Released Issue 25
3.5 FLIGHT EFFICIENCY
Figure 17: Average route extension due to airspace
design (RTE – DES)
The average route extension due
to airspace design decreased
from 2.55% in 2015 to 2.47% in
2016 (Figure 17), exceeding the
annual target of 0.06 percentage
points reduction. The indicator
reached a historically low level in
December 2016 with 2.38%. The
total potential savings for 2016
amounted to approximately 3.3
million nautical miles.
Figure 18: Yearly evolution of flight-planning indicator
(KEP)
The flight planning indicator
(KEP) measures the average
route extension based on the
latest filed flight plan. It
increased from 4.74% in 2015
to 4.82% in 2016, which is
above the NM objective of
4.34% (Figure 18).
The 2016 route extension performance target was missed mainly due to the capacity
shortfalls during the ATC strikes or airspace avoidance/closure due to crisis situations. This
generated total losses of 2.7 million nautical miles over the period January-October. For
November and December 2016 the indicators show gains of approximately 1.1 million
nautical miles flown less. This is explained by the fact that some major crisis started in
November 2015 impacting flight efficiency (e.g. mutual overflight deny measures between
Ukraine and Russian Federation).
3.53% 3.54% 3.45% 3.22%
3.04% 2.96%
2.80% 2.63% 2.55% 2.47%
0.00%
0.50%
1.00%
1.50%
2.00%
2.50%
3.00%
3.50%
4.00%
2007 2008 2009 2010 2011 2012 2013 2014 2015 2016
4.91% 4.87% 4.86% 4.70% 4.74% 4.82%
2.00%
2.50%
3.00%
3.50%
4.00%
4.50%
5.00%
5.50%
2011 2012 2013 2014 2015 2016

EUROCONTROL NMD
Main Report
ANNUAL NETWORK OPERATIONS REPORT 2016
Edition Validity Date: 08/05/2017 Edition: 1.0 Status: Released Issue 26
Figure 19: Yearly evolution of the actual trajectory
indicator (KEA)
The actual trajectory indicator (KEA)
increased to 2.98% (Figure 19),
which is above the target (2.78%) by
0.11pp. The negative impact is also
explained by industrial actions and
political events. It was partially
mitigated by a significant progress
with the implementation of the Free-
Route Airspace (FRA).
3.31% 3.20%
3.14%
2.72% 2.77%
2.98%
2.00%
2.20%
2.40%
2.60%
2.80%
3.00%
3.20%
3.40%
2011 2012 2013 2014 2015 2016
EUROCONTROL NMD
Main Report
ANNUAL NETWORK OPERATIONS REPORT 2016
Edition Validity Date: 08/05/2017 Edition: 1.0 Status: Released Issue 27
4 TRAFFIC IN DETAIL
Figure 21: IFR Flights per day in NM Area
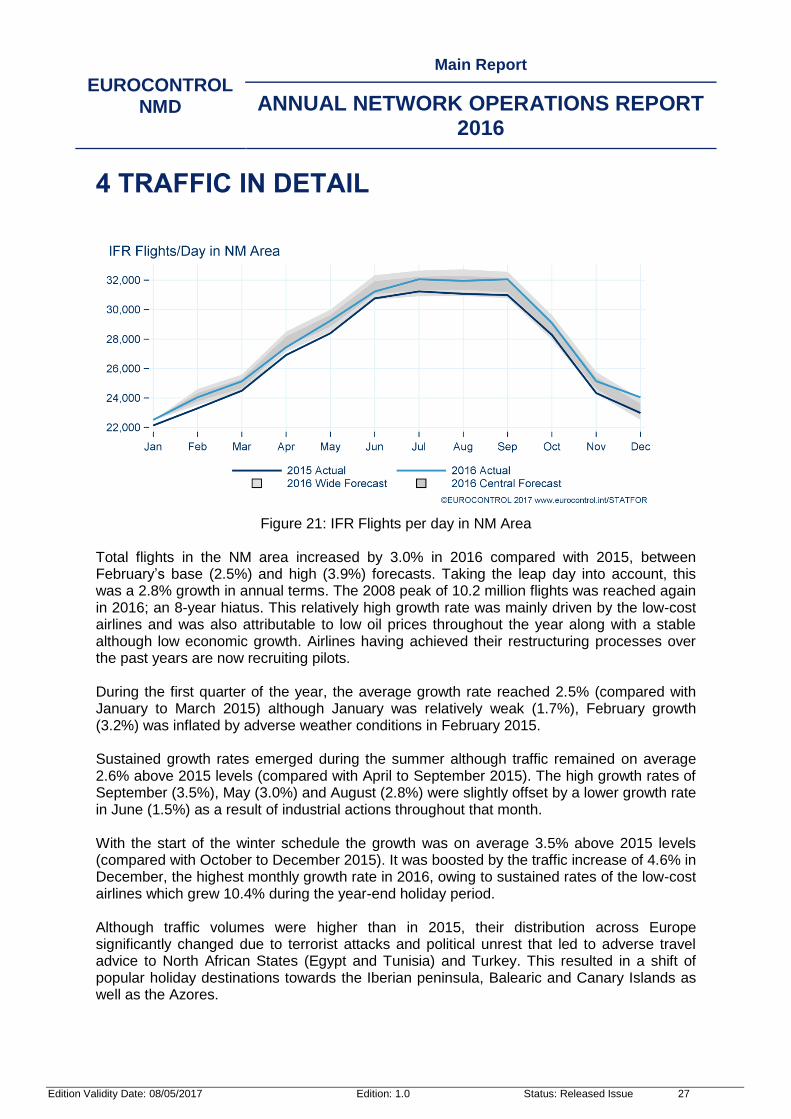
Total flights in the NM area increased by 3.0% in 2016 compared with 2015, between February’s base (2.5%) and high (3.9%) forecasts. Taking the leap day into account, this was a 2.8% growth in annual terms. The 2008 peak of 10.2 million flights was reached again in 2016; an 8-year hiatus. This relatively high growth rate was mainly driven by the low-cost airlines and was also attributable to low oil prices throughout the year along with a stable although low economic growth. Airlines having achieved their restructuring processes over the past years are now recruiting pilots. During the first quarter of the year, the average growth rate reached 2.5% (compared with January to March 2015) although January was relatively weak (1.7%), February growth (3.2%) was inflated by adverse weather conditions in February 2015. Sustained growth rates emerged during the summer although traffic remained on average 2.6% above 2015 levels (compared with April to September 2015). The high growth rates of September (3.5%), May (3.0%) and August (2.8%) were slightly offset by a lower growth rate in June (1.5%) as a result of industrial actions throughout that month. With the start of the winter schedule the growth was on average 3.5% above 2015 levels (compared with October to December 2015). It was boosted by the traffic increase of 4.6% in December, the highest monthly growth rate in 2016, owing to sustained rates of the low-cost airlines which grew 10.4% during the year-end holiday period. Although traffic volumes were higher than in 2015, their distribution across Europe significantly changed due to terrorist attacks and political unrest that led to adverse travel advice to North African States (Egypt and Tunisia) and Turkey. This resulted in a shift of popular holiday destinations towards the Iberian peninsula, Balearic and Canary Islands as well as the Azores.
EUROCONTROL NMD
Main Report
ANNUAL NETWORK OPERATIONS REPORT 2016
Edition Validity Date: 08/05/2017 Edition: 1.0 Status: Released Issue 28
4.1 NETWORK CONTRIBUTORS
Figure 20: Main changes to local3 traffic on the European network
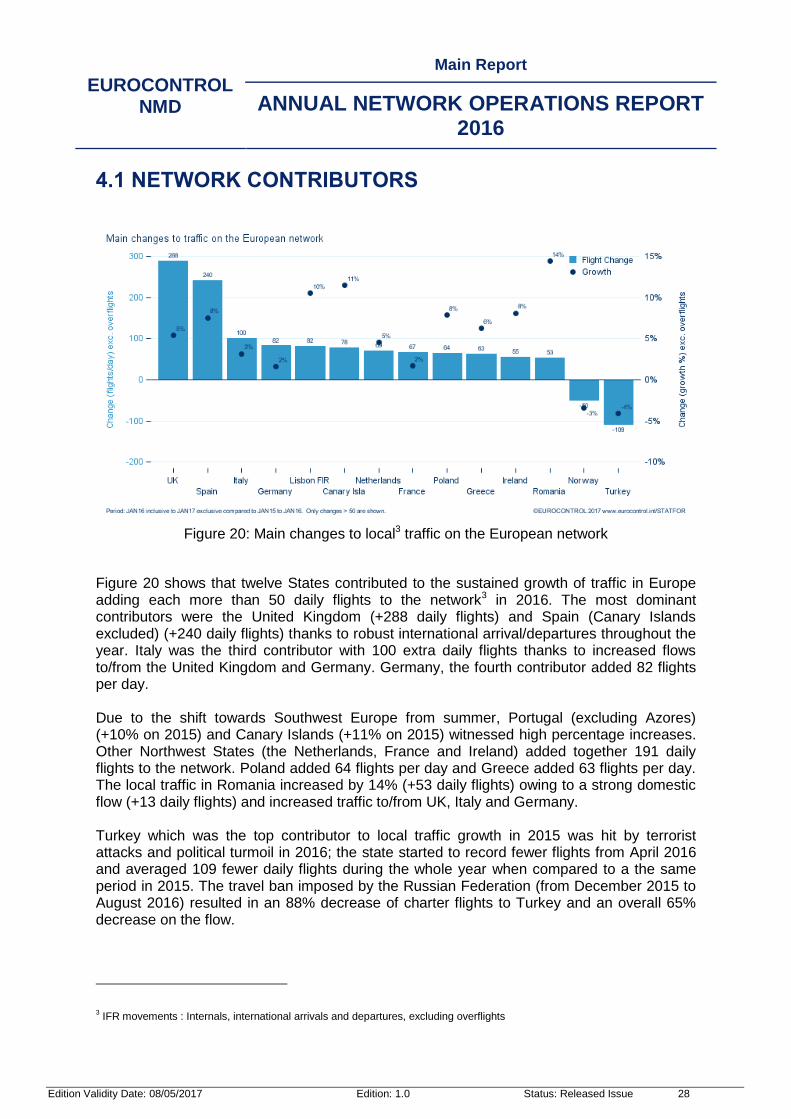
Figure 20 shows that twelve States contributed to the sustained growth of traffic in Europe adding each more than 50 daily flights to the network3 in 2016. The most dominant contributors were the United Kingdom (+288 daily flights) and Spain (Canary Islands excluded) (+240 daily flights) thanks to robust international arrival/departures throughout the year. Italy was the third contributor with 100 extra daily flights thanks to increased flows to/from the United Kingdom and Germany. Germany, the fourth contributor added 82 flights per day. Due to the shift towards Southwest Europe from summer, Portugal (excluding Azores) (+10% on 2015) and Canary Islands (+11% on 2015) witnessed high percentage increases. Other Northwest States (the Netherlands, France and Ireland) added together 191 daily flights to the network. Poland added 64 flights per day and Greece added 63 flights per day. The local traffic in Romania increased by 14% (+53 daily flights) owing to a strong domestic flow (+13 daily flights) and increased traffic to/from UK, Italy and Germany. Turkey which was the top contributor to local traffic growth in 2015 was hit by terrorist attacks and political turmoil in 2016; the state started to record fewer flights from April 2016 and averaged 109 fewer daily flights during the whole year when compared to a the same period in 2015. The travel ban imposed by the Russian Federation (from December 2015 to August 2016) resulted in an 88% decrease of charter flights to Turkey and an overall 65% decrease on the flow.
3 IFR movements : Internals, international arrivals and departures, excluding overflights

EUROCONTROL NMD
Main Report
ANNUAL NETWORK OPERATIONS REPORT 2016
Edition Validity Date: 08/05/2017 Edition: 1.0 Status: Released Issue 29
Norway continued to be affected by the oil crisis but also to a lesser extent by the air passenger tax increase in effect since June and saw 50 fewer daily flights in 2016. Although not shown on the graph, Belgium/Luxembourg was impacted by the terrorist attacks on 22 March and recorded 24 fewer flights per day in 2016 with its international arrivals/departures falling by 2.0% for the year as a whole.
4.2 ROUTING ASPECTS
Figure 21: Biggest changes in traffic patterns in 2016
Figure 21 shows States for which flights, all flows considered (arrival/departures, internals, overflights) have increased or decreased by +/- 7% in 2016. The most noticeable change was the Northwestern Europe flows shifting from Southeastern Europe to Southwestern Europe in 2016. This is attributable to the aftermath of terrorist attacks that impacted the usually popular holiday destinations in Turkey and Egypt for the benefit of Portugal, Santa Maria, Canary Islands and Spain which recorded strong increases in their arrivals/departures flows. This shift of traffic had also a negative impact on overflights with declines in the Southeast (SE) Axis States (from Italy to Cyprus). Some other States in Eastern Europe (e.g. Moldova, Ukraine, Armenia, Georgia and Turkey) suffered from the reduction of traffic from/to the Russian Federation. Iceland recorded increases in its flows to/from North Atlantic and Northwestern Europe as well as rises in overflight growth between the Middle-East and North Atlantic. Ireland also had strong overflight growth owing to transatlantic flights from/to Northwestern Europe but also due to the increase in flights between UK and the Iberian Peninsula and Canary Islands.

EUROCONTROL NMD
Main Report
ANNUAL NETWORK OPERATIONS REPORT 2016
Edition Validity Date: 08/05/2017 Edition: 1.0 Status: Released Issue 30
There were additional overflights for Poland resulting from the growth of the Russian Federation flows from/to Tunisia (from the second half of 2016) and Bulgaria, but also due to the fact that Russian flows continued to avoid crossing Ukraine airspace (Ukraine-Russian Federation flight ban in force since March 2014). More generally, the numerous constraints already in place in 2015 due to the airspace unavailability continued to generate many re-routings that affected some States positively, others negatively.
4.3 EXTRA-EUROPEAN PARTNERS
Figure 22: Daily Flight Change in 2016
As shown on the left hand side of the graph in Figure 22, the United States was for the second year in a row the number one destination from Europe in terms of number of flights: 466 departures per day on average, an increase of 6.0% compared with 2015. This flow represented 18% of all departures from ECAC to countries outside Europe. The Russian Federation remained Europe’s second destination with 345 daily departures, an annual decrease of 16% compared with 2015. There were progressive signs of traffic recovery which started in October and led to an increase of 4.3% in December (vs. December 2015). This coincided with a progressive return to flights to Turkey after the ban was lifted at the end of August 2016. The United Arab Emirates was the third extra-European partner with 162 daily departures on average, an increase of 7.4% on last year. Other States in the Middle-East: Qatar, Iran, Saudi Arabia and Oman recorded significant increases on their flow from/to Europe. Morocco was the fourth extra-European partner with 144 average daily departures, an annual decrease of 2.0% although traffic has been healthier since November. The state recorded an 8.5% increase on its flights from France - its main European partner - during the last two months of the year (vs. same period in 2015). Israel was the fifth extra-European partner and recorded the best progression in 2016 with an increase of 9.4% or 140 departures per day throughout the year with Eastern States (Cyprus, Ukraine, Turkey, Romania, Greece and Georgia) adding the most flights to the flow. In 2016 Israel’s main European partners were Turkey, Germany, Italy, Greece and France.
EUROCONTROL NMD
Main Report
ANNUAL NETWORK OPERATIONS REPORT 2016
Edition Validity Date: 08/05/2017 Edition: 1.0 Status: Released Issue 31
Traffic flows between Europe and Tunisia continued to suffer from the disruption due to terrorist attacks which took place in 2015 although the size of the decrease reduced from an average of -19.6% from January to August to an increase of 5% for the rest of the year thanks to increased flights from France and Turkey. Overall, flights from Europe to Tunisia were down 13% on 2015. Tunisia was the twelfth destination from Europe in 2016 (hence not shown in Figure 22). Flows between Europe and Egypt remained overall 30% below 2015 levels but started to recover in December with an increase of 7.5% owing mainly to flights from Ukraine which doubled to 14 departures per day in December 2016 (vs. December 2015). This flow was ranked tenth in 2016 (hence not shown in Figure 22).
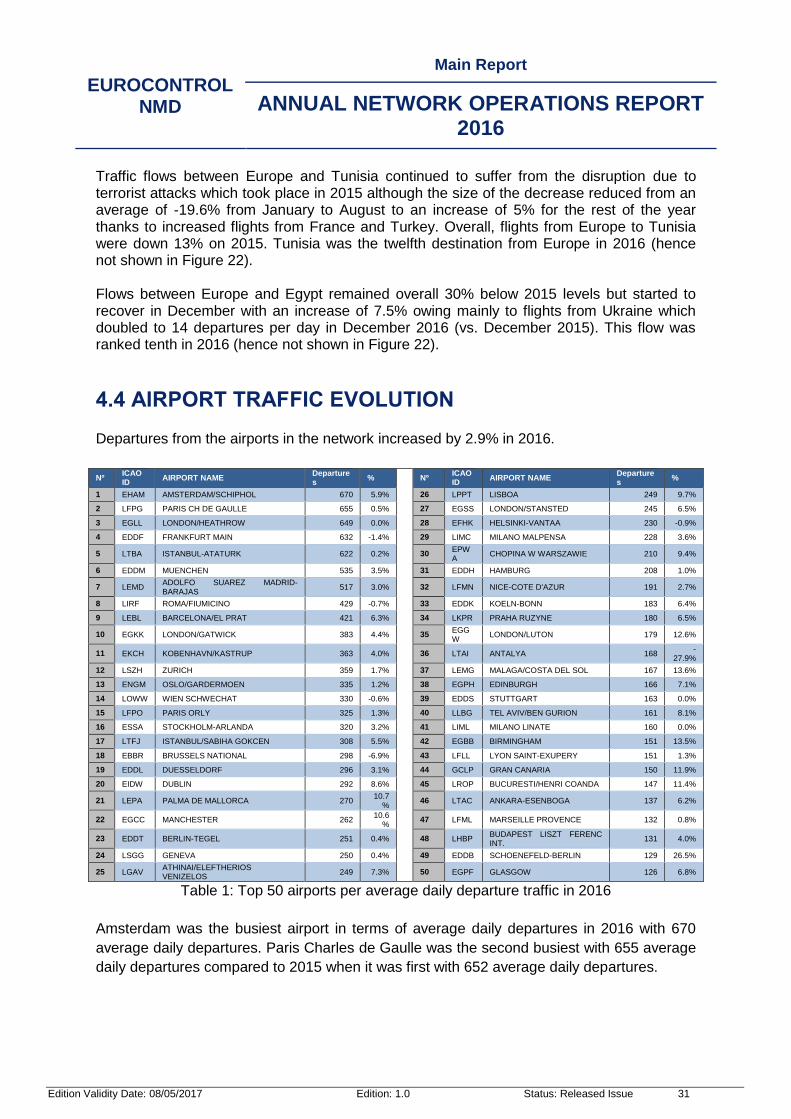
4.4 AIRPORT TRAFFIC EVOLUTION
Departures from the airports in the network increased by 2.9% in 2016.
Nº ICAO ID
AIRPORT NAME Departures
% Nº ICAO ID
AIRPORT NAME Departures
%
1 EHAM AMSTERDAM/SCHIPHOL 670 5.9% 26 LPPT LISBOA 249 9.7%
2 LFPG PARIS CH DE GAULLE 655 0.5% 27 EGSS LONDON/STANSTED 245 6.5%
3 EGLL LONDON/HEATHROW 649 0.0% 28 EFHK HELSINKI-VANTAA 230 -0.9%
4 EDDF FRANKFURT MAIN 632 -1.4% 29 LIMC MILANO MALPENSA 228 3.6%
5 LTBA ISTANBUL-ATATURK 622 0.2% 30 EPWA
CHOPINA W WARSZAWIE 210 9.4%
6 EDDM MUENCHEN 535 3.5% 31 EDDH HAMBURG 208 1.0%
7 LEMD ADOLFO SUAREZ MADRID-BARAJAS
517 3.0% 32 LFMN NICE-COTE D'AZUR 191 2.7%
8 LIRF ROMA/FIUMICINO 429 -0.7% 33 EDDK KOELN-BONN 183 6.4%
9 LEBL BARCELONA/EL PRAT 421 6.3% 34 LKPR PRAHA RUZYNE 180 6.5%
10 EGKK LONDON/GATWICK 383 4.4% 35 EGGW
LONDON/LUTON 179 12.6%
11 EKCH KOBENHAVN/KASTRUP 363 4.0% 36 LTAI ANTALYA 168 -
27.9%
12 LSZH ZURICH 359 1.7% 37 LEMG MALAGA/COSTA DEL SOL 167 13.6%
13 ENGM OSLO/GARDERMOEN 335 1.2% 38 EGPH EDINBURGH 166 7.1%
14 LOWW WIEN SCHWECHAT 330 -0.6% 39 EDDS STUTTGART 163 0.0%
15 LFPO PARIS ORLY 325 1.3% 40 LLBG TEL AVIV/BEN GURION 161 8.1%
16 ESSA STOCKHOLM-ARLANDA 320 3.2% 41 LIML MILANO LINATE 160 0.0%
17 LTFJ ISTANBUL/SABIHA GOKCEN 308 5.5% 42 EGBB BIRMINGHAM 151 13.5%
18 EBBR BRUSSELS NATIONAL 298 -6.9% 43 LFLL LYON SAINT-EXUPERY 151 1.3%
19 EDDL DUESSELDORF 296 3.1% 44 GCLP GRAN CANARIA 150 11.9%
20 EIDW DUBLIN 292 8.6% 45 LROP BUCURESTI/HENRI COANDA 147 11.4%
21 LEPA PALMA DE MALLORCA 270 10.7
% 46 LTAC ANKARA-ESENBOGA 137 6.2%
22 EGCC MANCHESTER 262 10.6
% 47 LFML MARSEILLE PROVENCE 132 0.8%
23 EDDT BERLIN-TEGEL 251 0.4% 48 LHBP BUDAPEST LISZT FERENC INT.
131 4.0%
24 LSGG GENEVA 250 0.4% 49 EDDB SCHOENEFELD-BERLIN 129 26.5%
25 LGAV ATHINAI/ELEFTHERIOS VENIZELOS
249 7.3% 50 EGPF GLASGOW 126 6.8%
Table 1: Top 50 airports per average daily departure traffic in 2016
Amsterdam was the busiest airport in terms of average daily departures in 2016 with 670
average daily departures. Paris Charles de Gaulle was the second busiest with 655 average
daily departures compared to 2015 when it was first with 652 average daily departures.

EUROCONTROL NMD
Main Report
ANNUAL NETWORK OPERATIONS REPORT 2016
Edition Validity Date: 08/05/2017 Edition: 1.0 Status: Released Issue 32
Six of the top ten airports (Amsterdam/Schiphol, Paris/Charles De Gaulle, Munich,
Madrid/Barajas, Barcelona/El Prat and London/Gatwick) had an increase in average daily
flights in 2016. Two of the top ten airports (Frankfurt/Main and Rome/Fiumicino) had a
decrease in average daily flights in 2016, while Istanbul/Ataturk and London/Heathrow
remained at similar levels to 2015.
Overall, the largest increase was at Berlin/Schoenefeld airport where traffic increased by
26.5% compared to 2015. The main contributors to this increase were Ryanair (+8,282
flights) and Easyjet (+1,392 flights). Malaga (13.6%), Birmingham (13.5%), London/Luton
(12.6%), Gran Canaria (11.9%), Bucharest (11.4%), Palma de Mallorca (10.7%) and
Manchester (10.6%) airports recorded significant traffic increase in 2016.
The largest decrease was at Antalya airport, where traffic decreased by 27.9% mainly due to
a reduction of flights from the Russian Federation (-9,940 flights), Germany (-5,643 flights)
and Sweden (-915 flights). Brussels airport also recorded a significant decrease of traffic (-
6.9%).
4.5 AIRLINE INDUSTRY
Figure 23: European Load Factors (source: AEA)
Figure 23 shows that in 2016 (January to October); the load factors of major European flag carriers on Europe cross-border flows were 1.1 percentage point lower than the 2015 ones, at 76.7% on average (source: AEA figures until WK45).

EUROCONTROL NMD
Main Report
ANNUAL NETWORK OPERATIONS REPORT 2016
Edition Validity Date: 08/05/2017 Edition: 1.0 Status: Released Issue 33
Figure 24: Traffic Development per Market Segment
STATFOR market segments definitions for business aviation, low-cost and all-cargo categories were reviewed at the end of 2016. The updated rules have been retroactively applied from 2012 onwards. The new definitions are available on the STATFOR Interactive Dashboardii.
The low-cost segment maintained its dominant position throughout the year with an average
growth rate of 7.5% and was followed by the traditional segment that grew steadily at a rate
of 2.1%.
A small portion of the low-cost segment’s growth was due to some traditional carriers, as part of restructuring, having handed their short-haul flights to low-cost carriers (e.g. Lufthansa to Eurowings). Also on the growth side, the all-cargo segment recorded an annual growth rate of 1.7% owing to the last two months of the year - November and December - which recorded strong increases of 8.4% partly due to the sustained increase in export orders in Germany and the ongoing weakness of the euro. The business aviation segment recorded a small growth of 0.5%, although ending November and December high with a growth of 4.3%. The charter segment (non-scheduled) was the weakest with an average yearly fall of 15% mainly due to a sharp decline in traffic to/from Turkey and the Russian Federation and to/from Egypt and the Russian Federation, notwithstanding the continuing impact of travel advice to Turkey on European leisure tour operators. Four out of the top five airlines adding the most flights to the European network in 2016 (vs. 2015) were low-cost operators. Ryanair added 200 flights per day in 2016 (compared with 2015) and was by far the main contributor, followed by easyJet (+75 flights/day), Wizz Air

EUROCONTROL NMD
Main Report
ANNUAL NETWORK OPERATIONS REPORT 2016
Edition Validity Date: 08/05/2017 Edition: 1.0 Status: Released Issue 34
(+50 flights/day) and Vueling (+35 flights/day). Turkish Airlines was the first traditional scheduled operator and ranked fifth, adding 28 flights per day to the network in 2016.
Figure 25: Crude Oil and Fuel Prices Evolution
As Figure 25 shows, oil prices averaged out at €41 per barrel in 2016. Oil prices fluctuated from €32 per barrel during the first quarter of 2016 up to €42 per barrel during the second and third quarters to reach an average of €47 per barrel in the last quarter, climbing to €52 per barrel in December, the highest level since July 2015. Fuel prices have consequently been low, with an average of €383 per tonne in 2016.
Figure 26: Deflated ticket prices in Europe
As Figure 26 shows airline ticket price growth in Europe has decelerated since the beginning of the year until December, owing to a drop in oil prices and increased competition among airlines. Ticket prices were on average 2.8% cheaper in 2016. The monthly peaks were mostly driven by Easter in March and by increasing oil prices in December.
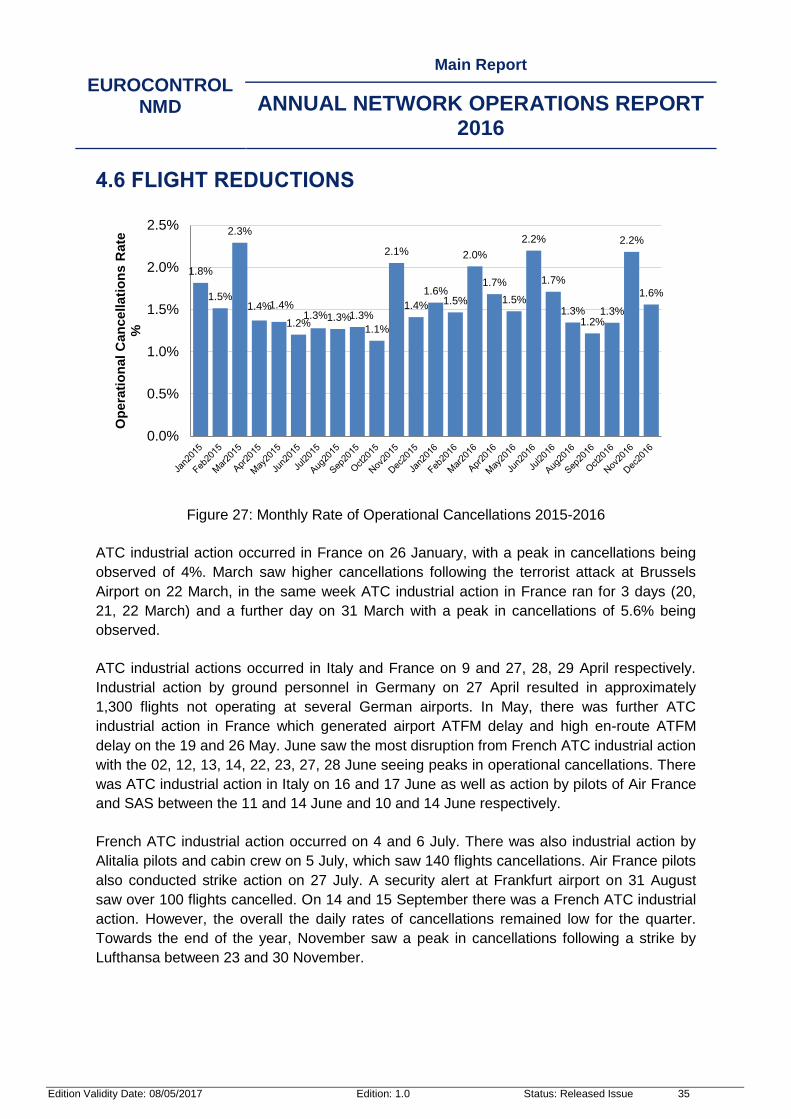
EUROCONTROL NMD
Main Report
ANNUAL NETWORK OPERATIONS REPORT 2016
Edition Validity Date: 08/05/2017 Edition: 1.0 Status: Released Issue 35
4.6 FLIGHT REDUCTIONS
Figure 27: Monthly Rate of Operational Cancellations 2015-2016
ATC industrial action occurred in France on 26 January, with a peak in cancellations being
observed of 4%. March saw higher cancellations following the terrorist attack at Brussels
Airport on 22 March, in the same week ATC industrial action in France ran for 3 days (20,
21, 22 March) and a further day on 31 March with a peak in cancellations of 5.6% being
observed.
ATC industrial actions occurred in Italy and France on 9 and 27, 28, 29 April respectively.
Industrial action by ground personnel in Germany on 27 April resulted in approximately
1,300 flights not operating at several German airports. In May, there was further ATC
industrial action in France which generated airport ATFM delay and high en-route ATFM
delay on the 19 and 26 May. June saw the most disruption from French ATC industrial action
with the 02, 12, 13, 14, 22, 23, 27, 28 June seeing peaks in operational cancellations. There
was ATC industrial action in Italy on 16 and 17 June as well as action by pilots of Air France
and SAS between the 11 and 14 June and 10 and 14 June respectively.
French ATC industrial action occurred on 4 and 6 July. There was also industrial action by
Alitalia pilots and cabin crew on 5 July, which saw 140 flights cancellations. Air France pilots
also conducted strike action on 27 July. A security alert at Frankfurt airport on 31 August
saw over 100 flights cancelled. On 14 and 15 September there was a French ATC industrial
action. However, the overall the daily rates of cancellations remained low for the quarter.
Towards the end of the year, November saw a peak in cancellations following a strike by
Lufthansa between 23 and 30 November.
1.8%
1.5%
2.3%
1.4% 1.4%
1.2% 1.3% 1.3% 1.3%
1.1%
2.1%
1.4%
1.6% 1.5%
2.0%
1.7%
1.5%
2.2%
1.7%
1.3% 1.2%
1.3%
2.2%
1.6%
0.0%
0.5%
1.0%
1.5%
2.0%
2.5%
Op
era
tio
nal
Can
cellati
on
s R
ate
%

EUROCONTROL NMD
Main Report
ANNUAL NETWORK OPERATIONS REPORT 2016
Edition Validity Date: 08/05/2017 Edition: 1.0 Status: Released Issue 36
5 EN-ROUTE PERFORMANCE ANALYSIS
5.1 PLANNED EVENTS AND DISRUPTIONS
En-route ATFM delays due to planned events (system upgrades/transition projects) were at
similar levels to 2015, but delays due to disruptions more than doubled (see En-Route ATFM
Delays for further information). In the following paragraphs there is an overview of the main
events and disruptions in 2016.
EN-ROUTE PLANNED EVENTS 5.1.1
The new ATM system implementation at Brest ACC (ERATO) continued to generate high
delays at the beginning of 2016 (approximately 450,000 minutes until April). System
implementations and upgrades at Langen ACC (P2, PSS) and London (Lamp Programme)
went relatively well, generating respectively 70,000 and 60,000 minutes of delay. However,
the iTEC system implementation at Prestwick ACC impacted heavily operations over the
summer (120,000 minutes of delay). This implementation was not included in the NOP
Transition Plans as there were no capacity reductions declared by UK NATS. The excellent
network cooperation for Bordeaux ACC’s ERATO implementation at year-end ensured a
smooth transition. The implementation generated 70,000 minutes of delay.

EUROCONTROL NMD
Main Report
ANNUAL NETWORK OPERATIONS REPORT 2016
Edition Validity Date: 08/05/2017 Edition: 1.0 Status: Released Issue 37
Table 2 shows the system upgrade/transition projects that imposed capacity reductions in
several ACCs and that were included in the NOP Transition Plansiii.
Major Projects / Special Events4 January - March April - June July -September October - December
Austria - APPs
Topsky (Jan ’16)
France - Bordeaux ACC
Implementation of ERATO system upgrade
France - Brest ACC
Implementation of ERATO system upgrade
Germany - Langen ACC
Implementation of PSS system EBG07
New system, P2 (Jan '16)
Implementation of PSS system EBG10 (Dec ’16)
Poland – Warsaw ACC
New sectorisation (Marc-May ’16)
Switzerland - Zurich ACC
ATM system (stripless CH step 4)
UK – London TC
LAMP 1A implementation
Ukraine - L'viv ACC
New ATM system (transition to)
Table 2: System Upgrade/Transition Projects
The Euro 2016 football tournament was well prepared and coordinated with NM and created
minimal impact on operations.
The FRISIAN FLAG military exercise generated ATFM delays in Maastricht UAC and the
Bellerophon exercise generated ATFM delay in Brest ACC with the application of protective
measures in Barcelona and Canarias ACCs due to traffic onload. Regular military activity
generated delays in Marseille and Nicosia ACCs.
4 Does not include postponed projects and should not be considered as exhaustive
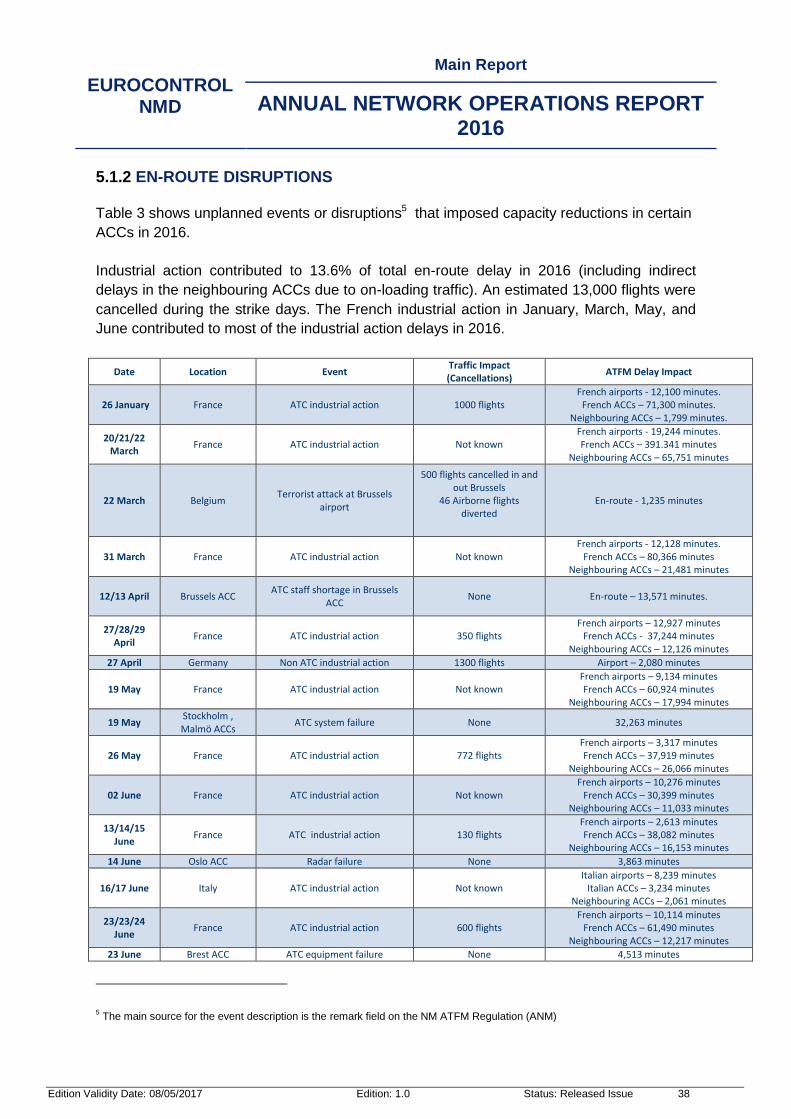
EUROCONTROL NMD
Main Report
ANNUAL NETWORK OPERATIONS REPORT 2016
Edition Validity Date: 08/05/2017 Edition: 1.0 Status: Released Issue 38
EN-ROUTE DISRUPTIONS 5.1.2
Table 3 shows unplanned events or disruptions5 that imposed capacity reductions in certain
ACCs in 2016.
Industrial action contributed to 13.6% of total en-route delay in 2016 (including indirect
delays in the neighbouring ACCs due to on-loading traffic). An estimated 13,000 flights were
cancelled during the strike days. The French industrial action in January, March, May, and
June contributed to most of the industrial action delays in 2016.
Date Location Event Traffic Impact (Cancellations)
ATFM Delay Impact
26 January France ATC industrial action 1000 flights French airports - 12,100 minutes.
French ACCs – 71,300 minutes. Neighbouring ACCs – 1,799 minutes.
20/21/22 March
France ATC industrial action Not known French airports - 19,244 minutes. French ACCs – 391.341 minutes
Neighbouring ACCs – 65,751 minutes
22 March Belgium Terrorist attack at Brussels
airport
500 flights cancelled in and out Brussels
46 Airborne flights diverted
En-route - 1,235 minutes
31 March France ATC industrial action Not known French airports - 12,128 minutes.
French ACCs – 80,366 minutes Neighbouring ACCs – 21,481 minutes
12/13 April Brussels ACC ATC staff shortage in Brussels
ACC None
En-route – 13,571 minutes.
27/28/29 April
France ATC industrial action 350 flights French airports – 12,927 minutes
French ACCs - 37,244 minutes Neighbouring ACCs – 12,126 minutes
27 April Germany Non ATC industrial action 1300 flights Airport – 2,080 minutes
19 May France ATC industrial action Not known French airports – 9,134 minutes French ACCs – 60,924 minutes
Neighbouring ACCs – 17,994 minutes
19 May Stockholm , Malmö ACCs
ATC system failure None 32,263 minutes
26 May France ATC industrial action 772 flights French airports – 3,317 minutes French ACCs – 37,919 minutes
Neighbouring ACCs – 26,066 minutes
02 June France ATC industrial action Not known French airports – 10,276 minutes
French ACCs – 30,399 minutes Neighbouring ACCs – 11,033 minutes
13/14/15 June
France ATC industrial action 130 flights French airports – 2,613 minutes French ACCs – 38,082 minutes
Neighbouring ACCs – 16,153 minutes
14 June Oslo ACC Radar failure None 3,863 minutes
16/17 June Italy ATC industrial action Not known Italian airports – 8,239 minutes
Italian ACCs – 3,234 minutes Neighbouring ACCs – 2,061 minutes
23/23/24 June
France ATC industrial action 600 flights French airports – 10,114 minutes
French ACCs – 61,490 minutes Neighbouring ACCs – 12,217 minutes
23 June Brest ACC ATC equipment failure None 4,513 minutes
5 The main source for the event description is the remark field on the NM ATFM Regulation (ANM)
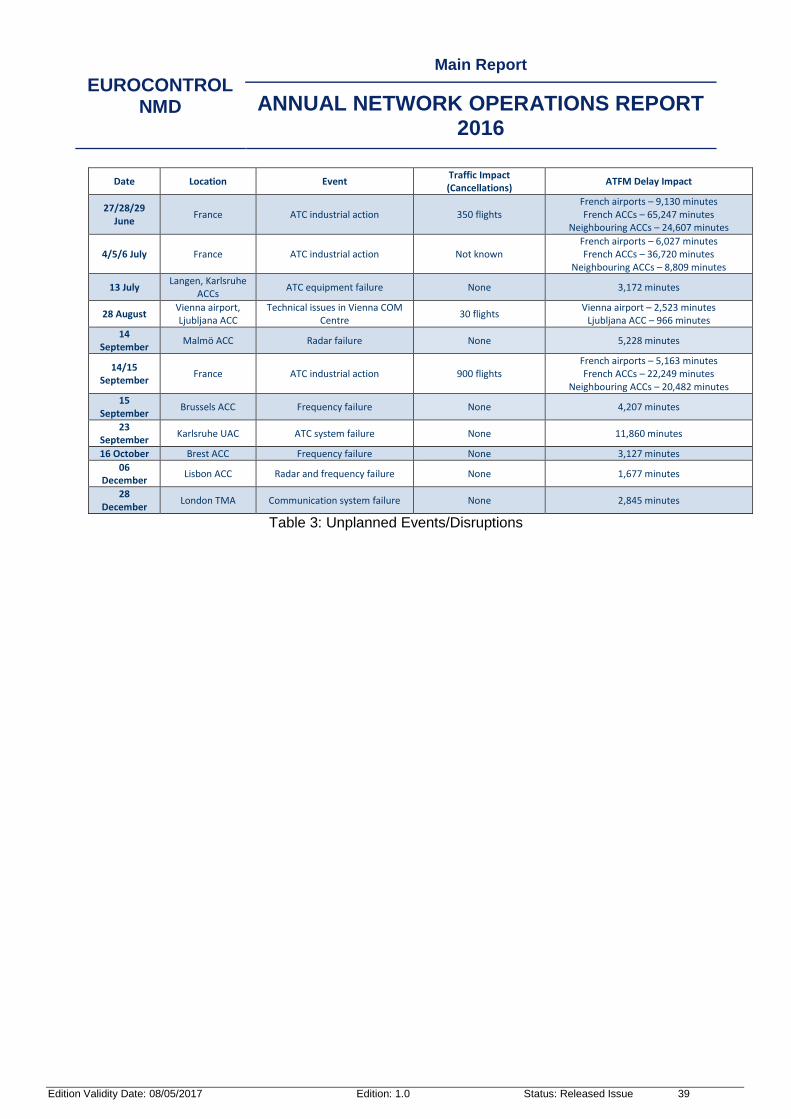
EUROCONTROL NMD
Main Report
ANNUAL NETWORK OPERATIONS REPORT 2016
Edition Validity Date: 08/05/2017 Edition: 1.0 Status: Released Issue 39
Date Location Event Traffic Impact (Cancellations)
ATFM Delay Impact
27/28/29 June
France ATC industrial action 350 flights French airports – 9,130 minutes French ACCs – 65,247 minutes
Neighbouring ACCs – 24,607 minutes
4/5/6 July France ATC industrial action Not known French airports – 6,027 minutes French ACCs – 36,720 minutes
Neighbouring ACCs – 8,809 minutes
13 July Langen, Karlsruhe
ACCs ATC equipment failure None 3,172 minutes
28 August Vienna airport, Ljubljana ACC
Technical issues in Vienna COM Centre
30 flights Vienna airport – 2,523 minutes
Ljubljana ACC – 966 minutes
14 September
Malmö ACC Radar failure None 5,228 minutes
14/15 September
France ATC industrial action 900 flights French airports – 5,163 minutes French ACCs – 22,249 minutes
Neighbouring ACCs – 20,482 minutes
15 September
Brussels ACC Frequency failure None 4,207 minutes
23 September
Karlsruhe UAC ATC system failure None 11,860 minutes
16 October Brest ACC Frequency failure None 3,127 minutes
06 December
Lisbon ACC Radar and frequency failure None 1,677 minutes
28 December
London TMA Communication system failure None 2,845 minutes
Table 3: Unplanned Events/Disruptions

EUROCONTROL NMD
Main Report
ANNUAL NETWORK OPERATIONS REPORT 2016
Edition Validity Date: 08/05/2017 Edition: 1.0 Status: Released Issue 40
5.2 CAPACITY EVOLUTION
The capacity at European level is quantified using the "effective capacity" 2 indicator of the
Performance Review Commission (PRC) that takes into account traffic and delay evolution.
Between 1999 and 2016, traffic increased by 27%, the “effective capacity” of the network
increased by 60% and the average en-route ATFM delay per flight decreased by 81%.
In 2016 the effective capacity indicator increased by 0.39% over the whole European ATM
network when compared to 2015.
The "effective capacity” indicator takes into account en-route ATFM delays, for all reasons,
including weather, disruptions and significant events: system failures, industrial action,
implementation of new ATM systems. Figure 28 shows the monthly evolution of the
“effective capacity” of the European ATM system since 2006. The highest value ever of this
indicator was in September 2016, when the average daily traffic value was also the highest
ever. September 2016 is the month with highest values of the “effective capacity” indicator
for the last three years, while July-August-September 2016 saw the highest daily traffic
values of the last 20 years.
Figure 28: Annual Traffic, delay and capacity evolution
0.00
0.50
1.00
1.50
2.00
2.50
3.00
3.50
4.00
0
5000
10000
15000
20000
25000
30000
35000
En
rou
te d
ela
y p
er
flig
ht (m
in)
Mo
ve
me
nts
per
day
Annual Traffic, Delay & Capacity Evolution
Traffic Effective Capacity Av ER delay PC/EU delay target

EUROCONTROL NMD
Main Report
ANNUAL NETWORK OPERATIONS REPORT 2016
Edition Validity Date: 08/05/2017 Edition: 1.0 Status: Released Issue 41
2016 was the year with the highest overall traffic and average daily traffic since the statistics
have been gathered in Eurocontrol (last 20 years), and at same levels as 2007-2008 traffic.
While 2013 was the year with lowest average delay per flight.
Figure 29: ECAC 'Effective Capacity' Evolution per Month (2006-2016)

EUROCONTROL NMD
Main Report
ANNUAL NETWORK OPERATIONS REPORT 2016
Edition Validity Date: 08/05/2017 Edition: 1.0 Status: Released Issue 42
5.3 ACC
In the European Network Operations Plan (NOP) 2016 – 2019/20iv there are two delay
values for each ACC:
The required en-route delay/flight performance to achieve annual network delay
target in 2016 (0.5 min/flight). This is also known as the “delay breakdown”.
The forecast delay based on 2016 NOP capacity planning, excluding disruptions
such as industrial action and technical failures.
An overview of the ACC performances in 2016 is in Table 4 and shows the traffic growth,
capacity and delay for each ACC. Those ACCs that exceeded the Delay Breakdown value
are highlighted in “amber”.
COUNTRY ACC ACC Code
EN-ROUTE DELAY TRAFFIC CAPACITY
Breakdown6 Forecast7 Actual Forecast8 Summer Actual
Annual Actual
NOP Plan Actual
NETWORK NETWORK ALL_DNM 0.50 0.68 0.86 2.4% 2.7% 2.8% n/a n/a
ALBANIA TIRANA ACC LAAAACC 0.09 0.04 0.00 0.0% -6.4% -7.8% 8.0% 0.0%
ARMENIA YEREVAN
ACC UDDDACC 0.01 0.00 0.00 -2.5% -10.7% -10.1% sufficient 0.0%
AUSTRIA WIEN ACC LOVVACC 0.21 0.19 0.07 0.8% -0.1% 2.5% 5.0% 0.0%
AZERBAIJAN BAKU ACC UBBAACC 0.01 0.00 0.00 1.2% 0.0% 0.0% sufficient 0.0%
BELGIUM BRUSSELS
ACC EBBUACC 0.05 0.05 0.49 3.5% -0.2% 0.2% 1.0% -11.9%
BOSNIA SARAJEVO
ACC LQSBACC 0.01 0.00 0.00 -3.1% 4.4% 4.4% sufficient 0.0%
BULGARIA SOFIA ACC LBSRACC 0.05 0.03 0.01 1.9% -3.9% -1.8% 8.0% 0.0%
CROATIA ZAGREB ACC LDZOACC 0.25 0.24 0.04 1.1% 1.0% -0.2% 5.0% 5.1%
CYPRUS NICOSIA ACC LCCCACC 0.26 1.91 0.63 0.5% 0.2% 0.7% 10.0% 13.5%
CZECH REPUBLIC
PRAGUE ACC LKAAACC 0.10 0.03 0.01 2.6% 5.6% 6.2% 2.0% 3.4%
DENMARK COPENHAGE
N ACC EKDKACC 0.08 0.05 0.00 2.9% 1.7% 1.7% 2.0% 0.0%
ESTONIA TALLINN ACC EETTACC 0.03 0.02 0.03 0.9% 2.5% 2.5% sufficient 0.0%
EUROCONTROL
MAASTRICHT UAC
EDYYUAC 0.17 0.32 0.55 2.4% 4.3% 4.3% 2.0% 0.0%
FINLAND TAMPERE
ACC EFESACC 0.09 0.03 0.00 2.3% -1.7% 0.1% sufficient 0.0%
FRANCE BORDEAUX
ACC LFBBALL 0.12 0.39 0.70 3.3% 7.1% 5.4% 1.0% 0.0%
6 The required en-route delay/flight performance to achieve annual network delay target in 2016 (0.5 min/flight), also known as
“delay breakdown” - NOP 2016-19/20 7 Forecast delay based on 2016 capacity planning including disruptions such as industrial action and technical failures at a
statistical level of 0.1 min/flt - NOP 2016-19/20 (June 16 edition) 8 Base traffic forecast STATFOR Feb 2016 used for NOP capacity planning, variation in % compared to 2015

EUROCONTROL NMD
Main Report
ANNUAL NETWORK OPERATIONS REPORT 2016
Edition Validity Date: 08/05/2017 Edition: 1.0 Status: Released Issue 43
COUNTRY ACC ACC Code
EN-ROUTE DELAY TRAFFIC CAPACITY
Breakdown6 Forecast7 Actual Forecast8 Summer Actual
Annual Actual
NOP Plan Actual
FRANCE REIMS ACC LFEEACC 0.18 0.57 0.26 2.8% 3.7% 3.7% 1.0% 4.7%
FRANCE PARIS ACC LFFFALL 0.15 0.04 0.34 1.3% 2.3% 1.9% 2.0% 1.8%
FRANCE MARSEILLE
ACC LFMMACC 0.15 0.15 0.44 2.3% 5.3% 4.7% 2.0% 2.5%
FRANCE BREST ACC LFRRACC 0.10 1.23 1.76 5.2% 6.5% 6.3% 1.0% 3.0%
FYROM SKOPJE ACC LWSSACC 0.19 0.16 0.01 3.2% -5.0% -5.6% 15.0% 0.0%
GEORGIA TBILISI ACC UGGGACC 0.01 0.00 0.00 -1.2% 4.1% 3.5% sufficient 25.0%
GERMANY LANGEN ACC EDGGALL 0.23 0.09 0.30 1.7% 0.3% 0.5% 0.0% -6.2%
GERMANY MUNCHEN
ACC EDMMACC 0.19 0.03 0.04 1.9% 1.5% 1.8% 1.0% 0.0%
GERMANY KARLSRUHE
UAC EDUUUAC 0.26 0.11 0.35 1.8% 3.3% 3.6% 2.0% -2.8%
GERMANY BREMEN ACC EDWWACC 0.07 0.03 0.13 3.5% 3.6% 3.4% 0.0% 0.0%
GREECE ATHINAI ACC LGGGACC 0.20 0.51 0.16 2.4% -1.1% -1.7% 18.0% 5.1%
GREECE MAKEDONIA
ACC LGMDACC 0.16 0.42 0.04 3.7% -3.3% -3.2% 11.0% 4.0%
HUNGARY BUDAPEST
ACC LHCCACC 0.05 0.03 0.08 2.2% 1.9% 3.3% 2.5% -4.9%
IRELAND DUBLIN ACC EIDWACC 0.03 0.03 0.00 3.5% 10.3% 9.8% 3.0% 8.5%
IRELAND SHANNON
ACC EISNACC 0.04 0.01 0.00 2.6% 7.2% 7.5% 2.0% 3.2%
ITALY BRINDISI ACC LIBBACC 0.01 0.01 0.00 3.6% 6.3% 5.2% 8.0% 1.2%
ITALY MILAN ACC LIMMACC 0.08 0.03 0.00 2.5% 2.8% 2.8% 5.0% 2.6%
ITALY PADOVA ACC LIPPACC 0.09 0.01 0.00 2.3% 3.7% 2.9% 2.0% 0.5%
ITALY ROME ACC LIRRACC 0.04 0.00 0.00 1.0% 1.5% 1.0% 2.0% 0.0%
LATVIA RIGA ACC EVRRACC 0.03 0.01 0.00 0.5% 0.3% 0.4% sufficient 5.9%
LITHUANIA VILNIUS ACC EYVCACC 0.02 0.01 0.00 -0.3% 1.5% 1.4% sufficient 0.0%
MALTA MALTA ACC LMMMAC
C 0.02 0.01 0.00 -1.3% 6.8% 6.9% sufficient 0.0%
MOLDOVA CHISINAU
ACC LUUUACC 0.01 0.00 0.00 1.2% -11.0% -9.3% sufficient 0.0%
MOROCCO CASABLANCA
ACC GMMMAC
C n/a n/a 0.00 5.1% 6.0% n/a[4]
NETHERLANDS
AMSTERDAM ACC
EHAAACC 0.14 0.08 0.10 2.5% 5.9% 5.5% 0.0% 2.1%
NORWAY BODO ACC ENBDACC 0.09 0.02 0.00 -0.9% 1.3% 1.1% sufficient 0.0%
NORWAY OSLO ACC ENOSACC 0.13 0.02 0.15 0.3% 6.8% 5.8% sufficient 0.0%
NORWAY STAVANGER
ACC ENSVACC 0.13 0.02 0.06 -0.5% -2.3% -3.1% sufficient 0.0%
POLAND WARSAW
ACC EPWWACC 0.23 0.13 0.40 1.3% 8.3% 7.2% 5.0% 1.4%
PORTUGAL LISBON ACC LPPCACC 0.10 0.24 0.23 5.8% 11.1% 10.6% 7.0% 11.7%
ROMANIA BUCHAREST
ACC LRBBACC 0.01 0.01 0.00 1.9% -4.9% -2.7% 4.0% 0.0%
SERBIA & MONT.
BELGRADE ACC
LYBAACC 0.10 0.01 0.01 1.8% 1.8% 1.8% 2.0% 0.0%
SLOVAKIA BRATISLAVA
ACC LZBBACC 0.10 0.01 0.03 2.2% 6.5% 6.4% 5.0% 2.3%

EUROCONTROL NMD
Main Report
ANNUAL NETWORK OPERATIONS REPORT 2016
Edition Validity Date: 08/05/2017 Edition: 1.0 Status: Released Issue 44
COUNTRY ACC ACC Code
EN-ROUTE DELAY TRAFFIC CAPACITY
Breakdown6 Forecast7 Actual Forecast8 Summer Actual
Annual Actual
NOP Plan Actual
SLOVENIA LJUBLJANA
ACC LJLAACC 0.21 0.04 0.01 -0.3% 3.3% 2.8% 3%-15% 0.0%
SPAIN CANARIAS
ACC GCCCACC 0.32 0.27 0.38 6.1% 11.0% 10.3% 3.0% 10.3%
SPAIN BARCELONA
ACC LECBACC 0.23 0.44 0.49 7.7% 8.3% 8.4% 8.0% 8.3%
SPAIN MADRID ACC LECMALL 0.16 0.12 0.15 5.3% 6.1% 6.2% 2.0% 4.4%
SPAIN PALMA ACC LECPACC 0.19 0.17 0.24 8.4% 11.4% 11.6% 4.0% 7.4%
SPAIN SEVILLA ACC LECSACC 0.12 0.08 0.09 5.6% 7.3% 7.0% 1.0% 2.2%
SWEDEN MALMO ACC ESMMACC 0.07 0.02 0.04 2.0% 1.2% 1.7% 5.0% 0.0%
SWEDEN STOCKHOLM
ACC ESOSACC 0.06 0.02 0.07 2.0% 1.6% 2.5% 2.0% 0.0%
SWITZERLAND
GENEVA ACC LSAGACC 0.19 0.11 0.09 1.8% 2.3% 2.0% 0.0% 0.0%
SWITZERLAND
ZURICH ACC LSAZACC 0.18 0.09 0.08 1.0% 2.1% 1.8% 1.0% 0.6%
TURKEY ANKARA ACC LTAAACC 0.16 0.02 0.00 2.1% 33.6% 33.8% 6.0% n/a
TURKEY ISTANBUL
ACC LTBBACC n/a n/a 0.00 -29.5% -23.5% n/a n/a
UKRAINE KYIV ACC UKBVACC 0.01 0.00 0.00 -8.2% -22.9% -19.0% sufficient 0.0%
UKRAINE DNIPROPETR
OVSK ACC UKDVACC 0.01 0.00 0.00 -3.9% 12.0% 11.1% sufficient 0.0%
UKRAINE SIMFEROPOL
ACC UKFVACC n/a n/a n/a n/a n/a n/a n/a
UKRAINE L’VIV ACC UKLVACC 0.01 0.00 0.00 0.9% 8.6% 8.1% sufficient 0.0%
UKRAINE ODESA ACC UKOVACC 0.01 0.00 0.00 -7.0% -23.4% -19.3% sufficient 0.0%
UNITED KINGDOM
PRESTWICK ACC
EGPXALL 0.12 0.02 0.30 1.9% 7.2% 6.6% 1.0% -9.8%
UNITED KINGDOM
LONDON ACC EGTTACC 0.19 0.07 0.08 2.7% 4.9% 4.6% 2.0% 2.1%
UNITED KINGDOM
LONDON TC EGTTTC 0.11 0.01 0.19 2.0% 4.3% 3.9% 2.0% 0.0%
Table 4: Overview of the ACC performances in 2016
The actual delay in 2016 did not match the breakdown value as reported in the NOP 2016-19/20 in 21 ACCs.
Brest ACC had ATFM delays of more than 1 minute per flight, with a further three ACCs
(Bordeaux, Nicosia and Maastricht) recording delays between 0.5 and 1 minute per flight.
The performance of the following ACCs was better than that in the NOP 2016-2019/20:
Nicosia, Zagreb, Reims, Athens, Makedonia, Vienna and Skopje.
The Greek ACCs’ capacity issues in 2015 were addressed in 2016, together with the implementation of measures agreed with NM. Nicosia ACC en-route delay was higher than the breakdown but better than the forecast. This was driven by the combination of low traffic growth with an increase in capacity that was the result of the implementation of measures agreed at NOP level.
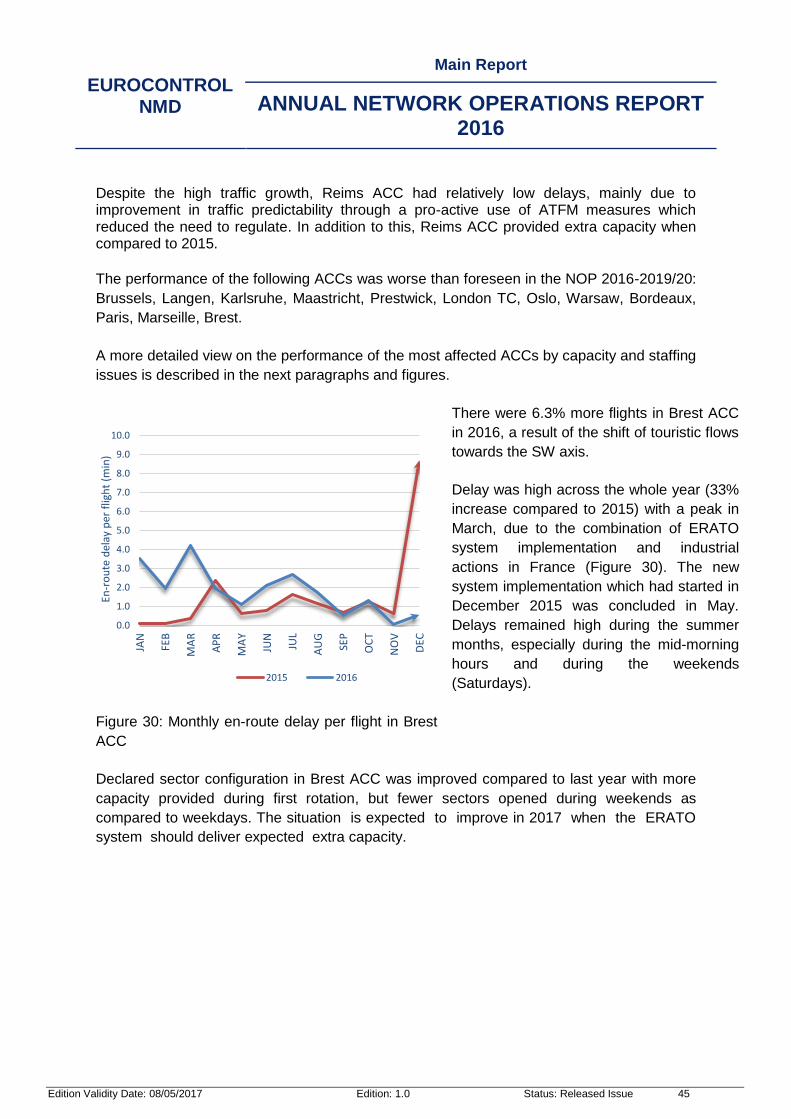
EUROCONTROL NMD
Main Report
ANNUAL NETWORK OPERATIONS REPORT 2016
Edition Validity Date: 08/05/2017 Edition: 1.0 Status: Released Issue 45
Despite the high traffic growth, Reims ACC had relatively low delays, mainly due to improvement in traffic predictability through a pro-active use of ATFM measures which reduced the need to regulate. In addition to this, Reims ACC provided extra capacity when compared to 2015.
The performance of the following ACCs was worse than foreseen in the NOP 2016-2019/20:
Brussels, Langen, Karlsruhe, Maastricht, Prestwick, London TC, Oslo, Warsaw, Bordeaux,
Paris, Marseille, Brest.
A more detailed view on the performance of the most affected ACCs by capacity and staffing
issues is described in the next paragraphs and figures.
Figure 30: Monthly en-route delay per flight in Brest
ACC
There were 6.3% more flights in Brest ACC
in 2016, a result of the shift of touristic flows
towards the SW axis.
Delay was high across the whole year (33%
increase compared to 2015) with a peak in
March, due to the combination of ERATO
system implementation and industrial
actions in France (Figure 30). The new
system implementation which had started in
December 2015 was concluded in May.
Delays remained high during the summer
months, especially during the mid-morning
hours and during the weekends
(Saturdays).
Declared sector configuration in Brest ACC was improved compared to last year with more
capacity provided during first rotation, but fewer sectors opened during weekends as
compared to weekdays. The situation is expected to improve in 2017 when the ERATO
system should deliver expected extra capacity.
0.0
1.0
2.0
3.0
4.0
5.0
6.0
7.0
8.0
9.0
10.0
JAN
FEB
MA
R
AP
R
MA
Y
JUN
JUL
AU
G
SEP
OC
T
NO
V
DEC
En-r
ou
te d
elay
per
flig
ht
(min
)
2015 2016

EUROCONTROL NMD
Main Report
ANNUAL NETWORK OPERATIONS REPORT 2016
Edition Validity Date: 08/05/2017 Edition: 1.0 Status: Released Issue 46
There were 5.4% more flights in Bordeaux
in 2016. High delay was recorded in March
(Figure 31) due to several industrial actions
in France, over the summer period due to
capacity shortage and in November, with
the implementation of the ERATO system.
The summer delay was generated mainly
on Saturday mornings due to insufficient
capacity. Sector configurations at
weekends was below that of weekdays.
Despite the peak in delay during ERATO
implementation, the collaboration with
neighbouring ACCs and NM kept the delay
levels lower than expected for this phase.
Figure 31: Monthly en-route delay per flight in
Bordeaux ACC
Figure 32: Monthly en-route delay per flight in
Barcelona ACC
There were 8.4% more flights in Barcelona
ACC. Delay was higher during the first part of
the year compared to 2015 (Figure 32).
Capacity issues were recorded mainly over the
summer when the traffic shift towards the SW
axis brought additional pressure to the ACC.
Internal touristic flows also had a relevant
impact on evening delays. Sector configuration
was improved compared to previous years and
no specific capacity shortage at weekends was
noticed.
0.0
0.2
0.4
0.6
0.8
1.0
1.2
1.4
1.6
1.8
2.0
JA
N
FE
B
MA
R
AP
R
MA
Y
JU
N
JU
L
AU
G
SE
P
OC
T
NO
V
DE
C
En
-ro
ute
de
lay p
er
flig
ht (m
in)
2015 2016
0.0
0.2
0.4
0.6
0.8
1.0
1.2
1.4
JA
N
FE
B
MA
R
AP
R
MA
Y
JU
N
JU
L
AU
G
SE
P
OC
T
NO
V
DE
C
En
-ro
ute
de
lay p
er
flig
ht (m
in)
2015 2016

EUROCONTROL NMD
Main Report
ANNUAL NETWORK OPERATIONS REPORT 2016
Edition Validity Date: 08/05/2017 Edition: 1.0 Status: Released Issue 47
There were 4.3% more flights in Maastricht
compared to 2015. The SW traffic flow shift
added additional pressure on this already
congested area, especially on the Brussels
sector. Delay increased sharply mainly as a
result of adverse weather conditions in June
and of the combination of strong traffic and
insufficient capacity over the summer period.
Delay was mainly generated in the Brussels
sector and, to a lesser extent, in the Deco
sector. The sector opening scheme was
improved compared to previous years but it
was still insufficient to cope with the strong
traffic growth, especially during weekends.
Figure 33: Monthly en-route delay per flight in
Maastricht UAC
Figure 34: Monthly en-route delay per flight in
Warsaw ACC
Warsaw had unexpected high traffic growth
(7.2%) which resulted in traffic levels
considerably higher than 2015, especially
during the summer. Delay was very low
during half of the year, rising to 1.4 minutes
per flight in July (Figure 34) due to staffing
issues. Summer daily delay peaked in the
evening periods. The capacity offered
decreased compared to 2015.
0.0
0.2
0.4
0.6
0.8
1.0
1.2
1.4
1.6
1.8
2.0
JA
N
FE
B
MA
R
AP
R
MA
Y
JU
N
JU
L
AU
G
SE
P
OC
T
NO
V
DE
C
En
-ro
ute
de
lay p
er
flig
ht (m
in)
2015 2016
0.0
0.2
0.4
0.6
0.8
1.0
1.2
1.4
1.6
JA
N
FE
B
MA
R
AP
R
MA
Y
JU
N
JU
L
AU
G
SE
P
OC
T
NO
V
DE
CEn
-ro
ute
de
lay p
er
flig
ht (m
in)
2015 2016
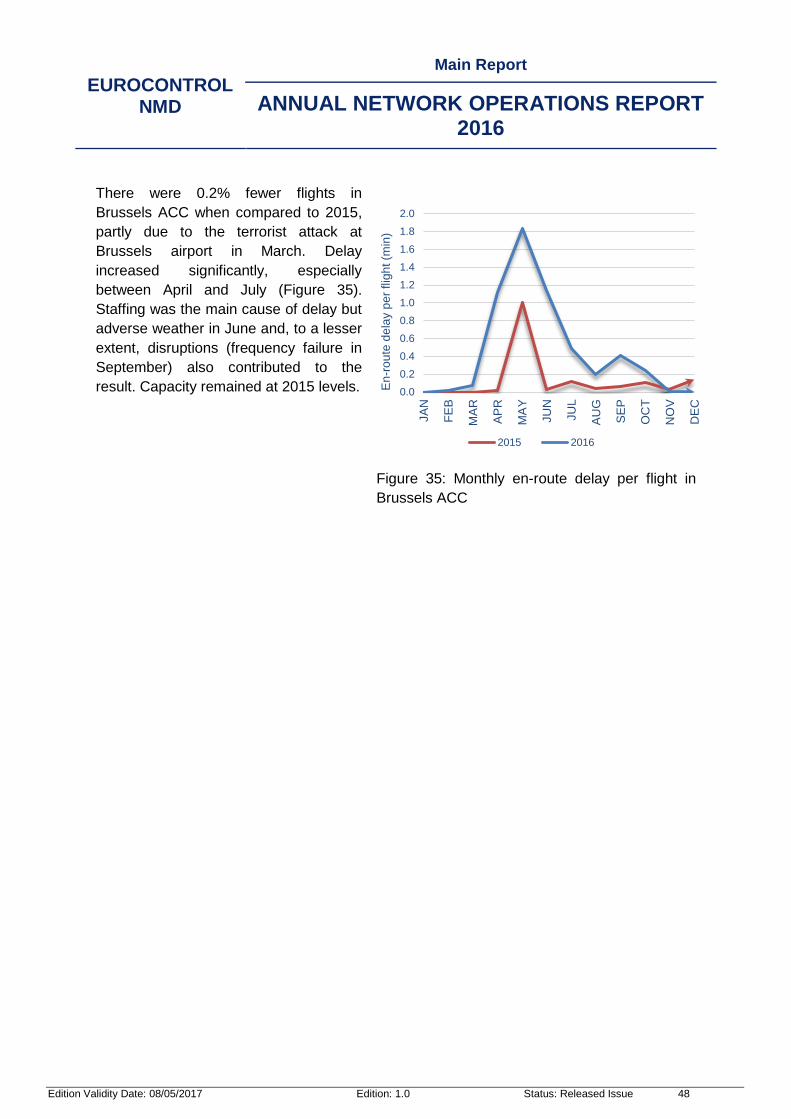
EUROCONTROL NMD
Main Report
ANNUAL NETWORK OPERATIONS REPORT 2016
Edition Validity Date: 08/05/2017 Edition: 1.0 Status: Released Issue 48
There were 0.2% fewer flights in
Brussels ACC when compared to 2015,
partly due to the terrorist attack at
Brussels airport in March. Delay
increased significantly, especially
between April and July (Figure 35).
Staffing was the main cause of delay but
adverse weather in June and, to a lesser
extent, disruptions (frequency failure in
September) also contributed to the
result. Capacity remained at 2015 levels.
Figure 35: Monthly en-route delay per flight in
Brussels ACC
0.0
0.2
0.4
0.6
0.8
1.0
1.2
1.4
1.6
1.8
2.0
JA
N
FE
B
MA
R
AP
R
MA
Y
JU
N
JU
L
AU
G
SE
P
OC
T
NO
V
DE
C
En
-ro
ute
de
lay p
er
flig
ht (m
in)
2015 2016

EUROCONTROL NMD
Main Report
ANNUAL NETWORK OPERATIONS REPORT 2016
Edition Validity Date: 08/05/2017 Edition: 1.0 Status: Released Issue 49
6 AIRPORTS
The integration of airports into the network progressed significantly in 2016. There was
progress towards the wider A-CDM implementation in Europe: 4 additional airports fully
implemented, giving a total of 22 A-CDM airports, covering 30.9% of the departures in the
NM area (see Airport CDM Implementation). In 2016, 3 airports connected to NM as
Advanced ATC Tower airports, making 16 airports in total, covering 6.8% of departures in
the NM area (see Advanced ATC Tower Implementation). NM now receives Departure
Planning Information (DPI) messages for more than 37% of departures in the NM area.
Greek islands had an average daily traffic growth of 4.8% in 2016 compared to 2015 for the
period between April and October. The summer 2016 was once again challenging due to the
long-standing problems at the Greek island airports, i.e. airport layout, passenger terminal
capacity and limited numbers of aircraft parking positions. To overcome these difficulties,
NM trialled an airport function within the NMOC which provided tactical support to hot-spot
airports (see Greek Islands – Summer 2016).
There was very good collaboration from airports on the provision of strategic information to
NM via the Airport Corner. Twenty-seven additional airports joined this process in 2016 (see
Airport Strategic Information Provision).
The Enhanced Information Exchange process in which airports share data with NMOC
continued throughout the year. In this process, airports report foreseen capacity impacts
caused by weather related or other events during the ATFM pre-tactical phase of operations.
The process of providing post-operational feedback on these events was established in
2016. Furthermore, a subscription mechanism to automatically receive updates from other
airports via email was made available to the airports information providers (see Pre-Tactical
and Tactical Airports Information Exchange).
In general, the partnership with airports has further improved. Airports started expressing
interest in the implementation of SESAR concepts (e.g. AOP-NOP/APOC, TBS, RECAT-EU)
establishing the foundation to achieve future SESAR targets. Paris Charles de Gaulle airport
implemented RECAT-EU on 22 March 2016.
Finally, NM continued the close and effective collaboration with airports through a number of
bilateral meetings, visits and exchanges organised by the ACI Liaison Officer.

EUROCONTROL NMD
Main Report
ANNUAL NETWORK OPERATIONS REPORT 2016
Edition Validity Date: 08/05/2017 Edition: 1.0 Status: Released Issue 50
6.1 HOT SPOTS
Traffic increased by 5.5% in Istanbul/Sabiha Gökcen airport in 2016, while ATFM delays
decreased by 7.6% (Figure 36). Airport capacity was the main contributor (2,937 min/day)
followed by weather (425 min/day). Istanbul/Ataturk airport traffic remained almost at the
same level as in 2015, while ATFM delays decreased by 31.6%. Airport capacity was the
main contributor (1,521 min/day) followed by weather (420 min/day). Despite the decrease of
delay, both airports remained the highest contributors to airport capacity related delays in the
network.
Amsterdam/Schiphol airport recorded a traffic increase of 5.9%, while ATFM delay
decreased by 28%. ATFM delay per flight decreased by 31% (Figure 37). Airport weather
accounted for a daily average of 778 minutes and airport capacity for 658 minutes per day.
Weather particularly impacted airport operations in February and December 2016.
London/Heathrow traffic remained at the same level as in 2015. The average daily airport
ATFM delay decreased 11.6% in 2016 to 1215 minutes per day, of which 95% was due to
weather. Adverse weather particularly impacted airport operations in December generating
104,774 minutes of ATFM delays. London Gatwick traffic and delay increased compared to
2015. Traffic increased by 4.4% compared to 2015. ATFM delay increased 147% in 2016.
Adverse weather and airport capacity were the main delay causes in 2016. Airport weather
delay increased from a daily average of 299 minutes in 2015 to 660 minutes in 2016. Airport
capacity regulations were applied due to ground congestion.
Figure 36: Top 20 airport delay locations during 20169
9 Only airports with more than 11,000 movements/year are included
3381
1976 1457
1215 937 805 683 679 550
365 348 325 316 282 278 265 263 262 236 234
0
500
1000
1500
2000
2500
3000
3500
4000
IST
AN
BU
L/S
AB
IHA
GO
KC
EN
IST
AN
BU
L-A
TA
TU
RK
AM
ST
ER
DA
M/S
CH
IPH
OL
LO
ND
ON
/HE
AT
HR
OW
LO
ND
ON
/GA
TW
ICK
ZU
RIC
H
BA
RC
ELO
NA
/EL
PR
AT
PA
RIS
OR
LY
FR
AN
KF
UR
T M
AIN
TE
L A
VIV
/BE
N G
UR
ION
PA
RIS
CH
DE
GA
ULLE
PA
LM
A D
E M
ALLO
RC
A
WIE
N S
CH
WE
CH
AT
GE
NE
VA
BR
US
SE
LS
NA
TIO
NA
L
OS
LO
/GA
RD
ER
MO
EN
AD
OLF
O S
UA
RE
Z M
AD
RID
-BA
RA
JA
S
MU
EN
CH
EN
LO
ND
ON
/ST
AN
ST
ED
LIS
BO
A
Avg
Air
po
rt d
ela
y
AD CAPACITY (ATC) AD STAFFING (ATC) AD DISRUPTION (ATC) AD CAPACITY
AD DISRUPTIONS AD EVENTS AD WEATHER PREV YEAR

EUROCONTROL NMD
Main Report
ANNUAL NETWORK OPERATIONS REPORT 2016
Edition Validity Date: 08/05/2017 Edition: 1.0 Status: Released Issue 51
Zurich airport traffic increased by 1.7% whereas delay decreased by 30% compared to 2015.
Airport capacity, weather and limited availability of the optimum runway configuration due to
environmental constraints were the main delay causes.
Brussels/Zaventem airport traffic decreased by 6.9% and ATFM delays decreased by 31%
compared to 2015. The biggest traffic decrease was in March and April due to the terrorist
attack at Brussels airport on 22 March. Brussels airport was closed for passenger traffic until
the end of March. Adverse weather conditions followed by airport capacity were the main
delay causes.
Barcelona/El Prat traffic increased by 6.3% and delays increased from a daily average of
271 minutes in 2015 to 683 minutes in 2016. Airport capacity due to environmental
constraints and adverse weather conditions generated most of these delays.
Paris Charles de Gaulle traffic remained almost at the same level while delay decreased
compared to 2015. Adverse weather conditions were the main delay cause. Airport
operations were also impacted by several industrial actions in 2016. Runway reconstruction
from July to October did not cause a major impact on airport operations. Paris/Orly traffic
increased by 1.3% and delay increased from a daily average of 348 minutes in 2015 to 679
minutes in 2016. The main causes were airport weather and airport capacity. Paris Orly
undertook major runway and taxiway reconstructions from April until October, which
generated airport capacity delays. Airport Operations were also impacted by several
industrial actions in 2016.
Frankfurt/Main airport traffic decreased by 1.4%, but delay increased by 27% compared to
2015. Adverse weather conditions caused most of the delays. Adverse weather impacted
airport operations particularly in June, generating 74,642 minutes of ATFM delays.
Tel Aviv/Ben Gurion traffic and delay increased compared to 2015. ATFM delay increased
168% in 2016. Runway maintenance in combination with airport capacity constraints were
the main cause of delays in 2016.
Madrid/Barajas traffic and delay increased compared to 2015. Adverse weather conditions we the main delay cause followed by airport capacity issues. Lisbon traffic increased by 9.7% and delay increased 47% in 2016. Airport weather and airport capacity (ATC) were the main delay causes in 2016. Palma de Mallorca traffic increased by 10.7%, while ATFM delay decreased by 21% compared to 2015. Airport capacity issues were the main cause followed by adverse weather conditions. Vienna and Geneva airport delay decreased compared to 2015. Adverse weather conditions were the main delay cause.

EUROCONTROL NMD
Main Report
ANNUAL NETWORK OPERATIONS REPORT 2016
Edition Validity Date: 08/05/2017 Edition: 1.0 Status: Released Issue 52
Oslo/Gardermoen, Munich and London/Stansted airports ATFM delay increased compared to 2015. Adverse weather conditions were the main delay cause. Rome/Fiumicino, Antalya, Iraklion N. Kazantzakis and Mikonos airports are no longer in the top 20 airports average daily delay locations.
Figure 37: Top 20 airport delay per flight locations during 20161
Biggin Hill airport appeared in the 2016 top 20 delay per flight locations (Figure 37). Airport
operations were impacted by the implementation of the first phase of the LAMP Programme.
75% of total ATFM delays were generated in this period.
Greek airports had a traffic growth of 3.4% during 2016 (5.7% during the summer), while
ATFM delay increased by 15%. Airport capacity was the main delay cause. Mikonos,
Santorini and Iraklion N. Kazantzakis delays per flight decreased, while Chania D.
Daskalogiannis delays per flight slightly increased compared to 2015. Thessaloniki airport
appeared in the top 20 airports average delay per flight locations. The main reason was
airport capacity due to major reconstruction works which are ongoing since February 2016.
Works impacted airport operations generating 14,838 minutes of ATFM delay. Mikonos
airport is no longer in the top 20 average delay locations. Rodos Diagoras and Kos airports
are no longer in the top 20 airports average delay per flight locations. See 6.2.1 for more
details on the Greek islands summer performance.
Cannes/Mandelieu airport delay per flight increased compared to 2015 mainly due to capacity issues.
5.70 5.49
2.63 2.15 1.59
1.23 1.22 1.13 1.12 1.09
1.05
1.04
1.03 0.94 0.84 0.83 0.81 0.68 0.61 0.60
0.0
2.0
4.0
6.0
8.0
MIK
ON
OS
IST
AN
BU
L/S
AB
IHA
GO
KC
EN
CH
AN
IA/I
OA
NN
IS D
AS
KA
LO
GIA
NN
IS
SA
NT
OR
INI
IST
AN
BU
L-A
TA
TU
RK
BIG
GIN
HIL
L
LO
ND
ON
/GA
TW
ICK
TE
L A
VIV
/BE
N G
UR
ION
ZU
RIC
H
AM
ST
ER
DA
M/S
CH
IPH
OL
PA
RIS
OR
LY
IRA
KLIO
N/N
IKO
S K
AZ
AN
TZ
AK
IS
CA
NN
ES
MA
ND
EL
IEU
LO
ND
ON
/HE
AT
HR
OW
LO
ND
ON
/CIT
Y
BE
AU
VA
IS-T
ILL
E
BA
RC
EL
ON
A/E
L P
RA
T
TH
ES
SA
LO
NIK
I/M
AK
ED
ON
IA
PA
FO
S/I
NT
L
PA
LM
A D
E M
ALL
OR
CA
Avg
Air
po
rt A
TF
M d
ela
y p
er
mo
ve
me
nt
AIRPORT CAPACITY (ATC) AIRPORT STAFFING (ATC) AIRPORT DISRUPTIONS (ATC)
AIRPORT CAPACITY AIRPORT DISRUPTIONS AIRPORT EVENTS
AIRPORT WEATHER PREV YEAR
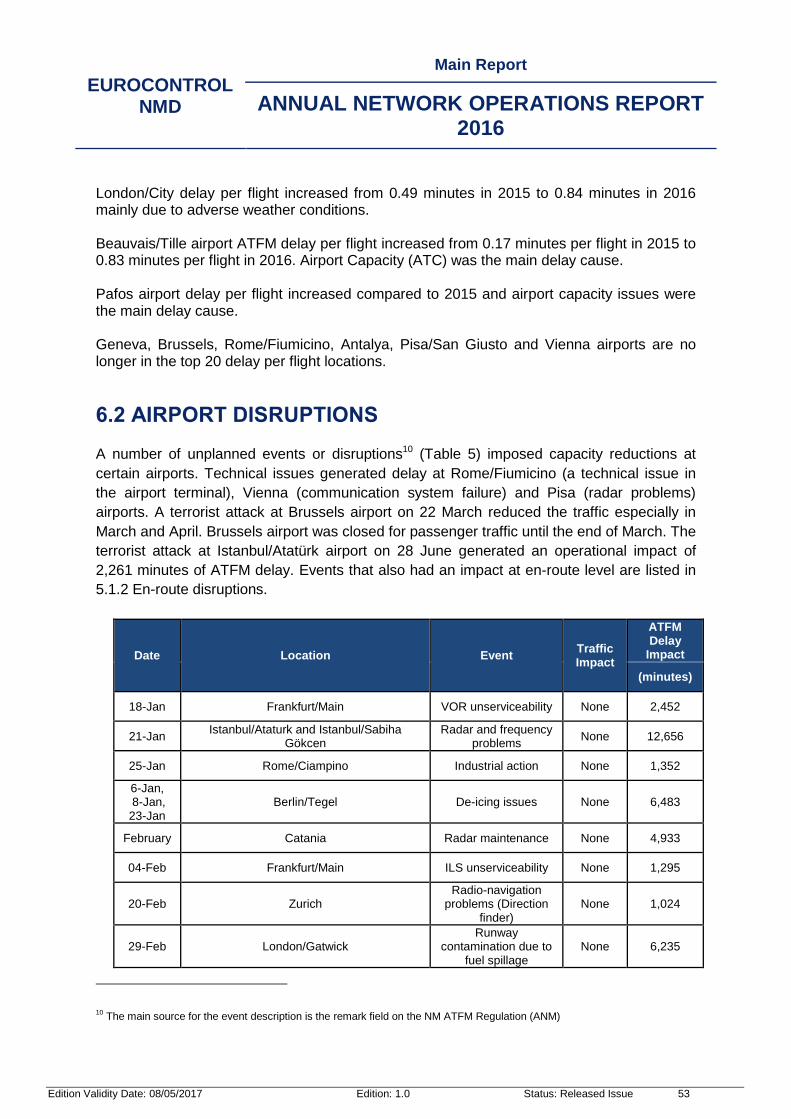
EUROCONTROL NMD
Main Report
ANNUAL NETWORK OPERATIONS REPORT 2016
Edition Validity Date: 08/05/2017 Edition: 1.0 Status: Released Issue 53
London/City delay per flight increased from 0.49 minutes in 2015 to 0.84 minutes in 2016 mainly due to adverse weather conditions. Beauvais/Tille airport ATFM delay per flight increased from 0.17 minutes per flight in 2015 to 0.83 minutes per flight in 2016. Airport Capacity (ATC) was the main delay cause. Pafos airport delay per flight increased compared to 2015 and airport capacity issues were the main delay cause. Geneva, Brussels, Rome/Fiumicino, Antalya, Pisa/San Giusto and Vienna airports are no longer in the top 20 delay per flight locations.
6.2 AIRPORT DISRUPTIONS
A number of unplanned events or disruptions10 (Table 5) imposed capacity reductions at
certain airports. Technical issues generated delay at Rome/Fiumicino (a technical issue in
the airport terminal), Vienna (communication system failure) and Pisa (radar problems)
airports. A terrorist attack at Brussels airport on 22 March reduced the traffic especially in
March and April. Brussels airport was closed for passenger traffic until the end of March. The
terrorist attack at Istanbul/Atatürk airport on 28 June generated an operational impact of
2,261 minutes of ATFM delay. Events that also had an impact at en-route level are listed in
5.1.2 En-route disruptions.
Date Location Event Traffic Impact
ATFM Delay
Impact
(minutes)
18-Jan Frankfurt/Main VOR unserviceability None 2,452
21-Jan Istanbul/Ataturk and Istanbul/Sabiha
Gökcen Radar and frequency
problems None 12,656
25-Jan Rome/Ciampino Industrial action None 1,352
6-Jan, 8-Jan, 23-Jan
Berlin/Tegel De-icing issues None 6,483
February Catania Radar maintenance None 4,933
04-Feb Frankfurt/Main ILS unserviceability None 1,295
20-Feb Zurich Radio-navigation
problems (Direction finder)
None 1,024
29-Feb London/Gatwick Runway
contamination due to fuel spillage
None 6,235
10
The main source for the event description is the remark field on the NM ATFM Regulation (ANM)
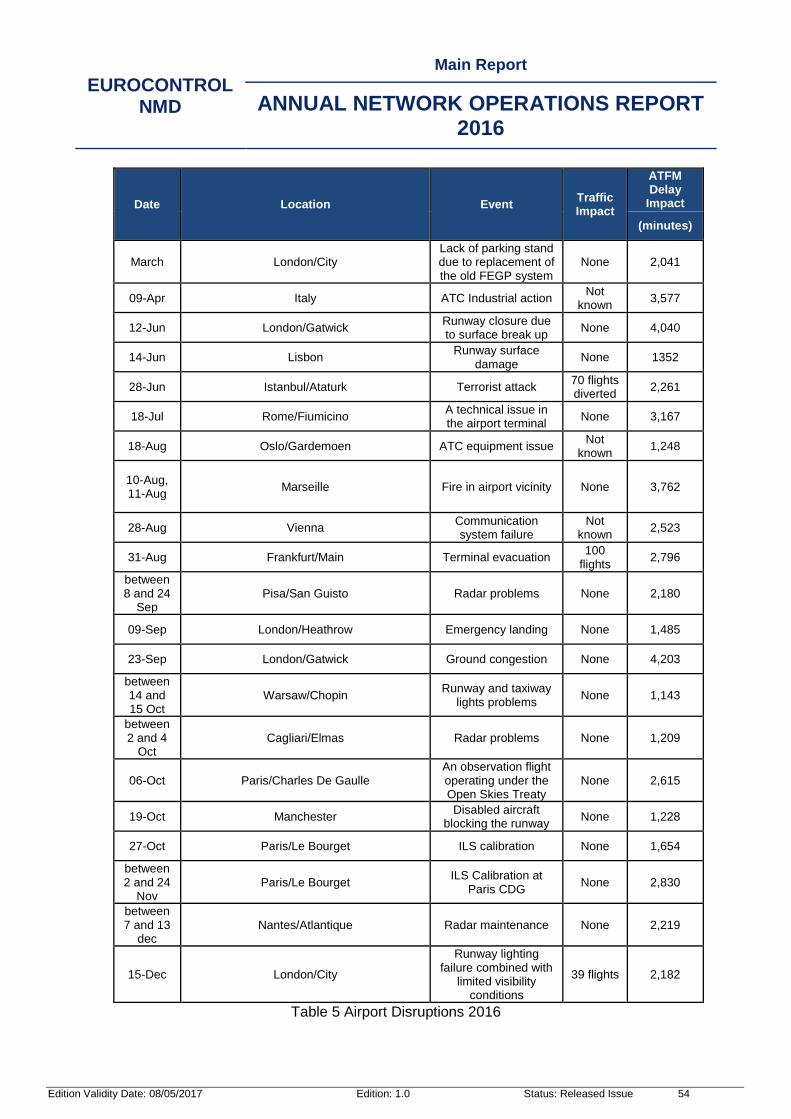
EUROCONTROL NMD
Main Report
ANNUAL NETWORK OPERATIONS REPORT 2016
Edition Validity Date: 08/05/2017 Edition: 1.0 Status: Released Issue 54
Date Location Event Traffic Impact
ATFM Delay
Impact
(minutes)
March London/City Lack of parking stand due to replacement of the old FEGP system
None 2,041
09-Apr Italy ATC Industrial action Not
known 3,577
12-Jun London/Gatwick Runway closure due to surface break up
None 4,040
14-Jun Lisbon Runway surface
damage None 1352
28-Jun Istanbul/Ataturk Terrorist attack 70 flights diverted
2,261
18-Jul Rome/Fiumicino A technical issue in the airport terminal
None 3,167
18-Aug Oslo/Gardemoen ATC equipment issue Not
known 1,248
10-Aug, 11-Aug
Marseille Fire in airport vicinity None 3,762
28-Aug Vienna Communication system failure
Not known
2,523
31-Aug Frankfurt/Main Terminal evacuation 100
flights 2,796
between 8 and 24
Sep Pisa/San Guisto Radar problems None 2,180
09-Sep London/Heathrow Emergency landing None 1,485
23-Sep London/Gatwick Ground congestion None 4,203
between 14 and 15 Oct
Warsaw/Chopin Runway and taxiway
lights problems None 1,143
between 2 and 4
Oct Cagliari/Elmas Radar problems None 1,209
06-Oct Paris/Charles De Gaulle An observation flight operating under the Open Skies Treaty
None 2,615
19-Oct Manchester Disabled aircraft
blocking the runway None 1,228
27-Oct Paris/Le Bourget ILS calibration None 1,654
between 2 and 24
Nov Paris/Le Bourget
ILS Calibration at Paris CDG
None 2,830
between 7 and 13
dec Nantes/Atlantique Radar maintenance None 2,219
15-Dec London/City
Runway lighting failure combined with
limited visibility conditions
39 flights 2,182
Table 5 Airport Disruptions 2016

EUROCONTROL NMD
Main Report
ANNUAL NETWORK OPERATIONS REPORT 2016
Edition Validity Date: 08/05/2017 Edition: 1.0 Status: Released Issue 55
6.3 NETWORK OPERATIONS SUPPORT
GREEK ISLANDS – SUMMER 2016 6.3.1
Summer traffic to the Greek islands summer destinations increased by 4.8% in 2016. The
majority of the smaller airports were operating at the limit of their declared capacity during
periods of peak demand. Arrival delays over the period remained at similar levels to those of
2015, with a slight decrease of 0.2% from 363,775 minutes to 362,981 minutes in 2016. The
overall performance has improved since 2012 when the joint NM / HCAA Action Plan was
put in place.
Summer 2016 was extremely challenging due to the combined effect of the traffic increase
as a result of the flow change from North Africa to Greece (see section 4) added to the long-
standing problems at those airports. The problems relate to airport layout, passenger
terminal capacity and the limited number of aircraft parking positions.
In 2016 the HCAA published a rule requiring GA/BA traffic to request airport slots. This had a
positive effect of better control. However, the insufficient ATCOs availability and the lack of
radar facilities that, in consequence, required the application of procedural approach at
certain destinations, were the main contributing factors for delays, in addition to the lack of
airport infrastructure. These long standing problems are unlikely to be resolved in 2017 but
the privatisation of the airports may provide sufficient funding for airport infrastructure and
technological modernisation in the coming years.
The preparation for the summer season was done in February 2016 in close collaboration
between NM and airlines, HCAA, HSCA and HANSP to highlight the busiest days and
busiest airports. NM re-iterated the importance of fair play by adhering to the allocated
airport slot.
Close ‘on the day’ cooperation with HANSP, HSCA and aircraft operators (AOs) allowed for
better utilisation of capacity. Close cooperation with GA/BA handling companies in Greece
allowed ‘extra’ capacity to be filled at those airports where most GA/BA flights are only drop
off/pick up and usually on the ground for approximately 15min.
In 2016, the Network Manager trialled an airport function within the NMOC to provide tactical support on hot-spot airports in Greece. This proved very beneficial for all operational stakeholders with tangible results in delay reduction of 40,753 minutes equating for a direct cost saving of 4.1 million euro for Airspace Users. Therefore, NM is planning to gradually implement such a function in the NMOC with a wider scope as from 2017 onwards. In the future the airport function will also support new concepts like APOC, disruption and contingency situations and crisis management.
EUROCONTROL NMD
Main Report
ANNUAL NETWORK OPERATIONS REPORT 2016
Edition Validity Date: 08/05/2017 Edition: 1.0 Status: Released Issue 56
FLIGHT PLAN SUSPENSION REQUESTS 6.3.2
NM supports a state’s decision-making authority when it decides to introduce flight plan suspensions at coordinated airports. In 2014, the French DGAC started such a process for Nice/Cote D'Azur airport and extended it to Lyon/Saint-Exupery for 2015 onwards. As from winter season 2015/2016, the DGAC asked NM to apply the procedure for an indefinite duration for both airports. Italy’s ENAC has applied a similar process for Venice airport in past summer seasons. A new agreement is yet to be signed between ENAC and NM covering all Italian coordinated airports.
6.4 AIRPORT CDM IMPLEMENTATION
During the course of 2016, 4 airports fully implemented A-CDM. These airports were Geneva on 23 March, Milan Linate on 3 May, Paris Orly on 15 November and Copenhagen on 19 December. This brings the total number of fully implemented airports to 22, covering 30.9% of departures in the NM area.
More and more airports are implementing A-CDM bringing benefits not only to themselves but also to neighbouring ACCs, thanks to increased predictability. A 12-month independent study, conducted on behalf of EUROCONTROL, assessing both the local and network impact of A-CDM implementation was completed in 2016. The study collected both implementation and operational experiences of A-CDM, as well as evidence on qualitative and quantitative benefits that have been realised. In addition, the study also conducted network simulations to assess the impact of improved take-off predictability on the ATM network. The results confirmed many benefits of the concept for all the major stakeholders; including airlines, ground handlers and the Network Manager. It also verified benefits in areas such as taxi-out times, ATFM delay, departure rates, fuel savings, Flight Activation Monitoring (FAM) suspensions, en-route sector over-deliveries, en-route capacity and take-off time predictability.
Local benefits
Average taxi-out time savings between 0.25 and 3 minutes per departure.
Average schedule adherence improvements between 0.5 and 2 minutes per flight.
Reduction in push-back delays after start-up approval.
Increased ATFM slot adherence.
Improved ground handling resource utilisation.
Reduction in the number of late stands and gate changes.
Improved management of and
Network benefits
Reduction in the standard deviation of take-off accuracy from 14 to between 5 and 7 minutes.
Clear reduction in en-route sector over-delivery risk when fed by 60% of flights from a CDM airport.
Increase by 3.5 - 5.5% of en-route capacity when Europe’s 50 busiest airports become integrated.
80% of en route capacity benefits realised when the top 30 European airports are integrated.
Average ATFM delay reduction of three minutes per regulation.
40 CDM airports could yield reductions of average ATFM delay of 20-25%.

EUROCONTROL NMD
Main Report
ANNUAL NETWORK OPERATIONS REPORT 2016
Edition Validity Date: 08/05/2017 Edition: 1.0 Status: Released Issue 57
recovery from adverse conditions.
Reduction in Flight Activation Monitoring suspensions.
Increased peak departure rates at the runway.
Improved take-off time predictability by 85% during adverse conditions.
Departures from A-CDM airports receive less ATFM delays than departures from non-ACDM airports through the same restriction – by an average of one minute per flight.
The survey can be downloaded from the EUROCONTROL A-CDM websitev Information on
individual airports that implemented A-CDM in 2016 can be found in Annex III.
6.5 ADVANCED ATC TOWER IMPLEMENTATION
Airports that have no plans to implement the A-CDM process but still wish to integrate with the ATM network may do so as an Advanced ATC Tower airport. A number of airports are also considering this option as a first step towards full A-CDM implementation. Such airports provide a reduced set of DPI messages with a reduced set of advantages (compared to A-CDM airports). An Advanced ATC Tower airport provides Target Take-Off-Time (TTOT) estimations as well as Variable Taxi-Times (VTTs) and SIDs in use to the NMOC. These are provided from the moment that the aircraft leaves the blocks.
In 2016, 3 airports connected to the Network as Advanced ATC Tower airports. These airports are Alicante, Liverpool and Nice. Nice airport is the first airport connected via B2B Services. This brings the total number of Advanced ATC Tower airports to 17, representing 6.8% of departures in the NM area.
The 22 A-CDM airports together with the 16 Advanced ATC Tower airports means that NM now receives Departure Planning Information (DPI) messages for more than 37% of departures in the NM area.
Information on individual airports which implemented Advanced ATC Tower in 2016 can be found in Annex III.

EUROCONTROL NMD
Main Report
ANNUAL NETWORK OPERATIONS REPORT 2016
Edition Validity Date: 08/05/2017 Edition: 1.0 Status: Released Issue 58
6.6 INFORMATION EXCHANGE BETWEEN AIRPORTS AND NM - AIRPORT CORNER PROCESS
AIRPORTS STRATEGIC INFORMATION PROVISION 6.6.1
As defined under the Network Manager Functions Implementing Regulation (677/2011)vi
,
NM has a task to help airports take advantage of the 'network approach' to solve operational issues and enhance performance. Eight years ago, NM implemented a centralised reporting process to capture relevant airports strategic information and monitor airport operations and planning. The process supports the early identification of mitigation actions aiming to minimise any negative operational impact in the network in the short, medium and long-term. A secured web based tool, the Airport Corner, enables this process permitting quick and easy information provision from key airport stakeholders. In 2016, 27 airports joined this process. There are now 102 European airports with 22 in the pipeline to join the process. In October 2016, the process was enhanced enabling airports to share information on diversion capabilities through the Enhanced Airport Information Exchange with NM (see next section).
The expected benefits are airport information sharing among all partners enabling an
improved situational awareness, enhanced planning and improved predictability for better
demand-capacity balancing.
PRE-TACTICAL AND TACTICAL AIRPORTS INFORMATION EXCHANGE 6.6.2
The Enhanced Information Exchange (EIE) is a process of sharing data on anticipated capacity impact of airport events (weather related or other) between airports and the NMOC during the ATFM pre-tactical phase of operations. EIE is an important step in the integration of airports and the network, building upon the data exchange already taking place through A-CDM and coordination between airport stakeholders and NMOC. Since 2015 the EIE reporting process has been established via the pre-tactical/tactical section of the Airport Corner which allows airports to report on events in a consistent manner throughout the tactical and pre-tactical phase. In 2016, NM implemented a process of providing detailed post-ops feedback on the events’ impact (e.g. applied regulations, generated delays) and on how the information was used by the NMOC. At the same time, a subscription mechanism was put in place with which airports can automatically receive updates from other selected airports via email, and as soon as any input is provided. By the end of 2016, 29 airports had reported 92 events via the pre-tactical interface. As of October 2016, airports can report diversion capabilities via dedicated Airport Corner Interface. In a diversion situation NMOC will collect information on diversion capabilities from the relevant airports and distribute the information via the NOP portal. Three levels of diversion capabilities were introduced standard, temporary and tactical diversion capabilities. The principle is to collect the number and types of aircraft that can be accepted by the airport in any situation. Thirty-nine airports have reported standard diversion capabilities. Temporary values were reported on 2 occasions.

EUROCONTROL NMD
Main Report
ANNUAL NETWORK OPERATIONS REPORT 2016
Edition Validity Date: 08/05/2017 Edition: 1.0 Status: Released Issue 59
Table 6 presents a list of airport planned events that were reported via the Airport Corner
and had an ATFM impact. The figure of 1,000 minutes of ATFM delay is used as a threshold.
Airport Name Event Name Start Date End Date ATFM Delay in 2016 (minutes)
Amsterdam/Schiphol Maintenance of runway 18C-36C
17-05-2016 31-05-2016 48,95611
Amsterdam/Schiphol Maintenance of runway 18R/36L
04-07-2016 11-07-2016 1,766
Amsterdam/Schiphol Rework B-apron 25-11-2016 01-07-2017 8,725
Athens/ Eleftherios Venizelos
Landscaping Maintenance Works
10-05-2016 14-05-2016 1,084
Athens/Eleftherios Venizelos
Maintenance of runway 03L/21R
05-12-2016 08-12-2016 1,568
Brussels Maintenance of runway 01/19
26-07-2016 23-09-2016 4,545
Bucharest/Henri Coanda
Maintenance of runway 08R/26L
05-10-2016 21-11-2016 13,827
Farnborough Farnborough Air show 04-07-2016 18-07-2016 2,373
Gran Canaria Runway 03L/21R maintenance and 03L ILS change
01-04-2016 16-11-2016 18,757
Hamburg Yearly maintenance of runway 05/23
12-09-2016 26-09-2016 8,705
Krakow/Balice World Youth Days 27-07-2016 31-07-2016 1,042
Lisbon Taxiways restoration work
17-10-2016 30-12-2016 9,814
Oslo/Gardermoen Taxiway B6 closed due to work on parallel taxiway Tango
04-04-2016 27-06-2016 3,127
Palma De Mallorca Runway 06R/24L maintenance
01-10-2016 31-12-2016 3,214
11 total ATFM delay on 30 May is a combination of runway maintenance and weather
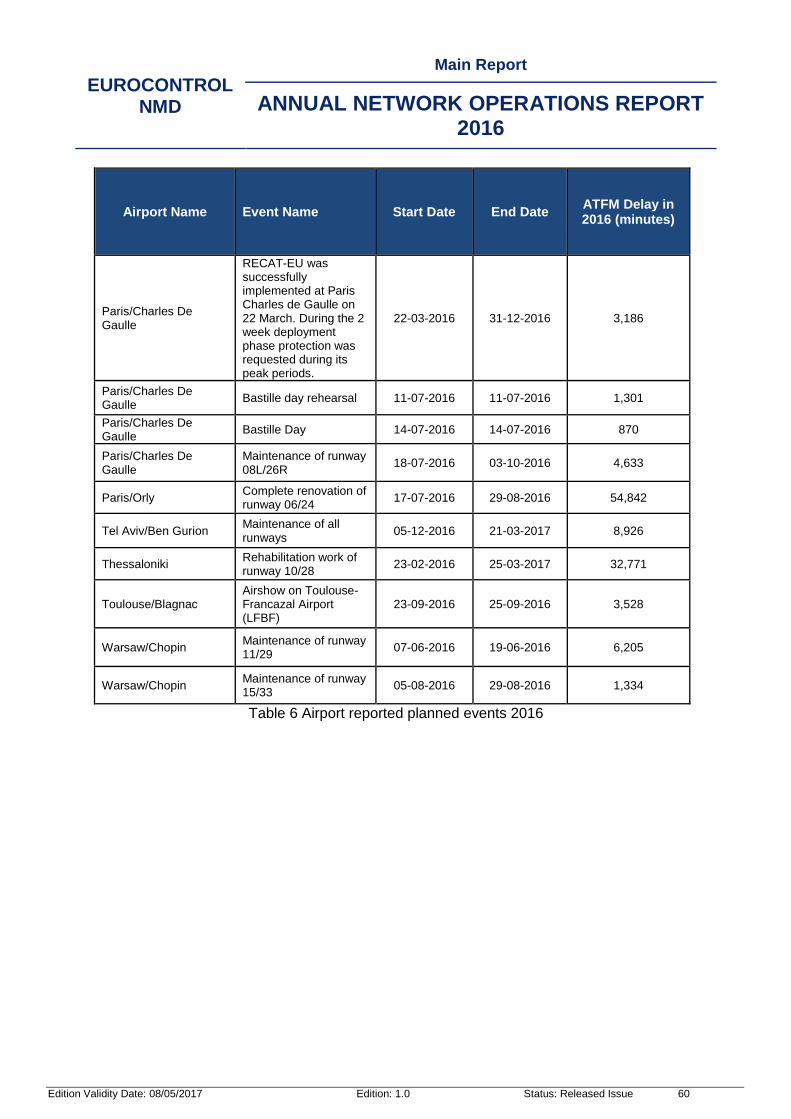
EUROCONTROL NMD
Main Report
ANNUAL NETWORK OPERATIONS REPORT 2016
Edition Validity Date: 08/05/2017 Edition: 1.0 Status: Released Issue 60
Airport Name Event Name Start Date End Date ATFM Delay in 2016 (minutes)
Paris/Charles De Gaulle
RECAT-EU was successfully implemented at Paris Charles de Gaulle on 22 March. During the 2 week deployment phase protection was requested during its peak periods.
22-03-2016 31-12-2016 3,186
Paris/Charles De Gaulle
Bastille day rehearsal 11-07-2016 11-07-2016 1,301
Paris/Charles De Gaulle
Bastille Day 14-07-2016 14-07-2016 870
Paris/Charles De Gaulle
Maintenance of runway 08L/26R
18-07-2016 03-10-2016 4,633
Paris/Orly Complete renovation of runway 06/24
17-07-2016 29-08-2016 54,842
Tel Aviv/Ben Gurion Maintenance of all runways
05-12-2016 21-03-2017 8,926
Thessaloniki Rehabilitation work of runway 10/28
23-02-2016 25-03-2017 32,771
Toulouse/Blagnac Airshow on Toulouse-Francazal Airport (LFBF)
23-09-2016 25-09-2016 3,528
Warsaw/Chopin Maintenance of runway 11/29
07-06-2016 19-06-2016 6,205
Warsaw/Chopin Maintenance of runway 15/33
05-08-2016 29-08-2016 1,334
Table 6 Airport reported planned events 2016
EUROCONTROL NMD
Main Report
ANNUAL NETWORK OPERATIONS REPORT 2016
Edition Validity Date: 08/05/2017 Edition: 1.0 Status: Released Issue 61
6.7 TOWARDS APOC AND AOP-NOP EXCHANGE
APOC and AOP-NOP exchange are concepts that were developed within SESAR. Their aim is to facilitate and improve collaborative decision-making and operational planning at airports. The APOC is the Airport Operations Centre, a community of airport stakeholders consisting of, but not limited to, airport operator, ANSP, airlines and ground handlers, who manage the airport operations with a view to optimise performance on a daily basis taking into account event reports or performance alerts. A Task Force (with the participation of Frankfurt, Dusseldorf, Helsinki/Vantaa, London/Heathrow, Amsterdam/Schiphol, Oslo Gardermoen, Stockholm/Arlanda, Geneva and Zurich airports) concluded in 2016 highlighting the challenges of local cooperation, showing best practices and giving recommendations on local interaction as well as interaction with NMOC. The AOP is the Airport Operations Plan that reflects all data of the current operational planning for the tactical and pre-tactical phase. The NOP in this case is the equivalent on NM side. Data from AOP and NOP shall complement each other by AOP-NOP automated exchange of information via System Wide Information Management (SWIM).
Building on the work done in SESAR, the same task force that concluded in 2016 provided a list of prioritized data use cases which contain the data elements that will be most beneficial to the airport as well as Network operations. The priority list is being used in SESAR deployment. A first AOP-NOP Integration project was started with Paris Charles de Gaulle and Paris Orly airports, Frankfurt airport and London Heathrow airport to implement the data exchange via NM B2B services. APOC or other forms of airport ground coordination and AOP-NOP exchange are two essential elements for the ongoing integration of airports and the network, which is why the Network Manager is focusing on reinforcing collaboration between the group of local stakeholders and NM (NMOC).
EUROCONTROL NMD
Main Report
ANNUAL NETWORK OPERATIONS REPORT 2016
Edition Validity Date: 08/05/2017 Edition: 1.0 Status: Released Issue 62
7 FLIGHT EFFICIENCY
This chapter provides a summary of the progress made on the implementation of the actions
agreed in the joint IATA/CANSO/EUROCONTROL Flight Efficiency Planvii, drawn up in 2008,
and responds to the requirements of the SES performance scheme.
The NM flight efficiency targets and objectives for 2016 included in the Network Performance
Plan (NPP) 2015-2019viii and in the Network Operations Plan (NOP) 2016-2019/20 are listed
below:
Route extension – airspace design (DES)
Target:
achieve an improvement of the DES indicator by 0.06 percentage points between 2015
and 2016
Route extension – last filed flight plan (KEP)
Target:
achieve a KEP target of 4.61% for the SES area and 4.34% for the NM area
Route extension – actual trajectory (KEA)
Target:
achieve a KEA target of 2.87% for both SES and NM areas
Increase the CDR1/2 usage (CDR-RAI and CDR-RAU)
NM Objective:
increase the CDR availability (CDR-RAI) and CDR usage (CDR-RAU) by 5% between
2015 and 2019

EUROCONTROL NMD
Main Report
ANNUAL NETWORK OPERATIONS REPORT 2016
Edition Validity Date: 08/05/2017 Edition: 1.0 Status: Released Issue 63
Flight efficiency indicators are monitored for pure airspace design and for flight planning.
The downward trend evolution of those indicators since the beginning of 2010 is shown on
Figure 38. While the airspace design target was met for 2016, the last filed flight plan target
was missed by 0.28 percentage points.
Figure 38: Route efficiency KPI per AIRAC cycle
The evolution recorded on the route extension based on the last filed flight plan during 2016
was heavily impacted by industrial actions, social issues that led to reduced capacities and
re-routings to avoid capacity constrained and avoided/closed areas due to crisis situation.
Those events had a detrimental effect on the flight planning indicator and thus on the overall
flight efficiency, which led to significant losses recorded during the AIRAC cycles of April,
May, June and July 2016. This evolution continues to demonstrate the necessity to provide
sufficient capacity constantly to further improve the flight planning indicator and to reduce the
gap with the airspace design indicator.
A number of events in 2016 affected the network and had direct consequences on the flight
efficiency evolution:
Overall crisis situation in Ukraine that led a significant number of flights to avoid the
entire Ukrainian airspace moving to neighbouring countries (Turkey, Bulgaria, Romania,
Poland, Slovakia, etc.); as a result of the Ukrainian crisis adjacent ACCs/ UACs were on-
2011
2013
2012
2014
0
0,1
0,2
0,3
0,4
0,5
0,6
0,7
0,8
0,9
1
2,0%
2,5%
3,0%
3,5%
4,0%
4,5%
5,0%
5,5%
11
01
11
02
11
03
11
04
11
05
11
06
11
07
11
08
11
09
11
10
11
11
11
12
11
13
12
01
12
02
12
03
12
04
12
05
12
06
12
07
12
08
12
09
12
10
12
11
12
12
12
13
13
01
13
02
13
03
13
04
13
05
13
06
13
07
13
08
13
09
13
10
13
11
13
12
13
13
14
01
14
02
14
03
14
04
14
05
14
06
14
07
14
08
14
09
14
10
14
11
14
12
14
13
15
01
15
02
15
03
15
04
15
05
15
06
15
07
15
08
15
09
15
10
15
11
15
12
15
13
16
01
16
02
16
03
16
04
16
05
16
06
16
07
16
08
16
09
16
10
16
11
16
12
16
13
Ro
ute
Exte
nsio
n
AIRAC
Route Efficiency KPI per AIRAC cycle RTE-DES
RTE-FPL

EUROCONTROL NMD
Main Report
ANNUAL NETWORK OPERATIONS REPORT 2016
Edition Validity Date: 08/05/2017 Edition: 1.0 Status: Released Issue 64
loaded by Far Eastern traffic avoiding the Ukraine airspace leading to increased route
extensions.
Closure of Libyan airspace for overflights due to the security situation required the
implementation of ATM procedures for traffic between Europe and Africa re-routed via
Egypt and Tunisia (while traffic to/from Tunisia remains suppressed since the terrorist
attack on 26 June 2016.)
Avoidance of Syrian and Iraqi airspace due to the security situation for traffic between
Europe and Middle East and Asia re-routed via Iran and Turkey with additional impacts
on the flows from the Ukrainian crisis situation.
Several French ATC industrial actions in January, April, May, June and July 2016
required regulations in French ACCs and protective measures in neighbouring ACCs,
with impact on flight planning route extension.
Implementation of French ERATO system required regulations in Brest ACC and
Bordeaux ACC with impact on network efficiency.
ATM system improvements by Prestwick ACC due to iTEC FDPS system training &
implementation and Langen ACC due to PSS Phase 2 implementation with impact on
network efficiency;
Brussels airport closure (terrorist attack on 22 March, with impact on network efficiency.
Widespread capacity and staffing issues across the network required a high number of
regulations and/or level-cap scenarios by Brest ACC, Bordeaux ACC, Brussels ACC,
Karlsruhe UAC, Maastricht UAC, Marseille ACC, Nicosia ACC and Warsaw ACC to
mitigate delays, with impact on flight planning route extension.
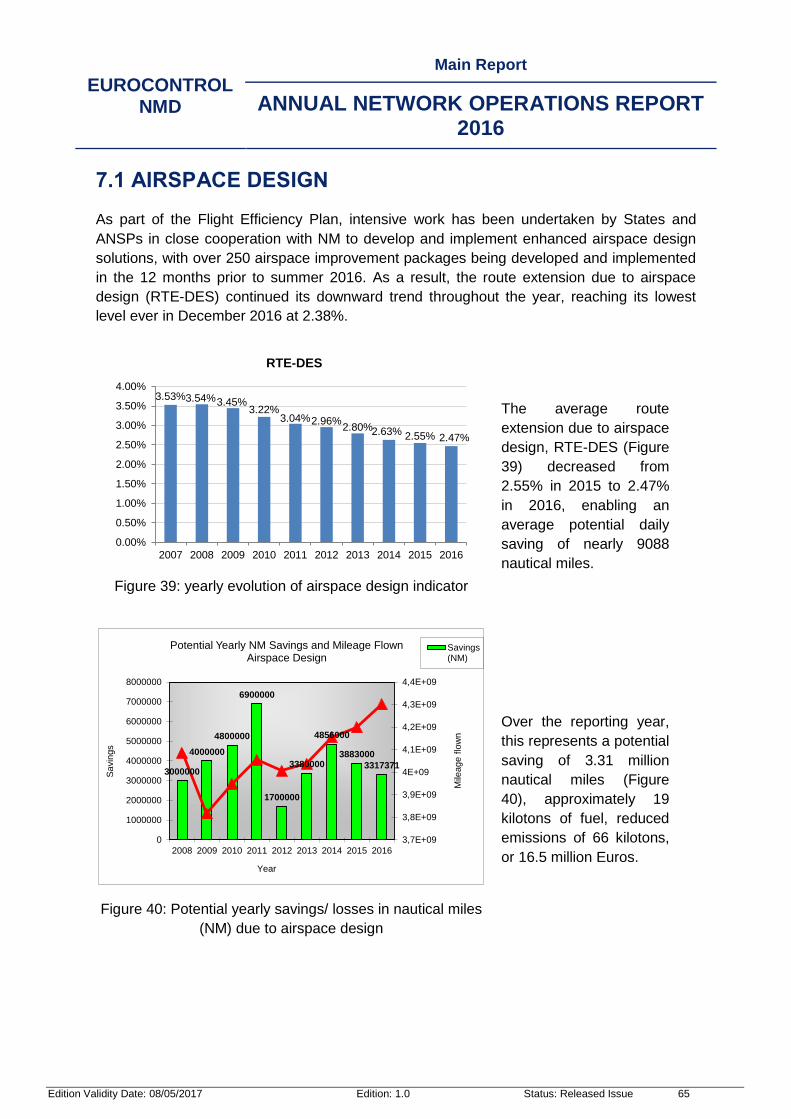
EUROCONTROL NMD
Main Report
ANNUAL NETWORK OPERATIONS REPORT 2016
Edition Validity Date: 08/05/2017 Edition: 1.0 Status: Released Issue 65
7.1 AIRSPACE DESIGN
As part of the Flight Efficiency Plan, intensive work has been undertaken by States and
ANSPs in close cooperation with NM to develop and implement enhanced airspace design
solutions, with over 250 airspace improvement packages being developed and implemented
in the 12 months prior to summer 2016. As a result, the route extension due to airspace
design (RTE-DES) continued its downward trend throughout the year, reaching its lowest
level ever in December 2016 at 2.38%.
Figure 39: yearly evolution of airspace design indicator
The average route
extension due to airspace
design, RTE-DES (Figure
39) decreased from
2.55% in 2015 to 2.47%
in 2016, enabling an
average potential daily
saving of nearly 9088
nautical miles.
Figure 40: Potential yearly savings/ losses in nautical miles
(NM) due to airspace design
Over the reporting year,
this represents a potential
saving of 3.31 million
nautical miles (Figure
40), approximately 19
kilotons of fuel, reduced
emissions of 66 kilotons,
or 16.5 million Euros.
3.53% 3.54% 3.45% 3.22%
3.04% 2.96% 2.80% 2.63% 2.55% 2.47%
0.00%
0.50%
1.00%
1.50%
2.00%
2.50%
3.00%
3.50%
4.00%
2007 2008 2009 2010 2011 2012 2013 2014 2015 2016
RTE-DES
3000000
4000000
4800000
6900000
1700000
3380000
4856000
3883000
3317371
3,7E+09
3,8E+09
3,9E+09
4E+09
4,1E+09
4,2E+09
4,3E+09
4,4E+09
0
1000000
2000000
3000000
4000000
5000000
6000000
7000000
8000000
2008 2009 2010 2011 2012 2013 2014 2015 2016
Mile
ag
e f
low
n
Sa
vin
gs
Year
Potential Yearly NM Savings and Mileage FlownAirspace Design
Savings(NM)

EUROCONTROL NMD
Main Report
ANNUAL NETWORK OPERATIONS REPORT 2016
Edition Validity Date: 08/05/2017 Edition: 1.0 Status: Released Issue 66
7.2 AIRSPACE CHANGES VS. FLIGHT PLANNING
The flight planning indicator (KEP) measures the length of the flight planned trajectory
compared to the great circle (route extension). It reflects inefficiencies in the use of the
airspace (due to RAD restrictions, CDR availability, inefficient flight-planning etc.), but also
user preferences for cheaper rather than shorter routes.
Figure 41: Yearly evolution of flight-planning indicator
(KEP)
The average route extension
based on the latest filed flight
plan (KEP) increased from
4.74% in 2015, to 4.82% in
2016 (Figure 41), which is
above the NM objective of
4.34%.
The unstable political situation
within and at the borders of
the NM area continued to
impact on flight efficiency and
the general environment –
longer routes had to be flown
to avoid dangerous zones.
Capacity shortfalls due to strikes or special events also had a significant impact. The
average route extension based on the latest filed flight plan increased from 4.74% in 2015,
to 4.82% in 2016, which is above the NM objective of 4.34%.
The average flight-planned distance increased when compared to 2015, resulting in some
additional 1.58 million nautical miles flown over the whole year. This means an average daily
increase of nearly 4,336 nautical miles. Over the year, this represents additional
approximately 9.5 kilotons of extra fuel, increased emissions of 31.6 kilotons, or €7.9 million
extra costs/ losses.
4.91% 4.87% 4.86% 4.70% 4.74% 4.82%
2.00%
2.50%
3.00%
3.50%
4.00%
4.50%
5.00%
5.50%
2011 2012 2013 2014 2015 2016
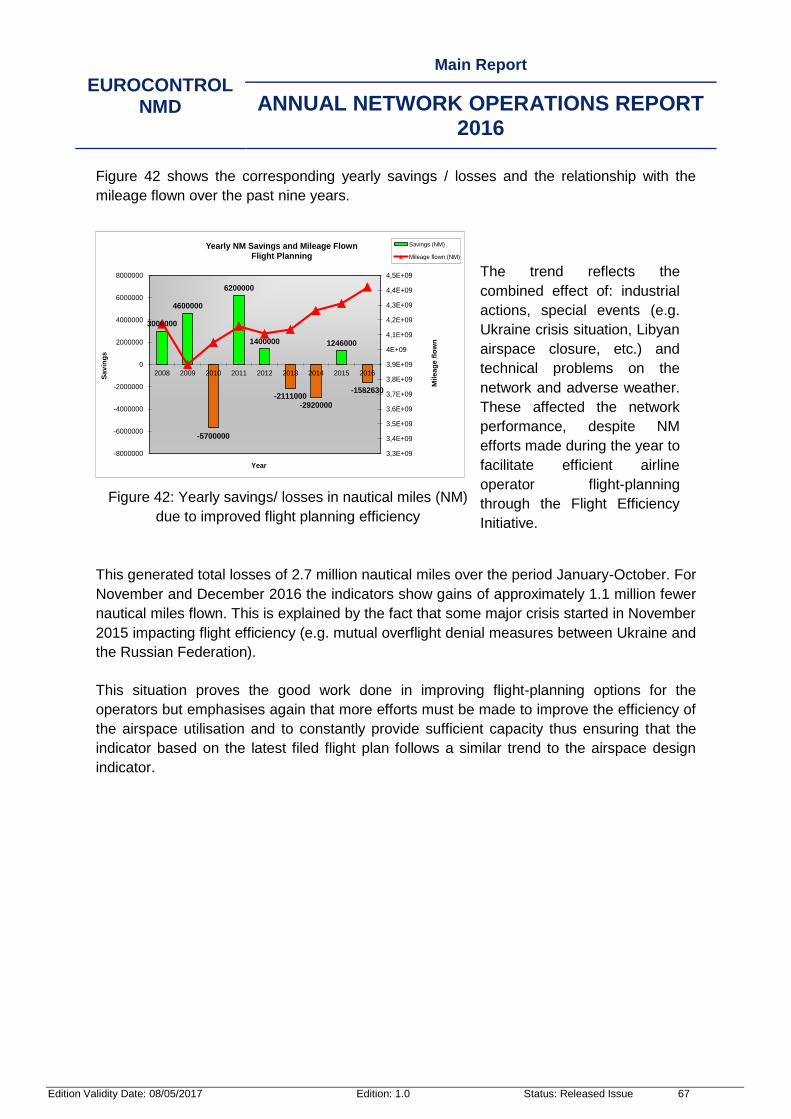
EUROCONTROL NMD
Main Report
ANNUAL NETWORK OPERATIONS REPORT 2016
Edition Validity Date: 08/05/2017 Edition: 1.0 Status: Released Issue 67
Figure 42 shows the corresponding yearly savings / losses and the relationship with the
mileage flown over the past nine years.
Figure 42: Yearly savings/ losses in nautical miles (NM)
due to improved flight planning efficiency
The trend reflects the
combined effect of: industrial
actions, special events (e.g.
Ukraine crisis situation, Libyan
airspace closure, etc.) and
technical problems on the
network and adverse weather.
These affected the network
performance, despite NM
efforts made during the year to
facilitate efficient airline
operator flight-planning
through the Flight Efficiency
Initiative.
This generated total losses of 2.7 million nautical miles over the period January-October. For
November and December 2016 the indicators show gains of approximately 1.1 million fewer
nautical miles flown. This is explained by the fact that some major crisis started in November
2015 impacting flight efficiency (e.g. mutual overflight denial measures between Ukraine and
the Russian Federation).
This situation proves the good work done in improving flight-planning options for the
operators but emphasises again that more efforts must be made to improve the efficiency of
the airspace utilisation and to constantly provide sufficient capacity thus ensuring that the
indicator based on the latest filed flight plan follows a similar trend to the airspace design
indicator.
3000000
4600000
-5700000
6200000
1400000
-2111000-2920000
1246000
-1582630
3,3E+09
3,4E+09
3,5E+09
3,6E+09
3,7E+09
3,8E+09
3,9E+09
4E+09
4,1E+09
4,2E+09
4,3E+09
4,4E+09
4,5E+09
-8000000
-6000000
-4000000
-2000000
0
2000000
4000000
6000000
8000000
2008 2009 2010 2011 2012 2013 2014 2015 2016
Mileag
e f
low
n
Sav
ing
s
Year
Yearly NM Savings and Mileage FlownFlight Planning
Savings (NM)
Mileage flown (NM)

EUROCONTROL NMD
Main Report
ANNUAL NETWORK OPERATIONS REPORT 2016
Edition Validity Date: 08/05/2017 Edition: 1.0 Status: Released Issue 68
7.3 ACTUAL TRAJECTORY
Figure 43: Yearly evolution of the actual trajectory
indicator (KEA)
The events impacting KEP (see
7.2) and the particularly bad
weather in 2016 also contributed
to an increase of the actual
trajectory indicator (KEA) to
2.98% (Figure 43), which was
above the target by 0.11pp. The
negative impact from those
events was partially mitigated by
a significant progress with the
implementation of the Free-
Route Airspace (FRA), which will
be a major factor for the positive
evolution of the environment
indicators in the remaining years
of RP2 (including continuous
expansion of cross-border FRA).
3.31% 3.20%
3.14%
2.72% 2.77%
2.98%
2.00%
2.20%
2.40%
2.60%
2.80%
3.00%
3.20%
3.40%
2011 2012 2013 2014 2015 2016
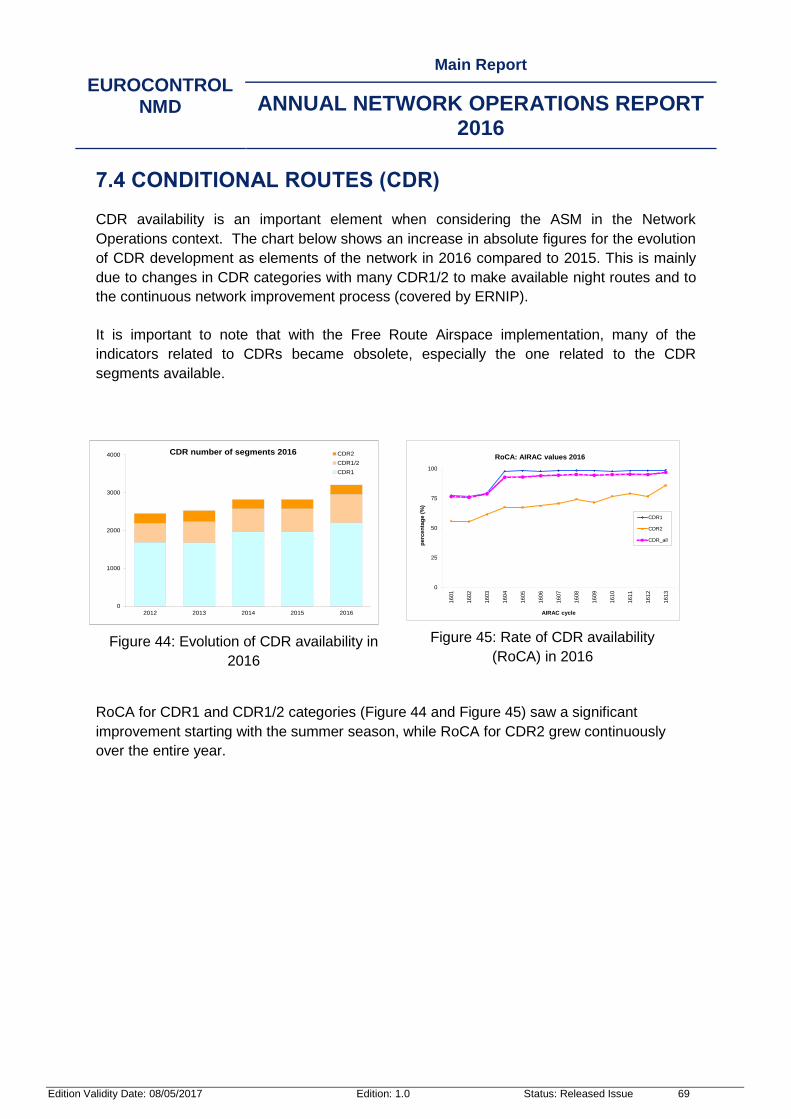
EUROCONTROL NMD
Main Report
ANNUAL NETWORK OPERATIONS REPORT 2016
Edition Validity Date: 08/05/2017 Edition: 1.0 Status: Released Issue 69
7.4 CONDITIONAL ROUTES (CDR)
CDR availability is an important element when considering the ASM in the Network
Operations context. The chart below shows an increase in absolute figures for the evolution
of CDR development as elements of the network in 2016 compared to 2015. This is mainly
due to changes in CDR categories with many CDR1/2 to make available night routes and to
the continuous network improvement process (covered by ERNIP).
It is important to note that with the Free Route Airspace implementation, many of the
indicators related to CDRs became obsolete, especially the one related to the CDR
segments available.
Figure 44: Evolution of CDR availability in
2016
Figure 45: Rate of CDR availability
(RoCA) in 2016
RoCA for CDR1 and CDR1/2 categories (Figure 44 and Figure 45) saw a significant
improvement starting with the summer season, while RoCA for CDR2 grew continuously
over the entire year.
0
1000
2000
3000
4000
2012 2013 2014 2015 2016
CDR number of segments 2016 CDR2
CDR1/2
CDR1
0
25
50
75
100
1601
1602
1603
1604
1605
1606
1607
1608
1609
1610
1611
1612
1613
perc
en
tag
e (
%)
AIRAC cycle
RoCA: AIRAC values 2016
CDR1
CDR2
CDR_all

EUROCONTROL NMD
Main Report
ANNUAL NETWORK OPERATIONS REPORT 2016
Edition Validity Date: 08/05/2017 Edition: 1.0 Status: Released Issue 70
Figure 46: RAI (%) 2016 per AIRAC cycle
Figure 47: RAU (%) 2016 per AIRAC
cycle
The Rate of Aircraft Interested (RAI) that
planned the available CDR is relatively
constant at a value of approx. 73% for the
entire year 2016.
The Rate of Aircraft actually Using (RAU)
CDR is lower (60%). This is the result of
ATC intervention for various reasons
(expedite traffic, weather, etc) as well as
due to the expansion of FRA
implementation in ECAC, making many
CDRs no longer a better solution for
flying.
Figure 48: Five year RAI evolution
Figure 49: Five year RAU evolution
The charts of RAI and RAU evolution over the past 5 years in Figure 48 and Figure 49 indicate the tendency to use less and less the CDR, since there are today better options in FRA or the DCTs.
0
10
20
30
40
50
60
70
80
90
100
1601
1602
1603
1604
1605
1606
1607
1608
1609
1610
1611
1612
1613
perc
en
tag
e (
%)
RAI (%) 2016 per AIRAC cycle
0
10
20
30
40
50
60
70
80
90
100
1601
1602
1603
1604
1605
1606
1607
1608
1609
1610
1611
1612
1613
perc
en
tag
e (
%)
RAU (%) 2016 per AIRAC cycle
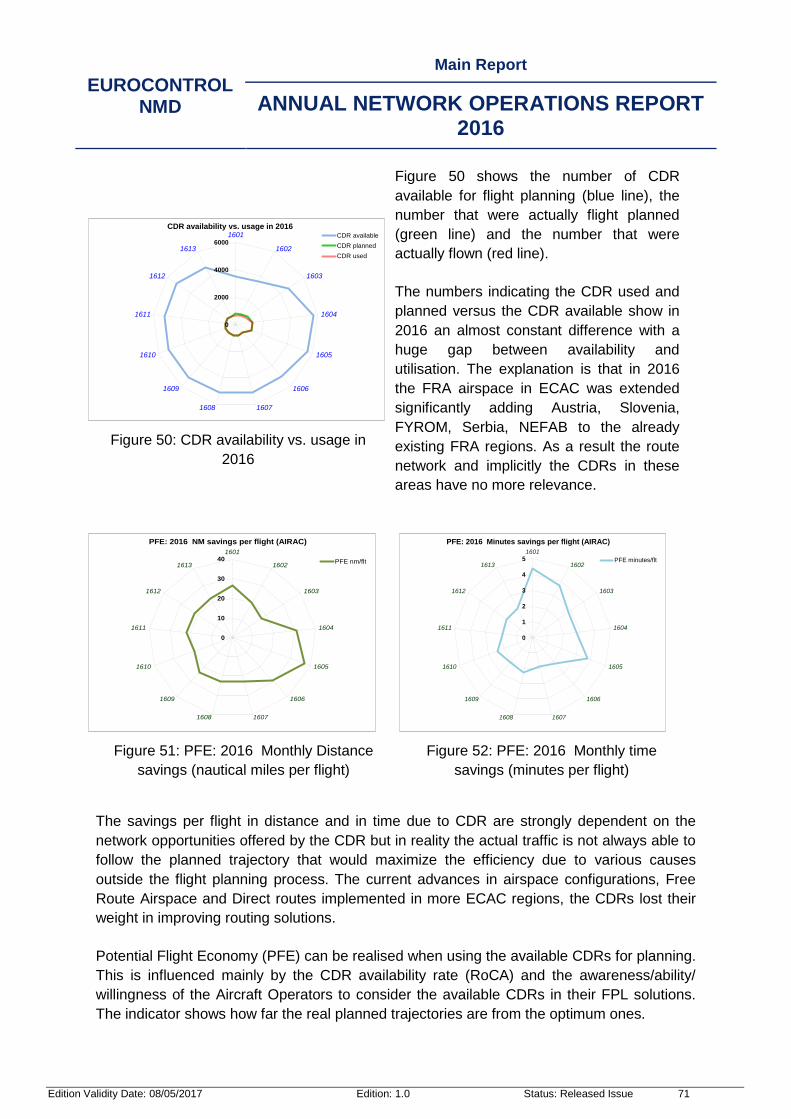
EUROCONTROL NMD
Main Report
ANNUAL NETWORK OPERATIONS REPORT 2016
Edition Validity Date: 08/05/2017 Edition: 1.0 Status: Released Issue 71
Figure 50: CDR availability vs. usage in
2016
Figure 50 shows the number of CDR
available for flight planning (blue line), the
number that were actually flight planned
(green line) and the number that were
actually flown (red line).
The numbers indicating the CDR used and
planned versus the CDR available show in
2016 an almost constant difference with a
huge gap between availability and
utilisation. The explanation is that in 2016
the FRA airspace in ECAC was extended
significantly adding Austria, Slovenia,
FYROM, Serbia, NEFAB to the already
existing FRA regions. As a result the route
network and implicitly the CDRs in these
areas have no more relevance.
Figure 51: PFE: 2016 Monthly Distance
savings (nautical miles per flight)
Figure 52: PFE: 2016 Monthly time
savings (minutes per flight)
The savings per flight in distance and in time due to CDR are strongly dependent on the
network opportunities offered by the CDR but in reality the actual traffic is not always able to
follow the planned trajectory that would maximize the efficiency due to various causes
outside the flight planning process. The current advances in airspace configurations, Free
Route Airspace and Direct routes implemented in more ECAC regions, the CDRs lost their
weight in improving routing solutions.
Potential Flight Economy (PFE) can be realised when using the available CDRs for planning.
This is influenced mainly by the CDR availability rate (RoCA) and the awareness/ability/
willingness of the Aircraft Operators to consider the available CDRs in their FPL solutions.
The indicator shows how far the real planned trajectories are from the optimum ones.
0
2000
4000
60001601
1602
1603
1604
1605
1606
16071608
1609
1610
1611
1612
1613
CDR availability vs. usage in 2016CDR available
CDR planned
CDR used
0
10
20
30
401601
1602
1603
1604
1605
1606
16071608
1609
1610
1611
1612
1613
PFE: 2016 NM savings per flight (AIRAC)
PFE nm/flt
0
1
2
3
4
51601
1602
1603
1604
1605
1606
16071608
1609
1610
1611
1612
1613
PFE: 2016 Minutes savings per flight (AIRAC)
PFE minutes/flt
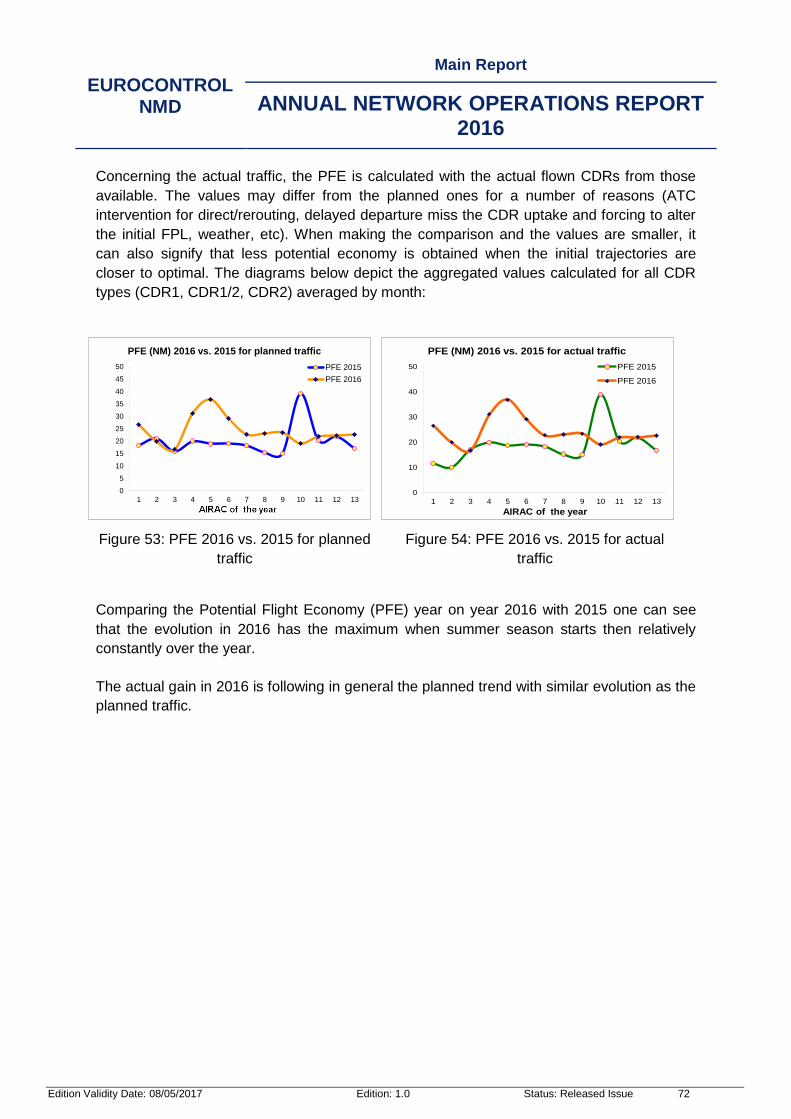
EUROCONTROL NMD
Main Report
ANNUAL NETWORK OPERATIONS REPORT 2016
Edition Validity Date: 08/05/2017 Edition: 1.0 Status: Released Issue 72
Concerning the actual traffic, the PFE is calculated with the actual flown CDRs from those
available. The values may differ from the planned ones for a number of reasons (ATC
intervention for direct/rerouting, delayed departure miss the CDR uptake and forcing to alter
the initial FPL, weather, etc). When making the comparison and the values are smaller, it
can also signify that less potential economy is obtained when the initial trajectories are
closer to optimal. The diagrams below depict the aggregated values calculated for all CDR
types (CDR1, CDR1/2, CDR2) averaged by month:
Figure 53: PFE 2016 vs. 2015 for planned
traffic
Figure 54: PFE 2016 vs. 2015 for actual
traffic
Comparing the Potential Flight Economy (PFE) year on year 2016 with 2015 one can see
that the evolution in 2016 has the maximum when summer season starts then relatively
constantly over the year.
The actual gain in 2016 is following in general the planned trend with similar evolution as the
planned traffic.
0
5
10
15
20
25
30
35
40
45
50
1 2 3 4 5 6 7 8 9 10 11 12 13
PFE (NM) 2016 vs. 2015 for planned traffic
PFE 2015
PFE 2016
0
10
20
30
40
50
1 2 3 4 5 6 7 8 9 10 11 12 13
AIRAC of the year
PFE (NM) 2016 vs. 2015 for actual traffic
PFE 2015
PFE 2016

EUROCONTROL NMD
Main Report
ANNUAL NETWORK OPERATIONS REPORT 2016
Edition Validity Date: 08/05/2017 Edition: 1.0 Status: Released Issue 73
Figure 55: PFE: 2016 Fuel economy and CO2
emissions
The environmental indicators of PFE
translated in fuel savings and reduced
CO2 emissions illustrated in the picture
on the left have been calculated using
the ICAO methodology for fuel burned
and CO2 emissions. The curves show
the effect of less CDR usage both for
planning and actual flying for the causes
mentioned above
7.5 FREE ROUTE OPERATIONS
By the end of 2016, the ACCs in Table 7 have either fully or partially implemented Free
Route Airspace operations.
Full Free Route Airspace implementation
Lisbon ACC
Oslo, Stavanger, Bodo, Tampere, Tallinn, Riga ,Copenhagen , Malmo and Stockholm ACCs as part of NEFRA
Shannon ACC
Vilnius ACC
Budapest ACC
Vienna and Ljubljana ACCs as part of SAXFRA
Rome, Padua, Brindisi and Milan ACCs as part of FRA IT
Malta ACC
Belgrade ACC
Zagreb ACC
Skopje ACC
Full Night Free Route Airspace implementation
Sofia ACC and Bucharest ACC as part of Danube FAB
Chisinau ACC
Kyiv, Lviv , Odesa, Dnipropetrovsk ACCs
DCT based implementation
Reims, Brest, Bordeaux, Paris, Marseille ACCs
Madrid ACC
London and Prestwick ACCs
Maastricht UAC
Karlsruhe UAC
Geneva and Zurich ACCs
Athens and Macedonia ACCs
Bratislava ACC
Prague ACC
Warsaw ACC
Nicosia ACC
Table 7: Free Route Airspace Operations implementations
0
0,25
0,5
0,75
1
1601 1602 1603 1604 1605 1606 1607 1608 1609 1610 1611 1612 1613
ton
s f
uel / C
O2 p
er
flig
ht
AIRAC 2016
PFE: 2016 Fuel economy and CO2 emissions
PFE tons/flt
PFE CO2/flt

EUROCONTROL NMD
Main Report
ANNUAL NETWORK OPERATIONS REPORT 2016
Edition Validity Date: 08/05/2017 Edition: 1.0 Status: Released Issue 74
Note that 48 ACCs have partial or full Free Route implementation, which is above the target
set by NM of 35 ACCs by the end of 2016. The following map shows the European Free
Route Airspace deployment status as of end 2016.
7.6 ROUTE AVAILABILITY DOCUMENT (RAD)
The Route Availability Document (RAD) is a tool that addresses how the European network
airspace may be used. According to the Commission Regulation (EU) No 255/2010ix the
scope of the RAD is to be a common reference document containing the policies,
procedures and description for route and traffic orientation.
The Network Manager Implementing Rule (Commission Regulation (EU) No 677/2011)x
makes a clear reference that the European Route Network Improvement Plan shall include
route network and free route airspace utilisation rules and availability.
The airspace design and airspace utilisation aspects were brought closer by the established
multi-disciplinary Network Manager RAD Team guided by the Operational Stakeholders RAD
Management Group.
The actions performed by the NM RAD Team have facilitated a pragmatic refinement of the
RAD during 2016, with full cooperation of Operational Stakeholders, aiming to overcome
weaknesses in airspace design and ATM system functionality and to ensure application of
the remaining restrictions only where and when required.
Figure 56: Map – Free Route Airspace Deployment by end 2016.
EUROCONTROL NMD
Main Report
ANNUAL NETWORK OPERATIONS REPORT 2016
Edition Validity Date: 08/05/2017 Edition: 1.0 Status: Released Issue 75
The major RAD evolutions and developments in 2016 focusing particularly at Network level
and covering the entire NM area of responsibility were as follows:
Gradual removal of “Indention” used as RAD Utilization definition;
Adaptation of the time expression and harmonisation in entire RAD;
Adaptations of Pan-Europe Annex and simplification of existence of two or more
restrictions for same RAD “reference”;
Adaptation and simplification of Appendix 3 flow condition/s from Column “FL
Capping” moved into Column “City Pair”;
As from 1 DEC 2015 (Tuesday) the NM RAD Team started to load the EU/EURO
restrictions xls file every Tuesday and Friday;
Appendix 6 - Alignment with CACD database;
Appendix 7 - FUA Restriction alignment with CACD database - update;
Appendix 7 - Management of Complex FUA restrictions;
Appendix 7 - FUA restrictions utilization time buffer;
Initiation of improvement of Dependent Applicability Function (RAD) in NMOC
Systems;
Further developments of the NM DCT / CDR mapping tool;
Monitoring and continuation of publication of harmonised text in regard to
promulgation of RAD via the State AIPs;
Approval of RAD Terms - Definitions. This is the first ever Document in
EUROCONTROL containing the definition of terms used in the RAD in order to
describe and express the utilization of the European airspace.
Improvements in data structure and format, and change management based on
RAD - AURA@n-CONECT grammar;
Continuation of NM Release development related to Airspace Utilisation Rules
and Availability (AURA) interactive process via the NOP and use of the NOP
Portal as a collaborative platform to build the RAD - AURA[iii]@n-CONECT.
The other RAD evolutions and developments in 2016 included the following aspects (not
exhaustive):
Further improvement of a single Network wide European Airport Connectivity
containing all general arrival / departure information, arrival procedures and
departure procedures;
Further development of the RAD DCT Chart;
Continuation of improvements in data structure and format, and change
management based on RAD - AURA@n-CONECT grammar;
Further adaptations in the RAD Harmonization Rule (RHR-1) based on RAD -
AURA@n-CONECT developments;
Continuation of harmonisation of terminology and definitions;
Continuation of improvements in RAD availability (publication) to users;
Continuation of rationalisation of restrictions expression;

EUROCONTROL NMD
Main Report
ANNUAL NETWORK OPERATIONS REPORT 2016
Edition Validity Date: 08/05/2017 Edition: 1.0 Status: Released Issue 76
Continuation of the pdf RAD publication.
Further RAD improvement measures have been proposed for implementation in 2017 such
as:
Gradual improvement in RAD Utilization definition, adaptation of the expressions
in the RAD and harmonisation in entire RAD;
Preparation for run of a Network impact assessment of the RAD restrictions
implemented in the States.
Further NM Release developments related to Airspace Utilisation Rules and
Availability (AURA) interactive process via the NOP and use of the NOP Portal as
a collaborative platform to build the RAD - AURA@n-CONECT.
o Restriction structures and grammars;
o Restriction ID taxonomy;
o Formal exposure of the service deployment.

EUROCONTROL NMD
Main Report
ANNUAL NETWORK OPERATIONS REPORT 2016
Edition Validity Date: 08/05/2017 Edition: 1.0 Status: Released Issue 77
8 NETWORK MANAGER
In addition to the network targets defined for 2016, the NM Performance Plan defines a set
of internal NM performance objectives/targets, to measure NM’s contribution to the ATM
network performance. In the Capacity performance area NM has the target to reduce the
en-route ATFM delays by 10%.
NM Operations Centre (NMOC) looks for opportunities to reduce the delays by means of
proposing alternative routes (RRPs) to the airlines, manually optimising the calculated time
over (CTO) or take-off times (CTOT) (these are the direct delay reduction actions). The
manual CTOT changes are performed in conjunction with the FMPs/AOs and are therefore
regarded as confirmed delay reductions. Re-route proposals can only deliver delay benefit if
the AO accepts the proposal - this is monitored in post-ops. These techniques reduce delays
at individual flight level and deliver further delay reductions at network level through the
CASA optimisation algorithm (indirect ‘snowball’ effect). While it is currently possible to
measure the direct delay reductions initiated by NMOC, it is not possible to quantify the
indirect delay reduction effect of the direct actions. The amount of delay reduced by NMOC
pre-tactical planning process and the applied scenarios cannot be quantified either.
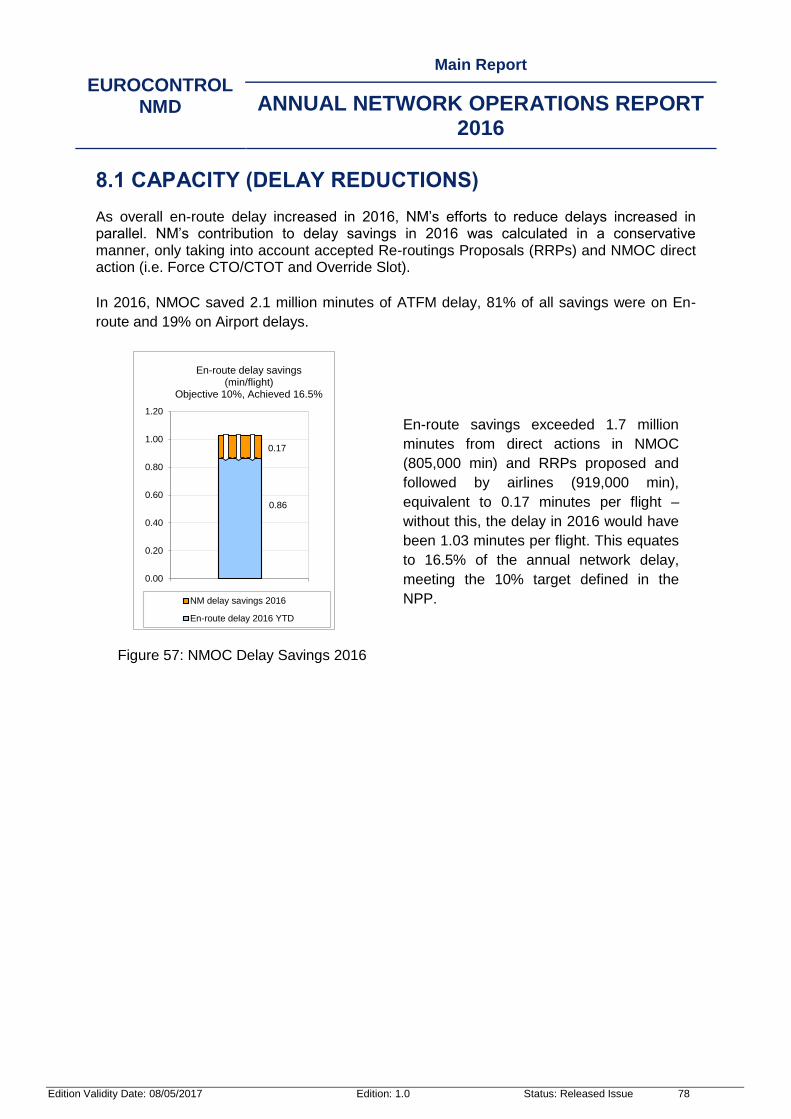
EUROCONTROL NMD
Main Report
ANNUAL NETWORK OPERATIONS REPORT 2016
Edition Validity Date: 08/05/2017 Edition: 1.0 Status: Released Issue 78
8.1 CAPACITY (DELAY REDUCTIONS)
As overall en-route delay increased in 2016, NM’s efforts to reduce delays increased in parallel. NM’s contribution to delay savings in 2016 was calculated in a conservative manner, only taking into account accepted Re-routings Proposals (RRPs) and NMOC direct action (i.e. Force CTO/CTOT and Override Slot).
In 2016, NMOC saved 2.1 million minutes of ATFM delay, 81% of all savings were on En-
route and 19% on Airport delays.
Figure 57: NMOC Delay Savings 2016
En-route savings exceeded 1.7 million
minutes from direct actions in NMOC
(805,000 min) and RRPs proposed and
followed by airlines (919,000 min),
equivalent to 0.17 minutes per flight –
without this, the delay in 2016 would have
been 1.03 minutes per flight. This equates
to 16.5% of the annual network delay,
meeting the 10% target defined in the
NPP.
0.86
0.17
0.00
0.20
0.40
0.60
0.80
1.00
1.20
En-route delay savings(min/flight)
Objective 10%, Achieved 16.5%
NM delay savings 2016
En-route delay 2016 YTD

EUROCONTROL NMD
Main Report
ANNUAL NETWORK OPERATIONS REPORT 2016
Edition Validity Date: 08/05/2017 Edition: 1.0 Status: Released Issue 79
8.2 ENVIRONMENT (FLIGHT EFFICIENCY)
As part of Flight Efficiency Plan, intensive work has been undertaken by States and ANSPs
in close cooperation with NM to develop and implement enhanced airspace design solutions,
with over 200 airspace improvement packages being co-ordinated at network level and
implemented during the 12 months of 2016. These improvement measures reduced
significantly the actual losses recorded as a result of number of events (see 3.5) which had
direct consequences on the flight efficiency evolution. The list below provides an overview of
the major enhancements implemented in 2016.
Austria / Slovenia - SAXFRA - Slovenian Austrian cross-border Free Route Airspace
Austria / Germany - ATS routes / RAD update Munich FIR/ Wien FIR in support od SAXFRA.
Bulgaria / Romania / Turkey - UDROS / ODERO area re-organization.
Croatia / Bosnia Herzegovina / Serbia - Free Route Airspace Zagreb, Phase 5b – SEAFRA.
Cyprus - Nicosia Direct Route Airspace, Phase 1A. - Nicosia Direct Route Airspace, Phase 1B.
Denmark / Estonia / Latvia / Finland / Sweden - North European Free Route Airspace/ NEFRA Phase 1 (NEFAB plus DK/SE).
France - S-WAFLE - South West Adaptation Flight Level Evolution, Phase 1. - Marseille ACC re-organisation, Phase 2. - Marseille ACC re-organisation, Phase 3.
Germany - FRA Germany - Phase 1. - FRA Germany - Phase 2. - Karlsruhe UAC sector split (4th layer).
Greece - Night Free Route Airspace Greece (Phase II).
Island / Norway - Borealis FRA - Step 2a Enhancement of EUR/NAT interface. - Borealis FRA - Step 2b.
Island / UK - Borealis FRA - Step 3 Enhancement of EUR/NAT interface.
Italy - New Apulia CTR. - Milano TMA/ Roma TMA reorganisation. - Removal U prefix Milano, Roma and Brindisi UIR. - FRA-IT Free Route Airspace Italy, Phase 3.
Lituania - Free Route Airspace Vilnius - EYSFRA, Phase 2.
Maastricht UAC - New Division Flight Level Brussels Sector Group.
Malta - Free Route Airspace Malta - Phase 3a.

EUROCONTROL NMD
Main Report
ANNUAL NETWORK OPERATIONS REPORT 2016
Edition Validity Date: 08/05/2017 Edition: 1.0 Status: Released Issue 80
Poland - Polish Airspace Project 2010+, Phase 3a (vertical sector splits). - FRA Like (DCT) Warsaw FIR.
Romania - Removal of ‘U’ prefix within Bucuresti FIR.
Serbia - Lower airspace re-organisation Beograd FIR (Step 1).
Serbia / Montenegro / Bosnia Herzegovina / Coatia
- Free Route Airspace Beograd, Phase 5b – SEAFRA. Slovakia
- Free Route Airspace Bratislava - FRABRA Phase 1. Spain
- Madrid ACC sector split. Sweden
- Malmo ACC/ ESMM ‘Sector 2’ split. The Former Yugoslav Republic of Macedonia
- Free Route Airspace Skopje FIR. UK
- Prestwick ACC iTEC (interoperability Through European Collaboration) operating system.
- London Airspace Management Programme, LAMP (Phase 1a). - D201 Bypass Route, Phase 1 (new DCTs). - Improvement of vertical Flight Efficiency over the North Sea.

EUROCONTROL NMD
Main Report
ANNUAL NETWORK OPERATIONS REPORT 2016
Edition Validity Date: 08/05/2017 Edition: 1.0 Status: Released Issue 81
9 ATFM COMPLIANCE
9.1 ATFM DEPARTURE SLOTS
The overall percentage of traffic departing within their Slot Tolerance Window (STW) was
89.4% in 2016, meeting the target of 80%. However, many airports did not meet the target
(see ATFM Compliance - ATFM Departure Slot Monitoring Reportxi). It is an improvement
over 2015 where the compliance percentage was 88.1%. NM is working with the ANSPs for
improving the level of adherence.
Figure 58: ATFM Departure Slot Monitoring for 2015 and 201612
12
Geographical Zone : NM or Adjacent Member States

EUROCONTROL NMD
Main Report
ANNUAL NETWORK OPERATIONS REPORT 2016
Edition Validity Date: 08/05/2017 Edition: 1.0 Status: Released Issue 82
9.2 ADHERENCE TO FLIGHT PLAN SUSPENSIONS
The percentage of flights suspended by FAM (Flight Activation Monitoring) but which were
activated by airborne data received whilst the flight was temporarily suspended decreased in
2016 to 0.25% of all departures. Figure 59 shows the top airports where such situations
occurred, as well as the percentage of these flights within the total number of flights at that
airport. The introduction of Airport CDM has proven to be the most effective measure in
bringing down the number of such flights.
Figure 59: Top 20 ADEPs - Flight Plans Suspensions for 2015 and 201613
13
Geographical Zone : Eurocontrol or EUR28 Member States
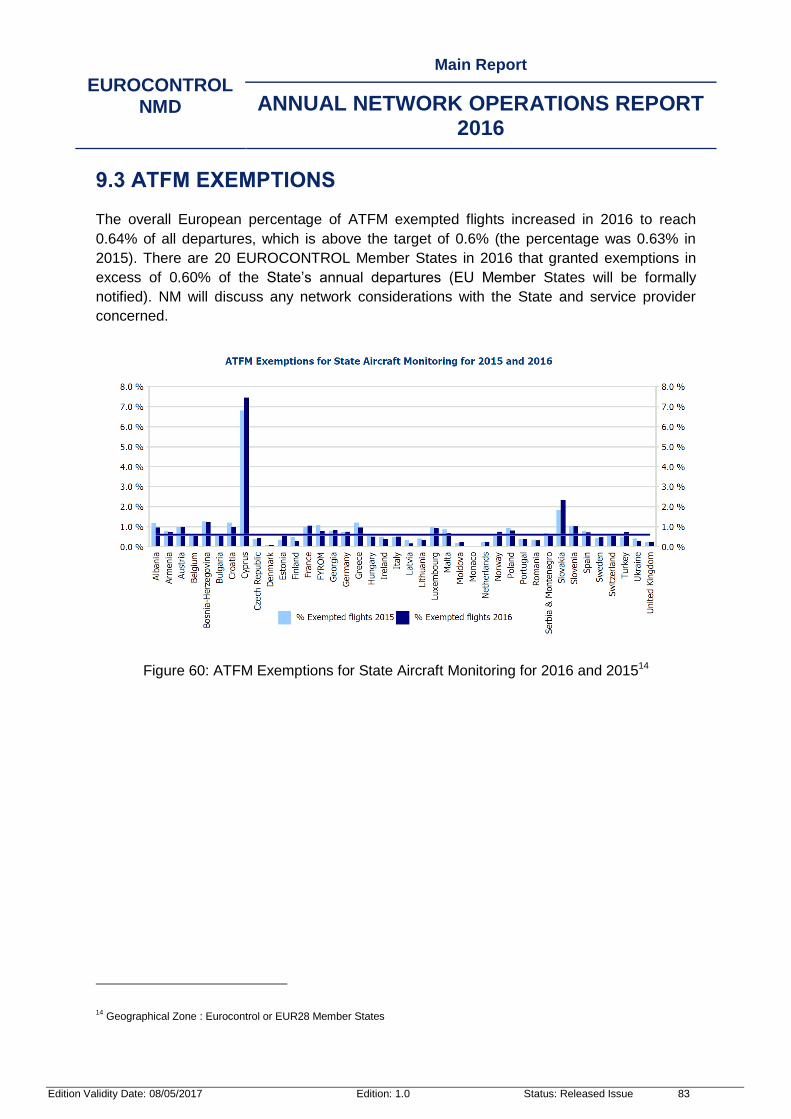
EUROCONTROL NMD
Main Report
ANNUAL NETWORK OPERATIONS REPORT 2016
Edition Validity Date: 08/05/2017 Edition: 1.0 Status: Released Issue 83
9.3 ATFM EXEMPTIONS
The overall European percentage of ATFM exempted flights increased in 2016 to reach
0.64% of all departures, which is above the target of 0.6% (the percentage was 0.63% in
2015). There are 20 EUROCONTROL Member States in 2016 that granted exemptions in
excess of 0.60% of the State’s annual departures (EU Member States will be formally
notified). NM will discuss any network considerations with the State and service provider
concerned.
Figure 60: ATFM Exemptions for State Aircraft Monitoring for 2016 and 201514
14
Geographical Zone : Eurocontrol or EUR28 Member States
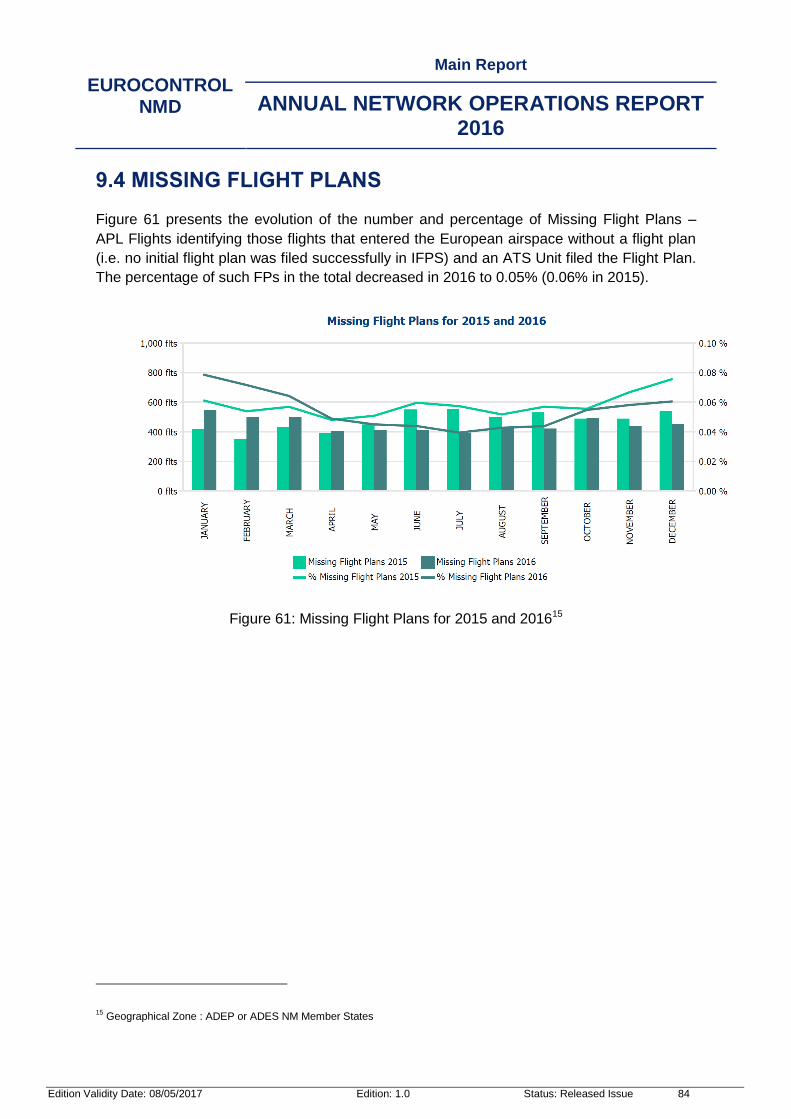
EUROCONTROL NMD
Main Report
ANNUAL NETWORK OPERATIONS REPORT 2016
Edition Validity Date: 08/05/2017 Edition: 1.0 Status: Released Issue 84
9.4 MISSING FLIGHT PLANS
Figure 61 presents the evolution of the number and percentage of Missing Flight Plans –
APL Flights identifying those flights that entered the European airspace without a flight plan
(i.e. no initial flight plan was filed successfully in IFPS) and an ATS Unit filed the Flight Plan.
The percentage of such FPs in the total decreased in 2016 to 0.05% (0.06% in 2015).
Figure 61: Missing Flight Plans for 2015 and 201615
15
Geographical Zone : ADEP or ADES NM Member States

EUROCONTROL NMD
Main Report
ANNUAL NETWORK OPERATIONS REPORT 2016
Edition Validity Date: 08/05/2017 Edition: 1.0 Status: Released Issue 85
9.5 MULTIPLE FLIGHTS
NM is using the data from Flight Activation Monitoring to identify possible multiple flight plans
by measuring the number of flight plans received for which no subsequent activation or
airborne information is received. Figure 62 presents the evolution of numbers and
proportion of these flights within the total traffic. The percentage of these flights remained at
2015 level (0.25%). NM reviews the causes and the network impact of such cases and
contacts the airlines or FP originators when necessary.
Figure 62: Multiple Flight Plans for 2015 and 2016

EUROCONTROL NMD
Main Report
ANNUAL NETWORK OPERATIONS REPORT 2016
Edition Validity Date: 08/05/2017 Edition: 1.0 Status: Released Issue 86
10 REFERENCES
i EUROCONTROL Seven Year IFR Movements and Service Units Forecast 2016 – 2022, STATFOR Document 579, February
2016 www.eurocontrol.int/statfor ii
STATFOR Interactive Dashboard http://www.eurocontrol.int/statfor/sid
iii Transition Plan for major Projects in Europe 2015-2016 for more information
https://www.eurocontrol.int/sites/default/files/publication/files/network-operations-transition-plan-2016-2017.pdf
iv
European Network Operations Plan 2016 – 2019/20 http://www.eurocontrol.int/publications/european-network-operations-
plan-2016-2020
v ACDM website http://www.eurocontrol.int/articles/airport-collaborative-decision-making-cdm
vi
Network Manager Functions Implementing Regulation (677/2011) – Annex V – Appendix II – Airports
http://skybrary.aero/bookshelf/books/1551.pdf
vii
Flight Efficiency Plan https://www.eurocontrol.int/articles/airspace-developments-and-flight-efficiency-plan-fep
viii
Network Performance Plan 2015 -2019 http://www.eurocontrol.int/sites/default/files/publication/files/npp-report-2015-19.pdf
ix
Common Rules on Air Traffic Flow Management (255/2010) http://www.skybrary.aero/index.php/Regulation_255/2010_-
_Common_Rules_on_Air_Traffic_Flow_Management x
Detailed rules for the implementation of ATM network functions
http://www.skybrary.aero/index.php/Regulation_677/2011_laying_down_detailed_rules_for_the_implementation_of_ATM_network_functions xi
Air Traffic Flow Monitoring Compliance reports https://intra-
x.eurocontrol.int/atfm_report/nonpublic/standard_page/atfm_compliance_index.html


