Year: 2019
Address:
Tel:
Email:
Prepared by: Position:
Approved by: Position:
Version: 1
Issue Date:
A Jackson General Manager
31/1/2020
MES Environmental Ltd, Sideway, Campbell Road, Stoke, ST4 4DX
01782 412131
[email protected]
J Purnell Environmental Manager
MES Environmental Ltd.
Add company logo
Add photo
Annual Performance Report 2019
Permit EPR/QP3234SX
Stoke Energy from Waste Facility
Annual Performance Report 2019 Stoke Energy from Waste Facility
Contents
Section Page
3
4
5
6
7
8
9
10
11
12
13
14
15
16
17
18
19
20
21
Version Control
Section Date
All 31/1/2020
Distribution
Copy No.
This report is required under the Industrial Emissions Directive’s Article 55(2) requirements on reporting and public information
on waste incineration plants and co-incineration plants, which require the operator to produce an annual report on the
functioning and monitoring of the plant and make it available to the public.
Carbon Monoxide emissions
Ammonia emissions
Information
Version 1
Name, Role
Particulate Matter emissions
Permit Compliance
Improvements
Public Liaison
Residue Quality - Optional
Emissions to Water
Emissions to Air (periodically monitored)
Emissions to Air (continuously monitored)
Hydrogen Chloride emissions
Sulphur Dioxide emissions
Oxides of Nitrogen emissions
Total Organic Carbon emissions
Energy Form 1
Subject
Facility Information
Operational Summary
Operational Data
Performance Form 1
Page 2
Annual Performance Report 2019 Stoke Energy from Waste Facility
Plant Description and Design
Summary of Operational Processes and Procedures
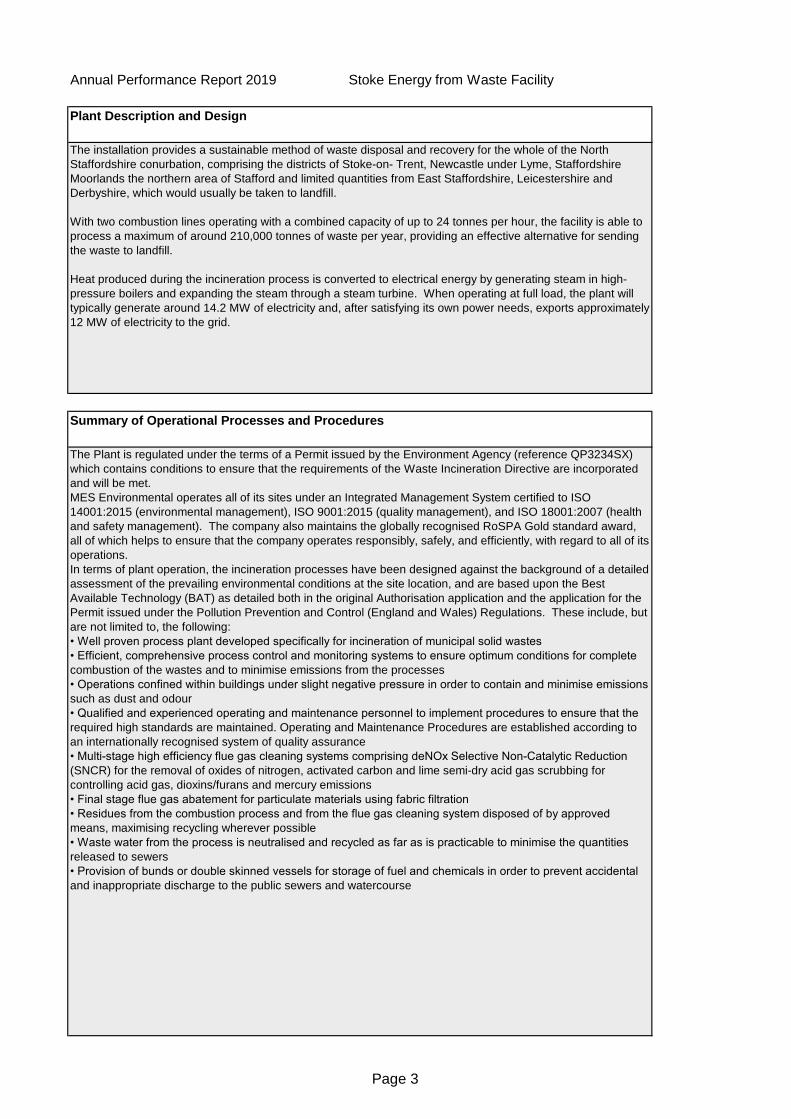
The installation provides a sustainable method of waste disposal and recovery for the whole of the North
Staffordshire conurbation, comprising the districts of Stoke-on- Trent, Newcastle under Lyme, Staffordshire
Moorlands the northern area of Stafford and limited quantities from East Staffordshire, Leicestershire and
Derbyshire, which would usually be taken to landfill.
With two combustion lines operating with a combined capacity of up to 24 tonnes per hour, the facility is able to
process a maximum of around 210,000 tonnes of waste per year, providing an effective alternative for sending
the waste to landfill.
Heat produced during the incineration process is converted to electrical energy by generating steam in high-
pressure boilers and expanding the steam through a steam turbine. When operating at full load, the plant will
typically generate around 14.2 MW of electricity and, after satisfying its own power needs, exports approximately
12 MW of electricity to the grid.
The Plant is regulated under the terms of a Permit issued by the Environment Agency (reference QP3234SX)
which contains conditions to ensure that the requirements of the Waste Incineration Directive are incorporated
and will be met.
MES Environmental operates all of its sites under an Integrated Management System certified to ISO
14001:2015 (environmental management), ISO 9001:2015 (quality management), and ISO 18001:2007 (health
and safety management). The company also maintains the globally recognised RoSPA Gold standard award,
all of which helps to ensure that the company operates responsibly, safely, and efficiently, with regard to all of its
operations.
In terms of plant operation, the incineration processes have been designed against the background of a detailed
assessment of the prevailing environmental conditions at the site location, and are based upon the Best
Available Technology (BAT) as detailed both in the original Authorisation application and the application for the
Permit issued under the Pollution Prevention and Control (England and Wales) Regulations. These include, but
are not limited to, the following:
• Well proven process plant developed specifically for incineration of municipal solid wastes
• Efficient, comprehensive process control and monitoring systems to ensure optimum conditions for complete
combustion of the wastes and to minimise emissions from the processes
• Operations confined within buildings under slight negative pressure in order to contain and minimise emissions
such as dust and odour
• Qualified and experienced operating and maintenance personnel to implement procedures to ensure that the
required high standards are maintained. Operating and Maintenance Procedures are established according to
an internationally recognised system of quality assurance
• Multi-stage high efficiency flue gas cleaning systems comprising deNOx Selective Non-Catalytic Reduction
(SNCR) for the removal of oxides of nitrogen, activated carbon and lime semi-dry acid gas scrubbing for
controlling acid gas, dioxins/furans and mercury emissions
• Final stage flue gas abatement for particulate materials using fabric filtration
• Residues from the combustion process and from the flue gas cleaning system disposed of by approved
means, maximising recycling wherever possible
• Waste water from the process is neutralised and recycled as far as is practicable to minimise the quantities
released to sewers
• Provision of bunds or double skinned vessels for storage of fuel and chemicals in order to prevent accidental
and inappropriate discharge to the public sewers and watercourse
Page 3
Annual Performance Report 2019 Stoke Energy from Waste Facility
Summary of Plant Operations and Maintenance during the reporting year
Summary of Residue Handling for the reporting year
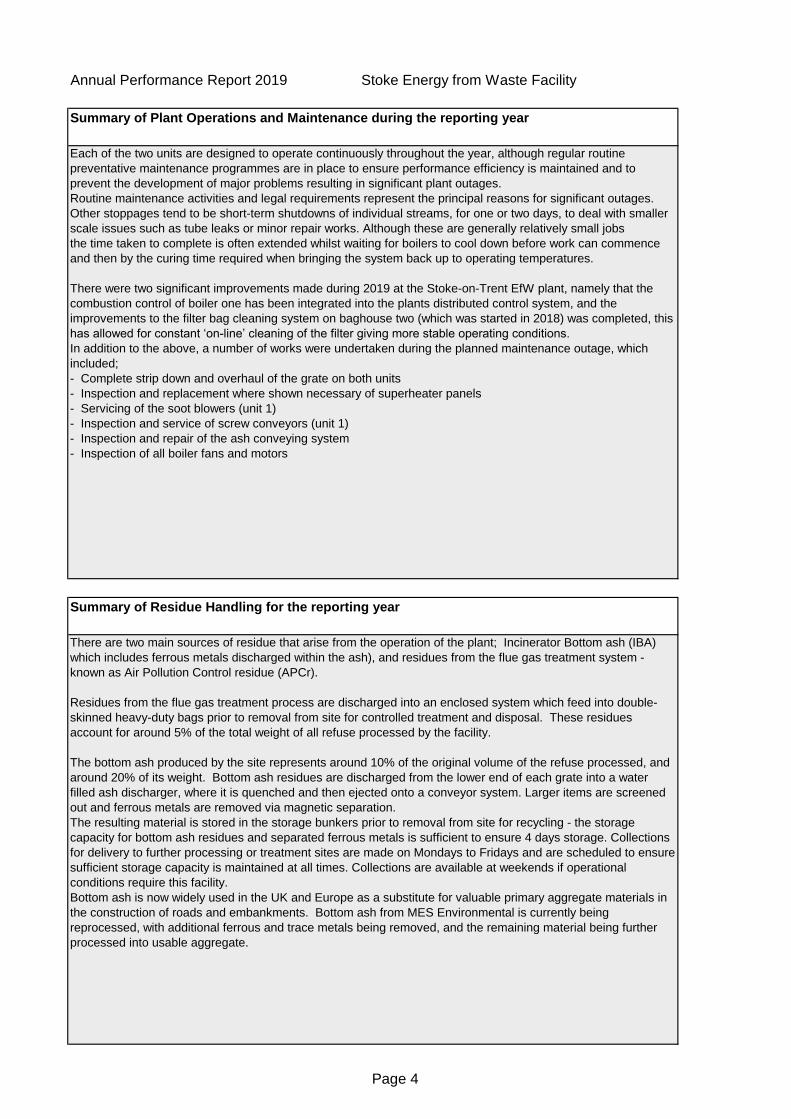
Each of the two units are designed to operate continuously throughout the year, although regular routine
preventative maintenance programmes are in place to ensure performance efficiency is maintained and to
prevent the development of major problems resulting in significant plant outages.
Routine maintenance activities and legal requirements represent the principal reasons for significant outages.
Other stoppages tend to be short-term shutdowns of individual streams, for one or two days, to deal with smaller
scale issues such as tube leaks or minor repair works. Although these are generally relatively small jobs
the time taken to complete is often extended whilst waiting for boilers to cool down before work can commence
and then by the curing time required when bringing the system back up to operating temperatures.
There were two significant improvements made during 2019 at the Stoke-on-Trent EfW plant, namely that the
combustion control of boiler one has been integrated into the plants distributed control system, and the
improvements to the filter bag cleaning system on baghouse two (which was started in 2018) was completed, this
has allowed for constant ‘on-line’ cleaning of the filter giving more stable operating conditions.
In addition to the above, a number of works were undertaken during the planned maintenance outage, which
included;
- Complete strip down and overhaul of the grate on both units
- Inspection and replacement where shown necessary of superheater panels
- Servicing of the soot blowers (unit 1)
- Inspection and service of screw conveyors (unit 1)
- Inspection and repair of the ash conveying system
- Inspection of all boiler fans and motors
There are two main sources of residue that arise from the operation of the plant; Incinerator Bottom ash (IBA)
which includes ferrous metals discharged within the ash), and residues from the flue gas treatment system -
known as Air Pollution Control residue (APCr).
Residues from the flue gas treatment process are discharged into an enclosed system which feed into double-
skinned heavy-duty bags prior to removal from site for controlled treatment and disposal. These residues
account for around 5% of the total weight of all refuse processed by the facility.
The bottom ash produced by the site represents around 10% of the original volume of the refuse processed, and
around 20% of its weight. Bottom ash residues are discharged from the lower end of each grate into a water
filled ash discharger, where it is quenched and then ejected onto a conveyor system. Larger items are screened
out and ferrous metals are removed via magnetic separation.
The resulting material is stored in the storage bunkers prior to removal from site for recycling - the storage
capacity for bottom ash residues and separated ferrous metals is sufficient to ensure 4 days storage. Collections
for delivery to further processing or treatment sites are made on Mondays to Fridays and are scheduled to ensure
sufficient storage capacity is maintained at all times. Collections are available at weekends if operational
conditions require this facility.
Bottom ash is now widely used in the UK and Europe as a substitute for valuable primary aggregate materials in
the construction of roads and embankments. Bottom ash from MES Environmental is currently being
reprocessed, with additional ferrous and trace metals being removed, and the remaining material being further
processed into usable aggregate.
Page 4
Annual Performance Report 2019 Stoke Energy from Waste Facility
Operational Data
Plant Size tonnes pa MWth 14 MWe
No. of combustion lines 2 No. of Turbines: 1
Waste types received Unit Q1 Q2 Q3 Q4 Year Total %
Household / Local Authority 46,814 34,534 43,923 50,368 175,639 98.3%
Commercial & Industrial 1,228 65 558 1,225 3,076 1.7%
Hazardous - -
Clinical - -
Waste wood (biomass) - -
Refuse derived fuel - -
Solid recovered fuel - -
Other [Please specify] - -
Other [Please specify]
Other [Please specify]
Total waste received 48,042 34,599 44,481 51,593 178,715 100.0%
Rejected Waste - -
Waste transferred out - -
Energy Useage / Export Unit Q1 Q2 Q3 Q4 Year Total KWh/te
Power Generated 25,154 16,124 20,952 25,758 87,988 492
Power Exported 21,242 13,370 17,482 21,668 73,762 413
Power Used on site 3,912 2,754 3,470 4,090 14,226 80
Power Imported 65 425 325 106 921 5
Parasitic Load % 15.8% 19.2% 17.8% 16.2% 17.0%
Thermal Energy Produced - -
Thermal Energy Exported - -
R1 value
Waste Disposal & Recovery Unit Q1 Q2 Q3 Q4 Year Total % inputs
APC Residues - produced 1,456 1,053 1,377 1,818 5,704 3.2%
IBA - produced 8,492 6,899 7,913 8,837 32,141 18.0%
Metals recycling 610 517 743 956 2,826 1.6%
Other - - - - - -
Other - - - - - -
Other - - - - - -
Raw Material Usage Unit Q1 Q2 Q3 Q4 Year Total kg or Ltr /te
Mains Water m3 8,394 9,906 7,754 7,744 33,798 189.12
Other Water m3 12,616 10,170 13,974 18,943 55,703 311.69
Ammonia / Urea kgs 77,000 48,000 43,000 46,000 214,000 1.20
Activated Carbon kgs 4,000 3,500 4,000 3,500 15,000 0.08
Lime / hydrated lime kgs 498,780 354,380 428,960 597,960 1,880,080 10.52
Fuel oil ltrs 41,440 163,203 104,628 68,535 377,806 2.11
Gas cf - - - - - -
Other - - - - - -
Summary of Hours Line/Unit Q1 Q2 Q3 Q4 Year Total
Hours of waste combustion, total 1 2,159 1,444 1,912 2,187 7,701 87.9%
Hours of waste combustion, total 2 1,999 1,507 1,838 1,912 7,256 82.8%
Hours of waste combustion, total - x %
Hours of waste combustion, total - x %
Hours of waste combustion, total - x %
Hours of turbine operations, total 1 2,121 1,603 1,914 2,149 7,786 88.9%
Hours of turbine operations, total - x %
Hours of heat / steam export - - - - - n/a
Abnormal Events qty. 1 1 - 2 4 yes
Abnormal operation hours 0.5 1 - 1 2 0.02%
Permit Breaches qty. 1 1 1 1 4 yes
tonnes
Design / Operational / n/a
210,000
tonnes
MW
hG
Wh
Page 5
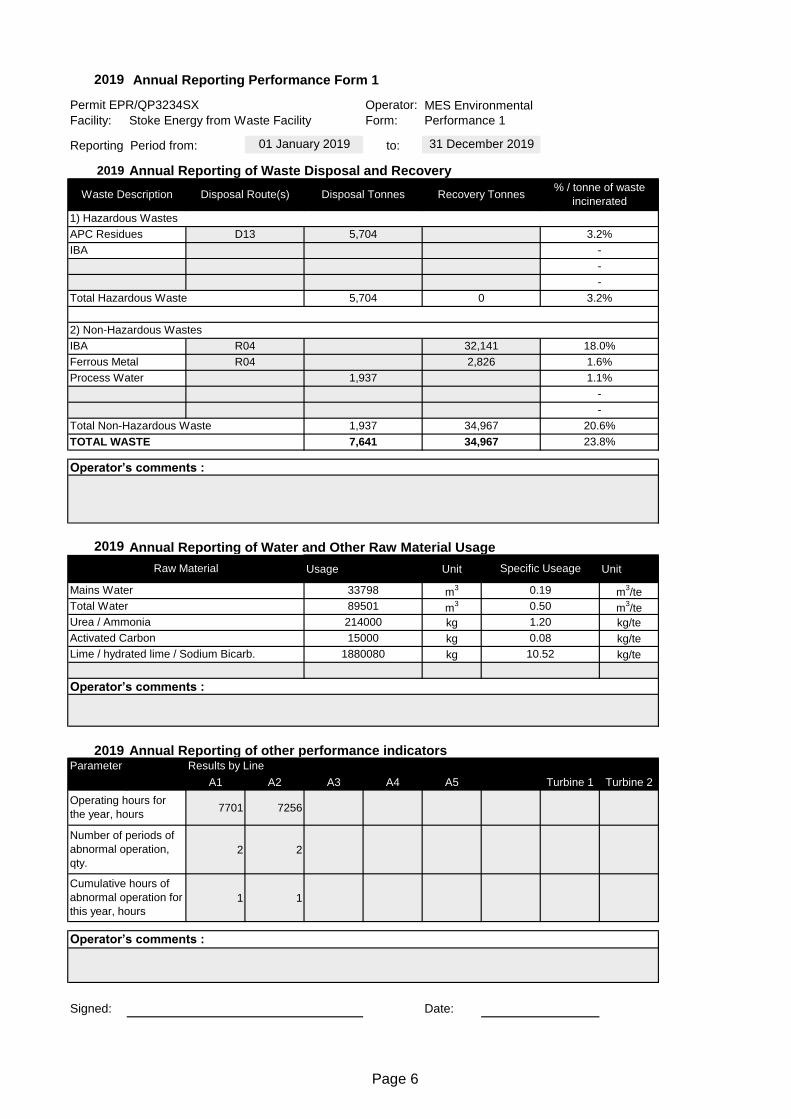
2019 Annual Reporting Performance Form 1
Operator:
Facility: Form: Performance 1
Reporting Period from: to:
2019 Annual Reporting of Waste Disposal and Recovery
2019 Annual Reporting of Water and Other Raw Material Usage
Usage Unit Unit
m3
m3/te
m3
m3/te
kg kg/te
kg kg/te
kg kg/te
2019 Annual Reporting of other performance indicators
A1 A2 A3 A4 A5 Turbine 1 Turbine 2
7701 7256
2 2
1 1
Signed: Date:
Cumulative hours of
abnormal operation for
this year, hours
Operator’s comments :
Operator’s comments :
Parameter Results by Line
Operating hours for
the year, hours
Number of periods of
abnormal operation,
qty.
Lime / hydrated lime / Sodium Bicarb. 1880080 10.52
Urea / Ammonia 214000 1.20
Activated Carbon 15000 0.08
Raw Material Specific Useage
Mains Water 33798 0.19
Total Water 89501 0.50
TOTAL WASTE 7,641 34,967 23.8%
Operator’s comments :
-
Total Non-Hazardous Waste 1,937 34,967 20.6%
Process Water 1,937 1.1%
-
IBA R04 32,141 18.0%
Ferrous Metal R04 2,826 1.6%
2) Non-Hazardous Wastes
-
Total Hazardous Waste 5,704 0 3.2%
IBA -
-
1) Hazardous Wastes
APC Residues D13 5,704 3.2%
Permit EPR/QP3234SX MES Environmental
Stoke Energy from Waste Facility
01 January 2019 31 December 2019
Waste Description Disposal Route(s) Disposal Tonnes Recovery Tonnes% / tonne of waste
incinerated
Page 6
2019 Annual Reporting of Energy Usage/Export
Permit EPR/QP3234SX Operator:
Facility: Form: Energy 1
Reporting Period from: to:
Unit
MWh
MWh
MWh
tonnes
GWh
Signed: Date:
Operator’s comments :
Steam/hot water exported 0 -
Electricity Exported 73,762 413
Gas Oil
Electricity Produced 87,988 492
Electricity Imported 921 5
MES Environmental
Stoke Energy from Waste Facility
01 January 2019 31 December 2019
Energy Source Energy UsageSpecific Useage (KWh/tonne
incinerated
Page 7
Annual Performance Report 2019 Stoke Energy from Waste Facility
Summary of Permit Compliance
Compliance with permit limits for continuously monitored pollutants
The plant met its emission limits as shown in the table below:
Date
18/1/2019
7/6/2019
2/8/2019
7/10/2019
Date
Summary of any complaints received and actions to taken to resolve them.
Summary of any notifications or non-compliances under the permit
Summary of complaint [including
Line/Reference]Reason *
Measures taken to
prevent
reoccurrence
A1, TOC, 1 x half hourly limit Wet waste caused thick
grate
Thorough mixing of
older and new waste
A1, HCl, Daily limit Poor mix of lime Plant settings altered
A1, HCl, 1 x half hourly limit Rogue element of waste Lime supply
increased
Summary of notification or non-compliance
[including Line/Reference]Reason
Measures taken to
prevent
reoccurrence
A1, A2, HCl & SO2 Daily limitContaminated lime
delivery received
Lime supplier contacted,
new procedures
introduced
Hydrogen chloride 99.99% 97.81%
100% 99.54%Average
100% 100%
Total organic carbon 99.99% 100%
* including whether substantiated by the
operator or the EA
Particulates 100% 100%
Substance Percentage time compliant during operation
Half-hourly limit Daily limit
Oxides of nitrogen 100% 100%
Sulphur dioxide 100% 99.45%
Carbon monoxide
Page 8
Annual Performance Report 2019 Stoke Energy from Waste Facility
Summary of Plant Improvements
Summary of any other improvements made to the plant or planned to be made and a summary of the
resulting environmental benefits.
As with boiler 1 in 2019, boiler 2 combustion control is due to be integrated into the distributed control system in May 2020.
The same improvements made to the filter bag cleaning system on boiler 2 are planned to be implemented on boiler 1 in July
2020.
Summary of any efficiency improvements that have been completed within the year.
As a result of the combustion control integration and filter bag cleaning system upgrade on unit 2, the throughput of each boiler
has shown an increase, boiler one by circa 1tonne/hour and boiler two by 0.25tonne/hour.
Additionally, there is an ongoing project focussing on replacing old lighting with energy efficient LED bulbs in progress, with
replacements being made as old units fail.
Summary of any permit improvement conditions that have been completed within the year and the resulting
environmental benefits.
All improvement conditions listed in the permit were completed prior to 2019.
Summary of any changes to the plant or operating techniques which required a variation to the permit and a
summary of the resulting environmental impact.
No variations to the permit were made during 2019.
Page 9
Annual Performance Report 2019 Stoke Energy from Waste Facility
Details of Public & Stakeholder Liasion
Summary of events held during the reporting year.
If you wish to be involved in the public liasion programme, please contact _________________
2020 MESE will continue to meet with its core stakeholders on a monthly basis.
Date Description
Date Description
Across 2019 MESE conducts monthly meetings with its core stakeholders in order discuss operational, health
and safety, and environmental performance.
List of events planned for next year
Page 10
Annual Performance Report 2019 Stoke Energy from Waste Facility
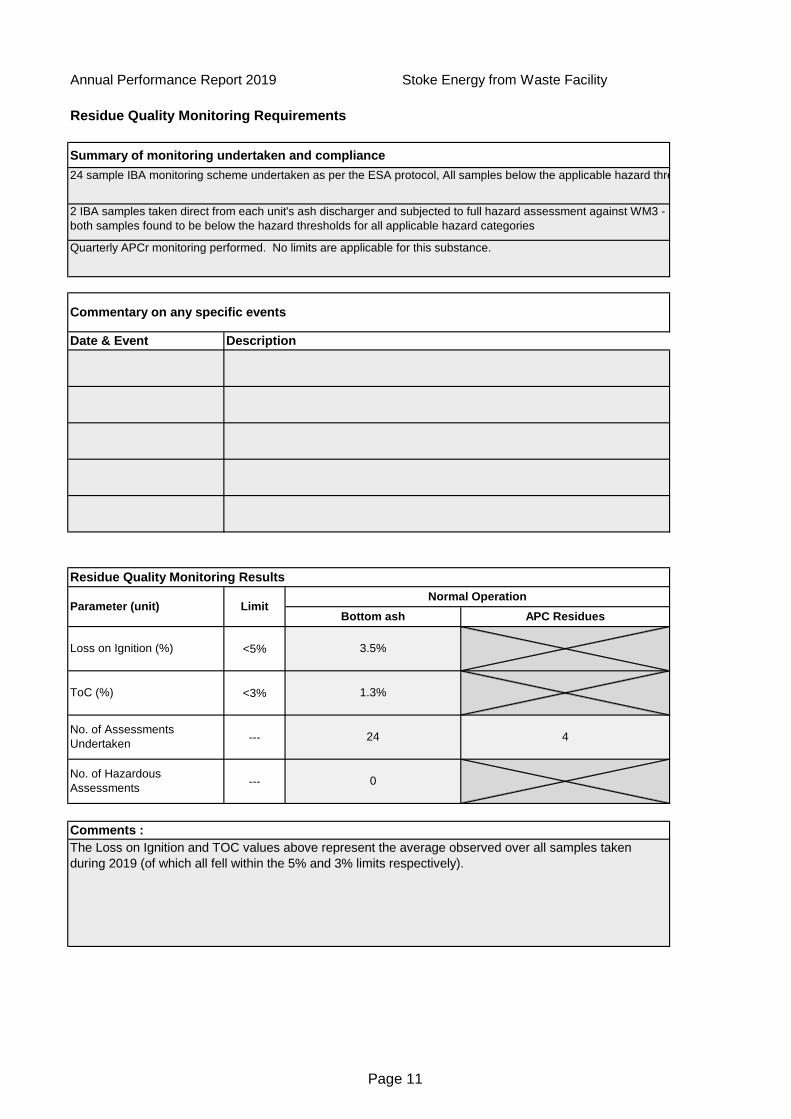
Residue Quality Monitoring Requirements
Summary of monitoring undertaken and compliance
<5%
<3%
---
---
The Loss on Ignition and TOC values above represent the average observed over all samples taken
during 2019 (of which all fell within the 5% and 3% limits respectively).
0
Comments :
Parameter (unit)
Loss on Ignition (%)
ToC (%)
No. of Assessments
Undertaken
No. of Hazardous
Assessments
3.5%
1.3%
424
LimitBottom ash APC Residues
Normal Operation
Residue Quality Monitoring Results
24 sample IBA monitoring scheme undertaken as per the ESA protocol, All samples below the applicable hazard threshold.
2 IBA samples taken direct from each unit's ash discharger and subjected to full hazard assessment against WM3 -
both samples found to be below the hazard thresholds for all applicable hazard categories
Quarterly APCr monitoring performed. No limits are applicable for this substance.
Commentary on any specific events
Date & Event Description
Page 11
Annual Performance Report 2019 Stoke Energy from Waste Facility
Emissions to Water
Summary of monitoring undertaken and compliance
Limit Target Max.
6 - 10 6 - 10 8.2
400 mg/L <400 mg/L 11 mg/L
600 mg/L <600 mg/L 19 mg/L
1000 mg/L<1000
mg/L43.4 mg/L
25 mg/L <25 mg/L 0.67 mg/L
nil nil nil
Sulphate Annual
Phosphorus Annual
Oil Annual
pH Annual
Total Suspended Solids (TSS) Annual
Chemical Oxygen Demand (COD) Annual
Emissions to Water / Sewer
Parameter Monitoring Frequency
Annual sample taken and analysed. All results below limits given in discharge consent.
Waste water from the process is neutralised and recycled as far as is practicible in order to minimise the quantity released to
sewer.
Commentary on any specific events
Date & Event Description
Page 12
Annual Performance Report 2019 Stoke Energy from Waste Facility
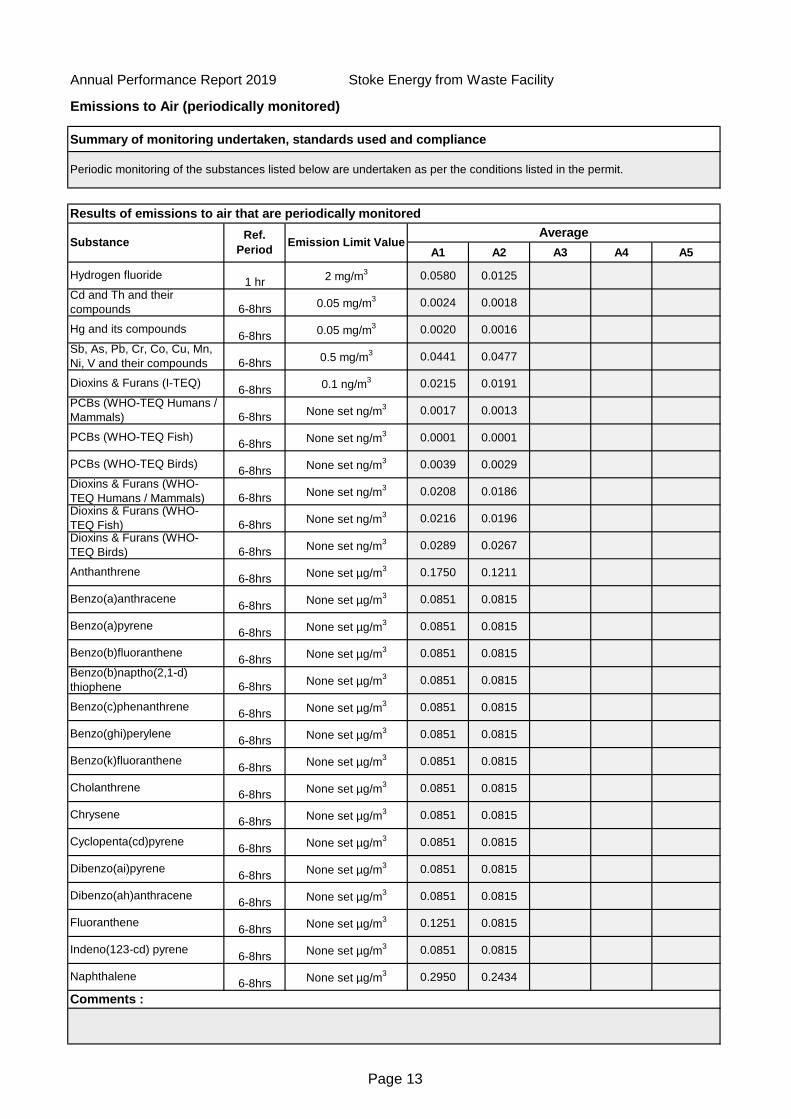
Emissions to Air (periodically monitored)
Summary of monitoring undertaken, standards used and compliance
A1 A2 A3 A4 A5
1 hr0.0580 0.0125
6-8hrs0.0024 0.0018
6-8hrs0.0020 0.0016
6-8hrs0.0441 0.0477
6-8hrs0.0215 0.0191
6-8hrs0.0017 0.0013
6-8hrs0.0001 0.0001
6-8hrs0.0039 0.0029
6-8hrs0.0208 0.0186
6-8hrs0.0216 0.0196
6-8hrs0.0289 0.0267
6-8hrs0.1750 0.1211
6-8hrs0.0851 0.0815
6-8hrs0.0851 0.0815
6-8hrs0.0851 0.0815
6-8hrs0.0851 0.0815
6-8hrs0.0851 0.0815
6-8hrs0.0851 0.0815
6-8hrs0.0851 0.0815
6-8hrs0.0851 0.0815
6-8hrs0.0851 0.0815
6-8hrs0.0851 0.0815
6-8hrs0.0851 0.0815
6-8hrs0.0851 0.0815
6-8hrs0.1251 0.0815
6-8hrs0.0851 0.0815
6-8hrs0.2950 0.2434
None set ng/m3
None set µg/m3
None set µg/m3
None set ng/m3
None set ng/m3
None set ng/m3
None set µg/m3
None set µg/m3
None set µg/m3
None set µg/m3
None set µg/m3
None set µg/m3
None set µg/m3
0.05 mg/m3
0.5 mg/m3
0.1 ng/m3
None set ng/m3
None set ng/m3
Comments :
Dioxins & Furans (WHO-
TEQ Humans / Mammals)Dioxins & Furans (WHO-
TEQ Fish)Dioxins & Furans (WHO-
TEQ Birds)
None set µg/m3
None set µg/m3
Dibenzo(ai)pyrene
Dibenzo(ah)anthracene
Fluoranthene
Indeno(123-cd) pyrene
Benzo(a)pyrene
None set µg/m3
Benzo(b)fluoranthene
Benzo(b)naptho(2,1-d)
thiophene
Anthanthrene
Benzo(a)anthracene
Naphthalene
Benzo(c)phenanthrene
Benzo(ghi)perylene
Benzo(k)fluoranthene
Cholanthrene
Chrysene
Cyclopenta(cd)pyrene
None set µg/m3
None set µg/m3
None set µg/m3
None set µg/m3
PCBs (WHO-TEQ Humans /
Mammals)
PCBs (WHO-TEQ Fish)
PCBs (WHO-TEQ Birds)
Hg and its compounds
Sb, As, Pb, Cr, Co, Cu, Mn,
Ni, V and their compounds
Dioxins & Furans (I-TEQ)
Cd and Th and their
compounds
2 mg/m3
0.05 mg/m3
SubstanceAverage
Emission Limit ValueRef.
Period
Results of emissions to air that are periodically monitored
Periodic monitoring of the substances listed below are undertaken as per the conditions listed in the permit.
Hydrogen fluoride
Page 13
Annual Performance Report 2019 Stoke Energy from Waste Facility
Emissions to Air (continously monitored)
Summary of monitoring undertaken, standards used and compliance
Max. Avg. Max. Avg. Max. Avg. Max. Avg. Max. Avg.
Daily mean 200 mg/m3 191 164 198 168
½ hourly mean 400 mg/m3 243 164 434 168
Particulates Daily mean 10 mg/m3 8 0.8 5 2
½ hourly mean 30 mg/m3 17 0.8 16 2
Total Organic Carbon Daily mean 10 mg/m3 1 0.3 2 0.2
½ hourly mean 20 mg/m3 16 0.3 10 0.2
Hydrogen chloride Daily mean 10 mg/m3 20 7 28 8
½ hourly mean 60 mg/m3 114 7 74 8
Sulphur dioxide Daily mean 50 mg/m3 36 13 51 22
½ hourly mean 200 mg/m3 90 13 226 22
Carbon monoxide Daily mean 50 mg/m3 26 14 54 17
95%ile 10-min
avg *150 mg/m
3 * 687 14 423 17
Ammonia Daily mean No limit set 6 2 53 6
Comments :
* = delete or amend as appropriate
Oxides of nitrogen
Periodic monitoring of the substances listed below are undertaken as per the conditions listed in the permit.
Results of emissions to air that are continuously monitored
SubstanceEmission Limit
Value
Reference
Period
A1 A2 A3 A4 A5
Page 14
Annual Performance Report 2019 Stoke Energy from Waste Facility
Monitoring of Hydrogen Chloride emissions Whole Installation See Notes in Cell Q3
mg/Nm3
20191/2 hourly HCl
ELV
Monthly 1/2
hourly mean
Highest 1/2
hourly maximumDaily HCl ELV
Monthly daily
mean
Highest daily
maximum
Jan 60 8 114 10 8 28
Feb 60 6.5 65 10 6.5 9
Mar 60 7.5 41 10 7.5 10
Apr 60 7.5 38 10 7.5 9
May 60 7.5 41 10 7.5 18
Jun 60 7.5 61 10 7.5 11
Jul 60 8 43 10 8 11
Aug 60 7 63 10 7 9
Sep 60 7.5 50 10 7.5 9
Oct 60 7.5 48 10 7.5 10
Nov 60 7.5 45 10 7.5 9
Dec 60 7 43 10 7 9
1/2 Hourly Reference Periods Daily Reference Periods
Comments :
Jan Feb Mar Apr May Jun Jul Aug Sep Oct Nov Dec
1/2 hourly HCl ELV 60 60 60 60 60 60 60 60 60 60 60 60
Monthly 1/2 hourly mean 8 6.5 7.5 7.5 7.5 7.5 8 7 7.5 7.5 7.5 7
Highest 1/2 hourly maximum 114 65 41 38 41 61 43 63 50 48 45 43
Daily HCl ELV 10 10 10 10 10 10 10 10 10 10 10 10
Monthly daily mean 8 6.5 7.5 7.5 7.5 7.5 8 7 7.5 7.5 7.5 7
Highest daily maximum 28 9 10 9 18 11 11 9 9 10 9 9
0
20
40
60
80
100
120
Co
nce
ntr
atio
n m
g/N
m3
Page 15
Annual Performance Report 2019 Stoke Energy from Waste Facility
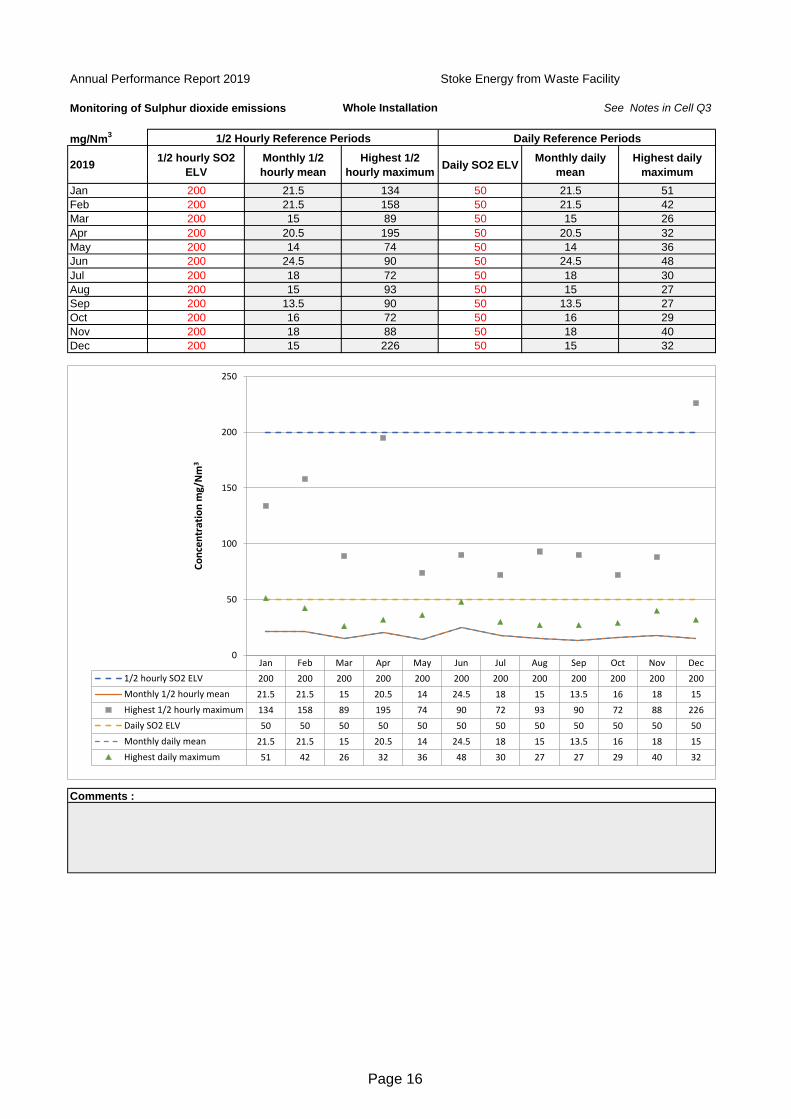
Monitoring of Sulphur dioxide emissions Whole Installation See Notes in Cell Q3
mg/Nm3
20191/2 hourly SO2
ELV
Monthly 1/2
hourly mean
Highest 1/2
hourly maximumDaily SO2 ELV
Monthly daily
mean
Highest daily
maximum
Jan 200 21.5 134 50 21.5 51
Feb 200 21.5 158 50 21.5 42
Mar 200 15 89 50 15 26
Apr 200 20.5 195 50 20.5 32
May 200 14 74 50 14 36
Jun 200 24.5 90 50 24.5 48
Jul 200 18 72 50 18 30
Aug 200 15 93 50 15 27
Sep 200 13.5 90 50 13.5 27
Oct 200 16 72 50 16 29
Nov 200 18 88 50 18 40
Dec 200 15 226 50 15 32
1/2 Hourly Reference Periods Daily Reference Periods
Comments :
Jan Feb Mar Apr May Jun Jul Aug Sep Oct Nov Dec
1/2 hourly SO2 ELV 200 200 200 200 200 200 200 200 200 200 200 200
Monthly 1/2 hourly mean 21.5 21.5 15 20.5 14 24.5 18 15 13.5 16 18 15
Highest 1/2 hourly maximum 134 158 89 195 74 90 72 93 90 72 88 226
Daily SO2 ELV 50 50 50 50 50 50 50 50 50 50 50 50
Monthly daily mean 21.5 21.5 15 20.5 14 24.5 18 15 13.5 16 18 15
Highest daily maximum 51 42 26 32 36 48 30 27 27 29 40 32
0
50
100
150
200
250
Co
nce
ntr
atio
n m
g/N
m3
Page 16
Annual Performance Report 2019 Stoke Energy from Waste Facility
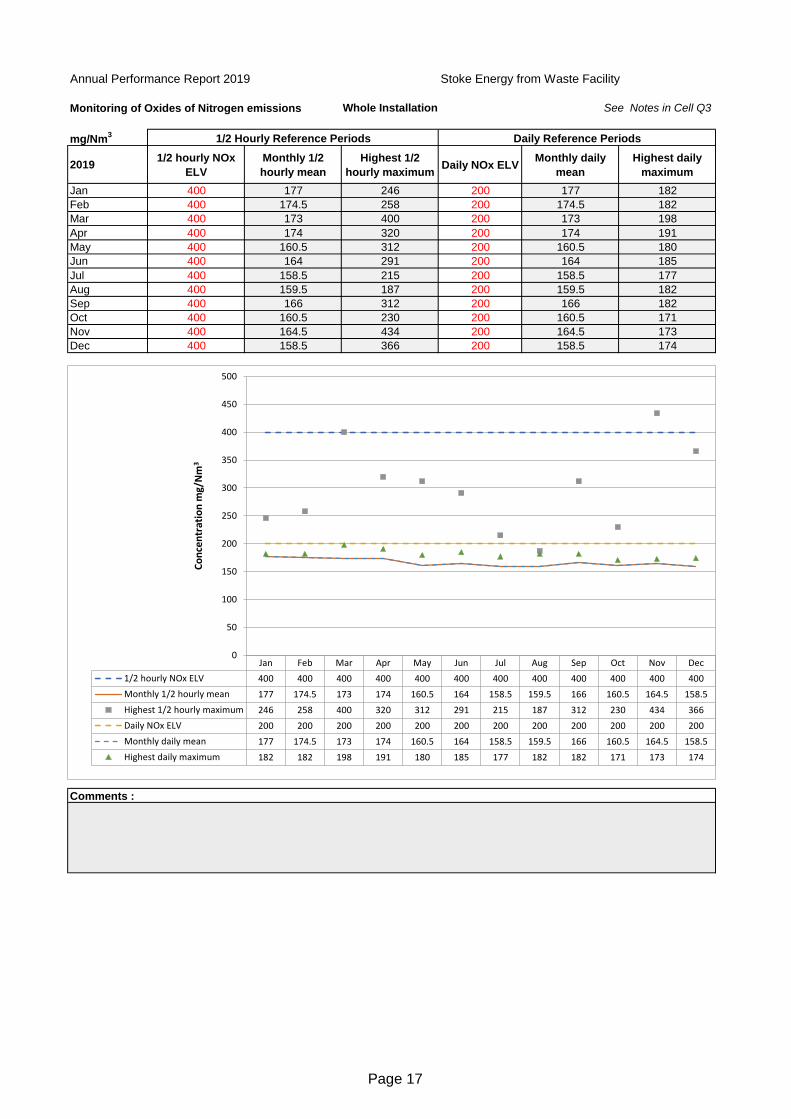
Monitoring of Oxides of Nitrogen emissions Whole Installation See Notes in Cell Q3
mg/Nm3
20191/2 hourly NOx
ELV
Monthly 1/2
hourly mean
Highest 1/2
hourly maximumDaily NOx ELV
Monthly daily
mean
Highest daily
maximum
Jan 400 177 246 200 177 182
Feb 400 174.5 258 200 174.5 182
Mar 400 173 400 200 173 198
Apr 400 174 320 200 174 191
May 400 160.5 312 200 160.5 180
Jun 400 164 291 200 164 185
Jul 400 158.5 215 200 158.5 177
Aug 400 159.5 187 200 159.5 182
Sep 400 166 312 200 166 182
Oct 400 160.5 230 200 160.5 171
Nov 400 164.5 434 200 164.5 173
Dec 400 158.5 366 200 158.5 174
1/2 Hourly Reference Periods Daily Reference Periods
Comments :
Jan Feb Mar Apr May Jun Jul Aug Sep Oct Nov Dec
1/2 hourly NOx ELV 400 400 400 400 400 400 400 400 400 400 400 400
Monthly 1/2 hourly mean 177 174.5 173 174 160.5 164 158.5 159.5 166 160.5 164.5 158.5
Highest 1/2 hourly maximum 246 258 400 320 312 291 215 187 312 230 434 366
Daily NOx ELV 200 200 200 200 200 200 200 200 200 200 200 200
Monthly daily mean 177 174.5 173 174 160.5 164 158.5 159.5 166 160.5 164.5 158.5
Highest daily maximum 182 182 198 191 180 185 177 182 182 171 173 174
0
50
100
150
200
250
300
350
400
450
500
Co
nce
ntr
atio
n m
g/N
m3
Page 17
Annual Performance Report 2019 Stoke Energy from Waste Facility
Monitoring of Total organic carbon emissions Whole Installation See Notes in Cell Q3
mg/Nm3
20191/2 hourly TOC
ELV
Monthly 1/2
hourly mean
Highest 1/2
hourly maximumDaily TOC ELV
Monthly daily
mean
Highest daily
maximum
Jan 20 0.5 4 10 0.5 1
Feb 20 0.5 1 10 0.5 1
Mar 20 0 5 10 0 1
Apr 20 0 0 10 0 0
May 20 0.5 16 10 0.5 1
Jun 20 0 10 10 0 1
Jul 20 0 9 10 0 1
Aug 20 0.5 6 10 0.5 1
Sep 20 0.5 7 10 0.5 2
Oct 20 0 6 10 0 1
Nov 20 0 4 10 0 1
Dec 20 0 4 10 0 1
1/2 Hourly Reference Periods Daily Reference Periods
Comments :
Jan Feb Mar Apr May Jun Jul Aug Sep Oct Nov Dec
1/2 hourly TOC ELV 20 20 20 20 20 20 20 20 20 20 20 20
Monthly 1/2 hourly mean 0.5 0.5 0 0 0.5 0 0 0.5 0.5 0 0 0
Highest 1/2 hourly maximum 4 1 5 0 16 10 9 6 7 6 4 4
Daily TOC ELV 10 10 10 10 10 10 10 10 10 10 10 10
Monthly daily mean 0.5 0.5 0 0 0.5 0 0 0.5 0.5 0 0 0
Highest daily maximum 1 1 1 0 1 1 1 1 2 1 1 1
0
5
10
15
20
25
Co
nce
ntr
atio
n m
g/N
m3
Page 18
Annual Performance Report 2019 Stoke Energy from Waste Facility
Monitoring of Particulate matter emissions Whole Installation See Notes in Cell Q3
mg/Nm3
20191/2 hourly PM
ELV
Monthly 1/2
hourly mean
Highest 1/2
hourly maximumDaily PM ELV
Monthly daily
mean
Highest daily
maximum
Jan 30 0.5 16 10 0.5 4
Feb 30 0.5 15 10 0.5 1
Mar 30 1 11 10 1 3
Apr 30 1.5 17 10 1.5 8
May 30 1 8 10 1 2
Jun 30 1.5 15 10 1.5 3
Jul 30 1.5 12 10 1.5 3
Aug 30 1.5 10 10 1.5 4
Sep 30 1.5 10 10 1.5 3
Oct 30 1.5 14 10 1.5 5
Nov 30 2 9 10 2 4
Dec 30 1.5 9 10 1.5 4
1/2 Hourly Reference Periods Daily Reference Periods
Comments :
Jan Feb Mar Apr May Jun Jul Aug Sep Oct Nov Dec
1/2 hourly PM ELV 30 30 30 30 30 30 30 30 30 30 30 30
Monthly 1/2 hourly mean 0.5 0.5 1 1.5 1 1.5 1.5 1.5 1.5 1.5 2 1.5
Highest 1/2 hourly maximum 16 15 11 17 8 15 12 10 10 14 9 9
Daily PM ELV 10 10 10 10 10 10 10 10 10 10 10 10
Monthly daily mean 0.5 0.5 1 1.5 1 1.5 1.5 1.5 1.5 1.5 2 1.5
Highest daily maximum 4 1 3 8 2 3 3 4 3 5 4 4
0
5
10
15
20
25
30
35
Co
nce
ntr
atio
n m
g/N
m3
Page 19
Annual Performance Report 2019 Stoke Energy from Waste Facility
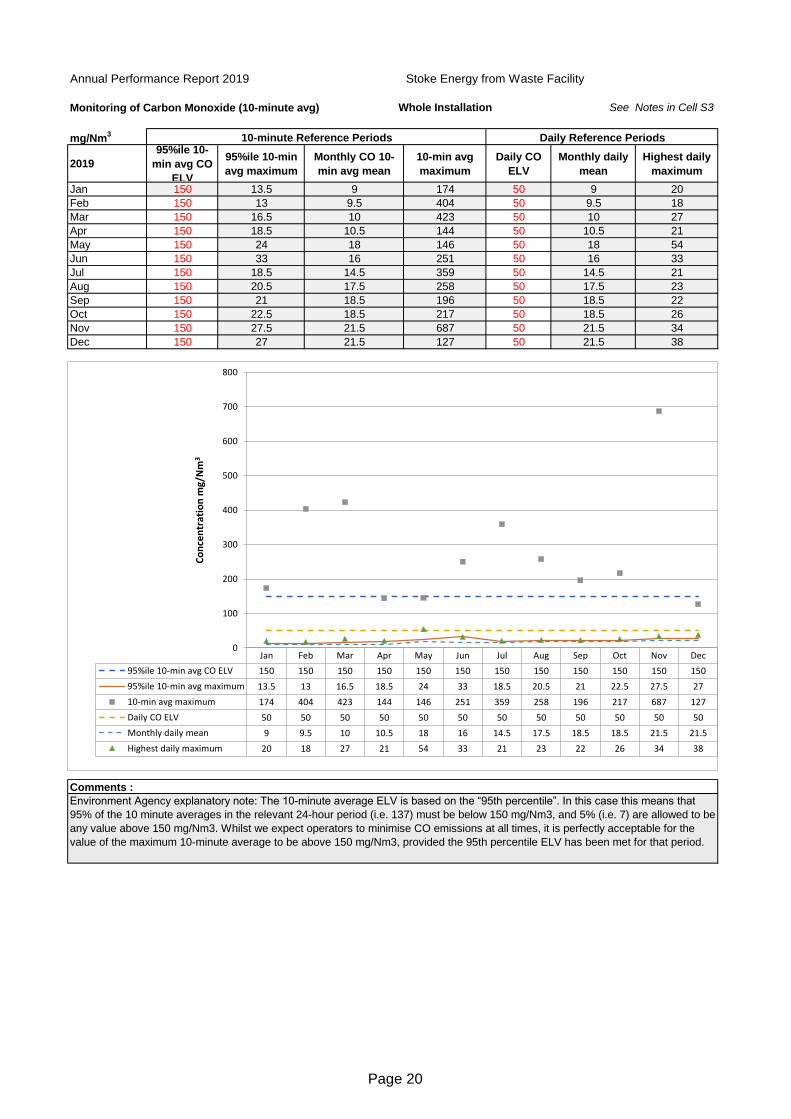
Monitoring of Carbon Monoxide (10-minute avg) Whole Installation See Notes in Cell S3
mg/Nm3
2019
95%ile 10-
min avg CO
ELV
95%ile 10-min
avg maximum
Monthly CO 10-
min avg mean
10-min avg
maximum
Daily CO
ELV
Monthly daily
mean
Highest daily
maximum
Jan 150 13.5 9 174 50 9 20
Feb 150 13 9.5 404 50 9.5 18
Mar 150 16.5 10 423 50 10 27
Apr 150 18.5 10.5 144 50 10.5 21
May 150 24 18 146 50 18 54
Jun 150 33 16 251 50 16 33
Jul 150 18.5 14.5 359 50 14.5 21
Aug 150 20.5 17.5 258 50 17.5 23
Sep 150 21 18.5 196 50 18.5 22
Oct 150 22.5 18.5 217 50 18.5 26
Nov 150 27.5 21.5 687 50 21.5 34
Dec 150 27 21.5 127 50 21.5 38
10-minute Reference Periods Daily Reference Periods
Comments :
Environment Agency explanatory note: The 10-minute average ELV is based on the “95th percentile”. In this case this means that
95% of the 10 minute averages in the relevant 24-hour period (i.e. 137) must be below 150 mg/Nm3, and 5% (i.e. 7) are allowed to be
any value above 150 mg/Nm3. Whilst we expect operators to minimise CO emissions at all times, it is perfectly acceptable for the
value of the maximum 10-minute average to be above 150 mg/Nm3, provided the 95th percentile ELV has been met for that period.
Jan Feb Mar Apr May Jun Jul Aug Sep Oct Nov Dec
95%ile 10-min avg CO ELV 150 150 150 150 150 150 150 150 150 150 150 150
95%ile 10-min avg maximum 13.5 13 16.5 18.5 24 33 18.5 20.5 21 22.5 27.5 27
10-min avg maximum 174 404 423 144 146 251 359 258 196 217 687 127
Daily CO ELV 50 50 50 50 50 50 50 50 50 50 50 50
Monthly daily mean 9 9.5 10 10.5 18 16 14.5 17.5 18.5 18.5 21.5 21.5
Highest daily maximum 20 18 27 21 54 33 21 23 22 26 34 38
0
100
200
300
400
500
600
700
800
Co
nce
ntr
atio
n m
g/N
m3
Page 20
Annual Performance Report 2019 Stoke Energy from Waste Facility
Monitoring of Ammonia emissions Whole Installation See Notes in Cell Q3
mg/Nm3
20191/2 hourly NH3
ELV
Monthly 1/2
hourly mean
Highest 1/2
hourly maximumDaily NH3 ELV
Monthly daily
mean
Highest daily
maximum
Jan 0 3.5 45 10 3.5 8
Feb 0 4 16 10 4 7
Mar 0 4.5 180 10 4.5 53
Apr 0 1 12 10 1 4
May 0 2 12 10 2 7
Jun 0 6.5 64 10 6.5 20
Jul 0 5.5 58 10 5.5 18
Aug 0 2.5 38 10 2.5 8
Sep 0 3.5 16 10 3.5 8
Oct 0 4 63 10 4 16
Nov 0 6.5 81 10 6.5 45
Dec 0 6 79 10 6 33
1/2 Hourly Reference Periods Daily Reference Periods
Comments :
An indicated ELV value of zero in the table above means that no ammonia limit is set in the permit.
Jan Feb Mar Apr May Jun Jul Aug Sep Oct Nov Dec
1/2 hourly NH3 ELV 0 0 0 0 0 0 0 0 0 0 0 0
Monthly 1/2 hourly mean 3.5 4 4.5 1 2 6.5 5.5 2.5 3.5 4 6.5 6
Highest 1/2 hourly maximum 45 16 180 12 12 64 58 38 16 63 81 79
Daily NH3 ELV 10 10 10 10 10 10 10 10 10 10 10 10
Monthly daily mean 3.5 4 4.5 1 2 6.5 5.5 2.5 3.5 4 6.5 6
Highest daily maximum 8 7 53 4 7 20 18 8 8 16 45 33
0
20
40
60
80
100
120
140
160
180
200
Co
nce
ntr
atio
n m
g/N
m3
Page 21