National Aeronautics and Space Administration ANNUAL PROCUREMENT REPORT Fiscal Year 2015 Photo: Pluto from New Horizons Image credit: NASA/Johns Hopkins University Applied Physics Laboratory/Southwest Research Institute
Transcript
National Aeronautics and Space Administration
ANNUAL
PROCUREMENT
REPORT
Fiscal Year 2015
Photo: Pluto from New Horizons Image credit: NASA/Johns Hopkins University Applied Physics Laboratory/Southwest Research Institute
ii
INTRODUCTION
This report presents summary data on all NASA procurement actions and detailed information on contracts, grants,
cooperative agreements and other procurements awarded by NASA during Fiscal Year 2015 using appropriated funds.
All data was pulled from the Federal Procurement Data System (FPDS)* with the exception of awards made through
other Government agencies, which was obtained from NASA’s financial system.
“Procurement action,” as used in this report, means a contractual action to obtain supplies, services or construction that
increases or decreases funds. A procurement action, thus, may be a new procurement or a modification such as a
supplemental agreement, change order or termination to an existing contract that changes the total amount of funds
obligated. An obligation is a contractual commitment to pay for supplies or services that are specified in the contract.
(See Glossary for more information.)
The Annual Procurement Report is available via the internet on the Procurement homepage. The address is
http://www.hq.nasa.gov/office/procurement/. The report was prepared by the Analysis Division, Office of
Procurement, NASA Headquarters. Inquiries should be addressed in writing to:
National Aeronautics and Space Administration Office of Procurement Washington, DC 20546
*Data as of November 2015
iii
TABLE OF CONTENTS
Contents INTRODUCTION ....................................................................................................................................................................... ii
TABLE OF CONTENTS .............................................................................................................................................................. iii
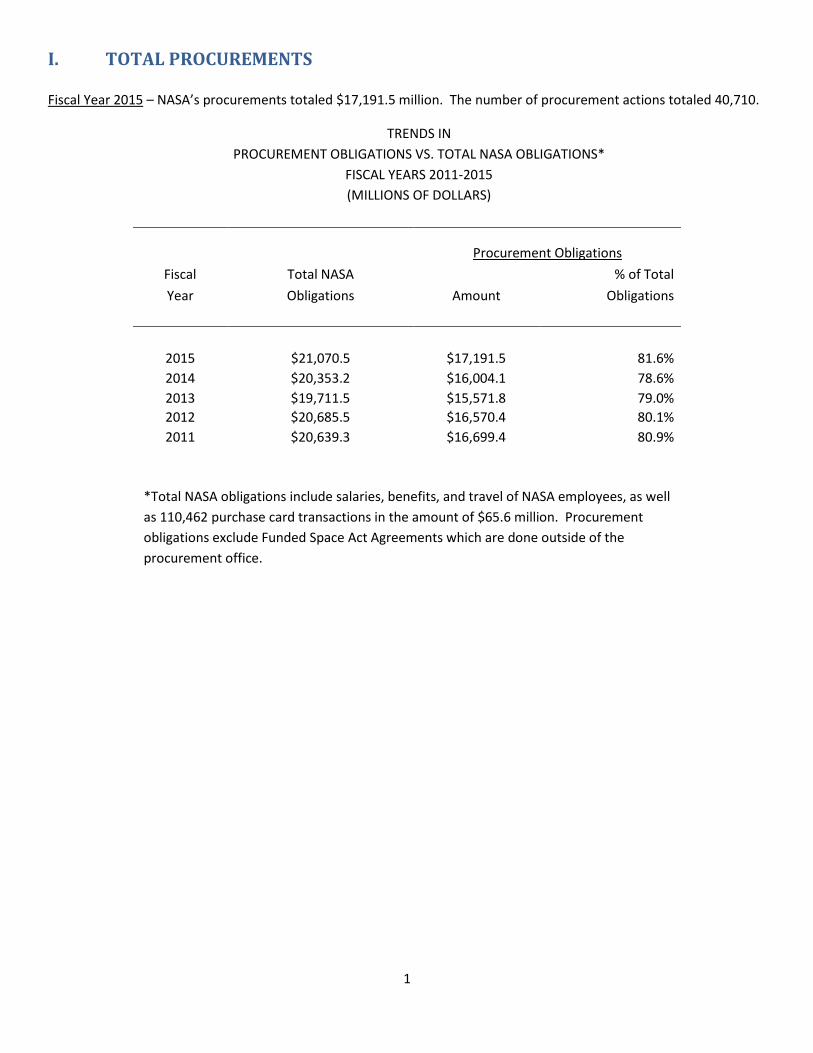
I. TOTAL PROCUREMENTS ................................................................................................................................................ 1
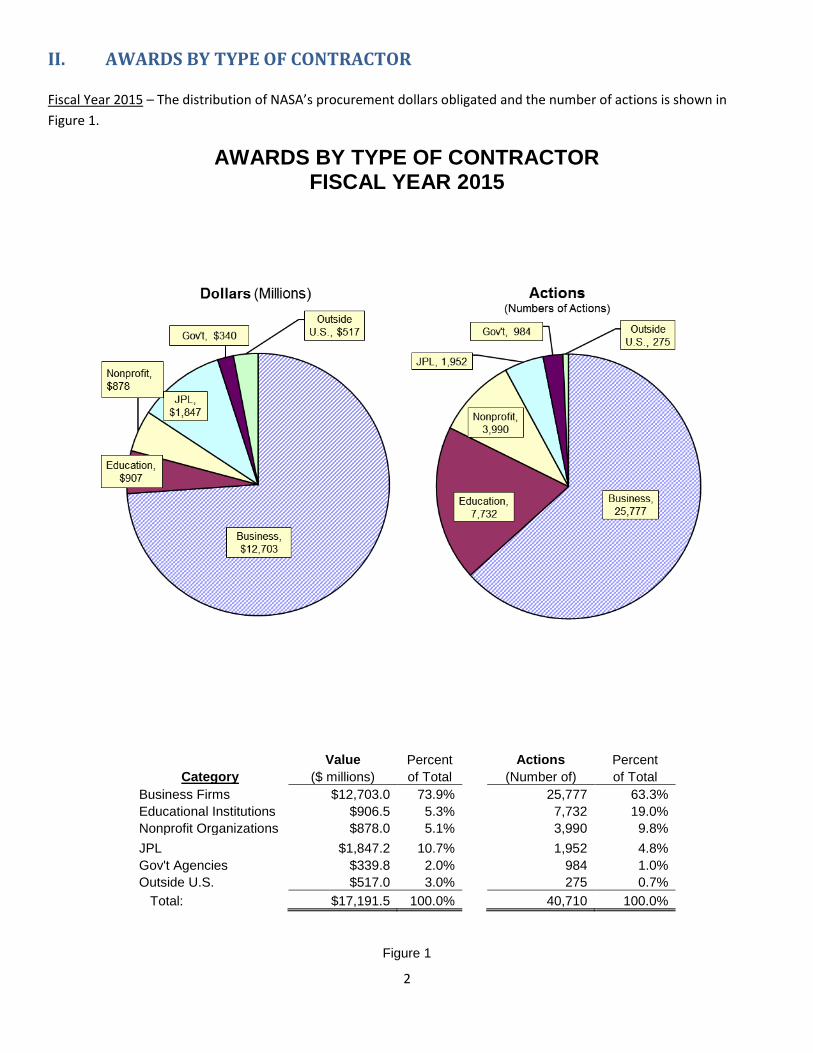
II. AWARDS BY TYPE OF CONTRACTOR ............................................................................................................................. 2
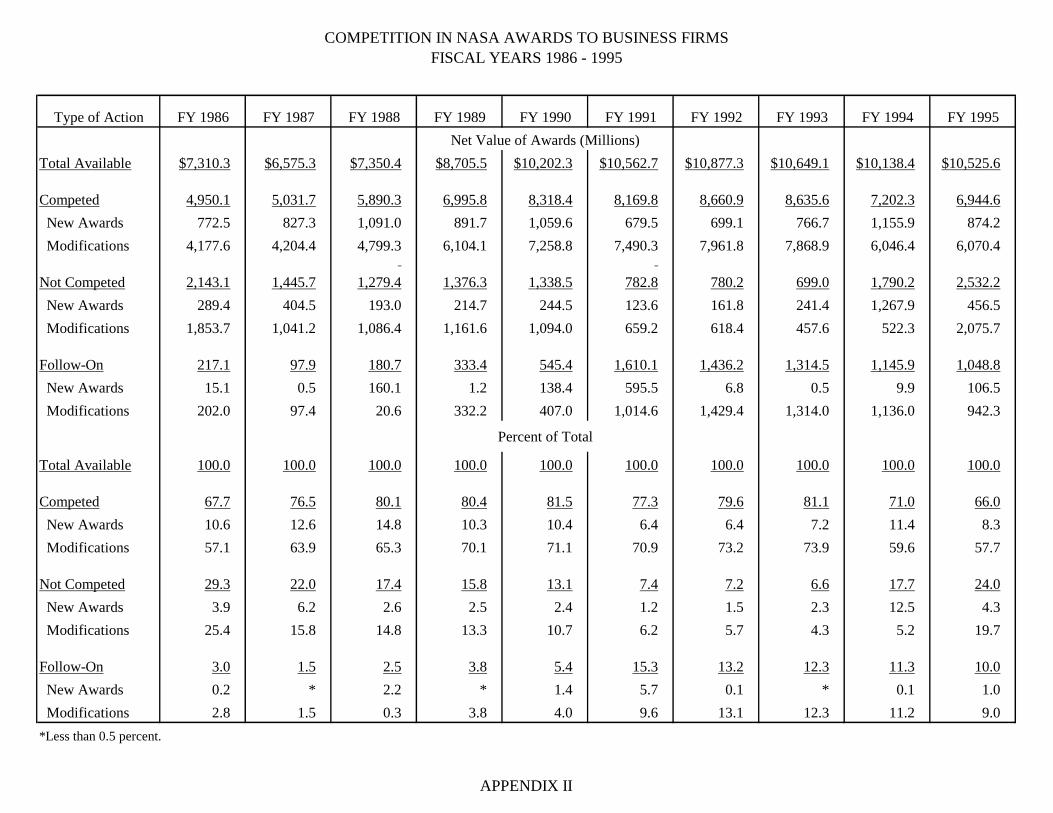
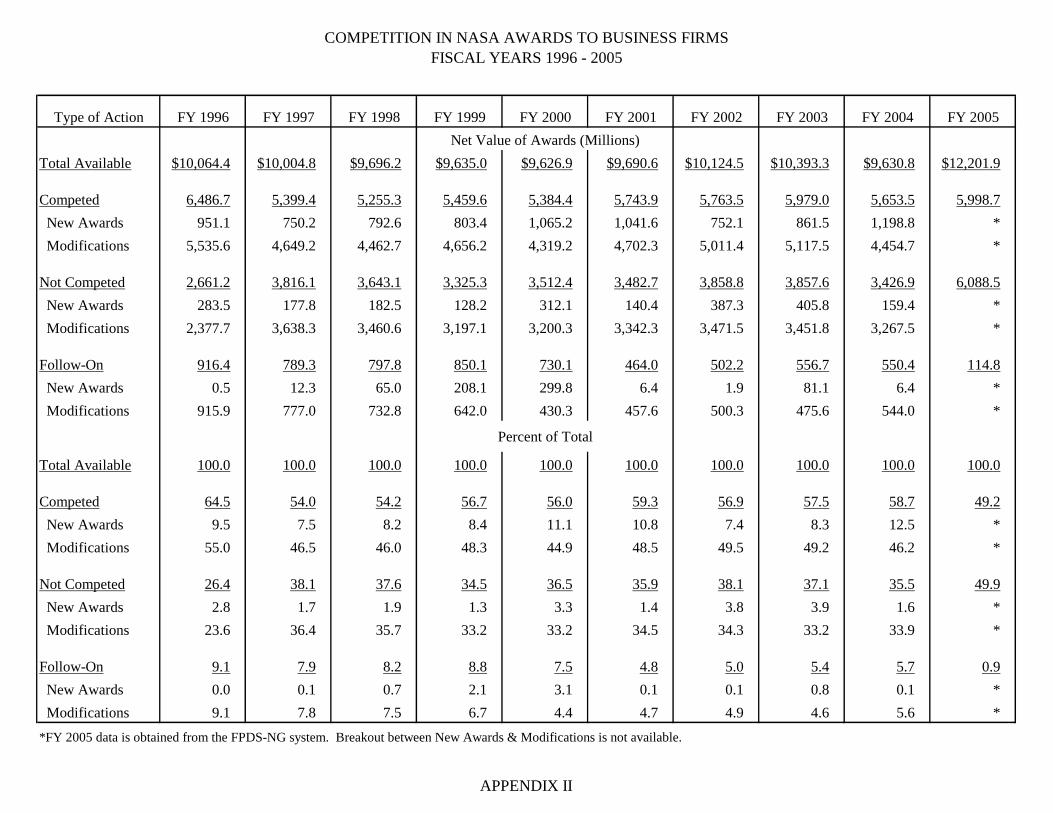
III. COMPETITION IN NASA AWARDS.................................................................................................................................. 3
A. Competition in Contracting Act ................................................................................................................................ 3
B. Reporting of Competition......................................................................................................................................... 3
C. Competition During Fiscal Year 2015 ....................................................................................................................... 3
IV. AWARDS TO BUSINESS FIRMS ....................................................................................................................................... 6
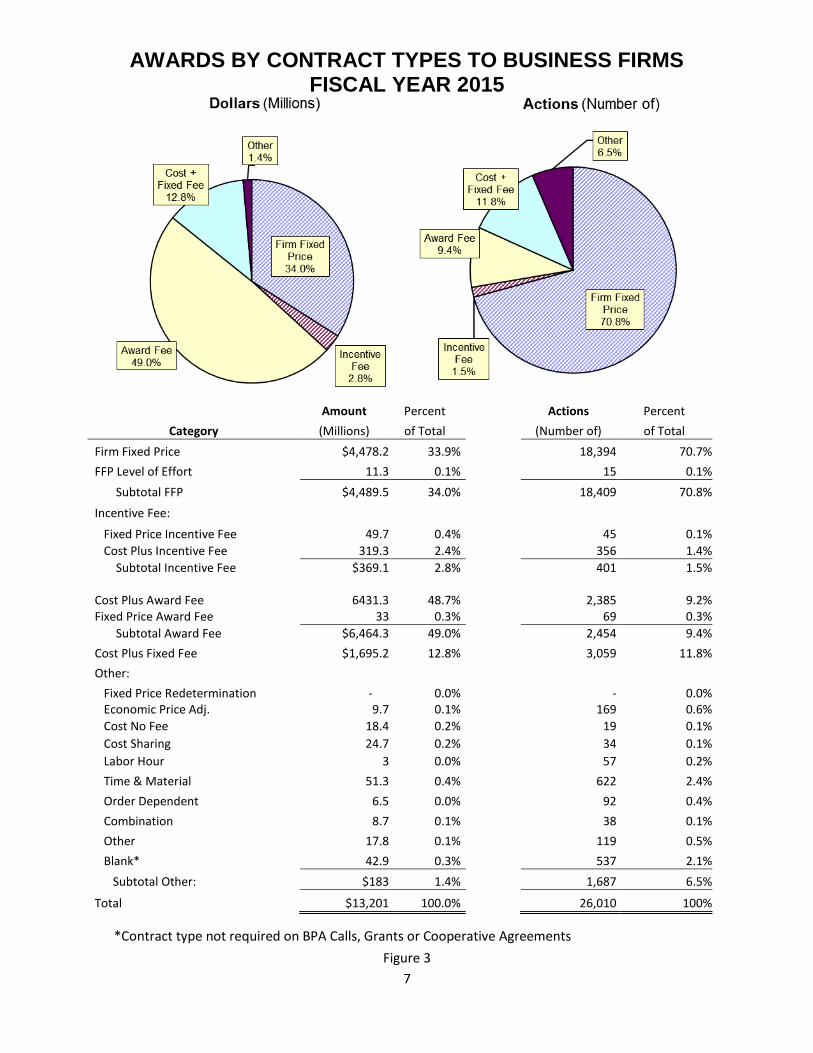
A. Awards by Contract Type ......................................................................................................................................... 6
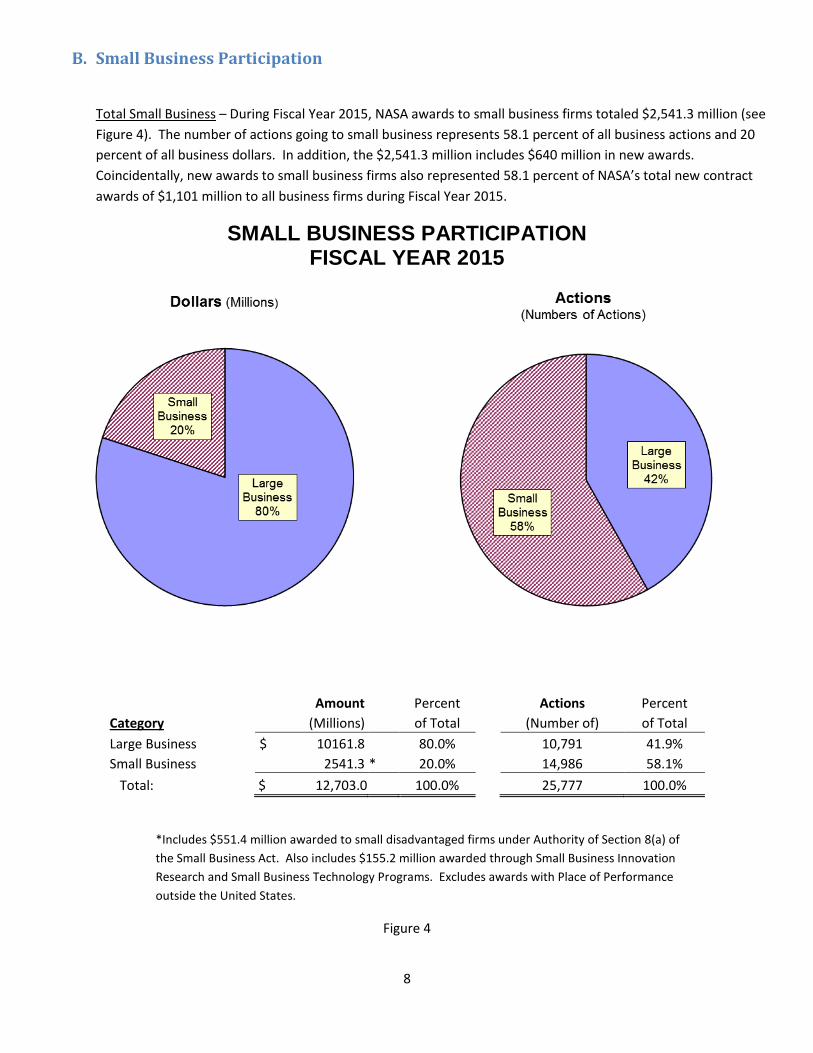
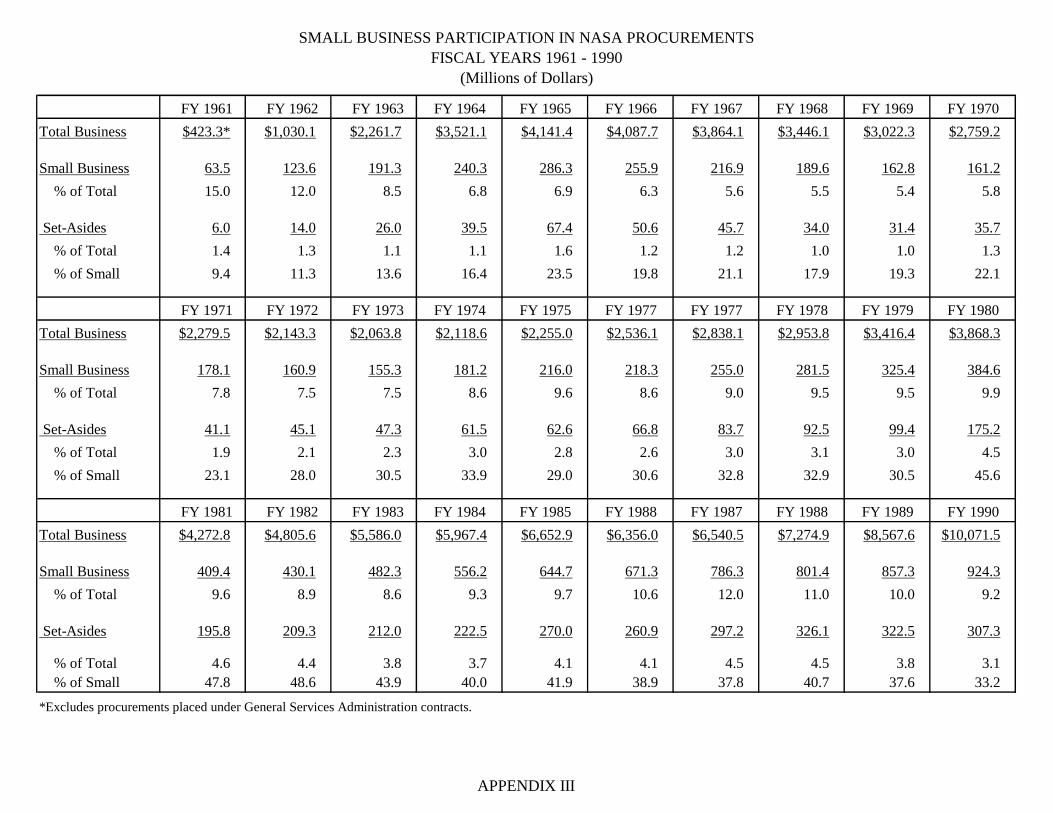
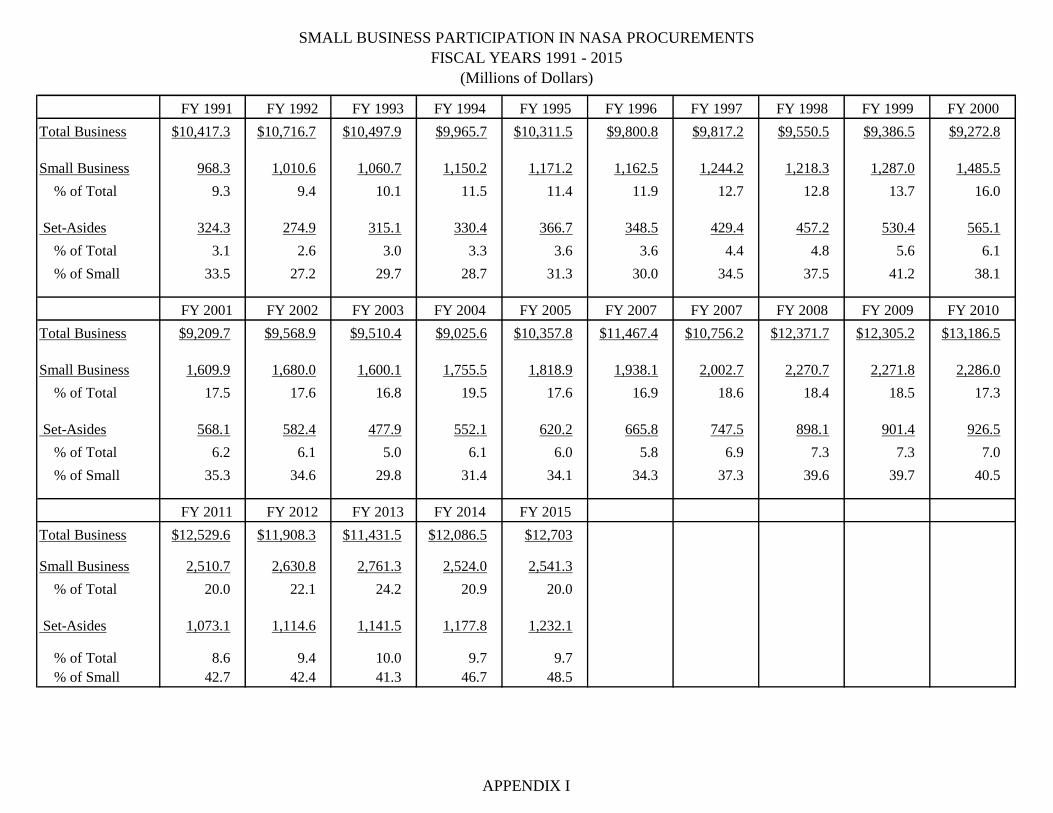
B. Small Business Participation ..................................................................................................................................... 8
C. Extent of Competition in Small Business Awards ................................................................................................... 10
D. Small Disadvantaged Business Participation .......................................................................................................... 11
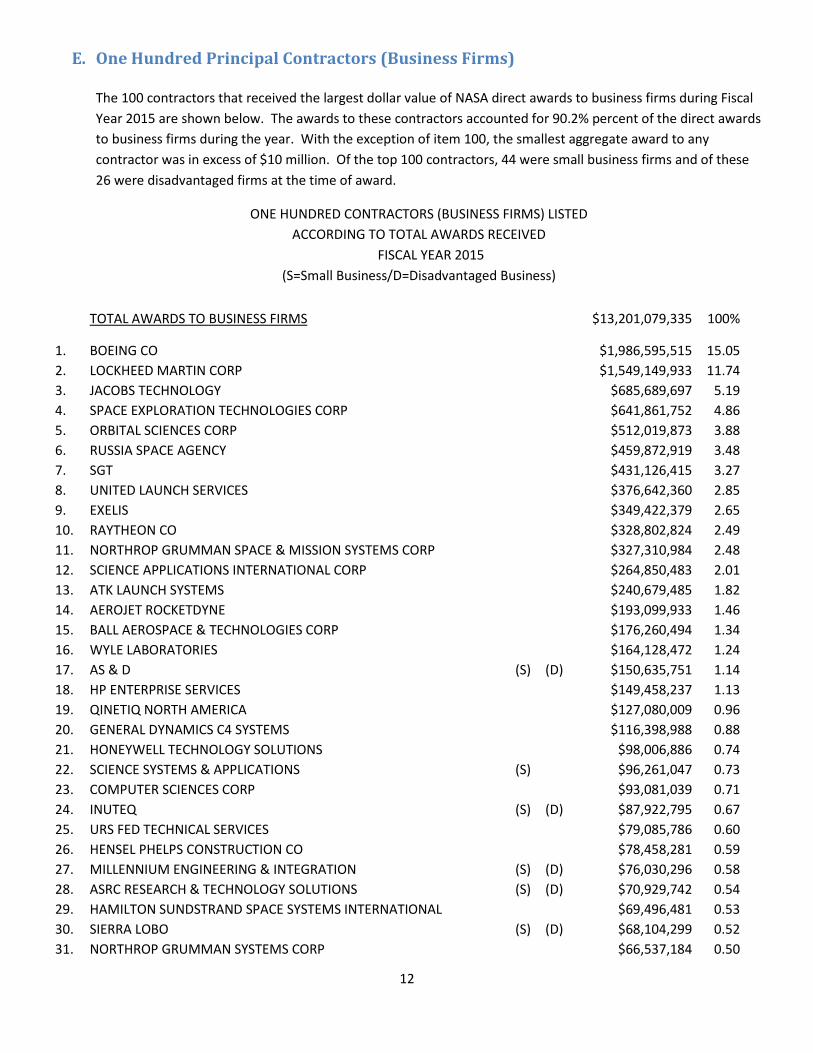
E. One Hundred Principal Contractors (Business Firms) ............................................................................................ 12
V. CONTRACT FOR OPERATION OF THE JET PROPULSION LABORATORY........................................................................ 15
VI. AWARDS TO EDUCATIONAL AND OTHER NONPROFIT INSTITUTIONS ........................................................................ 15
A. Distribution by Type of Institution and Award ....................................................................................................... 15
B. One Hundred Principal Educational & Nonprofit Institutions ................................................................................ 16
VII. AWARDS BY TYPE OF EFFORT ...................................................................................................................................... 19
VIII. AWARDS THROUGH OTHER GOVERNMENT AGENCIES .............................................................................................. 20
IX. U.S. GEOGRAPHICAL DISTRIBUTION OF AWARDS ....................................................................................................... 20
X. AWARDS PLACED OUTSIDE THE UNITED STATES ........................................................................................................ 24
XI. PROCUREMENT ACTIVITY BY INSTALLATION .............................................................................................................. 25
71. COMMONWEALTH SCIENTIFIC & INDUSTRIAL RESEARCH ORGANISATION $18,405,957 0.14
14
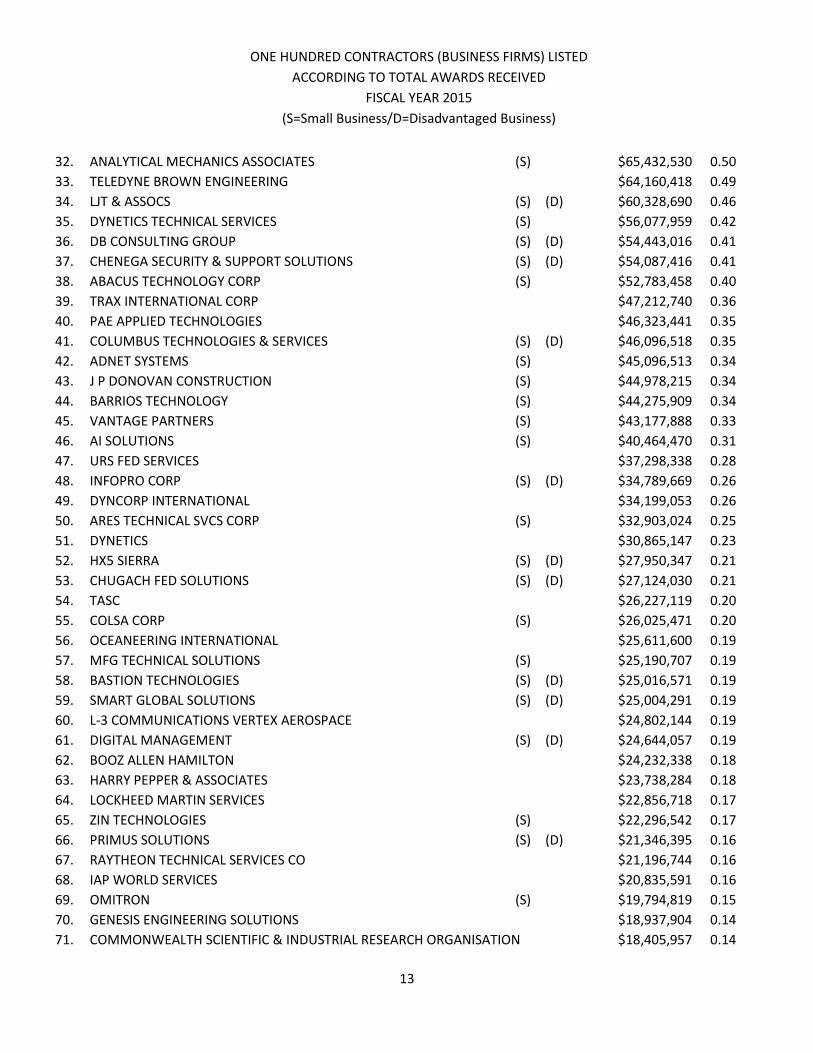
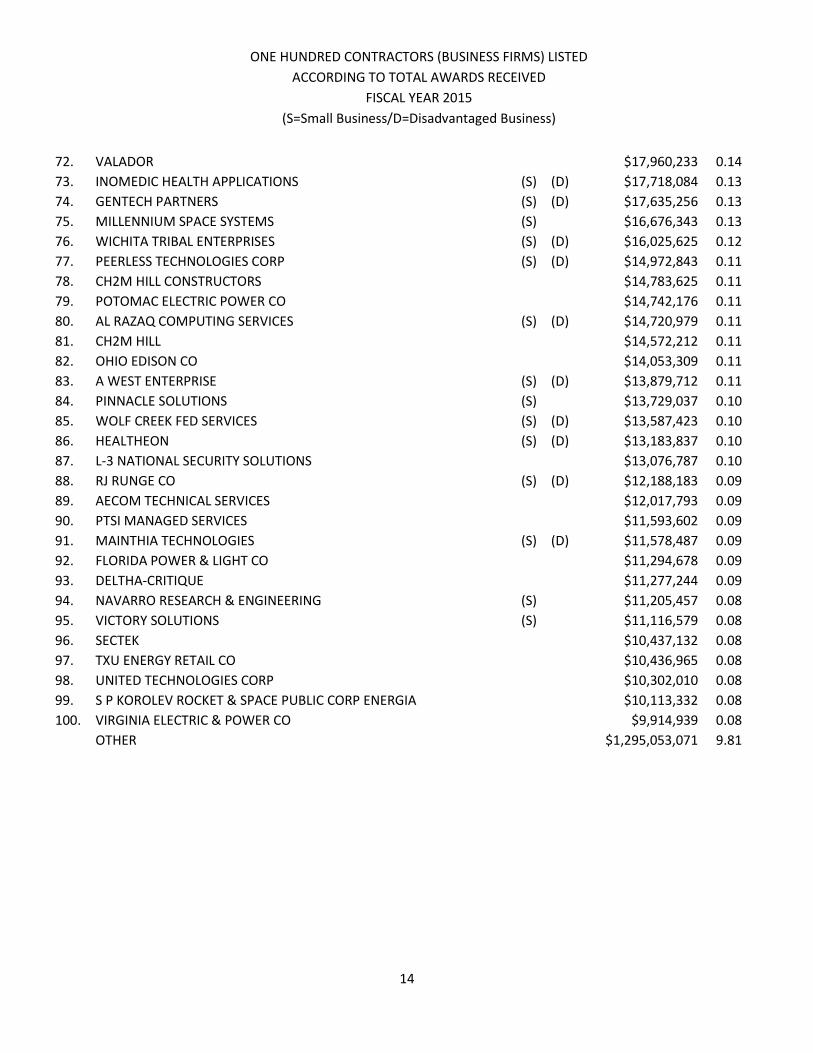
ONE HUNDRED CONTRACTORS (BUSINESS FIRMS) LISTED
ACCORDING TO TOTAL AWARDS RECEIVED
FISCAL YEAR 2015
(S=Small Business/D=Disadvantaged Business)
72. VALADOR $17,960,233 0.14
73. INOMEDIC HEALTH APPLICATIONS (S) (D) $17,718,084 0.13
74. GENTECH PARTNERS (S) (D) $17,635,256 0.13
75. MILLENNIUM SPACE SYSTEMS (S) $16,676,343 0.13
76. WICHITA TRIBAL ENTERPRISES (S) (D) $16,025,625 0.12
77. PEERLESS TECHNOLOGIES CORP (S) (D) $14,972,843 0.11
78. CH2M HILL CONSTRUCTORS $14,783,625 0.11
79. POTOMAC ELECTRIC POWER CO $14,742,176 0.11
80. AL RAZAQ COMPUTING SERVICES (S) (D) $14,720,979 0.11
81. CH2M HILL $14,572,212 0.11
82. OHIO EDISON CO $14,053,309 0.11
83. A WEST ENTERPRISE (S) (D) $13,879,712 0.11
84. PINNACLE SOLUTIONS (S) $13,729,037 0.10
85. WOLF CREEK FED SERVICES (S) (D) $13,587,423 0.10
86. HEALTHEON (S) (D) $13,183,837 0.10
87. L-3 NATIONAL SECURITY SOLUTIONS $13,076,787 0.10
88. RJ RUNGE CO (S) (D) $12,188,183 0.09
89. AECOM TECHNICAL SERVICES $12,017,793 0.09
90. PTSI MANAGED SERVICES $11,593,602 0.09
91. MAINTHIA TECHNOLOGIES (S) (D) $11,578,487 0.09
92. FLORIDA POWER & LIGHT CO $11,294,678 0.09
93. DELTHA-CRITIQUE $11,277,244 0.09
94. NAVARRO RESEARCH & ENGINEERING (S) $11,205,457 0.08
95. VICTORY SOLUTIONS (S) $11,116,579 0.08
96. SECTEK $10,437,132 0.08
97. TXU ENERGY RETAIL CO $10,436,965 0.08
98. UNITED TECHNOLOGIES CORP $10,302,010 0.08
99. S P KOROLEV ROCKET & SPACE PUBLIC CORP ENERGIA $10,113,332 0.08
100. VIRGINIA ELECTRIC & POWER CO $9,914,939 0.08
OTHER $1,295,053,071 9.81
15
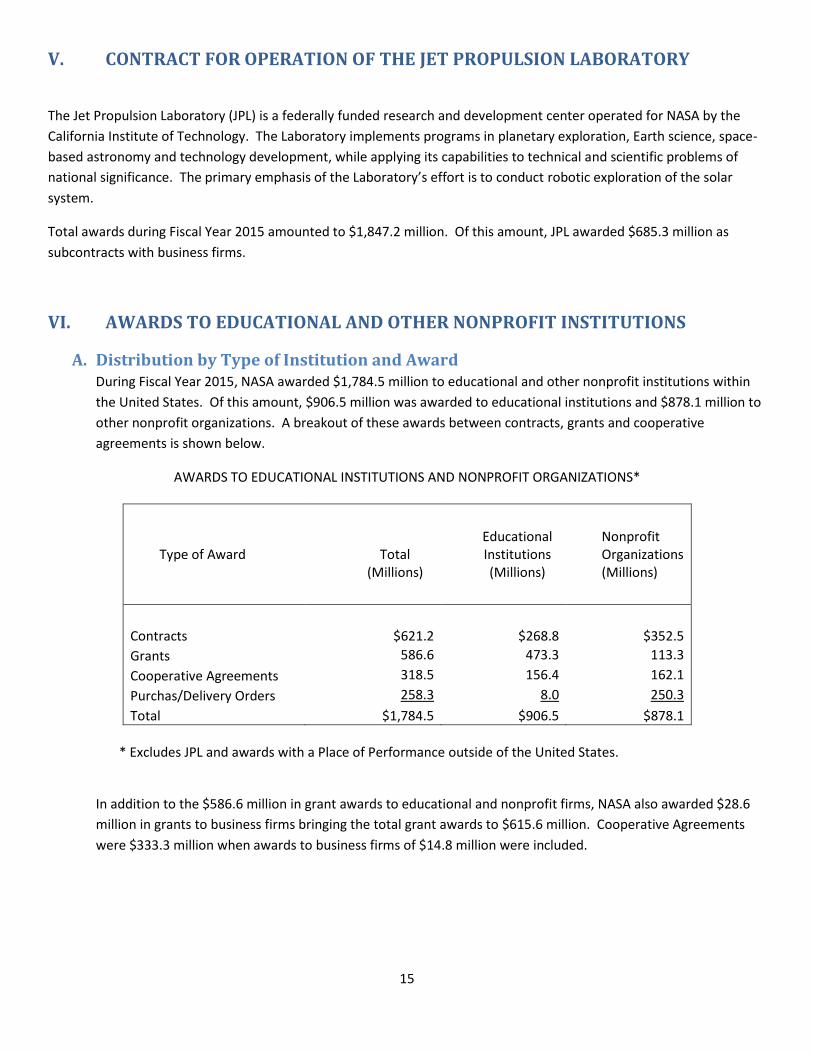
V. CONTRACT FOR OPERATION OF THE JET PROPULSION LABORATORY
The Jet Propulsion Laboratory (JPL) is a federally funded research and development center operated for NASA by the
California Institute of Technology. The Laboratory implements programs in planetary exploration, Earth science, space-
based astronomy and technology development, while applying its capabilities to technical and scientific problems of
national significance. The primary emphasis of the Laboratory’s effort is to conduct robotic exploration of the solar
system.
Total awards during Fiscal Year 2015 amounted to $1,847.2 million. Of this amount, JPL awarded $685.3 million as
subcontracts with business firms.
VI. AWARDS TO EDUCATIONAL AND OTHER NONPROFIT INSTITUTIONS
A. Distribution by Type of Institution and Award During Fiscal Year 2015, NASA awarded $1,784.5 million to educational and other nonprofit institutions within
the United States. Of this amount, $906.5 million was awarded to educational institutions and $878.1 million to
other nonprofit organizations. A breakout of these awards between contracts, grants and cooperative
agreements is shown below.
AWARDS TO EDUCATIONAL INSTITUTIONS AND NONPROFIT ORGANIZATIONS*
Type of Award
Total (Millions)
Educational Institutions (Millions)
Nonprofit Organizations (Millions)
Contracts $621.2 $268.8 $352.5
Grants 586.6 473.3 113.3
Cooperative Agreements 318.5 156.4 162.1
Purchas/Delivery Orders 258.3 8.0 250.3
Total $1,784.5 $906.5 $878.1
* Excludes JPL and awards with a Place of Performance outside of the United States.
In addition to the $586.6 million in grant awards to educational and nonprofit firms, NASA also awarded $28.6
million in grants to business firms bringing the total grant awards to $615.6 million. Cooperative Agreements
were $333.3 million when awards to business firms of $14.8 million were included.
16
B. One Hundred Principal Educational & Nonprofit Institutions
The 100 educational and nonprofit institutions that received the largest dollar value of NASA awards during Fiscal
Year 2015 are shown below.*
The awards to these institutions accounted for 91.25 percent of the total awards to educational and nonprofit
institutions during the period. Of the top 100, 65 were educational institutions; 35 were nonprofit organizations.
*Excludes JPL
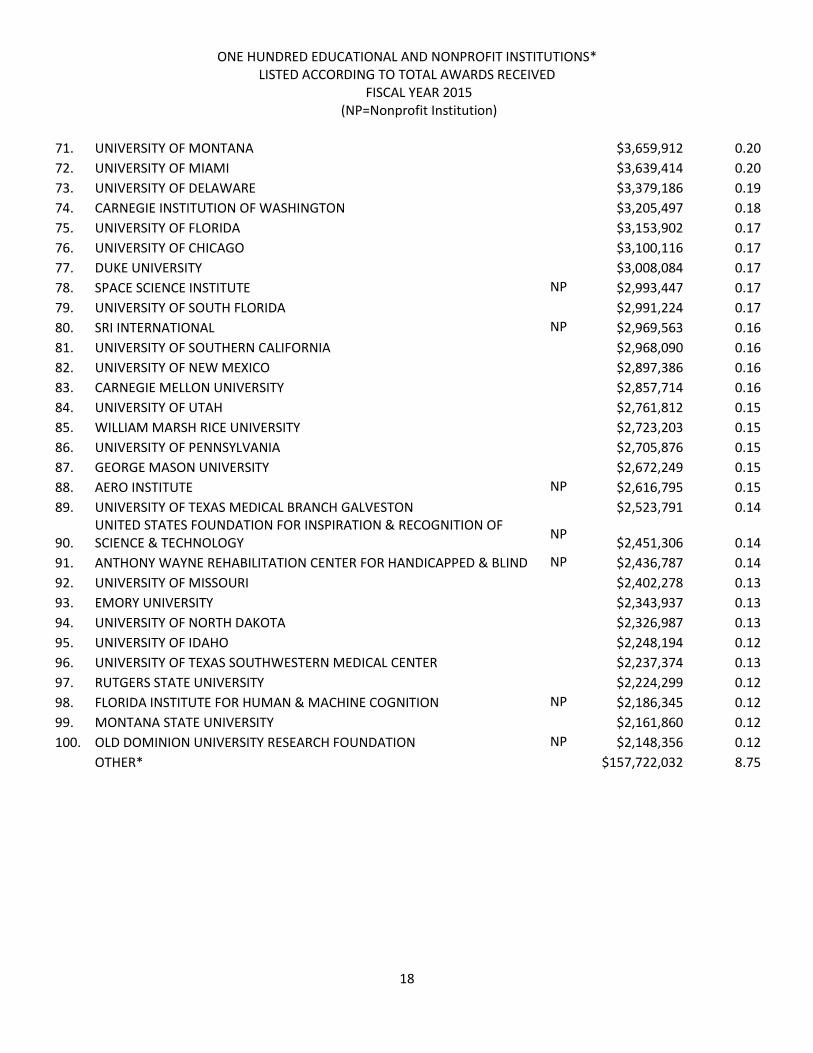
ONE HUNDRED EDUCATIONAL AND NONPROFIT INSTITUTIONS*
LISTED ACCORDING TO TOTAL AWARDS RECEIVED
FISCAL YEAR 2015
(NP=Nonprofit Institution)
TOTAL AWARDS TO EDUCATIONAL & NONPROFIT $1,803,465,520 100%
1. JOHNS HOPKINS UNIVERSITY $214,047,526 11.87
2. UNIVERSITY OF CALIFORNIA $160,913,529 8.92
3. ASSOCIATION OF UNIVERSITIES FOR RESEARCH IN ASTRONOMY NP $143,755,793 7.97
4. UNIVERSITIES SPACE RESEARCH ASSOCIATION NP $98,499,327 5.46
5. SMITHSONIAN INSTITUTION NP $73,150,924 4.06
6. UNIVERSITY OF COLORADO $65,790,275 3.65
7. SOUTHWEST RESEARCH INSTITUTE NP $59,571,903 3.30
8. UNIVERSITY OF MARYLAND $57,418,792 3.18
9. MASSACHUSETTS INSTITUTE OF TECHNOLOGY $38,933,765 2.16
10. UNIVERSITY OF ARIZONA $34,845,294 1.93
11. AEROSPACE CORP NP $33,282,689 1.85
12. UNIVERSITY OF ALABAMA $25,543,637 1.42
13. NATIONAL INSTITUTE OF AEROSPACE ASSOCIATES NP $23,879,586 1.32
14. UNIVERSITY OF MICHIGAN $22,101,645 1.23
15. UNIVERSITY OF HAWAII $20,564,297 1.14
16. SAN JOSE STATE UNIVERSITY RESEARCH FOUNDATION NP $20,286,106 1.12
17. COLUMBIA UNIVERSITY $20,197,941 1.12
18. UNIVERSITY OF CENTRAL FLORIDA $18,021,246 1.00
19. BAY AREA ENVIRONMENTAL RESEARCH INSTITUTE NP $17,322,985 0.96
20. OAK RIDGE ASSOCIATED UNIVERSITIES NP $17,197,338 0.95
21. ARIZONA STATE UNIVERSITY $16,934,416 0.94
22. INSTITUTO NACIONAL DE TECNICA AEROESPACIAL NP $16,503,842 0.92
23. BAYLOR COLLEGE OF MEDICINE $15,328,340 0.85
24. UNIVERSITY OF ALASKA $15,087,061 0.84
25. UNIVERSITY OF TEXAS $15,083,096 0.84
26. CENTER FOR THE ADVANCEMENT OF SCIENCE IN SPACE NP $15,000,000 0.83
27. STANFORD UNIVERSITY $14,142,267 0.78
28. TEXAS A & M UNIVERSITY $13,351,320 0.74
29. UNIVERSITY CORP FOR ATMOSPHERIC RESEARCH NP $12,256,938 0.68
30. UNIVERSITY OF WASHINGTON $11,664,566 0.65
17
ONE HUNDRED EDUCATIONAL AND NONPROFIT INSTITUTIONS*
LISTED ACCORDING TO TOTAL AWARDS RECEIVED FISCAL YEAR 2015
(NP=Nonprofit Institution)
31. SETI INSTITUTE NP $11,363,916 0.63
32. CALIFORNIA INSTITUTE OF TECHNOLOGY $11,207,264 0.62
33. UNIVERSITY OF WISCONSIN $11,172,931 0.62
34. NEW MEXICO STATE UNIVERSITY $10,668,154 0.59
35. PENNSYLVANIA STATE UNIVERSITY $10,281,710 0.57
36. UNIVERSITY OF NEW HAMPSHIRE $9,556,837 0.53
37. UNIVERSITY OF ILLINOIS $8,001,632 0.44
38. OREGON STATE UNIVERSITY $7,923,982 0.44
39. COLORADO STATE UNIVERSITY $7,700,396 0.43
40. GEORGIA TECH RESEARCH CORP NP $7,657,363 0.42
41. VIRGINIA COMMERCIAL SPACE FLIGHT AUTHORITY NP $7,655,000 0.42
42. HARVARD COLLEGE $7,303,185 0.40
43. CATHOLIC UNIVERSITY OF AMERICA $7,037,571 0.39
44. NATIONAL ACADEMY OF SCIENCES NP $6,858,957 0.38
45. WASHINGTON UNIVERSITY $6,802,975 0.38
46. PLANETARY SCIENCE INSTITUTE NP $6,262,867 0.35
47. BREVARD ACHIEVEMENT CENTER NP $6,202,691 0.34
48. HAMPTON UNIVERSITY $6,095,632 0.34
49. MELWOOD HORTICULTURAL TRAINING CENTER NP $6,050,243 0.34
50. PURDUE UNIVERSITY $5,489,905 0.30
51. PRINCETON UNIVERSITY $5,419,019 0.30
52. WEST VIRGINIA UNIVERSITY RESEARCH CORP NP $5,337,362 0.30
57. LOGISTICS MANAGEMENT INSTITUTE NP $4,983,203 0.28
58. CITY OF HAMPTON NP $4,946,002 0.27
59. RESEARCH FOUNDATION STATE UNIVERSITY OF NEW YORK NP $4,890,130 0.27
60. OHIO STATE UNIVERSITY $4,869,287 0.27
61. BERMUDA INSTITUTE OF OCEAN SCIENCES NP $4,744,565 0.26
62. UNIVERSITY OF MINNESOTA $4,683,252 0.26
63. UNIVERSITY OF MASSACHUSETTS $4,529,797 0.25
64. BRIGHAM YOUNG UNIVERSITY $3,983,581 0.22
65. BROWN UNIVERSITY $3,941,860 0.22
66. SOUTH DAKOTA STATE UNIVERSITY $3,870,657 0.21
67. UNIVERSITY OF OKLAHOMA $3,863,555 0.21
68. CHARLES STARK DRAPER LABORATORY NP $3,857,389 0.21
69. CALIFORNIA ASSOCIATION FOR RESEARCH IN ASTRONOMY NP $3,813,000 0.21
70. UNIVERSITY OF NEBRASKA $3,795,893 0.21
18
ONE HUNDRED EDUCATIONAL AND NONPROFIT INSTITUTIONS* LISTED ACCORDING TO TOTAL AWARDS RECEIVED
FISCAL YEAR 2015 (NP=Nonprofit Institution)
71. UNIVERSITY OF MONTANA $3,659,912 0.20
72. UNIVERSITY OF MIAMI $3,639,414 0.20
73. UNIVERSITY OF DELAWARE $3,379,186 0.19
74. CARNEGIE INSTITUTION OF WASHINGTON NP $3,205,497 0.18
75. UNIVERSITY OF FLORIDA $3,153,902 0.17
76. UNIVERSITY OF CHICAGO $3,100,116 0.17
77. DUKE UNIVERSITY $3,008,084 0.17
78. SPACE SCIENCE INSTITUTE NP $2,993,447 0.17
79. UNIVERSITY OF SOUTH FLORIDA $2,991,224 0.17
80. SRI INTERNATIONAL NP $2,969,563 0.16
81. UNIVERSITY OF SOUTHERN CALIFORNIA $2,968,090 0.16
82. UNIVERSITY OF NEW MEXICO $2,897,386 0.16
83. CARNEGIE MELLON UNIVERSITY $2,857,714 0.16
84. UNIVERSITY OF UTAH $2,761,812 0.15
85. WILLIAM MARSH RICE UNIVERSITY $2,723,203 0.15
86. UNIVERSITY OF PENNSYLVANIA $2,705,876 0.15
87. GEORGE MASON UNIVERSITY $2,672,249 0.15
88. AERO INSTITUTE NP $2,616,795 0.15
89. UNIVERSITY OF TEXAS MEDICAL BRANCH GALVESTON $2,523,791 0.14
90. UNITED STATES FOUNDATION FOR INSPIRATION & RECOGNITION OF SCIENCE & TECHNOLOGY
NP $2,451,306 0.14
91. ANTHONY WAYNE REHABILITATION CENTER FOR HANDICAPPED & BLIND NP $2,436,787 0.14
92. UNIVERSITY OF MISSOURI $2,402,278 0.13
93. EMORY UNIVERSITY $2,343,937 0.13
94. UNIVERSITY OF NORTH DAKOTA $2,326,987 0.13
95. UNIVERSITY OF IDAHO $2,248,194 0.12
96. UNIVERSITY OF TEXAS SOUTHWESTERN MEDICAL CENTER $2,237,374 0.13
97. RUTGERS STATE UNIVERSITY $2,224,299 0.12
98. FLORIDA INSTITUTE FOR HUMAN & MACHINE COGNITION NP $2,186,345 0.12
99. MONTANA STATE UNIVERSITY $2,161,860 0.12
100. OLD DOMINION UNIVERSITY RESEARCH FOUNDATION NP $2,148,356 0.12
OTHER* $157,722,032 8.75
19
VII. AWARDS BY TYPE OF EFFORT
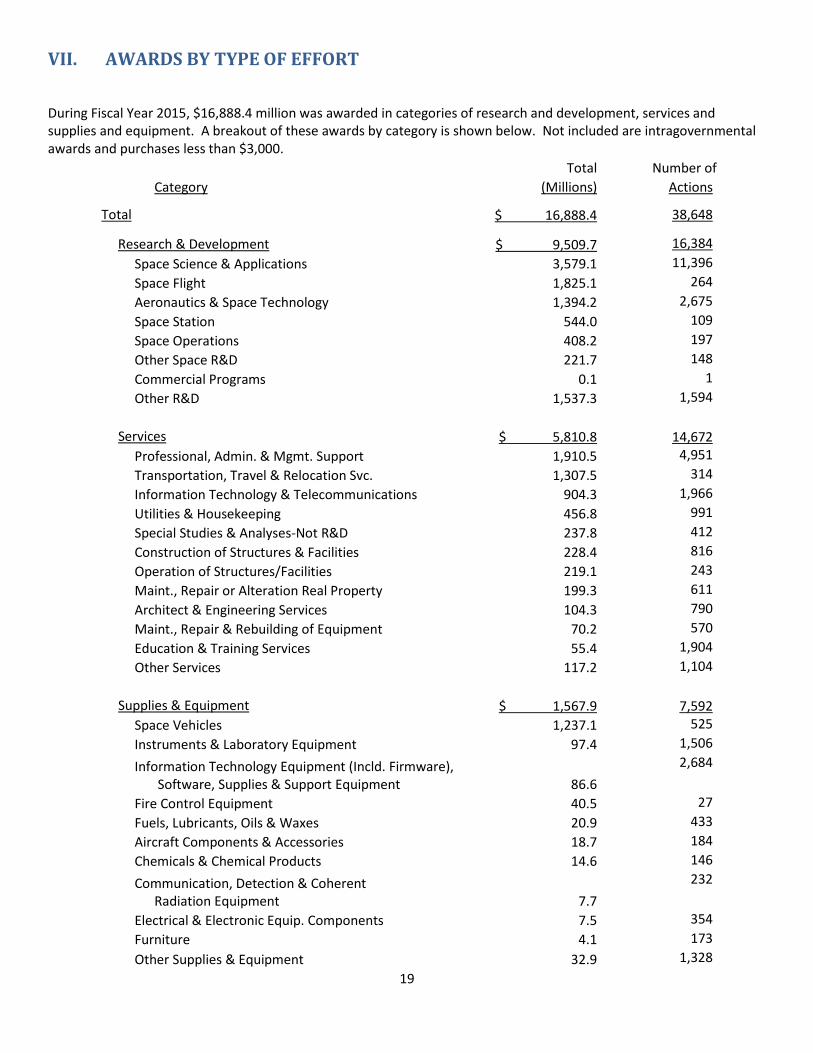
During Fiscal Year 2015, $16,888.4 million was awarded in categories of research and development, services and supplies and equipment. A breakout of these awards by category is shown below. Not included are intragovernmental awards and purchases less than $3,000.
Total Number of
Category (Millions) Actions
Total $ 16,888.4 38,648
Research & Development $ 9,509.7 16,384
Space Science & Applications 3,579.1 11,396
Space Flight 1,825.1 264
Aeronautics & Space Technology 1,394.2 2,675
Space Station 544.0 109
Space Operations 408.2 197
Other Space R&D 221.7 148
Commercial Programs 0.1 1
Other R&D 1,537.3 1,594
Services $ 5,810.8 14,672
Professional, Admin. & Mgmt. Support 1,910.5 4,951
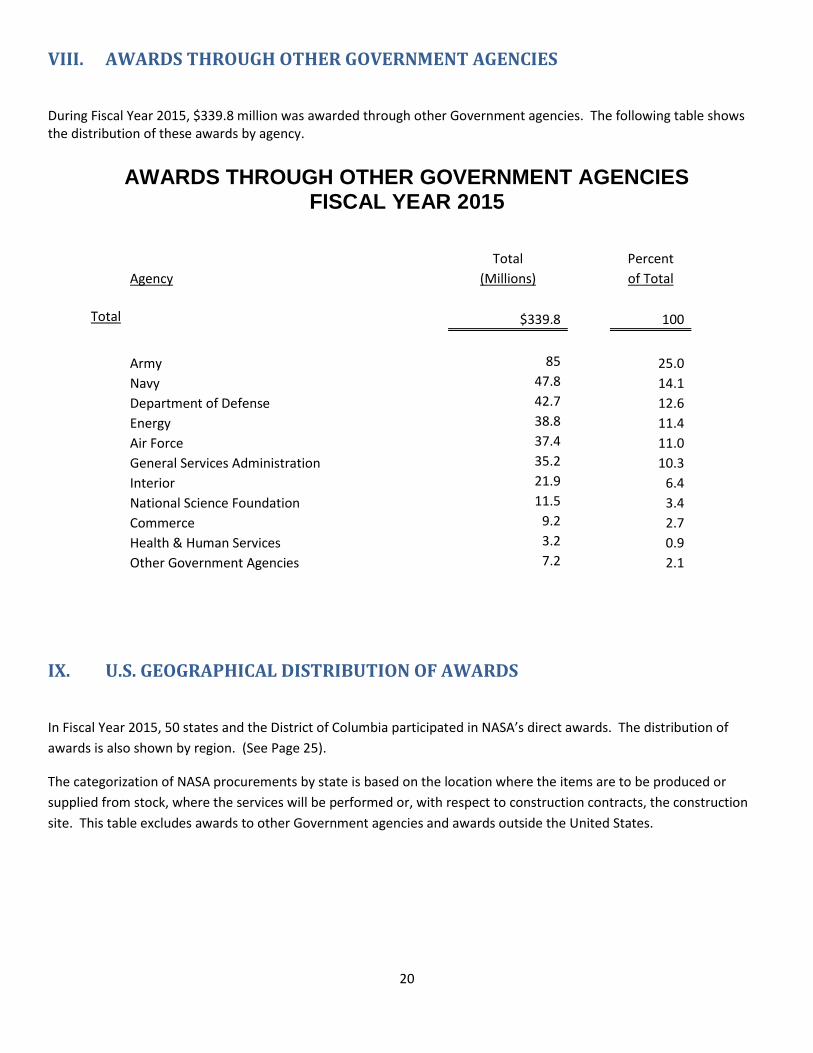
During Fiscal Year 2015, $339.8 million was awarded through other Government agencies. The following table shows the distribution of these awards by agency.
AWARDS THROUGH OTHER GOVERNMENT AGENCIES FISCAL YEAR 2015
Total Percent
Agency (Millions) of Total
Total $339.8 100
Army 85 25.0
Navy 47.8 14.1
Department of Defense 42.7 12.6
Energy 38.8 11.4
Air Force 37.4 11.0
General Services Administration 35.2 10.3
Interior 21.9 6.4
National Science Foundation 11.5 3.4
Commerce 9.2 2.7
Health & Human Services 3.2 0.9
Other Government Agencies 7.2 2.1
IX. U.S. GEOGRAPHICAL DISTRIBUTION OF AWARDS
In Fiscal Year 2015, 50 states and the District of Columbia participated in NASA’s direct awards. The distribution of
awards is also shown by region. (See Page 25).
The categorization of NASA procurements by state is based on the location where the items are to be produced or
supplied from stock, where the services will be performed or, with respect to construction contracts, the construction
site. This table excludes awards to other Government agencies and awards outside the United States.
21
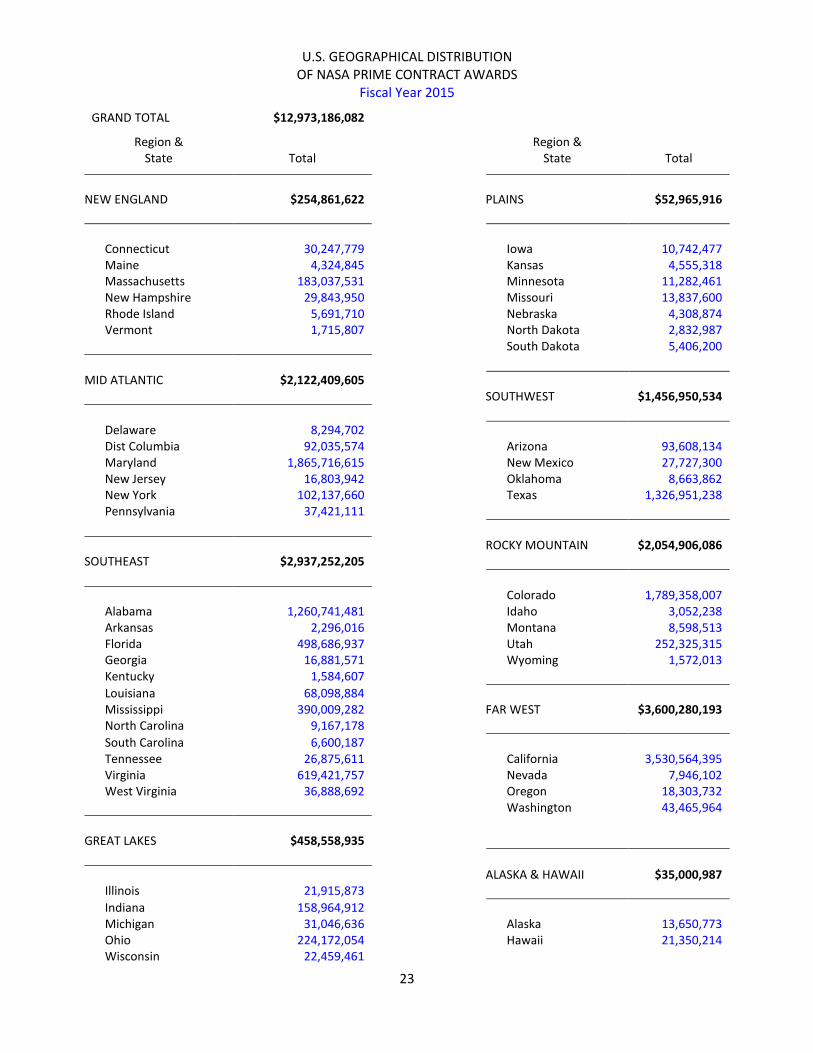
US GEOGRAPHICAL DISTRIBUTION OF NASA PRIME CONTRACT AWARDS
Delaware 8,294,702 Dist Columbia 92,035,574 Arizona 93,608,134 Maryland 1,865,716,615 New Mexico 27,727,300 New Jersey 16,803,942 Oklahoma 8,663,862 New York 102,137,660 Texas 1,326,951,238 Pennsylvania 37,421,111
Louisiana 68,098,884 Mississippi 390,009,282 FAR WEST $3,600,280,193 North Carolina 9,167,178
South Carolina 6,600,187 Tennessee 26,875,611 California 3,530,564,395 Virginia 619,421,757 Nevada 7,946,102 West Virginia 36,888,692 Oregon 18,303,732
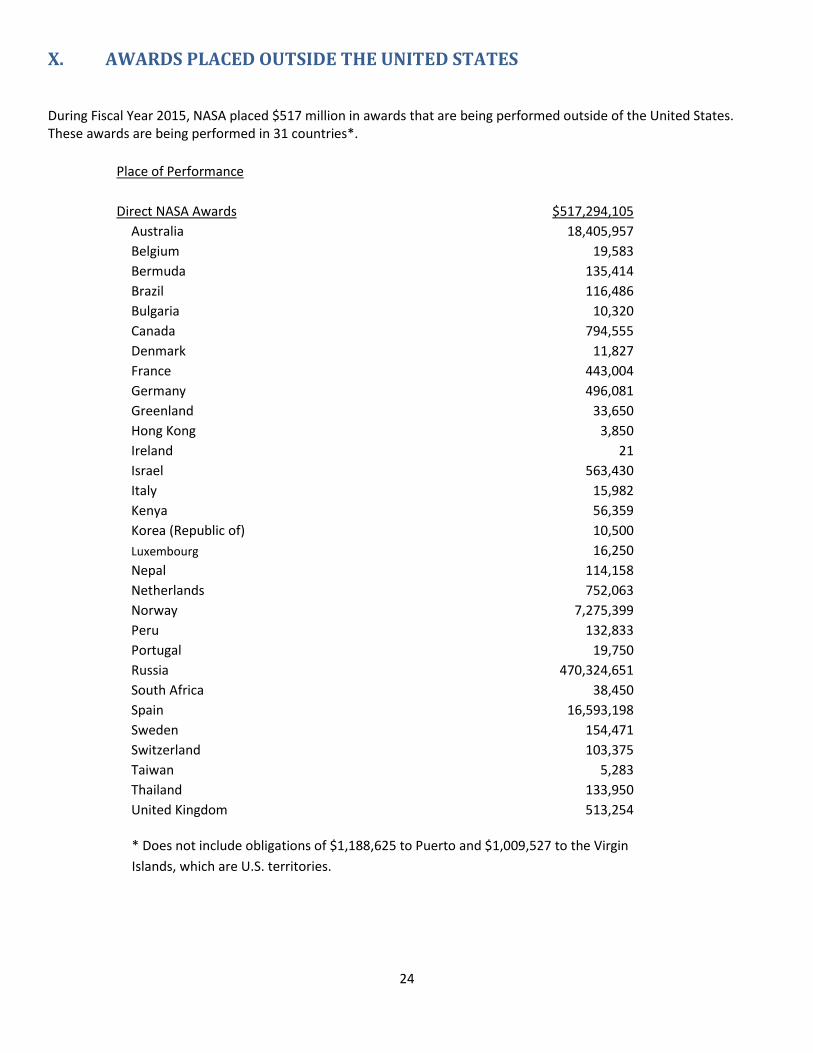
During Fiscal Year 2015, NASA placed $517 million in awards that are being performed outside of the United States. These awards are being performed in 31 countries*.
Place of Performance
Direct NASA Awards $517,294,105
Australia 18,405,957
Belgium 19,583
Bermuda 135,414
Brazil 116,486
Bulgaria 10,320
Canada 794,555
Denmark 11,827
France 443,004
Germany 496,081
Greenland 33,650
Hong Kong 3,850
Ireland 21
Israel 563,430
Italy 15,982
Kenya 56,359
Korea (Republic of) 10,500
Luxembourg 16,250
Nepal 114,158
Netherlands 752,063
Norway 7,275,399
Peru 132,833
Portugal 19,750
Russia 470,324,651
South Africa 38,450
Spain 16,593,198
Sweden 154,471
Switzerland 103,375
Taiwan 5,283
Thailand 133,950
United Kingdom 513,254
* Does not include obligations of $1,188,625 to Puerto and $1,009,527 to the Virgin
Islands, which are U.S. territories.
25
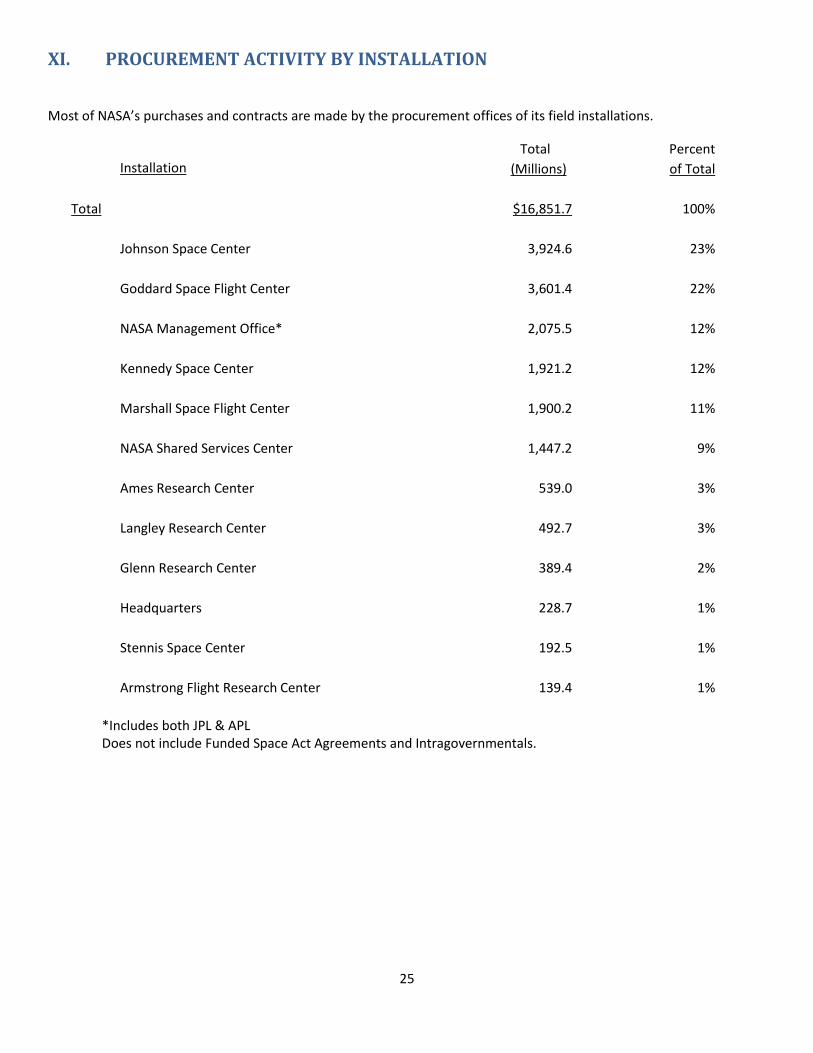
XI. PROCUREMENT ACTIVITY BY INSTALLATION
Most of NASA’s purchases and contracts are made by the procurement offices of its field installations.
Total Percent
Installation (Millions) of Total
Total $16,851.7 100%
Johnson Space Center 3,924.6 23%
Goddard Space Flight Center 3,601.4 22%
NASA Management Office* 2,075.5 12%
Kennedy Space Center 1,921.2 12%
Marshall Space Flight Center 1,900.2 11%
NASA Shared Services Center 1,447.2 9%
Ames Research Center 539.0 3%
Langley Research Center 492.7 3%
Glenn Research Center 389.4 2%
Headquarters 228.7 1%
Stennis Space Center 192.5 1%
Armstrong Flight Research Center 139.4 1%
*Includes both JPL & APL Does not include Funded Space Act Agreements and Intragovernmentals.
26
GLOSSARY
The data contained in this publication were compiled on the basis of the definitions given below:
1. Sealed Bids – Procurement actions resulting from acceptance of bids made by contractors in response to
invitations for bid.
2. Award – See procurement action.
3. Coverage
a. Summary data are provided in terms of obligations on all procurement actions (see item 8). The
obligation data are obtained from the Federal Procurement Data System (FPDS-NG).
b. Detailed data – Information on procurements includes all contracts, grants and cooperative agreements.
Wherever exclusions apply, a generalized footnote is provided.
4. Intragovernmental – Procurement actions placed through other Government agencies, except orders placed
under Federal Supply Schedule contracts and awards to small disadvantaged business through the Small
Business Administration under Section 8(a) of the Small Business Act.
5. Modifications – Any written alteration in the specifications, delivery point, contract period, price, quantity or
other contract requirement of an existing contract, whether accomplished by unilateral action in accordance
with a contract clause or by mutual agreement of the parties to the contract. It includes (a) bilateral actions,
such as supplemental agreements, and (b) unilateral actions, such as change orders, notices of termination and
notices of the exercise of an option.
6. Competitive – Procurements where offers are solicited from more than one responsible offeror capable of
satisfying the Government’s requirements wholly or partially, and the award or awards were made on the basis
of price, design or technical competition.
7. Other than Competitive – Procurements where an offer was solicited and received from only one responsible
offeror capable of satisfying the Government’s requirements wholly or partially. (Includes contracts resulting
from unsolicited proposals.)
8. Procurement Action (Award) – Any contractual action to obtain supplies, services or construction that increases
or decreases funds, including:
a. Letter contracts or other preliminary notices of negotiated awards.
b. Definitive contracts, including purchase orders.
c. Orders under GSA Federal Supply Schedule contracts and basic ordering agreements and against
indefinite delivery type contracts.
d. Intragovernmental orders.
e. Grants.
f. Cooperative Agreements.
g. Supplemental agreements, change orders, administrative changes and terminations to existing
procurements.
9. Small Business – For purposes of Government procurement, a small business is a profit making concern,
including its affiliates, which is independently owned and operated, is not dominant in its field and further
qualifies under the size standards criteria of the Small Business Administration (SBA). These criteria are
published under Title 13 of the Code of Federal Regulations, Section 121.3-8, and in the Federal Acquisition
Regulation, Part 19, Subpart 19.1. For service industries, the size standard generally is based on average annual
receipts over a three year period, depending on the service to be procured. Generally, in the case of agricultural
or manufactured products, the size standards are determined on the basis of number of employees. The
applicable size standard is prescribed in each NASA solicitation.