52
Maeda Corporation ANNUAL REPORT 2017 For the year ended March 31, 2017
Maeda Corporation
AnnuAl RepoRt
2017For the year ended March 31, 2017
02 The History of Maeda Corporation04 Message from the President06 Review of Operations09 Overseas Operations10 Special Feature12 Corporate Governance13 Financial Section13 Consolidated Financial Highlights14 Consolidated Balance Sheets16 Consolidated Statements of Income17 Consolidated Statements of Comprehensive Income18 Consolidated Statements of Changes in Net Assets19 Consolidated Statements of Cash Flows20 Notes to the Consolidated Financial Statements47 Report of Independent Certified Public Accountants48 Corporate Information
Contents
Building and Civil Engineering for the World
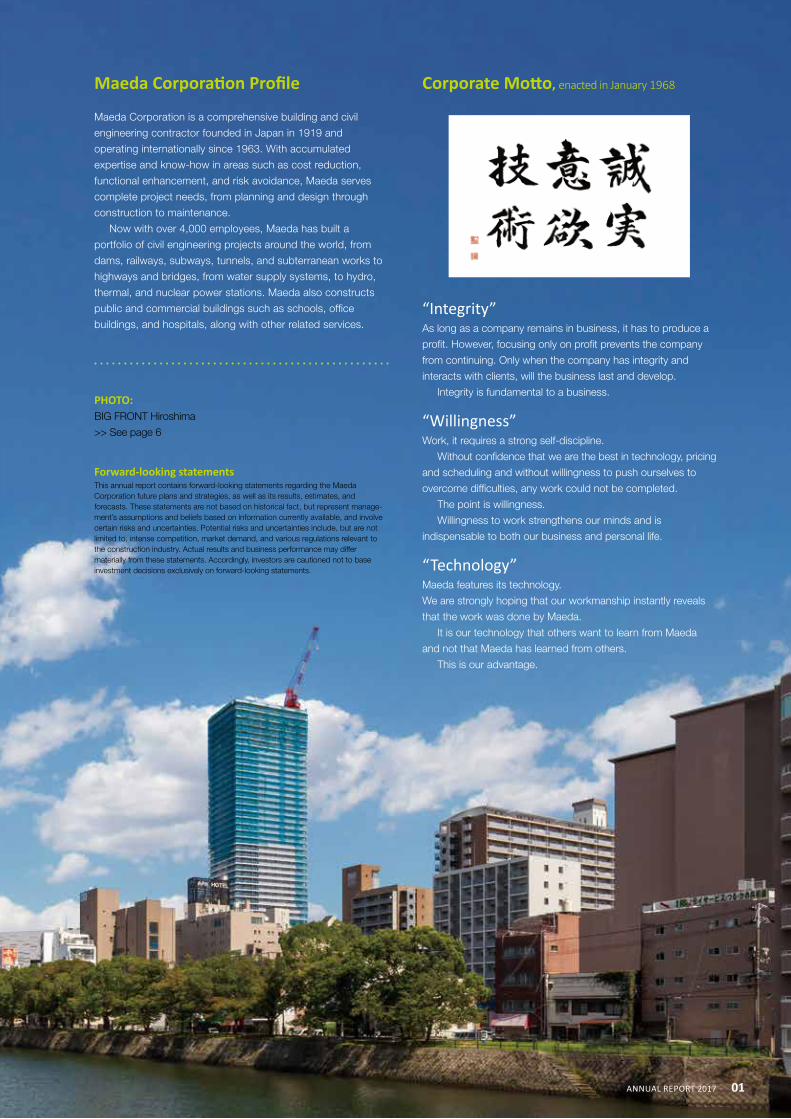
Corporate Motto, enacted in January 1968
“Integrity”As long as a company remains in business, it has to produce a
profit. However, focusing only on profit prevents the company
from continuing. Only when the company has integrity and
interacts with clients, will the business last and develop.
Integrity is fundamental to a business.
“Willingness”Work, it requires a strong self-discipline.
Without confidence that we are the best in technology, pricing
and scheduling and without willingness to push ourselves to
overcome difficulties, any work could not be completed.
The point is willingness.
Willingness to work strengthens our minds and is
indispensable to both our business and personal life.
“Technology”Maeda features its technology.
We are strongly hoping that our workmanship instantly reveals
that the work was done by Maeda.
It is our technology that others want to learn from Maeda
and not that Maeda has learned from others.
This is our advantage.
Maeda Corporation Profile
Maeda Corporation is a comprehensive building and civil
engineering contractor founded in Japan in 1919 and
operating internationally since 1963. With accumulated
expertise and know-how in areas such as cost reduction,
functional enhancement, and risk avoidance, Maeda serves
complete project needs, from planning and design through
construction to maintenance.
Now with over 4,000 employees, Maeda has built a
portfolio of civil engineering projects around the world, from
dams, railways, subways, tunnels, and subterranean works to
highways and bridges, from water supply systems, to hydro,
thermal, and nuclear power stations. Maeda also constructs
public and commercial buildings such as schools, office
buildings, and hospitals, along with other related services.
PHOTO: BIG FRONT Hiroshima
>> See page 6
Forward-looking statements This annual report contains forward-looking statements regarding the Maeda Corporation future plans and strategies, as well as its results, estimates, and forecasts. These statements are not based on historical fact, but represent manage-ment’s assumptions and beliefs based on information currently available, and involve certain risks and uncertainties. Potential risks and uncertainties include, but are not limited to, intense competition, market demand, and various regulations relevant to the construction industry. Actual results and business performance may differ materially from these statements. Accordingly, investors are cautioned not to base investment decisions exclusively on forward-looking statements.
01AnnuAl RepoRT 2017
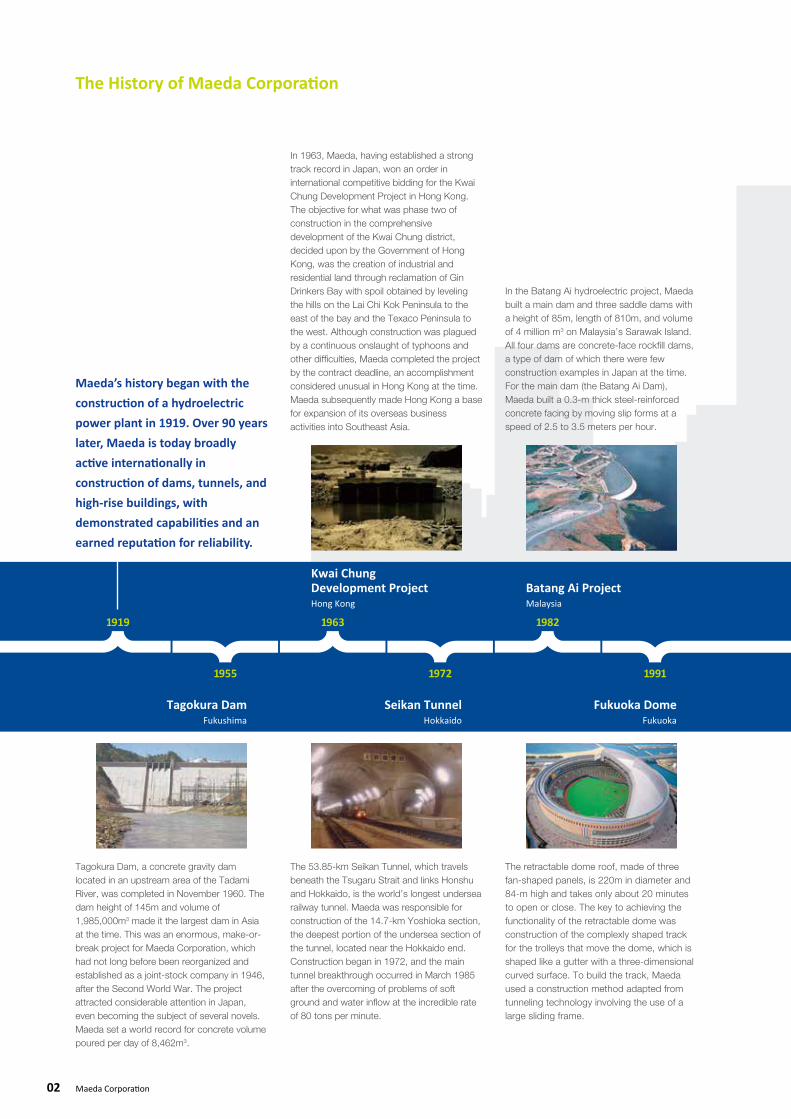
The History of Maeda Corporation
Tagokura Dam, a concrete gravity dam located in an upstream area of the Tadami River, was completed in November 1960. The dam height of 145m and volume of 1,985,000m3 made it the largest dam in Asia at the time. This was an enormous, make-or-break project for Maeda Corporation, which had not long before been reorganized and established as a joint-stock company in 1946, after the Second World War. The project attracted considerable attention in Japan, even becoming the subject of several novels. Maeda set a world record for concrete volume poured per day of 8,462m3.
The 53.85-km Seikan Tunnel, which travels beneath the Tsugaru Strait and links Honshu and Hokkaido, is the world’s longest undersea railway tunnel. Maeda was responsible for construction of the 14.7-km Yoshioka section, the deepest portion of the undersea section of the tunnel, located near the Hokkaido end. Construction began in 1972, and the main tunnel breakthrough occurred in March 1985 after the overcoming of problems of soft ground and water inflow at the incredible rate of 80 tons per minute.
The retractable dome roof, made of three fan-shaped panels, is 220m in diameter and 84-m high and takes only about 20 minutes to open or close. The key to achieving the functionality of the retractable dome was construction of the complexly shaped track for the trolleys that move the dome, which is shaped like a gutter with a three-dimensional curved surface. To build the track, Maeda used a construction method adapted from tunneling technology involving the use of a large sliding frame.
In 1963, Maeda, having established a strong track record in Japan, won an order in international competitive bidding for the Kwai Chung Development Project in Hong Kong. The objective for what was phase two of construction in the comprehensive development of the Kwai Chung district, decided upon by the Government of Hong Kong, was the creation of industrial and residential land through reclamation of Gin Drinkers Bay with spoil obtained by leveling the hills on the Lai Chi Kok Peninsula to the east of the bay and the Texaco Peninsula to the west. Although construction was plagued by a continuous onslaught of typhoons and other difficulties, Maeda completed the project by the contract deadline, an accomplishment considered unusual in Hong Kong at the time. Maeda subsequently made Hong Kong a base for expansion of its overseas business activities into Southeast Asia.
In the Batang Ai hydroelectric project, Maeda built a main dam and three saddle dams with a height of 85m, length of 810m, and volume of 4 million m3 on Malaysia’s Sarawak Island. All four dams are concrete-face rockfill dams, a type of dam of which there were few construction examples in Japan at the time. For the main dam (the Batang Ai Dam), Maeda built a 0.3-m thick steel-reinforced concrete facing by moving slip forms at a speed of 2.5 to 3.5 meters per hour.
Maeda’s history began with the construction of a hydroelectric power plant in 1919. Over 90 years later, Maeda is today broadly active internationally in construction of dams, tunnels, and high-rise buildings, with demonstrated capabilities and an earned reputation for reliability.
Hong Kong Malaysia
Fukushima Hokkaido Fukuoka
Kwai Chung Development Project Batang Ai Project
Tagokura Dam Seikan Tunnel Fukuoka Dome
1963 1982
1972 19911955
1919
02 Maeda Corporation
A five-member consortium of British, Chinese, and Japanese companies including Maeda won the order from the Airport Authority Hong Kong for construction of a passenger terminal building with a total floor area of 498,000m2 on a 1,248-hectare artificial island. Hong Kong International Airport is an international hub airport that has consistently been selected as the world’s best airport since 2001 by an aviation-related research firm in the U.K. Maeda has subsequently continued to win orders for projects such as area expansion construction.
Maeda’s involvement in the Upper Kotmale Hydropower Project in Sri Lanka started in September 2005 with Lot 01 Preparatory Work followed by Lot 02 Main Civil Work, which started construction on January 1, 2007, and was completed on February 25, 2014. The project consists of a 36-m high dam, a headrace tunnel with a total length of 15km, and total power capacity of 150MW (two turbines generating 75MW each). In honor of the 60th anniversary of diplomatic relations between Japan and Sri Lanka, a commemorative coin engraved with an image of this dam was issued.
Near to where it was founded, Maeda has erected a 30 storey office and commercial tower with a two level basement together with a 40 storey residential tower also with a two level basement. The design of the two towers express and combine Japanese “iki” (stylishness) through silver grey vertical louvers that face the outer moat of the Imperial Palace and the “esprit” of the area’s Western culture through champagne gold horizontal louvers that face the Palace. Both buildings are designed and equipped for high-level emergencies. Maeda’s headquarters are located on the 11th and 12th floors of the office tower.
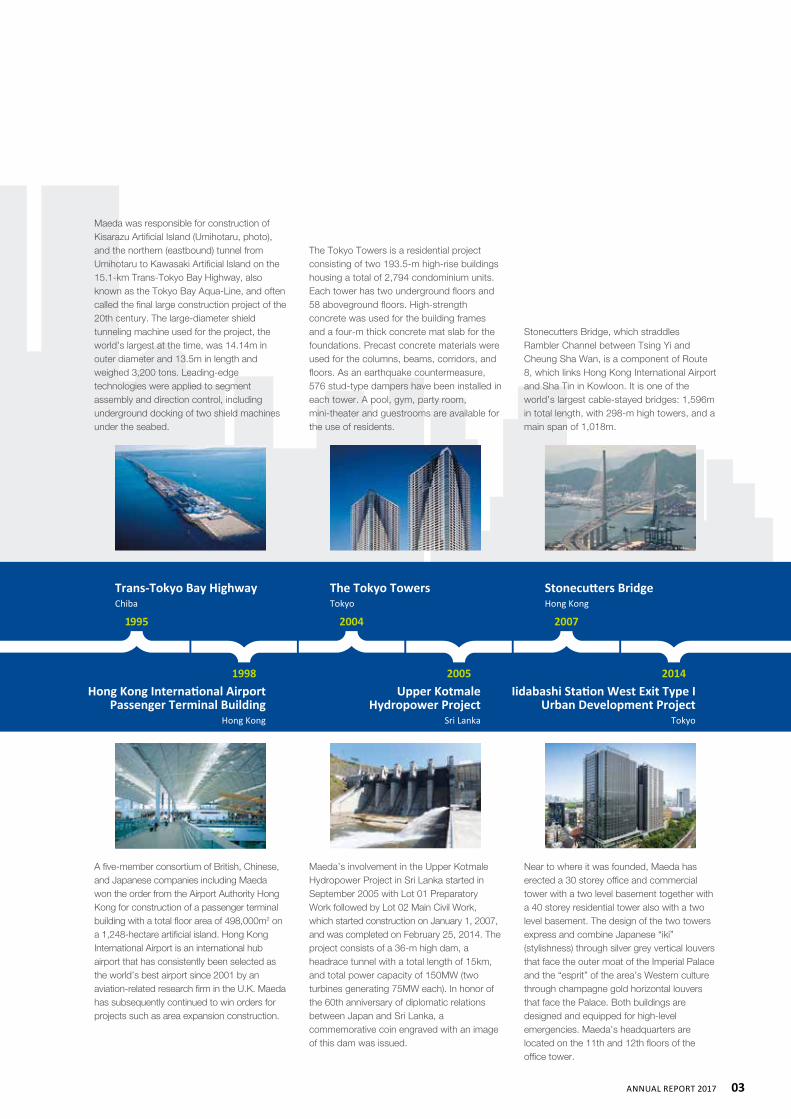
Maeda was responsible for construction of Kisarazu Artificial Island (Umihotaru, photo), and the northern (eastbound) tunnel from Umihotaru to Kawasaki Artificial Island on the 15.1-km Trans-Tokyo Bay Highway, also known as the Tokyo Bay Aqua-Line, and often called the final large construction project of the 20th century. The large-diameter shield tunneling machine used for the project, the world’s largest at the time, was 14.14m in outer diameter and 13.5m in length and weighed 3,200 tons. Leading-edge technologies were applied to segment assembly and direction control, including underground docking of two shield machines under the seabed.
The Tokyo Towers is a residential project consisting of two 193.5-m high-rise buildings housing a total of 2,794 condominium units. Each tower has two underground floors and 58 aboveground floors. High-strength concrete was used for the building frames and a four-m thick concrete mat slab for the foundations. Precast concrete materials were used for the columns, beams, corridors, and floors. As an earthquake countermeasure, 576 stud-type dampers have been installed in each tower. A pool, gym, party room, mini-theater and guestrooms are available for the use of residents.
Stonecutters Bridge, which straddles Rambler Channel between Tsing Yi and Cheung Sha Wan, is a component of Route 8, which links Hong Kong International Airport and Sha Tin in Kowloon. It is one of the world’s largest cable-stayed bridges: 1,596m in total length, with 298-m high towers, and a main span of 1,018m.
Chiba Tokyo Hong Kong
Hong Kong Sri lanka Tokyo
Trans-Tokyo Bay Highway The Tokyo Towers Stonecutters Bridge
Hong Kong International Airport Passenger Terminal Building
Upper Kotmale Hydropower Project
Iidabashi Station West Exit Type I Urban Development Project
1995 2004 2007
1998 2005 2014
03AnnuAl RepoRt 2017
Message from the President
Putting forth an image of a new society where harmony prevails
Undertaking to solve diverse and complex social issues in a world where turmoil is spreading deeperWith the world trending towards lower levels of global
business expansion and world economic growth, and
given the widening of numerous disparities and the
confrontations surrounding them, the amount of turmoil
in the world is increasing more and more, as evidenced
by growing terrorism and the rise of the extreme right
combined with the “my country first” principle. Even the
concepts of freedom and democracy, which had been
considered universal principles, have been having
difficulty attracting full-scale support. As people’s sense
of value and lifestyles diversify, social issues and social
needs are becoming ever more complex. In times like
these, Japan is a step farther down the path than the
rest of the world in the maturing of its economy, shrinking
of its population, and standing now in an era in which
economic growth faces structural limits.
Under these circumstances, in order for society to
realize sustainable development, I think it is crucial to
develop harmony among the elements of the
environment, the economy, the community, and people’s
lives, too. I believe moreover that Maeda shall be a
business that assumes responsibility for this task.
A prompt start to solving social issuesMaeda is responsible for operating Sendai Airport, the
country’s first public-private concession, and Aichi
Prefecture Toll Road, the country’s first road concession.
These types of society-leading enterprises are the results
of Maeda’s preparations attained for over a decade by
envisaging possible future changes in the construction
industry as well as by thinking over what value we can
provide to society as a business engaged in
infrastructure. The concession business is instrumental in
04 Maeda Corporation
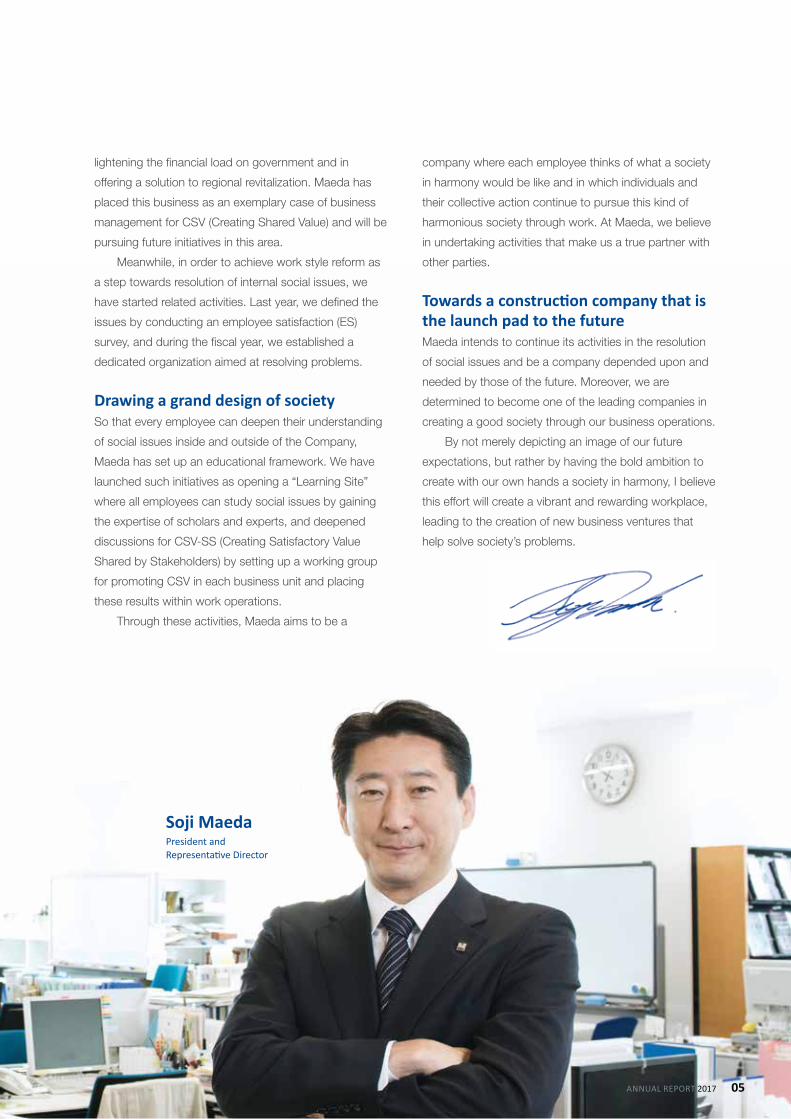
Soji MaedaPresident and Representative Director
lightening the financial load on government and in
offering a solution to regional revitalization. Maeda has
placed this business as an exemplary case of business
management for CSV (Creating Shared Value) and will be
pursuing future initiatives in this area.
Meanwhile, in order to achieve work style reform as
a step towards resolution of internal social issues, we
have started related activities. Last year, we defined the
issues by conducting an employee satisfaction (ES)
survey, and during the fiscal year, we established a
dedicated organization aimed at resolving problems.
Drawing a grand design of societySo that every employee can deepen their understanding
of social issues inside and outside of the Company,
Maeda has set up an educational framework. We have
launched such initiatives as opening a “Learning Site”
where all employees can study social issues by gaining
the expertise of scholars and experts, and deepened
discussions for CSV-SS (Creating Satisfactory Value
Shared by Stakeholders) by setting up a working group
for promoting CSV in each business unit and placing
these results within work operations.
Through these activities, Maeda aims to be a
company where each employee thinks of what a society
in harmony would be like and in which individuals and
their collective action continue to pursue this kind of
harmonious society through work. At Maeda, we believe
in undertaking activities that make us a true partner with
other parties.
Towards a construction company that is the launch pad to the futureMaeda intends to continue its activities in the resolution
of social issues and be a company depended upon and
needed by those of the future. Moreover, we are
determined to become one of the leading companies in
creating a good society through our business operations.
By not merely depicting an image of our future
expectations, but rather by having the bold ambition to
create with our own hands a society in harmony, I believe
this effort will create a vibrant and rewarding workplace,
leading to the creation of new business ventures that
help solve society’s problems.
05AnnuAl RepoRT 2017
Review of Operations: Completed Works
Maeda is one of the leading companies in Japan’s construction industry. Here are the track records of major works completed in the past year.
Building Projects
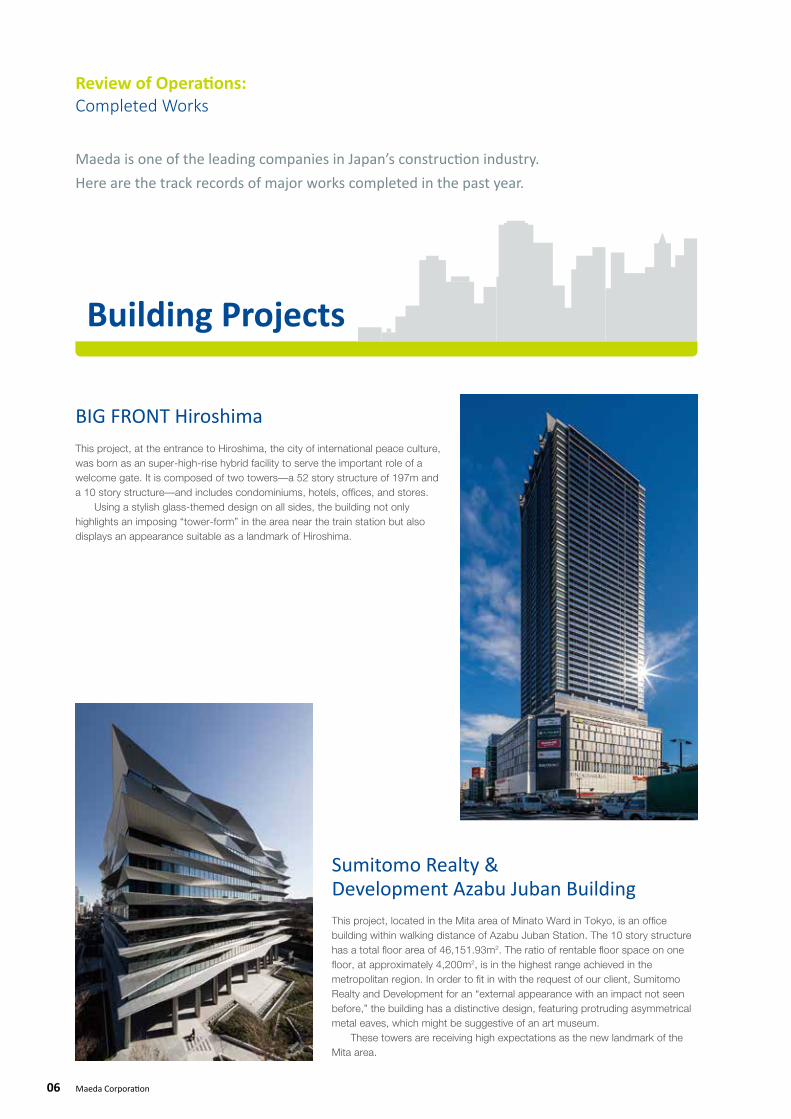
BIG FRonT Hiroshima
Sumitomo Realty & Development Azabu Juban Building
This project, at the entrance to Hiroshima, the city of international peace culture, was born as an super-high-rise hybrid facility to serve the important role of a welcome gate. It is composed of two towers—a 52 story structure of 197m and a 10 story structure—and includes condominiums, hotels, offices, and stores. Using a stylish glass-themed design on all sides, the building not only highlights an imposing “tower-form” in the area near the train station but also displays an appearance suitable as a landmark of Hiroshima.
This project, located in the Mita area of Minato Ward in Tokyo, is an office building within walking distance of Azabu Juban Station. The 10 story structure has a total floor area of 46,151.93m2. The ratio of rentable floor space on one floor, at approximately 4,200m2, is in the highest range achieved in the metropolitan region. In order to fit in with the request of our client, Sumitomo Realty and Development for an “external appearance with an impact not seen before,” the building has a distinctive design, featuring protruding asymmetrical metal eaves, which might be suggestive of an art museum. These towers are receiving high expectations as the new landmark of the Mita area.
06 Maeda Corporation
Civil Engineering Projects
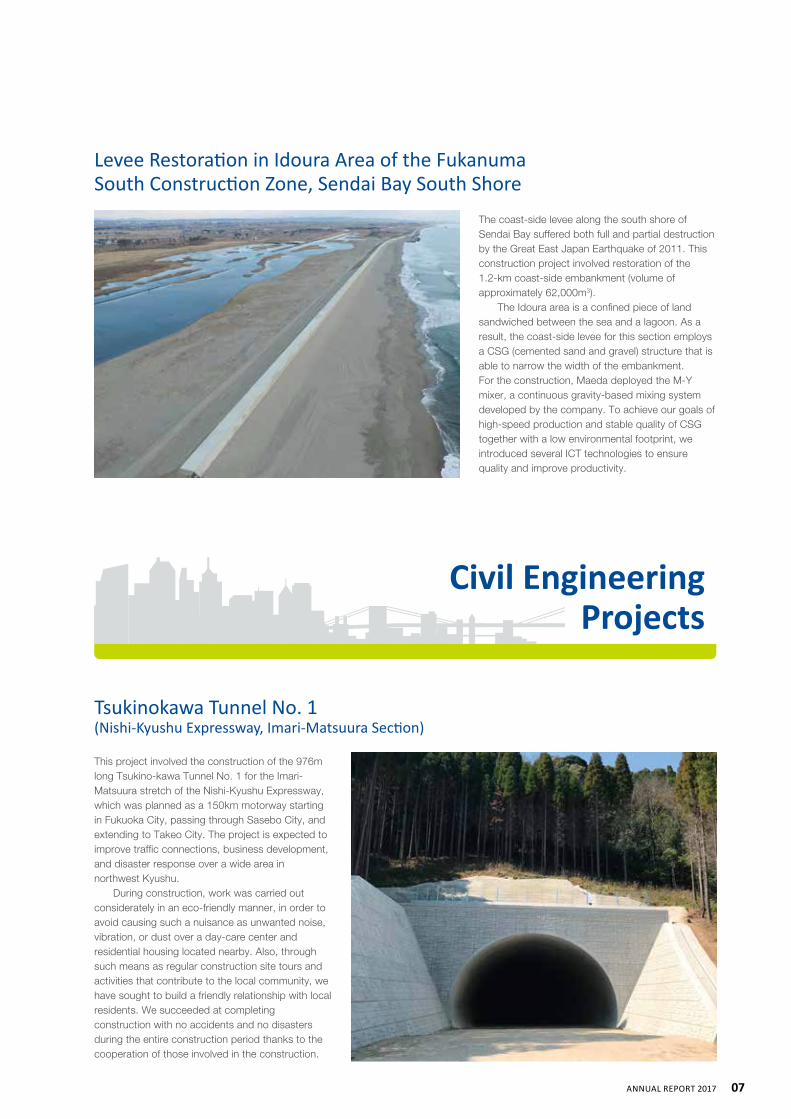
Levee Restoration in Idoura Area of the Fukanuma South Construction Zone, Sendai Bay South Shore
Tsukinokawa Tunnel No. 1 (Nishi-Kyushu Expressway, Imari-Matsuura Section)
The coast-side levee along the south shore of Sendai Bay suffered both full and partial destruction by the Great East Japan Earthquake of 2011. This construction project involved restoration of the 1.2-km coast-side embankment (volume of approximately 62,000m3). The Idoura area is a confined piece of land sandwiched between the sea and a lagoon. As a result, the coast-side levee for this section employs a CSG (cemented sand and gravel) structure that is able to narrow the width of the embankment.For the construction, Maeda deployed the M-Y mixer, a continuous gravity-based mixing system developed by the company. To achieve our goals of high-speed production and stable quality of CSG together with a low environmental footprint, we introduced several ICT technologies to ensure quality and improve productivity.
This project involved the construction of the 976m long Tsukino-kawa Tunnel No. 1 for the Imari-Matsuura stretch of the Nishi-Kyushu Expressway, which was planned as a 150km motorway starting in Fukuoka City, passing through Sasebo City, and extending to Takeo City. The project is expected to improve traffic connections, business development, and disaster response over a wide area in northwest Kyushu. During construction, work was carried out considerately in an eco-friendly manner, in order to avoid causing such a nuisance as unwanted noise, vibration, or dust over a day-care center and residential housing located nearby. Also, through such means as regular construction site tours and activities that contribute to the local community, we have sought to build a friendly relationship with local residents. We succeeded at completing construction with no accidents and no disasters during the entire construction period thanks to the cooperation of those involved in the construction.
07AnnuAl RepoRt 2017
VietnamSuntory pepsiCo Vietnam Beverage Central project
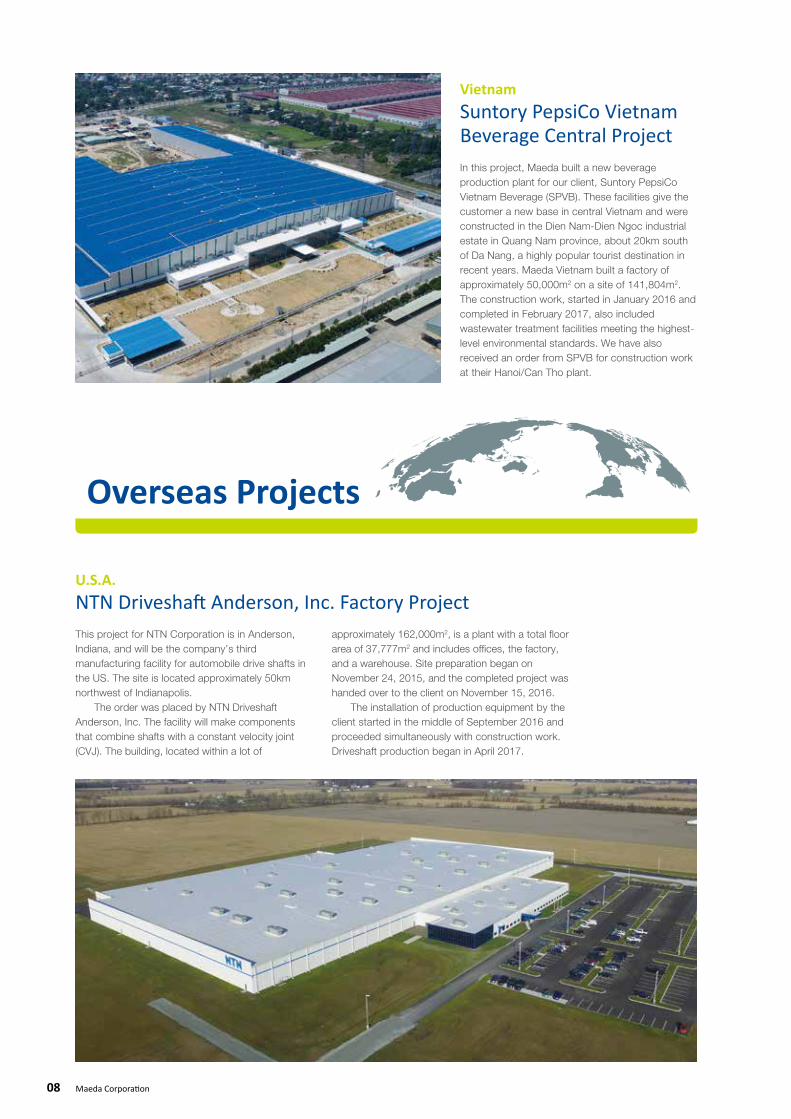
U.S.A.NTN Driveshaft Anderson, Inc. Factory ProjectThis project for NTN Corporation is in Anderson, Indiana, and will be the company’s third manufacturing facility for automobile drive shafts in the US. The site is located approximately 50km northwest of Indianapolis. The order was placed by NTN Driveshaft Anderson, Inc. The facility will make components that combine shafts with a constant velocity joint (CVJ). The building, located within a lot of
In this project, Maeda built a new beverage production plant for our client, Suntory PepsiCo Vietnam Beverage (SPVB). These facilities give the customer a new base in central Vietnam and were constructed in the Dien Nam-Dien Ngoc industrial estate in Quang Nam province, about 20km south of Da Nang, a highly popular tourist destination in recent years. Maeda Vietnam built a factory of approximately 50,000m2 on a site of 141,804m2. The construction work, started in January 2016 and completed in February 2017, also included wastewater treatment facilities meeting the highest-level environmental standards. We have also received an order from SPVB for construction work at their Hanoi/Can Tho plant.
Overseas Projects
approximately 162,000m2, is a plant with a total floor area of 37,777m2 and includes offices, the factory, and a warehouse. Site preparation began on November 24, 2015, and the completed project was handed over to the client on November 15, 2016. The installation of production equipment by the client started in the middle of September 2016 and proceeded simultaneously with construction work. Driveshaft production began in April 2017.
08 Maeda Corporation
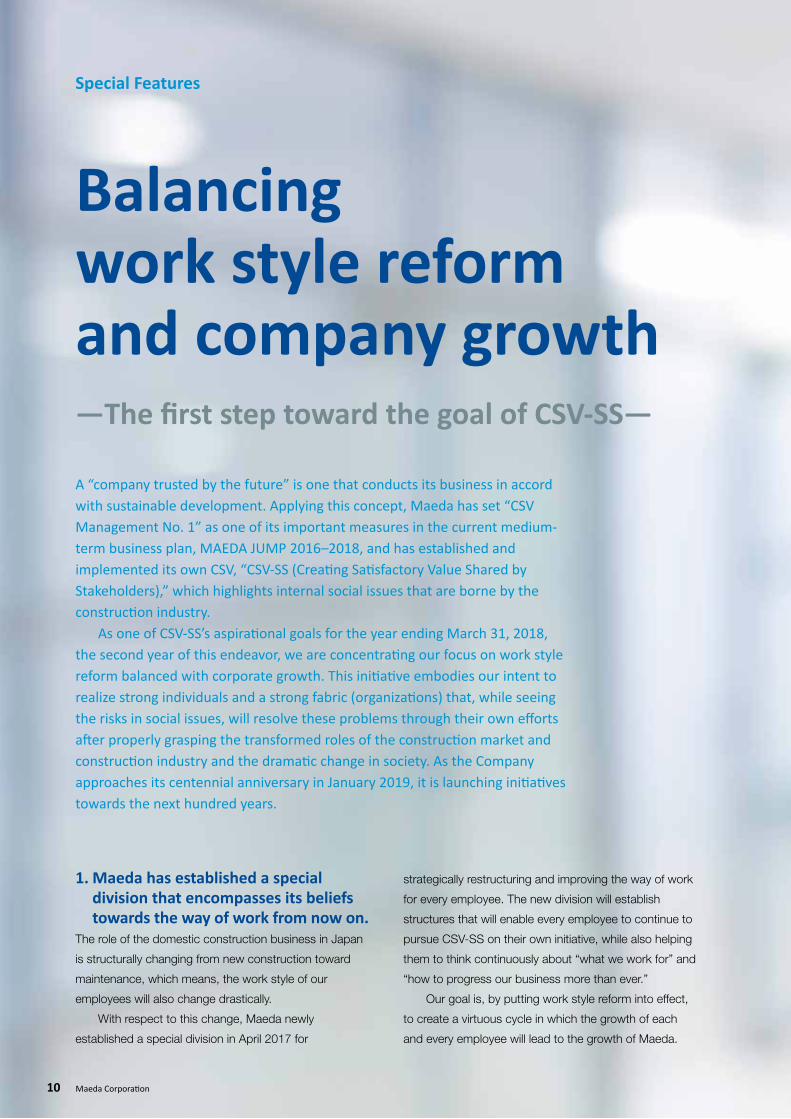
Japan U.S.A.
India Guam Mexico
China
Sri lanka Taiwan
MyanmarTurkey
Thailand Hong KongIndonesia Vietnam
Cambodia
Overseas Operations
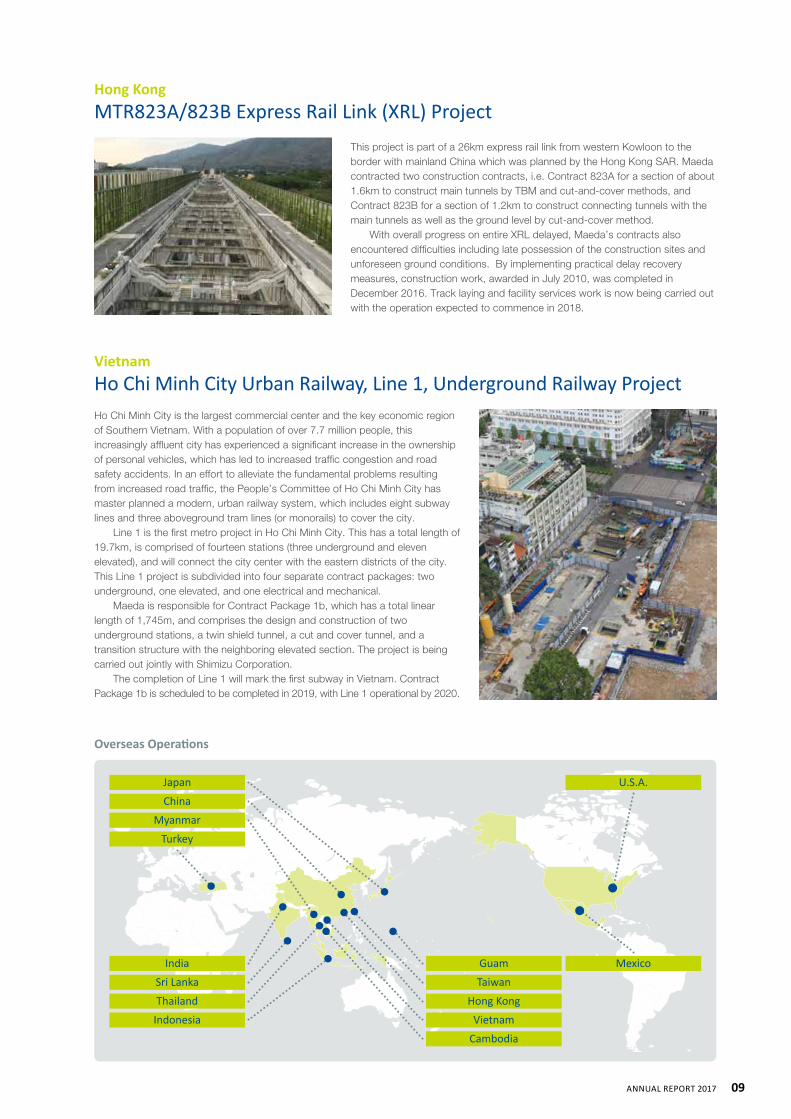
Hong Kong MTR823A/823B Express Rail Link (XRL) Project
VietnamHo Chi Minh City Urban Railway, Line 1, Underground Railway Project
This project is part of a 26km express rail link from western Kowloon to the border with mainland China which was planned by the Hong Kong SAR. Maeda contracted two construction contracts, i.e. Contract 823A for a section of about 1.6km to construct main tunnels by TBM and cut-and-cover methods, and Contract 823B for a section of 1.2km to construct connecting tunnels with the main tunnels as well as the ground level by cut-and-cover method. With overall progress on entire XRL delayed, Maeda’s contracts also encountered difficulties including late possession of the construction sites and unforeseen ground conditions. By implementing practical delay recovery measures, construction work, awarded in July 2010, was completed in December 2016. Track laying and facility services work is now being carried out with the operation expected to commence in 2018.
Ho Chi Minh City is the largest commercial center and the key economic region of Southern Vietnam. With a population of over 7.7 million people, this increasingly affluent city has experienced a significant increase in the ownership of personal vehicles, which has led to increased traffic congestion and road safety accidents. In an effort to alleviate the fundamental problems resulting from increased road traffic, the People’s Committee of Ho Chi Minh City has master planned a modern, urban railway system, which includes eight subway lines and three aboveground tram lines (or monorails) to cover the city. Line 1 is the first metro project in Ho Chi Minh City. This has a total length of 19.7km, is comprised of fourteen stations (three underground and eleven elevated), and will connect the city center with the eastern districts of the city. This Line 1 project is subdivided into four separate contract packages: two underground, one elevated, and one electrical and mechanical. Maeda is responsible for Contract Package 1b, which has a total linear length of 1,745m, and comprises the design and construction of two underground stations, a twin shield tunnel, a cut and cover tunnel, and a transition structure with the neighboring elevated section. The project is being carried out jointly with Shimizu Corporation. The completion of Line 1 will mark the first subway in Vietnam. Contract Package 1b is scheduled to be completed in 2019, with Line 1 operational by 2020.
09AnnuAl RepoRt 2017
Special Features
strategically restructuring and improving the way of work
for every employee. The new division will establish
structures that will enable every employee to continue to
pursue CSV-SS on their own initiative, while also helping
them to think continuously about “what we work for” and
“how to progress our business more than ever.”
Our goal is, by putting work style reform into effect,
to create a virtuous cycle in which the growth of each
and every employee will lead to the growth of Maeda.
1. Maeda has established a special division that encompasses its beliefs towards the way of work from now on.
The role of the domestic construction business in Japan
is structurally changing from new construction toward
maintenance, which means, the work style of our
employees will also change drastically.
With respect to this change, Maeda newly
established a special division in April 2017 for
A “company trusted by the future” is one that conducts its business in accord with sustainable development. Applying this concept, Maeda has set “CSV Management No. 1” as one of its important measures in the current medium-term business plan, MAEDA JUMP 2016–2018, and has established and implemented its own CSV, “CSV-SS (Creating Satisfactory Value Shared by Stakeholders),” which highlights internal social issues that are borne by the construction industry. As one of CSV-SS’s aspirational goals for the year ending March 31, 2018, the second year of this endeavor, we are concentrating our focus on work style reform balanced with corporate growth. This initiative embodies our intent to realize strong individuals and a strong fabric (organizations) that, while seeing the risks in social issues, will resolve these problems through their own efforts after properly grasping the transformed roles of the construction market and construction industry and the dramatic change in society. As the Company approaches its centennial anniversary in January 2019, it is launching initiatives towards the next hundred years.
Balancing work style reform and company growth—The first step toward the goal of CSV-SS—
10 Maeda Corporation
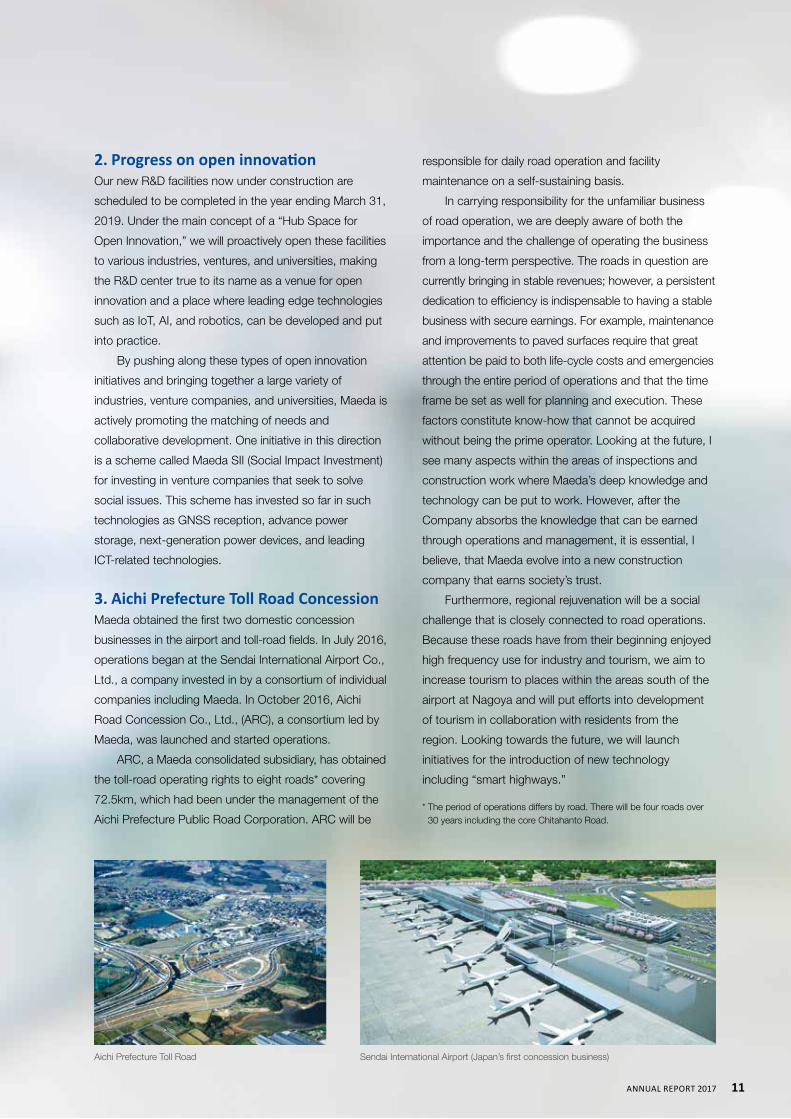
Aichi Prefecture Toll Road Sendai International Airport (Japan’s first concession business)
2. Progress on open innovationOur new R&D facilities now under construction are
scheduled to be completed in the year ending March 31,
2019. Under the main concept of a “Hub Space for
Open Innovation,” we will proactively open these facilities
to various industries, ventures, and universities, making
the R&D center true to its name as a venue for open
innovation and a place where leading edge technologies
such as IoT, AI, and robotics, can be developed and put
into practice.
By pushing along these types of open innovation
initiatives and bringing together a large variety of
industries, venture companies, and universities, Maeda is
actively promoting the matching of needs and
collaborative development. One initiative in this direction
is a scheme called Maeda SII (Social Impact Investment)
for investing in venture companies that seek to solve
social issues. This scheme has invested so far in such
technologies as GNSS reception, advance power
storage, next-generation power devices, and leading
ICT-related technologies.
3. Aichi Prefecture Toll Road ConcessionMaeda obtained the first two domestic concession
businesses in the airport and toll-road fields. In July 2016,
operations began at the Sendai International Airport Co.,
Ltd., a company invested in by a consortium of individual
companies including Maeda. In October 2016, Aichi
Road Concession Co., Ltd., (ARC), a consortium led by
Maeda, was launched and started operations.
ARC, a Maeda consolidated subsidiary, has obtained
the toll-road operating rights to eight roads* covering
72.5km, which had been under the management of the
Aichi Prefecture Public Road Corporation. ARC will be
responsible for daily road operation and facility
maintenance on a self-sustaining basis.
In carrying responsibility for the unfamiliar business
of road operation, we are deeply aware of both the
importance and the challenge of operating the business
from a long-term perspective. The roads in question are
currently bringing in stable revenues; however, a persistent
dedication to efficiency is indispensable to having a stable
business with secure earnings. For example, maintenance
and improvements to paved surfaces require that great
attention be paid to both life-cycle costs and emergencies
through the entire period of operations and that the time
frame be set as well for planning and execution. These
factors constitute know-how that cannot be acquired
without being the prime operator. Looking at the future, I
see many aspects within the areas of inspections and
construction work where Maeda’s deep knowledge and
technology can be put to work. However, after the
Company absorbs the knowledge that can be earned
through operations and management, it is essential, I
believe, that Maeda evolve into a new construction
company that earns society’s trust.
Furthermore, regional rejuvenation will be a social
challenge that is closely connected to road operations.
Because these roads have from their beginning enjoyed
high frequency use for industry and tourism, we aim to
increase tourism to places within the areas south of the
airport at Nagoya and will put efforts into development
of tourism in collaboration with residents from the
region. Looking towards the future, we will launch
initiatives for the introduction of new technology
including “smart highways.”
* The period of operations differs by road. There will be four roads over 30 years including the core Chitahanto Road.
11AnnuAl RepoRt 2017
Corporate Governance
Advice
Advice
Notification
Appointment Appointment Appointment
Linked
AuditAudit
Audit
Audit
Reporting
ReportingRecommendation / Proposal
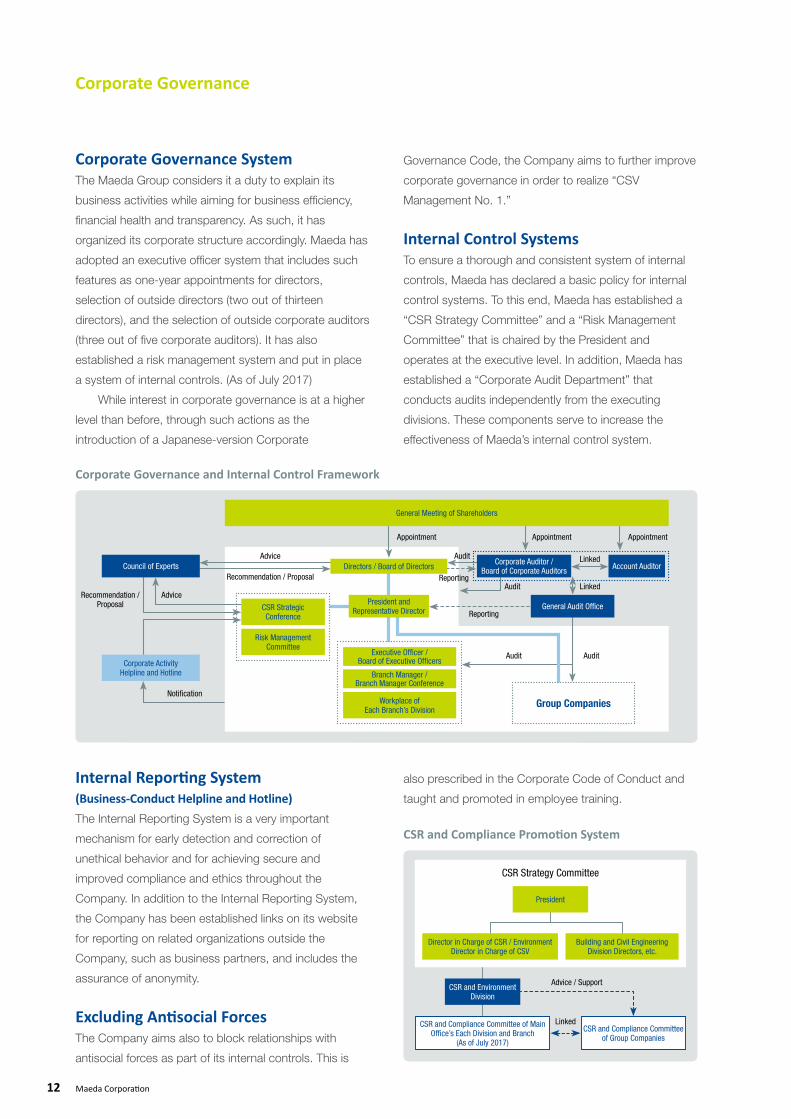
Recommendation /Proposal General Audit Office
Account AuditorDirectors / Board of Directors
General Meeting of Shareholders
Corporate Auditor /Board of Corporate Auditors
Branch Manager /Branch Manager Conference
Workplace ofEach Branch’s Division
Executive Officer /Board of Executive Officers
Linked
Group Companies
President andRepresentative Director
Risk ManagementCommittee
CSR StrategicConference
Corporate ActivityHelpline and Hotline
Council of Experts
Corporate Governance and Internal Control Framework
CSR and Compliance Committee of Main Office’s Each Division and Branch
(As of July 2017)
CSR and Compliance Committee of Group Companies
CSR and EnvironmentDivision
President
Director in Charge of CSR / Environment Director in Charge of CSV
Building and Civil EngineeringDivision Directors, etc.
Advice / Support
Linked
CSR Strategy Committee
CSR and Compliance Promotion System
Corporate Governance SystemThe Maeda Group considers it a duty to explain its
business activities while aiming for business efficiency,
financial health and transparency. As such, it has
organized its corporate structure accordingly. Maeda has
adopted an executive officer system that includes such
features as one-year appointments for directors,
selection of outside directors (two out of thirteen
directors), and the selection of outside corporate auditors
(three out of five corporate auditors). It has also
established a risk management system and put in place
a system of internal controls. (As of July 2017)
While interest in corporate governance is at a higher
level than before, through such actions as the
introduction of a Japanese-version Corporate
Governance Code, the Company aims to further improve
corporate governance in order to realize “CSV
Management No. 1.”
Internal Control SystemsTo ensure a thorough and consistent system of internal
controls, Maeda has declared a basic policy for internal
control systems. To this end, Maeda has established a
“CSR Strategy Committee” and a “Risk Management
Committee” that is chaired by the President and
operates at the executive level. In addition, Maeda has
established a “Corporate Audit Department” that
conducts audits independently from the executing
divisions. These components serve to increase the
effectiveness of Maeda’s internal control system.
Internal Reporting System(Business-Conduct Helpline and Hotline)The Internal Reporting System is a very important
mechanism for early detection and correction of
unethical behavior and for achieving secure and
improved compliance and ethics throughout the
Company. In addition to the Internal Reporting System,
the Company has been established links on its website
for reporting on related organizations outside the
Company, such as business partners, and includes the
assurance of anonymity.
Excluding Antisocial ForcesThe Company aims also to block relationships with
antisocial forces as part of its internal controls. This is
also prescribed in the Corporate Code of Conduct and
taught and promoted in employee training.
12 Maeda Corporation
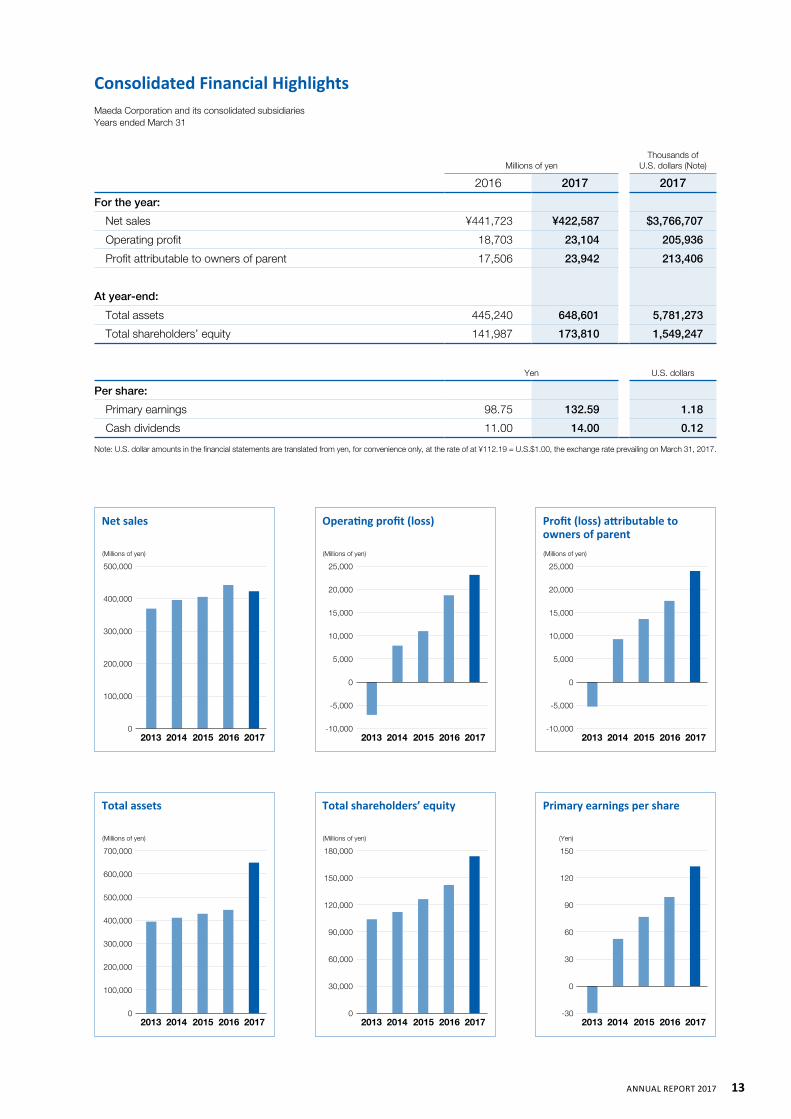
Consolidated Financial HighlightsMaeda Corporation and its consolidated subsidiariesYears ended March 31
Millions of yenThousands of
U.S. dollars (Note)
2016 2017 2017
For the year:
Net sales ¥441,723 ¥422,587 $3,766,707
Operating profit 18,703 23,104 205,936
Profit attributable to owners of parent 17,506 23,942 213,406
At year-end:
Total assets 445,240 648,601 5,781,273
Total shareholders’ equity 141,987 173,810 1,549,247
Yen U.S. dollars
Per share:
Primary earnings 98.75 132.59 1.18
Cash dividends 11.00 14.00 0.12
Note: U.S. dollar amounts in the financial statements are translated from yen, for convenience only, at the rate of at ¥112.19 = U.S.$1.00, the exchange rate prevailing on March 31, 2017.
(Millions of yen)
0
100,000
200,000
300,000
400,000
500,000
2015 2016 20172013 2014
Net sales
(Millions of yen)
0
100,000
200,000
300,000
700,000
600,000
500,000
400,000
2015 2016 20172013 2014
Total assets
(Millions of yen)
-10,000
-5,000
10,000
5,000
0
25,000
20,000
15,000
2015 2016 20172013 2014
Operating profit (loss)
(Millions of yen)
0
30,000
60,000
180,000
150,000
120,000
90,000
2015 2016 20172013 2014
Total shareholders’ equity
(Millions of yen)
-10,000
0
-5,000
5,000
25,000
20,000
15,000
10,000
2015 2016 20172013 2014
Profit (loss) attributable to owners of parent
(Yen)
-30
30
0
150
120
90
60
2015 2016 20172013 2014
Primary earnings per share
13AnnuAl RepoRt 2017
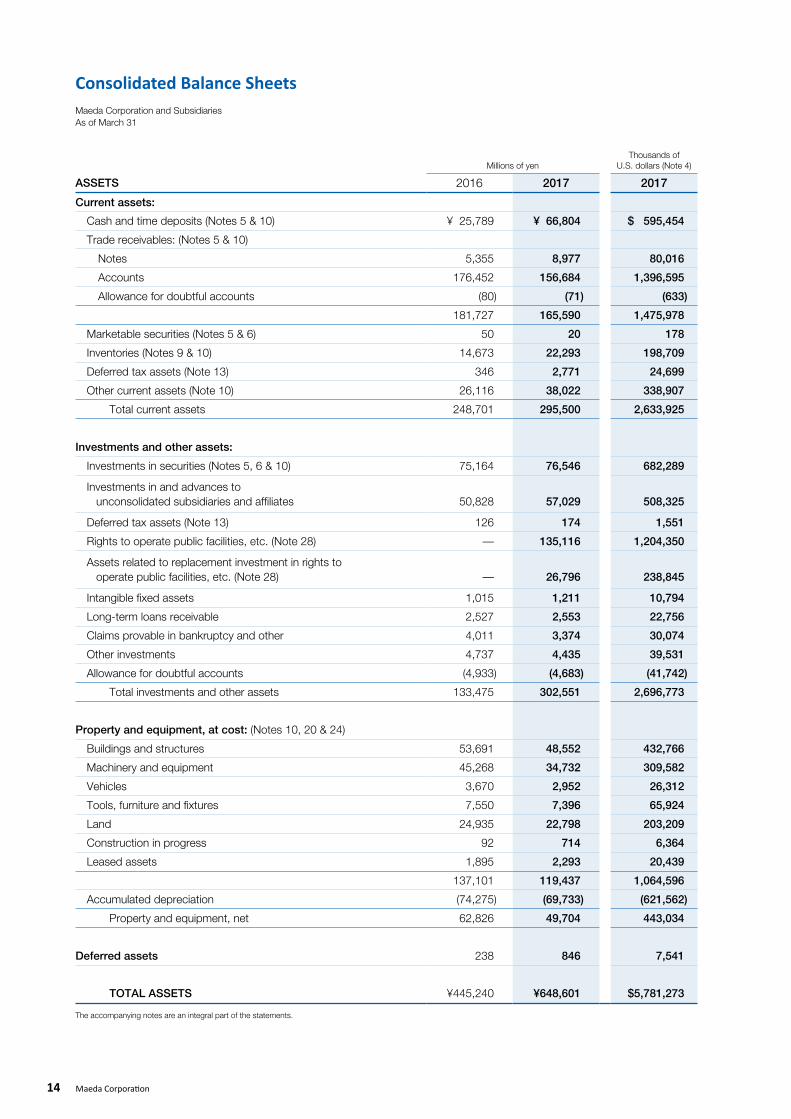
Consolidated Balance SheetsMaeda Corporation and SubsidiariesAs of March 31
Millions of yenThousands of
U.S. dollars (Note 4)
ASSETS 2016 2017 2017
Current assets:
Cash and time deposits (Notes 5 & 10) ¥ 25,789 ¥ 66,804 $ 595,454
Trade receivables: (Notes 5 & 10)
Notes 5,355 8,977 80,016
Accounts 176,452 156,684 1,396,595
Allowance for doubtful accounts (80) (71) (633)
181,727 165,590 1,475,978
Marketable securities (Notes 5 & 6) 50 20 178
Inventories (Notes 9 & 10) 14,673 22,293 198,709
Deferred tax assets (Note 13) 346 2,771 24,699
Other current assets (Note 10) 26,116 38,022 338,907
Total current assets 248,701 295,500 2,633,925
Investments and other assets:
Investments in securities (Notes 5, 6 & 10) 75,164 76,546 682,289
Investments in and advances to unconsolidated subsidiaries and affiliates 50,828 57,029 508,325
Deferred tax assets (Note 13) 126 174 1,551
Rights to operate public facilities, etc. (Note 28) — 135,116 1,204,350
Assets related to replacement investment in rights to operate public facilities, etc. (Note 28) — 26,796 238,845
Intangible fixed assets 1,015 1,211 10,794
Long-term loans receivable 2,527 2,553 22,756
Claims provable in bankruptcy and other 4,011 3,374 30,074
Other investments 4,737 4,435 39,531
Allowance for doubtful accounts (4,933) (4,683) (41,742)
Total investments and other assets 133,475 302,551 2,696,773
Property and equipment, at cost: (Notes 10, 20 & 24)
Buildings and structures 53,691 48,552 432,766
Machinery and equipment 45,268 34,732 309,582
Vehicles 3,670 2,952 26,312
Tools, furniture and fixtures 7,550 7,396 65,924
Land 24,935 22,798 203,209
Construction in progress 92 714 6,364
Leased assets 1,895 2,293 20,439
137,101 119,437 1,064,596
Accumulated depreciation (74,275) (69,733) (621,562)
Property and equipment, net 62,826 49,704 443,034
Deferred assets 238 846 7,541
TOTAL ASSETS ¥445,240 ¥648,601 $5,781,273
The accompanying notes are an integral part of the statements.
14 Maeda Corporation
Millions of yenThousands of
U.S. dollars (Note 4)
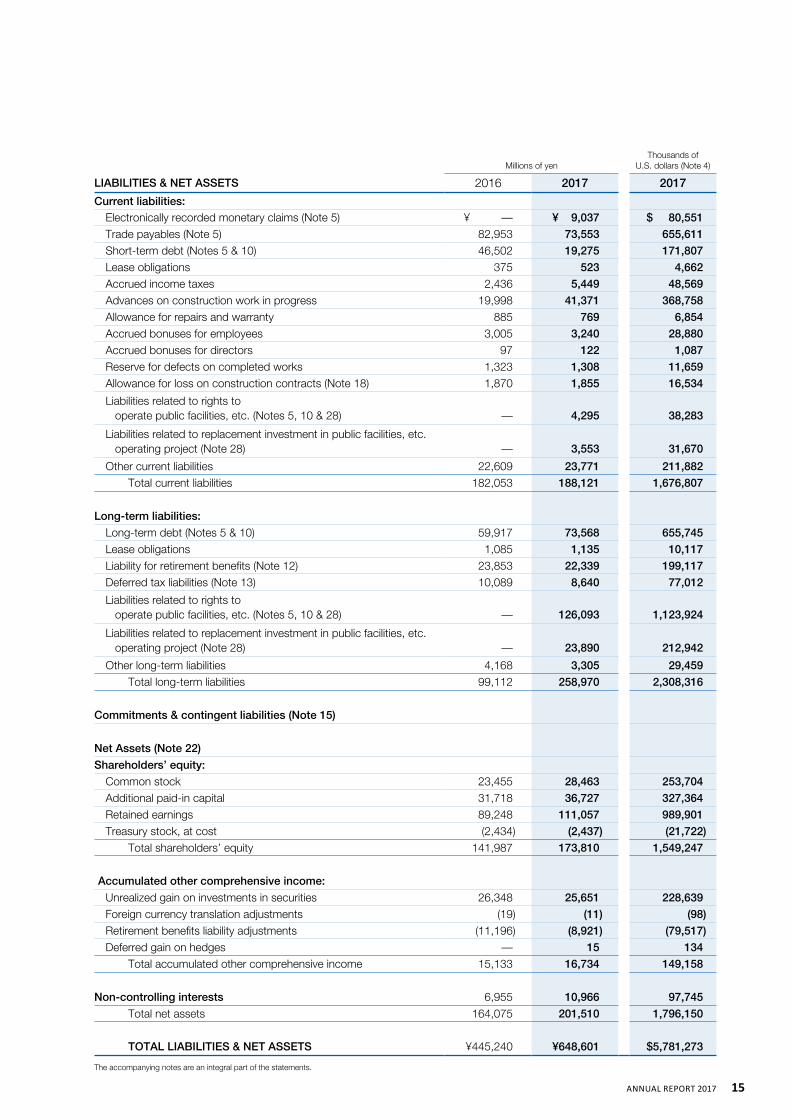
LIABILITIES & NET ASSETS 2016 2017 2017
Current liabilities:Electronically recorded monetary claims (Note 5) ¥ — ¥ 9,037 $ 80,551
Trade payables (Note 5) 82,953 73,553 655,611
Short-term debt (Notes 5 & 10) 46,502 19,275 171,807
Lease obligations 375 523 4,662
Accrued income taxes 2,436 5,449 48,569
Advances on construction work in progress 19,998 41,371 368,758
Allowance for repairs and warranty 885 769 6,854
Accrued bonuses for employees 3,005 3,240 28,880
Accrued bonuses for directors 97 122 1,087
Reserve for defects on completed works 1,323 1,308 11,659
Allowance for loss on construction contracts (Note 18) 1,870 1,855 16,534
Liabilities related to rights to operate public facilities, etc. (Notes 5, 10 & 28) — 4,295 38,283
Liabilities related to replacement investment in public facilities, etc. operating project (Note 28) — 3,553 31,670
Other current liabilities 22,609 23,771 211,882
Total current liabilities 182,053 188,121 1,676,807
Long-term liabilities:
Long-term debt (Notes 5 & 10) 59,917 73,568 655,745
Lease obligations 1,085 1,135 10,117
Liability for retirement benefits (Note 12) 23,853 22,339 199,117
Deferred tax liabilities (Note 13) 10,089 8,640 77,012
Liabilities related to rights to operate public facilities, etc. (Notes 5, 10 & 28) — 126,093 1,123,924
Liabilities related to replacement investment in public facilities, etc. operating project (Note 28) — 23,890 212,942
Other long-term liabilities 4,168 3,305 29,459
Total long-term liabilities 99,112 258,970 2,308,316
Commitments & contingent liabilities (Note 15)
Net Assets (Note 22)
Shareholders’ equity:
Common stock 23,455 28,463 253,704
Additional paid-in capital 31,718 36,727 327,364
Retained earnings 89,248 111,057 989,901
Treasury stock, at cost (2,434) (2,437) (21,722)
Total shareholders’ equity 141,987 173,810 1,549,247
Accumulated other comprehensive income:
Unrealized gain on investments in securities 26,348 25,651 228,639
Foreign currency translation adjustments (19) (11) (98)
Retirement benefits liability adjustments (11,196) (8,921) (79,517)
Deferred gain on hedges — 15 134
Total accumulated other comprehensive income 15,133 16,734 149,158
Non-controlling interests 6,955 10,966 97,745
Total net assets 164,075 201,510 1,796,150
TOTAL LIABILITIES & NET ASSETS ¥445,240 ¥648,601 $5,781,273
The accompanying notes are an integral part of the statements.
15AnnuAl RepoRt 2017
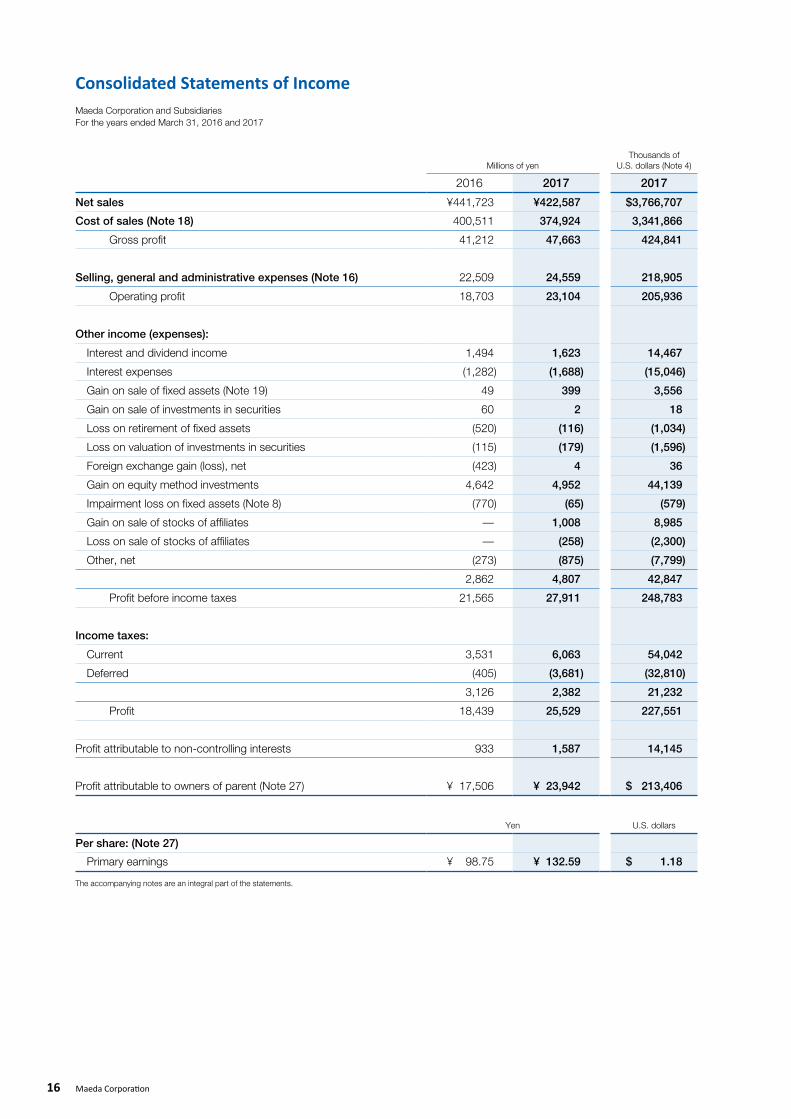
Consolidated Statements of IncomeMaeda Corporation and SubsidiariesFor the years ended March 31, 2016 and 2017
Millions of yenThousands of
U.S. dollars (Note 4)
2016 2017 2017
Net sales ¥441,723 ¥422,587 $3,766,707
Cost of sales (Note 18) 400,511 374,924 3,341,866
Gross profit 41,212 47,663 424,841
Selling, general and administrative expenses (Note 16) 22,509 24,559 218,905
Operating profit 18,703 23,104 205,936
Other income (expenses):
Interest and dividend income 1,494 1,623 14,467
Interest expenses (1,282) (1,688) (15,046)
Gain on sale of fixed assets (Note 19) 49 399 3,556
Gain on sale of investments in securities 60 2 18
Loss on retirement of fixed assets (520) (116) (1,034)
Loss on valuation of investments in securities (115) (179) (1,596)
Foreign exchange gain (loss), net (423) 4 36
Gain on equity method investments 4,642 4,952 44,139
Impairment loss on fixed assets (Note 8) (770) (65) (579)
Gain on sale of stocks of affiliates — 1,008 8,985
Loss on sale of stocks of affiliates — (258) (2,300)
Other, net (273) (875) (7,799)
2,862 4,807 42,847
Profit before income taxes 21,565 27,911 248,783
Income taxes:
Current 3,531 6,063 54,042
Deferred (405) (3,681) (32,810)
3,126 2,382 21,232
Profit 18,439 25,529 227,551
Profit attributable to non-controlling interests 933 1,587 14,145
Profit attributable to owners of parent (Note 27) ¥ 17,506 ¥ 23,942 $ 213,406
Yen U.S. dollars
Per share: (Note 27)
Primary earnings ¥ 98.75 ¥ 132.59 $ 1.18
The accompanying notes are an integral part of the statements.
16 Maeda Corporation
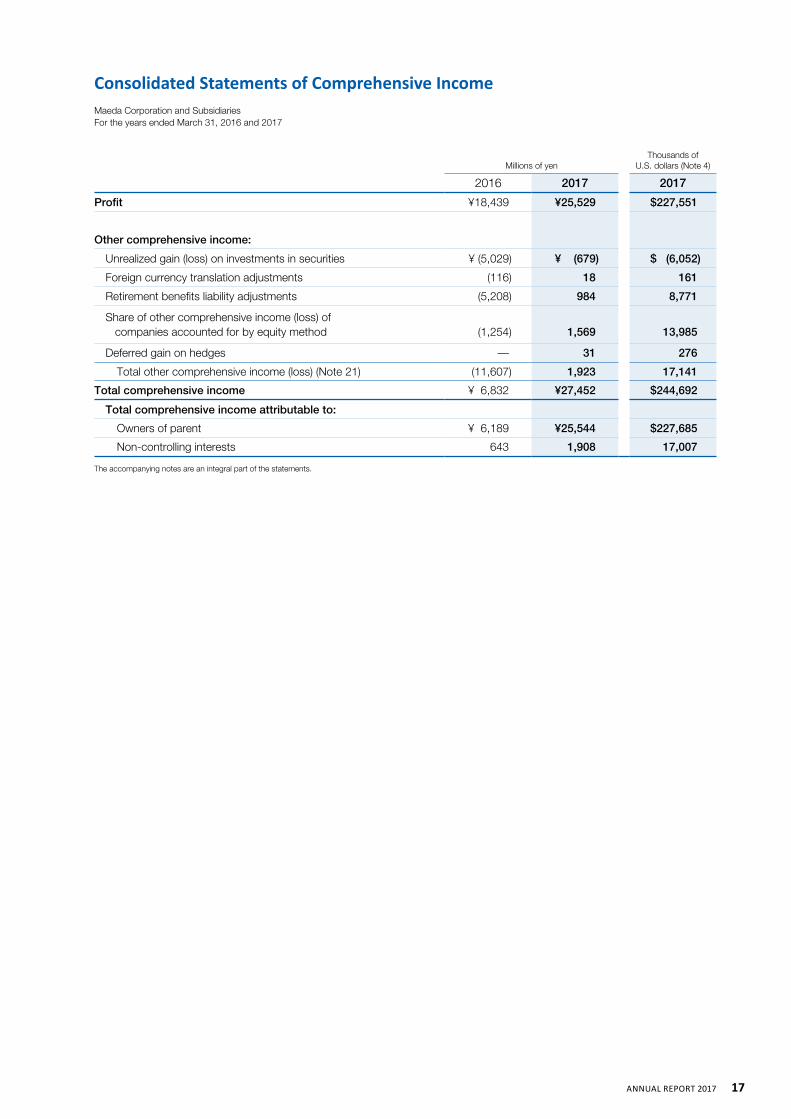
Consolidated Statements of Comprehensive IncomeMaeda Corporation and SubsidiariesFor the years ended March 31, 2016 and 2017
Millions of yenThousands of
U.S. dollars (Note 4)
2016 2017 2017
Profit ¥18,439 ¥25,529 $227,551
Other comprehensive income:
Unrealized gain (loss) on investments in securities ¥ (5,029) ¥ (679) $ (6,052)
Foreign currency translation adjustments (116) 18 161
Retirement benefits liability adjustments (5,208) 984 8,771
Share of other comprehensive income (loss) of companies accounted for by equity method (1,254) 1,569 13,985
Deferred gain on hedges — 31 276
Total other comprehensive income (loss) (Note 21) (11,607) 1,923 17,141
Total comprehensive income ¥ 6,832 ¥27,452 $244,692
Total comprehensive income attributable to:
Owners of parent ¥ 6,189 ¥25,544 $227,685
Non-controlling interests 643 1,908 17,007
The accompanying notes are an integral part of the statements.
17AnnuAl RepoRt 2017
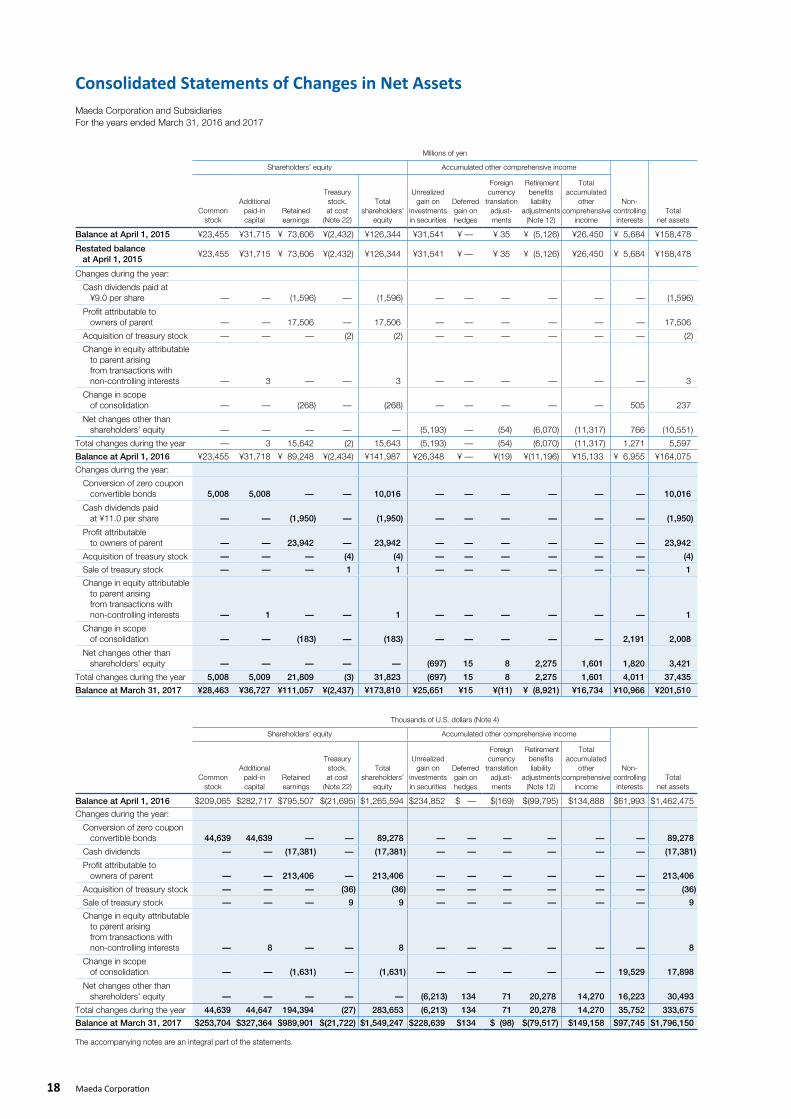
Consolidated Statements of Changes in Net AssetsMaeda Corporation and SubsidiariesFor the years ended March 31, 2016 and 2017
Millions of yen
Shareholders’ equity Accumulated other comprehensive income
Non- controlling interests
Total net assets
Common stock
Additional paid-in capital
Retained earnings
Treasury stock, at cost
(Note 22)
Total shareholders’
equity
Unrealized gain on
investments in securities
Deferred gain on hedges
Foreign currency
translation adjust-ments
Retirement benefits liability
adjustments (Note 12)
Total accumulated
other comprehensive
income
Balance at April 1, 2015 ¥23,455 ¥31,715 ¥ 73,606 ¥(2,432) ¥126,344 ¥31,541 ¥ — ¥ 35 ¥ (5,126) ¥26,450 ¥ 5,684 ¥158,478
Restated balance at April 1, 2015
¥23,455 ¥31,715 ¥ 73,606 ¥(2,432) ¥126,344 ¥31,541 ¥ — ¥ 35 ¥ (5,126) ¥26,450 ¥ 5,684 ¥158,478
Changes during the year:
Cash dividends paid at ¥9.0 per share — — (1,596) — (1,596) — — — — — — (1,596)
Profit attributable to owners of parent — — 17,506 — 17,506 — — — — — — 17,506
Acquisition of treasury stock — — — (2) (2) — — — — — — (2)
Change in equity attributable to parent arising from transactions with non-controlling interests — 3 — — 3 — — — — — — 3
Change in scope of consolidation — — (268) — (268) — — — — — 505 237
Net changes other than shareholders’ equity — — — — — (5,193) — (54) (6,070) (11,317) 766 (10,551)
Total changes during the year — 3 15,642 (2) 15,643 (5,193) — (54) (6,070) (11,317) 1,271 5,597
Balance at April 1, 2016 ¥23,455 ¥31,718 ¥ 89,248 ¥(2,434) ¥141,987 ¥26,348 ¥ — ¥(19) ¥(11,196) ¥15,133 ¥ 6,955 ¥164,075
Changes during the year:
Conversion of zero coupon convertible bonds 5,008 5,008 — — 10,016 — — — — — — 10,016
Cash dividends paid at ¥11.0 per share — — (1,950) — (1,950) — — — — — — (1,950)
Profit attributable to owners of parent — — 23,942 — 23,942 — — — — — — 23,942
Acquisition of treasury stock — — — (4) (4) — — — — — — (4)
Sale of treasury stock — — — 1 1 — — — — — — 1
Change in equity attributable to parent arising from transactions with non-controlling interests — 1 — — 1 — — — — — — 1
Change in scope of consolidation — — (183) — (183) — — — — — 2,191 2,008
Net changes other than shareholders’ equity — — — — — (697) 15 8 2,275 1,601 1,820 3,421
Total changes during the year 5,008 5,009 21,809 (3) 31,823 (697) 15 8 2,275 1,601 4,011 37,435
Balance at March 31, 2017 ¥28,463 ¥36,727 ¥111,057 ¥(2,437) ¥173,810 ¥25,651 ¥15 ¥(11) ¥ (8,921) ¥16,734 ¥10,966 ¥201,510
Thousands of U.S. dollars (Note 4)
Shareholders’ equity Accumulated other comprehensive income
Non- controlling interests
Total net assets
Common stock
Additional paid-in capital
Retained earnings
Treasury stock, at cost
(Note 22)
Total shareholders’
equity
Unrealized gain on
investments in securities
Deferred gain on hedges
Foreign currency
translation adjust-ments
Retirement benefits liability
adjustments (Note 12)
Total accumulated
other comprehensive
income
Balance at April 1, 2016 $209,065 $282,717 $795,507 $(21,695) $1,265,594 $234,852 $ — $(169) $(99,795) $134,888 $61,993 $1,462,475
Changes during the year:
Conversion of zero coupon convertible bonds 44,639 44,639 — — 89,278 — — — — — — 89,278
Cash dividends — — (17,381) — (17,381) — — — — — — (17,381)
Profit attributable to owners of parent — — 213,406 — 213,406 — — — — — — 213,406
Acquisition of treasury stock — — — (36) (36) — — — — — — (36)
Sale of treasury stock — — — 9 9 — — — — — — 9
Change in equity attributable to parent arising from transactions with non-controlling interests — 8 — — 8 — — — — — — 8
Change in scope of consolidation — — (1,631) — (1,631) — — — — — 19,529 17,898
Net changes other than shareholders’ equity — — — — — (6,213) 134 71 20,278 14,270 16,223 30,493
Total changes during the year 44,639 44,647 194,394 (27) 283,653 (6,213) 134 71 20,278 14,270 35,752 333,675
Balance at March 31, 2017 $253,704 $327,364 $989,901 $(21,722) $1,549,247 $228,639 $134 $ (98) $(79,517) $149,158 $97,745 $1,796,150
The accompanying notes are an integral part of the statements.
18 Maeda Corporation
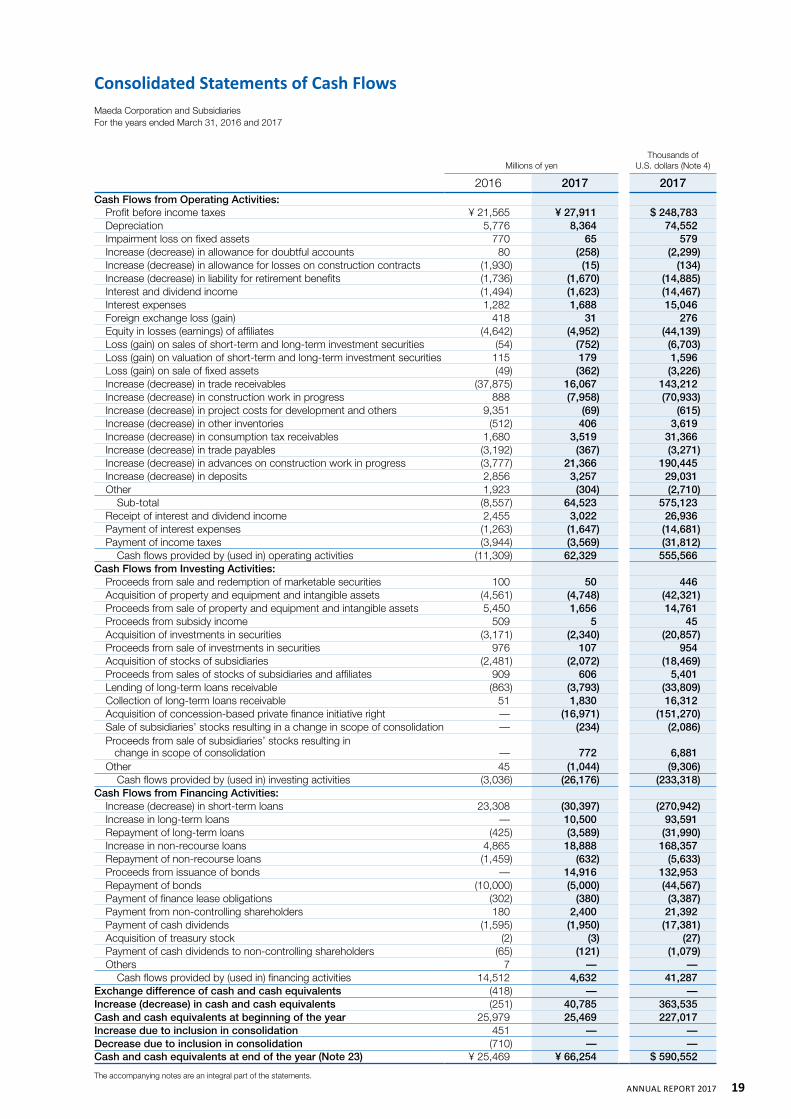
Consolidated Statements of Cash FlowsMaeda Corporation and SubsidiariesFor the years ended March 31, 2016 and 2017
Millions of yenThousands of
U.S. dollars (Note 4)
2016 2017 2017Cash Flows from Operating Activities:
Profit before income taxes ¥ 21,565 ¥ 27,911 $ 248,783 Depreciation 5,776 8,364 74,552 Impairment loss on fixed assets 770 65 579 Increase (decrease) in allowance for doubtful accounts 80 (258) (2,299)Increase (decrease) in allowance for losses on construction contracts (1,930) (15) (134)Increase (decrease) in liability for retirement benefits (1,736) (1,670) (14,885)Interest and dividend income (1,494) (1,623) (14,467)Interest expenses 1,282 1,688 15,046 Foreign exchange loss (gain) 418 31 276 Equity in losses (earnings) of affiliates (4,642) (4,952) (44,139)Loss (gain) on sales of short-term and long-term investment securities (54) (752) (6,703)Loss (gain) on valuation of short-term and long-term investment securities 115 179 1,596 Loss (gain) on sale of fixed assets (49) (362) (3,226)Increase (decrease) in trade receivables (37,875) 16,067 143,212 Increase (decrease) in construction work in progress 888 (7,958) (70,933)Increase (decrease) in project costs for development and others 9,351 (69) (615)Increase (decrease) in other inventories (512) 406 3,619 Increase (decrease) in consumption tax receivables 1,680 3,519 31,366 Increase (decrease) in trade payables (3,192) (367) (3,271)Increase (decrease) in advances on construction work in progress (3,777) 21,366 190,445 Increase (decrease) in deposits 2,856 3,257 29,031 Other 1,923 (304) (2,710)
Sub-total (8,557) 64,523 575,123 Receipt of interest and dividend income 2,455 3,022 26,936 Payment of interest expenses (1,263) (1,647) (14,681)Payment of income taxes (3,944) (3,569) (31,812)
Cash flows provided by (used in) operating activities (11,309) 62,329 555,566 Cash Flows from Investing Activities:
Proceeds from sale and redemption of marketable securities 100 50 446 Acquisition of property and equipment and intangible assets (4,561) (4,748) (42,321)Proceeds from sale of property and equipment and intangible assets 5,450 1,656 14,761 Proceeds from subsidy income 509 5 45 Acquisition of investments in securities (3,171) (2,340) (20,857)Proceeds from sale of investments in securities 976 107 954 Acquisition of stocks of subsidiaries (2,481) (2,072) (18,469)Proceeds from sales of stocks of subsidiaries and affiliates 909 606 5,401 Lending of long-term loans receivable (863) (3,793) (33,809)Collection of long-term loans receivable 51 1,830 16,312 Acquisition of concession-based private finance initiative right — (16,971) (151,270)Sale of subsidiaries’ stocks resulting in a change in scope of consolidation — (234) (2,086)Proceeds from sale of subsidiaries’ stocks resulting in change in scope of consolidation — 772 6,881 Other 45 (1,044) (9,306)
Cash flows provided by (used in) investing activities (3,036) (26,176) (233,318)Cash Flows from Financing Activities:
Increase (decrease) in short-term loans 23,308 (30,397) (270,942)Increase in long-term loans — 10,500 93,591 Repayment of long-term loans (425) (3,589) (31,990)Increase in non-recourse loans 4,865 18,888 168,357 Repayment of non-recourse loans (1,459) (632) (5,633)Proceeds from issuance of bonds — 14,916 132,953 Repayment of bonds (10,000) (5,000) (44,567)Payment of finance lease obligations (302) (380) (3,387)Payment from non-controlling shareholders 180 2,400 21,392 Payment of cash dividends (1,595) (1,950) (17,381)Acquisition of treasury stock (2) (3) (27)Payment of cash dividends to non-controlling shareholders (65) (121) (1,079)Others 7 — —
Cash flows provided by (used in) financing activities 14,512 4,632 41,287 Exchange difference of cash and cash equivalents (418) — —Increase (decrease) in cash and cash equivalents (251) 40,785 363,535 Cash and cash equivalents at beginning of the year 25,979 25,469 227,017 Increase due to inclusion in consolidation 451 — —Decrease due to inclusion in consolidation (710) — —Cash and cash equivalents at end of the year (Note 23) ¥ 25,469 ¥ 66,254 $ 590,552
The accompanying notes are an integral part of the statements.
19AnnuAl RepoRt 2017
Notes to the Consolidated Financial Statements
01 Basis of Presenting Consolidated Financial Statements
Maeda Corporation and Subsidiaries
(1) Accounting principles and presentationMaeda Corporation (the “Company”) and its consolidated subsidiaries maintain their books of
account in conformity with the financial accounting standards of Japan, and, its foreign subsidiaries
maintain their books of account in conformity with those countries of domicile.
Effective April 1, 2008, the Company adopted the “Practical Solution to Unification of Accounting
Policies Applied to Foreign Subsidiaries for Consolidated Financial Statements (PITF No. 18)”. In
accordance with PITF No. 18, the accompanying consolidated financial statements for the years
ended March 31, 2016 and 2017 have been prepared by using, the accounts of foreign consolidated
subsidiaries prepared in accordance with either International Financial Reporting Standards (IFRS) or
accounting principles generally accepted in the United States as adjusted for certain items. Until
March 31, 2008, the accompanying consolidated financial statements had been prepared by using
the accounts of foreign consolidated subsidiaries prepared in accordance with accounting principles
generally accepted in their countries of domicile.
The accompanying consolidated financial statements have been prepared in accordance with
accounting principles generally accepted in Japan, which are different in certain respects as to the
application and disclosure requirements of IFRS, and have been compiled from the consolidated
financial statements prepared by the Company as required by the Financial Instruments and
Exchange Law of Japan.
Certain amounts in the prior years’ financial statements have been reclassified to conform to the
current year’s presentation.
Certain reclassifications have been made to present the accompanying consolidated financial
statements in a format which is familiar to readers outside Japan.
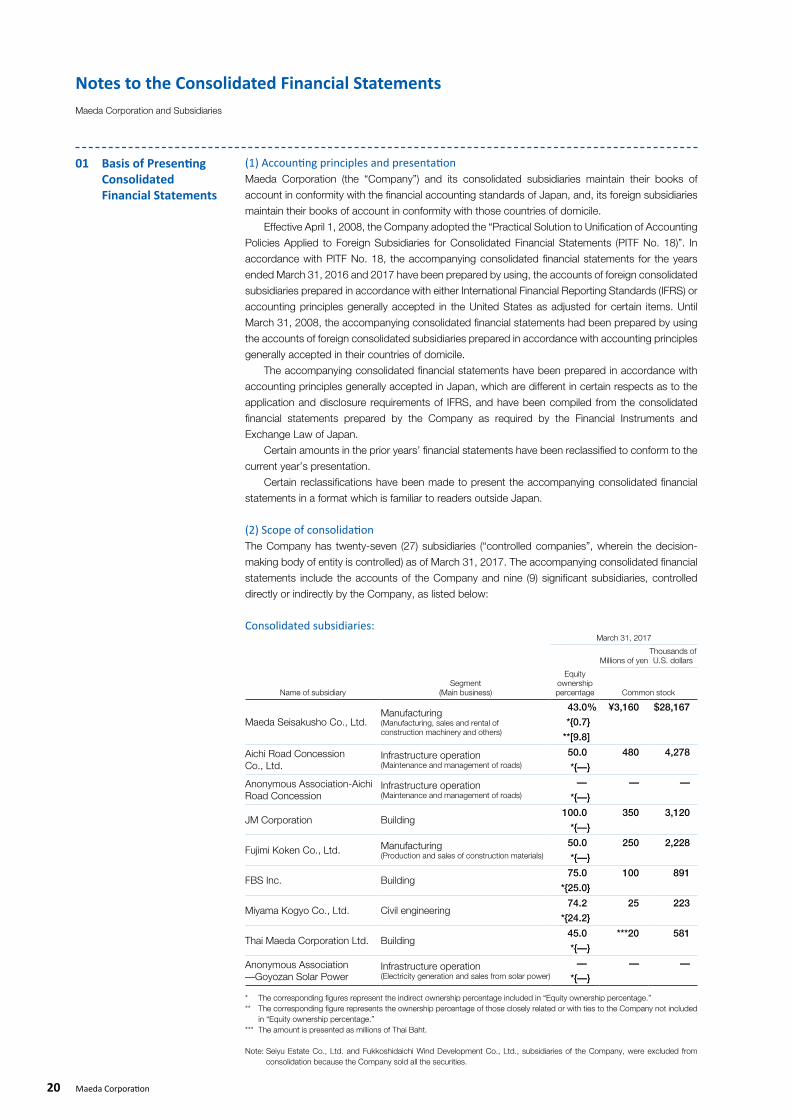
(2) Scope of consolidationThe Company has twenty-seven (27) subsidiaries (“controlled companies”, wherein the decision-
making body of entity is controlled) as of March 31, 2017. The accompanying consolidated financial
statements include the accounts of the Company and nine (9) significant subsidiaries, controlled
directly or indirectly by the Company, as listed below:
Consolidated subsidiaries:March 31, 2017
Millions of yenThousands of U.S. dollars
Name of subsidiarySegment
(Main business)
Equity ownershippercentage Common stock
Maeda Seisakusho Co., Ltd.Manufacturing(Manufacturing, sales and rental of construction machinery and others)
43.0% ¥3,160 $28,167
*{0.7}
**[9.8]
Aichi Road Concession Co., Ltd.
Infrastructure operation(Maintenance and management of roads)
50.0 480 4,278
*{—}
Anonymous Association-Aichi Road Concession
Infrastructure operation(Maintenance and management of roads)
— — —
*{—}
JM Corporation Building100.0 350 3,120
*{—}
Fujimi Koken Co., Ltd. Manufacturing(Production and sales of construction materials)
50.0 250 2,228
*{—}
FBS Inc. Building75.0 100 891
*{25.0}
Miyama Kogyo Co., Ltd. Civil engineering74.2 25 223
*{24.2}
Thai Maeda Corporation Ltd. Building45.0 ***20 581
*{—}
Anonymous Association —Goyozan Solar Power
Infrastructure operation (Electricity generation and sales from solar power)
— — —
*{—}
* The corresponding figures represent the indirect ownership percentage included in “Equity ownership percentage.”** The corresponding figure represents the ownership percentage of those closely related or with ties to the Company not included
in “Equity ownership percentage.”*** The amount is presented as millions of Thai Baht.
Note: Seiyu Estate Co., Ltd. and Fukkoshidaichi Wind Development Co., Ltd., subsidiaries of the Company, were excluded from consolidation because the Company sold all the securities.
20 Maeda Corporation
The accounts of the other eighteen (18) subsidiaries have not been consolidated with the Company
because of the insignificant amount of total assets, net sales, net profit and retained earnings, but
one (1) of the unconsolidated subsidiaries is accounted for by the equity method.
(3) Consolidation and eliminationFor the purposes of preparing the consolidated financial statements, all significant inter-company
transactions, account balances and unrealized profits among the Company and its consolidated
subsidiaries have been eliminated, and the portion thereof attributable to non-controlling interests is
charged to non-controlling interests.
Differences between the cost and the underlying net equity at fair value of investments in
consolidated subsidiaries and in companies which are accounted for by the equity method are
amortized by the straight-line method over periods not exceeding 5 years. However, immaterial
amounts of goodwill are charged to profit or loss in the year of acquisition.
(4) Investments in unconsolidated subsidiaries and affiliatesAs of March 31, 2017, the Company has twenty one (21) affiliates (“influenced companies”, wherein
the financial and operating or business decision-making body of an entity that is not a subsidiary can
be influenced to a material degree).
Investments in one (1) unconsolidated subsidiary and five (5) affiliates are accounted for by the
equity method, under which the Company’s equity in the net profit of these affiliates is included in
consolidated profit with appropriate elimination of inter-company profit as of March 31, 2017, and
for the year then ended. The remaining investments in unconsolidated subsidiaries and affiliates are
stated at cost since the investments do not have a material effect on consolidated net profit and
retained earnings in the consolidated financial statements.
Major unconsolidated subsidiary accounted for by the equity method;
J. City Corporation
Major affiliates accounted for by the equity method;
Maeda Road Construction Co., Ltd.
Toyo Construction Co., Ltd.
Major unconsolidated subsidiary not accounted for by the equity method;
Chiba City Consumer Life PFI Service Co., Ltd.
Major affiliate not accounted for by the equity method;
Jindai Hospital Parking Service Co., Ltd.
02 Summary of Significant Accounting Policies
(1) Revenue recognitionSales are recognized by the percentage-of-completion method for the construction contracts,
whose profit/loss and stage of completion of the contracts can be estimated reliably at the balance
sheet date, and by the completed-contract method for the other construction contracts.
Sales for the year ended March 31, 2017 include ¥337,262 million ($3,006,168 thousand) of
sales based on the percentage-of-completion method.
(2) Financial instruments1) Securities Bonds held to maturity: Amortized cost method
Other securities:
Securities with market value:
Market price method based on the market value as of the balance sheet date. (Net unrealized
gains or losses on these securities are reported as a separate item in net assets at a net-of-
tax amount, and sales costs are calculated based on the moving average cost method.)
Securities without market value: Moving average cost method
21AnnuAl RepoRt 2017
Notes to the Consolidated Financial Statements
2) DerivativesAll derivatives are stated at fair value, with changes in fair value included in net profit or loss for the
period in which they arise, except for derivatives that are designated as “hedging instruments”.
Gains or losses arising from changes in fair value of the derivatives designated as “hedging
instruments” are deferred as assets or liabilities and included in net profit or loss in the same period
during which the gains and losses on the hedged items or transactions are recognized.
The derivatives designated as hedging instruments by the Company are principally interest rate
swaps and forward foreign exchange contracts. The related hedged items are trade accounts
receivable and payable, long-term bank loans, and debt securities issued by the Company.
The Company has a policy of utilizing the above hedging instruments in order to reduce the
Company’s exposure to the risks of interest rate and exchange rate fluctuations. Thus, the
Company’s purchases of the hedging instruments are limited to, at maximum, the amounts of the
hedged items.
The Company evaluates effectiveness of its hedging activities by reference to the accumulated
gains or losses on the hedging instruments and the related hedged items from the commencement
of the hedges.
(3) InventoriesConstruction work in progress is stated at the specific identification cost.
Real estate held for sale, merchandise and finished products, project costs for development and
others and materials in stock are stated at the specific identification cost (write-down according to
decreased profitability method).
(4) Property and equipmentDepreciation costs of property and equipment are computed by the declining balance method over
the estimated useful lives of respective assets except for buildings (not including facilities annexed to
buildings) acquired on or after April 1, 1998, and facilities and structures acquired on or after April 1,
2016 whose depreciation costs are computed by the straight-line method over the estimated useful
lives of respective assets.
Useful lives and residual values of property and equipment are in accordance with the Corporation
Tax Act of Japan.
Depreciation costs of certain tangible assets held by certain consolidated subsidiaries are
computed by the straight-line method over the estimated useful life or in the proportion that
production for a period relates to management’s estimate of production.
(5) Intangible fixed assets and long-term prepaid expenseThe straight-line method is adopted. Rights to operate public facilities, etc. and assets related to
replacement investment in the public facilities, etc. operating project are amortized in the proportion
that production for a period relates to management’s estimate of production. Software for the
Company is amortized by the straight-line method over 5 years, the useful life set by the Company.
(6) Leased assetsThe leased assets under finance lease contracts that transfer ownership to the lessee are depreciated
by the same method applicable to the Company’s own fixed assets, but the leased assets that do
not transfer ownership are fully depreciated to a zero residual value by the straight-line method over
the period of the lease contract.
Finance lease contracts that do not transfer ownership to the lessee, which had commenced
prior to the adoption of the “Accounting Standard for Lease Transactions” (Accounting Standards
Board of Japan (ASBJ) Statement No. 13), out of the finance lease contracts without title-transfer are
accounted for as ordinary operating lease contracts.
(7) Bond issuance expensesBond issuance expenses are fully amortized at the time of issuance.
(8) Deferred assetsDeferred assets are amortized on a straight-line basis over 5 years.
22 Maeda Corporation
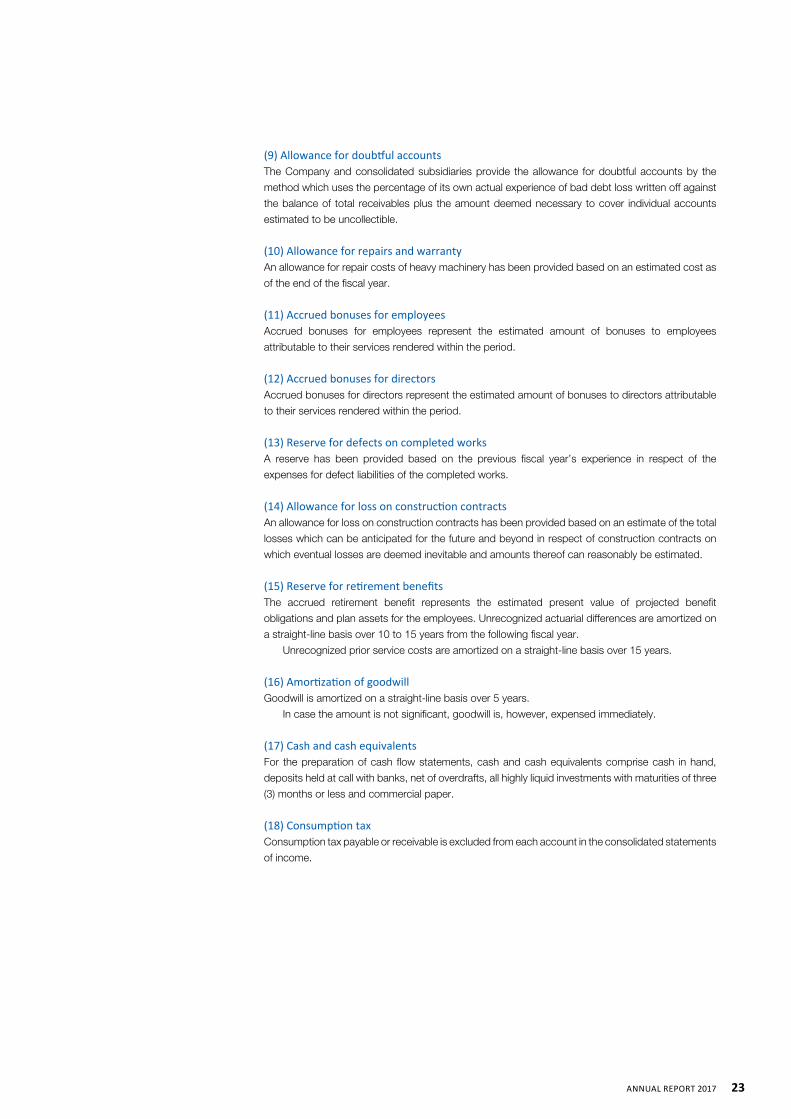
(9) Allowance for doubtful accountsThe Company and consolidated subsidiaries provide the allowance for doubtful accounts by the
method which uses the percentage of its own actual experience of bad debt loss written off against
the balance of total receivables plus the amount deemed necessary to cover individual accounts
estimated to be uncollectible.
(10) Allowance for repairs and warrantyAn allowance for repair costs of heavy machinery has been provided based on an estimated cost as
of the end of the fiscal year.
(11) Accrued bonuses for employeesAccrued bonuses for employees represent the estimated amount of bonuses to employees
attributable to their services rendered within the period.
(12) Accrued bonuses for directorsAccrued bonuses for directors represent the estimated amount of bonuses to directors attributable
to their services rendered within the period.
(13) Reserve for defects on completed worksA reserve has been provided based on the previous fiscal year’s experience in respect of the
expenses for defect liabilities of the completed works.
(14) Allowance for loss on construction contractsAn allowance for loss on construction contracts has been provided based on an estimate of the total
losses which can be anticipated for the future and beyond in respect of construction contracts on
which eventual losses are deemed inevitable and amounts thereof can reasonably be estimated.
(15) Reserve for retirement benefitsThe accrued retirement benefit represents the estimated present value of projected benefit
obligations and plan assets for the employees. Unrecognized actuarial differences are amortized on
a straight-line basis over 10 to 15 years from the following fiscal year.
Unrecognized prior service costs are amortized on a straight-line basis over 15 years.
(16) Amortization of goodwillGoodwill is amortized on a straight-line basis over 5 years.
In case the amount is not significant, goodwill is, however, expensed immediately.
(17) Cash and cash equivalentsFor the preparation of cash flow statements, cash and cash equivalents comprise cash in hand,
deposits held at call with banks, net of overdrafts, all highly liquid investments with maturities of three
(3) months or less and commercial paper.
(18) Consumption taxConsumption tax payable or receivable is excluded from each account in the consolidated statements
of income.
23AnnuAl RepoRt 2017
Notes to the Consolidated Financial Statements
03 Accounting Changes
04 U.S. Dollar Amounts
05 Financial Instruments
(1) Financial instruments1) Policy of financial instrumentsThe Company and its group raise funds mainly necessary for construction business according to its
financial planning by means of borrowings from banks and bonds.
Temporary surplus funds are managed by means of safe and secured financial instruments. The
Company has a policy of utilizing derivative transactions in order to avoid the Company’s exposure
to the risks mentioned below, but not for trading or speculative purposes.
2) Financial instruments, risks and risks managementNotes and accounts of trade receivables are exposed to the credit risks of the clients. The Company
attempts to reduce the risks of disability or delay in collection of debt by the routine confirmation of
the debt balances and examination of credit standing of each client in accordance with the project
award control procedures, the accounting rules and other rules of the Company. The consolidated
subsidiaries manage the risks according to the Company’s regulations.
Marketable securities and investments in securities include mainly the securities of subsidiaries,
affiliates, and business partners. Marketable securities of the business partners are exposed to the
stock market fluctuation risks, and the Company, examining the fair values and financial status of
such companies, makes continuous review of the possession situation, by taking the market
situation and the relationship with such companies into consideration.
Trade payables and others as liabilities are to be paid mostly within one year. Part of foreign
currency trade payables is exposed to the foreign exchange market fluctuation risks, but they are
constantly within the amount of the same foreign currency trade receivables. Forward foreign
exchange contracts are utilized against the payment for part of the amount fixed by the long-term
contract in order to avoid the exchange rate fluctuation risks.
Loans and bonds are utilized for the purpose of operating funds (mainly from short-term debt)
and investments in facilities and others (mainly from long-term debt). Variable interest loans are
exposed to interest rate fluctuation risks. Regarding part of long-term debt, interest rate swap
transactions are utilized per each contract in order to hedge the interest rate fluctuation risks and fix
interest payments. Forward foreign exchange contracts are utilized in order to hedge the exchange
rate fluctuation risks against part of foreign currency loans.
Liabilities related to rights to operate public facilities, etc. are the accounts payable for rights to
operate public facilities, etc. and they will be paid over the operating period. The accompanying
interest payments are fixed.
The risks in funding liquidity are managed and controlled by monitoring and maintaining the funding
liquidity in hand, and by preparing and reviewing the financial planning timely by the department in
charge based on the reports from the subsidiaries, affiliates and the branches of the Company. Cash
Management System (CMS) is operated among the consolidated subsidiaries and affiliates in order to
promote mutual exploitation of surplus funds within the Company’s group. It enhances efficiency of
The translation of yen amounts into U.S. dollar amounts is included solely for the convenience of
readers outside Japan and has been made, as a matter of arithmetic computation only, at ¥112.19
= U.S.$1.00, the approximate rate of exchange in effect on March 31, 2017. The translation should
not be construed as a representation that yen have been, could have been, or could in the future be,
converted into U.S. dollars at the above or any other rate.
As a result of revisions to the Corporate Tax Act of Japan, the Company and its domestic subsidiaries
adopted the “Practical Solution on Accounting for Changes in Depreciation Method” (ASBJ
Statement No. 32). As a result, the depreciation method of facilities annexed to buildings and
structures acquired on or after April 1, 2016 was changed from the declining-balance method over
the estimated useful life to the straight-line method. The impact of this change on operating profit,
ordinary profit, profit before income taxes and additional paid-in capital for the year ended and as of
March 31, 2017 was immaterial.
24 Maeda Corporation

funding, and is useful for the maintenance and management of the funding liquidity in hand.
The derivative transactions are conducted and managed in accordance with the Company’s
regulations for authority for approval, and such transactions are conducted only with highly-rated
financial institutions in order to reduce the credit risks.
The explanation for hedging instruments, hedged items, policy for hedge accounting and
evaluation of effectiveness of hedging activities are provided in aforementioned “2) Derivatives” of “(2)
Financial instruments” in Note “2. Summary of Significant Accounting Policies”.
3) Supplemental explanation on fair value of financial instrumentsThe fair values of financial instruments are based on the fair market value. The financial instruments
without market value, are evaluated by reasonable assessment, and such evaluations based on
variable factors may change in line with the adoption of new assumptions.
(2) Fair value and otherFair values of financial instruments, except for those for which the fair value is recognized as extremely
difficult to determine, as of March 31, 2016 and 2017 are summarized as follows:Millions of yen
March 31, 2016 Book value Fair value Difference
(a) Cash and time deposits ¥ 25,789 ¥ 25,789 ¥ —
(b) Trade receivables 181,807 181,751 (56)
(c) Marketable securities and investment in securities 117,199 118,318 1,119
Total assets ¥324,795 ¥325,858 ¥1,063
(a) Electronically recorded monetary claims ¥ — ¥ — ¥ —
(b) Trade payables 82,953 82,953 —
(c) Short-term loans 40,497 40,497 —
(d) Short-term non-recourse loans 1,005 1,005 —
(e) Current liabilities related to rights to operate public facilities, etc. — — —
( f ) Corporate bonds* 15,000 14,803 (197)
(g) Non-recourse corporate bonds 20 29 9
(h) Long-term loans 28,703 28,999 296
( i ) Long-term non-recourse loans 11,169 11,071 (98)
( j ) Long-term liabilities related to rights to operate public facilities, etc. — — —
Total liabilities ¥179,347 ¥179,357 ¥ 10
(a) Derivative transactions** ¥ — ¥ — ¥ —
Millions of yen
March 31, 2017 Book value Fair value Difference
(a) Cash and time deposits ¥ 66,804 ¥ 66,804 ¥ —
(b) Trade receivables 165,661 165,588 (72)
(c) Marketable securities and investments in securities 123,482 120,069 (3,414)
Total assets ¥355,947 ¥352,461 ¥(3,486)
(a) Electronically recorded monetary claims ¥ 9,037 ¥ 9,037 ¥ —
(b) Trade payables 73,552 73,552 —
(c) Short-term loans 18,317 18,317 —
(d) Short-term non-recourse loans 958 958 —
(e) Current liabilities related to rights to operate public facilities, etc. 4,295 4,295 —
(f ) Corporate bonds* 25,000 24,869 (131)
(g) Non-recourse corporate bonds 20 22 2
(h) Long-term loans 25,933 26,035 102
( i ) Long-term non-recourse loans 22,615 22,697 82
( j ) Long-term liabilities related to rights to operate public facilities, etc. 126,093 129,693 3,600
Total liabilities ¥305,820 ¥309,475 ¥ 3,655
(a) Derivative transactions** ¥ 33 ¥ 33 ¥ —
25AnnuAl RepoRt 2017
Notes to the Consolidated Financial Statements
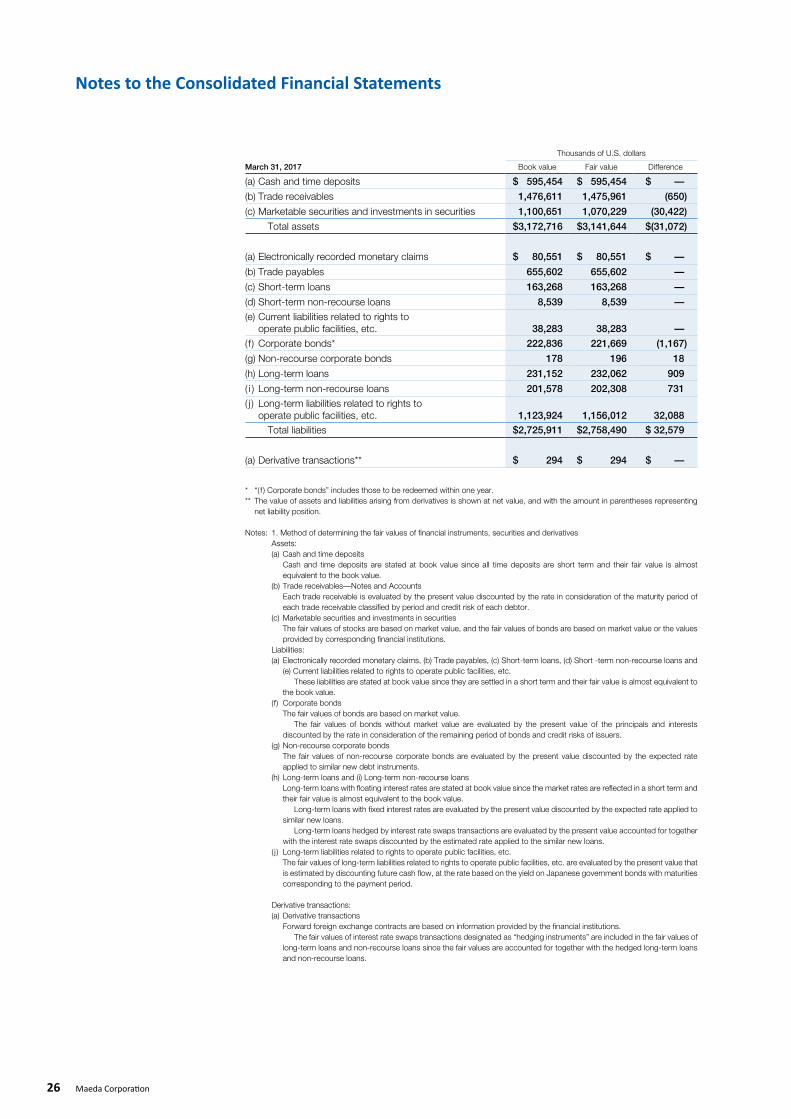
Thousands of U.S. dollars
March 31, 2017 Book value Fair value Difference
(a) Cash and time deposits $ 595,454 $ 595,454 $ —
(b) Trade receivables 1,476,611 1,475,961 (650)
(c) Marketable securities and investments in securities 1,100,651 1,070,229 (30,422)
Total assets $3,172,716 $3,141,644 $(31,072)
(a) Electronically recorded monetary claims $ 80,551 $ 80,551 $ —
(b) Trade payables 655,602 655,602 —
(c) Short-term loans 163,268 163,268 —
(d) Short-term non-recourse loans 8,539 8,539 —
(e) Current liabilities related to rights to operate public facilities, etc. 38,283 38,283 —
(f ) Corporate bonds* 222,836 221,669 (1,167)
(g) Non-recourse corporate bonds 178 196 18
(h) Long-term loans 231,152 232,062 909
( i ) Long-term non-recourse loans 201,578 202,308 731
( j ) Long-term liabilities related to rights to operate public facilities, etc. 1,123,924 1,156,012 32,088
Total liabilities $2,725,911 $2,758,490 $ 32,579
(a) Derivative transactions** $ 294 $ 294 $ —
* “( f ) Corporate bonds” includes those to be redeemed within one year.** The value of assets and liabilities arising from derivatives is shown at net value, and with the amount in parentheses representing
net liability position.
Notes: 1. Method of determining the fair values of financial instruments, securities and derivatives Assets: (a) Cash and time deposits Cash and time deposits are stated at book value since all time deposits are short term and their fair value is almost
equivalent to the book value. (b) Trade receivables—Notes and Accounts Each trade receivable is evaluated by the present value discounted by the rate in consideration of the maturity period of
each trade receivable classified by period and credit risk of each debtor. (c) Marketable securities and investments in securities The fair values of stocks are based on market value, and the fair values of bonds are based on market value or the values
provided by corresponding financial institutions. Liabilities: (a) Electronically recorded monetary claims, (b) Trade payables, (c) Short-term loans, (d) Short -term non-recourse loans and
(e) Current liabilities related to rights to operate public facilities, etc. These liabilities are stated at book value since they are settled in a short term and their fair value is almost equivalent to
the book value. (f) Corporate bonds The fair values of bonds are based on market value. The fair values of bonds without market value are evaluated by the present value of the principals and interests
discounted by the rate in consideration of the remaining period of bonds and credit risks of issuers. (g) Non-recourse corporate bonds The fair values of non-recourse corporate bonds are evaluated by the present value discounted by the expected rate
applied to similar new debt instruments. (h) Long-term loans and (i) Long-term non-recourse loans Long-term loans with floating interest rates are stated at book value since the market rates are reflected in a short term and
their fair value is almost equivalent to the book value. Long-term loans with fixed interest rates are evaluated by the present value discounted by the expected rate applied to
similar new loans. Long-term loans hedged by interest rate swaps transactions are evaluated by the present value accounted for together
with the interest rate swaps discounted by the estimated rate applied to the similar new loans. ( j ) Long-term liabilities related to rights to operate public facilities, etc. The fair values of long-term liabilities related to rights to operate public facilities, etc. are evaluated by the present value that
is estimated by discounting future cash flow, at the rate based on the yield on Japanese government bonds with maturities corresponding to the payment period.
Derivative transactions: (a) Derivative transactions Forward foreign exchange contracts are based on information provided by the financial institutions. The fair values of interest rate swaps transactions designated as “hedging instruments” are included in the fair values of
long-term loans and non-recourse loans since the fair values are accounted for together with the hedged long-term loans and non-recourse loans.
26 Maeda Corporation
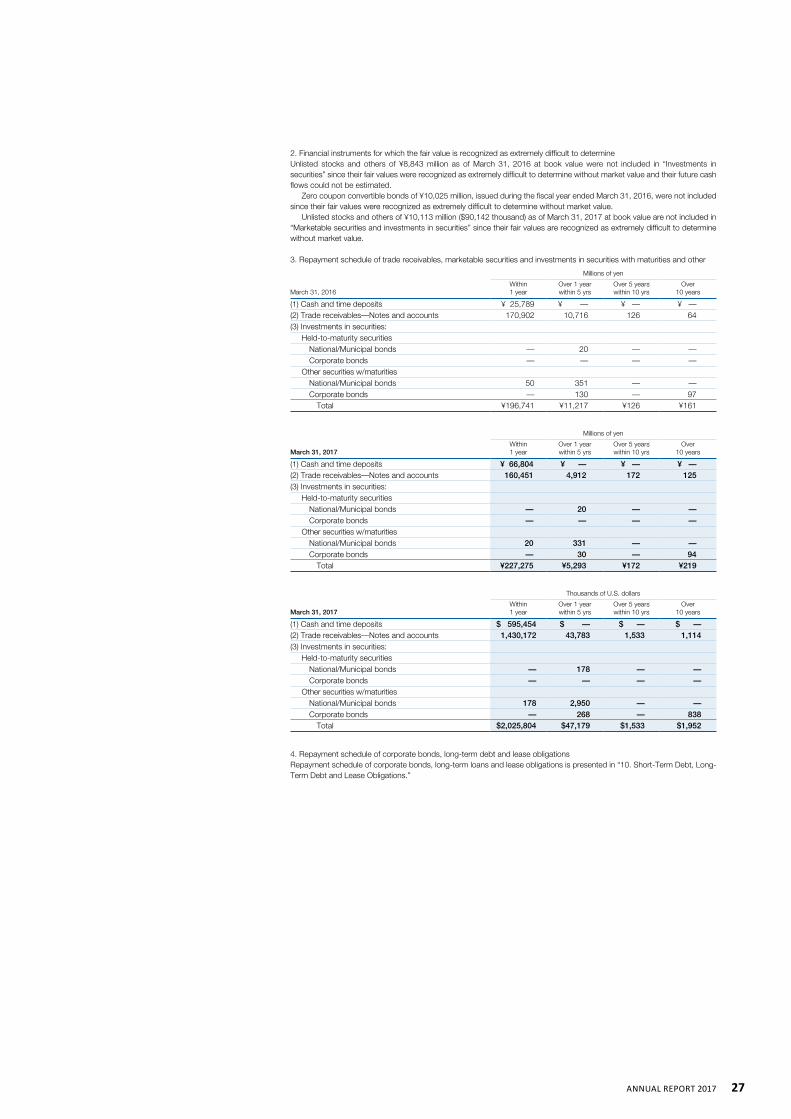
2. Financial instruments for which the fair value is recognized as extremely difficult to determine Unlisted stocks and others of ¥8,843 million as of March 31, 2016 at book value were not included in “Investments in
securities” since their fair values were recognized as extremely difficult to determine without market value and their future cash flows could not be estimated.
Zero coupon convertible bonds of ¥10,025 million, issued during the fiscal year ended March 31, 2016, were not included since their fair values were recognized as extremely difficult to determine without market value.
Unlisted stocks and others of ¥10,113 million ($90,142 thousand) as of March 31, 2017 at book value are not included in “Marketable securities and investments in securities” since their fair values are recognized as extremely difficult to determine without market value.
3. Repayment schedule of trade receivables, marketable securities and investments in securities with maturities and other
Millions of yen
March 31, 2016Within1 year
Over 1 yearwithin 5 yrs
Over 5 yearswithin 10 yrs
Over10 years
(1) Cash and time deposits ¥ 25,789 ¥ — ¥ — ¥ —(2) Trade receivables—Notes and accounts 170,902 10,716 126 64(3) Investments in securities:
Held-to-maturity securitiesNational/Municipal bonds — 20 — —Corporate bonds — — — —
Other securities w/maturitiesNational/Municipal bonds 50 351 — —Corporate bonds — 130 — 97
Total ¥196,741 ¥11,217 ¥126 ¥161
Millions of yen
March 31, 2017Within1 year
Over 1 yearwithin 5 yrs
Over 5 yearswithin 10 yrs
Over10 years
(1) Cash and time deposits ¥ 66,804 ¥ — ¥ — ¥ —(2) Trade receivables—Notes and accounts 160,451 4,912 172 125(3) Investments in securities:
Held-to-maturity securitiesNational/Municipal bonds — 20 — —Corporate bonds — — — —
Other securities w/maturitiesNational/Municipal bonds 20 331 — —Corporate bonds — 30 — 94
Total ¥227,275 ¥5,293 ¥172 ¥219
Thousands of U.S. dollars
March 31, 2017Within1 year
Over 1 yearwithin 5 yrs
Over 5 yearswithin 10 yrs
Over10 years
(1) Cash and time deposits $ 595,454 $ — $ — $ —(2) Trade receivables—Notes and accounts 1,430,172 43,783 1,533 1,114(3) Investments in securities:
Held-to-maturity securitiesNational/Municipal bonds — 178 — —Corporate bonds — — — —
Other securities w/maturitiesNational/Municipal bonds 178 2,950 — —Corporate bonds — 268 — 838
Total $2,025,804 $47,179 $1,533 $1,952
4. Repayment schedule of corporate bonds, long-term debt and lease obligations Repayment schedule of corporate bonds, long-term loans and lease obligations is presented in “10. Short-Term Debt, Long-
Term Debt and Lease Obligations.”
27AnnuAl RepoRt 2017
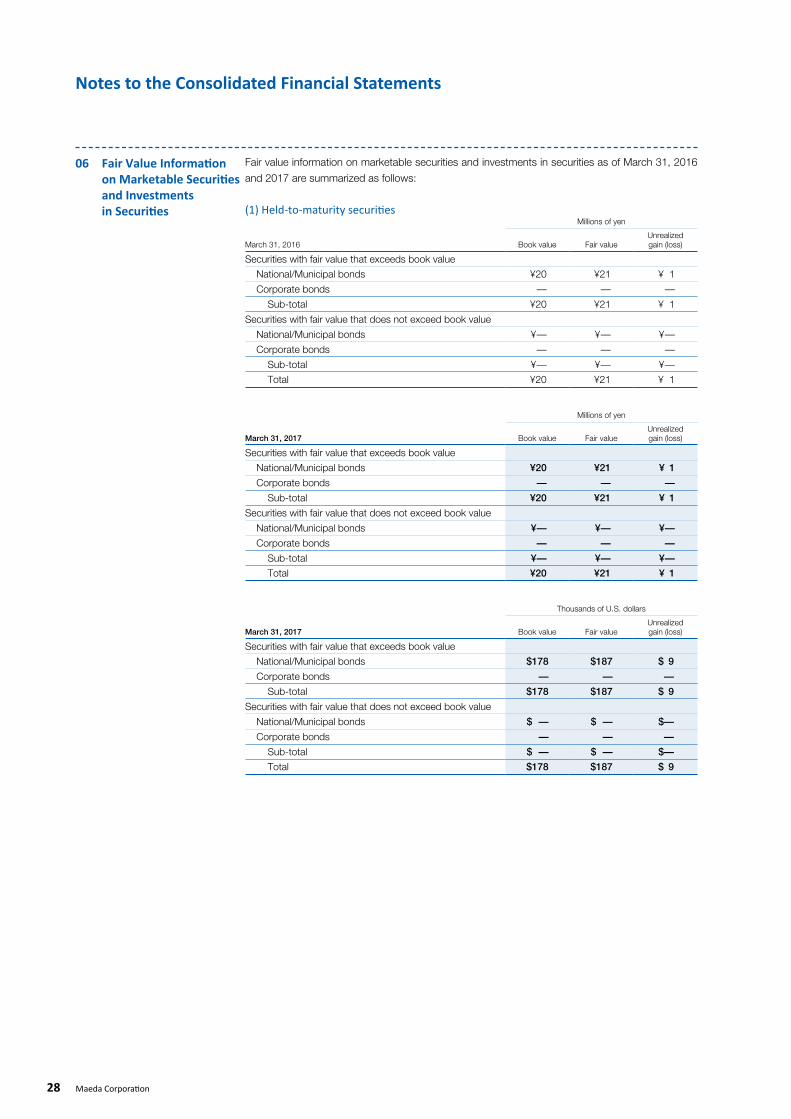
Notes to the Consolidated Financial Statements
06 Fair Value Information on Marketable Securities and Investments in Securities
Fair value information on marketable securities and investments in securities as of March 31, 2016
and 2017 are summarized as follows:
(1) Held-to-maturity securitiesMillions of yen
March 31, 2016 Book value Fair valueUnrealized gain (loss)
Securities with fair value that exceeds book value
National/Municipal bonds ¥20 ¥21 ¥ 1
Corporate bonds — — —
Sub-total ¥20 ¥21 ¥ 1
Securities with fair value that does not exceed book value
National/Municipal bonds ¥— ¥— ¥—
Corporate bonds — — —
Sub-total ¥— ¥— ¥—
Total ¥20 ¥21 ¥ 1
Millions of yen
March 31, 2017 Book value Fair valueUnrealized gain (loss)
Securities with fair value that exceeds book value
National/Municipal bonds ¥20 ¥21 ¥ 1
Corporate bonds — — —
Sub-total ¥20 ¥21 ¥ 1
Securities with fair value that does not exceed book value
National/Municipal bonds ¥— ¥— ¥—
Corporate bonds — — —
Sub-total ¥— ¥— ¥—
Total ¥20 ¥21 ¥ 1
Thousands of U.S. dollars
March 31, 2017 Book value Fair valueUnrealized gain (loss)
Securities with fair value that exceeds book value
National/Municipal bonds $178 $187 $ 9
Corporate bonds — — —
Sub-total $178 $187 $ 9
Securities with fair value that does not exceed book value
National/Municipal bonds $ — $ — $—
Corporate bonds — — —
Sub-total $ — $ — $—
Total $178 $187 $ 9
28 Maeda Corporation
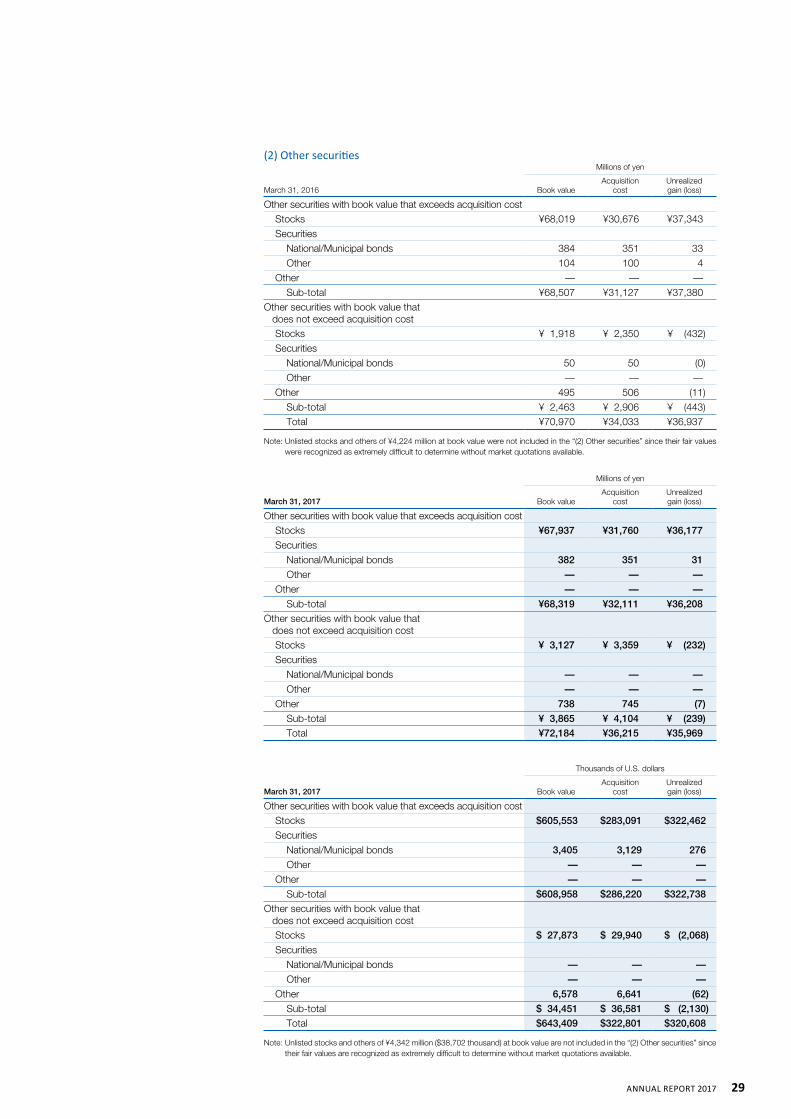
(2) Other securitiesMillions of yen
March 31, 2016 Book valueAcquisition
costUnrealizedgain (loss)
Other securities with book value that exceeds acquisition costStocks ¥68,019 ¥30,676 ¥37,343
Securities
National/Municipal bonds 384 351 33
Other 104 100 4
Other — — —
Sub-total ¥68,507 ¥31,127 ¥37,380 Other securities with book value that does not exceed acquisition cost
Stocks ¥ 1,918 ¥ 2,350 ¥ (432)
Securities
National/Municipal bonds 50 50 (0)
Other — — —
Other 495 506 (11)
Sub-total ¥ 2,463 ¥ 2,906 ¥ (443)Total ¥70,970 ¥34,033 ¥36,937
Note: Unlisted stocks and others of ¥4,224 million at book value were not included in the “(2) Other securities” since their fair values were recognized as extremely difficult to determine without market quotations available.
Millions of yen
March 31, 2017 Book valueAcquisition
costUnrealizedgain (loss)
Other securities with book value that exceeds acquisition costStocks ¥67,937 ¥31,760 ¥36,177
Securities
National/Municipal bonds 382 351 31
Other — — —
Other — — —
Sub-total ¥68,319 ¥32,111 ¥36,208 Other securities with book value that does not exceed acquisition cost
Stocks ¥ 3,127 ¥ 3,359 ¥ (232)
Securities
National/Municipal bonds — — —
Other — — —
Other 738 745 (7)
Sub-total ¥ 3,865 ¥ 4,104 ¥ (239)Total ¥72,184 ¥36,215 ¥35,969
Thousands of U.S. dollars
March 31, 2017 Book valueAcquisition
costUnrealizedgain (loss)
Other securities with book value that exceeds acquisition costStocks $605,553 $283,091 $322,462
Securities
National/Municipal bonds 3,405 3,129 276
Other — — —
Other — — —
Sub-total $608,958 $286,220 $322,738 Other securities with book value that does not exceed acquisition cost
Stocks $ 27,873 $ 29,940 $ (2,068)
Securities
National/Municipal bonds — — —
Other — — —
Other 6,578 6,641 (62)
Sub-total $ 34,451 $ 36,581 $ (2,130)Total $643,409 $322,801 $320,608
Note: Unlisted stocks and others of ¥4,342 million ($38,702 thousand) at book value are not included in the “(2) Other securities” since their fair values are recognized as extremely difficult to determine without market quotations available.
29AnnuAl RepoRt 2017
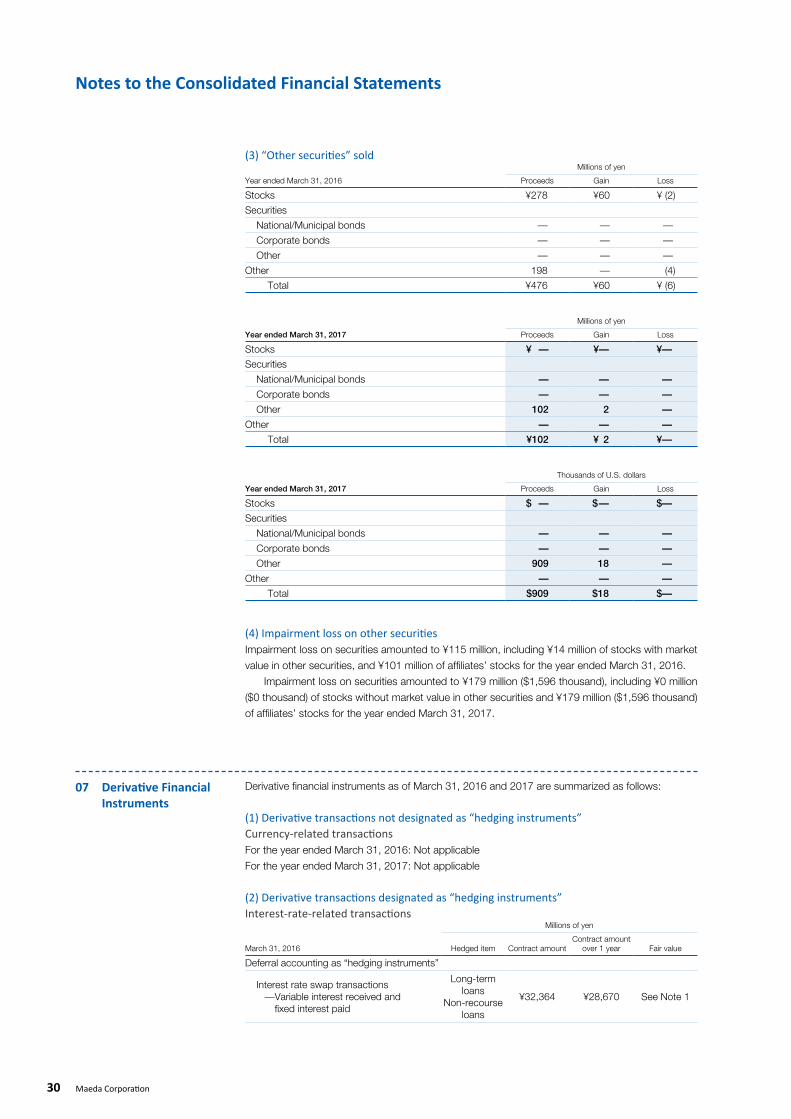
Notes to the Consolidated Financial Statements
(3) “Other securities” soldMillions of yen
Year ended March 31, 2016 Proceeds Gain Loss
Stocks ¥278 ¥60 ¥ (2)
Securities
National/Municipal bonds — — —
Corporate bonds — — —
Other — — —
Other 198 — (4)
Total ¥476 ¥60 ¥ (6)
Millions of yen
Year ended March 31, 2017 Proceeds Gain Loss
Stocks ¥ — ¥— ¥—
Securities
National/Municipal bonds — — —
Corporate bonds — — —
Other 102 2 —
Other — — —
Total ¥102 ¥ 2 ¥—
Thousands of U.S. dollars
Year ended March 31, 2017 Proceeds Gain Loss
Stocks $ — $— $—
Securities
National/Municipal bonds — — —
Corporate bonds — — —
Other 909 18 —
Other — — —
Total $909 $18 $—
(4) Impairment loss on other securitiesImpairment loss on securities amounted to ¥115 million, including ¥14 million of stocks with market
value in other securities, and ¥101 million of affiliates’ stocks for the year ended March 31, 2016.
Impairment loss on securities amounted to ¥179 million ($1,596 thousand), including ¥0 million
($0 thousand) of stocks without market value in other securities and ¥179 million ($1,596 thousand)
of affiliates’ stocks for the year ended March 31, 2017.
07 Derivative Financial Instruments
Derivative financial instruments as of March 31, 2016 and 2017 are summarized as follows:
(1) Derivative transactions not designated as “hedging instruments”Currency-related transactionsFor the year ended March 31, 2016: Not applicable
For the year ended March 31, 2017: Not applicable
(2) Derivative transactions designated as “hedging instruments”Interest-rate-related transactions
Millions of yen
March 31, 2016 Hedged item Contract amountContract amount
over 1 year Fair value
Deferral accounting as “hedging instruments”
Interest rate swap transactions — Variable interest received and
fixed interest paid
Long-term loans
Non-recourse loans
¥32,364 ¥28,670 See Note 1
30 Maeda Corporation
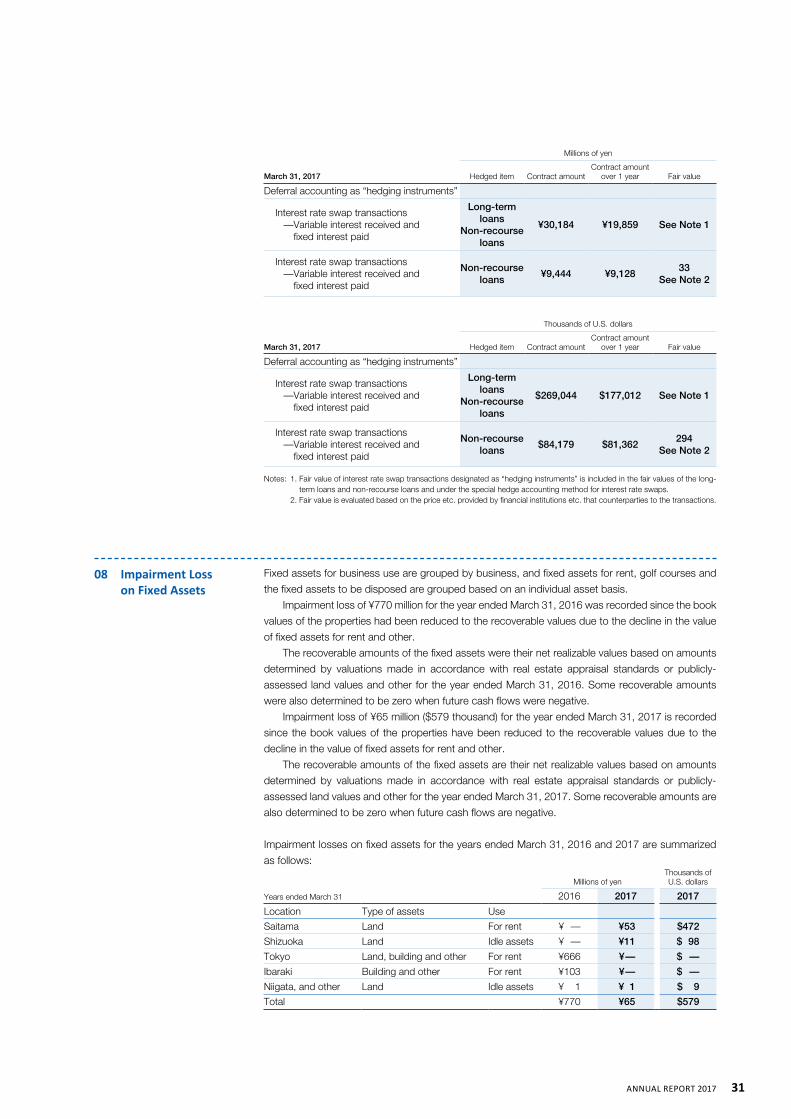
Millions of yen
March 31, 2017 Hedged item Contract amountContract amount
over 1 year Fair value
Deferral accounting as “hedging instruments”
Interest rate swap transactions — Variable interest received and
fixed interest paid
Long-term loans
Non-recourse loans
¥30,184 ¥19,859 See Note 1
Interest rate swap transactions — Variable interest received and
fixed interest paid
Non-recourse loans
¥9,444 ¥9,12833
See Note 2
Thousands of U.S. dollars
March 31, 2017 Hedged item Contract amountContract amount
over 1 year Fair value
Deferral accounting as “hedging instruments”
Interest rate swap transactions — Variable interest received and
fixed interest paid
Long-term loans
Non-recourse loans
$269,044 $177,012 See Note 1
Interest rate swap transactions — Variable interest received and
fixed interest paid
Non-recourse loans
$84,179 $81,362294
See Note 2
Notes: 1. Fair value of interest rate swap transactions designated as “hedging instruments” is included in the fair values of the long-term loans and non-recourse loans and under the special hedge accounting method for interest rate swaps.
2. Fair value is evaluated based on the price etc. provided by financial institutions etc. that counterparties to the transactions.
08 Impairment Loss on Fixed Assets
Fixed assets for business use are grouped by business, and fixed assets for rent, golf courses and
the fixed assets to be disposed are grouped based on an individual asset basis.
Impairment loss of ¥770 million for the year ended March 31, 2016 was recorded since the book
values of the properties had been reduced to the recoverable values due to the decline in the value
of fixed assets for rent and other.
The recoverable amounts of the fixed assets were their net realizable values based on amounts
determined by valuations made in accordance with real estate appraisal standards or publicly-
assessed land values and other for the year ended March 31, 2016. Some recoverable amounts
were also determined to be zero when future cash flows were negative.
Impairment loss of ¥65 million ($579 thousand) for the year ended March 31, 2017 is recorded
since the book values of the properties have been reduced to the recoverable values due to the
decline in the value of fixed assets for rent and other.
The recoverable amounts of the fixed assets are their net realizable values based on amounts
determined by valuations made in accordance with real estate appraisal standards or publicly-
assessed land values and other for the year ended March 31, 2017. Some recoverable amounts are
also determined to be zero when future cash flows are negative.
Impairment losses on fixed assets for the years ended March 31, 2016 and 2017 are summarized
as follows:
Millions of yenThousands of U.S. dollars
Years ended March 31 2016 2017 2017
Location Type of assets Use
Saitama Land For rent ¥ — ¥53 $472
Shizuoka Land Idle assets ¥ — ¥11 $ 98
Tokyo Land, building and other For rent ¥666 ¥— $ —
Ibaraki Building and other For rent ¥103 ¥— $ —
Niigata, and other Land Idle assets ¥ 1 ¥ 1 $ 9
Total ¥770 ¥65 $579
31AnnuAl RepoRt 2017
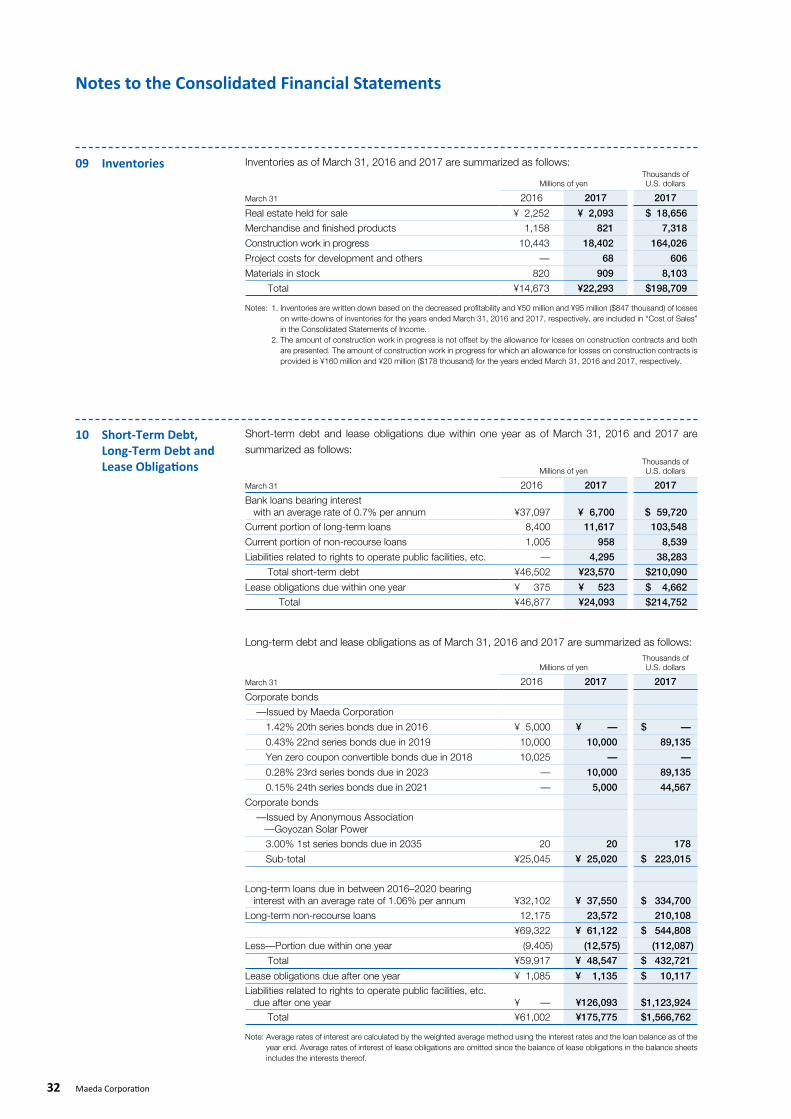
Notes to the Consolidated Financial Statements
10 Short-Term Debt, Long-Term Debt and Lease Obligations
09 Inventories Inventories as of March 31, 2016 and 2017 are summarized as follows:
Millions of yenThousands of U.S. dollars
March 31 2016 2017 2017
Real estate held for sale ¥ 2,252 ¥ 2,093 $ 18,656
Merchandise and finished products 1,158 821 7,318
Construction work in progress 10,443 18,402 164,026
Project costs for development and others — 68 606
Materials in stock 820 909 8,103
Total ¥14,673 ¥22,293 $198,709
Notes: 1. Inventories are written down based on the decreased profitability and ¥50 million and ¥95 million ($847 thousand) of losses on write-downs of inventories for the years ended March 31, 2016 and 2017, respectively, are included in “Cost of Sales” in the Consolidated Statements of Income.
2. The amount of construction work in progress is not offset by the allowance for losses on construction contracts and both are presented. The amount of construction work in progress for which an allowance for losses on construction contracts is provided is ¥160 million and ¥20 million ($178 thousand) for the years ended March 31, 2016 and 2017, respectively.
Short-term debt and lease obligations due within one year as of March 31, 2016 and 2017 are
summarized as follows:
Millions of yenThousands of U.S. dollars
March 31 2016 2017 2017
Bank loans bearing interest with an average rate of 0.7% per annum ¥37,097 ¥ 6,700 $ 59,720Current portion of long-term loans 8,400 11,617 103,548
Current portion of non-recourse loans 1,005 958 8,539
Liabilities related to rights to operate public facilities, etc. — 4,295 38,283
Total short-term debt ¥46,502 ¥23,570 $210,090
Lease obligations due within one year ¥ 375 ¥ 523 $ 4,662
Total ¥46,877 ¥24,093 $214,752
Long-term debt and lease obligations as of March 31, 2016 and 2017 are summarized as follows:
Millions of yenThousands of U.S. dollars
March 31 2016 2017 2017
Corporate bonds
—Issued by Maeda Corporation
1.42% 20th series bonds due in 2016 ¥ 5,000 ¥ — $ —
0.43% 22nd series bonds due in 2019 10,000 10,000 89,135
Yen zero coupon convertible bonds due in 2018 10,025 — —
0.28% 23rd series bonds due in 2023 — 10,000 89,135
0.15% 24th series bonds due in 2021 — 5,000 44,567
Corporate bonds
—Issued by Anonymous Association —Goyozan Solar Power
3.00% 1st series bonds due in 2035 20 20 178
Sub-total ¥25,045 ¥ 25,020 $ 223,015
Long-term loans due in between 2016–2020 bearing interest with an average rate of 1.06% per annum ¥32,102 ¥ 37,550 $ 334,700
Long-term non-recourse loans 12,175 23,572 210,108
¥69,322 ¥ 61,122 $ 544,808
Less—Portion due within one year (9,405) (12,575) (112,087)
Total ¥59,917 ¥ 48,547 $ 432,721
Lease obligations due after one year ¥ 1,085 ¥ 1,135 $ 10,117 Liabilities related to rights to operate public facilities, etc. due after one year ¥ — ¥126,093 $1,123,924
Total ¥61,002 ¥175,775 $1,566,762
Note: Average rates of interest are calculated by the weighted average method using the interest rates and the loan balance as of the year end. Average rates of interest of lease obligations are omitted since the balance of lease obligations in the balance sheets includes the interests thereof.
32 Maeda Corporation
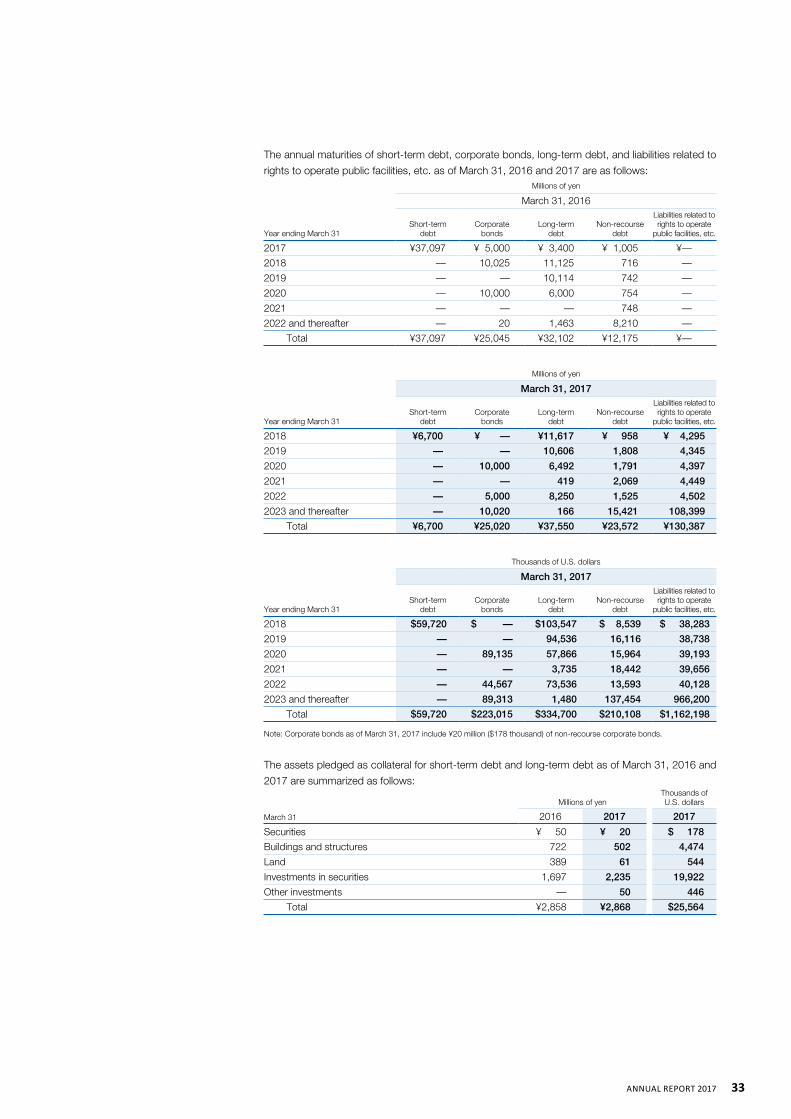
The annual maturities of short-term debt, corporate bonds, long-term debt, and liabilities related to
rights to operate public facilities, etc. as of March 31, 2016 and 2017 are as follows:Millions of yen
March 31, 2016
Year ending March 31Short-term
debtCorporate
bondsLong-term
debtNon-recourse
debt
Liabilities related to rights to operate
public facilities, etc.
2017 ¥37,097 ¥ 5,000 ¥ 3,400 ¥ 1,005 ¥—
2018 — 10,025 11,125 716 —
2019 — — 10,114 742 —
2020 — 10,000 6,000 754 —
2021 — — — 748 —
2022 and thereafter — 20 1,463 8,210 —
Total ¥37,097 ¥25,045 ¥32,102 ¥12,175 ¥—
Millions of yen
March 31, 2017
Year ending March 31Short-term
debtCorporate
bondsLong-term
debtNon-recourse
debt
Liabilities related to rights to operate
public facilities, etc.
2018 ¥6,700 ¥ — ¥11,617 ¥ 958 ¥ 4,295
2019 — — 10,606 1,808 4,345
2020 — 10,000 6,492 1,791 4,397
2021 — — 419 2,069 4,449
2022 — 5,000 8,250 1,525 4,502
2023 and thereafter — 10,020 166 15,421 108,399
Total ¥6,700 ¥25,020 ¥37,550 ¥23,572 ¥130,387
Thousands of U.S. dollars
March 31, 2017
Year ending March 31Short-term
debtCorporate
bondsLong-term
debtNon-recourse
debt
Liabilities related to rights to operate
public facilities, etc.
2018 $59,720 $ — $103,547 $ 8,539 $ 38,283
2019 — — 94,536 16,116 38,738
2020 — 89,135 57,866 15,964 39,193
2021 — — 3,735 18,442 39,656
2022 — 44,567 73,536 13,593 40,128
2023 and thereafter — 89,313 1,480 137,454 966,200
Total $59,720 $223,015 $334,700 $210,108 $1,162,198
Note: Corporate bonds as of March 31, 2017 include ¥20 million ($178 thousand) of non-recourse corporate bonds.
The assets pledged as collateral for short-term debt and long-term debt as of March 31, 2016 and
2017 are summarized as follows:
Millions of yenThousands of U.S. dollars
March 31 2016 2017 2017
Securities ¥ 50 ¥ 20 $ 178
Buildings and structures 722 502 4,474
Land 389 61 544
Investments in securities 1,697 2,235 19,922
Other investments — 50 446
Total ¥2,858 ¥2,868 $25,564
33AnnuAl RepoRt 2017
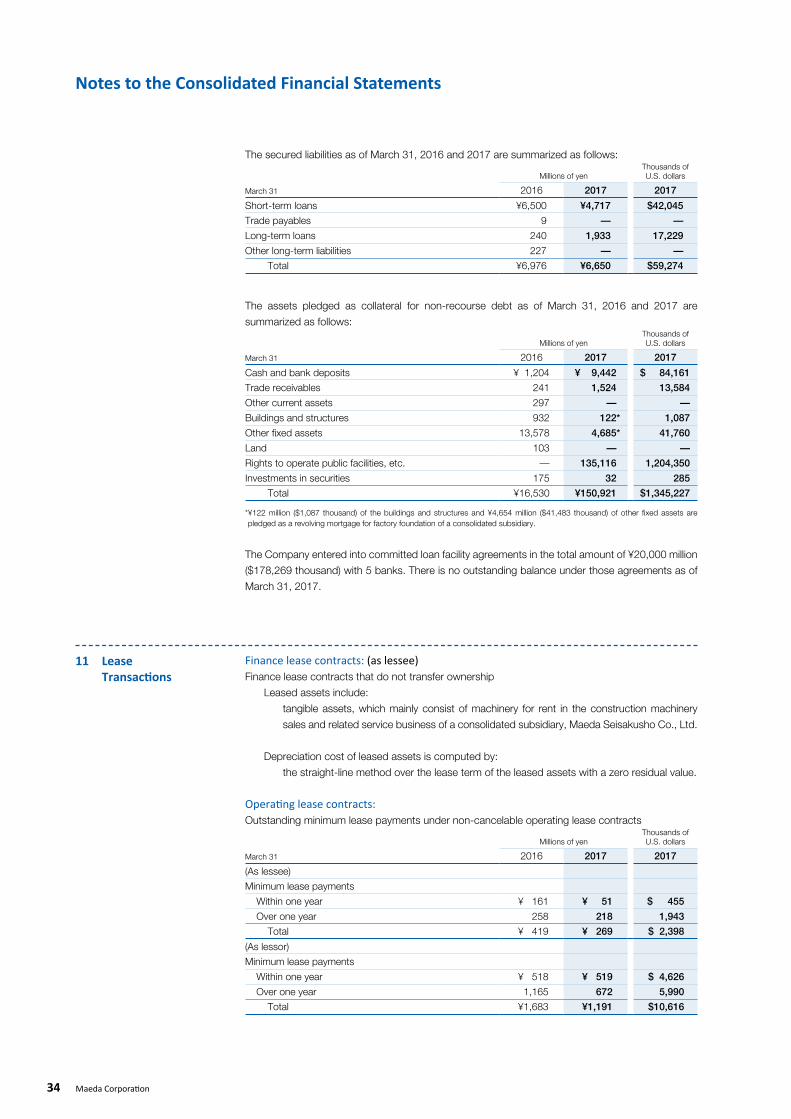
Notes to the Consolidated Financial Statements
The secured liabilities as of March 31, 2016 and 2017 are summarized as follows:
Millions of yenThousands of U.S. dollars
March 31 2016 2017 2017
Short-term loans ¥6,500 ¥4,717 $42,045
Trade payables 9 — —
Long-term loans 240 1,933 17,229
Other long-term liabilities 227 — —
Total ¥6,976 ¥6,650 $59,274
The assets pledged as collateral for non-recourse debt as of March 31, 2016 and 2017 are
summarized as follows:
Millions of yenThousands of U.S. dollars
March 31 2016 2017 2017
Cash and bank deposits ¥ 1,204 ¥ 9,442 $ 84,161
Trade receivables 241 1,524 13,584
Other current assets 297 — —
Buildings and structures 932 122* 1,087
Other fixed assets 13,578 4,685* 41,760
Land 103 — —
Rights to operate public facilities, etc. — 135,116 1,204,350
Investments in securities 175 32 285
Total ¥16,530 ¥150,921 $1,345,227
* ¥122 million ($1,087 thousand) of the buildings and structures and ¥4,654 million ($41,483 thousand) of other fixed assets are pledged as a revolving mortgage for factory foundation of a consolidated subsidiary.
The Company entered into committed loan facility agreements in the total amount of ¥20,000 million
($178,269 thousand) with 5 banks. There is no outstanding balance under those agreements as of
March 31, 2017.
11 Lease Transactions
Finance lease contracts: (as lessee)Finance lease contracts that do not transfer ownership
Leased assets include:
tangible assets, which mainly consist of machinery for rent in the construction machinery
sales and related service business of a consolidated subsidiary, Maeda Seisakusho Co., Ltd.
Depreciation cost of leased assets is computed by:
the straight-line method over the lease term of the leased assets with a zero residual value.
Operating lease contracts:Outstanding minimum lease payments under non-cancelable operating lease contracts
Millions of yenThousands of U.S. dollars
March 31 2016 2017 2017
(As lessee)
Minimum lease payments
Within one year ¥ 161 ¥ 51 $ 455
Over one year 258 218 1,943
Total ¥ 419 ¥ 269 $ 2,398
(As lessor)
Minimum lease payments
Within one year ¥ 518 ¥ 519 $ 4,626
Over one year 1,165 672 5,990
Total ¥1,683 ¥1,191 $10,616
34 Maeda Corporation
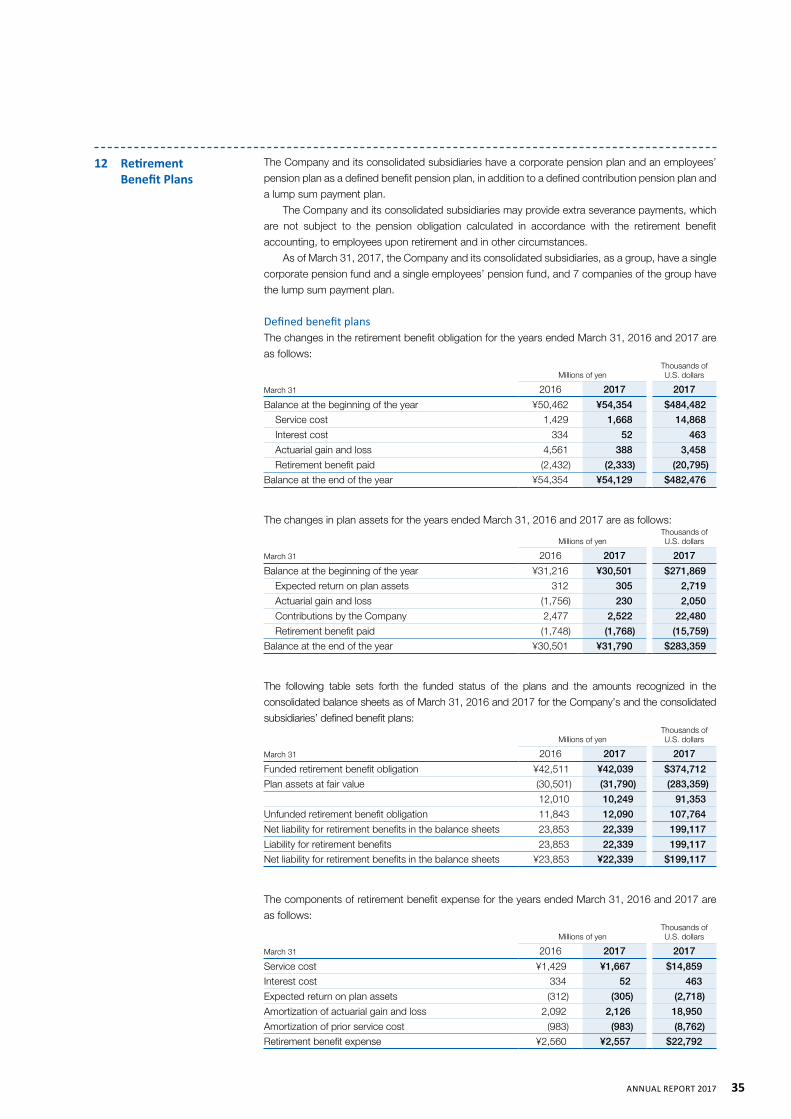
12 Retirement Benefit Plans
The Company and its consolidated subsidiaries have a corporate pension plan and an employees’
pension plan as a defined benefit pension plan, in addition to a defined contribution pension plan and
a lump sum payment plan.
The Company and its consolidated subsidiaries may provide extra severance payments, which
are not subject to the pension obligation calculated in accordance with the retirement benefit
accounting, to employees upon retirement and in other circumstances.
As of March 31, 2017, the Company and its consolidated subsidiaries, as a group, have a single
corporate pension fund and a single employees’ pension fund, and 7 companies of the group have
the lump sum payment plan.
Defined benefit plansThe changes in the retirement benefit obligation for the years ended March 31, 2016 and 2017 are
as follows:
Millions of yenThousands of U.S. dollars
March 31 2016 2017 2017
Balance at the beginning of the year ¥50,462 ¥54,354 $484,482
Service cost 1,429 1,668 14,868
Interest cost 334 52 463
Actuarial gain and loss 4,561 388 3,458
Retirement benefit paid (2,432) (2,333) (20,795)
Balance at the end of the year ¥54,354 ¥54,129 $482,476
The changes in plan assets for the years ended March 31, 2016 and 2017 are as follows:
Millions of yenThousands of U.S. dollars
March 31 2016 2017 2017
Balance at the beginning of the year ¥31,216 ¥30,501 $271,869
Expected return on plan assets 312 305 2,719
Actuarial gain and loss (1,756) 230 2,050
Contributions by the Company 2,477 2,522 22,480
Retirement benefit paid (1,748) (1,768) (15,759)
Balance at the end of the year ¥30,501 ¥31,790 $283,359
The following table sets forth the funded status of the plans and the amounts recognized in the
consolidated balance sheets as of March 31, 2016 and 2017 for the Company’s and the consolidated
subsidiaries’ defined benefit plans:
Millions of yenThousands of U.S. dollars
March 31 2016 2017 2017
Funded retirement benefit obligation ¥42,511 ¥42,039 $374,712
Plan assets at fair value (30,501) (31,790) (283,359)
12,010 10,249 91,353
Unfunded retirement benefit obligation 11,843 12,090 107,764
Net liability for retirement benefits in the balance sheets 23,853 22,339 199,117
Liability for retirement benefits 23,853 22,339 199,117
Net liability for retirement benefits in the balance sheets ¥23,853 ¥22,339 $199,117
The components of retirement benefit expense for the years ended March 31, 2016 and 2017 are
as follows:
Millions of yenThousands of U.S. dollars
March 31 2016 2017 2017
Service cost ¥1,429 ¥1,667 $14,859
Interest cost 334 52 463
Expected return on plan assets (312) (305) (2,718)
Amortization of actuarial gain and loss 2,092 2,126 18,950
Amortization of prior service cost (983) (983) (8,762)
Retirement benefit expense ¥2,560 ¥2,557 $22,792
35AnnuAl RepoRt 2017
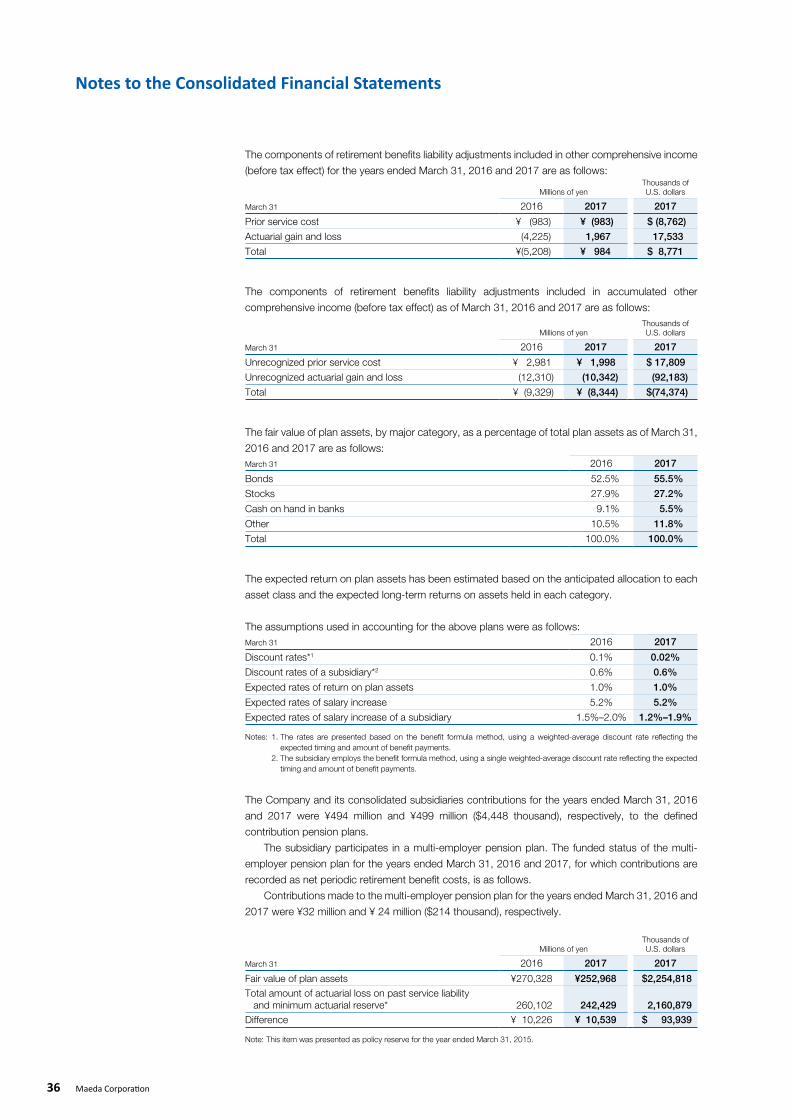
Notes to the Consolidated Financial Statements
The components of retirement benefits liability adjustments included in other comprehensive income
(before tax effect) for the years ended March 31, 2016 and 2017 are as follows:
Millions of yenThousands of U.S. dollars
March 31 2016 2017 2017
Prior service cost ¥ (983) ¥ (983) $ (8,762)
Actuarial gain and loss (4,225) 1,967 17,533
Total ¥(5,208) ¥ 984 $ 8,771
The components of retirement benefits liability adjustments included in accumulated other
comprehensive income (before tax effect) as of March 31, 2016 and 2017 are as follows:
Millions of yenThousands of U.S. dollars
March 31 2016 2017 2017
Unrecognized prior service cost ¥ 2,981 ¥ 1,998 $ 17,809
Unrecognized actuarial gain and loss (12,310) (10,342) (92,183)
Total ¥ (9,329) ¥ (8,344) $(74,374)
The fair value of plan assets, by major category, as a percentage of total plan assets as of March 31,
2016 and 2017 are as follows:March 31 2016 2017
Bonds 52.5% 55.5%
Stocks 27.9% 27.2%
Cash on hand in banks 9.1% 5.5%
Other 10.5% 11.8%
Total 100.0% 100.0%
The expected return on plan assets has been estimated based on the anticipated allocation to each
asset class and the expected long-term returns on assets held in each category.
The assumptions used in accounting for the above plans were as follows:March 31 2016 2017
Discount rates*1 0.1% 0.02%
Discount rates of a subsidiary*2 0.6% 0.6%
Expected rates of return on plan assets 1.0% 1.0%
Expected rates of salary increase 5.2% 5.2%
Expected rates of salary increase of a subsidiary 1.5%–2.0% 1.2%–1.9%
Notes: 1. The rates are presented based on the benefit formula method, using a weighted-average discount rate reflecting the expected timing and amount of benefit payments.
2. The subsidiary employs the benefit formula method, using a single weighted-average discount rate reflecting the expected timing and amount of benefit payments.
The Company and its consolidated subsidiaries contributions for the years ended March 31, 2016
and 2017 were ¥494 million and ¥499 million ($4,448 thousand), respectively, to the defined
contribution pension plans.
The subsidiary participates in a multi-employer pension plan. The funded status of the multi-
employer pension plan for the years ended March 31, 2016 and 2017, for which contributions are
recorded as net periodic retirement benefit costs, is as follows.
Contributions made to the multi-employer pension plan for the years ended March 31, 2016 and
2017 were ¥32 million and ¥ 24 million ($214 thousand), respectively.
Millions of yenThousands of U.S. dollars
March 31 2016 2017 2017
Fair value of plan assets ¥270,328 ¥252,968 $2,254,818Total amount of actuarial loss on past service liability and minimum actuarial reserve* 260,102 242,429 2,160,879Difference ¥ 10,226 ¥ 10,539 $ 93,939
Note: This item was presented as policy reserve for the year ended March 31, 2015.
36 Maeda Corporation
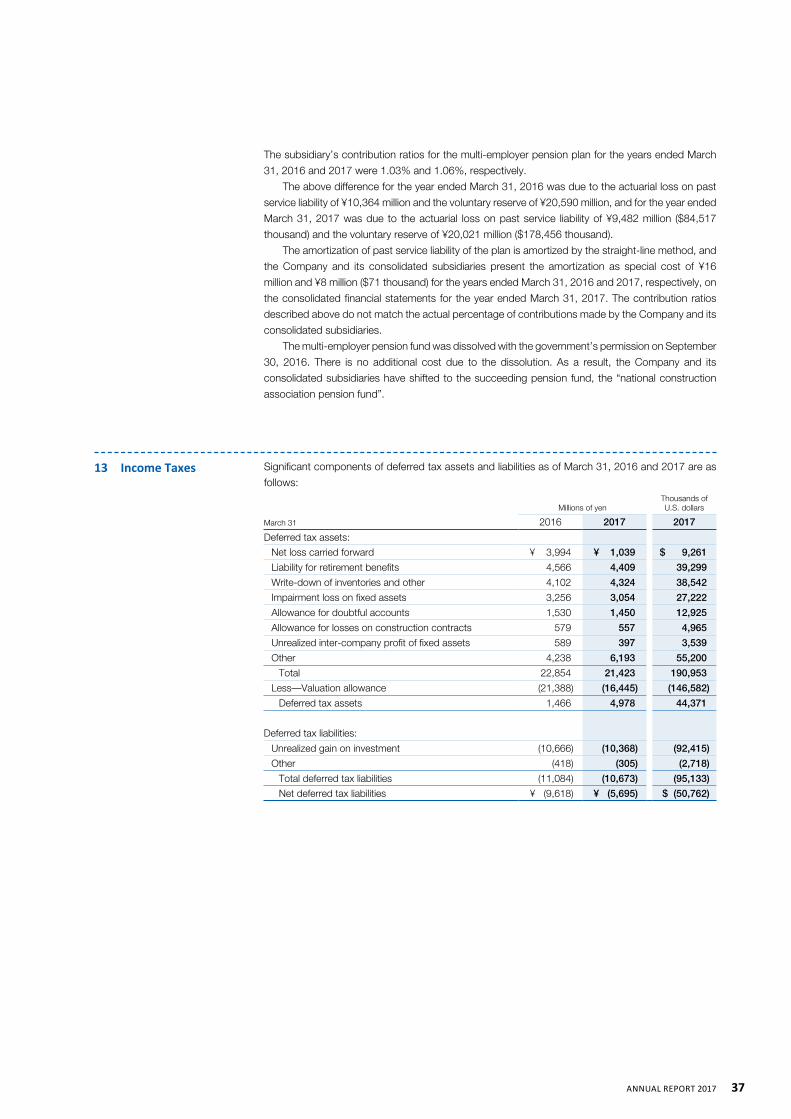
The subsidiary’s contribution ratios for the multi-employer pension plan for the years ended March
31, 2016 and 2017 were 1.03% and 1.06%, respectively.
The above difference for the year ended March 31, 2016 was due to the actuarial loss on past
service liability of ¥10,364 million and the voluntary reserve of ¥20,590 million, and for the year ended
March 31, 2017 was due to the actuarial loss on past service liability of ¥9,482 million ($84,517
thousand) and the voluntary reserve of ¥20,021 million ($178,456 thousand).
The amortization of past service liability of the plan is amortized by the straight-line method, and
the Company and its consolidated subsidiaries present the amortization as special cost of ¥16
million and ¥8 million ($71 thousand) for the years ended March 31, 2016 and 2017, respectively, on
the consolidated financial statements for the year ended March 31, 2017. The contribution ratios
described above do not match the actual percentage of contributions made by the Company and its
consolidated subsidiaries.
The multi-employer pension fund was dissolved with the government’s permission on September
30, 2016. There is no additional cost due to the dissolution. As a result, the Company and its
consolidated subsidiaries have shifted to the succeeding pension fund, the “national construction
association pension fund”.
13 Income Taxes Significant components of deferred tax assets and liabilities as of March 31, 2016 and 2017 are as
follows:
Millions of yenThousands of U.S. dollars
March 31 2016 2017 2017
Deferred tax assets:
Net loss carried forward ¥ 3,994 ¥ 1,039 $ 9,261
Liability for retirement benefits 4,566 4,409 39,299
Write-down of inventories and other 4,102 4,324 38,542
Impairment loss on fixed assets 3,256 3,054 27,222
Allowance for doubtful accounts 1,530 1,450 12,925
Allowance for losses on construction contracts 579 557 4,965
Unrealized inter-company profit of fixed assets 589 397 3,539
Other 4,238 6,193 55,200
Total 22,854 21,423 190,953
Less—Valuation allowance (21,388) (16,445) (146,582)
Deferred tax assets 1,466 4,978 44,371
Deferred tax liabilities:
Unrealized gain on investment (10,666) (10,368) (92,415)
Other (418) (305) (2,718)
Total deferred tax liabilities (11,084) (10,673) (95,133)
Net deferred tax liabilities ¥ (9,618) ¥ (5,695) $ (50,762)
37AnnuAl RepoRt 2017
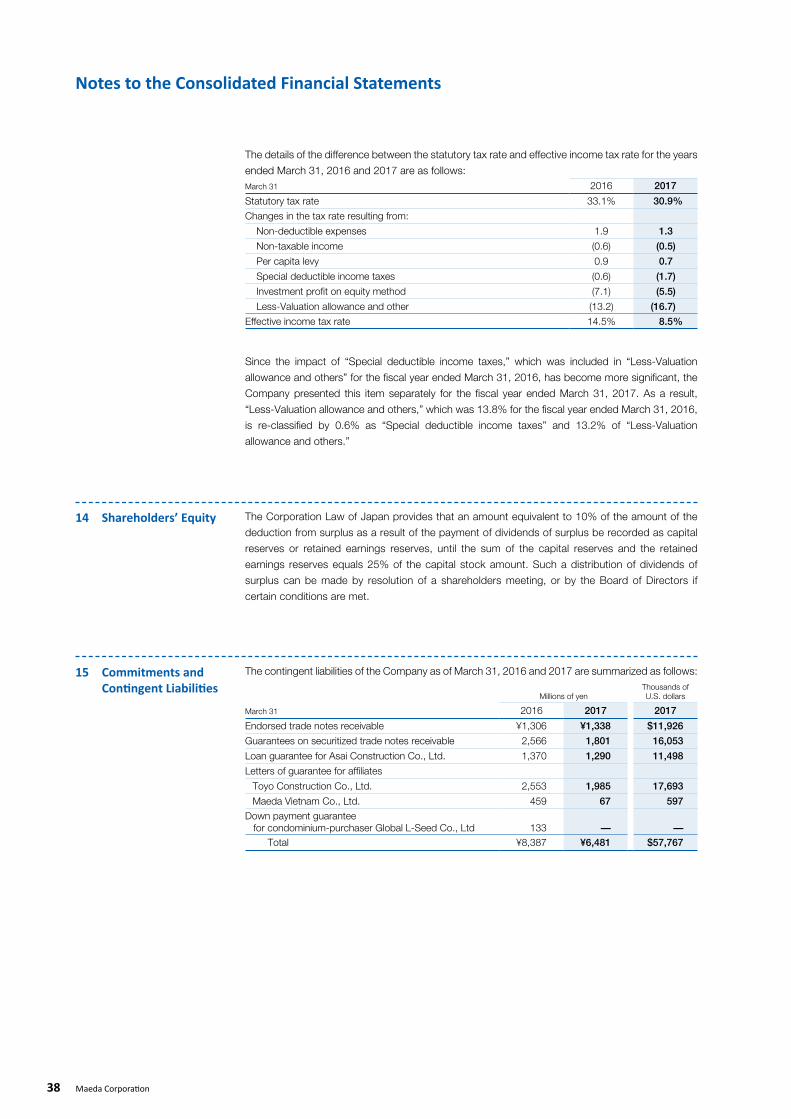
Notes to the Consolidated Financial Statements
14 Shareholders’ Equity The Corporation Law of Japan provides that an amount equivalent to 10% of the amount of the
deduction from surplus as a result of the payment of dividends of surplus be recorded as capital
reserves or retained earnings reserves, until the sum of the capital reserves and the retained
earnings reserves equals 25% of the capital stock amount. Such a distribution of dividends of
surplus can be made by resolution of a shareholders meeting, or by the Board of Directors if
certain conditions are met.
15 Commitments and Contingent Liabilities
The contingent liabilities of the Company as of March 31, 2016 and 2017 are summarized as follows:
Millions of yenThousands of U.S. dollars
March 31 2016 2017 2017
Endorsed trade notes receivable ¥1,306 ¥1,338 $11,926
Guarantees on securitized trade notes receivable 2,566 1,801 16,053
Loan guarantee for Asai Construction Co., Ltd. 1,370 1,290 11,498
Letters of guarantee for affiliates
Toyo Construction Co., Ltd. 2,553 1,985 17,693
Maeda Vietnam Co., Ltd. 459 67 597
Down payment guarantee for condominium-purchaser Global L-Seed Co., Ltd 133 — —
Total ¥8,387 ¥6,481 $57,767
The details of the difference between the statutory tax rate and effective income tax rate for the years
ended March 31, 2016 and 2017 are as follows:March 31 2016 2017
Statutory tax rate 33.1% 30.9%
Changes in the tax rate resulting from:
Non-deductible expenses 1.9 1.3
Non-taxable income (0.6) (0.5)
Per capita levy 0.9 0.7
Special deductible income taxes (0.6) (1.7)
Investment profit on equity method (7.1) (5.5)
Less-Valuation allowance and other (13.2) (16.7)
Effective income tax rate 14.5% 8.5%
Since the impact of “Special deductible income taxes,” which was included in “Less-Valuation
allowance and others” for the fiscal year ended March 31, 2016, has become more significant, the
Company presented this item separately for the fiscal year ended March 31, 2017. As a result,
“Less-Valuation allowance and others,” which was 13.8% for the fiscal year ended March 31, 2016,
is re-classified by 0.6% as “Special deductible income taxes” and 13.2% of “Less-Valuation
allowance and others.”
38 Maeda Corporation
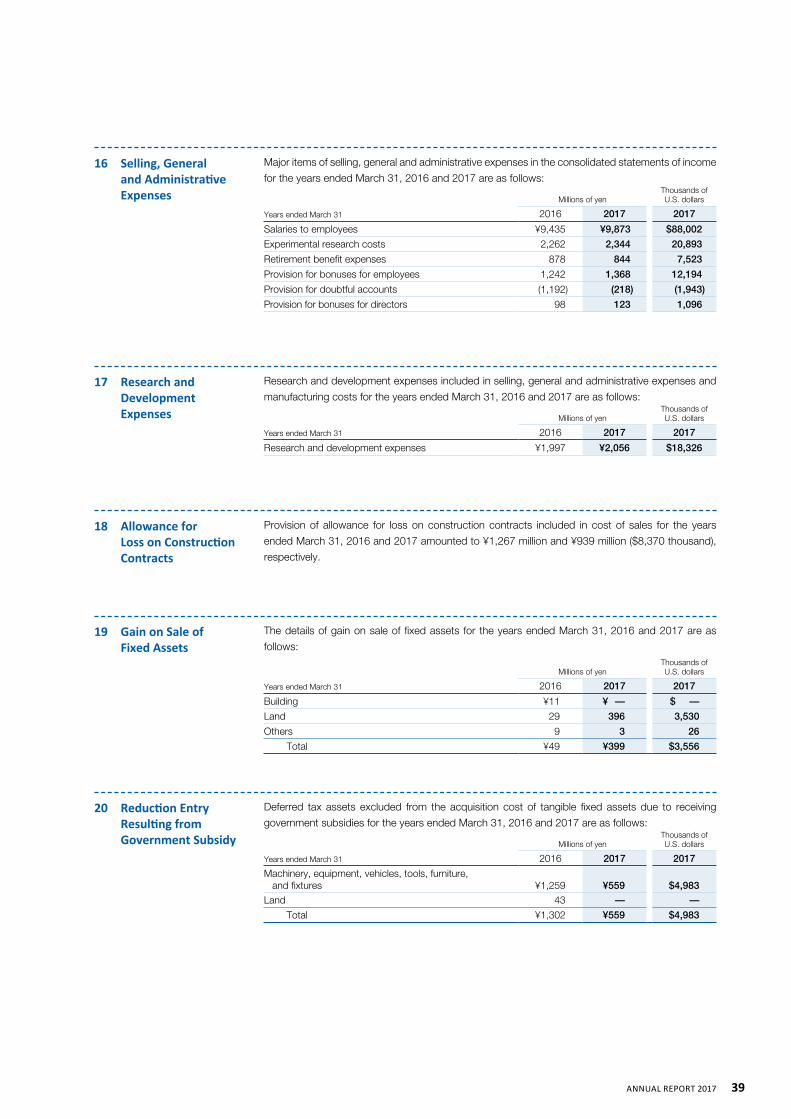
16 Selling, General and Administrative Expenses
Major items of selling, general and administrative expenses in the consolidated statements of income
for the years ended March 31, 2016 and 2017 are as follows:
Millions of yenThousands of U.S. dollars
Years ended March 31 2016 2017 2017
Salaries to employees ¥9,435 ¥9,873 $88,002
Experimental research costs 2,262 2,344 20,893
Retirement benefit expenses 878 844 7,523
Provision for bonuses for employees 1,242 1,368 12,194
Provision for doubtful accounts (1,192) (218) (1,943)
Provision for bonuses for directors 98 123 1,096
17 Research and Development Expenses
18 Allowance for Loss on Construction Contracts
Provision of allowance for loss on construction contracts included in cost of sales for the years
ended March 31, 2016 and 2017 amounted to ¥1,267 million and ¥939 million ($8,370 thousand),
respectively.
Research and development expenses included in selling, general and administrative expenses and
manufacturing costs for the years ended March 31, 2016 and 2017 are as follows:
Millions of yenThousands of U.S. dollars
Years ended March 31 2016 2017 2017
Research and development expenses ¥1,997 ¥2,056 $18,326
19 Gain on Sale of Fixed Assets
20 Reduction Entry Resulting from Government Subsidy
The details of gain on sale of fixed assets for the years ended March 31, 2016 and 2017 are as
follows:
Millions of yenThousands of U.S. dollars
Years ended March 31 2016 2017 2017
Building ¥11 ¥ — $ —
Land 29 396 3,530
Others 9 3 26
Total ¥49 ¥399 $3,556
Deferred tax assets excluded from the acquisition cost of tangible fixed assets due to receiving
government subsidies for the years ended March 31, 2016 and 2017 are as follows:
Millions of yenThousands of U.S. dollars
Years ended March 31 2016 2017 2017
Machinery, equipment, vehicles, tools, furniture, and fixtures ¥1,259 ¥559 $4,983Land 43 — —
Total ¥1,302 ¥559 $4,983
39AnnuAl RepoRt 2017
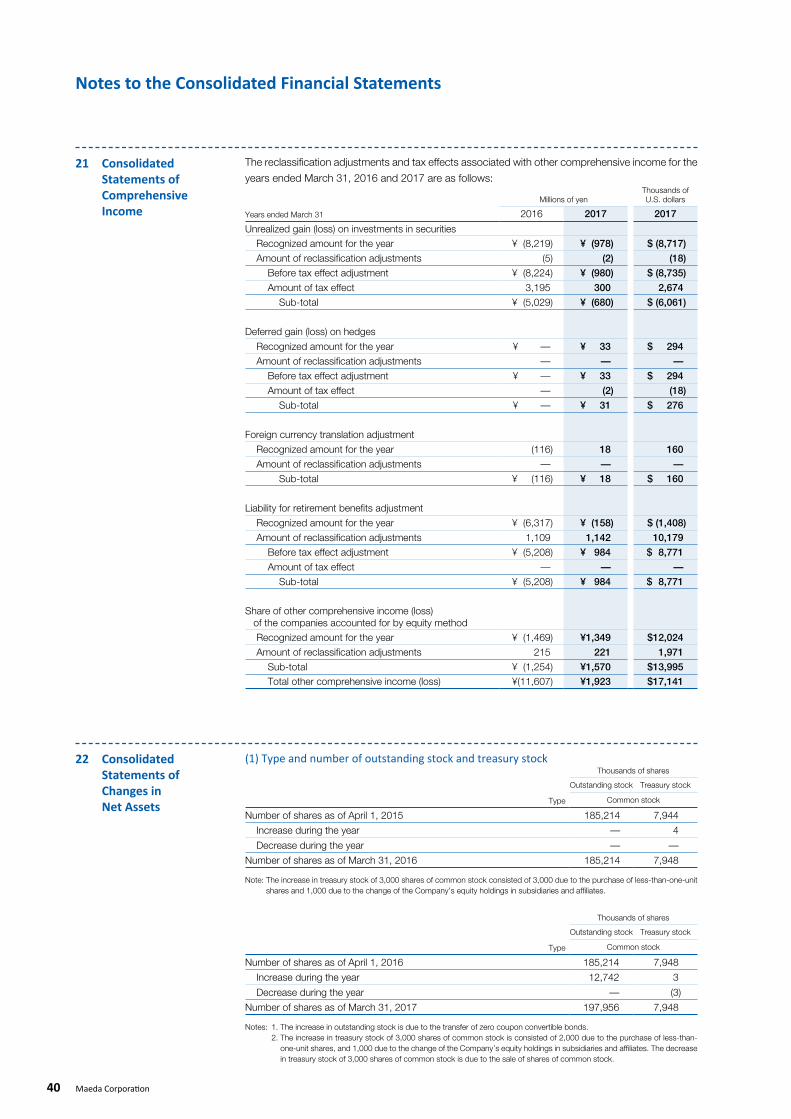
Notes to the Consolidated Financial Statements
22 Consolidated Statements of Changes in Net Assets
(1) Type and number of outstanding stock and treasury stockThousands of shares
Outstanding stock Treasury stock
Type Common stock
Number of shares as of April 1, 2015 185,214 7,944
Increase during the year — 4
Decrease during the year — —
Number of shares as of March 31, 2016 185,214 7,948
Note: The increase in treasury stock of 3,000 shares of common stock consisted of 3,000 due to the purchase of less-than-one-unit shares and 1,000 due to the change of the Company’s equity holdings in subsidiaries and affiliates.
Thousands of shares
Outstanding stock Treasury stock
Type Common stock
Number of shares as of April 1, 2016 185,214 7,948
Increase during the year 12,742 3
Decrease during the year — (3)
Number of shares as of March 31, 2017 197,956 7,948
Notes: 1. The increase in outstanding stock is due to the transfer of zero coupon convertible bonds. 2. The increase in treasury stock of 3,000 shares of common stock is consisted of 2,000 due to the purchase of less-than-
one-unit shares, and 1,000 due to the change of the Company’s equity holdings in subsidiaries and affiliates. The decrease in treasury stock of 3,000 shares of common stock is due to the sale of shares of common stock.
21 Consolidated Statements of Comprehensive Income
The reclassification adjustments and tax effects associated with other comprehensive income for the
years ended March 31, 2016 and 2017 are as follows:
Millions of yenThousands of U.S. dollars
Years ended March 31 2016 2017 2017
Unrealized gain (loss) on investments in securitiesRecognized amount for the year ¥ (8,219) ¥ (978) $ (8,717)
Amount of reclassification adjustments (5) (2) (18)
Before tax effect adjustment ¥ (8,224) ¥ (980) $ (8,735)
Amount of tax effect 3,195 300 2,674
Sub-total ¥ (5,029) ¥ (680) $ (6,061)
Deferred gain (loss) on hedges
Recognized amount for the year ¥ — ¥ 33 $ 294
Amount of reclassification adjustments — — —
Before tax effect adjustment ¥ — ¥ 33 $ 294
Amount of tax effect — (2) (18)
Sub-total ¥ — ¥ 31 $ 276
Foreign currency translation adjustment
Recognized amount for the year (116) 18 160
Amount of reclassification adjustments — — —
Sub-total ¥ (116) ¥ 18 $ 160
Liability for retirement benefits adjustment
Recognized amount for the year ¥ (6,317) ¥ (158) $ (1,408)
Amount of reclassification adjustments 1,109 1,142 10,179
Before tax effect adjustment ¥ (5,208) ¥ 984 $ 8,771
Amount of tax effect — — —
Sub-total ¥ (5,208) ¥ 984 $ 8,771
Share of other comprehensive income (loss) of the companies accounted for by equity method
Recognized amount for the year ¥ (1,469) ¥1,349 $12,024
Amount of reclassification adjustments 215 221 1,971
Sub-total ¥ (1,254) ¥1,570 $13,995 Total other comprehensive income (loss) ¥(11,607) ¥1,923 $17,141
40 Maeda Corporation
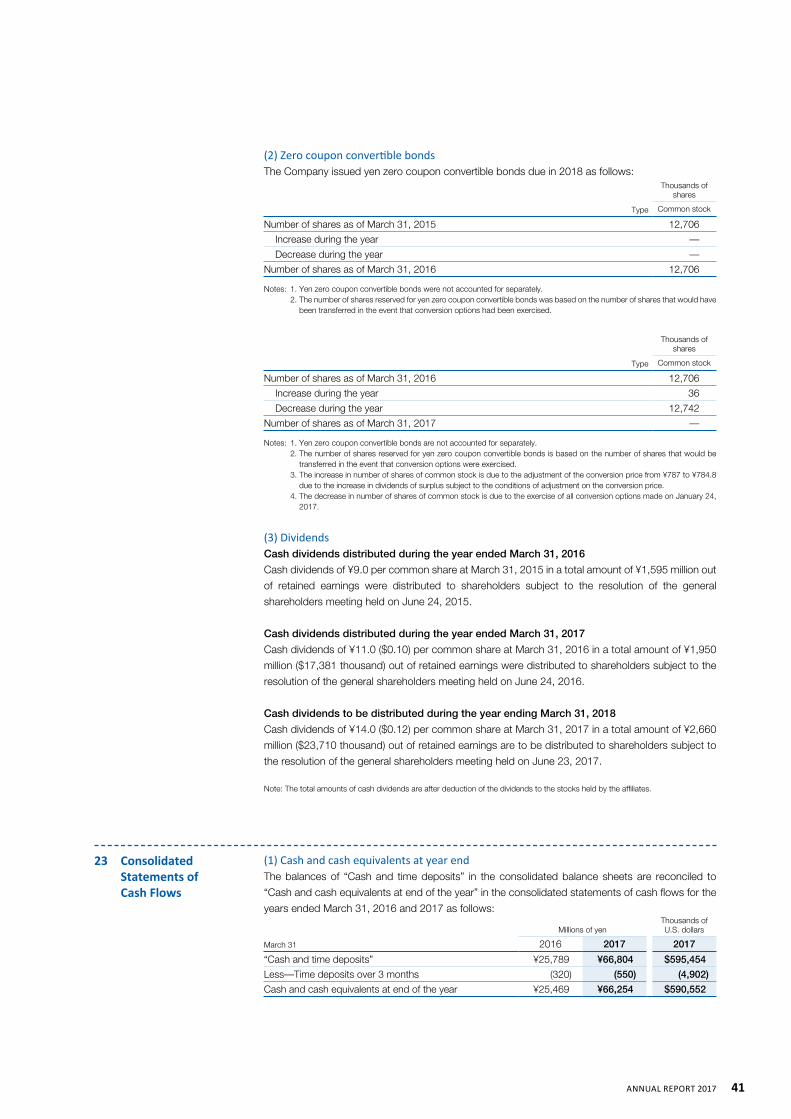
(2) Zero coupon convertible bondsThe Company issued yen zero coupon convertible bonds due in 2018 as follows:
Thousands of shares
Type Common stock
Number of shares as of March 31, 2015 12,706
Increase during the year —
Decrease during the year —
Number of shares as of March 31, 2016 12,706
Notes: 1. Yen zero coupon convertible bonds were not accounted for separately. 2. The number of shares reserved for yen zero coupon convertible bonds was based on the number of shares that would have
been transferred in the event that conversion options had been exercised.
Thousands of shares
Type Common stock
Number of shares as of March 31, 2016 12,706
Increase during the year 36
Decrease during the year 12,742
Number of shares as of March 31, 2017 —
Notes: 1. Yen zero coupon convertible bonds are not accounted for separately. 2. The number of shares reserved for yen zero coupon convertible bonds is based on the number of shares that would be
transferred in the event that conversion options were exercised. 3. The increase in number of shares of common stock is due to the adjustment of the conversion price from ¥787 to ¥784.8
due to the increase in dividends of surplus subject to the conditions of adjustment on the conversion price. 4. The decrease in number of shares of common stock is due to the exercise of all conversion options made on January 24,
2017.
(3) DividendsCash dividends distributed during the year ended March 31, 2016
Cash dividends of ¥9.0 per common share at March 31, 2015 in a total amount of ¥1,595 million out
of retained earnings were distributed to shareholders subject to the resolution of the general
shareholders meeting held on June 24, 2015.
Cash dividends distributed during the year ended March 31, 2017
Cash dividends of ¥11.0 ($0.10) per common share at March 31, 2016 in a total amount of ¥1,950
million ($17,381 thousand) out of retained earnings were distributed to shareholders subject to the
resolution of the general shareholders meeting held on June 24, 2016.
Cash dividends to be distributed during the year ending March 31, 2018
Cash dividends of ¥14.0 ($0.12) per common share at March 31, 2017 in a total amount of ¥2,660
million ($23,710 thousand) out of retained earnings are to be distributed to shareholders subject to
the resolution of the general shareholders meeting held on June 23, 2017.
Note: The total amounts of cash dividends are after deduction of the dividends to the stocks held by the affiliates.
23 Consolidated Statements of Cash Flows
(1) Cash and cash equivalents at year endThe balances of “Cash and time deposits” in the consolidated balance sheets are reconciled to
“Cash and cash equivalents at end of the year” in the consolidated statements of cash flows for the
years ended March 31, 2016 and 2017 as follows:
Millions of yenThousands of U.S. dollars
March 31 2016 2017 2017
“Cash and time deposits” ¥25,789 ¥66,804 $595,454
Less—Time deposits over 3 months (320) (550) (4,902)
Cash and cash equivalents at end of the year ¥25,469 ¥66,254 $590,552
41AnnuAl RepoRt 2017
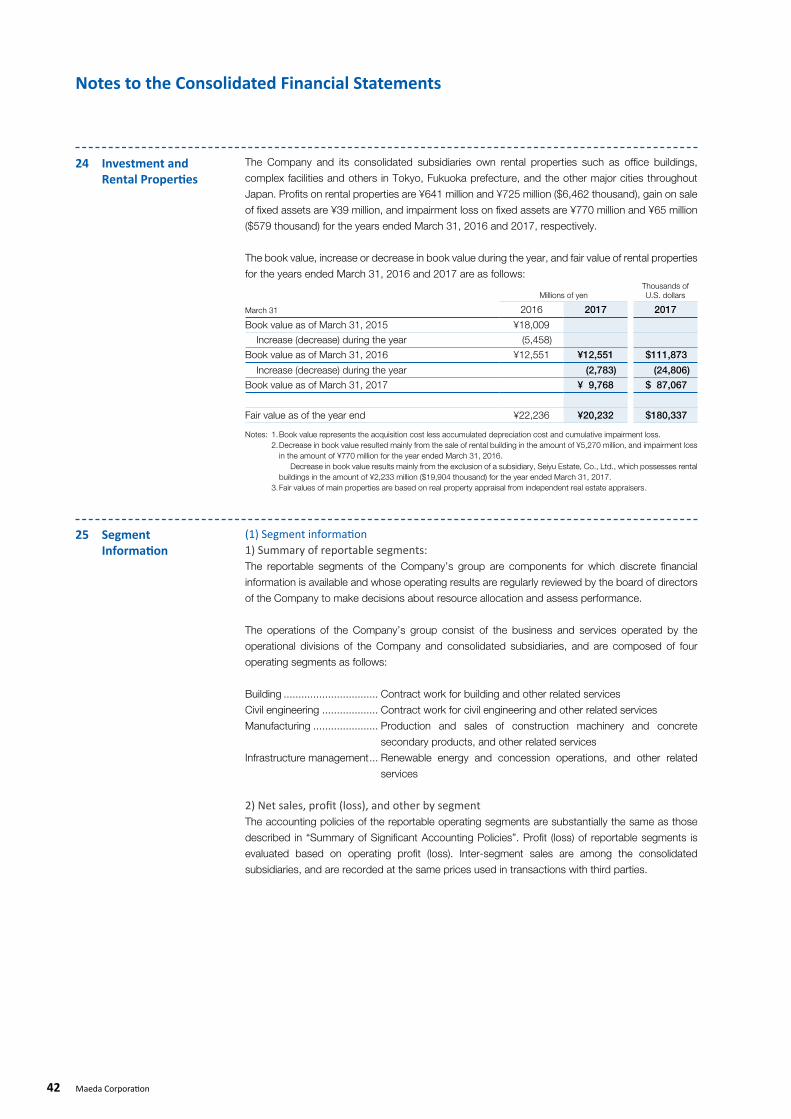
Notes to the Consolidated Financial Statements
24 Investment and Rental Properties
The Company and its consolidated subsidiaries own rental properties such as office buildings,
complex facilities and others in Tokyo, Fukuoka prefecture, and the other major cities throughout
Japan. Profits on rental properties are ¥641 million and ¥725 million ($6,462 thousand), gain on sale
of fixed assets are ¥39 million, and impairment loss on fixed assets are ¥770 million and ¥65 million
($579 thousand) for the years ended March 31, 2016 and 2017, respectively.
The book value, increase or decrease in book value during the year, and fair value of rental properties
for the years ended March 31, 2016 and 2017 are as follows:
Millions of yenThousands of U.S. dollars
March 31 2016 2017 2017
Book value as of March 31, 2015 ¥18,009
Increase (decrease) during the year (5,458)
Book value as of March 31, 2016 ¥12,551 ¥12,551 $111,873
Increase (decrease) during the year (2,783) (24,806)
Book value as of March 31, 2017 ¥ 9,768 $ 87,067
Fair value as of the year end ¥22,236 ¥20,232 $180,337
Notes: 1. Book value represents the acquisition cost less accumulated depreciation cost and cumulative impairment loss. 2. Decrease in book value resulted mainly from the sale of rental building in the amount of ¥5,270 million, and impairment loss
in the amount of ¥770 million for the year ended March 31, 2016. Decrease in book value results mainly from the exclusion of a subsidiary, Seiyu Estate, Co., Ltd., which possesses rental
buildings in the amount of ¥2,233 million ($19,904 thousand) for the year ended March 31, 2017. 3. Fair values of main properties are based on real property appraisal from independent real estate appraisers.
25 Segment Information
(1) Segment information1) Summary of reportable segments:The reportable segments of the Company’s group are components for which discrete financial
information is available and whose operating results are regularly reviewed by the board of directors
of the Company to make decisions about resource allocation and assess performance.
The operations of the Company’s group consist of the business and services operated by the
operational divisions of the Company and consolidated subsidiaries, and are composed of four
operating segments as follows:
Building ................................ Contract work for building and other related services
Civil engineering ................... Contract work for civil engineering and other related services
Manufacturing ...................... Production and sales of construction machinery and concrete
secondary products, and other related services
Infrastructure management ... Renewable energy and concession operations, and other related
services
2) Net sales, profit (loss), and other by segmentThe accounting policies of the reportable operating segments are substantially the same as those
described in “Summary of Significant Accounting Policies”. Profit (loss) of reportable segments is
evaluated based on operating profit (loss). Inter-segment sales are among the consolidated
subsidiaries, and are recorded at the same prices used in transactions with third parties.
42 Maeda Corporation
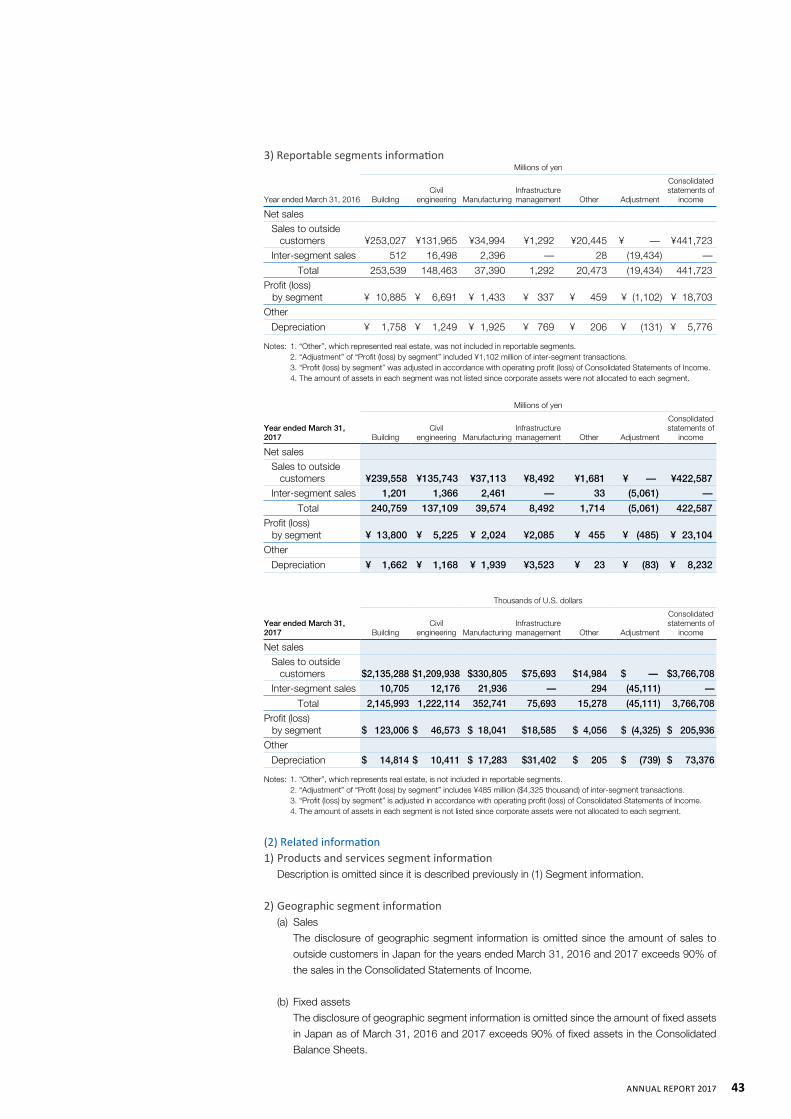
3) Reportable segments informationMillions of yen
Year ended March 31, 2016 BuildingCivil
engineering ManufacturingInfrastructuremanagement Other Adjustment
Consolidated statements of
income
Net salesSales to outside customers ¥253,027 ¥131,965 ¥34,994 ¥1,292 ¥20,445 ¥ — ¥441,723
Inter-segment sales 512 16,498 2,396 — 28 (19,434) —
Total 253,539 148,463 37,390 1,292 20,473 (19,434) 441,723
Profit (loss) by segment ¥ 10,885 ¥ 6,691 ¥ 1,433 ¥ 337 ¥ 459 ¥ (1,102) ¥ 18,703
Other
Depreciation ¥ 1,758 ¥ 1,249 ¥ 1,925 ¥ 769 ¥ 206 ¥ (131) ¥ 5,776
Notes: 1. “Other”, which represented real estate, was not included in reportable segments. 2. “Adjustment” of “Profit (loss) by segment” included ¥1,102 million of inter-segment transactions. 3. “Profit (loss) by segment” was adjusted in accordance with operating profit (loss) of Consolidated Statements of Income. 4. The amount of assets in each segment was not listed since corporate assets were not allocated to each segment.
Millions of yen
Year ended March 31, 2017 Building
Civil engineering Manufacturing
Infrastructuremanagement Other Adjustment
Consolidated statements of
income
Net salesSales to outside customers ¥239,558 ¥135,743 ¥37,113 ¥8,492 ¥1,681 ¥ — ¥422,587
Inter-segment sales 1,201 1,366 2,461 — 33 (5,061) —
Total 240,759 137,109 39,574 8,492 1,714 (5,061) 422,587
Profit (loss) by segment ¥ 13,800 ¥ 5,225 ¥ 2,024 ¥2,085 ¥ 455 ¥ (485) ¥ 23,104
Other
Depreciation ¥ 1,662 ¥ 1,168 ¥ 1,939 ¥3,523 ¥ 23 ¥ (83) ¥ 8,232
Thousands of U.S. dollars
Year ended March 31, 2017 Building
Civil engineering Manufacturing
Infrastructuremanagement Other Adjustment
Consolidated statements of
income
Net salesSales to outside customers $2,135,288 $1,209,938 $330,805 $75,693 $14,984 $ — $3,766,708
Inter-segment sales 10,705 12,176 21,936 — 294 (45,111) —
Total 2,145,993 1,222,114 352,741 75,693 15,278 (45,111) 3,766,708
Profit (loss) by segment $ 123,006 $ 46,573 $ 18,041 $18,585 $ 4,056 $ (4,325) $ 205,936
Other
Depreciation $ 14,814 $ 10,411 $ 17,283 $31,402 $ 205 $ (739) $ 73,376
Notes: 1. “Other”, which represents real estate, is not included in reportable segments. 2. “Adjustment” of “Profit (loss) by segment” includes ¥485 million ($4,325 thousand) of inter-segment transactions. 3. “Profit (loss) by segment” is adjusted in accordance with operating profit (loss) of Consolidated Statements of Income. 4. The amount of assets in each segment is not listed since corporate assets were not allocated to each segment.
(2) Related information1) Products and services segment information Description is omitted since it is described previously in (1) Segment information.
2) Geographic segment information (a) Sales
The disclosure of geographic segment information is omitted since the amount of sales to
outside customers in Japan for the years ended March 31, 2016 and 2017 exceeds 90% of
the sales in the Consolidated Statements of Income.
(b) Fixed assets
The disclosure of geographic segment information is omitted since the amount of fixed assets
in Japan as of March 31, 2016 and 2017 exceeds 90% of fixed assets in the Consolidated
Balance Sheets.
43AnnuAl RepoRt 2017
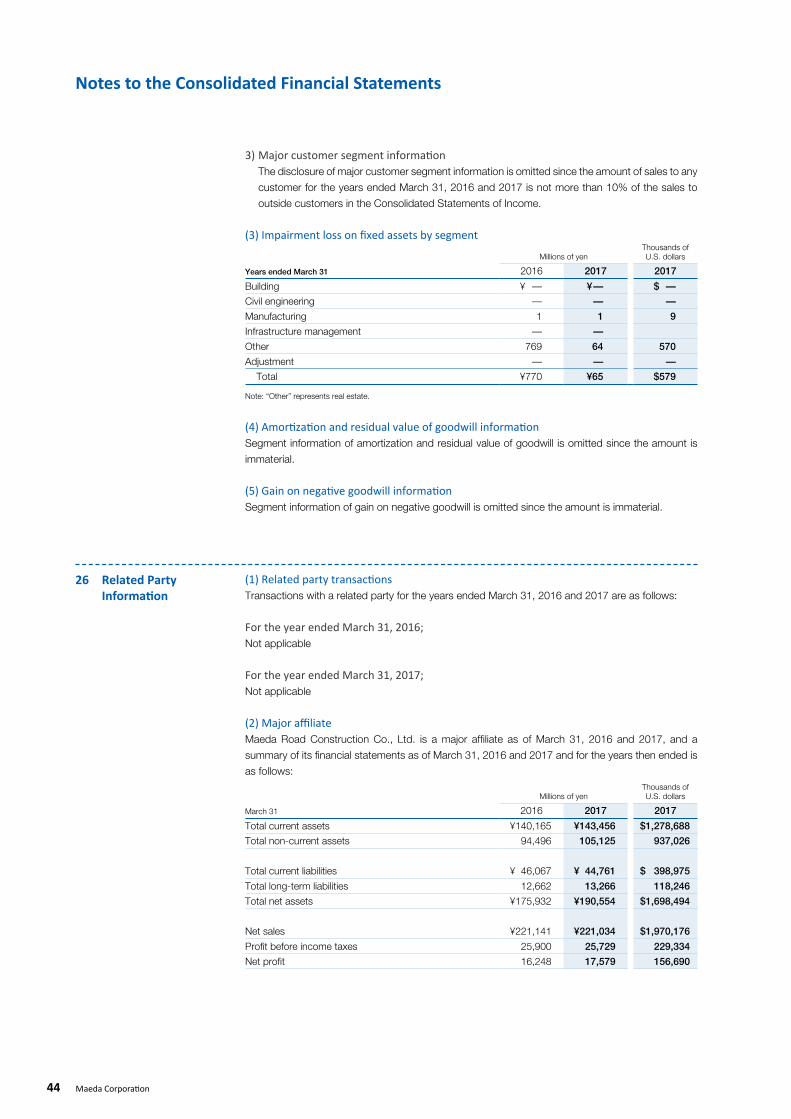
Notes to the Consolidated Financial Statements
3) Major customer segment information The disclosure of major customer segment information is omitted since the amount of sales to any
customer for the years ended March 31, 2016 and 2017 is not more than 10% of the sales to
outside customers in the Consolidated Statements of Income.
(3) Impairment loss on fixed assets by segment
Millions of yenThousands of U.S. dollars
Years ended March 31 2016 2017 2017
Building ¥ — ¥— $ —
Civil engineering — — —
Manufacturing 1 1 9
Infrastructure management — —
Other 769 64 570
Adjustment — — —
Total ¥770 ¥65 $579
Note: “Other” represents real estate.
(4) Amortization and residual value of goodwill informationSegment information of amortization and residual value of goodwill is omitted since the amount is
immaterial.
(5) Gain on negative goodwill informationSegment information of gain on negative goodwill is omitted since the amount is immaterial.
26 Related Party Information
(1) Related party transactionsTransactions with a related party for the years ended March 31, 2016 and 2017 are as follows:
For the year ended March 31, 2016;Not applicable
For the year ended March 31, 2017;Not applicable
(2) Major affiliateMaeda Road Construction Co., Ltd. is a major affiliate as of March 31, 2016 and 2017, and a
summary of its financial statements as of March 31, 2016 and 2017 and for the years then ended is
as follows:
Millions of yenThousands of U.S. dollars
March 31 2016 2017 2017
Total current assets ¥140,165 ¥143,456 $1,278,688
Total non-current assets 94,496 105,125 937,026
Total current liabilities ¥ 46,067 ¥ 44,761 $ 398,975
Total long-term liabilities 12,662 13,266 118,246
Total net assets ¥175,932 ¥190,554 $1,698,494
Net sales ¥221,141 ¥221,034 $1,970,176
Profit before income taxes 25,900 25,729 229,334
Net profit 16,248 17,579 156,690
44 Maeda Corporation
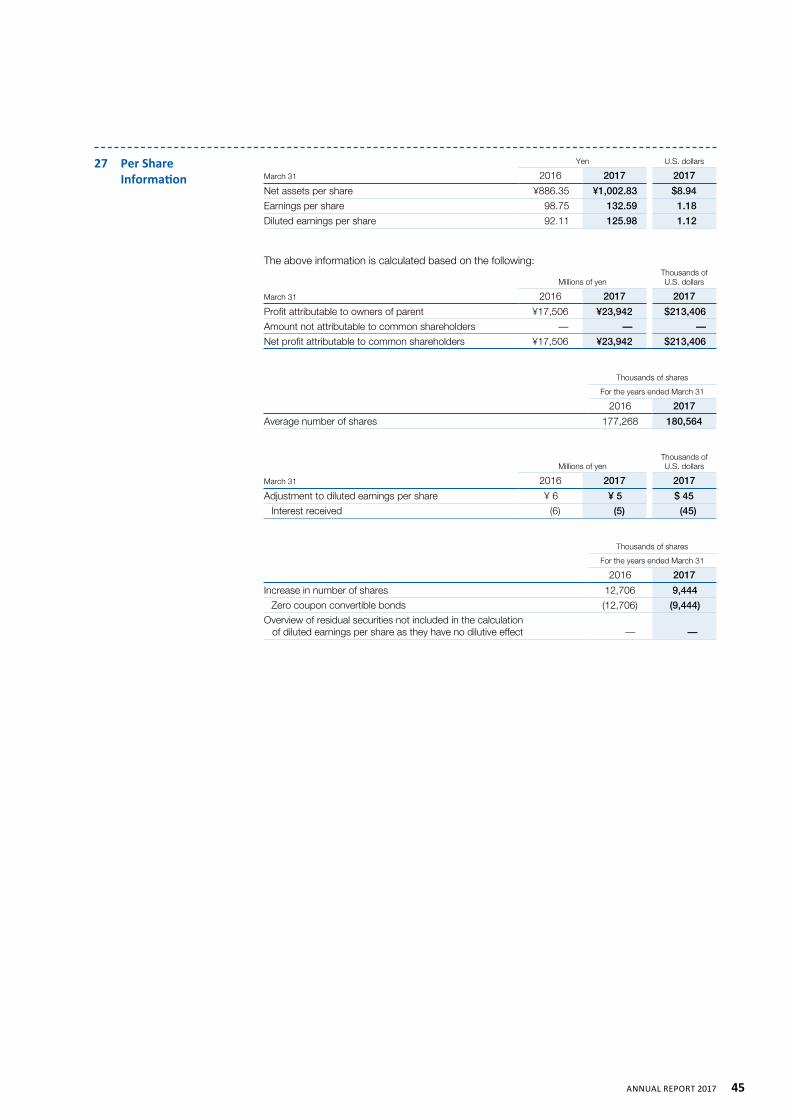
27 Per Share Information
Yen U.S. dollars
March 31 2016 2017 2017
Net assets per share ¥886.35 ¥1,002.83 $8.94
Earnings per share 98.75 132.59 1.18
Diluted earnings per share 92.11 125.98 1.12
The above information is calculated based on the following:
Millions of yenThousands of U.S. dollars
March 31 2016 2017 2017
Profit attributable to owners of parent ¥17,506 ¥23,942 $213,406
Amount not attributable to common shareholders — — —
Net profit attributable to common shareholders ¥17,506 ¥23,942 $213,406
Thousands of shares
For the years ended March 31
2016 2017
Average number of shares 177,268 180,564
Millions of yenThousands of U.S. dollars
March 31 2016 2017 2017
Adjustment to diluted earnings per share ¥ 6 ¥ 5 $ 45
Interest received (6) (5) (45)
Thousands of shares
For the years ended March 31
2016 2017
Increase in number of shares 12,706 9,444
Zero coupon convertible bonds (12,706) (9,444)
Overview of residual securities not included in the calculation of diluted earnings per share as they have no dilutive effect — —
45AnnuAl RepoRt 2017
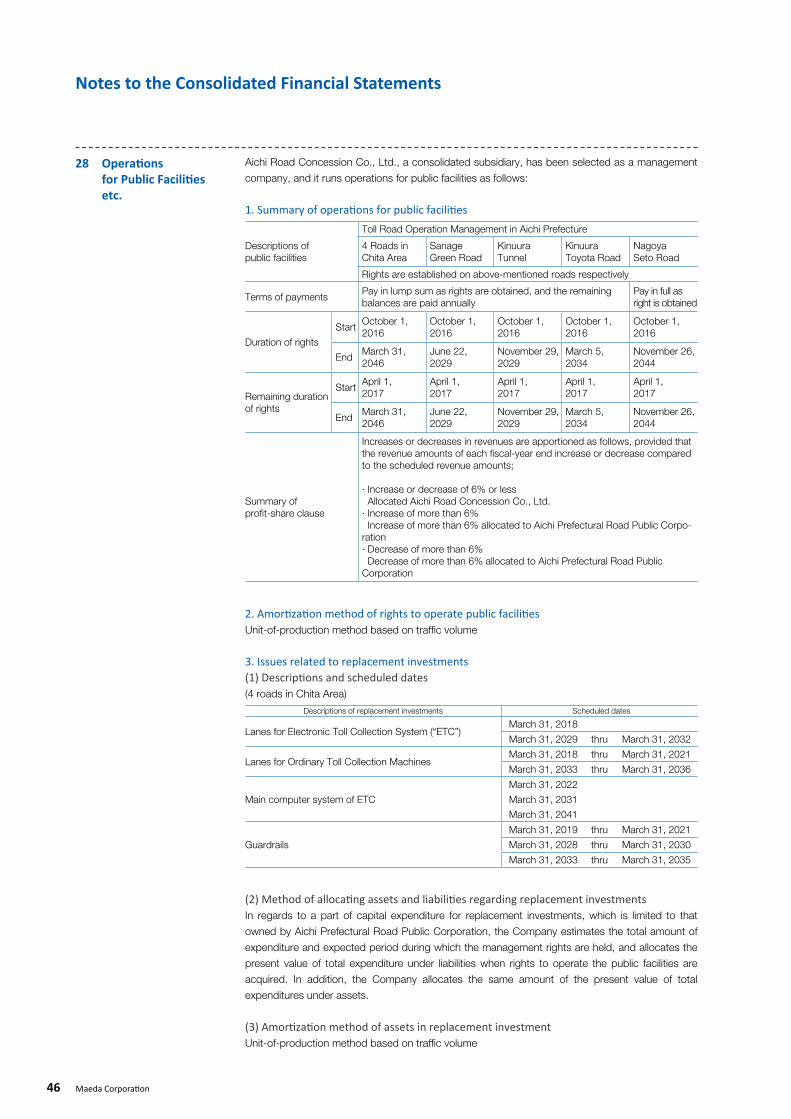
Notes to the Consolidated Financial Statements
28 Operations for Public Facilities etc.
Aichi Road Concession Co., Ltd., a consolidated subsidiary, has been selected as a management
company, and it runs operations for public facilities as follows:
1. Summary of operations for public facilities
Descriptions of public facilities
Toll Road Operation Management in Aichi Prefecture
4 Roads in Chita Area
Sanage Green Road
Kinuura Tunnel
Kinuura Toyota Road
Nagoya Seto Road
Rights are established on above-mentioned roads respectively
Terms of paymentsPay in lump sum as rights are obtained, and the remaining balances are paid annually
Pay in full as right is obtained
Duration of rights
StartOctober 1, 2016
October 1, 2016
October 1, 2016
October 1, 2016
October 1, 2016
EndMarch 31, 2046
June 22, 2029
November 29, 2029
March 5, 2034
November 26, 2044
Remaining duration of rights
StartApril 1, 2017
April 1, 2017
April 1, 2017
April 1, 2017
April 1, 2017
EndMarch 31, 2046
June 22, 2029
November 29, 2029
March 5, 2034
November 26, 2044
Summary of profit-share clause
Increases or decreases in revenues are apportioned as follows, provided that the revenue amounts of each fiscal-year end increase or decrease compared to the scheduled revenue amounts;
· Increase or decrease of 6% or less Allocated Aichi Road Concession Co., Ltd.· Increase of more than 6% Increase of more than 6% allocated to Aichi Prefectural Road Public Corpo-ration· Decrease of more than 6% Decrease of more than 6% allocated to Aichi Prefectural Road Public Corporation
2. Amortization method of rights to operate public facilitiesUnit-of-production method based on traffic volume
3. Issues related to replacement investments(1) Descriptions and scheduled dates(4 roads in Chita Area)
Descriptions of replacement investments Scheduled dates
Lanes for Electronic Toll Collection System (“ETC”)March 31, 2018
March 31, 2029 thru March 31, 2032
Lanes for Ordinary Toll Collection MachinesMarch 31, 2018 thru March 31, 2021
March 31, 2033 thru March 31, 2036
Main computer system of ETC
March 31, 2022
March 31, 2031
March 31, 2041
Guardrails
March 31, 2019 thru March 31, 2021
March 31, 2028 thru March 31, 2030
March 31, 2033 thru March 31, 2035
(2) Method of allocating assets and liabilities regarding replacement investmentsIn regards to a part of capital expenditure for replacement investments, which is limited to that
owned by Aichi Prefectural Road Public Corporation, the Company estimates the total amount of
expenditure and expected period during which the management rights are held, and allocates the
present value of total expenditure under liabilities when rights to operate the public facilities are
acquired. In addition, the Company allocates the same amount of the present value of total
expenditures under assets.
(3) Amortization method of assets in replacement investmentUnit-of-production method based on traffic volume
46 Maeda Corporation
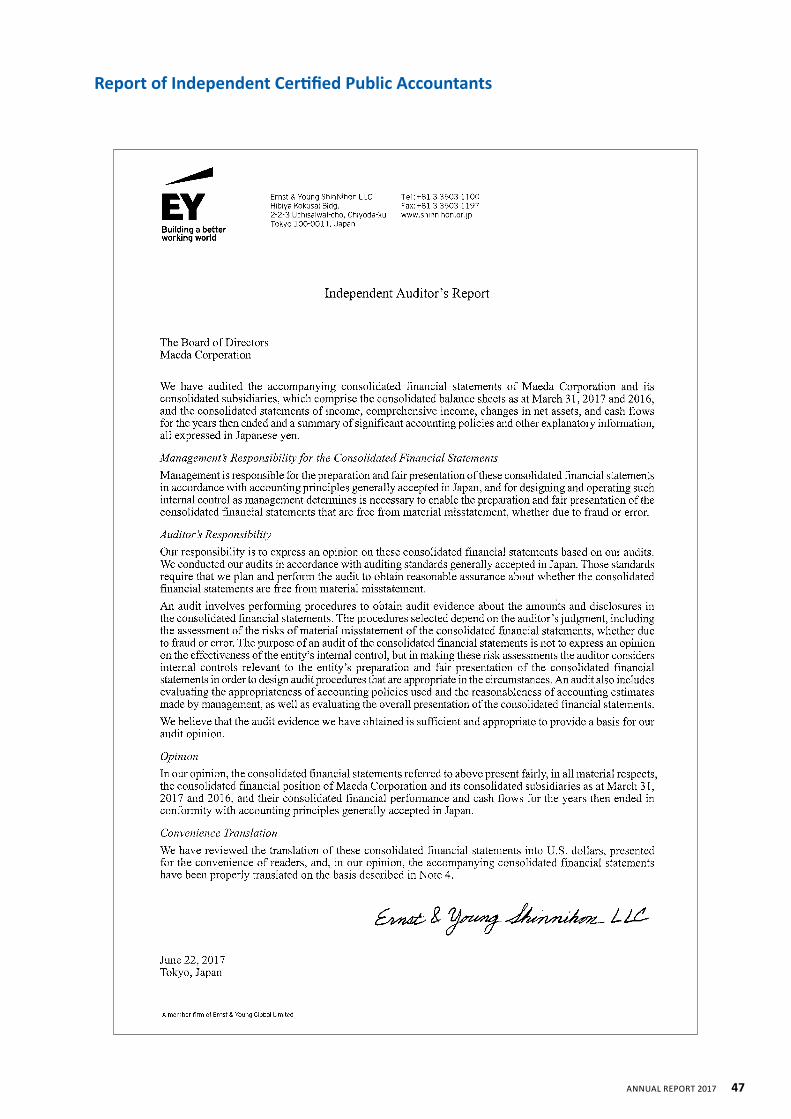
Report of Independent Certified Public Accountants
47AnnuAl RepoRt 2017
Directory
Directory Overseas
Hong Kong Office
Rooms 1602-1605 New East Ocean
Centre, 9 Science Museum Road,
T.S.T. East, Kowloon, Hong Kong,
China
Tel: 852-2369-9267
Fax: 852-2724-4046
Taiwan Office
2F, No. 205, Chang’an West Road,
Datong District, Taipei City 103, Taiwan
Tel: 886-2-2558-6380
Fax: 886-2-2558-6390
Hanoi Office
4F, 45 Trieu Viet Vuong Street,
Hai Ba Trung Dist., Hanoi, Vietnam
Tel: 84-4-3943-6311/2
Fax: 84-4-3943-6314
Phnom Penh Office
#53 E0 E1 E2, Street 01A,
Touk Thlar Village, Touk Thlar Commune,
Khan Sen Sok, Phnom Penh, Cambodia
Tel: 855-23-884-456/7
Fax: 855-23-884-458
Bangkok Office
18th Floor Thaniya Plaza Building,
52 Silom Road, Suriyawong, Bangrak,
Bangkok 10500, Thailand
Tel: 66-2-231-2470/2
Fax: 66-2-231-2473
Yangon Office
Room 601, Wizaya Plaza, Corner of
Dhammazedi Street & U Wisara Road,
Bahan Township, Yangon, Myanmar
Tel: 95-1-513-758
Fax: 95-1-513-758
Jakarta Office
Summitmas II, 12th Floor,
Jl. Jend. Sudirman Kav. 61-62,
Jakarta 12190 Indonesia
Tel: 62-21-252-6833
Fax: 62-21-252-6834
Sri Lanka Office
No.71/6, Barns Place, Colombo 07,
Sri Lanka
Tel: 94-11-269-7041
Fax: 94-11-452-8260
U.S.A. Office
39209 West Six Mile Road, Suite 204,
Livonia, Michigan, 48152-2660, U.S.A.
Tel: 1-734-462-2230
Fax: 1-734-462-2232
Mexico Office
Av. Las Americas #1701-D50,
Piso 7 Oficina 7, El Dorado,
Aguascalientes, Ags. Cp20235, Mexico
Tel: 52-449-140-5917
Principal Subsidiaries and Affiliates
Overseas:
THAI MAEDA CORPORATION LTD.
18th Floor Thaniya Plaza Building,
52 Silom Road, Suriyawong, Bangrak,
Bangkok 10500, Thailand
Tel: 66-2-231-2470/2
Fax: 66-2-231-2473
MAEDA VIETNAM CO., LTD.
Room 9 (Area B), 19th Floor,
Vincom Center, 72 Le Thanh Ton
Street,
Ben Nghe Ward, District 1,
Ho Chi Minh City, Vietnam
Tel: 84-8-3936-9000/9132/9133
Fax: 84-8-3936-9111
MAEDA CORPORATION
INDIA PRIVATE LTD.
7th Floor, Unit No. 702,
DLF South Court,
Saket, New Delhi-017, India
Tel: 91-11-4973-8888
Fax: 91-11-4973-8899
MAEDA (SHENZHEN)
CONSTRUCTION TECHNOLOGY
CO., LTD.
Room B1117 Annex Golden Central
Tower, 3037 Jintian Rd, Futian District,
Shenzhen 518048, China
Tel: 86-755-8278-4910
Fax: 86-755-8278-4920
GKMC CONSTRUCTION AND
CONSULTING INC.
Tekstilkent Koza Plaza A Blok K:34
34235 Esenler/Istanbul, Turkey
Tel: 90-212-467-2901/2902
Fax: 90-212-438-2409/2410
MAEDA THIEN DUC CO., LTD.
Floor 9, Block 6, Vista Building 628C
Hanoi Highway Residential Zone 4,
An Phu Ward, Dist. 2, Ho Chi Minh City,
Vietnam
Tel: 84-8-6258-6611
Fax: 84-9-0995-1067
Domestic:
• MAEDA ROAD CONSTRUCTION
CO., LTD.
• TOYO CONSTRUCTION CO., LTD.
• MAEDA SEISAKUSHO CO., LTD.
• HIKARIGAOKA CORPORATION
• FUJIMI KOKEN CO., LTD.
• FBS·MIYAMA CO., LTD.
• JM CORPORATION
• KOHO CO., LTD.
48 Maeda Corporation
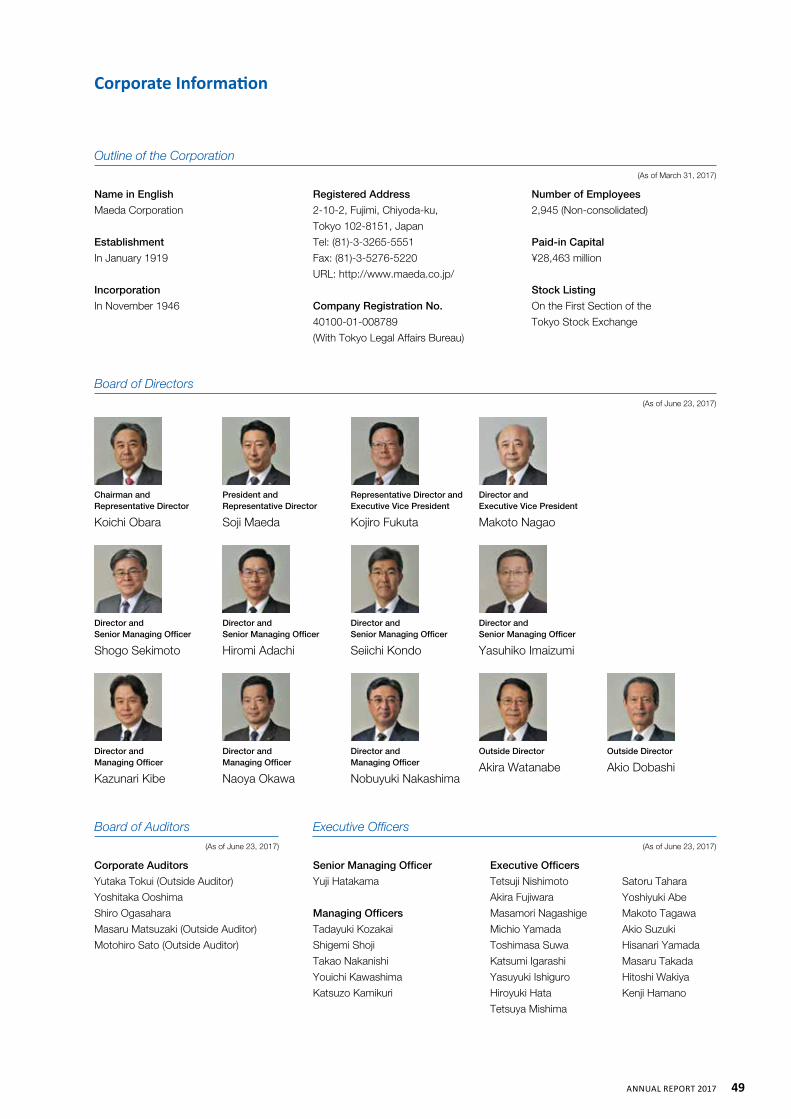
Corporate Information
Outline of the Corporation(As of March 31, 2017)
Name in English
Maeda Corporation
Establishment
In January 1919
Incorporation
In November 1946
Board of Directors (As of June 23, 2017)
Board of Auditors (As of June 23, 2017)
Corporate Auditors
Yutaka Tokui (Outside Auditor)
Yoshitaka Ooshima
Shiro Ogasahara
Masaru Matsuzaki (Outside Auditor)
Motohiro Sato (Outside Auditor)
Senior Managing Officer
Yuji Hatakama
Managing Officers
Tadayuki Kozakai
Shigemi Shoji
Takao Nakanishi
Youichi Kawashima
Katsuzo Kamikuri
Executive Officers (As of June 23, 2017)
Registered Address
2-10-2, Fujimi, Chiyoda-ku,
Tokyo 102-8151, Japan
Tel: (81)-3-3265-5551
Fax: (81)-3-5276-5220
URL: http://www.maeda.co.jp/
Company Registration No.
40100-01-008789
(With Tokyo Legal Affairs Bureau)
Number of Employees
2,945 (Non-consolidated)
Paid-in Capital
¥28,463 million
Stock Listing
On the First Section of the
Tokyo Stock Exchange
Executive Officers
Tetsuji Nishimoto
Akira Fujiwara
Masamori Nagashige
Michio Yamada
Toshimasa Suwa
Katsumi Igarashi
Yasuyuki Ishiguro
Hiroyuki Hata
Tetsuya Mishima
Chairman and Representative Director
Koichi Obara
Director and Managing Officer
Kazunari Kibe
President and Representative Director
Soji Maeda
Director and Senior Managing Officer
Shogo Sekimoto
Director and Managing Officer
Naoya Okawa
Representative Director and Executive Vice President
Kojiro Fukuta
Director and Managing Officer
Nobuyuki Nakashima
Director and Executive Vice President
Makoto Nagao
Director and Senior Managing Officer
Hiromi Adachi
Outside Director
Akira WatanabeOutside Director
Akio Dobashi
Director and Senior Managing Officer
Seiichi Kondo
Director and Senior Managing Officer
Yasuhiko Imaizumi
Satoru Tahara
Yoshiyuki Abe
Makoto Tagawa
Akio Suzuki
Hisanari Yamada
Masaru Takada
Hitoshi Wakiya
Kenji Hamano
49AnnuAl RepoRt 2017
Maeda Corporation
Printed in Japan
2-10-2, Fujimi, Chiyoda-ku,
Tokyo 102-8151, Japan
Tel: (81)-3-3265-5551 Fax: (81)-3-5276-5220
http://www.maeda.co.jp/


