30
Our strategy is working… INCREASED OUR PROFITABILITY REDUCED OUR DEBT OPTIMIZED OUR RESOURCES FOCUSED ON PROFITABLE GROWTH Annual Report 2002
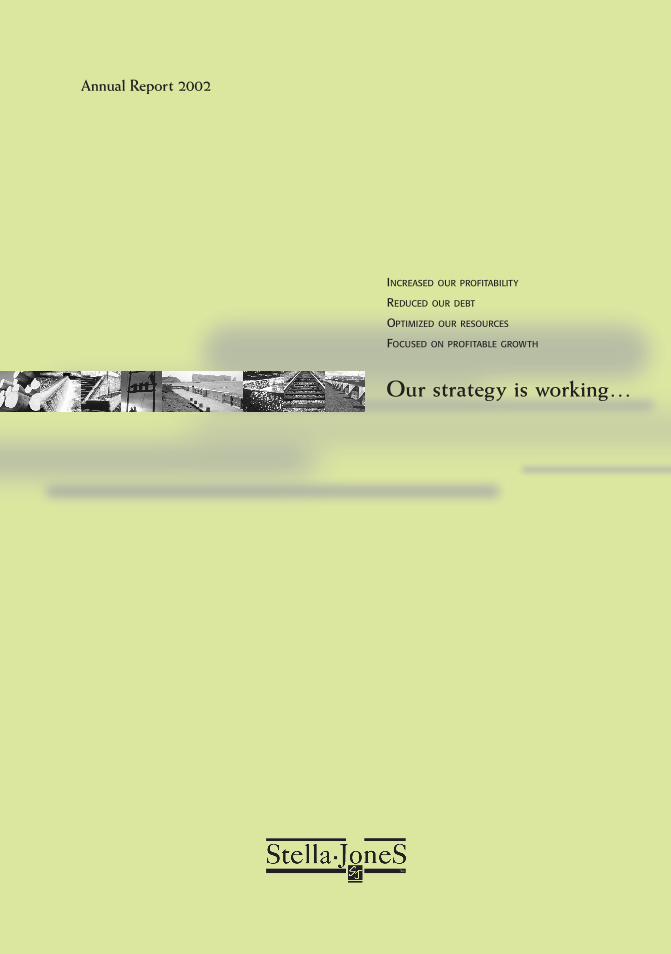
Our strategy is working…
INCREASED OUR PROFITABILITY
REDUCED OUR DEBT
OPTIMIZED OUR RESOURCES
FOCUSED ON PROFITABLE GROWTH
Annual Report 2002
Stella-Jones Inc. is the leading Canadian
producer of pressure treated wood products.
Stella-Jones’ products include treated wood
poles for electrical utilities and telecommu-
nications companies, railway ties, highway
guardrail posts, marine and foundation pil-
ings, and construction and bridge timbers.
The Company also provides customized
services to lumber companies and whole-
salers for the treatment of consumer lumber
products, such as decks and fencing.
Stella-Jones is committed to offering the
best in price, quality, service and environ-
mental practices. With some 200 employees
across Canada, the Company is the only
producer of pressure treated wood products
operating on a national scale and serving
markets worldwide.
Table of Contents
Our Mission 1Chairman’s Message 2President’s Message 4Management’s Discussion
and Analysis of Financial Condition and Results of Operations 6
Management’s Statement of Responsibilityfor Financial Information 11
Auditors’ Report 11Consolidated Financial Statements 12Notes to Consolidated Financial
Statements 15Directors and Officers 23Corporate Information 24
Our Profile

PolesCrossarms
Red pineJack pine Lodgepole pineSouthern yellow pineDouglas firWestern red cedarScots pine
Chromated Copper Arsenate (CCA)
PentachlorophenolCreosoteAmmoniacal Copper
Zinc Arsenate (ACZA)
UtilitiesTelecommunications
companiesCrown corporationsContractors
CanadaUnited StatesMexico Central AmericaSouth AmericaMiddle EastAfricaAsiaCaribbean
CrosstiesSwitchties
MapleOakBirchRed pine Jack pineLodgepole pineHemlock
CreosoteCreosote/oil
Railway companiesMining corporationsIndustryRailway maintenance
contractors
CanadaUnited StatesSouth America
Wood boardLatticeFence boardPlywoodDimensional lumber
for use in patios, decks, fences and other outdoor applications
White pineRed pine Jack pineFir
Chromated Copper Arsenate (CCA)*
Amine Copper Quaternary (ACQ)
WholesalersLumber companies
Canada
Foundation pilingsMarine pilingsMarine timbersConstruction timbersHighway guardrail postsBridge timbers
HemlockDouglas firRed pineJack pineLodgepole pineWestern red cedar
CanadaUnited States
Governmental departments– Transportation– Public works– Forestry– Harbours
ContractorsIndustryWholesalers Retailers
Chromated Copper Arsenate (CCA)
PentachlorophenolCreosoteAmmoniacal Copper
Zinc Arsenate (ACZA)
WO
OD
SPEC
IES
PR
OD
UCT
SP
RES
ERVA
TIV
ESC
UST
OM
ERS
GEO
GR
AP
HIC
MA
RK
ETS
WOOD POLES RAILWAY TIES INDUSTRIAL CONSUMER LUMBER
TREATED WOOD
Our Operations
* By the end of 2003, all Stella-Jones consumer lumber products will be treated with ACQ, a non-arsenic-based wood preservative.

(thousands of dollars, except per share data and ratios)Years ended December 31, 2002 2001 2000 1999 1998
$ $ $ $ $
Operating results
Sales 96,652 87,829 87,045 68,995 67,718
January 1998 ice storm sales – – – – 14,296
Total sales 96,652 87,829 87,045 68,995 82,014
EBITDA 9,620 5,045 8,928 8,732 8,680
Net earnings 3,721 488 3,156 3,625 3,821
Cash flow from operations* 5,818 3,064 5,287 4,870 5,371
Financial position
Working capital 21,418 20,669 21,086 22,376 21,765
Total assets 69,436 80,854 74,494 57,994 53,547
Long-term debt** 7,028 11,843 10,618 8,917 7,831
Shareholders’ equity 35,355 31,615 31,570 29,990 27,165
Per share data
Earnings per share 0.41 0.05 0.35 0.39 0.41
Earnings per share (diluted) 0.41 0.05 0.35 0.37 0.39
Cash flow from operations* 0.64 0.34 0.59 0.53 0.58
Book value 3.91 3.50 3.53 3.24 2.92
Working capital 2.37 2.29 2.36 2.42 2.34
Average number of shares outstanding (000s) 9,048 9,002 9,028 9,298 9,291
Shares outstanding at year end (000s) 9,053 9,043 8,947 9,245 9,305
Average number of diluted shares outstanding (000s) 9,078 9,015 9,087 9,853 9,855
Dividend per share – $0.07 $0.07 $0.07 –
Financial ratios
Return on average equity 11.1% 1.5% 10.3% 12.7% 15.1%
Long-term debt** to equity 0.20:1 0.37:1 0.34:1 0.30:1 0.29:1
* Before change in non-cash working capital balances** Including current portion
1998 1999 2000 2001 2002
4,000
5,000
6,000
7,000
8,000
9,000
10,000
Earnings Before Interest, Taxes, Depreciation and Amortization (EBITDA)(thousands of dollars)
1998 1999 2000 2001 2002
1.0
1.5
2.0
2.5
3.0
3.5
4.0
Book Value per Common Share(dollars)
Financial Highlights

STELLA-JONES’ OBJECTIVE IS TO BE THE PERFORMANCE LEADER IN THE
WOOD PRESERVING INDUSTRY AND A MODEL CORPORATE CITIZEN,EXERCISING ENVIRONMENTAL RESPONSIBILITY AND INTEGRITY.
STELLA-JONES WILL ACHIEVE THESE GOALS BY FOCUSING ON CUSTOMER
SATISFACTION, CORE PRODUCTS, KEY MARKET SEGMENTS, INNOVATIVE
WORK PRACTICES AND THE OPTIMAL USE OF ITS RESOURCES.
STELLA-JONES IS COMMITTED TO PROVIDING A SAFE, RESPECTFUL
AND PRODUCTIVE ENVIRONMENT FOR ITS EMPLOYEES, WHERE PROBLEM
SOLVING, INITIATIVE AND HIGH STANDARDS OF PERFORMANCE
ARE REWARDED.
Our Mission
1 STELLA-JONES
In our last report to shareholders, we high-
lighted the comprehensive measures that
we had taken to concentrate on our core
product lines and to improve productivity
in each of them. It was well that we did: all
sectors of the domestic and international
forest products industry remained difficult
throughout 2002, and our particular market
sectors continued to be very competitive.
It is therefore especially encouraging to
report that our forecast of a return to more
acceptable profitability by the end of 2002
has proved to be well-founded.
Our net profit improved to $3.7 million, or
$0.41 per share in fiscal 2002, from $488,000,
or $0.05 per share in 2001. Much of the
credit for this significant improvement goes
to our management team working under the
very capable leadership and direction of
Brian McManus in his first full year as
President and Chief Operating Officer of
Stella-Jones.
The implementation of our short-term cost-
cutting measures has not been at the expense
of the longer term. Our approach has
focused on those key areas where improve-
ments needed to be made, both within our
operations and in our markets, and by
achieving our objectives through close co-
operation with management and employees
at all levels. I believe that we are well on the
way to a consolidation of our business that
will enable it to respond rapidly to future
customer needs and industry developments.
This need for rapid response was demon-
strated during 2002 in our actions to
address concerns about the use of
Chromated Copper Arsenate in consumer
lumber applications. Stella-Jones responded
to these concerns by becoming the first
Canadian treater to use a new generation of
preservatives. Our unique strength of multiple
sites and treating cylinders has enabled us to
make the necessary alterations to our
processes while maintaining total service to
our customers without interruption or delay.
Chairman’s Message
2 STELLA-JONES

3 STELLA-JONES
In March 2003, your Board of Directors
adopted a modification to the Company’s
dividend policy whereby a dividend would
be considered on a semi-annual rather than
an annual basis. The payment of a semi-
annual dividend will be dependent upon the
Company’s financial performance and cash
requirements. In light of the Company’s
improved results in fiscal 2002 and solid
expectations for 2003, your Board is pleased
to recommend a first semi-annual dividend
of $0.04 per common share.
Since Stella-Jones became a publicly quoted
company in 1994, your Board of Directors
has been committed to constant improvement
in its corporate governance practices. We are
now in the process of developing a new
Corporate Governance Policy with particular
emphasis on communications and disclosure
practices, and we have recently re-structured
the composition of our Audit Committee.
George J. Bunze has replaced me as Chairman
of this Committee, and all members of the
Audit Committee are outside and unrelated
directors with excellent financial credentials.
You will find full details of the Board of
Directors, its members and the composition
of Board Committees on page 23 of this
Annual Report.
On behalf of the Board of Directors, I wish
to thank all employees for their commitment
during this year of improvement and for
their contribution to a very successful year.
Tom A. Bruce Jones, CBEChairman of the Board andChief Executive Officer
(Signed)
Your Board of Directors is committed to constant improve-ment in its corporate governance practices. We are now inthe process of developing a new Corporate GovernancePolicy with particular emphasis on communications anddisclosure practices.

During 2002, we began seeing the results
of a strategic operations review that was
conducted during the second half of the
previous year. During that review, we decided
to focus on building our lead in product
categories where our competitive advantage
was clearest, and to increase overall
organizational efficiency.
Both domestic and international markets
remain highly competitive and price remains
a key selling point in our industry. Never-
theless, our strategy is working. Due to a
continuous drive toward efficiency, we have
been able to keep our prices low while
increasing sales and profitability in our key
product lines – utility poles and railway ties.
We also moved aggressively to build on our
consumer lumber products business. We
invested in production capacity to supply
alternate wood treatments in advance of
the industry’s voluntary discontinuation of
Chromated Copper Arsenate as a preservative
for consumer applications.
Financial performance Our numbers speak for themselves. The
Company showed a marked improvement
in all key financial measures both in the income
statement and balance sheet.
During the year ended December 31, 2002,
earnings grew more than sevenfold to
$3.7 million or $0.41 per share, from $488,000
or $0.05 per share in the previous year.
President’s Message
Fiscal 2002 was characterized by a continued focus on corebusiness lines and cost containment. The results wereincreased sales and a marked improvement in profitability.Stella-Jones now looks to the future from a position ofstrength, with pared-down inventories, less debt and a strongerbalance sheet.
4 STELLA-JONES
5 STELLA-JONES
The earnings growth was due in large part
to heavy cost containment, which helped
keep prices competitive. Sales rose 10.1%
to $96.7 million during the year from
$87.8 million the previous year.
The additional sales and earnings meant
that the Company generated significantly
more cash. EBITDA rose 92% to a record
$9.6 million during the year, compared with
$5.0 million in the corresponding period
last year.
We also worked hard to improve the balance
sheet. For one, we cleared out excess inven-
tories of low-margin and slow-moving
items and freed up cash to reduce bank
indebtedness and long-term debt, which
together decreased by $9.9 million from
$28.1 million. We have also increased our
working capital position to $21.4 million at
year-end from $20.7 million a year earlier.
Continued focus on profitable growthAs we head into 2003, we look toward the
future with increased confidence created
by the momentum of a sound business
strategy, a strong financial position and
a solid management team.
While Canada’s pressure treated wood
market remains stable overall, we believe
there is considerable room for growth
within the sector. That means we intend to
continue to boost core product sales by
building relationships with key existing clients
such as blue-chip utilities and railways, as well
as adding new ones.
But we will not grow at any price. We will
focus on serving market segments, both
domestically and internationally, that ade-
quately reward the costs and risk of serving
those markets. We will continue to look
inwards, by honing operating efficiency and
focusing on remaining the dominant, yet
lowest cost producer in the Canadian market.
Taking ownership of our futureWe will also remain vigilant with regard to
new opportunities on the competitive land-
scape, specifically with regard to acquisitions.
While the domestic market is mature, it is
also highly fragmented with numerous
smaller regional players that could poten-
tially provide excellent synergies with our
existing operations.
We have set out clear criteria for acquisition
candidates. They must provide complemen-
tary strengths and synergies to our existing
operations, and any move would have to be
immediately accretive to earnings.
A word of thanks The last year has been filled with challenges,
new initiatives and lots of hard work. Our
many accomplishments have been very
much a team effort and there are a lot of
people to thank. We could not have done all
that we have without the contribution and
support of our employees, shareholders, a
strong and active Board of Directors and,
most importantly, our customers.
To them we extend our heartfelt appreciation.
Brian McManus President and Chief Operating Officer
(Signed)

6 STELLA-JONES
Operating resultsSales for the year ended December 31, 2002
grew 10.1% to reach $96.7 million, compared
with sales of $87.8 million in 2001. This
growth resulted from a strong improvement
in railway tie sales and significant increases
in domestic utility pole and consumer
lumber treating sales. These gains were
offset by minor declines in our industrial
treated wood and export utility pole markets,
two areas that were targeted for strategic
sales reductions.
Railway tie demand, particularly in Eastern
Canada, generated sales increases of 11.2%
compared with last year, while domestic
utility pole sales across Canada posted an
increase of 13.2% for the same period.
Treating services for consumer lumber were
up 31.5% over 2001, as we continued to
make inroads in the growing Ontario
consumer market serviced by our Guelph
facility. Our export utility pole sales
declined 4.6% versus last year. Industrial
treated wood sales were down by 2.1%
compared with 2001, as we exited lower
margin segments of this market to concentrate
on more profitable items.
Management’s Discussion and Analysis of Financial Condition and Results of Operations
In fiscal 2002, Stella-Jones signi-ficantly improved its operatingperformance and financial sta-bility, creating a stronger base forfuture growth. Specifically, theCompany focused on reducingcosts, streamlining operationsand improving profitability. Itsucceeded on all measures.

7 STELLA-JONES
Geographically, sales to the Unites States
increased by $4.5 million, or 34% over the
year 2001, to reach $17.9 million in 2002.
We have become a major supplier to various
U.S. power utilities and also successfully
compete on cross-border railway tie busi-
ness. In addition, Douglas fir, supplied by
our West Coast operations, is a preferred
species for many U.S. transmission projects.
In Canada, overall sales increased by 7.6%,
or $4.9 million, to reach $68.6 million in
2002. Export sales totalled $10.1 million for
the current year, down slightly from the
$10.6 million for the corresponding period
last year.
Gross margin increased to 15.4% of sales in
2002 compared with 12.7% of sales in 2001.
Operational efficiencies and improvements
in product mix accounted for this increase.
Selling and administration expenses amounted
to $5.2 million, or 5.4% of sales, down
significantly from the $6.2 million, or 7% of
sales, incurred the prior year. The major
cause of this reduction is the full year effect
of the cost-cutting measures and staff reduc-
tions introduced in the latter part of 2001. A
one-time refund of workmen’s compensation
premiums from previous periods and the
non-recurrence of last year’s charges related
to an acquisition evaluation and plant clo-
sures at Delson, Quebec, also contributed to
this year-over-year improvement.
Amortization of capital assets remained
unchanged from 2001 levels at $2.5 million
for the year.
Financial expenses decreased by 25.9% to
$1.3 million from $1.8 million in 2001. This
decrease reflects lower prime rates in the
corresponding period, scheduled debt
reductions and the overall decrease in bank
indebtedness resulting from the Company’s
improved working capital position.
Income tax expense was $2.1 million for the
year ended December 31, 2002, representing
an effective tax rate of 36%, marginally
lower than last year’s effective rate of 36.4%.
Net earnings amounted to $3.7 million, or
$0.41 per share in 2002, compared with
$488,000, or $0.05 per share in 2001. As a
percentage of sales, net earnings increased
from 0.6% of sales to 3.8% in 2002.
Liquidity and capital resourcesCash flow from operations increased by
$2.7 million in 2002, from $3.1 million as
at December 31, 2001 to $5.8 million as at
December 31, 2002. The cash flow generated
from changes in non-cash working capital
items, particularly resulting from the reduc-
tion in inventory levels, brought total cash flow
from operating activities to $11.1 million for
fiscal 2002, an improvement of $7.7 million
over the cash flow from operating activities
of $3.4 million as at the end of last year.
Sales by product (% of revenues)
Sales by geographic region (% of revenues)
United States 19%
Canada 71% Wood poles 58%
Railway ties 27%
Industrial treated wood 9%
Consumer lumber 6%Overseas 10%

The funds generated by operating activities
have been used to significantly reduce short-
and long-term bank indebtedness by
$5.0 million and $4.5 million, respectively,
since December 31, 2001. Trade accounts
payable have also been reduced by $7.2 million
over the same period. Our improved cash
flow position has enabled us to take greater
advantage of supplier discount terms and to
develop new sources of wood supply, where
prompt payment is a competitive advantage.
Working capital stood at $21.4 million as at
December 31, 2002, a $700,000 increase
over the working capital of $20.7 million at
the end of the prior year. The Company’s
current ratio improved to 1:80 from 1:54
during the 2002 fiscal period, while the
long-term debt to equity ratio went from
0.37:1 as at December 31, 2001 to 0.20:1 as
at December 31, 2002. The strength of
the Company’s balance sheet clearly
demonstrates the success of the Company’s
strategy of focusing on cutting costs and
reducing debt.
The Company has been in full compliance
with all its financial covenants since the
refinancing of its bank credit facilities on
February 15, 2002.
Shareholders’ equity increased to $35.4 mil-
lion in 2002, representing a book value of
$3.91 per share, compared with $31.6 million,
or $3.50 per share in 2001.
Cash used for capital expenditures in 2002
was $1.4 million, down $500,000 from the
$1.9 million spent in 2001. The largest expen-
ditures were made at our Guelph facility,
where we increased our consumer treating
capacity and completed a conversion to allow
treatment with Amine Copper Quaternary, a
new non-arsenic-based preservative approved
for consumer applications. Our Truro plant
was also converted and can now treat con-
sumer products with the new preservative.
Delson’s conversion will be completed by
the first quarter of 2003. The balance of the
capital expenditures related to equipment
upgrades, the purchase of mobile equipment
and environmental compliance projects.
DividendsOn March 18, 2003, the Board of Directors
adopted a modification to the Company’s
dividend policy whereby a dividend would
be considered on a semi-annual rather than
an annual basis. The payment of a semi-
annual dividend will be dependent upon the
Company’s financial performance and cash
requirements. In light of the Company’s
improved results in fiscal 2002 and solid
expectations for 2003, the Board declared
a first semi-annual dividend of $0.04 per
common share to shareholders of record as
of April 3, 2003. There can be no assurance
as to the amount or timing of such divi-
dends in the future.
8 STELLA-JONES
50,000
60,000
70,000
80,000
90,000
100,000
1998* 1999 2000 2001 2002
Sales(thousands of dollars)
* Includes January 1998 ice storm sales of $14.3 million.

9 STELLA-JONES
Risks and uncertaintiesManagement considers that Stella-Jones
may be affected by the industry-wide
concerns of long-term availability of com-
petitively priced wood and potential fluctu-
ations in wood prices. Nevertheless,
Stella-Jones’ overall competitiveness in this
industry is strengthened by its access to a
high quality timber supply provided by its
long-term cutting licenses and its long-
standing relationships with private wood-
land owners and other suppliers.
The possibility of major changes in envi-
ronmental laws and regulations is another
risk faced by the Company. Management
believes that its commitment to the environ-
mental integrity of the Company’s plants
and operations, supported by significant
investments toward that end, will allow
Stella-Jones to continue to meet the applicable
regulatory requirements.
The Company is exposed to currency risks
due to its export of goods manufactured in
Canada. These risks are partially covered by
purchases. The Company also uses foreign
exchange forward contracts to hedge con-
tracted net cash inflows of U.S. dollars.
OutlookThe current uncertainty facing the domestic
and global economies over the coming year
is similar to the situation the Company
faced at the start of 2002. We decided at
that time to concentrate on those elements
of our operations that we could control and
to focus on those product sectors that could
produce satisfactory returns. This strategy
has already proved successful and we intend
to continue along that same path.
We are pleased to report that in 2002 our
primary objectives of improving profitability
and cash flow were largely attained and, as
we predicted this time last year, our finan-
cial results progressively improved throughout
the year. In 2003, we expect to see further
progressive improvement as the full eco-
nomic impact of the cost reductions and
operational efficiencies that were put in
place in the latter part of 2001 and in early
2002 take effect. Many of the one-time costs
associated with these changes, particularly
severance expenses, should not recur and
the labour savings will extend over a full
year. There were also other one-time costs
incurred in exiting certain markets or product
segments. We have scaled back both our
operating and management infrastructure to
a level which can most efficiently support
our current level of activity.
However, there are still major challenges to
be faced in the coming year. Rising energy
prices, which directly affect both our raw
material costs and operating expenses, will
adversely impact our direct margins. The
1998 1999 2000 2001 2002
0
1,000
2,000
3,000
4,000
5,000
6,000
Cash Flow from Operations*
(thousands of dollars)
* Before change in non-cash working capital balances

10 STELLA-JONES
overcapacity in our industry makes it diffi-
cult to recover these rapid cost escalations
in the short term.
During the year 2000, baseline assessments,
known as Technical Recommendations
Documents, were carried out on the
Company’s plants as well as on all other wood
preserving plants in Canada by environ-
mental consultants on behalf of Environment
Canada. By December 31, 2001, all Canadian
wood preserving plants were obliged to
submit a plan of action to effectively remedy,
by year end 2005, all items for correction
noted in the assessments. The Company is
on schedule at all five of its plants with
respect to the plans of action submitted.
In 2003, we will be making an environ-
mental investment of approximately $2.0 mil-
lion to improve and augment the air and
wastewater treatment capacities at our
Delson, Quebec, plant. This facility is our
primary tie producing plant and the largest
utility pole producer in Eastern Canada.
The Canadian and U.S. wood treating
industry has voluntarily decided to phase
out, by December 31, 2003, the use of
Chromated Copper Arsenate (CCA) as a
preservative for treating lumber used in
consumer applications. CCA will continue
to be accepted for industrial uses, such as
treating utility poles and industrial timbers.
Stella-Jones was the first Canadian manu-
facturer to treat with Amine Copper
Quaternary (ACQ), one of the new genera-
tion of preservatives approved for consumer
applications. We have converted three
cylinders, one at each of our Delson,
Guelph and Truro plants to treat with
ACQ, and have installed a new cylinder at
our Guelph facility to handle anticipated
growth in our consumer custom treating
business in Ontario. We are working closely
with a major lumber wholesaler in Eastern
Canada to better service the consumer
lumber market and we anticipate that this
sector will deliver substantial growth over
the coming year.
In 2003, we should see a sharp decline in
overseas export sales. In 2002, we com-
pleted deliveries of several international
contracts and there is no order backlog to
replace this business. Competition from
new entrants and a foreign exchange disad-
vantage over the past two years in our his-
torically largest market of the Middle East
is the primary reason for this drop in new
business. We will continue to selectively
bid on international contracts if we are
satisfied that an adequate return can be
obtained for the risk involved, but we are
not targeting export sales as a primary
growth area. The impact of this sales reduc-
tion on the Company’s overall profitability
will be insignificant given the very low
margins we have been experiencing on
these sales.
We believe that industry consolidation is
inevitable given the number of treating
facilities in Canada, the available market
and the investment in plant and equipment
that will be required over the next few years to
meet environmental standards. Our renewed
financial capacity will provide us with the
necessary resources to take advantage of
any investment opportunities that may arise.

11 STELLA-JONES
Management’s Statement of Responsibility for Financial Information
Auditors’ Report
The consolidated financial statements contained in this Annual Report are the responsibility of management, and havebeen prepared in accordance with Canadian generally accepted accounting principles. Where necessary, managementhas made judgements and estimates of the outcome of events and transactions, with due consideration given to mate-riality. Management is also responsible for all other information in the Annual Report and for ensuring that this infor-mation is consistent, where appropriate, with the information and data included in the consolidated financial statements.
The Company maintains a system of internal controls to provide reasonable assurance as to the reliability of the financialrecords and safeguarding of its assets. The consolidated financial statements have been examined by the Company’sindependent auditors, PricewaterhouseCoopers LLP, and they have issued their report thereon.
The Board of Directors is responsible for overseeing management in the performance of its responsibilities forfinancial reporting. The Board exercises its responsibilities through the Audit Committee which is comprised ofthree unrelated non-management Directors. The Audit Committee meets from time to time with management andthe Company’s independent auditors to review the financial statements and matters relating to the audit. TheCompany’s independent auditors have full and free access to the Audit Committee. The consolidated financial statementshave been reviewed by the Audit Committee which recommended their approval by the Board of Directors.
Brian McManus George T. Labelle, C.A.President and Chief Operating Officer Vice-President, Finance
To the Shareholders ofStella-Jones Inc.
We have audited the consolidated balance sheets of Stella-Jones Inc. as at December 31, 2002 and 2001 and theconsolidated statements of earnings, retained earnings and cash flows for the years then ended. These financialstatements are the responsibility of the Company’s management. Our responsibility is to express an opinion on thesefinancial statements based on our audits.
We conducted our audits in accordance with Canadian generally accepted auditing standards. Those standards requirethat we plan and perform an audit to obtain reasonable assurance whether the financial statements are free of materialmisstatement. An audit includes examining, on a test basis, evidence supporting the amounts and disclosures in thefinancial statements. An audit also includes assessing the accounting principles used and significant estimates made bymanagement, as well as evaluating the overall financial statement presentation.
In our opinion, these consolidated financial statements present fairly, in all material respects, the financial positionof the Company as at December 31, 2002 and 2001 and the results of its operations and its cash flows for the yearsthen ended in accordance with Canadian generally accepted accounting principles.
PricewaterhouseCoopers LLP
Chartered AccountantsMontréal, QuebecFebruary 14, 2003
(Signed) (Signed)
(Signed)
12 STELLA-JONES
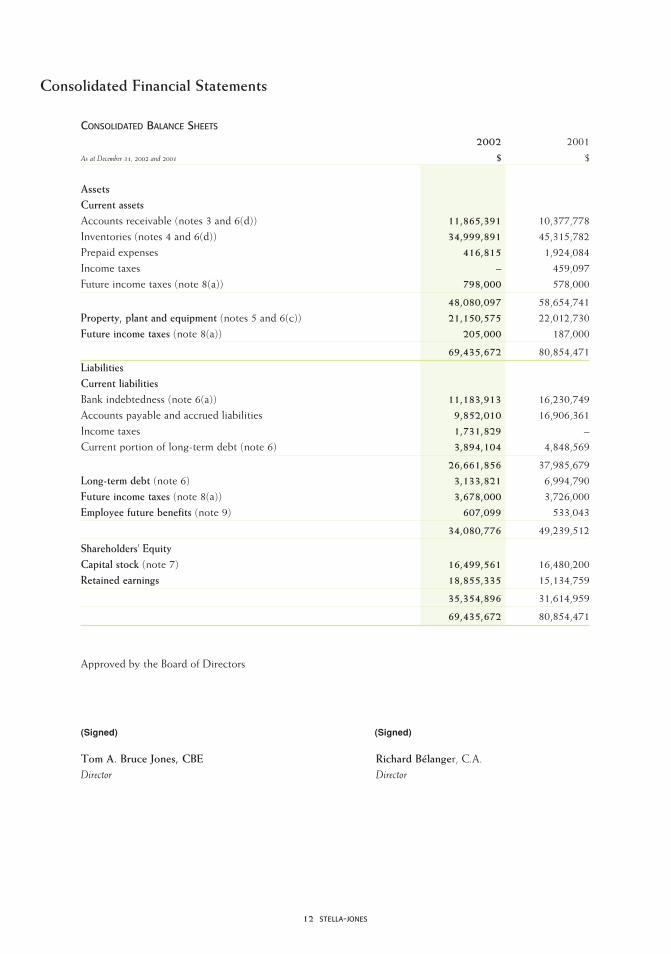
CONSOLIDATED BALANCE SHEETS
2002 2001As at December 31, 2002 and 2001 $ $
AssetsCurrent assetsAccounts receivable (notes 3 and 6(d)) 11,865,391 10,377,778Inventories (notes 4 and 6(d)) 34,999,891 45,315,782Prepaid expenses 416,815 1,924,084Income taxes – 459,097Future income taxes (note 8(a)) 798,000 578,000
48,080,097 58,654,741Property, plant and equipment (notes 5 and 6(c)) 21,150,575 22,012,730Future income taxes (note 8(a)) 205,000 187,000
69,435,672 80,854,471LiabilitiesCurrent liabilitiesBank indebtedness (note 6(a)) 11,183,913 16,230,749Accounts payable and accrued liabilities 9,852,010 16,906,361Income taxes 1,731,829 –Current portion of long-term debt (note 6) 3,894,104 4,848,569
26,661,856 37,985,679Long-term debt (note 6) 3,133,821 6,994,790Future income taxes (note 8(a)) 3,678,000 3,726,000Employee future benefits (note 9) 607,099 533,043
34,080,776 49,239,512
Shareholders’ EquityCapital stock (note 7) 16,499,561 16,480,200Retained earnings 18,855,335 15,134,759
35,354,896 31,614,959
69,435,672 80,854,471
Approved by the Board of Directors
Tom A. Bruce Jones, CBE Richard Bélanger, C.A.Director Director
(Signed) (Signed)
Consolidated Financial Statements

13 STELLA-JONES
CONSOLIDATED STATEMENTS OF EARNINGS
2002 2001For the years ended December 31, 2002 and 2001 $ $
Sales 96,652,333 87,828,972
ExpensesCost of sales 81,798,301 76,630,823Selling and administrative 5,233,714 6,153,355Amortization of property, plant and equipment 2,472,592 2,479,554
89,504,607 85,263,732
Operating earnings 7,147,726 2,565,240
Financial expenses (note 6(h)) 1,332,150 1,798,523
Earnings before income taxes 5,815,576 766,717
Provision for income taxes (note 8(b))
Current 2,381,000 208,000Future (286,000) 71,000
2,095,000 279,000
Net earnings for the year 3,720,576 487,717
Net earnings per common share (note 7(b)) 0.41 0.05
Diluted net earnings per common share (notes 2(b) and 7(b)) 0.41 0.05
CONSOLIDATED STATEMENTS OF RETAINED EARNINGS
2002 2001For the years ended December 31, 2002 and 2001 $ $
Balance – Beginning of year 15,134,759 15,273,356Net earnings for the year 3,720,576 487,717
18,855,335 15,761,073Dividends on common shares – (626,314)
Balance – End of year 18,855,335 15,134,759
Consolidated Financial Statements

14 STELLA-JONES
CONSOLIDATED STATEMENTS OF CASH FLOWS
2002 2001For the years ended December 31, 2002 and 2001 $ $
Cash flows from
Operating activitiesNet earnings for the year 3,720,576 487,717Adjustments for
Amortization of property, plant and equipment 2,472,592 2,479,554Gain on disposal of property, plant and equipment (163,700) (34,592)Employee future benefits 74,056 59,844Future income taxes (286,000) 71,000
5,817,524 3,063,523
Change in non-cash working capital componentsDecrease (increase) in
Accounts receivable (1,487,613) 1,132,070Inventories 10,315,891 (7,968,014)Prepaid expenses 1,507,269 (703,025)Income taxes 459,097 272,025
Increase (decrease) inAccounts payable and accrued liabilities (note 5(b)) (7,227,945) 7,999,534Income taxes 1,731,829 (418,768)
5,298,528 313,822
11,116,052 3,377,345
Financing activitiesDecrease in bank indebtedness (5,046,836) (2,048,296)Increase in long-term debt 6,436,023 4,000,000Repayment of long-term debt (11,251,457) (3,032,374)Proceeds from issuance of common shares 19,361 183,598Dividends – (626,314)
(9,842,909) (1,523,386)
Investing activitiesPurchase of property, plant and equipment (note 5(b)) (1,436,843) (1,903,959)Proceeds from disposal of property, plant and equipment 163,700 50,000
(1,273,143) (1,853,959)
Net change in cash and cash equivalents during the year – –
Cash and cash equivalents – Beginning and end of year – –Supplemental disclosureInterest paid 1,314,977 1,794,120Income taxes paid 215,748 344,177
Consolidated Financial Statements

15 STELLA-JONES
1 ACCOUNTING POLICIES
Principles of consolidationThese consolidated financial statements include the accounts of the Company and its subsidiary, Guelph UtilityPole Company Ltd., using the purchase method.
Measurement uncertaintyThe preparation of financial statements in conformity with Canadian generally accepted accounting principlesrequires management to make estimates and assumptions that affect the reported amounts of assets and liabilitiesand disclosure of contingent assets and liabilities at the dates of the financial statements and the reported amountsof revenues and expenses during the reporting periods. Actual results could differ from those estimates. Estimatesare reviewed periodically and, as adjustments become necessary, they are reported in earnings in the period inwhich they become known.
Fair market value of financial instrumentsThe Company has estimated the fair market value of its financial instruments based on current interest rates, marketvalue and current pricing of financial instruments with similar terms. Unless otherwise disclosed herein, the carryingvalue of these financial instruments, especially those with current maturities such as cash and cash equivalents,accounts receivable and accounts payable and accrued liabilities, approximates their fair market value.
Revenue recognitionSales are recognized upon delivery of the products if the payment terms are not subject to acceptance criteria. If anacceptance period is stipulated, revenues are recognized upon customer acceptance.
Cash and cash equivalentsCash and cash equivalents include cash on hand, bank balances and short-term liquid investments with maturitiesof three months or less.
InventoriesInventories of raw materials are valued at the lower of average cost and replacement cost. Finished goods are valuedat the lower of average cost and net realizable value and include the cost of raw materials, direct labour and manu-facturing overhead expenses.
Property, plant and equipmentProperty, plant and equipment are recorded at cost less accumulated amortization. Amortization is calculated on astraight-line basis using rates based on the estimated useful lives of the assets which are generally as follows:
Buildings up to 40 yearsProduction, anti-pollution and office equipment and rolling stock 2 to 20 years
Income taxesThe Company applies the liability method to account for income taxes. Under this method, future income taxes atthe balance sheet date are determined using the differences between the accounting and tax bases of assets and lia-bilities and the enacted income tax rates to be in effect when these differences are expected to reverse. Future taxassets are recognized when it is more likely than not that the assets will be realized.
Employee future benefitsThe cost of other retirement benefits earned by employees is established by actuarial calculations using theprojected benefit method prorated on years of service based on management’s best estimate of economic anddemographic assumptions.
Foreign currency translationTransactions denominated in a foreign currency are translated by applying exchange rates in effect at the transactiondate. At year-end, monetary assets and liabilities denominated in a foreign currency are translated using theexchange rate at that date. Any resulting foreign currency translation gains or losses are included in the statementof earnings.
Financial instrumentsThe Company enters into foreign exchange forward contracts to limit its exposure under contracted net cash inflowsof U.S. dollars. These contracts are treated as hedges. The exchange gains or losses related to these contracts,together with related hedging costs, are included in sales when the underlying hedged transaction is completed.
Notes to Consolidated Financial StatementsDecember 31, 2002 and 2001

16 STELLA-JONES
2 CHANGES IN ACCOUNTING POLICIES
a) Effective January 1, 2002, the Company adopted, on a prospective basis, the new recommendations of the CanadianInstitute of Chartered Accountants (“CICA”) related to the accounting for stock-based compensation and otherstock-based payments. These recommendations do not require the use of the fair value method when accounting forstock-based awards to employees, except for stock-based compensation that meets certain criteria. The recommen-dations require the use of a fair value based approach of accounting for stock-based payments to non-employees.
The Company has chosen to record an expense for the fair value of the stock options granted to employeesusing the Black-Scholes option pricing model. This model determines the fair value of stock options granted, and the dif-ference between the exercise price and the fair value at the grant date is amortized to earnings over the vesting period.
In accordance with the transitional provisions, the Company has adopted the new recommendations for awards grantedafter January 1, 2002. No charge was recorded for the year ended December 31, 2002 as the effect of these recommen-dations was not significant.
b) Effective January 1, 2001, the Company adopted the new recommendations of the CICA related to the calculationof earnings per share.
3 ACCOUNTS RECEIVABLE
2002 2001$ $
Trade 11,632,608 9,545,947Other 232,783 831,831
11,865,391 10,377,778
4 INVENTORIES
2002 2001$ $
Raw materials 23,740,652 30,034,468Finished goods 11,259,239 15,281,314
34,999,891 45,315,782
5 PROPERTY, PLANT AND EQUIPMENT
2002Accumulated
Cost amortization Net$ $ $
Buildings 4,720,231 1,202,413 3,517,818Production equipment 22,415,111 9,330,662 13,084,449Rolling stock 1,095,862 1,037,080 58,782Anti-pollution equipment 6,778,131 2,345,726 4,432,405Office equipment 591,468 534,347 57,121
35,600,803 14,450,228 21,150,575
2001
AccumulatedCost amortization Net
$ $ $
Buildings 4,720,231 978,972 3,741,259Production equipment 21,446,236 7,827,235 13,619,001Rolling stock 1,085,137 903,564 181,573Anti-pollution equipment 6,391,207 2,005,760 4,385,447Office equipment 591,468 506,018 85,450
34,234,279 12,221,549 22,012,730
Notes to Consolidated Financial Statements
17 STELLA-JONES
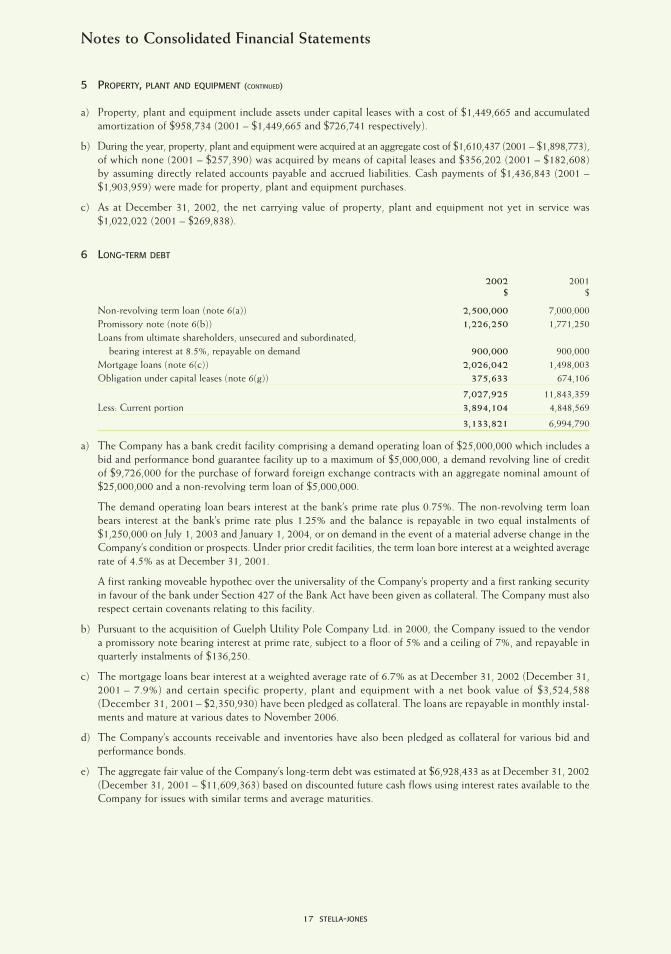
5 PROPERTY, PLANT AND EQUIPMENT (CONTINUED)
a) Property, plant and equipment include assets under capital leases with a cost of $1,449,665 and accumulatedamortization of $958,734 (2001 – $1,449,665 and $726,741 respectively).
b) During the year, property, plant and equipment were acquired at an aggregate cost of $1,610,437 (2001 – $1,898,773),of which none (2001 – $257,390) was acquired by means of capital leases and $356,202 (2001 – $182,608)by assuming directly related accounts payable and accrued liabilities. Cash payments of $1,436,843 (2001 –$1,903,959) were made for property, plant and equipment purchases.
c) As at December 31, 2002, the net carrying value of property, plant and equipment not yet in service was$1,022,022 (2001 – $269,838).
6 LONG-TERM DEBT
2002 2001$ $
Non-revolving term loan (note 6(a)) 2,500,000 7,000,000Promissory note (note 6(b)) 1,226,250 1,771,250Loans from ultimate shareholders, unsecured and subordinated,
bearing interest at 8.5%, repayable on demand 900,000 900,000Mortgage loans (note 6(c)) 2,026,042 1,498,003Obligation under capital leases (note 6(g)) 375,633 674,106
7,027,925 11,843,359Less: Current portion 3,894,104 4,848,569
3,133,821 6,994,790
a) The Company has a bank credit facility comprising a demand operating loan of $25,000,000 which includes abid and performance bond guarantee facility up to a maximum of $5,000,000, a demand revolving line of creditof $9,726,000 for the purchase of forward foreign exchange contracts with an aggregate nominal amount of$25,000,000 and a non-revolving term loan of $5,000,000.
The demand operating loan bears interest at the bank’s prime rate plus 0.75%. The non-revolving term loanbears interest at the bank’s prime rate plus 1.25% and the balance is repayable in two equal instalments of$1,250,000 on July 1, 2003 and January 1, 2004, or on demand in the event of a material adverse change in theCompany’s condition or prospects. Under prior credit facilities, the term loan bore interest at a weighted averagerate of 4.5% as at December 31, 2001.
A first ranking moveable hypothec over the universality of the Company’s property and a first ranking securityin favour of the bank under Section 427 of the Bank Act have been given as collateral. The Company must alsorespect certain covenants relating to this facility.
b) Pursuant to the acquisition of Guelph Utility Pole Company Ltd. in 2000, the Company issued to the vendora promissory note bearing interest at prime rate, subject to a floor of 5% and a ceiling of 7%, and repayable inquarterly instalments of $136,250.
c) The mortgage loans bear interest at a weighted average rate of 6.7% as at December 31, 2002 (December 31,2001 – 7.9%) and certain specific property, plant and equipment with a net book value of $3,524,588(December 31, 2001 – $2,350,930) have been pledged as collateral. The loans are repayable in monthly instal-ments and mature at various dates to November 2006.
d) The Company’s accounts receivable and inventories have also been pledged as collateral for various bid andperformance bonds.
e) The aggregate fair value of the Company’s long-term debt was estimated at $6,928,433 as at December 31, 2002(December 31, 2001 – $11,609,363) based on discounted future cash flows using interest rates available to theCompany for issues with similar terms and average maturities.
Notes to Consolidated Financial Statements

18 STELLA-JONES
6 LONG-TERM DEBT (CONTINUED)
f) The aggregate amount of the principal portion of the long-term debt payments, excluding the obligation undercapital leases, required in each of the next four years to meet retirement provisions is as follows:
$
Years ending December 31, 2003 3,685,9872004 2,194,8402005 513,3122006 258,153
6,652,292
g) Future minimum payments under capital leases are as follows:
$
Years ending December 31, 2003 227,4422004 150,0492005 24,521
Total future minimum lease payments 402,012Less: Interest (weighted average rate of 7.2%) 26,379Balance of obligation 375,633Less: Current portion 208,117
167,516
h) Financial expenses are detailed as follows:
2002 2001$ $
Interest on long-term debt 313,165 764,889Other interest 1,018,985 1,033,634
1,332,150 1,798,523
7 CAPITAL STOCK
a) Capital stock includes the following:
Authorized
An unlimited number of preferred shares issuable in series
An unlimited number of common shares
Issued
2002 2001
Shares $ Shares $
Balance – Beginning of year 9,043,462 16,480,200 8,947,348 16,296,602Stock option plan – – 80,000 155,675Share purchase plan 9,638 19,361 16,114 27,923
Balance – End of year 9,053,100 16,499,561 9,043,462 16,480,200
b) Net earnings per common share are calculated using the weighted average number of common shares outstandingduring the year. Diluted net earnings per common share are calculated using the weighted average number ofcommon shares outstanding during the year based on the application of the treasury stock method for the cal-culation of the dilutive effect of stock options and other dilutive securities.
Notes to Consolidated Financial Statements

19 STELLA-JONES
7 CAPITAL STOCK (CONTINUED)
The following table provides the reconciliation between net earnings per common share and diluted net earningsper common share:
2002 2001
Net earnings applicable to common shares $3,720,576 $487,717
Weighted average number of common shares outstanding 9,047,741 9,002,112Effect of dilutive stock options 30,032 13,309
Weighted average number of diluted common shares outstanding 9,077,773 9,015,421
Net earnings per common share $0.41 $0.05
Diluted net earnings per common share $0.41 $0.05
c) Stock Option Plan
The Company has a stock option plan for directors, officers and employees whereby the Board of Directors ora committee appointed for such purpose may from time to time grant to directors, officers or employees of theCompany options to acquire common shares in such numbers, for such terms and at such exercise prices as aredetermined by the Board or such committee. The stated purpose of the Stock Option Plan is to secure for theCompany and its shareholders the benefits of incentives inherent in share ownership by directors, officers andemployees of the Company.
Under the Stock Option Plan adopted on June 13, 1994 and amended on May 3, 1995 and on March 15, 2001,the aggregate number of common shares in respect of which options may be granted is 800,000 and no optioneeis able to hold options to purchase common shares exceeding 5% of the number of common shares outstandingfrom time to time. One-fifth of the options granted may be exercised within each year following the grant date.The exercise price of an option shall not be lower than the closing price of the common shares on the TorontoStock Exchange on the last trading day preceding the granting of the option and the term of the option maynot exceed ten years. Options will not be assignable and will terminate in the case of an employee, either 30 or180 days following cessation of service with the Company depending on the circumstances of such cessation,and in the case of a director who is not an employee of the Company, 180 days following the date on whichsuch optionee ceases to be a director of the Company.
Changes in the number of options outstanding were as follows:
2002 2001
Weighted WeightedNumber of average Number of average
options exercise price options exercise price$ $
Outstanding – Beginning of year 499,095 2.19 484,100 2.06Granted 30,000 2.00 322,495 2.16Cancelled (29,285) 2.04 (227,500) 1.93Exercised – – (80,000) 1.95
Outstanding – End of year 499,810 2.19 499,095 2.19
Options exercisable – End of year 284,884 2.23 223,099 2.24
The fair value of the options granted in 2002 was $5,700 ($0.19 per option).
Notes to Consolidated Financial Statements

20 STELLA-JONES
7 CAPITAL STOCK (CONTINUED)
The following options were outstanding as at December 31, 2002:
Options outstanding Options exercisable
Weighted Weightedaverage average
Year Number of exercice Number of exercice Expirationgranted option price options price date
$ $
1995 41,600 3.28 41,600 3.28 20051996 37,500 2.10 37,500 2.10 20061997 52,500 1.76 52,500 1.76 20071998 15,000 1.93 15,000 1.93 20082000 15,000 2.20 9,000 2.20 20102001 308,210 2.16 123,284 2.16 20112002 30,000 2.00 6,000 2.00 2012
499,810 284,884
d) Employee Share Purchase Plan
The aggregate number of common shares reserved for issuance under the Employee Share Purchase Plan is120,000. Under this plan, employees are eligible to purchase common shares from the Company at a price of90% of the market value. In 2002, 9,638 shares (2001 – 16,114) were issued under this plan at an average priceof $2.01 per share (2001 – $1.73). As at December 31, 2002, the total number of shares issued under this planis 94,329 (December 31, 2001 – 84,691).
8 INCOME TAXES
a) Current future income tax assets relate mainly to accrued liabilities, long-term future income tax assets relatemainly to employee future benefits and long-term future income tax liabilities relate mainly to property, plantand equipment.
b) The effective income tax rate differs from the basic Federal and provincial rates due to the following:
2002 2001% %
Basic Federal rate less provincial deduction 29.12 29.12Combined provincial tax rates 11.43 13.31
40.55 42.43Manufacturing and processing profit deduction (6.98) (8.09)Other 2.45 2.05
Effective income tax rate 36.02 36.39
Notes to Consolidated Financial Statements

21 STELLA-JONES
9 EMPLOYEE FUTURE BENEFITS
The Company offers employees benefits consisting of group health and dental care, life insurance and complementaryretirement benefits. These plans are not funded.
a) The following information pertains to the Company’s plans as established by independent actuaries:
2002 2001$ $
Change in accrued benefit obligationBalance – Beginning of year 611,373 473,199Current year service costs 36,421 27,972Interest on obligation 41,048 35,893Benefit payments (4,307) (4,021)Actuarial loss 105,257 78,330
Balance – End of year 789,792 611,373
Net obligation – End of year 789,792 611,373Less: Unamortized net actuarial loss 182,693 78,330
Accumulated benefit obligation 607,099 533,043
Component of net benefit cost for the yearCurrent year service cost 36,421 27,972Interest on obligation 41,048 35,893Amortization of net actuarial loss 894 –
Net benefit cost 78,363 63,865
b) The significant actuarial assumptions are the following:
2002 2001
Discount rate 6.50% 6.50%Salary escalation rate 4.50% 4.50%
For measurement purposes, a 10% annual rate of increase in the per capita cost of covered health care benefitswas assumed for 2002. This rate is assumed to decrease gradually by 0.5% per year, to reach 5%.
10 CONTINGENCIES AND COMMITMENTS
a) The Company has issued guarantees for $2,738,034 (December 31, 2001 – $4,226,694) under various bid andperformance bonds.
b) Future minimum payments under operating leases are as follows:
$
Years ending December 31, 2003 410,0292004 174,1172005 121,9022006 96,7602007 96,760
Thereafter 1,931,980
2,831,548
c) The Company’s operations are subject to Federal and provincial environmental laws and regulations governing,among other matters, air emissions, waste management and wastewater effluent discharges. The Company takesmeasures to comply with such laws and regulations. However, the measures taken are subject to the uncertaintiesof changing legal requirements, enforcement practices and developing technological processes.
Notes to Consolidated Financial Statements

22 STELLA-JONES
11 FINANCIAL INSTRUMENTS
Currency risksThe Company is exposed to currency risks due to its export of goods manufactured in Canada. These risks are partiallycovered by purchases. The Company also uses foreign exchange forward contracts to hedge contracted net cashinflows of U.S. dollars. Prices on export contracts are generally established well in advance of shipment dates andin order to protect margins from currency fluctuations, the Company sells forward the U.S. dollars to be received.The forward exchange contracts aggregating a nominal amount of US$13,000,000 have expiry dates ranging fromJanuary 2003 to December 2007, nominal values ranging from US$300,000 to US$1,000,000 and contracted ratesranging from 1.5850 to 1.6125. As at December 31, 2002, the unrealized foreign exchange loss on these contractswas $269,000.
Interest rate risksAs at December 31, 2002, the Company is exposed to an interest rate risk on long-term debt because 53%(December 31, 2001 – 74%) of the Company’s long-term debt is at variable rates.
Credit risksThe geographic distribution of customers and procedures regarding commercial risk management limit the concentrationof credit risks.
Trade accounts receivable include an element of credit risk should the counterparty be unable to meet its obligations.The Company reduces this risk by dealing primarily with utility and telecommunication companies and othermajor corporations.
12 RELATED PARTY TRANSACTIONS
The Company had the following transactions with related parties:
2002 2001$ $
Parent companyMarketing and technical service fees paid 200,000 200,000
Ultimate shareholdersMarketing and technical service fees paid 100,000 100,000Interest on loans 76,500 76,500
These transactions occurred in the normal course of operations and have been measured at the exchange amount,which is the amount of consideration established and agreed to by the related parties.
As at December 31, the balance sheets include the following amounts with related parties:
2002 2001$ $
Accounts payable to parent company 50,000 50,000Accounts payable to ultimate shareholders 63,774 63,774
13 SEGMENTED INFORMATION
The Company operates within one dominant business segment, the production and sale of pressure treated wood.Operating plants are located in Nova Scotia, Quebec, Ontario and British Columbia.
As at December 31, 2002, export sales amounted to $28,004,000 (2001 – $24,052,000), including $17,855,000(2001 – $13,412,000) to the United States. Other export sales are to various foreign countries located in CentralAmerica, South America, the Middle East and Africa.
In 2002, the Company had one customer representing 11% of its sales. In 2001, no customer represented more than10% of sales.
Notes to Consolidated Financial Statements
23 STELLA-JONES
Board of Directors
Richard Bélanger, C.A.(1)
President and Chief Executive Officer,Bois Daaquam Inc. (Forest products company)Sainte-Foy, QuebecDirector since March 1997
Tom A. Bruce Jones, CBEChairman of the Board and Chief Executive Officer,Stella-Jones Inc.Chairman of the Board,James Jones & Sons Limited(Forest products company)Larbert, ScotlandDirector since July 1993
George J. Bunze(1) (2)
Vice-Chairman and Chief Financial Officer,Kruger Inc. (Manufacturer of specialty wood and paper products)Montreal, QuebecDirector since May 2001
Gianni Chiarva(2)
Vice-Chairman of the Board,Stella-Jones Inc.President,Stella S.p.A. (Manufacturer of utility poles)Chairman of the Board,Sirti S.p.A.(Designs, maintains and installs telecommunications, transmission and electrical systems)Milan, ItalyDirector since July 1993
Arthur P. Earle, C.M., F.E.I.C.(1) (3)
Corporate Director,Beaconsfield, QuebecDirector since October 1992
Brian McManus
President and Chief Operating Officer,Stella-Jones Inc.Westmount, QuebecDirector since June 2001
Nycol Pageau-Goyette(2) (3)
President and Chief Executive Officer, Pageau Goyette et associés limitée(Management services firm)President, Sorinco inc.(Recycling facility)Montreal, QuebecDirector since July 1993
Daniel Picotte(3)
Partner,Fasken Martineau DuMoulin LLP (Law firm)Montreal, QuebecDirector since July 1993
Officers
Tom A. Bruce Jones, CBEChairman of the Board and Chief Executive Officer
Gianni Chiarva
Vice-Chairman of the Board
Brian McManus
President and Chief Operating Officer
George T. Labelle, C.A.Vice-President, Finance
Marla Eichenbaum
General Counsel and Secretary
Bernard Lucas
Vice-President and General Manager, Western Region
Gordon Murray
Vice-President, Environment and Technology and General Manager, Atlantic Region
Martin Poirier
General Manager, Central Region
Rémi Godin, C.G.A.Comptroller
Subsidiary – Senior Management
Rick Thompson
General Manager,Guelph Utility Pole Company Ltd.
Transfer Agent and Registrar
Computershare Trust Company of Canada
Auditors
PricewaterhouseCoopers LLP
Legal Counsel
Fasken Martineau DuMoulin LLP
(1) Member of the Audit Committee(2) Member of the Remuneration Committee(3) Member of the Environmental Committee
Directors and Officers

00
2/9712/97 2/912/98 2/912/99 2/012/00 2/012/01 2/0212/02
550
100
150
22002200
$
24 STELLA-JONES
Annual Meeting of Shareholders
May 7, 20039:30 a.m.Hotel Inter-Continental MontrealSalon Saint-Jacques360 Saint Antoine Street WestMontreal, Quebec
Stock Information
Shares listed: Toronto Stock Exchange
Ticker symbol: SJ
Initial public offering: 1994
Majority shareholder: Stella Jones
International S.A. (69%)
52-week high/low (January 1, 2002 –
December 31, 2002): $3.25 / $1.75
Share price at March 27, 2003: $3.00
Common shares outstanding as at December 31, 2002: 9.1 million
Dividend policy
On March 18, 2003, the Board of Directors adopted
a modification to the Company’s dividend policy
whereby a dividend would be considered on a semi-
annual rather than an annual basis. The payment
of a semi-annual dividend will be dependent upon
the Company’s financial performance and cash
requirements. In light of the Company’s improved
results in fiscal 2002 and solid expectations for 2003,
the Board declared a first semi-annual dividend
of $0.04 per common share. With the exception
of fiscal 2002, an annual dividend of $0.07 per
common share has been paid since May 1999.
Cumulative Total Return1998 1999 2000 2001 2002
Close $1.75 $2.50 $2.30 $ 2.00 $2.75
Price/earnings 4.27 6.41 6.57 40.00 6.71
Price/book value 0.60 0.77 0.65 0.57 0.70
Comparison of Five-Year Cumulative Total Return*
Between Stella-Jones Inc. and the S&P/TSX Composite Index
Stella-Jones Inc.
S&P/TSXComposite
*$100 invested on December 31, 1997 in stock or index-including reinvestment of dividends. Fiscal year ending December 31.
Corporate Information

Head Office
7th Floor4269 Saint Catherine Street WestWestmount, QuebecH3Z 1P7Tel.: (514) 934-8666Fax: (514) 934-5327E-mail: [email protected]
British Columbia
Plant and Sales Office25 Braid StreetNew WestminsterBritish ColumbiaV3L 3P2Tel.: (604) 521-4385Fax: (604) 526-8597E-mail: [email protected]
Plant7177 Pacific StreetPrince GeorgeBritish ColumbiaV2N 5S4Tel.: (250) 561-1161Fax: (250) 561-0903E-mail: [email protected]
Ontario
Plant and Sales OfficeGuelph Utility Pole Company Ltd.7818 Wellington Road 22Box 154, R.R. #5Guelph, OntarioN1H 6J2Tel.: (519) 822-3901Fax: (519) 822-5411E-mail: [email protected] site: www.guelphpole.com
Distribution Yard555 Station StreetBelleville, OntarioK8N 5A2Tel.: (613) 966-2637Fax: (613) 966-4521
Quebec
Plant and Sales Office41 Rodier StreetDelson, QuebecJ0L 1G0Tel.: (450) 632-2011Fax: (450) 632-3211E-mail: [email protected]
Pole Peeling Facility805 Grande Ligne RoadHérouxville, QuebecG0X 1J0Tel.: (418) 365-6369Fax: (418) 365-6308E-mail: [email protected]
Nova Scotia
Plant and Sales Office278 Park StreetTruro, Nova ScotiaB2N 5C1Tel.: (902) 893-9456Fax: (902) 893-3874E-mail: [email protected]
Locations

Prin
ted
in C
anad
a
Visit our web site at www.stella-jones.com


