49
Page: 1 Albany Port Authority Annual Report 1 July 2004 to 30 June 2005

Page: 1
Albany Port Authority
Annual Report
1 July 2004 to 30 June 2005

Page: 2
CONTENTS
CHAIRMAN’S REPORT ……………..….………… 3
CHIEF EXECUTIVE OFFICER’S REPORT ….…… 5
REPORT ON OPERATIONS ……………..……….. 7
ORGANISATIONAL STRUCTURE …………….. 18
PERFORMANCE INDICATORS ……….…………. 19
FINANCIAL REPORT ……………….……………... 22

Page: 3
CHAIRMAN’S REPORT Australia is an exporting nation and the standard of living enjoyed by every citizen is heavily dependent on the efficiency and cost competitiveness of exporting industries. The ports play a major role in the delivery chain and must offer a reliable, efficient, safe and secure door to their markets at a competitive cost. The evidence indicates that the Albany Port Authority is now doing well in that competition, as the last two years have been records in terms of both throughput and profit. From an average 1.8m tons in 2003, the Port is now operating at about 3m tons per annum, and plans are in place for 5m tons by 2008, a probable increase of about 250% in 5 years. This rapid growth has demanded considerable expenditure, planning and culture change. Following 3 years of losses, a return to profit has been an important milestone for the APA. Establishing sustainable financial stability repays the support and confidence placed in us by our shareholder, the State Government and ultimately the people of Western Australia. From these profits debt has been reduced, and work is about to commence on a major project to refurbish the port’s two oldest berths and restore them to their original operating capacity. To stand still is to go backwards and capability must grow. The investment of over $100m in new storage and handling equipment by Cooperative Bulk Handling at the Port will ensure that the Great Southern grain trade is well placed to meet the demanding specifications now required by world markets. The further development of wood chip infrastructure at the Port guarantees that the crops of plantation timber in the Great Southern can rely on efficient handling and loading of their product through our facility, which will soon become the largest wood chip port in Australia. In total, the infrastructure investment this year for grain and woodchips has exceeded $140m, all outlaid directly by the exporters. But they have looked to us for reciprocal support, to ensure that their investment is safe and effective. Matching rail and road systems are being developed and long term tenancies arranged to ensure that land on which infrastructure has been developed is efficient and secure for the long term. Stable industrial relations are of crucial importance and the Port has abandoned the previous practice of outsourcing, to ensure that all work on the facility is now undertaken by skilled local personnel. Self sufficiency of port operations, based on full time jobs have resulted in a marked improvement in morale and since making these changes in 2002, there have been no lost time injuries. Job training and safety have been enhanced and APA personnel are now well trained for the job. The skills base at our Port is significant and growing. Similarly with engineering, legislative compliance and environmental management, the Port now undertakes a large part of these activities in house and it has been pleasing to note that the quality of all work has improved at the same time that costs have been reduced. Because of a history in which the town grew up around the Port, the APA has been left with no significant buffer zones between where people live and where we work. For some time that was regarded as a handicap, but with high levels of interest in Port activity by our neighbours, the opportunity has been taken to broaden consultation and ensure that wherever possible, the APA operates as a friend to its many neighbours and the City in general. To achieve that harmonious balance, one of the major challenges is incoming transport. Rail has far less impact on residents than road and with help from Government we are working to minimize those effects. Passing rail lines, longer trains, better loading and coordination will double present rail capacity. Some truck traffic is unavoidable, but the State has undertaken to ensure that the impacts of road transport will be minimised. That is being achieved by the construction of a ring road north of the town and ensuring that remaining traffic is directed to lower impact roads. It has been an exciting year and in concluding this report, I offer sincere thanks to our employees, ably led by the CEO Brad Williamson. They daily demonstrate their enthusiasm for this Port and the tasks they perform for our customers. Similarly we are indeed fortunate to have a Board of Directors with a mix of talents, but who together have become such a successful and impressive team. It has been a pleasure and

Page: 4
privilege for me to be involved with all these people, who together have combined to deliver such a solid performance, my sincere thanks to you all.
Alan Birchmore Chairman

Page: 5
CHIEF EXECUTIVE OFFICER’S REPORT It has been another strong year at the port. A record was set for tonnage handled, at 2.99 million tonnes (up 5% from last year’s record); revenue was up 13% whilst expenditure was down 4%, resulting in a 29% increase in profit. Debt was reduced by $2.5 million. These are pleasing figures – the port is starting to receive the benefit of an increase in the wood chip trade (up 106% from last year), whilst grain, which has traditionally been the foundation of the port’s trade, increased 2% despite average to below-average rains in the port’s catchment area. Clearly the port is now financially secure and travelling well. The focus now needs to be on managing growth and protecting the existing assets. The Albany port has been a very busy construction site throughout the year. CBH has been undertaking a $100 million expansion to significantly upgrade the storage, segregation, handling and loading facilities at the port. Such a complex development requires close liaison and I am pleased to report that the multitude of issues thrown up by such a very large development have been handled smoothly between the parties. The Plantation Pulpwood Terminal, comprised of a joint venture between the interests of Timbercorp and Integrated Tree Cropping (ITC), has also been busy with the completion of their wood chip receival terminal, trading under the name of Albany Chip Terminal. This terminal will eventually be able to handle over 1 million tonnes of wood chips per annum, and links up to the existing wood chip loader owned and operated by Albany Bulk Handling. This project has also involved an array of complex technical issues that have required close liaison with the Port, and again this has proceeded smoothly throughout the year. The facility will export its first shipment of wood chips early in the 2005/06 financial year, which is a significant achievement for Timbercorp and ITC. During the year Albany Bulk Handling commenced an expansion of their facility, with over one hectare added to the site to expand the existing wood chip stockpile. Albany Plantation Export Company (APEC), the port’s first wood chip customer, more than doubled their throughput, reaching 459,000 tonnes. APEC is the pioneer of the wood chip industry in the Great Southern, their vision and perseverance through many challenges has now enabled the port and region to reap the benefits of a new, thriving industry. The Port’s claim against the Commonwealth for damages and remediation caused by the presence of negligently dumped munitions in the harbour has proceeded very slowly. The Port has been keen to avoid an expensive and adversarial court hearing, and has instead attempted to resolve the issue through mediation. Unfortunately the year closes without a resolution to this most difficult issue, one that has significant cost implications for us. Given the concerns expressed during the year by the Commonwealth about removing “bottlenecks” in ports, it is hoped a resolution of this issue can be achieved in the next financial year. The Albany port is forecasting strong growth in the next 5 years. Indeed, I expect tonnages at the port to double in this time, which requires careful planning. A key bottleneck identified at the port has been the location of the wood chip rail car dumper, which limits the length of wood chip trains to 14 wagons. This number of wagons will not be sufficient for the anticipated bulk wood chip trade, and it has become a priority to find a technical and financial solution to allow longer trains to enter the port. An analysis has identified grade separation between Princess Royal Drive and the railway line as the best solution and I am very pleased to report that the State Government has committed $2.6 million in funding to this project. This equity contribution is much appreciated and demonstrates their recognition of the critical importance of rail delivery to our port. To facilitate the use of rail and ease road congestion around Albany, the State Government has also made a commitment to the ring road, with stage 1 of this project now funded. The Albany Port is economical with staff numbers and we rate very well against other facilities in that way, but we have steadily expanded staff numbers where key roles can be filled from within. A milestone was the appointment of Graeme Poole as Port Engineer. The Port is now tackling such a wide variety of complex planning and maintenance issues, that professional in-house engineering is required full-time. Graeme has the ideal background for such a role, and I look forward to his contribution to the port. It was once fashionable to reduce direct staffing to very low numbers and contract out many activities, including core port services. We have found that this is not necessarily the best path to follow, and the port is now very well served by its first-rate team of permanent employees. The wharf operations area continues to be run very professionally under the guidance of Eric Norman (Wharf Manager), supported by Adrian Hetherington (Maintenance Supervisor), Trevor Grove, Kevin Jones, Dylan O’Neill and Kevin Drage.

Page: 6
The Port continues to improve the environmental management of the land and water under our care. For some time there has been concern expressed over the amount of nutrients discharged into Princess Royal Harbour with the port identified as a prime suspect. Mandy Bailey (Environment and Compliance Officer) has been able to demonstrate that fertiliser spillage through the spill plate containment system is negligible, with only 150 kilos being discharged in 2004/05 (1 kilo per 1,000 tonnes), compared to over 20 tonnes of nitrogen and 2 tonnes of phosphorus (2001 Department of Environment audit) entering the harbour from other sources. This information enables the Department of Environment to look further for the real culprits whilst we intensify our efforts to make a good record even better. Throughout the year there has been extensive planning work undertaken for a proposed iron ore (magnetite) trade from the Southdown deposit 90 kilometres east of Albany, near Wellstead. This is an ambitious project, involving the export of 6.5 million tonnes of magnetite concentrate through the port via a slurry pipeline. Without doubt this project, should it eventuate, would be the biggest development in the port’s modern history. It would involve dredging 9 kilometres into King George Sound, extensive reclamation and the development of a new berth. Such a development will require a major capital investment and the Port looks forward to working with Grange Resources Limited during its current feasibility stage to see if the project meets key operational and financial criteria. A priority for the Port is trade facilitation and we are making a significant effort to fulfil this role by working closely with Grange. The strong results this year have only been achieved through the efforts of the entire staff and in addition to those staff members mentioned earlier, I wish to thank Chris Shuttleworth (Harbour Master), Colin Berry (Finance Manager), his assistant George Blunden, Alyson Miller and Dowson Remaj for all their work during the year. In particular, I would like to thank Sue Sandison (Executive Assistant) for very professionally putting my working day into some sort of reasonable order. In addition, I would like to thank the Board and the Chairman for their support and guidance throughout the year.
Brad Williamson Chief Executive Officer

Page: 7
Albany Port Authority
Report on Operations
1 July 2004 to 30 June 2005
Page: 8
REPORT ON OPERATIONS This report, presents the operating report of the Albany Port Authority for the year ended 30 June 2005. Board Members The following persons were directors of the Albany Port Authority during the whole of the financial year and up to the date of this report:
Name Position Expiry Date of Tenure Mr. Alan Birchmore Chairman 31-Dec-2006 Mr. Russell Harrison Deputy Chairman 30-Jun-2005 Ms. Melissa Fletcher-Toovey Mr. Bob Golding Ms. Jo Hummerston
Member Member Member
30-Jun-2007 30-Jun-2006 31-Dec-2007
Chairman: Alan Birchmore A.A.I.I., F.A.I.C.D Mr. Birchmore was appointed to the Board in August 2003. He is currently the Chairman of Mermaid Marine Australia Ltd (since August 1998) His experience encompassed senior management and board appointments in Australia, England, Europe and the USA. These included companies such as British Satellite Broadcasting, TVam, the Swan Brewery, GMK Limited, Bond International Gold, St Barbara Mines Ltd, Argyle Diamonds, Whittakers, Mermaid Marine Limited and United Kimberley Diamonds Limited. Director: Russell Harrison B.Comm., F.T.I.A., A.C.A. Mr. Harrison was appointed to the Board in November 1993. Special responsibility: Finance His work experience includes 19 years as a public accountant, and for 13 years has been a partner of Lincoln’s Accountants & Business Advisors, and sits on various other boards. Director: Melissa Fletcher-Toovey Ms. Fletcher-Toovey was appointed to the Board in September 2001. She is currently the General Manager (since April 1993) of Fletcher International, a meat processing plant, which employs 300 - 500 people, depending on seasonal conditions. Director: Bob Golding Dip Man
Mr. Golding was appointed to the Board in October 2002 He is currently the business manager of Albany Bulk Handling and is a Member of the Australian Grain Institute and a past Member Director of CBH Superannuation Fund. His work experience includes twenty years in managerial roles in the grain storage industry.

Page: 9
Director: Jo Hummerston Ms. Hummerston was appointed to the Board in September 2003 She is currently the Chief Executive Officer of the Albany Chamber of Commerce and is a member of a number of local committees, including the Great Southern Employment Development Committee, the Great Southern TAFE College Council and the Regional Chambers of Commerce WA. Her work experience includes eight years in education and seven years with an employment agency. Principal Activities
In accordance with the Port Authorities Act 1999, the principal activities of the Authority consist of: (a) To facilitate trade within and through the port and plan for future growth and development of the
port; (b) To undertake or arrange for activities that will encourage and facilitate the development of trade
and commerce generally for the economic benefit of the state through the use of port and related facilities;
(c) To control business and other activities in the port or in connection with the operation of the port; (d) To be responsible for the safe and efficient operation of the port; (e) To be responsible for the maintenance and preservation of vested property and other property held
by the Authority; and (f) To protect the environment of the port and minimise the impact of port activities on that
environment.

Page: 10
Meetings of the Board
2005 2004
Number of meeting held 7 8
Number of meetings attended by:
A G Birchmore, Chairman 6 5 of 5
R J Harrison, Deputy Chairman 7 4
M Fletcher-Toovey 6 7 R J Golding 7 8 J Hummerston 6 5 of 5
Insurance of Officers
During the financial year, the Authority paid a premium of $25,516 (Excluding GST) to insure the members and executive officers of the Authority. The liabilities insured are costs and expenses that may be incurred in defending civil or criminal proceedings that may be brought against the officers in their capacity as officers of the Authority. Auditor In accordance with the Financial Administration and Audit Act 1985, the Office of the Auditor General continues in the office of auditor for the Authority. Port Polices and Procedures The port has developed a number of policies and procedures to address specific responsibilities. The port is committed to these policies, all of which are regularly reviewed and updated to ensure they reflect the current standards in the port industry. Copies of the policies are available on request. The following specific policies (and procedures where appropriate) have been developed: (a) Risk assessment and management
In 1997, Minter Ellison was engaged to assess the port’s risks.
These risks are regularly reviewed and updated as necessary to ensure the port’s exposure to those risks is addressed in a timely and appropriate manner.
(b) Internal audit
The Authority has formed an audit group comprising of relevant officers from four regional ports (Albany, Broome, Geraldton and Pt Hedland). The group has developed an internal audit program for each of the ports. Mr. Rick Pochroj, from the Port of Pt Hedland, carried out the internal audit function for the Authority.

Page: 11
(c) Equal employment opportunities (Equal Opportunities Act 1994)
The current staff level is fifteen, comprising of the CEO, four line managers (Harbour Master, Finance Manager, Port Engineer and Wharf Manager), three administration and seven operational staff members.
(d) Occupational Health and Safety (Occupational Health Safety & Welfare Act 1984)
The Authority has developed an OH&S committee, in accordance with the Act. This committee meets regularly to consider issues raised by staff members and persons operating in the port area. OH&S statistics, which are reviewed by the committee, are prepared by the Compliance Officer. Also, the port has developed a policy of licensing organisations operating in the port area. As part of each license it is mandatory for each organisation to have an appropriate OH&S program and the operator is required to provide periodic reports (to the port) on related OH&S statistics.
(e) Ethical standards
The port has developed a Code of Conduct (the Code) which has been fully endorsed by the Board and applies to all Board Members and employees.
The Code is regularly reviewed and updated as necessary to ensure it reflects the highest standards of behaviour and professionalism.
In summary, the Code requires that at all times all port personnel act with the utmost integrity, objectivity and in compliance with the letter and spirit of both the law and port policies.
(f) Port Compliance Advertising and sponsorship (Electoral Act s175ze)
The Authority did not incur any expenditure (greater than $1,500) on advertising agencies, market research organisations, polling organisations, direct marketing organisations or media advertising organisations
Records Management System
The Authority recognises the importance of proper and adequate record keeping practices. The State Records Act 2000 requires the following to be reported:
1. the efficiency and effectiveness of the record management system has been evaluated to be within the requirements of the Act;
2. the Authority conducts record keeping training as required; 3. the efficiency and effectiveness of the Authority’s training program is reviewed within the
requirements of the Act; and 4. new employees are inducted in their responsibility with regard to compliance with the
Authority’s record management system and the authority’s responsibility under the Act
Page: 12
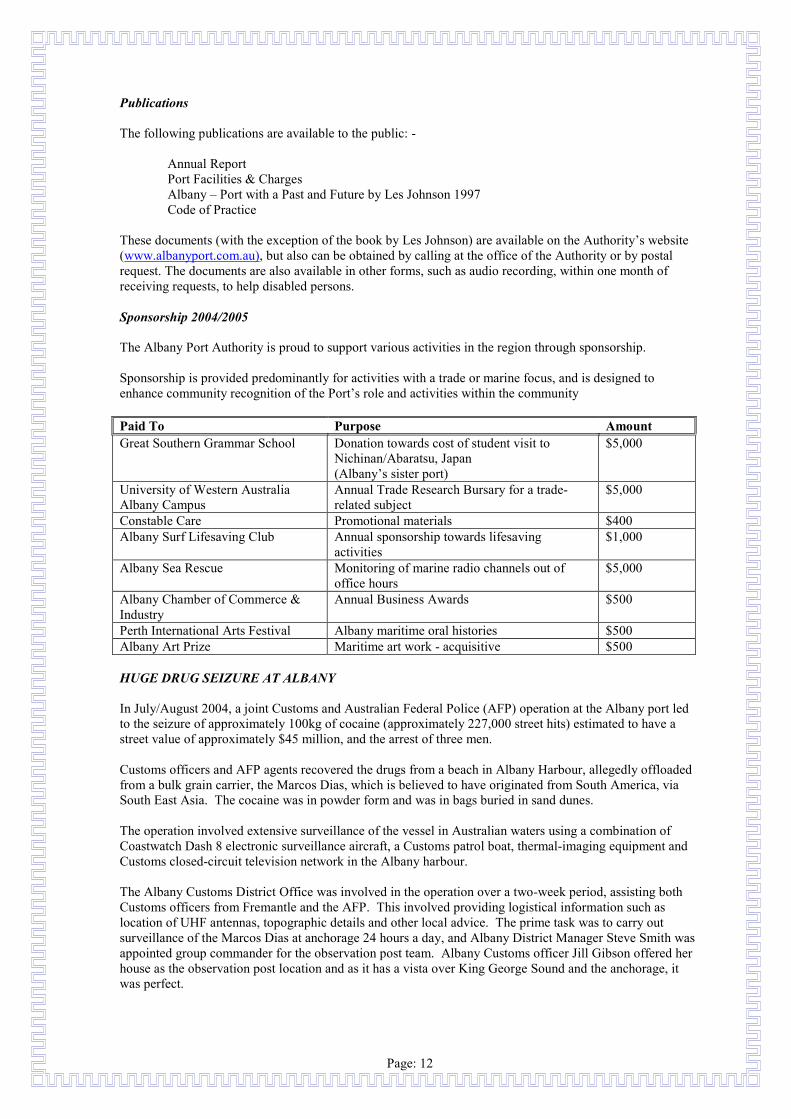
Publications The following publications are available to the public: -
Annual Report Port Facilities & Charges Albany – Port with a Past and Future by Les Johnson 1997 Code of Practice These documents (with the exception of the book by Les Johnson) are available on the Authority’s website (www.albanyport.com.au), but also can be obtained by calling at the office of the Authority or by postal request. The documents are also available in other forms, such as audio recording, within one month of receiving requests, to help disabled persons. Sponsorship 2004/2005 The Albany Port Authority is proud to support various activities in the region through sponsorship. Sponsorship is provided predominantly for activities with a trade or marine focus, and is designed to enhance community recognition of the Port’s role and activities within the community Paid To Purpose Amount Great Southern Grammar School Donation towards cost of student visit to
Nichinan/Abaratsu, Japan (Albany’s sister port)
$5,000
University of Western Australia Albany Campus
Annual Trade Research Bursary for a trade-related subject
$5,000
Constable Care Promotional materials $400 Albany Surf Lifesaving Club Annual sponsorship towards lifesaving
activities $1,000
Albany Sea Rescue Monitoring of marine radio channels out of office hours
$5,000
Albany Chamber of Commerce & Industry
Annual Business Awards $500
Perth International Arts Festival Albany maritime oral histories $500 Albany Art Prize Maritime art work - acquisitive $500
HUGE DRUG SEIZURE AT ALBANY In July/August 2004, a joint Customs and Australian Federal Police (AFP) operation at the Albany port led to the seizure of approximately 100kg of cocaine (approximately 227,000 street hits) estimated to have a street value of approximately $45 million, and the arrest of three men. Customs officers and AFP agents recovered the drugs from a beach in Albany Harbour, allegedly offloaded from a bulk grain carrier, the Marcos Dias, which is believed to have originated from South America, via South East Asia. The cocaine was in powder form and was in bags buried in sand dunes. The operation involved extensive surveillance of the vessel in Australian waters using a combination of Coastwatch Dash 8 electronic surveillance aircraft, a Customs patrol boat, thermal-imaging equipment and Customs closed-circuit television network in the Albany harbour. The Albany Customs District Office was involved in the operation over a two-week period, assisting both Customs officers from Fremantle and the AFP. This involved providing logistical information such as location of UHF antennas, topographic details and other local advice. The prime task was to carry out surveillance of the Marcos Dias at anchorage 24 hours a day, and Albany District Manager Steve Smith was appointed group commander for the observation post team. Albany Customs officer Jill Gibson offered her house as the observation post location and as it has a vista over King George Sound and the anchorage, it was perfect.

Page: 13
Thermal imaging and CCTV equipment was set up on the verandah and linked to monitors inside the house. After 10 days at anchorage, the Marcos Dias berthed and the observation post was moved to the District Office. The operation culminated in 45 Customs officers from all around Australia converging on Albany for the ship-search phase of the operation.
Page: 14
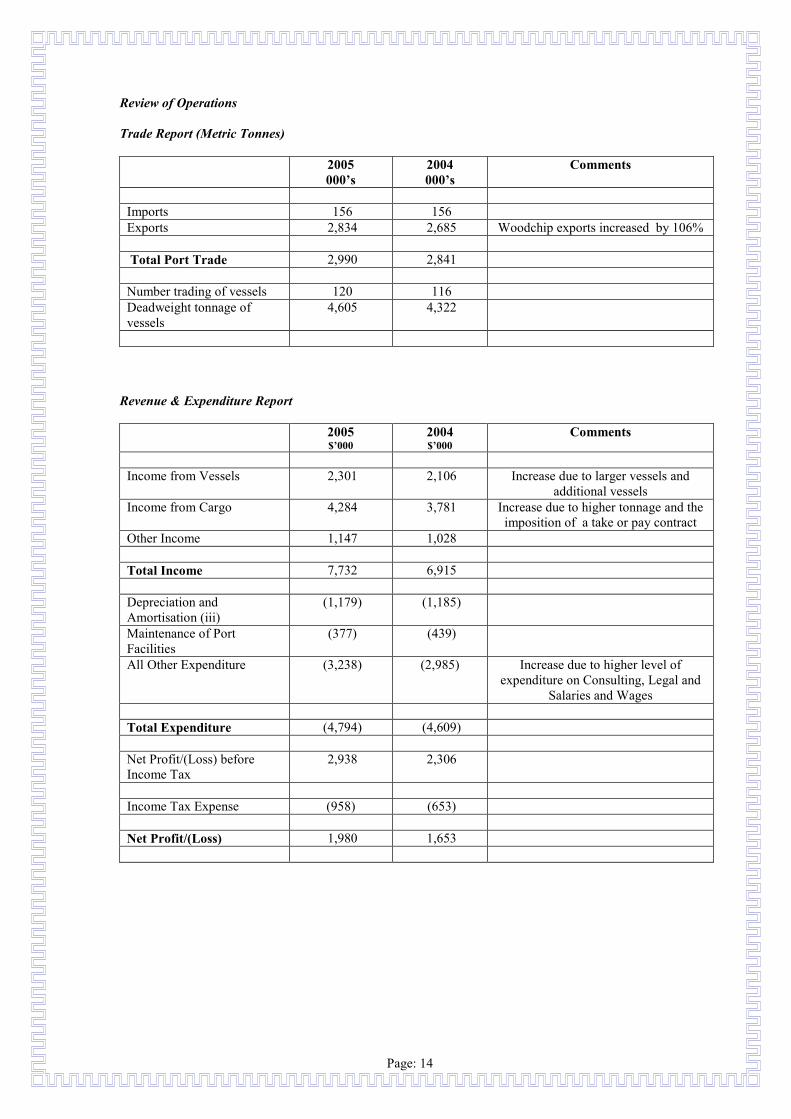
Review of Operations Trade Report (Metric Tonnes)
2005 000’s
2004 000’s
Comments
Imports 156 156 Exports 2,834 2,685 Woodchip exports increased by 106%
Total Port Trade 2,990 2,841
Number trading of vessels 120 116 Deadweight tonnage of vessels
4,605 4,322
Revenue & Expenditure Report
2005 $’000
2004 $’000
Comments
Income from Vessels 2,301 2,106 Increase due to larger vessels and additional vessels
Income from Cargo 4,284 3,781 Increase due to higher tonnage and the imposition of a take or pay contract
Other Income 1,147 1,028
Total Income 7,732 6,915
Depreciation and Amortisation (iii)
(1,179) (1,185)
Maintenance of Port Facilities
(377) (439)
All Other Expenditure (3,238) (2,985) Increase due to higher level of expenditure on Consulting, Legal and
Salaries and Wages
Total Expenditure (4,794) (4,609)
Net Profit/(Loss) before Income Tax
2,938 2,306
Income Tax Expense (958) (653)
Net Profit/(Loss) 1,980 1,653
Page: 15
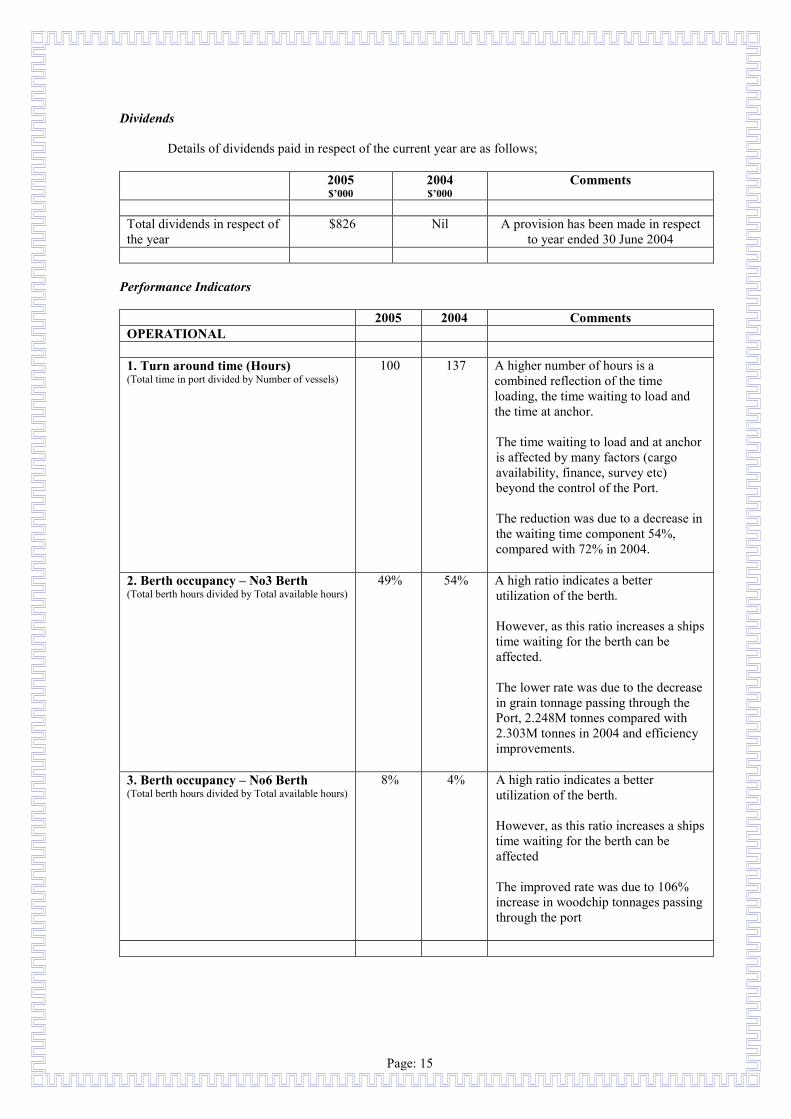
Dividends
Details of dividends paid in respect of the current year are as follows;
2005 $’000
2004 $’000
Comments
Total dividends in respect of the year
$826 Nil A provision has been made in respect to year ended 30 June 2004
Performance Indicators
2005 2004 Comments OPERATIONAL
1. Turn around time (Hours) (Total time in port divided by Number of vessels)
100 137 A higher number of hours is a combined reflection of the time loading, the time waiting to load and the time at anchor. The time waiting to load and at anchor is affected by many factors (cargo availability, finance, survey etc) beyond the control of the Port. The reduction was due to a decrease in the waiting time component 54%, compared with 72% in 2004.
2. Berth occupancy – No3 Berth (Total berth hours divided by Total available hours)
49% 54% A high ratio indicates a better utilization of the berth. However, as this ratio increases a ships time waiting for the berth can be affected. The lower rate was due to the decrease in grain tonnage passing through the Port, 2.248M tonnes compared with 2.303M tonnes in 2004 and efficiency improvements.
3. Berth occupancy – No6 Berth (Total berth hours divided by Total available hours)
8% 4% A high ratio indicates a better utilization of the berth. However, as this ratio increases a ships time waiting for the berth can be affected The improved rate was due to 106% increase in woodchip tonnages passing through the port
Page: 16
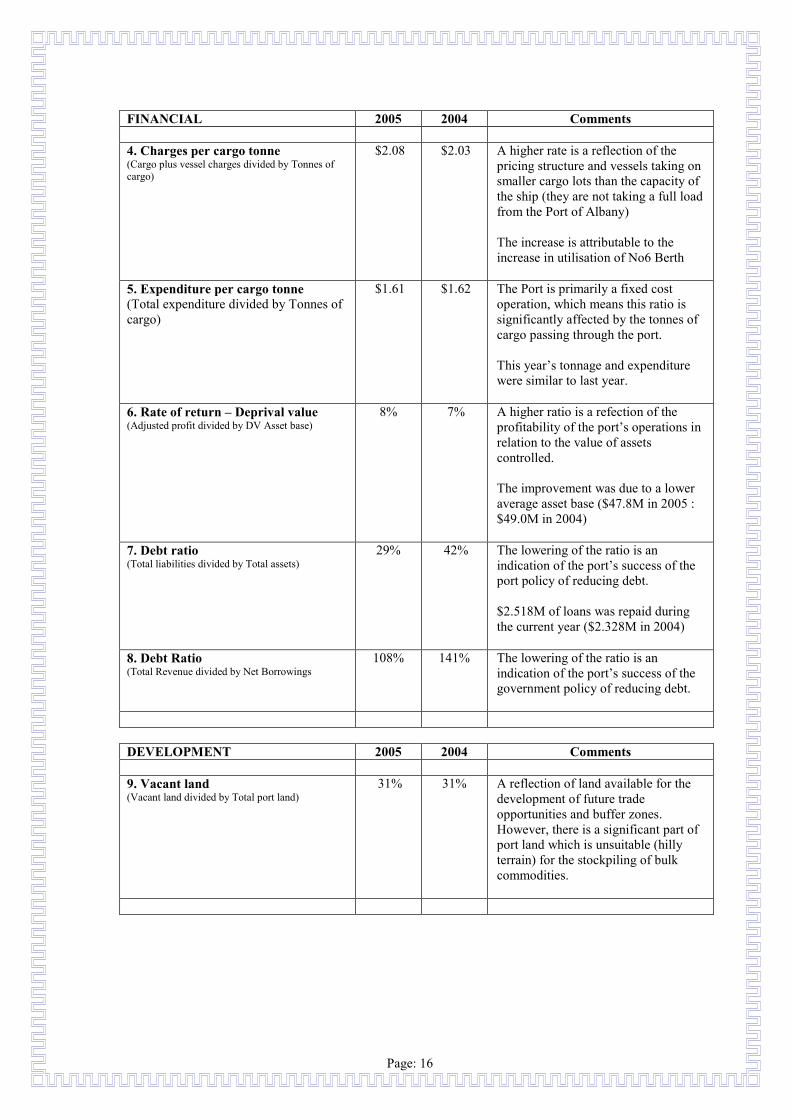
FINANCIAL 2005 2004 Comments
4. Charges per cargo tonne (Cargo plus vessel charges divided by Tonnes of cargo)
$2.08 $2.03 A higher rate is a reflection of the pricing structure and vessels taking on smaller cargo lots than the capacity of the ship (they are not taking a full load from the Port of Albany) The increase is attributable to the increase in utilisation of No6 Berth
5. Expenditure per cargo tonne (Total expenditure divided by Tonnes of cargo)
$1.61 $1.62 The Port is primarily a fixed cost operation, which means this ratio is significantly affected by the tonnes of cargo passing through the port. This year’s tonnage and expenditure were similar to last year.
6. Rate of return – Deprival value (Adjusted profit divided by DV Asset base)
8% 7% A higher ratio is a refection of the profitability of the port’s operations in relation to the value of assets controlled. The improvement was due to a lower average asset base ($47.8M in 2005 : $49.0M in 2004)
7. Debt ratio (Total liabilities divided by Total assets)
29% 42% The lowering of the ratio is an indication of the port’s success of the port policy of reducing debt. $2.518M of loans was repaid during the current year ($2.328M in 2004)
8. Debt Ratio (Total Revenue divided by Net Borrowings
108% 141% The lowering of the ratio is an indication of the port’s success of the government policy of reducing debt.
DEVELOPMENT 2005 2004 Comments
9. Vacant land (Vacant land divided by Total port land)
31% 31% A reflection of land available for the development of future trade opportunities and buffer zones. However, there is a significant part of port land which is unsuitable (hilly terrain) for the stockpiling of bulk commodities.

Page: 17
CITIZENSHIP 2005 2004 Comments
10. Incident Rate (Environmental incidents per million tonnes of cargo)
1.34 0.70 The port seeks to address complaints lodged by members of the public in a timely and appropriate manner. The complaints received in 2005 related to environmental issues, and the assistance of the Department of Environmental Protection is utilised to address such matters
PERSONNEL 2005 2004 Comments
11. Incident Rate (Lost time injuries per million man hours worked)
0 0 The ports objective is to have no lost time injuries.
ETHICS 2005 2004 Comments
12. Number of Complaints (Ethical) 0 0
Rounding of Amounts to Nearest Thousand Dollars Amounts in the financial report have been rounded off to the nearest thousand dollars.
DECLARATION BY THE DIRECTORS This report has been made in accordance with a resolution of the Directors
Russell Harrison Jo Hummerston Chairman of Audit Committee Director Albany, Western Australia 8 August 2005

Page: 18
ORGANISATIONAL STRUCTURE
Chief Executive Officer Brad Williamson
Port Engineer Graeme Poole
Finance Manager Colin Berry
Harbour Master Chris Shuttleworth
Environment & Compliance Officer
Mandy Bailey
Wharf Manager Eric Norman
Assistant Finance Manager
George Blunden
Maintenance Foreman Adrian Hetherington Wharf Carpenter Dylan O’Neill Maintenance Team Trevor Grove Kevin Jones Kevin Drage Cleaner (Part time) Dowson Remaj
BOARDChairman Alan Birchmore Deputy Chairman Russell Harrison Directors Bob Golding Melissa Fletcher-Toovey Jo Hummerston
Executive Assistant Sue Sandison
Office Assistant(Part Time) Alyson Miller
Total FTE = 14.17
Page: 19
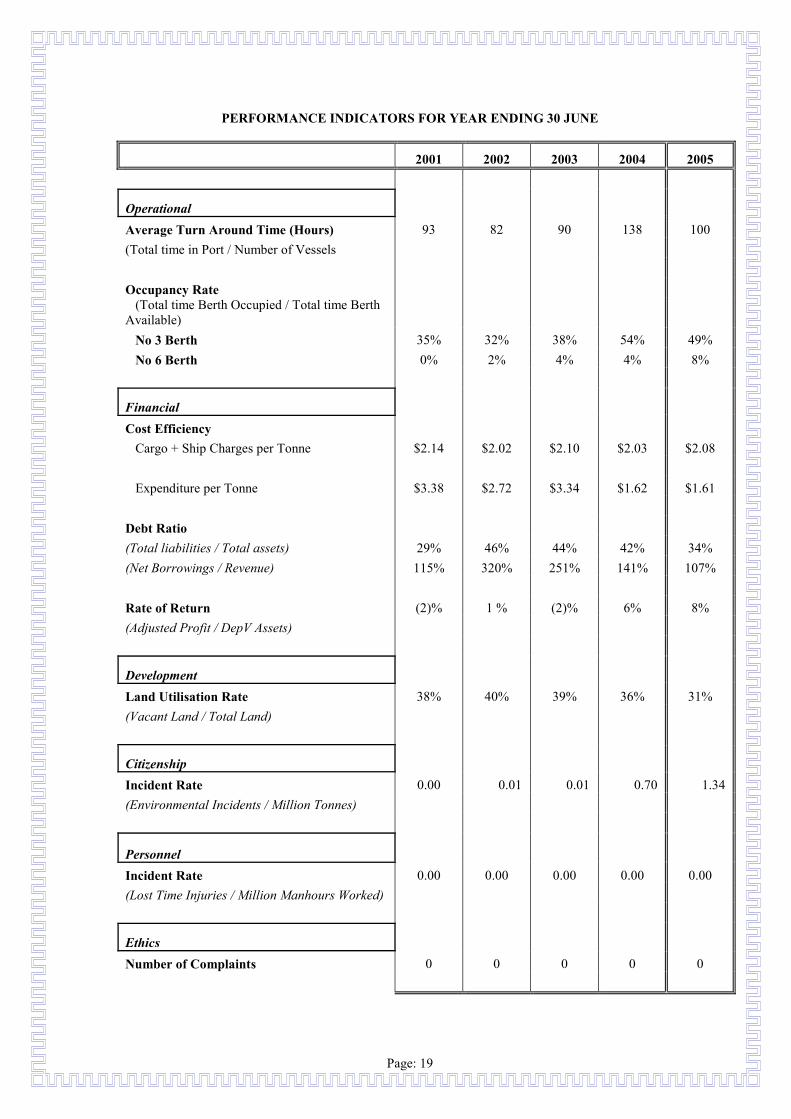
PERFORMANCE INDICATORS FOR YEAR ENDING 30 JUNE
2001 2002 2003 2004 2005
Operational
Average Turn Around Time (Hours) 93 82 90 138 100 (Total time in Port / Number of Vessels
Occupancy Rate (Total time Berth Occupied / Total time Berth
Available) No 3 Berth 35% 32% 38% 54% 49% No 6 Berth 0% 2% 4% 4% 8%
Financial
Cost Efficiency Cargo + Ship Charges per Tonne $2.14 $2.02 $2.10 $2.03 $2.08
Expenditure per Tonne $3.38 $2.72 $3.34 $1.62 $1.61
Debt Ratio (Total liabilities / Total assets) 29% 46% 44% 42% 34% (Net Borrowings / Revenue) 115% 320% 251% 141% 107%
Rate of Return (2)% 1 % (2)% 6% 8% (Adjusted Profit / DepV Assets)
Development
Land Utilisation Rate 38% 40% 39% 36% 31% (Vacant Land / Total Land)
Citizenship Incident Rate 0.00 0.01 0.01 0.70 1.34 (Environmental Incidents / Million Tonnes)
Personnel Incident Rate 0.00 0.00 0.00 0.00 0.00 (Lost Time Injuries / Million Manhours Worked)
Ethics
Number of Complaints 0 0 0 0 0

Page: 20
TRADE STATISTICS FOR YEAR ENDING 30 JUNE
2001 2002 2003 2004 2005
IMPORTS Agras 0 2,356 3,064 3,571 0All Star 0 1,208 0 2,428 0Ammonia Sulphate 0 494 1,120 1,497 1,216 C.A.N. 1,021 2,734 3,006 3,244 1,151 D.A.P. 9,366 7,837 7,559 3,855 7,281 Fish 2,168 4,087 5,549 2,486 4,418 General 2,058 0 3,545 0 0Kieserite 0 0 0 1,361 0MAPS 16,054 19,213 28,224 19,461 19,914 NPK Fertiliser 2,693 0 2,139 564 7,675 Petroleum Products 74,573 57,117 22,354 24,427 0Potash 15,116 20,225 25,781 35,680 36,503 Rock Phosphate 57,314 0 0 6,396 28,273 Single Super 3,460 3,246 4,217 4,814 3,892 Sulphur 12,510 0 0 0 0Triple Super 7,079 6,054 8,045 12,993 9,911 Urea 40,662 35,829 31,966 31,131 35,830 Vigour 131 0 1,208 1,973 0Zinc Star 0 0 0 515 0
TOTAL IMPORTS 244,205 160,401 147,778 156,396 156,065
EXPORTS Barley 252,787 330,001 459,711 585,725 857,018 Canola 125,782 172,993 121,125 252,490 214,536 Meat (Frozen) 3,779 0 0 0 0Lupins 0 0 5,498 25,275 0Oats 0 24,999 51,885 50,230 0Peas 0 0 0 0 4,949 Silica Sand 83,850 123,829 122,258 158,215 127,750 Superphosphate 0 0 0 0 0Wheat 963,007 711,561 840,145 1,426,028 1,171,186 Woodchips 0 70,740 212,846 223,185 458,732
TOTAL EXPORTS 1,429,206 1,434,123 1,813,468 2,721,148 2,834,170
Bunkers 44 0 25 41 150
TOTAL PORT TRADE 1,673,454 1,594,524 1,961,271 2,877,585 2,990,385
VESSELS Number of Vessels Entered Port 89 86 104 116 120 Gross Registered Tonnage 1,807,713 1,795,256 2,213,096 2,616,888 2,834,882 Deadweight Tonnage 3,064,192 3,017,665 3,582,845 4,321,577 4,605,416
Page: 21
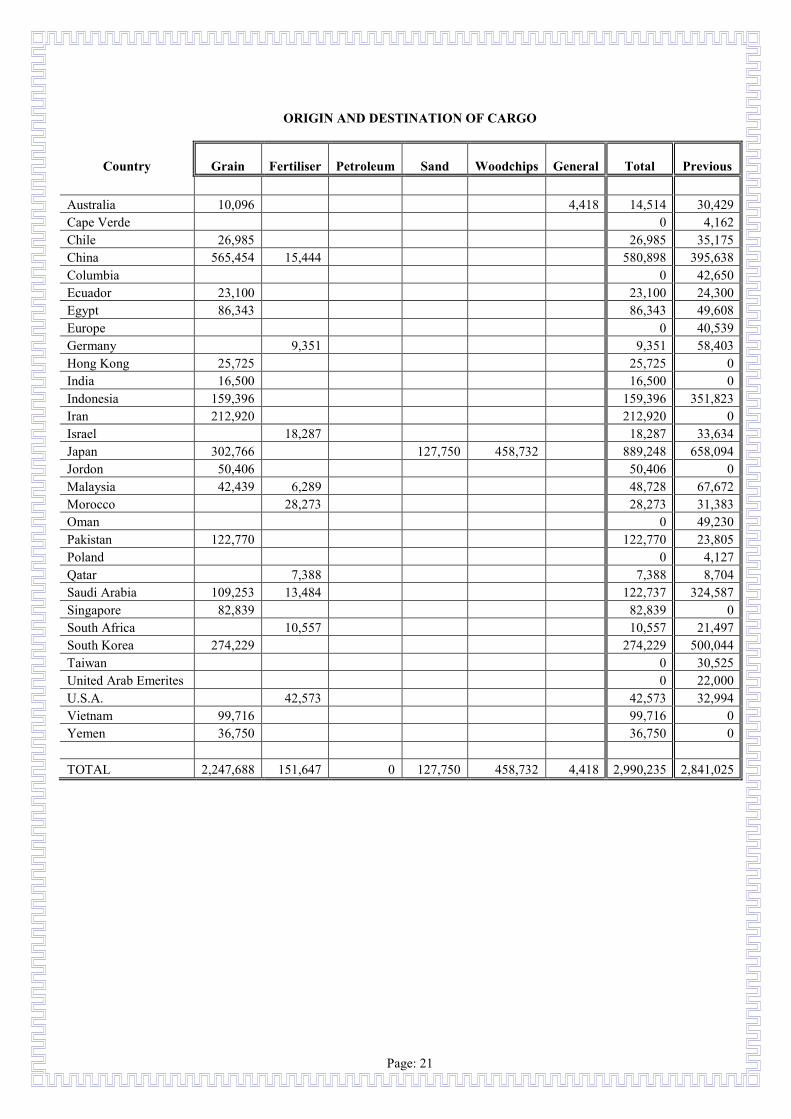
ORIGIN AND DESTINATION OF CARGO
Country Grain Fertiliser Petroleum Sand Woodchips General Total Previous
Australia 10,096 4,418 14,514 30,429 Cape Verde 0 4,162 Chile 26,985 26,985 35,175 China 565,454 15,444 580,898 395,638 Columbia 0 42,650 Ecuador 23,100 23,100 24,300 Egypt 86,343 86,343 49,608 Europe 0 40,539 Germany 9,351 9,351 58,403 Hong Kong 25,725 25,725 0India 16,500 16,500 0Indonesia 159,396 159,396 351,823 Iran 212,920 212,920 0Israel 18,287 18,287 33,634 Japan 302,766 127,750 458,732 889,248 658,094 Jordon 50,406 50,406 0Malaysia 42,439 6,289 48,728 67,672 Morocco 28,273 28,273 31,383 Oman 0 49,230 Pakistan 122,770 122,770 23,805 Poland 0 4,127 Qatar 7,388 7,388 8,704 Saudi Arabia 109,253 13,484 122,737 324,587 Singapore 82,839 82,839 0South Africa 10,557 10,557 21,497 South Korea 274,229 274,229 500,044 Taiwan 0 30,525 United Arab Emerites 0 22,000 U.S.A. 42,573 42,573 32,994 Vietnam 99,716 99,716 0Yemen 36,750 36,750 0
TOTAL 2,247,688 151,647 0 127,750 458,732 4,418 2,990,235 2,841,025

Page: 22
Albany Port Authority
Financial Report
1 July 2004 to 30 June 2005
Page: 23
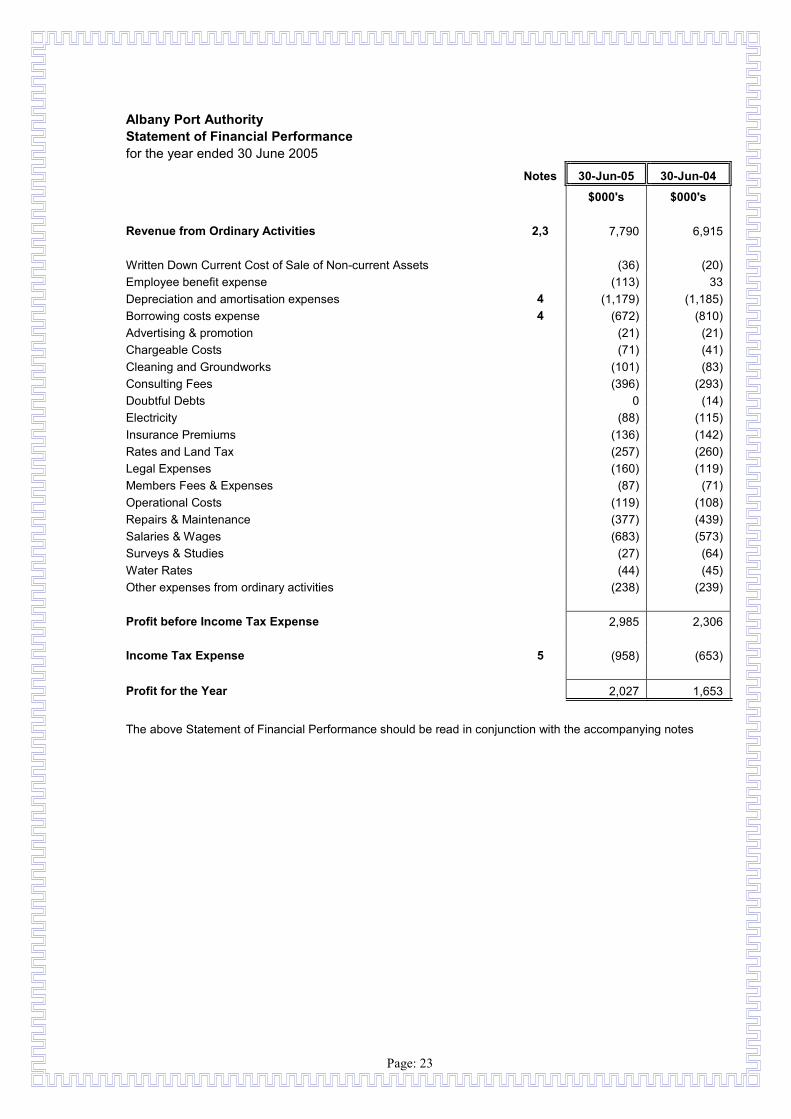
Albany Port Authority Statement of Financial Performance for the year ended 30 June 2005
Notes 30-Jun-05 30-Jun-04
$000's $000's
Revenue from Ordinary Activities 2,3 7,790 6,915
Written Down Current Cost of Sale of Non-current Assets (36) (20) Employee benefit expense (113) 33 Depreciation and amortisation expenses 4 (1,179) (1,185) Borrowing costs expense 4 (672) (810) Advertising & promotion (21) (21) Chargeable Costs (71) (41) Cleaning and Groundworks (101) (83) Consulting Fees (396) (293) Doubtful Debts 0 (14) Electricity (88) (115) Insurance Premiums (136) (142) Rates and Land Tax (257) (260) Legal Expenses (160) (119) Members Fees & Expenses (87) (71) Operational Costs (119) (108) Repairs & Maintenance (377) (439) Salaries & Wages (683) (573) Surveys & Studies (27) (64) Water Rates (44) (45) Other expenses from ordinary activities (238) (239)
Profit before Income Tax Expense 2,985 2,306
Income Tax Expense 5 (958) (653)
Profit for the Year 2,027 1,653
The above Statement of Financial Performance should be read in conjunction with the accompanying notes
Page: 24
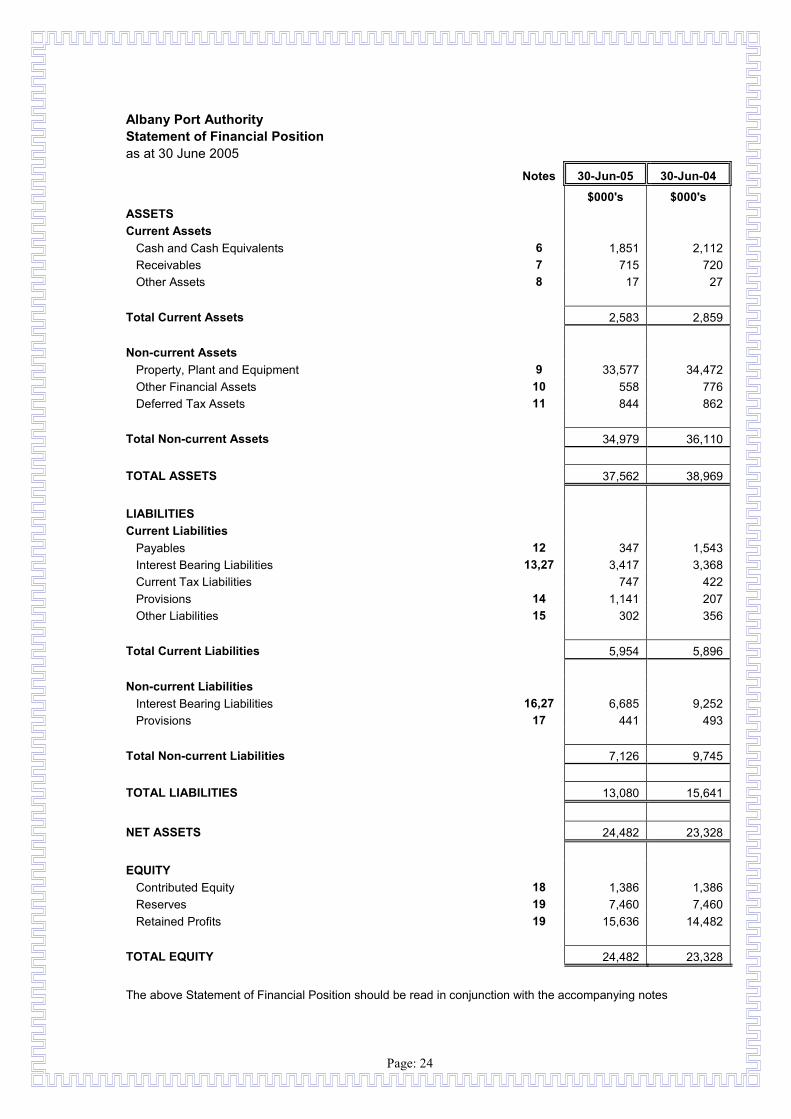
Albany Port Authority Statement of Financial Position as at 30 June 2005
Notes 30-Jun-05 30-Jun-04
$000's $000's ASSETS Current Assets
Cash and Cash Equivalents 6 1,851 2,112 Receivables 7 715 720 Other Assets 8 17 27
Total Current Assets 2,583 2,859
Non-current Assets Property, Plant and Equipment 9 33,577 34,472 Other Financial Assets 10 558 776 Deferred Tax Assets 11 844 862
Total Non-current Assets 34,979 36,110
TOTAL ASSETS 37,562 38,969
LIABILITIES Current Liabilities
Payables 12 347 1,543 Interest Bearing Liabilities 13,27 3,417 3,368 Current Tax Liabilities 747 422 Provisions 14 1,141 207 Other Liabilities 15 302 356
Total Current Liabilities 5,954 5,896
Non-current Liabilities Interest Bearing Liabilities 16,27 6,685 9,252 Provisions 17 441 493
Total Non-current Liabilities 7,126 9,745
TOTAL LIABILITIES 13,080 15,641
NET ASSETS 24,482 23,328
EQUITY Contributed Equity 18 1,386 1,386 Reserves 19 7,460 7,460 Retained Profits 19 15,636 14,482
TOTAL EQUITY 24,482 23,328
The above Statement of Financial Position should be read in conjunction with the accompanying notes
Page: 25
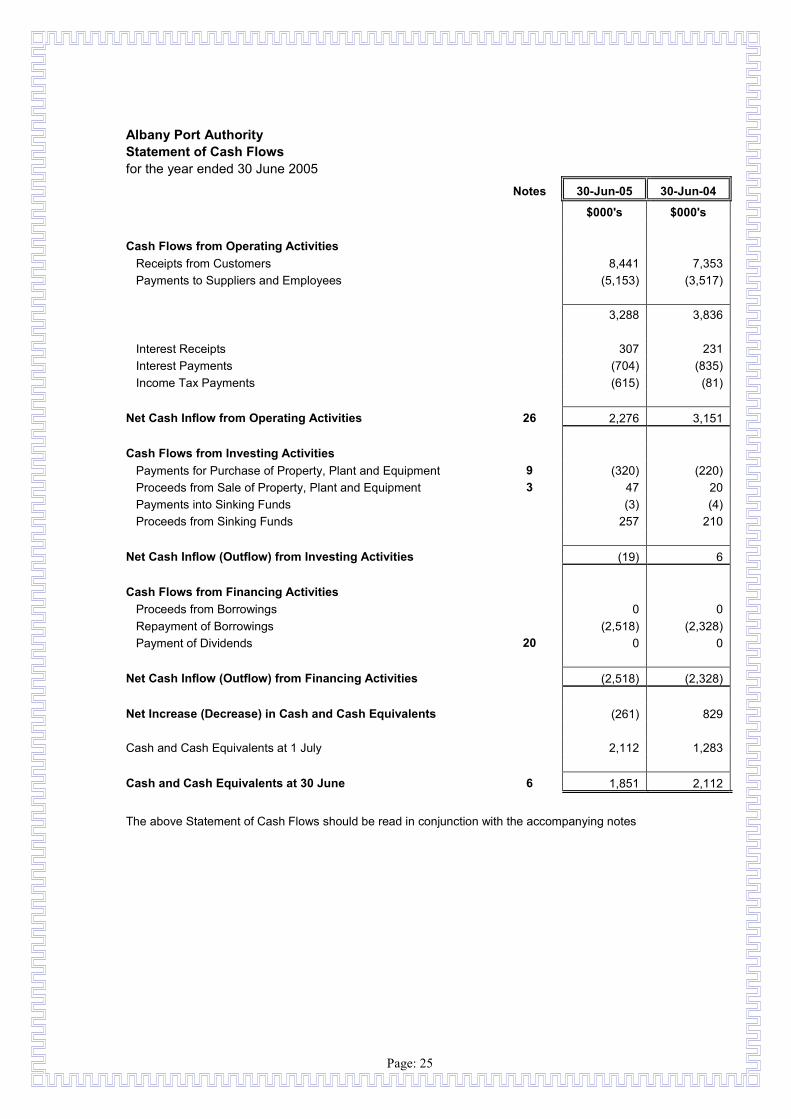
Albany Port Authority Statement of Cash Flows for the year ended 30 June 2005
Notes 30-Jun-05 30-Jun-04
$000's $000's
Cash Flows from Operating Activities Receipts from Customers 8,441 7,353 Payments to Suppliers and Employees (5,153) (3,517)
3,288 3,836
Interest Receipts 307 231 Interest Payments (704) (835) Income Tax Payments (615) (81)
Net Cash Inflow from Operating Activities 26 2,276 3,151
Cash Flows from Investing Activities Payments for Purchase of Property, Plant and Equipment 9 (320) (220) Proceeds from Sale of Property, Plant and Equipment 3 47 20 Payments into Sinking Funds (3) (4) Proceeds from Sinking Funds 257 210
Net Cash Inflow (Outflow) from Investing Activities (19) 6
Cash Flows from Financing Activities Proceeds from Borrowings 0 0Repayment of Borrowings (2,518) (2,328) Payment of Dividends 20 0 0
Net Cash Inflow (Outflow) from Financing Activities (2,518) (2,328)
Net Increase (Decrease) in Cash and Cash Equivalents (261) 829
Cash and Cash Equivalents at 1 July 2,112 1,283
Cash and Cash Equivalents at 30 June 6 1,851 2,112
The above Statement of Cash Flows should be read in conjunction with the accompanying notes

Page: 26
1. Summary of Significant Accounting Policies
This general purpose financial report has been prepared in accordance with Accounting Standards, other authoritative pronouncements of the Australian Accounting Standards Board, Urgent Issues Group Consensus Views and the Port Authorities Act 1999, which generally reflects the requirements of the Corporations Act 2001.
It is prepared in accordance with the historical cost convention, except for certain assets which, as noted, are at valuation.
Unless otherwise stated, the accounting policies adopted are consistent with those of the
previous year.
Comparative information is reclassified where appropriate to enhance comparability.
a) Income Tax
From 1 July 2001 the Authority was subject to taxation under the National Tax Equivalent Regime (“NTER”). Under the NTER the Authority is required to pay to the State Government the equivalent tax that would be paid to the Federal Government under Federal Taxation Legislation. Tax effect accounting procedures are followed whereby the income tax expense in the Statement of Financial Performance is based on the accounting profit after allowing for permanent differences. The future income tax benefit relating to tax losses is not carried forward as an asset unless the benefit is virtually certain of realisation. Income tax on cumulative timing differences is set aside to the deferred income tax or the future income tax benefit accounts at the rates which are expected to apply when those timing differences reverse. The amount of benefits brought to account or which may be realised in the future is based on the assumption that no adverse change will occur in income taxation legislation and the anticipation that the economic entity will derive sufficient future assessable income to enable the benefit to be realised and comply with the conditions of deductibility imposed by the law.
b) Acquisition of Assets
The prime cost method of accounting is used for all acquisitions of assets. Cost is determined as the fair value of the assets given up or liabilities undertaken at the date of acquisition, plus incidental costs directly attributable to the acquisition. Where settlement of any part of cash consideration is deferred, the amounts payable in the future are discounted to their present value as at the date of the acquisition. The discount rate used is the rate at which a similar borrowing could be obtained under comparable terms and conditions.
c) Revenue Recognition
Amounts disclosed as revenue are net of returns, trade allowances and duties and taxes paid.
Page: 27
Revenue is recognised for all business activities after the goods and services have been provided. Revenue from rentals is recognised when accrued.
(d) Receivables
All trade debtors are recognised at the amount receivable as they are due for settlement within 30 days.
Collectibility of trade debtors is reviewed on an ongoing basis. Debts that are known to be uncollectible are written off. A provision for doubtful debts is raised where some doubt as to collection exists and in any event when the debt is more than 60 days overdue.
(e) Recoverable Amount of Non-Current Assets
The recoverable amount of an asset is the net amount expected to be recovered through the net cash inflows and outflows arising from its use and subsequent disposal.
Where the carrying amount is greater than its recoverable amount, the asset is revalued to its recoverable amount.
Where net cash inflows are derived from a group of assets working together, the recoverable amount is determined on the basis of the relevant group of assets.
The expected net cash flows included in determining recoverable amounts of non-current assets are discounted to their present values using market-determined, risk-adjusted discount rate of 11.25% (2002 – 13.21%).
(f) Change in accounting policy for the measurement of Non-current Assets
Until 30 June 2000 non-current assets were revalued every three years. On applying AASB 1041, with effect from 1 July 2000, the Authority elected to revert to the cost basis for measuring all non-current assets. This option was chosen because it was considered the cost of complying with the alternative policy permitted by AASB 1041 of revaluing non-current assets with sufficient regularity to ensure that the carrying amount of each item does not materially differ from its fair value at the reporting date, would exceed the benefits that would be gained.
(g) Depreciation of Non-current Assets
Depreciation is calculated on a straight-line basis to write off the net cost or revalued amount of each item of property, plant and equipment (excluding land) over its expected useful life. Estimates of remaining useful lives are made on a regular basis for all assets, with annual reassessments for major items. The expected useful lives are as follows: Buildings, wharves and other infrastructure 20 - 50 years Dredging 40 - 100 years Breakwaters 40 - 50 years Plant and equipment 3 - 10 years Major spares purchased specifically for particular plant are capitalised and depreciated on the same basis as the plant to which they relate.

Page: 28
(h) Non-current assets constructed by the Authority
The cost of non-current assets constructed by the Authority includes the cost of all materials used in construction, direct labour, borrowing costs incurred during construction of qualifying assets and an appropriate proportion of variable and fixed overhead. Borrowing costs included in the cost of qualifying assets are costs that would have been avoided if the expenditure on the construction of the assets had not been made. Borrowing costs incurred while active construction is interrupted for extended periods are recognised as expenses.
(i) Trade and Other Creditors
These amounts represent liabilities for goods and services provided prior to the end of the financial year and which are unpaid. The amounts are unsecured and are usually paid within 30 days of recognition.
(j) Interest bearing liabilities
Loans are carried at their principal amounts, which represent the present value of future cash flows associated with servicing the debt. Interest is accrued over the period it becomes due and is recorded as part of accrued expenses.
(k) Maintenance and Repairs
Plant and equipment is required to be overhauled on a regular basis. This is managed as part of an ongoing major cyclical maintenance program. The costs of this maintenance are charged as expenses as incurred, except where they relate to the replacement of a component of an asset, in which case the costs are capitalised and depreciated. Other routine operating maintenance, repair costs and minor renewals are also charged as expenses as incurred.
(l) Employee Benefits
(i) Wages and Salaries, Annual and Sick Leave
Liability for wages and salaries, annual leave, sick leave and accumulated days off are measured at the nominal rates of pay paid or payable.
(ii) Long Service Leave
Liability for long service leave expected to be settled within 12 months of the reporting date is measured at the nominal rates of pay paid or payable. Liability for long service leave expected to settled beyond 12 months is measured as the net present value of expected future payments to be made in respect of services provided by employees up to the reporting date. Consideration is given to expected future wage and salary levels, experience of employee departures and periods of service.

Page: 29
Expected future payments are discounted using interest rates on national government guaranteed securities with terms of maturity that match, as closely as possible, the estimated future cash flows.
(iii) Superannuation
Staff may contribute to the Superannuation and Family Benefits Act Scheme, a defined befits pension scheme, now closed to new members, or to the Gold State Superannuation Scheme, a defined lump sum scheme, now also closed to new members. All staff who do not contribute to either of these schemes become non-contributory members of the West State Superannuation Scheme or any other fund of their choosing. The Authority contributes to these accumulation funds in compliance with the Commonwealth Government’s Superannuation Guarantee (Administration) Act 1992. The liability for superannuation charges incurred under the Superannuation and Family Benefits Act pension scheme, together with the pre-transfer service liability for employees who transferred to the Gold State Superannuation Scheme, are provided for up to the reporting date. The liabilities for superannuation charges under the Gold State Superannuation Scheme and West State Superannuation Scheme and other funds, of the employees choosing, are extinguished by the fortnightly payment of employer contributions to the respective funds. Employer contributions are made to state superannuation funds (GESB) and other funds, of the employees choosing, which exist to provide benefits for employees and their dependents on retirement, disability or death. The note disclosure required by paragraph 6.10 of AASB1028 (being the employer’s share of the difference between employee’s accrued superannuation benefits and the attributable net market value of plan assets) has not been provided. State scheme deficiencies are recognised by the State on its whole of government reporting. The Government Employees Superannuation Board’s records are not structured to provide the information for the Authority. Accordingly, deriving the information for the Authority is impractical under current arrangements, and thus any benefits thereof would be exceeded by the cost of obtaining the information. Employee Benefit On-costs Employee benefit on-costs, including payroll tax, superannuation and workers compensation are recognised and included in employee benefit liabilities and costs when the employee benefits to which they relate are recognised as liabilities and expenses.
(m) Borrowing Costs
Borrowing costs are recognised as expenses in the period in which they are incurred, except where they are included in the costs of qualifying assets. The capitalisation rate used to determine the amount of borrowing costs to be capitalised is the weighted average interest rate applicable to the Authority’s outstanding borrowings during the year, in this case 5.53% (5.49% last year).
Borrowing costs include interest on short-term and long-term borrowings.

Page: 30
(n) Cash
For the purpose of the statement of cash flows, cash includes cash on hand, cash at bank and term deposits.
(o) International Financial Reporting Standards (IFRS)
The Australian Accounting Standards Board (AASB) is adopting IFRS for application to reporting periods beginning on or after 1 January 2005. The AASB will issue Australian equivalents to IFRS and the Urgent Issues Group (UIG) will issue abstracts corresponding to IASB interpretations originated by the International Financial Reporting Interpretations Committee or the former Standards Interpretations Committee (SIC). The adoption of Australian equivalents to IFRS will be first reflected in the financial statements for the half-year ending 31 December 2005 and the year ending 30 June 2006.
Entities complying with Australian equivalents IFRS for the first time will be required to restate their comparative financial statements to amounts reflecting the application of IFRS to that comparative period. Most adjustments required on transition to IFRS will be made retrospectively against opening retained earnings as at 1 July 2004.
The Authority has established a process to manage the transition to Australian equivalents IFRS, including training of staff and system and internal control changes necessary to gather all required financial information. The process is overseen by the Finance Manager, who reports to the Chief Executive Officer and the Board regularly. A timetable for managing the transition has been prepared and is currently on schedule.
The major changes identified to date to existing accounting policies include the following:
(i) Income Taxes
Under the Australian equivalent to IAS 112 Income Taxes, deferred tax balances are determined using the balance sheet method which calculates temporary differences based on the carrying amounts of assets and liabilities in the statement of financial position and their associated tax bases. In addition, current and deferred taxes attributable to amounts recognised directly in equity are also recognised directly in equity. This will result in a change to the current accounting policy under which deferred tax balances are determined using the income statement method, items are only tax-affected if they are included in the determination of pre-tax accounting profit or loss and/or taxable income or loss and current and deferred taxes cannot be recognised directly in equity
(ii) Employee Benefits
In accordance with Summary of Significant Accounting Policies – Note 1 (l), the Authority contributes to a defined benefit pension scheme administered by the Government Employees Superannuation Board (GESB). The superannuation liability has been established from an actuarial assessment of the expected future payments for current employees and other beneficiaries that will be met by the Authority.

Page: 31
Under Australian equivalent to AASB 119 Employee Benefits, the Authority will be required to recognise actuarial gains and losses relating to this plan as they arise and to recognise an asset or liability in respect of this plan. As detailed in Note 1 (l), the GESB is currently not structured to provide this information to the Authority. Accordingly, the Authority may not be able to drive this information in the future.
(p) Rounding of Amounts
Amounts in the financials report have been rounded off to the nearest thousand dollars.
(q) Dividends
Provision is made for the amount of any dividend declared or determined on or before the end of the financial year, but not distributed at reporting date.
(r) Investments
Investments are brought to account at the lower of cost and recoverable amount.
2005 2004 $000's $000's 2. Revenue from Ordinary Activities
Revenue from Operating Activities
Shipping Services 2,301 2,106 Cargo Services 4,284 3,781 Other Services 206 199
6,791 6,086
Revenue from Outside Operating Activities
Rentals 643 532 Interest 298 277 Proceeds from Sale of Non-current Assets 47 20
7,779 6,915
3. Profit/(Loss) from Ordinary Activities
Net Gain on Disposal of Property, Plant and Equipment
Profit from ordinary activities before income tax expense includes the following specific net gains
Plant and Equipment Revenue 47 20 Less: Written Down Cost (36) (20)
Net Gain on Disposal 11 0

Page: 32
2005 2004
$000's $000's4. Expenses
Profit from ordinary activities before income tax expense includes the following specific expenses
Depreciation
Buildings 86 88 Wharves and Other Infrastructure 399 428 Dredging 428 428 Breakwaters 140 140 Plant and Equipment 126 101
Total Depreciation 1,179 1,185
Borrowing Costs
Interest and Finance Charges 672 810 Less : Amount Capitalised 0 0
Borrowing Costs Expensed 672 810
2005 2004 $000's $000's 5. Income Tax Expense
The aggregate amount of income tax attributable to the financial year differs from the amount calculated on the profit/(loss) from ordinary activities
The differences are reconciled as follows:
Profit/(Loss) from Ordinary Activities 2,985 2,306
Income tax calculated @ 30% 881 692 Non-deductible Items
Consultants Fees 20 2Legal Fees 44 30 Sundry Items 0 1
945 725 Under (Over) provision in prior years 13 (72)
Income tax expense (benefit) 958 653
Income tax expense (benefit) comprises: Current Tax Provision 940 231
Future Income Tax Benefit 18 422 958 653

Page: 33
2005 2004 $000's $000's
6. Current Assets - Cash and Cash Equivalents
Cash at Bank and on hand 1,828 1,899 Short Term Deposit 0 200 Term Deposits 23 13
1,851 2,112 Cash at Bank Interest was earnt at variable rates of between 4.75% and 5.00%
(2004 4.25% and 4.75%)
Short Term Deposit Interest was earnt at variable rates of between 5.268% and 5.285%
(2004 4.741% and 5.312%)
Term Deposits The deposits (one & two year periods) are bearing fixed interest rates
of between 1.75% and 5.25% (2004 1.75%) 7. Current Assets - Receivables
Trade Debtors 741 745 Other Debtors 34 40
775 785 Less: Provision for doubtful debts (60) (65)
715 720
Other Debtors These amounts generally arise from transactions outside the usual
operating activities
2005 2004 $000's $000's 8. Current Assets - Other
Prepaid Expenditure 15 15 Accrued Revenue 2 12
17 27

Page: 34
9. Non-current Assets - Property, Plant & Equipment
Freehold land
At Cost 1,517 1,517
Vested land At Cost 1,449 1,449
Buildings At Cost 4,174 4,139
At Recoverable Amount 218 218 Less Accumulated Depreciation (3,373) (3,286)
1,019 1,071
Wharves and other infrastructure At Cost 19,578 19,604
At Recoverable Amount 1,319 1,319 Less Accumulated Depreciation (13,949) (13,619)
6,948 7,304
Dredging At Cost 21,032 21,032
Accumulated Depreciation (3,678) (3,250)17,354 17,782
2005 2004 $000's $000's Breakwaters At Cost 5,689 5,689
Less Accumulated Depreciation (977) (838)4,712 4,851
Plant and equipment At Cost 2,917 2,792
Less Accumulated Depreciation (2,378) (2,303)539 489
Work in Progress At Cost 39 9
Total at Cost 56,395 56,231 Total at Recoverable Amount 1,537 1,537
Total Accumulated Depreciation (24,355) (23,296) Total Property Plant and Equipment 33,577 34,472
Reconciliation of the carrying amounts of property plant and equipment at the beginning and end of the current and previous financial year are set out below

Page: 35
2005 2004
$000's $000's Freehold Land
Carrying amount at start of year 1,517 1,517 Additions 0 0Transfers 0 0Disposals 0 0Depreciation 0 0Carrying amount at end of year 1,517 1,517 Vested Land
Carrying amount at start of year 1,449 1,449 Additions 0 0Transfers 0 0Disposals 0 0Depreciation 0 0Carrying amount at end of year 1,449 1,449
Buildings
Carrying amount at start of year 860 940 Additions 35 0Transfer 0 0Disposals 0 0Depreciation (78) (80)
Carrying amount at end of year 817 860
Buildings (Recoverable Amount)
Carrying amount at start of year 210 218 Additions 0 0Transfer 0 0Disposals 0 0Depreciation (8) (8)
Carrying amount at end of year 202 210
Wharves and Other Infrastructure
Carrying amount at start of year 6,028 6,360 Additions 43 53 Transfer 0 0Disposals 0 0Depreciation (355) (385)Carrying amount at end of year 5,716 6,028
Page: 36
2005 2004
$000's $000's
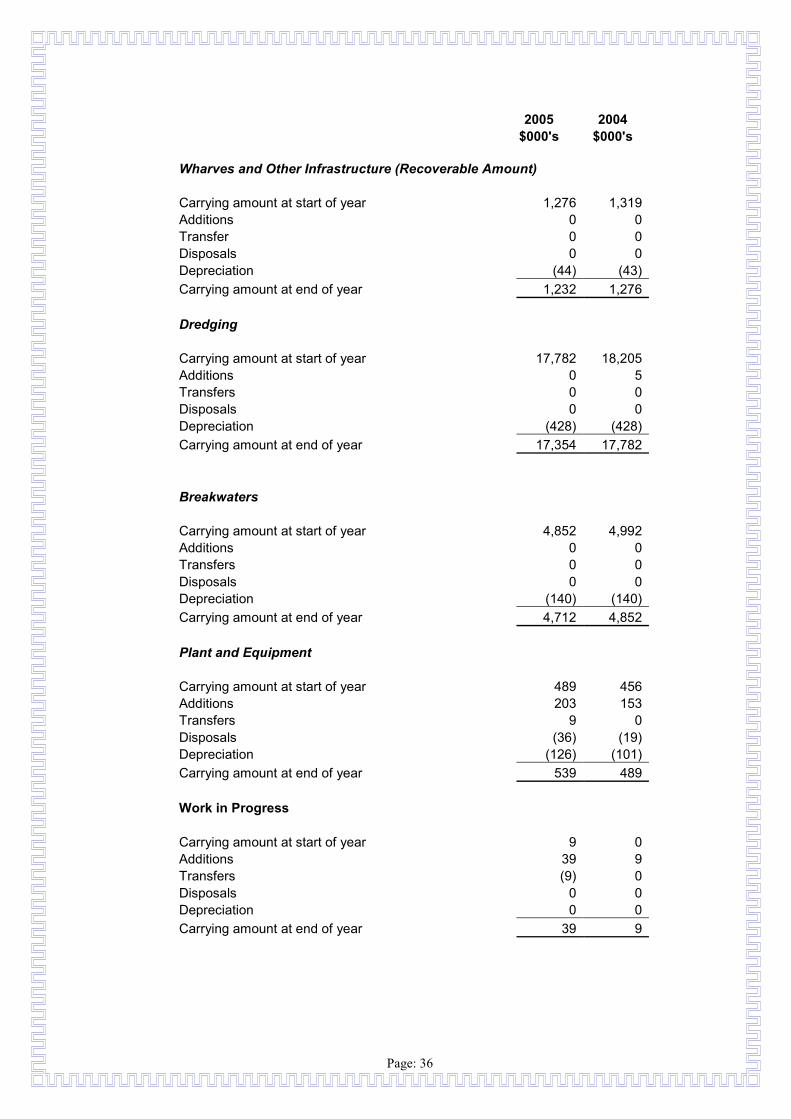
Wharves and Other Infrastructure (Recoverable Amount)
Carrying amount at start of year 1,276 1,319 Additions 0 0Transfer 0 0Disposals 0 0Depreciation (44) (43)
Carrying amount at end of year 1,232 1,276
Dredging
Carrying amount at start of year 17,782 18,205 Additions 0 5Transfers 0 0Disposals 0 0Depreciation (428) (428)Carrying amount at end of year 17,354 17,782
Breakwaters
Carrying amount at start of year 4,852 4,992 Additions 0 0Transfers 0 0Disposals 0 0Depreciation (140) (140)Carrying amount at end of year 4,712 4,852
Plant and Equipment
Carrying amount at start of year 489 456 Additions 203 153 Transfers 9 0Disposals (36) (19)
Depreciation (126) (101)Carrying amount at end of year 539 489
Work in Progress
Carrying amount at start of year 9 0Additions 39 9Transfers (9) 0Disposals 0 0Depreciation 0 0Carrying amount at end of year 39 9

Page: 37
2005 2004
$000's $000's
Total Property, Plant and Equipment
Carrying amount at start of year 34,472 35,456 Additions 320 220 Transfers 0 0Disposals (36) (19)
Depreciation (1,179) (1,185)Carrying amount at end of year 33,577 34,472
Recoverable Amount The basis of valuations is the Optimised Depreciated Replacement Cost
The 2003 revaluations were based on the independent assessments of Fudali Waterhouse PRP of Adelaide who are Certified Practicing Valuers
Land Holdings The carrying value of vested land is $1.449M compared with $6.789M shown
in the Government Property Register (2003) The carrying value of freehold land is $1.517M compared with $1.945M shown
in the Government Property Register (2003) 10. Non-current Assets - Other Financial Assets
Sinking Funds 558 776
Sinking funds, for the eventual repayment of loan funds, are invested at floating interest rates with Treasury. Interest rates received ranged between 5.246% and 5.447% (2004 - 4.741% and 5.312%)
Interest revenue is recognised on an accrual basis 11. Non-current Assets - Deferred Tax Assets
Future Income Tax Benefits Timing Differences 844 862
12. Current Liabilities - Payables
Trade creditors 347 383 Other creditors 0 1,160
347 1,543
Other Creditors These amounts generally arise from transactions outside the usual
operating activities

Page: 38
2005 2004
$000's $000's 13. Current Liabilities - Interest Bearing Liabilities
Government loan No1 67 68 Government loan No2 3,350 3,300
3,417 3,368
Government loan No1 Loan No1 is repayable on fixed dates and bear interest (fixed)
at between 8.92% and 14.09% (2004 - 14.09%)
Government loan No2 Loan No2 is repayable on fixed dates and bear interest (fixed)
at between 5.50% and 5.57% (2004 5.33% and 5.46%)
Fair value disclosures Details of the fair value of interest bearing liabilities are set out in note 28
Effective interest rates and credit risk
Information concerning the effective interest rate of interest bearing liabilities are set out in note 28 14. Current Liabilities - Provisions
Employee Benefits 315 207 Dividends 826 0
1,141 207
15. Current Liabilities - Other Liabilities
Accrued Expenditure 258 267 Income Received in Advance 44 89
302 356
16. Non-current Liabilities - Interest Bearing Liabilities
Loans - Inscribed stocks 600 850 Government loan No1 0 67 Government loan No2 6,085 8,335
6,685 9,252
Inscribed stocks Inscribed stocks are repayable on fixed dates and
bear interest (fixed) at between 6.40% and 7.40% (2004 5.875% and 7.40%)
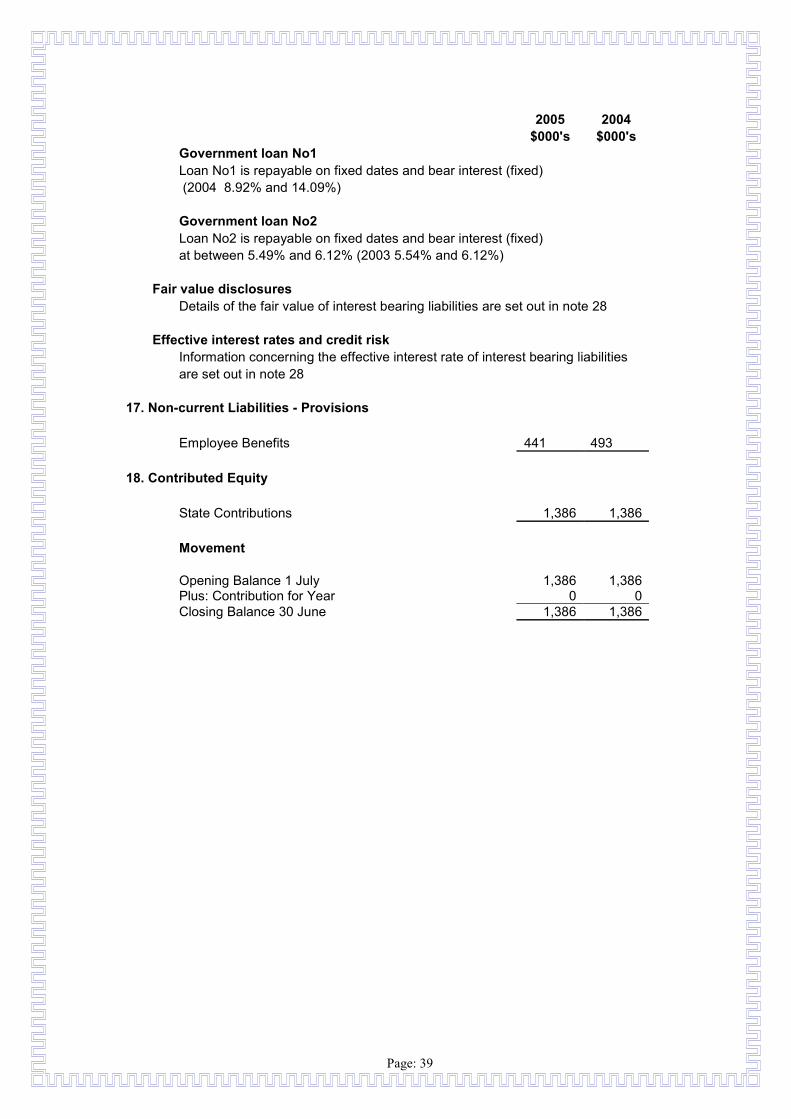
Page: 39
2005 2004
$000's $000's Government loan No1
Loan No1 is repayable on fixed dates and bear interest (fixed) (2004 8.92% and 14.09%)
Government loan No2 Loan No2 is repayable on fixed dates and bear interest (fixed)
at between 5.49% and 6.12% (2003 5.54% and 6.12%)
Fair value disclosures Details of the fair value of interest bearing liabilities are set out in note 28
Effective interest rates and credit risk
Information concerning the effective interest rate of interest bearing liabilities are set out in note 28 17. Non-current Liabilities - Provisions
Employee Benefits 441 493 18. Contributed Equity
State Contributions 1,386 1,386
Movement
Opening Balance 1 July 1,386 1,386 Plus: Contribution for Year 0 0Closing Balance 30 June 1,386 1,386

Page: 40
2005 2004
$000's $000's 19. Reserves and Retained Profits
Reserves
Asset Revaluation Reserve 7,460 7,460
Movement
Opening Balance 1 July 7,460 7,460 Less : Transfers 0 0Closing Balance 30 June 7,460 7,460
The asset revaluation reserve is used to record increments and decrements on revaluation of non-current assets (see note 1(f)
Retained Profits
Retained profits 15,636 14,482
Movement
Opening Balance 1 July 14,482 12,829 Net Profit for Year 1,980 1,653
16,462 14,482 Less : Dividends (826) 0
Closing Balance 30 June 15,636 14,482
20. Dividends
Dividends 826 0
Movement
Opening Balance 1 July 0 0Provision 826 0
826 0Less : Paid 0 0
Closing Balance 30 June 826 0
21. Remuneration of Auditors
Remuneration for audit of the financial reports 21 16

Page: 41
2005 2004
$000's $000's 22. Contingencies
Contingent Liabilities
Superannuation Liability
The following amount represents the superannuation liability for an ex-Department of Marine and Harbours employee who transferred over to the Authority in 1992/93. At the time of the transfer the Department agreed to meet the previous liability and so this amount is not provided in the Authority's superannuation liability calculations.
Maximum contingent consideration in respect to this claim. 193 180
23. Commitments
The Authority does not have any further commitments. 24. Related Party Transactions
No transactions occurred between the Authority and related parties. 25. Events Occurring after Balance Sheet Date
There were no events occurring after the reporting date. 26. Reconciliation of profit after income tax to net cash flow from
Operating Activities
Profit for the Year 2,027 1,653 Depreciation and Amortisation 1,179 1,185 Interest on Other Financial Assets (36) (43)
Net (Gain)/Loss on Sale of Assets (11) 0Changes in Assets and Liabilities :-
(Increase)/Decrease in Receivables 5 7(Increase)/Decrease in Deferred Tax Assets 18 231 (Increase)/Decrease in Other Assets 10 (6)
Increase/(Decrease) in Payables (1,196) (371)Increase/(Decrease) in Deferred Tax Liabilities 325 422 Increase/(Decrease) in Provisions 56 (55)
Increase/( Decrease) in Other Liabilities (54) 128
Net Cash Inflows from Operating Activities 2,323 3,151

Page: 42
27. Interest Bearing Liabilities
Interest Rate Risk
The Authority's exposure to interest rate risk and the effective weighted average interest rate by maturity periods is set out in the following table.
For interest rates applicable to each class of asset or liability, refer to individual notes to the financial statements
Floating Fixed Interest Maturing
Interest 1 Year Over 1 Over Non-
interest
Notes Rate or Less to 5
Years 5
Years Bearing Total $'000 $'000 $'000 $'000 $'000 $'000
2005
Financial assets
Cash Assets 6 1,828 16 7 1,851 Receivables 7 715 715 Other Financial Assets 10 558 558
Total Financial assets 2,386 16 7 0 715 3,124Weighted average interest rate 5.10% 3.87% 1.75%
Financial liabilities
Payables 12 347 347 Interest Bearing Liabilities 13,16 3,417 6,085 600 10,102
Total financial liabilities 0 3,417 6,085 600 347 10,449 Weighted average interest rate 5.66% 5.71% 6.73%
Net Financial Assets/(Liabilities) 2,386 (3,401) (6,078) (600) 368 (7,325)

Page: 43
Floating Fixed Interest Maturing
Interest 1 Year Over 1 Over Non-
interest
Notes Rate or Less to 5
Years 5
Years Bearing Total $'000 $'000 $'000 $'000 $'000 $'000
2004
Financial assets
Cash Assets 6 2,099 4 9 2,112 Receivables 7 720 720 Other Financial Assets 10 776 776
Total Financial assets 2,875 4 9 0 720 3,608Weighted average interest rate 4.90% 1.75% 1.75%
Financial liabilities
Payables 12 1,544 1,544 Interest Bearing Liabilities 13,16 3,368 7,802 1,450 12,620
Total financial liabilities 0 3,368 7,802 1,450 1,544 14,164 Weighted average interest rate 5.62% 5.75% 6.09%
Net Financial Assets/(Liabilities) 2,875 (3,364) (7,793) (1,450) (824) (10,556)
Net Fair Value of Financial Assets and Liabilities
The net fair value of cash and cash equivalents and non-interest bearing monetary financial assets and
liabilities approximates their carrying amounts
The net fair value of other monetary financial assets and financial liabilities is based upon market prices
where a market exists or by discounting the expected future cash flows by the current interest rates for
assets and liabilities with similar profiles.
Net fair value is exclusive of costs which would be incurred on realisation of an asset and inclusive of
costs which would be incurred on settlement of a liability
The carrying amounts and net fair values of financial assets and liabilities at reporting date were:
Page: 44
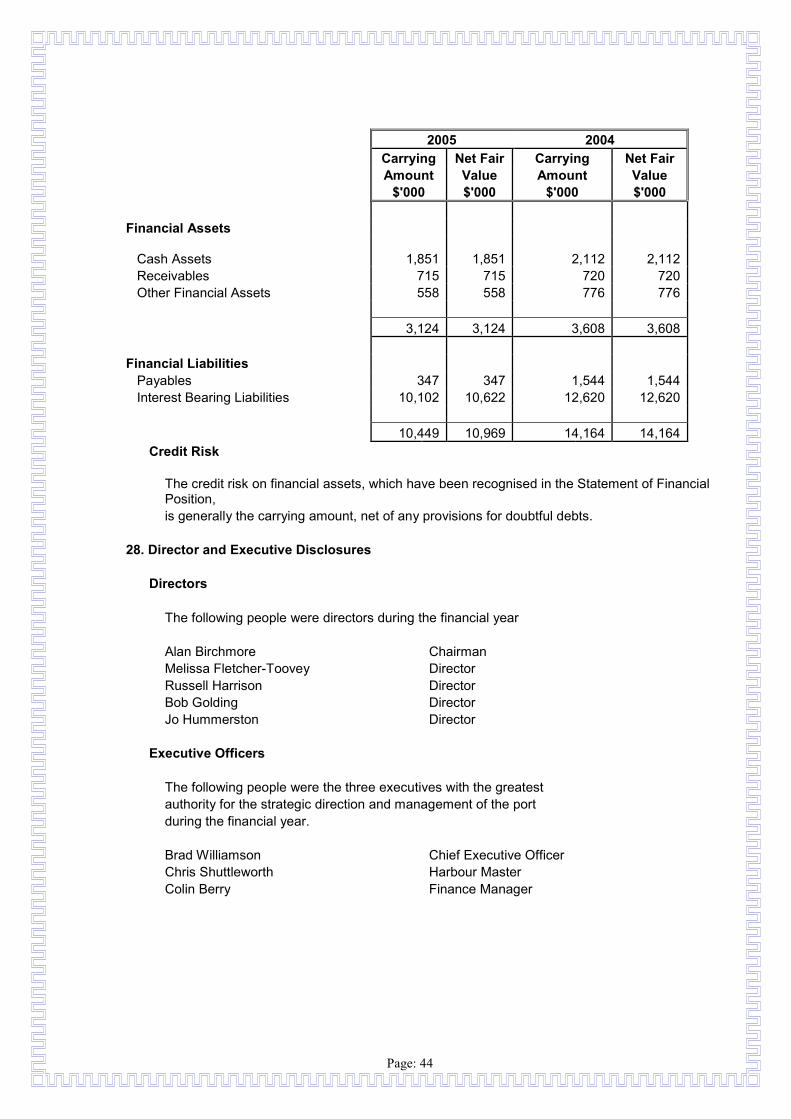
2005 2004 Carrying Net Fair Carrying Net Fair Amount Value Amount Value
$'000 $'000 $'000 $'000
Financial Assets
Cash Assets 1,851 1,851 2,112 2,112 Receivables 715 715 720 720 Other Financial Assets 558 558 776 776
3,124 3,124 3,608 3,608
Financial Liabilities Payables 347 347 1,544 1,544 Interest Bearing Liabilities 10,102 10,622 12,620 12,620
10,449 10,969 14,164 14,164 Credit Risk
The credit risk on financial assets, which have been recognised in the Statement of Financial Position,
is generally the carrying amount, net of any provisions for doubtful debts. 28. Director and Executive Disclosures
Directors
The following people were directors during the financial year
Alan Birchmore Chairman Melissa Fletcher-Toovey Director Russell Harrison Director Bob Golding Director Jo Hummerston Director
Executive Officers
The following people were the three executives with the greatest authority for the strategic direction and management of the port during the financial year.
Brad Williamson Chief Executive Officer Chris Shuttleworth Harbour Master Colin Berry Finance Manager

Page: 45
Remuneration of Directors and Executives
In accordance with Section 10 of the Port Authorities Act 1999, the Minister determines the remuneration and allowances payables to directors.
The Board determines staff remuneration policies and practices.
The Chief Executive Officers remuneration and terms of employment are reviewed annually, having regard to performance against goals set at the start of the year, relevant comparative information and independent expert advice. As well as a base salary, the remuneration package includes superannuation and fringe benefits.
Details of Remuneration
Members' Other This Year
Directors Base Fee Super-
annuation Benefits Total $ $ $ $
2005
Alan Birchmore Chairman 22,000 1,980 600 24,580Melissa Fletcher-Toovey Director 11,000 990 11,990Russell Harrison Director 11,000 990 11,990Bob Golding Director 11,000 990 11,990Jo Hummerston Director 11,000 990 11,990
Total 66,000 5,940 600 72,540
2004
Alan Birchmore Chairman 13,500 1,215 800 15,515(from 01/10/03 to 30/06/04) Melissa Fletcher-Toovey Director 8,100 729 8,829Russell Harrison Director 8,100 729 8,829Bob Golding Director 8,100 729 8,829J Hummerson Director 6,750 608 7,358(from 01/10/03 to 30/06/04) Terry Enright Chairman 2,700 243 100 3,043(from 01/07/03 to 30/09/03) Owen Ubergang Director 1,350 122 1,472(from 01/07/03 to 30/09/03)
Total 48,600 4,375 900 53,875

Page: 46
Officers' Motor This Year
Executive Officers Base Fee Vehicle Super-
annuation Total $ $ $ $
2005
Brad Williamson Chief Executive Officer 122,215 12,689 10,999 145,903
Chris Shuttleworth Harbour Master 109,616 7,339 12,219 129,174Colin Berry Finance Manager 83,761 3,220 9,194 96,175
Total 315,592 23,248 32,412 371,252
2004
Brad Williamson Chief Executive Officer 109,506 12,094 9,841 131,441
Chris Shuttleworth Harbour Master 104,013 7,132 11,962 123,107Colin Berry Finance Manager 82,243 2,865 9,025 94,133
Total 295,762 22,091 30,828 348,681

Page: 47
29. The impact of Adopting Australian Equivalents to IFRS
Australia is adopting Australian equivalents to International Financial Reporting Standards (AIFRS) for reporting periods beginning on or after 1 January 2005. The Albany Port Authority will adopt these Standards for the first time for the year ended 30 June 2006.
AASB 1047 'Disclosing the Impacts of Adopting Australian Equivalents to International Financial Reporting Standards' requires disclosure of any known or reliably estimable information about the impacts on the financial statements had they been prepared using AIFRSs.
Set out below are the key areas where accounting policies are expected to change on adoption of AIFRS and our best estimate of the quantitative impact of the changes on total equity as at the date of transition and 30 June 2005 and on net profit for the year ended 30 June 2005.
(a) Reconciliation of total equity as presented under previous AGAAP to that under AIFRS:
30 June 1 July 2005 2004 $000 $000
Total equity under previous AGAAP 24,482 23,328Adjustments to accumulated surplus/(deficiency): Increase in deferred tax assets (i) 1,772 1,790Increase in provisions – Dividends (ii) 826 0Total equity under AIFRS 27,080 25,118
(i) Taxation – Deferred tax assets To comply with AASB 112 Income Taxes, the Authority will be required to use the balance sheet liability method, rather than the income statement method currently adopted under AGAAP. The balance sheet liability method recognises tax balances when there is a difference between the carrying value of an asset or liability and its corresponding tax base.
The increase in tax assets represents the balance reversed against equity as all timing differences no longer apply.
(ii) Provision for Dividends
AASB 110 Events after The Balance Sheet Date, provide that a dividend liability is not to be recognised if the dividends are declared after the reporting date. “Declared” is considered to mean that the dividends are appropriately authorised and no longer at the discretion of the entity. Undeclared dividends do not meet the criteria of a present obligation. Under Section 84 (2) of the Port Authorities Act 1999, the Board recommends a dividend to the Minister after reporting date and the dividend is subject to the Minister’s subsequent approval.
(iii) Financial Instruments
Management has decided to apply the exemption provided in AASB 1 First Time Adoption of Australian Equivalents to International Financial Reporting Standard which permits entities not to apply the requirements of AASB 132 Financial Instruments: Presentation and Disclosures and AASB 139 Financial Instruments: Recognition and Measurement for the financial year ended 30 June 2005. The standards will be applied from 1 July 2005.
Page: 48
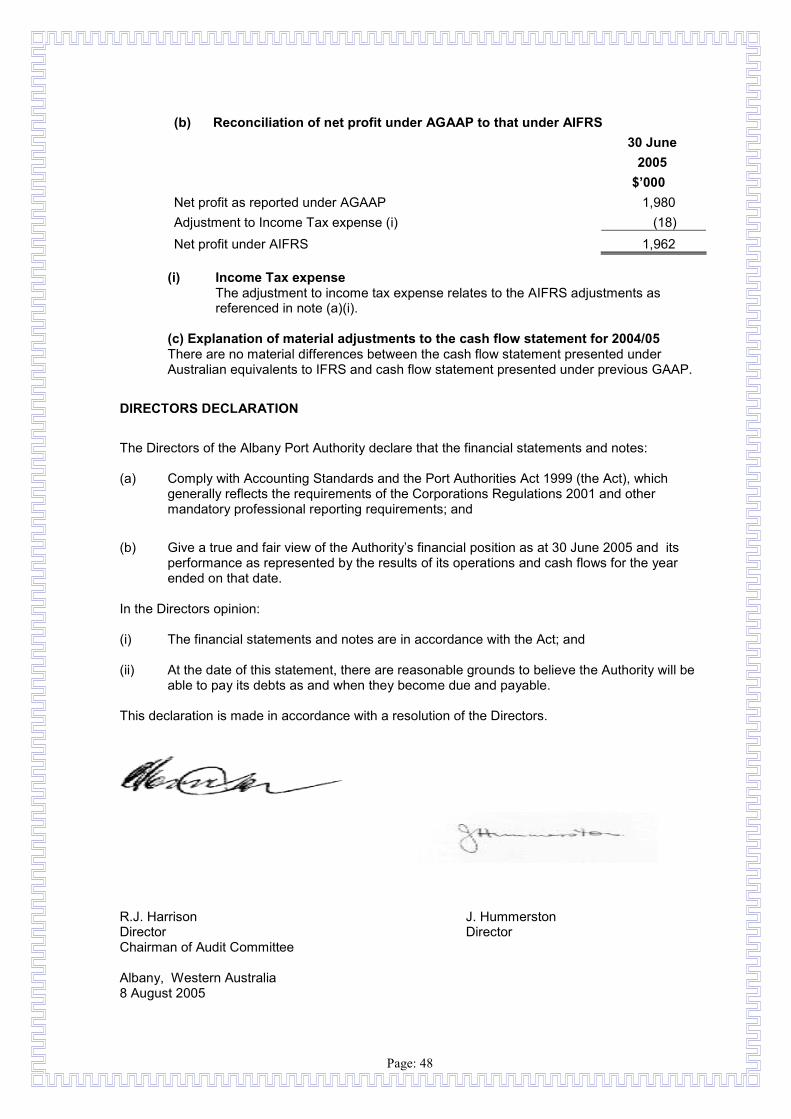
(b) Reconciliation of net profit under AGAAP to that under AIFRS
30 June 2005
$’000 Net profit as reported under AGAAP 1,980Adjustment to Income Tax expense (i) (18) Net profit under AIFRS 1,962
(i) Income Tax expense The adjustment to income tax expense relates to the AIFRS adjustments as referenced in note (a)(i).
(c) Explanation of material adjustments to the cash flow statement for 2004/05 There are no material differences between the cash flow statement presented under Australian equivalents to IFRS and cash flow statement presented under previous GAAP.
DIRECTORS DECLARATION
The Directors of the Albany Port Authority declare that the financial statements and notes: (a) Comply with Accounting Standards and the Port Authorities Act 1999 (the Act), which
generally reflects the requirements of the Corporations Regulations 2001 and other mandatory professional reporting requirements; and
(b) Give a true and fair view of the Authority’s financial position as at 30 June 2005 and its performance as represented by the results of its operations and cash flows for the year ended on that date.
In the Directors opinion: (i) The financial statements and notes are in accordance with the Act; and (ii) At the date of this statement, there are reasonable grounds to believe the Authority will be
able to pay its debts as and when they become due and payable. This declaration is made in accordance with a resolution of the Directors.
R.J. Harrison J. Hummerston Director Director Chairman of Audit Committee Albany, Western Australia 8 August 2005

AUDITOR GENERAL
4th Floor Dumas House 2 Havelock Street West Perth 6005 Western Australia Tel: 08 9222 7500 Fax: 08 9322 5664
INDEPENDENT AUDIT REPORT ON ALBANY PORT AUTHORITY To the Parliament of Western Australia Audit Opinion In my opinion, the financial report of the Albany Port Authority is in accordance with: (a) schedule 5 of the Port Authorities Act 1999, including: (i) giving a true and fair view of the Authority’s financial position at
30 June 2005 and of its performance for the financial year ended on that date; and
(ii) complying with Accounting Standards in Australia; and (b) other mandatory professional reporting requirements in Australia. Scope The Board’s Role The Board of Directors is responsible for the financial report. The financial report consists of the Statement of Financial Performance, Statement of Financial Position, Statement of Cash Flows, accompanying Notes and Directors’ Declaration. Summary of my Role As required by the Port Authorities Act 1999, I have independently audited the financial report to express an opinion on it. This was done by looking at a sample of the evidence. An audit does not guarantee that every amount and disclosure in the financial report is error free, nor does it examine all evidence and every transaction. However, my audit procedures should identify errors or omissions significant enough to adversely affect the decisions of users of the financial report.
D D R PEARSON AUDITOR GENERAL 23 September 2005


