396
ANNUAL REPORT 2011-12 BANGLADESH INSTITUTE OF NUCLEAR AGRICULTURE BAU CAMPUS, MYMENSINGH-2202 BANGLADESH

ANNUAL REPORT 2011-12
BANGLADESH INSTITUTE OF NUCLEAR AGRICULTURE BAU CAMPUS, MYMENSINGH-2202
BANGLADESH

Compiled and Edited by Dr. M. A. Salam, Director (Research) Dr. Md. Asgar Ali Sarkar, CSO (R.C) Dr. M. Raisul Haider, PSO and Head, TCP Division Published by
Bangladesh Institute of Nuclear Agriculture BAU Campus, Mymensingh-2202, Bangladesh
Phone : (091) 67601, 67602, 67834, 67835, 67837 Fax : (091) 67842, 67843, 62131 E-mail : [email protected] Website : www.bina.gov.bd Composed by
Pallab Dutta
Printed by
Ekushey Products Chotobazer Mymensingh
CONTENTS
Page
Foreword i
Preface iii
BINA’s Objectives v
Personnel vii
Plant Breeding Division 1
Crop Physiology Division 65
Soil Science Division 79
Entomology Division 153
Plant Pathology Division 167
Agricultural Engineering Division 187
Agronomy Division 279
Training, Communication and Publication Division 293
Biotechnology Division 323
Horticulture Division 349
Agricultural Economics Division 357
List of Publication 375

FOREWORD
I am delighted to know that the Annual Research Report 2011-12 of the Institute is going to be published. During this period, the Institute made significant contributions on technology generation and its transfer throughout the country, capacity building through national and international collaborations. The research activities of the Institute were carried out under eleven research divisions. During this period, 12 crop varieties were released viz., two varieties of rice (Binadhan-9 and Binadhan-10), two varieties of groundnut (Binachinabadam-5 and Binachinabadam-6), one variety of sesame (Binatil-2), two varieties of soybean (Binasoybean-1 and Binasoybean-2), two varieties of lentil (Binamasur-5 and Binamasur-6) and one variety of tomato (Binatomato-7). Binadhan-9 is an aromatic long fine grain rice variety suitable for aman season. Binadhan-10 is a salt tolerant variety to the tune of 10-12 dS/m. Binachinabadam-5 and Binachinabadam-6 are also salt tolerant which can tolerant upto 8 dS/m salinity during flowering till harvest stages. A substantial progress has been made towards the development of new crop varieties. Some significant features of the developed lines are elucidated here as; the mutant KD518-150 showed 40.06% higher grain yield (average 3.62 t ha-1) than mother Kalizira and 22.65% than the existing aromatic rice BRRI dhan34 in different sub-stations of BINA as well as in different farmers’ field across the country. Two rice lines viz., Ciherang sub1 and Samba Mahsuri sub1 were found promising for submergence tolerant, early maturing and minikate type for T. aman season. Two mutant lines of mungbean; N3J-305 and E4I-915 were found consistent in respect of seed yield over locations which matured six days earlier than Binamoog-7 and Binamoog-8. In another study against salinity, two rice genotypes; NERICA-1 and PBRC-37 showed relatively better performance in respect of yield and yield attributes up to 12 dS/m. On the basis of nitrate reductase activity of Binatomato-6, 150 kg N ha-1 was found sufficient for normal plant growth and development if urea is applied frequently in 20 days interval. A black seeded mutant line SM-12 of sesame was identified as high yield potential; two lines (BAU-S/80 and BAU-S/109) of soybean were found early maturing with higher seed yield; two lentil lines (LM-75-4 and LM-132-7) were found very promising for seed yield and consumers’ preferred characteristics; three summer tomato mutant lines (TM-131, TM-134 and TM-219) were found to be promising in respect to fruit yield, shape and size. Fertilizer recommendations were made on some elite mutant lines of mustard, soybean, sesame, salt tolerant rice and Binapatshak. In a study, about 20% increased yield was found using PGPR biofertilizer in the field condition of boro season at Mymensingh. In pest management, advanced selected lines of rice, pulses, oilseeds, tomato and onion were discriminated for resistance apart from bio-control and irradiation aided control measures. Mutants/lines of rice, pulses, oilseeds, tomato and jute were also evaluated for tolerance to their major insect pests and some mutants found to show tolerance against insect pests. Resource management for higher water productivity and water use efficiency together with water requirement and irrigation scheduling of BINA developed crop varieties were assessed. A water saving cropping pattern was also developed for the

drought prone Barind area of Chapai Nawabganj district, Magura and Mymensingh district as well. Trend of long-term climatic parameters and water table were also evaluated and its predictions were made for year-round crop planning. For yield maximization through better crop management, population density, early and late sowing potentials of advanced selected lines/varieties of rice, oilseeds, pulses and tomato were also performed and reported. Two genotypes of rice (Binadhan-9 and Kalozira) were evaluated under three transplanting date (August 01, August 10 and August 20) and found best time as August 01 for better yield. Three advance lines/varieties of soybean (BAU S/70, AVRDC 78 and Binasoybean-1) were assessed under different row spacing (20, 25 and 30 cm) and 20-25 cm line sowing produced more yield (2.55-2.79 tha-1). Two genotypes of sesame (Binatil-1 and Binatil-2) were evaluated under three row spacing (15, 20 and 25 cm) and 15-20 cm row spacing found better for maximum yield (1.08-1.15 t ha-1). In order to take the BINA crop varieties to the end users and attain maximum benefit from them, a good number of training programmes for the farmers, BADC, DAE and NGO personnel, field days and demonstrations were carried out. Besides this, BINA scientists supervised considerable number of M.S. and Ph.D. students of BAU, Mymensingh. It is hoped that the report would be useful for scientists, planners, policy makers and those who have academic interest as well. I am grateful to the members of the Publication Committee for their efforts in bringing out the report in time.
(Dr. M A Sattar) Director General

PREFACE
Bangladesh Institute of Nuclear Agriculture is an Agriculture Research Institute which has been using nuclear techniques in agriculture research since 1975. Now the Institute has become one of the reputed national institute and its exposure is gradually increasing internationally. The institute always has updated its annual research programme under changing climate & needs of the country. The scientist of the institute are trying also to devote themselves in full concentration developing new varieties and generating the non commodity technologies. I feel very happy for the success of the scientists of our institute to develop short duration (120-125 days) an aromatic fine long slender grain rice with an average grain yield 3.75 tons per hectare. This variety opens the potentiality of cultivating robi crops in the occupied land area by the existing local aromatic variety having life cycle of 150-160 days. In this year we could make release of a salt tolerant variety Bindhan-10 (tolerant upto 10-12 dS/m) which can be easily cultivated in at least one third area in the southern zones with a yield potential of 5.02-5.5 t ha-1. This variety can be grown also in non-saline condition throughout the country with more yield potential (7.5-8.5 t ha-1). There are many potential mutant lines of different crops which are being in advanced stages and awaiting for release process. Among them the rice mutant line RM(1)-200(C)-1-17 produced 200-990 kg ha-1 higher yield than BRRI dhan28. These are other rice mutant line RM(2)-50(C)-2-1 produced 8.58 t ha-1 yield in boro season which was 1.35 t ha-1 more yield than its parent BRRI dhan29. The rice mutant line RM(2)-40(C)-4-2-4 took the shortest period to mature in T. aman season (119 days) and produced all most alike yield as BRRI dhan49. The jute mutant O91/90/72-3 produced 8-10% higher fiber and 25-30% higher stick yield than the parent O-9897. Four mutant lines of wheat immerged as saline tolerant 6-12 dS/m. Two rapeseed mutants MM-51 and MM-63 have been identified with higher seed yield and short duration (1700 and 1800 kg ha-1, 78-82 days). A sesame mutant line (SM-10-04) has performed better in different locations in respect of seed yield (1500-1700 kg ha-1. Two soybean lines (BSUS-70 and AVRDC-78) have been selected for higher yield (2500-2800 kg ha-1). Two chickpea genotype P-70 and CPM-860 have been selected for bolder seed size and higher seed yield. Three AVRDC tomato mutant lines TM-8, TM-14 and TM-17 and one Cherry type mutant line TM-19 have been selected for higher yield. In addition to that one summer mutant line (TM-219) was found to be promising in respect of fruit yield (38.5 t ha-1), shape and size. Three onion mutants had significantly higher dry bulb yield than BARI Piaj-3 and BARI Piaj-8, had also lower weight loss on storing for one month. Research on soil fertility restore and production of Plant Growth Promoting Rhizobacteria (PGPR), Phosphate Solubilizing Bacteria (PSB) are in progress, needs further evaluation in on farm and regional condition. Irrigation scheduling research for different mutants are also in progress under changing climate and soil condition. Cropping pattern research including the BINA short duration varieties are carried on to increase the cropping intensity. Development of economically and severely affective pest tolerant mutants of different crops are in progress also. Regarding technology transfer activities like block demonstration, DAE personnel and farmers training and field days, production and distributions of seeds of different varieties to different stake holders are being carried out also successfully. I feel proud to congratulate our scientists for their keen interest, hardworking and great devotion for research. Thanks to all concerned who put their all sincere endeavors to prepare the document. Any constructive suggestions for the improvement of this annual report would be highly appreciated.
Dr. M. A. Salam Director (Research)

BINA’S OBJECTIVES
To develop high yielding and better quality crop varieties using both mutation and conventional breeding techniques. To assess the fertilizer status of the soils of Bangladesh and efficiency of utilization of applied nutrients by crop plants using radioisotopic techniques. To develop means of water use efficiency for optimization of crop yields through radioisotopes and radiation techniques. To evolve control measure against major pests and diseases of crop plants. To assist national and international research programmes through cooperative support. To provide facilities to students of the Bangladesh Agricultural University for carrying out research leading to Masters and Ph.D. degree in Agriculture. To arrange training programmes for the research scientists on the peaceful use of atomic energy in agriculture.

PERSONNEL OFFICE OF THE DIRECTOR GENERAL AND DIRECTORS AND
OTHER DIVISIONS
Director General's Office
M. A. Sattar, M.Sc.Ag., Ph.D Director General Kazi Rafiqul Alam, B.A Private Secretary (Admin. Officer) Md. Wazed Ali Fakir, B.A Stenographer (P.A.)
Director (Research)'S Office
M. A. Salam, B.Sc.Ag. (Hons.), M.Sc.Ag. Ph.D Director (Research) Md. Asgar Ali Sarkar, M.Sc.Ag. Engg., Ph.D Chief Scientific Officer (R.C) Md. Sarawardi Hossain, B.A Computer Operator
Director (Admn. & S.S.)'S Office
M. A. R. Howlider, M.Sc.(Ag.) Director (Admin & S.S) Md. Sanwar Hossain Stenographer (P.A)
Plant Breeding Division
M. A. Samad, M.Sc., Ph.D Principal Scientific Officer and Head Md. Abdul Malek, M.Sc., Ph.D Principal Scientific Officer Md. Abul Kalam Azad, M.S., Ph.D Principal Scientific Officer Md. Imtiaz Uddin, M.S., Ph.D Senior Scientific Officer Shamsun Nahar Begum, M.S., Ph.D Senior Scientific Officer Snigdha Roy, M.Sc. (Ag.) Senior Scientific Officer Mrs. Fahmina Yasmine, M.S Scientific Officer Reza Muhammad Emon, M.S Scientific Officer Mohammad Ali, M.S Scientific Officer Krishna Rany Das, M.S Scientific Officer Md. Nure Alam, B.Sc. (Ag.) Scientific Officer Md. Abdur Razzaque Assistant Scientific Officer Md. Abdul Jalil Pathan Assistant Scientific Officer Md. Mojibur Rahman Shaikh Assistant Scientific Officer Md. Abdul Gani Talukder Assistant Scientific Officer Sanjib Kumar Halder Assistant Scientific Officer Md. Syed Jakir Hossain Assistant Scientific Officer Mst. Ferdusi Begum Assistant Scientific Officer
vii
M.A. Sayeed Scientific Assistant-1 Shahanaz Parvin Scientific Assistant-1 Md. Abdur Rahman Scientific Assistant-1 Md. Sadequr Rahman Scientific Assistant-1 Bimol Chandra Modak Scientific Assistant-1 Md. Shahidullah Scientific Assistant-1 Md. Habibur Rahman Scientific Assistant-1 Md. Abdul Halim Scientific Assistant-1
Crop Physiology Division
A.H.M. Razzaque, M.S., Ph.D Chief Scientific Officer and Head A. F. M. Saiful Islam, M.Sc.Ag., Ph.D Principal Scientific Officer Md. Tariqul Islam, M.Sc.Ag., Ph.D Senior Scientific Officer M. Monjurul Alam Mondal, M.Sc.Ag., Ph.D Senior Scientific Officer Md. Siddiqure Rahman, M.Sc.Ag. Senior Scientific Officer Sakina Khanom, M.S., Ph.D Scientific Officer Md. Babul Akter Scientific Officer Roushan Ara Begum Assistant Scientific Officer Md. Shawkatul Islam Assistant Scientific Officer Md. Anwarul Islam Assistant Scientific Officer Md. Osman Gani Scientific Assistant-1 Md. Abdur Rahman Scientific Assistant-1 Md. Borhan Uddin Scientific Assistant-1
Soil Science Division
M. A. Sattar, M.Sc.Ag., Ph.D Chief Scientific Officer and Head Dr. Md. Monowar Karim Khan, M.Sc.Ag., Ph.D Chief Scientific Officer Dr. Md. Mohsin Ali , M.Sc.Ag., M. Agric, Ph.D Principal Scientific Officer Hafez Md. Ekram-ul Haque, M.Sc.Ag., M.S Principal Scientific Officer Dr. Md. Boktiar Hossain, M.Sc.Ag., Ph.D (Lien) Senior Scientific Officer Md. Azizul Haque, M.Sc.Ag., Ph.D. Senior Scientific Officer Dr. Md. Zahurul Islam, M.Sc.Ag., Ph.D Senior Scientific Officer Dr. M. Habibur Rahman, M.Sc.Ag., Ph.D Senior Scientific Officer Dr. Md. Belal Hossain, M.Sc.Ag., Ph.D Scientific Officer Md. Harun-or Rashid, M.Sc.Ag. (Deputation) Scientific Officer Saiyera Choudhury, M.S. (Deputation) Scientific Officer Md. Forhadul Islam, M.Sc.Ag Scientific Officer Md. Mahbubul Alam Tarafder, M.Sc.Ag. (Deputation) Scientific Officer Md. Mostafigur Rahman, B.Sc.Ag Scientific Officer Md. Mahbubur Rahman Khan, M.S Scientific Officer Sadia Tasmin, M.S Scientific Officer
viii

Tania Sarmin, M.Sc.Ag Scientific Officer Md. Forhad Hossain, B.Sc.Ag Scientific Officer Abdul Wahab Mia Assistant Scientific Officer Md. Tarikul Alam Assistant Scientific Officer Md. Tahurul Islam Assistant Scientific Officer Md. Abul Fazal Assistant Scientific Officer Md. Mosaraf Hossain Assistant Scientific Officer Kamrun Nahar Begum Assistant Scientific Officer Nunur Nahar Begum Scientific Assistant-1 Md. Kobinur Islam Scientific Assistant-1 Md. Abdul Awal Scientific Assistant-1 Md. Nazrul Islam Technician-1
Entomology Division
Md. Jahangir Alam, M.Sc.Ag., Ph.D Principal Scientific Officer and Head Morzia Begum, M.Sc.Ag., Ph.D Senior Scientific Officer Md. Tazmul Haque, M.Sc.Ag., Ph.D Scientific Officer Md. Lutfar Rahman Mollah, M.S Scientific Officer Md. Maruf Husain, M.S Scientific Officer Md. Joynal Abedin Assistant Scientific Officer Md. Abdul Baki Assistant Scientific Officer Md. Golam Rasul Assistant Scientific Officer Habiba Khatun Scientific Assistant-1 Ramendra Chandra Nayak Scientific Assistant-1 Md. Nazrul Islam Scientific Assistant-1
Plant Pathology Division
M. A. R. Howlider, M. Sc. Chief Scientific Officer and Head Hosne Ara Begum, M. Sc., Ph.D Principal Scientific Officer Md. Abul Kashem, M. Sc., Ph.D Senior Scientific Officer Mahbuba Kaniz Hasna, M. S., Ph.D Scientific Officer Md. Ibrahim Khalil, M. S. Scientific Officer Md. Rohizuddin Miah Assistant Scientific Officer Shazahan Ahmed Assistant Scientific Officer Md. Sawkatul Islam Assistant Scientific Officer Sujit Kumar Sarkar Scientific Assistant-1 Md. Mashiur Rahman Scientific Assistant-1
ix

Agricultural Engineering Division
Md. Asgar Ali Sarkar, M.Sc. Ag. Engg., Ph.D Md. Hossain Ali, M.Sc. Ag. Engg., Ph.D Nazmun Nahar Karim, M.S. (IWM), Ph.D Mohammad Ashiqur Rahman, M.S Md. Hasanuzzaman, M.S Md. Ashadullah Md. Nazrul Islam Bhuiya Md. Samsuddin Md. Abdul Malek Akanda
Chief Scientific Officer and Head Senior Scientific Officer Senior Scientific Officer Scientific Officer Scientific Officer Assistant Scientific Officer Scientific Assistant -1 Scientific Assistant -1 Scientific Assistant -1
Agronomy Division
Md. Monjurul Islam, M.Sc.Ag., Ph.D Senior Scientific Office and Head Md. Shahidul Islam, M.Sc.Ag Scientific Officer Md. Nurul Amin, B.Sc Assistant Scientific Officer Md. Niamat Ullah, B.Sc Assistant Scientific Officer Md Abdur Razzak, H.S.C Scientific Assistant-1 Md. Mosharraf Hossain, B.Sc Scientific Assistant-1 Sailendra Chandra Nayak, Dip. Agric Scientific Assistant-1
Training, Communication and Publication Division
M. Raisul Haider, M.Sc. (Ag. Ext. Ed.), Ph.D Principal Scientific Officer and Head A.F. M. Feroj Hasan, M.Sc. (Ag. Ext. Ed.), M.S., Ph.D Senior Scientific Officer Md. Ashraful Islam, M.Sc. (Ag. Ext. Ed.), Ph.D Senior Scientific Officer Shamima Begum, B.Sc. Ag. (Hons), M.S. Scientific Officer Julker Nain, B.Sc. Ag. (Hons), M.S. Scientific Officer Mr. Abdur Rab Gazi, B.Sc. Ag. (Hons), M.S. (Ag. Ext. Ed.) Scientific Officer A. H. M Quamruzzman Assistant Scientific Officer Md. Abdul Haque Scientific Assistant-1 Md. Mojibor Rahman Scientific Assistant-1 Mst. Abeda Sultana Upper Division Assistant Md. Jahangir Kabir Photographer
Biotechnology Division
Mirza Mofazzal Islam, M.Sc (Ag.), Ph.D Principal Scientific Officer and Head
Horticulture Division
A. F. M. Saiful Islam, M.Sc.(Ag.), Ph.D. Principal Scientific Officer and Head
x

Agricultural Economics Division
Md. Habibur Rahman, M.S. (Econ), Ph.D Senior Scientific Officer and Head Mohammad Rashidul Haque, M.S. (Econ) Scientific Officer
BINA Farm Establishment
Bijon Kumar Topdar Farm Manager Golam Mostofa Scientific Assistant-1
Ishurdi Sub-Station
Md. Nurun-Nabi Mozumder, M.S Scientific Officer and OIC Md. Shahidul Haque Bir, M.S Scientific Officer Md. Shain Akter Farm Manager Md. Abdus Subhan Assistant Scientific Officer Md. Al-amin Talukder Scientific Assistant-1
Magura Sub-Station
Md. Asad Ullah, M.S. Scientific Officer and OIC Md. Haider Ali Sarker Farm Manager Md. Anisur Rahman Assistant Scientific Officer Mrinal Kumar Shil Scientific Assistant-1
Rangpur Sub-Station
Md. Habibur Rahman, M.S. Scientific Officer and OIC Md. Ferdous Iqubal, M.S. Scientific Officer Md. Atiqul Islam Assistant Scientific Officer Md. Samsul Alam Sarker Scientific Assistant-1 Md. Shah Alam Scientific Assistant-1 Md. Mostafizur Rahman Scientific Assistant-1
Comilla Sub-Station
Md. Rafiqul Islam, M.S., Ph.D Scientific Officer Md. Shah Alam Scientific Assistant-1
Jamalpur Annex Farm
Md. Ilias Hossain, M.S. Scientific Officer and OIC Md. Hafizur Rahman Akanda Farm Manager Md. Mozzamel Haque Assistant Scientific Officer Mrs. Ferdousi Begum Scientific Assistant-1
xi

Satkhira Sub-Station
Md. Mahamudul Hassan, M.S Scientific Officer Md. Alamgir Kabir Assistant Scientific Officer
Electronics Section
Shriful Haque Bhuiya, B.Sc. Engg. M.S., Ph.D Principal Scientific Officer (Electronics) Khondakar Sumsul Arefin Senor Scientific Officer (Electronics) Md. Shahabuddin Khan Assistant Scientific Officer Md. Kamrul Islam Khan, MBA Sub Asst. Engineer
Planning and Development Cell
Md. Habibur Rahman, M.S.(Econ), Ph.D Senior Scientific Officer and Head Md. Kamruzzaman, M.Sc.Ag. (Entom) Scientific Officer Mohammad Rashidul Haque, M.S. (Econ) Scientific Officer
General Administration and Establishment
Md. Maheb Hussain, M.Sc. Deputy Director (Admn.) Md. Abdul Latif Siddique, M.A. L.L.B Asstt. Director (Senior scale) Md. Abdur Razzaque Khan, B.A Administrative Officer Md. Siddiqur Rahman Security Supervisor Md. Abdul Bari Estate Officer Hafez Md. Abdul Mannan Care Taker A.B.M. Mojibur Rahman Bhuiyan Head Assistant Mrs. Jesmin Akter Head Assistant Selina Begum Upper Division Assistant Md. Abdur Rahim Upper Division Assistant
Store Section
Salah Uddin Ahmed Store Officer Hasina begum Store Keeper
Procurement Section
Md. Mohiuddin Miah Procurement Officer Md. Sorwar Hossain Mollah Upper Division Assistant
xii
Finance and Accounts
Md. Abu Layes, B.Com (Hons.) Deputy Director (Finance) Md. Monjurul Hossain Khan, B.Com Asstt. Director (Finance) Md. Shamsul Hoque Audit Officer Md. Abdur Rahim Asstt. Director (Account) Md. Abdul Malek Accountant Md. Abdur Rahman Accounts Assistant cum Cashier Md. Habibur Rahman Accounts Assistant Md. Formaj Hossain Accounts Assistant Parvin Zakia Khanom Accounts Assistant Md. Nazim Uddin Accounts Assistant Md. Israfil Hossain Accounts Assistant
Engineering Support Service
M. A. Halim Sardar, B.Sc.Ag. Engg. (Hons) Executive Engineer Gias Uddin Ahmed, Dip-in-Engg. (Civil) Asstt. Engineer Khandakar Musharrof Hossain Sub-Asstt. Engineer Md. Arifur Rahman, Dip-in-Engg. (Civil) Sub-Asstt. Engineer Md. Abdur Rouf, Dip-in-Engg. (Civil) Sub-Asstt. Engineer Md. Harun-or-Rashid, Dip-in-Engg. (Elect) Sub-Asstt. Engineer Md. Mahabubul Islam, Dip-in-Engg. (Elect) Sub-Asstt. Engineer Md. Abdul Quddus Technician-1 Sayeda Bilkis Begum Technician-1 Md. Alamgir Howlader Technician-1 Md. Abdul Halim Upper Division Assistant Md. Shafiqul Islam Technician-1 S. M. Faizanul Haque Technician-1
Library Section
Mohammad Faroque Hossain Librarian Md. Shakhawat Hossain Assistant Librarian
xiii

PLANT BREEDING DIVISION

BINA Annual Report 2011-12 Plant Breeding
2

BINA Annual Report 2011-12 Plant Breeding
RESEARCH HIGHLIGHTS Rice The aromatic long fine grain rice line RC-43-28-5-3-3 has been released as Binadhan-9 in the 77th meeting of National Seed Board held on 15Th May 2012. It is suitable for T. aman season. It produces higher yield (3.0-4.15 t ha-1) than its parent Kalizira and the check BRRI dhan38; and matures 23-25 days earlier. For its shorter culm length it does not lodge. The mutant RM(1)-200(C)-1-17 produced 233-1333 kg and RM(1)-200(C)-1-17 produced 200-990 kg higher yields than BRRI dhan28 at 6 out of 9 locations when transplanted after harvest of long durated mustard/rapeseed during 2nd week of February to 1st week of March. The maturity of the mutant lines was 3-5 days earlier than BRRI dhan28. The mutant line RM (2)-50(C)-2-1-1 produced 8.58 t ha-1 yield in boro season which was 1.35 t ha-1 more yield than its parent BRRI dhan29 and matured 4 days earlier. In contrast, in T. aman season it produced 7.72 t ha-1 yield which was 2.06 t ha-1 higher than the check variety BRRI dhan49 and matured 5 days earlier. Interestingly, the mutant RM(2)-40(C)-3-1-7 appeared as aromatic in the boro season, although produced statistically at par yield with its parent and matured 12 days earlier. Moreover, 4 other mutants were selected in boro season that matured 8-10 days earlier and produced statistically at par yield with their parent BRRI dhan29. The mutant RM(2)-40(C)-4-2-4 took the shortest period to mature in T. aman season, only 119 days, and produced statistically indifferent yield with BRRI dhan49. Thirty four F5 lines have been selected for higher aroma with long fine grains and higher iron contents. To select for higher yielding deep water rice M2 bulk population of Mousar and M1 population of Luxmi digha have been grown. Jute The mutant O97/90/72-3 produced 8-10% higher fiber and 25-30% higher stick yields than its parent O-9897. Wheat Four mutant lines produced significantly higher yields through maintaining higher population in the saline soil of Satkhira than the check variety Pradip. Germination of wheat hardly affected by soil salinity ≤ 6.0 dS/m while yield up to 12 dS/m. Mustard/Rapeseed Two rapeseed mutants (MM-51 and MM-63) have been identified with higher seed yield and short duration (1700 and1800 kg ha-1, 78-82 days). Two mustrad lines (RC-4 and RC-9) have been identified with higher seed yield and short duration (1400 and1500 kg ha-1, 75-80 days). In addition, some M6 and M5 mutant lines of mustard and rapeseed have been selected with higher seed yield potential. These lines also need further evaluation. Groundnut Three mutants derived from Dacca-1 and two mutants from PK-1 produced significantly higher yields than their respective parents. Three Cercospora leaf spot tolerant lines that having significantly higher yield than the parents, Dacca-1 and Zhingabadam have also been selected.
3

BINA Annual Report 2011-12 Plant Breeding
Sesame A mutant line (SM-10-04) has performed better in different locations in respect of seed yield (1500-1700 kg ha-1). The capsules and leaves are hairy which can resist insect infestation. Application will be done to NSB for registration this line as variety. In addition there are some other mutants in advanced generations (M8 and M9) for evaluation. Soybean Two lines (BAUS-70 and AVRDC-78) have been selected for higher yield (2500-2800 kg ha-1). Seven mutant lines have been selected which gave higher than their mother varieties, Sohag and BARI soybean-5. Mungbean MBM-3-07-Y performed well in respect of seed coat colour, grain yield and tolerant to Cercospora leaf spot disease at different agro-ecological zones. Some promising mutants have been selected for earliness, grain yield and tolerance to diseases which will be tested in different yield trial. Chickpea Two genotypes P-70 and CPM-860 have been selected for bolder seed size and higher seed yield. Application will be made to NSB for registration as a variety. Some desirable mutant lines/plants have been selected for earliness, bolder seed size and higher seed yield at Barind area. Lentil LM-75-4, LM-185-2 and LM-132-7 mutant lines were found promising for seed yield (Av. wt. 2315, 2058 and 2221 kg ha-1) and other characters. In addition, some mutant lines (20 from M4, 15 from M6 and 7 from M7) have been selected and these are in trial for further evaluation. Tomato Three AVRDC mutant lines TM-8, TM-14 and TM-17 and one Cherry type mutant line TM-19 have been selected for higher yield. In addition to that one summer mutant line (TM-219) was found to be promising in respect of fruit yield (38.5 t ha-1), shape and size. Application will be made to NSB for registration these advanced lines as varieties. Onion Three mutants had significantly higher dry bulb yield than BARI Piaj-3 and 8 had lower weight loss on storing for one month at Rangpur and two at Mymensingh. The parent BARI Piaj-2 did not produce any seed. Ten mutants produced higher seed yield than BARI Piaj-3.
4

BINA Annual Report 2011-12 Plant Breeding
RICE
Preliminary yield trial with M5 high yielding mutant lines of T. aman rice
Seedlings of 13 mutant lines derived from BRRI dhan29 by irradiating its seeds with carbon ion beams in T. aman season along with BRRI dhan49 were transplanted on 11 August 2011, 30 days after seed sowing. The experiment followed RCB design with 3 replications. Seedlings were transplanted at 15 cm distances within rows of 20 cm apart. A unit plot size was 1.5 m × 1.0 m. Recommended doses of fertilizers, cultural and intercultural operations were also followed as and when required. Data on plant height, days to maturity; number of effective tillers, panicle length, filled and unfilled grains per panicle and yield plot-1 were recorded. Maturity was recorded experiment basis while plant height, effective tiller number, panicle length, filled and unfilled grains/panicle was recorded from 5 hills in each plot at harvest. Grain yield was recorded from 1 m2 which was latter converted to yield ha-1. Finally, the recorded data were subjected to proper statistical analyses following the design used and presented in Table 1. Table 1. Yield and some yield attributes of 13 mutant lines derived from BRRI dhan29 with carbon ion beams
irradiation along with BRRI dhan49
Mutant/variety
Days to
maturity
Plant height (cm)
Effective tiller (no.)
Panicle length (cm)
Filled grainspanicle-1
(no.)
Unfilled grains
panicle-1 (no.)
Grain yield
(t ha-1)
RM(2)-50 (C)-2-1-1 131 119.6 7.8 29.0 165.4 21.4 7.72 RM(2)-40 (C)-1-1-12 123 96.67 8.87 26.40 128.13 22.40 4.00 RM(2)-40 (C)-3-1-1 126 103.40 11.07 29.00 137.87 23.73 4.10 RM(2)-40 (C)-3-1-2 123 111.97 7.93 27.80 80.33 18.13 3.33 RM(2)-40 (C)-3-1-3 131 98.07 11.40 23.80 123.53 21.80 5.67 RM(2)-40 (C)-3-1-5 126 103.30 9.93 26.22 137.75 32.10 5.83 RM(2)-40 (C)-4-2-1 120 96.87 8.87 27.20 119.87 26.73 5.00 RM(2)-40 (C)-4-2-2 126 99.13 10.73 27.87 114.93 25.87 5.33 RM(2)-40 (C)-4-2-3 131 107.60 8.87 26.80 129.53 20.97 5.33 RM(2)-40 (C)-4-2-4 120 108.67 9.33 29.27 116.37 17.20 5.67 RM(2)-40 (C)-4-2-5 123 94.20 10.87 27.00 118.27 20.40 5.33 RM(2)-40 (C)-4-2-7 126 119.20 8.93 28.93 145.20 16.47 6.00 RM(2)-40 (C)-4-2-8 123 116.0 7.53 31.4 143.2 29.33 5.03 BRRI dhan49 136 103.8 8.53 24.73 129.67 18.40 5.67 LSD(0.05) - 24.36 14.07 - 15.99 5.00 Results showed that the mutants and the check variety differed significantly for yield and yield attributes. All the tested mutants took shorter period to mature, 120 to 131 days, while the check variety BRRI dhan49 took 136 days. The mutant RM (2)-4 (C)-4-2-4 took the shortest period, only 120 days, which was 16 days shorter than the check variety but with indifferent yield. Another mutant RM (2)-4(C)-4-2-1 also took 16 days shorter period to mature than the check variety but had lower grain yield. Moreover, two other mutants RM (2)-40(C)-3-1-5 and RM (2)-40(C)-4-2-7 produced a bit higher yield than the check variety but matured 10 days earlier. Filled grain was significantly the highest in the mutant RM (2)-50(C)-2-1-1 and it also had the highest grain yield, 7.72 t ha-1, which was
5

BINA Annual Report 2011-12 Plant Breeding
36.16% higher than BRRI dhan49. This higher yield of this mutant was attributed to its significantly longer panicle length and higher number of filled grains panicle-1. This mutant matured 5 days earlier than the check variety. Evaluation and screening of F4 populations of fine grain aromatic and higher iron containing rice in T. aman season
Seven F4 populations of which 3 derived by crossing aromatic long fine grain Binadhan-9 with Binadhan-7 designated as RC(3), 3 by crossing high iron containing Red rice with Binasail designated as RC(2), and the other by crossing Red rice with Binadhan-7 designated as RC(1). All these populations were transplanted on 18 August 2011 at 37 days after sowing at BINA farm, Mymensingh in plant-progeny-rows. The three parents of the populations were also included in this experiment. Seedlings were transplanted at 15 cm distances within rows of 20 cm apart. The length of each row was 3.0 m and the number of rows per population was 7-17. Recommended doses of fertilizers, cultural and intercultural operations were also followed as and when necessitated. Data on plant height, days to maturity; number of effective tiller, panicle length, filled and unfilled grains panicle-1 and yield hill-1 were recorded. Maturity was recorded population basis while plant height, effective tiller number, panicle length, filled and unfilled grains panicle-1 and grain yield were recorded from only the selected hills of each population but from 5 hills of the parents at harvest. Finally, the recorded data were subjected to proper statistical analyses and presented in Table 2. Table 2. Yield and some yield attributes of 13 F4 selected hills with aromatic long fine grain and higher iron
contents in T. aman season
Lines/variety Days
to maturity
Plant height (cm)
Effective tiller hill-1
(no.)
Panicle length (cm)
Filled grains panicle- 1
(no.)
Unfilled grains panicle-1
(no.)
Grain yield hill-1
(g) RC(1)-3-1 129 116 8 26 110 11 21.4 RC(1)-3-2 129 127 12 31 155 25 25.2 RC(1)-3-3 129 123 8 30 166 22 20.6 RC(1)-3-4 129 120 11 30 180 18 28.6 RC(1)-3-5 129 134 10 31 204 19 31.6 RC(2)-2-1-1 131 140 9 28 212 5 32.9 RC(2)-2-1-2 131 146 10 30 207 22 36.2 RC(2)-2-1-3 131 144 14 30 207 22 47.2 RC(2)-2-2-1 131 129 9 33 166 17 28.4 RC(2)-2-4-1 123 121 7 30 137 55 19.0 RC(2)-2-4-2 123 115 11 28 169 15 35.4 RC(2)-2-4-3 123 121 10 28 147 55 32.7 RC(3)-4-1 123 127 15 34 166 55 34.6 Binadhan-7 (P) 123 100 12 27 120 11 25.0 Red rice (P) 134 109 15 29 110 39 26.0 Binadhan-9 (P) 128 121 11 30 149 35 24.5 SE 1 3 1 1 8 4 1.80
6

BINA Annual Report 2011-12 Plant Breeding
Based on maturity, panicle length, filled grains panicle-1 and grain yield/hill 13 hills were selected, 5 from RC(1) group, 7 from RC(2) group and 1 from RC(3) group. It showed that maturity period of all the selected hills ranged 123-131days, shorter than the parent Red rice. Three selected hills derived from crossing between Red rice and Binasail designated as RC (2)-2-4-1, RC (2)-2-4-2, RC (2)-2-4-3 and the parent Binadhan-7 took the shortest period to mature. Plant height of the selected hills ranged 115-146 cm with RC (2)-2-1-2 being the tallest while RC (2)-2-4-2 the shortest. In contrast, heights of the parents Binadhan-7 and Red rice were significantly shorter than any of the selected hills despite height of 4 hills did not differ from Binadhan-9. Effective tiller number of the hills ranged 8-15 with RC (3)-4-1 being the highest and RC (2)-2-4-1 the lowest. Panicle length of the selected hills ranged 26-34 cm with RC (3)-4-1 being the longest while RC (1)-3-1 the shortest. In contrast, panicle length of the three parents ranged 27-30 cm with Binadhan-9 being the longest while Binadhan-7 the shortest. Filled grains panicle-1 ranged 110-212 g with RC (2)-2-1-1 being the highest while RC (1)-3-1 and Red rice the lowest. Nine hills had significantly higher grain yield hill-1 than any of the parent. All these hills will be screened again in the next boro season, 2012. Evaluation and screening of M2 populations of Mousar (local aus cv.) in T. aman season
Two M2 bulk populations derived from irradiating the seeds of local aus cv. Mousar with carbon ion beams at 40 and 60 Gy doses, respectively, were transplanted on 14 August 2011 at 33 days after sowing at BINA farm, Mymensingh in two plots. The parent cv. Mousar was also included in this experiment in a separate plot. There were 20 rows in each of 40 and 60 Gy dose’s plot but 5 rows parent. The length of each row was 3.0 m. Seedlings were transplanted at 15 cm distances within rows of 20 cm apart. Recommended doses of fertilizers, cultural and intercultural operations were also followed as and when required. Data on plant height, days to maturity; number of effective tiller, panicle length, filled and unfilled grains panicle-1 and yield hill-1 were recorded. Maturity was recorded population basis while plant height, effective tiller number, panicle length, filled and unfilled grains panicle-1 and grain yield were recorded from only the selected hills of each population but from 5 hills of the parents at harvest. Finally, the recorded data were subjected to proper statistical analyses and presented in Table 3. Based on maturity, panicle length, filled grains panicle-1 and grain yield hill-1 10 progenies have been selected. It appears that maturity of the selected progenies were significantly shorter than the parent Mousar despite having not significant difference within each other. In contrast, plant height of the M2 progenies were significantly longer than the parent ranged, 108-134 cm. Five progenies had significantly higher number of effective tiller, 1 progeny had longer panicle length but none had higher filled and lower unfilled grains panicle-1. The progeny with significantly higher number of effective tiller and longer panicle length had higher grain yield hill-1 also. All these progenies will be screened further in the next T. aman season.
7

BINA Annual Report 2011-12 Plant Breeding
Table 3. Yield and some yield attributes of 10 M2 selected progenies of Mousar (local aus cv.) in T. aman season
Progeny/variety Days
to maturity
Plant height (cm)
Effective tiller hill-1
(no.)
Panicle length (cm)
Filled grains panicle-1
(no.)
Unfilled grains panicle-1
(no.)
Grain yield hill-1
(g) RM(3)-40(C)-1 105 116 11 23 67 4 12.2 RM(3)-40(C)-2 105 125 12 22 32 59 15.6 RM(3)-40(C)-3 105 124 14 28 65 67 20.9 RM(3)-40(C)-4 105 134 6 24 35 29 4.8 RM(3)-40(C)-5 105 121 12 22 65 12 17.8 RM(3)-60(C)-1 106 108 12 21 20 25 1.75 RM(3)-60(C)-2 106 115 10 20 33 5 5.9 RM(3)-60(C)-3 106 113 13 25 25 40 7.8 RM(3)-60(C)-4 106 113 9 21 78 4 4.9 RM(3)-60(C)-5 106 108 7 18 23 15 3.7 Mousar (P) 116 103 11 23.8 84 2.6 18.2 SE 1.0 2.71 0.74 0.81 7.21 6.88 2.05 Growing of M1 generation of local deep water rice cv. Luxmi digha and aromatic rice cv. Kalozira in T. aman season With a view to develop high yielding variety of deep water and aromatic rice, seeds of the local deep water rice cv. Luxmi digha and aromatic local cv. Kalozira were irradiated with 200, 250 and 300 Gy doses of gamma rays from 60Co source of Institute of Food and Radiation Biology (IFRB), Savar. The irradiated seeds were sown separately dose-wise variety-1 on 30 July 2011. Seedling height was recorded from 10 randomly selected plants from each dose variety-1 at 24 days after sowing (DAS). The following day seedlings were transplanted at 15 cm distances within rows of 20 cm apart. Single seedling was transplanted in each hill of each dose variety-1. Recommended doses of fertilizers, cultural and intercultural operations were also followed as and when required. Data on plant height, days to maturity; number of effective tiller, panicle length and filled and unfilled grains panicle-1 were recorded. Maturity was recorded dose basis while plant height, effective tiller number, panicle length and filled and unfilled grains panicle-1 were recorded from randomly selected 5 hills of each dose exposed to Luxmi digha only at harvest. The recorded data were subjected to proper statistical analyses and presented in Tables 4 and Table 5. It appears that seedling height of Luxmi digha was decreased at 200 and 300 Gy doses of gamma ray showing significant difference with non irradiated (control) but appeared indifferent between each other. Interestingly, seedling height at 250 Gy dose was increased significantly from 200 Gy dose. This means 250 Gy dose has stimulating effect on seedling height, could not be used for future plant breeding applications. But either 200 or 300 Gy dose could be used as the difference in height reduction between these two doses was not significant. Interestingly, seedling height of Kalozira increased significantly with increasing doses of gamma rays. This means the doses used in this experiment had stimulating effect on seedling height and could not be used for further variant creation in Kalozira. Higher doses should be used in further plant breeding applications.
8

BINA Annual Report 2011-12 Plant Breeding
Table 4. Effect of different doses of gamma rays on seedling height of deep water rice local cv. Luxmi digha and aromatic local cv. Kalozira at 24 DAS in T. aman season
Gamma ray dose (Gy) Seedling height (cm) at 24 DAS Luxmi digha
Control (0) 60.1 200 51.3 250 59.9 300 50.6 SE 2.62
Kalozira Control (0) 41.3
200 45.0 250 46.7 300 46.1 SE 1.21
Effect of different doses of gamma rays on some yield attributes of deep water rice local cv. Luxmi digha in T. aman season is presented in Table 5. Like seedling height, all the yield attributes showed mostly similar response to exposed gamma ray doses. The harvested M1 plants derived from irradiating the seeds of Luxmi digha with 200, 250 and 300 Gy have been kept dose wise to screen in M2
generation in next T. aman season. Table 5. Effect of different doses of gamma rays on some yield attributes of deep water rice local cv. Luxmi
digha in T. aman season
Gamma ray dose (Gy)
Days to
maturity
Plant height (cm)
Effective tiller (no.)
Panicle length (cm)
Filled grains panicle-1
(no.)
Unfilled grains panicle-1
(no.) Control (0) 106 149.8 10.4 24.2 100.2 11.6 200 106 136.2 9.6 23.8 130.0 37.4 250 106 146.6 12.2 25.2 99.0 28.0 300 106 141.2 8.6 23.6 116.0 29.4 SE - 3.0 0.8 0.36 7.3 5.41 On-farm and on-station trials with 2 early maturing boro mutant lines
Seeds of 2 mutant lines of short duration boro rice along with BRRI dhan28 were sown during 5 to 18 January 2012 at 9 different locations of Bangladesh (Table 6). Seedlings were transplanted during 8 February to 1 March 2012. Age of seedlings varied between 35 to 44 days. In most of the locations, transplantation was made after harvest of long duration mustard/rapeseed following RCB designs with 3 replications. A unit plot size was 5.1 m × 4.0 m. Seedlings were transplanted at 15 cm distances within rows of 20 cm apart. Recommended doses fertilizers, cultural and intercultural operations were followed as and when required. Data on plant height, days to maturity; number of effective tillers hill-1, panicle length, filled and unfilled grains panicle-1and yield plot-1 were recorded. Maturity was recorded plot basis while plant height, effective tiller number, panicle length, filled and unfilled grains panicle-1 was recorded from hills plot-1 at harvest.
9

BINA Annual Report 2011-12 Plant Breeding
Table 6. Seed sowing, transplanting and seedling age of two short duration mutants along with BRRI dhan28
Location Date of seed sowing Date of transplanting Age of seedlings (days)BINA farm, Mymensingh 5 January 2012 8 February 2012 35 Ghunti, Mymensingh 5 January 2012 9 February 2012 36 Satkhira 8 January 2012 15 February 2012 39 Magura 8 January 2012 14 February 2012 40 Barisal 13 January 2012 28 February 2012 47 Natore 16 January 2012 23 February 2012 39 Rajshahi 16 January 2012 24 February 2012 40 Farmer’s field, Rangpur 18 January 2012 1 March 2012 44 BINA sub-station farm, Rangpur 18 January 2012 1 March 2012 44
Grain yield was recorded from 1 m2 which was latter converted to yield ha-1 at 14% moisture. Moisture data was recorded with a grain moisture meter. Grain characters like 1000-grain weight, length, breadth and length: breadth ratio were also recorded. Grain length and breadth was gathered from 25 grains of each mutant/variety. Finally, the recorded data were subjected to proper statistical analyses following the design used and are presented in Tables 7, 8, 9, 10 and 11. Moreover, four farmers and extension agent gatherings were arranged at Magura, Barisal, Ghunti Mymensingh and Farmers field, Rangpur during harvest to collect their opinion on the comparative benefits of these two mutants over BRRI dhan28 in regards to transplantation after harvest of long duration mustard/rapeseeds. Yield and some yield attributes of the mutant lines and the check variety BRRI dhan28 averaged over 9 locations of Bangladesh showed significant difference for plant height, panicle length, filled and unfilled grains panicle-1, and grain yield ha-1 (Table 2). In contrast, effective tiller number did not show any significant difference. The two mutants had significantly shorter height than the check variety BRRI dhan28. Grain yield of the mutants were significantly higher than the check variety despite showed not significant difference between them. Table 7. Yield and some yield attributes of two short duration mutant lines and the check variety BRRI dhan28
averaged over 9 locations of Bangladesh
Mutant/variety Plant height (cm)
Effective tiller hill-1
(no.)
Panicle length (cm)
Filled grains panicle-1
(no.)
Unfilled grains panicle-1
(no.)
Grain yield (tha-1)
RM(1)-200-(C)-1-10 87.46 10.68 21.70 91.96 15.77 5.35 RM(1)-200-(C)-1-17 87.79 10.34 22.49 96.56 14.32 5.42 BRRI dhan28 98.27 10.36 23.21 103.81 19.60 4.97 LSD(0.05) 1.61 NS 0.43 4.91 2.33 0.22
NS = Not significant The location showed also shown significant difference for yield and yield attributes (Table 8). Plant height, panicle length and filled grains panicle-1 were the highest at farmer’s field, Rangpur. In contrast, the shortest height and panicle length were recorded at Rajshahi. The highest unfilled and lowest filled grains panicle-1 were recorded at Barisal. Grain yield was the highest at BINA farm,
10

BINA Annual Report 2011-12 Plant Breeding
Mymensingh followed by farmer’s field, Rangpur. The lowest grain yield was recorded at Satkhira. The performance of the mutants at Satkhira, Rajshahi, Barisal and even Natore were poor in terms of grain yield ha-1. This might be due to late transplantation (Table 6). Earlier transplantation by 1 or two weeks with seedling age of ≤ 30 days may cause better performance which should be investigated latter. Table 8. Yield and some yield attributes at 9 locations averaged over the mutants and variety
Mutant/variety Plant height (cm)
Effective tiller hill-1
(no.)
Panicle length (cm)
Filled grains panicle-1
(no.)
Unfilled grains panicle-1
(no.)
Grain yield
(t ha-1) BINA farm, Mymensingh 95.09 9.53 23.33 104.18 16.27 6.84 Farmer’s field, Rangpur 99.62 11.00 24.69 110.67 16.78 6.23 Ghunti, Mymensingh 96.11 10.36 21.40 105.98 10.09 6.10 BINA sub-station farm, Rangpur 93.58 8.98 24.31 97.62 15.49 6.00 Magura 89.20 10.86 21.91 99.38 11.91 5.67 Natore 83.36 15.29 22.36 104.98 9.40 5.08 Barisal 94.00 10.91 21.87 78.88 34.71 4.48 Rajshahi 81.82 9.29 20.51 79.07 20.29 3.48 Satkhira 88.22 7.29 22.16 96.76 15.16 3.21 LSD(0.05) 2.80 1.00 0.74 8.50 4.03 0.38 Maturity period of the mutants and check variety differed with change in locations (Tables 6 and 9). Age of seedlings hardly affected maturity period as it was evident from Magura experiment where age of seedling was 40 days but maturity period was only 121-123 days (Tables 6 and 9). In contrast, at BINA sub-station farm, Rangpur maturity period was 128-129 days despite seedling age was 44 days. But with the same seedling age, maturity period was 134-137 days. The causes of such discrepancies are not clear, should be investigated latter. Table 9. Maturity period of the mutants and the check variety at 9 locations
Location RM(1)-200 (C)-1-1-10 RM(1)-200 (C)-1-1-17 BRRI dhan28 BINA farm, Mymensingh 129 128 131 Ghunti, Mymensingh 126 126 131 Satkhira 123 123 126 Magura 121 121 123 Barisal 131 131 133 Natore 130 130 133 Rajshahi 124 124 127 Farmer’s field, Rangpur 134 134 137 BINA sub-station farm, Rangpur 128 128 129 The interaction between mutant/variety and location on yield and yield attributes presented in Table 10.The interaction of mutant/variety and location was significant for yield and all yield attributes except effective tiller number and panicle length (Table 11). The mutant RM(1)-200 (C)-1-17 produced the highest grain yield at BINA farm, Mymensingh, Satkhira, Magura, Barisal, and Rajshahi. In contrast, the other mutant produced highest yield at Ghunti, Mymensingh and farmer’s field at Rangpur.
11
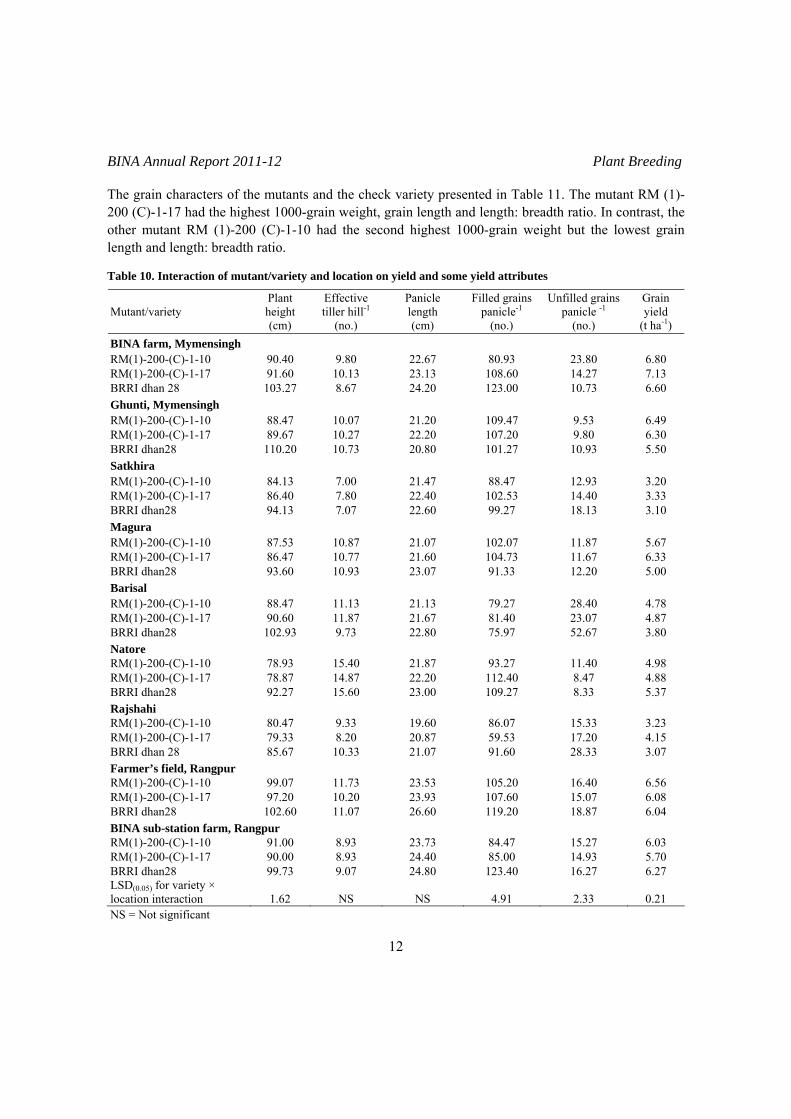
BINA Annual Report 2011-12 Plant Breeding
The grain characters of the mutants and the check variety presented in Table 11. The mutant RM (1)-200 (C)-1-17 had the highest 1000-grain weight, grain length and length: breadth ratio. In contrast, the other mutant RM (1)-200 (C)-1-10 had the second highest 1000-grain weight but the lowest grain length and length: breadth ratio. Table 10. Interaction of mutant/variety and location on yield and some yield attributes
Mutant/variety Plant height (cm)
Effective tiller hill-1
(no.)
Panicle length (cm)
Filled grains panicle-1
(no.)
Unfilled grains panicle -1
(no.)
Grain yield
(t ha-1) BINA farm, Mymensingh RM(1)-200-(C)-1-10 90.40 9.80 22.67 80.93 23.80 6.80 RM(1)-200-(C)-1-17 91.60 10.13 23.13 108.60 14.27 7.13 BRRI dhan 28 103.27 8.67 24.20 123.00 10.73 6.60 Ghunti, Mymensingh RM(1)-200-(C)-1-10 88.47 10.07 21.20 109.47 9.53 6.49 RM(1)-200-(C)-1-17 89.67 10.27 22.20 107.20 9.80 6.30 BRRI dhan28 110.20 10.73 20.80 101.27 10.93 5.50 Satkhira RM(1)-200-(C)-1-10 84.13 7.00 21.47 88.47 12.93 3.20 RM(1)-200-(C)-1-17 86.40 7.80 22.40 102.53 14.40 3.33 BRRI dhan28 94.13 7.07 22.60 99.27 18.13 3.10 Magura RM(1)-200-(C)-1-10 87.53 10.87 21.07 102.07 11.87 5.67 RM(1)-200-(C)-1-17 86.47 10.77 21.60 104.73 11.67 6.33 BRRI dhan28 93.60 10.93 23.07 91.33 12.20 5.00 Barisal RM(1)-200-(C)-1-10 88.47 11.13 21.13 79.27 28.40 4.78 RM(1)-200-(C)-1-17 90.60 11.87 21.67 81.40 23.07 4.87 BRRI dhan28 102.93 9.73 22.80 75.97 52.67 3.80 Natore RM(1)-200-(C)-1-10 78.93 15.40 21.87 93.27 11.40 4.98 RM(1)-200-(C)-1-17 78.87 14.87 22.20 112.40 8.47 4.88 BRRI dhan28 92.27 15.60 23.00 109.27 8.33 5.37 Rajshahi RM(1)-200-(C)-1-10 80.47 9.33 19.60 86.07 15.33 3.23 RM(1)-200-(C)-1-17 79.33 8.20 20.87 59.53 17.20 4.15 BRRI dhan 28 85.67 10.33 21.07 91.60 28.33 3.07 Farmer’s field, Rangpur RM(1)-200-(C)-1-10 99.07 11.73 23.53 105.20 16.40 6.56 RM(1)-200-(C)-1-17 97.20 10.20 23.93 107.60 15.07 6.08 BRRI dhan28 102.60 11.07 26.60 119.20 18.87 6.04 BINA sub-station farm, Rangpur RM(1)-200-(C)-1-10 91.00 8.93 23.73 84.47 15.27 6.03 RM(1)-200-(C)-1-17 90.00 8.93 24.40 85.00 14.93 5.70 BRRI dhan28 99.73 9.07 24.80 123.40 16.27 6.27 LSD(0.05) for variety × location interaction 1.62 NS NS 4.91 2.33 0.21
NS = Not significant
12
BINA Annual Report 2011-12 Plant Breeding
Table 11. Grain characters of the mutants and the check variety
Mutant/variety 1000-grain weight (g)
Grain length (mm)
Grain breadth (mm)
Length: breadth ratio
RM(1)-200-(C)-1-10 23.18 8.6 2.4 3.58 RM(1)-200-(C)-1-17 23.64 8.8 2.4 3.67 BRRI dhan28 22.90 8.7 2.4 3.63
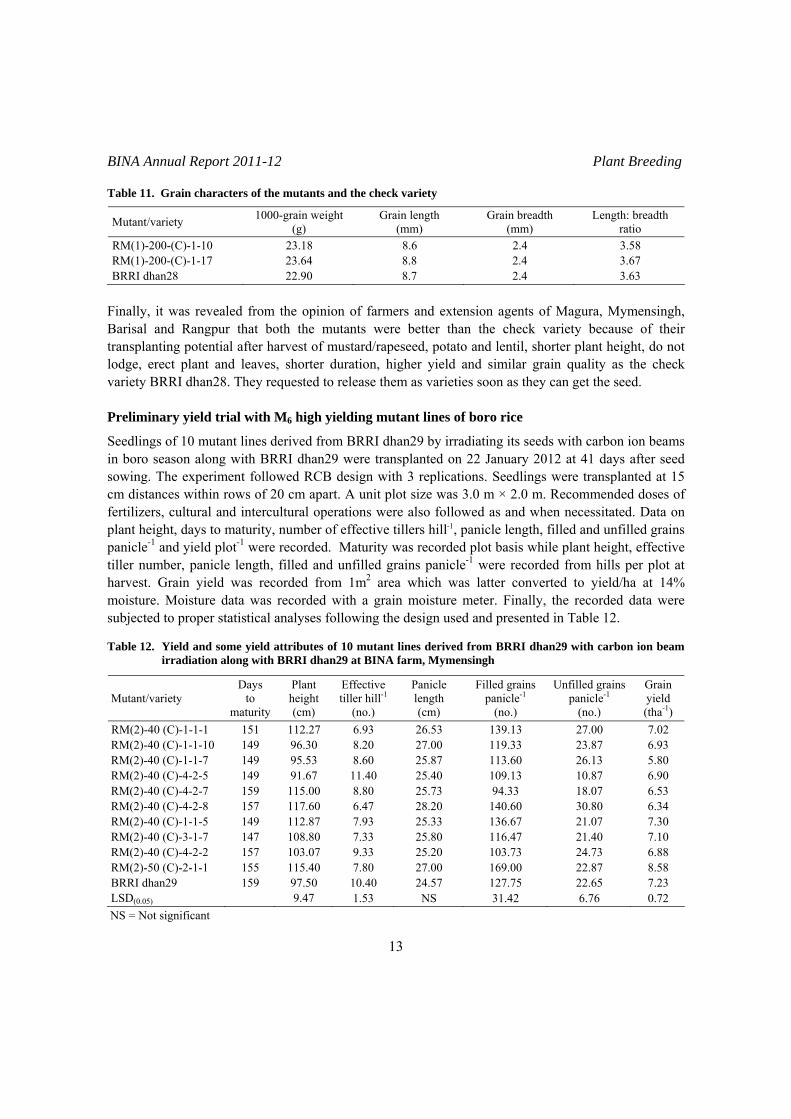
Finally, it was revealed from the opinion of farmers and extension agents of Magura, Mymensingh, Barisal and Rangpur that both the mutants were better than the check variety because of their transplanting potential after harvest of mustard/rapeseed, potato and lentil, shorter plant height, do not lodge, erect plant and leaves, shorter duration, higher yield and similar grain quality as the check variety BRRI dhan28. They requested to release them as varieties soon as they can get the seed. Preliminary yield trial with M6 high yielding mutant lines of boro rice
Seedlings of 10 mutant lines derived from BRRI dhan29 by irradiating its seeds with carbon ion beams in boro season along with BRRI dhan29 were transplanted on 22 January 2012 at 41 days after seed sowing. The experiment followed RCB design with 3 replications. Seedlings were transplanted at 15 cm distances within rows of 20 cm apart. A unit plot size was 3.0 m × 2.0 m. Recommended doses of fertilizers, cultural and intercultural operations were also followed as and when necessitated. Data on plant height, days to maturity, number of effective tillers hill-1, panicle length, filled and unfilled grains panicle-1 and yield plot-1 were recorded. Maturity was recorded plot basis while plant height, effective tiller number, panicle length, filled and unfilled grains panicle-1 were recorded from hills per plot at harvest. Grain yield was recorded from 1m2 area which was latter converted to yield/ha at 14% moisture. Moisture data was recorded with a grain moisture meter. Finally, the recorded data were subjected to proper statistical analyses following the design used and presented in Table 12. Table 12. Yield and some yield attributes of 10 mutant lines derived from BRRI dhan29 with carbon ion beam
irradiation along with BRRI dhan29 at BINA farm, Mymensingh
Mutant/variety Days
to maturity
Plant height (cm)
Effective tiller hill-1
(no.)
Panicle length (cm)
Filled grains panicle-1
(no.)
Unfilled grains panicle-1
(no.)
Grain yield (tha-1)
RM(2)-40 (C)-1-1-1 151 112.27 6.93 26.53 139.13 27.00 7.02 RM(2)-40 (C)-1-1-10 149 96.30 8.20 27.00 119.33 23.87 6.93 RM(2)-40 (C)-1-1-7 149 95.53 8.60 25.87 113.60 26.13 5.80 RM(2)-40 (C)-4-2-5 149 91.67 11.40 25.40 109.13 10.87 6.90 RM(2)-40 (C)-4-2-7 159 115.00 8.80 25.73 94.33 18.07 6.53 RM(2)-40 (C)-4-2-8 157 117.60 6.47 28.20 140.60 30.80 6.34 RM(2)-40 (C)-1-1-5 149 112.87 7.93 25.33 136.67 21.07 7.30 RM(2)-40 (C)-3-1-7 147 108.80 7.33 25.80 116.47 21.40 7.10 RM(2)-40 (C)-4-2-2 157 103.07 9.33 25.20 103.73 24.73 6.88 RM(2)-50 (C)-2-1-1 155 115.40 7.80 27.00 169.00 22.87 8.58 BRRI dhan29 159 97.50 10.40 24.57 127.75 22.65 7.23 LSD(0.05) 9.47 1.53 NS 31.42 6.76 0.72
NS = Not significant
13

BINA Annual Report 2011-12 Plant Breeding
It appears that the mutants and the check variety differed significantly for yield and yield attributes except panicle length (Table 12). The mutants took 147 to 157 days to mature while their parent BRRI dhan29 took 159 days. The mutant RM (2)-40 (C)-3-1-7 took the shortest period only 147 days. Filled grains was significantly the highest in the mutant RM(2)-50 (C)-2-1-1 and it also had the highest grain yield at 14% moisture content, 8.58 t ha-1, which was 1.35 t more than BRRI dhan29. This higher yield of this mutant was attributed to its considerable longer panicle length (Picture 5) and significantly higher number of filled grains panicle-1 (Table 12). This mutant together with those with higher filled grains panicle-1, longer panicle length, statistically at par yield and shorter maturity period would be put into advance yield trial in the next boro season. Evaluation and screening of F5 populations of fine grain aromatic and higher iron containing rice in T. aman season
Twelve F5 populations of which 7 derived by crossing high iron containing Red rice with Binadhan-7 designated as RC(1), 4 by crossing Red rice with Binasail designated as RC(2), and 1 by crossing aromatic long fine grain Binadhan-9 with Binadhan-7 designated as RC(3). All these populations were transplanted on 23 January 2012 at 37 days after sowing at BINA farm, Mymensingh in plant-progeny-rows. Three parents of the populations were also included in this experiment. Seedlings were transplanted at 15 cm distances within rows of 20 cm apart. The length of each row was 3.0 m and the number of rows per population was 10. Recommended doses of fertilizers, cultural and intercultural operations were also followed as and when necessitated. Data on plant height, number of effective tiller, panicle length, and filled and unfilled grains panicle-1 were recorded. Maturity was recorded population basis while plant height, effective tiller number, panicle length and filled and unfilled grains panicle-1 were recorded from only the selected hills of each population but from 5 hills of the parents at harvest. Finally, the recorded data were subjected to proper statistical analyses and are presented in Table 13. Based on panicle length and filled grains panicle-1, 34 plants have been selected, 14 from RC (1) group, 12 from RC (2) group and 8 from RC (3) group (Table 13). It appears that plant height of the selected plants ranged 80-138 cm with RC (2)-2-2-1-5 being the tallest while RC (2)-2-2-1-1 the shortest. Effective tiller number of the plants ranged 6-22 with RC (3)-4-1-4 being the highest and RC (1)-3-2-3 the lowest. Panicle length of the selected plants ranged 22-37 cm with RC (2)-2-2-1-5 being the longest while RC (2)-2-2-1-1 the shortest (Table 13). In contrast, panicle length of the three parents ranged 21-26 cm with Red rice being the longest while Binadhan-7 the shortest. Filled grains panicle-1 ranged 100-258 g with RC (3)-4-1-5 being the highest while RC (2)-2-4-1-2 the lowest. Unfilled grains panicle-1 ranged 4-45 g with RC (1)-3-2-2 being the lowest while RC (2)-2-2-1-4 and RC (2)-2-2-1-5 the highest. All these 34 plants will be further screened in the next T. aman season along with their parents.
14

BINA Annual Report 2011-12 Plant Breeding
Table 13. Yield and some yield attributes of 13 F5 selected plants with aromatic long fine grain and higher iron contents in T. aman season
Lines/variety Plant height (cm)
Effective tiller hill-1
(no.)
Panicle length (cm)
Filled grains panicle- 1
(no.)
Unfilled grains panicle-1
(no.) RC(1)-3-2-1 124 9 25 180 11 RC(1)-3-2-2 125 8 25 135 4 RC(1)-3-2-3 120 6 24 130 16 RC(1)-3-2-6 125 9 23 150 15 RC(1)-3-2-7 127 7 26 150 8 RC(1)-3-3-1 112 8 26 160 8 RC(1)-3-3-2 107 7 26 190 12 RC(1)-3-3-4 110 13 24 168 10 RC(1)-3-4-1 118 12 27 190 14 RC(1)-3-4-2 100 11 26 150 24 RC(1)-3-4-3 114 10 26 132 18 RC(1)-3-4-5 112 13 27 174 18 RC(1)-3-5-2 113 8 27 199 10 RC(1)-3-5-5 110 7 25 135 18 RC(2)-2-2-1-1 80 11 22 161 14 RC(2)-2-2-1-2 125 8 29 130 12 RC(2)-2-2-1-3 117 12 30 170 31 RC(2)-2-2-1-4 118 11 32 199 45 RC(2)-2-2-1-5 138 13 37 162 45 RC(2)-2-2-1-7 108 12 30 125 17 RC(2)-2-4-1-2 113 17 29 100 10 RC(2)-2-4-1-3 102 18 31 124 17 RC(2)-2-4-1-4 106 11 30 118 28 RC(2)-2-4-2-5 103 13 30 133 23 RC(2)-2-4-3-1 103 9 28 123 18 RC(2)-2-4-3-4 108 9 27 160 10 RC(3)-4-1-1 136 18 29 136 8 RC(3)-4-1-2 130 17 31 186 31 RC(3)-4-1-3 110 20 28 150 40 RC(3)-4-1-4 109 22 26 160 10 RC(3)-4-1-5 126 15 30 258 38 RC(3)-4-1-6 122 12 31 202 16 RC(3)-4-1-7 133 16 30 223 16 RC(3)-4-1-8 127 21 31 169 24 Binadhan-7 (P) 84 9 21 141 20 Red rice (P) 101 8 26 138 14 Binadhan-9 (P) 103 8 25 94 33 SE 2 1 1 6 2
15
BINA Annual Report 2011-12 Plant Breeding
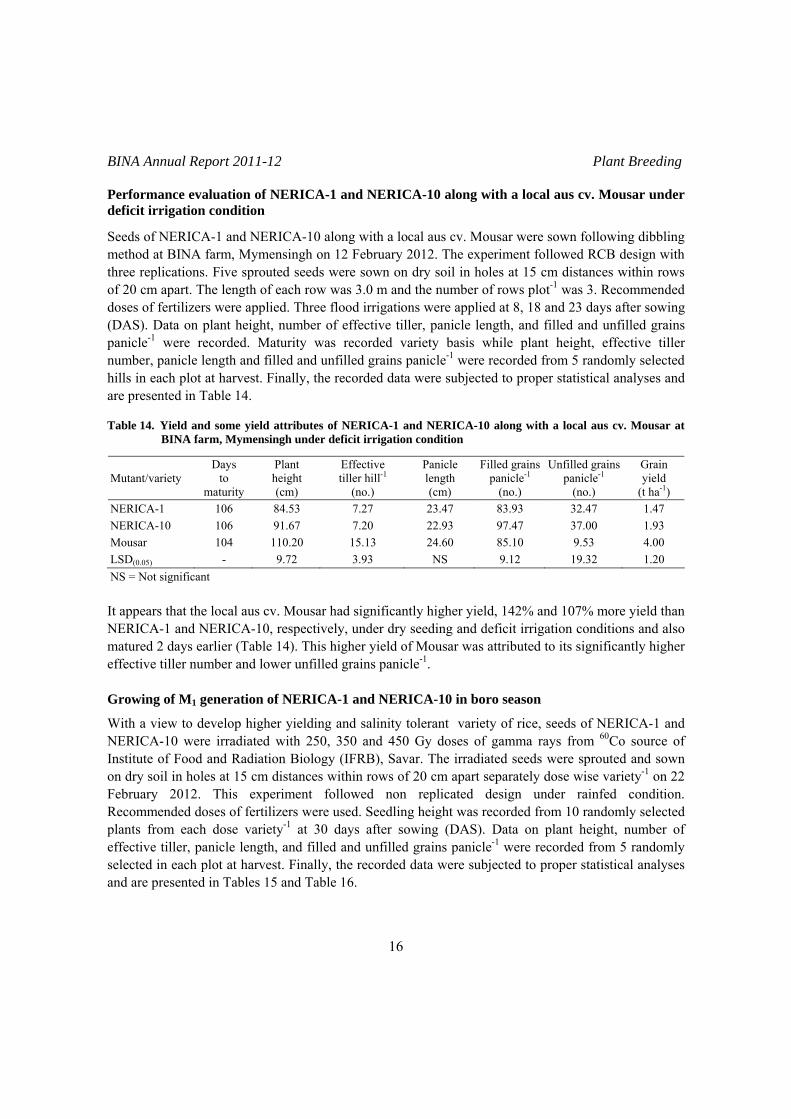
Performance evaluation of NERICA-1 and NERICA-10 along with a local aus cv. Mousar under deficit irrigation condition
Seeds of NERICA-1 and NERICA-10 along with a local aus cv. Mousar were sown following dibbling method at BINA farm, Mymensingh on 12 February 2012. The experiment followed RCB design with three replications. Five sprouted seeds were sown on dry soil in holes at 15 cm distances within rows of 20 cm apart. The length of each row was 3.0 m and the number of rows plot-1 was 3. Recommended doses of fertilizers were applied. Three flood irrigations were applied at 8, 18 and 23 days after sowing (DAS). Data on plant height, number of effective tiller, panicle length, and filled and unfilled grains panicle-1 were recorded. Maturity was recorded variety basis while plant height, effective tiller number, panicle length and filled and unfilled grains panicle-1 were recorded from 5 randomly selected hills in each plot at harvest. Finally, the recorded data were subjected to proper statistical analyses and are presented in Table 14. Table 14. Yield and some yield attributes of NERICA-1 and NERICA-10 along with a local aus cv. Mousar at
BINA farm, Mymensingh under deficit irrigation condition
Mutant/variety Days
to maturity
Plant height (cm)
Effective tiller hill-1
(no.)
Panicle length (cm)
Filled grainspanicle-1
(no.)
Unfilled grains panicle-1
(no.)
Grain yield
(t ha-1) NERICA-1 106 84.53 7.27 23.47 83.93 32.47 1.47 NERICA-10 106 91.67 7.20 22.93 97.47 37.00 1.93 Mousar 104 110.20 15.13 24.60 85.10 9.53 4.00 LSD(0.05) - 9.72 3.93 NS 9.12 19.32 1.20
NS = Not significant It appears that the local aus cv. Mousar had significantly higher yield, 142% and 107% more yield than NERICA-1 and NERICA-10, respectively, under dry seeding and deficit irrigation conditions and also matured 2 days earlier (Table 14). This higher yield of Mousar was attributed to its significantly higher effective tiller number and lower unfilled grains panicle-1. Growing of M1 generation of NERICA-1 and NERICA-10 in boro season
With a view to develop higher yielding and salinity tolerant variety of rice, seeds of NERICA-1 and NERICA-10 were irradiated with 250, 350 and 450 Gy doses of gamma rays from 60Co source of Institute of Food and Radiation Biology (IFRB), Savar. The irradiated seeds were sprouted and sown on dry soil in holes at 15 cm distances within rows of 20 cm apart separately dose wise variety-1 on 22 February 2012. This experiment followed non replicated design under rainfed condition. Recommended doses of fertilizers were used. Seedling height was recorded from 10 randomly selected plants from each dose variety-1 at 30 days after sowing (DAS). Data on plant height, number of effective tiller, panicle length, and filled and unfilled grains panicle-1 were recorded from 5 randomly selected in each plot at harvest. Finally, the recorded data were subjected to proper statistical analyses and are presented in Tables 15 and Table 16.
16

BINA Annual Report 2011-12 Plant Breeding
Table 15. Effect of different doses of gamma rays on seedling height of NERICA-1 and NERICA-10 in boro season
Gamma ray dose (Gy)
Seedling height (cm) at 24 DAS
NERICA-1 Control (0) 37.5
250 41.8 350 34.6 450 31.7 SE 2.15
NERICA-10 Control (0) 36.4
250 35.3 350 30.2 450 25.9 SE 2.43
Seedling height of NERICA-1 and NERICA-10 were decreased gradually with gradual increase in gamma ray doses except NERICA-1 at 250 Gy dose (Table 15). In contrast, plant height and yield plant-1 at maturity in NERICA-1 decreased gradually with gradual increase in gamma ray doses (Table 16) while only plant height at NERICA-10 showed such trend. These findings confirm the occurrence of chromosomal aberrations in these two varieties and thus new combinations are expected in M2 generation which would be selected in the next T. aman seson. For this, M1 seeds from each plant have been individually to grow plant-progeny-rows. Table 16. Effect of different doses of gamma rays on some yield attributes of NERICA-1 and NERICA-10 in
boro season
Gamma ray dose (Gy) Plant height (cm)
Effective tiller hill-1
(no.)
Panicle length (cm)
Filled grains panicle-1
(no.)
Unfilled grains panicle-1
(no.)
Yield plant-1
(g) NERICA-1
Control (0) 88.2 8.4 25.4 133.4 27.1 15.86 250 83.8 6.2 24.6 101.4 39.4 10.29 350 76.2 7 24.8 83.2 42.6 6.10 450 3.75 4 24.4 86.8 49.6 3.50 SE 3.63 0.92 0.22 11.43 4.70 2.70
NERICA-10 Control (0) 94 7.2 26.2 131.8 25.4 19.02
250 88.2 6.6 20.6 73 49.2 7.70 350 83.8 8.6 23.2 80.6 53.0 12.07 450 76.2 4.4 24 83.4 47.6 3.63 SE 3.8 0.9 1.2 13.4 6.2 3.29
17

BINA Annual Report 2011-12 Plant Breeding
JUTE
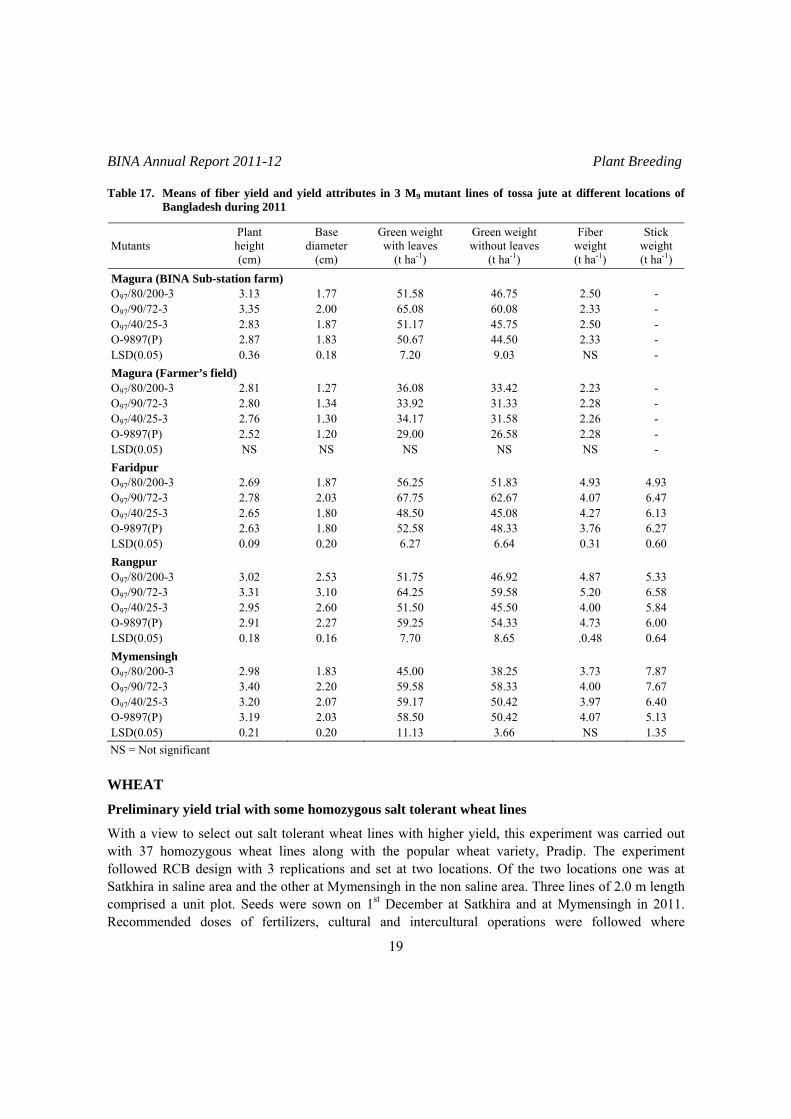
Zonal yield trial with M9 mutant lines of tossa jute
The aim of this experiment is to develop tossa jute variety(s) with higher fiber and stick yields and lower lignin content with three mutant lines following RCB design with three replications. The parent O-9897 was also included in this experiment. Seeds were sown on 16-24 April 2011 at farmer’s field at Mymensingh, Faridpur and Magura and BINA sub-station farms at Magura and Rangpur. Spacing between plants was 7-8 cm within rows of 30 cm apart. A unit plot size was 5.0 m × 4.0 m. Recommended doses of fertilizers, cultural and intercultural practices were followed as and when necessitated. Data on plant height, base diameter, green weight with and without leaves, dry fiber weight and stick weight were recorded after harvest. Green weight without leaves, fiber weight and stick weight were gathered from an area of 5 m2 and later converted to t ha-1. Finally, these data were subjected to proper statistical analyses and are presented in Table 17. It appears that the mutant O97/90/72-3 had significantly taller plant height at all locations than the check variety O-9897 except farmer’s field at Magura. At farmer’s field of Magura none of the characters had shown significant difference amongst the mutants and the check variety. In contrast, base diameter of O97/90/72-3 had shown significant difference at Rangpur and Faridpur locations. Green weight with and without leaves of this mutant were also higher than the check variety at all locations despite having not significant difference at Rangpur and Mymensingh. Fiber weight of this mutant did not show significant difference with the check variety. Contrarily, stick weight was significantly higher than the check variety. Finally, the mutant O97/90/72-3 will be put into on-farm and on-station trials again at different jute growing areas of Bangladesh, next year to confirm its fiber and stick yield potentiality. Growing of M4 populations of tossa jute
The aim of this experiment is to select out tossa jute mutant lines with higher fiber and stick yields, and lower lignin and higher cellulose contents. For this, dry seeds of O-9897 were irradiated with 400, 500, 600, 700 and 800 Gy doses of gamma rays and selection based on the mentioned objectives during M2 and M3 generations. M4 seeds were sown in April 2011 at BINA farm, Mymensingh in separate plots dose wise. Spacing between plants was 7-8 cm within rows of 30 cm apart. Recommended doses of fertilizers, cultural and intercultural practices were followed as and when necessitated. Based on plant height, base diameter and stem color 10 plants from 400 Gy, 4 from 500 Gy, 7 from 600 Gy, 4 from 700 Gy and 9 from 800 Gy doses were selected for preliminary yield trial during 2012.
18
BINA Annual Report 2011-12 Plant Breeding
Table 17. Means of fiber yield and yield attributes in 3 M9 mutant lines of tossa jute at different locations of Bangladesh during 2011
Mutants Plant height (cm)
Base diameter
(cm)
Green weight with leaves
(t ha-1)
Green weight without leaves
(t ha-1)
Fiber weight (t ha-1)
Stick weight (t ha-1)
Magura (BINA Sub-station farm) O97/80/200-3 3.13 1.77 51.58 46.75 2.50 - O97/90/72-3 3.35 2.00 65.08 60.08 2.33 - O97/40/25-3 2.83 1.87 51.17 45.75 2.50 - O-9897(P) 2.87 1.83 50.67 44.50 2.33 - LSD(0.05) 0.36 0.18 7.20 9.03 NS - Magura (Farmer’s field) O97/80/200-3 2.81 1.27 36.08 33.42 2.23 - O97/90/72-3 2.80 1.34 33.92 31.33 2.28 - O97/40/25-3 2.76 1.30 34.17 31.58 2.26 - O-9897(P) 2.52 1.20 29.00 26.58 2.28 - LSD(0.05) NS NS NS NS NS - Faridpur O97/80/200-3 2.69 1.87 56.25 51.83 4.93 4.93 O97/90/72-3 2.78 2.03 67.75 62.67 4.07 6.47 O97/40/25-3 2.65 1.80 48.50 45.08 4.27 6.13 O-9897(P) 2.63 1.80 52.58 48.33 3.76 6.27 LSD(0.05) 0.09 0.20 6.27 6.64 0.31 0.60 Rangpur O97/80/200-3 3.02 2.53 51.75 46.92 4.87 5.33 O97/90/72-3 3.31 3.10 64.25 59.58 5.20 6.58 O97/40/25-3 2.95 2.60 51.50 45.50 4.00 5.84 O-9897(P) 2.91 2.27 59.25 54.33 4.73 6.00 LSD(0.05) 0.18 0.16 7.70 8.65 .0.48 0.64 Mymensingh O97/80/200-3 2.98 1.83 45.00 38.25 3.73 7.87 O97/90/72-3 3.40 2.20 59.58 58.33 4.00 7.67 O97/40/25-3 3.20 2.07 59.17 50.42 3.97 6.40 O-9897(P) 3.19 2.03 58.50 50.42 4.07 5.13 LSD(0.05) 0.21 0.20 11.13 3.66 NS 1.35
NS = Not significant WHEAT
Preliminary yield trial with some homozygous salt tolerant wheat lines
With a view to select out salt tolerant wheat lines with higher yield, this experiment was carried out with 37 homozygous wheat lines along with the popular wheat variety, Pradip. The experiment followed RCB design with 3 replications and set at two locations. Of the two locations one was at Satkhira in saline area and the other at Mymensingh in the non saline area. Three lines of 2.0 m length comprised a unit plot. Seeds were sown on 1st December at Satkhira and at Mymensingh in 2011. Recommended doses of fertilizers, cultural and intercultural operations were followed where
19

BINA Annual Report 2011-12 Plant Breeding
necessary. Soil salinity records were gathered during sowing, vegetative and flowering stages. Data on plant number, plant height, effective tiller number, panicle length, grains panicle-1 and grain yield plot-1 were recorded at harvest. Grain yield plot-1 was converted to kg ha-1 latter. Finally, all the collected data were subjected to proper statistical analyses and are presented in Table 18. Table 1. Comparison of plant population, yield and some yield attributes of 37 homozygous salt tolerant lines of
wheat in the saline and non saline areas
Mutant/check Plants plot-1
(no.) Plant height
(cm) Effective tiller
(no.) Panicle length
(cm) Grains panicle-1
(no.) Grain yield ha-1
(kg) Satkhira (saline area) L-885-10 20.33 82.30 9.07 10.60 59.00 2541.67 L-61-7 19.33 83.78 8.27 9.85 48.40 2500.00 L-61-12 32.00 84.80 9.07 9.23 55.80 3287.50 L-61-15 33.00 83.23 8.20 9.93 55.80 3020.83 L-61-18 31.00 83.23 9.27 10.43 55.23 3082.92 L-61-28 25.67 80.47 9.87 10.47 56.07 2456.67 L-61-33 33.33 82.77 7.83 9.47 49.20 3014.17 L-61-34 25.67 84.27 9.33 11.13 54.47 2453.33 L-61-35 33.67 87.87 8.87 9.50 40.87 2644.17 L-61-37 27.00 90.53 8.07 10.23 53.53 3162.50 L-879-1 37.00 82.72 11.27 10.23 46.47 3100.42 L-879-2 24.67 78.20 8.13 10.20 44.53 2458.04 L-879-4 34.33 78.63 9.73 10.13 58.40 2704.58 L-879-5 18.00 79.93 7.93 11.07 56.80 1914.17 L-879-11 25.67 81.62 9.07 10.33 67.93 2848.33 L-879-22 22.67 79.20 8.13 10.10 52.67 2330.42 L-879-32 24.67 80.20 8.60 9.87 46.93 2812.50 L-879-33 17.33 75.55 8.47 10.33 59.53 1977.92 L-879-34 24.33 82.47 8.07 10.47 47.27 2287.08 L-880-1 45.00 86.90 8.33 9.40 48.43 3937.50 L-880-5 38.67 86.77 7.60 10.31 37.53 4160.83 L-880-7 24.67 82.23 9.47 10.17 52.53 2789.58 L-880-10 34.33 77.73 9.50 10.27 55.33 3146.25 L-880-11 26.67 79.50 8.40 10.27 48.67 2583.13 L-880-13 35.67 73.00 8.23 10.60 48.67 2791.67 L-880-14 27.33 84.97 10.40 9.77 53.07 2662.08 L-880-15 22.00 79.00 9.00 10.37 52.13 1895.83 L-880-17 26.00 81.33 7.27 9.13 42.73 2187.50 L-880-18 8.67 83.77 9.73 10.10 56.63 892.08 L-880-19 19.33 86.53 9.03 10.70 51.67 1852.50 L-880-20 32.67 88.13 10.33 9.93 48.33 2288.33 L-880-26 29.33 82.43 8.93 9.77 41.20 2953.33 L-880-27 31.67 74.13 9.17 10.63 43.13 2854.17 L-880-34 30.67 87.67 10.50 9.90 45.93 3080.00 L-880-36 26.67 81.17 8.87 9.97 40.53 2750.00 L-880-37 32.00 82.77 9.37 9.60 50.60 3337.54 L-880-43 33.33 87.32 10.07 10.33 49.33 3517.04 Pradip 19.00 81.00 8.80 13.25 52.37 3168.21 LSD(0.05) 3.32 5.25 1.08 2.48 9.89 270.58
20

BINA Annual Report 2011-12 Plant Breeding
Table 18 Contd.
Mutant/check Plants plot-1
(no.) Plant height Effective tiller
(no.) Panicle length
(cm) (cm) Grains panicle-1
(no.) Grain yield ha-1
(kg) Mymensingh (non saline area) L-885-10 24.67 92.73 8.40 12.13 57.47 2630.83 L-61-7 22.33 94.20 10.67 12.37 62.60 2647.58 L-61-12 28.67 95.73 9.73 11.83 55.73 3033.33 L-61-15 29.33 93.00 7.87 11.63 59.50 3010.54 L-61-18 20.33 94.10 8.47 11.80 50.87 2633.75 L-61-28 20.33 90.40 10.47 12.17 56.67 2461.46 L-61-33 32.67 88.60 6.73 10.77 36.13 3209.17 L-61-34 35.33 94.93 7.27 11.23 47.27 3343.75 L-61-35 23.67 95.40 7.80 10.80 54.60 2630.83 L-61-37 32.00 96.40 8.87 12.20 64.27 3175.42 L-879-1 27.33 88.87 9.87 11.07 49.60 2770.83 L-879-2 35.00 96.27 10.07 12.03 60.93 3529.17 L-879-4 26.67 95.93 8.87 11.40 60.73 2488.75 L-879-5 18.00 93.13 11.80 11.63 54.13 1883.75 L-879-11 17.67 93.27 9.67 11.77 58.47 1828.33 L-879-22 16.00 97.07 11.27 12.27 54.67 2499.17 L-879-32 29.67 97.33 12.93 11.80 56.17 2062.04 L-879-33 17.00 92.33 10.67 11.63 58.07 2163.75 L-879-34 32.33 95.80 10.27 11.90 63.13 2454.58 L-880-1 27.33 95.40 8.20 12.00 57.47 2959.58 L-880-5 22.00 110.40 11.80 13.07 54.97 3072.50 L-880-7 20.33 94.07 14.33 12.03 56.53 1268.42 L-880-10 26.33 97.40 11.00 12.37 58.53 3196.25 L-880-11 16.33 92.73 8.53 11.53 56.40 1910.21 L-880-13 28.67 95.87 11.40 12.10 56.37 3048.75 L-880-14 25.33 98.00 10.43 12.33 52.73 3139.58 L-880-15 20.00 91.53 12.27 11.90 52.97 2234.58 l-880-17 22.33 94.77 9.63 11.77 52.67 2215.83 L-880-18 19.00 89.87 11.60 12.10 52.93 2016.67 L-880-19 24.00 96.23 9.80 11.53 60.67 2435.00 L-880-20 22.33 90.17 11.27 12.10 50.47 3183.92 L-880-26 23.33 81.83 10.00 12.50 45.30 2842.08 L-880-27 26.00 96.63 12.53 13.00 50.17 1912.17 L-880-34 39.00 100.07 8.43 11.67 56.93 3961.67 L-880-37 29.67 95.87 11.87 11.40 48.40 3214.58 L-880-43 26.00 97.80 14.13 11.90 63.33 3427.50 Pradip 33.00 93.40 9.20 14.13 56.00 4503.33 LSD(0.05) 3.32 6.40 2.55 0.64 8.22 403.86 LSD(0.05) for comparing between locations
7.50 5.68 1.89 NS 8.81 337.16
NS = Not significant
21

BINA Annual Report 2011-12 Plant Breeding
It appears that interaction of line and location for plant population, plant height, number of effective tiller number, grains panicle-1 and grain yield ha-1 were significant (Table 18). Only panicle length did not differ significantly. This means yield and yield attributes of wheat differ with change in location except panicle length. Yield and yield attributes of the lines had lower scores in saline area at Satkhira than the non saline area at Mymensingh. Plant population ranged 19-45 at Satkhira with the lowest in the check variety Pradip while the highest in L-880-1 followed by L-880-5. In contrast, it ranged 16-39 at Mymensingh with L-879-22 being the lowest while L-880-34 the highest. The line(s) that could maintain higher population in the saline soil mostly produced higher yields. Three lines L-880-5, L-880-1 and L-880-43 produced significantly higher yield than the check variety Pradip in the saline area. In contrast, none of the tested lines produced higher yield than Pradip in the non saline area at Mymensingh despite some of them appeared statistically at par. Finally, it could be concluded that L-880-5, L-880-1 and L-880-43 would be tested over other locations in the saline area to assess performance in terms of yield in Advance Yield Trial, next year. Assessment of salt tolerance levels of different phenological stages of wheat
With a view to assess the tolerance levels of different phenological stages of wheat, this experiment was carried out with three lines/variety of wheat including the most popular variety Pradip. This lines/variety was subjected to five levels of salinity: control, 3, 6, 9 and 12 dS/m and three growth stages: pre sowing, vegetative, flowering and grain filling. A three factor experiment following CRD design with three replications was used. Plastic pots with 10 liter capacity were weighed and filled with 8 Kg soil mixture, prepared with sandy loam soil and rotten cow dung in a 1:1 ratio. The fertilizer needed for each pot was determined following the Fertilizer Recommendation Guide-2005. The total amount of nitrogen, phosphorus, potassium, sulphur and zinc were applied in the form of Urea, TSP, MP, Gypsum and Zinc sulphate. These were mixed thoroughly with the soil in each pot before sowing. For determination of plant available water analogus to field capacity, three earthen pots were weighed and filled with 8 kg of soil, as above. Then these were watered until leaked through the hole at the bottom. Thereafter, these were covered with black polyethylene sheet and weighed after cessation of water leaking through the perforated hole. Finally, plant available water was determined using the following formula-
weightpotweightInitialwaterpotweightFinal
Soilsoil(soil( ) ) + + − +
% PAW = × 100
100soilofweightdryOven
soil)core(brassweightdryovensoil)core(brassweightInitial×
+−+
For determination of initial moisture content and bulk density of the soil mixture three brass cores with 5 cm height and diameter were properly filled with the soil mixture and weighed. These were then oven dried at 105˚C for 24 hours. After cooling, these were again weighed and the dry soil removed. Weight of the blank cores was also recorded. Initial moisture content of the soil was calculated following the formula-
% Initial moisture content =
22

BINA Annual Report 2011-12 Plant Breeding
23
While bulk density was calculated using the formula-
(cc)mixture soilofVolume(g)soilofweightdryOven mixture
Bulk density (g/cc) =
Here, volume of soil mixture = π r2l Where, r = radius of brass core (cm) l = height of brass core (cm) In contrast, for determination of initial salinity three random samples of mixed soil were taken each with 50g, sun dried, pulverized and sieved. Twenty ml distilled water was added with 8g of such sieved mixed soil and was stirred for 30 minutes at 250 rpm. The following day, it was stirred again and electrical conductivity was recorded using an EC meter in dS/m. Seeds were sown on 11 December 2011 and when the plants were established, only five healthy plants were kept in each pot. The pots were kept free from weeds. The plants were protected from insect pest by spraying appropriate insecticides as and when necessary. The saline water was synthesized by using mixture of different salts: 50% NaCl, 15% Na2SO4, 10% NaHCO3, CaCl2, and MgCl2 together with 5% MgSO4 so that their compositions were almost alike their average compositions in the ground water of saline areas of Bangladesh. Fifty grams of such salt was dissolved liter-1 tap water to prepare the stock solution. The salinity of the stock solution was 80 dS/m. The total amount of stock solution needed to raise the desired salinity of the soil mixture was estimated with the following equation-
V1S1 = V2S2
Where, V1 = volume of soil mixture in a pot S1 = desired salinity - initial salinity of the soil V2 = volume of water at 70-80% PAW S2 = salinity of stock solution
Again, volume of soil mixture (V1) was determined using the following formula-
soilofdensityBulk soil driedoven ofWeight
V1 = Volume of water (V2) was determined by dividing the weight of water with its density (0.98 g/cc).

BINA Annual Report 2011-12 Plant Breeding
24
The estimated amount of stock solution was then diluted to the desired salinity levels by adding tap water and then imposed during the assigned stage till harvest. The total amount of saline water for the respective doses at different phenological stages was applied during the initiation of the respective stage till maturity at installments except the pre sowing stage. At pre sowing stage, the whole amount of saline water needed for the respective doses was applied at a time before sowing. Contrary to pre sowing stage, 0.5 liter saline water was applied at each installment so that the moisture content of the pots remained 70-80% of plant available water (PAW). For the control, same amount of only fresh tap water was applied.
Relative performance was calculated following the formula-
100
conditioncontrolunder ePerformanccondition salineunder trait a of ePerformanc
×Relative performance (% of control) =
The relative performance of yield and some yield attributes of wheat at different phenological stages as affected by different levels of salinity are presented in Table 19 (a-f). Germination of seeds of all lines/variety was quite normal at 3 dS/m when exposed to soil before sowing. In contrast, there was no germination of any seed of any lines/variety at 9 and 12 dS/m salinity levels upto 20-30 days after sowing. At 6 dS/m seed germination was affected to some extent and was delayed germination. Plant height was affected more when salinity was imposed before sowing, particularly at 12 dS/m salinity with L-885 being the highest while Pradip the lowest (Table 19a). Moreover, height of Pradip was reduced markedly at 6 and 9 dS/m salinities with the highest reduction at 6 dS/m. In addition to 12 dS/m, height of L-885 was reduced to that of its control at 9 dS/m lesser extent. The check variety Pradip was more affected. At grain filling stage, effect of salinity on plant height was the highest in L-880 at 9 dS/m despite it had longer height at 12 dS/m salinity. This means, this reduction in height of L-880 at 9 dS/m was attributed to other factors, may be insect infestation. Effective tiller number of any line/variety was not at all affected rather stimulated when exposed to 6 and 9 dS/m salinities before sowing except Pradip at 9 dS/m (Table 19b). In contrast, at 3 dS/m effective tiller number in L-880 was reduced by 14.29% and in L-885 by 2.04%. At 12 dS/m effective tiller number was reduced drastically in all line/variety with L-880 being the highest while pradip the least. Effective tiller number was mostly reduced in all lines/variety to that of their respective control treatments at the remainder three stages although with non linear trend. When wheat plant was exposed to salinity at vegetative stage, no symptom of salinity appeared on plant height of any of the lines/variety rather it was stimulated. Salinity imposition at flowering stage showed some effect on plant height like pre sowing stage at 12 dS/m but with like plant height, panicle length was affected more in all lines/variety at 12 dS/m salinity when exposed before sowing followed by 9 dS/m (Table 19c). At 6 dS/m panicle length of L-880 and Pradip were reduced markedly. Highest reductions in panicle length to that of control were 4.50% in L-885 at 12 dS/m at vegetative stage, 9.49% in Pradip at 6 dS/m at flowering stage and 5.22% in L-885 at 12 dS/m at grain filling stage.

BINA Annual Report 2011-12 Plant Breeding
Table 19. Relative performance of different yield and yield attributes of wheat at different phenological stages as affected by different salinity levels
(a) Plant height (% of control)
Salinity level (dS/m) Line/variety
Control 3 6 9 12 Pre-sowing L-880 100.00 110.90 105.57 100.93 29.89 L-885 100.00 99.34 104.91 73.68 24.04 Pradip 100.00 99.68 67.63 94.64 56.81 Vegetative L-880 100.00 104.92 107.05 108.85 102.24 L-885 100.00 106.44 109.82 107.63 106.18 Pradip 100.00 107.61 110.07 105.85 106.03 Flowering L-880 100.00 96.35 102.77 101.98 98.19 L-885 100.00 92.77 99.82 97.52 94.74 Pradip 100.00 99.84 100.16 100.05 91.80 Grain filling L-880 100.00 99.89 97.87 93.72 97.16 L-885 100.00 94.24 98.82 103.10 95.88 Pradip 100.00 109.93 100.77 96.00 101.51 (b) Effective tiller hill-1 (% of control)
Pre-sowing L-880 100.00 85.71 111.11 235.71 23.81 L-885 100.00 97.96 104.59 135.71 45.92 Pradip 100.00 100.00 73.41 162.50 51.14 Vegetative L-880 100.00 78.69 77.05 88.52 75.41 L-885 100.00 71.19 71.19 71.19 67.80 Pradip 100.00 69.64 62.50 73.21 73.21 Flowering L-880 100.00 106.78 93.22 76.27 86.44 L-885 100.00 78.33 75.00 84.17 71.67 Pradip 100.00 71.88 81.25 70.31 67.19 Grain filling L-880 100.00 94.64 105.36 108.93 82.14 L-885 100.00 92.19 95.31 82.81 95.31 Pradip 100.00 87.72 89.47 85.96 87.72
25

BINA Annual Report 2011-12 Plant Breeding
(c) Panicle length (% of control)
Pre-sowing L-880 100.00 103.05 95.43 85.18 25.91 L-885 100.00 101.67 102.77 63.38 28.30 Pradip 100.00 97.64 64.97 91.90 59.39 Vegetative L-880 100.00 99.60 107.43 98.41 96.33 L-885 100.00 98.41 99.81 98.31 95.50 Pradip 100.00 100.50 107.01 99.67 99.00 Flowering L-880 100.00 96.99 106.40 104.07 108.63 L-885 100.00 95.73 94.27 97.27 94.55 Pradip 100.00 97.93 90.51 94.11 97.17 Grain filling L-880 100.00 103.44 97.42 99.62 99.62 L-885 100.00 95.71 99.07 96.92 94.78 Pradip 100.00 100.00 104.75 97.50 99.75
(d) Grains panicle-1 (% of control)
Pre-sowing L-880 100.00 108.75 104.23 72.16 24.29 L-885 100.00 92.41 101.62 57.84 17.41 Pradip 100.00 90.27 90.12 70.21 49.40 Vegetative L-880 100.00 115.45 125.45 121.92 123.50 L-885 100.00 114.08 109.73 100.14 103.36 Pradip 100.00 111.84 101.80 112.64 120.11 Flowering L-880 100.00 122.45 103.88 139.85 92.91 L-885 100.00 110.34 93.62 113.85 101.91 Pradip 100.00 88.68 89.58 85.87 95.54 Grain filling L-880 100.00 92.33 93.86 90.39 110.72 L-885 100.00 91.00 92.27 82.27 89.48 Pradip 100.00 98.62 103.06 107.04 79.76
26

BINA Annual Report 2011-12 Plant Breeding
(e) Grain weight panicle-1 (% of control)
Salinity level (dS/m) Line/variety
Control 3 6 9 12 Pre-sowing L-880 100.00 106.11 95.74 57.78 13.89 L-885 100.00 89.63 93.81 51.55 8.82 Pradip 100.00 89.31 59.21 56.74 40.13 Vegetative L-880 100.00 110.30 115.76 100.61 113.94 L-885 100.00 86.34 81.94 80.62 83.70 Pradip 100.00 125.99 118.64 116.38 120.90 Flowering L-880 100.00 106.29 89.14 110.29 84.57 L-885 100.00 122.82 106.71 130.87 125.50 Pradip 100.00 81.40 91.16 80.47 88.37 Grain filling L-880 100.00 108.54 92.96 90.45 106.53 L-885 100.00 105.61 93.37 97.96 97.96 Pradip 100.00 96.21 97.63 100.00 75.83
(f) Grain weight hill-1 (% of control) L-880 100.00 92.68 100.42 144.42 15.69 L-885 100.00 109.01 104.70 137.80 15.39 Pradip 100.00 100.53 75.24 92.36 46.18 Vegetative L-880 100.00 110.30 115.76 100.61 121.82 L-885 100.00 86.34 81.94 80.62 91.63 Pradip 100.00 137.29 129.38 116.38 122.60 Flowering L-880 100.00 95.58 89.16 77.21 94.25 L-885 100.00 100.80 101.33 122.81 118.57 Pradip 100.00 79.17 73.02 76.79 75.20 Grain filling L-880 100.00 105.90 103.30 100.47 91.98 L-885 100.00 103.45 96.75 80.73 90.06 Pradip 100.00 95.79 99.77 94.16 71.96
Grains panicle-1 was also affected more in all lines/variety at 12 dS/m salinity when exposed before sowing followed by 9 dS/m (Table 19d). At 6 dS/m grains panicle-1 of Pradip reduced markedly. In contrast, at 3 dS/m it reduced markedly in L-885 and Pradip. It was stimulated in all lines/variety at all salinity levels when exposed to vegetative stage. When salinity was exposed to flowering stage, grain number in Pradip was reduced at all salinity levels with the highest being at 9 dS/m. But in L-880 it was reduced at 12 dS/m and in L-885 at 6 dS/m. At grain filling stage, it was reduced at all salinity levels in L-885 and at 3-9 dS/m in L-880 and at 3 and 12dS/m in Pradip.
27

BINA Annual Report 2011-12 Plant Breeding
Grain yield panicle-1 was affected more in all lines/variety at 12 dS/m salinity when exposed before sowing followed by 9 dS/m (Table 19e). At 6 dS/m grain yield panicle-1 was also reduced markedly with the highest being in Pradip at 3dS/m in L-880 and Pradip. At vegetative stage, grain yield panicle-
1 was reduced at all salinity levels to that of control only in L-885. At flowering stage, it was reduced at all salinity levels to that of control only in Pradip and at 6 and 12 dS/m in L-880. At grain filling stage, grain yield panicle-1 was reduced at 6 to 12 dS/m in L-885, in Pradip at 3, 6 and 12 dS/m and in L-880 at 6 and 9 dS/m. Grain yield hill-1 was affected more in all lines/variety at 12 dS/m salinity when exposed before sowing (Table 19f). At 6 and 9 dS/m grain yield panicle-1 was also reduced markedly in Pradip. When salinity was imposed at vegetative stage, yield hill-1 was reduced to that of control at all salinity levels only in L-885. In contrast, its yield was stimulated at all salinity levels to that of control when exposed at flowering stage. But that of L-880 and Pradip were reduced at this stage of development at all salinity levels. At grain filling stage, grain yield hill-1 in L-880 was mostly stimulated at all salinity levels except 12 dS/m while that of L-885 and Pradip were mostly reduced at all salinity levels except 3 dS/m in L-885. Finally, it could be concluded that wheat is sensitive to soil salinity ≥6 dS/m when exposed before sowing. At the remainder stages, imposition of salinity up to 12 dS/m has little effect on yield and different yield attributes.
RAPESEED-MUSTARD
Zonal yield trial rapeseed mutants (B. napus)
Six M7 mutant lines of rapeseed (Brassica napus) along with a check variety Binasarisha-4 and Binasarisha-5 were put into the trial. The trial was conducted in the BINA Head Quater farm, Mymensingh and in the farms of BINA sub-stations at Magura, Ishurdi and Rangpur. The experiment was laid out in a randomized complete block design with three replications. Seeds were sown on 03 November in BINA Head Quaters 27 October at Magura, 28 October at Ishurdi and 3 November 2011 at Rangpur. Unit plot size was 12 m2
(4 m × 3 m) with 25 cm row to row spacing and 6-8 cm from plant to plant within rows. Recommended production packages i.e., application of fertilizers, weeding, thinning, irrigation, application of pesticide etc. were followed to ensure normal plant growth and development. Data on plant height, branches plant-1, siliquae plant-1 and seeds siliqua-1 were taken from 10 randomly selected plants from each plot. Maturity period was counted when 70% siliquae were matured. Seed yield of each plot was recoded after harvest and then converted into kg ha-1. Appropriate statistical analyses were performed for comparison of means of each character. Results obtained from the trial of individual location and combined over four locations for all the characters are presented in Table 20. Significant variations were observed among the mutants and check variety for some of the characters in both the locations and combined over locations. On an average, days to maturity varied from 98-103 days, 90-99days, 94-103 days and 100-102 days at Mymensingh, Magura, Rangpur and Ishurdi, respectively. Most of the mutants had similar or longer duration for maturity with the check varieties. In case of plant height, the mutant MM-256 was the tallest in all locations.
28

BINA Annual Report 2011-12 Plant Breeding
Table 20. Mean of M7 mutants and check of rapeseed for different characters
Locations Mutants/check Days to maturity (days)
Plant height (cm)
Branches plant-1
(no.)
Siliqua plant-1
(no.)
Seeds siliqua-1
(no.)
Seed yield
(kg ha-1) MM-10 103 111.9cd 2.7ab 91.1a 30.7a 1355bc MM-35 102 110.6d 1.8b 76.3a 28.7a-c 1333bc MM-37 98 111.6cd 2.4ab 72.9a 30.0ab 1666a MM-256 103 140.4a 1.6b 97.9a 25.9c 1266c MM-210 100 124.5bc 2.0b 71.1a 28.5a-c 1511ab MM-211 100 126.2b 2.0b 75.1a 28.0a-c 1422bc Binasarisha-4 96 109.7d 2.3ab 88.5a 27.1bc 1689a
Mymensingh
Binasarisha-5 98 104.7d 3.3a 102.3a 29.3ab 1509ab MM-10 90 123.7ab 2.6a 67.7b 30.0ab 1577a MM-35 92 116.1b 2.5a 66.2b 33.1a 1433a MM-37 93 124.5ab 2.7a 72.1ab 31.9ab 1511a MM-256 90 132.1a 2.9a 90.5a 30.8ab 1400a MM-210 99 116.9b 2.1a 77.1ab 27.9ab 1533a MM-211 96 117.7b 2.7a 73.8ab 27.3b 1355a Binasarisha-4 89 113.5b 2.2a 67.2b 32.1ab 1366a
Magura
Binasarisha-5 92 114.0b 2.8a 73.1ab 29.5ab 1511a MM-10 94 93.9c 2.3ab 66.9a 24.3ab 978bc MM-35 95 97.5bc 2.1b 64.3a 25.7a 1222ab MM-37 99 106.5b 2.7ab 78.5a 23.1b 1288a MM-256 102 123.3a 2.9a 74.8a 24.2ab 1011bc MM-210 95 102.3bc 2.2b 61.5a 23.5ab 1055a-c MM-211 101 98.7bc 2.2b 62.9a 20.1c 955c Binasarisha-4 94 91.3c 2.3ab 70.8a 23.1b 1144a-c
Ishurdi
Binasarisha-5 97 95.2bc 2.1b 59.5a 22.3bc 1089a-c MM-10 102 111.9cd 2.7ab 91.1a 30.7a 1391ab MM-35 102 110.6d 1.8b 72.9a 28.7a-c 1409ab MM-37 100 111.6cd 2.4ab 72.9a 30.0ab 1449a MM-256 102 140.4a 1.6b 97.9a 25.9c 1175b MM-210 100 124.5bc 2.0b 71.1a 28.5a-c 1306ab MM-211 102 126.2b 2.0b 75.1a 28.0a-c 1306ab Binasarisha-4 99 109.7d 2.3ab 88.5a 27.1bc 1400ab
Rangpur
Binasarisha-5 99 104.7d 3.3a 102.3a 29.3ab 1426ab MM-10 97f 110.4cd 2.5ab 79.2a-c 28.9ab 1325b-d MM-35 98d 108.7cd 2.1b 69.9c 29.0a 1349bc MM-37 98d 113.6bc 2.5ab 74.1bc 28.7ab 1479a MM-256 99b 134.1a 2.3b 90.3a 26.7c 1213d MM-210 99b 117.0b 2.1b 70.2bc 27.1bc 1351bc MM-211 100a 117.2b 2.2b 71.7bc 25.9c 1260cd Binasarisha-4 95h 106.1d 2.3b 78.7a-c 27.3a-c 1400ab
Combined over four Locations
Binasarisha-5 97g 104.6d 2.9a 84.3ab 27.6a-c 1384ab 100b 117.4a 2.3b 84.4a 28.5b 1469a 93d 119.8a 2.6a 73.4b 30.3a 1461a 97c 101.1b 2.4ab 67.4b 23.3c 1093b
Location means
Mymensingh Magura Ishurdi Rangpur 101a 117.4a 2.3b 84.0a 28.5b 1358a
The common letters did not differ at 5% level of probability as per DMRT
29
BINA Annual Report 2011-12 Plant Breeding
Most of mutant lines had taller plant height than the check varieties Binasarisha-4 and Binasarisha-5 in all locations. The average number of branches ranged from 1.8-3.7, 2.1-2.9, 2.1-2.9 and 1.6-2.7 at Mymensingh, Magura, Rangpur and Ishurdi, respectively. At Mymensingh and Rangpur, MM-10 had highest number branches followed by MM-37, whereas, at Magura and Ishurdi MM-256 had the highest number of branches plant-1. At Magura, MM-256 had the significantly highest number of siliqua/plant followed by MM-210, whereas no significant difference was found at Mymensingh, Ishurdi and Rangpur. Average number of seeds siliqua-1 ranged from 25.9-30.7, 27.3-33.1, 20.1-25.7 and 25.9-30.7 at Mymensingh, Magura, Rangpur and Ishurdi, respectively. The mutant lines MM-10, MM-35 and MM-37 had the higher number of seed siliqua-1 in most of the locatrions. Significant difference for grain yield was found at Mymensingh, Ishurdi and Rangpur. At Mymensingh, MM-37 gave the highest seed yield (1666 kg ha-1) followed by MM-210 which was similar or higher than the two check varieties Binasarisha-4 and Binasarisha-5. At Magura, MM-10 gave highest seed yield (1577 kg ha-1) followed by MM-210 and MM-37. The mutant lines MM-37 and MM-35 gave the higher seed yield at Ishurdi and Rangpur locations. In combined over locations, MM-37 produced highest seed yield (1479 kg ha-1) followed by MM-210 (1351 kg ha-1) and MM-35 (1349 kg ha-1). Among four locations, the highest seed yield was obtained from Mymensingh (1469 kg ha-1) followed by Magura (1461 kg ha-1). Preliminary yield trial with m6 rapeseed mutants (B. juncea)
Fourteen M6 mutant lines of mustard (B. juncea) were put into the trial to assess their performance in respect of plant height, branches per plant, siliquae per plant, seeds per siliqua, maturity period and seed yield as compared to the check variety, BARI Sarisha-11. The trial was conducted at BINA Head Quarters, Mymensingh and in the farms of BINA sub-stations at Ishurdi and Magura. The experiment was laid out in a randomized complete block design (RCBD) with three replications. Seeds were sown on 16 November 2011 in Mymensingh, 28 October 2011 at Ishurdi. Unit plot size was 12 m2
(4 m × 3 m) keeping 30 cm row to row spacing and 6-8 cm from plant to plant within row. Recommended production packages i.e., application of recommended doses of fertilizers, weeding, thinning, irrigation, pesticide etc. were followed as and when necessary. Data were taken from 10 randomly selected plants from each plot. Maturity period was considered when 70% siliquae and plant turned into brownish color in each plot. Seed yield of each plot was recorded after harvest and then converted into kgha-1. Appropriate statistical analysis was done for comparison of means of mutants and check for each character. The results of individual location and combined over three locations for all the characters are presented in Table 21. On an average, maturity period varied from 92-108 days and MM-43 took 92 days to mature at Mymensingh which was 8-13 days earlier than BARI sarisha-11. The mutant line MM-31 produced the highest plant height (136 cm) having non-significant difference with BARI Sarisha-11 (130 cm) while MM-38, MM-39 and MM-43 produced the shortest plant height of 110 cm. The average number of branches per plant ranged from 2.4-3.2. The mutants lines MM-31 and MM-32 produced highest number of siliquae plant-1 (132). The number of seeds siliqua-1 ranged from 9.3-11.4. On an average, MM-37 (1465 kg ha-1), MM-35 (1437 kg ha-1) and MM-31 (1427 kg ha-1) produced the highest seed yield which were statistically similar yield to the check BARI Sarisha-11. Between the two locations, Ishurdi showed slightly better performance in respect of seed yield (1380 kg ha-1).
30
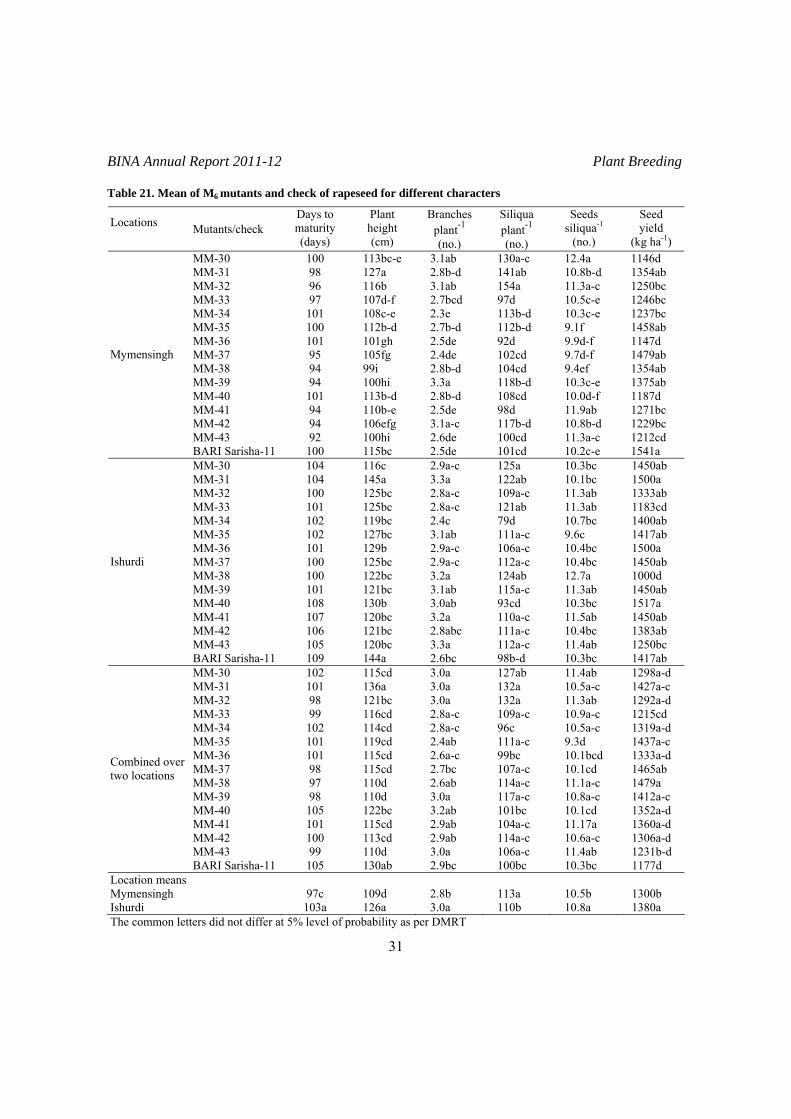
BINA Annual Report 2011-12 Plant Breeding
Table 21. Mean of M6 mutants and check of rapeseed for different characters
Locations Mutants/check
Days to maturity (days)
Plant height (cm)
Branches plant-1
(no.)
Siliqua plant-1
(no.)
Seeds siliqua-1
(no.)
Seed yield
(kg ha-1) MM-30 100 113bc-e 3.1ab 130a-c 12.4a 1146d MM-31 98 127a 2.8b-d 141ab 10.8b-d 1354ab MM-32 96 116b 3.1ab 154a 11.3a-c 1250bc MM-33 97 107d-f 2.7bcd 97d 10.5c-e 1246bc MM-34 101 108c-e 2.3e 113b-d 10.3c-e 1237bc MM-35 100 112b-d 2.7b-d 112b-d 9.1f 1458ab MM-36 101 101gh 2.5de 92d 9.9d-f 1147d MM-37 95 105fg 2.4de 102cd 9.7d-f 1479ab MM-38 94 99i 2.8b-d 104cd 9.4ef 1354ab MM-39 94 100hi 3.3a 118b-d 10.3c-e 1375ab MM-40 101 113b-d 2.8b-d 108cd 10.0d-f 1187d MM-41 94 110b-e 2.5de 98d 11.9ab 1271bc MM-42 94 106efg 3.1a-c 117b-d 10.8b-d 1229bc MM-43 92 100hi 2.6de 100cd 11.3a-c 1212cd
Mymensingh
BARI Sarisha-11 100 115bc 2.5de 101cd 10.2c-e 1541a MM-30 104 116c 2.9a-c 125a 10.3bc 1450ab MM-31 104 145a 3.3a 122ab 10.1bc 1500a MM-32 100 125bc 2.8a-c 109a-c 11.3ab 1333ab MM-33 101 125bc 2.8a-c 121ab 11.3ab 1183cd MM-34 102 119bc 2.4c 79d 10.7bc 1400ab MM-35 102 127bc 3.1ab 111a-c 9.6c 1417ab MM-36 101 129b 2.9a-c 106a-c 10.4bc 1500a MM-37 100 125bc 2.9a-c 112a-c 10.4bc 1450ab MM-38 100 122bc 3.2a 124ab 12.7a 1000d MM-39 101 121bc 3.1ab 115a-c 11.3ab 1450ab MM-40 108 130b 3.0ab 93cd 10.3bc 1517a MM-41 107 120bc 3.2a 110a-c 11.5ab 1450ab MM-42 106 121bc 2.8abc 111a-c 10.4bc 1383ab MM-43 105 120bc 3.3a 112a-c 11.4ab 1250bc
Ishurdi
BARI Sarisha-11 109 144a 2.6bc 98b-d 10.3bc 1417ab MM-30 102 115cd 3.0a 127ab 11.4ab 1298a-d MM-31 101 136a 3.0a 132a 10.5a-c 1427a-c MM-32 98 121bc 3.0a 132a 11.3ab 1292a-d MM-33 99 116cd 2.8a-c 109a-c 10.9a-c 1215cd MM-34 102 114cd 2.8a-c 96c 10.5a-c 1319a-d MM-35 101 119cd 2.4ab 111a-c 9.3d 1437a-c MM-36 101 115cd 2.6a-c 99bc 10.1bcd 1333a-d MM-37 98 115cd 2.7bc 107a-c 10.1cd 1465ab MM-38 97 110d 2.6ab 114a-c 11.1a-c 1479a MM-39 98 110d 3.0a 117a-c 10.8a-c 1412a-c MM-40 105 122bc 3.2ab 101bc 10.1cd 1352a-d MM-41 101 115cd 2.9ab 104a-c 11.17a 1360a-d MM-42 100 113cd 2.9ab 114a-c 10.6a-c 1306a-d MM-43 99 110d 3.0a 106a-c 11.4ab 1231b-d
Combined over two locations
BARI Sarisha-11 105 130ab 2.9bc 100bc 10.3bc 1177d Location means Mymensingh 97c 109d 2.8b 113a 10.5b 1300b Ishurdi 103a 126a 3.0a 110b 10.8a 1380a
The common letters did not differ at 5% level of probability as per DMRT
31

BINA Annual Report 2011-12 Plant Breeding
Preliminary yield trial with early maturing F6 (cross between Binasarisha-4 and Tori-7) rapeseed lines.
Eleven mutant lines of rapeseed cross between Binasarisha-4 and Tori-7 were put into the trial. The trial was conducted in the BINA HQ. farm, Mymensingh and in the farms of BINA sub-stations at Ishurdi. The experiment was laid out in a randomized complete block design with three replications. Seeds were sown on 15 November in BINA Head Quarters 28 October at Ishurdi and 05 November at Rangpur. Unit plot size was 12 m2
(4 m × 3 m) with 25 cm row to row spacing and 6-8 cm from plant to plant within rows. Recommended production packages i.e., application of fertilizers, weeding, thinning, irrigation, application of pesticide etc. were followed to ensure normal plant growth and development. Data on plant height, branches plant-1, siliquae plant-1 and seeds siliqua-1 were taken from 10 randomly selected plants from each plot. Maturity period was counted when 70% siliquae were matured. Seed yield of each plot was recoded after harvest and then converted into kg ha-1. Appropriate statistical analyses were performed for comparison of means of each character. Results obtained from the trial of individual location and combined over three locations for all the characters are presented in Table 22. Significant variations were observed among the mutants and check variety for some of the characters in both the locations and combined over locations. The results of individual location and combined over three locations for all the characters are presented in Table 22. On an average, maturity period of the F6 lines varied from 79-82 days which was 2-5 days earlier than Tori-7. The line RC-3 had the highest plant height (97.6 cm) having non-significant difference with Tori-7 (93.4 cm) while RC-6, RC-8 and RC-9 had the shortest plant height of 87 cm. The average number of branches per plant ranged from 3.4-4.0. The lines RC-5 and RC-9 produced highest number of siliqua plant-1 (104.6). The number of seeds siliqua-1 ranged from 14.4 -16.4. On an average, RC-4 (1189 kg ha-1), RC-5 (1183 kg ha-1) and RC-10 (1140 kg ha-1) produced the highest seed yield which were statistically similar yield of the check Tori-7. Between the three locations, Rangpur showed slightly better performance in respect of seed yield (1215 kg ha-1). Table 22. Mean of F6 rapeseed lines and check variety of mustard for different characters
Locations Mutants/ varieties
Days to maturity (days)
Plant height (cm)
Branches plant-1
(no.)
Siliquae plant-1
(no.)
Seeds siliqua-1
(no.)
Seed yield
(kg ha-1) RC-1 78 89.5cd 3.9bc 100.9ab 14.9ab 889de RC-2 78 94.6bc 3.8cd 89.7ab 13.9bc 1083b RC-3 77 100.3a 4.5a 87.5bc 12.9cd 889de RC-4 78 92.5bc 4.3ab 114.1a 12.1e 1166a RC-5 78 93.2bc 4.1ab 104.0ab 12.8cd 1278a RC-6 78 87.0e 4.2ab 111.7ab 12.3de 1083b Tori-7 83 95.3ab 3.5d 102.3ab 13.8bc 750e RC-7 78 91.5bc 3.9bc 103.9ab 15.5a 993cd RC-8 81 91.2bc 4.3ab 108.5ab 13.9bc 1111a RC-9 79 88.7de 3.9bc 109.7ab 13.2cd 805de
Ishurdi
RC-10 78 88.9de 3.8cd 96.5abc 13.5cd 1167a
32

BINA Annual Report 2011-12 Plant Breeding
Table 22 Contd.
Locations Mutants/ varieties
Days to maturity (days)
Plant height (cm)
Branches plant-1
(no.)
Siliquae plant-1
(no.)
Seeds siliqua-1
(no.)
Seed yield (kg ha-1)
RC-1 86 93.7c 2.5d 96.3cd 15.7d 1183b-d RC-2 89 97.0bc 3.1bc 110.3a-c 15.6d 1067de RC-3 86 104.0a 2.9cd 93.3cd 15.7d 1161c-e RC-4 86 100.7ab 3.0b-d 112.7a-c 16.0d 1372a RC-5 86 100.0ab 3.5ab 130.7a 15.2d 1283a-c RC-6 86 93.0c 3.7a 117.3a-c 19.2c 1216bc Tori-7 89 92.3c 3.5ab 108.7a-b 20.4ab 1283a-c RC-7 87 100.0ab 2.9cd 100.0b-d 20.9ab 1305a-c RC-8 86 93.7c 3.0b-d 87.7d 21.9ab 1022ef RC-9 87 96.7bc 3.5a-c 122.0ab 19.9bc 1394a RC-10 87 97.0bc 3.1bc 106.7a-c 21.7a 1311ab
Rangpur
RC-11 87 96.7bc 3.2a-c 102.7b-d 20.9ab 988f RC-1 74 89.7ab 3.9c 61.7bc 14.5a-c 930bc RC-2 74 88.7ab 5.0a 71.3ab 13.5bc 997bc RC-3 72 88.3ab 5.0a 72.3ab 14.7ab 725f RC-4 75 95.3a 4.2bc 73.0ab 15.6a 1028b RC-5 81 89.7ab 4.1bc 74.0ab 15.2ab 989bc RC-6 80 83.0cd 4.1bc 67.0ab 14.5ab 916b-d Tori-7 81 92.7ab 4.7ab 74.0ab 13.4bc 1222a RC-7 77 91.3ab 4.2bc 66.3a-c 15.2ab 866c-f RC-8 72 78.7de 4.2bc 50.0c 12.9cd 803df RC-9 72 76.0e 4.5ab 82.0a 14.8ab 994bc RC-10 72 84.0cd 4.3ab 59.obc 14.0ab 944b-d
Mymensingh
RC-11 74 86.0bc 4.1bc 71.3ab 12.7d 780ef RC-1 79 90.9bc 3.4b 86.3ab 15.1bc 1001b-e RC-2 80 93.4ab 4.0ab 90.4ab 14.4d 1049a-d RC-3 78 97.6a 4.2a 84.4ab 14.4d 925de RC-4 80 96.2ab 3.8ab 99.9ab 14.6cd 1189a RC-5 82 94.3ab 3.9ab 104.6ab 14.4d 1183a RC-6 81 87.7c 4.0a 98.7ab 15.3bc 1072a-d Tori-7 84 93.4ab 3.9ab 95.0ab 15.9ab 1085a-c RC-7 81 94.3ab 3.7ab 90.1ab 17.2a 1048a-d RC-8 80 87.8c 3.8ab 82.0b 16.0ab 979c-e RC-9 79 87.1c 4.0ab 104.6a 16.0ab 1064a-d RC-10 79 90.0bc 3.8ab 87.4ab 16.4ab 1140ab
Combined over three locations
RC-11 81 91.0bc 4.0ab 82.2b 15.5bc 852e Ishurdi 79 91.9ab 4.1a 100.1a 13.5b 999b Rangpur 87 97.1a 3.2b 107.4a 18.5a 1215a Location
means Mymensingh 75 86.9b 4.4a 68.5b 14.3b 933b
The common letters in a column did not differ at 5% level of probability as per DMRT.
33
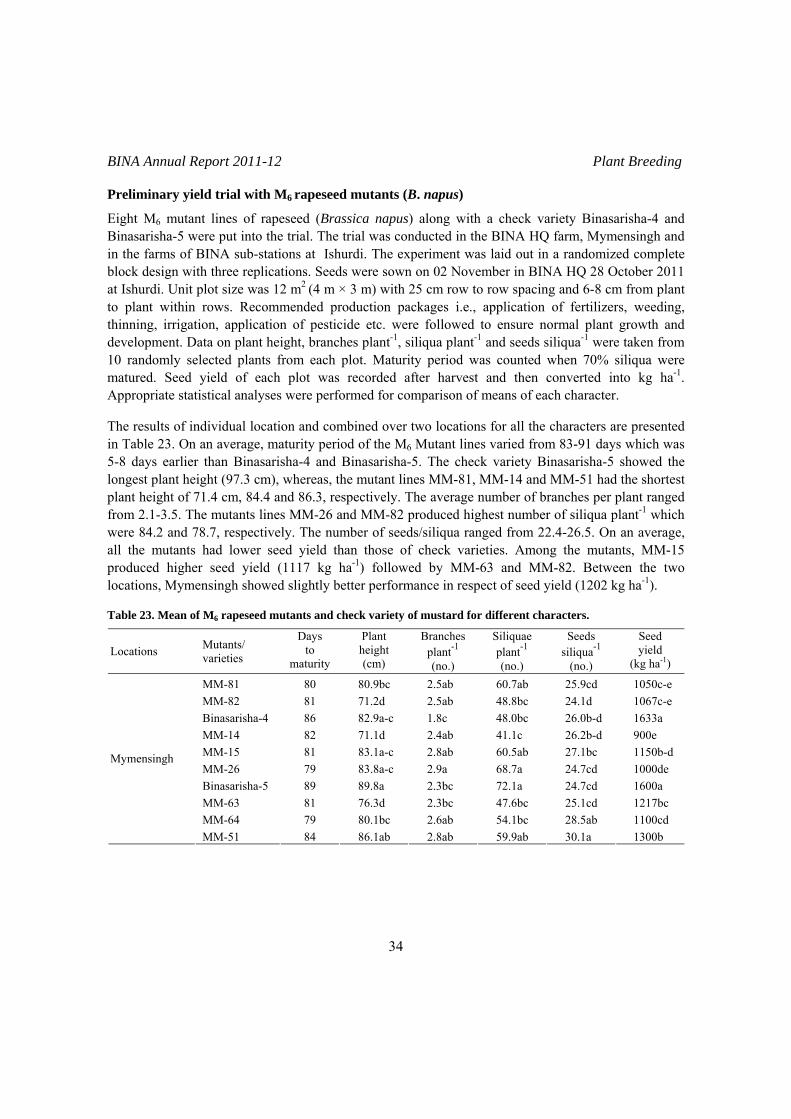
BINA Annual Report 2011-12 Plant Breeding
Preliminary yield trial with M6 rapeseed mutants (B. napus)
Eight M6 mutant lines of rapeseed (Brassica napus) along with a check variety Binasarisha-4 and Binasarisha-5 were put into the trial. The trial was conducted in the BINA HQ farm, Mymensingh and in the farms of BINA sub-stations at Ishurdi. The experiment was laid out in a randomized complete block design with three replications. Seeds were sown on 02 November in BINA HQ 28 October 2011 at Ishurdi. Unit plot size was 12 m2
(4 m × 3 m) with 25 cm row to row spacing and 6-8 cm from plant to plant within rows. Recommended production packages i.e., application of fertilizers, weeding, thinning, irrigation, application of pesticide etc. were followed to ensure normal plant growth and development. Data on plant height, branches plant-1, siliqua plant-1 and seeds siliqua-1 were taken from 10 randomly selected plants from each plot. Maturity period was counted when 70% siliqua were matured. Seed yield of each plot was recorded after harvest and then converted into kg ha-1. Appropriate statistical analyses were performed for comparison of means of each character. The results of individual location and combined over two locations for all the characters are presented in Table 23. On an average, maturity period of the M6 Mutant lines varied from 83-91 days which was 5-8 days earlier than Binasarisha-4 and Binasarisha-5. The check variety Binasarisha-5 showed the longest plant height (97.3 cm), whereas, the mutant lines MM-81, MM-14 and MM-51 had the shortest plant height of 71.4 cm, 84.4 and 86.3, respectively. The average number of branches per plant ranged from 2.1-3.5. The mutants lines MM-26 and MM-82 produced highest number of siliqua plant-1 which were 84.2 and 78.7, respectively. The number of seeds/siliqua ranged from 22.4-26.5. On an average, all the mutants had lower seed yield than those of check varieties. Among the mutants, MM-15 produced higher seed yield (1117 kg ha-1) followed by MM-63 and MM-82. Between the two locations, Mymensingh showed slightly better performance in respect of seed yield (1202 kg ha-1). Table 23. Mean of M6 rapeseed mutants and check variety of mustard for different characters.
Locations Mutants/ varieties
Days to
maturity
Plant height (cm)
Branches plant-1
(no.)
Siliquae plant-1
(no.)
Seeds siliqua-1
(no.)
Seed yield
(kg ha-1)
MM-81 80 80.9bc 2.5ab 60.7ab 25.9cd 1050c-e MM-82 81 71.2d 2.5ab 48.8bc 24.1d 1067c-e Binasarisha-4 86 82.9a-c 1.8c 48.0bc 26.0b-d 1633a MM-14 82 71.1d 2.4ab 41.1c 26.2b-d 900e MM-15 81 83.1a-c 2.8ab 60.5ab 27.1bc 1150b-d MM-26 79 83.8a-c 2.9a 68.7a 24.7cd 1000de Binasarisha-5 89 89.8a 2.3bc 72.1a 24.7cd 1600a MM-63 81 76.3d 2.3bc 47.6bc 25.1cd 1217bc MM-64 79 80.1bc 2.6ab 54.1bc 28.5ab 1100cd
Mymensingh
MM-51 84 86.1ab 2.8ab 59.9ab 30.1a 1300b
34

BINA Annual Report 2011-12 Plant Breeding
Table 4 Contd.
Locations Mutants/ varieties
Days to
maturity
Plant height (cm)
Branches plant-1
(no.)
Siliquae plant-1
(no.)
Seeds siliqua-1
(no.)
Seed yield
(kg ha-1) MM-81 88 71.4f 3.3ab 69.8bc 23.9bc 917c MM-82 85 87.9c-e 3.1bc 78.7ab 25.4ab 1000bc Binasarisha-4 91 94.0ab 2.1e 64.9b-d 25.3ab 1317a MM-14 83 84.4e 2.5de 52.2d 24.0bc 933bc MM-15 86 90.7b-d 2.9bc 70.3a-c 24.5b 1117b MM-26 88 86.9de 3.5a 84.2a 22.4c 950bc Binasarisha-5 91 97.3a 2.8cd 71.3a-c 23.9bc 1400a MM-63 87 87.7c-e 2.7cd 71.6a-c 26.5a 1000bc MM-64 83 91.7bc 2.5de 75.7ab 25.6ab 933bc
Ishurdi
MM-51 87 86.3de 2.8cd 60.9cd 25.3ab 958bc MM-81 88 71.4f 3.3ab 69.8bc 23.9bc 917c MM-82 85 87.9cd 3.1ab 78.7ab 25.4ab 1000bc Binasarisha-4 91 94.0ab 2.1e 64.9b-d 25.3ab 1317a MM-14 83 84.4e 2.5de 52.2d 24.0bc 933bc MM-15 86 90.7bc 2.9bc 70.3a-c 24.5b 1117b MM-26 88 86.9de 3.5a 84.2a 22.4c 950bc Binasarisha-5 91 97.3a 2.8cd 61.3a-c 23.9bc 1300a MM-63 87 87.7cd 2.7cd 71.6a-c 26.5a 1000bc MM-64 83 91.7bc 2.5de 75.7ab 25.6ab 933bc
Combined over two locations
MM-51 87 86.3de 2.8cd 60.9cd 25.3ab 958bc Mymensingh 82 80.5 2.5 56.2 26.2 1202 Location mean Ishurdi 87 87.8 2.8 70.0 24.7 1053
The common letters did not differ at 5% level of probability as per DMRT. Growing of M4 population
A large number of M3 variants developed from Binasarisha-4 and BARI Sarisha-11 were grown in plant progeny rows for selecting desirable mutants at BINA HQ farm, Mymensingh. From them a total of 25 lines have been selected primarily for further selection in M5 generation. Growing of F5 population
F4 population developed from the cross Binasarisha-4 and Tori-7 were grown at BINA HQ farm, Mymensingh. From them a total of 10 lines have been selected primarily for further selection in F6
generation. Maintenance of germplasm (mutants, local and exotic collection)
Forty germplasm were grown in the farms of BINA HQ farm, Mymensingh. After harvest, seeds of all these germplasm were collected and have been preserved as breeding materials.
35

BINA Annual Report 2011-12 Plant Breeding
GROUNDNUT
Advanced yield trial with two M7 mutant lines of groundnut
This experiment was performed with 2 M7 mutant lines of groundnut. Seeds were sown on 11 October 2011, at BINA sub-station farm, Ishurdi to assess performance of the mutant lines compare to their respective parents Dacca-1 and PK-1. The experiment followed RCB design with 3 replications and a unit plot size was 3.0 m × 2.70 m. Recommended doses of fertilizers were applied together with cultural and intercultural practices. Data on plant height, primary branches and mature pod plant-1 were recorded during harvest from randomly selected 10 competitive plants while pod weight plant-1, 100-pod weight, 100-kernel weight and shelling percentage were recorded after proper sun drying. Pod yield was recorded from 1.0 m2 area and converted latter to kg ha-1. Finally, the recorded data were subjected to proper statistical analyses and are presented in Table 24. Table 24. Pod yield and yield attributes of 2 M7 mutant lines of groundnut at Ishurdi during early rabi season,
2011-12
Mutants/ varieties
Plant height (cm)
Branch plant-1
( no)
Mature pods plant-1 (no.)
Pod weight plant-1
(g)
100-pod wt. (g)
Pod yield (kg ha-1)
Shelling (%)
D1/20/17-1 12.07 4.00 7.47 3.00 40.26 658.33 77.50 RS/25/3-1 11.43 4.00 8.43 2.97 35.17 652.67 83.90 Dacca-1 11.37 4.00 10.17 3.40 33.39 748.00 79.03 PK-1 11.73 4.00 7.50 2.67 35.54 586.67 78.90 LSD(0.05) NS NS 0.92 NS NS 55.58 NS
NS = Not significant
The overall performance of the mutant lines as well as the check varieties was very low, might be due to the sowing time. Presently, farmers mostly sow groundnut in the Rabi season from late December to mid February. However, the mutant lines and parents appeared indifferent in height, primary branch number, pod yield plant-1 and shelling while showed significant differences in mature pod number and pod yield ha-1. Pod number is the most important yield attributes in groundnut was the highest of all in the check variety Dacca-1. The mutant RS/25/3-1 had significantly higher pod number than its parent PK-1. Like pod number, pod yield ha-1 was once again the highest in the check variety Dacca-1 while the other check variety the lowest. The mutant RS/25/3-1although had significantly lower yield than Dacca-1 but it produced significantly higher yield than its parent PK-1. The mutant D1/20/17-1 although had indifferent pod number with the check variety PK-1 but had significantly higher pod yield ha-1 because of its higher pod size. This mutant also showed less infestation by jassid, leaf hopper and jute hairy caterpillar (data will be presented by Entomology Division). Finally, this experiment will be repeated in the coming Kharif-2 season for confirmation. Advance yield trial with some late Cercospora leaf spot tolerant lines of groundnut
This experiment was performed with 11 lines derived from crossing between late Cercospara tolerant Zhingabadam with susceptible varieties of groundnut. Seeds were sown on 11 October 2011 at BINA sub-station farm, Ishurdi. Dacca-1 and Zhingabadam were included in this experiment as check
36
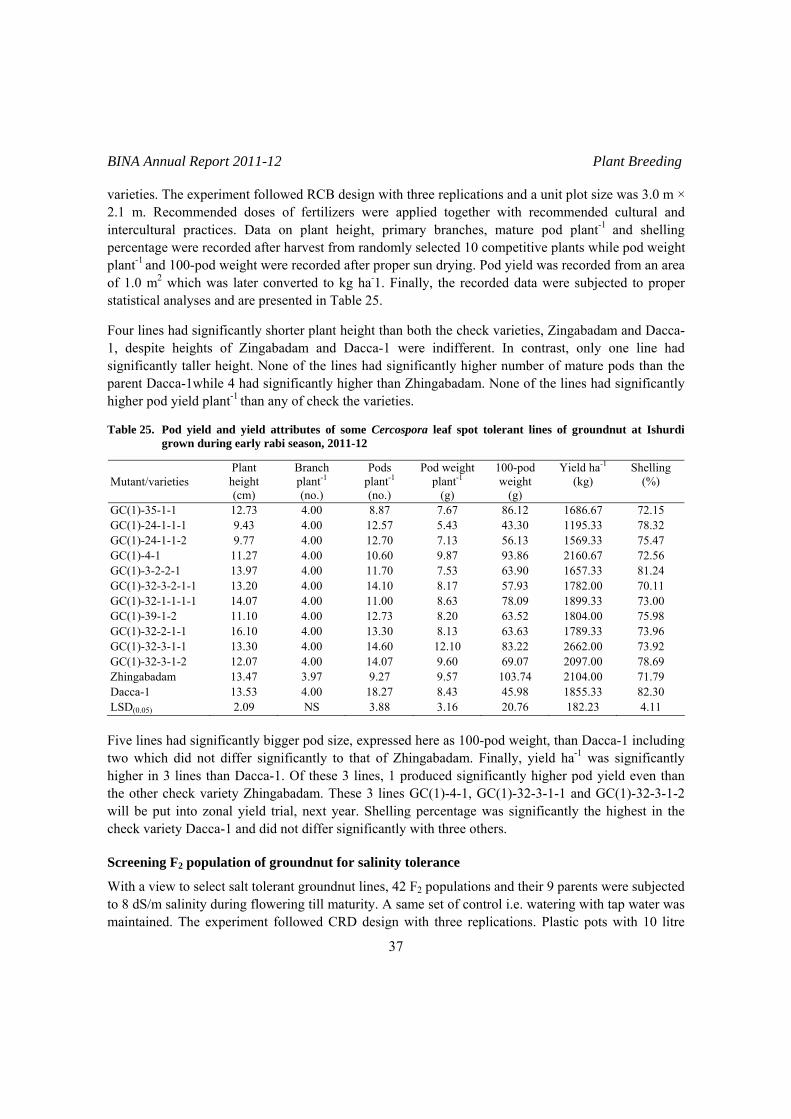
BINA Annual Report 2011-12 Plant Breeding
varieties. The experiment followed RCB design with three replications and a unit plot size was 3.0 m × 2.1 m. Recommended doses of fertilizers were applied together with recommended cultural and intercultural practices. Data on plant height, primary branches, mature pod plant-1 and shelling percentage were recorded after harvest from randomly selected 10 competitive plants while pod weight plant-1 and 100-pod weight were recorded after proper sun drying. Pod yield was recorded from an area of 1.0 m2 which was later converted to kg ha-1. Finally, the recorded data were subjected to proper statistical analyses and are presented in Table 25. Four lines had significantly shorter plant height than both the check varieties, Zingabadam and Dacca-1, despite heights of Zingabadam and Dacca-1 were indifferent. In contrast, only one line had significantly taller height. None of the lines had significantly higher number of mature pods than the parent Dacca-1while 4 had significantly higher than Zhingabadam. None of the lines had significantly higher pod yield plant-1 than any of check the varieties. Table 25. Pod yield and yield attributes of some Cercospora leaf spot tolerant lines of groundnut at Ishurdi
grown during early rabi season, 2011-12
Mutant/varieties Plant height (cm)
Branch plant-1
(no.)
Pods plant-1
(no.)
Pod weight plant-1
(g)
100-pod weight
(g)
Yield ha-1
(kg) Shelling
(%)
GC(1)-35-1-1 12.73 4.00 8.87 7.67 86.12 1686.67 72.15 GC(1)-24-1-1-1 9.43 4.00 12.57 5.43 43.30 1195.33 78.32 GC(1)-24-1-1-2 9.77 4.00 12.70 7.13 56.13 1569.33 75.47 GC(1)-4-1 11.27 4.00 10.60 9.87 93.86 2160.67 72.56 GC(1)-3-2-2-1 13.97 4.00 11.70 7.53 63.90 1657.33 81.24 GC(1)-32-3-2-1-1 13.20 4.00 14.10 8.17 57.93 1782.00 70.11 GC(1)-32-1-1-1-1 14.07 4.00 11.00 8.63 78.09 1899.33 73.00 GC(1)-39-1-2 11.10 4.00 12.73 8.20 63.52 1804.00 75.98 GC(1)-32-2-1-1 16.10 4.00 13.30 8.13 63.63 1789.33 73.96 GC(1)-32-3-1-1 13.30 4.00 14.60 12.10 83.22 2662.00 73.92 GC(1)-32-3-1-2 12.07 4.00 14.07 9.60 69.07 2097.00 78.69 Zhingabadam 13.47 3.97 9.27 9.57 103.74 2104.00 71.79 Dacca-1 13.53 4.00 18.27 8.43 45.98 1855.33 82.30 LSD(0.05) 2.09 NS 3.88 3.16 20.76 182.23 4.11 Five lines had significantly bigger pod size, expressed here as 100-pod weight, than Dacca-1 including two which did not differ significantly to that of Zhingabadam. Finally, yield ha-1 was significantly higher in 3 lines than Dacca-1. Of these 3 lines, 1 produced significantly higher pod yield even than the other check variety Zhingabadam. These 3 lines GC(1)-4-1, GC(1)-32-3-1-1 and GC(1)-32-3-1-2 will be put into zonal yield trial, next year. Shelling percentage was significantly the highest in the check variety Dacca-1 and did not differ significantly with three others. Screening F2 population of groundnut for salinity tolerance
With a view to select salt tolerant groundnut lines, 42 F2 populations and their 9 parents were subjected to 8 dS/m salinity during flowering till maturity. A same set of control i.e. watering with tap water was maintained. The experiment followed CRD design with three replications. Plastic pots with 10 litre
37

BINA Annual Report 2011-12 Plant Breeding
38
capacity were weighed and filled with 8 kg soil mixture, prepared with sandy loam soil and rotten cow dung in a 1:1 ratio. The fertilizer needed for each pot was determined following the BARC Fertilizer Recommendation Guide-2005. The total amount of nitrogen, phosphorus, potassium, sulphur and zinc were applied in the form of Urea, TSP, MP, Gypsum and Zinc sulphate. These were mixed thoroughly with the soil in each pot before sowing. Plant available water, initial moisture content, initial soil salinity and salinity development in pot soil were done following the methods used, above, in assessing salt tolerance levels of different phenological stages in wheat experiment. Seeds were sown on 18 August, 2011 and when the plants were established, only three healthy plants were kept in each pot. The pots were kept free from weeds. The plants were protected from insect pest by spraying appropriate insecticides as and when necessary. The saline water was synthesized by using mixture of different salts: 50% NaCl, 15% Na2SO4, 10% NaHCO3, CaCl2, and MgCl2 together with 5% MgSO4 so that their compositions were almost alike their average compositions in the ground water of saline areas of Bangladesh. Fifty grams of such salt was dissolved liter-1 tap water to prepare the stock solution. The salinity of the stock solution was 80 dS/m. The total amount of stock solution needed to bring the salinity of the soil mixture to 8 dS/m was estimated following the same method used, above, in assessing salt tolerance levels of different phenological stages in wheat experiment. The estimated amount of stock solution was then diluted to 8dS/m by adding tap water and then imposed during flowering till maturity at different installments so that the moisture content of the pots remained 70- 80% of plant available water (PAW). For the control, same amount of only fresh tap water was applied. Relative performance was calculated following the formula-
100conditioncontrolunder ePerformanc
condition salineunder trait a of ePerformanc×Relative performance (% of control) =
The relative performance of yield and some yield attributes as affected by 8 dS/m salinity are presented in Table 26. Relative plant height of the F2s and parents ranged 57.14 to 113.32% (Table 26). In contrast, relative number of primary branch ranged 75.00 to 200%, 39 with either 100% or more and only 12 with less than 100%. This means upon salinity stress groundnut mostly produce more branches. Unlike plant height and branch number, relative mature pod number, pod and kernel yields had comparatively lower relative performances. Mature pod number ranged 0.00 to 80.86%, pod yield 0.00 to 74.77% and kernel yield 0.00 to 76.65%. Kernel yield is the ultimate product in groundnut. Therefore, it is proper to discriminate the F2 and parents based on its relative kernel yields. The F2 and parents with 50% and above relative kernel yields could be classified as salt tolerant. In this regard, 4 parents: Binchinabadam-2, Binchinabadam-3, Binchinabadam-4 and BARI Badam-7; and the F2s: Binchinabadam-1 × Dacca-1, Binchinabadam-3 × Zhingabadam, Jx87015-SL-O1 × BARI Badam-7, Binchinabadam-4 × Binchinabadam-2 appeared tolerant. These 4 F2 populations will be further screened in F3 generation.

BINA Annual Report 2011-12 Plant Breeding
Table 26. Relative performance (% of control) of yield and yield attributes of 42 F2 population and their 9 parents at 8 dS/m salinity imposed during flowering till maturity
F2 population and parents Plant height
(%)
Primary branch number
(%)
Pod plant-1
(%)
Pops plant-1
(%)
Pod yield plant-1
(%)
Kernel yield plant-1
(%) Zhingabadam × Dacca-1 98.52 149.81 0.00 31.79 0.00 0.00 BARI Badam-7 × Dacca-1 65.45 100.00 0.00 0.00 0.00 0.00 ICGV-95063 × Dacca-1 84.54 100.00 2.02 200.00 11.64 10.10 BCB-1 × Dacca-1 69.15 100.00 36.01 424.34 74.65 71.52 BCB-2 × Dacca-1 71.41 120.12 27.27 43.62 17.32 17.50 BCB-3 × Dacca-1 71.24 110.21 8.11 69.99 24.16 22.10 BCB-4 × Dacca-1 70.76 120.12 4.55 65.19 14.19 14.65 Baribadam-7 × Zhingabadam 87.39 112.36 0.00 199.79 0.00 0.00 Jx87015-SL-O1 × Zhingabadam 74.61 150.00 10.72 59.07 23.50 23.44 ICGV-95063 × Zhingabadam 82.89 171.67 12.57 130.95 16.63 15.53 BCB-1 × Zhingabadam 57.14 110.21 0.00 86.96 0.00 0.00 BCB-2 × Zhingabadam 72.91 200.00 82.85 53.62 60.94 66.17 BCB-3 × Zhingabadam 72.62 120.12 55.41 96.46 33.09 33.36 BCB-4 × Zhingabadam 71.73 100.00 23.08 135.80 40.36 35.68 ICGV-90227 × Zhingabadam 95.63 120.12 56.45 122.17 0.00 0.00 Jx87015-SL-O1 × BARI badam-7 96.47 91.75 50.0 59.33 65.47 62.26 ICGV-95063× BARI badam-7 66.09 100.00 47.94 60.02 55.82 47.45 BCB-1 × BARI Badam-7 62.37 166.50 63.42 65.19 13.83 15.53 BCB-2 × BARI Badam-7 84.96 100.00 12.05 148.02 37.61 41.08 BCB-3 × BARI Badam-7 71.88 108.99 36.65 164.31 53.88 49.75 BCB-4 × BARI Badam-7 88.33 133.33 51.01 134.68 27.14 25.28 ICGV-90227 × BARI Badam-7 75.40 120.12 54.57 26.38 0.00 0.00 ICGV-90227 × jx87015-SL-O1 80.88 120.12 0.00 89.57 43.15 35.87 BCB-2 × Jx87015-SL-O1 82.81 85.65 22.47 172.03 55.79 50.17 BCB-3× Jx87015-SL-O1 80.22 91.75 37.11 46.70 21.19 21.77 BCB-4 × Jx87015-SL-O1 71.41 100.00 22.22 264.92 36.31 38.19 ICGV-90227 × Jx87015-SL-O1 77.49 100.00 69.20 50.09 19.44 17.55 BCB-1 × ICGV-95063 73.25 100.00 4.05 112.00 48.55 48.38 BCB-2 × ICGV-95063 76.98 100.00 80.86 185.71 64.34 49.96 BCB-3 × ICGV-95063 82.95 100.00 44.27 199.73 26.87 27.76 BCB-4 ×ICGV-95063 83.51 91.75 20.94 47.85 50.59 44.30 ICGV-90227 × ICGV-95063 88.48 91.75 76.70 87.62 50.36 49.15 BCB-42 × BCB-1 70.78 100.00 16.37 202.75 37.70 39.40 BCB-3×BCB-1 82.35 100.00 25.01 199.90 47.65 49.39 BCB-4 × BCB-1 72.54 75.00 28.41 76.32 12.28 12.33 ICGV-90227 × BCB-1 113.32 108.99 33.33 39.11 25.03 25.40 BCB-3 × BCB-2 90.11 100.00 5.36 62.21 37.84 40.62 BCB-4 × BCB-2 67.49 91.75 46.31 116.17 71.29 71.04 ICGV-90227 × BCB-2 82.35 91.75 69.49 233.00 19.78 20.58 BCB-4 × BCB-3 60.61 83.25 9.45 72.25 44.92 34.44 ICGV-90227 × BCB-3 82.95 75.00 35.12 53.86 17.84 16.71 ICGV-90227 × BCB-4 78.48 75.00 11.82 79.64 0.00 0.00 BCB-1 47.77 83.25 57.48 144.98 38.46 39.15 BCB-2 86.67 91.75 71.13 85.74 61.39 59.92 BCB-3 61.00 124.72 51.62 157.07 43.32 68.47 BCB-4 89.29 100.00 28.57 328.27 74.77 76.65 BARI Badam-7 72.62 100.00 51.20 137.52 57.40 55.65 Dacca-1 81.10 110.21 31.35 153.40 7.94 8.60 Zhingabadam 64.28 124.72 0.00 0.00 0.00 0.00 Jx87015-SL-O1 74.04 120.12 9.28 73.91 24.78 22.06 ICGV-95063 103.69 91.75 30.00 161.66 24.20 26.48 BCB = Binachinabadam
39

BINA Annual Report 2011-12 Plant Breeding
SESAME
On-station yield trial with advanced sesame mutants
The trial was conducted in the farms of BINA sub-station at Ishurdi and Magura during Kharif-I 2012. There were three advanced mutant lines and two check varieties (Binatil-2 and BARI Til-2). The mutants and check varieties were laid out in a randomized complete block design with three replications. Unit plot size was 20 m2 (4 m × 5 m) keeping 25 cm spacing between rows and 6-8 cm among the plants in a row. Seeds were sown within March 01-10, 2012. Recommended production packages like application of recommended doses of fertilizers, weeding, thinning, irrigation, application of pesticide etc. were followed to ensure normal plant growth and development. Data were taken for plant height, branches plant-1, capsules plant-1 and seeds capsule-1 from 10 randomly selected plants from each plot. Maturity period was counted when 80% capsules were matured and most of the plants turned into straw or yellowish color in each plot. Seed yield of each plot was recorded after harvest and then converted into kilogram per hectare (kg ha-1). Appropriate statistical analyses were performed for comparison of means of each character. The results of each location are presented in Table 27. The results showed significant variations for all the characters among the mutant and check varieties in both locations except for days to maturity. The tallest plant height was found in mutant line SM-058 and SM-067 in at Ishurdi and Magura, respectively. The average number of branches ranged from 2.1-3.5, where the mutant line SM10-04 had the highest number of branches. The number of capsules plant-1 was significantly higher in mutant line SM-10-04 followed by SM-067 in both locations. This line contained 3 capsules/axils, which is one of the important features of this mutant. SM-10-04 contained significantly higher number of seeds capsules-1 in all locations. The higher of capsules as well as higher number of seeds capsules-1 in SM10-04 resulted in significantly higher grain yield in both locations. The plants SM10-04 are hairy which acts as a natural barrier for aphid infestation. The mutant line SM-067 was also promising in respect of seed yield which gave higher or equal yield of two check varieties. Between the two locations, better performance in respect of seed yield was found at Magura. Application will be done to NSB for registration of these two lines as varieties. Table 27. Mean performance of sesame mutants along with check varieties for different quantitative characters
Locations Mutants/varieties Days
to maturity
Plant height (cm)
Branches plant-1
(no.)
Capsules plant-1
(no.)
Seeds capsule-1
(no.)
Seed yield
(kg ha-1) SM-10-04 90 92.8 3.5 87.5 67.3 1450 SM-058 95 95.2 3.3 72.9 63.3 1360 SM-067 92 90.2 2.9 70.2 65.2 1260 Binatil-2 (check) 91 87.2 3.4 61.3 61.5 1270 BARI Til-2 (check) 93 90.3 3.5 71.5 58.3 1280
Ishurdi
LSD NS 4.955 0.704 12.75 4.127 122.8 SM-10-04 86 107.3 2.3 69.3 76.3 1560 SM-058 92 108.3 2.5 63.6 68.6 1460 SM-067 91 113.4 2.1 61.3 66.3 1420 Binatil-2 (check) 90 104.2 3.0 55.6 68.6 1275
Magura
BARI Til-2 (check) 89 111.3 3.1 54.3 63.3 1325 LSD NS 5.783 0.848 10.92 4.682 176.1
40

BINA Annual Report 2011-12 Plant Breeding
Advanced yield trial with promising sesame mutants
The trial was conducted in the farms of BINA sub-station at Ishurdi and Magura during Kharif-I 2012. There were three advanced mutant lines and two check varieties (Binatil-2 and BARI Til-2). The mutants and check varieties were laid out in a randomized complete block design with three replications. Unit plot size was 20 m2 (4 m × 5 m) keeping 25 cm spacing between rows and 6-8 cm among the plants in a row. Seeds were sown within March 01-10, 2012. Recommended production packages like application of recommended doses of fertilizers, weeding, thinning, irrigation, application of pesticide etc. were followed to ensure normal plant growth and development. Data were taken for plant height, branches plant-1, capsules plant-1 and seeds capsule-1 from 10 randomly selected plants from each plot. Maturity period was counted when 80% capsules were matured and most of the plants turned into straw or yellowish color in each plot. Seed yield of each plot was recorded after harvest and then converted into kilogram per hectare (kg ha-1). Appropriate statistical analyses were performed for comparison of means of each character. The results are presented in Table 28. The results showed significant variations for all the characters among the mutant and check varieties in each location except for days to maturity. The average plant height ranged from 79-97 cm and 75-107 cm in at Ishurdi and Magura, respectively. Among the four mutants, SM-09 found to the tallest. The mutant line SM-09 had the highest number of branches plant-1 as compared with unicum variety Binatil-1 and BARI Til-2 in both locations. The number of capsules plant-1 ranged from 59-70 and 37-52 in at Ishurdi and Magura, respectively. Significantly higher number of seeds capsules-1 was found in mutant line SM-white (white seed coat) followed by check Binatil-2. The mutant lines SM-09 and SM-08 were found to be promising in respect of seed yield in both locations. The mutant line SM-09 gave highest seed yield followed by SM-08. These lines will be further evaluated in different locations of the country. Table 28. Mean performance of sesame mutants along with check varieties for different quantitative characters
Locations Mutants/varieties Days
to maturity
Plant height (cm)
Branches plant-1
(no.)
Capsules plant-1
(no.)
Seeds capsule-1
(no.)
Seed yield
(kg ha-1) SM-white 90 79.3 1.2 59.3 73.1 1050 SM-black 95 76.3 1.2 61.3 69.3 1090 SM-8 89 88.4 3.3 70.2 59.2 1210 SM-9 91 97.2 3.7 70.6 63.5 1290 Binatil-1 (check) 93 95.2 0.0 36.3 72.2 1260 BARI Til-2 (check) 95 96.4 2.9 77.2 59.3 1285
Ishurdi
LSD NS 6.955 0.704 13.75 6.127 122.8 SM-white 87 82.6 1.2 48.3 85.3 1130 SM-black 85 75.3 1.3 37.3 75.2 1160 SM-8 90 106.3 2.3 52.2 77.3 1350 SM-9 89 107.3 3.1 50.3 76.2 1380 Binatil-1 (check) 90 98.2 0.0 32.6 83.2 1270 BARI Til-2 (check) 93 105.6 2.6 54.6 69.2 1290
Magura
LSD NS 8.783 0.848 11.92 7.682 176.1
41

BINA Annual Report 2011-12 Plant Breeding
SOYBEAN
Zonal yield trial of promising soybean lines during rabi
Three promising soybean lines along with two check varieties were put into zonal yield trials during rabi 2012. The experiment was conducted in the BINA HQ farm, Mymensingh and BINA sub-stations at Magura and Rangpur. The experiment was laid out in randomized complete block design with three replications. Sowing was done within January 01-15, 2012. Spacing between rows was 30 cm and 5-7 cm between plants in a row. Unit plot size was 24 m2 (5 m × 4.8 m). Research management i.e., packages of recommended managements were followed. Data on various characters, such as plant height, number of branches plant-1, pods plant-1 and seeds pod-1 were taken from 10 randomly selected plants from each plot. Maturity period was counted when the plant and pods of each plot turned into yellowish brown color and almost all the leaves shed. Seed yield of each plot was recorded after sun drying of seeds and then converted into kg ha-1. Data recorded from the experiment were analyzed following appropriate statistical design. Location-wise mean values over two locations for different characters of the lines and the check varieties are presented in Table 29. Significant variations were observed among the lines and check varieties for all of the characters except for days to maturity in at Mymensingh and Magura. At Mymensingh and Magura all the lines matured within the range of 124-128 days, whereas, it took longer days to maturity (one week) in at Rangpur. The line BAU-S/70 had the longest average plant height and showed significant difference with AVRDC-78 and AVRDC-73. The line AVRDC-78 had Table 29. Mean performance of soybean lines along with check varieties for different quantitative characters
Genotype Days to maturity
Plant height (cm)
Branches plant-1
(no.) Pods plant-1
(no.) Seeds pod-1
(no.) Seed yield (kg ha-1)
Mymensingh BAU-S/70 124 102.6 3.2 63.4 2.1 3370 AVRDC-78 124 55.2 3.5 50.3 1.9 3220 AVRDC-73 126 79.3 3.8 45.3 2.1 3330 Binasoybean-1 (check) 124 82.2 3.1 53.3 1.9 3160 BARI Soybean-6 (check) 126 70.2 4.1 66.6 2.1 3050 LSD0.05 NS 12.78 0.60 13.42 0.36 436.6 Magura BAU-S/70 127 77.3 1.2 56.3 2.1 2150 AVRDC-78 126 32.2 3.5 52.3 2.3 1820 AVRDC-73 128 56.6 3.6 43.3 2.1 1810 Binasoybean-1 (check) 129 87.3 2.4 54.2 1.9 2110 BARI Soybean-6 (check) 126 56.3 2.2 52.4 1.7 1850 LSD0.05 NS 12.81 1.45 10.08 0.40 269.5 Rangpur BAU-S/70 132 90.3 1.9 89.3 2.2 2280 AVRDC-78 132 37.4 3.3 56.3 2.1 2175 AVRDC-73 126 47.9 2.4 51.6 2.2 1820 Binasoybean-1 (check) 130 53.6 2.1 74.2 1.8 2180 BARI Soybean-6 (check) 125 52.3 2.2 60.3 1.9 1920 LSD0.05 1.68 11.31 0.91 18.37 0.41 190.2
42

BINA Annual Report 2011-12 Plant Breeding
the shortest plant height in all locations. The number pods plant-1 was higher in BAU-S/70 in all locations. In all locations, BAU-S/870 produced the average highest seed yield in all locations followed by AVRDC-73 in at Mymensingh and AVRDC-78 in at Magura and Rangpur. Application will be done to NSB for registration of the lines BAU-S/70 as variety. Advanced yield trial of promising soybean mutants during rabi
Seven mutant lines with three check varieties (Binasoybean-1 and BARI Soybean-5 for Mymensingh and Magura; Binasoybean-1 and Binasoybean-2 for Noakhali) were put into advanced yield trial during rabi 2012. The experiment was conducted in the farms of BINA HQ farm, Mymensingh, BINA sub-station at Magura and in farmer’s field at Noakhali. The experiment was laid out in randomized complete block design with three replications. Sowing was done within first week of January 2012. Spacing between rows was 30 cm and 5-7 cm between plants in a row. Unit plot size was 12 m2 (4 m × 3 m). Research management i.e., packages of recommended managements were followed to ensure normal growth and development of plants. Data on various characters, such as plant height, number of branches plant-1, pods plant-1 and seeds pod-1 were taken from 10 randomly selected plants from each plot. Maturity period was counted when the plant and pods of each plot turned into yellowish brown color and almost all the leaves shed. Seed yield of each plot was recorded after sun drying of seeds and then converted into kg ha-1. Data recorded from the experiment were analyzed following appropriate statistical design. Location-wise mean values over two locations for different characters of the lines and the check varieties are presented in Table 30. Significant variations were observed for all the characters in all locations. Among the mutants, average days to maturity ranged from 106-109 days, 116-123 days and 135-138 days in at Mymensingh, Magura and Noakhali, respectively. It indicated that, at Noakhali all the mutant lines as well as check varieties had prolonged days to maturity, which eventually reflected significantly higher grain yield in this location. Plant height ranged from 39-96 cm, 64-82 cm and 63-90 cm in at Mymensingh, Magura and Noakhali, respectively. Higher number of branches plant-1 in all mutant lines as well as check was found in at Noakhali. The average number of pods plant-1 in the mutant lines ranged from 1.82-2.32. The highest number of pods plant-1 was found in mutant lines SBM-17, SBM-20 and SBM-09 in at Mymensingh, Magura and Naokhali, respectively. At Mymensingh, the mutant line SBM-18 produced the highest seed yield (3080 kg ha-1) followed by SBM-22 and SBM-09. Similarly, SBM-18 gave the highest grain yield followed by SBM-20 in at Magura, whereas, the mutant line SBM-22 produced highest seed yield followed by SBM-09 and SBM-18. Among the locations, all mutants as well as check varieties gave the highest seed yield at Noakhali area, which is considered one of the soybean growing belts in Bangladesh. Among mutant lines, some of the better mutants will be selected on the basis of yield and yield contributed characters for further trials.
43

BINA Annual Report 2011-12 Plant Breeding
Table 30. Mean performance of soybean mutants along with check varieties for different quantitative characters
Mutants and mothers Days to maturity
Plant height (cm)
Branches plant-1
(no.) Pods plant-1
(no.) Seeds pod-1
(no.) Seed yield (kg ha-1)
Mymensingh SBM-09 106 84.3 2.2 58.2 1.97 2830 SBM-15 106 96.2 2.1 45.3 1.87 2790 SBM-17 106 88.3 2.1 59.6 1.94 2230 SBM-18 106 86.2 2.3 43.3 1.91 3080 SBM-20 108 94.3 2.5 48.1 1.82 2830 SBM-22 109 39.5 2.3 45.3 1.94 2840 SBM-23 108 86.2 2.8 46.3 1.91 2420 Binasoybean-1 (check) 113 81.6 1.9 42.6 2.18 2780 BARI Soybean-5 (check) 121 50.9 3.4 52.3 1.60 2580 LSD0.05 4.27 12.27 0.95 7.95 0.54 417.1 Magura SBM-09 118 67.3 2.4 60.1 1.82 2380 SBM-15 116 74.2 2.3 52.2 1.99 2040 SBM-17 120 64.3 2.6 56.1 1.82 2030 SBM-18 120 67.3 2.1 59.3 2.10 2510 SBM-20 120 82.3 2.2 60.2 1.96 2450 SBM-22 123 77.8 2.1 56.3 1.95 2390 SBM-23 120 69.2 2.9 55.6 2.05 2230 Binasoybean-1 (check) 130 91.2 2.1 55.3 2.12 2210 BARI Soybean-5 (check) 122 66.3 3.4 85.3 1.89 2090 LSD0.05 4.32 10.45 0.94 12.63 0.31 371.8 Noakhali SBM-09 135 63.1 4.5 61.8 1.85 3160 SBM-15 136 81.6 2.6 41.6 1.86 3010 SBM-17 138 63.6 3.6 51.6 1.85 2960 SBM-18 136 67.3 3.4 45.2 2.20 3160 SBM-20 136 90.3 3.8 54.2 2.10 2910 SBM-22 136 81.2 3.2 48.8 2.32 3250 SBM-23 138 69.2 3.3 52.3 1.89 3080 Binasoybean-1 (check) 141 96.3 2.9 40.6 2.10 2960 Binasoybean-2 (check) 138 35.8 4.1 35.8 2.10 2590 LSD0.05 2.31 16.40 0.654 8.54 0.32 460.0
44
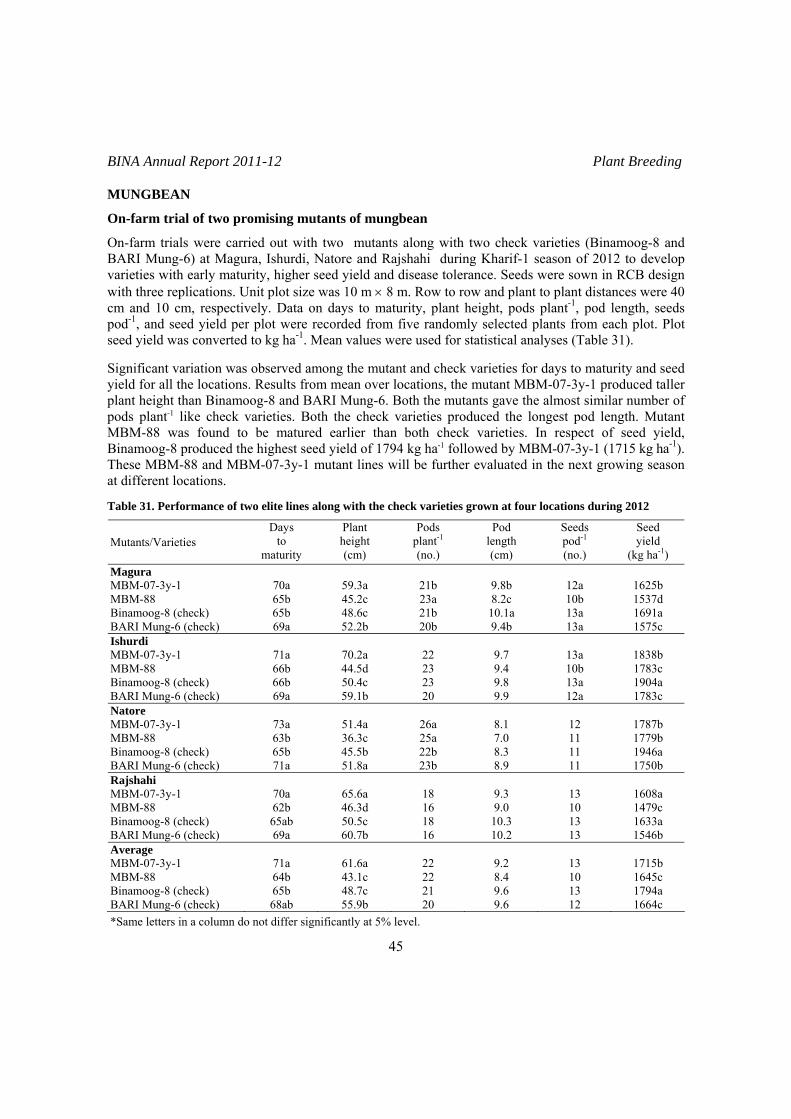
BINA Annual Report 2011-12 Plant Breeding
MUNGBEAN
On-farm trial of two promising mutants of mungbean
On-farm trials were carried out with two mutants along with two check varieties (Binamoog-8 and BARI Mung-6) at Magura, Ishurdi, Natore and Rajshahi during Kharif-1 season of 2012 to develop varieties with early maturity, higher seed yield and disease tolerance. Seeds were sown in RCB design with three replications. Unit plot size was 10 m × 8 m. Row to row and plant to plant distances were 40 cm and 10 cm, respectively. Data on days to maturity, plant height, pods plant-1, pod length, seeds pod-1, and seed yield per plot were recorded from five randomly selected plants from each plot. Plot seed yield was converted to kg ha-1. Mean values were used for statistical analyses (Table 31). Significant variation was observed among the mutant and check varieties for days to maturity and seed yield for all the locations. Results from mean over locations, the mutant MBM-07-3y-1 produced taller plant height than Binamoog-8 and BARI Mung-6. Both the mutants gave the almost similar number of pods plant-1 like check varieties. Both the check varieties produced the longest pod length. Mutant MBM-88 was found to be matured earlier than both check varieties. In respect of seed yield, Binamoog-8 produced the highest seed yield of 1794 kg ha-1 followed by MBM-07-3y-1 (1715 kg ha-1). These MBM-88 and MBM-07-3y-1 mutant lines will be further evaluated in the next growing season at different locations. Table 31. Performance of two elite lines along with the check varieties grown at four locations during 2012
Mutants/Varieties Days
to maturity
Plant height (cm)
Pods plant-1
(no.)
Pod length (cm)
Seeds pod-1
(no.)
Seed yield
(kg ha-1) Magura MBM-07-3y-1 70a 59.3a 21b 9.8b 12a 1625b MBM-88 65b 45.2c 23a 8.2c 10b 1537d Binamoog-8 (check) 65b 48.6c 21b 10.1a 13a 1691a BARI Mung-6 (check) 69a 52.2b 20b 9.4b 13a 1575c Ishurdi MBM-07-3y-1 71a 70.2a 22 9.7 13a 1838b MBM-88 66b 44.5d 23 9.4 10b 1783c Binamoog-8 (check) 66b 50.4c 23 9.8 13a 1904a BARI Mung-6 (check) 69a 59.1b 20 9.9 12a 1783c Natore MBM-07-3y-1 73a 51.4a 26a 8.1 12 1787b MBM-88 63b 36.3c 25a 7.0 11 1779b Binamoog-8 (check) 65b 45.5b 22b 8.3 11 1946a BARI Mung-6 (check) 71a 51.8a 23b 8.9 11 1750b Rajshahi MBM-07-3y-1 70a 65.6a 18 9.3 13 1608a MBM-88 62b 46.3d 16 9.0 10 1479c Binamoog-8 (check) 65ab 50.5c 18 10.3 13 1633a BARI Mung-6 (check) 69a 60.7b 16 10.2 13 1546b Average MBM-07-3y-1 71a 61.6a 22 9.2 13 1715b MBM-88 64b 43.1c 22 8.4 10 1645c Binamoog-8 (check) 65b 48.7c 21 9.6 13 1794a BARI Mung-6 (check) 68ab 55.9b 20 9.6 12 1664c
*Same letters in a column do not differ significantly at 5% level.
45
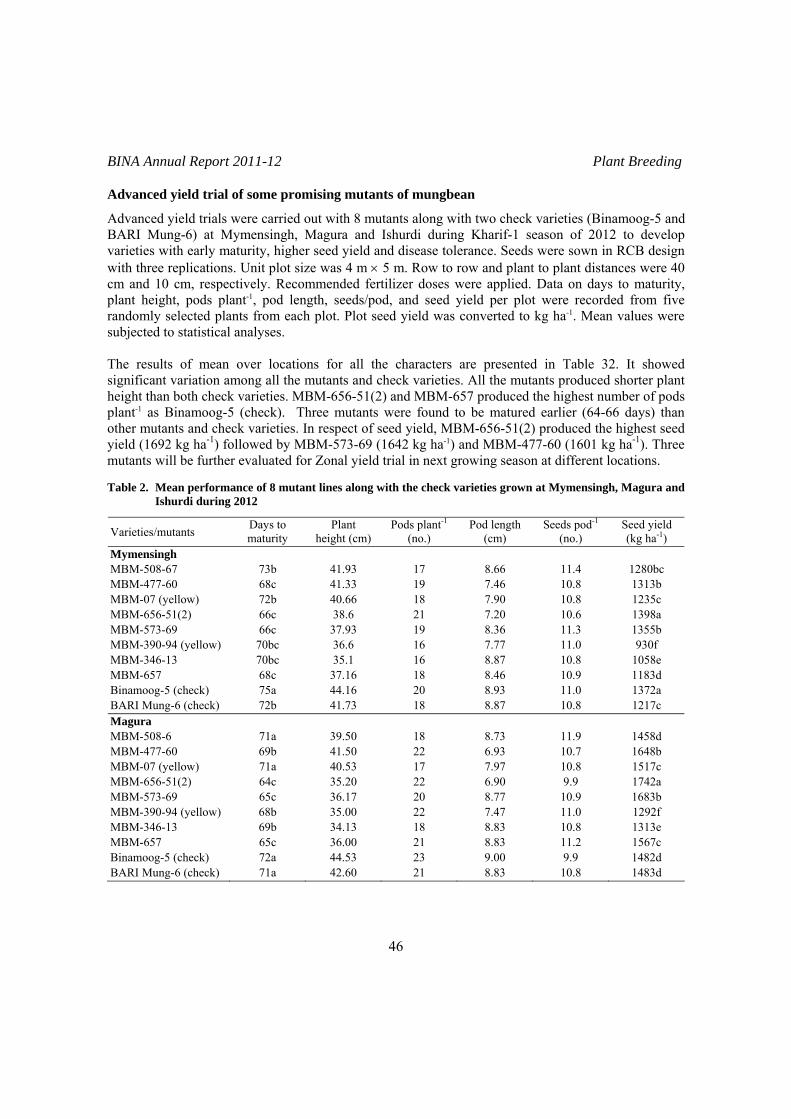
BINA Annual Report 2011-12 Plant Breeding
Advanced yield trial of some promising mutants of mungbean
Advanced yield trials were carried out with 8 mutants along with two check varieties (Binamoog-5 and BARI Mung-6) at Mymensingh, Magura and Ishurdi during Kharif-1 season of 2012 to develop varieties with early maturity, higher seed yield and disease tolerance. Seeds were sown in RCB design with three replications. Unit plot size was 4 m × 5 m. Row to row and plant to plant distances were 40 cm and 10 cm, respectively. Recommended fertilizer doses were applied. Data on days to maturity, plant height, pods plant-1, pod length, seeds/pod, and seed yield per plot were recorded from five randomly selected plants from each plot. Plot seed yield was converted to kg ha-1. Mean values were subjected to statistical analyses. The results of mean over locations for all the characters are presented in Table 32. It showed significant variation among all the mutants and check varieties. All the mutants produced shorter plant height than both check varieties. MBM-656-51(2) and MBM-657 produced the highest number of pods plant-1 as Binamoog-5 (check). Three mutants were found to be matured earlier (64-66 days) than other mutants and check varieties. In respect of seed yield, MBM-656-51(2) produced the highest seed yield (1692 kg ha-1) followed by MBM-573-69 (1642 kg ha-1) and MBM-477-60 (1601 kg ha-1). Three mutants will be further evaluated for Zonal yield trial in next growing season at different locations. Table 2. Mean performance of 8 mutant lines along with the check varieties grown at Mymensingh, Magura and
Ishurdi during 2012
Varieties/mutants Days to maturity
Plant height (cm)
Pods plant-1(no.)
Pod length (cm)
Seeds pod-1
(no.) Seed yield (kg ha-1)
Mymensingh MBM-508-67 73b 41.93 17 8.66 11.4 1280bc MBM-477-60 68c 41.33 19 7.46 10.8 1313b MBM-07 (yellow) 72b 40.66 18 7.90 10.8 1235c MBM-656-51(2) 66c 38.6 21 7.20 10.6 1398a MBM-573-69 66c 37.93 19 8.36 11.3 1355b MBM-390-94 (yellow) 70bc 36.6 16 7.77 11.0 930f MBM-346-13 70bc 35.1 16 8.87 10.8 1058e MBM-657 68c 37.16 18 8.46 10.9 1183d Binamoog-5 (check) 75a 44.16 20 8.93 11.0 1372a BARI Mung-6 (check) 72b 41.73 18 8.87 10.8 1217c Magura MBM-508-6 71a 39.50 18 8.73 11.9 1458d MBM-477-60 69b 41.50 22 6.93 10.7 1648b MBM-07 (yellow) 71a 40.53 17 7.97 10.8 1517c MBM-656-51(2) 64c 35.20 22 6.90 9.9 1742a MBM-573-69 65c 36.17 20 8.77 10.9 1683b MBM-390-94 (yellow) 68b 35.00 22 7.47 11.0 1292f MBM-346-13 69b 34.13 18 8.83 10.8 1313e MBM-657 65c 36.00 21 8.83 11.2 1567c Binamoog-5 (check) 72a 44.53 23 9.00 9.9 1482d BARI Mung-6 (check) 71a 42.60 21 8.83 10.8 1483d
46

BINA Annual Report 2011-12 Plant Breeding
Table 32 Contd.
Varieties/mutants Days to maturity
Plant height (cm)
Pods plant-1(no.)
Pod length (cm)
Seeds pod-1
(no.) Seed yield (kg ha-1)
Ishurdi MBM-508-67 72a 39.93 20 9.07 12.2 1602e MBM-477-60 68b 44.27 25 6.77 11.1 1840b MBM-07 (yellow) 74a 41.07 25 8.27 10.8 1620d MBM-656-51(2) 63c 34.93 27 6.77 9.8 1935a MBM-573-69 66bc 34.00 23 8.90 10.7 1888b MBM-390-94 (yellow) 67bc 34.20 25 7.60 10.9 1738c MBM-346-13 70b 34.60 22 9.23 10.7 1635d MBM-657 65 34.53 29 9.23 11.0 1862b Binamoog-5 (check) 75a 41.33 25 9.03 9.9 1790c BARI Mung-6 (check) 73a 40.73 24 8.33 10.1 1620e Average MBM-508-67 72a 40.46 18 8.82 11.8 1447d MBM-477-60 68b 42.37 22 7.06 10.8 1601b MBM-07 (yellow) 72a 40.76 20 8.04 10.8 1457d MBM-656-51(2) 64c 36.24 23 6.96 10.1 1692a MBM-573-69 66c 36.03 21 8.68 11.0 1642a MBM-390-94 (yellow) 68b 35.27 21 7.61 11.0 1320e MBM-346-13 70b 34.61 19 8.98 10.8 1336e MBM-657 66c 35.90 23 8.84 11.0 1537c Binamoog-5 (check) 74a 43.34 23 8.99 10.3 1548c BARI Mung-6 (check) 72a 41.69 21 8.68 10.6 1440d Growing of M3 population of mungbean
M3 variants developed from Binamoog-5 and BARI Mung-6 and all the variants were grown in plant- progeny-rows for selecting desirable mutants at Ishurdi sub-station farm during 2012. A total of 34 plants/lines have been selected for further selection in M4 generation (Table 33). Table 33. Mean performance of 34 mutant lines along with the check varieties grown at Ishurdi during 2012
Varieties/mutants Days
to maturity
Plant height (cm)
Pods plant-1
(no.)
Pod length (cm)
Seeds pod-1
(no.)
100-seed wt. (g)
Seed yield plant-1
(g) MBM-104-21 65 37.2 18 9.2 12 4.2 6.8 MBM-320-13(1) 72 39.4 16 7.8 11 3.9 7.0 MBM-94-3 71 56.1 15 8.0 11 3.2 5.4 MBM-110-12(5) 66 35.4 20 8.5 11 3.8 7.2 MBM-39-28 68 39.0 20 7.3 10 4.1 8.2 MBM-38-7(2) 67 36.7 18 7.8 11 3.4 5.8 MBM-90-3(1) 70 39.1 18 5.9 9 3.6 6.8 MBM-21-4(3) 71 35.5 23 7.3 11 4.1 7.8 MBM-74-14 70 40.1 20 7.0 10 3.3 5.8 MBM-527-114 73 40.3 18 8.0 11 4.5 5.8 MBM-427-37(3) 65 38.0 17 6.5 10 4.0 5.0 MBM-590-93 66 33.8 20 7.0 11 4.0 7.5 MBM-L-4(3) 68 38.6 15 6.7 11 4.8 7.0 MBM-28(1) 70 37.2 10 6.8 10 4.3 4.1 MBM-49-3(1) 70 57.1 20 7.1 10 4.0 8.0
47

BINA Annual Report 2011-12 Plant Breeding
Table 33 Contd.
Varieties/mutants Days to maturity
Plant height(cm)
Pods plant-1(no.)
Pod length(cm)
Seeds pod-1
(no.) 100-seed wt.
(g) Seed yield plant-1 (g)
MBM-280-10 68 40.0 9 8.2 11 3.7 5.6 MBM-62-18 65 35.9 18 7.2 11 4.8 6.0 MBM-72-51(4) 68 40.5 11 7.3 10 4.1 7.5 MBM-201-3(1) 72 35.3 11 8.5 11 3.5 5.3 MBM-64-11(7) 70 38.5 23 7.8 11 4.0 6.9 MBM-84-9 68 41.2 18 9.0 12 4.0 8.0 MBM-79-11 65 35.9 22 7.5 10 4.3 4.8 MBM-87-7 71 38.5 22 8.1 11 4.5 8.0 MBM-108-12 66 35.6 12 8.0 11 4.7 4.7 MBM-234-1(3) 68 38.8 20 7.3 11 3.8 7.5 MBM-215-18(3) 67 39.2 13 9.0 12 3.5 5.0 MBM-234-18(7) 67 35.6 15 7.6 11 3.3 7.0 MBM-187-4(3) 67 39.5 15 6.5 11 4.8 5.5 MBM-201-6(5) 67 38.1 19 9.2 12 3.5 6.8 MBM-230-16 68 40.0 16 7.5 11 3.1 8.2 MBM-220-5(3) 68 41.6 20 8.5 11 3.5 7.5 MBM-175-13(1) 70 40.8 11 8.0 11 3.1 5.0 MBM-180-4(1) 70 38.9 18 9.5 12 3.6 7.1 MBM-39-4(1) 68 37.4 19 7.8 11 3.8 7.8 Binamoog-5 (check) 70 45.3 20 8.7 12 4.0 7.4 BARI Mung-6 (check) 69 41.2 18 8.8 12 4.2 7.3 Maintenance of germplasm lines of mungbean
Fifteen AVRDC germplasm were grown in the farm of BINA Head Quarters, Farm during 2012. Data on plant height, days to 50% flowering, days to maturity, pod length, number of pods plant-1, number of seeds pod-1 and seed yield plant-1 were recorded from each genotypes (Table 34). At harvest, seeds of all these germplasm were collected and have been preserved as breeding materials for further evaluation. Table 34. Agronomic performances of 15 mungbean germplasm of AVRDC
Germplasm Plant height (cm)
Days to 50%
flowering
Days to
maturity
Pod length (cm)
pods plant-1
(no.)
seeds pod-1
(no.)
100-seed weight
(g)
Seed yield-1
plant (g)
AVRDC 01 45.0 43 72 9.20 22 10.0 3.5 5.30 AVRDC 02 37.2 45 72 8.20 17 10.8 5.1 4.47 AVRDC 03 32.0 46 79 7.60 19 7.4 4.4 2.26 AVRDC 04 37.0 45 75 9.60 17 11.6 6.2 3.03 AVRDC 05 39.6 44 74 6.20 19 10.2 4.3 5.84 AVRDC 06 48.4 42 66 10.60 17 9.4 4.3 5.60 AVRDC 07 36.8 43 71 6.20 22 10.4 5.5 4.04 AVRDC 08 32.2 47 78 6.00 16 8.8 3.5 4.03 AVRDC 09 37.2 42 67 8.80 18 9.2 3.5 5.60 AVRDC 10 32.4 45 78 6.80 14 6.1 3.6 2.23 AVRDC 11 36.8 40 65 6.60 18 8.8 5.1 5.52 AVRDC 12 35.6 45 70 6.40 19 7.0 4.4 5.30 AVRDC 13 30.2 43 70 5.40 21 6.2 2.8 5.85 AVRDC 14 34.4 40 68 5.60 12 6.8 4.8 3.90 AVRDC 15 39.4 42 70 6.60 11 7.2 3.3 4.82
48

BINA Annual Report 2011-12 Plant Breeding
CHICKPEA
On-farm trial of two promising mutant lines of chickpea
Two chickpea genotypes along with two check varieties (BARI sola-5 and Binasola-4) were grown in zonal yield trial at Nachole, Rajshahi, Ishurdi and Magura during 2011-2012. The main objective of this trial was to develop variety having large seed size and higher seed yield. The experiment was conducted in randomized complete block design with three replications. Unit plot size was 10 m × 8 m. Row to row and plant to plant distances were 40 and 15 cm, respectively. Data on plant height, days to maturity, plant height, primary branches, number of pods plant-1, number of seeds pod-1, 100-seed weight and seed yield were recorded. Data were analysed statistically (Table 35). Table 35. Performance of two mutants along with 2 check varieties of chickpea for different characters during
2011-2012
Variety Days
to maturity
Plant height (cm)
Primary branches plant-1
Pods plant-1 (no.)
Seeds pod-1
(no.)
100-seed weight
(g)
Seed yield
(kg ha-1) Nachole P-70 119 60.5 3.4 49.9 1.1 24.2 1943 CPM-860 120 54.1 3.4 45.6 1.2 23.8 2073 BARI Sola-5 (check) 121 51.6 3.4 59.9 1.4 12.0 1562 Binasola-4 (check) 121 54.6 3.4 53.6 1.3 12.7 1570 LSD(0.05) 0.98 2.52 2.11 12.20 0.78 0.97 158 Rajshahi P-70 120 72.6 3.8 83.0 1.0 25.9 2067 CPM-860 123 68.7 3.2 59.6 1.4 25.1 2185 BARI Sola-5 (check) 122 61.4 3.3 90.3 1.6 12.8 1685 Binasola-4 (check) 120 60.1 3.0 68.8 1.8 13.3 1615 LSD(0.05) 0.34 3.56 1.21 10.79 0.96 0.89 136 Ishurdi P-70 117 41.8 4.7 37.4 1.4 25.2 1791 CPM-860 115 43.3 3.8 31.8 1.1 24.0 1655 BARI Sola-5 (check) 121 37.2 4.6 56.0 1.5 12.7 1562 Binasola-4 (check) 118 37.4 4.1 39.9 1.6 12.4 1545 LSD (0.05) 0.25 3.66 0.88 4.22 0.53 0.81 123 Magura P-70 122 59.4 4.4 75.5 1.2 25.4 1955 CPM-860 120 55.8 4.0 68.1 1.1 25.0 1985 BARI Sola-5 (check) 120 49.0 4.2 84.0 1.4 12.9 1625 Binasola-4 (check) 121 51.8 4.2 59.8 1.1 13.3 1690 LSD(0.05) 2.62 7.17 1.73 11.21 0.31 0.57 129 Average P-70 119 58.5 4.0 61.4 1.1 25.2 1939 CPM-860 119 55.5 3.6 51.3 1.5 24.5 1974 BARI Sola-5 (check) 121 49.8 3.9 72.5 1.5 12.6 1608 Binasola-4 (check) 120 51 3.6 55.5 1.5 12.9 1605 LSD(0.05) 0.82 4.62 1.27 10.76 0.94 0.79 118
49
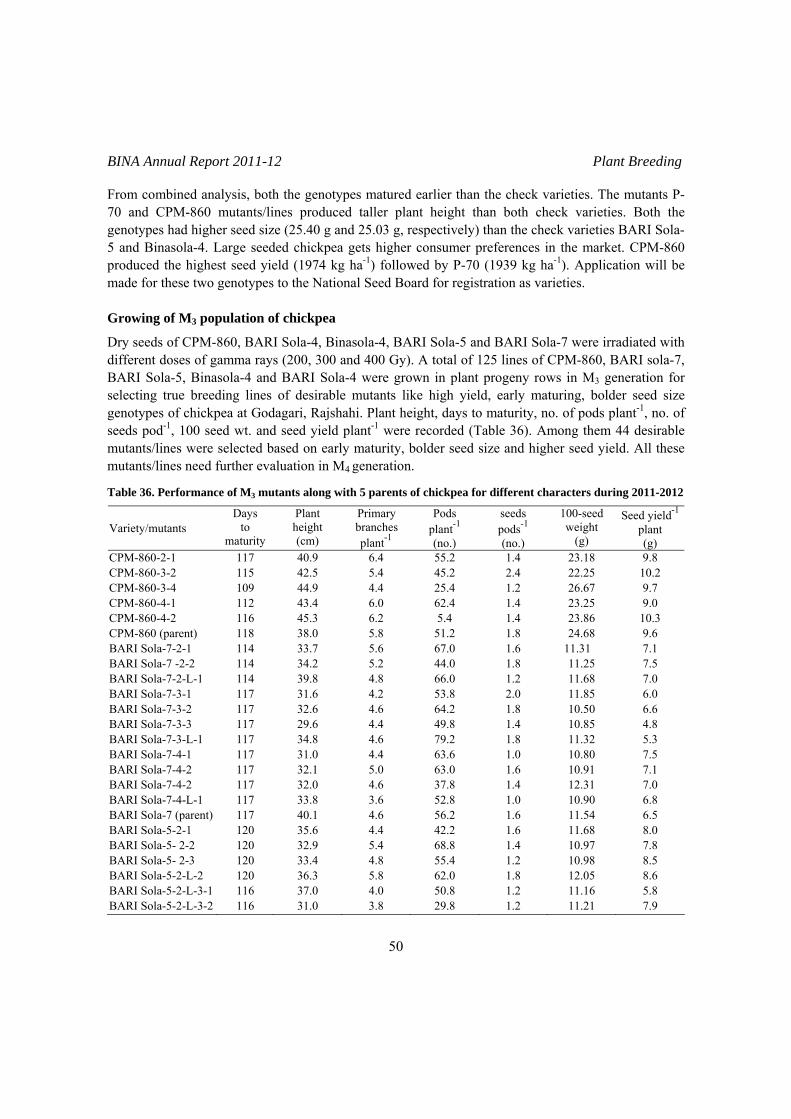
BINA Annual Report 2011-12 Plant Breeding
From combined analysis, both the genotypes matured earlier than the check varieties. The mutants P-70 and CPM-860 mutants/lines produced taller plant height than both check varieties. Both the genotypes had higher seed size (25.40 g and 25.03 g, respectively) than the check varieties BARI Sola-5 and Binasola-4. Large seeded chickpea gets higher consumer preferences in the market. CPM-860 produced the highest seed yield (1974 kg ha-1) followed by P-70 (1939 kg ha-1). Application will be made for these two genotypes to the National Seed Board for registration as varieties. Growing of M3 population of chickpea
Dry seeds of CPM-860, BARI Sola-4, Binasola-4, BARI Sola-5 and BARI Sola-7 were irradiated with different doses of gamma rays (200, 300 and 400 Gy). A total of 125 lines of CPM-860, BARI sola-7, BARI Sola-5, Binasola-4 and BARI Sola-4 were grown in plant progeny rows in M3 generation for selecting true breeding lines of desirable mutants like high yield, early maturing, bolder seed size genotypes of chickpea at Godagari, Rajshahi. Plant height, days to maturity, no. of pods plant-1, no. of seeds pod-1, 100 seed wt. and seed yield plant-1 were recorded (Table 36). Among them 44 desirable mutants/lines were selected based on early maturity, bolder seed size and higher seed yield. All these mutants/lines need further evaluation in M4 generation.
Table 36. Performance of M3 mutants along with 5 parents of chickpea for different characters during 2011-2012
Variety/mutants Days
to maturity
Plant height (cm)
Primary branches plant-1
Pods plant-1
(no.)
seeds pods-1
(no.)
100-seed weight
(g)
Seed yield-1
plant (g)
CPM-860-2-1 117 40.9 6.4 55.2 1.4 23.18 9.8 CPM-860-3-2 115 42.5 5.4 45.2 2.4 22.25 10.2 CPM-860-3-4 109 44.9 4.4 25.4 1.2 26.67 9.7 CPM-860-4-1 112 43.4 6.0 62.4 1.4 23.25 9.0 CPM-860-4-2 116 45.3 6.2 5.4 1.4 23.86 10.3 CPM-860 (parent) 118 38.0 5.8 51.2 1.8 24.68 9.6 BARI Sola-7-2-1 114 33.7 5.6 67.0 1.6 11.31 7.1 BARI Sola-7 -2-2 114 34.2 5.2 44.0 1.8 11.25 7.5 BARI Sola-7-2-L-1 114 39.8 4.8 66.0 1.2 11.68 7.0 BARI Sola-7-3-1 117 31.6 4.2 53.8 2.0 11.85 6.0 BARI Sola-7-3-2 117 32.6 4.6 64.2 1.8 10.50 6.6 BARI Sola-7-3-3 117 29.6 4.4 49.8 1.4 10.85 4.8 BARI Sola-7-3-L-1 117 34.8 4.6 79.2 1.8 11.32 5.3 BARI Sola-7-4-1 117 31.0 4.4 63.6 1.0 10.80 7.5 BARI Sola-7-4-2 117 32.1 5.0 63.0 1.6 10.91 7.1 BARI Sola-7-4-2 117 32.0 4.6 37.8 1.4 12.31 7.0 BARI Sola-7-4-L-1 117 33.8 3.6 52.8 1.0 10.90 6.8 BARI Sola-7 (parent) 117 40.1 4.6 56.2 1.6 11.54 6.5 BARI Sola-5-2-1 120 35.6 4.4 42.2 1.6 11.68 8.0 BARI Sola-5- 2-2 120 32.9 5.4 68.8 1.4 10.97 7.8 BARI Sola-5- 2-3 120 33.4 4.8 55.4 1.2 10.98 8.5 BARI Sola-5-2-L-2 120 36.3 5.8 62.0 1.8 12.05 8.6 BARI Sola-5-2-L-3-1 116 37.0 4.0 50.8 1.2 11.16 5.8 BARI Sola-5-2-L-3-2 116 31.0 3.8 29.8 1.2 11.21 7.9
50

BINA Annual Report 2011-12 Plant Breeding
Table 36 Contd.
Variety/mutants Days
to maturity
Plant height (cm)
Primary branches plant-1
Pods plant-1
(no.)
seeds pods-1
(no.)
100-seed weight
(g)
Seed yield-1
plant (g)
BARI Sola-5-2-L-3-3 116 36.2 4.6 47.0 1.2 10.56 8.5 BARI Sola-5-4-1 116 31.2 3.4 16.6 1.2 12.16 7.0 BARI Sola-5-4-2 116 38.4 3.0 28.6 1.4 12.67 8.5 BARI Sola-5 (parent) 120 36.0 3.8 59.8 1.0 12.25 7.6 Binasola-4-2-1 117 49.2 3.2 83.0 1.8 1304 9.0 Binasola-4-2-2 117 37.0 5.5 77.8 1.6 12.34 9.2 Binasola-4-2-3 117 44.6 6.0 78.2 1.4 11.55 8.8 Binasola-4-2-L-1 117 41.0 5.4 72.4 1.8 12.36 8.5 Binasola-4-3-1 117 112.8 5.4 75.0 1.8 12.26 9.2 Binasola-4-3-2 117 42.2 6.4 78.8 1.8 12.08 9.1 Binasola-4-3-L-1 117 37.4 6.2 69.8 1.8 12.26 7.8 Binasola-4 (parent) 117 28.6 3.8 61.0 1.6 12.01 8.7 Binasola-4-3-3 117 32.8 2.8 71.8 1.4 12.36 8.5 Binasola-4-3-L-2 117 33.0 3.4 75.6 1.6 12.36 8.6 BARI Sola4 (parent) 117 38.6 5.6 68.2 1.4 11.90 6.7 BARI Sola-4-2-1 117 37.5 4.0 43.8 1.7 11.90 7.2 BARI Sola-4-2-L-1 117 33.2 5.0 45.0 1.8 11.92 5.0 BARI Sola-4-2-2 120 35.8 3.0 37.5 1.5 11.91 6.3 BARI Sola-4-2-3 115 31.6 2.6 29.8 1.6 12.90 7.8 BARI Sola-4-3-L-1 115 35.9 4.0 50.0 1.4 12.90 5.9 BARI Sola-4-4-1 116 37.7 3.6 50.8 2.6 12.90 7.0 BARI Sola-4-4-2 118 35.4 4.6 44.6 1.4 12.90 5.8 BARI Sola-4-4-L-1 120 38.8 4.2 41.8 1.4 12.90 8.2 Screening of Kabuli mutants of chickpea
Kabuli mutants were derived from Binasola-2 (parent) with gamma rays of 300 Gy. These mutants were grown for selecting desirable types. Selected plants/lines will be tested for Preliminary yield trial in the next growing season. LENTIL
On station yield trial of four selected mutants of lentil
Four mutants along with a check variety, BARI Masur-4 were put into on station yield trial at Maugra and Ishurdi. The experiment was carried out in a randomized complete block design with three replications. Unit plot was 5 m × 4 m. Distances between rows and plants were 30 cm and 5-6 cm, respectively. Plant height, number of primary branches plant-1, days to maturity, number of pods plant-
1 and yield per plot were recorded from randomly selected 10 plants of each plot. Plot yield was converted to kg ha-1. Statistical analysis of different characters of the mutants and check are presented in Table 36.
51

BINA Annual Report 2011-12 Plant Breeding
Results showed that significant variations were present in all the characters except number of primary branches plant-1. It was observed from results that plant height ranged from 35.2 to 39.5 cm. The days to maturity ranged from 103 to 112 days for mutants while it was 112 days for mother variety of BARI Masur-4. The mutant LM-156-1 matured earlier among the mutants and the check. The mutant LM-123-7 produced the highest number of pods plant-1. In Magura, mutant LM-123-7 produced significantly the highest seed yield (2061 kg ha-1) followed by LM-28-2 and LM-156-1. At Ishurdi, mutants LM-123-7 produced the highest seed yield among the mutants and the check variety. But, the mutant LM-123-7 produced higher in average seed yield and number of pods plant-1 among the mutants and the check variety. The selected mutant lines LM-123-7 and LM-28-2 will be grown in the next year to assess their yield potential at different locations of Bangladesh. Table 37. Mean of yield and yield contributing characters of the selected promising mutants grown at Magura
and Ishurdi during 2011-12
Seed yield (kg ha-1) Mutant/variety
Plant height (cm)
Branches plant-1 (no.)
Days to
maturity
Pods plant-1 (no.) Magura Ishurdi
Mean
LM-156-1 35.7b 2.6NS 103c 158.0bc 1862b 1810b 1836b LM-28-2 38.4a 2.6 108b 163.7b 1890b 1821b 1856b LM-67-7 35.2b 3.0 110a 159.9bc 1823b 1815b 1819b LM-123-7 39.5a 2.7 107b 184.5a 2061a 2005a 2033a BARI Masur-4 (check) 38.0a 2.9 112a 150.9c 1565c 1500c 1533c
Same letters in a column do not differ significantly at 5% level.
Zonal yield trial for the selected mutants of lentil
Five mutants along with check variety, BARI Masur-4 were put into on station yield trial at Maugra and Ishurdi. The experiment was carried out in a randomized complete block design with three replications. Unit plot was 5 m × 4 m. Distances between rows and plants were 30 cm and 5-6 cm, respectively. Plant height, number of primary branches plant-1, days to maturity, number of pods plant-
1 and seed yield (kg ha-1) were recorded from randomly selected 10 plants of each plot. Plot yield was converted to kg ha-1. Statistical analysis of different characters of the mutants and check are presented in Table 38. Results showed that significant variations were present in all the characters except number of primary branches plant-1. It was observed from the results that plant height ranged from 35.4 to 42.6 cm. The days to maturity ranged from 105 to 113 days for mutants while it was 113 days for mother variety of BARI Masur-4. The mutant LM-24-3 matured earlier than both the mutants and the check variety. The mutant, LM-21-1, LM-24-3 and LM-14-2 produced higher number of pods plant-1. In Magura, mutant LM-21-1 produced significantly the highest seed yield of 2100 kgha-1 followed by LM-24-3 and LM-14-2. At Ishurdi, mutants LM-21-1 produced the highest seed yield among the mutants and the check variety. But, the mutant LM-21-1 produced higher in average seed yield and number of pods plant-1 among the mutants and the check variety. The selected mutant lines of LM-121-1, LM-24-3 and LM-14-2 will be grown in the next year to assess their yield potential at different locations of Bangladesh.
52

BINA Annual Report 2011-12 Plant Breeding
Table 38. Mean of yield and yield contributing characters of the selected promising mutants grown at Magura and Ishurdi during 2011-12
Seed yield (kg ha-1) Mutant/variety
Plant height (cm)
Branches plant-1 (no.)
Days to
maturity
Pods plant-1 (no.) Magura Ishurdi
Mean
LM-21-1 42.6a 2.6NS 106c 196.2a 2100a 2010a 2055a LM-101-8 36.4b 2.5 110ab 162.2bc 1790cd 1801b 1796c LM-48-1 42.0a 2.5 109ab 168.8b 1911bc 1890ab 1901bc LM-24-3 36.8b 2.3 105c 195.6a 2090a 1990a 2040a LM-14-2 35.4b 2.5 108bc 193.0a 2070ab 1925ab 1998ab BARI Masur-4 (check) 37.0b 2.7 113a 154.0c 1545d 1510c 1528d
Same letters in a column do not differ significantly at 5% level. Advanced yield trial for the selected mutants of lentil
Six mutants along with the check variety, BARI Masur-4 were put into an advanced yield trial at Magura and Ishurdi. The experiment was carried out in a randomized complete block design with three replications. Unit plot was 4 m × 3 m. Distances between rows and plants were 30 cm and 5-6 cm, respectively. Plant height, number of primary branches plant-1, days to maturity, number of pods plant-
1 and seed yield (kg ha-1) were recorded from randomly selected 10 plants of each plot. Plot yield was converted to kg ha-1. Statistical analysis of different characters of the mutants and check are presented in Table 39. Table 39. Mean of yield and yield contributing characters of the selected promising mutants grown at Magura
and Ishurdi during 2011-12
Seed yield (kg ha-1) Mutant/variety
Plant height (cm)
Branches plant-1 (no.)
Days to
maturity
Pods plant-1 (no.) Magura Ishurdi
Mean
LM-93-3 37.8b 2.9NS 109b 171.1b 1894a 1825ab 1860ab LM-37-8 43.8a 2.7 107c 138.9de 1690bc 1640c 1665bc LM-20-3 41.5ab 2.7 105c 128.4e 1564bc 1535c 1550c LM-13-1 39.8ab 2.8 110b 194.3a 1990a 1910a 1950a LM-15-9 41.8ab 2.6 112ab 190.0ab 1904a 1894a 1899ab LM-99-4 41.9ab 2.7 113ab 156.0bc 1800ab 1808b 1804ab BARI Masur-4 (check) 41.5ab 2.8 116a 148.4cd 1485c 1464c 1475c Same letters in a column do not differ significantly at 5% level. Results showed that significant variations were present in all the characters except number of primary branches plant-1. It was observed from results that plant height ranged from 37.8 to 43.8 cm. The days to maturity ranged from 105 to 116 days for mutants while it was 116 days for mother variety BARI Masur-4. The mutant LM-20-3 matured earlier than the check variety BARI Masur-4. The mutants LM-13-1 and LM-15-9 produced higher number of pods plant-1 than the mutants and check. At Magura, mutant LM-13-1 produced significantly the highest seed yield of 1990 kg ha-1 followed by LM-15-9 among the mutants and the check variety. At Ishurdi, the mutant LM-13-1 produced the highest seed yield at all the locations. But, in average the mutants LM-13-1 produced significantly the highest seed yield of 1950 kg ha-1. Out of 6 mutants, two showed promising in respect of number of pods plant-1 and seed yield. The selected mutant lines of LM-13-1 and LM-15-9 will be grown in the next year to assess their yield potential at different locations of Bangladesh.
53

BINA Annual Report 2011-12 Plant Breeding
On-farm yield trial of three mutants and a check variety of lentil
Trials on three promising lentil mutants along with a check variety were conducted at Natore, Ishurdi, Magura and Jessore during 2011-12 in order to assess the performance of those mutants at farmer’s field. The mutants were LM-185-2, LM-75-4, LM-132-7 and BARI Masur-4 (check). Each trial was conducted in non-replicated field of 10 m × 10 m. Seeds were sown @ 35 kg ha-1 in lines with 30 cm distance between rows. Data on days to maturity and yield kgha-1 were recorded from each trial and are summarized in Tables 40a and 40b. The duration and yield of lentil mutants/variety ranged from 98-110 days and 2499-1959 kgha-1, respectively at Magura of which the mutant LM-75-4 produced highest yield (2499 kg ha-1) than the remaining mutant and check variety. The mutant LM-75-4 matured earlier by 9-12 days than the check variety, while at Jessore the mutant LM-75-4 produced highest yield (2390 kg ha-1) followed by the mutant LM-132-7. At Natore and Ishurdi, mutants LM-75-4 and LM-132-7 produced higher seed yield than the check variety. The duration of LM-185-2 ranged from 104-110 days and that of LM-75-4, LM-132-7 and BARI Masur-4, 98-104 days, 102-105 days and 111-116 days over the locations with mean 107 days, 101 days, 103 day and 114 days, respectively. Yield ranged from 1998-2185 kg ha-1, 2175-2499 kg ha-1, 2130-2312 kgha-1, and 1612-2124 kg ha-1, in the mutants LM-185-2, LM-75-4, LM-132-7 and BARI Masur-4, yield over all locations 2058, 2315, 2221 and 1881 kgha-1, respectively. Table 40a. Mean of days to maturity of three mutants and a check variety of lentil at four locations during
2011-2012 (average of four locations)
Mutant/lines Natore Ishurdi Magura Jessore Average LM-185-2 110b 109b 105b 104b 107b LM-75-4 104c 102c 98c 99c 101c LM-132-7 105c 104c 99c 102c 103c BARI Masur-4 (check) 116a 115a 111a 113a 114a
Same letters in a column do not differ significantly at 5% level. Table 40b. Mean of yield of three mutants and a check variety of lentil at four locations during 2011-2012
(average of four locations)
Mutant/lines Natore Ishurdi Magura Jessore Average LM-185-2 2089b 1998ab 2185b 1959b 2058b LM-75-4 2198a 2175a 2499a 2390a 2315a LM-132-7 2145a 2130b 2312a 2296a 2221ab BARI Masur-4 (check) 1890c 1612c 2124b 1899b 1881c Same letters in a column do not differ significantly at 5% level. Evaluation of ICARDA lines of lentil
Seeds of 7 genotypes along with one check variety, BARI masur-4 were put into yield trial at Magura and Ishurdi. The experiment was carried out in a randomized complete block design with three replications. Unit plot was 3 m × 1.2 m. Distances between rows and plants were 30 cm and 5-6 cm, respectively. Plant height, number of primary branches/plant, days to maturity, number of pods plant-1 and seed yield (kg ha-1) were recorded from randomly selected 10 plants of each plot. Plot yield was converted to kg ha-1. Statistical analysis of different characters of the mutants and check are presented in Table 41.
54
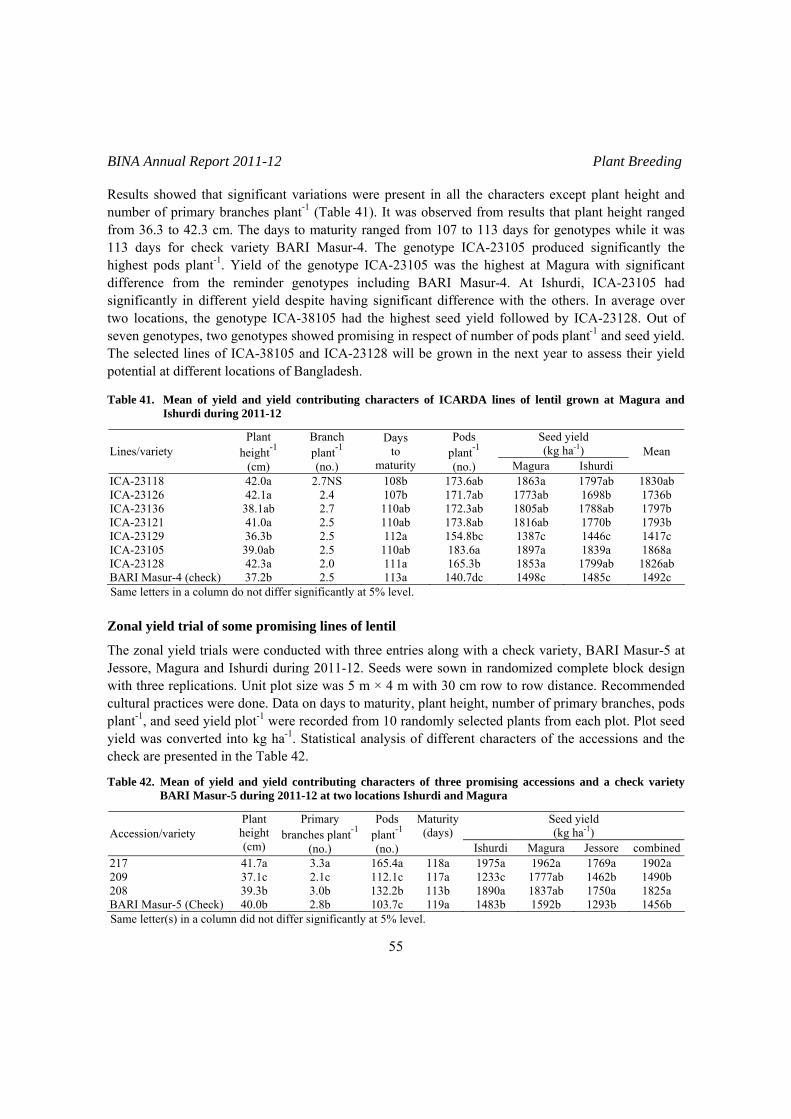
BINA Annual Report 2011-12 Plant Breeding
Results showed that significant variations were present in all the characters except plant height and number of primary branches plant-1 (Table 41). It was observed from results that plant height ranged from 36.3 to 42.3 cm. The days to maturity ranged from 107 to 113 days for genotypes while it was 113 days for check variety BARI Masur-4. The genotype ICA-23105 produced significantly the highest pods plant-1. Yield of the genotype ICA-23105 was the highest at Magura with significant difference from the reminder genotypes including BARI Masur-4. At Ishurdi, ICA-23105 had significantly in different yield despite having significant difference with the others. In average over two locations, the genotype ICA-38105 had the highest seed yield followed by ICA-23128. Out of seven genotypes, two genotypes showed promising in respect of number of pods plant-1 and seed yield. The selected lines of ICA-38105 and ICA-23128 will be grown in the next year to assess their yield potential at different locations of Bangladesh. Table 41. Mean of yield and yield contributing characters of ICARDA lines of lentil grown at Magura and
Ishurdi during 2011-12
Seed yield (kg ha-1) Lines/variety
Plant height-1
(cm)
Branch plant-1
(no.)
Days to
maturity
Pods plant-1
(no.) Magura Ishurdi Mean
ICA-23118 42.0a 2.7NS 108b 173.6ab 1863a 1797ab 1830ab ICA-23126 42.1a 2.4 107b 171.7ab 1773ab 1698b 1736b ICA-23136 38.1ab 2.7 110ab 172.3ab 1805ab 1788ab 1797b ICA-23121 41.0a 2.5 110ab 173.8ab 1816ab 1770b 1793b ICA-23129 36.3b 2.5 112a 154.8bc 1387c 1446c 1417c ICA-23105 39.0ab 2.5 110ab 183.6a 1897a 1839a 1868a ICA-23128 42.3a 2.0 111a 165.3b 1853a 1799ab 1826ab BARI Masur-4 (check) 37.2b 2.5 113a 140.7dc 1498c 1485c 1492c Same letters in a column do not differ significantly at 5% level. Zonal yield trial of some promising lines of lentil
The zonal yield trials were conducted with three entries along with a check variety, BARI Masur-5 at Jessore, Magura and Ishurdi during 2011-12. Seeds were sown in randomized complete block design with three replications. Unit plot size was 5 m × 4 m with 30 cm row to row distance. Recommended cultural practices were done. Data on days to maturity, plant height, number of primary branches, pods plant-1, and seed yield plot-1 were recorded from 10 randomly selected plants from each plot. Plot seed yield was converted into kg ha-1. Statistical analysis of different characters of the accessions and the check are presented in the Table 42. Table 42. Mean of yield and yield contributing characters of three promising accessions and a check variety
BARI Masur-5 during 2011-12 at two locations Ishurdi and Magura
Seed yield (kg ha-1) Accession/variety
Plant height (cm)
Primary branches plant-1
(no.)
Pods plant-1
(no.)
Maturity(days)
Ishurdi Magura Jessore combined217 41.7a 3.3a 165.4a 118a 1975a 1962a 1769a 1902a 209 37.1c 2.1c 112.1c 117a 1233c 1777ab 1462b 1490b 208 39.3b 3.0b 132.2b 113b 1890a 1837ab 1750a 1825a BARI Masur-5 (Check) 40.0b 2.8b 103.7c 119a 1483b 1592b 1293b 1456b Same letter(s) in a column did not differ significantly at 5% level.
55

BINA Annual Report 2011-12 Plant Breeding
Results revealed that all the characters showed significant variation among the accessions and the check (Table 42). The accession 217 attained the tallest plant height, produced the highest number of primary branches as well as the highest number of pods plant-1. This accession 217 also produced the highest seed yield (1975, 1962, 1769 kg ha-1) at all three locations, Ishurdi, Magura and Jessore followed by the accession 208 (1890, 1837 and 1750 kg ha-1) which were statistically identical. Accession 208 was the earliest for maturity period (113 days) among the check (119 days) and other accessions (118 and 117 days, respectively). Advanced yield trials of some promising lines of lentil
An advanced yield trial was carried out with seven lines and a check variety BARI Masur-5 at two locations, BINA sub-station farm, Ishurdi and Magura during 2011-12. Seeds were sown in randomized complete block design with three replications. Unit plot size was 4 m × 3 m with 30 cm row to row distance. Recommended cultural practices were done. Data on days to maturity, plant height, number of primary branches, pods plant-1 and seed yield plot-1 were recorded from 10 randomly selected plants from each plot. Plot seed yield was converted into kg ha-1. Statistical analysis of different characters of the lines and the check are presented in the Table 43. Table 43. Mean of yield and yield contributing characters of seven promising lines and a check variety BARI
masur-5 during 2011-12 at two locations Ishurdi and Magura
Yield (kg ha-1) Strains
Plant height (cm)
Branches plant-1
(no.)
Pods plant-1
(no.)
Maturity (days)
Ishurdi Magura Combined Yield increased (%)
207 34.6c 2.7bc 104cd 116bc 1417c 1466cd 1441cd 10 202 35.6c 2.5bc 134ab 118a 1300c 1444cd 1372d 10 203 35.0c 2.4c 89d 115c 1383c 1666bc 1524c 20 204 41.2a 2.6bc 102cd 117ab 1300c 1190d 1245d - 205 38.8ab 2.9ab 126ab 115c 1717b 1844ab 1780b 28 206 41.1a 3.3a 142a 116abc 2050a 2089a 2069a 36 9 38.5b 2.3c 94cd 113d 1300c 1244d 1272d - BARI Masur-5 39.8ab 2.6bc 114bc 117ab 1383c 1253d 1318d Means followed by same letter in a column did not differ significantly at 5% level. Results revealed that there were significant differences among the tested lines and check for all the characters. Lines 203, 205 and 9 matured earlier than the check and the other lines. Regarding plant height, 204 and 206 were the tallest. The highest number of branches and pods plant-1 were observed in lines 205 and 206. The seed yield of two locations showed that the lines 206 and 205 produced the highest seed yield of 2050 and 1717 kg ha-1 at Ishurdi and 2089 and 1844 kg ha-1 at Magura. The average seed yield over two locations was also highest for two lines 206 and 205 and the seed yield was increased by 36% and 28%, respectively. Growing of M3 generation
To create variability three selected germplasm 118, 138 and 135 along with a popular variety BARI Masur-5 were irradiated with 100, 150, 200 and 250 Gy of gamma rays. A total of 50 M1 plants were harvested from two doses, 150 and 100 Gy. Pod and seed were not formed in two doses, 200 and 250 Gy. Seeds of selected 38 M2 plants were grown in plant-progeny-rows at Magura sub-station along
56

BINA Annual Report 2011-12 Plant Breeding
with the mother lines/variety. Each row was 2 m long with 30 cm row to row distance. Recommended cultural practices were done. Seeds of the selected 13 M3 plants were harvested separately to grow M4 population. Table 44. Mean values of different characters of the selected M3 mutants of lentil during 2011-12
Strains and radiation dose Plant height
(cm) Branches plant-1
(no.) Pods plant-1
(no.) Maturity (days)
Yield plant-1
(g) 150 Gy 137-1-10 32.1 2.0 65 105 0.89 137-2-10 37.5 3.6 70 102 0.9 137-5-10 37.1 4.0 85 101 1.2 138-1-10 40.5 1.9 50 102 0.8 118-1-10 42.0 2.6 65 107 0.89 118-5-10 44.1 2.8 60 106 0.85 118-8-10 47.2 2.5 66 108 0.9 118-9-10 48.1 3.0 51 106 0.8 BARI Masur-5-1-10 38.5 2.2 40 108 0.7 100 Gy 137-4-10 36.1 2.5 50 102 0.8 138-1-10 30.1 1.7 35 106 0.6 138-2 32.1 1.9 45 105 0.7 137 (mother) 40.1 2.0 33 108 0.7 138 (mother) 36.3 3.0 31 110 0.6 118 (mother) 42.1 3.0 28 112 0.5 BARI Masur-5 (mother) 40.0 3.0 40 112 0.6 Range 32.1-48.1 2-4 28-85 101-112 0.5-1.2
TOMATO
Zonal yield trial of a promising winter mutant (M8) line
Only one promising winter mutant line (TM-110) along with two checks varieties (Binatomato-5 and BARI Tomato-7) at BINA sub-station- Ishurdi, Magura, Rangpur and BINA HQ. during the winter 2011-12. The experiment was laid out in a Randomized Complete Block Design (RCBD) with three replications. Unit plot size was 5 m × 4 m and as a result the area of each plot was 20 m2 having 50 cm spacing for both row to row and plant to plant as well. Recommended production packages such as- application of manures and fertilizers, weeding, mulching, irrigation, application of fungicide and insecticide and sticking etc. were followed as and when necessary to ensure normal plant growth and development. Data were taken for plant height, days to 90% fruit ripening, number of fruits plant-1, average fruit weight from 10 randomly selected plants from each harvest in an unit plot. Fruit yield of each plot was recorded for each harvest in kg and finally converted into t ha-1. There in no data gathered from Magura due to extremely less fruit setting after vegetative growth. The collected row data for all the parameters were compiled for analysis so as to get concluding remarks. The mean values for different characters of mutant and as well as checks are presented in Table 45. The results showed significant variation among the mutant and check varieties for all the concerned characters.
57

BINA Annual Report 2011-12 Plant Breeding
On an average, check variety BARI Tomato-7 produced the tallest plant (85.1 cm) having the longest maturity period of 113 days, lowest number of fruits per plant (19) and inversely the larger fruit size (93.0 g fruit-1) and as well as gave the highest fruit yield (69.21 t ha-1) for combined over three locations. On the other hand, TM-110 had the shortest plant height of 71.53 cm along with lowest maturity period (103 days) having the highest number of fruits (32.67 plant-1) with smallest fruit size (53.33 g fruit-1) and finally produced the average fruit yield of 64.2 t ha-1. Considering yield and yield attributing characters the winter mutant TM-110 was not significantly higher than two of the check varieties. Table 45. Mean of important characters and fruit yield of the mutant along with check varieties over two
locations during winter in 2011-12
Fruit yield (t ha-1) Mutant lines/ check
Plant height (cm)
Days to 90% fruit ripening
No. of fruits
plant-1
Av. fruit weight
(g) BINA Hq. Ishurdi Rangpur
Av. fruit yield
(t ha-1) TM-110 71.5c 103b 32.7a 53.3c 65.6ab 64.1b 64.2ab 64.2ab Binatomato-5 78.9b 107b 23.3b 81.3b 66.3a 69.1a 53.9b 61.1b BARI Tomato-7 85.1a 113a 19.0b 93.0a 64.7b 66.6ab 71.8a 69.2a
Preliminary yield trial of promising mutants of winter tomato in BINA headquarter, Mymensingh
The experiment was conducted with two promising mutant lines along with three check varieties in BINA farm, Mymensingh during late winter in 2011-12. Twenty eight days old seedlings were transplanted into the main field. The experiment was laid out in a randomized complete block design with three replications. The area of unit plot size was 20 m2 (5 m × 4 m). Spacing for both row to row and plant to plant within the rows was 50 cm. Recommended doses of manures and fertilizers, cultural and intercultural operations were followed as and when necessitated. Before flowering stages, sticking were put down in each plant individually. Data on different parameters within the mutants were recorded at vegetative, reproductive and ripening stages as well from 10 randomly selected plants. Apart from this, data on average fruit weight, number of fruits plant-1 and fruit yield per plot were collected from each harvest. And finally, fruit yield of each plot (up to last harvest) was converted into t ha-1. The mean performances of five lines/varieties regarding the parameters are presented in Table 46. Table 46. Mean of important characters and fruit yield of promising lines along with check varieties
Mutants/varieties Plant height (cm)
Days to 90% fruit ripening
Fruits plant-1
(no.)
Average fruit weight
(g)
Fruit yield plant-1 (kg)
Yield (t ha-1)
TM-110 70.7e 101c 25.0a 53.3e 1.3c 50.6b TM-219 80.3d 114a 23.0ab 81.0c 1.8ab 66.6ab BARI Tomato-3 114.3a 114a 18.7b 94.7b 1.8ab 66.6ab Binatomato-5 92.8c 109b 21.7ab 70.0d 1.4bc 51.8b BARI Tomato-14 103.7b 116a 19.3b 114.3a 2.1a 77.7a
58

BINA Annual Report 2011-12 Plant Breeding
From the mean results it showed that TM-110 had the shortest plant having early maturing behaviour among all the entries followed by TM-219 while BARI Tomato-3 had the tallest plant with the longest maturity period of 114 days (Table 46. TM-110 also produced the highest number of fruits per plant (25 plant-1) as compared to others though it had a smallest fruit size of 53.3 g fruit-1. As considered the fruit yield and also total yield per hectare, there was non-significant difference in between two mutants. Check varieties, BARI Tomato-14 and Binatomato-5 produced fruit yield of 77.7 t ha-1 and 66.6 t ha-1 respectively. It will be noticed that during the last three years the mutant TM-219 also performed better in respect of fruit yield in the growing season of late winter and also in summer season with the help polythene cover. Application will be made soon to NSB for registration of this mutant.
On-farm and on-station trial of two promising summer M7 mutant lines
Two promising mutant lines along with two check varieties were put into trial in BINA HQ farm, sub-stations at Magura and Rangpur, BINA annex farm, Jamalpur and farmers’ field at Magura and Rangpur in late summer (Nov 2011-July 2012). The experiment was laid out in a RCBD with three replications. Unit plot size was 6 m2 (3 m × 2 m). Spacing in row to row was 40 cm and plant to plant was 40 cm. Seeds were sown in the last week of October. Recommended production packages like application of recommended doses of fertilizers, weeding, mulching, regular irrigation, application of pesticide etc. were followed to ensure normal plant growth and development. Data were taken for plant height, 90% fruit maturity, number of fruits plant-1 and average fruit weight from 5 randomly selected plants from each plot. Maturity period was considered when 90% fruits were matured and most of the plants turned into straw or yellowish color in whole plot. Experiment conducted at BINA farm and in the farmers’ field at Magura had uneven and incomplete due to extreme temperature at beginning stage and excessive rainfall in later stage and thus no outcome from these locations. Therefore, results of these locations are not included in this report. Appropriate statistical analysis was performed for comparison of means of each parameter for the locations of Magura, Rangpur and Jamalpur which is shown in Tableb 47. The mean values for different characters of the mutants and check varieties are presented in Table 47. The results showed significant variation among the mutants and the check varieties for most of the characters. Table 47. Mean performance of important characters and fruit yield of promising lines along with check varieties
Fruit yield (t ha-1) Mutant lines/ check
Plant height (cm)
Fruits plant-1
(no.)
Days to 90% fruit ripening
Av. fruit weight
(g) Rangpur Magura Jamalpur
Av.fruit yield
(t ha-1) TM-134 83.6b 11c 80b 55b 28.3c 19.8b 19.7b 22.6c TM-219 90.8a 15b 80b 60a 27.4c 25.2ab 45.4a 32.3a Binatomato-3 84.5b 15b 68d 40d 37.9a 9.2c 22.2b 2.1c BARI Tomato-5 88.2a 20a 83a 38e 33.3b 27.8a 21.4b 27.5b
59

BINA Annual Report 2011-12 Plant Breeding
On an average, TM-219 produced the tallest plant (90.8 cm) followed by the check variety BARItomato-5 of 88.2 cm. In addition to that BARItomato-5 produced higher number of fruits per plant (20 plant-1) having the longest maturity period (83 days) having the lowest average fruit weight of 38 g. As TM-219 had the larger fruit size and thus it produced highest fruit yield in context of 3 locations among all the entries. On the other hand, the results revealed that considering of three locations among the mutant lines and check; TM-134 had the shortest plant height of 83.6 cm while TM-219 and Baritomato-5 had the tallest plants with longest maturity period (90% fruit maturity). Between two (TM-134 and TM-219) lines there was a significant yield difference considering all locations (TM-134 22.6 t ha-1 while TM-219 32.3 tha-1). Growing of M2 generation with AVRDC mutants
Some lines of AVRDC and Taiwan has been grown at BINA HQ. farm and Rangpur substation. Among all these entries TM-1, TM-2, TM-3, TM-4 and TM-5 were heat tolerant and thus grown better in summer and late winter. Their detailed study summarized hereafter. Currently some of these lines are exclusive in field condition which needs to take care in intensive manner for the next years. Table 48. A detailed study of AVRDC tomato lines
Sl. No. Full Accession Name BINA Code General description 1. CL5915-93D4-1-0-3 TM-1 Dwarf plant, broader leaf with deep green color, fruit shape-round,
less infected in Tomato mosaic virus (TMV), globe fruit shape 2. CLN2413R TM-2 Long plant height with broader leaf, fruit surface ridged 3. CLN2418A TM-3 Dwarf plant, green leaf, smaller fruit with round shaped, light
insect infestation was found. 4. CLN2001A TM-4 Deep green leaf with round shape, fruit size also round, medium
plant height 5. CLN1621L TM-5 Light green leaf, elongated fruit, huge nos. and cluster flowering 6. CLN3125O (AVTOV 1004) TM-6 Completely round fruit shape, comparatively less no. of fruit in
each plant, infected in Tomato mosaic virus (TMV) 7. CLN3125P (AVTOV 1005) TM-7 Long plant and elongated fruit shape 8. CLN3078A (AVTOV 1007) TM-8 Dwarf plant, pale green leaf color, round and smaller fruit size 9. CLN3078C (AVTOV 1008) TM-9 Dwarf plant, pale green leaf color, round and smaller fruit size 10. CLN3078G (AVTOV 1009) TM-10 Long plant height with deep green color of leaf, Larger fruit size
with round shaped 11. CLN3070J (AVTOV 1010) TM-11 Dwarf plant, elongated fruit shape 12. CLN3125A (AVTOV 1001) TM-12 Dwarf plant, Leaf infected and curled, wavy fruit shape 13. CLN3125L (AVTOV 1003) TM-13 Dwarf plant, light green leaf, heavy branching elongated fruit, huge
nos. and cluster bearing habit 14. CLN3024A TM-14 Dwarf plant, light green leaf, elongated smaller fruit, huge nos.
and cluster bearing habit, Less infected up to harvest 15. CLN3070A TM-15 Comparatively more dwarf plant, Round fruit shape, comparatively
less no. of fruit in each plant 16. 4 TOM 031 TM-17 Long plant height with deep green color of leaf, Larger fruit size
with round shaped 17. 4 TOM 021 (Cherry) TM-19 Cherry type tomato, long plant, huge flowering with alternate
bearing habit, deep green leaves, consecutive fruit setting 18. Juliet 1437 (Cherry) TM-20 Cherry type tomato, long plant, huge flowering with alternate
bearing habit, deep green leaves, consecutive fruit setting Note: Within bracket i.e. AVTOV. From Sl. No. 6-13 indicates new code by AVRDC.
60

BINA Annual Report 2011-12 Plant Breeding
ONION
Preliminary yield trial with M5 mutant lines of summer onion for bulb yield potential in Kharif, 2011 season
Seeds of seven M5 mutant lines that produced enough seeds and had comparatively better bulb yield potentials in last winter season were sown on 15 June for Ishurdi and that of Magura on 15 July 2011 in steel tray at BINA glass house and office yard, respectively. The parent variety, BARI Piaj-2 was also included in this experiment. Seedlings were transplanted on 23 August 2011 at Ishurdi and 15 September at Magura following RCBD with 3 replications. A unit plot size was 1.2 m × 0.8 m and 2.4 m × 0.8 m at Ishurdi and Magura locations, respectively. Plants were spaced at 15 cm within rows of 20 cm apart. Recommended doses of cowdung and fertilizers were applied during final land preparation and after 20 days of transplanting. Data on plant height and bulb diameter were recorded from randomly selected five competitive plants and yield from the whole plot-1 were recorded at harvest. Yield plot-1 was then converted to yield ha-1. We know onion is a biennial crop completes vegetative growth in first year and reproductive growth in the following year. As the onion in the experiment at Magura received favorable conditions for flowering just at the time of bulb maturity, they switched over to reproductive phase. When onion starts to flower the previously formed bulbs split and become inconsumable. Considering all these, no bulb was harvested rather left for seed production. During seed harvest, non replicated data on total number of plants, seed yield plant-1 and seed yield plot-1 were recorded. Finally, the collected data were subjected to proper statistical analyses and are presented in Tables 49 and 50. It appears that plant height of the mutant lines did not differ significantly with the parent BARI Piaj-2 and even amongst themselves (Table 49). In contrast, bulb diameter, the most important yield attributes in onion showed significant differences. The mutant line BP2/75/13 had the widest diameter followed by the parent BARI Piaj-2 showing no significant difference with each other. Like bulb diameter, bulb yield was the highest in BP2/75/13 followed by the parent BARI Piaj-2. This means the more the bulb diameter the more will be the bulb yield. Table 49. Bulb yield and yield attributes of some mutant lines of summer onion in Kharif season, 2011
Mutant lines/varieties Plant height (cm)
Bulb diameter (cm)
Bulb yield (kg ha-1)
BP2/75/2 13.78 4.70 2913.19 BP2/75/5 12.97 4.27 899.31 BP2/75/6 14.50 4.20 2288.19 BP2/75/13 13.38 5.30 3881.94 BP2/100/1 13.33 4.77 3079.86 BP2/100/12 15.50 4.32 913.19 BP2/75/3 12.30 4.80 2017.36 BARI Piaj-2 13.87 5.03 3854.17 LSD(0.05) NS 0.58 603.78
NS = not significant
61

BINA Annual Report 2011-12 Plant Breeding
The parent, BARI Piaj-2 and the mutant BP2/75/2 could not produce any seed despite the seed yield of the remainder mutant lines ranged 0.63 to 4.0 g plant-1 with BP2/100/12 being the highest and BP2/100/2 the least (Table 50). The highest seed yield ha-1 was produced by the mutant BP2/75/5 followed by BP2/75/13. The mutant BP2/75/13 also produced the highest bulb yield ha-1 and had the widest bulb diameter (Table 49).
Table 50. Seed yield of some mutant lines of summer onion at Magura in 2011-12
Mutant lines/varieties Seed yield plant-1
(g) Seed yield (kg ha-1)
BP2/75/2 0.00 0.00 BP2/75/5 2.05 67.71 BP2/75/6 1.00 12.15 BP2/75/13 1.57 38.19 BP2/100/1 2.25 15.63 BP2/100/12 4.00 34.72 BP2/100/2 0.63 32.99 BARI Piaj-2 0.00 0.00 SE+ 0.47 8.08
Preliminary yield trial with M5 mutant lines of summer onion for bulb yield potential in winter and M6 seed production
This experiment performed with 13 M5 mutant lines of onion derived by irradiating the seeds of summer type BARI Piaj-2 to assess bulb yield potential in winter. Seeds were sown on 26 October 2011 at BINA farm, Mymensingh. Seedlings were transplanted on 14 December 2011 at BINA farm, Mymensingh and 18 December 2011 at BINA sub-station farm, Rangpur following RCBD with 3 replications. The summer variety BARI Piaj-3 was also included in this experiment. For seed production, seedlings of 26 M5 mutant lines together with the parent BARI Piaj-2 were transplanted on 19 December 2011 at BINA sub-station farm, Ishurdi following non-replicated design. A unit plot size of 2.0 m × 0.6 m was used at Mymensingh while 1.8 m × 0.4 m at Rangpur. For seed production, unit plot sizes ranged 2 to 34 rows of 1.5 m length. Plants were spaced at 15 cm within rows of 20 cm apart. Recommended doses of cow dung and fertilizers were applied together with recommended cultural and intercultural practices for seed and bulb productions for the respective experiments. Data on plant height and bulb diameter were recorded from 5 plants while fresh bulb weight from whole plot at harvest. Dry weight was recorded after sun drying for one month. Fresh and dry weight of bulb was finally converted to kg ha-1. Moreover, data on total and flowering plants, seed yield plant-1 from randomly selected 10 competitive plants seed yield and plot-1 were recorded during harvest from the experiment set for M6 seed production. Finally, number of flowering plants were converted to percentage and that of seed yield plot-1 to yield ha-1 and subjected to proper statistical analyses and are presented in Tables 51, 52 and 53.
62

BINA Annual Report 2011-12 Plant Breeding
Table 51. Bulb yield and related traits of 13 mutant lines of summer onion during winter season of 2011-12 at Rangpur including weight loss on storage
Mutant lines/varieties Plant height (cm)
Bulb diameter
(cm)
Fresh weight of bulb
(kg ha-1)
Dry weight of bulb
(kg ha-1)
Rate of weight loss
(%) BP2/75/5 28.80 12.40 6388.89 5115.74 18.02 BP2/125/5 20.67 10.27 3148.15 2500.00 20.77 BP2/100/1 26.40 12.00 7638.89 5717.59 25.32 BP2/75/12 21.47 11.40 3287.04 2152.78 13.80 BP2/75/3 26.00 11.40 5092.59 3009.26 39.88 BP2/100/5 27.27 11.07 6851.85 5694.44 19.21 BP2/75/2 27.27 12.40 7638.89 5601.85 23.50 BP2/75/13 26.07 11.67 5694.44 3703.70 39.03 BP2/100/2 28.73 12.33 6157.41 5416.67 14.16 BP2/75/11 28.60 12.67 3425.93 3055.56 11.17 BP2/125/1 28.67 12.93 7222.22 6157.41 14.74 BP2/75/6 25.73 11.87 5138.89 4606.48 10.23 BARI Piaj-3 28.73 13.20 5324.07 4629.63 24.06 LSD(0.05) NS NS 677.02 661.97 3.51
NS= Not significant It appears that the plant height and bulb diameter of the mutant lines grown at Rangpur had not shown significant difference with the check variety, BARI Piaj-3, and also amongst themselves (Table 51). In contrast, fresh and dry weights of bulb had shown such significant differences. Six mutant lines had significantly higher fresh weight of bulb than the check variety with BP2/75/2 and BP2/100/1 being the highest followed by BP2/125/1 and BP2/100/5. In contrast, 5 mutant lines had significantly higher dry weight of bulb with BP2/125/1 being the highest followed by BP2/100/1. The mutant line BP2/125/1 also had significantly lower rate of weight loss on storing compared to the check variety together with five others. At Mymensingh, plant height, bulb diameter, fresh and dry weight of bulb ha-1 was higher than that of Rangpur (Table 52). The mutant line BP2/75/5 had the tallest while BP2/75/11 the shortest plant height at Mymensingh. Bulb diameter of the mutant lines did not differ significantly with each other or even with the check variety. Five mutant lines produced significantly higher bulb yield than the check variety with BP2/125/1 being the highest followed by BP2/125/5. The mutant BP2/75/5 produced significantly higher dry weight of bulb ha-1 than the check variety together with the fact that it had the lowest rate of weight loss on storage. It is evident that the mutants with the highest population had the lowest percentage of flowering plants and vice versa (Table 53). This rule deviated in case of the parent BARI Piaj-2, although it had lower plant population yet it had the lowest percentage of flowering plants and the flowering plants did not produce any seed, finally. In contrast, almost all the mutants that flowered could produce seed. Seed yield plant-1 and ha-1of the mutants ranged 0.04 to 1.07g and 11.76 to 357.14 kg with BP2/75/11 being the highest while BP2/125/1 the lowest.
63

BINA Annual Report 2011-12 Plant Breeding
Table 52. Bulb yield and related traits of 13 mutant lines of summer onion during winter season, 2011-12 at Mymensingh including weight loss on storage
Mutant lines/varieties Plant height (cm)
Bulb diameter
(cm)
Fresh weight of bulb
(kg ha-1)
Dry weight of bulb
(kg ha-1)
Rate of weight loss
(%) BP2/75/5 50.77 15.48 10555.56 8777.78 16.04 BP2/125/5 43.57 15.67 11319.44 8444.44 26.47 BP2/75/12 44.33 13.70 5138.89 3861.11 25.39 BP2/75/3 42.40 15.53 9375.00 5750.00 40.37 BP2/100/5 41.40 14.80 9027.78 6388.89 30.43 BP2/75/2 41.60 14.67 9444.44 7500.00 20.08 BP2/75/13 43.67 14.80 7847.22 5694.44 28.47 BP2/100/2 45.93 14.93 7569.44 5833.33 23.32 BP2/75/11 39.67 13.93 5972.22 5416.67 12.61 BP2/125/1 42.60 15.27 11944.44 8166.67 32.41 BP2/75/6 42.20 15.40 6805.56 5277.78 22.91 BP2/100/12 41.80 14.33 1058.33 6527.78 26.30 BARI Piaj-3 48.33 16.43 9727.78 7458.33 23.31 LSD(0.05) 4.12 NS 111.24 1007.23 4.16
NS = Not significant Table 53. Seed yield and yield attributes of 22 mutant lines of summer onion along with the parent BARI Piaj-2
during winter season, 2011-12 at Ishurdi
Mutant lines Total plant (no.)
Flowering plant (%)
Seed yield plant-1
(g) Seed yield (kg ha-1)
BP2/75/2 252 60.32 0.24 79.37 BP2/75/3 401 79.05 0.24 78.97 BP2/75/5 224 87.50 0.22 74.40 BP2/75/6 283 68.55 0.08 25.91 BP2/75/7 239 77.41 0.06 20.92 BP2/100/7 44 90.91 0.20 68.18 BP2/100/12 192 81.25 0.08 26.04 BP2/100/1 162 83.95 0.43 144.03 BP2/100/2 443 73.59 0.16 52.67 BP2/100/5 291 56.70 0.12 38.95 BP2/75/13 230 71.30 0.07 23.19 BP2/125/1 340 77.94 0.04 11.76 BP2/75/8 26 96.15 0.69 230.77 BP2/75/11 84 76.19 1.07 357.14 BP2/75/12 51 76.47 0.69 228.76 BP2/100/8 20 100.00 0.90 300.00 BP2/100/11 25 88.00 0.80 266.67 BP2/125/2 101 83.17 0.30 99.01 BP2/125/3 39 87.18 0.26 85.47 BP2/125/5 101 84.16 0.35 115.51 BP2/125/9 82 78.05 0.34 113.82 BP2/100/6 90 71.11 0.20 66.67 BARI Piaj-2 21 9.52 0 0.0 SE 26.60 3.69 0.06 20.42
Finally, based on higher seed production, fresh and dry bulb yields and lowest/lower weight loss on storage, 6 mutants have been selected to evaluate further in advance yield yrial, next winter. The mutants are: BP2/75/2, BP2/75/5, BP2/75/13, BP2/100/1, BP2/100/2 and BP2/125/1.
64

CROP PHYSIOLOGY DIVISION

BINA Annual Report 2011-12 Crop Physiology
66

BINA Annual Report 2011-12 Crop Physiology
RESEARCH HIGHLIGHTS
Three aromatic rice mutants/cultivars were evaluated at six on-stations and four farmers’ fields. Average yield of KD5-18-150, BRRI dhan34 and Kalizira was 3.37, 2.60 and 2.14 tha-1, respectively. Crop duration of the varieties ranged from 138-143 days. Five mungbean mutants along with two check varieties Binamoog-7 and Binamoog-8 were evaluated at two locations and out of these, two mutants N3J-305 and E4I-915 had consistent seed yield over locations and matured six days earlier than Binamoog-7 and Binamoog-8. Thirty five genotypes of lentil were screened at BINA sub-stations Magura and Ishurdi. Among these, fifteen were selected for further screening. Four rice genotypes viz., Binadhan-8, PBRC-37, NERICA-1 and NERICA-10 were evaluated with four levels of salinity viz., control, 6, 9 and 12 dSm-1. NERICA-1 and PBRC-37 showed better performance with respect to yield and yield attributes. Growth, morpho-physiological characters, yield attributes and seed yield were investigated in four soybean mutants viz., SBM-13, SBM-17, SBM-20 and SBM-22 along with a newly released variety, Binasoybean-1. High yielding genotypes have taller plant, higher number of branches, LA, TDM and AGR which resulted in higher number of pods plant-1 than the low yielding soybean genotypes; and among the genotypes, SBM-20 produced the highest seed yield due to superiority of yield attributes than the others. Precise N-application on the basis of nitrate reductase activity in Binatomato-6 demonstrated that 150 kg N ha-1 was sufficient for normal plant growth and development when urea was applied during 20-80 days after transplanting at 20 days intervals. Foliar application of chitosan growth regulator on maize (QPM-I) revealed that three spray with 100 ppm at different growth stages increased the yield in maize.
67

BINA Annual Report 2011-12 Crop Physiology
On-station trial of fine grain aromatic rice
One advanced mutants, KD5-18-150 and two check cultivars BRRI dhan34 and Kalizira were evaluated at different sub-stations of BINA viz., Magura, Comilla, Ishurdi, Rangpur, Mymensingh and Jamalpur for their yield performance during T. aman season of 2011. The experiments were conducted following RCBD design with four replications. The unit plot size of each experiment was 8 m × 5 m. Fertilizers such as Urea, TSP and MP were applied at the rate of 86, 90 and 30 kgha-1, respectively. Transplanting was done with 30-day-old seedlings having the hill spacing of 20 cm × 15 cm. Normal weeding and other cultural practices were done as and when necessary. At harvest, 10 hill plot-1 were randomly selected for collecting data of yield contributing characters. Grain yield plot-1 was finally converted into t ha-1. The height and panicle length of the rice genotypes were statistically insignificant (Table 1). The higher no. of effective tiller hill-1, higher number of filled grains panicle-1, higher grain size, harvest index as well as higher yield (t ha-1) were produced by the mutant KD5-18-150. Kalizira showed the lowest 1000-grain weight, grain yield and harvest index. BRRI dhan34 showed medium status. Among the genotypes, KD5-18-150 recorded the highest seed yield all over the locations compared to other genotypes (Table 2). Mutants KD5-18-150 produced the highest grain yield (4.0 t ha-1) at Mymensingh and the lowest in Rangpur (2.85 t ha-1) sub-station. Table 1. Means of yield contributing characters of three fine grain rice mutants/cultivars at six location of BINA
sub-stations and Mymensingh HQ during T. aman season of 2011
Mutant/varieties Plant height (cm)
Effective tiller hill-1
(no.)
Panicle length (cm)
Filled grainspanicle-1
(no.)
1000-grain weight
(g)
Grain yield
(t ha-1)
HI
(%) KD5-18-150 146.4 a 7.167 a 26.3 a 116.0 a 13.20 a 3.624 a 38.30 a BRRI dhan34 147.2 a 6.633 b 26.7 a 116.7 a 10.87 b 2.798 b 34.43 b Kalizira 146.9 a 6.167 b 24.3 a 97.0 b 11.33 c 2.174 c 32.23 c CV(%) 0.81 3.11 4.38 2.87 2.77 2.70 2.00
In a column, means followed by the same letter (s) do not differ significantly at 5% level. Table 2. Interaction of genotypes and locations on grain yield of three fine grain rice mutants/cultivars at six
locations of BINA sub-stations and Mymensingh HQ during T. aman season of 2011
Grain yield (t ha-1) Mutants/cultivars Ishurdi Rangpur Magura Comilla Mymensingh Jamalpur
KD5-18-150 3.01 d 2.85 e 3.8 b 3.55 c 4.00 a 3.77 b BRRI dhan34 2.4 ij 2.65 fg 2.66 f 2.52 hi 2.87 e 2.65 fg Kalizira 2.12 k 2.00 k 2.10 k 2.10 k 2.31 j 2.53 gh
In a column, means followed by the same letter(s) do not differ significantly at 5% level. Yield trial of fine grain aromatic rice genotypes in farmers’ field
One advanced mutants, KD5-18-150 and two check cultivars BRRI dhan34 and Kalizira were evaluated at different locations viz., Magura, Comilla, Ishurdi and Rangpur, for their yield performance during T. aman season of 2011. The experiments were conducted following RCB design
68

BINA Annual Report 2011-12 Crop Physiology
with four replications. The unit plot size of each experiment was 8 m × 5 m. Fertilizers such as Urea, TSP and MP were applied at the rate of 86, 90 and 30 kgha-1, respectively. Transplanting was done with 30-day-old seedlings having the hill spacing of 20 cm × 15 cm. Normal weeding and other cultural practices were done as and when necessary. At harvest, 10 hill plot-1 were randomly selected for collecting data of yield contributing characters. Grain yield plot-1 was finally converted into tha-1. KD5-18-150 recorded the highest seed yield all over the locations compared to other genotypes (Table 3). Mutants KD5-18-150 produced the highest grain yield (3.50 t ha-1) at Magura and Comilla and the lowest in Rangpur (2.83 t ha-1) due to the scarcity of irrigation facilities. Table 3. Interaction of genotypes and locations on grain yield of three fine grain rice mutants/cultivars at four
locations of farmers field during T. aman season of 2011
Grain yield (t ha-1) Mutants/cultivars Ishurdi Rangpur Magura Comilla KD5-18-150 3.16 b 2.83 c 3.50 a 3.45 a BRRI dhan34 2.72 cd 2.64 de 2.50 ef 2.43 f Kalizira 2.22 g 2.24 g 1.82 gh 2.05 g
In a column, means followed by the same letter(s) do not differ significantly at 5% level. Morpho-physiological evaluation of summer mungbean mutants
The experiments were conducted during Kharif-I season of 2012 at two locations viz., BINA sub-stations, Magura and Ishurdi with five mungbean mutants along with two check varieties Binamoog-7 and Binamoog-8 to evaluate the performance of genotypes through yield and yield attributes. The experiments were laid out following a RCB design with three replications having a unit plot size of 3 m × 2.0 m. Row to row and plant to plant distances were 30 cm and 10 cm, respectively. Urea, triple superphosphate and muriate of potash were applied at the rate of 40, 120 and 80 kgha-1, respectively at the time of final land preparation. Proper cultural practices were followed as and when necessary. Data on morphological and yield attributes were recorded at harvest from 10 randomly selected plants in each plot and seed yield was taken from the whole plot and converted into kgha-1. Data of different parameters showed significant differences among the genotypes in both the locations at P≤ 0.01 (Table 4). The highest number of pods plant-1 found in genotype N3J-305 (28.77) which was followed by genotypes E4I-915, Binamoog-8 and Binamoog-7 (Average 21.03) and the lowest was found in MB 1 (13.73). Out of seven, three genotypes N3J-305, E4I-915 and Binamoog-7 produced higher pod wt. plant-1 consequently higher seed pod-1, seed weight plant-1 and finally seed yield kg ha-1 in Magura. Though genotypes MB 1 and MB 13 produced larger seed but yield was lower due to lower number of pods plant-1, seeds pod-1 and seed weight plant-1. In Ishurdi, three genotypes N3J-305, E4I-915 and Binamoog-7 found higher number of pods plant-1 (25.05) while MB 1 recorded lower. In respect of seed yield, N3J-305 produced higher yield due to higher number of pods plant-1 and seed weight plant-1 which was followed by E4I-915 and Binamoog-7 and the lowest seed yield was produced by MB 1 due to lower number of pods plant-1, seed weight plant-1. In case of mean seed yield (kg ha-1) over locations, showed that N3J -305 produced the highest
69
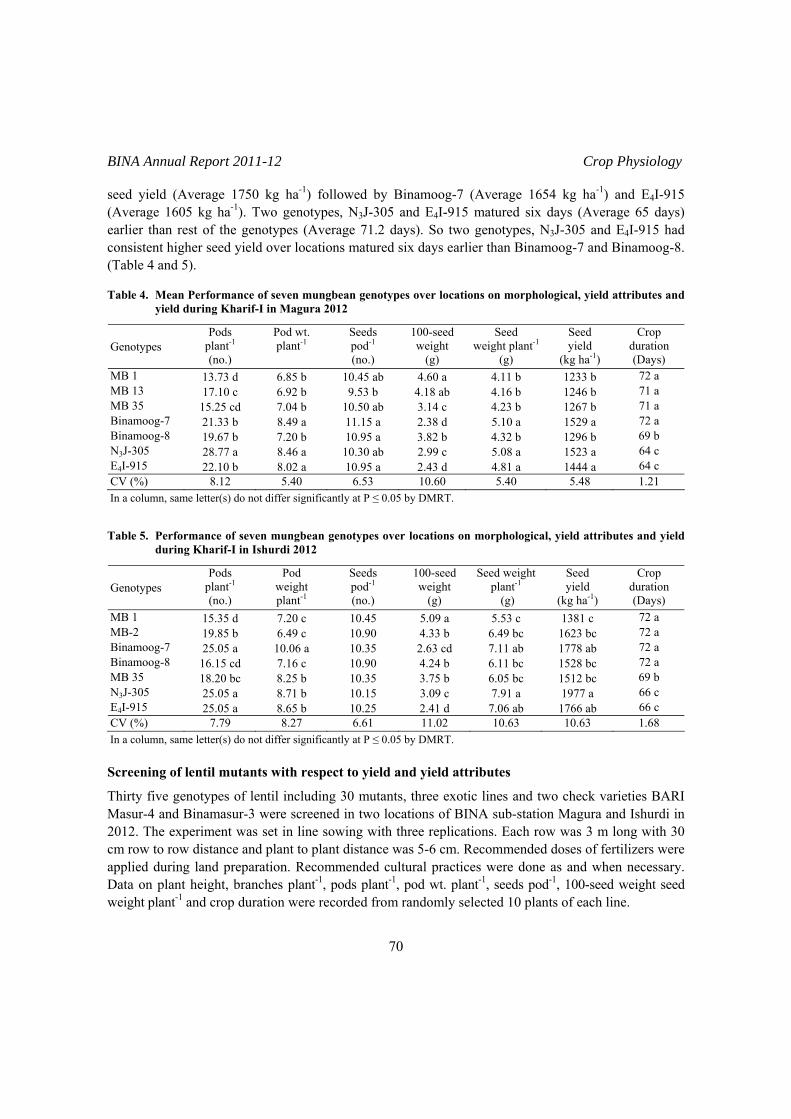
BINA Annual Report 2011-12 Crop Physiology
seed yield (Average 1750 kg ha-1) followed by Binamoog-7 (Average 1654 kg ha-1) and E4I-915 (Average 1605 kg ha-1). Two genotypes, N3J-305 and E4I-915 matured six days (Average 65 days) earlier than rest of the genotypes (Average 71.2 days). So two genotypes, N3J-305 and E4I-915 had consistent higher seed yield over locations matured six days earlier than Binamoog-7 and Binamoog-8. (Table 4 and 5). Table 4. Mean Performance of seven mungbean genotypes over locations on morphological, yield attributes and
yield during Kharif-I in Magura 2012
Genotypes Pods
plant-1
(no.)
Pod wt. plant-1
Seeds pod-1
(no.)
100-seed weight
(g)
Seed weight plant-1
(g)
Seed yield
(kg ha-1)
Crop duration (Days)
MB 1 13.73 d 6.85 b 10.45 ab 4.60 a 4.11 b 1233 b 72 a MB 13 17.10 c 6.92 b 9.53 b 4.18 ab 4.16 b 1246 b 71 a MB 35 15.25 cd 7.04 b 10.50 ab 3.14 c 4.23 b 1267 b 71 a Binamoog-7 21.33 b 8.49 a 11.15 a 2.38 d 5.10 a 1529 a 72 a Binamoog-8 19.67 b 7.20 b 10.95 a 3.82 b 4.32 b 1296 b 69 b N3J-305 28.77 a 8.46 a 10.30 ab 2.99 c 5.08 a 1523 a 64 c E4I-915 22.10 b 8.02 a 10.95 a 2.43 d 4.81 a 1444 a 64 c CV (%) 8.12 5.40 6.53 10.60 5.40 5.48 1.21
In a column, same letter(s) do not differ significantly at P ≤ 0.05 by DMRT. Table 5. Performance of seven mungbean genotypes over locations on morphological, yield attributes and yield
during Kharif-I in Ishurdi 2012
Genotypes Pods
plant-1
(no.)
Pod weight plant-1
Seeds pod-1
(no.)
100-seed weight
(g)
Seed weight plant-1
(g)
Seed yield
(kg ha-1)
Crop duration (Days)
MB 1 15.35 d 7.20 c 10.45 5.09 a 5.53 c 1381 c 72 a MB-2 19.85 b 6.49 c 10.90 4.33 b 6.49 bc 1623 bc 72 a Binamoog-7 25.05 a 10.06 a 10.35 2.63 cd 7.11 ab 1778 ab 72 a Binamoog-8 16.15 cd 7.16 c 10.90 4.24 b 6.11 bc 1528 bc 72 a MB 35 18.20 bc 8.25 b 10.35 3.75 b 6.05 bc 1512 bc 69 b N3J-305 25.05 a 8.71 b 10.15 3.09 c 7.91 a 1977 a 66 c E4I-915 25.05 a 8.65 b 10.25 2.41 d 7.06 ab 1766 ab 66 c CV (%) 7.79 8.27 6.61 11.02 10.63 10.63 1.68
In a column, same letter(s) do not differ significantly at P ≤ 0.05 by DMRT. Screening of lentil mutants with respect to yield and yield attributes
Thirty five genotypes of lentil including 30 mutants, three exotic lines and two check varieties BARI Masur-4 and Binamasur-3 were screened in two locations of BINA sub-station Magura and Ishurdi in 2012. The experiment was set in line sowing with three replications. Each row was 3 m long with 30 cm row to row distance and plant to plant distance was 5-6 cm. Recommended doses of fertilizers were applied during land preparation. Recommended cultural practices were done as and when necessary. Data on plant height, branches plant-1, pods plant-1, pod wt. plant-1, seeds pod-1, 100-seed weight seed weight plant-1 and crop duration were recorded from randomly selected 10 plants of each line.
70

BINA Annual Report 2011-12 Crop Physiology
The results revealed that out of 35 genotypes, 9 genotypes viz., E5M-1020, N5M- 568, N5M- 330, E2M-728, N4I- 404, N5I-504, N4I-411, E4I-925 and E1I-130 showed better performances in terms of number of pods plant-1 (82.15), number of seeds pod-1 (2.01) and seed weight plant-1 (3.34 g) in Magura (Table 6). In Ishurdi, the genotypes N5M-1027, N5M- 555, E2M-727, E1M-604, E5M- 1026, E1I-130, N5M- 330, E2M-720, E4I-925 and N4I-411 showed better performance in respect of number of pods plant-1, pod wt. plant-1, seed weight plant-1, 100-seed weight and number of seeds pod-1 (Table 7). It was observed that the genotypes E1I-130, N5M- 330, E4I-925 and N4I-411 showed better performance in both the locations. However, genotypes selected from each location should be tested further.
Table 6. Performance of some lentil genotypes on morphological, yield attributes and yield during Rabi season in Ishurdi 2012
Genotypes Plant height (cm)
Branches plant-1
(no.)
Pods plant-1 (no.)
Pod weight plant-1
Seeds pod-1
(no.)
100-seed weight
(g)
Seed wt. plant-1
(g)
Crop duration (Days)
E5M-1020 39.5 4.60 60.00 2.51 1.57 1.61 1.48 115 E2M-752 33.7 4.30 48.87 2.71 1.50 1.49 1.59 115 N5M-560 32.0 3.83 60.33 2.74 1.67 1.52 1.61 114 N5M-1027 39.2 4.50 62.40 3.27 1.53 1.75 1.85 114 N5M- 555 30.7 3.97 74.80 3.79 1.43 1.82 2.10 113 E3M-819 30.6 4.47 64.33 3.02 1.70 1.68 1.78 114 E5M- 1042 33.3 4.30 51.00 1.82 1.63 1.49 1.07 115 N5M- 546 30.6 4.13 52.73 2.40 1.57 1.41 1.41 109 N5M- 568 40.1 4.60 60.20 2.60 1.50 1.64 1.53 113 N3M-320 34.6 4.47 58.73 2.84 1.70 1.79 1.67 114 N5M- 564 36.6 3.87 59.60 2.27 1.57 1.40 1.33 114 E2M-727 39.9 5.10 64.00 3.83 1.50 1.77 2.16 114 E4I-1016 33.9 4.33 62.33 2.90 1.60 1.80 1.71 114 E1M-604 38.1 4.47 70.00 3.17 1.50 1.86 1.87 114 N5M- 505 37.0 4.73 54.67 2.29 1.43 1.65 1.34 113 E5M- 1026 38.9 5.13 68.00 3.08 1.57 1.56 1.81 115 E1I-130 33.9 4.60 85.33 3.10 1.53 2.03 1.83 114 N5M- 330 40.2 5.20 70.20 3.15 1.70 1.78 1.85 113 BARI Masur-4 50.2 5.60 78.83 3.06 1.67 2.05 1.80 114 E4I-704 32.3 4.47 45.80 2.42 1.37 1.80 1.42 113 E3I-316 34.3 4.67 53.53 2.46 1.70 1.75 1.45 108 N4I-415 30.9 4.33 63.80 2.54 1.73 1.62 1.50 114 N4M-412 33.6 5.00 61.33 2.83 1.57 1.86 1.66 110 E2M-728 33.9 4.93 51.00 2.25 1.80 1.72 1.32 111 N4I- 404 39.7 5.20 67.33 2.58 1.50 1.57 1.52 109 E2M-720 37.8 5.93 76.13 3.50 1.60 1.59 1.95 113 Binamasur-3 38.0 5.53 61.67 2.44 1.70 1.58 1.43 112 E5M- 501 36.3 5.53 60.20 3.17 1.50 1.63 1.78 107 N5I-504 34.7 5.40 64.67 3.20 1.70 1.70 1.88 113 N4M-540 32.6 4.73 72.00 2.75 1.50 1.78 1.62 109 N4I-411 36.9 5.07 63.67 3.54 1.57 2.15 1.97 112 E4I-925 36.5 5.07 71.47 3.40 1.73 2.01 1.92 116 RTP-635 37.1 4.20 48.20 2.46 1.40 2.16 1.44 113 IC-4414 34.7 4.47 61.00 2.81 1.70 1.74 1.65 117 IC-44251 32.5 4.33 81.33 3.14 1.70 1.69 1.75 114 LSD 0.05 2.432 0.4608 9.437 0.3958 0.1858 0.0728 0.2304 2.263 CV (%) 4.16 5.98 9.17 8.52 7.28 2.27 8.50 1.23
71

BINA Annual Report 2011-12 Crop Physiology
Table 7. Performance of some lentil genotypes on morphological, yield attributes and yield during Rabi season in Magura 2012
Genotypes Plant height (cm)
Branches plant-1 (no.)
Pods plant-1 (no.)
Pod weight plant-1
Seeds pod-1 (no.)
100-seed weight
(g)
Seed weight plant-1
(g)
Crop duration (Days)
E5M-1020 44.97 8.40 96.80 1.60 2.01 1.62 3.29 117 E2M-752 39.20 7.33 67.67 1.53 1.44 1.64 2.35 117 N5M-560 43.40 6.80 72.00 1.63 1.62 1.61 2.75 116 N5M-1027 43.07 5.13 55.40 1.60 1.47 1.79 2.41 116 N5M- 555 42.30 5.67 69.67 1.57 1.79 1.82 2.93 115 E3M-819 44.60 5.73 61.90 1.73 1.62 1.69 2.65 116 E5M- 1042 42.93 6.53 67.20 1.70 1.53 1.76 2.51 116 N5M- 546 42.07 6.00 55.87 1.57 1.25 1.73 2.05 111 N5M- 568 45.00 6.13 88.80 1.50 1.87 1.49 3.06 115 N3M-320 44.67 6.33 61.67 1.67 1.51 1.62 2.47 116 N5M- 564 45.80 6.80 66.67 1.60 1.00 1.61 1.63 115 E2M-727 43.93 6.93 67.40 1.57 1.24 1.57 2.03 116 E4I-1016 41.73 6.07 65.00 1.57 1.53 1.72 2.50 115 E1M-604 47.00 7.00 63.33 1.53 1.48 1.57 2.42 116 N5M- 505 40.07 6.87 67.20 1.40 1.54 1.63 2.52 115 E5M- 1026 42.60 7.17 71.00 1.67 1.64 1.56 2.68 116 E1I-130 44.27 5.67 50.20 1.57 2.06 1.75 3.37 115 N5M- 330 41.87 7.00 77.33 1.63 1.93 1.75 3.16 114 BARI Masur-4 39.80 7.93 79.67 1.60 1.85 1.91 3.02 116 E4I-704 45.73 6.00 57.90 1.43 1.40 1.46 2.30 115 E3I-316 45.20 5.87 67.83 1.63 1.28 1.81 2.09 109 N4I-415 41.60 6.40 78.33 1.63 1.83 1.62 2.99 114 N4M-412 45.73 5.87 77.00 1.53 1.73 1.74 2.82 108 E2M-728 43.67 7.10 77.33 1.73 1.92 1.58 3.14 113 N4I- 404 42.47 6.20 87.67 1.53 2.16 1.60 3.53 111 E2M-720 43.07 5.07 68.40 1.67 1.51 1.73 2.46 113 Binamasur-3 44.60 7.33 66.00 1.63 1.57 1.67 2.56 114 E5M- 501 42.33 5.57 52.00 1.57 1.04 1.63 1.71 109 N5I-504 44.93 5.93 79.47 1.63 2.01 1.65 3.49 115 N4M-540 41.27 6.07 51.53 1.43 1.55 1.71 2.70 112 N4I-411 42.67 6.00 86.00 1.63 1.96 2.11 3.40 114 E4I-925 45.40 5.40 95.77 1.67 2.16 1.66 3.63 117 RTP-635 41.93 4.80 53.93 1.47 1.26 1.77 2.05 115 IC-4414 42.53 5.67 64.33 1.63 1.87 1.67 3.06 117 IC-44251 45.57 6.20 71.40 1.60 1.80 1.57 3.02 116 LSD 0.05 5.912 1.765 9.856 0.1262 0.2186 0.2822 0.3607 1.989 CV (%) 8.37 17.16 8.68 4.81 8.16 10.36 8.18 1.07 Effect of salinity on four rice genotypes with respect to yield and yield attributes
A pot experiment was carried out at BINA pot experiment yard with four rice genotypes viz., Binadhan-8, PBRC-37, NERICA-1 and NERICA-10 in boro season 2012 to evaluate the effect of salinity on ion absorption and yield attributes. The experiment was set following CRD with four replications. To establish the experiment perforated pots were filled up with 8 kg well mixed soil with cow dung and fertilizer @ 50N, 25 P and 25 K mg kg-1 of soil. A polythene shade was established
72

BINA Annual Report 2011-12 Crop Physiology
above the experiment area to avoid the rain water. Eight filled pots were set in each glass fibre tray and filled the tray with water up to the neck of the pot. Sprouted three seeds were sown in each pot. Recommended cultural practices were done as and when necessary. Four levels of salinity viz. 0, 6, 9 and 12dSm-1 were imposed at maximum tillering stage and remained up to the harvest. To collect data different samples have been collected at final harvest. Results showed that NERICA-1 produced the highest grain weight hill-1 due to higher panicle hill-1, panicle length and 1000-grain wt. which was followed by PBRC-37 and the lowest grain yield was obtained in Binadhan-8 due to lower panicle hill-1, panicle length and 1000-grain wt. (Table 8). Plant height, total tiller hill-1, panicle hill-1, filled grain and grain wt. hill-1 decreased significantly with increasing salinity level except panicle length and unfilled grain panicle-1 due to the effect of different levels of salinity. Panicle length showed highest at 9 dSm-1. So, results revealed that NERICA-1 and PBRC-37 found better under salinity up to 12 dSm-1 with respect to yield and yield attributes. Table 8. Effect of salinity on morphological and yield attributes at reproductive stage in four rice genotypes in
2012
Treatments Plant height (cm)
Total tiller hill-1
(no.)
Panicle hill-1
(no.)
Panicle length (cm)
Filled grain panicle-1
(no.)
Unfilled grain panicle-1
(no.)
1000-grain weight
(g)
Grain weight hill-1
(g) Genotypes Binadhan-8 76.44 d 23.88 c 11.69 c 20.79 d 73.73 a 20.65 b 20.53 c 7.46 c PBRC-37 87.13 b 27.81 a 13.13 b 21.18 b 74.3 a 19.65 c 22.06 b 8.89 b NERICA-1 90.44 a 26.5 b 13.56 a 21.61 a 70.86 b 22.38 a 22.31 a 10.38 a NERICA-10 77.66 c 24.13 c 11.69 c 20.91 c 60.9 c 22.08 a 22.13 ab 8.39 b Salinity (dSm-1) Control 92.22 a 28.38 a 15 a 21.5 b 89.74 a 13.09 d 25.88 a 15.15 a 6 84.94 b 26.63 b 13.13 b 20.76 c 75.07 b 13.88 c 22.01 b 9.36 b 9 82.35 c 25.19 c 12.44 c 21.57 a 65.79 c 20.73 b 20.19 c 7.14 c 12 72.16 d 22.13 d 9.5 d 20.66 d 49.19 d 37.06 a 18.96 d 3.46 d CV% 1.70 2.09 3.77 0.26 2.71 2.87 1.28 7.12 In a column, same letter(s) do not differ significantly at P ≤ 0.05 by DMRT.
Evaluation of soybean genotypes based on morpho-physiolocal criteria
The experiment was conducted with 4 soybean mutants viz. SBM-13, SBM-17, SBM-20 and SBM-22 along with a check variety Binasoybean-1 at BINA farm, Mymensingh during the period from 11 January to 30 May 2012. The experiment was laid out in a RCB design with 3 replications. The size of the unit plot was 3 m × 4 m. Distances between block to block and plot to plot were 1.0 and 0.5 meter, respectively. Urea, triple super phosphate (TSP), muriate of potash (MOP) and gypsum were used as source of nitrogen, phosphorus, potassium and sulphur @ 40, 120, 80 and 40 kg ha-1, respectively. Total amount of Urea, TSP, MOP and gypsum were applied at basal doses during final land preparation. The seeds of five soybean genotypes were hand sown in rows on 11 January 2012. Plant protection measures were taken at 45 and 60 DAS against fruit and shoot borer by spraying Diapam 60 EC @ 0.25%. To study ontogenetic growth characteristics, a total of six harvests were made and at final harvest, data were collected from randomly selected 10 plants from each plot on some morpho-
73

BINA Annual Report 2011-12 Crop Physiology
physiological parameters, yield attributes and yield. The first crop sampling was done for collecting data on growth parameter at 35 DAS and continued at an interval of 10 days up to 110 DAS i.e. till attaining physiological maturity. From each sampling, five plants were randomly selected from each plot and uprooted for collecting necessary parameters. The plants were separated into leaves, stems and roots and the corresponding dry weight were recorded after oven drying at 80 ± 2°C for 72 hours. The leaf area of each sample was measured by LICOR automatic leaf area meter (Model: LICOR 3000). The growth analyzing attribute like AGR, RGR and NAR were calculated using the formulae of Radford (1967). The collected data were analyzed statistically following the analysis of variance (ANOVA) technique and the mean differences were adjusted with Duncan’s Multiple Range Test (DMRT) using the statistical computer package program, MSTAT-C. The ontogenetic plant height, leaf area and total dry mass production of soybean genotypes differed significantly at all growth stages (Table 9-11). Of the mutants/variety, SBM-20 was the tallest (63.3 cm) whilst Binasoybean-1 was the shortest (40.3 cm) of all. The maximum number of branches, leaf area and TDM plant-1 as well as biological yield was observed in SBM-20 whilst the lowest was recorded in BINAsoybean-1. However, total dry mass and leaf area increased till 80 DAS. Results also indicated that high yielding genotypes showed higher in TDM and LA than the low yielding ones. In present study, the high yield genotypes showed higher of branches plant-1. The variation in growth parameters like AGR and RGR of soybean genotypes were significant at all growth stages (Table 12-13). AGR increased till 70-80 DAS followed by a decline with age. On the other hand, the RGR and NAR showed higher values at early growth stages and declined latter on (Table 13-14). The mutant SBM-20 showed the advance in AGR and RGR at most of the growth stages compared to others. In contrast, Binasoybean-1 showed lesser in case of AGR but reverse trend was observed in RGR over its growth period. The lower value of AGR at initial stages of growth was the result of lower LAI. At 80 DAS, the AGR value was found to be maximum which mean that plants expanded it’s assimilate for the growth of leaf area for feeding of pods. The declining of AGR after reaching the maximum in all genotypes might be the result of abscission of leaves. Pod number, the most important yield attribute, was found significant difference among the genotypes. Results revealed that high yielding genotypes produced higher numbers of pods plant-1 (Table 15). SBM-20 produced the highest number of pods plant-1 (23.1) whilst SBM-17 produced the lowest (19.2 plant-1). The mutant SBM-20 produced highest seed yield plant-1 (8.51g plant-1) as well as seed yield hectare-1 (2.84 t ha-1) followed by SBM-13 (7.62g plant-1 and 2.54 t ha-1). In contrast, Binasoybean-1 produced the lowest seed yield (6.65g plant-1 and 2.22 t ha-1) due to fewer pods plant-1. However, in case of unit area basis, result revealed that seed yield ha-1 was rationale to seed yield plant-1. Further, the low yielder genotypes, Binasoybean-1 showed the highest harvest index (36.9%). High HI always does not contribute to high yield, high yield is determined by physiological process leading to a high net accumulation of photosynthates and it’s partitioning into plant and seed. This opinion has been reflected in the present study. Here, SBM-20 was high yielder mutant and also showed lower HI.
74

BINA Annual Report 2011-12 Crop Physiology
Table 9. Plant height at different age in five soybean mutants/variety
Plant height (cm) at different days after sowing Variety/mutants 40 50 60 70 80 90 Binasoybean-1 17.2 b 27.4b 30.0b 33.2b 40.3c 45.3c SBM-13 21.1 a 35.9a 38.6a 42.6a 47.1b 53.2b SBM-17 20.0ab 32.9a 38.4a 44.6a 63.0b 50.1bc SBM-20 21.3 a 34.9a 40.6a 50.9a 63.3a 65.1a SBM-22 18.6ab 35.0a 42.7a 45.4a 48.5 b 51.6bc F-test ** ** ** ** ** ** CV (%) 6.96 9.29 8.87 10.45 3.94 6.42
Same letter(s) in a column do not differ significantly at P ≤ 0.05 by DMRT. ** indicate significance at 1% level of probability. Table 10. Leaf area production at different days after sowing in five mutants/ variety soybean
Leaf area (cm2) plant-1 at different days after sowing Variety/mutants 40 50 60 70 80 90 Binasoybean-1 83.9d 333.3c 633.9c 1230.1d 1431.8c 1118.7c SBM-13 106.6bc 361.6bc 893.5c 1230.1d 1435.1d 1245.9b SBM-17 149.3a 400.0a 1603.1a 1171.1d 2653.1a 1220.0bc SBM-20 152.2b 495.4b 1632.0b 1478.9a 2683.0a 1320.0a SBM-22 92.5cd 335.7c 760.8d 1681.9b 2090.7b 1122.0c F-test ** ** ** ** * * CV (%) 9.18 10.54 5.97 3.21 3.39 4.59
Same letter(s) in a column do not differ significantly at P ≤ 0.05 by DMRT. ** indicate significance at 1% level of probability. Table 11. Total dry mass production as influenced by genotypes of soybean at different days after sowing
Total dry mass plant-1 (g) at different days after sowing Variety/Mutants 40 50 60 70 80 90 Binasoybean-1 5.7b 7.0b 10.0b 13.6c 21.1b 31.8b SBM-13 7.0a 9.6a 12.8a 15.7b 22.8b 33.3b SBM-17 6.6a 9.3a 12.8a 14.7b 21.7b 33.4b SBM-20 7.0a 10.0a 13.4a 21.1a 26.9a 41.7a SBM-22 6.2ab 9.7a 12.2a 16.1b 22.2b 33,8b F-test ** * ** ** ** ** CV (%) 6.96 6.8 8.86 3.95 4.58 1.26
Same letter(s) in a column do not differ significantly at P ≤ 0.05 by DMRT. *, ** indicate significance at 5% and 1% level of probability, respectively. Table 12. Effect of genotypes on absolute growth rate at different growth stages in soybean
Absolute growth rate (mg plant-1 day-1) at different days after sowing Variety/mutants 40-50 50-60 60-70 70-80 80-90 Binasoybean-1 57 c 73 d 136 d 297 b 168 b SBM-13 75 b 122 b 278 b 327 c 250 a SBM-17 85 a 99 c 195 c 390 b 155 b SBM-20 79 ab 147 a 344 a 400 b 211 a SBM-22 75 b 126 b 255 b 461 a 164 b F-test ** ** ** ** ** CV (%) 5.25 10.86 11.30 6.95 12.48
Same letter(s) in a column do not differ significantly at P ≤ 0.05 by DMRT. ** indicate significance at 1% level of probability.
75

BINA Annual Report 2011-12 Crop Physiology
Table 13. Relative growth rate at different growth stages in five soybean mutants/variety
Relative growth rate (mg g-1 day-1) at different days after sowing Variety/mutants 40-50 50-60 60-70 70-80 80-90
Binasoybean-1 138.6 a 52.9 c 75.2 b 72.0 a 26.1 a SBM-13 130.2 b 78.1 a 80.4 ab 50.1 c 26.3 a SBM-17 132.0 ab 61.7 b 64.5 c 66.8 b 17.7 b SBM-20 134.0 ab 76.5 a 84.4 a 51.1 c 19.1 b SBM-22 127.7 b 79.4 a 74.6 b 67.5 ab 16.0 b F-test ** ** ** ** ** CV (%) 6.22 4.13 5.24 3.94 11.35
Same letter(s) in a column do not differ significantly at P ≤ 0.05 by DMRT. ** indicate significance at 1% level of probability. Table 14. Net assimilation rate at different growth stages in five soybean mutants/variety
Net assimilation rate (mg dm2 day1) at different days after sowing Variety 40-50 50-60 60-70 70-80 80-90
Binasoybean-1 70.19c 74.07b 40.46b 49.20a 53.03ab SBM-13 131.14b 54.03bc 27.77c 55.19a 60.96a SBM-17 76.97c 35.31d 18.21d 23.36c 40.18c SBM-20 117.92d 42.84cd 53.7a 27.45bc 48.65bc SBM-22 178.70a 83.67a 20.63d 35.00b 53.58ab F-test ** ** ** ** ** CV% 15.39 12.58 1082 13.43 10.19
Same latter(s) in a column do not differ significantly at P ≤ 0.05 by DMRT. ** Indicate significance at 1% level of probability. Table 15. Some morpho-physiological characters and yield components and seed yield in five soybean mutants
/variety
Variety/mutants Branches
plant-1 (no)
Biological yield plant-1
(g)
Pods plant-1 (no)
Seeds pod-1 (no)
100-seed weight
(g)
Seed weight plant-1
(g)
Seed yield (tha-1)
Harvest index (%)
Binasoybean-1 2.33 ab 12.86 b 19.4 b 2.81 12.2 d 6.65 c 2.22 c 36.9 a SBM-13 2.33 b 113.67 b 21.3 ab 2.84 12.6 c 7.62 b 2.54 ab 35.3 a SBM-17 2.20 ab 13.66 b 19.2 b 2.57 14.0 a 6.90 bc 2.30 bc 30.2 b SBM-20 3.00 a 16.70 a 23.1 a 2.75 13.4 b 8.51 a 2.84 a 31.2 b SBM-22 2.53 ab 13.00 b 21.9 ab 2.63 12.8 c 7.37 bc 2.46 b 31.3 b F-test ** ** * NS * ** ** ** CV (%) 13.04 2.89 7.78 4.98 5.69 5.00 6.26 4.98
Same letter(s) in a column do not differ significantly at P ≤ 0.05 by DMRT. *, ** indicate significance at 5% and 1% level of probability, respectively; NS = Not significant. Determination of nitrogen requirement for Binatomato-6 based on nitrate reductase activity
The experiment was conducted at BINA farm, Mymensingh during Rabi season of 2011-2012 to determine the accurate metabolic requirement of nitrogen by tomato variety for its optimal productivity on the basis of a key enzyme for nitrate assimilation, the nitrate reductase (NR). Binatomato-6 was selected as test crop. Three five doses viz., 0, 50, 100 150 and 200 kg N ha-1 were used. Nitrogen was
76

BINA Annual Report 2011-12 Crop Physiology
applied as urea. Urea was applied in four equal splits at 20, 40, 60 and 80 days after transplanting (DAT). Nitrate reductase activity was determined from 30 DAT to every 10 days interval up to final harvest. Data on fruit yield were also recorded. Results showed that NRA varied significantly due to different N-doses at all growth stages. NRA increased with plant age till flowering and fruiting stages (70 DAT) followed by a decline (Table 16). NRA with the higher doses of N indicating higher biological activity at those doses of 150 and 200 kg N ha-1. Results indicated that N requirement was the maximum during flowering and fruit development stages. Therefore, final application of urea should be before flowering finishing and fruit development stages. The highest fruit yield as well as straw yield was recorded in 200 kg N ha-1 due to production of increased number of fruits plant-1 that was statistically similar to 150 kg N ha-1. Therefore, 150 kg ha-1 was sufficient for normal plant growth and development if urea was applied frequently with 20 days interval.
Fig. 1. Ontogenetic nitrate reductase activity as influenced by N-doses Table 16. Effect of different levels of nitrogen on yield attributes and yield in tomato
N-doses (kg ha-1) Fruits plant-1(no.)
Single fruit wt. (g)
Fruit wt. plant-1
(kg) Fruit yield
(t ha-1) Straw wt. plant-1
(g) 0 30.0b 770c 1.00c 35.0c 37.67d 50 13.5b 815c 1.10c 39.6c 40.06cd 100 16.0a 955b 1.53b 55.1b 49.30b 150 17.6a 1080a 1.90a 68.4a 60.65a 200 17.5a 1115a 1.95a 70.2a 62.24a
In a column, same letter(s) do not differ significantly at P ≤ 0.05 by DMRT. Effect of different levels of Chitosan application on yield of maize
The experiment was conducted at the farmers field, Mymensingh, Bangladesh during the period from December 2011 to April 2012 to investigate the response of grain yield to different concentrations of Chitosan growth promotor. Quality protein maize-1 (QPM-1) was used as planting material. Five different concentrations of Chitosan viz., 0. 50, 75, 100 and 125 ppm were sprayed three times at 40,
77

BINA Annual Report 2011-12 Crop Physiology
55 and 70 days after sowing (DAS). In control, water was sprayed as per treatment. The experiment was laid out in a randomized complete block design with three replications. The unit plot size was 4 m × 5 m. Plant spacing was 70 cm × 30 cm. Fertilizers such as urea, TSP, MOP and gypsum were applied @ 285, 250, 180 and 40 kg ha-1, respectively. Urea was applied in three splits at 30, 50 and 70 DAS and other fertilizers were applied as basal dose during final land preparation. Other cultural practices such as weeding and pest control were done as and when necessary for normal plant growth and development. Chitosan concentration had significant effect on plant height, biological yield, harvest index, yield components and seed yield in maize except number of cobs plant-1 (Table 17). Results revealed that all the plant parameters were greater in Chitosan applied plants than control plants except 50 ppm Chitosan. The highest plant height (218 cm), biological yield (278.0 g plant-1), yield attributes (except 100-seed weight) and seed yield (6.32 t ha-1) was recorded in 100 ppm followed by 125 ppm amd 75 ppm. The seed yield was higher in 100 ppm Chitosan might be due to increase number of seeds cob-1. In contrast, the lowest above mentioned parameters was recorded in control plants where no Chitosan was sprayed. Further, the highest 100-grain weight and harvest index wererecorded in 125 ppm Chitosan indicating dry matter partitioning to economic yield was better in 125 ppm concentration than the other concentrations. However, the grain and biological yield was lower in 125 ppm than 100 ppm Chitosan indicating application of Chitosan @ 125 ppm may be toxic for maize production. So, Chitosan may be applied thrice @ 100 ppm for increased grain yield of maize after few more field trials. Table 17. Effect of different levels of Chitosan on some morphological characters, yield attributes and seed yield
in maize cv. QPM-1
Concentration Plant height (cm)
Biological yield plant-1
(g)
Seeds cob-1
(no.)
100-seed weight
(g)
Seed yield
(t ha-1) 0 190.0c 235.5c 456.2b 22.94d 5.10c 50 188.0c 299.3c 436.2c 23.31cd 4.64d 75 211.0b 258.8b 450.0b 24.08bc 5.59bc 100 218.0a 278.0a 511.7a 23.95b 6.32a 125 212.0ab 255.6b 460.7b 25.08a 5.95ab
In a column, same letter(s) do not differ significantly at P ≤ 0.05 by DMRT.
78

SOIL SCIENCE DIVISION

BINA Annual Report 2011-12 Soil Science
80

BINA Annual Report 2011-12 Soil Science
RESEARCH HIGHLIGHTS Due to site-specific variations in land management practices, differences were found in soil texture, organic carbon, total nitrogen, available phosphorus, available sulfur and exchangeable cations (Ca, K and Na) within the soils of Pabna district of Ganges River Floodplain area. Arsenic contamination was found in the soils of the Ganges River Floodplain area. Results recommend a careful consideration for irrigation waters during irrigation. An augmentation of crop yields was observed due to 25% increase of N, P, K and S fertilizers with a few exceptions. Incorporation of press mud and/or tobacco dust @ 2 t ha-1 along with recommended fertilizer dose for MYG recorded identical grain yield of boro and T. aman compared to fertilizers applied for HYG. In case of HYG, IPNS based recommended fertilizers with press mud or tobacco dust @ 2 t ha-1 performed better compared to those with full dose of chemical fertilizer. 25% potassium fertilizers may be reduced due to addition of rice straw from the previous crop along with recommended doses of NPKS fertilizers were found the best for T. Aman rice production as well as K mining from the soil. Balu river water contains acceptable amount of pH and NO3 whereas, the EC, Ca, Mg, PO4, and Fe exceeded the recommended limit for drinking water, irrigation water and for aquaculture. The overall concentration of heavy metals in Balu river water showed the trend: Zn > Ni > Cd > Pb > Cr. The highest values of different heavy metals found at Termuni area whereas the lowest values were found at Demra Ghat. Within 4 weeks of incubation, a rapid decrease in dry matter was observed with losses of about 59% in soybean, 57% in lentil and 47% in mungbean. On average 51.67% N remained in soybean residue, whereas in lentil and mungbean the value of %N remaining was 54.60 and 61.33 respectively. PGPR biofertilizer along with cow dung and poultry manure can substitute 40% nitrogen application in rice cultivation. P20B3Mo2 along with rhizobial inoculant can be applied for sustainable mungbean cultivatioin. External use of 50% P fertilizer can be saved either from TSP or cow dung (CD) with the application of phosphatic biofertilizer with 50% P from TSP or CD for the cultivation of lentil, chickpea and boro rice, respectively.
81

BINA Annual Report 2011-12 Soil Science
SOIL MANAGEMENT AND BIOFERTILIZER Evaluation of Soil Characters for Assessment of Land Degradation Situation in Bangladesh
Evaluation of Soil Characters for Assessment of Land Degradation Situation in Pabna district
A study was initiated to evaluate the changes in soil characters over time for the assessment of land degradation situation in Bangladesh. The study was based on the selected sampling sites of Reconnaissance Soil Survey Reports of SRDI staffs, (1963-75) and Kawaguchi and Kyuma (1977). Based on those previous sites, soil samples from the same sites/series were collected from Pabna district during January, 2010. The sampled soil series covered part of the Ganges River Floodplain Soils and a brief description of the soil series is presented in Table 1. Table 1. Description of the soil series in terms of morphology and land uses at different locations of Ganges
River Floodplain area
Soil series Sa P La Present land use mpling Location hysiographic unit nd type Sara Baserpata, Sahapur, Ishurdi, Pabna Ganges River Highland Fruits garden/
veFloodplains getables Gopalpur Medium highland BoIshurdi i, Muladuli, Ishurdi Pabna Medium lowland Bo Gh o bna , Lowland Bo
Radhanagar, Sadar, Pabna Saraikad
,, ,,
ro-F-T. aman ro-F-T. aman
ior J tkan, Hemayetpur, Sadar, Pa , ro-F-T. aman The soi mp ile basis from ion and ta the la for ph nd ls were then dri at room c thro sis. The so ples we zed followin dard me viz.: drometer and soil lass elec ter, organic carbon by wet Oxidation and total nitrogen by micro-Kjeldahl method, availa hosphorus
l saysical a
les were collected on a prof chemical analysis. The soi
each located
ken totemperature, pro
boratoryessed and passed
ugh 10 mthods,
m sieve and stored for analy particle size distribution by a hy
il sam re analypH by g
g stantrode pH meble p
and available sulfur were extracted from the soil by dilute acid solutions and exchangeable cations e.g. Ca, K and Na were determined by ammonium acetate extraction method. The results of the soil characters were calculated on a profile basis. The mean and ranges of surface soil characters are presented in Table 2. Table 2. Mean and ranges of characters of some selected soil series of Ganges River Floodplains during the
period 2010
Soil characters Mean Range Sand (%) Silt (%)
(%)
36.9 23.4-55.4 39.0 24.1
33.0-48.0 11.6-38.6 Clay
Texture Silt loam to Clay loam soil pH
pm) ppm)
me %) me %)
e %)
7.30
7.20-7.49
1 0
Organic C (%) Total N (%) Avail-P (pAvail-S (Exch. Ca (Exch. K (
. Na (mExch
1.35 0.13 17.9623.6317.5 0.58 0.52-0.65 0.96
0.56-2.02 0.02-0.28.54-29.9614.30-32.115.0-22.50
0.73-1.24
82
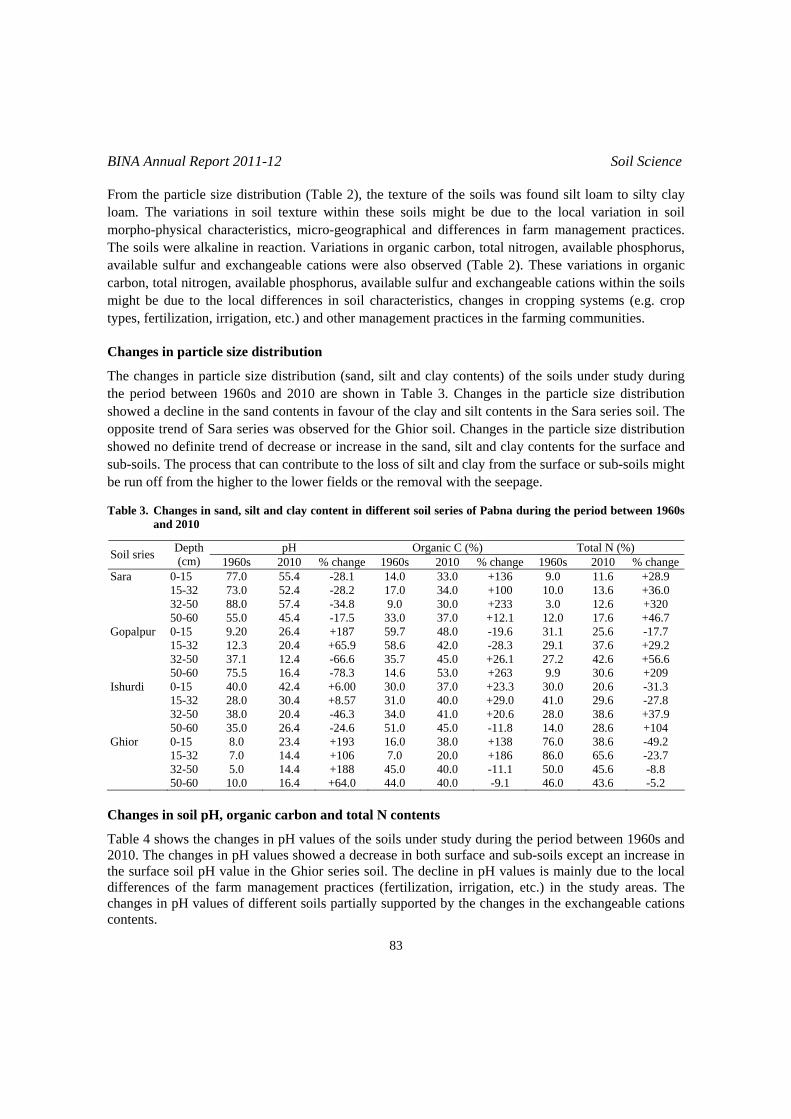
BINA Annual Report 2011-12 Soil Science
From the particle size distribution (Table 2), t xture of the soils was fo am to silty clay riations in soil texture within t soils might be due to t ariation in soil cal characteristics, micro-geogr l and differences in far ent practices.
lkaline in reaction. Variations ganic carbon, total nitrog phosphorus, and exchangeable cations we observed (Table 2). T tions in organic
. The pposite trend of Sara series was observed for the Ghior soil. Changes in the particle size distribution
increase in the sand, silt and clay contents for the surface and
he te und silt loloam. The va hese he local vmorpho-physi aphica m managemThe soils were a in or en, available available sulfur re also hese variacarbon, total nitrogen, available phosphorus, available sulfur and exchangeable cations within the soils might be due to the local differences in soil characteristics, changes in cropping systems (e.g. crop types, fertilization, irrigation, etc.) and other management practices in the farming communities. Changes in particle size distribution
The changes in particle size distribution (sand, silt and clay contents) of the soils under study during the period between 1960s and 2010 are shown in Table 3. Changes in the particle size distribution showed a decline in the sand contents in favour of the clay and silt contents in the Sara series soiloshowed no definite trend of decrease orsub-soils. The process that can contribute to the loss of silt and clay from the surface or sub-soils might be run off from the higher to the lower fields or the removal with the seepage. Table 3. Changes in sand, silt and clay content in different soil series of Pabna during the period between 1960s
and 2010
pH Organic C (%) Total N (%) Soil sries Depth (cm) 1960s 2010 % change 1960s 2010 % change 1960s 2010 % change
Sara 0-15 77.0 55.4 -28.1 14.0 33.0 +136 9.0 11.6 +28.9 15-32 73.0 52.4 -28.2 17.0 34.0 +100 10.0 13.6 +36.0
9.20 26.4 +187 59.7 48.0 -19.6 31.1 25.6 -17.7 1 12.3 +65.9 58.6 28.3 29.1 +29.2 3
hurdi
hior
32-50 88.0 57.4 -34.8 9.0 30.0 +233 3.0 12.6 +320 50-60 55.0 45.4 -17.5 33.0 37.0 +12.1 12.0 17.6 +46.7 Gopalpur 0-15
5-32 2-50
20.4 42.0 - 37.6 37.1 12.4 -66.6 35.7 45.0 +26.1 27.2 42.6 +56.6
50-60 75.5 16.4 -78.3 14.6 53.0 +263 9.9 30.6 +209 Is 0-15 40.0 42.4 +6.00 30.0 37.0 +23.3 30.0 20.6 -31.3 15-32 28.0 30.4 +8.57 31.0 40.0 +29.0 41.0 29.6 -27.8 32-50 38.0 20.4 -46.3 34.0 41.0 +20.6 28.0 38.6 +37.9 50-60 35.0 26.4 -24.6 51.0 45.0 -11.8 14.0 28.6 +104 G 0-15 8.0 23.4 +193 16.0 38.0 +138 76.0 38.6 -49.2 15-32 7.0 14.4 +106 7.0 20.0 +186 86.0 65.6 -23.7 32-50 5.0 14.4 +188 45.0 40.0 -11.1 50.0 45.6 -8.8 50-60 10.0 16.4 +64.0 44.0 40.0 -9.1 46.0 43.6 -5.2 Changes i H, nic n a al N tent
sh he ch s in alue e s nder study du he p be 9 d 10. The s in valu owe crea bot ace ub-s xcept an inc in e surface H v in th ior soi dec p es inly due to th l fferences fa ana nt practices (fertilizati riga etc.) in the are he
y the changes in the exchangeable cations
n soil p orga carbo nd tot con s
Table 4 ows t ange pH v s of th oils u ring t eriod tween 1 60s an20 change pH es sh d a de se in h surf and s oils e rease th soil p alue
rm me Gh series l. The line in H valu is ma e loca
di of the geme on, ir tion, study as. Tchanges in pH values of different soils partially supported bcontents.
83

BINA Annual Report 2011-12 Soil Science
Changes in organic carbon and total N contents showed either an increase or decrease in the surface and sub-soils, respectively (Table 4). The increase or decrease in organic carbon and total N contents was mainly due to the local differences in soil characteristics and farm management activities. Table 4. Changes in pH, total C and total N content in different soil series of Pabna during the period between
1960s and 2010
pH Organic C (%) Total N (%) Soil sries Depth (cm) 1960s 2010 % change 1960s 2010 % change 1960s 2010 % change
Sara 0-15 8.1 7.20 -11.1 0.40 0.56 +41.0 0.04 0.02 -42.5 15-32 8.0 7.31 -8.63 0.40 0.40 +0.75 0.03 0.02 -41.7
7.26 -10.6 1.10 1.25 +13.6 0.11 0.14 +28.4 8.2 -7.98 0.80 14.3 0.08 +20.0
hurdi
0 -1 0 +50.0
hior
32-50 7.7 7.28 -5.45 0.20 0.24 +21.0 0.03 0.02 -50.0 50-60 8.2 7.33 -10.6 - 0.73 - - 0.14 -
8.1 Gopalpur 0-15
15-32 32-50
7.50 0.68 - 0.09 8.2 7.62 -7.19 0.54 0.44 -18.0 0.05 0.06 +21.2
50-60 8.3 7.65 -8.05 0.46 0.34 -25.5 0.01 0.03 +130.8 Is 0-15 8.1 7.49 -7.53 1.44 1.58 +9.72 0.11 0.16 +45.5 15-32 8.0 7.50 -6.25 0.40 0.73 +81.3 0.04 0.07 +75.0 32-50 8.1 7.61 -6.05 .38 0.32 5.3 .04 0.06 50-60 8.1 7.65 -5.56 - 0.24 - - 0.63 - G 0-15 6.4 7.44 +16.3 3.06 2.02 -34.2 0.28 0.21 -25.0 15-32 7.5 7.48 -0.27 0.77 0.56 -26.8 0.07 0.09 +28.6 32-50 7.9 7.40 -6.33 0.41 0.73 +76.8 0.03 0.05 +66.7 50-60 8.0 7.62 -4.75 - 0.16 - - 0.49 - Changes in ng e cation (Ca, N ten
h es in angeable Ca, d Na content e G pur hio es ils during rio twee 60s 010 nge e e gea a co h a crease in layers of so cep creas the r 32-60 cm layers at Ghior seri ls.
hanges in the exchangeable K contents showed a general increase in all the layers of soils except a es in exchangeable Na content showed a
excha eabl K and a) con ts
Table 5 shows the c ang exch K an s of th opal and G r seriso the pe d be n 19 and 2 . Cha s in th xchan ble C ntents s owed de all the ils ex t an in e in lowe es i soCdecrease in the 15-32 cm layers at Ghior series soils. Changgeneral increase in all the sampled layers of both the soils except a decrease in the top soil layer of the Gopalpur series (Table 5). The decrease or increase in the exchangeable cation contents in different soils might be due to the local differences in the natural environment and the farming activities (e.g. fertilizations, irrigation, etc.). Table 5. Changes in exchangeable Ca, K and Na content in different soil series of Pabna during the period
between 1960s and 2010
Exch. Ca (me %) Exch. K (me %) Exch. Na (me %) Soil series Depth (cm) 1960s 2010 % change 1960s 2010 % change 1960s 2010 % change
Gopalpur 0-15 41.48 22.50 -45.8 0.41 0.65 +58.5 2.07 1.24 -40.1 15-32 42.71 16.25 -62.0 0.57 0.52 -8.77 0.47 1.04 +121
17.50 -39.9 0.09 0.52 +478 0.11 0.98 +791 30.30 8.1 0.07 514 0.11 64
32-50
32-50 24.02 17.50 -27.1 0.28 0.47 +67.7 0.34 0.72 +112 50-60 26.70 15.00 -43.8 0.10 0.30 +200 0.32 1.05 +228
29.10 Ghior 0-15 15-32 18.75 -3 0.43 + 0. 84 +6
17.70 18.75 +5.9 0.03 0.32 +967 0.10 0.92 +820 50-60 17.00 18.75 +10.3 0.03 0.28 +833 0.11 0.68 +518
84
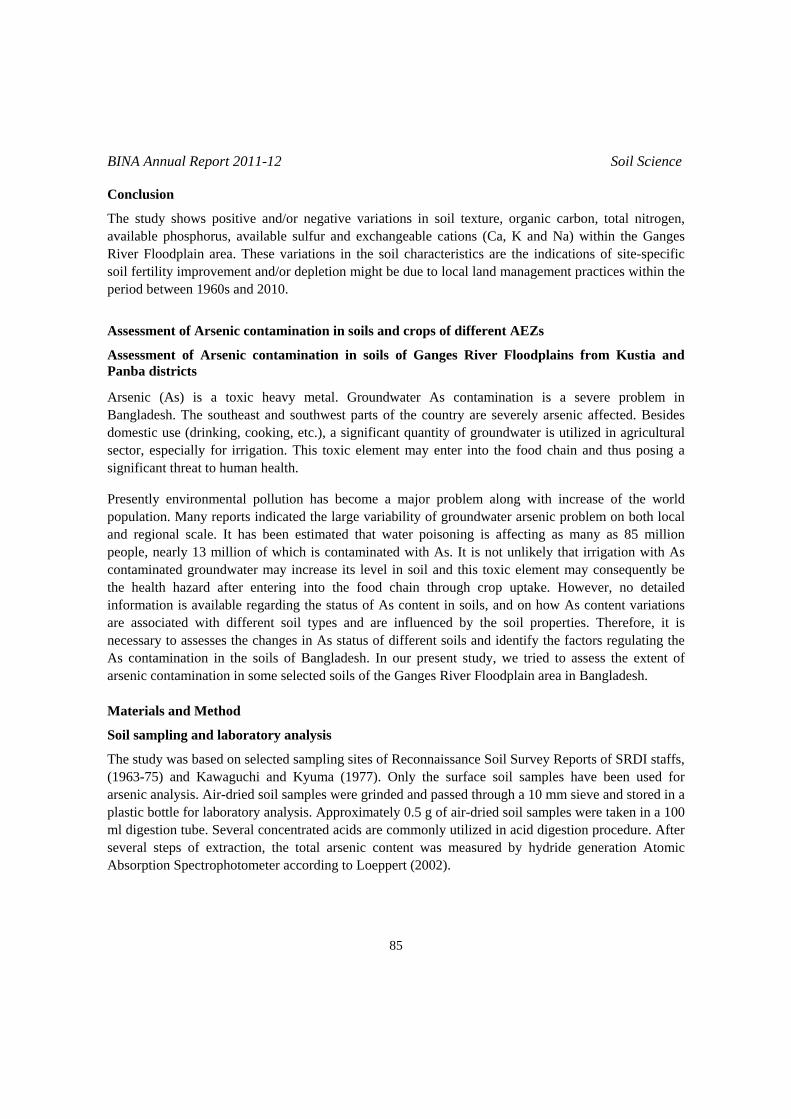
BINA Annual Report 2011-12 Soil Science
Conclusion
he study sh os gati riat in s xtu ani bon l ni n, pho us bl r a cha le c s (C and wi he s
iver Floodp rea e ns so rac ics n on ite- ic il fertility i em o etio ht b to n age pra wi e
en 1960s and 2010.
metal. Groundwater As contamination is a severe problem in c affected. Besides
utilized in agricultural
to human health.
rease its level in soil and this toxic element may consequently be
d for rsenic analysis. Air-dried soil samples were grinded and passed through a 10 mm sieve and stored in a
ry analysis. Approximately 0.5 g of air-dried soil samples were taken in a 100 ids are commonly utilized in acid digestion procedure. After
T ows p itive and/or ne ve va ions oil te re, org c car , tota trogeavailable sphor , availa e sulfu nd ex ngeab ation a, K Na) thin t GangeR lain a . Thes variatio ein th il cha terist are the i dicati s of s specifso mprov ent and/ r depl n mig e due local la d man ment ctices thin thperiod betwe
Assessment of Arsenic contamination in soils and crops of different AEZs
Assessment of Arsenic contamination in soils of Ganges River Floodplains from Kustia and Panba districts
rsenic (As) is a toxic heavyABangladesh. The southeast and southwest parts of the country are severely arsenidomestic use (drinking, cooking, etc.), a significant quantity of groundwater issector, especially for irrigation. This toxic element may enter into the food chain and thus posing a significant threat Presently environmental pollution has become a major problem along with increase of the world population. Many reports indicated the large variability of groundwater arsenic problem on both local and regional scale. It has been estimated that water poisoning is affecting as many as 85 million people, nearly 13 million of which is contaminated with As. It is not unlikely that irrigation with As contaminated groundwater may incthe health hazard after entering into the food chain through crop uptake. However, no detailed information is available regarding the status of As content in soils, and on how As content variations are associated with different soil types and are influenced by the soil properties. Therefore, it is necessary to assesses the changes in As status of different soils and identify the factors regulating the As contamination in the soils of Bangladesh. In our present study, we tried to assess the extent of arsenic contamination in some selected soils of the Ganges River Floodplain area in Bangladesh. Materials and Method
Soil sampling and laboratory analysis
The study was based on selected sampling sites of Reconnaissance Soil Survey Reports of SRDI staffs, (1963-75) and Kawaguchi and Kyuma (1977). Only the surface soil samples have been useaplastic bottle for laboratoml digestion tube. Several concentrated acseveral steps of extraction, the total arsenic content was measured by hydride generation Atomic Absorption Spectrophotometer according to Loeppert (2002).
85
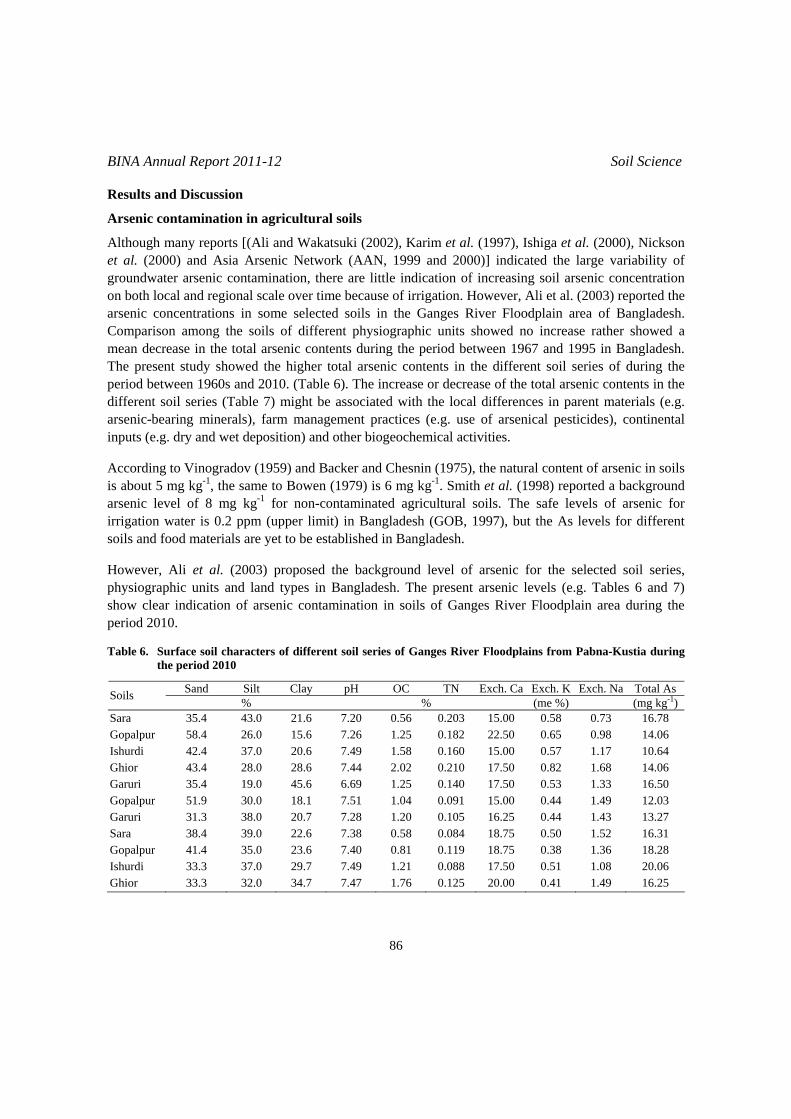
BINA Annual Report 2011-12 Soil Science
Results and Discussion
Arsenic contamination in agricultural soils
Although many reports [(Ali and Wakatsuki (2002), Karim et al. (1997), Ishiga et al. (2000), Nickson t al. (2000) and Asia Arsenic Network (AAN, 1999 and 2000)] indicated the large variability of
tamination, there are little indication of increasing soil arsenic concentration l scale over time because of irrigation. However, Ali et al. (2003) reported the
in the Ganges River Floodplain area of Bangladesh.
able 6. Surface s aracters of different soil series of Ganges River Floodplains from Pabna-Kustia during
egroundwater arsenic conon both local and regionaarsenic concentrations in some selected soilsComparison among the soils of different physiographic units showed no increase rather showed a mean decrease in the total arsenic contents during the period between 1967 and 1995 in Bangladesh. The present study showed the higher total arsenic contents in the different soil series of during the period between 1960s and 2010. (Table 6). The increase or decrease of the total arsenic contents in the different soil series (Table 7) might be associated with the local differences in parent materials (e.g. arsenic-bearing minerals), farm management practices (e.g. use of arsenical pesticides), continental inputs (e.g. dry and wet deposition) and other biogeochemical activities. According to Vinogradov (1959) and Backer and Chesnin (1975), the natural content of arsenic in soils is about 5 mg kg-1, the same to Bowen (1979) is 6 mg kg-1. Smith et al. (1998) reported a background arsenic level of 8 mg kg-1 for non-contaminated agricultural soils. The safe levels of arsenic for irrigation water is 0.2 ppm (upper limit) in Bangladesh (GOB, 1997), but the As levels for different soils and food materials are yet to be established in Bangladesh. However, Ali et al. (2003) proposed the background level of arsenic for the selected soil series, physiographic units and land types in Bangladesh. The present arsenic levels (e.g. Tables 6 and 7) show clear indication of arsenic contamination in soils of Ganges River Floodplain area during the period 2010. T oil ch
the period 2010
Sand Silt Clay pH OC TN Exch. Ca Exch. K Exch. Na Total As Soils % % (me %) (mg kg-1) Sara 35.4 43.0 21.6 7.20 0.56 0.203 15.00 0.58 0.73 16.78 Gopalpur 58.4 26.0 15.6 7.26 1.25 0.182 22.50 0.65 0.98 14.06
hior 28.0 28.6 7.44 2.02 0.210 17.50 0.82 1.68 14.06 0
18.1 7.51 1.04 0.091 15.00 1.49 i
r
Ishurdi 42.4 37.0 20.6 7.49 1.58 0.160 15.00 0.57 1.17 10.64 43.4 G
GaruriGopalpur 51.9
35.4 19.0 45.6 6.69 1.25 .140 17.50 0.53 1.33 16.50 30.0 0.44 12.03
Garur 31.3 38.0 20.7 7.28 1.20 0.105 16.25 0.44 1.43 13.27 Sara 38.4 39.0 22.6 7.38 0.58 0.084 18.75 0.50 1.52 16.31 Gopalpu 41.4 35.0 23.6 7.40 0.81 0.119 18.75 0.38 1.36 18.28 Ishurdi 33.3 37.0 29.7 7.49 1.21 0.088 17.50 0.51 1.08 20.06 Ghior 33.3 32.0 34.7 7.47 1.76 0.125 20.00 0.41 1.49 16.25
86
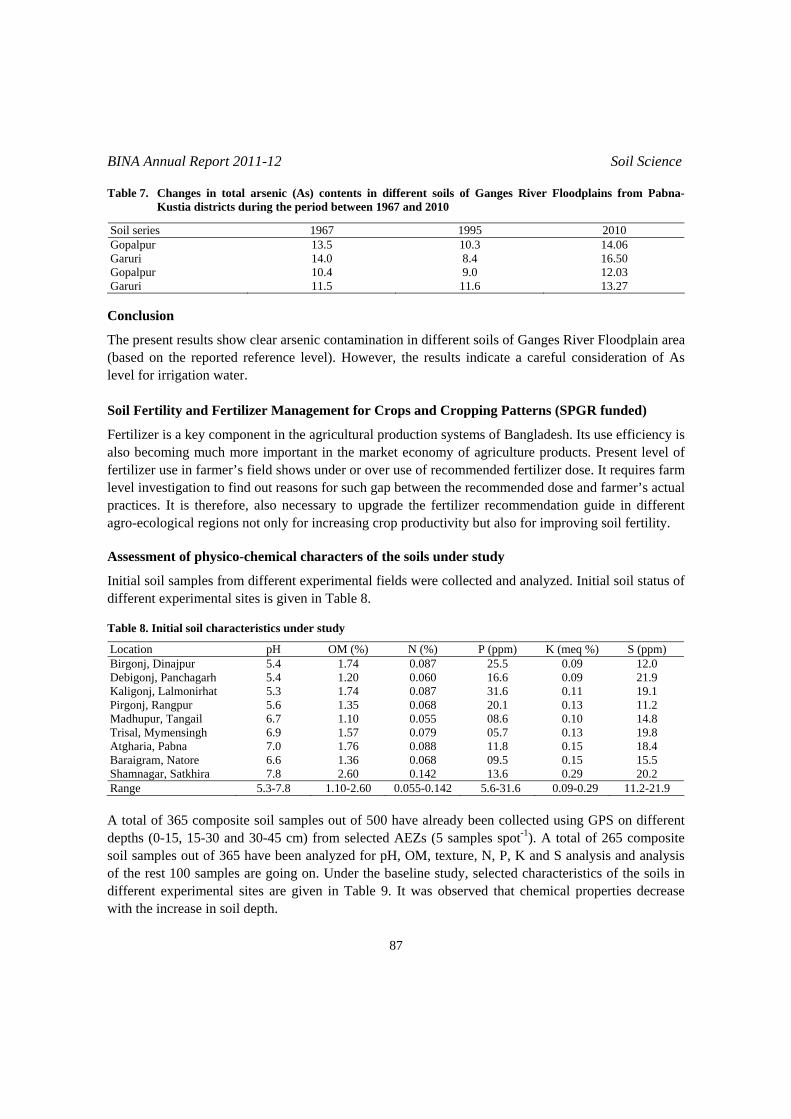
BINA Annual Report 2011-12 Soil Science
Table 7. Chan tota nic n d t s G iv odp from a- th d b 19 20
es 67 95 0
ges in l arse (As) contents i ifferen oils of anges R er Flo lains PabnKustia districts during e perio etween 67 and 10
Soil seri 19 19 201Gopalpur 3.5 .3 6 1 10 14.0Garuri 14.0 Gopalpur 10.4
8.4 16.50 9.0 12.03
Garuri 11.5 11.6 13.27 Conclusion
The present results show clear arsenic contamination in different soils of Ganges River Floodplain area (based on the reported reference level). However, the results indicate a careful consideration of As level for irrigation water. Soil Fertility and Fertilizer Management for Crops and Cropping Patterns (SPGR funded)
Fertilizer is a key component in the agricultural production systems of Bangladesh. Its use efficiency is also becoming much more important in the market economy of agriculture products. Present level of fertilizer use in farmer’s field shows under or over use of recommended fertilizer dose. It requires farm level investigation to find out reasons for such gap between the recommended dose and farmer’s actual practices. It is therefore, also necessary to upgrade the fertilizer recommendation guide in different agro-ecological regions not only for increasing crop productivity but also for improving soil fertility. Assessment of physico-chemical characters of the soils under study
Initial soil samples from different experimental fields were collected and analyzed. Initial soil status of different experimental sites is given in Table 8. Table 8. Initial soil characteristics under study
Location pH OM (%) N (%) P (ppm) K (meq %) S (ppm) Birgonj, Dinajpur 5.4 1.74 0.087 25.5 0.09 12.0 Debigonj, Panchagarh 5.4 1.20 0.060 16.6 0.09 21.9 Kaligonj, Lalmonirhat 5.3 1.74 0.087 31.6 0.11 19.1 Pirgonj, Rangpur 5.6 1.35 0.068 20.1 0.13 11.2 Madhupur, Tangail 6.7 1.10 0.055 08.6 0.10 14.8 Trisal, Mymensingh 6.9 1.57 0.079 05.7 0.13 19.8 Atgharia, Pabna 7.0 1.76 0.088 11.8 0.15 18.4 Baraigram, Natore 6.6 1.36 0.068 09.5 0.15 15.5 Shamnagar, Satkhira 7.8 2.60 0.142 13.6 0.29 20.2 Range 5.3-7.8 1.10-2.60 0.055-0.142 5.6-31.6 0.09-0.29 11.2-21.9 A total of 365 composite soil samples out of 500 have already been collected using GPS on different depths (0-15, 15-30 and 30-45 cm) from selected AEZs (5 samples spot-1). A total of 265 composite soil samples out of 365 have been analyzed for pH, OM, texture, N, P, K and S analysis and analysis of the rest 100 samples are going on. Under the baseline study, selected characteristics of the soils in different experimental sites are given in Table 9. It was observed that chemical properties decrease with the increase in soil depth.
87

BINA Annual Report 2011-12 Soil Science
Table 9. Selected characteristics of top soil (0-15 cm and 15-30 cm) at different locations under baseline study
Depth (cm) pH OM (%) N (%) Location P (ppm) K (meq %) S (ppm) 0-15 5.4-5.6 0.98-1.45 0.06-0.14 13.5-28.8 0.06-0.08 12.6-19.7 Birgonj,
Dinajpur 15-30 5.6-5.8 0.90-1.00 0.06-0.08 07.1-22.5 0.05-0.07 09.1-14.7 0-15 5.3-5.6 0.93-1.13 0.09-0.17 14.9-20.5 0.05-0.07 16.9-24.6
h 15-30 5.2-5.5 0.80-1.10 0.06-0.09 09.2-23.8 0.04-0.06 12.6-19.8 0-15 5.2-5.5 0.95-1.53 0.10-0.17 11.8-23.6 0.04-0.10 13.3-25.8
15-30 5.4-5.9 1.00-1.40 0.08-0.09 09.0-22.3 0.04-0.09 10.5-13.3
6.0-6.5 0.60-1.20 0.06-0.17 05.0-10.8 0.09-0.12 08.3-14.2 0-15 6.8-7.0 1.21-1.75 0.09-0.11 08.0-15.0 0.07-0.09 11.2-16.1
2.2
Debigonj, arPanchag
Kaligonj, Lalmonirhat
0-15 5.4-5.6 0.85-1.59 0.06-0.17 12.8-24.2 0.08-0.13 16.2-24.7 Pirgonj, Rangpur 15-30 5.2-5.5 0.60-1.50 0.06-0.11 08.1-20.4 0.08-0.13 10.5-14.1
0-15 6.3-6.5 0.85-1.20 0.08-0.17 08.0-15.6 0.08-0.10 08.5-16.2 Madhupur, Tangail 15-30 Trisal, Mymensingh 15-30 6.2-6.5 1.10-1.60 0.08-0.11 10.7-21.1 0.06-0.09 07.3-1
0-15 6.6-6.9 1.18-1.78 0.12-0.17 11.0-21.0 0.09-0.13 12.6-24.7 Atgharia, Pabna 15-30 6.4-6.9 1.00-1.00 0.10-0.15 13.1-20.7 0.10-0.14 08.8-13.7
0-15 6.4-7.0 1.11-1.71 0.14-0.22 12.0-28.0 0.10-0.18 09.8-24.6 Baraigram, Natore 15-30 6.8-7.1 1.00-1.60 0.11-0.15 15.9-26.8 0.12-0.17 07.8-11.7
0-15 6.4-7.0 1.11-1.71 0.14-0.22 12.0-28.0 0.10-0.18 09.8-24.6 Shamnagar, Satkhira 15-30 6.8-7.1 1.00-1.60 0.11-0.15 15.9-26.8 0.12-0.17 07.8-11.7
Response of fertilizers to different crops and cropping patterns
Yield of T. aman rice
(Kharif II-2011)
T. Aman rice experiment during kharif-II, 2011 was conducted at 7 different locations (Birgonj, ; Pirgonj, Rangpu ebigon agar gonj, irh My h,
ail and Gha Tangail ording ping p , four ex ents wi tato t up du Rabi se 2012 a nj, Din ; Pirgon ngpur; D onj, gonj, L onirhat; at Atg Pabna, ustard dhupur, ail.
abi crops 12 five f xperim ring kh -2012 ( rice) we t up r; Pirgo pur; igonj, P garh; T Mymen and M pur,
sign was u n these e ments ree rep Inte ral oper i.e. , thinnin secticid icide s ere do enever ssary. D ere
d on soil propert , OM K eld ld a t oncentration of the plant sample.
Dinajpur r; D j, Panch h; Kali Lalmon at; Trisal, mensingMadhupur, Tang tail, ). Acc to crop attern perim th poas first crop were se ring ason, t Birgo ajpur j, Ra ebigPanchagarh and Kali alm wheat haria, and m at Ma TangAfter harvesting R , 20 ield e ents du arif I Boro re seat Birgonj, Dinajpu nj, Rang Deb ancha risal, singh adhuTangail. RCB de sed i xperi with th lications. rcultu ationirrigation, weeding g, in e/fung pray w ne wh nece ata wcollecte ies (pH , N, P, and S), yi and yie component nd nutrienc
88

BINA Annual Report 2011-12 Soil Science
Table 10. Effects of fertilizers on yield of T. aman rice (Binadhan-7) during Kharif-II season, 2011
Trisal, Mym ngh r, Tan Gh gai nj, ensi Madhup gail atail, Tan l Birgo Dinajpur Yield (t ha-1) Treatments
rain Gr raw G Straw Grain Straw ain St Grain Straw T1= 100% NPK (STB 7bc 3.5 7c ) .8 3 5.13b 3.97b 4.47e 7d 4.9 3.93c 4.53c T = T + 252 1 %T
N 03ab 4 4.0 7b c NP 0ab 4.7 3b b
5% NK 80ab 5 4.9 0ab b PK 0ab b 5.87ab 4.47bc 5.53bc b
25% NPK .20a 5.60bc 5.5 0a of T1 3bc 5 3.7 3c trol 67c 2.1 7d
4. 4.73b 4.53ab .87de 0cd 5.6 c 4.37b 5.87b 3 = T1 + 25% 4.6 4.80b 5.00a 6.20a 0b 6.0 5.03a 6.10ab
T4 = T1 + 2 4. 5.13b 4.77a .90ab 3b 6.2 5.13a 6.47ab T5 = T1 + 25% 4.7 5.63a 4.53ab 4.93a 5.47bc T6 = T1 + 5 6.40a 5.10a 0a 6.8 5.72a 7.07a T7 = 75% T = Con
3.52.
5.23b3.60c
3.93b 2.87c
.83cd 3.73f
3d 5.27e 3.7
3.73c 2.87d
4.43c 3.27d 8
In a column, means foll y the sa s) a ican at mensingh: T N64P 1
r, Tangail: T1 ( N68P12: T1 (ST P12K36
Birgonj, Dina : T1 (S N64P6K
Resul icate tha icatio P, K s a t pr sig aff h nd straw yields of ric 10 e 1 e in 7
ions, ghest as f ea T1 K ll l bserved atmen 3, T t T me d M , T ,
4 and T5 at Birgonj, Dinajpur; T3 at Debigonj, Panchagar; T2, T3 and T4 at Kaligonj, Lalmonirhat and in treatment T6 (T1 + 25% NPK)
in treatment T3 (T1 + 25% NP). eld was found in T5 at Trisal, Mymensingh; T4 at Ghatail, Tangail; T3 and T4 at
1, T4 and T5 at Debigonj, Panchagar; T2, T4, T5 and T7 at Kaligonj, Lalmonirhaqt except T and T at Pirgonj, Rangpur.
owed b me letter( re not signif tly different 5% level. Trisal, My 1 (STB) = 14K28S6ZnMadhupu STB) = K32S8Zn1Ghatail, Tangail
jpurB) = N60 S8Zn1 TB) = 32S8Zn1
ts ind
the grain at appl n of N, fertilizer t differen oportion nificantly ected bot
T. aman e (Table and Tabl 1). Incras of rice gra yield at different locatyield was o
the hi yield w ound in tr tment T6 ( + 25% NP ). Statistica y identica in tre t T2, T 4 and T5 a risal, My nsingh an adhupur angail; T3
TT2 at Pirgonj, Rangpur. Incrase of straw, the highest yield was found except Madhupur, Tangail where the highest yield was observedStatistically identical yiBirgonj, Dinajpur; Tand all treatments 7 8 Table 11. Effects of fertilizers on the growth and yield of T. aman rice (Binadhan-7) Kharif-II season, 2011
Debigonj, Panchagarh Kaligonj, Lalmonirhat Pirgonj, Rangpur Yield (t ha-1) Treatments
Grain Straw Grain Straw Grain Straw T1= 100% NPK (STB) 4.07cd 6.30ab 3.24bcd 3.56bc 4.14c 4.85ab T2 = T1 + 25% N 4.30bcd 6.03b 3.58abc 4.40ab 4.63ab 5.12a T3 = T1 + 25% NP 4.80ab 6.03b 3.81ab 3.77bc 4.37bc 4.69ab T4 = T1 + 25% NK 4.23bcd 6.73ab 3.65abc 4.27ab 4.55b 5.19a T5 = T1 + 25% PK 4.37bc 6.37ab 3.31bcd 3.95ab 4.34bc 4.69ab T6 = T1 + 25% NPK 5.27a 6.90a 4.51a 3.94a 4.97a 5.06a T7 = 75% of T1 3.67de 4.83c 3.01cd 3.88ab 3.45d 4.35bc
8 = Control 3.17e 3.60d 2.64d 2.98c 2.77e 3.80c TIn a column, means followed by the same letter(s) are not significantly different at 5% level Debigonj, Panchagarh: T1 (STB) = N67P6K32S6Zn1 Kaligonj, Lalmonirhat: T1 (STB) = N64P6K32S6Zn1 Pirgonj, Rangpur: T1 (STB) = N65P6K28S8Zn1
89

BINA Annual Report 2011-12 Soil Science
Nutrient Uptake (T. aman rice, 2011)
Nutrient uptake by T fe o di s o Table 15) igh pta ob ent our ns
j, irh gon gpu e Pa arh. t ail; B Din and l, T th st u n ase of est e wa isal, ens ali alm Deb an an ail, n en a , T n
Birg ina tre T4 en owe h takexcept at pur ail (treatmen he st u of S obse n
l, ensi n tr adh Tan irg inaj d take of N, P, K and S was
tions.
ptake (kg ha-1) by T. aman rice (Binadhan-7) during Kharif-II season, 2011
. Aman rice at dif rent locations was in in
fluenced due t fferent treatment(Table 12 t . The h est N u
nke was served treatm T6 at f
, locatio namely
aTrisal, Mymensingh; Kaligon Lalmo at; Pir j, Ran r and D bigonj nchag But Madhupur, Tang irgonj, ajpur Ghatai angail e highe ptake of N was recorded itreatment T . In c4 P high uptak s observed at Tr Mym ingh; K gonj, L onirhat; Pirgonj, Rangpur; igonj, P chagarh d Ghat Tangail i treatm t T6; at M dhupur angail itreatment T3 and at onj, D jpur in atment . Treatm t T6 sh d the hig est up of K at all locations e Madhu , Tang t T ). T4 highe ptake was rved itreatment T at Trisa Mym ngh; i eatment T6 4
m Debigonj, Panchagarh. The lowest up at M upur, gail; B onj, D pur an
Ghatail, Tangail and in treat ent T1 at observed in control treatment at all loca Table 12. Effects of fertilizers on nutrient u
Trisal, Mymensingh Madhupur, Tangail Treatments
N P K S N P K S T1= 100% NPK (STB) 079 10.5 088 6.6 67 08.4 078 6.7 T2 = T1 + 25% N 071 09.5 075 6.5 82 10.8 087 9.4 T3 = T1 + 25% NP 084 11.4 082 7.7 90 13.1 096 8.9 T4 = T1 + 25% NK 100 11.4 098 6.9 90 11.6 115 9.2 T5 = T1 + 25% PK 088 12.2 112 7.5 78 10.9 096 9.0 T6 = T1 + 25% NPK 102 14.5 128 8.3 87 11.9 100 8.2 T7 = 75% of T1 064 09.5 083 6.5 70 10.0 086 7.4 T8 = Control 043 06.5 051 3.6 43 06.7 054 5.2 Table 13. Effects of fertilizers on nutrient uptake (kg ha-1) by T. aman rice (Binadhan-7) during Kharif-II
season, 2011
Kaligonj, Lalmonirhat Pirgonj, Rangpur Treatments
P K P K N S N S T1= 100% NPK (STB) 61 08.3 75 11.5 75.4 5.0 79 6.6 T2 = T + 25% N 1
T = T + 25% NP 64 11.2 74 12.5
10.9 60 10.711.0 92 12.1 93.8 09.6 77 12.411.7 101 14.0 98.3 07.8 68 5.1 61 10.9 73.3 06.8 43 06.6 53.5
5.9 89 89.5 7.2 3 1
T67 6.2 76 78.5 7.4
4 = T1 + 25% NK 73 5.5 86 6.8 T = T + 25% PK 5 1
T61 5.3 76 74.8 6.6
6 = T + 25% NPK 1
T77 6.3 92 7.2
7 = 75% of T1 53 5.8 T = Control 38 3.3 47 3.8 8
90

BINA Annual Report 2011-12 Soil Science
Table 14. Effects of fertilizers on nutrient uptake (kg ha-1) by T. aman rice (Binadhan-7 during Kharif-II season, 2011
Debigonj, Panchagarh Birgonj, Dinajpur Treatments
N P K S N P K S T1= 100% NPK (STB) 083 14.6 088 08.3 073 11.7 068 08.0 T2 = T1 + 25% N 082 14.8 108 08.6 084 13.1 090 09.0 T3 = T1 + 25% NP 093 14.3 094 09.6 100 14.1 089 09.6 T4 = T1 + 25% NK 091 15.6 116 08.5 104 16.6 097 10.4 T5 = T1 + 25% PK 086 14.3 096 09.2 098 14.0 090 09.6 T6 = T1 + 25% NPK 103 17.4 133 10.6 111 19.8 109 10.0 T7 = 75% of T1 074 12.2 089 06.4 068 10.3 068 07.9 T8 = Control 050 07.4 047 04.7 045 07.7 044 04.6 Table 15. Effects of fertilizers on nutrient uptake (kg ha-1) by T. aman rice (Binadhan-7) during Kharif-II
season, 2011
Ghatail, Tangail
Treatments N P K S
T1= 100% NPK (STB) 070 14.5 76 7.8 T2 = T1 + 25% N 079 15.4 90 8.4
093 17.0 91 10.6 099 19.5 98 20.5 091 16.6 94 9.2 106 23.4 95 9.6 072 13.4 83 8.5 041 09.1 58 4.3
T3 = T1 + 25% NP T4 = T1 + 25% NK T5 = T1 + 25% PK T6 = T1 + 25% NPK T7 = 75% of T1
T8 = Control Rabi crops (2011-12)
r yield of potaThe tube to at four different locations during Rabi 2011-12 are shown in Table 16. The er yield of potato was 6 (T1 + 25% NP Panchagar
w s statistically h er tha other treatments ut at Birgonj, inajpur and Kal , est p o yie s rec d in ment which was stat ly id
3 and T6. Besides onj, pur tment hig yield h imilar to t ment 3, T4 and T5.
ard and sig antly ferent ds w obtai mon trea ts hest yi of mu (1.4 a-1) was recorde trea T6. s not at
yield of wheat was observed i eatme 6 whi differ atist with er
highest tubhich wa
obtained in treatment T K) at Debigonj,igh n . B D igonj
Lalmonirhat the high otat ld wa orde treat T4 istical enticalwith treatment T at Pirg Rang trea T6 showed the hest whicwas statistically s reat T2, T Increase of must wheat nific dif yiel ere ned a g the tmen(Table 17). The hig eld stard 0 t h d in tment It wa ed thhighest grain n tr nt T ch ed st ically othtreatments.
91
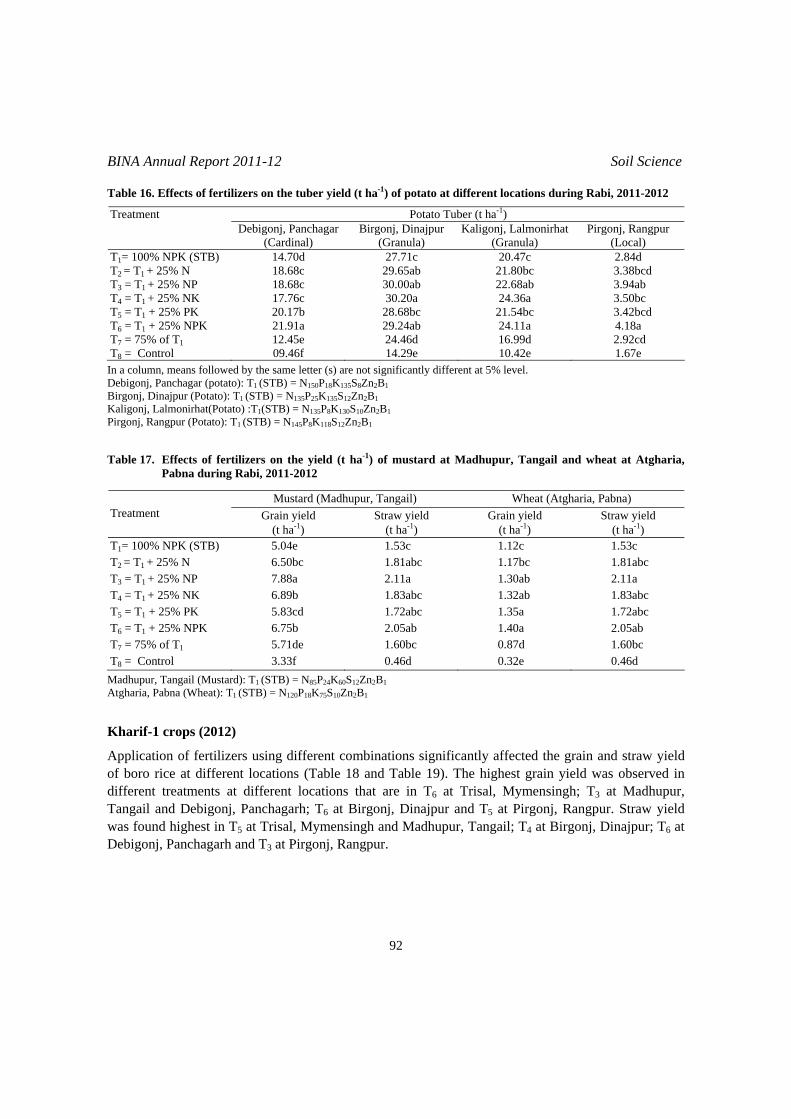
BINA Annual Report 2011-12 Soil Science
Table 16. Effects of fertilizers on the tuber yield (t ha-1) of potato at different locations during Rabi, 2011-2012
Potato Tuber (t ha-1) Treatment Debigonj, P
ardinal)inajpur
ranula)Kaligonj, Lalm
ranula), Rangpur
(Local) anchagar Birgonj, D
(C (G onirhat Pirgonj
(G T1= 100% NPK (STB) 14.70d 7.71c 2.84d 2 20.47c T2 = T + 25% N 1 T
18.68c .65ab 1.80bc .38bc8.68c .00ab 2.68ab .94ab7.76c 0.20a .50bc0.17b .68bc 1.54bc .42bc
1.91a .24ab 4.18a 2.45e 4.46d 6.99d
4.29e 1.67e
29 2 3 d 3 = T1 + 25% NP 1 30 2 3
T4 = T1 + 25% NK 1 3 24.36a 3 T5 = T1 + 25% PK 2 28 2 3 d T6 = T1 + 25% NPK 2 29 24.11a T7 = 75% of T1 1
09.46f 21
110.42e
2.92cd T8 = Control
In a column, means followed by ame le are no ifican erent a level. gar (potato): T ) = N 135S8Z
the s tter (s) t sign tly diff t 5% Debigonj, Pancha 1 (STB 150P18K n2BB
irgonj, Dinajpur (Potato): T1 (STB) = N135P25K135S12Zn2B1 irhat(Potato) :T (STB) = N P K S Zn B
ffects of fertilizers on the yield (t ha-1) of mustard at Madhupur, Tangail and wheat at Atgharia, abna during Rabi, 201 12
Mustard (Madhupur, Ta eat (Atgharia, Pab
1 BKaligonj, Lalmon 1 135 8 130 10 2 1 Pirgonj, Rangpur (Potato): T1 (STB) = N145P8K118S12Zn2B1
Table 17. EP 1-20
ngail) Wh na) Treatment Gra
(tStra ld
(Gra eld
(t ) Stra
(in yield ha-1)
w yiet ha-1)
in yi ha-1
w yield t ha-1)
T1= 100% NPK (STB) 5 1 1. 1.04e .53c 12c .53c T2 = T1 + 25% N 6.50bc 1.81abc 1.17bc 1.81abc
7 2 1.30ab 2K 6 1.83abc 1.32ab 1.83abc
PK 5.83cd 1. 1. 1.72abc = T + 25% NPK 6.75b 2.05ab 1.40a 2.05ab
5.71de 1.60bc 0.87d 1.60bc
T3 = T1 + 25% NP .88a .11a .11a T4 = T1 + 25% N .89b T5 = T1 + 25% 72abc 35a T6 1
T7 = 75% of T1
T8 = Control 3.33f 0.46d 0.32e 0.46d Madhupur, Tangail (Mustard): T1 (STB) = N85P24K60S12Zn2BB1Atgharia, Pabna (Wheat): T1 (STB) = N120P18K75S10Zn2B1B
ificantly affected the grain and straw yield
nchagarh and T3 at Pirgonj, Rangpur.
Kharif-1 crops (2012)
Application of fertilizers using different combinations signof boro rice at different locations (Table 18 and Table 19). The highest grain yield was observed in different treatments at different locations that are in T6 at Trisal, Mymensingh; T3 at Madhupur, Tangail and Debigonj, Panchagarh; T6 at Birgonj, Dinajpur and T5 at Pirgonj, Rangpur. Straw yield was found highest in T5 at Trisal, Mymensingh and Madhupur, Tangail; T4 at Birgonj, Dinajpur; T6 at Debigonj, Pa
92
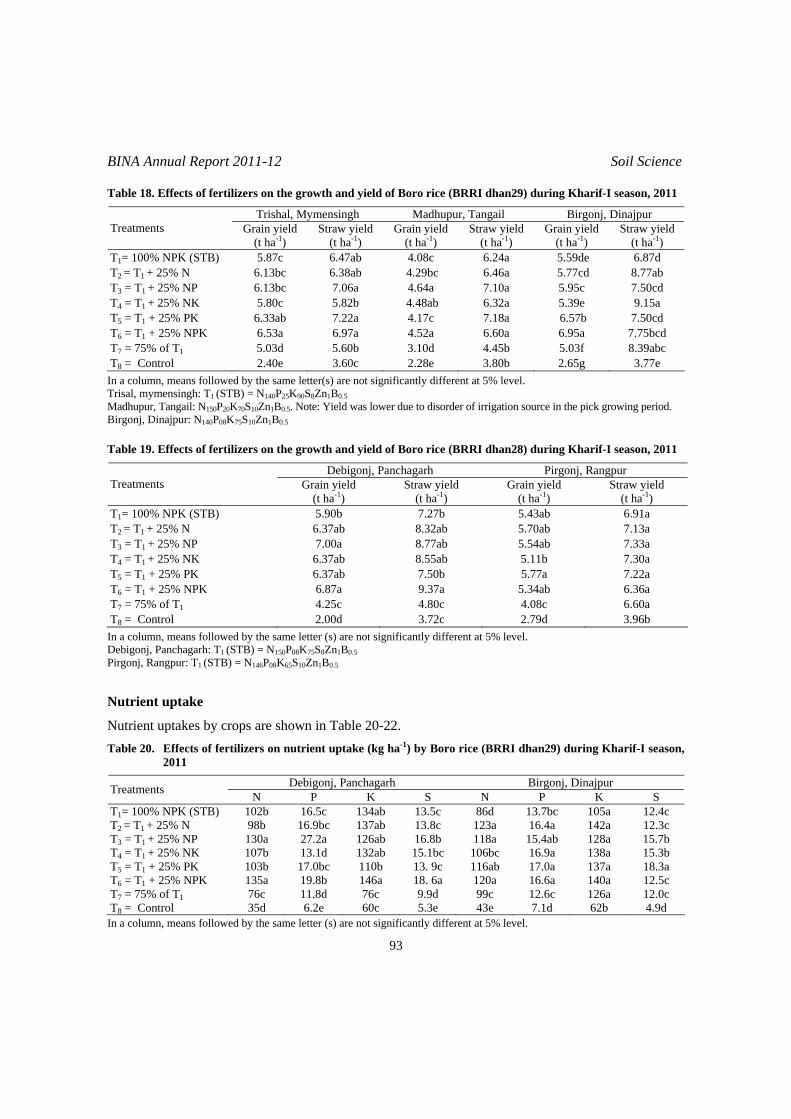
BINA Annual Report 2011-12 Soil Science
Table 18. Effects of fertilizers on the growth and yield of Boro rice (BRRI dhan29) during Kharif-I season, 2011
Trishal, Mymensingh Birgonj, Dinajpur Madhupur, Tangail Treatments
(t y
(t ha-1) ) (tyi
(t ha-1)
) Grain yield Straw
ha-1) ield Grain yield
(t ha-1Straw yield Grain
ha-1) eld Straw yield
-1(t haT1= 100% NPK (STB) 5.8 6.47ab 4.08c 6.24a 5.59de 7d 7c 6.8T2 = T1 + 25% N 6.1 6.38ab bc 6. 5.77cd b
6.1 7.06a a 7. 5.95c cd 5.8 5.82b ab 6. 5.39e
6.3 7.22a c 7. 6.57b d 6.5 6.97a a 6.6 6.95a cd 5.0 5.60b d 4.4 5.03f abc
2.65g 3.77e
3bc 4.29 46a 8.77aT3 = T1 + 25% NP 3bc 4.64 10a 7.50T = T + 25% NK
5 1
4 1 0c 4.48 32a 1
9.15a0cT = T + 25% PK
NPK 3ab 4.17
28a 7.5
T6 = T1 + 25% 3a 4.5 0a 7.75bT7 = 75% of T1 3d 3.10 5b 8.39T8 = Control 2.40e 3.60c 2.28e 3.80b
In a column, means followed by the same letter(s) are not significantly different at 5% level. Trisal, mymensingh: T1 (STB) = N140P25K90S8Zn1BB0.5Madhupur, Tangail: N150P20K70S10Zn1BB due to disorder of irrigation source in the pick growing period. 0.5. Note: Yield was lower Birgonj, Dinajpur: N140P08K75S10Zn1BB0.5
Table 19. Effects of fertilizers on the growth and yield of Boro rice (BRRI dhan28) during Kharif-I season, 2011
Debigonj, Panchagarh Pirgonj, Rangpur Treatments eld Straw yield
ha-1) Grain yield Straw yield
a-1) Grain yi
(t ha-1) (t (t ha-1) (t hT1= 100% NPK (STB) 90b b 5. 7.27 5.43ab 6.91a T2 = T1 + 25% N 6.37ab 32ab ab
7.00a 4ab a 6.37ab 5ab 1b
6.37ab 7.50b 7a a 6.87a 37a ab
4.25c 80c 8c 2.00d 72c 79d
8. 5.70 7.13aT3 = T1 + 25% NP 8.77ab 5.5 7.33T4 = T1 + 25% NK 8.5 5.1 7.30a T5 = T1 + 25% PK 5.7 7.22T6 = T1 + 25% NPK 9. 5.34
06.36a
T7 = 75% of T1 4.3.
4.2.
6.60a 3.96b T = Control 8
In column, meaDebigonj, Pancha
a ns followed by the ter (s) are not si y different at 5%garh: T1 (STB) = S8Zn1B0.5
r: T1 (STB) = N146P Zn1B0.5
s are shown in Table 20-22.
same letN
gnificantl level. 150P08K75
Pirgonj, Rangpu 08K65S10
Nutrient uptake
Nutrient uptakes by cropTable 20. Effects of fertilizers on nutrient uptake (kg ha-1) by Boro rice (BRRI dhan29) during Kharif-I season,
2011
Debigonj, Panchagarh Birgonj, Dinajpur Treatments N P K S N P K S T1= 100% NPK (STB) 102b 16.5c 134ab 13.5c 86d 13.7bc 105a 12.4c T2 = T1 + 25% N 98b 16.9bc 137ab 13.8c 123a 16.4a 142a 12.3c T3 = T1 + 25% NP 130a 27.2a 126ab
= T + 25% NK 107b 13.1d 132ab 16.8b 118a 15.4ab 128a 15.7b
4 1 15.1bc 106bc 16.9a 138a 15.3b 5 = T1 + 25% PK 103b 17.0bc 110b 13. 9c 116ab 17.0a 137a 18.3a 6 = T1 + 25% NPK 135a 19.8b 146a 18. 6a 120a 16.6a 140a 12.5c
T7 = 75% of T1 76c 11.8d 76c 9.9d 99c 12.6c 126a 12.0c T8 = Control 35d 6.2e 60c 5.3e 43e 7.1d 62b 4.9d
TTT
In a column, means followed by the same letter (s) are not significantly different at 5% level.
93

BINA Annual Report 2011-12 Soil Science
Table 21. Effects of fertilizers on nutrient uptake (kg ha-1) by Boro rice (BRRI dhan29 during Kharif-I season, 2011
ad ris ghM hupur, Tangail T al, Mymensin Treatments N P P K K S N S T1= 100% NPK (STB) 8 12.18a ab 10 14.6b 8ab e 4a b 94 8.9b 1ab c 10 10.7cdT = T2 1
T+ 25% N 81a 12.68a 85ab 10.5ab 10 14.2b 0ab
9 13.69a 1 15.7b 13a 86a 11.02b 7ab 9 13.7c 0bc d 8 13.62a 1 15.1b 11a 8 12.48a 10 18.2a 05ab 5 8.09c 4bc 8 13.6c 85c 3 5.51d 9c 43d 6.0d 1d
9ab c 11 10.3de3 = T1 + 25% NP 3a 105a 11.4a 13a 1 12.9ab
T = T + 25% NK 4 1 9 9.3ab 3bc 9 11.5bcT = T + 25% PK 5 1 2a 113a 9.4ab 12a c 1 13.1aT6 = T + 25% NPK 1 4a 108a 9.6ab 2ab 1 12.1abcT = 75% of T7 1 4b 7 6.5c 0c 9.5e T = Control 9c 4 5.2c 6 5.7f8
In a column, means followed by th a e tter(s) ae s m le re not significantly different at 5% level.
-1Table 22. Effects of fertilizers on nutrient uptake (kg ha ) by Boro rice (BRRI dhan29) at Pirgonj, Rangpur during Kharif-I season, 2011
Pirgonj, Rangpur Treatments N P K S
T1= 100% NPK (STB) 99bc 15.3a 50c 11ab T2 = T1 + 25% N T
11 111 15
9 111 1
1 184d 11.9b 4 6
0ab 5.1a 51c 12a 3 = T1 + 25% NP 8a .8a 69a 11ab
T4 = T1 + 25% NK 4cd 4.8a 67ab 12a T5 = T1 + 25% PK 9a 5.3a 71a 11ab T6 = T1 + 25% NPK 11a 5.1a 60b 12a T7 = 75% of T1
T31d 10b
8 = Control 9e .1c 14e 5c In a column, means followed by the same letter(s) are not significantly different at 5% level
attern at Chalanbil area, Natore (AEZ-5)
ble variation of yield parameters among the treatments. Significantly different yield ). The highest yield of garlic (9.03 t ha-1) was
cal with all other treatments except T7 and T8.
E
Plant heim) (no.)
ingle bulb weight (g)
Bulb diametem) (no.)
Garlic yield (bu
Fertilizer requirement for crops/cropping p
Cropping pattern: Garlic-B. aman
There was remarkaof garlic was obtained due to the treatments (Table 23recorded in treatment T2 which was statistically identi Table 23. ffects of fertilizers on the yield (tha-1) of garlic at Chalanbil area, Natore during Rabi, 2011-2012
Treatment ght Leaves S(c
r Cloves bulb(c
-1 lb)
T1= 100% NPK (STB) 51.6 4.1 2 8. 9.1 9. 15.3 22ab T2 = T1 + 25% N 51.8 4.1 17.1 9
.5 4.1 8.
.8 4.2 17.3 8.
.1 4.4 16.8 8.
.0 4.1 17.9 8.
.7 4.2 7.6 8.7 15.0 7.69b
.1 3.7 1 9.7 6.
10.5 9.6 .03a T3 = T1 + 25% NP 52 9.9 9.4 16.7 53ab T4 = T1 + 25% NK 50 9.0 9.4 71ab T5 = T1 + 25% PK 54 9.2 8.8 64ab T6 = T1 + 25% NPK 52 10.7 9.8 45ab T7 = 75% of T1 49T8 = Control 46 6.3 8. 22c
T1 (STB) = N100P35K100S25Zn2B1
94

BINA Annual Report 2011-12 Soil Science
Fertilizer requirement for crops adapted in saline area at Shamnagar, Satkhira (AEZ-13)
Cropping pattern: Boro-Fallow-T. aman
f different l ls of fertilizers significantl nfluenc the yie and nu t upta by & Sta hi rain wa ned atm w
l er tr s ex a 4, T7. yie als d nt T3 wh was ly ical 4 an
fertilize the (t of B (Bi -8) nag khir g 011
nt he Panicle length llers h Grain yield -1)
Straw (t ha
Application o eve y i ed ld trien keBoro rice (Tables 24 25). tistically gher g yield s obtai in tre ent T3 hich wasstatistically similar to a l oth eatment cept tre tment T T6 and Straw ld was o founhigher in treatme ich statistical ident with T d T6. Table 24. Effects of rs on grain yield ha-1) oro rice nadhan at Sham ar, Sat a durin
Kharif-1, 2
Treatments Pla ight (cm) (cm) (no)
Ti ill-1
(t hayield -1)
T1= 100% NPK (STB) 90.07bc 22.73a 09.40c 4.66abc 5.71b T2 1
T= T + 25% N 90.47b 22.67a 11.00ab 4.74abc 5.57b
T4 = T1 + 2 23.73a 10.67abc 4.53bc 5.97ab K 89.00c 23.00a 11.60ab 5.13ab 5.83b
% NPK 90.07bc 23.27a 10.53bc 5.04ab 87.33d 23.40a 09.33c 72.07 19.97b 06.73d d 0.88 4.65 7.05 9.90 7.66
3 = T1 + 25% NP 90.53b 23.87a 11.93a 5.50a 6.71a 5% NK 93.00a
T5 = T1 + 25% PT6 = T1 + 25 6.35ab T7 = 75% of T1 4.05c 4.74cT8 = Control e 2.07d 2.57CV (%)
In a column, means followed by the same letter(s) are not significantly different at 5% le12S4Zn1B0.5
fertilizers on nutr ptake (kg ha-1 ro rice (BRRI 29) at Shamnag atkhira g Kharif-I season, 201
vel. T1 (STB) = N120P20K
cts of Table 25. Effein
ient u1
) by Bo dhan ar, Sdur
Pirgonj, Rangpur Treatments N P K S
T1= 100% NPK (STB) 86ab 13.5bc 77bc 10.3b T2 = T1 + 25% N 88ab 12.7cd 79b 10.7b
a 15.1ab 108a 12.4a
= Control 33d 6.6f 32d 4.5d
T3 = T1 + 25% NP 98T4 = T1 + 25% NK 90ab 12.2cd 79b 10.6b T5 = T1 + 25% PK 78bc 11.2d 86b 10.8b T6 = T1 + 25% NPK 101a 15.9a 80b 12.1a T7 = 75% of T1 69c 9.3e 66c 9.0c T8
CV (%) 10.04 9.12 8.14 7.26
ity an rient m emen ined produc
ifferent o c mater for inc d crop duction mainta oil allow-Ri opping p rn
as initiat uring 20 1 at BIN arm, My h us ice-Fa ce determi itabi f differe urces of nic materials for integ
l fertilizers fo easing cr roductivi nd mainta ili he initia materials and soil properties used at different experiments are presented in
Integrated soil fertil d nut anag t fo star su c rop tion
Utilization of d rgani ials rease pro and ined sfertility in Rice-F
ce cr atte
The experiment wrn to
ed d 10-1 A f mensing ing R llow-Ricropping patte ne the su lity o nt so orga rated usewith chemica r incr op p ty a in soil fert ty. T l nutrientcontent of different organic
95

BINA Annual Report 2011-12 Soil Science
Tables 26 and 27. There were nine treatment combinations (Table 28) and the experiment was laid out three replications. Organic materials were applied to each in a randomized complete block design with
crop before rice transplanting. Table 26. Nutrient content (%) of the organic materials used in the experimental field
Name of the manure N P K S Tobacco dust 1.00 0.13 0.85 0.20 Press mud 1.50 0.20 0.80 0.28
y manure 2.15 0.53 0.75 0.95 15 -0.53 0.75-1.55 0.08-0.95
Cow dung 1.11 0.26 1.16 0.13 Rice straw 0.50 0.11 1.55 0.08 PoultrRange 0.50-2. 0.11 Table 27. Soil characteristics of rimental
nutrients
the expe sites
A evailabl (ppm) Location pH To( P S Z B
E tion )
OM (%)
tal N %) n
xcha. caK (meq %
BINA farm, Mymensingh
6.5 (SA) L) 0.09 13 (M) ) 1.3 ( 8 (Opt) ) 0.98 (V (VL) 08 (VL M) 0.4 0.10 (L
BINA substation, Rangpur
5.8 (SA) ) 0.08 12 (L) 0.70 29 (L) )
5.8-8.1 25 0.08 11-13 07-14 0.70-1.60 16-0.48 19
1.06 (L (VL) 14 (L) (L) 0. 0.19 (M
Range 0.98-1. -0.09 0. 0.09-0.Note: SA = Slightly Acidic, SAL = S Alkaline, L , VL = Very
able 28. Treatment detail of the experiment
lightly = Low Low M = Medium, H = High, VH = Very High, Opt. = Optimum T
Treatments Boro rice T. aman rice T1 Control Control T Fert. based on AEZ Recommen Z
STB based Fert. for HYG Recomm d (50% P & S) ss mud ha-1 75% Rec nded Fert. base Z + 1 ton press a-1
bacco dust ha-1 75% ended Fert. bas EZ + 1 ton tob st ha-1
ton press mud ha-1 75% ended Fert. base Z + 2 ton pre ha-1
ton tobacco dust ha-1 75% ended Fert. bas EZ + 2 ton tob st ha-1
on press mud ha-1 ba IPNS Reco Fert. based on + 2 ton press mbased
n tobacco dust ha-1 on IPNS Recom Fert. based on + 2 ton tobacco -1 based o S
2T
ded Fert. based on AEed Fert. based on HYG 3 en
ommeT4 T2 + 1 ton preT
d on AEed on A
mud hacco du5 T + 1 ton to2
T T + 2Recomm
6 2T
Recomm d on AE ss mud 7 T2 + 2 Recomm ed on A acco du
T8 T3 + 2 t sed on mmended HYG ud ha-1 on IPNS
T9 T3 + 2 to based mended HYG dust han IPN
Results
esults indicated that application of different packages of fertilizers increased grain and straw yields of traw yields of T.
8 90 12 36 10
tatistically identical with T , T , T , and T . On the other hand, treatment T which received no
Rrice differed significantly over absolute control treatment (Table 29). The grain and saman rice (cv. Binadhan-7) during 2011 ranged from 1.90-5.20 and 3.00-6.83 t ha-1, respectively. The highest grain yield of 5.20 t ha-1 was recorded in treatment T (N P K S kg ha-1) which was s 9 7 6 3 1
fertilizer produced lowest yields of 1.90 t ha-1. The grain and straw yields of Boro rice (cv. Binadhan-5) during 2012 ranged from 2.10–5.95 and 3.35–7.09 t ha-1, respectively. The highest grain yield of 5.95 t ha-1 was recorded in treatment T8 (N140, P20, K80, S20, Zn3 and B2 kg ha-1 with 2 t ha-1 press mud
96

BINA Annual Report 2011-12 Soil Science
based on IPNS) which was statistically identical with T9, T7, T6, and T3, respectively. On the other hand, treatment T1 which received no fertilizer produced lowest yields of 2.10 t ha-1. Like grain yields, the straw yields also differed significantly due to treatments. Azad and Leharia (2002) reported that
nic and inorganic
t of fertilization on the of boro and T. rice at BINA fa ymensingh
T. aman-2011 (Binadhan-7)
Mean of 2 yrs. (T. aman)
Boro-201(Binadhan
Mean s. (B
grain and straw yields of rice significantly increased with the combination of orgafertilizers. Table 29. Effec yield aman rm, M
2 -5)
of 3 yroro) Treatments
Grain Straw rain Straw Grain Straw Grain Straw G T1T2
1.90d 3.13c
3.89bc 4.58ab 4.78a5.20a
8
3.00d 3.95cd
4.83bc 5.80ab
336.80a
83
4.13 4.62
85.10
.0
34.30
6.44 .58
6.90 .20
2.10c 4.18b 5.80a 4.50b
5.80a55.95a 5.8
5.90c 5.35cd
7.067.55a
2.03 3.96 5.26 4.24 4.15 5.30
5.76
5.90 6.01
7.09
T3T4T5T6T7T8T9
4.50ab 3.93bc
5.90ab 4.60c
4.52 4.06
5.57 5.64
2.033.33
.06 3.35e 4.55d
2.974.54
b 6.
5.1 a 6.
a 4.
a 5
5 6
0 7
5.88
4.68b 5.50cd
.68a
8a
0a .35bc
6.10bc
5.07
5.66
5.72 6.70 6.62
6.52 Fertilizer dose (MYG): Boro-N98P14K S Zn B1, T.Aman-N P K S8 (kg ha )
r dose (HYG): 140P B56 14 2 65 8 25
-1
Fertilize Boro-N 20K80S20Zn3 B n-N S10
ata treatments used in the experiment. The highest ed with the treatment T8 followed by Tk. 1,60,593 ha-1 and
1 a in the treatm and T7, respectively. Among the treatm T7 treatment gave the h nefit (6.85). The s ighest margin st ratio was found in treat nt T Tabl . Ec -Fallow-T. aman
2, T.Ama 90P12K36 (kg ha-1) D in Table 30 shows the cost and benefit of differentgross margin of Tk.1,63,663 ha-1 was obtain
-1,56,430 high t mar
ent T9 ents, al benefit-coes ginal be cost ratio econd h
me 6 (6.77).
e 30 onomic analysis of Boro rice cropping pattern
Economic yield-1
(kg ha ) Trea
Grosreturtments
Grain Straw (Tk ha
s Variable Gross Marginal n -1)
cost (Tk ha-1)
margin (Tk ha-1)
gross margin (Tk ha-1)
MBCR
T1 4000 6300 66300 - 66300 - - T2T
7300 8500 1180010300 11800 16630
0 12217 105783 39483 3.23 0 16937 149363 43580 4.90 3
T4 8430 9950 136400 12150 124250 57950 4.77 T 8570 10330 138880 12150 126730 60430 4.97
10380 12800 156980 13150 143830 89050 6.77 5
T6T7 10460 12680 169580 13150 156430 90130 6.85 T8 11150 14350 181600 17937 163663 97363 5.43 T9 11060 12930 178830 18237 160593 94293 5.17
Grain = 15 Tk kg-1, Straw = 1.00 Tk kg-1, Urea = 12 Tk kg-1, TSP = 22 Tk kg-1, MP = 25 Tk kg-1
Gypsum = 10 Tk kg-1, Zn = 100 Tk kg-1, Boron = 80 Tk kg-1, MBCR = Marginal benefit cost ratio The amounts of N, P, K and S uptake by Boro-Fallow-T.aman rice as affected by different treatments combination are presented in Table 31. Nutrient uptake increased with increase of yield. The highest uptake was found in T8 treatment in case of N, P and S but for K it was in treatment T7. The nutrient uptake ra ged among the nutrients are N (42-159), P (08-29), K (62-222) and S (04-17) kg han -1.
97

BINA Annual Report 2011-12 Soil Science
Table 31. Nutrient uptake (kg ha-1) as affected by different treatment combinations of organic and inorganic fertilization in Rice-Fallow-Rice cropping pattern
Nutrient uptake (kg ha-1) Treatments N P K S T1 42 8 62 04 T2 103 20 142 11
15 T4
T6 147 28 189 15 150 29 222 15 159 29 216 17 156 27 213 16
Range 42-159 8-29 04-17
T3 133 25 183 136 21 192 15
T5 119 21 178 13
T7
T8
T9
62-222 Conclusion
Integrated nu man nt by ving mical fertilizer org manures and recommended fertilizer dose for
to fertilizers applied for HYG. case of HYG, IPNS based recommended fertilizers with press mud or tobacco dust @ 2 t ha-1
ne area. The experiment was laid , T = Fertilizer for MYG, T3 =
Fertili MYG ), T4 = Fertilizer fo 5 = F r f D -1) base S, r ps n ar licat times. Each repli represe block were 18 (6 × 3) u ts. The r mende oses of fertilizer treat used in the experi ll do , K, fer and 1 N ferti r were a t the t final parat e res rtiliz applie wo equa plit, i.e. 3 s of tra g a ays af ing. sam s colle for soil t ure, pH, organic matte , e able K available . Pla les (Grain and straw) were coll om the xperi r anal r NPK nt.
(ppm) ation
(meq %)
trient ageme invol che s with anic incorporation of press mud and/or tobacco dust @ 2 t ha-1 along withMYG recorded identical grain yield of boro and T. aman rice comparedInperformed better compared to those with full dose of chemical fertilizers. Thus it can be concluded that for efficient production rice and maintenance of soil productivity integrated use of organic manure or crop residues with chemical fertilizers is needed.
Monitoring and management of saline soil for increased crop production
The experiment was conducted at Kaligonj, Satkhira district of saliout in RCB design and there were six treatments Viz. T = control1
r HYG, T2
ertilizezer for d on IPN
+ CD ( t ha5 arme s
-1 or HYG + Cd p
(5 t haT6 = F practices, for the cro (Mungbea and must ), each re ed threecation nted a . There nit plo ecom d dments ment. Fu se of P S, Zn, B tilizers /3rd of
lize pplied a ime of land pre ion. Th t of N fe er was d in tl s 0 day nsplantin nd 60 d ter sow The soil ple wa cted ext r, total N xchange P, and S nt samp
ected fr field e ment fo ysis fo S conte
Table 32. Nutrient status of initia e Kal atkhil soil of farm r’s field at igonj, S ra
Available nutrients Exch. COM Total N pH
(%) (%) P S Zn B K (ds/m) EC
7.8 2.60 0.14 13.6 20.2 - - 0.29 4.6 Critical level - 0.12 10 10 0.6 0.2 0.12
98
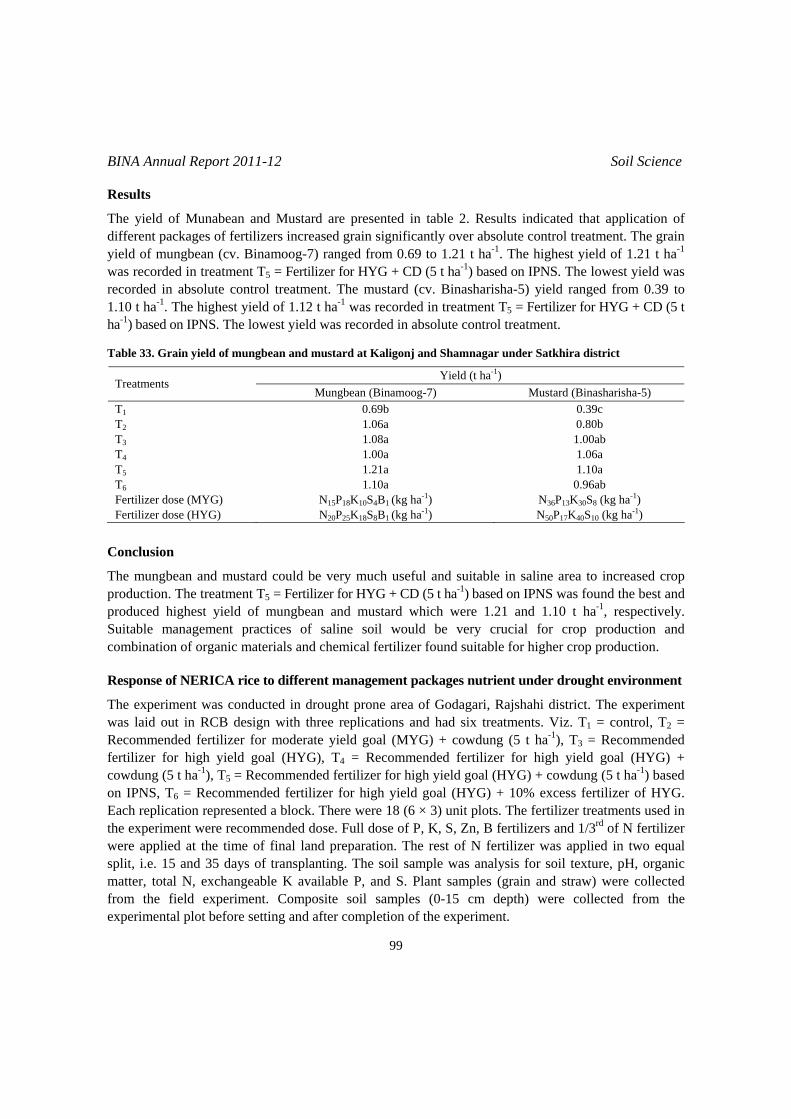
BINA Annual Report 2011-12 Soil Science
Results
The yield of Munabean and Mustard are presented in table 2. Results indicated that application of d lizers increased gra lute control treatment. The grain yield f mungbean (c inamoog-7) ranged om 0.69 to 1.21 t h The highest yield o .21 t ha-1 was recorded in treat T5 = Fertilizer for HYG + CD (5 t ha-1) based on IPNS. The low ield was recorded in absolute rol treatment. The stard (cv. Binasha a-5) yield ranged from 0.39 to 1.10 -1. The highe eld of 1.12 t ha-1 was recorded in treatme 5 = Fertilizer for HYG + CD (5 t ha-1) ed on IPNS. The lowest yield was re ed in absolute con reatment. Table 33. Grain yield of mungbean and mustard at Kaligonj and Shamnagar under Satkhira distric
Yield (t h
ifferent packages of ferti in significantly over abso-1 o v. B fr a . f 1
ment est y cont mu rish
t ha st yi nt T bas cord trol t
t
a-1) Tre ents
Mungbean (Binamoog-7) Mustard (Binasha a-5) atm
rishT b 0.39c1 0.69 T2 1.06a 0.80b
1.08a 1.00ab T3T4 1.00a 1.06a T5 1.21a 1.10a T6 1.10a 0.96ab Fertilizer dose (MYG) N15P18K10S4BB1 (kg ha ) N-1
36P13K30S8 (kg ha ) Fertilizer dose (HYG) N
-1
20P25K18S8B1 B (kg ha-1) N50P17K40S10 (kg ha-1)
Conclusion
The mungbean and mustard could be very much useful and suitable in saline area to increased crop was found the best and
-1
wdung (5 t ha ) based n IPNS, T6 = Recommended fertilizer for high yield goal (HYG) + 10% excess fertilizer of HYG.
e fertilizer treatments used in the experiment w m dose. Ful n, B fertil rd of N fertilizer
applied at me of final land preparation rest of N fertilizer was applied in t al split, i.e. 15 and 3 s of transplanting he s was analysis for soil texture, pH c
er, total N, ngeabl aila , a Pla p s (grain a raw) were c ted ld e eriment. Composite il s les 5 h) w collected from the
xperimental plot before setting and after completion of the experiment.
production. The treatment T5 = Fertilizer for HYG + CD (5 t ha-1) based on IPNSproduced highest yield of mungbean and mustard which were 1.21 and 1.10 t ha , respectively. Suitable management practices of saline soil would be very crucial for crop production and combination of organic materials and chemical fertilizer found suitable for higher crop production. Response of NERICA rice to different management packages nutrient under drought environment
The experiment was conducted in drought prone area of Godagari, Rajshahi district. The experiment was laid out in RCB design with three replications and had six treatments. Viz. T1 = control, T2 = Recommended fertilizer for moderate yield goal (MYG) + cowdung (5 t ha-1), T3 = Recommended fertilizer for high yield goal (HYG), T4 = Recommended fertilizer for high yield goal (HYG) + cowdung (5 t ha-1), T5 = Recommended fertilizer for high yield goal (HYG) + co -1
oEach replication represented a block. There were 18 (6 × 3) unit plots. Th
ere recomi
ended l dose of P, K, S, Z izers and 1/3were the t
5 day. The wo equ
, organi. T oil sample matt excha e K av ble P nd S. nt sam le nd st ollecfrom the fie xp so amp (0-1 cm dept ere e
99

BINA Annual Report 2011-12 Soil Science
Results
The grain and straw yields of Boro rice of 2012 are presented in Table 2. Results indicated that application of different packages of fertilizers increased grain and straw yield significantly over absolute control treatment. The grain and straw yields of Boro rice (cv. NERICA-10) during 2012 ranged from 1.68-5.29 and 2.04–5.69 t ha-1, respectively. The highest grain yield of 5.29 t ha-1 was recorded in treatment T5 (Recommended fertilizer for high yield goal + Cowdung @ 5 t ha-1 based on IPNS) which was statistically different with other treatments. Treatment T1 which received no fertilizer produced lowest yields of 2.17 t ha-1. Like grain yields, the straw yields also differ
-1ed significantly due
mended different
w eatments. On the other hand, the lowest straw t ha-1) was recorded in absolute control treatment. Table 34. Nutrient status of initial soil of farmer’s field at Godagari, Rajshahi
Available nutrients (ppm)
to treatments. The highest straw yield of 5.69 t ha was recorded in treatment T5 (Recomfertilizer for high yield goal + cowdung @ 5 t ha-1 based on IPNS) which was statistically
ith other tr yields (2.04
pH OM (%) Total N (%) Zn B xch. cation K
(meq %) P S E
5.2 1.55 0.11 13 1.6 0.45 0.12 10 Critical level 10.0 0.6 0.12 8.0 0.2 0.12
able 35. Effect of different levels of fertilizer on yield and yield contributing characters
Plant Tiller Panicle Seed 1000 seed Grain Straw
T
Treatments height (cm)
hill-1
(no.) length (cm)
panicle-1
(no.) weight
(g) yield
(t ha-1) yield
(t ha-1) T1 78.00c 4.03c 17.33b 58.77b 24.98 1.68d 2.04e T2 85.87b 5.57b 22.77a 120.93a 26.91 4.29c 4.27d T3 91.30ab 6.67a 22.60a 123.07a 26.84 4.42b 4.91c T4 89.97ab 6.87a 23.10a 132.40a 26.04 4.53b 5.07c T5 92.00a 7.27a 23.20a 135.20a 25.77 5.29a 5.69a T6 91.57a 6.77a 22.83a 132.67a 26.02 4.75b 5.37b
Fertilizer dose (Boro): MGY-N98P20K50S15Zn2B1 and HYG-N120P25K65S20Zn3BB1, Conclusion
Recommended fertilizer dose and along with cowdung (5 t ha ) was found best treatment combination and produced highest biological yield (Grain and straw). But depending on the local environment, further research is underway to observe the suitability of agricultural production which would be very much economically viable and sustainable production.
-1
100

BINA Annual Report 2011-12 Soil Science
Potassium management in soils and crop growth
Plant samples (Grain and straw) were collected from the field experiment and were
T Treatments c n of ilizer man
Boro rice (var. Binadhan-5 T. aman rice (var. Binadha
Effects of different levels of rice residue to potassium supply and its impact on soil fertility using Rice-Fallow-Rice cropping pattern
The experiment was conducted at BINA farm using the cropping pattern, Boro-Fallow-T. aman. The experiment was laid out in RCB design. There were four treatments for the first crop (Boro rice) and ten treatments for the second crop (T. aman rice), each replicated three times. The fertilizer treatments used in the experiment were recommended dose. For Boro rice full dose of P, K, S, Zn, B fertilizers and 1/3 of N fertilizer were applied at the time of final land preparation. The rest of N fertilizer was applied in two equal split, i.e. 30 days of transplanting and 60 days after transplanting. And for T. aman rice P, K S and 1/3rd of urea were applied as basal and rest N fertilizer were applied as like first crop. The soil sample was analysis for soil texture, pH, organic matter, total N, exchangeable K available P, and S. analyzed for NPKS content.
able 36. ombinatio different fert agement packages
) n-7) T (No fert. or rice straw.) T1 ontrol ert. or rice straw.) 1 Control C (No fTT
2 T2 aw removed 3 75% NPKSZnB T3 75% NPKS + 100% rice straw removed
emoved 10 S +50 25% aw d. 6 1 +50% 50% Boro rice straw d. 7 100% NPS +50% K fert.+ 75% e straw d. 1 +75% aw d. 1 +75% aw d. 1 +75% aw d.
50% NPKSZnB 50% NPKS + 100% rice str
T4 100% NPKSZnB T4 100% NPKS +100% rice straw rT5 0% NP
00% NPS% K fert.+
K fert.+Boro rice str remove
T removeT Boro ric removeT8 00% NPS K fert.+ 25% Boro rice str removeT9 00% NPS K fert.+ 50% Boro rice str removeT10 00% NPS K fert.+ 75% Boro rice str remove
Results
Table 37. Results indicated that pplication of different packages of fertilizers increased grain and straw yield significantly over
trol treatment. The grain and straw yields of Boro rice (cv. Binadhan-5) during 2012
2.17-5.20 and 3.18-7.13 t ha-1, respectively. ghest grain yield of 5.20 t ha-1 was found in two treatments (T8 and T9). On the other hand,
treatment T1 which received no fertilizer produced lowest yields of 2.17 t ha-1. Like grain yields, the straw yields also differed significantly due to treatments.
The grain and straw yields of Boro rice of 2012 are presented inaabsolute conranged from 2.25-6.24 and 3.05–7.75 t ha-1, respectively. The highest grain yield of 6.24 t ha-1 was recorded in treatment T4 (N140, P25, K45, S20, Zn4 and B2 kg ha-1) which was statistically different with other treatments. Like grain yields, the straw yields also differed significantly due to treatments. The lowest grain and straw yields were recorded in absolute control treatment. The grain and straw yields
f T. aman rice (cv. Binadhan-7) during 2011 ranged fromoThe hi
101

BINA Annual Report 2011-12 Soil Science
Table 37. Effect of different fertilizer management packages and rice straw on the yield of Boro and T. aman rice at BINA farm, Mymensingh
Boro-2012 (Var. Binadhan-5) T. Aman-2011 (Var. Binadhan-7) Yield (t ha-1) Mean of 3 yrs. Yield (t ha-1) Mean of 3 yrs. Treatments
Grain Straw Grain Straw Grain Straw Grain Straw T1T2T3T4T5T6T7 T8T9 T10
2.25c 4.13b 4.95b 6.24a
3.05d 4.85c 5.85b 7.75a
2..63 3.72 4.92. 5.98
3.50 4.40 6.12 7.20
2.17e 3.10d 3.83c
4.40bc 4.17bc 4.40bc 4.60ab 5.20a 5.20a
4.57ab
3.18e 4.27d 4.73d 5.33cd 5.00d 5.50cd 6.20bc 7.03ab 7.13a 6.10c
2.44 3.12 3.57 4.60 4.50 4.55 4.64 4.94 5.02 4.60
3.87 4.72 5.04 5.54 5.53 5.23 5.48 6.75 6.40 6.02
Fertilizer dose (HYG): Boro-N140P K S Zn B T. aman-N P K S (kg ha-120 80 20 3 2, 90 12 36 10
n the experiment. The highest ha was obtained ed by Tk. 1,86,380 ha-1 and
nd T7, respect 9 treatment gave the hes fit cost ratio (5.55). The secon was found in atme
am and S uptake by Boro-Fallo mbination are presented in Table 39 Nutrie take of N and P was found in T8 and T9 treat nt trient uptake ranged among the nutrients are N (95
hange n soil fertility status is very little due t e ttern (Table 40). The nutrient status of initia d the different treatment except control.
omic analysis of Boro-Fallow-T. aman rice cropping pattern
) Data in Table 38 shows the cost and benefit of different treatments used i
-1 gross margin of Tk. 1,86,480,55 -1
with the treatment T9 followive1,76 0 ha in the treatment T8 a ly. Among the treatments, T
hig t marginal bene d highest marginal benefit-cost ratiotre nt T8 (5.54).
heT ounts of N, P, K w-T. aman rice as affected by different treatmentscoup
ntme
uptake increased with increase of yield. The highestbut in case of K and S it was in treatment T . The10
nu -247), P (8-18), K (75-214) and S (08-22) kg ha-1. C i o th addition of fertilizer and rice straw in the croppingpa l an post harvest soil were not remarkably change dueto Table 38. Econ
Economic yield (kg ha-1) Treatments
Grain Straw
Gross return
(Tk ha-1)
Variable cost
(Tk ha-1)
Gross margin
(Tk ha-1)
Marginal gross margin
(Tk ha-1) MBCR
T1 4420 6230 72530 - 72530 - - T2 7230 9120 117570 8887 108683 36153 4.07 T3 8780 10580 142280 13331 128949 56419 4.23 T4 10640 13080 172680 17775 154905 82375 4.63 T5 10410 12750 168900 17025 151875 79345 4.66 T6 10640 13250 172850 17025 155825 83295 4.89 T7 10840 13950 176550 17025 159525 86995 5.11 T8 11440 14780 186380 17400 168980 96450 5.54 T9 11440 14880 186480 174T 10810 13850 176000 17400
00 169080 96550 5.55 10 158600 49917 2.87
Grain = 15 Tk kg-1, Straw = 1.00 Tk kg-1, Urea = 12 Tk kg-1, TSP = 22 Tk kg-1, MP = 25 Tk kg-1, Gypsum = 10 Tk kg-1, Zn = 100 Tk kg-1, Boron = 80 Tk kg-1, MBCR = Marginal benefit cost ratio.
102

BINA Annual Report 2011-12 Soil Science
Table 39. Nutrient uptake (kg ha-1) as affected by different treatment combinations of organic and inorganic fertilization in Rice-Fallow-Rice cropping pattern
e (kg h
Nutrient uptak a-1) Treatments
N P K S T1 8 95 8 75 T2 183 15 156 19
19 22
244 16 22 242 16 22 237 18 21 247 17 21 234 17 21
204 22
T3 215 17 181 T4 237 17 201 T5 202 T6 207 T7 210 T8 204 T9 214 T10 241 16
Table 40. Nutrient status of initial and post harvest soil in Rice-Fallow-Rice cropping pattern
Available nutrients (ppm) Treatments pH OM (%)
Total N (%) P S Zn B
Exch. cation K (meq %)
Initial soil 6.5
0.98 0.09 13 08 1.3 0.48 0.10
12 9 - - 0.10 13 10 - - 0.11
- - 0.11 T10 0.11 13 - 0.11
Post harvest soil T1 6.5 0.97 0.09 12 6 - - 0.09 T2 6.6 0.98 0.10 12 9 - - 0.10 T3 6.5 0.97 0.12 13 9 - - 0.11 T4 6.5 0.97 0.12 13 10 - - 0.11 T5 6.5 0.98 0.13 12 9 - - 0.11 T6 6.6 0.98 0.10 12 10 - - 0.10 T7 6.5 0.97 0.11 T 6.6 0.98 0.12 8
T9 6.6 0.99 0.12 13 9 6.5 0.98 10 -
Con sion
Pota m repl ent t h appli f fertiliz rganic is impo r susta e crop oducti plicat K fert crease oducti g with utrients and inco ration straw source rtilizer oduce ial gra T n rice. hus use kg N g of P, , 20 kg Zn a B ha-1 f rice 0 kg N kg of 5 kg kg o and 75% straw from p crop . Aman were fo be t treatm binatio e rice pping p mining from t
clu
ssiu enishm hroug cation o er or o sources rtant fo inabl pr on. Ap ion of ilizer in rice pr on alon other nrpo of rice as a of K fe may pr substant in yield of . amaT of 140 , 25 k 45 kg K S, 4 kg nd 2 kg or Boro and 8, 8 P, 22. of K, 8 f S ha-1 rice addition revious for T
und to he best ent com n for th -rice cro attern as well as Khe soil.
103

BINA Annual Report 2011-12 Soil Science
Evaluation of different organic fertilizer for field trail using vegetable
Evaluation of “Biogen Jaibo sar (BJS)” on Lady’s finger and “Krishibid Jaibo sar (KJS)” on Indian spinach production
Field xperiments were c ted at BINA farm, Mymensingh, BINA b-station farm, Ishurdi and BINA ubstation farm R ur during second we May to third w f August, 2012 e the effect of organic fe rs on Lady`s finge d Indian spinac uction. The e riments comp ed of seven treat ts: T1 = Recommended chemical fertiliz CF), T2 = 85% RCF, T3 = 70% RFC, T4 = 85% RC t ha-1 JS, T5 = 85% RCF + 1 t ha-1 JS, T 0% RCF + 3 t h S, T7 = 70% RCF + 1 t ha-1 JS. T periments were laid out in a RCB design three replicatio rganic fertil rs were applied b one week of final la eparation. Afte n days of organ ertilizer appli ion, one-third urea and all TSP, MP and G um were applied. a was applied in two equal splits. Both of these ins ents were applied as oadcast and inco ated with soil f wed by weed . The fresh lady’s finger and Indian spinac ere harvested at t growing per
Soil properties fa nsingh B BINA subst
e onduc su s angp ek of eek o to observ
rtilize r an h prod xperis men er (R
F + 3 6 = 7 a-1 Jhe ex with ns. O
ize efore nd pr r seve ic fcat yps Ure
tallm br rpor olloing h w differen iod.
Table 41. Initial soil status of the experimental sites.
BINA rm, Myme INA substation, Ishurdi ation, Rangpur pH 6.6 7.8 5.8 ON
M (%) 1.04 .27 1.06 itrogen (%) .11 0.08
Phosphorus (ppm) 12 Potassium (meq%) 0.16 0.19 Sulphur (ppm) 18.6 14.2
100.1
15.3 11.0 0.22
15.8 Resu
Lady’s finger
Fresh fruit yield lady’s finger on rent treatments of different cations s wn in Ta 2. In different locatio resh yield dy’s finger chang signific tly due to the treatm The fresh fruit yield of lady’s finger ranged from 7.2 to 17.0 t ha-1 at both the loca e The fresh fruit of lad finge es fr .2 to 1 Mym and 12.3 to .0 t ha-1 at Ishurdi,
sp ely. Th hest was r ed in T4 5% RCF + 3 t ha ent at My ingh nd Ishurdi. The lowest yield was obtained from treatment T3 (70% RCF) at both the locations. From
treatments of the organic and inorganic fertilizer packages, the results demonstrated that 3
4 (85% RCF + 3 t ha-1 BJS) treatment. However the highest gross return, net turns and marginal return were obtained from T4 treatment. In both the locations (Mymensingh and
Ishurdi) the highest MBCR (1.40 and 1.92, respectively) were obtained from T4 treatment.
lts
of diffe lo ho ble 4ns, f fruit of la ed an ents.
tions (Tabl 42).y’s r rang om 7 0.0 at ensingh 17
ectiv e hig yield ecord (8 -1 BJS) treatm mensreathe different t ha-1 BJS along with 85% RCF performed highest fruit yield in Mymensingh and Ishurdi. At Mymensingh, the application of BJS increased the gross and net return in all the treatments (Table 43). The gross return and net return ranged from Tk. 1,44,000/- to 2,00,000/- and Tk. 1,37,294/- to 1,76,857/- per hectare, respectively. At Ishurdi the application of BJS increased the gross and net return in all the treatments. The gross return and net return ranged from Tk. 2,46,000/- to 3,40,000/- and Tk. 2,39,294/- to 3,16,857/- ,respectively per hectare. The highest net return and marginal return
ere obtained from Twre
104

BINA Annual Report 2011-12 Soil Science
Indian Spinach
Fresh weight of Indian Spinach for different treatments at two locations is shown in Table 42. In both the locations, the yields were increased significantly due to the treatments. The yields ranged from
Fresh wt. (t ha-1)
27.8 to 48.5 t ha-1 depending on the KJS used and locations (Table 42). However, the highest yield of 48.5 t ha-1 was recorded in treatment T4 (85% RCF + 3 t ha-1 KJS) at Rangpur. The fresh weight of Indian Spinach ranged from 33.6 to 47.9 t ha-1 at Mymensingh. On the other hand, the yield ranged from 27.8 to 48.5 t ha-1 at Rangpur. The highest yield was recorded in treatment T4 (85% RCF + 3 t ha-1 KJS) at both the locations while the lowest yield was obtained by the treatment T3 (70% RCF) at both the locations. From the different treatments of organic and inorganic fertilizer packages, it may be concluded that 3 t ha-1 KJS along with 85% RCF performed the highest fresh vegetable yield at Mymensing and Rangpur. Table 42. Effect of “Biogen Jaibo Sar” on Lady`s finger and “Krishibid Jaibo Sar” on Indian spinach production
in different locations
Lady’s finger Indian spinach Treatments Mymensingh Ishurdi Mymensingh Rangpur
T : N1 120P24K60S2 (RCF) 7.7bc 14.1bc 41.6bc 36.4bc T : 85% RCF 2T
7 13.9c 38.3cd .7c 7. 12.3d 33.6e .8d
ha-1 JS 10.0a 17.0a 47.9a 48.5a ha-1 JS 8.1b 14.8bc 42.4bc 43.9ab
3 t ha-1 JS 8 15.4b 43.6ab .6a T7: 70% RCF + 1 t ha-1 JS 7.4c 13.7c 34.8de 34.8cd
.3c 353: 70% RCF 2c 27
T4: 85% RCF + 3 tT5: 85% RCF + 1 t T6: 70% RCF + .4b 47
RecommeRecomme
nded Chemical fertilizer, @ N120 P24 K60 S20 kg ha-1 at Mymensingh & Ishurdiur nded Chemical fertilizer @ N120 P24 K60 S20 kg ha-1 at Mymensingh & N120 P24 K80 S20 at Rangpur
Table 43. Cost benefit ratio of “Biogen Jaibo Sar” on Lady’s finger production at two locations
Gross return Variable cost Net return Marginal return MBCR Treatments Yield (t ha-1) Tk ha-1
Mymensingh T1 7.7 1,54,000 9,580 1,44,420 - - T2 7.2 1,46,000 8,143 1,37,857 -6,563 -0.81 T3 7.3 1,44,000 6,706 1,37,294 -7,126 -1.06 T4 10.0 2,00000 23,143 1,76,857 32,437 1.40 T5 8.1 1,62,000 13,143 1,48,857 4,437 0.34 T6 8.4 1,68,000 21,706 1,46,294 1,874 0.09 T 7.4 1,48,000 11,706 1,36,294 -8,126 -0.69 7
Ishurdi T1 14.1 2,82,000 9,580 2,72,420 - - T2 13.9 2,78,000 8,143 2,69,857 -2,563 -0.31 T3 12.3 2,46,000 6,706 2,39,294 -33,126 -4.94 T4 17.0 3,40,000 23,143 3,16,857 44,437 1.92 T5 14.8 2,96,000 13,143 2,82,857 10,437 0.79 T6 15.4 3,08,000 21,706 2,86,294 13,874 0.64 T7 13.7 2,74,000 11,706 2,62,294 -10,126 -0.87
Lady’s finger = Tk 20 kg-1, Urea = Tk 12 kg-1, TSP = Tk 22 kg-1, MP = Tk 25 kg-1, Gypsum = Tk 9 kg-1, Organic fertilizers = Tk 5 kg-1.
105

BINA Annual Report 2011-12 Soil Science
The estimated gross return, variable cost, net return and marginal benefit cost ratio (MBCR) presented in Table 44. The application of fertilizer increased the gross and net return in all the treatments. The gross and net return ranged from Tk 3,36,000/- to 4,79,000/- and Tk 3,29,294/- to 4,55,857/- hectare-1, at Mymensingh respectively .On the other hand, the gross and net return ranged from Tk 2,78,000/- to 4,85,000/- and Tk 2,71,294/- to 4,61,857/- at Rangpur respectively. However, the highest gross and net return 4,85,000/- and 4,61,857/- hectare-1 was obtained from T4 at Rangpur. The highest MBCR was obtained 5.44 from T5 (85% RCF + 1 t ha-1 KJS) treatment at Rangpur. Table 44. Cost benefit ratio of “Krishibid Jaibo Sar (KJS)” production on Indian spinach at two locations
Gross return Variable cost Net return Marginal return Treatments Yield
(t ha-1) Tk ha-1 MBCR
Mymensingh T1 41.6 4,16,000 9,580 4,06,420 - -
38.3 T2 3,83,000 8,143 3,74,857 -31563 -3.88 T3 33.6 3,36,000 6,706 4 -77126 -11.5
47.9 4,79,000 5 57 2.14 5 42.4 4,24,000 4,10,857 4
4,14,294 7874 6 3,36,294 -70126 .99
R3,6 3,54,420 - - 3,5 3,48,875 -5563 .68 2,7 2,71,294 -83126 .40
107437 5.44
T6 47.6 4,76,000 21,706 4,54,294 99874 4.60 6 -1.55
3,29,294,5 ,8T4 23,143 49437
4437 T 13,143 0.33T6 43.6
34.8 3,48,000 4,36,000 21,706 0.
T7 11,706 -5angpur
T 36.4 1 4,000 9,580 T2 35.7 7,000 8,143 -0T3 27.8 8,000 6,706 -12
4.64 T4 48.5 4,85,000 23,143 4,61,857 T5 43.9 4,39,000 13,143 4,25,857 71437
T7 34.8 3,48,000 11,706 3,36,394 -1812Indian spinach = Tk , Urea TSP P = Gypsum = Tk 9 kg-1 ic fer g-1.
Conclusion
From e results reveal ere was scope sing the y lady’s fi nd India pinach gh the nic n ecommen organic f ers based n integra utrien ment ap es. The organic ers are ca to reduc 15-30% of the rec ed chem rtilizer an increa yield up %
ng on the location.
10 kg-1 = Tk 12 kg-1, tilizers = Tk 5 k
= Tk 22 kg-1, M Tk 25 kg-1, , Organ
th it is ed that th ample of increa ield of nger an s throu use of orga fertilizers alo g with r ded in ertiliz o ted n t manage proach uses of fertiliz pablee ommend ical fe s and c se the to 25
dependi
106
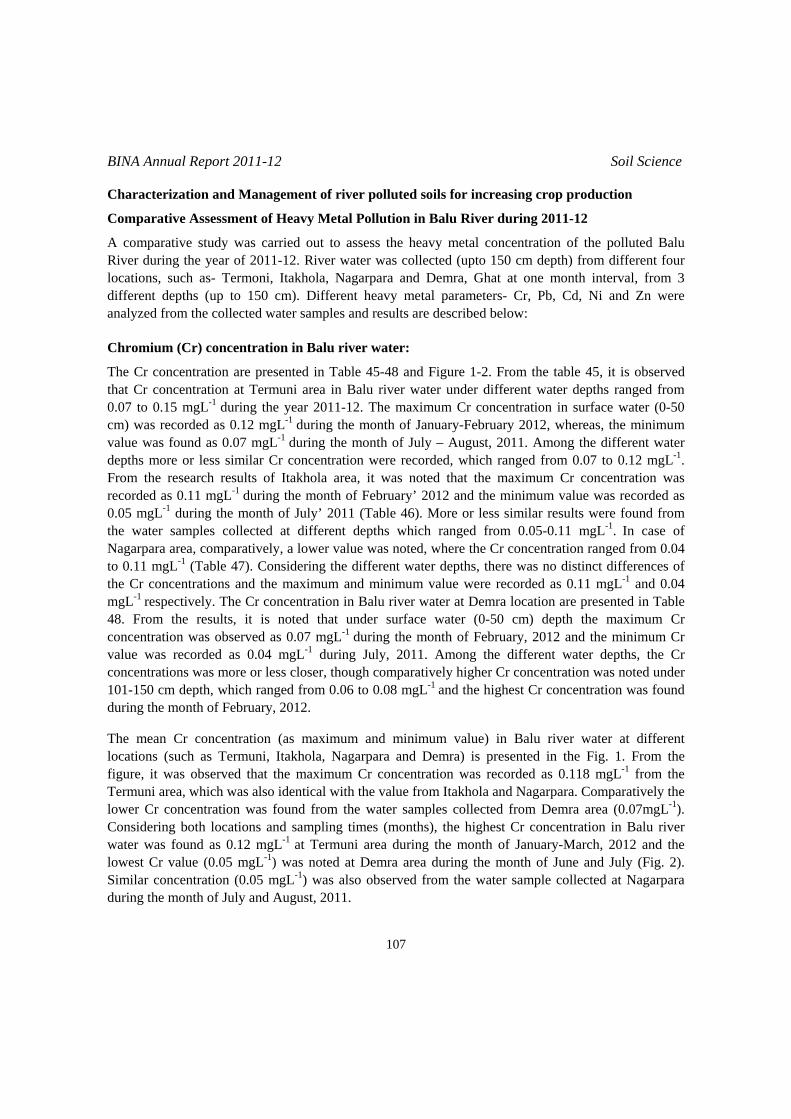
BINA Annual Report 2011-12 Soil Science
Characterization and Management of river polluted soils for increasing crop production
Comparative Assessment of Heavy Metal Pollution in Balu River during 2011-12
A comparative study was carried out to assess the heavy metal concentration of the polluted Balu River during the year of 2011-12. River water was collected (upto 150 cm depth) from different four locations, such as- Termoni, Itakhola, Nagarpara and Demra, Ghat at one month interval, from 3 different depths (up to 150 cm). Different heavy metal parameters- Cr, Pb, Cd, Ni and Zn were analyzed from the collected water samples and results are described below: Chromium (Cr) concentration in Balu river water:
The Cr concentration are presented in Table 45-48 and Figure 1-2. From the table 45, it is observed that Cr concentration at Termuni area in Balu river water under different water depths ranged from 0.07 to 0.15 mgL-1 during the year 2011-12. The maximum Cr concentration in surface water (0-50 cm) was recorded as 0.12 mgL-1 during the month of January-February 2012, whereas, the minimum value was found as 0.07 mgL-1 during the month of July – August, 2011. Among the different water depths more or less similar Cr concentration were recorded, which ranged from 0.07 to 0.12 mgL-1.
From the research results of Itakhola area, it was noted that the maximum Cr concentration was recorded as 0.11 mgL-1 during the month of February’ 2012 and the minimum value was recorded as 0.05 mgL-1 during the month of July’ 2011 (Table 46). More or less similar results were found from the water samples collected at different depths which ranged from 0.05-0.11 mgL-1. In case of Nagarpara area, comparatively, a lower value was noted, where the Cr concentration ranged from 0.04 to 0.11 mgL-1 (Table 47). Considering the different water depths, there was no distinct differences of the Cr concentrations and the maximum and minimum value were recorded as 0.11 mgL-1 and 0.04 mgL-1 respectively. The Cr concentration in Balu river water at Demra location are presented in Table 48. From the results, it is noted that under surface water (0-50 cm) depth the maximum Cr concentration was observed as 0.07 mgL-1 during the month of February, 2012 and the minimum Cr value was recorded as 0.04 mgL-1 during July, 2011. Among the different water depths, the Cr concentrations was more or less closer, though comparatively higher Cr concentration was noted under 101-150 cm depth, which ranged from 0.06 to 0.08 mgL-1 and the highest Cr concentration was found during the month of February, 2012. The mean Cr concentration (as maximum and minimum value) in Balu river water at different locations (such as Termuni, Itakhola, Nagarpara and Demra) is presented in the Fig. 1. From the figure, it was observed that the maximum Cr concentration was recorded as 0.118 mgL-1 from the Termuni area, which was also identical with the value from Itakhola and Nagarpara. Comparatively the lower Cr concentration was found from the water samples collected from Demra area (0.07mgL-1). Considering both locations and sampling times (months), the highest Cr concentration in Balu river water was found as 0.12 mgL-1 at Termuni area during the month of January-March, 2012 and the lowest Cr value (0.05 mgL-1) was noted at Demra area during the month of June and July (Fig. 2). Similar concentration (0.05 mgL-1) was also observed from the water sample collected at Nagarpara during the month of July and August, 2011.
107

BINA Annual Report 2011-12 Soil Science
Table 45. Cr (mgL-1) concentration in Balu River water at three different depths of Termuni location during the year 2011-2012
Water depth Month
0-50 cm 51-100 cm 101-150 cm Mean July’11 Aug’11 Sep’11 Oct’11 Nov’11 Dec’11 Jan’12 Feb’12 March’12 April’12 May’12 June’12
0.07 0.07 0.10 0.40 0.10 0.11 0.12 0.12 0.11 0.11 0.11 0.10
0.09 0.09 0.10 0.11 0.11 0.11 0.12 0.12 0.12 0.12 0.11 0.10
0.09 0.09 0.10 0.11 0.12 0.12 0.12 0.12 0.12 0.11 0.11 0.10
0.08 0.08 0.10 0.20 0.11 0.11 0.12 0.12 0.12 0.11 0.11 0.10
Average Maximum Minimum Std. Dev.
0.13 0.115 0.07 0.09
0.11 0.12 0.09 0.01
0.11 0.12 0.09 0.01
0.11 0.20 0.08 0.03
Table 46. Cr (mgL-1) concentration in Balu River water at three different depths of Itakhola location during the year 2011-2012.
Water depth Month
0-50 cm 51-100 cm 101-150 cm Mean July’11 Aug’11 Sep’11 Oct’11 Nov’11 Dec’11 Jan’12 Feb’12 March’12 April’12 May’12 June’12
0.05 0.06 0.08 0.08 0.08 0.10 0.10 0.11 0.10 0.10 0.09 0.07
0.06 0.06 0.08 0.08 0.08 0.11 0.11 0.11 0.11 0.11 0.10 0.09
0.07 0.07 0.08 0.08 0.08 0.10 0.11 0.11 0.11 0.11 0.11 0.09
0.06 0.06 0.08 0.08 0.08 0.10 0.11 0.11 0.11 0.11 0.10 0.08
Average Maximum Minimum Std. Dev.
0.09 0.11 0.05 0.02
0.09 0.11 0.06 0.02
0.09 0.11 0.07 0.02
0.09 0.11 0.06 0.02
108

BINA Annual Report 2011-12 Soil Science
Table 47. Cr (mgL-1) concentration in Balu River water at three different depths of Nagarpara location during the year 2011-2012.
Water depth Month
0-50 cm 51-100 cm 101-150 cm Mean July’11 Aug’11 Sep’11 Oct’11 Nov’11 Dec’11 Jan’12 Feb’12 March’12 April’12 May’12 June’12
0.04 0.05 0.06 0.06 0.08 0.10 0.11 0.11 0.10 0.09 0.07 0.06
0.05 0.06 0.06 0.07 0.08 0.11 0.11 0.11 0.11 0.10 0.08 0.07
0.05 0.06 0.06 0.07 0.08 0.10 0.10 0.10 0.11 0.10 0.10 0.07
0.05 0.05 0.06 0.07 0.08 0.10 0.11 0.11 0.10 0.10 0.08 0.07
Average Maximum Minimum Std. Dev.
0.08 0.11 0.04 0.02
0.08 0.11 0.05 0.02
0.08 0.11 0.05 0.02
0.08 0.11 0.05 0.02
Table 48. Cr (mgL-1) concentration in Balu River water at three different depths of Demra location during the
year 2011-2012.
Water depth Month
0-50 cm 51-100 cm 101-150 cm Mean July’11 Aug’11 Sep’11 Oct’11 Nov’11 Dec’11 Jan’12 Feb’12 March’12 April’12 May’12 June’12
0.04 0.05 0.05 0.05 0.06 0.05 0.06 0.07 0.07 0.06 0.06 0.05
0.05 0.06 0.06 0.06 0.06 0.06 0.07 0.07 0.07 0.07 0.06 0.05
0.06 0.06 0.06 0.06 0.07 0.06 0.07 0.08 0.07 0.07 0.06 0.06
0.05 0.06 0.06 0.06 0.06 0.06 0.07 0.07 0.07 0.07 0.06 0.05
Average Maximum Minimum Std. Dev.
0.05 0.07 0.04 0.01
0.06 0.07 0.05 0.01
0.07 0.08 0.06 0.01
0.06 0.07 0.05 0.01
109

BINA Annual Report 2011-12 Soil Science
0
0.02
0.04
0.06
0.08
0.1
0.12
Cr c
onc.
(mgL
-1)
Termuni Itakhola Nagarpar Demra
Different locations
Max imum conc. Minimum conc.
Fig. 1. Mean Cr concentration (as maximum and minimum value) varied in Balu river water under different locations during 2011-2012.
0
0.02
0.04
0.060.08
0.1
0.12
0.14
July’11 Aug’
11Sep’
11Oct’1
1Nov’1
1Dec’1
1Jan
’12Feb’
12
March’1
2April
’12May’1
2Jun
e’12
Month
Conc
. of C
r (m
gL-1
)
Termuni Itakhola Nagarpara Demra
Fig. 2. Cr concentration in Balu river water varied at different locations and months during the year 2011-2012.
110

BINA Annual Report 2011-12 Soil Science
Cadmium (Cd) concentration in Balu river water:
The Cd concentration are presented in Table 49-52 and Fig. 3.
From the table 49, it was observed that Cd concentration ranged from 0.03 to 0.16 mgL-1 during the year July’11-March’12. The maximum Cd concentration in surface water (0-50cm) was recorded as 0.16 mgL-1 during the month of March’ 2012, whereas, the minimum value was found as 0.03 mgL-1
during month of July’2011. Among the different water depths there was no distinct variation or changes of Cd concentration were shown, where the average Cd concentration was found as 0.10, 0.12 and 0.12 mgL-1 under the water depths of 0-50, 51-100 and 101- 150cm, respectively (Table 49). From the results of Itakhola area, within the surface water depth (0-50 cm) the maximum Cd concentration was observed as 0.13 mgL-1 during the month of February and March’ 2012 and the minimum Cd value was recorded as 0.04 mgL-1 during the month of July and August’2011 (Table 50). More or less similar results were found from the water samples collected from different depths which ranged from 0.02 to 0.15 mgL-1, the highest Cd concentration was as 0.05 mgL-1 was noted during the month of March, 2012 the water samples collected within 101-150 cm depth. In case of Nagarpara area, within 0-50 cm water depth, the Cd concentration ranged from 0.04 to 0.20 mgL-1 among the different water depths (Table 51) and comparatively lower concentration were observed within 51-100 cm which ranged from 0.05 mgL-1 during July’ 2011 to 0.18 mgL-1 during the month of February to April 2012. Considering the different water depths, there was differences of Cd concentrations were observed, though the highest Cd concentration was recorded as 0.20 mgL-1, during the month of December 2011 to March 2012 (Table 51). The concentration in Balu river water at Demra location are presented in Table 52, Fig. 3. From the results, it was noted that under surface water (0-50 cm) depth the maximum Cd concentration was observed as 0.11 mgL-1 during the month of February and March 2012 and the minimum Cd was recorded as 0.04 mgL-1 during July 2011. Among the different water depths, the Cr concentrations was more or less closer, though comparatively higher Cd concentration was noted under 101-150 cm depth, which ranged from 0.06 to 0.08 mgL-1 and the highest Cd concentration was found during the month of February 2012. At the location of Demra the Cd concentration in Balu river water ranged from 0.04-0.14 mgL-1 during the month of July 2011 to March 2012 (Table 52). Considering the mean Cd concentration in Balu river water at different locations, the maximum value was recorded from the Nagarpara area (0.18 mgL-1) which was followed by value found from Termuni and Itakhola area. The Minimum Cd value (0.03 mgL-1) was observed in the water sample collected from Itakhola area (Fig. 3). On average, during the sampling time, the highest mean Cd concentration in Balu river water was found as 0.18 mgL-1 duing the month of February’2012and March, 2012. The lowest mean Cd value (0.03 mgL-1) was noted from the water sample collected during the month of July 2011 (Fig. 3).
111
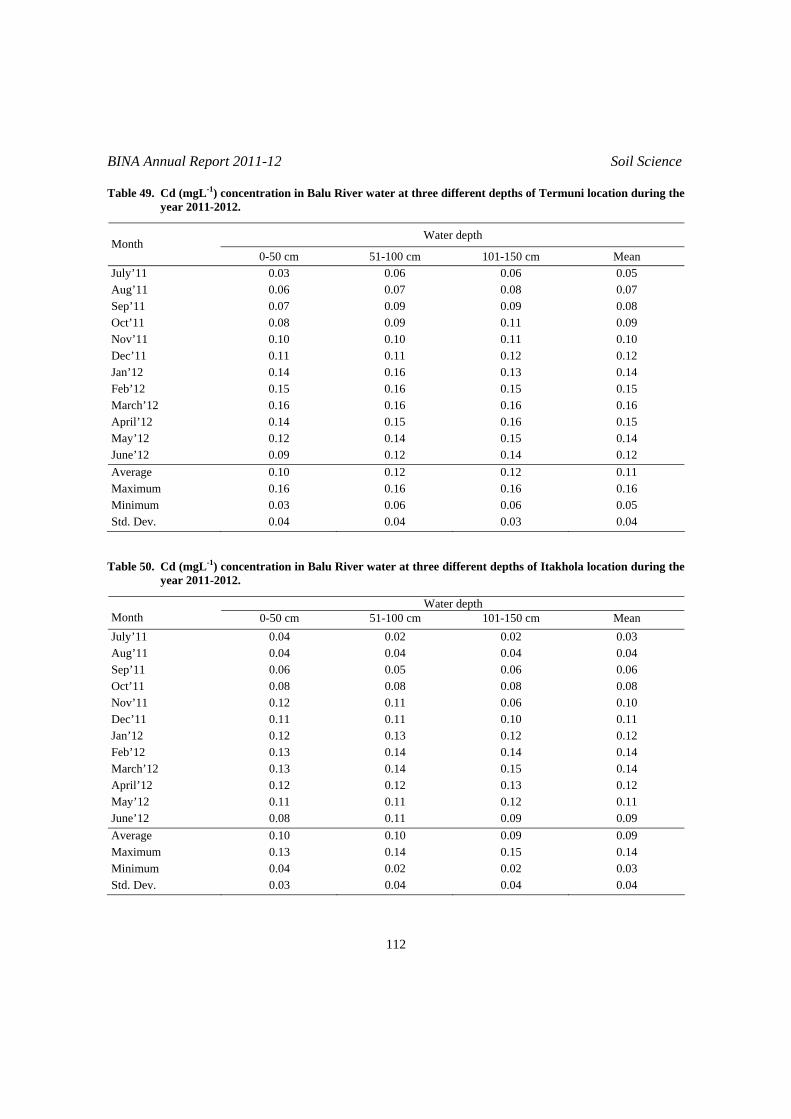
BINA Annual Report 2011-12 Soil Science
Table 49. Cd (mgL-1) concentration in Balu River water at three different depths of Termuni location during the year 2011-2012.
Water depth Month
0-50 cm 51-100 cm 101-150 cm Mean July’11 Aug’11 Sep’11 Oct’11 Nov’11 Dec’11 Jan’12 Feb’12 March’12 April’12 May’12 June’12
0.03 0.06 0.07 0.08 0.10 0.11 0.14 0.15 0.16 0.14 0.12 0.09
0.06 0.07 0.09 0.09 0.10 0.11 0.16 0.16 0.16 0.15 0.14 0.12
0.06 0.08 0.09 0.11 0.11 0.12 0.13 0.15 0.16 0.16 0.15 0.14
0.05 0.07 0.08 0.09 0.10 0.12 0.14 0.15 0.16 0.15 0.14 0.12
Average Maximum Minimum Std. Dev.
0.10 0.16 0.03 0.04
0.12 0.16 0.06 0.04
0.12 0.16 0.06 0.03
0.11 0.16 0.05 0.04
Table 50. Cd (mgL-1) concentration in Balu River water at three different depths of Itakhola location during the
year 2011-2012.
Water depth Month 0-50 cm 51-100 cm 101-150 cm Mean July’11 Aug’11 Sep’11 Oct’11 Nov’11 Dec’11 Jan’12 Feb’12 March’12 April’12 May’12 June’12
0.04 0.04 0.06 0.08 0.12 0.11 0.12 0.13 0.13 0.12 0.11 0.08
0.02 0.04 0.05 0.08 0.11 0.11 0.13 0.14 0.14 0.12 0.11 0.11
0.02 0.04 0.06 0.08 0.06 0.10 0.12 0.14 0.15 0.13 0.12 0.09
0.03 0.04 0.06 0.08 0.10 0.11 0.12 0.14 0.14 0.12 0.11 0.09
Average Maximum Minimum Std. Dev.
0.10 0.13 0.04 0.03
0.10 0.14 0.02 0.04
0.09 0.15 0.02 0.04
0.09 0.14 0.03 0.04
112

BINA Annual Report 2011-12 Soil Science
Table 51. Cd (mgL-1) concentration in Balu River water at three different depths of Nagarpara location during the year 2011-2012.
Water depth Month
0-50 cm 51-100 cm 101-150 cm Mean July’11 Aug’11 Sep’11 Oct’11 Nov’11 Dec’11 Jan’12 Feb’12 March’12 April’12 May’12 June’12
0.04 0.08 0.11 0.11 0.12 0.20 0.17 0.17 0.18 0.17 0.11 0.09
0.05 0.08 0.11 0.12 0.11 0.14 0.16 0.18 0.18 0.18 0.14 0.10
0.07 0.08 0.11 0.12 0.12 0.12 0.16 0.17 0.17 0.17 0.11 0.08
0.05 0.08 0.11 0.12 0.12 0.15 0.16 0.18 0.18 0.17 0.12 0.09
Average Maximum Minimum Std. Dev.
0.13 0.20 0.04 0.05
0.13 0.18 0.05 0.04
0.12 0.17 0.07 0.04
0.13 0.18 0.05 0.04
Table 52. Cd (mgL-1) concentration in Balu River water at three different depths of Demra location during the
year 2011-2012.
Water depth Month
0-50 cm 51-100 cm 101-150 cm Mean July’11 Aug’11 Sep’11 Oct’11 Nov’11 Dec’11 Jan’12 Feb’12 March’12 April’12 May’12 June’12
0.04 0.05 0.07 0.07 0.08 0.09 0.10 0.11 0.11 0.09 0.08 0.06
0.05 0.05 0.07 0.08 0.09 0.11 0.12 0.12 0.13 0.11 0.10 0.08
0.05 0.06 0.07 0.09 0.10 0.10 0.12 0.13 0.14 0.13 0.12 0.11
0.05 0.06 0.07 0.08 0.09 0.10 0.11 0.12 0.13 0.11 0.10 0.08
Average Maximum Minimum Std. Dev.
0.08 0.11 0.04 0.02
0.09 0.13 0.05 0.03
0.10 0.14 0.05 0.03
0.09 0.13 0.05 0.03
113

BINA Annual Report 2011-12 Soil Science
00.020.040.060.080.1
0.120.140.160.18
Cd c
onc.
(mgL
-1)
Termuni Itakhola Nagarpar Demra
Different locations
Max imum conc. Minimum conc.
Fig. 3. Cd (mgL-1) concentration in Balu river water at different locations and months
during the year 2011-2012.
114

BINA Annual Report 2011-12 Soil Science
Nickel (Ni) concentration in Balu river water
The Ni concentration are presented in Table 53-56 and Fig. 4.
From the table 53 it was noted that Ni concentration at Termuni area under different water depths ranged from 0.21 to 0.49 mgL-1. Within surface water (0-50 cm), the highest Ni concentration was observed as 0.39 mgL-1 during the month of February’ 2011 and the lowest concentration was recorded as 0.21 mgL-1 during July’ 2011. The amount of Ni concentration slightly increases with increasing the river water depth which ranged from 0.25 mgL-1 during the month of June and July’ 2011 to 0.49 mgL-
1 during the month of February and March’ 2012 within 51-150 cm depth. The maximum Ni concentration at river water depths (51-100 cm) and (101-150 cm) was recorded as 0.49 mgL-1 during the month of February, 2012 and March, 2012, whereas, the minimum value was found as 0.21 mgL-1 during month of July, 2011. Among the different water depths a significant changes are found in Ni concentration, where the average Ni value was found as 0.28, 0.34 and 0.37 mgL-1 under the water depths of 0-50, 51-100 and 101- 150 cm, respectively (Table 53). From the Itakhola area, the maximum Ni concentration was observed as 0.39 mgL-1 during the month of February, 2012 and the minimum value was recorded as 0.19 mgL-1 during the month of July’ 2011 (Table 54). Here comparatively a higher value was noted and More or less similar results were found form the water samples collected from different depths. In case of Nagarpara area, where the Ni concentration in Balu river water ranged from 0.11 to 0.32 mgL-1 (Table 55). Considering the different water depths, there was little differences of Ni concentrations were observed, though the highest Ni concentration was recorded as 0.32 mgL-1, during the month of March, 2012 (Table 55). At the location of Demra the Ni concentration in Balu river water ranged from 0.09-0.24 mgL-1 during the month of July, 2011 to February, 2012 (Table 56). Considering the mean Ni concentration in Balu river water at different locations, the maximum value was recorded from the Termuni area (0.44 mgL-1) which was followed by value found from Nagarpara and Itakhola area. The Minimum Ni value (0.13 mgL-1) was observed in the water sample collected from Nagarpara area (Fig. 4). On average, during the sampling time, the highest mean Ni concentration in Balu river water was found as 0.44 mgL-1 during the month of February’2012. The lowest mean Ni value (0.13 mgL-1) was noted from the water sample collected during the month of July’2011 (Fig. 4).
115
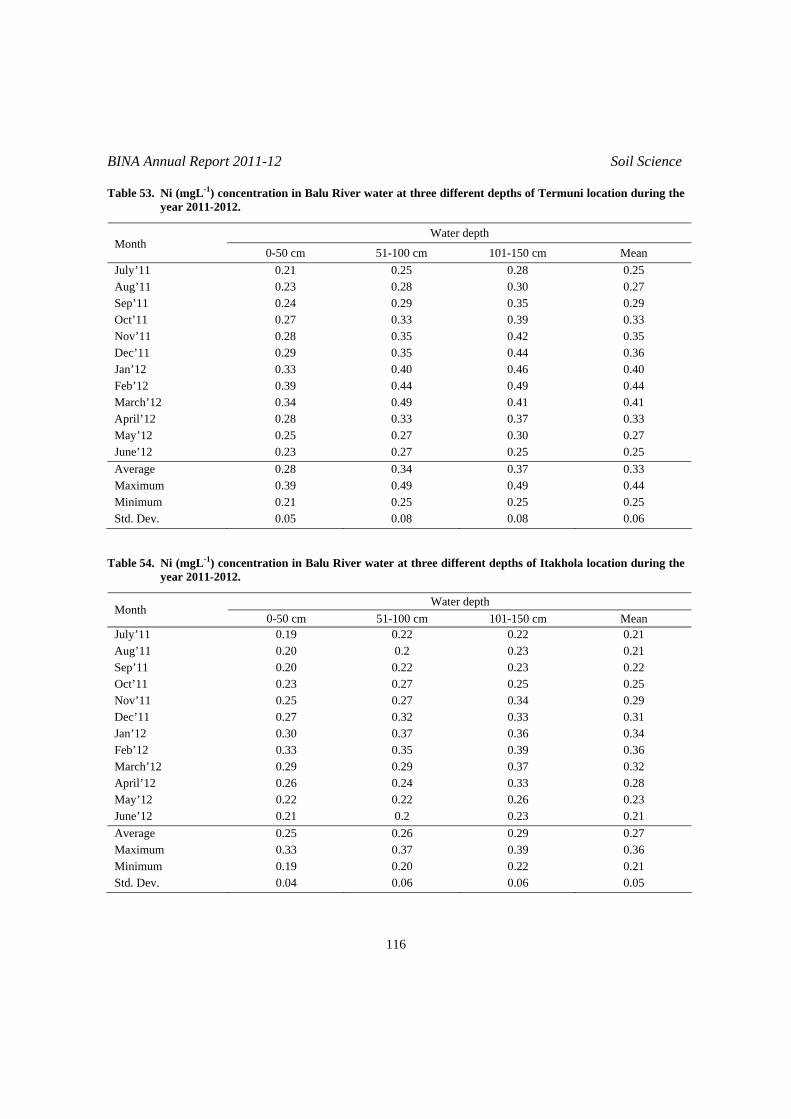
BINA Annual Report 2011-12 Soil Science
Table 53. Ni (mgL-1) concentration in Balu River water at three different depths of Termuni location during the year 2011-2012.
Water depth Month
0-50 cm 51-100 cm 101-150 cm Mean July’11 Aug’11 Sep’11 Oct’11 Nov’11 Dec’11 Jan’12 Feb’12 March’12 April’12 May’12 June’12
0.21 0.23 0.24 0.27 0.28 0.29 0.33 0.39 0.34 0.28 0.25 0.23
0.25 0.28 0.29 0.33 0.35 0.35 0.40 0.44 0.49 0.33 0.27 0.27
0.28 0.30 0.35 0.39 0.42 0.44 0.46 0.49 0.41 0.37 0.30 0.25
0.25 0.27 0.29 0.33 0.35 0.36 0.40 0.44 0.41 0.33 0.27 0.25
Average Maximum Minimum Std. Dev.
0.28 0.39 0.21 0.05
0.34 0.49 0.25 0.08
0.37 0.49 0.25 0.08
0.33 0.44 0.25 0.06
Table 54. Ni (mgL-1) concentration in Balu River water at three different depths of Itakhola location during the year 2011-2012.
Water depth Month
0-50 cm 51-100 cm 101-150 cm Mean July’11 Aug’11 Sep’11 Oct’11 Nov’11 Dec’11 Jan’12 Feb’12 March’12 April’12 May’12 June’12
0.19 0.20 0.20 0.23 0.25 0.27 0.30 0.33 0.29 0.26 0.22 0.21
0.22 0.2 0.22 0.27 0.27 0.32 0.37 0.35 0.29 0.24 0.22 0.2
0.22 0.23 0.23 0.25 0.34 0.33 0.36 0.39 0.37 0.33 0.26 0.23
0.21 0.21 0.22 0.25 0.29 0.31 0.34 0.36 0.32 0.28 0.23 0.21
Average Maximum Minimum Std. Dev.
0.25 0.33 0.19 0.04
0.26 0.37 0.20 0.06
0.29 0.39 0.22 0.06
0.27 0.36 0.21 0.05
116
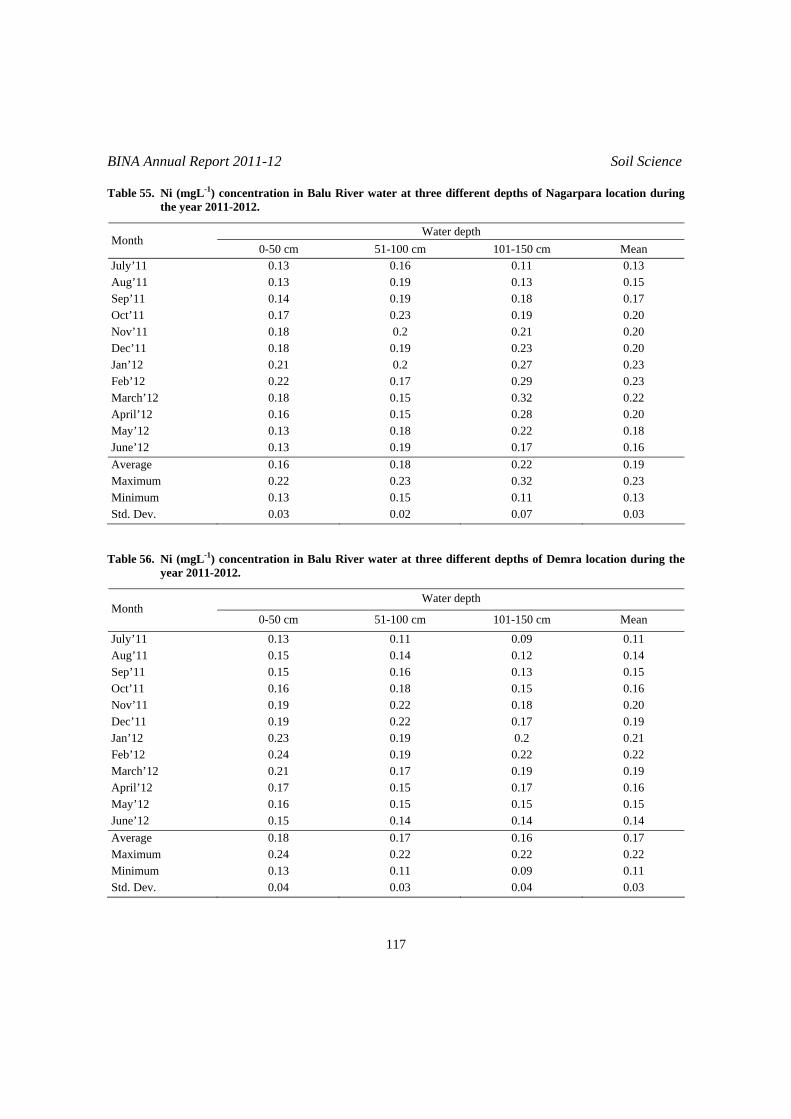
BINA Annual Report 2011-12 Soil Science
Table 55. Ni (mgL-1) concentration in Balu River water at three different depths of Nagarpara location during the year 2011-2012.
Water depth Month
0-50 cm 51-100 cm 101-150 cm Mean July’11 Aug’11 Sep’11 Oct’11 Nov’11 Dec’11 Jan’12 Feb’12 March’12 April’12 May’12 June’12
0.13 0.13 0.14 0.17 0.18 0.18 0.21 0.22 0.18 0.16 0.13 0.13
0.16 0.19 0.19 0.23 0.2
0.19 0.2
0.17 0.15 0.15 0.18 0.19
0.11 0.13 0.18 0.19 0.21 0.23 0.27 0.29 0.32 0.28 0.22 0.17
0.13 0.15 0.17 0.20 0.20 0.20 0.23 0.23 0.22 0.20 0.18 0.16
Average Maximum Minimum Std. Dev.
0.16 0.22 0.13 0.03
0.18 0.23 0.15 0.02
0.22 0.32 0.11 0.07
0.19 0.23 0.13 0.03
Table 56. Ni (mgL-1) concentration in Balu River water at three different depths of Demra location during the
year 2011-2012.
Water depth Month
0-50 cm 51-100 cm 101-150 cm Mean July’11 Aug’11 Sep’11 Oct’11 Nov’11 Dec’11 Jan’12 Feb’12 March’12 April’12 May’12 June’12
0.13 0.15 0.15 0.16 0.19 0.19 0.23 0.24 0.21 0.17 0.16 0.15
0.11 0.14 0.16 0.18 0.22 0.22 0.19 0.19 0.17 0.15 0.15 0.14
0.09 0.12 0.13 0.15 0.18 0.17 0.2 0.22 0.19 0.17 0.15 0.14
0.11 0.14 0.15 0.16 0.20 0.19 0.21 0.22 0.19 0.16 0.15 0.14
Average Maximum Minimum Std. Dev.
0.18 0.24 0.13 0.04
0.17 0.22 0.11 0.03
0.16 0.22 0.09 0.04
0.17 0.22 0.11 0.03
117

BINA Annual Report 2011-12 Soil Science
00.050.1
0.150.2
0.250.3
0.350.4
0.45
Ni c
onc.
(mgL
-1)
Termuni Itakhola Nagarpar Demra
Different locations
Max imum conc. Minimum conc.
Fig. 4. Ni (mgL-1) concentration in Balu river water at different locations and months during the year 2011-2012.
118

BINA Annual Report 2011-12 Soil Science
e. Lead (Pb) concentration in Balu river water:
The Pb concentration are presented in Table 57-60 and Fig. 5.
The table 57 described that Pb concentration at Termuni area under different water depths ranged from 0.06 to 0.22 mgL-1. The maximum Pb concentration at river water depths (101-150 cm) was recorded as 0.22 mgL-1 during the month of January, 2012, whereas, the minimum value was found as 0.06 mgL-1 during month of August, 2011. Among the different water depths no significant changes are found in Pb concentration, where the average Pb value was found as 0.10, 0.13 and 0.15 mgL-1 under the water depths of 0-50, 51-100 and 101- 150 cm, respectively (Table 57). From the Itakhola area, the maximum Pb concentration was observed as 0.15 mgL-1 during the month of January, 2012 and February, 2012 and the minimum value was recorded as 0.04 mgL-1 during the month of July, 2011 and August, 2011 (Table 58). Here comparatively a lower value was noted and More or less similar results were found form the water samples collected from different depths. In case of Nagarpara area, where the Pb concentration in Balu river water ranged from 0.04 to 0.12 mgL-1 (Table 59). Considering the different water depths, there was no significant differences of Pb concentrations were observed, though the highest Pb concentration was recorded as 0.12 mgL-1, during the month of December, 2011 and January, 2012 (Table 59). At the location of Demra the Pb concentration in Balu river water ranged from 0.03-0.19 mgL-1 during the month of July, 2011 to January, 2012 (Table 60). Considering the mean Pb concentration in Balu river water at different locations, the maximum value was recorded from the Termuni area (0.18 mgL-1) which was followed by value found from Nagarpara and Itakhola area. The Minimum Pb value (0.05 mgL-1) was observed in the water sample collected from Itakhola and Nagarpara area (Fig. 5). On average, during the sampling time, the highest mean Pb concentration in Balu river water was found as 0.18 mgL-1 duing the month of January, 2012. The lowest mean Pb value (0.05 mgL-1) was noted from the water sample collected during the month of July, 2011 (Fig. 5).
119

BINA Annual Report 2011-12 Soil Science
Table 57. Pb (mgL-1) concentration in Balu River water at three different depths of Termuni location during the year 2011-2012.
Water depth Month
0-50 cm 51-100 cm 101-150 cm Mean July’11 Aug’11 Sep’11 Oct’11 Nov’11 Dec’11 Jan’12 Feb’12 March’12 April’12 May’12 June’12
0.07 0.06 0.09 0.10 0.11 0.12 0.15 0.13 0.11 0.10 0.08 0.07
0.09 0.08 0.10 0.11 0.14 0.16 0.18 0.17 0.16 0.15 0.13 0.12
0.11 0.09 0.11 0.13 0.15 0.18 0.22 0.19 0.17 0.16 0.14 0.12
0.09 0.08 0.10 0.11 0.13 0.15 0.18 0.16 0.15 0.13 0.12 0.10
Average Maximum Minimum Std. Dev.
0.10 0.15 0.06 0.03
0.13 0.18 0.08 0.03
0.15 0.22 0.09 0.04
0.13 0.18 0.08 0.03
Table 58. Pb (mgL-1) concentration in Balu River water at three different depths of Itakhola location during the
year 2011-2012.
Water depth Month
0-50 cm 51-100 cm 101-150 cm Mean July’11 Aug’11 Sep’11 Oct’11 Nov’11 Dec’11 Jan’12 Feb’12 March’12 April’12 May’12 June’12
0.04 0.04 0.07 0.09 0.11 0.11 0.12 0.10 0.08 0.07 0.06 0.05
0.05 0.06 0.08 0.09 0.10 0.11 0.14 0.13 0.11 0.09 0.07 0.06
0.07 0.08 0.09 0.11 0.12 0.14 0.15 0.15 0.13 0.11 0.10 0.08
0.05 0.06 0.08 0.10 0.11 0.12 0.14 0.13 0.11 0.09 0.08 0.06
Average Maximum Minimum Std. Dev.
0.08 0.12 0.04 0.03
0.09 0.14 0.05 0.03
0.11 0.15 0.07 0.03
0.09 0.14 0.05 0.03
120

BINA Annual Report 2011-12 Soil Science
Table 59: Pb (mgL-1) concentration in Balu River water at three different depths of Nagarpara location during the year 2011-2012.
Water depth
Month 0-50 cm 51-100 cm 101-150 cm Mean
July’11 Aug’11 Sep’11 Oct’11 Nov’11 Dec’11 Jan’12 Feb’12 March’12 April’12 May’12 June’12
0.04 0.04 0.07 0.08 0.10 0.10 0.11 0.11 0.09 0.08 0.07 0.05
0.05 0.05 0.06 0.07 0.09 0.11 0.12 0.11 0.10 0.09 0.08 0.07
0.07 0.07 0.08 0.09 0.11 0.12 0.12 0.11 0.11 0.10 0.09 0.08
0.05 0.05 0.07 0.08 0.10 0.11 0.12 0.11 0.10 0.09 0.08 0.07
Average Maximum Minimum Std. Dev.
0.08 0.11 0.04 0.03
0.08 0.12 0.05 0.02
0.09 0.12 0.07 0.02
0.09 0.12 0.05 0.02
Table 60: Pb (mgL-1) concentration in Balu River water at three different depths of Demra location during the
year 2011-2012.
Water depth Month
0-50 cm 51-100 cm 101-150 cm Mean July’11 Aug’11 Sep’11 Oct’11 Nov’11 Dec’11 Jan’12 Feb’12 March’12 April’12 May’12 June’12
0.03 0.03 0.05 0.07 0.08 0.13 0.16 0.16 0.13 0.08 0.05 0.04
0.05 0.04 0.07 0.06 0.08 0.14 0.19 0.17 0.12 0.09 0.06 0.05
0.07 0.05 0.07 0.08 0.09 0.14 0.17 0.09 0.10 0.09 0.06 0.06
0.05 0.04 0.06 0.07 0.08 0.14 0.17 0.14 0.12 0.09 0.06 0.05
Average Maximum Minimum Std. Dev.
0.08 0.16 0.03 0.05
0.09 0.19 0.04 0.05
0.09 0.17 0.05 0.03
0.09 0.17 0.04 0.04
121
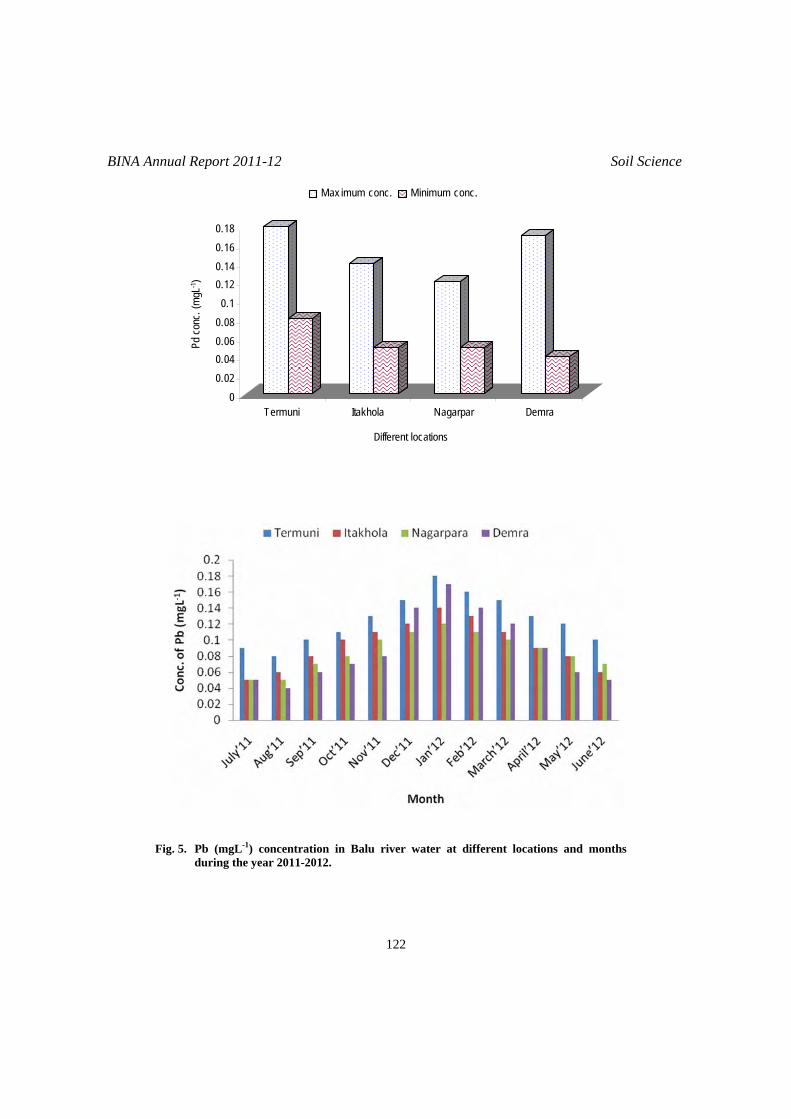
BINA Annual Report 2011-12 Soil Science
00.020.040.060.080.1
0.120.140.160.18
Pd c
onc.
(mgL
-1)
Termuni Itakhola Nagarpar Demra
Different locations
Max imum conc. Minimum conc.
Fig. 5. Pb (mgL-1) concentration in Balu river water at different locations and months
during the year 2011-2012.
122
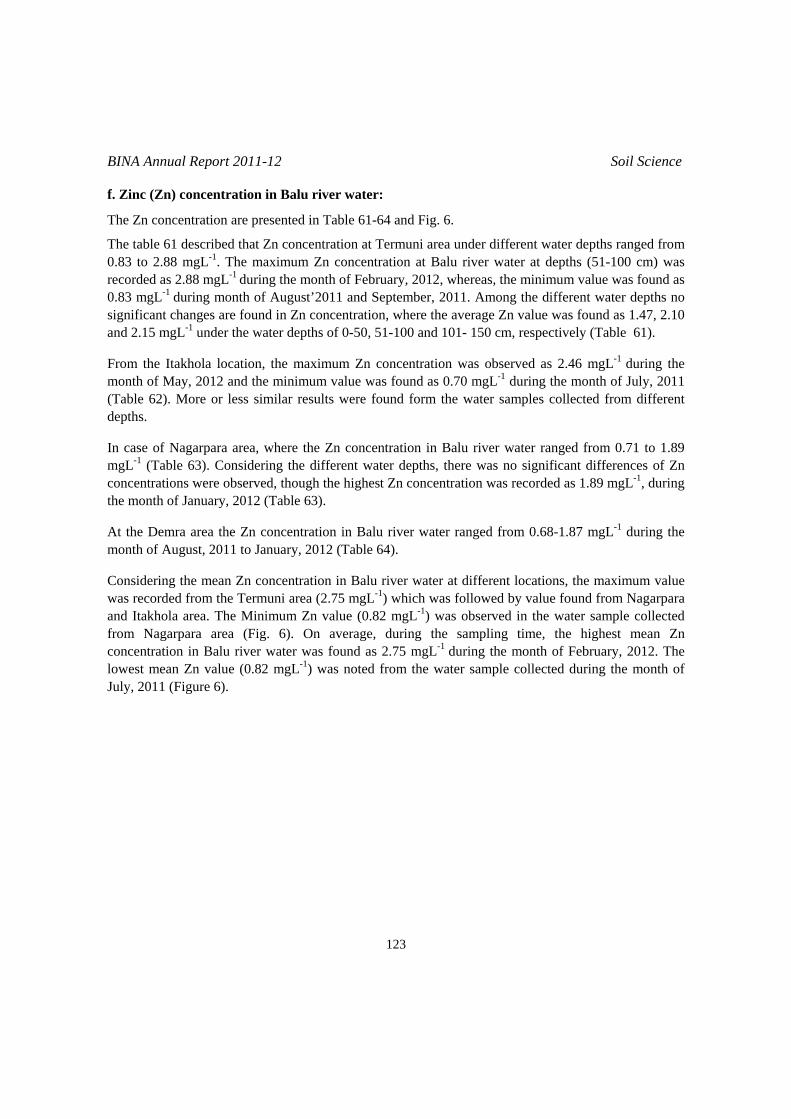
BINA Annual Report 2011-12 Soil Science
f. Zinc (Zn) concentration in Balu river water:
The Zn concentration are presented in Table 61-64 and Fig. 6.
The table 61 described that Zn concentration at Termuni area under different water depths ranged from 0.83 to 2.88 mgL-1. The maximum Zn concentration at Balu river water at depths (51-100 cm) was recorded as 2.88 mgL-1 during the month of February, 2012, whereas, the minimum value was found as 0.83 mgL-1 during month of August’2011 and September, 2011. Among the different water depths no significant changes are found in Zn concentration, where the average Zn value was found as 1.47, 2.10 and 2.15 mgL-1 under the water depths of 0-50, 51-100 and 101- 150 cm, respectively (Table 61). From the Itakhola location, the maximum Zn concentration was observed as 2.46 mgL-1 during the month of May, 2012 and the minimum value was found as 0.70 mgL-1 during the month of July, 2011 (Table 62). More or less similar results were found form the water samples collected from different depths. In case of Nagarpara area, where the Zn concentration in Balu river water ranged from 0.71 to 1.89 mgL-1 (Table 63). Considering the different water depths, there was no significant differences of Zn concentrations were observed, though the highest Zn concentration was recorded as 1.89 mgL-1, during the month of January, 2012 (Table 63). At the Demra area the Zn concentration in Balu river water ranged from 0.68-1.87 mgL-1 during the month of August, 2011 to January, 2012 (Table 64). Considering the mean Zn concentration in Balu river water at different locations, the maximum value was recorded from the Termuni area (2.75 mgL-1) which was followed by value found from Nagarpara and Itakhola area. The Minimum Zn value (0.82 mgL-1) was observed in the water sample collected from Nagarpara area (Fig. 6). On average, during the sampling time, the highest mean Zn concentration in Balu river water was found as 2.75 mgL-1 during the month of February, 2012. The lowest mean Zn value (0.82 mgL-1) was noted from the water sample collected during the month of July, 2011 (Figure 6).
123

BINA Annual Report 2011-12 Soil Science
Table 61. Zn (mgL-1) concentration in Balu River water at three different depths of Termuni location during the year 2011-2012.
Water depth Month
0-50 cm 51-100 cm 101-150 cm Mean July’11 Aug’11 Sep’11 Oct’11 Nov’11 Dec’11 Jan’12 Feb’12 March’12 April’12 May’12 June’12
0.89 0.83 0.83 1.06 1.35 1.48 2.48 2.56 2.19 1.63 1.27 1.09
1.18 1.73 1.58 1.83 2.29 2.55 2.80 2.88 2.73 2.02 1.93 1.70
1.59 1.44 1.63 1.90 2.31 2.53 2.75 2.82 2.53 2.34 2.04 1.89
1.22 1.33 1.34 1.60 1.98 2.19 2.68 2.75 2.48 2.00 1.75 1.56
Average Maximum Minimum Std. Dev.
1.47 2.56 0.83 0.62
2.10 2.88 1.18 0.54
2.15 2.82 1.44 0.47
1.91 2.75 1.22 0.53
Table 62. Zn (mgL-1) concentration in Balu River water at three different depths of Itakhola location during the
year 2011-2012.
Water depth Month
0-50 cm 51-100 cm 101-150 cm Mean July’11 Aug’11 Sep’11 Oct’11 Nov’11 Dec’11 Jan’12 Feb’12 March’12 April’12 May’12 June’12
0.70 0.76 0.80 0.87 1.39 1.47 2.10 2.03 1.85 1.72 1.57 1.21
1.43 1.07 0.91 1.33 1.53 2.00 2.18 1.97 2.18 2.13 2.46 2.23
1.51 1.21 1.10 1.19 1.34 1.38 1.53 1.66 1.38 1.63 1.58 1.51
1.21 1.01 0.94 1.13 1.42 1.62 1.94 1.89 1.80 1.83 1.87 1.65
Average Maximum Minimum Std. Dev.
1.37 2.10 0.70 0.50
1.79 2.46 0.91 0.51
1.42 1.66 1.10 0.18
1.52 1.94 0.94 0.37
124

BINA Annual Report 2011-12 Soil Science
Table 63. Zn (mgL-1) concentration in Balu River water at three different depths of Nagarpara location during the year 2011-2012.
Water depth Month 0-50 cm 51-100 cm 101-150 cm Mean July’11 Aug’11 Sep’11 Oct’11 Nov’11 Dec’11 Jan’12 Feb’12 March’12 April’12 May’12 June’12
0.71 0.75 0.80 0.86 1.25 1.44 1.76 1.78 1.29 1.24 1.18 1.15
0.83 0.93 0.98 1.12 1.52 1.65 1.88 1.62 1.36 1.26 1.16 1.15
0.91 0.96 1.07 1.31 1.76 1.67 1.89 1.78 1.45 1.30 1.28 1.46
0.82 0.88 0.95 1.10 1.51 1.59 1.84 1.73 1.37 1.27 1.21 1.25
Average Maximum Minimum Std. Dev.
1.18 1.78 0.71 0.36
1.29 1.88 0.83 0.32
1.40 1.89 0.91 0.33
1.29 1.84 0.82 0.33
Table 64. Zn (mgL-1) concentration in Balu River water at three different depths of Demra location during the
year 2011-2012.
Water depth Month
0-50 cm 51-100 cm 101-150 cm Mean July’11 Aug’11 Sep’11 Oct’11 Nov’11 Dec’11 Jan’12 Feb’12 March’12 April’12 May’12 June’12
0.70 0.68 0.71 1.17 1.29 1.47 1.51 1.36 1.20 1.13 1.03 0.87
0.90 0.78 0.85 1.33 1.40 1.71 1.82 1.50 1.29 1.16 1.13 1.00
1.15 1.06 1.20 1.36 1.51 1.80 1.87 1.75 1.57 1.45 1.32 1.24
0.91 0.84 0.92 1.29 1.40 1.66 1.73 1.54 1.36 1.25 1.16 1.04
Average Maximum Minimum Std. Dev.
1.09 1.51 0.68 0.30
1.24 1.82 0.78 0.33
1.44 1.87 1.06 0.27
1.26 1.73 0.84 0.30
125
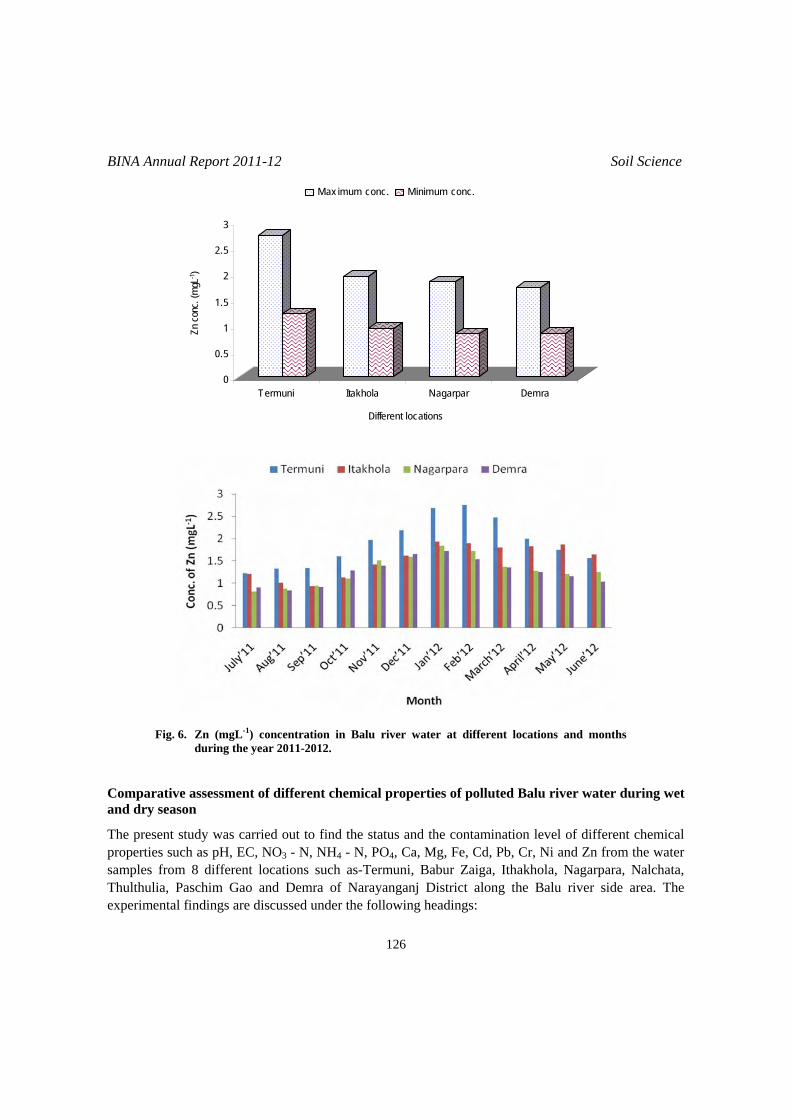
BINA Annual Report 2011-12 Soil Science
0
0.5
1
1.5
2
2.5
3
Zn c
onc.
(mgL
-1)
Termuni Itakhola Nagarpar Demra
Different locations
Max imum conc. Minimum conc.
Fig. 6. Zn (mgL-1) concentration in Balu river water at different locations and months during the year 2011-2012.
Comparative assessment of different chemical properties of polluted Balu river water during wet and dry season
The present study was carried out to find the status and the contamination level of different chemical properties such as pH, EC, NO3 - N, NH4 - N, PO4, Ca, Mg, Fe, Cd, Pb, Cr, Ni and Zn from the water samples from 8 different locations such as-Termuni, Babur Zaiga, Ithakhola, Nagarpara, Nalchata, Thulthulia, Paschim Gao and Demra of Narayanganj District along the Balu river side area. The experimental findings are discussed under the following headings:
126
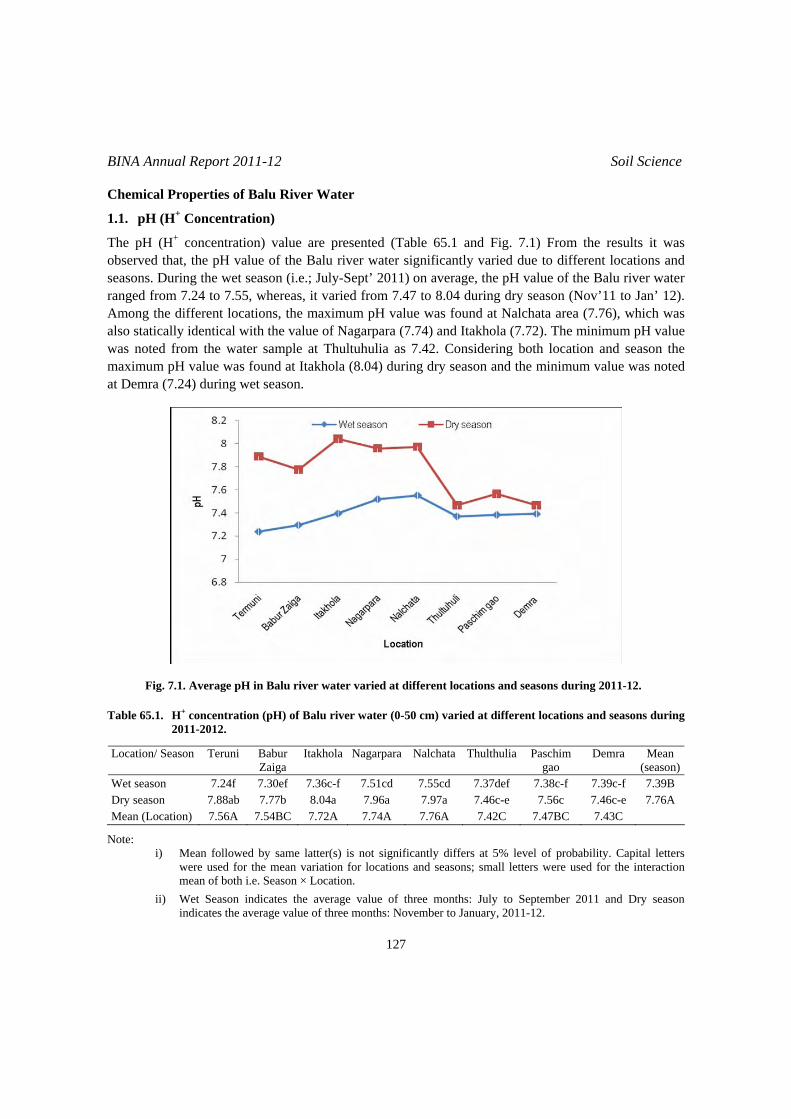
BINA Annual Report 2011-12 Soil Science
Chemical Properties of Balu River Water
1.1. pH (H+ Concentration)
The pH (H+ concentration) value are presented (Table 65.1 and Fig. 7.1) From the results it was observed that, the pH value of the Balu river water significantly varied due to different locations and seasons. During the wet season (i.e.; July-Sept’ 2011) on average, the pH value of the Balu river water ranged from 7.24 to 7.55, whereas, it varied from 7.47 to 8.04 during dry season (Nov’11 to Jan’ 12). Among the different locations, the maximum pH value was found at Nalchata area (7.76), which was also statically identical with the value of Nagarpara (7.74) and Itakhola (7.72). The minimum pH value was noted from the water sample at Thultuhulia as 7.42. Considering both location and season the maximum pH value was found at Itakhola (8.04) during dry season and the minimum value was noted at Demra (7.24) during wet season.
Fig. 7.1. Average pH in Balu river water varied at different locations and seasons during 2011-12. Table 65.1. H+ concentration (pH) of Balu river water (0-50 cm) varied at different locations and seasons during
2011-2012.
Location/ Season Teruni Babur Zaiga
Itakhola Nagarpara Nalchata Thulthulia Paschim gao
Demra Mean (season)
Wet season 7.24f 7.30ef 7.36c-f 7.51cd 7.55cd 7.37def 7.38c-f 7.39c-f 7.39B Dry season 7.88ab 7.77b 8.04a 7.96a 7.97a 7.46c-e 7.56c 7.46c-e 7.76A Mean (Location) 7.56A 7.54BC 7.72A 7.74A 7.76A 7.42C 7.47BC 7.43C
Note: i) Mean followed by same latter(s) is not significantly differs at 5% level of probability. Capital letters
were used for the mean variation for locations and seasons; small letters were used for the interaction mean of both i.e. Season × Location.
ii) Wet Season indicates the average value of three months: July to September 2011 and Dry season indicates the average value of three months: November to January, 2011-12.
127

BINA Annual Report 2011-12 Soil Science
Electrical Conductivity (EC)
The EC (electrical conductivity) values are presented (Table 65.2 and Fig. 7.2) From the results it was observed that, the EC value of the Balu river water significantly varied due to different locations and seasons. During the wet season (i.e; July – September, 2011) on average, the EC value of the Balu river water ranged from 1.05 to 1.33 mScm-1, whereas, it varied from 1.10 to 1.54 mScm-1 during dry season (November 2011 to January 2012). Among the different locations, the maximum EC value was found 1.44 mScm-1 at Termuni area, which was statically, differ from the value of Babur zaiga (1.37 mScm-1). The minimum EC value was noted as 1.08 mScm-1 from the water sample at Demra location. The high salinity content caused high EC in this contaminated sample, so it should be controlled or minimized immediately. Considering both locations and season the maximum Ec value was found at Termuni area (1.54 mScm-1) during dry season and the minimum value was noted at Demra ghat (1.05 mScm-1) during wet season.
Fig. 7.2. Average EC in Balu river water varied at different locations and seasons during’ 2011-12.
Table 65.2. Electrical Conductivity (EC mS/cm) concentration in Balu river water (0-50 cm) varied at different locations and seasons during 2011-2012.
Location/season
Termuni Babur Zaiga
Itakhola Nagarpara Nalchata Thulthulia Paschim gao Demra Mean (season)
Wet season 1.33d 1.26f 1.17g 1.14h 1.08j 1.07k 1.05l 1.05l 1.14B Dry season 1.54a 1.48b 1.40c 1.30e 1.25f 1.17g 1.14h 1.10i 1.30A Mean (Location) 1.44A 1.37B 1.28C 1.22D 1.17E 1.12F 1.09G 1.08H
Note: i) Mean followed by same latter(s) is not significantly differs at 5% level of probability. Capital letters
were used for the mean variation for locations and seasons; small letters were used for the interaction mean of both i.e. Season × Location.
ii) Wet Season indicates the average value of three months: July to September 2011 and Dry season indicates the average value of three months: November to January, 2011-12.
128

BINA Annual Report 2011-12 Soil Science
Nitrate Nitrogen (NO3 _ N)
The NO3 – N (Nitrate nitrogen) concentration of the water sample are given (Table 65.3 and Fig. 7.3). From the results it was observed that, the NO3 – N concentration of the Balu river water significantly varied due to different locations and seasons. During the wet season (i.e; July-September, 2011) on average, the NO3 – N value of the Balu river water ranged from 1.02 to 1.63mgL-1, whereas, it varied from 1.26 to 3.95 mgL-1 during dry season (Nov’11 to Jan’ 12). On average the maximum NO3
– N was recorded as 2.12 mgL-1 in dry season. Among the different locations, the highest NO3 – N value was found at Termuni area (2.79 mgL-1), which was also statically identical with the value of Babur zaiga (2.33 mgL-1). The minimum NO3 – N value was noticed from the water sample at Demra (1.14 mgL-1), which also statically identical with the result from Paschum gao (1.22 mgL-1) and Thultuhulia (1.25 mgL-1) area. Considering both location and season the highest NO3 – N value was noted at Termuni area during dry season (3.95 mgL-1) and the minimum value was found at Demra ghat during wet season (1.02 mgL-1).
Fig. 7.3. Average NO3 in Balu river water varied at different locations and seasons during 2011-12.
Table 65.3. NO3 – N (mgL-1) concentration in Balu river water (0-50 cm) varied at different location and season
during 2011-2012.
Location/season TermuniBabur Zaiga Itakhola Nagarpara Nalchata Thulthulia Paschim gao Demra Mean
(season)Wet season 1.63de 1.30f-h 1.23f-i 1.19g-i 1.13hi 1.08hi 1.04hi 1.02i 1.20B Dry season 3.95a 3.36b 2.31c 1.74d 1.49ef 1.43e-g 1.40e-g 1.26f-i 2.12A Mean (Location) 2.79A 2.33B 1.78C 1.47D 1.31DE 1.25EF 1.22EF 1.14F
Note: i) Mean followed by same latter(s) is not significantly differs at 5% level of probability. Capital letters
were used for the mean variation for locations and seasons; small letters were used for the interaction mean of both i.e. Season × Location.
ii) Wet Season indicates the average value of three months: July to September 2011 and Dry season indicates the average value of three months: November to January, 2011-12.
129

BINA Annual Report 2011-12 Soil Science
Ammonium Nitrogen NH4 - N (mgL-1)
The NH4 – N (Ammonium nitrogen) concentration of the water sample are presented (Table 65.4 and Fig. 7.4). From the results it was observed that, the NH4 – N concentration of the Balu river water significantly varied due to different locations and seasons. During the wet season (i.e; July-September, 2011) on average, the concentration of NH4 – N of the Balu river water ranged from 1.77 to 2.97mgL-1, whereas, it varied from 2.19 to 5.29 mgL-1 during dry season (Nov’11 to Jan’ 12). Among the different locations, the highest NH4
+- N concentration was noted as 4.13 mgL-1 in Termuni area, which was also statically identical with the value of Babur zaiga (3.51 mgL-1) and Itakhola (3.84 mgL-1). The minimum NH4 – N concentration was noticed as 1.99 mgL-1 from the water sample at Nagarpara location. Considering both location and season, the maximum NH4 – N concentration was recorded as 5.29 mgL-1 at Termuni area during dry season whereas, the minimum value was noted as 1.78 mgL-1 at Nagarpara during wet season.
Fig. 7.4. Average NH4 in Balu river water varied at different locations and seasons during 2011-12.
Table 65.4. NH4 – N (mgL-1) concentration in Balu river water (0-50 cm) varied at different location and season
during 2011-2012.
Location/Season Termuni Babur Zaiga
Itakhola Nagarpara Nalchata Thulthulia Paschim gao Demra Mean (season)
Wet season 2.973cd 2.547de 2.528de 1.777e 2.533de 2.273de 2.047de 2.040de 2.340B Dry season 5.290a 4.480ab 5.153a 2.193de 4.060b 3.773bc 3.713bc 3.633bc 3.037AMean (Location) 4.132A 3.513ABC 3.841AB 1.985D 3.297BC 3.023C 2.880C 2.837C
Note: i) Mean followed by same latter(s) is not significantly differs at 5% level of probability. Capital letters
were used for the mean variation for locations and seasons; small letters were used for the interaction mean of both i.e. Season × Location.
ii) Wet Season indicates the average value of three months: July to September, 2011 and Dry season indicates the average value of three months: November to January, 2011-12.
130

BINA Annual Report 2011-12 Soil Science
Calcium concentration (mgL-1)
The Calcium (Ca) concentration of the water sample are presented in Table 65.5 and Figure 7.5. From the results we observed that, the Calcium value of the Balu river water significantly varied due to different locations and seasons. During the wet season (i.e; July-September, 2011) on average the concentration of the Balu river water ranged from 23.200 to 45.497 mgL-1, whereas, it varied from 39.220 to 61.077 mgL-1 during dry season (November 2011 to January, 2012). Among the different locations, the maximum calcium concentration was found as 53.287 mgL-1 at Termuni area, which was also statically identical with the value recorded from Babur zaiga (50.502 mgL-1). The minimum calcium concentration was noted as 31.210 mgL-1 from the water sample at Nagarpara area. Considering both locations and seasons the maximum Calcium concentration was found at Termuni area during dry season (61.077 mgL-1) and the minimum value was noted at Nagarpara during wet season (23.200 mgL-1).
Fig. 7.5. Average Ca concentration in Balu river water varied at different locations and seasons during 2011-12.
Table 65.5. Ca (mgL-1) concentration in Balu river water (0-50 cm) varied at different location and season during 2011-2012.
Location/Season
Termuni Babur Zaiga
Itakhola Nagarpara Nalchata Thulthulia Paschim gao Demra Mean (season)
Wet season 45.50de 42.86e 38.73f 23.20j 34.59g 30.15h 27.77hi 25.75ij 33.57B Dry season 61.08a 58.14ab 55.50bc 39.22f 52.73c 48.65d 46.16d 42.63e 50.54A Mean (Location) 53.29A 50.50B 47.11C 31.21H 43.66D 39.40E 36.97F 34.19G
Note: i) Mean followed by same latter(s) is not significantly differs at 5% level of probability. Capital letters
were used for the mean variation for locations and seasons; small letters were used for the interaction mean of both i.e. Season × Location.
ii) Wet Season indicates the average value of three months: July to September, 2011 and Dry season indicates the average value of three months: November to January, 2011-12.
131

BINA Annual Report 2011-12 Soil Science
Magnesium concentration (mgL-1)
The Magnesium (Mg) concentration of the water sample are presented (Table 65.6, and Fig. 7.6). From the results it was observed that, the Magnesium concentration of the Balu river water significantly varied due to different locations and seasons. During the wet season (i.e., July-September 2011) on average, the Mg concentration of the Balu river water ranged from 14.247 to 29.723 mgL-1, whereas, it varied from 35.687 to 72.567 mgL-1 during dry season (November 2011 to January 2012). Among the different locations, the maximum magnesium concentration was as 51.145 mgL-1 found at Termuni area, which was also statically identical with the value 47.352 mgL-1 of Babur Zaiga. The minimum magnesium concentration was noticed from the water sample at Nagarpara area (26.047 mgL-1). Considering both locations and seasons the maximum magnesium concentration was found as 72.567 mgL-1 at Termuni area during dry season and the minimum value was noted at Demra ghat area (14.260 mgL-1) during wet season.
Fig. 7.6. Average Mg in Balu river water varied at different locations and seasons during 2011-12
Table 65.6. Mg (mgL-1) concentration in Balu river water (0-50 cm) varied at different location and season
during 2011-2012.
Location/Season
Termuni Babur Zaiga
Itakhola Nagarpara Nalchata Thulthulia Paschim gao Demra Mean (season)
Wet season 29.72h 26.20hi 23.85ij 16.41kl 21.04jk 17.99kl 15.69l 14.26l 20.64BDry season 72.57a 68.51ab 64.61bc 35.69g 61.54cd 57.64de 54.88ef 52.25f 58.46AMean (Location) 51.15A 47.35B 44.23BC 26.05F 41.29C 37.82D 35.28DE 33.25E
Note: i) Mean followed by same latter(s) is not significantly differs at 5% level of probability. Capital letters
were used for the mean variation for locations and seasons; small letters were used for the interaction mean of both i.e. Season × Location.
ii) Wet Season indicates the average value of three months: July to September, 2011 and Dry season indicates the average value of three months: November to January’ 2011-12.
132

BINA Annual Report 2011-12 Soil Science
Phosphate concentration (mgL-1)
The Phosphate (PO4) concentration of the water sample are presented (Table 65.7 and Fig. 7.7). From the results it was observed that, the Phosphate concentration of the Balu river water significantly varied due to different locations and seasons. During the wet season (i.e; July-September, 2011) the mean phosphate value of the Balu river water ranged from 3.193 to 12.827 mgL-1, whereas, it varied from 9.41 to 25.447 mgL-1 during dry season (Nov’11 to Jan’ 12). Among the different locations, the maximum Phosphate concentration was found at Termuni area (19.137 mgL-1), which was also statically identical with the value of Babur Zaiga (16.980 mgL-1). The minimum Phosphate value was noted from the water sample at Nagarpara (6.302 mgL-1). Considering the variation both locations and seasons the highest Phosphate concentration was found as 25.447 mgL-1 at Termuni during dry season and the minimum value was noted at Nagarpara (3.193 mgL-1) during wet season.
Fig. 7.7. Average PO4 in Balu river water varied at different locations and seasons during 2011-12.
Table 65.7. PO4 (mgL-1) concentration in Balu river water (0-50 cm) varied at different location and season during 2011-2012.
Location/Season Termuni Babur Zaiga
Itakhola Nagarpara Nalchata Thulthulia Paschim gao
Demra Mean (season)
Wet season 12.827ef 11.010fg 9.757h 3.193j 7.177hi 6.047ij 5.177ij 4.693ij 7.485B Dry season 25.447a 22.950ab 20.493bc 9.410gh 18.00cd 15.453de 13.957e 12.633ef 17.293AMean (Location) 19.137A 16.980B 15.125B 6.302F 12.590C 10.750CD 9.567DE 8.663E
Note: i) Mean followed by same latter(s) is not significantly differs at 5% level of probability. Capital letters
were used for the mean variation for locations and seasons; small letters were used for the interaction mean of both i.e. Season × Location.
ii) Wet Season indicates the average value of three months: July to September 2011 and Dry season indicates the average value of three months: November to January, 2011-12.
133

BINA Annual Report 2011-12 Soil Science
Concentration of Iron (Fe)
The Iron (Fe) concentration of the water sample are presented (Table 65.8 and Fig. 7.8). From the results it was observed that, the Fe concentration of the Balu river water significantly varied due to different locations and seasons. During the wet season (i.e.; July-September, 2011) on average, the value of the Balu river water ranged from 0.337 to 0.873 mgL-1, whereas, it varied from 1.828 to 2.522 mgL-1 during dry season (Nov’11 to Jan’ 12). Among the different locations, the maximum Fe concentration was found as 1.697 mgL-1 at Termuni area, which was also statically identical with the value of Babur Zaiga (1.575 mgL-1). The minimum Fe value was noticed from the water sample at Nagarpara (0.848 mgL-1). Concentration of Fe in the Karasu Greek region was 180-920 microgL-1 as reported by Yalcin et al. (2008). Considering both location and season the maximum Fe concentration was found at Termuni area (2.522 mgL-1) during dry season and the minimum value was noted at Nagarpara (0.337 mgL-1) during wet season.
Fig. 7.8. Average Fe in Balu river water varied at different locations and seasons during 2011-12.
Table 65.8. Fe (mgL-1) concentration in Balu river water (0-50 cm) varied at different location and season during 2011-2012.
Location/Season Termuni Babur Zaiga
Itakhola Nagarpara Nalchata Thulthulia Paschim gao
Demra Mean (season)
Wet season 0.873h 0.789hi 0.761hi 0.337k 0.676ij 0.625ij 0.576j 0.550j 0.648B Dry season 2.522a 2.362b 2.284bc 1.359g 2.159cd 2.036de 1.905ef 1.828f 2.057A Mean (Location) 1.697A 1.575B 1.522BC 0.848G 1.417CD 1.331DE 1.241EF 1.189F
Note: i) Mean followed by same latter(s) is not significantly differs at 5% level of probability. Capital letters
were used for the mean variation for locations and seasons; small letters were used for the interaction mean of both i.e. Season × Location.
ii) Wet Season indicates the average value of three months: July to September 2011 and Dry season indicates the average value of three months: November to January, 2011-12.
134

BINA Annual Report 2011-12 Soil Science
Soil water and nitrogen management for sustainable crop production in drought prone areas of Bangladesh using nuclear techniques Effect of soil water and Nitrogen levels on the growth and yield of wheat
The present study was conducted to develop improved management approaches to improve N and water use efficiency in wheat in drought prone areas of Bangladesh with a view to minimize the soil water and N loss. The experiment was assigned in a RCBD 2-factor split-plot design with 3 replications. The main plot treatment consists of 3 levels of irrigations, such as- W1 = Irrigation as Farmers’ practices, W2 = Two irrigations (at CRI and before flowering/anthesis stage of wheat), W3 = Three irrigations (at CRI, flag leaf ligule emergence and before flowering/anthesis stage of wheat). Four levels of N fertilizer were assigned in a spilt-plot as follows: N0 = No Nitrogen (control), N1 = 50 kg N ha-1, N2 = 100 kg N ha-1 and N3 = 150 kg N ha-1. The 1st year results are given as follows: Wheat seeds were sown on 4th December, 2011 and the harvest was completed on 29th March, 2012. During harvest, the data for yield and yield contributing characters were recorded and analyzed statistically. Plant and soil samples from the non-isotopic plots were collected and analyzed in the laboratory of Soil Science Division of BINA. The soil and plant samples were also collected from the 15N isotope plot and the laboratory analysis are in progress. The initial soil characteristics of the experimental field are given in Table 66. The data for yield and yield parameters, the amount of total N uptake by wheat and the soil analytical results are given in Table 67-73. Mean effect of different irrigations on the yield and yield attributes of wheat:
From the table 67, it is observed that different irrigation approaches significantly increases the plant height of wheat and the tallest (93.37 cm) plants were observed in the treatment W3. The dwarf plant (87.23 cm) was noticed in W1 (Farmer practice), which was also statistically identical with the treatment W2. The other parameters such as- spike length, grain and straw yield did not show any significant variation due to different irrigation treatments, though the highest yield of grain and straw were recorded in the treatment W3 as 3.86 and 5.13 t ha-1, respectively. Mean effect of different N levels on the yield and yield attributes of wheat
Different levels of N fertilizer significantly affected the yield and yield parameters of wheat grown at Rajshahi during the year of 2011-2012 (Table 68). The tallest wheat plant (93.62 cm) was observed in N3 treatment which was also identical with the value of N1 (91.83 cm) and N2 (93.54 cm). The dwarf plant of 82.41cm was noticed in the treatment N0 where no N was applied. Similarly the highest (11.64 cm) and the lowest (10.27 cm) spike length of wheat plants were recorded in the treatment N2 and N0, respectively. The maximum grain yield (4.21 t ha-1) of wheat was observed in the plot N2 where the N application rate was 100 kg ha-1. The minimum grain yield (2.06 t ha-1) of wheat was noticed under N0 treatment. Similar trends were observed in case of straw yield of wheat and the highest and lowest yield were as 5.40 and 2.88 t ha-1 in the treatment N2 and N0, respectively.
135

BINA Annual Report 2011-12 Soil Science
Interaction effect of irrigation and N on the yield and yield attributes of wheat:
Different irrigation approaches combined with the different N levels significantly influenced on the grain and straw yield of wheat at Barind area during 2011-12 (Table 69-71). Considering the grain yield of wheat the highest yield was observed in the treatment combination W3N2 (4.97 t ha-1), which was also showed an identical results with the value from the treatment combination W2N2 (4.09 t ha-1), W3N3 (4.36 t ha-1) and W1N3 (4.02 t ha-1). Similar results were noticed in case of straw yield of wheat and the maximum and minimum values were recorded in the treatment combination W3N2 (6.64 t ha-1) and W1N0 (2.74 t ha-1), respectively. Different irrigation and N levels affected on the amount of N uptake in grain and straw of wheat (Table 72). The maximum N uptake of 75.54 kg ha-1 was noticed in the treatment combination of W3N2, whereas, the minimum value (27.05 kg ha-1) was found in W3N0 treatment. Regarding the N uptake in wheat straw, the highest (21.54 kg ha-1) and lowest (5.75 kg ha-1) values were noticed in the treatment combination of W3N3 and W2N0, respectively. During the harvest of wheat, the soil samples were also analyzed for determining the content of total N, SOC and available P (Table 73). From the table, it was observed that due to different irrigation and N levels the amount of total N, SOC and available P showed a variations, which ranged from 0.09 to 0.11% for N, 0.53-0.79% for SOC and 12.35-23.01 ppm for available P in the soil during the time of wheat harvest. Table 66. Initial physico-chemical properties of soil collected from wheat experimental field at Barind area
(Godagari), Rajshahi during 2011-12.
Soil properties 0-15 cm depth 15-30 cm depth 30-50 cm depth Soil Texture clay loam clay clay % Sand 34.44 28.44 34.44 % Silt 36.00 28.00 18.00 % Clay 29.56 43.56 47.56 Soil O.C (%) 1.59 0.88 0.56 Soil pH 6.30 6.66 6.45 EC (dSm-1) 2.15 1.47 1.80 Total N (%) 0.10 0.06 0.05 Available P (ppm) 16 14 13 Exchangeable K meq/100 0.28 0.31 0.28 WHC (%) 30.64 25.37 -
Table 67. Mean Effect of different Irrigation practices on the yield and yield parameters of wheat grown at
Barind area (Godagari) during 2011-12.
Treatment Plant height (cm) Spike length (cm) Grain yield (t ha-1) Straw yield (t ha-1) W1 87.23b 10.99 3.21 4.28 W2 90.45ab 11.08 3.32 4.55 W3 93.37a 11.19 3.86 5.13 Level of significance ** NS NS NS %CV 2.79 4.27 18.18 23.66
Legend: W1 = Irrigation as Farmer’s practices W2 = Two irrigations (at CRI and before flowering/anthesis stage of wheat). W3 = Three irrigations (at CRI, flag leaf ligule emergence and before flowering/anthesis stage of wheat).
136

BINA Annual Report 2011-12 Soil Science
Table 68. Mean Effect of different N levels on the yield and yield parameters of wheat grown at Barind area (Godagari) during 2011-12.
Treatment Plant height (cm) Spike length (cm) Grain yield (t ha-1) Straw yield (t ha-1) N0 82.41b 10.27c 2.06b 2.88b N1 91.83a 11.02b 3.56a 5.05a N2 93.54a 11.64a 4.21a 5.40a N3 93.62a 11.42ab 4.02a 5.28a Level of significance ** ** ** ** CV(%) 2.79 4.27 18.18 23.66
Legend: N0 = No Nitrogen (control) N2 = 100 kg N ha-1
N1 = 50 kg N ha-1 N3 = 150 kg N ha-1
Table 69. Interaction Effect of different Irrigation and N levels on plant height of wheat grown at Barind area
(Godagari) during 2011-12.
Treatment W1 W2 W3 Mean N0 82.30fg 81.67g 83.27fg 82.41 N1 86.37ef 92.73b-d 96.40ab 91.83 N2 89.33de 92.40b-d 98.90a 93.54 N3 90.93cd 95.02a-c 94.90a 93.61 Mean 87.23 90.45 93.36 90.34
Legend: W1 = Irrigation as Farmers’ practices W2 = Two irrigations (at CRI and before flowering/anthesis stage of wheat). W3 = Three irrigations (at CRI, flag leaf ligule emergence and before flowering/anthesis stage of wheat).
N0 = No Nitrogen (control) N1 = 50 kg N ha-1
N2 = 100 kg N ha-1 N3 = 150 kg N ha-1
Table 70. Interaction Effect of different Irrigation and N levels on the grain yield of wheat grown at Barind area
(Godagari) during 2011-12.
Treatment W1 W2 W3 Mean N0 2.12cd 1.91d 2.17cd 2.06 N1 3.13bc 3.59b 3.96ab 3.56 N2 3.57b 4.09ab 4.97a 4.21 N3 4.02ab 3.70b 4.36ab 4.02 Mean 3.21 3.32 3.86 3.46
Legend: W1 = Irrigation as Farmer’s practices W2 = Two irrigations (at CRI and before flowering/anthesis stage of wheat). W3 = Three irrigations (at CRI, flag leaf ligule emergence and before flowering/anthesis stage of wheat).
N0 = No Nitrogen (control) N1 = 50 kg N ha-1
N2 = 100 kg N ha-1 N3 = 150 kg N ha-1
137

BINA Annual Report 2011-12 Soil Science
Table 71. Interaction Effect of different Irrigation and N levels on the straw yield of wheat grown at Barind area (Godagari) during 2011-12.
Treatment W1 W2 W3 Mean N0 2.74 2.78 3.13b 2.88 N1 4.45 5.57 5.13a 5.05 N2 4.35 5.21 6.64a 5.40 N3 5.57 4.64 5.62a 5.27 Mean 4.27 4.55 5.13 4.65
Legend: W1 = Irrigation as Farmers’ practices W2 = Two irrigations (at CRI and before flowering/anthesis stage of wheat). W3 = Three irrigations (at CRI, flag leaf ligule emergence and before flowering/anthesis stage of wheat).
N0 = No Nitrogen (control) N1 = 50 kg N ha-1
N2 = 100 kg N ha-1 N3 = 150 kg N ha-1
Table 72. Effect of different irrigation and N levels on the N content of wheat grown at Barind area (Godagari) during 2011-12.
Wheat Grain Wheat Straw
Treatment Yield (t ha-1) % N N yield
(kg ha-1) Yield (t ha-1) % N N yield
(kg ha-1) W1 N0 2.12 1.32 28.05 2.74 0.33 9.13
N1 3.13 1.47 46.12 4.45 0.24 10.83 N2 3.57 1.61 57.60 4.35 0.24 10.30 N3 4.02 1.61 64.86 5.57 0.29 16.34
W2 N0 1.91 1.64 31.39 2.78 0.21 5.75 N1 3.59 1.47 52.89 5.57 0.30 16.52 N2 4.09 1.30 53.31 5.21 0.32 16.67 N3 3.7 1.47 54.27 4.64 0.19 8.97
W3 N0 2.17 1.25 27.05 3.13 0.29 9.08 N1 3.96 1.19 46.99 5.13 0.32 16.42 N2 4.97 1.52 75.54 6.64 0.26 17.26 N3 4.36 1.35 58.86 5.62 0.38 21.54
Legend: W1 = Irrigation as Farmers’ practices W2 = Two irrigations (at CRI and before flowering/anthesis stage of wheat). W3 = Three irrigations (at CRI, flag leaf ligule emergence and before flowering/anthesis stage of wheat).
N0 = No Nitrogen (control) N1 = 50 kg N ha-1
N2 = 100 kg N ha-1 N3 = 150 kg N ha-1
138

BINA Annual Report 2011-12 Soil Science
Table 73. Effect of different irrigation and N levels on the content of % N, %SOC and available P in wheat field Barind area (Godagari) during 2011-12.
% N in soil % O.C. in soil P in soil (ppm) Treatment
Initial stage At harvest Initial stage At harvest Initial stage At harvest W1 N0 0.1 0.10 1.01 0.57 16.0 16.90
N1 0.1 0.10 1.01 0.86 16.0 17.55 N2 0.1 0.09 1.01 0.65 16.0 17.16 N3 0.1 0.09 1.01 0.53 16.0 17.55
W2 N0 0.1 0.09 1.01 0.70 16.0 16.51 N1 0.1 0.09 1.01 0.54 16.0 17.94 N2 0.1 0.11 1.01 0.84 16.0 15.47 N3 0.1 0.11 1.01 0.89 16.0 17.42
W3 N0 0.1 0.10 1.01 0.79 16.0 23.01 N1 0.1 0.09 1.01 0.68 16.0 15.86 N2 0.1 0.09 1.01 0.55 16.0 14.68 N3 0.1 0.10 1.01 0.61 16.0 12.35
Legend: W1 = Irrigation as Farmers’ practices W2 = Two irrigations (at CRI and before flowering/anthesis stage of wheat). W3 = Three irrigations (at CRI, flag leaf ligule emergence and before flowering/anthesis stage of wheat).
N0 = No Nitrogen (control) N1 = 50 kg N ha-1
N2 = 100 kg N ha-1 N3 = 150 kg N ha-1
Soil Organic matter dynamics and nutrient cycling on soil physical environment for sustainable crop production
Study the pattern of different crop residue decomposition using “nylon mesh bag technique”
In-situ incubation study was conducted by using Nylon mesh bag technique, during the year of 2011-12 at BINA sub-station farm, Magura, and Rangpur adjacent to the rice field experiment for determining the decomposition rate and nature of different crop residue. Four residue treatments, such as- 1. No residue in nylon bag/control; 2. Lentil residue, 3. Mungbean residue and 4. Soybean residue, were assigned in a RCB design with 3 replications. The nylon bags were retrieved at 7 different times, such as- i) 2 weeks after crop residue application (CRA); ii) 4 weeks after CRA; iii) 6 weeks after CRA; iv) 8 weeks after CRA; v) 10 weeks after CRA; vi) 12 weeks after CRA and vii) 14 weeks after CRA at 15 days intervals over the whole incubation period. For available N and net N release study from residue to soil, samples were collected from beneath the Nylon Mesh bag followed the same sampling time for each station. The amount of different legume residue remaining in the nylon mesh bag at different sampling intervals during the study is plotted in Fig 9-10. In general, three distinct phases of the legume residue decomposition in the rice field were observed. In the first phase, the legume residue decomposed faster for 2 weeks, followed by the second phase of 6 weeks in which the rate of decompositions slowed. The 3rd phase started after 8th week, in which the rate of decomposition maintained more or less a steady state. The maximum decomposition rate was observed at 15-20 days of residue incubation. The
139

BINA Annual Report 2011-12 Soil Science
soybean residue decomposed faster comparatively than the other legume residues. Within one month period, the maximum residue decomposition was observed from soybean residue treated soil as 55.33 and 50.0% in Magura and Rangpur, respectively. The minimum results were found from the soil, where mungbean residue was incorporated and the value were 37.67 and 33.67% in Magura and Rangpur, respectively (Fig. 9-10). Remaining of N (%) in different legume residues followed the same order between as the loss of dry weight (Fig. 11-12), i.e. the maximum amount of N released from soybean residue and the minimum was from mungbean. In the 1st phase, the rate of %N remaining decreases comparatively faster than other phases. At Magura within one month period, on an average 51.67% N remained in soybean residue, whereas, in lentil and mungbean the value of % N remaining were 54.60 and 64.67%, respectively. More or less similar trends were observed from the research results of Rangpur area and the %N remained as 50.5%, 54.33% and 67.75% in soybean, lentil and mungbean residue, respectively. From the N mineralization study, it was noted that, the release pattern of available N followed the same trend at both locations and the maximum value was recorded from soybean residue. In both locations, the maximum amount of net N release from soybean residue was recorded at 8th weeks after incubation (21.05 and 21.15 mgkg-1 in Magura and Rangpur), whereas, the minimum value (11.05 and 14.97 mgkg-1 in Magura Rangpur) was found from mungbean residue (Fig. 13-16).
140

BINA Annual Report 2011-12 Soil Science
0.00
10.00
20.00
30.00
40.00
50.00
60.00
70.00
80.00
2w 4w 6w 8w 10w 12w 14w
Weeks after incubation
% R
emain
ing o
f cro
p re
sidue
L1 L2 L3
Fig. 9. % Remaining of crop residue at different weeks after incubation at BINA sub-station
farm, Magura, 2011.
0.00
10.00
20.00
30.00
40.00
50.00
60.00
70.00
80.00
2w 4w 6w 8w 10w 12w 14w
Weeks after incubation
% R
emain
ing o
f cro
p re
sidue
L1 L2 L3
Fig. 10. % Remaining of crop residue at different weeks after incubation at BINA sub-station
farm, Rangpur, 2011
Legend:
L1 = Lentil L2 = Mungbean L3 = Soybean 2w = 2 weeks after incubation 10w = 10 weeks after incubation 4w = 4 weeks after incubation 12w = 12 weeks after incubation 6w = 6 weeks after incubation 14w = 14 weeks after incubation 8w = 8 weeks after incubation
141
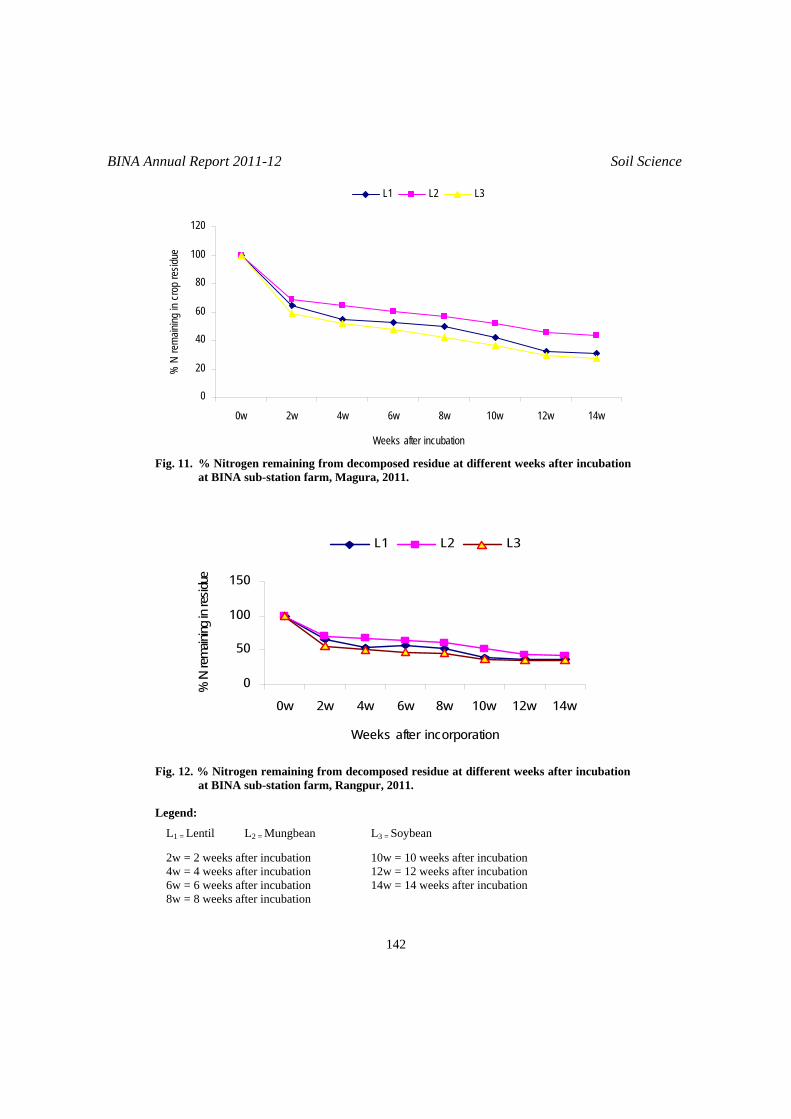
BINA Annual Report 2011-12 Soil Science
0
20
40
60
80
100
120
0w 2w 4w 6w 8w 10w 12w 14w
Weeks after incubation
% N
rem
aining
in c
rop
resid
ue
L1 L2 L3
Fig. 11. % Nitrogen remaining from decomposed residue at different weeks after incubation
at BINA sub-station farm, Magura, 2011.
0
50
100
150
0w 2w 4w 6w 8w 10w 12w 14w
Weeks after incorporation
% N
rem
aining
in re
sidue
L1 L2 L3
Fig. 12. % Nitrogen remaining from decomposed residue at different weeks after incubation
at BINA sub-station farm, Rangpur, 2011. Legend:
L1 = Lentil L2 = Mungbean L3 = Soybean 2w = 2 weeks after incubation 10w = 10 weeks after incubation 4w = 4 weeks after incubation 12w = 12 weeks after incubation 6w = 6 weeks after incubation 14w = 14 weeks after incubation 8w = 8 weeks after incubation
142

BINA Annual Report 2011-12 Soil Science
0
10
20
30
40
50
60
2w 4w 6w 8w 10w 12w 14w
Weeks after incorporation
Avai
labl
e N
(mg/
kg)
L0 L1L2 L3
Fig. 13. Amount of available N release from different residue during incubation study at
BINA sub-station farm, Magura, 2011.
0
5
10
15
20
25
2w 4w 6w 8w 10w 12w 14w
Weeks after incoporation
Net
N m
iner
aliz
atio
n (m
g/kg
) L1 L2 L3
Fig. 14. Amount of net N release from different residue during incubation study at BINA
sub-station farm, Magura, 2011. Legend:
L1 = Lentil L2 = Mungbean L3 = Soybean
2w = 2 weeks after incubation 10w = 10 weeks after incubation 4w = 4 weeks after incubation 12w = 12 weeks after incubation 6w = 6 weeks after incubation 14w = 14 weeks after incubation 8w = 8 weeks after incubation
143

BINA Annual Report 2011-12 Soil Science
0
10
20
30
40
50
60
2w 4w 6w 8w 10w 12w 14w
Weeks after incorporation
Avai
labl
e N
(mg/
kg)
L0 L1L2 L3
Fig. 15. Amount of available N release from different residue during incubation study at
BINA sub-station farm, Rangpur, 2011.
0
5
10
15
20
25
2w 4w 6w 8w 10w 12w 14w
Weeks after incorporation
Net N
mine
raliz
ation
(mg/
kg) L1 L2 L3
Fig. 16. Amount of net N release from different residue during incubation study at BINA
sub-station farm, Rangpur, 2011. Legend:
L1 = Lentil L2 = Mungbean L3 = Soybean
2w = 2 weeks after incubation 10w = 10 weeks after incubation 4w = 4 weeks after incubation 12w = 12 weeks after incubation 6w = 6 weeks after incubation 14w = 14 weeks after incubation 8w = 8 weeks after incubation
144
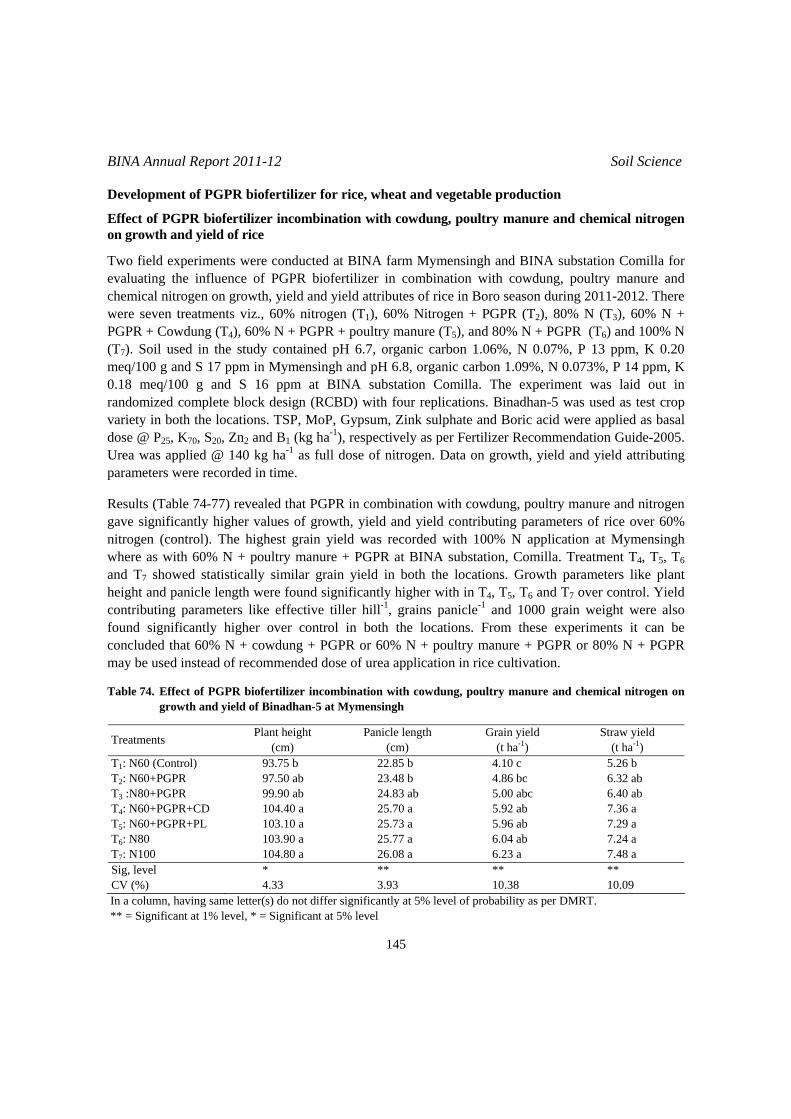
BINA Annual Report 2011-12 Soil Science
Development of PGPR biofertilizer for rice, wheat and vegetable production
Effect of PGPR biofertilizer incombination with cowdung, poultry manure and chemical nitrogen on growth and yield of rice
Two field experiments were conducted at BINA farm Mymensingh and BINA substation Comilla for evaluating the influence of PGPR biofertilizer in combination with cowdung, poultry manure and chemical nitrogen on growth, yield and yield attributes of rice in Boro season during 2011-2012. There were seven treatments viz., 60% nitrogen (T1), 60% Nitrogen + PGPR (T2), 80% N (T3), 60% N + PGPR + Cowdung (T4), 60% N + PGPR + poultry manure (T5), and 80% N + PGPR (T6) and 100% N (T7). Soil used in the study contained pH 6.7, organic carbon 1.06%, N 0.07%, P 13 ppm, K 0.20 meq/100 g and S 17 ppm in Mymensingh and pH 6.8, organic carbon 1.09%, N 0.073%, P 14 ppm, K 0.18 meq/100 g and S 16 ppm at BINA substation Comilla. The experiment was laid out in randomized complete block design (RCBD) with four replications. Binadhan-5 was used as test crop variety in both the locations. TSP, MoP, Gypsum, Zink sulphate and Boric acid were applied as basal dose @ P25, K70, S20, Zn2 and B1 (kg ha-1), respectively as per Fertilizer Recommendation Guide-2005. Urea was applied @ 140 kg ha-1 as full dose of nitrogen. Data on growth, yield and yield attributing parameters were recorded in time. Results (Table 74-77) revealed that PGPR in combination with cowdung, poultry manure and nitrogen gave significantly higher values of growth, yield and yield contributing parameters of rice over 60% nitrogen (control). The highest grain yield was recorded with 100% N application at Mymensingh where as with 60% N + poultry manure + PGPR at BINA substation, Comilla. Treatment T4, T5, T6 and T7 showed statistically similar grain yield in both the locations. Growth parameters like plant height and panicle length were found significantly higher with in T4, T5, T6 and T7 over control. Yield contributing parameters like effective tiller hill-1, grains panicle-1 and 1000 grain weight were also found significantly higher over control in both the locations. From these experiments it can be concluded that 60% N + cowdung + PGPR or 60% N + poultry manure + PGPR or 80% N + PGPR may be used instead of recommended dose of urea application in rice cultivation. Table 74. Effect of PGPR biofertilizer incombination with cowdung, poultry manure and chemical nitrogen on
growth and yield of Binadhan-5 at Mymensingh
Treatments Plant height (cm)
Panicle length (cm)
Grain yield (t ha-1)
Straw yield (t ha-1)
T1: N60 (Control) 93.75 b 22.85 b 4.10 c 5.26 b T2: N60+PGPR 97.50 ab 23.48 b 4.86 bc 6.32 ab T3 :N80+PGPR 99.90 ab 24.83 ab 5.00 abc 6.40 ab T4: N60+PGPR+CD 104.40 a 25.70 a 5.92 ab 7.36 a T5: N60+PGPR+PL 103.10 a 25.73 a 5.96 ab 7.29 a T6: N80 103.90 a 25.77 a 6.04 ab 7.24 a T7: N100 104.80 a 26.08 a 6.23 a 7.48 a Sig, level * ** ** ** CV (%) 4.33 3.93 10.38 10.09
In a column, having same letter(s) do not differ significantly at 5% level of probability as per DMRT. ** = Significant at 1% level, * = Significant at 5% level
145

BINA Annual Report 2011-12 Soil Science
Table 75. Effect of PGPR biofertilizer incombination with cowdung, poultry manure and chemical nitrogen on yield attributes of Binadhan-5 at Mymensingh
Treatments Effective tiller hill-1 (no.)
Grains panicle-1
(no.) 1000 grain weight
(g) T1 9.45 b 57.98 b 23.25 b T2 10.50 ab 65.46 ab 24.11 ab T3 10.65 ab 67.00 ab 24.16 ab T4 11.58 a 69.14 a 24.23 ab T5 11.80 a 73.45 a 24.26 ab T6 11.73 a 70.93 a 25.07 a T7 11.60 a 71.35 a 25.26 a Sig, level * ** * CV (%) 8.11 6.25 2.98
In a column, having same letter(s) do not differ significantly at 5% level of probability as per DMRT. ** = Significant at 1% level, * = Significant at 5% level Table 76. Effect of PGPR biofertilizer incombination with cowdung, poultry manure and chemical nitrogen on
growth and yield of Binadhan-5 at Comilla
Treatments Plant height (cm)
Panicle length (cm)
Grain yield (t ha-1)
Straw yield (t ha-1)
T1 90.94 b 21.51 b 4.46 b 7.70 b T2 95.40 ab 22.47 ab 5.36 ab 9.21 ab T3 95.63 ab 22.38 ab 5.27 ab 9.25 ab T4 99.97 a 23.49 a 6.10 a 10.16 a T5 100.20 a 23.70 a 6.44 a 10.34 a T6 101.70 a 23.52 a 6.33 a 10.16 a T7 100.60 a 23.75 a 6.40 a 10.40 a Sig, level * * ** ** CV (%) 4.11 4.18 11.49 9.93
In a column, having same letter(s) do not differ significantly at 5% level of probability as per DMRT. ** = Significant at 1% level, * = Significant at 5% level, NS = Not significant Table 77. Effect of PGPR biofertilizer incombination with cowdung, poultry manure and chemical nitrogen on
yield attributes of Binadhan-5 at Comilla
Treatments Effective tiller hill-1 (no.)
Grains panicle-1
(no.) 1000 grain weight
(g) T1 8.63 c 72.40 c 23.74 T2 9.80 bc 78.50 abc 24.72 T3 9.70 bc 76.25 bc 25.89 T4 11.15 ab 85.00 ab 25.54 T5 11.47 a 87.75 ab 25.80 T6 11.00 ab 90.00 a 24.89 T7 11.10 ab 87.25 ab 25.86 Sig, level ** * NS CV (%) 6.77 8.61 6.32
In a column, having same letter(s) do not differ significantly at 5% level of probability as per DMRT. ** = Significant at 1% level, * = Significant at 5% level, NS = Not significant
146
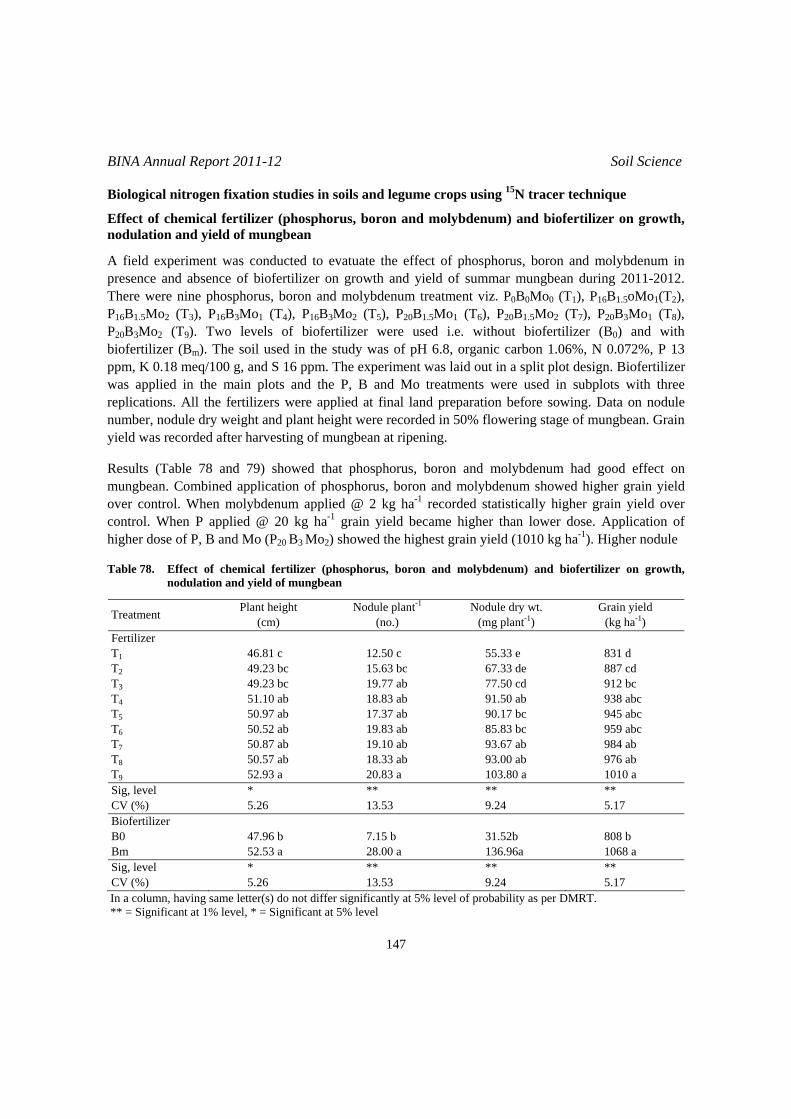
BINA Annual Report 2011-12 Soil Science
Biological nitrogen fixation studies in soils and legume crops using 15N tracer technique
Effect of chemical fertilizer (phosphorus, boron and molybdenum) and biofertilizer on growth, nodulation and yield of mungbean
A field experiment was conducted to evatuate the effect of phosphorus, boron and molybdenum in presence and absence of biofertilizer on growth and yield of summar mungbean during 2011-2012. There were nine phosphorus, boron and molybdenum treatment viz. P0B0Mo0 (T1), P16B1.5oMo1(T2), P16B1.5Mo2 (T3), P16B3Mo1 (T4), P16B3Mo2 (T5), P20B1.5Mo1 (T6), P20BB1.5Mo2 (T7), P20B3B Mo1 (T8), P20B3Mo2 (T9). Two levels of biofertilizer were used i.e. without biofertilizer (B0) and with biofertilizer (BBm). The soil used in the study was of pH 6.8, organic carbon 1.06%, N 0.072%, P 13 ppm, K 0.18 meq/100 g, and S 16 ppm. The experiment was laid out in a split plot design. Biofertilizer was applied in the main plots and the P, B and Mo treatments were used in subplots with three replications. All the fertilizers were applied at final land preparation before sowing. Data on nodule number, nodule dry weight and plant height were recorded in 50% flowering stage of mungbean. Grain yield was recorded after harvesting of mungbean at ripening. Results (Table 78 and 79) showed that phosphorus, boron and molybdenum had good effect on mungbean. Combined application of phosphorus, boron and molybdenum showed higher grain yield over control. When molybdenum applied @ 2 kg ha-1 recorded statistically higher grain yield over control. When P applied @ 20 kg ha-1 grain yield became higher than lower dose. Application of higher dose of P, B and Mo (P20 B3 Mo2) showed the highest grain yield (1010 kg ha-1). Higher nodule Table 78. Effect of chemical fertilizer (phosphorus, boron and molybdenum) and biofertilizer on growth,
nodulation and yield of mungbean
Treatment Plant height (cm)
Nodule plant-1
(no.) Nodule dry wt.
(mg plant-1) Grain yield
(kg ha-1) Fertilizer T1 46.81 c 12.50 c 55.33 e 831 d T2 49.23 bc 15.63 bc 67.33 de 887 cd T3 49.23 bc 19.77 ab 77.50 cd 912 bc T4 51.10 ab 18.83 ab 91.50 ab 938 abc T5 50.97 ab 17.37 ab 90.17 bc 945 abc T6 50.52 ab 19.83 ab 85.83 bc 959 abc T7 50.87 ab 19.10 ab 93.67 ab 984 ab T8 50.57 ab 18.33 ab 93.00 ab 976 ab T9 52.93 a 20.83 a 103.80 a 1010 a Sig, level * ** ** ** CV (%) 5.26 13.53 9.24 5.17 Biofertilizer B0 47.96 b 7.15 b 31.52b 808 b Bm 52.53 a 28.00 a 136.96a 1068 a Sig, level * ** ** ** CV (%) 5.26 13.53 9.24 5.17
In a column, having same letter(s) do not differ significantly at 5% level of probability as per DMRT. ** = Significant at 1% level, * = Significant at 5% level
147

BINA Annual Report 2011-12 Soil Science
Table 79. Interaction effect of chemical fertilizer (phosphorus, boron and molybdenum) and biofertilizer on growth, nodulation and yield of mungbean
Chem. Fertilizer × Biofertilizer
Plant height (cm)
Nodule number (no. plant-1)
Nodule dry wt. (mg plant-1)
Grain yield (kg ha-1)
BB0 × T1 44.69 4.67 d 15.67 f 706 BB0 ×T2 46.53 7.13 d 26.33 ef 756 BB0 × T3 47.87 6.87 d 28.67 ef 778 BB0 × T4 48.47 6.73 d 34.67 ef 815 BB0 × T5 49.80 7.07 d 34.67 ef 810 BB0 × T6 47.30 8.33 d 31.00 ef 828 BB0 × T7 49.20 8.20 d 32.67 ef 852 BB0 × T8 48.48 7.33 d 39.33 e 836 BB0 × T9 49.33 8.00 d 40.67 e 897 BBm × T1 48.93 20.33 c 95.00 d 957 BBm ×T2 51,93 24.13 bc 108.30 d 1018 BBm × T3 50.60 32.67 a 126.30 c 1045 BBm × T4 53,73 30.93 a 148.30 b 1062 BBm × T5 52.13 27.67 ab 145.70 b 1081 BBm × T6 53,73 31.67 a 140.70 bc 1090 BBm × T7 52.53 30.00 a 154.70 ab 1117 BBm × T8 52.67 29.33 ab 146.70 b 1116 BBm × T9 56.53 33.67 a 167.00 a 1123 Sig, level NS ** ** NS CV (%) 5.26 13.53 9.24 5.17
In a column, having same letter(s) do not differ significantly at 5% level of probability as per DMRT. ** = Significant at 1% level, NS = Not significant number, nodule dry weight were recorded with higher PBMo application. Highest nodule number and nodule dry weight were found with P20B3Mo2 (T9). Biofertilizer application showed significantly higher plant height, nodule number, nodule dry weight and grain yield of mungbean. There was significant interaction between biofertilizer and P, B and Mo on nodule number and dry weight. The highest values in nodule number, nodule dry weight, plant height and grain yield of mungbean were recorded with the application of treatment cobination biofertilizer and P20B3Mo2. It may be inferred that P20B3Mo2 along with biofertilizer might be applied for sustainable mungbean cultivation. Development of phosphatic biofertilizer for maximizing crop production
Effects of phosphatic biofertilizer with inorganic and organic P on the growth and yield of lentil and chickpea at Ishurdi and Magura
Field experiments were conducted to evaluate the phosphatic biofertilizer with inorganic or organic sources of P on lentil and chickpea at BINA substation, Ishurdi and BINA substation, Magura during 2011-12. The experiments were laid out in a RCB design using eight treatments with three replications. The treatments were as follows: T1: Control, T2: 100% P from TSP, T3: 50% P from TSP, T4: 50% P from TSP + Phosphatic biofertilizer (PB), T5: 50% P from TSP + PB, T6: 50% P from cowdung (CD), T7: 50% P from CD + PB and T8: Phosphatic biofertilizer (PB).
148

BINA Annual Report 2011-12 Soil Science
Lentil (var. Binamasur-2) and chickpea (Binasola-4) were sown in separate land at both the locations. Letil was sown on 17 and 18 November 2011 at Ishurdi and Magura, respectively while chickpea was sown on 24 November 2011 at Ishurdi and 23 November 2011 at Magura. Lentil was harvested on 14 March 2012 at Ishurdi and 6 March 2012 at Magura. Chickpea was harvested on 12 and 18 April 2012 at Ishurdi and Magura, respectivively. Characteristics of initial soils for both the locations have been given in Table 80 for lentil and chickpea. The fertilizer rates were used on the basis of soil tests (Table 81). In case of cowdung treatments, IPNS was followed. Phosphatic biofertilizer (as liquid inoculant) was applied with the seeds of lentil and chickpea before sowing. Table 82 shows that the treatment T5 (50% P from TSP + PB) gave significantly maximum seed yield of lentil (1.62 and 1.36 t ha -1) followed by the treatments T2 (1.51 and 1.21 t ha -1) at Ishurdi and Magura, respectively. But the treatments T2 (100% P from TSP) and T5 (50% P from TSP + PB) gave identical seed yields at both the locations. The treatment T4 (100% P from TSP + PB) gave similar seed yields with the treatment T2 (100% P from TSP) but it differed significantly from the treatment T5 (50% P from TSP + PB) at Ishurdi. At Magura the treatment T5 showed statistically similar seed yields of lentil with the treatments T2, T3 and T4. The treatment T6 (50% P from CD) gave insignificantly lower seed yield than the treatment T3 (50% P from TSP) but they gave identical results with the treatments T7 (50% P from CD + PB) and T8 (PB) at both the locations. However phosphatic biofertilizer with 50% P from cowdung gave higher seed yield of lentil to a some extent than 50% P from cowdung alone at both the locations which indicated that phosphate solubilizing bacteria might be stimulated with the application of cowdung. Without P gave significantly the lowest seed yield of lentil at both the locations. Stover yields of lentil (Table 82) also significantly affected with the different treatments at both the locations. The treatment T6 (50% P from CD) gave significantly maximum stover yield (3.57 and 3.22 t ha-1 at Ishurdi and Magura, respectively) of lentil followed by the treatment T5 (50% P from TSP + PB) and the lowest stover yield (2.39 and 2.45 t ha-1 at Ishurdi and Magura, respectively) was recorded with the treatment T1. The results indicated that phosphatic biofertilizer with reduced rate of P i.e. 50%P from TSP + Phosphatic biofertilizer gave comparable seed yields of lentil to the 100%P from TSP alone. Table 80. Physical, chemical and microbiological characteristics of initial soils of experimental fields at Ishurdi
and Magura for lentil and chickpea during 2011-12
Characteristics Ishurdi Magura Textural class Loam Clay Loam Cation exchange capacity (cmol kg-1) 13.6 12.4 Soil pH 7.7 7.6 Organic carbon (%) 0.60 0.65 Total N (%) 0.052 0.064 Available P (mg kg-1) 13.33 14.2 Total P (mg kg-1) 1454.5 1420.8 Exchangeable K (cmol kg-1) 0.237 0.228 Available S (mg kg-1) 10.8 11.0 PSB population (cfu g-1 dry soil) 1.2 × 10⁴ 1.4 × 10⁴
149

BINA Annual Report 2011-12 Soil Science
Phosphatic biofertilizer with inorganic and organic sources of P also significantly influenced the seed and stover yields of chickpea at Ishurdi and Magura (Table 83). The treatment T5 (50% P from TSP + PB) gave significantly maximum seed yields (2.7 and 1.7 t ha-1 at Ishurdi and Magura, respectively) of chickpea followed by the treatment T2 (50% P from TSP) at both the locations. The control treatment T1 gave significantly the lowest seed yield (1.53 and 0.95 t ha-1) at both the locations. Similar trends were also observed in case of stover yield of chickpea at both the locations. The results revealed that phosphatic biofertilizer with 50% P from TSP can be used for cultivation of chickpea as an alternative of 100% P from TSP alone. Table 81. Full rates (100%) of nutrients (kg ha-1) and 50% P equivalent CD (t ha-1) for lentil and chickpea crop
at Ishurdi and Magura on the basis of soil test values
Nutrients and CD rate for lentil and chickpea Locations N P K CD BINA sub-station, Ishurdi 19.0 23.0 17.1 0.58 BINA sub-station, Magura 19.0 22.0 18.0 0.55
Table 82. Effects of phosphatic biofertilizer with inorganic and organic P on seed and stover yields of lentil
(Binamasur 2) at Ishurdi and Magura during 2011-12
Ishurdi Magura Treatments Seed yield
(t ha-1) Stover yield
(t ha-1) Seed yield
(t ha-1) Stover yield
(t ha-1) T1: Control 0.95d 2.39d 0.86c 2.45b T2: 100% P from TSP 1.51ab 3.21ab 1.21ab 3.02a T3: 50% P from TSP 1.28bc 2.93bc 1.12b 2.81ab T4: 100% P from TSP + Phosphatic biofertilizer (PB) 1.36bc 2.88bc 1.16ab 3.12a T5: 50% P fromTSP + PB 1.62a 3.07bc 1.36a 3.18a T6: 50% P from cowdung 1.23c 3.57a 1.06bc 3.22a T7: 50% P from cowdung + PB 1.26c 2.81bcd 1.08b 2.83ab T8: PB 1.21c 2.64cd 1.10b 2.95ab CV (%) 9.81 8.30 10.95 9.34
In a column figures having common letter(s) do not differ significantly at 5% level of significance as per DMRT. Table 83. Effects of phosphatic biofertilizer with inorganic and organic P on seed and stover yields of chickpea
(Binasola-4) at Ishurdi and Magura during 2011-12
Ishurdi Magura Treatments Seed yield
(t ha-1) Stover yield
(t ha-1) Seed yield
(t ha-1) Stover yield
(t ha-1) T1: Control 1.53e 2.75b 0.95d 3.02b T2: 100% P from TSP 2.39ab 3.69a 1.67a 4.08a T3: 50% P from TSP 1.94cd 3.52ab 1.30bcd 3.91a T4: 100% P from TSP + Phosphatic biofertilizer (PB) 2.26bc 3.87a 1.62ab 4.31a T5: 50% P fromTSP + PB 2.70a 4.10a 1.70a 4.26a T6: 50% P from cowdung 2.08bcd 3.42ab 1.26bcd 3.47ab T7: 50% P from cowdung + PB 2.25bcd 3.55ab 1.54abc 3.99a T8: PB 1.90d 3.31ab 1.18cd 3.87a CV (%) 8.75 11.83 13.88 11.20
In a column figures having common letter(s) do not differ significantly at 5% level of significance as per DMRT
150
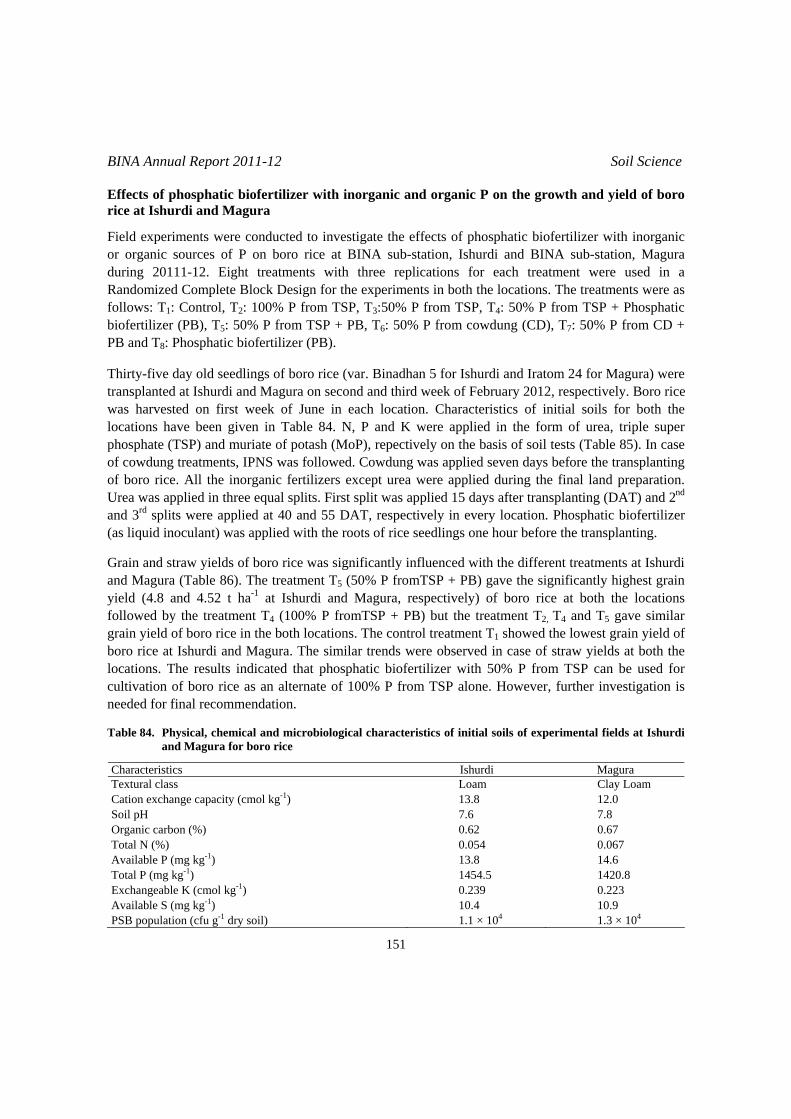
BINA Annual Report 2011-12 Soil Science
Effects of phosphatic biofertilizer with inorganic and organic P on the growth and yield of boro rice at Ishurdi and Magura
Field experiments were conducted to investigate the effects of phosphatic biofertilizer with inorganic or organic sources of P on boro rice at BINA sub-station, Ishurdi and BINA sub-station, Magura during 20111-12. Eight treatments with three replications for each treatment were used in a Randomized Complete Block Design for the experiments in both the locations. The treatments were as follows: T1: Control, T2: 100% P from TSP, T3:50% P from TSP, T4: 50% P from TSP + Phosphatic biofertilizer (PB), T5: 50% P from TSP + PB, T6: 50% P from cowdung (CD), T7: 50% P from CD + PB and T8: Phosphatic biofertilizer (PB). Thirty-five day old seedlings of boro rice (var. Binadhan 5 for Ishurdi and Iratom 24 for Magura) were transplanted at Ishurdi and Magura on second and third week of February 2012, respectively. Boro rice was harvested on first week of June in each location. Characteristics of initial soils for both the locations have been given in Table 84. N, P and K were applied in the form of urea, triple super phosphate (TSP) and muriate of potash (MoP), repectively on the basis of soil tests (Table 85). In case of cowdung treatments, IPNS was followed. Cowdung was applied seven days before the transplanting of boro rice. All the inorganic fertilizers except urea were applied during the final land preparation. Urea was applied in three equal splits. First split was applied 15 days after transplanting (DAT) and 2nd and 3rd splits were applied at 40 and 55 DAT, respectively in every location. Phosphatic biofertilizer (as liquid inoculant) was applied with the roots of rice seedlings one hour before the transplanting. Grain and straw yields of boro rice was significantly influenced with the different treatments at Ishurdi and Magura (Table 86). The treatment T5 (50% P fromTSP + PB) gave the significantly highest grain yield (4.8 and 4.52 t ha-1 at Ishurdi and Magura, respectively) of boro rice at both the locations followed by the treatment T4 (100% P fromTSP + PB) but the treatment T2, T4 and T5 gave similar grain yield of boro rice in the both locations. The control treatment T1 showed the lowest grain yield of boro rice at Ishurdi and Magura. The similar trends were observed in case of straw yields at both the locations. The results indicated that phosphatic biofertilizer with 50% P from TSP can be used for cultivation of boro rice as an alternate of 100% P from TSP alone. However, further investigation is needed for final recommendation. Table 84. Physical, chemical and microbiological characteristics of initial soils of experimental fields at Ishurdi
and Magura for boro rice
Characteristics Ishurdi Magura Textural class Loam Clay Loam Cation exchange capacity (cmol kg-1) 13.8 12.0 Soil pH 7.6 7.8 Organic carbon (%) 0.62 0.67 Total N (%) 0.054 0.067 Available P (mg kg-1) 13.8 14.6 Total P (mg kg-1) 1454.5 1420.8 Exchangeable K (cmol kg-1) 0.239 0.223 Available S (mg kg-1) 10.4 10.9 PSB population (cfu g-1 dry soil) 1.1 × 10⁴ 1.3 × 10⁴
151

BINA Annual Report 2011-12 Soil Science
Table 85. Full rates (100%) of nutrients (kg ha-1) and 50% P equivalent CD (t ha-1) for boro rice at Ishurdi and Magura on the basis of soil test values
Nutrients for boro rice Locations N P K CD
BINA sub-station, Ishurdi 136 13 21 0.65 BINA sub-station, Magura 136 12 24 0.60
Table 86. Effects of phosphatic biofertilizer with organic and inorganic fertilizes on grain and straw yields of
boro rice at Ishurdi (var. Binadhan 5) and Magura (var. Iratom 24) during 2011-12
Ishurdi Magura Treatments Grain yield
(t ha-1) Straw yield
(t ha-1) Grain yield
(t ha-1) Straw yield
(t ha-1) T1: Control 3.97c 4.88d 3.17c 4.80c T2: 100% P from TSP 4.62ab 5.52ab 4.13abc 5.47ab T3: 50% P from TSP 4.38abc 5.13cd 3.40bc 5.13abc T4: 100% P from TSP + Phosphatic biofertilizer (PB) 4.68ab 5.32bc 4.32ab 5.50a T5: 50% P fromTSP + PB 4.80a 5.77a 4.52a 5.60a T6: 50% P from cowdung 4.25bc 5.17bcd 3.35bc 4.98bc T7: 50% P from cowdung + PB 4.53ab 5.30bc 3.37bc 5.30abc T8: PB 4.40abc 4.92d 3.30c 4.87c CV (%) 5.37 3.64 13.62 5.03
In a column, figures having common letter(s) do not differ significantly at 5% level of significance as per DMRT.
152

ENTOMOLOGY DIVISION

BINA Annual Report 2011-12 Entomology
154

BINA Annual Report 2011-12 Entomology
155
RESEARCH HIGHLIGHTS
Among the three salt tolerant mutants/variety of rice, the overall infestation by stem borer throughout the cropping season was below the economic injury level (5-10%). In artificially infested condition, only the mutant PBRC-37 was found to be moderately tolerant (MT) to brown plant hopper. Between the two submergence tolerant mutants/lines of rice, the lowest leaf area consumed by rice hispa was in the mutant Sumba Mahsuri-Sub-1. Among the four salt tolerant mutants of rice, the lowest leaf area consumed by rice hispa was in the line PBRC-37 and it was followed by Binadhan-8. The maximum mortality (100%) of BPH recorded when cartap was used @ 800 gm ha-1 and the minimum mortality (50%) recorded when phipronyl and diazinon were used. Chickpea mutant P-70 was found to perform against pod borer. The lowest infestation by jassid, whitefly and pod borer was observed in mungbeen mutant MBM-07 though the overall infestation was low. All the tested mutants of jute having less than one number of knots plant-1 were designated as resistant to jute stem weevil. Among the tested mutants of mustard, the mutant MM- 211 may be regarded as less susceptible to mustard sawfly and the mutant MM-37 was found to be less susceptible to mustard aphid. Among the eleven mutants/varieties of groundnut, the mutant RS/25/3-1 showed less infested against jassid and leaf roller. Sesame mutant SM-058 was found to be less infested to pod borer.

BINA Annual Report 2011-12 Entomology
156
Evaluation of salt tolerant mutants/variety of rice for tolerance to major insect pests
Three salt tolerant mutants/variety of rice, viz. PBRC-15, SAL-655 and Binadhan-8 were tested along with one resistant check TKM6 and a susceptible check TN1 against rice stem borer and green leaf hopper under field condition. The experiment was laid out in a randomized complete block design with three replications during the Boro season, 2012 at BINA farm, Mymensingh. No protective measure was taken to control the insect pests. Data were recorded during maximum tillering and heading stage and analyzed statistically. Among the three salt tolerant mutants/variety of rice the overall infestation by stem borer throughout the cropping season was below the economic injury level (5-10%) (Table 1). In GLH infestation, there was no significant difference among the three mutants/varieties of rice. Table 1. Mean infestation of rice mutants/variety for tolerance to stem borer and GLH under field condition
Mutants/variety % Dead heart % White head GLH/10 sweeps PBRC-15 0.26 b 0.23 c 4.33 ab SAL-655 0.32 b 0.34 bc 3.00 ab Binadhan-8 0.33 b 0.41 b 2.00 ab TN1 (Susceptible check) 0.91 a 0.99 a 6.12 a TKM6 (Resistant check) 0.03 c 0.04 d 1.01 b
Note: GLH = Green leaf hopper Evaluation of Salt tolerant mutants/variety of rice for tolerance to brown plant hopper under artificially infested condition.
Four salt tolerant mutants/varieties of rice, viz. PBRC-15, PBRC-37, SAL-655 and Binadhan-8 were tested along with one resistant check T27A and a susceptible check TN1 against brown plant hopper under artificial infested condition. The experiment was laid out in a completely randomized design with three replications. Data were recorded timely and analyzed statistically. Among the four salt mutants/varieties of rice only the mutant PBRC-37 was found to be moderately tolerant (MT) and Binadhan-8 & SAL-655 were moderately susceptible and PBRC-15 was susceptible to brown plant hopper (Table 2). Table 2. Mean infestation of salt tolerant mutants/variety of rice for tolerance to brown plant hopper under
artificial infested condition
Mutants/variety Damage scale (0-9) Level of resistant TN1 (Susceptible check) 7 S TKM6 7 S PBRC-15 7 S Binadhan-8 5 MS SAL-655 5 MS PBRC-37 3 MT T27A (Resistant check) 0 HT
Note: S = Susceptible, MS = Moderately Susceptible, MT = Moderately Tolerant, HT = Highly Tolerant.
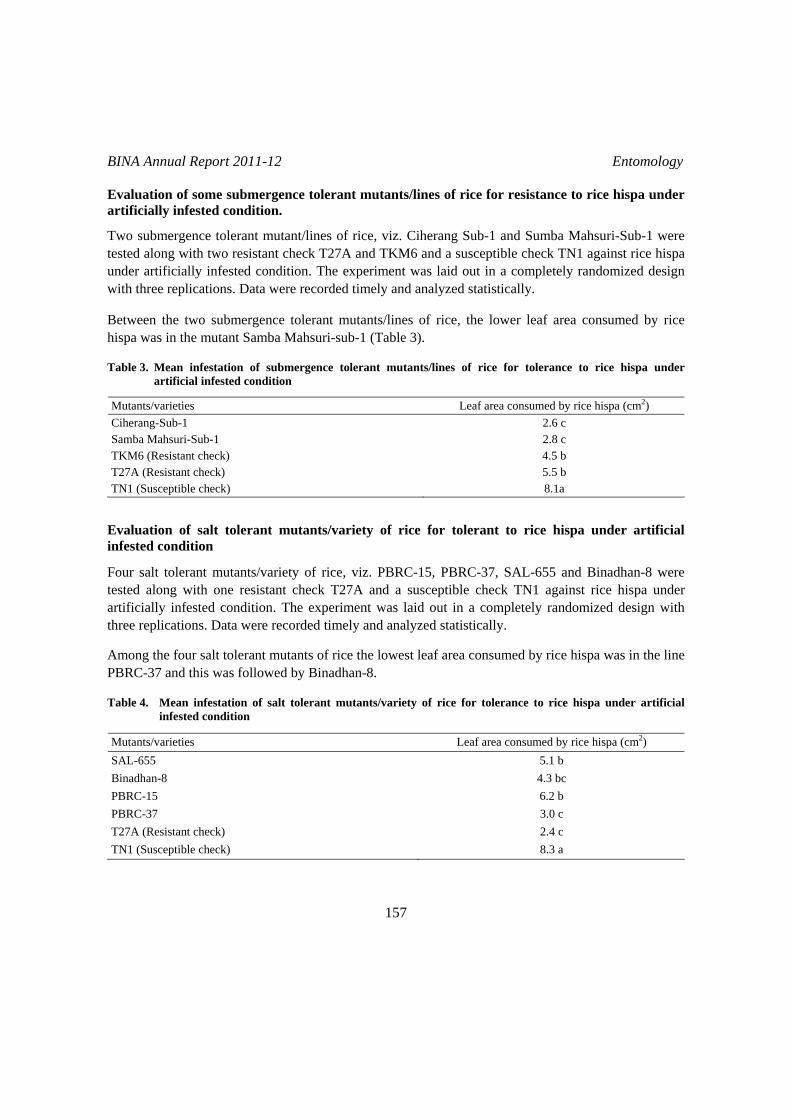
BINA Annual Report 2011-12 Entomology
157
Evaluation of some submergence tolerant mutants/lines of rice for resistance to rice hispa under artificially infested condition.
Two submergence tolerant mutant/lines of rice, viz. Ciherang Sub-1 and Sumba Mahsuri-Sub-1 were tested along with two resistant check T27A and TKM6 and a susceptible check TN1 against rice hispa under artificially infested condition. The experiment was laid out in a completely randomized design with three replications. Data were recorded timely and analyzed statistically. Between the two submergence tolerant mutants/lines of rice, the lower leaf area consumed by rice hispa was in the mutant Samba Mahsuri-sub-1 (Table 3). Table 3. Mean infestation of submergence tolerant mutants/lines of rice for tolerance to rice hispa under
artificial infested condition
Mutants/varieties Leaf area consumed by rice hispa (cm2) Ciherang-Sub-1 2.6 c Samba Mahsuri-Sub-1 2.8 c TKM6 (Resistant check) 4.5 b T27A (Resistant check) 5.5 b TN1 (Susceptible check) 8.1a
Evaluation of salt tolerant mutants/variety of rice for tolerant to rice hispa under artificial infested condition
Four salt tolerant mutants/variety of rice, viz. PBRC-15, PBRC-37, SAL-655 and Binadhan-8 were tested along with one resistant check T27A and a susceptible check TN1 against rice hispa under artificially infested condition. The experiment was laid out in a completely randomized design with three replications. Data were recorded timely and analyzed statistically. Among the four salt tolerant mutants of rice the lowest leaf area consumed by rice hispa was in the line PBRC-37 and this was followed by Binadhan-8. Table 4. Mean infestation of salt tolerant mutants/variety of rice for tolerance to rice hispa under artificial
infested condition
Mutants/varieties Leaf area consumed by rice hispa (cm2) SAL-655 5.1 b Binadhan-8 4.3 bc PBRC-15 6.2 b PBRC-37 3.0 c T27A (Resistant check) 2.4 c TN1 (Susceptible check) 8.3 a

BINA Annual Report 2011-12 Entomology
158
Effect of insecticides to control different insect pests of rice
Experiment was conducted during the year, 2012 When at Entomology growth room to evaluate the effect of some insecticides to control brown plant hopper of rice. The insecticides, viz., carbosulfun, prophenophos, phipronyl, cartap, carbofuran and diazinon were applied at 45 days old seedling of rice at the recommended doses supply by the company. A control treatment was maintained which received no insecticide. The experiment was laid out in a completely randomized design with three replications. Data were recorded timely specify (10 days after spraying) and analyzed statistically. The maximum mortality (100%) of BPH recorded when cartap was used @ 800 gm ha-1 and minimum mortality (50%) recorded when phipronyl and diazinon were used (Table 5). This indicates that among the six insecticides, cartap group of insecticides was most effective for controlling BPH. Table 5. Efficacy of different insecticides against brown plant hopper
Group of insecticides Effective dose % Mortality Carbosulfun 1.5 litre ha-1 93 Prophenophos 1 litre ha-1 90 Phipronyl 10 kg ha-1 50 Cartap 800 g ha-1 100 Carbofuran 16 kg ha-1 90 Diazinon 16.8 kg ha-1 50 Control 1.5 litre ha-1 0
Screening of chickpea mutants/varieties for resistance to pod borer under field condition
Two mutants/strains of chickpea along with 2 check varieties were tested for their resistance to pod borer (Helicoverpa armigera) during the rabi season of 2011-12 at BINA substation farm, Jamalpur and farmer’s field Godagari, Rajshahi under the pesticide free open field condition for natural pest infestation. Randomized complete block design with three replications were followed for setting the experiments. Data on the pod borer infestation was recorded from 10 randomly selected plants per plot at harvest. Recorded data were statistically analyzed and presented in Table 6. Among the advanced mutants/varieties of chickpea, the lowest pod infestation by pod borer was observed in mutant P-70 and highest infestation was observed in check variety BARI Chola-5 though no significant differences were found among the tested materials. Table 6. Reaction of some mutants/strains of chickpea to pod borer at two locations
% pod infested Mutants/varieties Jamalpur Rajshahi P 70 8.41a 7.56b CPM-860 10.33a 7.74b Binasola-4 11.05a 12.13a BARI Chola-5 11.42a 13.49a
Means in a column followed by same letter are not significantly different at 5% level by DMRT.

BINA Annual Report 2011-12 Entomology
159
Screening of summer mungbean mutants/varieties for resistance to major insect pests under field condition
Two advance mutants of summer mungbean and two check varieties were evaluated for resistance to jassid, whitefly and pod borer under field condition during summer season of 2012. The experiments were conducted in a randomized complete block design with three replications at BINA substation farm, Ishurdi and Rangpur. Unit plot size was 3 m × 4 m. Seeds were sown on 6 March at Ishurdi and 14 March at Rangpur. The field was exposed to natural attack of insects and no control measure was taken. To assess the percentage of presence of jassid and whitefly data were taken by using cage (1 case = 40 cm × 45 cm = 6 plants) at the vegetative stage. Ten plants per plot were selected randomly for assessing percentage of pod borer infestation before harvest. The data were analyzed statistically. The overall infestations by the jassid, whitefly and pod borer were very low in both the locations. Specially the presence of whitefly was very low and no significant differences were observed. Significant differences were observed among the mutants/varieties with respect to jassid/cage and pod borer infestation (Table 10). The jassid/cage was comparatively lower at Ishurdi than Rangpur and Binamoog-8 showed the highest at Rangpur. Pod borer infestation was lower at Rangpur thant that of Ishurdi and the highest infestation was found in Binamoog-8 at both the locations. Table 7. Reaction of summer mungbean mutants to jassid, whitefly and pod borer at two locations Ishurdi and
Rangpur
% Infestation Jassid Whitfly Pod borer Mutants/variety
Ishurdi Rangpur Ishurdi Rangpur Ishurdi Rangpur MBM-07 0.73a 3.33b 0.60a 0.47a 4.18a 2.95b MBM-L-88 0.73a 3.40b 1.00a 0.67a 5.92a 4.93ab Binamoog-5 0.87a 3.67b 1.07a 0.80a 7.06a 6.18ab Binamoog-8 0.87a 6.60a 1.13a 1.00a 8.53a 7.32a
Means in a column followed by the same letter are not significantly different at 5% level by DMRT. Evaluation of tossa jute mutants for resistance to jute stem weevil under field condition
Five mutants of jute along with one check variety 0-9897 were evaluated for resistance to jute stem weevil. The experiments were set up at two locations BINA farm, Mymensingh and BINA sub-station farm Rangpur. The fields were exposed to natural infestation and no control measures were taken against this pest. The data on weevil infestation were taken at 120 days after sowing. The data were expressed into percentage of weevil infested plants and average number of knots per plant was calculated. All the data were analyzed statistically. Significant differences were observed among the mutants in respect to percent plant infested and number of knots/plant by weevil at both the locations and mean of locations except at Rangpur in respect to percent plant infested by weevil (Table 8 and 9). The lowest percent plant infested and the lowest number of knots/plant by weevil was recorded in the mutant 25(3) at both the locations. Mean of locations showed similar results. All the tested mutants were found to be less infested than the check variety 0-9897. However, all the mutants having less than one number of knots plant-1 were designated as resistant to jute stem weevil.
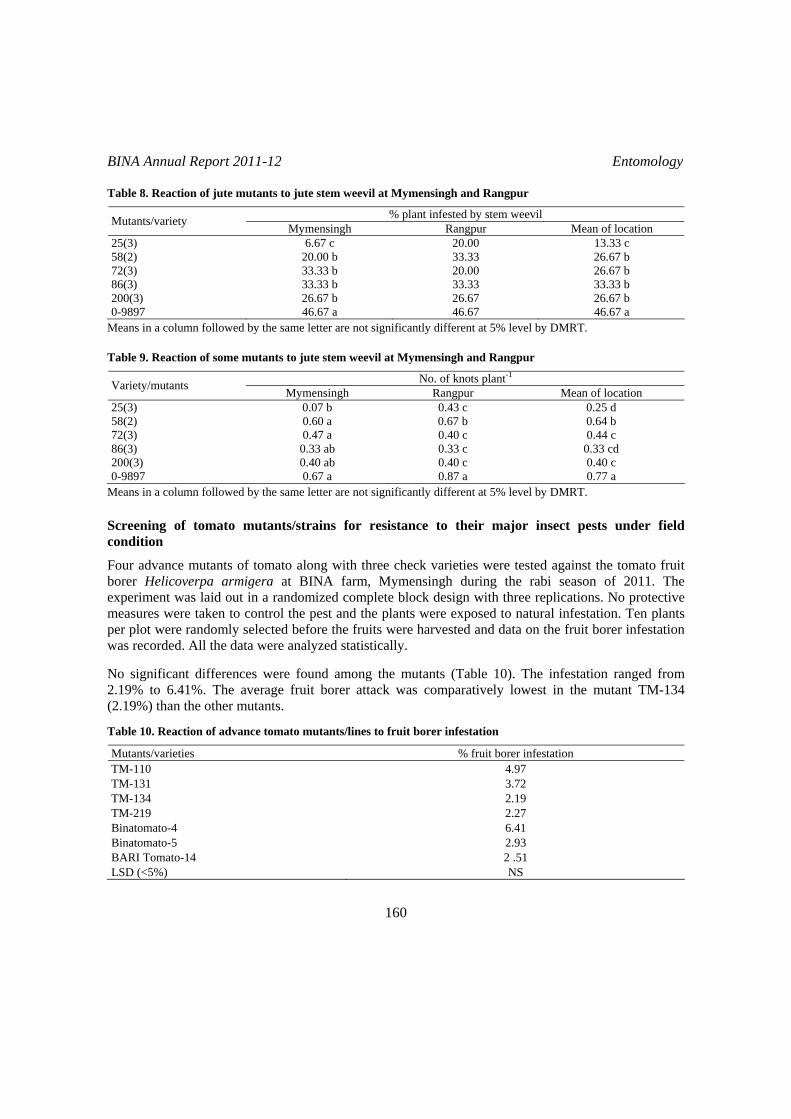
BINA Annual Report 2011-12 Entomology
160
Table 8. Reaction of jute mutants to jute stem weevil at Mymensingh and Rangpur
% plant infested by stem weevil Mutants/variety Mymensingh Rangpur Mean of location 25(3) 6.67 c 20.00 13.33 c 58(2) 20.00 b 33.33 26.67 b 72(3) 33.33 b 20.00 26.67 b 86(3) 33.33 b 33.33 33.33 b 200(3) 26.67 b 26.67 26.67 b 0-9897 46.67 a 46.67 46.67 a
Means in a column followed by the same letter are not significantly different at 5% level by DMRT. Table 9. Reaction of some mutants to jute stem weevil at Mymensingh and Rangpur
No. of knots plant-1Variety/mutants Mymensingh Rangpur Mean of location 25(3) 0.07 b 0.43 c 0.25 d 58(2) 0.60 a 0.67 b 0.64 b 72(3) 0.47 a 0.40 c 0.44 c 86(3) 0.33 ab 0.33 c 0.33 cd 200(3) 0.40 ab 0.40 c 0.40 c 0-9897 0.67 a 0.87 a 0.77 a
Means in a column followed by the same letter are not significantly different at 5% level by DMRT. Screening of tomato mutants/strains for resistance to their major insect pests under field condition
Four advance mutants of tomato along with three check varieties were tested against the tomato fruit borer Helicoverpa armigera at BINA farm, Mymensingh during the rabi season of 2011. The experiment was laid out in a randomized complete block design with three replications. No protective measures were taken to control the pest and the plants were exposed to natural infestation. Ten plants per plot were randomly selected before the fruits were harvested and data on the fruit borer infestation was recorded. All the data were analyzed statistically. No significant differences were found among the mutants (Table 10). The infestation ranged from 2.19% to 6.41%. The average fruit borer attack was comparatively lowest in the mutant TM-134 (2.19%) than the other mutants. Table 10. Reaction of advance tomato mutants/lines to fruit borer infestation
Mutants/varieties % fruit borer infestation TM-110 4.97 TM-131 3.72 TM-134 2.19 TM-219 2.27 Binatomato-4 6.41 Binatomato-5 2.93 BARI Tomato-14 2 .51 LSD (<5%) NS

BINA Annual Report 2011-12 Entomology
161
Evaluation of advanced mustard/rapeseed mutants for their resistance to major insect pests under field condition
Six mutants of mustard along with two check varieties Binasharisha-4 and Binasharisha-5 were evaluated against sawfly and aphid in the field at three locations BINA farm, Mymensingh, BINA substation farm Rangpur and Magura. The experiments were laid out in a randomized block design with three replications. The unit plot size was 4 m × 5 m. Spacing between plant to plant and row to row were 5 cm and 20 cm, respectively. The plants were exposed to natural infestation. No protective measures were taken against these pests. Number of aphids plant-1 were recorded. Percentage of plant infested by aphid and sawfly was collected from 5 randomly selected rows plot-1. Seed yield (kg ha-1) was also recorded from Mymensingh and Magura. All the data were analyzed statistically. In Mymensingh, the lowest infestation was recorded in the variety Binasharisa-4 followed by the mutant MM-211. No statistical variation was observed between this mutant and to the variety. No significant differences were observed among the tested mutants/varieties with respect to per cent plant infestation by sawfly at Rangpur, Magura and to the mean of per cent plant infestation at three locations. For the mean of percent plant infestation, the mutant and the variety with lowest infestation by sawfly was same at Mymensingh region (Table-11). Table. 11 Reaction of mustard mutants to sawfly at three locations
% plant infested by sawfly Mutants/varieties
Mymensingh Rangpur Magura Mean MM-10 41.15 a 26.83 22.96 30.31 MM-35 40.86 a 31.17 20.13 30.72 MM-37 32.77 dc 31.91 24.50 29.73 MM-210 36.05 bc 27.20 20.02 27.91 MM-211 31.62 e 28.36 21.76 27.25 MM-256 34.58 cd 28.79 21.87 28.41 Binasharisa-4 31.24 e 28.35 24.15 27.91 Binasharisa-5 38.28 b 27.48 21.08 28.95
Means in a column followed by the same letter are not significantly different at 5% level by DMRT. The infestation by aphid was very high at Magura throughout the cropping season. Significantly the lowest infestation by aphid was recorded in the mutant MM-37 at Mymensingh and Magura. Though no significant differences were observed among the mutants/varieties with respect to percent plant infested by aphid at Rangpur. Significantly lowest number of aphid was also found in the mutant MM-37 and at mean of location (Table 12 and 13). The mutant MM-37 also produced highest seed yield at Mymensingh and Magura though no significant differences were observed among the tested mutants with respect to seed yield of mustard. The conclusion of the experiment was that the mutant MM-37 may be regarded as tolerant or less susceptible to mustard aphid.

BINA Annual Report 2011-12 Entomology
162
Table 12. Reaction of mustard mutants to aphid at three locations
% plant infested by aphids Varieties/mutants
Mymensingh Rangpur Magura Mean MM-10 10.61 b 7.36 97.34 a 38.43 a MM-35 3.60 e 5.23 97.43 a 35.42 a MM-37 1.85 e 3.99 79.88 b 29.07 b MM-210 9.63 bc 7.30 95.73 a 37.55 a MM-211 8.97 bc 5.49 100.00 a 38.15 a MM-256 15.16 a 6.27 100.00 a 40.48 a Binasharisa-4 5.87 d 4.83 100.00 a 36.90 a Binasharisa-5 7.65 cd 8.86 100.00 a 38.84a
Means in a column followed by the same letter are not significantly different at 5% level by DMRT.
Table 13. Number of aphid in mustard mutants at three locations
Number of aphids plant-1Varieties/mutants
Mymensingh Rangpur Magura Mean Location
MM-10 45.4 a 9.97 c 67.80 a 41.06 MM-35 18.13 ab 24.37 a 47.53 c 30.01 MM-37 5.67 c 8.87 c 36.06 d 16.86 MM-210 13.6 bc 10.43 bc 48.13 c 24.05 MM-211 17.87 ab 22.13 ab 58.13 abc 32.71 MM-256 6.20 bc 15.53 abc 68.73 a 30.15 Binasharisa-4 21.02 ab 26.67 a 62.67 ab 36.84 Binasharisa-5 10.08 bc 15.53 abc 48.60 bc 24.98
Means in a column followed by the same letter are not significantly different at 5% level by DMRT. Table 14. Seed yield of mustard at two locations
Seed yield (kg ha-1) Varieties/mutants
Mymensingh Rangpur Mean
MM-10 1200.00 1183.33 1191.67 MM-35 1111.11 1216.67 1163.89 MM-37 1266.67 1250.00 1258.34 MM-210 1066.67 1216.67 1141.67 MM-211 1022.22 1167.67 1094.95 MM-256 1111.11 1200.00 1155.56 BINA Sharisa-4 1155.56 1167.67 1161.62 BINA Sharisa-5 1088.89 1216.67 1152.78

BINA Annual Report 2011-12 Entomology
163
Feeding response of mustard aphid Lipaphis erisimi (Kalt) on mustard mutants
Six mutants of mustard along with two check varieties Binasharisha-4 and Binasharisha-5 were evaluated against the feeding responses of mustard aphid. For this purpose honey dew, droplets excreted by the aphid were collected in a feeding chamber consisted of an inverted transparent plastic cup. Para film was stretched over the base of inverted cup. Three 5th instar nymphs previously starved for 2 hours were released into the excised twig of mustard plant. After the nymphs settled on, the twig was placed into the feeding chamber through a hole at the top of the cup. A cotton pad was then placed in the hole to prevent escape of the insect. The nymphs were allowed to feed for 24 hours. After 24 hours, the honey dew droplets were counted from the stretched Para film under binocular microscope at 6 x magnification. Thirty two feeding chamber were used for maintenance four replications for each treatment. The mutants/varieties showed significant difference in respect of excreted honeydew by aphid when feeding on mustard plant. The insect fed on the mutant MM-37 excreted lowest number of honeydew droplets followed by the mutant MM-35. No statistical variation was observed among these two mutants (Table 15). So, these two mutants may be regarded as less susceptible to aphid than other mutants/variety. Table 15. Number of droplets excreted by mustard aphid in 24 hours
Mutants/variety Mean no. of honeydew droplets MM-10 10.77 b MM-35 3.75 ef MM-37 2.00 f MM-210 8.23 bc MM-211 6.85 cd MM-256 15.79 a Binasharisha-4 5.13 de Binasharisha-5 8.52 bc
Means in a column followed by the same letter are not significantly different at 5% level by DMRT.
Evaluation of advanced sesame mutants for their resistance to hairy caterpillar and pod borer
Three mutants of sesame along with one check variety Baritil-2 were evaluated against hairy caterpillar and pod borer in the field at two locations BINA sub-station farm, Magura and Rangpur. The experiments were laid out in a randomized block design with three replications. The unit plot size was 5 m × 3 m. Spacing between plant to plant and row to row were 5 cm and 25 cm respectively. The plants were exposed to natural infestation and no protective measures against pests were taken. Data on leaf area consumed by hairy caterpillar were measured by transparent checker scale. Data on percentage of pod infested by pod borer was taken from 10 randomly selected plants plot-1 after harvest. All the data were analyzed statistically.

BINA Annual Report 2011-12 Entomology
164
Significantly the lowest leaf area consumed by hairy caterpillar was recorded in the mutant SM-10-04 followed by the mutants SM-067 and SM-058 at Rangpur and Magura. Same trend was followed in the mean of leaf area consumed by caterpillar (Table 16). So, the mutant SM-10-04 may be regarded as less susceptible to hairy caterpillar. The overall infestation by pod borer was low throughout the cropping season. The lowest per cent pod infested by pod borer was found in the mutant SM-058 at both the locations and at mean of per cent infested by pod borer (Table 16). Significant differences were observed among the mutants/variety with respect to percent pod infested by pod borer at Magura only. So, the mutant SM-058 may be regarded as less susceptible to pod borer than other mutants/variety.
Table 16. Reaction of sesame mutants/variety to hairy caterpillar and pod borer at two locations
leaf area (mm2) consumed by caterpillar % pod infested by pod borer Mutants/variety
Rangpur Magura Mean
Rangpur Magura Mean
SM-058 19.57 b 26.13 a 22.85 b 3.73 0.50 c 2.12 SM-067 16.73 b 25. 1 b 20.92 b 3.97 0.93 b 2.45 SM-10-04 15.23 b 20. 56 c 17.89 b 4.55 1.08 b 2.82 BINA Til-2 33.13 a 29.16 a 31.15 a 5.64 1.48 a 3.56
Means in a column followed by the same letter are not significantly different at 5% level by DMRT. Evaluation of advanced lines of soybean for resistance to major insect pests
Four advanced lines and one check variety of soybean were evaluated against cabbage looper hairy caterpillar and pod borer in the field at two locations, BINA sub-station farm Magura and farmer’s field, Noakhali. The experiments were laid out in a randomized complete block design with three replications Data on percent plant infested by cabbage looper was taken. Data on leaf area consumed by hairy caterpillar was measured by transparent chequer scale and percentage of pod infested by pod borer was recorded from 10 randomly selected plants per plot after harvest. The overall infestation by cabbage looper and hairy caterpillar was very high at Noakahali. Significantly the lowest percent of plant infested by cabbage looper was observed in the variety Binasoybean-1 followed by the mutant SBM-23. No statistical variation was found between this variety and the mutant at Noakhali. Mean of % plant infested by cabbage looper of locations showed similar results (Table 17). But at Magura significantly the lowest infestation by cabbage looper was recorded in the mutant SMB-22. In case of hairy caterpillar significantly lowest leaf area consumed by caterpillar was recorded in the mutant SBM-23 followed by the mutant SBM-18 and SBM-15 at Noakhali (Table 18). No statistical variation were found among these three mutants. No. significant differences were observed among the tested mutants/variety with respect to leaf area consumed at Magura and mean of locations (Table 18). No conclusion was drawn among the tested mutants against hairy caterpillar. So this experiment will be repeated next year.

BINA Annual Report 2011-12 Entomology
165
The overall infestation by pod borer was low at Noakhali and Magura (Table 19). Significantly the lowest infestation by pod borer was recorded in the mutant SBM-22 followed by the variety BINA-Soy-1, and the mutant SBM-15 at Noakhali. No significant variation was observed among the tested mutant mutants/variety with respect to percent plant infested by pod borer at Magura and mean of locations though the lowest infestation by pod borer were found in the mutant SBM-22 (Table 19). Table 17. Reaction of advanced line of Soybean to cabbage lopper
% Plant infested by cabbage lopper Variety/mutants
Noakhali Magura Mean SBM-15 92.88b 28.16 d 60.52 a SBM-18 92.46b 29.83 b 61.14 a SBM-22 100.00a 22.42 e 61.21 a SBM-23 81.07c 32.02 a 56.54 b BINA-Soy-1 79.69c 29.33 c 54.51 b
Means in a column followed by the same letter are not significantly different at 5% level by DMRT.
Table 18. Reaction of advanced line of Soybean to hairy caterpillar
Leaf area (mm2) consumed by caterpillar Variety/mutants
Noakhali Magura Mean of location SBM-15 98.83 b 65.10 81.96 SBM-18 94.43 b 64.00 79.21 SBM-22 127.50 a 50.63 83.06 SBM-23 88.23 b 79.83 82.63 BINA-Soy-1 115.56 a 49.10 82.33
Means in a column followed by the same letter are not significantly different at 5% level by DMRT.
Table. 19 Reaction of advanced lines of soybean to pod borer
% Pod infested by pod borer Variety/mutants
Noakhali Magura Mean SBM-15 2.48 bc 1.25 2.03 SBM-18 2.96 b 1.01 1.98 SBM-22 2.07 c 0.42 1.24 SBM-23 3.95 a 0.87 2.42 BINA-Soy-1 2.18 bc 0.62 1.40
Means in a column followed by the same letter are not significantly different at 5% level by DMRT.

BINA Annual Report 2011-12 Entomology
166
Evaluation of groundnut mutants for resistant to major insect pest under field condition
Nine advanced mutants along with two check varieties Dacca-1 and Zingabadam were evaluated against jassid, leaf roller and hairy caterpillar under field conditions at BINA sub-station farm, Ishurdi. The experiments were laid out in a randomized complete black design with three replications. The unit plot size was 4 m × 5 m. Seeds were sown at 15 cm distance within rows 30 cm apart on 1st week of December, 2011, respectively. The plants were exposed to natural infestation and no protective measure was taken against any insect pests. Data on percent plant infested by leaf roller was collected from 5 randomly selected plants per row and leaf area consumed by hairy caterpillar was measured by transparent check scale. Data on no. of jassid/cage was recorded. All data were analyzed statistically. Table 20. Reaction of groundnut mutants to jassid leaf roller and hairy caterpillar at Ishurdi
Mutants/varieties Number of jassids/case
% Leaf infested by leaf roller
Leaf area (mm2) consumed by hairy caterpillar
D1/20/17-1 0.60 4.87d 23.90b GC(1)-4-1 1.01 19.23 a 20.97 bcd GC(1)24-1-1-1 1.22 6.83 cd 10.20 f GC(1) 32-1-1-1 1.22 10.77 bc 17.27 cde GC(1) 32-2-1-1 0.93 4.86 d 15.73 de GC(1) 32-3-2-1-1 1.22 12.45 b 21.43 bc GC(1)35-1-1 0.88 12.20 b 16.83 cde PK-1 0.89 5.85 d 16.25 cde RS/25/3-1 0.44 2.26 e 15.23 e Dacca-1 1.22 7.07 cd 16.33 cde Zingabadam 0.55 19.07 a 31.10 a
Means in a column followed by the same letter are not significantly different at 5% level by DMRT. The infestation by jassid was very low throughout the cropping season. The lowest number of jassids per case was recorded in the mutant RS/25/3-1 though no significant differences were observed among the mutants/varieties with respect to no. of jassids/case (Table 20). The lowest infestation by leaf roller was also observed in the mutant RS/25/3-1. Significant differences were found among the tested mutants/varieties with respect to percent leaf infested by leaf roller. All the mutants except the mutant GC-(1)4-1 showed lower infested by leaf roller than the check varieties. On the other hand significantly the lowest infestation by hairy caterpillar was recorded in the mutant GC(1)24-1-1-1 (Table 20). Followed by the mutants/variety GC(1) 32-2-1-1, PK-1, Dacca-1 and GC(1) 35-1. All the tested mutants were lower infestation by hairy caterpillar than the check variety Zingabadam. It was concluded that the mutant RS/25/3-1 may be regarded as less susceptible against jassid and leaf roller.

PLANT PATHOLOGY DIVISION

BINA Annual Report 2011-12 Plant Pathology
168

BINA Annual Report 2011-12 Plant Pathology
RESEARCH HIGHLIGHTS
Among the 12 mutants and advanced lines of rice tested 3 and 5 were found to be moderately resistant to sheath blight and bacterial leaf blight, respectively during Aman season. However, the mutants RM-200(c)-1-9 and RM-200(c)-1-10 showed moderately resistant reaction to bacterial leaf blight during Boro season The organic amendments and biopesticides reduced sheath blight severity and increased grain yield significantly, but foliar fungicide Tilt showed the best performance for reducing the severities of sheath blight of boro rice (cv. Iratom-24) and increased grain yield (more than 40%) over control. Thirty two advanced mutants of lentil were evaluated against stemphylium blight. Twenty four mutants were found to be tolerant to Stemphylium blight. Twenty six mutants/varities were found to be tolerant to root rot under field condition. Three chickpea genotypes were evaluated against root rot and botrytis gray mold. All the mutants were found to be susceptible to root rot and tolerant to botrytis gray mold under field condition. Two promising lines of mungbean were assessed for their resistance to yellow mosaic and Cercospora leaf spot. All the lines/varieties were found moderately resistant to tolerant against yellow mosaic and Cercospora leaf spot. An isolate of Trichoderma was evaluated to control root rot of lentil and sheath blight of rice using seed and soil treated method. The result reveled that the soil treatment using Trichoderma is the best method to control root rot of lentil and sheath blight of rice. A promising mutant TM-110 of tomato was evaluated against fusarium wilt, late blight and yellow mosaic. The mutant TM-110 showed moderately resistant to fusarium wilt in Rangpur and Magura but susceptible in Mymensingh. The mutant showed tolerant to late blight. The genotype CLN-2777B showed moderately resistant to Fusarium wilt and tolerant to late blight. An experiment was conducted to manage Fusarium wilt of tomato and it was observed that the integrated application of Trichoderma (soil treated), MOC and Provax (seed treated) showed lowest disease incidence. Thirteen mutants were evaluated against purple blotch of onion. Six mutants BP2/75/2, BP2/75/3, BP2/75/5, BP2/75/11, BP2/100/12 and BP2/125/1 showed tolerant to the disease. Two promising mutants viz. D1/20/17-1 and RS/20/3-1 of groundnut exhibited tolerant reaction to collar rot, susceptible to rust and highly susceptible to Cercospora leaf spot at Ishurdi. Among the eleven mutants of groundnut tested GC(1)-4-1 and GC(1)-3-2 were moderately resistant to Cercospora leaf spot, 5 mutants were moderately resistant and 6 mutants were tolerant to rust and 9 were tolerant to collar rot at Ishurdi.
169

BINA Annual Report 2011-12 Plant Pathology
Amongst 6 promising mutants of rapeseed, all were graded as tolerant to Alternaria blight at Mymensingh, Magura and Rangpur. Seven promising mutants of soybean were tested against brown leaf spot and rust at Mymensingh and Magura and farmer’s field of Noakhali. All the mutants showed moderately resistant reaction to brown leaf spot at all the locations. All the mutants showed moderately resistant at Mymensingh and 4 mutants were moderately resistant and 3 were tolerant to rust at Mymensingh and Noakhali. Seven mutants showed moderately resistant at Mymensingh while at Noakhali 4 mutants showed moderately resistant reaction and 3 showed tolerant reaction to rust. The integrated use of Antacol (2g kg-1 seed), or Dithane M-45 (4g kg-1 seed) as seed treatment, Trichoderma sp (30 g m-1 long row) and mustard oil cake (200 kg ha-1) significantly decreased the incidence and severity of collar rot and brown leaf spot and increased seed yield of soybean.
170

BINA Annual Report 2011-12 Plant Pathology
Screening and evaluation of breeding materials against major diseases
Evaluation of some promising germplasms of rice for bacterial leaf blight and sheath blight during aman season
Eleven promising germplasms along with three check varieties and one susceptible check variety of rice were assessed for bacterial leaf blight (BLB) (Xanthomonas oryzae pv. oryzae) and sheath blight (ShB) (Rhizoctonia solani) resistance during aman season of 2011 under inoculated field condition. The experiment was conducted in a randomized block design with three replications at BINA farm, Mymensingh. The unit plot size was 3 m × 2 m. The spacing between lines and hills were 25 cm and 15 cm, respectively. The seedlings were transplanted on 25 August 2011. The fertilizers were applied as per recommended doses. Ten hills in each plot were inoculated at the booting stage with the culture of X. oryae pv. oryzae by clipping method. For sheath blight, ten hills were inoculated in each plot with R. solani at booting stage of plant growth. Plants were assessed for BLB and ShB severity after two and three weeks of inoculation, respectively following the indices developed at IRRI. Mean BLB incidence and severity ranged from 26.3-90.0% and 2.7-6.2, respectively (Table 1). Five mutants/advanced line and 2 check varieties were found to be moderately resistant and others were moderately susceptible to BLB. Mean sheath blight severity ranged from 2.8 to 7.5. Three mutants and Binadhan-4 were recorded as moderately resistant to ShB and others were moderately susceptible to susceptible. Grain yield ranged from 335.8 to 660.3 g m-2. Table 1. Mean incidences and severities of sheath blight and bacterial leaf blight and grain yield of some
mutants of rice during aman season of 2011 at Mymensingh
Bacterial leaf blight Sheath blight Mutant/variety Incidence (%) Severity DR Incidence (%) Severity DR
Grain yield (g m-2)
RM-200(c) -1-1 66.7cd 2.7 MR 86.7cd 5.3 MS 481.3ghi RM-200(c) -1-3 53.3ef 2.9 MR 80.0de 3.4 MR 541.3efg RM-200(c) -1-9 66.7cd 3.1 MR 80.0de 3.1 MR 543.2efg RM-200(c) -1-10 53.3ef 2.8 MR 90.0bc 4.2 MS 494.1fghi RM-200(c) -1-13 70.0c 4.0 MS 80.0de 2.9 MR 579.2bcde RM-200(c) -1-17 66.7cd 4.0 MS 80.0de 4.6 MS 559.3def RM-200(c) -1-18 63.3cde 3.6 MS 80.0de 5.1 MS 558.5def RC-43-2-5-3-3 85.0ab 5.2 MS 90.0bc 5.8 S 617.7abcd RM-250-112 60.0de 4.0 MS 86.7cd 4.0 MS 660.3a BINA Aroma-9 63.3cde 4.2 MS 96.7ab 6.3 S 432.2hi IR-50 (48) 50.0f 3.6 MS 100.0a 6.7 S 652.7ab BINA Aroma-5 61.7cde 3.2 MR 93.3abc 5.2 MS 641.8ab BINA Aroma-8 60.0de 5.4 MS 100.0a 5.9 S 504.7fgh Binadhan-4 53.3cde 3.0 MR 76.7e 2.8 MR 528.0efg Binadhan-7 63.3cde 4.4 MS 90.0bc 5.8 S 590.5abcde BRRI dhan32 90.0a 5.3 MS 66.7f 3.7 MR 566.9cdef Shorna 40.0g 3.3 MR 90.0bc 3.7 MS 635.5abc Kalozira 26.7h 3.5 MS 63.3f 4.2 MS 335.8j TN-1 80.0b 6.2 S 96.7ab 7.5 HS 424.8i Note: DR = Disease reaction, MS = Moderately susceptible, S = Susceptible and HS = Highly susceptible
171

BINA Annual Report 2011-12 Plant Pathology
Evaluation of some promising mutants of rice for sheath blight and bacterial leaf blight during boro season
Three promising germplasms along with 4 check varieties of rice were assessed for bacterial leaf blight (BLB) and sheath blight (ShB) resistance during boro season of 2011-12 under inoculated field condition. The experiments were conducted in a randomized block design with three replications at BINA farm, Mymensingh. The unit plot size was 3 m × 2 m. The spacing between lines and hills were 25 cm and 15 cm, respectively. The seedlings were transplanted on 31 January 2012. The fertilizers were applied at recommended doses. The method of inoculation and assessment of the disease were similar to the previous experiment of rice. Mean bacterial leaf blight severity ranged from 2.9 to 6.5 (Table 2). Mutants RM-200(c)-1-9 and RM-200(c)-1-10 and 2 check varieties were found to be moderately resistant to BLB. Mean sheath blight severity ranged from 2.6 to 6.9. The mutant RM-200-1-10 showed moderately susceptible reaction to ShB. Grain yield ranged from 412 to 766.7 g m-2 was obtained. Table 2. Mean incidences and severities of sheath blight and bacterial leaf blight and grain yield of some
mutants of rice during boro season of 2011-12 at Mymensingh
Bacterial leaf blight Sheath blight Mutant/variety Incidence (%) Severity DR Incidence (%) Severity DR
Grain yield (g m-2)
RM-200(c)-1-9 80.0 2.9 MR 100.0 6.0 S 594.5 RM-200(c)-1-10 56.7 3.0 MR 93.3 5.1 MS 621.5 RM-200(c)-1-17 63.3 4.2 MS 100.0 5.7 S 649.7 Iratom-24 66.7 4.6 MS 90.0 6.0 S 664.5 Binadhan-5 63.3 3.3 MR 90.0 3.1 MR 645.7 Binadhan-6 80.0 3.3 MR 83.3 2.6 MR 766.7 TN-1 93.3 6.5 S 100.0 6.9 S 412.0 LSD0.05 21.3 0.89 9.64 0.73 45.9
Note: DR = Disease reaction, MR = Moderately resistant, MS = Moderately susceptible and S = Susceptible Field evaluation of induced mutants of soybean for resistance to brown leaf spot and rust
Seven mutants of M7 generation along with three check varieties viz. Binasoybean-1, Binasoybean-2 and BARI soybean-5 were tested against brown leaf spot and rust under field condition. The experiments were conducted in a randomized complete block design with three replications at BINA farm, Mymensingh, farmer’s field, Noakhali and BINA sub-station farm, Magura during January to May 2012. The unit plot size was 3.0 m × 1.0 m each. The fertilizers were applied at recommended doses. No fungicide was used in order to ensure natural incidence of the diseases. With the appearance of visible symptoms observation on disease parameters was made at harvesting stage. Mutants/ varieties were graded as resistant and susceptible following (1-9) indexing scale for brown leaf spot and (0-9) for rust. The mean disease incidence of brown leaf spot differed among the tested materials of soybean at Mymensingh, Noakhali and Magura (Table 3). However, the least disease incidence was exhibited in
172
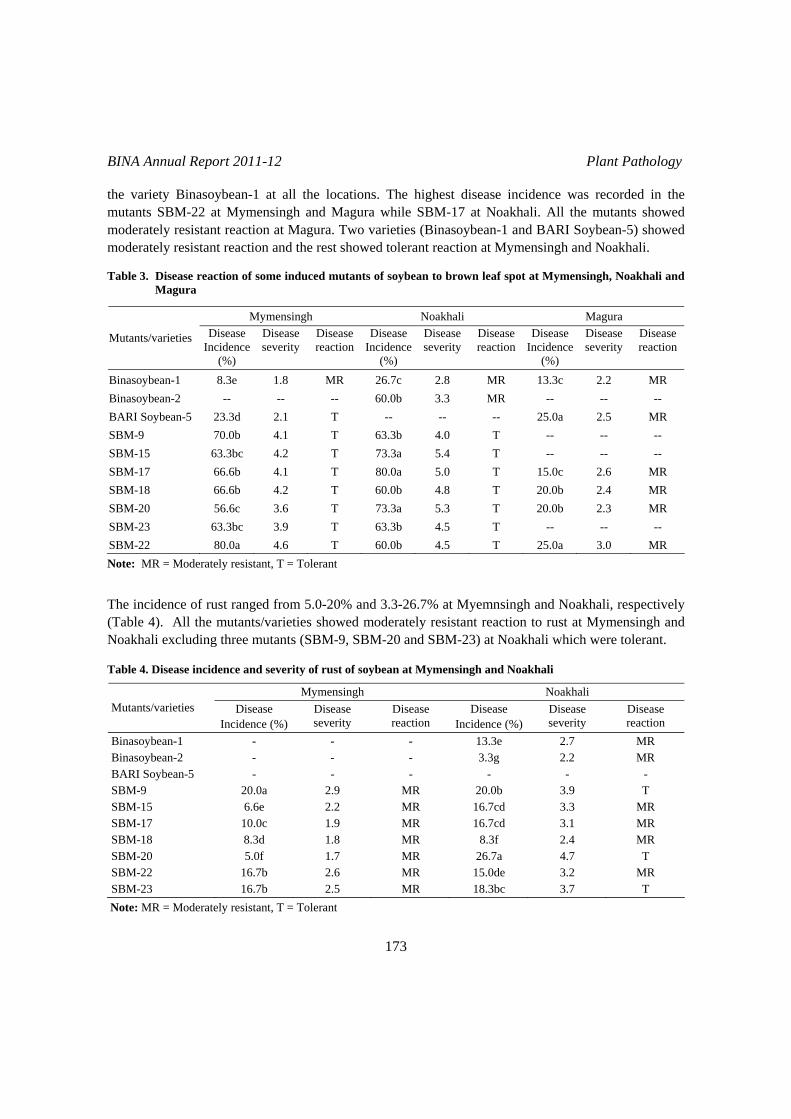
BINA Annual Report 2011-12 Plant Pathology
the variety Binasoybean-1 at all the locations. The highest disease incidence was recorded in the mutants SBM-22 at Mymensingh and Magura while SBM-17 at Noakhali. All the mutants showed moderately resistant reaction at Magura. Two varieties (Binasoybean-1 and BARI Soybean-5) showed moderately resistant reaction and the rest showed tolerant reaction at Mymensingh and Noakhali. Table 3. Disease reaction of some induced mutants of soybean to brown leaf spot at Mymensingh, Noakhali and
Magura
Mymensingh Noakhali Magura
Mutants/varieties Disease Incidence
(%)
Disease severity
Disease reaction
Disease Incidence
(%)
Disease severity
Disease reaction
Disease Incidence
(%)
Disease severity
Disease reaction
Binasoybean-1 8.3e 1.8 MR 26.7c 2.8 MR 13.3c 2.2 MR Binasoybean-2 -- -- -- 60.0b 3.3 MR -- -- -- BARI Soybean-5 23.3d 2.1 T -- -- -- 25.0a 2.5 MR SBM-9 70.0b 4.1 T 63.3b 4.0 T -- -- -- SBM-15 63.3bc 4.2 T 73.3a 5.4 T -- -- -- SBM-17 66.6b 4.1 T 80.0a 5.0 T 15.0c 2.6 MR SBM-18 66.6b 4.2 T 60.0b 4.8 T 20.0b 2.4 MR SBM-20 56.6c 3.6 T 73.3a 5.3 T 20.0b 2.3 MR SBM-23 63.3bc 3.9 T 63.3b 4.5 T -- -- -- SBM-22 80.0a 4.6 T 60.0b 4.5 T 25.0a 3.0 MR Note: MR = Moderately resistant, T = Tolerant
The incidence of rust ranged from 5.0-20% and 3.3-26.7% at Myemnsingh and Noakhali, respectively (Table 4). All the mutants/varieties showed moderately resistant reaction to rust at Mymensingh and Noakhali excluding three mutants (SBM-9, SBM-20 and SBM-23) at Noakhali which were tolerant. Table 4. Disease incidence and severity of rust of soybean at Mymensingh and Noakhali
Mymensingh Noakhali Mutants/varieties Disease
Incidence (%) Disease severity
Disease reaction
Disease Incidence (%)
Disease severity
Disease reaction
Binasoybean-1 - - - 13.3e 2.7 MR Binasoybean-2 - - - 3.3g 2.2 MR BARI Soybean-5 - - - - - - SBM-9 20.0a 2.9 MR 20.0b 3.9 T SBM-15 6.6e 2.2 MR 16.7cd 3.3 MR SBM-17 10.0c 1.9 MR 16.7cd 3.1 MR SBM-18 8.3d 1.8 MR 8.3f 2.4 MR SBM-20 5.0f 1.7 MR 26.7a 4.7 T SBM-22 16.7b 2.6 MR 15.0de 3.2 MR SBM-23 16.7b 2.5 MR 18.3bc 3.7 T
Note: MR = Moderately resistant, T = Tolerant
173

BINA Annual Report 2011-12 Plant Pathology
Field evaluation of M8 mutants of soybean against brown leaf spot and rust
Three mutants of M8 generation along with 2 check varieties Binasoybean-1 and BARI soybean-6 were tested against brown leaf spot and rust under natural epipytotic field condition. The unit plot size was 5 m × 4 m each. The experiments were conducted in a randomized complete block design with three replications at BINA farm, Mymensingh, BINA sub-station farms, Rangpur and Magura from January to May 2012. The procedure of sowing and assessment of diseases were similar to the previous experiment of soybean. The incidence of brown leaf spot ranged from 6.7-38.3% in Mymensingh, 2.0-2.2 in Rangpur and 2.0-46.7 in Magura (Table 5). The least disease incidence was recorded in the mutant AVRDC-73 and the highest was recorded in the mutant AVRDC-70 followed by AVRDC-78 at Mymensingh and Magura. The mutants/varieties developed slight disease incidence (2.0-2.2) and severity (1.9-2.3) at Rangpur. All the mutants/varieties showed moderately resistant reaction to the disease at all the locations. Table 5. Disease reaction of soybean mutants and varieties to brown leaf spot during 2011-12 at Mymensingh,
Rangpur and Magura
Mymensingh Rangpur Magura
Mutants/varieties Disease Incidence
(%)
Disease severity
Disease reaction
Disease Incidence
(%)
Disease severity
Disease reaction
Disease Incidence
(%)
Disease severity
Disease reaction
AVRDC-73 6.7 1.8 MR 2.2 1.9 MR 20.0 2.4 MR Binasoybean-1 20.0 2.5 MR 2.0 2.0 MR 20.0 2.7 MR BARI Soyban-6 26.7 2.6 MR -- -- -- 26.7 2.6 MR AVRDC-78 36.7 3.4 MR 2.0 2.0 MR 26.7 2.7 MR AVRDC-70 38.3 3.0 MR 2.0 2.3 MR 46.7 3.4 MR LSD 0.01 3.4 -- -- -- -- -- 4.7 -- --
Note: MR = Moderately resistant Disease incidence of rust ranged from 0.0-13.3% and 2.02-2.3% at Mymensingh and Rangpur, respectively. The mutant AVRDC-73 was graded as resistant having no infection caused by rust under natural field condition at Mymensingh (Table 6). All the mutants/varieties showed moderately resistant reaction at both the locations excluding AVRDC-73 at Mymensingh. Table 6. Disease reaction of soybean mutants and varieties to rust during 2011-12 at Mymensingh and Rangpur
Mymensingh Rangpur Mutants/varieties Disease
Incidence (%) Disease severity
Disease reaction
Disease Incidence (%)
Disease severity
Disease reaction
AVRDC-70 10.0 2.2 MR 2.3 2.6 MR AVRDC-73 0.0 0.0 R 2.0 2.1 MR AVRDC-78 13.3 2.8 MR 2.3 2.2 MR Binasoybean-1 6.7 1.9 MR 2.3 2.3 MR BARI Soyban-6 10.0 2.3 MR - - - LSD 0.05 2.6 0.52 -- 0.36
Note: R = Resistant, MR = Moderately resistant
174

BINA Annual Report 2011-12 Plant Pathology
Screening of M7 mutants/varieties of groundnut against collar rot, cercospora leaf spot and rust
Two mutants along with two check varieties of groundnut were screened against collar rot, cercospora leaf spot and rust under epiphytotic condition at BINA sub-station farm, Ishurdi. The experiments were conducted in a randomized block design with three replications in collaboration with Plant Breeding Division. The unit plot size was 4.0 m × 3.0 m. Spacing between rows and plants were 30 cm and 15 cm, respectively. Seeds were sown on 11 October 2011. Recommended cultural practices were done. The mutants were categorized for their resistance on the basis of rating scale (1-9) developed by ICRISAT for the diseases. Both the mutants and a check variety were tolerant to collar rot (Table 7). In case of cercospora leaf spot, all the mutants/varieties were highly susceptible. For rust, the mutants were susceptible and test varieties were moderately susceptible. Table 7. Disease reaction of some mutants/varieties of groundnut to collar rot, cercospora leaf spot and rust
under epiphytotic conditions at Ishurdi during 2011-12
Collar rot Cercospora leaf spot Rust Mutants/varieties Mean mortality
(%) Disease reaction
Disease severity (1-9)
Disease reaction
Disease severity (1-9)
Disease reaction
D1/20/17-1 18.3 T 8.8 HS 5.8 S RS/25/3-1 19.6 T 8.6 HS 5.6 S Dacca-1 18.0 T 9.0 HS 5.3 MS PK-1 21.9 MS 8.0 HS 4.9 MS LSD 0.05 2.79 0.47 0.21
Note: T = Tolerant MS = Moderately susceptible, S = Susceptible, HS = Highly susceptible
Field evaluation of advance lines/varieties of groundnut against collar rot, cercospora leaf spot and rust under field conditions
Eleven mutants along with two check varieties Dacca-1 and Zingabadam of groundnut were evaluated for their resistance to collar rot, cercospora leaf spot and rust under field conditions at Ishurdi during 2011-12. The experiments were set up in a randomized block design with three replications in collaboration with Plant Breeding Division. The unit plot size was 2.10 m × 1.05 m. Spacing between rows and plants within rows were 30 cm and 15 cm, respectively. Seeds were sown on 11 October 2011. Recommended cultural practices were done. The mutants were categorized for their resistance on the basis of rating scale (1-9) developed by ICRISAT. All the mutants and check varieties were tolerant and other ones were moderately susceptible to collar rot (Table 8). Two mutants GC(1)-32-3-1-2, GC(1)-4-1 and GC(1)-35-1-1 were graded as tolerant and rest of the mutants and check varieties were susceptible to highly susceptible to cercospora leaf spot. In case of rust, four mutants and one check variety were moderately resistant and rest of the mutants and check varieties were tolerant.
175
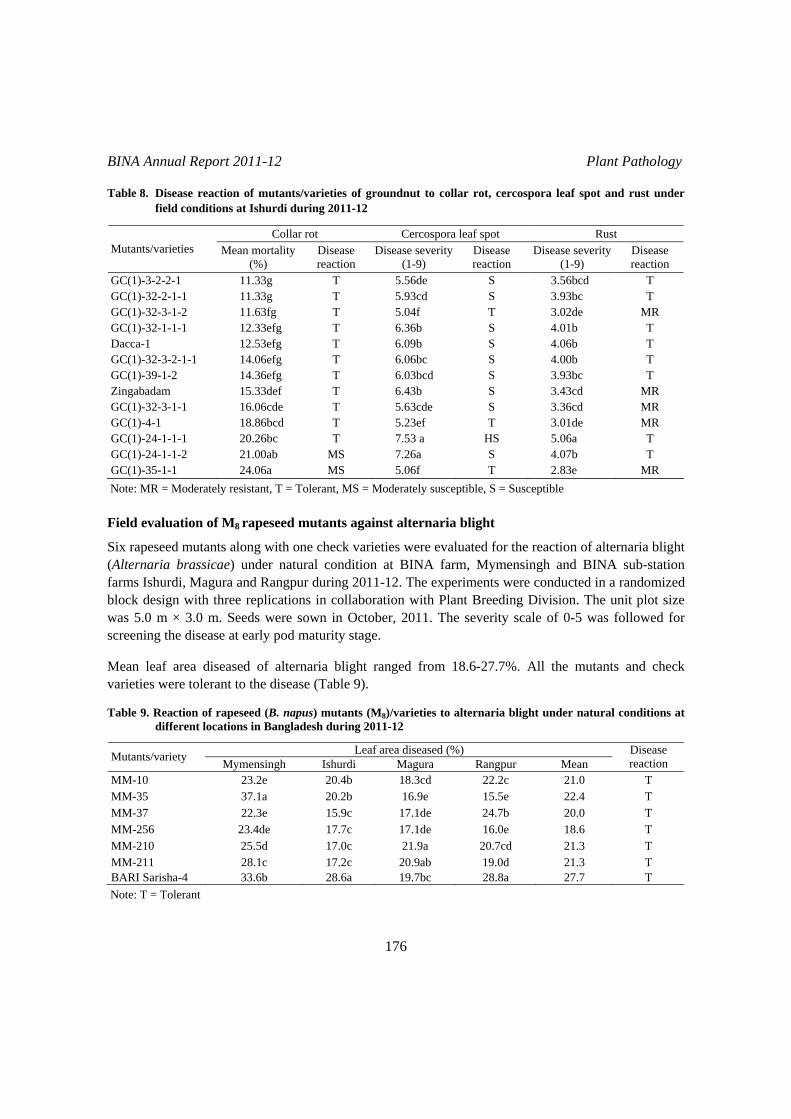
BINA Annual Report 2011-12 Plant Pathology
Table 8. Disease reaction of mutants/varieties of groundnut to collar rot, cercospora leaf spot and rust under field conditions at Ishurdi during 2011-12
Collar rot Cercospora leaf spot Rust Mutants/varieties Mean mortality
(%) Disease reaction
Disease severity (1-9)
Disease reaction
Disease severity (1-9)
Disease reaction
GC(1)-3-2-2-1 11.33g T 5.56de S 3.56bcd T GC(1)-32-2-1-1 11.33g T 5.93cd S 3.93bc T GC(1)-32-3-1-2 11.63fg T 5.04f T 3.02de MR GC(1)-32-1-1-1 12.33efg T 6.36b S 4.01b T Dacca-1 12.53efg T 6.09b S 4.06b T GC(1)-32-3-2-1-1 14.06efg T 6.06bc S 4.00b T GC(1)-39-1-2 14.36efg T 6.03bcd S 3.93bc T Zingabadam 15.33def T 6.43b S 3.43cd MR GC(1)-32-3-1-1 16.06cde T 5.63cde S 3.36cd MR GC(1)-4-1 18.86bcd T 5.23ef T 3.01de MR GC(1)-24-1-1-1 20.26bc T 7.53 a HS 5.06a T GC(1)-24-1-1-2 21.00ab MS 7.26a S 4.07b T GC(1)-35-1-1 24.06a MS 5.06f T 2.83e MR
Note: MR = Moderately resistant, T = Tolerant, MS = Moderately susceptible, S = Susceptible Field evaluation of M8 rapeseed mutants against alternaria blight
Six rapeseed mutants along with one check varieties were evaluated for the reaction of alternaria blight (Alternaria brassicae) under natural condition at BINA farm, Mymensingh and BINA sub-station farms Ishurdi, Magura and Rangpur during 2011-12. The experiments were conducted in a randomized block design with three replications in collaboration with Plant Breeding Division. The unit plot size was 5.0 m × 3.0 m. Seeds were sown in October, 2011. The severity scale of 0-5 was followed for screening the disease at early pod maturity stage. Mean leaf area diseased of alternaria blight ranged from 18.6-27.7%. All the mutants and check varieties were tolerant to the disease (Table 9). Table 9. Reaction of rapeseed (B. napus) mutants (M8)/varieties to alternaria blight under natural conditions at
different locations in Bangladesh during 2011-12
Leaf area diseased (%) Mutants/variety Mymensingh Ishurdi Magura Rangpur Mean Disease reaction
MM-10 23.2e 20.4b 18.3cd 22.2c 21.0 T MM-35 37.1a 20.2b 16.9e 15.5e 22.4 T MM-37 22.3e 15.9c 17.1de 24.7b 20.0 T MM-256 23.4de 17.7c 17.1de 16.0e 18.6 T MM-210 25.5d 17.0c 21.9a 20.7cd 21.3 T MM-211 28.1c 17.2c 20.9ab 19.0d 21.3 T BARI Sarisha-4 33.6b 28.6a 19.7bc 28.8a 27.7 T
Note: T = Tolerant
176

BINA Annual Report 2011-12 Plant Pathology
Evaluation of a promising mutant of winter tomato against Fusarium wilt, late blight and yellow mosaic virus
One promising mutant (TM-110) and two check varieties (BARI Tomato-5 and BARI Tomato-13) of tomato were evaluated against fusarium wilt (Fusarium oxysporum f. sp. lycopersici), late blight (Phytophthora infestans) and yellow mosaic (Yellow Mosaic Virus) under natural field conditions. The experiments were conducted during winter of 2011-12 at BINA farm, Mymensingh and BINA sub-station farms Rangpur, Magura and Ishurdi in collaboration with Plant Breeding Division. Experiments were done in randomized complete block design with three replications. Unit plot size was 4 m × 5 m. The disease incidence and severity was recorded at 55 and 75 days after transplanting. Disease incidence of fusarium wilt ranged from 11.3-22.1% (Table 10). The mutant (TM-110) and the two check varieties showed moderately resistant reaction to fusarium wilt in Rangpur and Magura. In Mymensingh, the mutant (TM-110) and BARI Tomato-13 showed susceptible reaction while BARI Tomato-5 showed moderately resistant reaction to fusarium wilt. For late blight disease, there was 100% disease incidence in Mymensingh and Rangpur (Table 11). The mutant (TM-110) as well as the check varieties showed tolerant reaction to late blight. The yellow mosaic virus incidence ranged from 45.7-60.3% (Table 12). Late blight and yellow mosaic virus were not observed in Magura. Table 10. Reaction of a promising mutant of winter tomato to fusarium wilt in 2001-12
Mymensingh Rangpur Magura Mutant/varieties Disease
incidence (%) Disease
reaction (0-5)Disease
incidence (%)Disease
reaction (0-5)Disease
incidence (%) Disease
reaction (0-5)TM-110 22.1 S 12.0 MR 14.5 MR BARI Tomato-5 15.8 MR 12.1 MR 16.1 MR BARI Tomato-13 21.1 S 15.1 MR 11.3 MR
Note: MR = Moderately resistant S = Susceptible
Table 11. Reaction of a promising mutant of winter tomato to late blight in 2011-12
Mymensingh Rangpur Mutant/varieties Disease
incidence (%) Disease
severity (0-6)Disease reaction
Disease incidence (%)
Disease severity (0-6)
Disease reaction
TM-110 100 3.0 T 100 3.0 T BARI Tomato-5 100 3.0 T 100 3.0 T BARI Tomato-13 100 3.0 T 100 3.0 T
Note : T = Tolerant
Table 12. Mean incidence of a promising mutant of winter tomato to yellow mosaic virus in 2011-12
Disease incidence (%) Mutant/varieties Mymensingh Rangpur
TM-110 56.1 53.2 BARI Tomato-5 58.2 50.0 BARI Tomato-13 45.7 60.3
177

BINA Annual Report 2011-12 Plant Pathology
Screening of five genotypes of tomato against fusarium wilt, late blight and yellow mosaic during the winter season of 2011-12
Five genotypes (CLN-2777B, CLN-2777G, CLN-2777H, D6-12 and D6-18) along with two check varieties (Binatomato-6 and Binatomato-7) of tomato were evaluated against fusarium wilt (Fusarium oxysporum), late blight (Phytophthora infestans) and yellow mosaic (Yellow Mosaic Virus) under field condition. The experiments were conducted in BINA farm, Mymensingh during winter season of 2011-12 in collaboration with Plant Physiology Division. The experiment was laid out in randomized complete block design with three replications. Unit plot size was 5 m × 3 m. Seedlings were transplanted on 14 November, 2011. Disease incidence was recorded at 55 and 75 days after transplanting. The genotype CLN-2777B and the two check varieties (Binatomato-6 and Binatomato-7) showed moderately resistant reaction while the rest four genotypes showed susceptible reaction to fusarium wilt. All genotypes and the check varieties except D6-12 and the check varieties showed tolerant reaction to late blight disease (Table 13). The yellow mosaic disease incidence ranged from 0-52.28% where the genotype D6-18 had the highest incidence. Table 13. Disease reaction of five genotypes of tomato to fusarium wilt, late blight and yellow mosaic during
winter season of 2011-12 at Mymensingh
Fusarium wilt Late blight Genotypes/varieties Disease
incidence (%) Disease reaction
Disease incidence (%)
Disease severity (0-6)
Disease reaction
Yellow mosaic incidence
(%)
CLN-2777B 16.3 MR 100 3 T 0.0 CLN-2777G 30.3 S 100 3 T 33.8 CLN-2777H 21.0 S 100 3 T 40.0 D6-12 22.2 S 100 4 S 0.0 D6-18 25.1 S 100 3 T 52.2 Binatomato-6 15.1 MR 100 3 T 30.0 Binatomato-7 14.2 MR 100 3 T 41.1
Note: MR = Moderately resistant, T = Tolerant, S = Susceptible
Field screening of thirteen mutants of onion against purple blotch disease
Thirteen mutants along with two check varieties (BARI Piaj-2 and BARI Piaj-3) were evaluated against purple blotch (Alternaria porri) under natural field condition during winter season of 2011-12. The experiments were conducted at BINA farm, Mymensingh and BINA sub-station farm, Rangpur in collaboration with Plant Breeding Division. Experiments were conducted in randomized complete block design with three replications. Unit plot size was 2 m × 6 m. Seeds were sown on 26 October and transplanting was done on 8 December, 2011. The disease severity was assessed following (0-5) scale (Sharma, 1986).
178

BINA Annual Report 2011-12 Plant Pathology
Six mutants (BP2/75/2, BP2/75/3, BP2/75/5, BP2/75/11, BP2/100/12 and BP2/125/1) showed tolerant reaction to purple blotch in both Mymensingh and Rangpur (Table 14). The mutants BP2/75/13, BP2/100/1 and BP2/100/5 and the two check varieties (BARI Piaj-2 and BARI Piaj-3) showed susceptible reaction in Mymensingh while these showed tolerant reaction in Rangpur. The mutants BP2/75/6, BP2/75/12, BP2/100/2 and BP2/125/5 showed susceptible reaction in both locations. Table 14. Disease reaction of thirteen mutants of onion to purple blotch in Mymensingh and Rangpur during
winter season of 2011-12
Mymensingh Rangpur Mutants/varieties Disease severity
(0-5) Disease reaction
Disease severity (0-5)
Disease reaction
BP2/75/2 3 T 3 T BP2/75/3 3 T 3 T BP2/75/5 3 T 3 T BP2/75/6 4 S 4 S BP2/75/11 3 T 3 T BP2/75/12 4 S 4 S BP2/75/13 4 S 3 T BP2/100/1 4 S 3 T BP2/100/2 4 S 4 S BP2/100/5 4 S 3 T BP2/100/12 3 T 3 T BP2/125/1 3 T 3 T BP2/125/5 4 S 4 S BARI Piaj-2 4 S 3 T BARI Piaj-3 4 S 3 T
Note: T = Tolerant, S = Susceptible
Evaluation of lentil mutants against Stemphylium blight and root rot
Thirty two advanced mutants along with one check variety of lentil were evaluated against root rot (Fusarium sp.) and Stemphylium blight (Stemphylium sarciniformis) at BINA sub-station farms Ishurdi and Magura during the winter season of 2011-12 under field condition in collaboration with Plant Breeding Division. The experiments were conducted in randomized complete block design with three replications. The seeds were sown in rows on early November, 2011. Distance between rows and seed were 30 cm and 5-6 cm, respectively. The mean severities of Stemphylium blight and root rot ranged from 3-4 and 5-7, respectively. The mutants LM-21-1, LM-101-8, LM-48-1, LM-24-3, LM-14-2, LM-75-4, LM-185-2, LM-132-7, LM-156-1, LM-28-2, LM-67-7, LM-123-7, LM-99-4, LM-15-9, LM-13-1, LM-20-3, ICA-23128, ICA-23105, ICA-23211, ICA-23136, IVA-23126, ICA-23118, SL-129, SL-110, SL-137, BARI masur-4 were found tolerant and the rest were susceptible to root rot (Table 15). The mutants LM-21-1,
179

BINA Annual Report 2011-12 Plant Pathology
LM-24-3, LM-14-2, LM-185-2, LM-156-1, LM-28-2, LM-67-7, LM-123-7, LM-99-4, LM-15-9, LM-13-1, LM-20-3, LM-37-8, LM-93-3, ICA-23128, ICA-23105, ICA-23211, ICA-23136, IVA-23126, ICA-23118, SL-129, SL-107, SL-30 and SL-137 were found tolerant and the rest were susceptible to Stemphylium blight (Table 16). Table 15. Severity of root rot on some mutants of lentil at Magura and Ishurdi
Mutants/varieties Severity
(1-9) Disease reaction
LM-21-1, LM-101-8, LM-48-1, LM-24-3, LM-14-2, LM-75-4, LM-185-2, LM-132-7, LM-156-1, LM-28-2, LM-67-7, LM-123-7, LM-99-4, LM-15-9, LM-13-1, LM-20-3, ICA-23128, ICA-23105, ICA-23211, ICA-23136,IVA-23126, ICA-23118, SL-129, SL-110, SL-137, BARI masur-4
5 Tolerant
LM-93-3, LM-37-8, SL-9, ICA-23121, SL-30, SL-107 7 Susceptible
Table 16. Severity of stemphylium blight on some mutants of lentil at Magura and Ishurdi
Mutants/varieties Severity (0-5)
Disease reaction
LM-21-1, LM-24-3, LM-14-2, LM-185-2, LM-156-1, LM-28-2, LM-67-7, LM-123-7, LM-99-4, LM-15-9,LM-13-1, LM-20-3, LM-37-8, LM-93-3, ICA-23128, ICA-23105, ICA-23211, ICA-23136,IVA-23126, ICA-23118, SL-129, SL-107, SL-30, SL-137
3 Tolerant
LM-101-8, LM-48-1, LM-75-4, LM-132-7, ICA-23121, SL-110, SL-9 SL-2, BARI masur-4
4 Susceptible
Evaluation of chickpea mutants against root rot/wilt and botrytis gray mold
Two chickpea mutants (CPC-860 and P-70) and one (BARI sola-5) check variety were evaluated against root rot (Fusarium solani) and botrytis gray mold (Botrytis cinerea) under natural field conditions. The experiments were conducted in a randomized block design with three replications during winter season, 2011-12 in collaborated with Plant Breeding Division. The mean severity of root rot and botrytis gray mold of the tested materials were 7 and 5, respectively. All the mutants were found susceptible to root rot and tolerant to botrytis gray mold (Table 17). Table 17. Mean severity of root rot and botrytis gray mold of some mutants of chickpea at Magura and Rajshahi
during 2011-12
Root rot Botrytis gray mold Mutants/strains
Severities (1-9) Disease reaction Severities (1-9) Disease reaction CPC-860 7 Susceptible 5 Tolerant P-70 7 Susceptible 5 Tolerant BARI sola-5 7 Susceptible 5 Tolerant
180

BINA Annual Report 2011-12 Plant Pathology
Evaluation of mungbean mutants against yellow mosaic and cercospora leaf spot
Two promising mutants along with two check varieties of mungbean were assessed for their resistance to yellow mosaic (MYMV) and Cercospora leaf spot (Cercospora sp.) at Rajshahi and Natore in collaborated with Plant Breeding Division in the summer season of 2012 under field condition. The experiments were conducted in a RCB design with three replications. The seeds were sown on mid March 2012. The unit plot size was 10 m × 8 m each. The recommended doses of fertilizer were applied and normal cultural practices were followed. The incidence and severities of the diseases were recorded at maximum pod ripening stage of crop growth. The mean incidences of yellow mosaic and Cercospora leaf spot ranged from 45.4-62.5% and 87.5-100%, respectively. All the mutants/varieties were found to be moderately resistant to tolerant against yellow mosaic and Cercospora leaf spot according the severity scale (Table 18). Table 18. Mean incidence of yellow mosaic and cercospora leaf spot in some mutants of summer mungbean at
Rajshahi and Natore in 2011-12
Disease incidence (%)
Disease severity (0-9) Mutant/variety
MYM CLS MYM CLS
Disease reaction of
MYM
Disease reaction of
CLS MBM-88 52.6 100 5 5 T T MBM-07-3y-1 36.6 87.5 3 3 MR MR Binamoog-8 45.4 95.2 3 5 MR T BARI Moog-6 62.5 95.0 3 5 MR T
Note: MR = Moderately resistant, T = Tolerant
Integrated Management of Major Diseases of Cereals, Pulses, Oilseed, Vegetable and Spices
Effect of pulse bran, poultry refuge, biopesticides and tilt on Sheath blight in boro rice
The single and combined applications of pulse bran, poultry refuge, Trichoderma based biopesticides and fungicide were assessed during boro season of 2011-12 to find out the suitable strategy for the integrated management of sheath blight (ShB) of rice (cv. Iratom24) at BINA sub-station farms Magura and Ishurdi. The treatments were : T1 = Pulse Bran (3 t ha-1), T2 = Poultry Refuge (5 t ha-1), T3 = IPM Lab Biopesticide (125 kg ha-1), T4 = BINA Biopesticide (200 kg ha-1), T5 = T1 + T2, T6 = T2 + T3, T7 = T2 + T4, T8 = Muriate of potash (40 kg ha-1), T9 = Tilt (2 ml L-1 two time), T10 = Control (only inoculum). The experiments were conducted in RCB design with three replications. The unit plot size was 3 m × 2 m and the spacing between lines and plants within lines were 25 and 15 cm, respectively. The recommended doses of fertilizers were applied and cultural practices were followed. Pulse bran, poultry refuge and biopesticides were applied to each plot 2 weeks before transplanting of seedlings. The inoculum of R. solani was previously grown on sterilized rice hull-husk media were applied in soil @ 50 g m-2 at the booting stage. Muriate of potash was sprayed at two splits at 15 days interval starting from maximum tillering stage and Tilt was sprayed 2 times starting from panicle initiation stage. Plants were assessed for severity at ripening stage. The grain yield and agronomic parameters were recorded after harvest.
181

BINA Annual Report 2011-12 Plant Pathology
The mean disease incidence, relative lesion height, per cent disease index (PDI) and grain yield significantly varied among the treatments in both the locations (Table 19 and 20). The highest disease development was recorded in control plots where pathogen inoculation was made and the lowest was recorded in tilt treated plots. The maximum PDI reduced in the plots where fungicide tilt were sprayed compared to inoculated control, 50% PDI reduced in other treatments. The grain yield varied from 3.90 to 5.83 t ha-1 and 4.13 to 6.06 t ha-1 in Magura and Ishurdi, respectively. About fifty per cent yield was increased in tilt treated plots than control plots. Though organic amendments and biopesticides reduced sheath blight severity and increased grain yield, the fungicide tilt was more effective to manage the disease in both the locations. Table 19. Effects of pulse bran, poultry refuge, biopesticides and Tilt on sheath blight in boro rice (cv. Iratom-24)
during 2011-12 at Magura
Treatment Incidence
(%)
RLH
(%)
PDI
(%)
PDI decreased over control
(%)
Grain yield (t/ha)
Grain yield increase over control (%)
Pulse bran (T1) 10.1 13.6 39.3 49.7 4.74 21.5 Poultry refuge (T2) 10.1 15.3 37.7 51.7 4.71 20.7 IPM Biopesticide (T3) 11.0 17.1 42.4 45.7 4.77 22.3 BINA Biopesticide (T4) 10.3 13.7 39.0 50.1 4.79 22.9 T1 + T2 (T5) 10.4 13.7 39.7 49.2 5.21 33.5 T2 + T3 (T6) 10.8 15.7 40.3 48.5 5.04 29.3 T2 + T4 (T7) 9.7 15.7 40.1 48.6 5.24 34.4 Muriate of potash (T8) 9.6 15.7 40.2 48.5 4.63 18.6 Tilt (T9) 6.6 9.5 16.9 78.4 5.83 49.5 Control (T10) 52.9 25.0 78.1 -- 3.90 -- LSD0.05 2.01 1.89 3.05 0.14 Note: RLH = Relative lesion height, PDI = Per cent disease index
Table 20. Effects of pulse bran, poultry refuge, biopesticides and Tilt on sheath blight in boro rice (cv. Iratom-24) during 2011-12 at Ishurdi
Treatment Incidence
(%)
RLH
(%)
PDI
(%)
PDI decreased over control
(%)
Grain yield (t/ha)
Grain yield increase over control (%)
Pulse bran (T1) 10.9 13.9 41.0 44.8 5.00 21.0 Poultry refuge (T2) 11.1 13.8 43.1 41.9 4.99 20.9 IPM biopesticide (T3) 10.9 15.1 40.3 45.7 4.95 19.8 BINA biopesticide (T4) 11.0 14.8 40.6 45.3 4.85 17.3 T1 + T2 (T5) 11.7 14.5 38.8 47.7 5.35 29.5 T2 + T3 (T6) 9.8 14.4 39.1 47.2 5.47 32.4 T2 + T4 (T7) 9.7 15.0 38.4 48.2 5.53 34.0 Muriate of potash (T8) 10.0 14.2 41.9 43.6 4.92 19.1 Tilt (T9) 7.8 10.7 23.9 67.8 6.06 46.7 Control (T11) 47.0 22.8 74.2 0.0 4.13 0.0 LSD0.05 1.48 1.65 3.67 -- 0.24 --
Note: RLH = Relative lesion height, PDI = Per cent disease index
182

BINA Annual Report 2011-12 Plant Pathology
Integrated management of collar rot of soybean
Single and combined application of three integrated disease management components viz. cultural (Mustard oil cake (MOC), chemical (Antacol and Dithane M-45) and bio-agent (Trichoderma sp.) along with control were assessed to find out a suitable strategy for the management of collar rot caused by Sclerotium rolfsii of soybean. The seeds of Binasoybean-2 were directly sown in rows on 20 December of 2011. The experiments were conducted in a randomized complete block design with four replications at BINA farm, Mymensingh and BINA sub-station farm, Magura. The experiment contained seven treatments viz. (T1) Antacol (2g kg-1 seed), (T2) Dithane M-45 (4g kg-1 seed), (T3) Trichoderma sp. (30 g m-1 long row), (T4) Mustard oil cake (200 kg ha-1), (T5) Antacol + Trichoderma sp. + MOC, (T6) Dithane M-45 + Trichoderma sp. + MOC and (T7) control (without treatment). Bio-agent was applied in rows before sowing. Soybean seeds were treated separately by Antacol or Dithane M-45. MOC powder was applied in the soil 3 days before sowing. Weeding and irrigation were done as and when necessary. Data were taken at harvesting stage. Significantly the least disease incidence and severity of collar rot and highest yield of soybean were recorded in the integrated treatment of Antacol + Trichoderma sp. + Mustard oil cake at both the locations Mymensingh and Magura (Table 21). Disease incidence flared up to 28% and 70% at Mymensingh and Magura, respectively at harvesting stage. All the treatments including control showed moderately resistant reaction at Mymensingh while only two treatments observed tolerant reaction and the rest exhibited moderately susceptible reaction at Magura to the disease. Table 21. Disease reaction of soybean cultivar as affected by integrated treatments to collar rot during 2011-12
at Mymensingh and Magura
Mymensingh Magura
Treatment Disease incidence
(%)
Disease severity
Disease reaction
Yield (kg ha-1)
Disease incidence
(%)
Disease severity
Disease reaction
Yield (kg ha-1)
T1 12cd 2.6 MR 1181d 70a 6.4 MS 1923.8c T2 28a 3.0 MR 981.8e 61b 6.9 MS 1887.5c T3 14c 2.4 MR 1206.3cd 61b 5.6 MS 1881.3c T4 21b 2.3 MR 1284.3bc 54bc 4.9 T 2062.5b T5 11d 2.3 MR 1456.3a 51c 5.4 T 2162.5a T6 12cd 3.0 MR 1346.8b 70a 6.3 MS 1793.8d T7 23b 4.9 T 1196.8cd 70a 6.7 MS 1771.3d
Note: MR = Moderately resistant, T = Tolerant, MS = Moderately susceptible Combined application of Dithane M-45 + Trichoderma sp. + Mustard oil cake was considerably superior to the treatments in reducing the incidence of brown leaf spot of soybean at both the locations. However, at Mymensingh the effect of Dithane M-45 + Trichoderma sp. + Mustard oil cake and single application of Mustard oil cake was same. On the other hand the efficacy of Mustard oil cake (single) and Antacol + Trichoderma sp. + Mustard oil cake was statistically identical. The highest incidence and severity were recorded in control treatment at both the locations at Magura. The single application of Antacol, Dithane M-45 and Trichoderma sp. was statistically identical. All the treatments excluding control showed moderately resistant reaction at Magura to the disease (Table 22).
183

BINA Annual Report 2011-12 Plant Pathology
Table 22. Disease reaction of soybean cultivar as affected by integrated treatments to brown leaf spot during 2011-12 at Mymensingh and Magura
Mymensingh Magura Treatment Disease
incidence (%) Disease severity
Disease reaction
Disease incidence (%)
Disease severity
Disease reaction
T1 13.0b 2.5 MR 40.0cd 2.6 MR T2 8.8c 2.3 MR 40.0cd 2.5 MR T3 12.5b 2.5 MR 40.0cd 2.6 MR T4 6.3d 2.2 MR 46.3b 2.5 MR T5 10.0c 2.2 MR 43.8bc 2.4 MR T6 6.3d 2.1 MR 37.5d 2.2 MR T7 23.8a 3.0 MR 57.5a 3.6 T
Note: MR = Moderately resistant, T = Tolerant
Integrated management of fusarium wilt of tomato
An experiment was conducted to find out a suitable strategy for the management of fusarium wilt (Fusarium oxysporum f. sp. lycopersici) of tomato at BINA farm, Mymensingh during winter season of 2011-12. The treatments were: T1 = Soil application of Trichoderma harzianum (50 g inoculum m-2), T2 = Soil amendment with MOC (200 kg ha-1), T3 = Seedling treatment with Provax before transplanting (2 g L-1 water), T4 = Integration of T1, T2 and T3 and T5 = Control. The experiments were laid out in randomized complete block design with three replications. The variety used in the experiment was Binatomato-5. The unit plot size was 2 m × 2 m. Line to line and plant to plant spacing was 50 cm. Disease incidence was recorded at 40, 55 and 75 days after transplanting. The wilt disease incidence ranged from 2.3-12.7% (Table 23). The lowest disease incidence (2.3%) was recorded in T5 (integration of T1, T2 and T3) followed by T1 (soil application of T. harzianum) compared to the control (12.7%). The effect of two other treatments T2 (soil amendment with MOC) and T3 (seedling treatment with Provax before transplanting) on disease suppression was almost same and that was 6.5% and 5.5%, respectively. The experiment indicated that integration of different treatments was better in fusarium wilt management than the application of a single treatment. Table 23. Mean incidence of fusarium wilt of tomato in response to different treatments at Mymensingh during
winter season of 2011-12
Treatments Mean incidence (%) T1 (Soil application of T. harzianum) 4.38 T2 (Soil amendment with MOC) 6.53 T3 (Seedling treatment with Provax) 5.53 T4 (Integration of T1, T2 and T3) 2.30 T5 (Control) 12.76 LSD 0.05 3.28
184
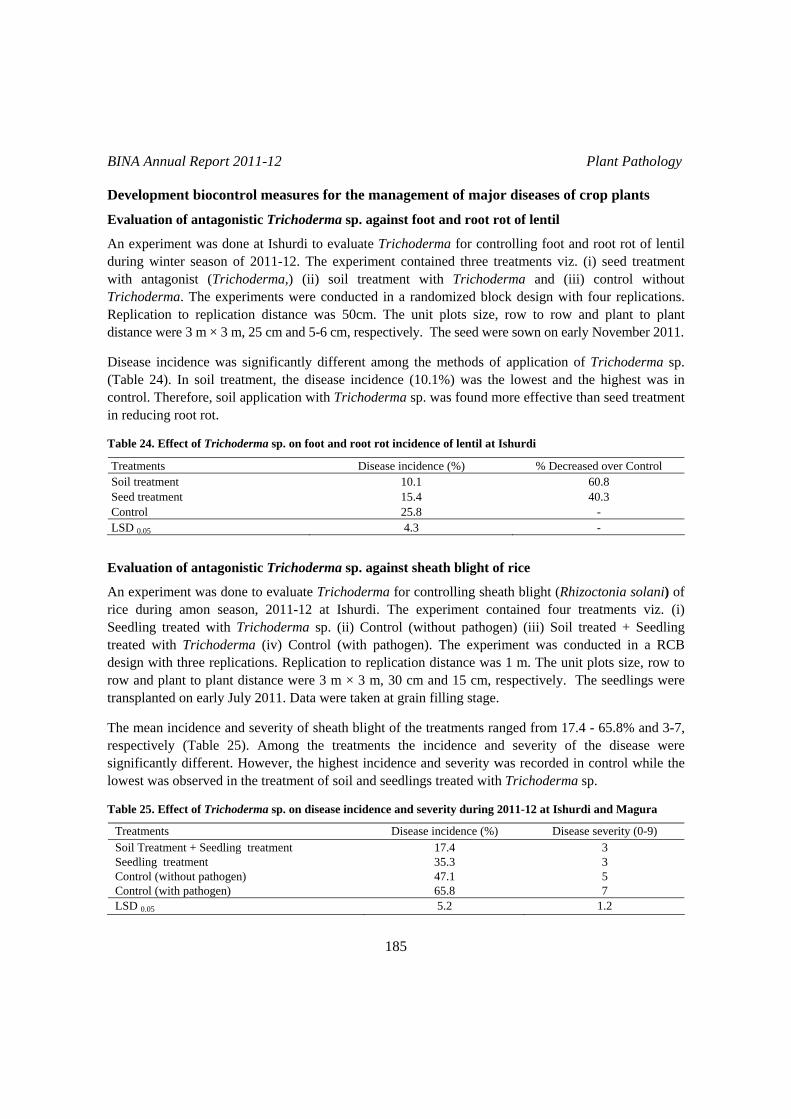
BINA Annual Report 2011-12 Plant Pathology
Development biocontrol measures for the management of major diseases of crop plants
Evaluation of antagonistic Trichoderma sp. against foot and root rot of lentil
An experiment was done at Ishurdi to evaluate Trichoderma for controlling foot and root rot of lentil during winter season of 2011-12. The experiment contained three treatments viz. (i) seed treatment with antagonist (Trichoderma,) (ii) soil treatment with Trichoderma and (iii) control without Trichoderma. The experiments were conducted in a randomized block design with four replications. Replication to replication distance was 50cm. The unit plots size, row to row and plant to plant distance were 3 m × 3 m, 25 cm and 5-6 cm, respectively. The seed were sown on early November 2011. Disease incidence was significantly different among the methods of application of Trichoderma sp. (Table 24). In soil treatment, the disease incidence (10.1%) was the lowest and the highest was in control. Therefore, soil application with Trichoderma sp. was found more effective than seed treatment in reducing root rot. Table 24. Effect of Trichoderma sp. on foot and root rot incidence of lentil at Ishurdi
Treatments Disease incidence (%) % Decreased over Control Soil treatment 10.1 60.8 Seed treatment 15.4 40.3 Control 25.8 - LSD 0.05 4.3 -
Evaluation of antagonistic Trichoderma sp. against sheath blight of rice
An experiment was done to evaluate Trichoderma for controlling sheath blight (Rhizoctonia solani) of rice during amon season, 2011-12 at Ishurdi. The experiment contained four treatments viz. (i) Seedling treated with Trichoderma sp. (ii) Control (without pathogen) (iii) Soil treated + Seedling treated with Trichoderma (iv) Control (with pathogen). The experiment was conducted in a RCB design with three replications. Replication to replication distance was 1 m. The unit plots size, row to row and plant to plant distance were 3 m × 3 m, 30 cm and 15 cm, respectively. The seedlings were transplanted on early July 2011. Data were taken at grain filling stage. The mean incidence and severity of sheath blight of the treatments ranged from 17.4 - 65.8% and 3-7, respectively (Table 25). Among the treatments the incidence and severity of the disease were significantly different. However, the highest incidence and severity was recorded in control while the lowest was observed in the treatment of soil and seedlings treated with Trichoderma sp. Table 25. Effect of Trichoderma sp. on disease incidence and severity during 2011-12 at Ishurdi and Magura
Treatments Disease incidence (%) Disease severity (0-9) Soil Treatment + Seedling treatment 17.4 3 Seedling treatment 35.3 3 Control (without pathogen) 47.1 5 Control (with pathogen) 65.8 7 LSD 0.05 5.2 1.2
185

BINA Annual Report 2011-12 Plant Pathology
186

AGRICULTURAL ENGINEERING DIVISION

BINA Annual Report 2011-12 Agricultural Engineering
188

BINA Annual Report 2011-12 Agricultural Engineering
RESEARCH HIGHLIGHTS
At Mymensingh (BINA Farm), the highest seed yield of soybean (2.97 t ha-1, in Kharif-1 season) was obtained with one supplemental irrigation at vegetative stage. Water quality parameters at BINA sub-stations were found within permissible limit for irrigation. At Satkhira, the parameters showed slight seasonal variation. At different locations of Mymensingh Sadar, the parameters were found within the permissible limit. At Satkhira, Binadhan-8 produced the highest yield (9.83 t ha-1) under alternate wetting and drying (10 cm lowering of WL from the surface, when irrigation water salinity varied from 4.32 to 7.05 dS/m. At Satkhira (Kharibila village, Satkhira Sadar), sunflower produced higher yield (2.82 to 2.95 t ha-1) with higher BCR when canal water (EC of 0.93 to 7.86 dS/m) or groundwater (EC of 4.32 to 6.40 dS/m) was used as a source of irrigation following three irrigations in the growing period, compared to non-irrigated plot (2.38 t ha-1). Maize produced higher yield (8.38 to 9.61 t ha-1) and higher BCR when canal water (0.93 to 8.00 dS/m) or groundwater (EC of 4.32 to 6.94 dS/m) was used as a source of irrigation following three or four irrigations in the growing period, compared to non-irrigated plot. Soybean yielded 1.94 to 2.00 t ha-1 (with BCR 1.39 to 2.35) when it was irrigated (3 nos.) by canal water (having EC of 1.48 to 7.86 dS/m) or groundwater (EC of 5.22 to 6.94 dS/m). Trend analysis of climatic parameters for Mymensingh, Faridpur and Jessore districts by MAKESENS software using 30 yrs (1981-2010) data, showed increasing or decreasing trend, and the rate of change differed with locations. Three cropping patterns i.e. T. aman–Fallow–Boro, T. aman–Mustard–Boro, and T. aman–Wheat– T. aus for Mymensingh district and T. aman–Lentil–Sesame, T. aman–Mustard–Mungbean, and T. aman – Chickpea – Jute for Magura district were successfully implemented. The farmers preferred pattern was T. aman–Mustard–Boro at Mymensingh, and T. aman–Lentil– Sesame at Magura. Results from five different cropping pattern experiments revealed that T. aman (Binadhan-7)–Rabi (Potato/Wheat) - Kharif-1 (Sesame/Mungbean) was the best pattern for increasing cropping intensity, higher yield and water saving at Rajbari farm, Dinajpur. At BINA Farm, Mymensingh, NERICA rice lines (NERICA-1 and NERICA-10) produced 1.04 to 1.67 t ha-1 grain under drought stress condition (Alternate flooding and drying at 5 to 9 days after disappearance of 5 cm ponded water). From one year experiment, NERICA rice seemed low yield potential under the imposed drought stress at this location.
189

BINA Annual Report 2011-12 Agricultural Engineering Water requirement and irrigation scheduling of different crops in different cropping systems
Effects of drought stress on growth and yield of two NERICA rice lines
This experiment was conducted to determine the drought effects on grain yield, optimum water requirement and water productivity of two NERICA rice lines at BINA farm Mymensingh during January-May, 2012. Experimental design was RCBD with split-plot arrangement of the treatments, having three replications. Main plot treatments were: T1 = Continuous ponding 3-5 cm, T2 = Alternate flooding and drying at 5 days after disappearance (DAD) of 5 cm ponded water, T3 = Alternate flooding and drying at 7 DAD of 5 cm ponded water and T4 = Alternate wetting and drying (AWD) at 9 DAD of 5 cm ponded water, and sub plot treatments were: V1 = NERICA-1, V2 = NERICA-10 and V3 = Binadhan-8. The experimental plot fertilized with required dose of fertilizers before final land preparation. Fifty six days rice seedlings of NERICA-1 and NERICA-10 and forty seven days rice seedlings of Binadhan-8 were transplanted on 9th February 2012. Treatments were started fifteen days after transplanting and it continued up to flowering stage and again treatment started after flowering stage and continued up to around 2 weeks before harvesting. Cultural practices were followed as per need and recommendation. NERICA-10 and Binadhan-8 were harvested on 17th May 2012 and NERICA-1 was harvested on 20th May 2012. At the harvest time, yield and yield attributing characters were collected and analyzed. Interaction effect of irrigation treatments and varieties on yield and yield attributing characters of NERICA rice lines is presented in Table 1. Interaction effect of AWD irrigation treatment and varieties had significant effect on plant height, number of tiller, panicle length, grain and straw yield. The highest grain yield was observed in T1V3 i.e., Binadhan-8 produced the highest yield in continuous ponding treatment. The NERICA rice lines also produced higher yield in continuous ponding method treatment. Irrigation frequency was higher in more watered plots compared to the delayed irrigated plots (Table 2). It also elucidated that 5 to 9 days AWD irrigation method (T2, T3 and T4) saved about 41 to 52% irrigation water compared to continuous ponding treatment. Hence, water productivity was obviously higher with reduced irrigation at 5 to 9 days alternate wetting and drying in T2, T3 and T4 treatment plots. Rainfall pattern during the growing period of NERICA rice lines and Binadhan-8 is presented in Fig. 1. Table 1. Interaction effect of AWD irrigation treatment and varieties on yield and yield attributing characters of
NERICA rice lines
Treatment × Variety
Plant height (cm)
No. of tiller
Panicle length (cm)
Grain panicle-1
(no.) 1000 seed wt.
(g) Grain yield
(t ha-1) Straw yield
(t ha-1) T1V1 81.93 ab 9.33 a 18.40 bc 115.87 a 32.43 ab 3.67 c 8.17 b T1V2 80.53 bc 7.40 ab 18.47 cd 95.07 ab 27.11 d 3.41 c 6.33 c T1V3 87.47 a 9.87 a 21.39 a 115.00 ab 26.49 d 7.33 a 10.50 a T2V1 73.07 de 5.60 b 18.50 cd 84.60 bcd 34.06 a 1.67 d 4.17 ef T2V2 70.40 de 7.13 ab 16.43 e 58.20 d 27.39 d 1.50 d 2.83 gh T2V3 76.80 bcd 8.20 ab 20.39 ab 90.73 abc 27.36 d 4.92 b 6.33 c T3V1 70.13 de 5.40 b 17.53 cde 59.00 d 31.26 b 1.33 d 4.58 de T3V2 68.93 e 5.67 b 17.13 de 58.33 d 28.13 cd 1.33 d 3.00 fgh T3V3 75.73 b-e 9.33 a 21.83 a 103.67 ab 26.15 d 3.75 c 5.59 cd T4V1 69.40 e 5.67 b 17.93 cde 62.00 cd 31.75 ab 1.04 d 4.04 efg T4V2 61.87 f 6.87 ab 16.67 de 57.4 d 30.07 bc 1.13 d 2.58 h T4V3 74.07 cde 8.27 ab 20.40 ab 86.27 a-d 26.41 d 3.75 c 5.50 cd
LSD0.05 6.34 3.08 1.72 27.49 2.41 0.76 0.43
190

BINA Annual Report 2011-12 Agricultural Engineering Table 2. Effect of different AWD irrigation techniques on water saving and water productivity of Boro rice
Treatments Water applied
(cm)
Irrigation numbers
Effective rainfall (cm)
Water requirement
(cm)
Water saving compared to T1
(%)
Grain yield
(t ha-1)
Water productivity
(L kg-1) T1 66.50 21 21.48 87.98 - 4.81 1829 T2 30.50 7 21.48 51.98 41 2.69 1932 T3 25.50 6 21.48 46.98 47 2.14 2195 T4 20.50 5 21.48 41.98 52 1.97 2130
0
5
10
15
20
25
30
35
40
13/3
/201
2
6/4/
2012
8/4/
2012
10/4
/201
2
13/4
/201
2
16/4
/201
2
19/4
/201
2
26/4
/201
2
1/5/
2012
3/5/
2012
12/5
/201
2
15/5
/201
2
18/5
/201
2Time
Rai
nfal
l, m
m
Fig. 1. Rainfall pattern during the growing period of NERICA-1, NERICA-10 and
Binadhan-8 in Mymensingh
Determination of optimum water requirement of some lines of soybean
The experiment was conducted at BINA farm, Mymensingh during January-May, 2012 to determine the optimum irrigation water requirement of some mutant lines of soybean. The experimental design was RCBD. The irrigation treatments were assigned in main plots and the soybean cultivars were in the sub-plots. Irrigation treatments were: T0 = Control (No irrigation); T1 = Irrigation at vegetative stage up to field capacity (FC); T2 = Irrigation at flowering stage up to FC; and T3 = Irrigation at vegetative and flowering stages up to FC. Variety/lines were: V1 = AVRDC-78; V2 = BAU-S/70 and V3 = Binasoybean-1. After land preparation, application of basal dozes of fertilizer, the seeds of soybean were sown on 16th January, 2012. Required row (30 cm) and plant spacing (5 cm) were also maintained. First irrigation was applied at vegetative stage and the next irrigation (scheduled at flowering stage) was omitted due to rainfall. Soil moisture was measured by gravimetric method up to 60 cm for every 15 cm increment at the time of sowing and harvest. Other cultural practices were followed as and when necessary. The crop was harvested on 15th May 2012. All agronomic data were collected at the harvest time.
191

BINA Annual Report 2011-12 Agricultural Engineering The crop during its growing period received about 209 mm rainfall which is graphically shown in Fig. 2. The irrigation treatments showed significant differences in plant height and 100 seed weight, and varietal treatment showed significant differences in plant height, 100 seed weight, and straw yield (Table 2). The highest yield was obtained in treatment T3. Amount of irrigation water requirement and water productivity of soybean are shown in Table 4. From Table 4, it is observed that irrigation water productivity is highest in T3 treatment.
13 14
23
15
21
3935
19
30
0
5
10
15
20
25
30
35
40
45
3 48 49 50 51 56 57 59 61
Days from sowing
Rai
nfal
l (m
m)
Fig. 2. Rainfall distribution during the growing period of soybean at BINA farm, Mymensingh Table 3. Yield and yield attributing characters of soybean at BINA farm, Mymensingh
Treatments Plant height (cm)
Pods plant-1 (no.)
Seed pod-1
(no.) 100 seed weight
(g) Seed yield
(t ha-1) Straw yield
(t ha-1) T0 53.04 62.47 2.27 131.68 2.44 2.93 T1 55.51 68.69 2.27 139.60 2.81 2.73 T2 44.56 58.80 2.40 140.62 2.34 2.47 T3 54.02 60.57 2.51 140.08 2.97 3.11
LSD0.05 5.38 NS NS 5.87 NS NS V1 41.40 67.93 2.42 143.65 2.48 2.59 V2 73.83 60.38 2.23 136.99 2.66 3.30 V3 40.17 59.58 2.43 133.34 2.78 2.55
LSD0.05 6.13 NS NS 7.12 NS 0.47 NS = Non-significant. Table 4. Water requirement and irrigation water productivity of soybean at BINA farm, Mymensingh
Treatments
Irrigation water, IR
(cm)
Effective rainfall, Re
(cm)
Seasonal soil moisture depletion, ΔS (cm)
Water requirement, IR + Re +ΔS
(cm)
Yield
(kg ha-1)
Irrigation water productivity
(kg ha-1cm-1)
T0 T1 T2T3
0 3.0 0
3.0
20.9
-0.34 -2.79 -1.22 -0.90
20.56 21.11 19.68 20.00
2440 2810 2340 2970
118.67 133.11 118.90 148.50
192
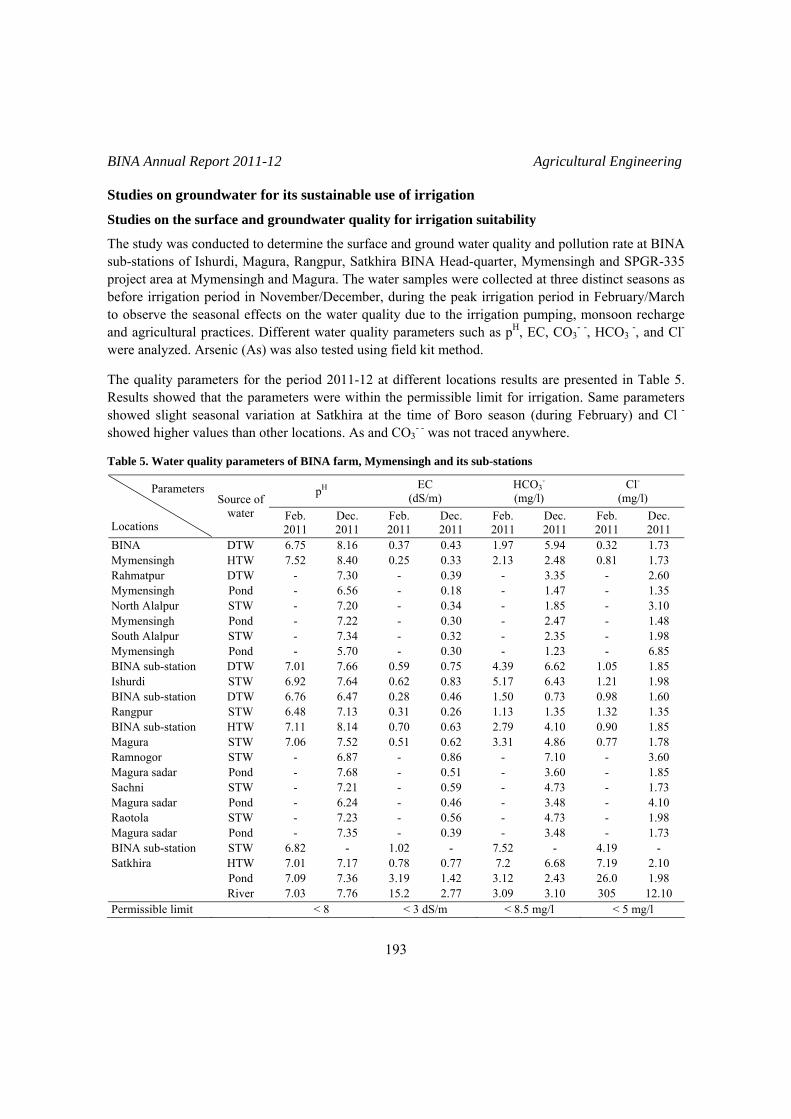
BINA Annual Report 2011-12 Agricultural Engineering Studies on groundwater for its sustainable use of irrigation
Studies on the surface and groundwater quality for irrigation suitability
The study was conducted to determine the surface and ground water quality and pollution rate at BINA sub-stations of Ishurdi, Magura, Rangpur, Satkhira BINA Head-quarter, Mymensingh and SPGR-335 project area at Mymensingh and Magura. The water samples were collected at three distinct seasons as before irrigation period in November/December, during the peak irrigation period in February/March to observe the seasonal effects on the water quality due to the irrigation pumping, monsoon recharge and agricultural practices. Different water quality parameters such as pH, EC, CO3
- -, HCO3 -, and Cl-
were analyzed. Arsenic (As) was also tested using field kit method. The quality parameters for the period 2011-12 at different locations results are presented in Table 5. Results showed that the parameters were within the permissible limit for irrigation. Same parameters showed slight seasonal variation at Satkhira at the time of Boro season (during February) and Cl -
showed higher values than other locations. As and CO3- - was not traced anywhere.
Table 5. Water quality parameters of BINA farm, Mymensingh and its sub-stations
pH EC (dS/m)
HCO3-
(mg/l) Cl-
(mg/l) Parameters
Locations
Source of water Feb.
2011 Dec. 2011
Feb. 2011
Dec. 2011
Feb. 2011
Dec. 2011
Feb. 2011
Dec. 2011
DTW 6.75 8.16 0.37 0.43 1.97 5.94 0.32 1.73 BINA Mymensingh HTW 7.52 8.40 0.25 0.33 2.13 2.48 0.81 1.73
DTW - 7.30 - 0.39 - 3.35 - 2.60 Rahmatpur Mymensingh Pond - 6.56 - 0.18 - 1.47 - 1.35
STW - 7.20 - 0.34 - 1.85 - 3.10 North Alalpur Mymensingh Pond - 7.22 - 0.30 - 2.47 - 1.48
STW - 7.34 - 0.32 - 2.35 - 1.98 South Alalpur Mymensingh Pond - 5.70 - 0.30 - 1.23 - 6.85
DTW 7.01 7.66 0.59 0.75 4.39 6.62 1.05 1.85 BINA sub-station Ishurdi STW 6.92 7.64 0.62 0.83 5.17 6.43 1.21 1.98
DTW 6.76 6.47 0.28 0.46 1.50 0.73 0.98 1.60 BINA sub-station Rangpur STW 6.48 7.13 0.31 0.26 1.13 1.35 1.32 1.35
HTW 7.11 8.14 0.70 0.63 2.79 4.10 0.90 1.85 BINA sub-station Magura STW 7.06 7.52 0.51 0.62 3.31 4.86 0.77 1.78
STW - 6.87 - 0.86 - 7.10 - 3.60 Ramnogor Magura sadar Pond - 7.68 - 0.51 - 3.60 - 1.85
STW - 7.21 - 0.59 - 4.73 - 1.73 Sachni Magura sadar Pond - 6.24 - 0.46 - 3.48 - 4.10
STW - 7.23 - 0.56 - 4.73 - 1.98 Raotola Magura sadar Pond - 7.35 - 0.39 - 3.48 - 1.73
STW 6.82 - 1.02 - 7.52 - 4.19 - HTW 7.01 7.17 0.78 0.77 7.2 6.68 7.19 2.10 Pond 7.09 7.36 3.19 1.42 3.12 2.43 26.0 1.98
BINA sub-station Satkhira
River 7.03 7.76 15.2 2.77 3.09 3.10 305 12.10 Permissible limit < 8 < 3 dS/m < 8.5 mg/l < 5 mg/l
193

BINA Annual Report 2011-12 Agricultural Engineering Assessment of aquifer exploitation due to irrigation during dry season
The study was conducted at BINA sub-stations of Ishurdi, Magura, Rangpur, Satkhira and BINA head-quarters, Mymensingh to assess the surface and ground water withdrawal pattern from water table data for its sustainable use. Observation wells were installed earlier at the sub-stations at Ishurdi, Magura, Rangpur and BINA head-quarter at Mymensingh. Using water level indicator, WT data were monitored fortnightly which were then interpreted to see the seasonal as well as yearly WT dynamics. Long-term (1992-2011) water table data were also recorded from earlier installed observation wells at the above locations. Monthly WT study at BINA Head-quarters at Mymensingh and its sub-stations
Monthly WT fluctuation pattern in the yearly cycle of 2011-12 (May 2011 to April 2012) showed within the suction limit (< 8m) of STW at Rangpur and Magura but it went below the suction limit at Ishurdi from March to June. On the other hand, at Mymensingh, maximum WT sharply went below the suction limit from January and on-ward till the onset of monsoon in June/July (Fig. 3).
Mymensingh
0
2
4
6
8
10
12
14
Months
WT
(m)
M ax M inIshurdi
0
2
4
6
8
10
12
Months
WT
(m)
M ax M inSuc.Lift
Magura
0
2
4
6
8
10
12
Months
WT
(m)
M ax M inSuc.Lift
Rangpur
0
2
4
6
8
10
12
Months
WT
(m)
M ax M in
Suc.Lift
Fig. 3. Monthly WT fluctuation pattern at BINA Head quarter and its sub-stations
194

BINA Annual Report 2011-12 Agricultural Engineering Long-term yearly WT study at BINA Head-quarters at Mymensingh and its sub-stations:
Long-term yearly WT fluctuation at BINA head-quarters at Mymensingh and its sub-stations are shown in Fig. 4. It showed that at Mymensingh all along from 1992-2011, WT went below the suction limit of STW. But at Ishurdi, WT was within the suction limit up to 2007 which then had a transition state and from 2010 it went below the suction limit of STW. At other locations, though data missing but was very much within the suction limit of STW.
(a) (b)
Ishurdi
0
4
8
12
16
20
92 94 96 98 0 2 4 6 8 10Year
WT
(m)
WT (max) WT (min) Suc. Lift
Mymensigh
0
4
8
12
16
20
92 94 96 98 0 2 4 6 8 10Year
WT
(m)
WT (max) WT (min) Suc. Lift
(d)(c)
Magura0
4
8
12
16
20
92 94 96 98 0 2 4 6 8 10Year
WT
(m)
WT (max) WT (min) Suc. Lift
Rangpur
0
4
8
12
16
20
92 94 96 98 0 2 4 6 8 10Year
WT
(m)
WT (max) WT (min) Suc. Lift
Fig. 4. Long term yearly (1992-2011) WT fluctuation pattern of BINA sub-stations at (a) Ishurdi, (b) Magura,
(c) Rangpur and (d) BINA Head quarter, Mymensingh Studies on the surface and groundwater quality for irrigation suitability (SPGR Part)
The study was conducted to determine the surface and ground water quality and pollution rate at SPGR-335 project area at Mymensingh and Magura.
195

BINA Annual Report 2011-12 Agricultural Engineering Methodology
The water samples were collected before irrigation in November/December, and during the peak irrigation period in February/March to observe the seasonal effects on the water quality due to the irrigation pumping, monsoon recharge and agricultural practices. Different water quality parameters such as pH, EC, CO3
--, HCO3- and Cl- were analyzed. Arsenic (As) was also tested using field kit
method.
Results
The quality parameters for the period 2012 at different locations studied are presented in Table 6. Results showed that the parameters were within the permissible limit for irrigation. Table 6. Water quality parameters collected from different locations
pH EC (dS/m) HCO3- (mg/l) Cl- (mg/l) Parameters
Locations Source of
water Dec. 2011 Dec. 2011 Dec. 2011 Dec. 2011 DTW 8.16 0.43 5.94 1.73 BINA
Mymensingh HTW 8.40 0.33 2.48 1.73 DTW 7.30 0.39 3.35 2.60 Rahmatpur
Mymensingh Pond 6.56 0.18 1.47 1.35 STW 7.20 0.34 1.85 3.10 North Alalpur
Mymensingh Pond 7.22 0.30 2.47 1.48 STW 7.34 0.32 2.35 1.98 South Alalpur
Mymensingh Pond 5.70 0.30 1.23 6.85 HTW 8.14 0.63 4.10 1.85 BINA sub-station
Magura STW 7.52 0.62 4.86 1.78 STW 6.87 0.86 7.10 3.60 Ramnogor
Magura sadar Pond 7.68 0.51 3.60 1.85 STW 7.21 0.59 4.73 1.73 Sachni
Magura, sadar Pond 6.24 0.46 3.48 4.10 STW 7.23 0.56 4.73 1.98 Raotola
Magura, sadar Pond 7.35 0.39 3.48 1.73 Permissible limit < 8 < 3 dS/m < 8.5 mg/l < 5 mg/l
Development of appropriate water management practices for increasing crop productivity in saline area
Studies on optimum water requirement of salt tolerant rice variety Binadhan-8
The experiment was conducted at farmers field of Kharibila village, Satkhira Sadar, Satkhira, during January-May, 2012 to determine the optimum water requirement and water productivity of salt tolerant rice variety Binadhan-8 in saline area. Experimental design was RCBD having three replications. Irrigation treatments were: T1 = Continuous ponding (3-5 cm), T2 = AWD 10cm, T3 = AWD 15 cm and T4 = AWD 20cm. After land preparation, required dose of fertilizers was applied. Thirty-five day
196

BINA Annual Report 2011-12 Agricultural Engineering old rice seedlings were transplanted on 23rd January 2012. Treatments were started 15 days after transplanting and continued up to flowering stage. Intercultural practices were followed as per need and recommendation. Binadhan-8 was harvested on 1st May 2012. At the harvest time, yield and yield attributing characters were collected and analyzed. Also, other necessary data e.g. agro-meteorological data, amount of water applied at each irrigation, EC of plot water and EC of irrigation water were collected and recorded. Analysis of EC of soil is under process. Effects of different AWD irrigation techniques on yield and different yield attributes of Binadhan-8 are presented in Table 7. The highest yield was observed in T2 treatment which was not statistically significant with other treatments. In T2 treatment, irrigation was applied by 41.35 cm, and water savings compared to T1 treatment was 7% (Table 8). The highest water savings was in T4 treatment. Water productivity was the highest in T1 treatment followed by T4, T3 and T2 treatments. In T1 treatment plot, salinity was increased in ponding water (Fig. 5). Irrigation water salinity varied from 4.32 to 7.05 dS/m (Fig. 6). Rainfall was occurred 141.50 cm during the growing period of Binadhan-8 and effective rainfall was 7.28 cm (Fig. 7). From the experimental findings, it is found that Binadhan-8 creates an opportunity to increase rice production and improving food security in the saline area irrespective to yield and prevailing soil and water condition. This experiment should be repeated in the next year to confirm the findings. Table 7. Effect of different AWD irrigation techniques on yield and different yield attributes of Binadhan-8
Treatments Plant height (cm)
No. of tillers/hill
Panicle length (cm)
1000 seed wt. (gm)
Grain yield (t ha-1)
T1 103.60 9.87 24.93 29.67 a 9.42 T2 102.53 9.67 23.40 26.00 b 9.83 T3 99.47 9.33 22.67 24.67 b 8.65 T4 98.40 9.00 22.87 26.00 b 7.92
LSD 2.61 NS NS 2.85 NS Table 8. Effect of different AWD irrigation techniques on water saving and water productivity of boro rice
Treatments Water
applied (cm)
Effective rainfall (cm)
Water requirement
(cm)
Water saving compared to T1
(%)
Grain yield
(t ha-1)
Water productivity
(L kg-1) T1 45.23 7.28 52.51 - 9.42 557 T2 41.35 7.28 48.63 7 9.83 495 T3 38.68 7.28 45.96 12 8.65 531 T4 36.35 7.28 43.63 17 7.92 551
197

BINA Annual Report 2011-12 Agricultural Engineering
0
2
4
6
8
10
12
16/2
/201
2
21/2
/201
2
26/2
/201
2
2/3/
2012
7/3/
2012
12/3
/201
2
17/3
/201
2
22/3
/201
2
27/3
/201
2
1/4/
2012
6/4/
2012
11/4
/201
2
Time
Exp
erim
enta
l plo
t wat
er s
alin
ity,
dS/m
Fig. 5. EC of ponding water during the growing period of Binadhan-8 in
continuous ponding water plot
012345678
5/1/
2012
21/1
/201
2
6/2/
2012
3/3/
2012
18/3
/201
2
22/3
/201
2
28/3
/201
2
5/4/
2012
10/4
/201
2
20/4
/201
2
Time
Irri
gatio
n w
ater
GW
) sal
inity
dS/m
Fig. 6. EC of groundwater during the growing period of Binadhan-8
0
5
10
15
20
25
30
35
5/1/
2012
7/1/
2012
9/1/
2012
15/2
/201
2
28/2
/201
2
6/4/
2012
9/4/
2012
12/4
/201
2
24/4
/201
2
Time
Rai
nfal
l, m
m
Fig. 7. Rainfall pattern during the growing period of Binadhan-8
198

BINA Annual Report 2011-12 Agricultural Engineering Development of appropriate irrigation and water management technologies for growing upland crops in selected saline area of Satkhira district (KGF funded Project)
Potentialities of using surface and ground water for sunflower cultivation in saline area
The objective of this experiment was to find out the possibility of growing sunflower after harvesting T. aman rice in saline soil, and evaluate productivity and economics of growing sunflower using variable sources of irrigation water. The experiment was conducted at Kharibila village, Satkhira Sadar, Satkhira, during January-April, 2012. The experimental design was RCBD with four replications. Irrigation treatments were: T1 = No irrigation, T2 = Canal water irrigation, and T3 = Ground water irrigation. After land preparation, the experimental plots were fertilized with urea 95 kg ha-1, triple super phosphate 170 kg ha-1, muriate of potash 160 kg ha-1, gypsum 160 kg ha-1, zinc sulphate 19 kg ha-1, boric acid 11 kg ha-1, magnesium sulphate 90 kg ha-1 and cowdung 9000 kg ha-1 as basal dose. Additional 95 kg ha-1 of urea was applied before flowering stage (45-50 DAS). The seeds of sunflower (BARI Surjamukhi-2) were sown on 5th January 2012 maintaining required row (50 cm) and plant spacing within the row (30 cm). Irrigation water was applied up to field capacity as per treatment. Soil moisture was measured by gravimetric method up to 60 cm depth with 15 cm increment from the soil surface, at 10 days interval from sowing to harvest time. Other cultural practices were followed as and when necessary. Other necessary crop and yield data, agro-meteorological data, amount of water applied at each irrigation, and phenological events (germination, vegetative, flowering and ripening stages etc.) were recorded. At 15 days interval, soil sample was collected up to 45 cm for every 15 cm increment for EC and pH determination. In addition, irrigation water was collected for EC determination. Sunflower was harvested on 12th April, 2012. At the harvest time, necessary data were collected and analyzed. Irrigation water sources had significant effect on plant height, head diameter, seed per head, 1000 seed weight, seed yield and straw yield of sunflower (Table 9). The highest seed yield of sunflower was found in T3 treatment (2954 kg ha-1) which received three irrigations from groundwater. There was no significant seed yield difference among the treatments (T2 and T3). Also reasonable yield was found in T1 treatment due to rainfall and higher profile soil moisture (Fig. 8-9). The highest water use efficiency of sunflower was also found in T3 treatment (Table 10). Electrical conductivity (EC) of canal water and groundwater varied from 0.93 to 7.86 and 4.32 to 6.09 dS m-1 during the growing period (Table 11). The soil moisture was increased with the increase of soil depth (Fig. 9-11). The highest salinity was observed at the top soil (5.84 dS/m) followed by 15 cm soil depth (4.07 dS/m), 30 cm soil depth (2.42 dS/m), 45 cm soil depth (2.01 dS/m) and 60 cm soil depth (1.81 dS/m). Soil salinity was decreased with increasing soil depth (Fig. 12-14). Soil pH varied from 7.39 to 7.87, 7.61 to 7.87 and 7.59 to 7.83 in different depths of soil profile at the total growing period of sunflower (Fig. 15-17). The total number of human labour used for producing sunflower was 168 man-days/ha and per hectare cost was Tk. 42,000.00 which is 51% of total variable cost of sunflower production. The highest number of human labour (24%) occupied in harvesting, carrying and drying purpose followed by land preparation (18%), weeding (15%), seed sowing (14%), manuring (8%), thinning and storing (6%), irrigation (4%), application of chemical fertilizer and top dressing (3%) and application of insecticide and pesticide (2%), respectively (Table 12). Per hectare cost of tractor and power tiller was Tk. 6000.00 which was 7% of total variable cost (Table 13). Per hectare material cost was Tk. 34,730.00 which was 42% of total variable cost (Table 14). The highest material cost was for chemical fertilizer (58%) followed by cowdung (13%), soil treatment (12%), irrigation water (9%), insecticide and pesticide (6%) and seed (4%).
199

BINA Annual Report 2011-12 Agricultural Engineering Table 9. Yield and yield attributes of sunflower for different irrigation treatments
Treatment Plant height (cm)
Head diameter
(cm)
Seeds head-1
(no.)
Seed weight/head
(gm)
1000 seed weight (gm)
Seed yield
(kg ha-1)
Straw yield
(kg ha-1) T1 130.34 14.13 528.50 42.75 80.15 2383 5615 T2 147.19 15.94 602.92 47.83 84.01 2821 6911 T3 140.32 15.31 562.00 44.10 81.10 2954 7426
LSD 0.05 6.36 0.52 31.21 NS 2.68 0.026 NS Table 10. Water requirement and water use efficiency of sunflower in different irrigation treatments
Treatment Life
irrigation (cm)
Irrigation water (cm)
Effective rainfall (cm)
Soil moisture depletion
(cm)
Water requirement
(cm)
Seed yield
(kg ha-1)
Water use efficiency
(kg ha-1cm-1)T1 - - 3.84 5.30 9.14 2383 260.83 T2 - 9 3.84 -0.42 12.42 2821 227.13 T3 - 9 3.84 -0.42 12.42 2954 237.84
Table 11. EC of different sources of irrigation water during the different growing stages of sunflower
Treatments Different growing periods of sunflower
Depth of irrigation (cm)
Sources of irrigation water
EC of irrigation water (dS/m)
Vegetative stage 3 0.93 Flowering stage 3 2.03 T2
Pod development stage 3 Canal water
7.86 Vegetative stage 3 4.32 Flowering stage 3 6.40 T3
Pod development stage 3 Ground water
6.09 Table 12. Per hectare cost of human labour for producing sunflower
Input Human labour (nos. ha-1)
Per hectare cost (Tk.)
Land preparation 30 7500.00 Manuring 14 3500.00 Chemical fertilizer and top dressing 5 1250.00 Seed sowing 24 6000.00 Thinning 10 2500.00 Weeding 25 6250.00 Pest management 4 1000.00 Irrigation 6 1500.00 Harvesting, carrying and drying 40 10000.00 Storing 10 2500.00 Total 168 42000.00
Table 13. Per hectare cost of tractor and power tiller of sunflower production
Number of cultivation (nos./cultivation)
Unit cost (Tk.)
Total per hectare cost of tractor and power tiller (Tk.)
Tractor and power tiller 4 1500.00 6000.00
200
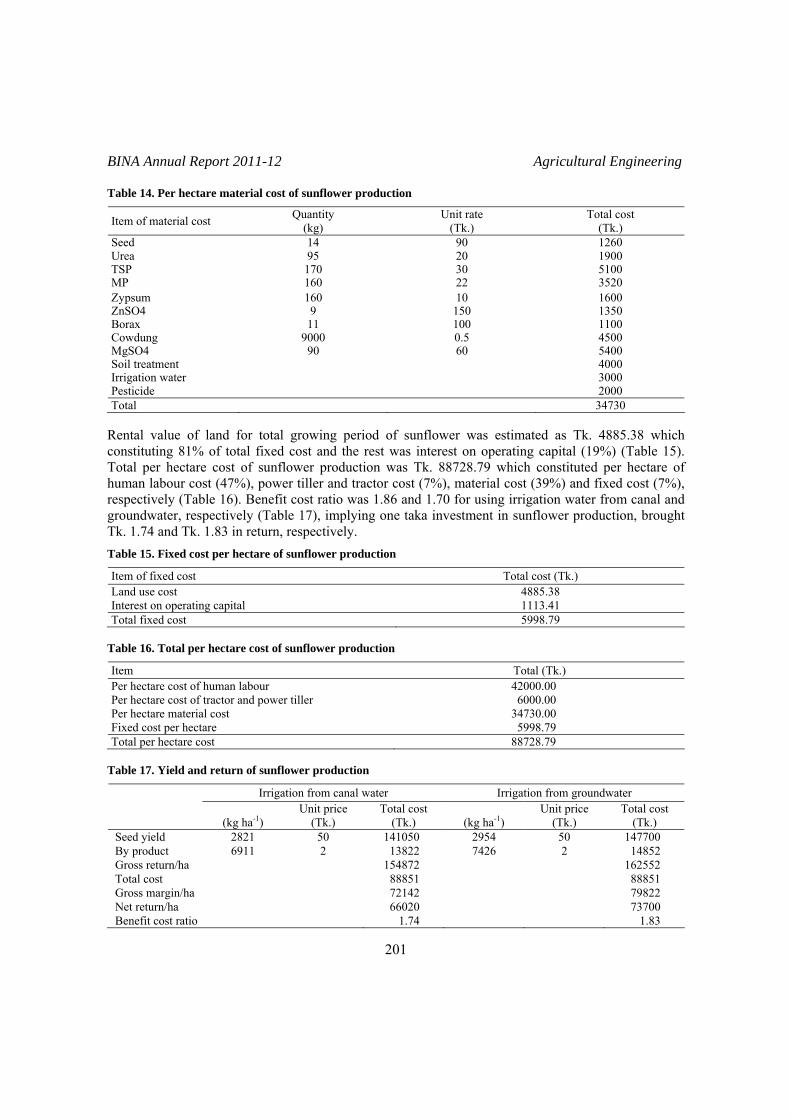
BINA Annual Report 2011-12 Agricultural Engineering Table 14. Per hectare material cost of sunflower production
Item of material cost Quantity (kg)
Unit rate (Tk.)
Total cost (Tk.)
Seed 14 90 1260 Urea 95 20 1900 TSP 170 30 5100 MP 160 22 3520 Zypsum 160 10 1600 ZnSO4 9 150 1350 Borax 11 100 1100 Cowdung 9000 0.5 4500 MgSO4 90 60 5400 Soil treatment 4000 Irrigation water 3000 Pesticide 2000 Total 34730
Rental value of land for total growing period of sunflower was estimated as Tk. 4885.38 which constituting 81% of total fixed cost and the rest was interest on operating capital (19%) (Table 15). Total per hectare cost of sunflower production was Tk. 88728.79 which constituted per hectare of human labour cost (47%), power tiller and tractor cost (7%), material cost (39%) and fixed cost (7%), respectively (Table 16). Benefit cost ratio was 1.86 and 1.70 for using irrigation water from canal and groundwater, respectively (Table 17), implying one taka investment in sunflower production, brought Tk. 1.74 and Tk. 1.83 in return, respectively.
Table 15. Fixed cost per hectare of sunflower production
Item of fixed cost Total cost (Tk.) Land use cost 4885.38 Interest on operating capital 1113.41 Total fixed cost 5998.79
Table 16. Total per hectare cost of sunflower production
Item Total (Tk.) Per hectare cost of human labour 42000.00 Per hectare cost of tractor and power tiller 6000.00 Per hectare material cost 34730.00 Fixed cost per hectare 5998.79 Total per hectare cost 88728.79
Table 17. Yield and return of sunflower production
Irrigation from canal water Irrigation from groundwater
(kg ha-1) Unit price
(Tk.) Total cost
(Tk.) (kg ha-1) Unit price
(Tk.) Total cost
(Tk.) Seed yield 2821 50 141050 2954 50 147700 By product 6911 2 13822 7426 2 14852 Gross return/ha 154872 162552 Total cost 88851 88851 Gross margin/ha 72142 79822 Net return/ha 66020 73700 Benefit cost ratio 1.74 1.83
201

BINA Annual Report 2011-12 Agricultural Engineering
0
5
10
15
20
25
30
35
5/1/
2012
6/1/
2012
7/1/
2012
8/1/
2012
9/1/
2012
10/1
/201
2
15-2
-201
2
16-2
-201
2
28-2
-201
2
29-2
-201
2
6/4/
2012
8/4/
2012
9/4/
2012
10/4
/201
2
12/4
/201
2
Time
Rai
nfal
l, m
m
Fig. 8. Rainfall (mm) pattern during the growing periods of sunflower
012345678
1 5 3 0 4 5 6 0
S o i l d e p t h , c m
Soil
moi
stur
e, c
m
S o w i n g t i m e ( 5 - J a n )
5 - F e b
1 5 - F e b
2 5 - F e b
1 5 - M a r
2 3 - M a r
H a r v e s t t i m e ( 1 1 - A p r i l )
Fig. 9. Volume basis soil moisture at different soil profiles during the
growing periods of sunflower affected by no irrigation
012345678
1 5 3 0 4 5 6 0
S o i l d e p t h , c m
Soil
moi
stur
e, c
m
S o w i n g t i m e ( 5 - J a n )
2 5 - J a n
5 - F e b
1 5 - F e b
2 5 - F e b
4 - M a r
1 5 - M a r
2 3 - M a r
H a r v e s t t i m e ( 1 1 - A p r i l )
Fig. 10. Volume basis soil moisture at different soil profiles during the growing periods of sunflower affected by canal water irrigation
202

BINA Annual Report 2011-12 Agricultural Engineering
012345678
1 5 3 0 4 5 6 0
S o i l d e p t h , c m
Soil
moi
stur
e, c
mS o w i n g t i m e ( 5 - J a n )
2 5 - J a n
5 - F e b
1 5 - F e b
2 5 - F e b
4 - M a r
1 5 - M a r
2 3 - M a r
H a r v e s t t i m e ( 1 1 - A p r i l )
Fig. 11. Volume basis soil moisture at different soil profiles during the
growing periods of sunflower affected by groundwater irrigation
0
0 . 5
1
1 . 5
2
2 . 5
3
ST(0
5Ja
n. 2
012)
15Fe
b.20
12
15M
ar.2
012
HT
(12
Apr
.20
12)
S o w in g t im e , g r o w i n g p e r io d a n d h a r v e s t t im e
Soi
l sal
inity
(dS/
m)
T o p0 - 1 5 c m1 5 - 3 0 c m3 0 - 4 5 c m4 5 - 6 0 c m
Fig. 12. EC in different depths of soil profile during the growing period of
sunflower affected by no irrigation
00 . 5
11 . 5
22 . 5
33 . 5
44 . 5
5
ST(0
5Ja
n. 2
012)
15Fe
b.20
12
15M
ar.2
012
HT
(12
Apr
.20
12)
S o w in g t im e , g r o w in g p e r io d a n d h a r v e s t t im e
Soil
salin
ity (d
S/m
)
T o p0 - 1 5 c m1 5 - 3 0 c m3 0 - 4 5 c m4 5 - 6 0 c m
Fig. 13. EC in different depths of soil profile during the growing period of
sunflower affected by canal water irrigation
203
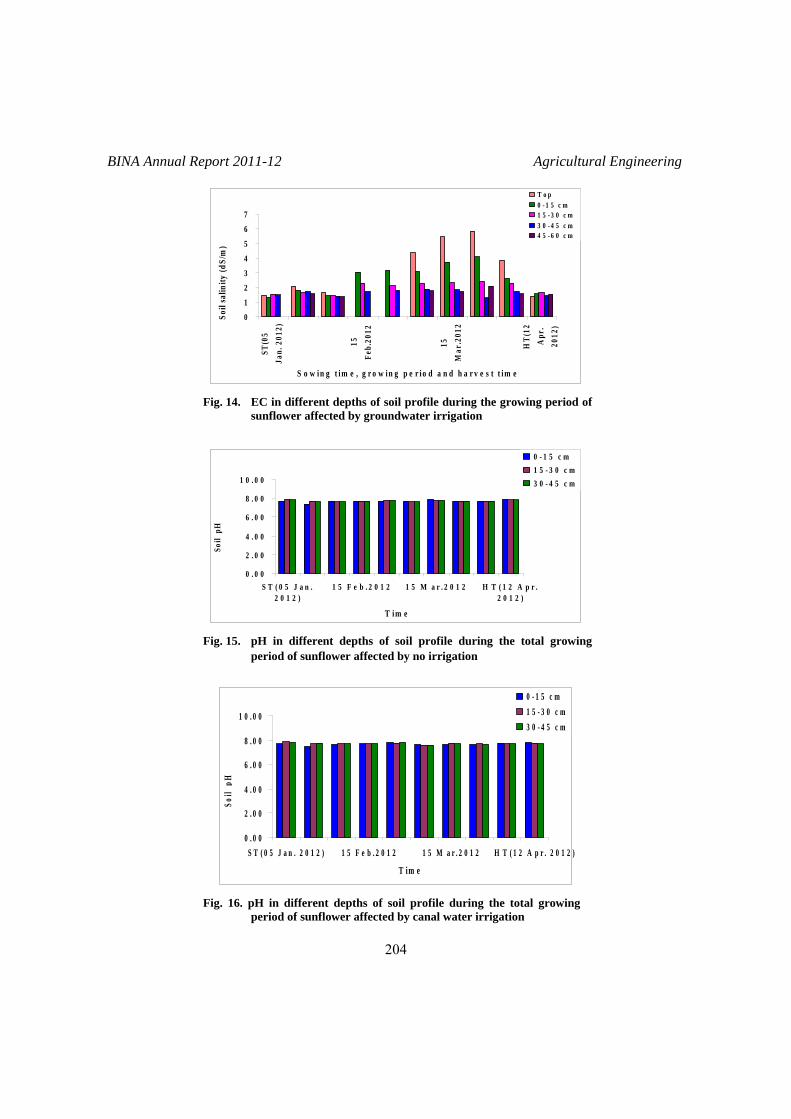
BINA Annual Report 2011-12 Agricultural Engineering
0
1
2
3
4
5
6
7
ST(0
5Ja
n. 2
012)
15Fe
b.20
12
15M
ar.2
012
HT
(12
Apr
.20
12)
S o w in g t im e , g r o w in g p e r io d a n d h a r v e s t t im e
Soil
salin
ity (d
S/m
)
T o p0 - 1 5 c m1 5 - 3 0 c m3 0 - 4 5 c m4 5 - 6 0 c m
Fig. 14. EC in different depths of soil profile during the growing period of
sunflower affected by groundwater irrigation
0 . 0 0
2 . 0 0
4 . 0 0
6 . 0 0
8 . 0 0
1 0 . 0 0
S T ( 0 5 J a n .2 0 1 2 )
1 5 F e b . 2 0 1 2 1 5 M a r . 2 0 1 2 H T ( 1 2 A p r .2 0 1 2 )
T im e
Soil
pH
0 - 1 5 c m1 5 - 3 0 c m3 0 - 4 5 c m
Fig. 15. pH in different depths of soil profile during the total growing
period of sunflower affected by no irrigation
0 . 0 0
2 . 0 0
4 . 0 0
6 . 0 0
8 . 0 0
1 0 . 0 0
S T ( 0 5 J a n . 2 0 1 2 ) 1 5 F e b . 2 0 1 2 1 5 M a r . 2 0 1 2 H T ( 1 2 A p r . 2 0 1 2 )
T im e
Soil
pH
0 - 1 5 c m1 5 - 3 0 c m3 0 - 4 5 c m
Fig. 16. pH in different depths of soil profile during the total growing
period of sunflower affected by canal water irrigation
204

BINA Annual Report 2011-12 Agricultural Engineering
0 . 0 0
2 . 0 0
4 . 0 0
6 . 0 0
8 . 0 0
1 0 . 0 0
S T ( 0 5 J a n . 2 0 1 2 ) 1 5 F e b . 2 0 1 2 1 5 M a r . 2 0 1 2 H T ( 1 2 A p r . 2 0 1 2 )
T im e
Soil
pH
0 - 1 5 c m1 5 - 3 0 c m3 0 - 4 5 c m
Fig. 17. pH in different depths of soil profile during the total growing
period of sunflower affected by groundwater irrigation
Potentialities of using surface and ground water for maize cultivation in saline area
The objective of this experiment was to find out the possibility of growing maize after harvesting T. aman rice in saline soil and evaluate productivity and economics of growing maize using variable sources of irrigation water. This experiment was set at farmers’ field located at Kharibila village, Satkhira Sadar, Satkhira during January-May 2012. Maize crop was replicated among four selected farmers and experimental design was RCBD. After land preparation, applying required dozes of fertilizer, the seeds of maize (Pacific 60) were sown on 5th January 2012 maintaining required row (76 cm) and plant spacing within row (25 cm). As per treatment (T1 = no irrigation, T2 = canal water irrigation, and T3 = groundwater), irrigation water was applied up to field capacity. Soil moisture was measured by gravimetric method up to 60 cm for every 15 cm increment at the 10 days interval from sowing to harvest time. Other cultural practices were followed as per schedule and when necessary. Agro-meteorological data, amount of water applied at each irrigation, and phenological events (e.g. germination, vegetative, flowering, tesseling and silking stage and maturity etc.) were recorded. Soil sample was collected for analyzing different types of data, EC and pH of surface and groundwater before each irrigation, EC and pH data at different depths of root zone at 15 days interval. Maize crop harvested on 16th May, 2012. At the harvest time, yield and yield attributing characters of maize were recorded and soil samples were collected. Yield and yield attributing data were analyzed by MSTAT-C programme. Treatments had significant effect on yield and yield attributes of maize (Table 18). The highest grain yield was obtained from T2 treatment (9.61 t ha-1) followed by T3 treatment (8.38 t ha-1). Yield attributing characters showed better performance in T2 and T3 treatments than T1 treatment. Reasonable maize yield was found in T1 treatment due to rainfall and contribution of profile soil moisture (Fig. 18-19). The highest water use efficiency was observed in T2 followed by T1 and T3 treatments. T2 and T3 treatments received three irrigations in vegetative stage, tesseling and silking stage, and yield
205

BINA Annual Report 2011-12 Agricultural Engineering formation stage, respectively from canal water and groundwater source (Table 19-20). Soil moisture depletion was the highest in T1 treatment plot (Table 19, Fig. 19-21). Electrical conductivity (EC) of canal water and groundwater varied from 0.93 to 8.00 and 4.32 to 6.94 dS/m during the growing period of maize. The highest salinity was observed at the top soil (6.08 dS/m) followed by 15 cm soil depth (3.59 dS/m), 30 cm soil depth (2.93 dS/m), 45 cm soil depth (2.07 dS/m) and 60 cm soil depth (2.03 dS/m) (Fig. 22-24). Soil salinity was decreased with the increasing soil depth. Soil pH varied from 7.51 to 7.92, 7.68 to 7.89, 7.70 to 7.89 and 7.63 to 7.88 in different depths of soil profile at the growing period of maize (Fig. 25-27). The total number of human labour used for producing maize was 204 man-days ha-1 and per hectare human cost Tk. 51000.00 which is 51% of total variable cost of maize production. The highest number of human labour (25%) occupied in land preparation and harvesting, carrying and drying purpose followed by weeding and shelling and storing (12%), seed sowing and guarding (9%), manuring and irrigation (7%), pest management and earthing up (6%), Chemical fertilizer and top dressing and thinning (3%), respectively (Table 21). Per hectare cost of tractor and power tiller was Tk. 6000.00 which was 6% of total variable cost. (Table 22). Per hectare material cost was Tk. 43,706.00 which was 43% of total variable cost (Table 23). The highest material cost was for chemical fertilizer (66%) followed by soil treatment and irrigation water (9%), seed and cowdung (6%) and insecticide and pesticide (5%), respectively. Rental value of land for total growing period of maize was estimated as Tk. 6655.00 which constituted 78% of total fixed cost and the rest was interest on operating capital (22%) (Table 24). Total per hectare cost of maize production was Tk. 109207.30 which constituting per hectare of human labour cost 47%, power tiller and tractor cost 5%, material cost 40% and fixed cost 8%, respectively (Table 25). Benefit cost ratio was 1.94 and 1.74 implying one taka investment in maize production, returned Tk. 1.94 and Tk. 1.70 using irrigation water from canal and groundwater, respectively (Table 26). Table 18. Yield and yield attributes of maize for different treatments
Treatment Plant height (cm)
Leaf length (cm)
Leaf breadth
(cm)
Ear height (cm)
Cob length (cm)
Seeds cob-1
(no.)
1000-seed wt.
(gm)
Grain yield
(t ha-1) T1 192.27 89.13 7.11 88.93 11.83 405.40 342.67 7.16 T2 211.47 98.67 7.86 101.53 14.80 502.67 358.67 9.61 T3 202.13 94.67 7.50 95.07 13.40 467.47 351.67 8.38
LSD 0.05 6.99 4.73 0.63 8.28 0.71 46.16 3.46 1.35
Table 19. Irrigation water application, water use and water use efficiency of maize
Treatment Irrigation
water (cm)
Effective rainfall (cm)
Soil moisture depletion
(cm)
Water requirement
(cm)
Grain yield
(t ha-1)
Water use efficiency
(kg ha-1cm-1) T1 - 13.61 10.88 24.49 7.16 292 T2 9 13.61 9.72 32.33 9.61 297 T3 9 13.61 10.30 32.91 8.38 255
206

BINA Annual Report 2011-12 Agricultural Engineering Table 20. EC of different sources of irrigation water in different treatments during the different growth stages
of maize
Treatments Different growing periods of maize
Depth of irrigation (cm)
Sources of irrigation water
EC of irrigation water (dS m-1)
Vegetative stage 3 0.93 Tesseling and silking stage 3 7.86
T2
Yield formation stage 3
Canal water
8.00 Vegetative stage 3 4.32 Tesseling and silking stage 3 6.94
T3
Yield formation stage 3
Ground water
6.02
Table 21. Per hectare cost of human labour for producing maize
Item Human labour (nos. ha-1)
Total per hectare cost (Tk.)
Land preparation 40 10000 Manuring 12 3000 Chemical fertilizer & top dressing 5 1250 Seed sowing 15 3750 Thinning 5 1250 Weeding 20 5000 Insecticide and pesticide 10 2500 Earthing up 10 2500 Irrigation 12 3000 Guarding 15 3750 Harvesting, carrying and drying 40 10000 Shelling and storing 20 5000 Total 204 40800
Table 22. Per hectare cost of tractor and power tiller of maize production
Number of cultivation (nos. ha-1)
Unit cost (Tk.)
Total per hectare cost of tractor and power tiller (Tk.)
Tractor and power tiller 4 1500.00 6000.00
Table 23. Per hectare material cost of maize production
Material Quantity (kg)
Unit rate (Tk.)
Total cost (Tk.)
Seed 16 160 2560 Urea 555 20 11100 TSP 286 30 8580 MP 113 22 2486 Zypsum 276 10 2760 ZnSO4 17 150 2550 Borax 12 100 1200 Cowdung 4940 0.5 2470 Soil treatment 4000 Irrigation water 4000 Pesticide 2000 Total 43706
207

BINA Annual Report 2011-12 Agricultural Engineering Table 24. Fixed cost per hectare of maize production
Item of fixed cost Total cost (Tk.)
Land use cost 6655.00 Interest on operating capital 1846.28 Total fixed cost per hectare 8501.28
Table 25. Total per hectare cost of maize production
Item Total cost (Tk.)
Per hectare cost of human labour 51000 Per hectare cost of tractor and power tiller 6000 Per hectare material cost 43706 Fixed cost per hectare 8501.28 Total per hectare cost 109207.3
Table 26. Yield and return of maize production Irrigation from canal water Irrigation from groundwater
(kg ha-1) Unit price
(Tk.) Total cost
(Tk.) (kg ha-1) Unit price
(Tk.) Total cost
(Tk.) Cob yield 9610 20 192200 8380 20 167600 By product 10000 2 20000 9000 2 18000 Gross return/ha 212200 185600 Total cost 109207 109207 Gross margin/ha 111494 84894 Net return/ha 102992 76392 Benefit cost ratio 1.94 1.7
208

BINA Annual Report 2011-12 Agricultural Engineering
0
5
10
15
20
25
30
35
5/1/20
12
8/1/20
12
15-2-
2012
29-2-
2012
9/4/20
12
23-4-
12
1/5/20
12
4/5/20
12
Time
Rai
nfal
l, m
m
Fig. 18. Rainfall (mm) pattern during the growing periods of maize
012345678
1 5 3 0 4 5 6 0
S o i l d e p t h , c m
Soil
moi
stur
e (c
m)
S o w i n g t i m e ( 0 5 - J a n )2 5 - J a n5 - F e b1 5 - F e b2 5 - F e b5 - M a r1 5 - M a r2 5 - M a r5 - A p r1 5 - A p r2 5 - A p r5 - M a yH a r ve s t t i m e ( 1 6 - M a y )
Fig. 19. Volume basis soil moisture at different soil profiles during the
growing periods of maize affected by no irrigation
0
1
2
3
4
5
6
7
8
1 5 3 0 4 5 6 0
S o i l d e p t h , c m
Soil
moi
stur
e (c
m)
S o w i n g t i m e ( 0 5 - J a n )2 5 - J a n5 - F e b
1 5 - F e b2 5 - F e b5 - M a r1 5 - M a r
2 5 - M a r6 - A p r1 5 - A p r2 5 - A p r
5 - M a yH a r ve s t t i m e ( 1 6 - M a y )
Fig. 20. Volume basis soil moisture at different soil profiles during the
growing periods of maize affected by canal water irrigation
209

BINA Annual Report 2011-12 Agricultural Engineering
0
1
2
3
4
5
6
7
8
1 5 3 0 4 5 6 0
S o i l d e p t h , c m
Soil
moi
stur
e (c
m)
S o w i n g t i m e ( 0 5 - J a n )2 5 - J a n5 - F e b1 5 - F e b2 5 - F e b5 - M a r1 5 - M a r2 5 - M a r6 - A p r1 5 - A p r2 5 - A p r5 - M a yH a r ve s t t i m e ( 1 6 - M a y )
Fig. 21. Volume basis soil moisture at different soil profiles during the
growing periods of maize affected by groundwater irrigation
0
0 . 5
1
1 . 5
2
2 . 5
3
ST(0
5 Ja
n.
2012
)
15
Feb.
2012
15
Mar
.201
2
15
Apr
.201
2
HT
(15
May
201
2)
S o w in g t im e , g r o w in g p e r io d a n d h a r v e s t t i m e
Soil
salin
ity (d
S/m
)
T o p0 - 1 5 c m1 5 - 3 0 c m3 0 - 4 5 c m4 5 - 6 0 c m
Fig. 22. EC in different depths of soil profile during the different growing
stages of maize in affected by no irrigation
00 . 5
11 . 5
22 . 5
33 . 5
44 . 5
5
ST(0
5Ja
n. 2
012)
15Fe
b.20
12
15M
ar.2
012
15A
pr.2
012
HT
(15
May
2012
)
S o w i n g t i m e , g r o w i n g p e r i o d a n d h a r v e s t t i m e
Soil
salin
ity (d
S/m
)
T o p0 - 1 5 c m1 5 - 3 0 c m3 0 - 4 5 c m4 5 - 6 0 c m
Fig. 23. EC in different depths of soil profile during the different growing
stages of maize affected by canal water
210
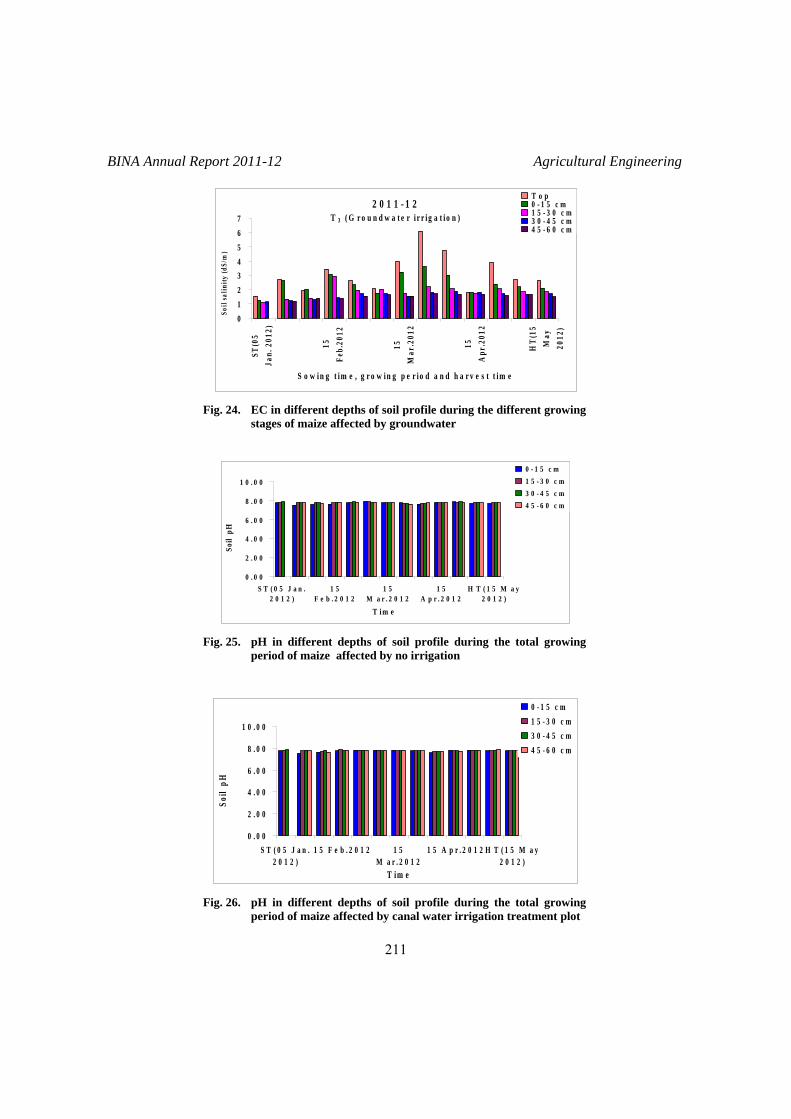
BINA Annual Report 2011-12 Agricultural Engineering
2 0 1 1 - 1 2T 3 ( G r o u n d w a t e r i r r ig a t io n )
01234567
ST(0
5Ja
n. 2
012)
15Fe
b.20
12
15M
ar.2
012
15A
pr.2
012
HT
(15
May
2012
)
S o w in g t im e , g r o w in g p e r io d a n d h a r v e s t t im e
Soil
salin
ity (d
S/m
)
T o p0 - 1 5 c m1 5 - 3 0 c m3 0 - 4 5 c m4 5 - 6 0 c m
Fig. 24. EC in different depths of soil profile during the different growing
stages of maize affected by groundwater
0 . 0 0
2 . 0 0
4 . 0 0
6 . 0 0
8 . 0 0
1 0 . 0 0
S T ( 0 5 J a n .2 0 1 2 )
1 5F e b . 2 0 1 2
1 5M a r . 2 0 1 2
1 5A p r . 2 0 1 2
H T ( 1 5 M a y2 0 1 2 )
T im e
Soil
pH
0 - 1 5 c m1 5 - 3 0 c m3 0 - 4 5 c m4 5 - 6 0 c m
Fig. 25. pH in different depths of soil profile during the total growing
period of maize affected by no irrigation
0 . 0 0
2 . 0 0
4 . 0 0
6 . 0 0
8 . 0 0
1 0 . 0 0
S T ( 0 5 J a n .2 0 1 2 )
1 5 F e b . 2 0 1 2 1 5M a r . 2 0 1 2
1 5 A p r . 2 0 1 2 H T ( 1 5 M a y2 0 1 2 )
T im e
Soil
pH
0 - 1 5 c m1 5 - 3 0 c m3 0 - 4 5 c m4 5 - 6 0 c m
Fig. 26. pH in different depths of soil profile during the total growing
period of maize affected by canal water irrigation treatment plot
211
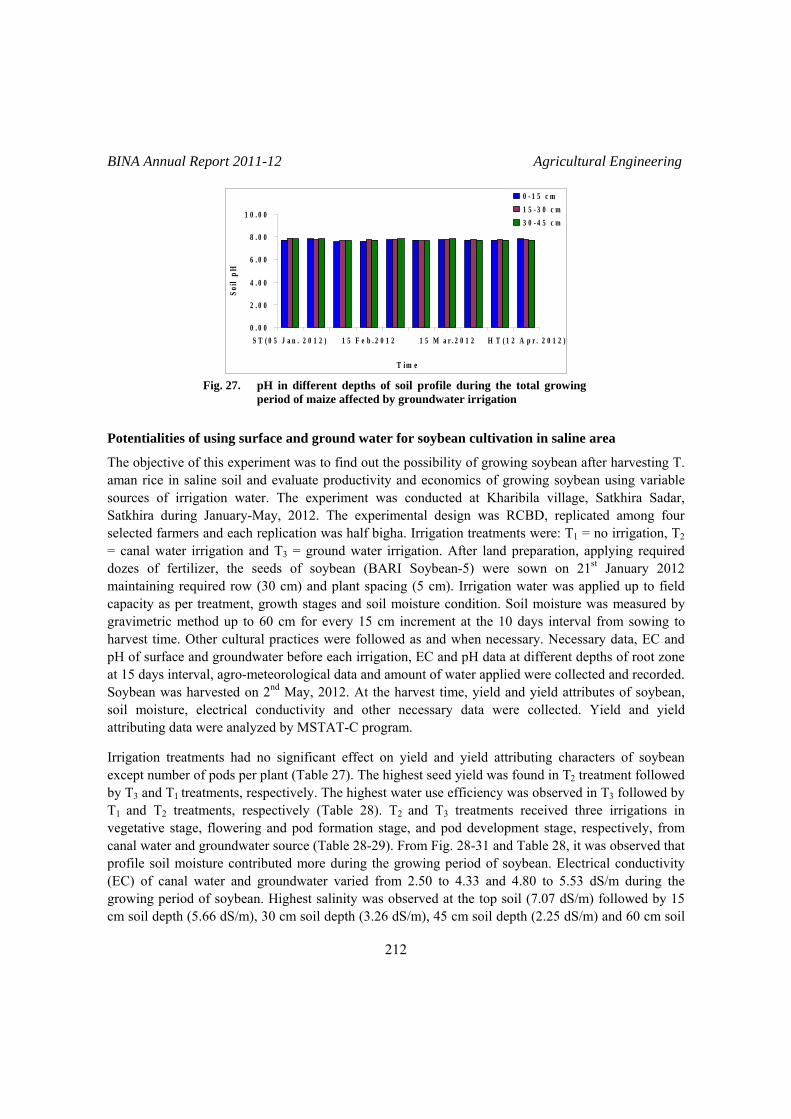
BINA Annual Report 2011-12 Agricultural Engineering
0 . 0 0
2 . 0 0
4 . 0 0
6 . 0 0
8 . 0 0
1 0 . 0 0
S T ( 0 5 J a n . 2 0 1 2 ) 1 5 F e b . 2 0 1 2 1 5 M a r . 2 0 1 2 H T ( 1 2 A p r . 2 0 1 2 )
T im e
Soil
pH
0 - 1 5 c m1 5 - 3 0 c m3 0 - 4 5 c m
Fig. 27. pH in different depths of soil profile during the total growing
period of maize affected by groundwater irrigation
Potentialities of using surface and ground water for soybean cultivation in saline area
The objective of this experiment was to find out the possibility of growing soybean after harvesting T. aman rice in saline soil and evaluate productivity and economics of growing soybean using variable sources of irrigation water. The experiment was conducted at Kharibila village, Satkhira Sadar, Satkhira during January-May, 2012. The experimental design was RCBD, replicated among four selected farmers and each replication was half bigha. Irrigation treatments were: T1 = no irrigation, T2 = canal water irrigation and T3 = ground water irrigation. After land preparation, applying required dozes of fertilizer, the seeds of soybean (BARI Soybean-5) were sown on 21st January 2012 maintaining required row (30 cm) and plant spacing (5 cm). Irrigation water was applied up to field capacity as per treatment, growth stages and soil moisture condition. Soil moisture was measured by gravimetric method up to 60 cm for every 15 cm increment at the 10 days interval from sowing to harvest time. Other cultural practices were followed as and when necessary. Necessary data, EC and pH of surface and groundwater before each irrigation, EC and pH data at different depths of root zone at 15 days interval, agro-meteorological data and amount of water applied were collected and recorded. Soybean was harvested on 2nd May, 2012. At the harvest time, yield and yield attributes of soybean, soil moisture, electrical conductivity and other necessary data were collected. Yield and yield attributing data were analyzed by MSTAT-C program. Irrigation treatments had no significant effect on yield and yield attributing characters of soybean except number of pods per plant (Table 27). The highest seed yield was found in T2 treatment followed by T3 and T1 treatments, respectively. The highest water use efficiency was observed in T3 followed by T1 and T2 treatments, respectively (Table 28). T2 and T3 treatments received three irrigations in vegetative stage, flowering and pod formation stage, and pod development stage, respectively, from canal water and groundwater source (Table 28-29). From Fig. 28-31 and Table 28, it was observed that profile soil moisture contributed more during the growing period of soybean. Electrical conductivity (EC) of canal water and groundwater varied from 2.50 to 4.33 and 4.80 to 5.53 dS/m during the growing period of soybean. Highest salinity was observed at the top soil (7.07 dS/m) followed by 15 cm soil depth (5.66 dS/m), 30 cm soil depth (3.26 dS/m), 45 cm soil depth (2.25 dS/m) and 60 cm soil
212

BINA Annual Report 2011-12 Agricultural Engineering depth (1.90 dS/m), respectively (Fig. 32-34). Soil salinity was decreased with the increasing soil depth. Soil pH varied from 7.41 to 7.77, 7.57 to 7.82, 7.60 to 7.84 and 7.56 to 7.77 in different depths of soil profile at the growing period of soybean (Fig. 35-37). The total number of human labour used for producing soybean was 144 man-days ha-1 and per hectare cost Tk. 36000.00 which is 62% of total variable cost of soybean production. The highest number of human labour (21%) occupied in land preparation followed by seed sowing (17%), weeding and harvesting, carrying and drying purpose (14%), thinning, nirani, irrigation and storing (7%) and application of chemical fertilizer and top dressing and insecticide and pesticide (3%), respectively (Table 30). Per hectare cost of tractor and power tiller was Tk. 4500.00 which was 8% of total variable cost (Table 31). Per hectare material cost was Tk. 17190.00 which was 30% of total variable cost (Table 32). The highest material cost was for chemical fertilizer (55%) followed by irrigation water (17%), seed (16%), and insecticide and pesticide (12%). Rental value of land for total growing period of soybean was estimated as Tk. 5097.13 which constituted 86% of total fixed cost and the rest was interest on operating capital (14%) (Table 33). Benefit cost ratio was 2.35 and 2.28 implying one taka investment in soybean production, returned Tk. 2.35 and Tk. 2.28 using irrigation water from canal and groundwater, respectively (Table 34). Table 27. Yield and yield attributes of soybean for different irrigation treatments
Treatment Plant height (cm)
Pods/Plant (nos.)
Pod length (cm)
Seeds pod-1
(nos.) 1000 seed wt.
(gm) Seed yield (kg ha-1)
Straw yield (kg ha-1)
T1 35.59 26.73 3.83 2.40 101.67 1486.00 3111.00 T2 36.93 41.20 4.03 2.80 110.67 2000.00 3583.33 T3 38.47 45.53 3.93 2.53 105.00 1944.33 3611.33
LSD 0.05 NS 11.96 NS NS NS NS NS Table 28. Irrigation water application, water requirement and water use efficiency of soybean
Treatment Irrigation
water (cm)
Effective rainfall
(cm)
Soil moisture depletion
(cm)
Water requirement
(cm)
Seed yield
(kg ha-1)
Water use efficiency
(kg ha-1cm-1) T1 - 7.36 10.84 18.20 1486 82 T2 9 7.36 8.16 24.52 2000 82 T3 9 7.36 10.88 27.24 1944 71
Table 29. EC of different sources of irrigation water in different treatments during the growing stages of soybean
Treatments Different growing periods of soybean
Depth of irrigation (cm)
Sources of irrigation water
EC of irrigation water (dS/m)
Vegetative stage 3 1.48 Flowering and pod formation stage 3 2.03
T2
Pod development stage 3
Canal water
7.86
Vegetative stage 3 5.36 Flowering and pod formation stage 3 6.40
T3
Pod development stage 3
Groundwater
6.94
213

BINA Annual Report 2011-12 Agricultural Engineering Table 30. Per hectare cost of human labour for producing soybean
Item Human labour (nos. ha-1)
Per hectare cost (Tk.)
Land preparation 30 7500 Chemical fertilizer & top dressing 5 1250 Seed sowing 25 6250 Thinning 10 2500 Weeding 20 5000 Insecticide and pesticide 4 1000 Nirani 10 2500 Irrigation 10 2500 Harvesting, carrying and drying 20 5000 Storing 10 2500 Total 144 36000
Table 31. Per hectare cost of tractor and power tiller of soybean production
Number of cultivation (nos. ha-1)
Unit cost (Tk.)
Total per hectare cost of tractor and power tiller (Tk.)
Tractor and power tiller 3 1500.00 4500.00
Table 32. Per hectare material cost of soybean production
Item of material cost Quantity (kg)
Unit rate (Tk.)
Total cost (Tk.)
Seed 56 50 2800.00 Urea 55 20 1100.00 TSP 163 30 4890.00 MP 110 22 2420.00 Gypsum 98 10 980.00 Pesticide 2000.00 Irrigation water 3000.00 Total per hectare material cost 17190.00
Table 33. Fixed cost per hectare of soybean production
Item of fixed cost Total cost (Tk.)
Land use cost 5097.13 Interest on operating capital 810.01 Total fixed cost per hectare 5907.14
214

BINA Annual Report 2011-12 Agricultural Engineering Table 34. Total per hectare cost of soybean production
Item of total cost per hectare Total cost (Tk.)
Per hectare cost of human labour 36000.00 Per hectare cost of tractor and power tiller 4500.00 Per hectare material cost 17190.00 Fixed cost per hectare 5907.14 Total per hectare cost 63597.14
Table 35. Yield and return of soybean production
Irrigation from canal water Irrigation from groundwater
(kg ha-1) Unit price
(Tk.) Total cost
(Tk.) (kg ha-1) Unit price
(Tk.) Total cost
(Tk.) Seed yield 2000 71 142000 1944.33 71 138047.4 By product 3583.33 2 7166.66 3611.33 2 7222.66 Gross return ha-1 149166.7 145270.1 Total cost 63597.14 63597.14 Gross margin ha-1 91476.7 87580.1 Net return ha-1 85569.56 81672.96 Benefit cost ratio 2.35 2.28
0
5
10
15
20
25
30
35
8/2/2012 6/4/2012 9/4/2012 12/4/2012 24/4/2012 1/5/2012
Time
Rai
nfal
l, m
m
Fig. 28. Rainfall (mm) pattern during the growing periods of soybean
215

BINA Annual Report 2011-12 Agricultural Engineering
0
1
2
3
4
5
6
7
8
1 5 3 0 4 5 6 0
S o i l d e p t h ( c m )
Soil
moi
stur
e (c
m)
S o w i n g t i m e ( 2 1 - J a n )5 - F e b1 5 - F e b2 5 - F e b1 5 - M a r2 2 - M a r5 - A p r1 5 - A p r2 5 - A p rH a r ve s t t i m e ( 0 2 - M a y )
Fig. 29. Volume basis soil moisture at different soil profiles during the
growing periods of soybean affected by no irrigation
0
1
2
3
4
5
6
7
8
1 5 3 0 4 5 6 0
S o i l d e p l t h ( c m )
Soil
moi
stur
e (c
m)
S o w i n g t i m e ( 2 1 - J a n )1 5 - F e b2 5 - F e b1 5 - M a r2 2 - M a r5 - A p r1 5 - A p r2 5 - A p rH a r ve s t t i m e ( 0 2 - M a y )
Fig. 30. Volume basis soil moisture at different soil profiles during the
growing periods of soybean affected by canal water irrigation
0 . 0 01 . 0 02 . 0 03 . 0 04 . 0 0
5 . 0 06 . 0 07 . 0 08 . 0 0
1 5 3 0 4 5 6 0S o i l d e p t h ( c m )
Soil
moi
stur
e (c
m)
S o w i n g t i m e ( 2 1 - J a n )1 5 - F e b2 5 - F e b1 5 - M a r2 2 - M a r5 - A p r1 5 - A p r2 5 - A p rH a r ve s t t i m e ( 0 2 - M a y )
Fig. 31. Volume basis soil moisture at different soil profiles during the
growing periods of soybean affected by groundwater irrigation
216

BINA Annual Report 2011-12 Agricultural Engineering
0 . 0 00 . 5 01 . 0 01 . 5 02 . 0 02 . 5 03 . 0 03 . 5 04 . 0 0
Sow
ing
time
(21
Jan.
2012
)
05
Mar
.201
2
05
Apr
.201
2
HT(
2 M
ay
2012
)
S o w i n g t i m e , g r o w i n g p e r i o d a n d h a r v e s t t i m e
Soil
salin
ity (d
S/m
)
T o p0 - 1 5 c m1 5 - 3 0 c m3 0 - 4 5 c m4 5 - 6 0 c m
Fig. 32. EC in different depths of soil profile during the growing period of
soybean affected by no irrigation
0 . 0 01 . 0 02 . 0 03 . 0 04 . 0 05 . 0 06 . 0 07 . 0 0
Sow
ing
time
(21
Jan.
201
2)
05M
ar.2
012
05A
pr.2
012
HT
(2 M
ay20
12)
S o w in g t im e , g r o w in g p e r io d a n d h a r v e s t t im e
Soil
salin
ity (d
S/m
)
T o p0 - 1 5 c m1 5 - 3 0 c m3 0 - 4 5 c m4 5 - 6 0 c m
Fig. 33. EC in different depths of soil profile during the growing period of
soybean affected by canal water irrigation
0 . 0 01 . 0 02 . 0 03 . 0 04 . 0 05 . 0 06 . 0 07 . 0 08 . 0 0
Sow
ing
time
(21
Jan.
201
2)
05M
ar.2
012
05A
pr.2
012
HT
(2 M
ay20
12)
S o w in g t im e , g r o w in g p e r io d a n d h a r v e s t t im e
Soil
salin
ity (d
S/m
)
T o p0 - 1 5 c m1 5 - 3 0 c m3 0 - 4 5 c m4 5 - 6 0 c m
Fig. 34. EC in different depths of soil profile during the growing period of
soybean affected by groundwater irrigation
217

BINA Annual Report 2011-12 Agricultural Engineering
0 . 0 0
2 . 0 0
4 . 0 0
6 . 0 0
8 . 0 0
1 0 . 0 0
S o w i n g t i m e ( 2 1J a n . 2 0 1 2 )
0 5 M a r . 2 0 1 2 0 5 A p r . 2 0 1 2 H T ( 2 M a y 2 0 1 2 )
T im e
Soil
pH
0 - 1 5 c m1 5 - 3 0 c m3 0 - 4 5 c m4 5 - 6 0 c m
Fig. 35. pH in different depths of soil profile during the total growing
period of soybean affected by no irrigation
0 . 0 0
2 . 0 0
4 . 0 0
6 . 0 0
8 . 0 0
1 0 . 0 0
S o w i n g t i m e ( 2 1J a n . 2 0 1 2 )
0 5 M a r . 2 0 1 2 0 5 A p r . 2 0 1 2 H T ( 2 M a y 2 0 1
T im e
Soil
pH
0 - 1 5 c m1 5 - 3 0 c m3 0 - 4 5 c m4 5 - 6 0 c m
Fig. 36. pH in different depths of soil profile during the total growing
period of soybean affected by canal water irrigation
0 . 0 0
2 . 0 0
4 . 0 0
6 . 0 0
8 . 0 0
1 0 . 0 0
S o w i n g t i m e ( 2 1J a n . 2 0 1 2 )
0 5 M a r . 2 0 1 2 0 5 A p r . 2 0 1 2 H T ( 2 M a y 2 0 1 2 )
T im e
Soil
pH
0 - 1 5 c m1 5 - 3 0 c m3 0 - 4 5 c m4 5 - 6 0 c m
Fig. 37. pH in different depths of soil profile during the total growing
period of soybean affected by groundwater irrigation
218

BINA Annual Report 2011-12 Agricultural Engineering Water management for enhancing crop production under changing climate (SPGR Funded Project: BINA Component)
Baseline survey in Mymensingh and Magura district
A baseline survey questionnaire was conducted at Mymensingh Sadar, Mymensingh district and Magura Sadar, Magura district for collection of basic information on farmers’ socio-economic conditions, existing cropping pattern, cultivated land, irrigation practices and knowledge about climatic change in different experimental site of SPGR sub-project. Digharkanda, Alalpur and Rahmatpur of Mymensingh Sadar Upazila, Mymensingh and Poshchim Ramnagar, Shachani and Rawtola of Magura Sadar Upazila, Magura district were selected for the baseline survey (Fig. 38). Random sampling procedure was followed in the survey. Farmers’ details (names and addresses) were collected from Upazila Krishi Office, Mymensingh Sadar, Mymensingh and Magura Sadar, Magura. The farmers were grouped as large (2%), medium (31%), marginal (18%) and small (48%) in three villages for Mymensingh and farmers were grouped as large (4%), medium (26%), marginal (20%) and small farmer (50%) in three villages for Magura. A total of 130 farmers in Mymensingh and 120 farmers in Magura were drawn randomly from the 250 large, medium, marginal and small farmers in Mymensingh and from the 180 large, medium, marginal and small farmers in Magura. Moreover, a reserve list of 50 farmers in Mymensingh and 40 farmers in Magura were maintained in order to minimize the difficulties due to farmers’ unavailability or absence during data collection. Thus, the sample size was 130 in Mymensingh and 120 in Magura for the baseline survey. The PIs and Co-PIs prepared a survey questionnaire considering the project theme and actual situation of the study area. Necessary care and attention were given in developing questionnaire in general and the questionnaire was prepared in Bengali for better understanding of the farmers. Later, the project consultant, in a consultative meeting with project coordinator, co-project coordinator and PIs finalized a unified questionnaire for the baseline survey. Assistant Scientific Officer, Scientific Assistant-1 of BINA and Sub-Assistant Agriculture Officer of Upazila Agriculture office conducted face to face interviews from 1st October to 6th October 2011 at Mymensingh and from 16th October to 21st October at Magura (Fig 39). The interviewers collected information within stipulated time frame. In order to get valid and relevant information from the farmers, all possible efforts were made to achieve the purpose of the survey. Whenever any farmer felt difficulty in understanding any question, the interviewer took utmost care to explain and clarify properly. The data collected from the selected farmers were systematically recorded, edited, compiled, tabulated and analyzed. The software MS Excel was used to analyze the data. Descriptive statistical measures such as ranges and percentage distribution were used in describing the variables of the survey. The age of the selected farmers at Mymensingh Sadar and Magura Sadar ranged from 20 to 75 years and 22 to 75 years, respectively and number of their family members ranged from 1 to 10 and 1 to 8, respectively. The personal educational levels of the farmers at Mymensingh Sadar and Magura Sadar are presented in Table 36. The educational qualification of majority of the farmers ranged from class-I to class-V. The majority of the selected farmers are involved in agriculture as a means of their livelihood. Rest of them are in agriculture and others, and agriculture and business. The occupation pattern of the farmers at Mymensingh Sadar and Magura Sadar are presented in Table 37. Majority of
219

BINA Annual Report 2011-12 Agricultural Engineering the respondents have their own land and cultivate by self initiatives and homestead both at Mymensingh and Magura Sadar. There is a little fallow land (1%) in both the study area. No fish gher was found in the study area of Magura. Type of land owner and farm size of farmers are presented in Table 38. The percentage shares of the households’ and others assets are illustrated in Tables 39-40. There are variations in housing type like half-bricked building, brick building, tin shed house and straw shed and tin made house at Mymensingh Sadar and Magura Sadar. About 50% farmers in both the study area live in tin shed house. About 100% of the household have separate cooking shed. Electricity connection certainly represents the standard of living and capacity of utilizing energy. Eighty six percent of surveyed households at Mymensingh Sadar have access to electric power where as 54% at Magura Sadar. Most of the farmers use self hand tubewell and hygienic latrine in both locations. The loan taken by the farmers from different banks and NGOs are presented in Table 41. Most of the farmers (50-68%) have taken loan from Government Bank; few farmers (12-17%) have taken loan from non-Government Bank and rest of them have taken loan from NGOs/person. The land type of the selected farmers are high land, medium high land, medium low land, low land and very low land (Table 42). Majority of the farmers have medium high land in both the locations. Farmer’s yearly income, production cost and net profit from agriculture and non-agriculture sources are presented in Table 43. Farmers yearly income ranged from Tk. 14,000 to Tk. 19,83,000 from agricultural and non-agricultural sources and net profit ranged from Tk. 4,000 to Tk.6,55,000 at Mymensingh Sadar. At Magura Sadar, yearly income ranged from Tk. 3,400 to Tk. 9,22,800 from agricultural and non-agricultural sources and net profit ranged from Tk. 2000 to Tk. 3,42,800. Farmers cropped lands at Mymensingh Sadar and Magura Sadar ranged from 0.01 to 9.06 acres and 0.11 to 6.97 acres, respectively. Majority of the farmers have twice crop-growing land at both Upazila. But there is no thrice crop-growing land at Mymensingh Sadar Upazila (Table 44). The principal cropping patterns followed by the selected farmers are Aman-fallow-Boro (97%) at Mymensingh Sadar and rice-mustard, lentil-jute (71%) at Magura Sadar. But wide variations were found in the cropping patterns at Magura Sadar (Table 45). The most popular varieties in aman and boro season are BR11 and Boroafgi, and BRRI dhan28 and BRRI dhan29, respectively for Mymensingh. Life cycle (transplanting to harvest) of aman and boro rice varied from 110 to 190 and 105 to 190 days, respectively. Aman and Boro rice production varied from 0.12 to 5.75 t ha-1 and 2.87 to 8.14 t ha-1, respectively. Majority (88%) of the farmers are informed about the changes of climate. In both the season, they are facing various problems due to climate changes as unavailability of rainfall in peak period, excess rainfall, higher insect and diseases infestation, stagnant growth of rice plant, unavailability of irrigation water due to declining of groundwater table, drought problem, foggy weather, cold wave, water logging, etc due to climate changes. Majority (80%) of the farmers opined that they cultivated aman rice in rainfed condition and rest of the farmers informed that rainfall was not sufficient for aman rice cultivation. So, they met-up their water need by applying supplemental irrigation in aman field. Hundred percent of the farmers were found to depend on irrigation water for Boro rice cultivation. Majority (80%) of the selected farmers reported that they did not apply irrigation water. Rest of the farmers irrigated their land 1 to 3 times and irrigation coverage ranged from 0.01 to 3.22 acres in aman season. Hundred percent of farmers’ irrigated their land 9 to 60 times in boro season and irrigated land ranged from 0.01 to 7.85 acres, respectively. Majority (92%) of the farmers opined that they were facing various problems when they applied irrigation water in boro season at Mymensingh Sadar upazila. They faced
220

BINA Annual Report 2011-12 Agricultural Engineering problems for unavailability of irrigation water due to conflict within the members of the irrigation societies and mechanical disturbance, high price of diesel and electricity, load shedding, irrigation water losses due to earthen canal and unavailability of irrigation water due to depletion of groundwater table. Opinions of the farmers for problems of application of irrigation water in aman and boro seasons are presented below in Table 46. Majority of the selected farmers reported availability of the irrigation system as about normal. The cropped lands were irrigated by self-management and other management. Mainly, those farmers who had STW and LLP, they used to irrigate their lands by self-management. Forty six percent selected farmers at Mymensingh Sadar Upazila used STW irrigation systems while 40% of the farmer used DTW. But 100% selected farmers at Magura Sadar Upazila used STW (Table 47). In respect to farmer’s familiarity with advanced water management technology in aman and boro season, majority of the farmers (65 to 73%) opined that they were not familiar with advanced technology and rest of the farmers were familiar with only AWD technology in aman and boro season. Opinions of the farmers for irrigation cost in all seasons are presented in Table 49. In respect to cost of irrigation in aman and boro season it was observed that farmer’s opinion were different. Majority of the farmers (52%) opined that the irrigation cost was very high in aman season. On the other hand, 64% farmers informed that the irrigation cost was high in boro season in Mymensingh. But in Magura, majority of the farmers opined that the irrigation cost was very high in aus and Kharif-1 seasons. The irrigation cost varied from Tk. 200 to 800 per bigha i.e. 33 decimal for varied irrigation frequencies in aman and boro season. Sources of irrigation water are given in Table 48. In respect to the source of irrigation water it was observed that most of the farmers used groundwater for crop cultivation. Sometimes farmers lifted groundwater and gathered in the pond. Usually they used their pond (100%) mainly in domestic purpose, fish cultivation and duck farming, etc. There are lots of problems in agricultural development in both the study areas. In respect to problems, farmers’ opinions are: High price of electricity, high price of chemical fertilizer, high cost of production but low market price, problems in taking agricultural loan from the scheduled bank, high load shedding, lack of technical knowledge, lack of modern agricultural machinery, unavailability of agricultural labour during the peak season, unfavorable weather, water logging condition, depletion of organic matter in the soil, lack of organized training for the farmers, adulteration of fertilizer and seed, depletion of groundwater table, unavailability of irrigation equipments, and water loss due to earthen canal. To address the said agricultural problems, farmer’s opinions were: Per unit electricity and diesel price should be reduced for irrigation use, supply of good seed should be ensured to the farmers without middle men, Government subsidy in respect to seed, fertilizer and agricultural machinery should be increased just to minimize the cost of production, ensure supply of pure fertilizer, market price of the agricultural products should be fixed in accordance with cost of production, remediation of water logging condition in the agricultural land, educate farmer through organizing training on improved practices, innovations and technology, ensuring supply of electricity and implementation of improved water distribution system.
221

BINA Annual Report 2011-12 Agricultural Engineering
MYMENSINGH
MAGURA
(a) Mymensingh Sadar (b) Magura Sadar
Fig. 38. Locations of the study area
222

BINA Annual Report 2011-12 Agricultural Engineering
Fig. 39. Photographic views of baseline survey
223

BINA Annual Report 2011-12 Agricultural Engineering Table 36. Educational qualification of the farmers
Education level (%) Study area No education Sign only 1-5 class 6-10 class SSC HSC HSC< Mymensingh Sadar 18 11 24 22 17 2 6 Magura Sadar 1 1 41 36 16 3 2
Table 37. Present occupational pattern of the farmers
Occupation (%) Study area Agriculture Agriculture and others Agriculture and business Mymensingh Sadar 89 5 6 Magura Sadar 98 1 1
Table 38. Farm sizes of the farmers
Mymensingh Sadar Magura Sadar Type of land owner Farm size (acre) Percentage (%) Farm size (acre) Percentage (%) Own land under own cultivation 0.01 to 6.04 27 0.08 to 9.76 23 Land taken from other on ‘Borga’ 0.30 to 5.03 7 0.12 to 3.38 16 Land taken from other on lease 0.10 to 4.13 7 0.15 to 1.39 7 Homestead 0.03 to 0.65 31 0.01 to 1.26 27 Pond 0.02 to 3.52 15 0.07 to 1.39 6 Own land given to others on Borga 0.10 to 5.03 2 0.16 to 6.97 4 Own land given to others on lease 0.10 to 1.61 3 0.18 to 1.92 2 Garden 0.03 to 0.81 5 0.12 to 20.91 14 Fish gher 0.03 to 4.63 2 0.00 0 Fallow land 0.05 to 0.20 1 0.32 1
Table 39. The percentage shares of the households
Assets name Mymensingh Sadar Magura Sadar Half bricked building 28 18 Brick building 12 3 Tin shed house 49 59
Type of House
Straw shed & tin made house 12 20 Self 89 81 Others 2 0 Jointly 5 16
Hand Tube well
None 4 3 Hygienic 89 69 Latrine Non hygienic 11 31 Cooking shed 100 98 Cow shed 63 92
Others
Electricity connection 86 54
224

BINA Annual
Report 2011-12 Agricultural Engineering
225
Table 40. The percentage shares of the others assets
Assets name Mymensingh Sadar Magura Sadar Irrigation pump 49 38 Power tiller 10 6 Thresher 1 24 Plough 2 19 Sprayer 5 33 Fishing net 20 6 Fish trap 2 5 Shop 10 18
Table 41. Farmers received loan from different Bank and NGOs
Name of the Bank/NGOs Study area Sonali
Bank Bangladesh
Agricultural BankBRAC Bank
Grameen Bank
AB Bank
NGO/ Person
Mymensingh Sadar 29 21 05 10 02 33 Magura Sadar 0 68 8 4 0 21
Table 42. Land type and size of land of farmers in different location
Mymensingh Sadar Magura Sadar Land type
Farm size (acre) Percentage (%) Farm size (acre) Percentage (%) High land 0.01 to 4.23 32 0.12 to 0.70 26 Medium high land 0.01 to 7.53 33 0.14 to 20.91 54 Medium low land 0.01 to 3.62 19 0.11 to 2.83 11 Low land 0.10 to 3.02 1 0.24 to 2.09 8 Very low land/others 0.40 to 3.62 15 0.32 to 1.39 1

Report 2011-12 Agricultural Engineering
226
Table 43. Farmer’s yearly income, productions cost and net profit from agricultural and non-agriculture sources
Mymensingh Sadar Magura Sadar
Sources Total yearly income
(Tk.)
Total production cost (Tk.)
Net yearly profit (Tk.)
Total yearly income (Tk.)
Total production cost
(Tk.)
Net yearly Profit (Tk.)
1. Crop 13,040-4,80,600 6,000-3,45,000 4,000-3,15,500 4000-584600 800-1152400 2000-2278400
2. Livestock 1,000-1,50,000 200-40,000 800-1,25,000 10000-130000 2000-30000 6000-114300
3. Fisheries 5,000-10,00,000 1200-7,00,000 4,000-3,00,000 4000-5000 1000-3000 200-3000
4. Poultry 500-33,000 200-1,80,000 200-15,000 500-2000 100-1000 300-2000
Agricultural
Total (Tk.) 13,040-14,83,000 7,000-8,28,000 4,000-6,55,000 3200-442800 2000-188000 2000-342800
1. Agricultural labours 5,000-1,00,000 - - 2000-5000 - -
2. Service 10,000-2,28,000 - - 10000-180000 - -
3. Trade and business 5,000-10,00,000 - - 2000-10000 - -
4. Non-agricultural labours 2,000-75,000 - - 200-72000 - -
Non-agricultural
5. Others 800-1,20,000 - - 3500-10000 - -
Total (Tk.) 800-10,00,000 - - 2000-480000 - -
Total yearly income (Tk.) from agricultural and non-agricultural source 14,000-19,83,000 - - 3400-922800 - -
BINA Annual

BINA Annual Report 2011-12 Agricultural Engineering
227
Table 44. Different types of the farmers’ crop lands
Single crop land Double crop land Triple crop land Study area Farm size
(acre) Percentage
(%) Farm size
(acre) Percentage
(%) Farm size
(acre) Percentage
(%) Mymensingh Sadar 0.10 to 8.45 10 0.01 to 9.06 90 - - Magura Sadar 0.11 to 3.65 13 0.28 to 6.97 68 0.24 to 3.49 19
Table 45. Existing cropping pattern of the farm
Area Cropping pattern Percentage (%)
T. aman-Fallow-Boro 97 T. aman-Fallow-Fallow 1
Mymensingh Sadar
Boro-Fallow-Fallow 2 T. aman-Mustard, Lentil-Jute 71 T. aman-Mustard, Lentil-Fallow 17 Fallow-Mustard, Lentil-Jute 4 T. aman-Vegetable-Jute 1 T. aman-Mustard-Boro 1 T. aman-Wheat-Fallow 2 Wheat-Fallow-Fallow 2
Magura Sadar
Mustard, Lentil 2 Table 46. Opinions of the farmers for problems of application of irrigation water in aman and boro season
Study area Season Yes No Aman 41% 59% Mymensingh Sadar Boro 92% 8% Aman 48% 52%
Magura Sadar Boro 72% 28%
Table 47. Farmers used irrigation systems
Irrigation system (%) Study area
DTW STW LLP LLP & STW LLP & DTW Mymensingh Sadar 40 46 6 2 6 Magura Sadar 0 100 0 0 0
Table 48. Source of irigation water in percentage
Area Drain Water
Pond water
Rain water
Tubewell water
Other source
Mymensingh Sadar 0.00 0.00 0.00 100 0.00 Magura Sadar 7.56 0.00 0.00 92.00 0.00
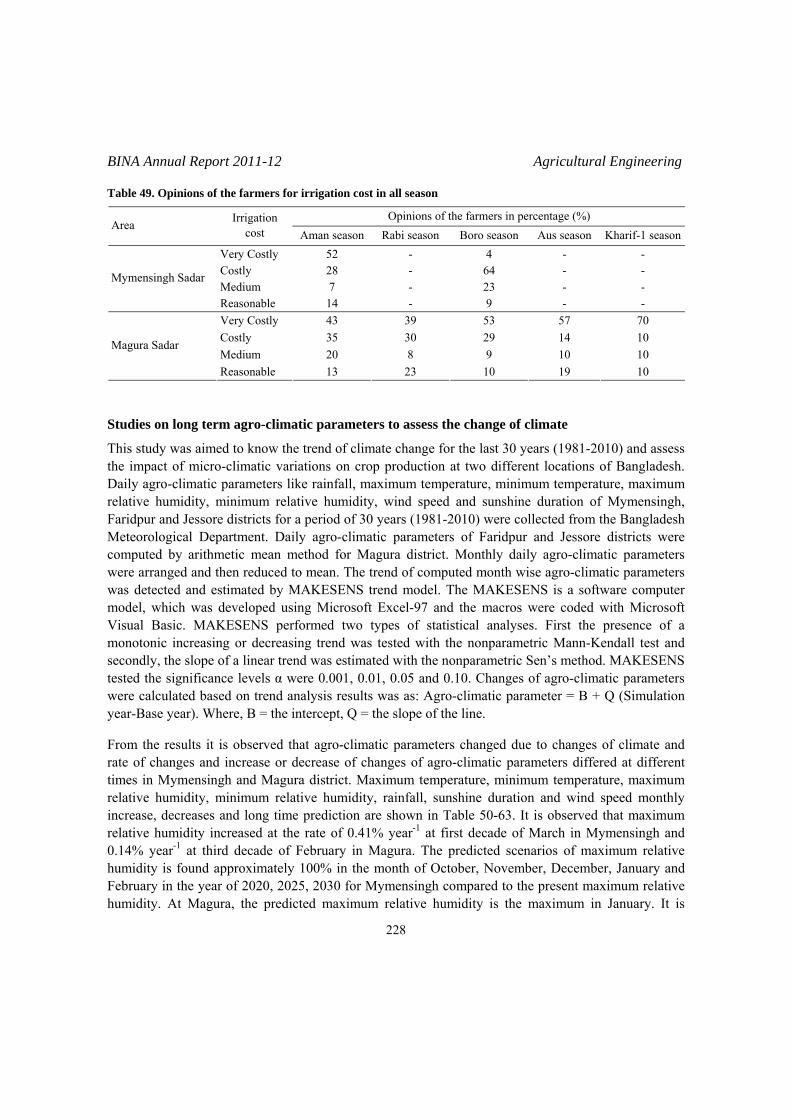
BINA Annual Report 2011-12 Agricultural Engineering
228
Table 49. Opinions of the farmers for irrigation cost in all season
Opinions of the farmers in percentage (%) Area Irrigation
cost Aman season Rabi season Boro season Aus season Kharif-1 seasonVery Costly 52 - 4 - - Costly 28 - 64 - - Medium 7 - 23 - -
Mymensingh Sadar
Reasonable 14 - 9 - - Very Costly 43 39 53 57 70 Costly 35 30 29 14 10 Medium 20 8 9 10 10
Magura Sadar
Reasonable 13 23 10 19 10 Studies on long term agro-climatic parameters to assess the change of climate
This study was aimed to know the trend of climate change for the last 30 years (1981-2010) and assess the impact of micro-climatic variations on crop production at two different locations of Bangladesh. Daily agro-climatic parameters like rainfall, maximum temperature, minimum temperature, maximum relative humidity, minimum relative humidity, wind speed and sunshine duration of Mymensingh, Faridpur and Jessore districts for a period of 30 years (1981-2010) were collected from the Bangladesh Meteorological Department. Daily agro-climatic parameters of Faridpur and Jessore districts were computed by arithmetic mean method for Magura district. Monthly daily agro-climatic parameters were arranged and then reduced to mean. The trend of computed month wise agro-climatic parameters was detected and estimated by MAKESENS trend model. The MAKESENS is a software computer model, which was developed using Microsoft Excel-97 and the macros were coded with Microsoft Visual Basic. MAKESENS performed two types of statistical analyses. First the presence of a monotonic increasing or decreasing trend was tested with the nonparametric Mann-Kendall test and secondly, the slope of a linear trend was estimated with the nonparametric Sen’s method. MAKESENS tested the significance levels α were 0.001, 0.01, 0.05 and 0.10. Changes of agro-climatic parameters were calculated based on trend analysis results was as: Agro-climatic parameter = B + Q (Simulation year-Base year). Where, B = the intercept, Q = the slope of the line. From the results it is observed that agro-climatic parameters changed due to changes of climate and rate of changes and increase or decrease of changes of agro-climatic parameters differed at different times in Mymensingh and Magura district. Maximum temperature, minimum temperature, maximum relative humidity, minimum relative humidity, rainfall, sunshine duration and wind speed monthly increase, decreases and long time prediction are shown in Table 50-63. It is observed that maximum relative humidity increased at the rate of 0.41% year-1 at first decade of March in Mymensingh and 0.14% year-1 at third decade of February in Magura. The predicted scenarios of maximum relative humidity is found approximately 100% in the month of October, November, December, January and February in the year of 2020, 2025, 2030 for Mymensingh compared to the present maximum relative humidity. At Magura, the predicted maximum relative humidity is the maximum in January. It is

BINA Annual
Report 2011-12 Agricultural Engineering
229
observed that maximum temperature decreased at the rate of 2.78oC year-1 at first decade of April and increased at the rate of 2.12oC year-1 at second decade of May in Mymensingh district. In Magura district, this rate is 2.1oC at first decade of April and 2.67oC at second decade of May, respectively. Maximum temperature in 2012 was observed 33.59oC at second decade of May and 36.25oC at third decade of April in Mymensingh and Magura districts, respectively. The predicted maximum temperature in the year 2020, 2025 and 2030 are 34.18, 34.54, 34.91oC in Mymensingh and 36.05, 36.38, 36.70oC in Magura at decade of May, respectively. Long term (1981-2010) average annual rainfall are about 2054 mm and 1801mm in Mymesingh and Magura, respectively, while the national average is 2030 mm. Approximately 82% rainfall in Mymensingh and 78% rainfall in Magura occurred in monsoon season (during the months from May to September). It is observed that rainfall decreased at the rate of 4.89 cm year-1 in September and increased at the rate of 4.0 cm year-1 in June in Mymensingh district while, in Magura district, rainfall decreased at the rate of 0.09 cm year-1 in May and increased at the rate of 0.02 cm year-1 in July. The predicted maximum rainfall is in June for Mymensingh and in July for Magura in 2020, 2025 and 2030, respectively.
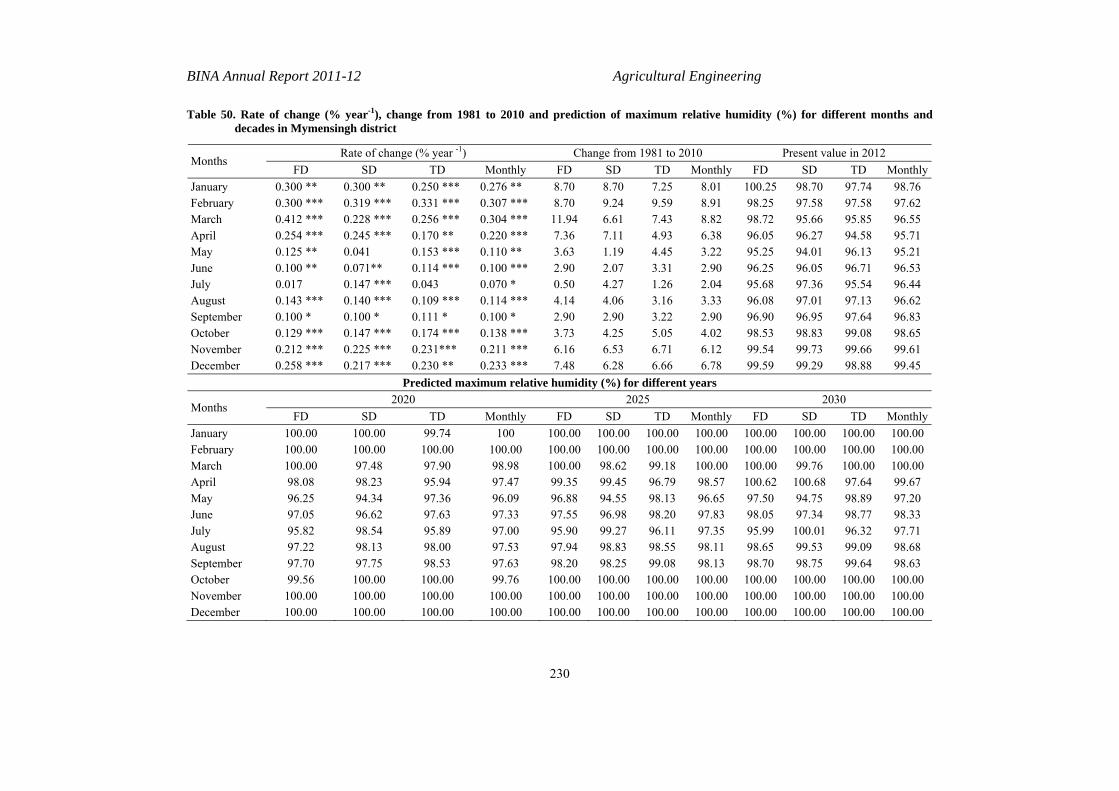
BINA Annual Report 2011-12 Agricultural Engineering
Table 50. Rate of change (% year-1), change from 1981 to 2010 and prediction of maximum relative humidity (%) for different months and decades in Mymensingh district
Rate of change (% year -1) Change from 1981 to 2010 Present value in 2012 Months
FD SD TD Monthly FD SD TD Monthly FD SD TD MonthlyJanuary 0.300 ** 0.300 ** 0.250 *** 0.276 ** 8.70 8.70 7.25 8.01 100.25 98.70 97.74 98.76 February 0.300 *** 0.319 *** 0.331 *** 0.307 *** 8.70 9.24 9.59 8.91 98.25 97.58 97.58 97.62 March 0.412 *** 0.228 *** 0.256 *** 0.304 *** 11.94 6.61 7.43 8.82 98.72 95.66 95.85 96.55 April 0.254 *** 0.245 *** 0.170 ** 0.220 *** 7.36 7.11 4.93 6.38 96.05 96.27 94.58 95.71 May 0.125 ** 0.041 0.153 *** 0.110 ** 3.63 1.19 4.45 3.22 95.25 94.01 96.13 95.21 June 0.100 ** 0.071** 0.114 *** 0.100 *** 2.90 2.07 3.31 2.90 96.25 96.05 96.71 96.53 July 0.017 0.147 *** 0.043 0.070 * 0.50 4.27 1.26 2.04 95.68 97.36 95.54 96.44 August 0.143 *** 0.140 *** 0.109 *** 0.114 *** 4.14 4.06 3.16 3.33 96.08 97.01 97.13 96.62 September 0.100 * 0.100 * 0.111 * 0.100 * 2.90 2.90 3.22 2.90 96.90 96.95 97.64 96.83 October 0.129 *** 0.147 *** 0.174 *** 0.138 *** 3.73 4.25 5.05 4.02 98.53 98.83 99.08 98.65 November 0.212 *** 0.225 *** 0.231*** 0.211 *** 6.16 6.53 6.71 6.12 99.54 99.73 99.66 99.61 December 0.258 *** 0.217 *** 0.230 ** 0.233 *** 7.48 6.28 6.66 6.78 99.59 99.29 98.88 99.45
Predicted maximum relative humidity (%) for different years 2020 2025 2030
Months FD SD TD Monthly FD SD TD Monthly FD SD TD Monthly
January 100.00 100.00 99.74 100 100.00 100.00 100.00 100.00 100.00 100.00 100.00 100.00 February 100.00 100.00 100.00 100.00 100.00 100.00 100.00 100.00 100.00 100.00 100.00 100.00 March 100.00 97.48 97.90 98.98 100.00 98.62 99.18 100.00 100.00 99.76 100.00 100.00 April 98.08 98.23 95.94 97.47 99.35 99.45 96.79 98.57 100.62 100.68 97.64 99.67 May 96.25 94.34 97.36 96.09 96.88 94.55 98.13 96.65 97.50 94.75 98.89 97.20 June 97.05 96.62 97.63 97.33 97.55 96.98 98.20 97.83 98.05 97.34 98.77 98.33 July 95.82 98.54 95.89 97.00 95.90 99.27 96.11 97.35 95.99 100.01 96.32 97.71 August 97.22 98.13 98.00 97.53 97.94 98.83 98.55 98.11 98.65 99.53 99.09 98.68 September 97.70 97.75 98.53 97.63 98.20 98.25 99.08 98.13 98.70 98.75 99.64 98.63 October 99.56 100.00 100.00 99.76 100.00 100.00 100.00 100.00 100.00 100.00 100.00 100.00 November 100.00 100.00 100.00 100.00 100.00 100.00 100.00 100.00 100.00 100.00 100.00 100.00 December 100.00 100.00 100.00 100.00 100.00 100.00 100.00 100.00 100.00 100.00 100.00 100.00
230

BINA Annual Report 2011-12 Agricultural Engineering
Table 51. Rate of change (% year -1), change from 1981 to 2010 and prediction of minimum relative humidity (%) for different months and decades in Mymensingh district
Rate of change (% year -1) Change from 1981 to 2010 Present value in 2012
Months FD SD TD Monthly FD SD TD Monthly FD SD TD MonthlyJanuary 0.230 0.214 0.280 + 0.305 ** 6.67 6.20 8.11 8.85 57.32 54.24 51.18 56.89 February 0.033 0.117 0.259 0.107 0.97 3.38 7.52 3.11 47.30 43.97 48.14 47.14 March 0.100 0.263 0.561 ** 0.247 ** 2.90 7.61 16.26 7.15 41.55 48.36 62.54 50.39 April 0.731 *** 0.426 * 0.033 0.420 ** 21.19 12.36 0.97 12.17 69.06 66.72 64.17 66.43 May -0.133 -0.262 * -0.033 -0.120 -3.87 -7.58 -0.96 -3.48 62.83 60.86 70.68 64.84 June 0.013 -0.062 0.000 -0.031 0.36 -1.80 0.00 -0.91 74.51 74.95 76.85 74.86 July -0.200 + 0.150 -0.248 * -0.126 * -5.80 4.35 -7.18 -3.66 74.70 79.18 71.94 74.36 August -0.115 0.229 + -0.136 -0.046 -3.35 6.63 -3.95 -1.33 72.43 78.49 73.11 73.47 September -0.264 + -0.173 0.000 -0.127 + -7.65 -5.01 0.00 -3.67 71.27 71.46 74.45 72.71 October 0.124 0.000 0.396 * 0.134 + 3.59 0.00 11.49 3.90 73.30 68.05 68.14 69.53 November 0.155 + 0.305 * 0.238 * 0.195 * 4.48 8.85 6.90 5.65 59.90 59.16 53.98 57.58 December 0.225 * -0.014 0.051 0.068 6.53 -0.41 1.46 1.97 53.45 49.63 52.68 52.47
Predicted minimum relative humidity (%) for different years 2020 2025 2030
Months FD SD TD Monthly FD SD TD Monthly FD SD TD MonthlyJanuary 59.16 55.95 53.42 59.34 60.31 57.02 54.82 60.86 61.46 58.09 56.22 62.39 February 47.57 44.90 50.22 48.00 47.73 45.48 51.51 48.54 47.90 46.07 52.81 49.08 March 42.35 50.46 67.02 52.36 42.85 51.78 69.83 53.60 43.35 53.09 72.63 54.83 April 74.90 70.13 64.43 69.79 78.56 72.26 64.60 71.88 82.21 74.39 64.77 73.98 May 61.77 58.77 70.41 63.88 61.10 57.46 70.25 63.28 60.43 56.15 70.08 62.68 June 74.61 74.46 76.85 74.61 74.68 74.15 76.85 74.45 74.74 73.84 76.85 74.29 July 73.10 80.38 69.96 73.35 72.10 81.13 68.72 72.72 71.10 81.88 67.48 72.09 August 71.51 80.32 72.02 73.10 70.93 81.46 71.34 72.88 70.36 82.61 70.66 72.65 September 69.16 70.08 74.45 71.70 67.84 69.21 74.45 71.07 66.52 68.35 74.45 70.43 October 74.29 68.05 71.31 70.60 74.90 68.05 73.29 71.27 75.52 68.05 75.27 71.95 November 61.14 61.60 55.89 59.14 61.91 63.13 57.08 60.11 62.69 64.65 58.27 61.09 December 55.25 49.51 53.08 53.01 56.38 49.44 53.33 53.35 57.50 49.37 53.59 53.69
231

BINA Annual Report 2011-12 Agricultural Engineering
Table 52. Rate of change (ºC Year -1) change from 1981 to 2010 and prediction of maximum temperature (ºC) for different months and decades in Mymensingh district
Rate of change (ºC Year -1) Change from 1981 to 2010 Present value in 2012
Months FD SD TD Monthly FD SD TD Monthly FD SD TD Monthly
January -0.033 -0.034 -0.089 * -0.047 ** -0.95 -0.99 -2.59 -1.36 23.29 23.51 23.63 23.65 February -0.001 0.010 0.029 0.014 -0.03 0.29 0.84 0.41 25.73 28.00 28.27 27.39 March 0.010 -0.038 -0.032 -0.020 0.29 -1.09 -0.92 -0.57 29.79 30.44 31.17 30.17 April -0.096 * 0.003 0.031 -0.006 -2.78 0.08 0.89 -0.19 30.74 31.83 31.96 31.87 May 0.066 0.073 * -0.025 0.027 1.91 2.12 -0.73 0.80 32.62 33.59 31.35 32.50 June -0.024 0.022 0.006 0.005 -0.70 0.63 0.17 0.14 30.92 31.93 31.54 31.49 July 0.028 -0.015 0.046 * 0.018 0.82 -0.44 1.34 0.53 31.45 30.98 32.08 31.35 August 0.049 * -0.047 + 0.025 0.010 1.41 -1.38 0.74 0.30 32.43 30.92 32.03 31.91 September 0.046 0.037 0.025 0.035 + 1.34 1.07 0.72 1.02 32.04 32.23 31.20 31.92 October 0.005 0.029 -0.009 0.006 0.15 0.85 -0.25 0.17 31.71 32.08 30.97 31.51 November 0.027 -0.010 -0.008 0.002 0.77 -0.29 -0.24 0.07 30.98 29.17 28.41 29.50 December 0.001 0.015 0.001 0.007 0.03 0.45 0.02 0.20 27.32 26.39 25.41 26.21
Predicted maximum temperature (ºC) for different years 2020 2025 2030
Month FD SD TD Monthly FD SD TD Monthly FD SD TD Monthly
January 23.03 23.23 22.91 23.28 22.86 23.06 22.47 23.04 22.70 22.89 22.02 22.81 February 25.72 28.08 28.50 27.51 25.72 28.13 28.65 27.58 25.71 28.18 28.79 27.65 March 29.87 30.14 30.91 30.02 29.92 29.95 30.75 29.92 29.97 29.76 30.59 29.82 April 29.98 31.85 32.20 31.82 29.50 31.86 32.36 31.79 29.02 31.88 32.51 31.76 May 33.15 34.18 31.14 32.72 33.48 34.54 31.02 32.86 33.81 34.91 30.89 32.99 June 30.73 32.10 31.59 31.53 30.61 32.21 31.62 31.55 30.49 32.32 31.65 31.58 July 31.68 30.86 32.46 31.49 31.82 30.79 32.69 31.59 31.96 30.71 32.92 31.68 August 32.82 30.54 32.23 31.99 33.06 30.31 32.36 32.04 33.31 30.07 32.48 32.10 September 32.41 32.53 31.40 32.20 32.64 32.71 31.53 32.38 32.87 32.90 31.65 32.55 October 31.75 32.32 30.90 31.56 31.78 32.46 30.86 31.59 31.80 32.61 30.82 31.61 November 31.20 29.09 28.34 29.52 31.33 29.04 28.30 29.54 31.46 28.99 28.26 29.55 December 27.33 26.52 25.42 26.26 27.33 26.59 25.42 26.30 27.34 26.67 25.43 26.33
232

BINA Annual Report 2011-12 Agricultural Engineering
Table 53. Rate of change (ºC Year -1), change from 1981 to 2010 and prediction of minimum temperature (ºC) for different months and decades in Mymensingh district
Rate of change (o C year -1) Change from 1981 to 2010 Present value in 2012
Months FD SD TD Monthly FD SD TD Monthly FD SD TD Monthly
January -0.005 0.026 0.011 -0.047 ** -0.15 0.76 0.31 -1.36 11.91 12.17 12.40 12.15 February 0.004 0.033 0.078 * 0.014 0.13 0.96 2.27 0.41 13.88 15.54 17.25 15.47 March 0.078 * -0.006 0.020 -0.020 2.25 -0.18 0.59 -0.57 17.99 18.69 20.45 19.28 April 0.009 0.017 0.026 -0.006 0.25 0.50 0.76 -0.19 21.96 22.77 22.45 22.55 May 0.042 + 0.044 * 0.006 0.027 1.23 1.28 0.17 0.80 23.58 24.64 24.34 24.21 June -0.022 0.001 0.017 0.005 -0.63 0.04 0.49 0.14 24.71 25.90 26.40 25.64 July 0.028 ** 0.014 0.022 * 0.018 0.81 0.41 0.63 0.53 26.61 26.40 26.47 26.51 August 0.036 ** 0.004 0.009 0.010 1.04 0.13 0.26 0.30 27.05 26.43 26.30 26.45 September 0.024 * 0.024 + 0.020 0.035 + 0.69 0.68 0.58 1.02 26.40 26.16 25.55 26.10 October 0.003 0.009 0.000 0.006 0.10 0.25 0.00 0.17 24.75 24.09 21.49 23.31 November 0.018 0.016 -0.001 0.002 0.53 0.46 -0.04 0.07 20.62 18.57 16.21 18.37 December 0.028 0.027 0.009 0.007 0.81 0.77 0.26 0.20 15.15 14.04 12.50 13.73
Predicted minimum temperature (ºC) for different years 2020 2025 2030
Months FD SD TD Monthly FD SD TD Monthly FD SD TD Monthly
January 11.87 12.38 12.48 12.23 11.84 12.51 12.54 12.27 11.81 12.64 12.59 12.32 February 13.91 15.81 17.87 15.79 13.93 15.97 18.26 15.98 13.96 16.14 18.65 16.18 March 18.61 18.64 20.61 19.52 19.00 18.61 20.72 19.68 19.39 18.58 20.82 19.83 April 22.03 22.91 22.67 22.70 22.07 23.00 22.80 22.79 22.12 23.08 22.93 22.88 May 23.91 24.99 24.39 24.42 24.13 25.21 24.42 24.56 24.34 25.44 24.44 24.69 June 24.54 25.91 26.53 25.62 24.43 25.92 26.62 25.60 24.32 25.93 26.70 25.59 July 26.83 26.51 26.64 26.68 26.97 26.59 26.75 26.79 27.11 26.66 26.86 26.89 August 27.34 26.47 26.37 26.54 27.51 26.49 26.42 26.59 27.69 26.51 26.46 26.64 September 26.59 26.35 25.71 26.30 26.71 26.47 25.81 26.43 26.82 26.59 25.91 26.55 October 24.78 24.16 21.49 23.33 24.79 24.21 21.49 23.34 24.81 24.25 21.49 23.35 November 20.77 18.70 16.20 18.44 20.86 18.78 16.19 18.48 20.95 18.86 16.19 18.53 December 15.38 14.25 12.57 13.85 15.52 14.39 12.62 13.92 15.66 14.52 12.66 13.99
233
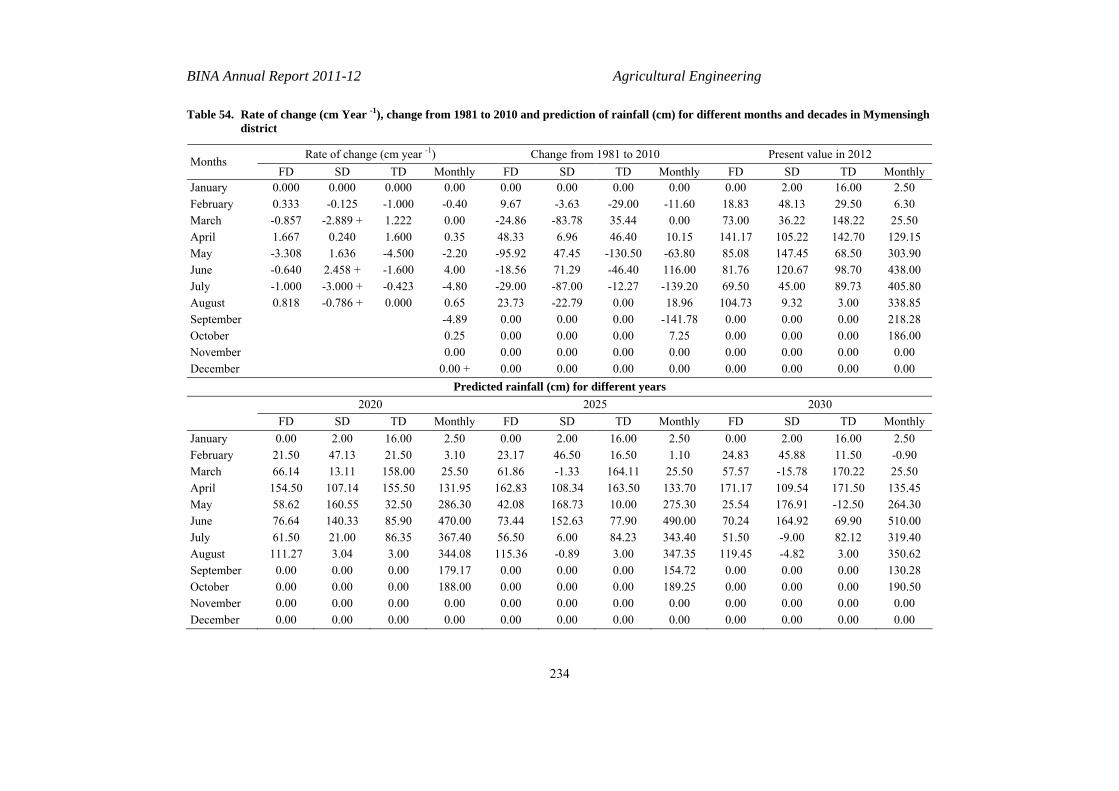
BINA Annual Report 2011-12 Agricultural Engineering
Table 54. Rate of change (cm Year -1), change from 1981 to 2010 and prediction of rainfall (cm) for different months and decades in Mymensingh district
Rate of change (cm year -1) Change from 1981 to 2010 Present value in 2012 Months FD SD TD Monthly FD SD TD Monthly FD SD TD Monthly
January 0.000 0.000 0.000 0.00 0.00 0.00 0.00 0.00 0.00 2.00 16.00 2.50 February 0.333 -0.125 -1.000 -0.40 9.67 -3.63 -29.00 -11.60 18.83 48.13 29.50 6.30 March -0.857 -2.889 + 1.222 0.00 -24.86 -83.78 35.44 0.00 73.00 36.22 148.22 25.50 April 1.667 0.240 1.600 0.35 48.33 6.96 46.40 10.15 141.17 105.22 142.70 129.15 May -3.308 1.636 -4.500 -2.20 -95.92 47.45 -130.50 -63.80 85.08 147.45 68.50 303.90 June -0.640 2.458 + -1.600 4.00 -18.56 71.29 -46.40 116.00 81.76 120.67 98.70 438.00 July -1.000 -3.000 + -0.423 -4.80 -29.00 -87.00 -12.27 -139.20 69.50 45.00 89.73 405.80 August 0.818 -0.786 + 0.000 0.65 23.73 -22.79 0.00 18.96 104.73 9.32 3.00 338.85 September -4.89 0.00 0.00 0.00 -141.78 0.00 0.00 0.00 218.28 October 0.25 0.00 0.00 0.00 7.25 0.00 0.00 0.00 186.00 November 0.00 0.00 0.00 0.00 0.00 0.00 0.00 0.00 0.00 December 0.00 + 0.00 0.00 0.00 0.00 0.00 0.00 0.00 0.00
Predicted rainfall (cm) for different years 2020 2025 2030
FD SD TD Monthly FD SD TD Monthly FD SD TD Monthly January 0.00 2.00 16.00 2.50 0.00 2.00 16.00 2.50 0.00 2.00 16.00 2.50 February 21.50 47.13 21.50 3.10 23.17 46.50 16.50 1.10 24.83 45.88 11.50 -0.90 March 66.14 13.11 158.00 25.50 61.86 -1.33 164.11 25.50 57.57 -15.78 170.22 25.50 April 154.50 107.14 155.50 131.95 162.83 108.34 163.50 133.70 171.17 109.54 171.50 135.45 May 58.62 160.55 32.50 286.30 42.08 168.73 10.00 275.30 25.54 176.91 -12.50 264.30 June 76.64 140.33 85.90 470.00 73.44 152.63 77.90 490.00 70.24 164.92 69.90 510.00 July 61.50 21.00 86.35 367.40 56.50 6.00 84.23 343.40 51.50 -9.00 82.12 319.40 August 111.27 3.04 3.00 344.08 115.36 -0.89 3.00 347.35 119.45 -4.82 3.00 350.62 September 0.00 0.00 0.00 179.17 0.00 0.00 0.00 154.72 0.00 0.00 0.00 130.28 October 0.00 0.00 0.00 188.00 0.00 0.00 0.00 189.25 0.00 0.00 0.00 190.50 November 0.00 0.00 0.00 0.00 0.00 0.00 0.00 0.00 0.00 0.00 0.00 0.00 December 0.00 0.00 0.00 0.00 0.00 0.00 0.00 0.00 0.00 0.00 0.00 0.00
234

BINA Annual Report 2011-12 Agricultural Engineering
Table 55. Rate of change (hr Year -1), change from 1981 to 2010 and prediction of sunshine duration (hr) for different months and decades in Mymensingh district
Rate of change (cm year -1) Change from 1981 to 2010 Present value in 2012
Months FD SD TD Monthly FD SD TD Monthly FD SD TD Monthly
January -0.058 * -0.081 ** -0.053 + -0.072 *** -1.68 -2.34 -1.55 -2.10 5.12 4.77 5.59 5.01 February -0.001 0.001 -0.024 -0.018 -0.02 0.04 -0.70 -0.52 7.07 7.56 7.29 7.00 March -0.002 -0.039 -0.074 + -0.036 * -0.07 -1.12 -2.15 -1.04 7.38 6.99 5.69 6.63 April -0.022 0.009 0.022 -0.006 -0.63 0.28 0.64 -0.17 6.74 7.24 7.20 7.02 May 0.028 -0.040 0.001 0.81 0.00 -1.17 0.03 7.46 0.00 5.09 6.29 June -0.054 -0.013 -0.003 -0.018 -1.57 -0.38 -0.08 -0.53 3.68 3.44 3.08 3.48 July 0.036 -0.064 + 0.090 + 0.023 1.04 -1.86 2.62 0.65 3.98 2.31 5.20 4.11 August 0.037 -0.115 + 0.003 -0.017 1.07 -3.34 0.09 -0.50 5.27 2.64 3.79 4.35 September 0.049 0.018 0.008 0.018 1.41 0.52 0.24 0.53 5.02 4.35 4.27 4.68 October -0.049 + -0.013 -0.072 + -0.033 + -1.43 -0.36 -2.08 -0.95 4.37 6.35 6.55 6.05 November -0.002 -0.040 -0.030 -0.025 -0.06 -1.16 -0.86 -0.74 7.72 6.88 7.32 7.16 December -0.044 -0.042 -0.024 -0.045 * -1.27 -1.22 -0.70 -1.29 7.00 6.48 5.92 6.29
Predicted rainfall (cm) for different years 2020 2025 2030
Months FD SD TD Monthly FD SD TD Monthly FD SD TD Monthly
January 4.65 4.12 5.16 4.43 4.36 3.72 4.89 4.07 4.08 3.31 4.63 3.71 February 7.07 7.57 7.10 6.85 7.07 7.58 6.98 6.76 7.06 7.59 6.86 6.67 March 7.36 6.68 5.10 6.34 7.35 6.49 4.73 6.16 7.34 6.30 4.36 5.98 April 6.56 7.31 7.38 6.98 6.46 7.36 7.49 6.95 6.35 7.41 7.60 6.92 May 7.68 0.00 4.77 6.29 7.82 0.00 4.57 6.30 7.96 0.00 4.36 6.30 June 3.24 3.33 3.06 3.33 2.97 3.27 3.05 3.24 2.70 3.20 3.03 3.15 July 4.27 1.79 5.92 4.30 4.45 1.47 6.37 4.41 4.63 1.15 6.83 4.52 August 5.56 1.72 3.82 4.22 5.75 1.15 3.83 4.13 5.93 0.57 3.85 4.04 September 5.41 4.50 4.34 4.82 5.65 4.59 4.38 4.92 5.90 4.68 4.42 5.01 October 3.98 6.25 5.97 5.79 3.73 6.19 5.62 5.63 3.48 6.13 5.26 5.46 November 7.71 6.56 7.08 6.96 7.69 6.36 6.94 6.83 7.68 6.16 6.79 6.71 December 6.65 6.14 5.73 5.93 6.43 5.93 5.60 5.71 6.21 5.72 5.48 5.49
235

BINA Annual Report 2011-12 Agricultural Engineering
Table 56. Rate of change (m sec -1 year -1), change from 1981 to 2010 and prediction of wind speed (m sec -1) for different months and decades in Mymensingh district
Rate of change (cm year -1) Change from 1981 to 2010 Present value in 2012 Months
FD SD TD Monthly FD SD TD Monthly FD SD TD MonthlyJanuary -0.023 ** -0.019 *** -0.021 *** -0.020 *** -0.66 -0.55 -0.60 -0.59 0.81 0.91 0.78 0.89 February -0.030 *** -0.023 ** -0.032 *** -0.027 *** -0.87 -0.66 -0.93 -0.79 0.85 1.00 0.86 0.94 March -0.028 *** -0.041 *** -0.042 ** -0.038 *** -0.82 -1.18 -1.22 -1.10 0.92 0.86 1.22 1.01 April -0.038 ** -0.051 *** -0.040 ** -0.046 *** -1.10 -1.49 -1.16 -1.32 1.37 1.40 1.52 1.40 May -0.061 *** -0.048 ** -0.043 ** -0.056 *** -1.77 -1.39 -1.26 -1.62 1.01 1.26 1.28 1.15 June -0.046 *** -0.044 *** -0.070 *** -0.055 *** -1.34 -1.28 -2.03 -1.59 1.16 1.38 1.13 1.18 July -0.043 *** -0.045 *** -0.042 *** -0.042 *** -1.26 -1.30 -1.21 -1.22 1.19 1.22 1.22 1.20 August -0.061 *** -0.021 * -0.039 *** -0.042 *** -1.78 -0.61 -1.14 -1.22 0.89 1.50 1.03 1.16 September -0.037 *** -0.028 ** -0.032 *** -0.029 *** -1.06 -0.83 -0.93 -0.84 1.04 1.07 0.96 1.06 October -0.013 -0.024 *** -0.011 + -0.016 ** -0.38 -0.70 -0.33 -0.47 1.11 0.77 0.96 0.96 November -0.021 *** -0.013 ** -0.024 *** -0.021 *** -0.61 -0.39 -0.70 -0.60 0.74 0.90 0.62 0.75 December -0.019 *** -0.021 *** -0.019 *** -0.019 *** -0.55 -0.60 -0.56 -0.57 0.70 0.74 0.70 0.76
Predicted rainfall (cm) for different years 2020 2025 2030
Months FD SD TD Monthly FD SD TD Monthly FD SD TD Monthly
January 0.62 0.75 0.61 0.72 0.51 0.66 0.51 0.62 0.40 0.56 0.41 0.52 February 0.61 0.82 0.61 0.72 0.46 0.70 0.45 0.58 0.31 0.59 0.29 0.45 March 0.70 0.54 0.89 0.71 0.55 0.33 0.68 0.52 0.41 0.13 0.47 0.33 April 1.06 0.99 1.20 1.03 0.87 0.73 1.01 0.81 0.68 0.47 0.81 0.58 May 0.52 0.87 0.93 0.71 0.21 0.63 0.71 0.43 -0.09 0.39 0.49 0.15 June 0.79 1.02 0.57 0.75 0.56 0.80 0.22 0.47 0.32 0.58 -0.13 0.20 July 0.84 0.86 0.89 0.86 0.62 0.64 0.68 0.65 0.41 0.42 0.47 0.44 August 0.39 1.33 0.71 0.82 0.09 1.22 0.52 0.61 -0.22 1.12 0.32 0.40 September 0.75 0.84 0.71 0.83 0.56 0.70 0.55 0.68 0.38 0.55 0.39 0.54 October 1.00 0.58 0.87 0.83 0.94 0.46 0.82 0.75 0.87 0.33 0.76 0.67 November 0.57 0.79 0.43 0.58 0.47 0.72 0.31 0.48 0.36 0.65 0.19 0.37 December 0.55 0.57 0.54 0.60 0.46 0.47 0.45 0.50 0.36 0.36 0.35 0.41
236

BINA Annual Report 2011-12 Agricultural Engineering
Table 57. Rate of change (% Year -1), change from 1981 to 2010 and prediction of maximum relative humidity (%) for different months and decades in Magura district
Rate of change (cm year -1) Change from 1981 to 2010 Present value in 2012 Months
FD SD TD Monthly FD SD TD Monthly FD SD TD MonthlyJanuary 0.068 0.073+ 0.070 0.069 1.97 2.11 2.04 2.00 96.63 96.91 96.44 96.44 February 0.100+ 0.077 0.135+ 0.109+ 2.90 2.24 3.93 3.17 96.53 95.75 96.29 96.11 March 0.079+ 0.042 0.080 0.057+ 2.28 1.21 2.31 1.66 94.95 93.76 94.48 94.35 April 0.111** 0.090+ 0.000 0.052 3.21 2.61 0.00 1.52 95.06 94.69 93.25 94.14 May -0.042 -0.015 0.023 -0.012 -1.21 -0.43 0.66 -0.35 93.40 93.55 94.38 93.68 June -0.006 -0.040 -0.050** -0.034+ -0.17 -1.16 -1.45 -0.99 94.73 94.91 95.33 95.01 July -0.037* -0.011 -0.070*** -0.046** -1.09 -0.31 -2.04 -1.33 95.70 95.86 95.01 95.21 August -0.037 0.006 -0.032+ -0.020 -1.07 0.18 -0.92 -0.58 95.02 95.68 95.08 95.24 September -0.035+ -0.007 -0.021 -0.003 -1.00 -0.19 -0.60 -0.09 95.44 96.22 96.08 96.15 October 0.017 0.009 0.030 0.023 0.48 0.26 0.88 0.67 96.77 96.35 96.64 96.54 November 0.023 0.002 0.042 0.010 0.67 0.07 1.23 0.30 96.19 96.34 96.62 96.33 December 0.038 0.021 0.050 0.042 1.09 0.62 1.44 1.22 96.89 96.31 96.86 96.63
Predicted rainfall (cm) for different years 2020 2025 2030
Months FD SD TD Monthly FD SD TD Monthly FD SD TD Monthly
January 97.17 97.49 97.00 96.99 97.51 97.85 97.35 97.33 97.85 98.22 97.70 97.68 February 97.33 96.37 97.38 96.99 97.83 96.76 98.05 97.53 98.33 97.14 98.73 98.08 March 95.58 94.09 95.11 94.80 95.98 94.30 95.51 95.09 96.37 94.51 95.91 95.38 April 95.94 95.41 93.25 94.56 96.49 95.86 93.25 94.82 97.05 96.31 93.25 95.08 May 93.07 93.44 94.56 93.58 92.86 93.36 94.67 93.52 92.65 93.29 94.78 93.46 June 94.69 94.59 94.93 94.74 94.66 94.39 94.68 94.57 94.63 94.19 94.43 94.40 July 95.40 95.78 94.45 94.84 95.21 95.72 94.10 94.62 95.03 95.67 93.74 94.39 August 94.72 95.73 94.83 95.08 94.54 95.77 94.67 94.99 94.35 95.80 94.51 94.89 September 95.17 96.16 95.91 96.12 94.99 96.13 95.81 96.10 94.82 96.10 95.70 96.09 October 96.90 96.42 96.88 96.73 96.98 96.47 97.03 96.84 97.07 96.51 97.18 96.96 November 96.37 96.36 96.96 96.42 96.49 96.38 97.17 96.47 96.60 96.39 97.38 96.52 December 97.19 96.49 97.26 96.97 97.38 96.59 97.51 97.18 97.56 96.70 97.76 97.39
237

BINA Annual Report 2011-12 Agricultural Engineering
Table 58. Rate of change (% Year -1), change from 1981 to 2010 and prediction of minimum relative humidity (%) for different months and decades in Magura district
Rate of change (cm year -1) Change from 1981 to 2010 Present value in 2012 Months
FD SD TD Monthly FD SD TD Monthly FD SD TD MonthlyJanuary -0.006 0.154 0.133 0.081 -0.17 4.46 3.85 2.34 50.07 50.87 47.82 49.35 February 0.050 -0.053 0.002 -0.023 1.45 -1.55 0.06 -0.68 43.60 40.29 38.03 41.93 March 0.019 0.006 0.273 0.102 0.54 0.16 7.91 2.96 35.96 38.12 47.61 42.21 April 0.484* 0.230 -0.205 0.142 14.04 6.67 -5.95 4.11 54.85 52.55 51.28 50.32 May -0.358* -0.347** -0.086 -0.252* -10.39 -10.06 -2.49 -7.31 51.12 54.19 61.85 55.57 June -0.104 -0.154 -0.250** -0.125* -3.01 -4.47 -7.25 -3.63 65.45 69.88 70.53 69.20 July -0.100 -0.061 -0.221** -0.136** -2.90 -1.76 -6.40 -3.95 74.80 73.92 71.02 72.86 August -0.250*** 0.033 -0.234*** -0.152** -7.25 0.97 -6.78 -4.41 69.73 74.45 69.86 71.41 September -0.250** -0.071 -0.064 -0.108+ -7.25 -2.06 -1.86 -3.14 69.60 69.57 69.60 70.08 October 0.186 -0.017 0.287 0.072 5.40 -0.48 8.32 2.08 71.08 63.12 61.62 63.70 November 0.077 -0.041 0.035 0.027 2.23 -1.18 1.03 0.77 55.40 49.91 48.05 51.76 December 0.075 0.169 -0.009 0.043 2.18 4.90 -0.26 1.23 47.54 51.16 47.39 48.45
Predicted rainfall (cm) for different years 2020 2025 2030
Months FD SD TD Monthly FD SD TD Monthly FD SD TD Monthly
January 50.03 52.10 48.88 50.00 50.00 52.87 49.55 50.40 49.97 53.64 50.21 50.81 February 44.00 39.87 38.05 41.75 44.25 39.60 38.06 41.63 44.50 39.33 38.07 41.51 March 36.11 38.17 49.80 43.03 36.21 38.19 51.16 43.54 36.30 38.22 52.52 44.05 April 58.73 54.39 49.64 51.45 61.15 55.54 48.61 52.16 63.57 56.69 47.59 52.87 May 48.25 51.42 61.16 53.55 46.46 49.68 60.73 52.29 44.67 47.95 60.30 51.03 June 64.62 68.65 68.53 68.20 64.10 67.88 67.28 67.58 63.58 67.11 66.03 66.95 July 74.00 73.44 69.25 71.77 73.50 73.13 68.15 71.09 73.00 72.83 67.05 70.41 August 67.73 74.72 67.99 70.19 66.48 74.88 66.82 69.43 65.23 75.05 65.66 68.67 September 67.60 69.00 69.08 69.21 66.35 68.65 68.76 68.67 65.10 68.29 68.44 68.13 October 72.57 62.98 63.91 64.27 73.50 62.90 65.35 64.63 74.43 62.82 66.78 64.98 November 56.01 49.58 48.33 51.97 56.40 49.38 48.51 52.10 56.78 49.18 48.68 52.24 December 48.14 52.51 47.31 48.79 48.51 53.36 47.27 49.01 48.89 54.20 47.22 49.22
238

BINA Annual Report 2011-12 Agricultural Engineering
Table 59. Rate of change (ºC Year -1), change from 1981 to 2010 and prediction of maximum temperature (ºC) for different months and decades in Magura district
Rate of change (cm year -1) Change from 1981 to 2010 Present value in 2012 Months
FD SD TD Monthly FD SD TD Monthly FD SD TD MonthlyJanuary -0.004 0.018 -0.050+ -0.018 -0.10 0.53 -1.45 -0.51 24.40 25.04 24.50 24.85 February 0.015 0.039 0.073* 0.042 0.44 1.12 2.11 1.21 27.20 29.33 31.18 29.10 March 0.037 -0.035 0.021 0.018 1.09 -1.02 0.62 0.53 32.13 32.73 34.46 33.35 April -0.073+ -0.033 0.058* 0.004 -2.11 -0.97 1.68 0.11 33.67 35.14 36.26 34.97 May 0.044 0.065** 0.005 0.038+ 1.28 1.88 0.13 1.09 35.52 35.53 34.54 35.10 June 0.016 0.038 0.048** 0.037* 0.47 1.12 1.38 1.07 34.52 33.42 33.10 33.75 July 0.029+ 0.029 0.045*** 0.036*** 0.85 0.85 1.31 1.05 32.46 32.56 32.71 32.60 August 0.092*** 0.004 0.060*** 0.052*** 2.67 0.13 1.75 1.50 33.90 32.23 33.38 33.12 September 0.065*** 0.029 0.010 0.036** 1.89 0.84 0.28 1.05 33.45 33.18 32.68 32.95 October 0.001 0.023 -0.001 0.013 0.04 0.67 -0.02 0.37 32.52 32.74 31.46 32.29 November 0.035 0.037+ 0.033* 0.036** 1.02 1.08 0.96 1.05 31.53 30.45 29.13 30.38 December 0.025 -0.001 0.009 0.012 0.72 -0.03 0.26 0.34 27.88 26.40 25.56 26.61
Predicted rainfall (cm) for different years 2020 2025 2030
Months FD SD TD Monthly FD SD TD Monthly FD SD TD Monthly
January 24.37 25.19 24.10 24.71 24.35 25.28 23.85 24.62 24.33 25.37 23.60 24.53 February 27.32 29.64 31.76 29.44 27.39 29.84 32.13 29.65 27.47 30.03 32.49 29.85 March 32.43 32.45 34.63 33.49 32.62 32.27 34.74 33.59 32.81 32.10 34.84 33.68 April 33.09 34.87 36.72 35.00 32.73 34.70 37.01 35.02 32.36 34.53 37.30 35.04 May 35.87 36.05 34.57 35.40 36.09 36.38 34.60 35.59 36.31 36.70 34.62 35.78 June 34.65 33.72 33.48 34.05 34.73 33.91 33.72 34.23 34.81 34.11 33.96 34.42 July 32.69 32.79 33.07 32.89 32.84 32.94 33.30 33.07 32.98 33.08 33.53 33.25 August 34.64 32.27 33.86 33.53 35.10 32.29 34.17 33.79 35.56 32.31 34.47 34.05 September 33.97 33.41 32.76 33.24 34.30 33.56 32.81 33.43 34.63 33.70 32.85 33.61 October 32.53 32.93 31.46 32.39 32.53 33.04 31.45 32.46 32.54 33.16 31.45 32.52 November 31.81 30.75 29.40 30.67 31.99 30.93 29.57 30.85 32.16 31.12 29.73 31.03 December 28.07 26.39 25.63 26.71 28.20 26.39 25.68 26.77 28.32 26.38 25.72 26.83
239

BINA Annual Report 2011-12 Agricultural Engineering
Table 60. Rate of change (ºC Year -1), change from 1981 to 2010 and prediction of minimum temperature (ºC) for different months and decades in Magura district
Rate of change (cm year -1) Change from 1981 to 2010 Present value in 2012 Months
FD SD TD Monthly FD SD TD Monthly FD SD TD MonthlyJanuary -0.037 -0.020 -0.002 -0.036 -1.07 -0.58 -0.05 -1.04 11.09 11.37 12.29 11.16 February -0.009 0.026 0.096* 0.029+ -0.27 0.77 2.78 0.84 13.35 15.69 18.01 15.26 March 0.050 -0.012 0.061 0.032 1.46 -0.34 1.78 0.94 18.33 19.57 22.30 20.08 April 0.053 0.096* 0.075** 0.066** 1.53 2.78 2.19 1.91 23.78 25.56 24.88 24.57 May 0.063* 0.057* 0.018 0.037** 1.82 1.66 0.53 1.06 25.12 25.88 25.88 25.45 June -0.004 0.027+ 0.034* 0.016 -0.11 0.78 1.00 0.46 25.84 26.33 26.60 26.12 July 0.033* 0.023+ 0.017+ 0.026* 0.96 0.65 0.49 0.76 26.48 26.52 26.41 26.49 August 0.035** 0.008 0.017 0.017* 1.02 0.22 0.48 0.48 26.57 26.33 26.44 26.38 September 0.021+ 0.016+ 0.019 0.018+ 0.62 0.47 0.54 0.52 26.26 26.00 25.84 25.99 October 0.011 0.031 0.032 0.016 0.32 0.89 0.92 0.46 25.16 24.59 22.63 23.88 November 0.048 0.044 0.042 0.040 1.40 1.28 1.23 1.15 21.33 19.28 17.16 19.30 December 0.024 0.043 0.018 0.010 0.69 1.26 0.51 0.28 14.97 14.05 12.72 13.33
Predicted rainfall (cm) for different years 2020 2025 2030
Months FD SD TD Monthly FD SD TD Monthly FD SD TD Monthly
January 10.79 11.21 12.28 10.87 10.61 11.11 12.27 10.69 10.42 11.01 12.26 10.52 February 13.28 15.90 18.78 15.49 13.23 16.03 19.26 15.64 13.18 16.17 19.74 15.78 March 18.73 19.47 22.79 20.34 18.99 19.42 23.10 20.50 19.24 19.36 23.41 20.66 April 24.21 26.32 25.48 25.10 24.47 26.80 25.86 25.43 24.74 27.28 26.24 25.76 May 25.62 26.33 26.02 25.74 25.93 26.62 26.11 25.93 26.25 26.91 26.20 26.11 June 25.81 26.54 26.87 26.25 25.80 26.68 27.04 26.33 25.78 26.81 27.22 26.41 July 26.74 26.70 26.54 26.69 26.90 26.81 26.63 26.82 27.07 26.93 26.71 26.95 August 26.85 26.39 26.58 26.51 27.03 26.43 26.66 26.60 27.21 26.47 26.74 26.68 September 26.43 26.13 25.99 26.13 26.54 26.21 26.08 26.22 26.65 26.29 26.18 26.31 October 25.25 24.83 22.88 24.01 25.31 24.99 23.04 24.09 25.36 25.14 23.20 24.17 November 21.71 19.63 17.50 19.62 21.95 19.85 17.71 19.81 22.20 20.07 17.92 20.01 December 15.16 14.39 12.86 13.41 15.28 14.61 12.95 13.46 15.40 14.83 13.04 13.51
240

BINA Annual Report 2011-12 Agricultural Engineering
Table 61. Rate of change (cm Year -1), change from 1981 to 2010 and prediction of rainfall (cm) for different months and decades in Magura district
Rate of change (cm year -1) Change from 1981 to 2010 Present value in 2012 Months
FD SD TD Monthly FD SD TD Monthly FD SD TD MonthlyJanuary 0.000 0.000 0.000 0.000 0.00 0.00 0.00 0.00 0.50 0.25 0.00 5.00 February 0.000 0.000 0.000 -0.002 0.00 0.00 0.00 -6.77 1.00 2.00 1.50 14.15 March 0.000 -0.100 -0.239 -0.032* 0.00 -2.90 -6.93 -32.28 2.00 0.45 12.14 22.40 April -0.036 -0.857* -2.167* -0.078* -1.04 -24.86 -62.83 -101.50 19.41 3.93 15.58 33.25 May -1.453+ -1.368+ 0.250 -0.086* -42.14 -39.68 7.25 -104.06 23.21 47.54 78.50 136.53 June 1.457 -0.806 -0.813 0.001 42.24 -23.36 -23.56 -14.50 99.82 60.91 97.59 288.00 July 3.306* 1.538+ -1.700 0.022 95.86 44.62 -49.30 142.28 183.28 97.15 75.10 404.86 August -2.000* 1.750* -1.667+ -0.063 -58.00 50.75 -48.33 -89.90 55.25 101.63 44.33 215.05 September -0.318 0.056 0.500 -0.027 -9.23 1.61 14.50 -11.35 62.77 57.47 89.50 217.68 October 1.375 -0.900 0.231 0.015 39.88 -26.10 6.69 46.72 74.38 16.50 15.62 169.91 November 0.000 0.000 0.000 0.000 0.00 0.00 0.00 0.00 6.00 0.50 0.00 8.33 December 0.000 0.000 0.000 0.000 0.00 0.00 0.00 0.00 6.00 0.00 0.00 6.25
Predicted rainfall (cm) for different years 2020 2025 2030
Months FD SD TD Monthly FD SD TD Monthly FD SD TD Monthly
January 0.50 0.25 0.00 5.00 0.50 0.25 0.00 5.00 0.50 0.25 0.00 5.00 February 1.00 2.00 1.50 12.28 1.00 2.00 1.50 11.12 1.00 2.00 1.50 9.95 March 2.00 -0.35 10.23 13.50 2.00 -0.85 9.03 7.93 2.00 -1.35 7.84 2.37 April 19.13 -2.93 -1.75 5.25 18.95 -7.21 -12.58 -12.25 18.77 -11.50 -23.42 -29.75 May 11.58 36.59 80.50 107.82 4.32 29.75 81.75 89.88 -2.95 22.91 83.00 71.94 June 111.47 54.47 91.09 284.00 118.75 50.44 87.03 281.50 126.03 46.41 82.97 279.00 July 209.72 109.46 61.50 444.11 226.25 117.15 53.00 468.64 242.78 124.85 44.50 493.17 August 39.25 115.63 31.00 190.25 29.25 124.38 22.67 174.75 19.25 133.13 14.33 159.25 September 60.23 57.92 93.50 214.55 58.64 58.19 96.00 212.60 57.05 58.47 98.50 210.64 October 85.38 9.30 17.46 182.80 92.25 4.80 18.62 190.86 99.13 0.30 19.77 198.91 November 6.00 0.50 0.00 8.33 6.00 0.50 0.00 8.33 6.00 0.50 0.00 8.33 December 6.00 0.00 0.00 6.25 6.00 0.00 0.00 6.25 6.00 0.00 0.00 6.25
241

BINA Annual Report 2011-12 Agricultural Engineering
Table 62. Rate of change (hr Year -1), change from 1981 to 2010 and prediction of sunshine duration (hr) for different months and decades in Magura district
Rate of change (cm year -1) Change from 1981 to 2010 Present value in 2012
Months FD SD TD Monthly FD SD TD Monthly FD SD TD Monthly
January -0.022 -0.017 -0.036 -0.036 -0.63 -0.48 -1.05 -1.01 6.36 6.63 6.80 6.08 February -0.001 -0.040 -0.017 -0.017 -0.03 -1.16 -0.49 0.18 7.54 6.10 7.76 7.80 March 0.014 -0.005 -0.023 -0.023 0.41 -0.14 -0.66 -0.16 8.17 7.99 7.08 7.56 April -0.012 0.017 0.042* 0.042* -0.35 0.49 1.21 0.57 7.79 8.31 8.66 8.29 May 0.008 -0.011 -0.023 -0.023 0.24 -0.31 -0.66 0.01 7.49 7.90 6.61 7.16 June -0.046 0.077* 0.039 0.039 -1.34 2.22 1.13 -0.23 5.18 8.59 4.49 4.53 July 0.008 -0.002 0.050 0.050 0.24 -0.06 1.44 0.53 3.46 4.37 5.41 4.24 August 0.074* -0.068+ 0.035 0.035 2.15 -1.97 1.03 0.31 5.98 3.40 5.16 4.85 September 0.057+ -0.045 -0.033 -0.033 1.66 -1.31 -0.94 -0.03 5.37 3.58 4.40 4.60 October -0.061 -0.071** -0.060+ -0.060+ -1.76 -2.06 -1.74 -1.31 4.84 4.01 6.32 5.94 November -0.010 -0.053+ -0.034+ -0.034+ -0.29 -1.54 -0.99 -0.66 7.39 6.14 7.12 7.15 December -0.035 -0.006 -0.011 -0.011 -1.02 -0.17 -0.33 -0.89 6.85 7.20 6.74 6.48
Predicted rainfall (cm) for different years 2020 2025 2030
Months FD SD TD Monthly FD SD TD Monthly FD SD TD Monthly
January 6.18 6.50 6.51 5.81 6.07 6.42 6.33 5.63 5.97 6.33 6.15 5.46 February 7.53 5.78 7.63 7.86 7.52 5.58 7.54 7.89 7.51 5.38 7.46 7.92 March 8.28 7.95 6.90 7.51 8.35 7.93 6.78 7.49 8.42 7.90 6.67 7.46 April 7.69 8.44 8.99 8.45 7.63 8.53 9.20 8.54 7.57 8.62 9.41 8.64 May 7.55 7.82 6.43 7.16 7.60 7.76 6.31 7.16 7.64 7.71 6.20 7.16 June 4.82 9.20 4.80 4.47 4.58 9.58 5.00 4.43 4.35 9.96 5.19 4.39 July 3.52 4.36 5.81 4.39 3.57 4.35 6.06 4.48 3.61 4.34 6.31 4.57 August 6.57 2.85 5.44 4.93 6.94 2.52 5.62 4.98 7.31 2.18 5.80 5.04 September 5.83 3.22 4.14 4.59 6.12 2.99 3.97 4.59 6.40 2.77 3.81 4.58 October 4.35 3.45 5.84 5.58 4.05 3.09 5.54 5.35 3.75 2.74 5.24 5.13 November 7.31 5.72 6.85 6.97 7.26 5.45 6.68 6.85 7.21 5.19 6.51 6.74 December 6.57 7.15 6.65 6.23 6.40 7.12 6.60 6.08 6.22 7.09 6.54 5.93
242

BINA Annual
Report 2011-12 Agricultural Engineering
243
Table 63. Rate of change (m sec -1 year -1), change from 1981 to 2010 and prediction of wind speed (m sec -1) for different months and decades in Magura district
Rate of change (cm year -1) Change from 1981 to 2010 Present value in 2012 Months
FD SD TD Monthly FD SD TD Monthly FD SD TD MonthlyJanuary -0.025 -0.052*** -0.013 -0.027* -0.74 -1.51 -0.39 -0.80 2.67 2.25 3.14 2.67 February -0.034+ -0.019 -0.044+ -0.036** -0.98 -0.55 -1.27 -1.05 2.78 3.39 3.28 3.07 March -0.028+ -0.075** -0.037 -0.038** -0.81 -2.17 -1.08 -1.11 3.77 3.36 4.57 3.79 April -0.064+ -0.071 -0.052+ -0.061* -1.85 -2.07 -1.49 -1.77 4.67 4.66 5.46 5.19 May -0.092** -0.036 -0.036 -0.047* -2.67 -1.04 -1.05 -1.36 4.44 5.37 5.23 4.99 June -0.064* -0.062+ -0.073** -0.070** -1.86 -1.80 -2.11 -2.03 4.26 4.56 4.08 4.37 July -0.076*** -0.063* -0.057** -0.073*** -2.21 -1.82 -1.66 -2.13 3.81 4.35 4.26 4.20 August -0.071*** -0.075*** -0.052*** -0.068*** -2.07 -2.16 -1.52 -1.96 3.92 3.94 4.03 3.86 September -0.060*** -0.068* -0.052+ -0.053** -1.74 -1.96 -1.51 -1.54 3.70 3.20 3.21 3.50 October -0.046 -0.063** -0.035+ -0.047** -1.34 -1.82 -1.01 -1.37 2.63 1.89 2.14 2.18 November -0.072 -0.058** -0.075*** -0.069*** -2.10 -1.67 -2.19 -2.00 1.27 1.52 1.06 1.11 December -0.088 -0.075*** -0.037* -0.064*** -2.55 -2.18 -1.07 -1.85 0.65 1.23 2.05 1.44
Predicted rainfall (cm) for different years 2020 2025 2030
Months FD SD TD Monthly FD SD TD Monthly FD SD TD Monthly
January 2.47 1.83 3.04 2.45 2.34 1.57 2.97 2.31 2.21 1.31 2.90 2.18 February 2.51 3.24 2.93 2.78 2.34 3.14 2.71 2.60 2.18 3.05 2.49 2.42 March 3.54 2.76 4.27 3.49 3.40 2.38 4.09 3.29 3.26 2.01 3.90 3.10 April 4.16 4.09 5.04 4.71 3.84 3.74 4.79 4.40 3.52 3.38 4.53 4.10 May 3.70 5.09 4.94 4.61 3.24 4.91 4.76 4.38 2.78 4.73 4.58 4.15 June 3.75 4.07 3.50 3.80 3.43 3.76 3.14 3.45 3.11 3.45 2.78 3.10 July 3.20 3.84 3.80 3.61 2.82 3.53 3.52 3.25 2.44 3.21 3.23 2.88 August 3.35 3.34 3.61 3.32 2.99 2.97 3.35 2.98 2.63 2.59 3.09 2.64 September 3.22 2.66 2.80 3.07 2.92 2.32 2.54 2.81 2.62 1.98 2.28 2.54 October 2.27 1.39 1.86 1.80 2.03 1.07 1.69 1.57 1.80 0.76 1.51 1.33 November 0.70 1.05 0.45 0.56 0.33 0.77 0.08 0.21 -0.03 0.48 -0.30 -0.13 December -0.05 0.63 1.75 0.93 -0.49 0.25 1.57 0.61 -0.93 -0.12 1.38 0.29
The symbol ***, **, * and + indicate significance at levels α were 0.001, 0.01, 0.05 and 0.10, respectively. FD, SD, TD, means first decade second decade and third decade, respectively.

BINA Annual Report 2011-12 Agricultural Engineering
244
Studies on irrigation schedules of rice and non-rice crops for optimum yield and water use
The objectives of this experiment was to make the effective use of profile soil moisture for the cultivation of Rabi crops with minimum supplemental irrigation, effective utilization of water resources (surface water, rainfall and ground water), determine critical stages, time and amount of irrigation need for optimum yield and increased water use efficiency of different crops, and identify and recommend most profitable cropping pattern for the area. Digharkanda, Alalpur and Rahmatpur of Mymensingh Sadar Upazilla, Mymensingh and Ramnagar, Rautola and Sachani of Magura Sadar Upazilla, Magura were selected for different on-farm experiments. Three cropping patterns i.e., T. aman – Fallow –Boro, T. aman–Mustard – Boro and T. aman-Wheat-T. aus for Mymensingh district, and T. aman – Lentil – Sesame, T. aman – Mustard – Mungbean and T. aman-Chickpea-Jute for Magura district were followed. In all the cropping patterns, T. aman rice (popular varieties) was transplanted on July. All the cultural practices were followed and data were collected and recorded as per need. According to all the cropping patterns, T. aman experiments were conducted under normal and rain fed condition in Mymensingh and Magura districts and all cultural practices were followed as per need. Binadhan-7 was harvested on last week of October 2011 and Binadhan-4 was harvested on second week of November 2011. At the harvest time, necessary yield and meteorological data were collected and analyzed. After T. aman harvest, mustard and wheat seeds were sown on 5th and 20th November 2011 in Mymensingh district and lentil, mustard and chickpea seeds were sown on 15th November 2011 in Magura district. The experimental design was RCBD with split plot arrangement of the treatments, having irrigation treatments in main plots and mustard varieties in sub-plots. In mustard experimental plots, irrigation treatments were: T1 = Irrigation at vegetative stage up to field capacity; T2 = Irrigation at vegetative stage and flowering stage up to field capacity and T3 = Irrigation at vegetative stage, flowering stage and pod development stage up to field capacity. The varieties were: V1 = Binasarisha-3; V2 = Binasarisha-4 and V3 = BARI Sarisha-15. In wheat experimental plot, irrigation treatments were: T1 = Irrigation at CRI stage up to field capacity ; T2 = Irrigation at CRI stage and maximum tillering stage up to field capacity and T3 = Irrigation at CRI stage, maximum tillering stage and booting and heading stage up to field capacity. The wheat varieties were: V1 = Bijoy; V2 = Prodip and V3 = BARI Gom-26. In lentil experimental plots, irrigation treatments were T1 = Irrigation at vegetative stage up to field capacity, T2 = Irrigation at vegetative stage and flowering stage up to field capacity and T3 = Irrigation at vegetative stage, flowering stage and pod development stage up to field capacity. The varieties were: V1 = Binamasur-2; V2 = BARI Masur-5 and V3 = Binamasur-6. In chickpea experimental plots, irrigation treatments were T1 = Irrigation at vegetative stage up to field capacity, T2 = Irrigation at vegetative stage and flowering stage up to field capacity and T3 = Irrigation at vegetative stage, flowering stage and pod development stage up to field capacity. The varieties were: V1 = Binasola-4; V2 = Binasola-5 and V3 = BARI Sola-5. Irrigation water was applied up to field capacity as per treatment. Soil moisture was measured by gravimetric method up to 60 cm for every 15 cm increments at the time of sowing, before and after irrigation and at harvest time. Other cultural practices were followed as and when necessary. BARI Sarisa-15, Binasarisa-4 and Binasarisa-3 were harvested on 28th January and 5th February 2012, respectively. Binamasur-2, BARI Masur-5 and

BINA Annual Report 2011-12 Agricultural Engineering
245
Binamasur-6 were harvested on 6th March 2012. Binasarisa-3, Binasarisa-4 and BARI Sarisa-15 were harvested on, 21st February 2012, 19th February 2012 and 12th February 2012 respectively. Binasola-4, Binasola-5 and BARI Sola-5 were harvested on 27th March 2012 and wheat was harvested on 18th
March 2012. After mustard and wheat harvest, boro rice and transplanted aus rice were transplanted in Mymensingh. In T. aman–Fallow–Boro cropping pattern, boro rice was transplanted on 17th January 2012 and harvested on 25th April to 11th May 2012. In T. aman–Mustard–Boro cropping pattern, boro rice was transplanted on 11th February 2012 and harvested on 8th to 18th May 2012. In all the rice experiments, main plot treatments were T1 = Continuous ponding 3-5 cm, T2 = AWD 20 cm, T3 = AWD 30 cm and T4 = AWD 40 cm. Popular boro rice varieties were V1 = Binadhan-5, V2 = Binadhan-7 and V3 = BRRI dhan28. All cultural practices were done as per recommendation. In T. aman-Wheat-T. aus cropping pattern, T. aus rice was transplanted on 9th April 2012 and harvested on 1th September 2012. In all the rice experiments, main plot treatments were T1 = Continuous ponding 3-5 cm, T2 = AWD 20 cm, T3 = AWD 30 cm and T4 = AWD 40 cm. Popular T. aus rice varieties were V1 = BR26 and V2 = BRRI dhan 48. All cultural practices were done as per recommendation. All agronomic data were collected at the harvest time. After lentil, mustard and chickpea harvest, sesame and mungbean seeds were sown on 20th March 2012 and jute seed was sown on 5th April 2012 in Magura districts according to cropping pattern T. aman–Lentil–Sesame, T. aman–Mustard–Mungbean and T. aman– Chickpea – Jute. The experimental design was split plot having irrigation treatments in main plots and varieties in subplots. In mungbean experimental plot, irrigation treatments were T1 = Irrigation at vegetative stage up to field capacity, T2 = Irrigation at vegetative stage and flowering stage up to field capacity and T3 = Irrigation at vegetative stage, flowering stage and pod development stage up to field capacity. The varieties were: V1 = Binamoog-5; V2 = Binamoog-8 and V3 = Barimoog-5. In sesame experimental plot, irrigation treatments were T1 = Irrigation at vegetative stage up to field capacity, T2 = Irrigation at vegetative stage and flowering stage up to field capacity and T3 = Irrigation at vegetative stage, flowering stage and pod development stage up to field capacity. The varieties were: V1 = Binatil-1; V2 = Binatil-2 and V3 = BARI Til-3. In jute experimental plot, irrigation treatment were T1 =No supplementary irrigation, T2 = Irrigation at vegetative stage up to field capacity and T3 = Irrigation at fiber development stage up to field capacity. The variety was Bonkim. Binamoog-8, Binamoog-5 and BARI Moog-5 were harvested on 31st May 2012, 1st June 2012 and 10th June 2012, respectively. Sesame was harvested on 10th May 2012 and jute was harvested on 4th August 2012. All the cultural practices were done as per recommendation. All agronomic data were collected at the harvest time. Meteorological data (maximum temperature, minimum temperature, maximum relative humidity, minimum relative humidity, sunshine hour, and rainfall) were also collected. Effective rainfall was determined by FAO method: Re = 0.8 × R-25 mm when R>75 mm month-1; Re = 0.6 × R-0 mm when R<75 mm month-1. Irrigation water productivity kg ha-1cm-1 was calculated as the ratio of yield and irrigation water. From the experimental findings, it was found that Binadhan-7 was harvested on last week of October 2011 completing their life cycle within 113 to 116 days and soil moisture was about 40% by volume (Table 64). Yield of Binadhan-7 was found about 5.06 to 6.38 t ha-1. On the other hand, Binadhan-4

BINA Annual Report 2011-12 Agricultural Engineering
246
was harvested on 2nd week of November 2011 by completing its life cycle 127 to 131 days i.e. just two weeks later than the Binadhan-7 and soil moisture was 30% by volume. Yield of Binadhan-4 varied from 6.30 to 6.64 t ha-1 at different locations. Profiles of agro-meteorological parameters during the growing period of T. aman are presented in Table 65. It was observed that about 28.49, 74.10, 23.95 and 1.71 cm rainfall occurred in July, August, September and October, respectively. During the growing period of T. aman, maximum temperature varied from 27.5 to 36.5oC and minimum temperature was 26.5 to 20oC, respectively. The average maximum and minimum relative humidity varied from 92 to 100% and 41 to 92%, respectively. Sunshine hour varied from 3.55 to 7.39 hours, respectively. Mean effect of irrigation and varieties on yield and yield attributing characters of mustard at Mymesingh sadar upazila is presented in Table 66. Irrigation treatments had no significant effect on yield attributing characters of mustard except plant height but varieties had significant effect on plant height, pod length, number of seeds per pod, 1000 seed wt, seed yield and straw yield of mustard. The highest seed yield was obtained from T2 treatment which received two irrigations and Binasarisha-3 produced the highest yield (1726.80 kg ha-1) followed by Binasarisha-4 and BARI Sarisha-15, respectively (Table 66). Interaction effect of treatments and varieties on yield and yield attributing characters of mustard at Mymesingh sadar upazila are presented in Table 67. The highest yield was obtained 1871.25 kg ha-1 in treatment T2V1 and the lowest was 1299.87 kg ha-1 in treatment T3V3. Higher water use efficiency was also found in T2 treatment (Table 68). Profiles of agro-meteorological parameters during the growing period of mustard in Mymensingh are presented in Table 69. It was observed that about 1.8 cm rainfall was occurred in January and no rainfall occurred in November, December and February. During the growing period of mustard, maximum temperature varied from 31.7 to 25.2oC and minimum temperature 14 to 9.4oC, respectively. The average maximum and minimum relative humidity varied from 99 to 100% and 71.97 to 83.58%, respectively. Sunshine hour varied from 4.66 to 7.51 hours, respectively. Irrigation treatment had no significant effect on wheat yield and no varietals yield differences was observed (Table 70-71). The highest water use efficiency was observed in T1 treatment where only one irrigation was applied at crown root initiation stage (Table 72). Profiles of agro-meteorological parameters during the growing period of wheat are presented in Table 73. It was observed that about 1.92 cm rainfall was occurred in January and March and no rainfall occurred in November, December and February. During the growing period of wheat, maximum temperature varied from 19.0 to 32.5oC and minimum temperature 8.0 to 22.0oC, respectively. The average maximum and minimum relative humidity varied from 99 to 100% and 71.97 to 83.58%, respectively. Sunshine hour varied from 4.66 to 7.51 hours, respectively. Mean effect of irrigation and varieties on yield and yield attributing characters of boro (T. aman- Fellow-Boro) rice at Mymesingh sadar upazila are presented in Table 74. Highest yield of 6.18 tha-1 and 5.84 t ha-1 was obtained in treatment T1 (continuous ponding) and variety V1 (Binadhan-7), respectively. Interaction effect of treatment and varieties on yield and yield attributing characters of boro rice at Mymesingh sadar upazila are presented in Table 75. Highest yield of 6.54 t ha-1 was obtained in treatment T1V1 and lowest of 5.12 t ha-1 was obtained in treatment T4V1. The total water inputs (rainfall and irrigation) ranged from 107.45 cm to 70.93 cm (Table 76). To maintain continuous

BINA Annual Report 2011-12 Agricultural Engineering
247
standing water, maximum irrigation water needed was 107.45 cm, but in AWD treatments 87.92 cm (applying irrigation when AWD 20 cm), 78.09 cm (applying irrigation when AWD 30 cm) and 70.93 cm (applying irrigation when AWD 40 cm) was applied. Due to applying AWD method it was found that yield of rice decreased in other treatments over treatment T1. About 4.21, 10.52 and 13.59 percent yield was decreased in treatment T2, T3 and T4 over T1, respectively. Mean effect of irrigation and varieties on yield and yield attributing characters of boro rice (T. aman- Mustard-Boro) at Mymesingh sadar upazila are presented in Table 77. Highest yield was obtained 6.10 t ha-1 and 5.54 t ha-1 in treatment T1 (continuous ponding) and variety V1 (Binadhan-7), respectively. Interaction effect of treatment and varieties on yield and yield attributing characters of boro rice at Mymesingh sadar upazila are presented in Table 78. Highest yield was obtained 6.37 t ha-1 in treatment T1V1 and lowest was 4.48 t ha-1 in treatment T4V1. The total water inputs (rainfall and irrigation) ranged from 109.26 cm to 68.76 cm in Table 79. To maintain continuous standing water, maximum irrigation water needed was 109.26 cm, but in AWD treatments 85.91 cm (applying irrigation when AWD 20 cm), 77.22 cm (applying irrigation when AWD 30 cm) and 68.76 cm (applying irrigation when AWD 40 cm) was applied. Due to applying AWD method it was found that yield of rice decreased in other treatments over treatment T1. About 5.72, 14.22 and 20.92 percent yield was decreased in treatment T2, T3 and T4 over T1, respectively. Mean effect of irrigation and varieties on yield and yield attributing characters of T. aus rice at Mymesingh sadar upazila are presented in Table 80. Highest yield was obtained 1.59 t ha-1 and 1.5 t ha-1 in treatment T1 (continuous ponding) and variety V1 (BR-26), respectively. Interaction effect of treatment and varieties on yield and yield attributing characters of T. aus rice at Mymesingh sadar upazila are presented in Table 81. Highest yield of 1.53 tha-1 was obtained in treatment T3V1 and lowest of 1.33 t ha-1 was obtained in treatment T3V2. Due to applying AWD method it was found that yield of rice decreased in other treatments over treatment T1. About 4.40, 8.18 and 11.32 percent yield was decreased in treatment T2, T3 and T4 over T1, respectively (Table 82). In Magura district, average profile soil moisture was found 41% by volume at the harvest time. It also showed that yield of Binadhan-7 was found about 5.6 to 7.5 t ha-1 in different locations of Magura district (Table 83). From meteorological data it was observed that there was total 46.5 cm effective rainfall during the crop growing period (Fig. 40). Maximum temperature varied from 28 to 38.8oC and minimum temperature varied from 19 to 34.4oC. Average temperature varied from 31.30 to 34.2oC (Table 84). Average relative humidity varied from 78.51% to 84.27%. Average sunshine hour was 3.22 hours up to 32 DAT and increased to 5.92 hours on last 28 DAT (Fig. 41). Mean effect of irrigation and varieties on yield and yield attributing characters of lentil at Magura sadar upazila was presented in Table 85. Irrigation treatments had no significant effect on yield attributing characters of lentil except plant height but varieties had significant effect on seed yield of lentil. Highest seed yield was obtained from T1 treatment which received one irrigation and Binamasur-6 produced highest yield (1699.04 kg ha-1). Profiles of agro-meteorological parameters during the growing period of lentil are presented in Table 87. It was observed that about 5.7 cm rainfall occurred in January and no rainfall occurred in November, December and February. During the

BINA Annual Report 2011-12 Agricultural Engineering
248
growing period of lentil, maximum temperature varied from 35.9 to 14.8oC and minimum temperature 19 to 6oC, respectively. The average relative humidity varied from 99 to 63%. Mean effect of irrigation and varieties on yield and yield attributing characters of mustard at Magura sadar upazila was presented in Table 88. Irrigation treatments had significant effect on plant height, seed per plot and seed yield of mustard and varieties had significant effect on plant height, seed per pod, branch per plant and seed yield of mustard. Highest seed yield was obtained from T2 treatment which received two irrigation and Binasarisa-3 produced highest yield (1911.95 kg ha-1). Profiles of agro-meteorological parameters during the growing period of mustard are presented in Table 90. It was observed that about 5.7 cm rainfall occurred in January and no rainfall occurred in November, December and February. During the growing period of mustard, maximum temperature varied from 32.5 to 14.8oC and minimum temperature was 19 to 6.1oC, respectively. The average relative humidity varied from 98 to 65%. Mean effect of irrigation and varieties on yield and yield attributing characters of chickpea at Magura sadar upazila is presented in Table 91. Irrigation treatments had significant effect on grain yield and straw yield of chickpea and varieties had significant effect on seed per pod and seed yield of chickpea. Highest seed yield was obtained from T1 treatment which received one irrigation and Binasola-5 produced highest yield (1663.20 kg ha-1). Profiles of agro-meteorological parameters during the growing period of mustard are presented in Table 93. It was observed that about 5.7 cm rainfall occurred in January and no rainfall occurred in November, December February and March. During the growing period of chickpea, maximum temperature varied from 37 to 14.8oC and minimum temperature was 21.8 to 6.1oC, respectively. The average relative humidity varied from 98 to 61%. Mean effect of irrigation and varieties on yield and yield attributing characters of sesame at Magura sadar upazila was presented in Table 94. Irrigation treatments had significant effect on seed yield of sesame and varieties had significant effect on branch per plant, seed per pod and seed yield of sesame. Highest seed yield was obtained from T2 treatment which received two irrigation and Binatil-2 produced highest yield (2100 kg ha-1). Profiles of agro-meteorological parameters during the growing period of sesame are presented in Table 95. It was observed that about 46.44 cm rainfall occurred in April to June and no rainfall occurred in March. One irrigation at T2 at vegetative stage was applied. Due to excessive rainfall T3 treatment was not applied. During the growing period of sesame, maximum temperature varied from 39.9 to 29.0oC and minimum temperature was 28.7 to 16.8oC, respectively. The average relative humidity varied from 84.18 to 63.02%. Mean effect of irrigation and varieties on yield and yield attributing characters of mungbean at Magura sadar upazila is presented in Table 96. Irrigation treatments had significant effect on seed yield of mungbean and varieties had significant effect on plant height and seed yield of mungbean. Highest seed yield was obtained from T2 treatment which received two irrigation and Binamoog-8 produced highest yield (1327 kg ha-1). Profiles of agro-meteorological parameters during the growing period of mungbean are presented in Table 97. It was observed that about 20.54 cm rainfall occurred in April to May and no rainfall occurred in March. One irrigation was applied in T2 at vegetative stage. Due to excessive rainfall irrigation was not applied in T3 treatment. During the growing period of mungbean, maximum temperature varied from 32.5 to 14.8oC and minimum temperature varied from 19 to 6.1oC, respectively. The average relative humidity varied from 76.21 to 63.02%. Mean effect of irrigation and varieties on yield and yield attributing characters of jute at Magura sadar upazila was presented in

BINA Annual Report 2011-12 Agricultural Engineering
249
Table 98. Irrigation treatments had significant effect on plant height, fiber weight and stick weight of jute. Highest fiber weight was obtained from T2 treatment which received one irrigation produced highest fiber weight 6.77 t ha-1 (Table 98). Profiles of agro-meteorological parameters during the growing period of jute are presented in Table 99. It was observed that about 61.51cm rainfall occurred in April to August (Table 99). One irrigation was applied in T2 at vegetative stage. Due to excessive rainfall irrigation was not applied in T3 treatment. During the growing period of jute, maximum temperature varied from 39.9 to 28.4oC and minimum temperature from 29 to 21.4oC, respectively. The average relative humidity varied from 84.27 to 70.32%. Table 64. Life cycle, yield and yield attributing characters of Binadhan-7 and Binadhan-4 at different locations
of Mymensingh Sadar Upazilla
T. aman rice varieties Locations Life cycle
(days) Plant height
(cm) Tiller (no.)
Panicle length (cm)
Seed panicle-1
Grain yield (t ha-1)
Straw yield (t ha-1)
Rahamatpur 113 97.17 14.00 25.85 129.35 6.38 11.90 Digharkanda 116 102.00 11.50 18.50 169.25 5.85 20.76 Binadhan-7 Alalpur 113 101.50 12.50 24.91 121.61 5.06 6.46 Rahamatpur 127 132.60 8.80 27.10 136.45 6.30 31.21 Digharkanda 127 131.83 14.50 29.00 199.50 6.64 30.62 Binadhan-4 Alalpur 131 133.33 14.85 29.78 216.32 6.57 29.58
Table 65. Profiles of agro-meteorological parameters during the growing season of T. aman rice (Binadhan-7 and Binadhan-4) at Mymensingh Sadar Upazila
Maximum temperature (°C)
Minimum temperature (°C)
Relative humidity (%) Months
Rain-fall (cm)
Range Ave. Range Ave.
Sun shine (hour) Max. Min. Ave.
July 28.49 34.5-28.0 31.69 28.0-24.0 26.15 3.55 97-94 90-63 86.55 August 74.10 35.5-28.2 31.32 29.2-24.8 28.80 3.85 99-93 92-51 86.94 September 23.95 36.5-27.5 32.17 27.2-24.5 26.08 5.70 99-92 92-55 84.43 October 1.71 35.0-29.0 32.34 26.5-20.0 23.78 7.39 100-94 76-53 76.45 November 0.00 31.7-25.5 28.75 20.4-15.0 16.87 7.00 100-97 69-41 82.23
Table 66. Mean effect of irrigation and varieties on yield and yield attributing characters of mustard at Mymesingh Sadar Upazila
Treatment Plant height (cm)
Branch plant-1
(no.)
Pod length (cm)
Pods plant-1
(no.)
Seeds pod-1
(no.)
1000 seed wt.
(gm)
Seed yield
(kg ha-1)
Straw yield
(kg ha-1) T1 93.46 5.59 5.94 81.35 26.76 3.38 1484.93 1576.11 T2 98.32 5.67 5.75 78.14 25.68 3.45 1587.29 1663.82 T3 94.30 5.87 5.78 82.61 26.68 3.47 1503.33 1613.75
LSD0.05 3.71 NS NS NS NS NS NS NS V1 93.33 4.88 6.54 75.97 27.51 3.77 1726.80 1790.41 V2 93.02 6.08 6.70 81.77 28.31 3.95 1637.50 1798.26 V3 99.73 6.18 4.23 84.36 23.31 2.58 1211.25 1265.00
LSD0.05 3.71 NS 0.43 NS 2.73 0.25 216.2 248.50

BINA Annual Report 2011-12 Agricultural Engineering
250
Table 67. Interaction effect of treatment and varieties on yield and yield attributing characters of mustard at Mymensingh Sadar Upazila
Treatment Plant height (cm)
Branch plant-1
(no.)
Pod length (cm)
Pods plant-1
(no.)
Seeds pod-1
(no.)
1000 seed wt.
(gm)
Seed yield
(kg ha-1)
Straw yield
(kg ha-1) T1V1 90.80 c 5.64 6.80 a 86.80 27.06 abc 3.76 a 1620.00 ab 1805.21 a T1V2 89.53 c 5.26 6.63 a 76.13 28.80 a 3.87 a 1650.41 a 1678.75 abT1V3 100.06 ab 5.88 4.40 b 81.12 24.44 abc 2.50 b 1184.37 c 1244.37 b T2V1 96.33 bc 4.33 6.36 a 64.47 26.00 abc 3.71 a 1871.25 a 1863.96 a T2V2 95.20 bc 6.19 6.86 a 76.06 27.93 ab 4.02 a 1653.12 a 1877.91 a T2V3 103.43 a 6.50 4.03 b 93.91 23.11 bc 2.63 b 1237.51 bc 1249.58 b T3V1 92.86 c 4.66 6.46 a 76.66 29.46 a 3.84 a 1689.16 a 1702.08 abT3V2 94.33 bc 6.80 6.60 a 93.13 28.20 ab 3.95 a 1608.96 bc 1838.12 a T3V3 95.70 bc 6.16 4.27 b 78.05 22.39 c 2.61 b 1299.87 c 1301.04 b
Table 68. Amount of irrigation water requirement and water productivity of mustard at Mymensingh Sadar Upazila
Treatments Irrigation
water (cm)
Effective rainfall (cm)
Soil moisture depletion
(cm)
Water requirement
(cm)
Yield
(kg ha-1)
Water use efficiency
(kg ha-1 cm-1) T1 2.44 1.8 9.12 13.36 1484.93 111 T2 3.56 1.8 5.98 11.34 1587.29 140 T3 3.56 1.8 5.44 10.8 1503.33 139
Table 69. Profiles of agro-meteorological parameters during the growing season of mustard at Mymensingh Sadar Upazila
Maximum temperature (°C)
Minimum temperature (°C)
Relative humidity (%) Months
Rain-fall (cm)
Range Ave. Range Ave.
Sun shine (hour) Max. Min. Ave.
November 0.00 31.7-25.2 28.75 16.7-14.5 16.87 6.96 99 36 82.23 December 0.00 29.0-19.0 24.48 14.0-9.4 13.64 5.01 100 28 83.58 January 1.80 27.2-19.0 23.16 16.3-8.0 12.43 4.66 100 29 80.03 February 0.00 31.3-24.0 27.40 17.5-9.4 13.94 7.51 100 23 71.97
Table 70. Mean effect of irrigation and varieties on yield and yield attributing characters of wheat at Mymensingh Sadar Upazila
Treatment Plant height (cm)
Tiller hill-1
(no.) Spike length
(cm) Grains spike-1
(no.) 1000 seed wt.
(gm) Grain yield
(t ha-1) Straw yield
(t ha-1) T1 94.68 8.75 11.39 36.28 47.34 3.38 2.96 T2 94.79 9.55 11.25 48.59 46.27 3.34 3.06 T3 96.95 10.05 11.44 47.67 42.68 3.41 3.56
LSD0.05 0.83 0.74 NS 1.51 1.89 NS 0.16 V1 94.46 9.20 11.77 41.03 48.94 3.22 3.25 V2 97.07 9.96 11.60 45.11 44.43 3.37 3.02 V3 94.91 9.19 10.71 46.41 42.92 3.52 3.32
LSD0.05 1.44 0.74 0.72 1.51 1.89 NS 0.16

BINA Annual Report 2011-12 Agricultural Engineering
251
Table 71. Interaction effect of treatment and varieties on yield and yield attributing characters of wheat at Mymensingh Sadar Upazila
Treatment Plant height (cm)
Tiller hill-1 (no.)
Spike length (cm)
Grains spike-1
(no.) 1000 seed wt.
(gm) Grain yield
(t ha-1) Straw yield
(t ha-1) T1V1 94.31 d 9.03 bc 12.26 a 32.35 e 54.28 a 3.23 ab 3.33 b T1V2 95.36 bcd 9.48 ab 10.95 ab 42.49 cd 44.69 bc 3.39 ab 2.67 c T1V3 94.36 cd 7.72 c 10.95 ab 34.02 e 43.05 bc 3.51 ab 2.89 c T2V1 94.46 cd 8.99 bc 11.24 ab 48.48 b 51.19 a 3.35 ab 2.91 c T2V2 97.09 abc 9.59 ab 11.95 ab 45.00 c 46.14 b 3.35 ab 2.88 c T2V3 92.82 d 10.07 ab 10.56 b 52.29 a 41.46 c 3.32 ab 3.40 ab T3V1 94.59 cd 9.58 ab 11.81 ab 42.25 d 41.34 c 3.09 b 3.50 ab T3V2 98.75 a 10.80 a 11.89 ab 47.85 b 42.45 c 3.38 ab 3.51 ab T3V3 97.51 ab 9.77 ab 10.63 b 52.92 a 44.25 bc 3.74 a 3.68 a
Table 72. Amount of irrigation water requirement and water productivity of wheat at Mymensingh Sadar Upazila
Treatments Irrigation
water (cm)
Effective rainfall (cm)
Soil moisture depletion
(cm)
Water requirement
(cm)
Grain yield
(kg ha-1)
Water use efficiency
(kg ha-1 cm-1) T1 2.51 1.92 7.77 12.2 3380 277.05 T2 5.53 1.92 6.37 13.82 3340 241.68
T3 9.67 1.92 4.16 15.75 3410 216.51
Table 73. Profiles of agro-meteorological parameters during the growing season of wheat at Mymensingh Sadar Upazila
Maximum temperature (°C)
Minimum temperature (°C)
Relative humidity (%) Months Rainfall
(cm) Range Ave. Range Ave.
Sun shine (hour) Max. Min. Ave.
November 0.00 30.2-27.3 28.75 16.7-14.5 16.87 6.96 99 36 82.23 December 0.00 29.0-19.0 24.48 14.0-9.4 13.64 5.01 100 28 83.58 January 1.80 27.2-19.0 23.16 16.3-8.0 12.43 4.66 100 29 80.03 February 0.00 31.3-24.0 27.40 17.5-9.4 13.94 7.51 100 23 71.97 March 0.12 32.5-28.0 31.37 22.0-14.5 19.17 7.16 100 26 73.84
Table 74. Mean effect of irrigation and varieties on yield and yield attributing characters of Boro rice (T. aman-Fellow-Boro) at Mymensingh Sadar Upazila
Treatment Plant height (cm)
Tiller hill-1
(no.) Panicle length
(cm) Seeds panicle-1
(no.) 1000 seed wt.
(g) Grain yield
(t ha-1) Straw yield
(t ha-1) T1 106.7 a 13.48 a 23.07 a 134.53 a 25.69 a 6.18 a 12.97 a T2 105.96 a 12.97 ab 23.27 a 120.11 b 25.49 a 5.92 b 12.60 a T3 103.36 b 12.24 ab 22.31 ab 104.60 c 25.09 b 5.53 c 11.40 b T4 101.5 b 11.48 b 21.77 b 94.33 d 24.64 c 5.34 d 11.38 b
LSD0.05 2.21 1.57 1.18 3.18 0.20 0.11 0.43 V1 119.95 a 11.41 b 22.07 a 145.66 a 26.48 a 5.84 a 14.14 a V2 91.43 c 12.83 a 22.70 a 96.56 b 24.94 b 5.64 c 10.84 c V3 101.76 b 13.40 a 23.05 a 97.95 b 24.26 c 5.74 b 11.29 b
LSD0.05 3.42 1.09 0.95 3.23 0.23 0.06 0.32
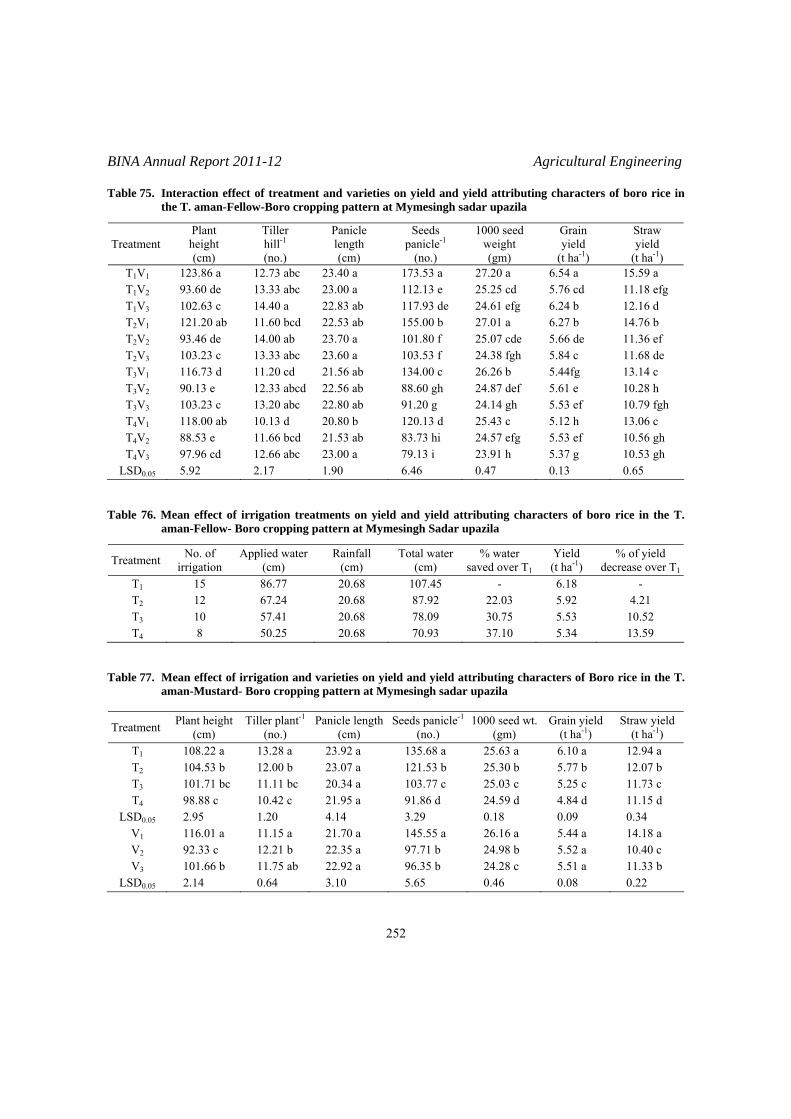
BINA Annual Report 2011-12 Agricultural Engineering
252
Table 75. Interaction effect of treatment and varieties on yield and yield attributing characters of boro rice in the T. aman-Fellow-Boro cropping pattern at Mymesingh sadar upazila
Treatment Plant height (cm)
Tiller hill-1
(no.)
Panicle length (cm)
Seeds panicle-1
(no.)
1000 seed weight (gm)
Grain yield
(t ha-1)
Straw yield
(t ha-1) T1V1 123.86 a 12.73 abc 23.40 a 173.53 a 27.20 a 6.54 a 15.59 a T1V2 93.60 de 13.33 abc 23.00 a 112.13 e 25.25 cd 5.76 cd 11.18 efg T1V3 102.63 c 14.40 a 22.83 ab 117.93 de 24.61 efg 6.24 b 12.16 d T2V1 121.20 ab 11.60 bcd 22.53 ab 155.00 b 27.01 a 6.27 b 14.76 b T2V2 93.46 de 14.00 ab 23.70 a 101.80 f 25.07 cde 5.66 de 11.36 ef T2V3 103.23 c 13.33 abc 23.60 a 103.53 f 24.38 fgh 5.84 c 11.68 de T3V1 116.73 d 11.20 cd 21.56 ab 134.00 c 26.26 b 5.44fg 13.14 c T3V2 90.13 e 12.33 abcd 22.56 ab 88.60 gh 24.87 def 5.61 e 10.28 h T3V3 103.23 c 13.20 abc 22.80 ab 91.20 g 24.14 gh 5.53 ef 10.79 fgh T4V1 118.00 ab 10.13 d 20.80 b 120.13 d 25.43 c 5.12 h 13.06 c T4V2 88.53 e 11.66 bcd 21.53 ab 83.73 hi 24.57 efg 5.53 ef 10.56 gh T4V3 97.96 cd 12.66 abc 23.00 a 79.13 i 23.91 h 5.37 g 10.53 gh
LSD0.05 5.92 2.17 1.90 6.46 0.47 0.13 0.65 Table 76. Mean effect of irrigation treatments on yield and yield attributing characters of boro rice in the T.
aman-Fellow- Boro cropping pattern at Mymesingh Sadar upazila
Treatment No. of irrigation
Applied water (cm)
Rainfall (cm)
Total water (cm)
% water saved over T1
Yield (t ha-1)
% of yield decrease over T1
T1 15 86.77 20.68 107.45 - 6.18 - T2 12 67.24 20.68 87.92 22.03 5.92 4.21 T3 10 57.41 20.68 78.09 30.75 5.53 10.52 T4 8 50.25 20.68 70.93 37.10 5.34 13.59
Table 77. Mean effect of irrigation and varieties on yield and yield attributing characters of Boro rice in the T.
aman-Mustard- Boro cropping pattern at Mymesingh sadar upazila
Treatment Plant height (cm)
Tiller plant-1
(no.) Panicle length
(cm) Seeds panicle-1
(no.) 1000 seed wt.
(gm) Grain yield
(t ha-1) Straw yield
(t ha-1) T1 108.22 a 13.28 a 23.92 a 135.68 a 25.63 a 6.10 a 12.94 a T2 104.53 b 12.00 b 23.07 a 121.53 b 25.30 b 5.77 b 12.07 b T3 101.71 bc 11.11 bc 20.34 a 103.77 c 25.03 c 5.25 c 11.73 c T4 98.88 c 10.42 c 21.95 a 91.86 d 24.59 d 4.84 d 11.15 d
LSD0.05 2.95 1.20 4.14 3.29 0.18 0.09 0.34 V1 116.01 a 11.15 a 21.70 a 145.55 a 26.16 a 5.44 a 14.18 a V2 92.33 c 12.21 b 22.35 a 97.71 b 24.98 b 5.52 a 10.40 c V3 101.66 b 11.75 ab 22.92 a 96.35 b 24.28 c 5.51 a 11.33 b
LSD0.05 2.14 0.64 3.10 5.65 0.46 0.08 0.22

BINA Annual Report 2011-12 Agricultural Engineering
253
Table 78. Interaction effect of treatment and varieties on yield and yield attributing characters of boro rice in the T. aman-Mustard- Boro at Mymesingh sadar upazila
Treatment Plant height
(cm) Tiller plant-1
(no.) Panicle length
(cm) Seeds panicle-1
(no.) 1000 seed wt.
(gm) Grain yield
(t ha-1) Straw yield
(t ha-1) T1V1 122.20 a 13.26 a 25.10 a 174.53 a 26.91 a 6.37 a 15.45 a T1V2 97.66 de 13.93 a 23.33 a 116.963 d 25.34 bcd 5.69 bc 11.07 f T1V3 104.80 c 12.66 ab 23.33 a 115.60 d 24.63 def 6.25 a 12.30 d T2V1 118.33 a 11.80 bc 23.56 a 160.53 d 26.32 ab 5.83 b 14.16 b T2V2 93.66 ef 12.66 ab 22.60 ab 101.53 e 25.15 cde 5.63 c 10.51 g T2V3 101.60 cd 11.53 bc 23.06 ab 102.53 e 24.44 bef 5.85 b 11.55 e T3V1 112.93 b 10.06 de 16.20 b 132.66 c 26.02 abc 5.11 f 13.72 c T3V2 90.13 fg 11.53 bc 21.86 ab 89.13 f 24.90 de 5.45 d 10.21 gh T3V3 102.06 cd 11.73 bc 22.96 ab 89.40 f 24.19 ef 5.19 ef 11.26 ef T4V1 110.60 b 9.46 e 21.93 ab 114.46 d 25.39 bcd 4.48 h 13.39 c T4V2 87.86 g 10.73 cde 21.60 ab 83.26 f 24.53 def 5.30 de 9.82 h T4V3 98.20 d 11.06 cd 22.33 ab 77.86 f 23.85 f 4.74 g 10.23 gh
LSD0.05 4.28 1.29 6.21 11.31 0.93 0.16 0.44
Table 79. Mean effect of irrigation treatments on yield and yield attributing characters of boro rice in the T. aman-Mustard-Boro cropping pattern at Mymesingh Sadar upazila
Treatment Irrigation (no.)
Applied water (cm)
Rainfall (cm)
Total water (cm)
% water saved over T1
Yield (t ha-1)
% of yield decrease over T1
T1 16 88.58 20.68 109.26 - 6.12 - T2 12 65.23 20.68 85.91 23.81 5.77 5.72 T3 9 56.54 20.68 77.22 31.52 5.25 14.22 T4 8 48.08 20.68 68.76 39.02 4.84 20.92
Table 80. Mean effect of irrigation and varieties on yield and yield attributing characters of T. aus rice at Mymensingh Sadar Upazila
Treatment Plant height (cm)
Tiller plant-1
(no.) Panicle length
(cm) Seeds panicle-1
(no.) 1000 seed wt.
(gm) Grain yield
(t ha-1) Straw yield
(t ha-1) T1 98.16 10 22.00 26.06 24.00 1.43 9.25 T2 96.33 10 22.35 25.46 23.91 1.52 9.35 T3 95.60 10 22.08 25.53 23.35 1.46 9.07 T4 95.86 10 21.91 23.00 23.62 1.41 8.77
LSD0.05 0.23 NS 0.06 2.34 0.09 0.11 0.45 V1 97.83 10 22.14 23.86 24.02 1.51 9.46 V2 95.15 11 22.03 26.16 23.42 1.40 8.76
LSD0.05 0.34 1.65 NS 0.67 0.34 0.07 0.12

BINA Annual Report 2011-12 Agricultural Engineering
254
Table 81. Interaction effect of treatment and varieties on yield and yield attributing characters of T. aus rice at Mymensingh Sadar Upazila
Treatment Plant height (cm)
Tiller plant-1
(no.) Panicle length
(cm) Seeds panicle-1
(no.) Straw yield 1000 seed wt. Grain yield
(t ha-1) (gm) (t ha-1) T1V1 98.86 10.13 22.16 24.46 24.35 1.50 9.75 T1V2 97.46 10.26 21.83 27.66 23.65 1.37 8..75 T2V1 97.66 10.20 22.63 24.20 24.27 1.54 9.70 T2V2 95.00 10.60 22.06 26.73 23.55 1.50 9.00 T3V1 97.46 10.26 21.96 23.66 23.77 1.58 9.50 T3V2 93.73 10.53 22.20 27.40 22.94 1.33 8.65 T4V1 97.33 10.13 21.80 23.13 23.71 1.41 8.90 T4V2 94.40 10.73 22.03 22.86 23.54 1.41 8.65
LSD0.05 0.82 0.01 0.06 0.13 0.032 0.07 0.08 Table 82. Mean effect of irrigation treatments on yield and yield attributing characters of T. aus rice at
Mymesingh Sadar upazila
Treatment No. of irrigation
Applied water (cm)
Rainfall (cm)
Total water
% water saved over T1
Yield (t ha-1)
% of yield decrease over T1
T1 9 62.68 18.45 81.13 - 1.59 - T2 8 46.00 18.45 64.45 20.56 1.52 4.40 T3 7 43.31 18.45 61.76 23.88 1.46 8.18 T4 5 36.49 18.45 54.94 32.28 1.41 11.32
Table 83. Yield and yield attributing characters of Binadhan-7 in at different locations of Magura
Location Plant height
(cm) Tiller hill-1
(no.) Panicle length (cm)
Grain per panicle
(no)
Average grain yield
(t ha-1)
Average straw yield
(t ha-1) Ramnagar 88.4 20 24.2 134 7.55 12.76 Rautola 100 17.2 24.6 109.4 6.01 11.62 Sachani 94 15.8 22.6 100.2 5.59 12.1
Table 84. Climatic parameters during the growing days of Binadhan-7 from transplanting to harvest at
different locations of Magura
Maximum temperature (oC)
Minimum temperature (oC)
Relative humidity (%) Growing period
Range Average Range Average Max. Min. Average First 31 days 24.0-38.8 31.30 24.2-34.4 27.23 90-98 70-97 82.82 Second 31 days 26.8-36.6 32.37 24.2-27.4 25.57 93-98 68-95 84.27 Last 29 days 30.2-36.2 34.21 19-25.8 23.71 91-97 63-88 78.51

BINA Annual Report 2011-12 Agricultural Engineering
255
Distibution of rainfall on T. aman rice at Magura
25.8
19.3
1.40
5
10
15
20
25
30
1-31 DAT 32-62 DAT 63- 90 DAT
Days after transplanting
Rain
fall
(cm
)
Fig. 40. Distribution of rainfall during T. aman rice growing period at Magura
Average sunshine hour on T. aman at Magura
3.22 3.42
5.96
01234567
1-31 DAT 32-62 DAT 63- 90 DAT
Date after Transplant (DAT)
Suns
hine
hou
r
Fig. 41. Distribution of sunshine hour during T. aman rice growing period at Magura Table 85. Mean effect of irrigation and varieties on yield and yield attributing characters of lentil at Magura
Sadar Upzilla
Treatments Plant height (cm)
Branch plant-1
(no.) Pods
plant-1Grain yield
(kg ha-1) Straw yield
(kg ha-1) T1 38.27 a 2.96 87.69 1787.89 1306.94 T2 36.20 b 2.89 75.98 1550.91 1320.51 T3 38.80 a 3.11 91.87 1539.06 1282.73
LSD0.05 2.03 NS NS NS NS V1 36.64 2.71 b 71.78 1484.03 b 1361.40 V2 37.89 3.08 ab 93.27 1694.79 a 1272.44 V3 38.73 3.16 a 90.49 1699.04 a 1276.34
LSD0.05 NS 0.05 NS 162.6 NS

BINA Annual Report 2011-12 Agricultural Engineering
256
Table 86. Water requirement and water use efficiency of lentil at Magura Sadar Upazila
Treatments Irrigation
water (cm)
Effective rainfall (cm)
Soil moisture depletion
(cm)
Water requirement
(cm)
Yield
(kg ha-1)
Water use efficiency
(kg ha-1 cm-1) T1 2.25 5.7 7.12 15.07 1787.89 118.64 T2 3.75 5.7 5.22 14.67 1550.91 105.72 T3 4.75 5.7 4.80 15.25 1539.06 100.92
Table 87. Climatic parameters during the growing days of lentil from seeding to harvest at different locations of
Magura
Temperature (oC)
Relative humidity (%) Growing period
(Month)
Days after seeding (DAS) Max. Min. Avg. Range Average
Rainfall (cm)
November 0-17 32.5-27.8 19-12.7 23.04 65-91 79 0 December 18-47 31.0-14.8 17.9-6.1 15.98 99-72 87.74 0 January 48-78 19.4-28.7 16.1-6.8 16.84 98-74 86.1 5.7 February 79-107 34.1-24.3 18.3-8.3 19.66 89-66 76.96 0 March 108-113 35.9-32.3 18.9-13.8 23.57 79-63 69.83 0
Table 88. Mean effect of irrigation and varieties on yield and yield attributing characters of mustard at Magura
Sadar Upzilla
Treatments Plant height (cm)
Branch plant-1(no.)
Pod plant-1
(no.) Seed pod-1
(no.) Grain yield
(kg ha-1) Straw yield
(kg ha-1) T1 103.80 a 2.28 58.66 29.06 ab 1557.63 b 1490.17 T2 102.53 a 2.40 54.08 28.30 b 2023.16 b 1440.40 T3 97.69 b 2.50 51.36 29.97 a 2020.30a 1427.17
LSD0.05 4.43 NS NS 1.40 80.03 NS V1 99.63 b 2.02 b 63.67 a 32.33 a 1911.95 a 1448.31 V2 99.82 b 1.92 b 58.46 a 31.09a 1902.97 a 1491.52 V3 104.58 a 3.23 a 41.97 b 23.90 b 1786.16 b 1417.89
LSD0.05 4.65 1.05 12.48 3.60 58.92 NS Table 89. Water requirement and water use efficiency of mustard at Magura Sadar Upazila
Treatments Irrigation
water (cm)
Effective rainfall
(cm)
Soil moisture depletion
(cm)
Water requirement
(cm)
Yield
(kg ha-1)
Water use efficiency
(kg ha-1 cm-1) T1 2.75 5.7 8.42 16.87 1557.63 92.33 T2 4.55 5.7 5.48 15.73 2023.16 128.62 T3 4.55 5.7 5.44 15.69 2020.30 128.73

BINA Annual Report 2011-12 Agricultural Engineering
257
Table 90. Climatic parameters during the growing days of mustard from seeding to harvest at different locations of Magura
Temperature (oC)
Relative humidity (%) Growing period
(Month)
Days after seeding (DAS) Max. Min. Avg. Range Average
Rainfall (cm)
November 0-17 32.5-27.8 19-12.7 23.04 65-91 79 0 December 18-47 31.0-14.8 17.9-6.1 15.98 99-72 87.74 0 January 48-78 19.4-28.7 16.1-6.8 16.84 98-74 86.1 5.7 February 79-99 31.0-24.3 18.3-8.03 18.74 89-66 78.52 0
Table 91. Mean effect of irrigation and varieties on yield and yield attributing characters of chickpea at Magura
Sadar Upzilla
Treatments Plant height (cm)
Branch plant-1
(no.) Pod plant-1
(no.) Seed pod-1
(no.) Grain yield
(kg ha-1) Straw yield
(kg ha-1) T1 68.78 3.58 59.00 1.72 1659.69 a 1797.16 a T2 69.47 3.89 65.37 1.88 1573.15 b 1465.49 b T3 67.89 3.93 53.82 1.79 1540.95 b 1381.21 b
LSD0.05 NS NS NS NS 57.88 291.2 V1 70.29 3.87 55.89 1.86 a 1589.13 ab 1676.97 a V2 66.18 3.53 58.51 1.83 ab 1663.20 a 1419.59 b V3 69.67 4.00 63.79 1.71 b 1521.46 b 1547.30 ab
LSD0.05 NS NS NS 0.39 1.81 200.6 Table 92. Water requirement and water use efficiency of chickpea at Magura Sadar Upazila
Treatments Irrigation
water (cm)
Effective rainfall
(cm)
Soil moisture depletion
(cm)
Water requirement
(cm)
Yield
(kg ha-1)
Water use efficiency
(kg ha-1 cm-1) T1 2.30 5.7 6.12 14.12 1659.69 117.54 T2 3.80 5.7 4.98 14.48 1573.15 108.64 T3 3.80 5.7 4.44 13.94 1540.95 110.54
Table 93. Climatic parameters during the growing days of chickpea from seeding to harvest at different
locations of Magura.
Temperature (oC)
Relative humidity (%)
Growing period (Month)
Days after seeding (DAS) Max. Min. Avg. Range Average
Rainfall (cm)
November 0-17 32.5-27.8 19.0-12.7 23.04 65-91 79 0 December 18-47 31.0-14.8 17.9-6.1 15.98 99-72 87.74 0 January 48-78 19.4-28.7 16.1-6.8 16.84 98-74 86.1 5.7 February 79-107 34.1-24.2 18.3-8.3 19.66 89-66 76.96 0 March 108-134 37.0-22.7 21.8-13.8 24.5 98-61 72.74 0

BINA Annual Report 2011-12 Agricultural Engineering
258
Table 94. Mean effect of irrigation and varieties on yield and yield attributing characters of sesame at Magura Sadar Upzilla
Location Treatments Plant height (cm)
Pod plant-1
(nos.) Branch plant-1
(nos.) Pod Length
(cm) Seed pod-1
(nos.) Seed yield (kg ha-1)
T1 110.72 28.72 1.13 2.96 65.08 1412 T2 119.16 33.64 1.66 3.28 69.66 1543 T3 105.03 26.17 1.60 3.12 68.53 1472
LSD0.05 6.559** NS 0.718** 0.255 NS 83.49
V1 118.11 26.93 1.40 3.33 74.52 1528 V2 111.01 29.78 2.08 2.80 64.33 1709 V3 105.80 31.82 1.91 3.17 64.42 1293
Rawtola
LSD0.05 5.654** 1.863** 0.408** NS 7.903 46.03**
T1 111.66 40.82 1.93 3.24 72.57 1871 T2 120.84 63.73 2.37 3.19 76.70 2039 T3 111.31 42.66 2.00 3.22 71.88 1990
LSD0.05 2.210** 4.48** NS NS NS 76.16**
V1 118.26 43.52 1.40 4.13 84.51 1808 V2 112.17 53.61 2.08 2.82 65.66 2100 V3 113.38 50.08 1.91 2.70 70.92 1992
Ramnagor
LSD0.05 NS 4.88** 0.408** 0.334** 4.38** 75.33**
T1 123.09 34.66 1.77 2.92 69.35 1732 T2 122.88 34.97 1.88 2.98 73.04 1861 T3 128.00 34.11 1.60 3.00 70.35 1836
LSD0.05 NS NS 0.180 NS NS 26.80**
V1 124.71 32.93 0.33 3.64 87.86 1877 V2 122.76 36.26 2.80 2.65 62.68 1890 V3 126.51 36.95 2.28 2.66 62.27 1662
Sachani
LSD0.05 NS NS 0.504** 0.482** 6.754** 60.50**
** indicating significant level 0.01 Table 95. Climatic parameters during the growing days of sesame from seeding to harvest at different locations
of Magura.
Temperature (oC)
Relative humidity (%)
Growing period (Month)
Days after seeding (DAS) Max. Min. Avg. Max. Min. Average
Rainfall (cm)
March 0-12 38-32.3 27.2-16.8 28.55 98-83 56-16 63.02 0 April 13-42 39.9-33.5 28.1-21.4 31.07 96-85 56-16 70.32 3.60 May 43-73 36.6-29.0 28.7-22.5 29.78 96-87 64-22 76.21 16.94 June 74-83 34.9-29.2 27.7-24.8 29.66 97-91 77-44 84.18 25.90

BINA Annual Report 2011-12 Agricultural Engineering
259
Table 96. Mean effect of irrigation and varieties on yield and yield attributing characters of mungbean at Magura Sadar Upzilla
Location Treatments Plant height (cm)
Pod plant-1
(nos.) Branch plant-1
(no.) Pod length
(cm) Seed pod-1
(nos.) Seed yield (kg ha-1)
T1 79.80 20.16 2.28 8.44 11.0 1020 T2 82.29 21.22 2.42 8.70 11.2 1436 T3 79.67 21.56 2.24 8.64 11.2 1343
LSD0.05 NS NS NS NS NS 42.82 V1 86.56 20.86 2.37 8.59 11.22 1296 V2 71.96 21.64 2.47 8.71 11.36 1327 V3 83.24 20.42 2.10 8.49 10.82 1178
Rawtola
LSD0.05 6.33** NS 0.142** NS 0.39 46.68**
T1 76.53 19.77 2.34 8.73 10.84 1039 T2 79.75 20.77 2.62 8.97 11.13 1256 T3 78.29 19.23 2.42 8.70 10.90 1148
LSD0.05 NS NS NS NS NS 69.49**
V1 84.56 20.02 2.45 8.91 10.84 1167 V2 80.31 20.38 2.52 8.88 11.29 1283 V3 69.71 19.36 2.41 8.61 10.74 1094
Ramnagor
LSD0.05 6.69** NS NS NS 0.39 37.56**
T1 74.68 20.82 2.51 8.4 11.4 1019 T2 77.11 23.13 2.40 8.9 11.4 1190 T3 74.88 21.22 2.54 8.7 11.3 1088
LSD0.05 NS NS NS NS NS 60.72 V1 82.24 22.71 2.40 8.8 11.3 1148 V2 77.11 23.56 2.54 8.8 11.7 1168 V3 67.33 21.06 2.51 8.4 11.1 1080
Sachani
LSD0.05 7.89 NS NS NS NS 24.71 ** indicating significant level 0.01 Table 97. Climatic parameters during the growing days of mungbean from seeding to harvest at different
locations of Magura
Temperature (oC)
Relative humidity (%)
Growing period (Month)
Days after seeding (DAS) Max. Min. Avg. Max. Min. Average
Rainfall
(cm) March 0-12 32.5-27.8 19-12.7 28.55 98-83 56-16 63.02 0 April 13-42 31.0-14.8 17.9-6.1 31.07 96-85 56-16 70.32 3.60 May 43-73 19.4-28.7 16.1-6.8 29.78 96-87 64-22 76.21 16.94
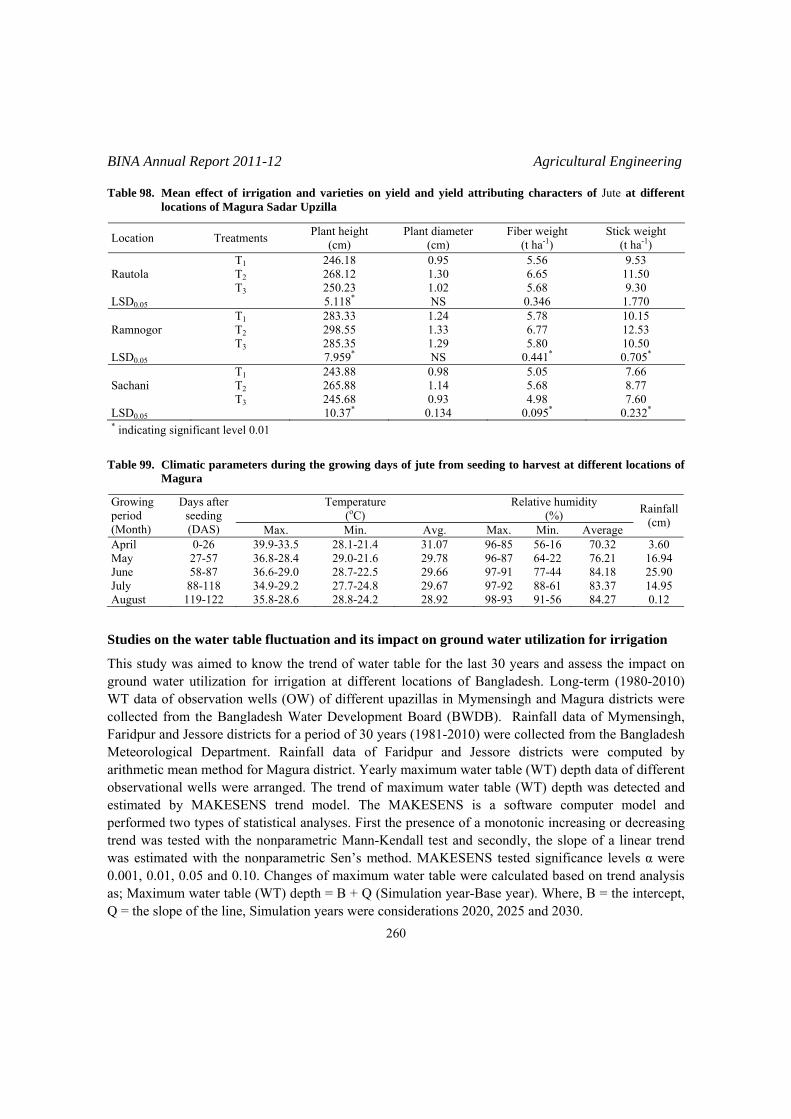
BINA Annual Report 2011-12 Agricultural Engineering
260
Table 98. Mean effect of irrigation and varieties on yield and yield attributing characters of Jute at different locations of Magura Sadar Upzilla
Location Treatments Plant height (cm)
Plant diameter (cm)
Fiber weight (t ha-1)
Stick weight (t ha-1)
T1 246.18 0.95 5.56 9.53 Rautola T2 268.12 1.30 6.65 11.50 T3 250.23 1.02 5.68 9.30 LSD0.05 5.118* NS 0.346 1.770 T1 283.33 1.24 5.78 10.15 Ramnogor T2 298.55 1.33 6.77 12.53 T3 285.35 1.29 5.80 10.50 LSD0.05 7.959* NS 0.441* 0.705*
T1 243.88 0.98 5.05 7.66 Sachani T2 265.88 1.14 5.68 8.77 T3 245.68 0.93 4.98 7.60 LSD0.05 10.37* 0.134 0.095* 0.232*
* indicating significant level 0.01
Table 99. Climatic parameters during the growing days of jute from seeding to harvest at different locations of Magura
Temperature (oC)
Relative humidity (%)
Growing period (Month)
Days after seeding (DAS) Max. Min. Avg. Max. Min. Average
Rainfall(cm)
April 0-26 39.9-33.5 28.1-21.4 31.07 96-85 56-16 70.32 3.60 May 27-57 36.8-28.4 29.0-21.6 29.78 96-87 64-22 76.21 16.94 June 58-87 36.6-29.0 28.7-22.5 29.66 97-91 77-44 84.18 25.90 July 88-118 34.9-29.2 27.7-24.8 29.67 97-92 88-61 83.37 14.95 August 119-122 35.8-28.6 28.8-24.2 28.92 98-93 91-56 84.27 0.12
Studies on the water table fluctuation and its impact on ground water utilization for irrigation
This study was aimed to know the trend of water table for the last 30 years and assess the impact on ground water utilization for irrigation at different locations of Bangladesh. Long-term (1980-2010) WT data of observation wells (OW) of different upazillas in Mymensingh and Magura districts were collected from the Bangladesh Water Development Board (BWDB). Rainfall data of Mymensingh, Faridpur and Jessore districts for a period of 30 years (1981-2010) were collected from the Bangladesh Meteorological Department. Rainfall data of Faridpur and Jessore districts were computed by arithmetic mean method for Magura district. Yearly maximum water table (WT) depth data of different observational wells were arranged. The trend of maximum water table (WT) depth was detected and estimated by MAKESENS trend model. The MAKESENS is a software computer model and performed two types of statistical analyses. First the presence of a monotonic increasing or decreasing trend was tested with the nonparametric Mann-Kendall test and secondly, the slope of a linear trend was estimated with the nonparametric Sen’s method. MAKESENS tested significance levels α were 0.001, 0.01, 0.05 and 0.10. Changes of maximum water table were calculated based on trend analysis as; Maximum water table (WT) depth = B + Q (Simulation year-Base year). Where, B = the intercept, Q = the slope of the line, Simulation years were considerations 2020, 2025 and 2030.

BINA Annual Report 2011-12 Agricultural Engineering
261
Rate of change of maximum water table depth (m/year) and prediction of maximum water table depth (m) for different years in different upazillas of Mymensingh and Magura district are presented in Table 100-101, respectively. From table, it was observed that maximum WT was increased significantly in all the observation wells except two observation wells of Bhaluka and Phulpur upazila in Mymensingh and three observation wells of Magura Sadar upazila. It was evidenced that maximum WT depth change varied from 19.86 m to -0.30 m in Mymensingh and 6.51 to -0.11m in Magura during 1981-2010. Predicted WT depth dropped below the suction lifts in most of the observation wells in different upazilla of Mymensingh and Magura districts. Yearly maximum WT depth (1980-2010) in different upazillas of Mymensingh and Magura districts are presented in Fig. 42-43. Table 100. Rate of change of maximum water table depth (m/year) and prediction of maximum water table
depth (m) for different years in different Upazillas of Mymensingh district
Prediction of maximum water table (WT) depth in different yearName of
Upazilla Observation
well
Rate of change of maximum water table (m year-1)
Maximum WT change from 1980 to 2010
Maximum WT in 2012 2020 2025 2030
GT6152020 0.287*** 8.61 13.13 15.42 16.86 18.29 Mymensingh Sadar GT6152021 0.308*** 9.25 14.63 17.10 18.64 20.18
GT6120005 0.662*** 19.86 23.97 29.26 32.57 35.88 GT6120006 0.225*** 6.75 11.05 12.85 13.98 15.10
Fulbaria GT6120007 0.138*** 4.15 9.97 11.08 11.77 12.46
GT6123011 0.004 0.11 4.00 4.03 4.05 4.07 Gouripur GT6123012 0.061*** 1.83 6.20 6.69 7.00 7.30
GT6124013 0.363*** 10.89 18.00 20.90 22.72 24.53 GT6124014 0.075** 2.24 7.64 8.24 8.61 8.98 Haluaghat GT6124015 0.121*** 3.63 9.25 10.22 10.82 11.43 GT6122008 0.205*** 6.14 10.46 12.09 13.11 14.14 GT6122009 0.020 0.60 7.92 8.08 8.18 8.28 Gaffargaon GT6122010 0.205*** 6.16 10.84 12.48 13.50 14.53
Muktagacha GT6165022 0.108*** 3.25 9.23 10.09 10.63 11.17 GT6113001 0.173*** 5.20 8.77 10.16 11.03 11.89 GT6113002 -0.010 -0.31 7.18 7.09 7.04 6.99 GT6113003 0.134*** 4.01 9.23 10.30 10.96 11.63 Bhaluka
GT6113004 0.062*** 1.85 8.64 9.13 9.44 9.75 GT6131016 0.031*** 0.94 4.41 4.67 4.82 4.98 GT6131017 0.092*** 2.75 6.69 7.42 7.88 8.34 Ishwarganj GT6131018 0.187*** 5.60 9.92 11.42 12.35 13.28 GT6172026 0.364*** 10.91 14.22 17.13 18.95 20.76 GT6172027 0.008 0.24 6.03 6.09 6.13 6.17 GT6172028 0.398*** 11.94 16.78 19.97 21.96 23.95 GT6172029 0.130*** 3.90 8.30 9.34 9.99 10.64
Nandail
GT6172030 0.080* 2.40 6.15 6.79 7.19 7.59 GT6181031 0.058*** 1.73 4.44 4.90 5.18 5.47 GT6181032 0.048+ 1.45 7.27 7.65 7.89 8.13 GT6181033 -0.010 -0.30 4.01 3.93 3.88 3.83 GT6181034 0.045*** 1.35 5.51 5.87 6.10 6.32
Phulpur
GT6181035 0.036*** 1.08 6.11 6.40 6.58 6.76 GT6194036 0.047* 1.43 11.79 12.17 12.41 12.65 GT6194037 0.540*** 16.20 21.52 25.84 28.54 31.24 Trisal GT6194038 0.022 0.65 6.94 7.12 7.22 7.33

BINA Annual Report 2011-12 Agricultural Engineering
262
Table 101. Rate of change of maximum water table depth (m/year) and prediction of maximum water table depth (m) for different years in different Upazillas of Magura district
Prediction of maximum water table (WT) depth in different yearUpazillas of
Magura district Observation
well
Rate of change of maximum water table (m year-1)
Maximum WT change from 1981 to 2010
Maximum WT in 2012 2020 2025 2030
GT5566006 0.067*** 1.93 8.22 8.75 9.09 9.42
GT5566007 0.073*** 2.13 7.68 8.26 8.63 9.00
GT5566502 0.022+ 0.63 7.51 7.69 7.80 7.90 Mohammadpur
GT5566503 0.027** 0.79 7.47 7.68 7.82 7.96
GT5557001 0.068 1.97 8.45 8.99 9.33 9.67
GT5557002 -0.004** -0.11 7.41 7.38 7.36 7.34
GT5557003 0.101 2.93 7.92 8.73 9.24 9.74
GT5557004 0.018*** 0.51 7.69 7.83 7.91 8.00
GT5557005 0.030 0.87 7.69 7.93 8.08 8.23
Sadar GT5557501 0.020** 0.57 6.20 6.35 6.45 6.55
GT5595009 0.063*** 1.84 8.92 9.43 9.75 10.06
GT5595010 0.094** 2.71 7.27 8.02 8.48 8.95
GT5595011 0.069*** 2.01 9.15 9.71 10.06 10.40
GT5595012 0.224*** 6.51 11.15 12.94 14.06 15.18
GT5595013 0.055* 1.60 8.53 8.97 9.24 9.52
GT5595014 0.069** 1.99 8.67 9.22 9.57 9.91
Sreepur GT5595015 0.083*** 2.42 9.21 9.87 10.29 10.71
Shalikha GT5566006 0.067*** 1.93 8.22 8.75 9.09 9.42

BINA Annual Report 2011-12 Agricultural Engineering
263
Year
-16-14-12-10
-8-6-4-2024
1980 1983 1986 1989 1992 1995 1998 2001 2004 2007 2010
Mymensingh Sader
WT
(m)
Rai
nfal
l(m)
Rainfall GT6152020 GT6152021 Suc ttion lif
Year
-24-22-20-18-16-14-12-10
-8-6-4-2024
1980 1983 1986 1989 1992 1995 1998 2001 2004 2007 2010
Fulbaria
WT
(m)
R
ainf
all(m
)
RainfallGT6120005GT6120006GT6120007Suction lift
Year
-12
-10
-8
-6
-4
-2
0
2
4
1980 1983 1986 1989 1992 1995 1998 2001 2004 2007 2010
Gouripur
WT
(m)
R
ainf
all(m
)
Rainfall GT6123011 GT6123012 Suction lift
Year
-20
-18-16
-14
-12-10
-8
-6-4
-2
02
4
1980 1983 1986 1989 1992 1995 1998 2001 2004 2007 2010
Haluaghat
WT
(m)
Rai
nfal
l(m)
Rainfall GT6124013 GT6124014 GT6124015 Suction lift
Year
-14
-12
-10
-8
-6
-4
-2
0
2
4
1980 1983 1986 1989 1992 1995 1998 2001 2004 2007 2010
Gaffargaon
WT
(m)
R
ainf
all(m
)
Rainfall GT6122008 GT6122009GT6122010 Suction lift
Year
-12
-10
-8
-6
-4
-2
0
2
4
1980 1983 1986 1989 1992 1995 1998 2001 2004 2007 2010
Ishwarganj
WT
(m)
R
ainf
all(m
)
Rainfall GT6131016 GT6131017
GT6131018 Suction lift
Year
-20-18-16-14-12-10
-8-6-4-2024
1980 1983 1986 1989 1992 1995 1998 2001 2004 2007 2010
Nandail
WT
(m)
Rai
nfal
l (m
)
Rainfall GT6172026GT6172027 GT6172028
GT6172029 GT6172030Suction lift
Year
-12
-10
-8
-6
-4
-2
0
2
4
1980 1983 1986 1989 1992 1995 1998 2001 2004 2007 2010
Muktagacha
WT
(m)
R
ainf
all(m
)
Rainfall GT6165022 Suction lift
Year
-12
-10
-8
-6
-4
-2
0
2
4
1980 1983 1986 1989 1992 1995 1998 2001 2004 2007 2010
Phulpur
WT
(m)
Rai
nfal
l(m)
Rainfall GT6181031 GT6181033GT6181034 GT6181035 Suction lift
Trishal
-22-20-18-16-14-12-10
-8-6-4-2024
1980 1983 1986 1989 1992 1995 1998 2001 2004 2007 2010Year
WT
(m)
Rai
nfal
l (m
)
Rainfall GT6194036GT6194037 GT6194038Suction lift
Fig. 42. Yearly maximum WT depth (1980-2010) in different Upazilas of Mymensingh district
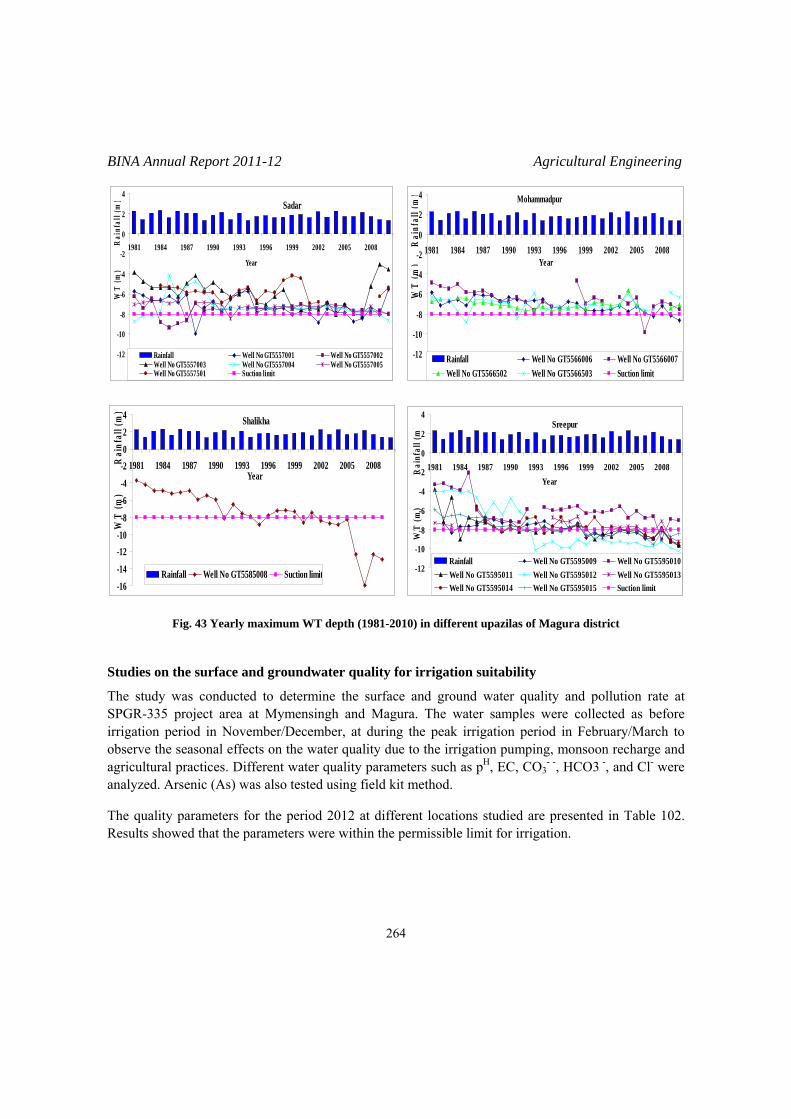
BINA Annual Report 2011-12 Agricultural Engineering
264
Sadar
-12
-10
-8
-6
-4
-2
0
2
4
1981 1984 1987 1990 1993 1996 1999 2002 2005 2008
Year
WT
(m)
R
ainf
all (
m)
Rainfall Well No GT5557001 Well No GT5557002Well No GT5557003 Well No GT5557004 Well No GT5557005Well No GT5557501 Suction limit
Mohammadpur
-12
-10
-8
-6
-4
-2
0
2
4
1981 1984 1987 1990 1993 1996 1999 2002 2005 2008Year
WT
(m)
R
ainf
all (
m)
Rainfall Well No GT5566006 Well No GT5566007Well No GT5566502 Well No GT5566503 Suction limit
Shalikha
-16-14-12-10-8-6-4-2024
1981 1984 1987 1990 1993 1996 1999 2002 2005 2008Year
WT
(m)
R
ainf
all (
m)
Rainfall Well No GT5585008 Suction limit
Sreepur
-12
-10
-8
-6
-4
-2
0
2
4
1981 1984 1987 1990 1993 1996 1999 2002 2005 2008Year
WT
(m)
R
ainf
all (
m)
Rainfall Well No GT5595009 Well No GT5595010Well No GT5595011 Well No GT5595012 Well No GT5595013Well No GT5595014 Well No GT5595015 Suction limit
Fig. 43 Yearly maximum WT depth (1981-2010) in different upazilas of Magura district
Studies on the surface and groundwater quality for irrigation suitability
The study was conducted to determine the surface and ground water quality and pollution rate at SPGR-335 project area at Mymensingh and Magura. The water samples were collected as before irrigation period in November/December, at during the peak irrigation period in February/March to observe the seasonal effects on the water quality due to the irrigation pumping, monsoon recharge and agricultural practices. Different water quality parameters such as pH, EC, CO3
- -, HCO3 -, and Cl- were
analyzed. Arsenic (As) was also tested using field kit method. The quality parameters for the period 2012 at different locations studied are presented in Table 102. Results showed that the parameters were within the permissible limit for irrigation.
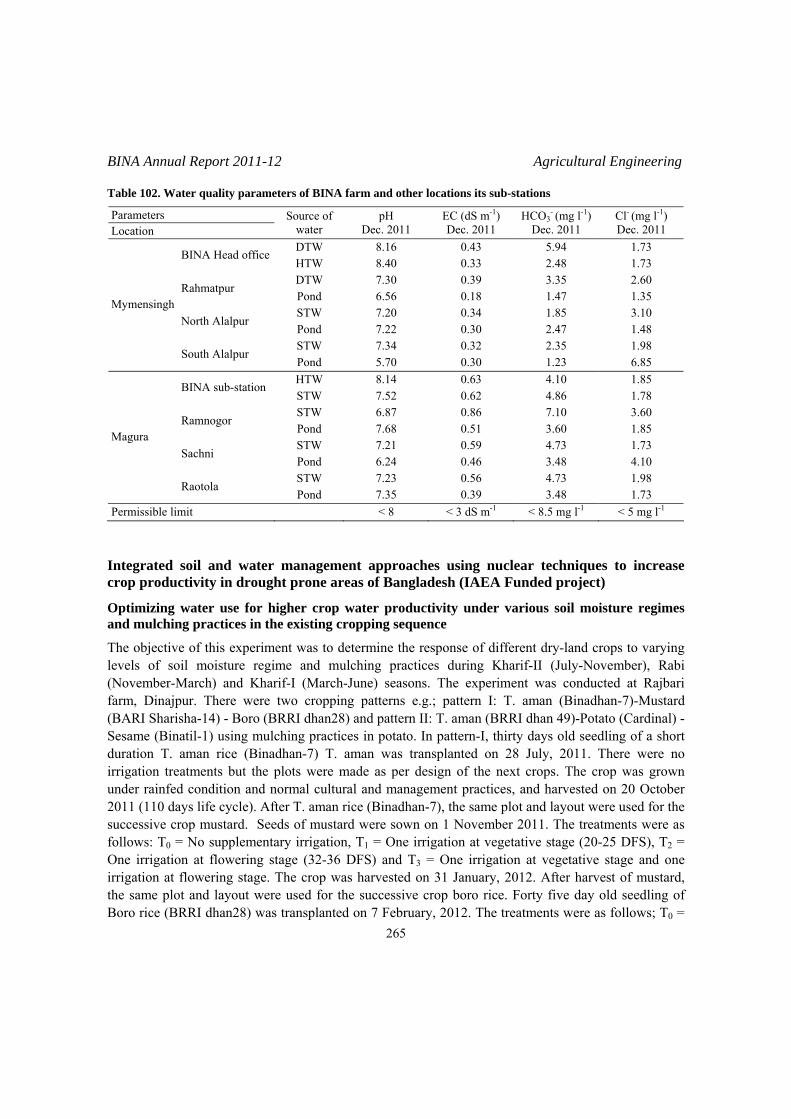
BINA Annual Report 2011-12 Agricultural Engineering
265
Table 102. Water quality parameters of BINA farm and other locations its sub-stations
Parameters Location
Source of water
pH Dec. 2011
EC (dS m-1) Dec. 2011
HCO3- (mg l-1)
Dec. 2011 Cl- (mg l-1)
Dec. 2011
DTW 8.16 0.43 5.94 1.73 BINA Head office
HTW 8.40 0.33 2.48 1.73 DTW 7.30 0.39 3.35 2.60
Rahmatpur Pond 6.56 0.18 1.47 1.35 STW 7.20 0.34 1.85 3.10
North Alalpur Pond 7.22 0.30 2.47 1.48 STW 7.34 0.32 2.35 1.98
Mymensingh
South Alalpur Pond 5.70 0.30 1.23 6.85 HTW 8.14 0.63 4.10 1.85
BINA sub-station STW 7.52 0.62 4.86 1.78 STW 6.87 0.86 7.10 3.60
Ramnogor Pond 7.68 0.51 3.60 1.85 STW 7.21 0.59 4.73 1.73
Sachni Pond 6.24 0.46 3.48 4.10 STW 7.23 0.56 4.73 1.98
Magura
Raotola Pond 7.35 0.39 3.48 1.73
Permissible limit < 8 < 3 dS m-1 < 8.5 mg l-1 < 5 mg l-1
Integrated soil and water management approaches using nuclear techniques to increase crop productivity in drought prone areas of Bangladesh (IAEA Funded project)
Optimizing water use for higher crop water productivity under various soil moisture regimes and mulching practices in the existing cropping sequence
The objective of this experiment was to determine the response of different dry-land crops to varying levels of soil moisture regime and mulching practices during Kharif-II (July-November), Rabi (November-March) and Kharif-I (March-June) seasons. The experiment was conducted at Rajbari farm, Dinajpur. There were two cropping patterns e.g.; pattern I: T. aman (Binadhan-7)-Mustard (BARI Sharisha-14) - Boro (BRRI dhan28) and pattern II: T. aman (BRRI dhan 49)-Potato (Cardinal) - Sesame (Binatil-1) using mulching practices in potato. In pattern-I, thirty days old seedling of a short duration T. aman rice (Binadhan-7) T. aman was transplanted on 28 July, 2011. There were no irrigation treatments but the plots were made as per design of the next crops. The crop was grown under rainfed condition and normal cultural and management practices, and harvested on 20 October 2011 (110 days life cycle). After T. aman rice (Binadhan-7), the same plot and layout were used for the successive crop mustard. Seeds of mustard were sown on 1 November 2011. The treatments were as follows: T0 = No supplementary irrigation, T1 = One irrigation at vegetative stage (20-25 DFS), T2 = One irrigation at flowering stage (32-36 DFS) and T3 = One irrigation at vegetative stage and one irrigation at flowering stage. The crop was harvested on 31 January, 2012. After harvest of mustard, the same plot and layout were used for the successive crop boro rice. Forty five day old seedling of Boro rice (BRRI dhan28) was transplanted on 7 February, 2012. The treatments were as follows; T0 =

BINA Annual Report 2011-12 Agricultural Engineering
266
Normal farmer’s practice (continuous ponding), T1 = AWD (5 cm ponding to saturation), T2 = 3-5 days AWD (5 cm ponding), T3 = 5-7 days AWD (5 cm ponding). The crop was harvested on 14 May 2012. In pattern-II, after T. aman rice (BRRI dhan49), the same plot and layout were used for the successive crop potato. Seeds of potato were transplanted on 22 November 2011. The treatments were as follows: T0 = No supplementary irrigation, T1 = One irrigation at vegetative stage (25-30 DFS), T2 = One irrigation at yield formation stage (50-60 DFS), and T3 = One irrigation at vegetative stage and one irrigation at yield formation stage. The crop was harvested on 24 February, 2012. After harvest of potato, the same plot and layout were used for the successive crop sesame. The treatments for sesame were as follows: T0 = No irrigation (control), T1 = One irrigation at vegetative stage (20-25 DFS), T2 = One irrigation at flowering stage (35-40 DFS), T3 = One irrigation at vegetative stage and one irrigation at flowering stage. Soil moisture was recorded at sowing time, before and after irrigation, and at harvest time of crop using gravimetric method and neutron probe (Troxler) in all Rabi and Kharif-I crops. All the cultural practices were followed as and when necessary. Yield and yield attributes were recorded which were then statistically analyzed. The yield and yield attributing characters of rice in pattern-I is presented in Table 103. It is found that in all plots yield is almost identical and produced a yield of 5.46-5.66 t ha-1 under rainfed condition. Profile soil moisture pattern at different depth of irrigation treatments of mustard (BARI Sharisha-14) crop are shown in Fig. 44. At sowing time, the soil moisture at different depths (0-15, 15-30, 30-45 and 45-60 cm) was high ranging from about 30 to 40% (by volume), and at harvest time it declined to15 to 22 % (by volume). Effect of irrigation practices on the yield and yield attributing characters of mustard is presented in Table 104. Irrigation showed significant effect on number of seed/pod and straw yield. The highest seed yield (1.99 t ha-1) was obtained in irrigation treatment T2. Amount of irrigation water requirement and water productivity of mustard are shown in Table 105. From table, it is observed that irrigation water productivity is highest in T2 treatment (irrigation at flowering stage). The effect of different AWD irrigation treatments on the yield and yield contributing characters of boro rice is shown in Table 106. The AWD method showed significant effect on plant height. The highest yield of 7.34 t ha-1 was obtained in continuous ponding plots (T0). It is observed that after transplanting, about 32 cm water was applied for crop establishment (Table 107). Almost in every alternate 3 days, irrigation was applied in the continuous ponding plots (T0), and 4, 7 and 11 days after irrigation, irrigations were applied in treatments T1, T2 and T3, respectively. Accordingly, water requirement was the highest 85.00 cm in T0 and lowest (57.00 cm) in T3. It also elucidated that 5 to 7 days AWD irrigation method saved about 37 to 49% irrigation water compared to continuous ponding and saturation irrigation method, producing insignificant yield differences. In cropping Pattern-II, yield and yield attributing characters of rice (BRRI dhan49) are presented in Table 108. It is found that in the entire plots yield are almost identical (4.55-4.91 t ha-1) under rainfed condition. Profile soil moisture distribution at sowing time to harvest time of potato at various depths of soil is shown in Fig. 45. At sowing time, soil moisture was high (about 30 to 40% by vol.). Periodical moisture in control plots showed a very gradual decreasing trend during its growing period. Yield and yield attributing characters of potato is presented in Table 109. The highest yield of 30.29 t ha-1 was obtained in treatment T3. Amount of irrigation water requirement and water productivity of

BINA Annual Report 2011-12 Agricultural Engineering
267
potato is shown in Table 110. From table, it is observed that irrigation water productivity is highest in T0 treatment (control). Yield and yield attributing characters of sesame are presented in Table 111. Irrigation did not show any effect on the yield and its parameters. The highest yield of 1134.58 kg ha-1 was obtained in treatment T2. Amount of irrigation water requirement and water productivity of sesame are shown in Table 112 From table, it is observed that irrigation water productivity is highest in T2 treatment. Table 103. Yield and yield attributing characters of T. aman rice (Binadhan-7) at Wheat Research Research
sub-station, Rajbari farm, Dinajpur district under rainfed condition
Treatments Plant height (cm)
Tiller hill-1
(no.) Panicle length
(cm) 1000 seed wt.
(g) Grain yield
(t ha-1) Straw yield
(t ha-1) T0
T1
T2
T3
99.17 97.60 95.40 98.20
13.50 12.30 12.20 12.30
24.66 24.34 23.68 24.58
26.16 25.58 26.10 26.25
5.56 5.46 5.66 5.59
4.06 4.33 3.93 4.25
LSD(0.05) NS NS NS NS NS NS
Table 104. Yield and yield attributing characters of mustard (BARI Sharisha-14) at Wheat Research Sub-station, Rajbari farm, Dinajpur district
Treatments Plant height (cm)
Branch Plant (no.)
Pod plant-1
(no.)
Pod length (cm)
Seed pod-1
(no.)
1000 seed wt.
(g)
Grain yield
(t ha-1)
Straw yield
(t ha-1) T0
T1
T2
T3
82.60 97.73 86.33 98.47
5.733 7.933 6.933 7.53
59.53 84.33 84.13 86.00
3.51 4.08 4.80 4.67
23.93 33.40 29.07 32.27
3.92 3.85 3.87 3.67
1.52 1.62 1.99 1.67
1.53 1.61 1.91 1.75
LSD(0.05) NS NS NS NS 5.72 NS NS 0.25
Table 105. Water requirement and irrigation water productivity of mustard (BARI Sharisha-14) at Wheat ResearchResearch Sub-station, Rajbari farm, Dinajpur
Treatments Irrigation water, IR
(cm)
Effective rainfall, Re
(cm)
Seasonal soil moisture
depletion, ΔS (cm)
Water requirement, IR + Re +ΔS
(cm)
Yield (t ha-1)
Irrigation water productivity (kg ha-1cm-1)
T0
T1
T2
T3
0 3 3 6
0 0 0 0
9.18 11.81 7.78 10.91
9.18 14.81 10.78 16.91
1520 1620 1990 1670
165.57 109.38 184.60 98.76

BINA Annual Report 2011-12 Agricultural Engineering
268
Treatment (T0)
0
10
2 0
3 0
4 0
5 0
Sow
ing
time BI
1
AI1
BI2
AI2
Har
vest
time
Days from sowing
Vol
umet
ric
soil
wat
er
cont
ent (
%)
15304560
Treatment (T1)
0
10
2 0
3 0
4 0
5 0
Days from sowing
Vol
umet
ric
soil
wat
er
cont
ent (
%)
15304560
Treatment (T2)
0
10
2 0
3 0
4 0
5 0
Sow
ing
time BI
1
AI1
BI2
AI2
Har
vest
time
Days from sowing
Vol
umet
ric
soil
wat
er
cont
ent (
%)
15304560
Treatment (T3)
0
10
2 0
3 0
4 0
5 0
Sow
ing
time BI
1
AI1
BI2
AI2
Har
vest
time
Days from sowing
Vol
umet
ric
soil
wat
er
cont
ent (
%)
15304560
* BI1= Before 1st irrigation, AI1= After 1st irrigation, BI2= Before 2nd irrigation and AI2= After 2nd irrigation Fig. 44. Volumetric soil water content (%) at various stages from sowing to harvest of mustard at Wheat
Research Research Sub-station, Rajbari farm, Dinajpur Table 106. Effect of AWD methods on the yield and yield attributing characters of boro rice at Wheat Research
Research Sub-station, Rajbari farm, Dinajpur district
Treatments Plant height (cm)
Tiller hill-1
(no.) Panicle length
(cm) 1000 seed wt.
(g) Grain yield
(t ha-1) Straw yield
(t ha-1) T0
T1
T2
T3
11.6.26 109.80 105.63 100.16
13.00 12.67 12.76 11.60
24.76 23.88 23.83 23.65
24.88 24.24 24.33 24.73
7.34 7.29 6.93 6.17
6.49 6.44 5.98 6.24
LSD( 0.05) 5.43 NS NS NS NS NS
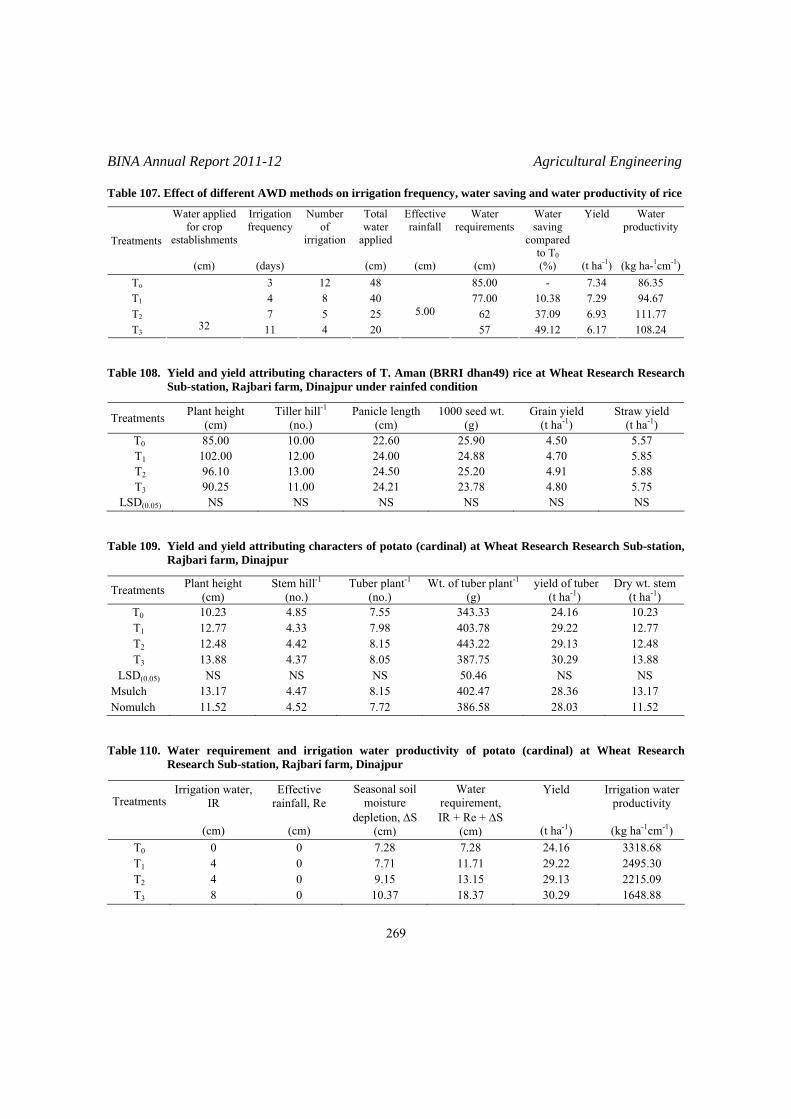
BINA Annual Report 2011-12 Agricultural Engineering
269
Table 107. Effect of different AWD methods on irrigation frequency, water saving and water productivity of rice
Treatments
Water applied for crop
establishments
(cm)
Irrigation frequency
(days)
Number of
irrigation
Total water
applied
(cm)
Effective rainfall
(cm)
Water requirements
(cm)
Water saving
compared to T0 (%)
Yield
(t ha-1)
Water productivity
(kg ha-1cm-1)To 3 12 48 85.00 - 7.34 86.35 T1 4 8 40 77.00 10.38 7.29 94.67 T2 7 5 25 62 37.09 6.93 111.77 T3
32 11 4 20
5.00 57 49.12 6.17 108.24
Table 108. Yield and yield attributing characters of T. Aman (BRRI dhan49) rice at Wheat Research Research Sub-station, Rajbari farm, Dinajpur under rainfed condition
Treatments Plant height (cm)
Tiller hill-1
(no.) Panicle length
(cm) 1000 seed wt.
(g) Grain yield
(t ha-1) Straw yield
(t ha-1) T0
T1
T2
T3
85.00 102.00 96.10 90.25
10.00 12.00 13.00 11.00
22.60 24.00 24.50 24.21
25.90 24.88 25.20 23.78
4.50 4.70 4.91 4.80
5.57 5.85 5.88 5.75
LSD(0.05) NS NS NS NS NS NS
Table 109. Yield and yield attributing characters of potato (cardinal) at Wheat Research Research Sub-station,
Rajbari farm, Dinajpur
Treatments Plant height (cm)
Stem hill-1
(no.) Tuber plant-1
(no.) Wt. of tuber plant-1
(g) yield of tuber
(t ha-1) Dry wt. stem
(t ha-1) T0
T1
T2
T3
10.23 12.77 12.48 13.88
4.85 4.33 4.42 4.37
7.55 7.98 8.15 8.05
343.33 403.78 443.22 387.75
24.16 29.22 29.13 30.29
10.23 12.77 12.48 13.88
LSD(0.05) NS NS NS 50.46 NS NS Msulch
Nomulch
13.17 11.52
4.47 4.52
8.15 7.72
402.47 386.58
28.36 28.03
13.17 11.52
Table 110. Water requirement and irrigation water productivity of potato (cardinal) at Wheat Research
Research Sub-station, Rajbari farm, Dinajpur
Treatments
Irrigation water, IR
(cm)
Effective rainfall, Re
(cm)
Seasonal soil moisture
depletion, ΔS (cm)
Water requirement, IR + Re + ΔS
(cm)
Yield
(t ha-1)
Irrigation water productivity
(kg ha-1cm-1)
T0
T1
T2
T3
0 4 4 8
0 0 0 0
7.28 7.71 9.15 10.37
7.28 11.71 13.15 18.37
24.16 29.22 29.13 30.29
3318.68 2495.30 2215.09 1648.88

BINA Annual Report 2011-12 Agricultural Engineering
270
Treatment (T0)
0
10
2 0
3 0
4 0
5 0
Sow
ing
time AI1
AI2
Days from sowing
Vol
umet
ric
soil
wat
er
cont
ent (
%)
15
30
45
60
Tr e a t me nt ( T2 )
0
10
2 0
3 0
4 0
5 0
Sow
ing
time AI1
AI2
Days from sowing
Vol
umet
ric
soil
wat
er
cont
ent (
%)
15
30
45
60
Tr e a t me nt ( T3 0
0
10
2 0
3 0
4 0
5 0
Sow
ing
time AI1
AI2
Days from sowing
Vol
umet
ric
soil
wat
er
cont
ent (
%)
15
30
45
60
Tr e a t me nt ( T1)
0
10
2 0
3 0
4 0
5 0
Sow
ing
time AI1
AI2
Days from sowing
Vol
umet
ric
soil
wat
er
cont
ent (
%)
15
30
45
60
*BI1 = Before 1st irrigation, AI1 = After 1st irrigation, BI2 = Before 2nd irrigation and AI2 = After 2nd irrigation
Fig. 45. Volumetric soil water content (%) at various stages from sowing to harvest of potato at Wheat Research Sub-station, Rajbari, Dinajpur
Table 111. Yield and yield attributing characters of sesame at Wheat Research Sub-station, Rajbari farm, Dinajpur under rainfed condition
Treatments Plant Height (cm)
Branch plant-1
(no.) Pod length
(cm) Pod plant-1
(no.) Seed pod-1
(no.) Grain yield
(kg ha-1) T0 T1 T2 T3
157.83 160.50 153.13 146.63
1.10 0.77 1.47 1.43
4.30 4.76 4.51 4.38
77.00 60.43 73.83 64.93
83.50 73.30 78.07 72.73
971.25 1123.58 1134.58 939.17
LSD(0.05) NS NS NS NS NS NS
Table 112. Water requirement and irrigation water productivity of sesame (Binatil-1) at Wheat Research Sub-station, Rajbari farm, Dinajpur
Treatments
Irrigation water, IR
(cm)
Effective rainfall, Re
(cm)
Seasonal soil moisture
depletion, ΔS (cm)
Water requirement, IR + Re + ΔS
(cm)
Yield
(t ha-1)
Irrigation water productivity (kg ha-1cm-1)
T0 T1 T2T3
0 3.0 0
3.0
13.0 13.0 13.0 13.0
8.91 3.12 9.58 2.14
24.91 22.12 25.58 21.14
971.25 1123.58 1134.58 939.17
38.99 50.79 44.35 44.42
* includes 3cm post sowing irrigation

BINA Annual Report 2011-12 Agricultural Engineering
271
Studies on the water and nitrogen use efficiency for sustaining productivity of different dry land crops under varying soil moisture regimes using 15N tracer technique
The objective of this experiment was to know the effect of different N levels on the growth, yield and N uptake in a given cropping pattern during Kharif-II (July-November), Rabi (November-March) and Kharif-I (March-June) season. The experiment was conducted at Rajbari farm, Dinajpur district. A single cropping pattern e.g.; T. aman (BRRI dhan49)–Wheat (BARI Gom-26)-Mungbean (Binamoog- 8). Thirty day old seedling of (BRRI dhan49) T. aman rice was transplanted on 28 July, 2011. There were no irrigation treatments but the plots were made as per design of the next crops. The crop was grown under rainfed condition and normal cultural and management practices and harvested on 17 November 2011 (138 days life cycle). After T. aman rice (BRRI dhan49), the same plot and layout were used for the successive crop wheat. Seeds of wheat (BARI Gom-26) were sown on 14 December 2011. The main plot treatments were as follows: T0 = No irrigation (control), T1 = Irrigation at CRI stage (20-25 DFS) up to field capacity ,T2 = Irrigation at CRI and maximum tillering stages (40-45 DFS) up to field capacity, T3 = Irrigation at CRI, maximum tillering, and booting and heading stages (60-65 DFS) up to field capacity and the sub plot treatment were as follows; N0 = No Nitrogen (control), N1 = 50 kg N ha-1, N2 = 100 kg N ha-1 and N3 = 150 kg N ha-1. The crop was harvested on 4 April, 2012. After harvest of wheat, the same plot and layout were used for the successive crop mungbean. The treatments were as follows: T0 = No supplementary irrigation, T1 = One irrigation at vegetative stage (15-20 DFS), T2 = One irrigation at flowering stage (32-38 DFS), T3 = One irrigation at vegetative stage and one irrigation at flowering stage. Seeds of mungbean (Binamoog-8) were sown on 7 April 2012. The treatments were followed are as follows: T0 = No supplementary irrigation, T1 = One irrigation at vegetative stage (25-30 DFS), T2 = One irrigation at yield formation stage (50-60 DFS) and T3 = One irrigation at vegetative stage and one irrigation at yield formation stage. For all the Rabi and Kharif-–I crops, soil moisture was recorded at sowing time, before and after irrigation, and at harvest time of crop using gravimetric method and neutron probe (Troxler). All the cultural practices were followed as and when necessary. Yield and yield attributes were recorded which were then statistically analyzed. The 15N isotope could not be applied as it was not received from IAEA. It is found that the rice variety BRRI dhan49 produced almost identical yield of 4.85 to 5.41 t ha-1 under rainfed condition (Table 113.) Profile soil moisture at sowing and its depletion pattern at different depths of wheat are shown in Fig. 46. At sowing time, the soil moisture at different depths (0-15, 15-30, 30-45 and 45-60 cm) was high, ranging from about 30 to 39% (by volume). Effects of irrigation and fertilizer practices on the yield and yield attributing characters of wheat are shown in Table 114. Irrigation showed significant effect on plant height and spike length. Amount of irrigation water requirement and water productivity of wheat are shown in Table 115. Irrigation water productivity was highest in T0 treatment (control). Effects of irrigation and fertilizer practices on the yield and yield attributing characters of mungbean are shown in Table 116. Irrigation showed significant effect on plant height, pod length, number of seed pod-1 and 1000 seed weight. The highest yield (1698.45 kg ha-1) was obtained in treatment T3. Amount of irrigation water requirement and water productivity of wheat are shown in Table 117. It is observed that irrigation water productivity is highest in T3 treatment.

BINA Annual Report 2011-12 Agricultural Engineering
272
Table 113. Yield and yield attributing characters of T. aman (BRRI dhan49) rice at Wheat Research Sub-station, Rajbari, Dinajpur under rainfed condition
Treatments Plant height (cm)
Tiller hill-1
(no.) Panicle length
(cm) 1000 seed wt.
(g) Grain yield
(t ha-1) Straw yield
(t ha-1) T0
T1
T2
T3
92.60 103.00 95.00 97.10
10.10 17.17 12.20 11.20
24.10 24.60 23.40 24.20
26.20 25.90 24.85 24.95
5.41 5.27 4.85 5.10
5.75 6.00 5.30 5.82
LSD(0.05) NS NS NS NS NS NS Table 114. Yield and yield attributing characters of Wheat (BARI Gom-26) at Wheat Research Sub-station,
Rajbari, Dinajpur
Treatments Plant height (cm)
Spike length (cm)
Seed yield (t ha-1)
Straw yield (t ha-1)
T0 88.70 8.67 3.70 5.49 T1 92.87 8.93 4.06 5.72 T2 93.28 9.17 4.04 5.86 T3 94.02 8.84 4.03 5.62
LSD(0.05) 3.96 0.26 NS NS N0 83.10 7.50 2.58 4.30 N1 92.51 9.02 3.81 5.48 N2 96.86 9.22 4.70 6.33 N3 96.86 9.86 4.75 6.58
LSD(0.05) 2.32 0.44 0.24 0.51 Table 115. Water requirement and irrigation water productivity of Wheat (BARI gom26) at Wheat Research
Sub-station, Rajbari farm, Dinajpur
Treatments
Irrigation water, IR
(cm)
Effective rainfall, Re
(cm)
Seasonal soil moisture
depletion, ΔS (cm)
Water requirement, IR + Re + ΔS
(cm)
Yield
(kg ha-1)
Irrigation water productivity
(kg ha-1cm-1)
T0
T1
T2
T3
0 3 6 9
0 0 0 0
15.51 14.67 14.94 15.44
15.51 17.67 18.94 24.44
3700 4060 4040 4030
238.55 229.77 213.30 164.89
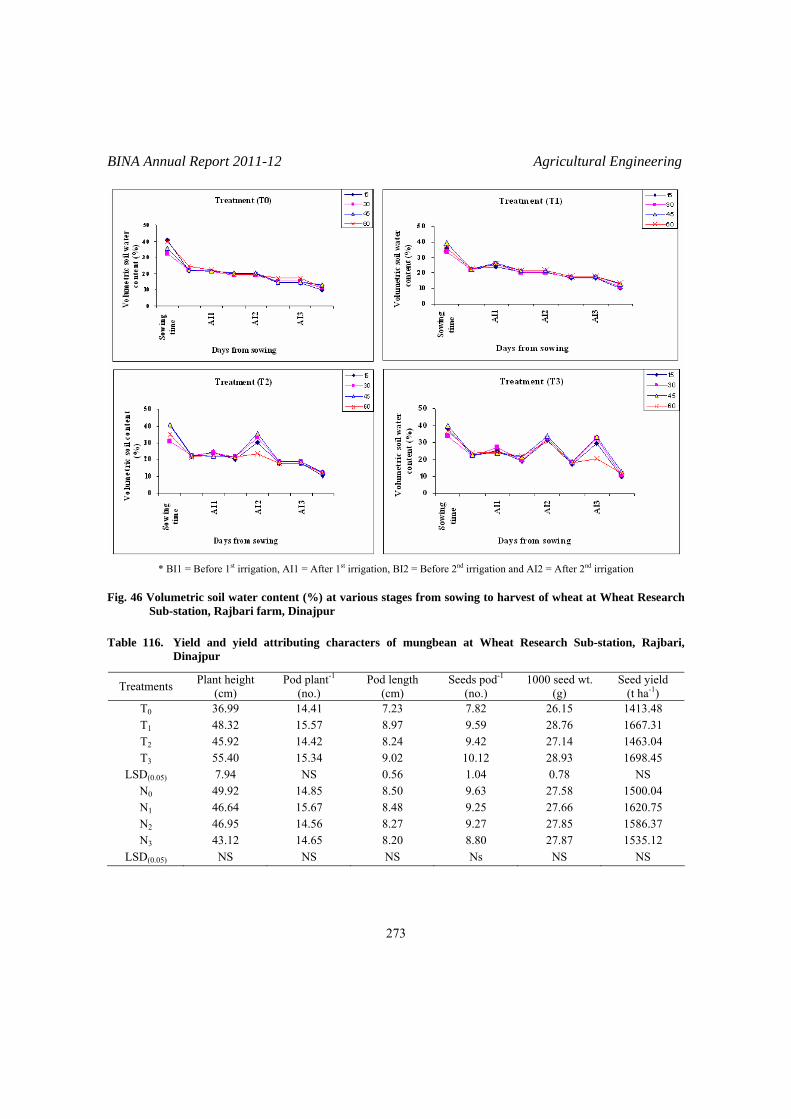
BINA Annual Report 2011-12 Agricultural Engineering
273
* BI1 = Before 1st irrigation, AI1 = After 1st irrigation, BI2 = Before 2nd irrigation and AI2 = After 2nd irrigation Fig. 46 Volumetric soil water content (%) at various stages from sowing to harvest of wheat at Wheat Research
Sub-station, Rajbari farm, Dinajpur
Table 116. Yield and yield attributing characters of mungbean at Wheat Research Sub-station, Rajbari, Dinajpur
Treatments Plant height (cm)
Pod plant-1
(no.) Pod length
(cm) Seeds pod-1
(no.) 1000 seed wt.
(g) Seed yield
(t ha-1) T0 36.99 14.41 7.23 7.82 26.15 1413.48 T1 48.32 15.57 8.97 9.59 28.76 1667.31 T2 45.92 14.42 8.24 9.42 27.14 1463.04 T3 55.40 15.34 9.02 10.12 28.93 1698.45
LSD(0.05) 7.94 NS 0.56 1.04 0.78 NS N0 49.92 14.85 8.50 9.63 27.58 1500.04 N1 46.64 15.67 8.48 9.25 27.66 1620.75 N2 46.95 14.56 8.27 9.27 27.85 1586.37 N3 43.12 14.65 8.20 8.80 27.87 1535.12
LSD(0.05) NS NS NS Ns NS NS

BINA Annual Report 2011-12 Agricultural Engineering
274
Table 117. Water requirement and irrigation water productivity of Mungbean (Binamoog-8) at Wheat Research Sub-station, Rajbari farm, Dinajpur
Treatments
Irrigation water, IR
(cm)
Effective rainfall, Re
(cm)
Seasonal soil moisture
depletion, ΔS (cm)
Water requirement,
IR + Re+ ΔS+*(cm)
Yield
(t ha-1)
Irrigation water productivity
(kg ha-1cm-1)
T0
T1
T2
T3
0 3.0 0
3.0
13.0 13.0 13.0 13.0
9.80 1.25 9.98 1.23
25.8 20.25 25.98 17.23
1413.48 1667.31 1463.04 1698.45
54.78 82.33 56.31 98.57
*Includes 3.0 cm post sowing irrigation Rain water harvesting in ponds and its feasibility assessment for irrigation to non rice upland crops
The objective of this experiment was to determine the rain-water volume that could be stored and used for irrigation of non-rice low water-demanding upland crops during Kharif-I (July-November), Rabi (November-March) and Kharif-I (March-June) season. The experiment was conducted at farmer’s field near Rajbari farm, Dinajpur district. A single cropping pattern e.g.; pattern I; T. aman (Binadhan-7)–Mustard (BARI Sarisha-14)–Mungbean (Binamoog-8) was followed. Thirty day old seedling of (Binadhan-7) T. aman rice was transplanted on 20 July, 2011. There was no irrigation treatment but the plots were made as per design of the next crops. The crop was grown under rainfed condition and normal cultural and management practices, and harvested on 21 October 2011 (110 days life cycle). After T. aman rice (Binadhan-7), the same plot and layout were used for the successive crop mustard. Seeds of mustard (BARI Sharisha-14) were sown in plots on 14 November 2011. The treatments were as follows: T0 = No supplementary irrigation, T1 = One irrigation at vegetative stage (20-25 DFS), T2 = One irrigation at flowering stage (32-36 DFS) and T3 = One irrigation at vegetative stage and one irrigation at flowering stage. The crop was harvested on 31 January, 2012. After harvest of mustard, the same plot and layout were used for the successive crop mungbean. Seeds of mungbean (Binamoog-8) were sown in plots on 20 March 2012. The treatments were as follows: T0 = No supplementary irrigation T1 = One irrigation at vegetative stage (25-30 DFS), T2 = One irrigation at pod formation stage (50-60 DFS) and T3 = One irrigation at vegetative stage and one irrigation at pod formation stage. For all the robi and Kharif-I crops, soil moisture was recorded at sowing time, before and after irrigation, and at harvest time of crop using gravimetric method and neutron probe (Troxler). All the cultural practices were followed as and when necessary. Yield and yield attributes were recorded which were then statistically analyzed. It is found that Binadhan-7 produced almost identical yield of 4.00 to 4.5 t ha-1 under rainfed condition (Table 118.) Profile soil moisture at sowing and its depletion pattern at different depths of mustard are shown in Fig. 47. Soil moisture at different depths (0-15, 15-30, 30-45 and 45-60 cm) was high ranging from about 30 to 38% (by volume). Effect of irrigation on the yield and yield attributing characters of mustard are shown in Table 119. Irrigation did not show any effect on the yield and its parameters except straw yield. The highest seed yield of 2.51 t ha-1 was obtained under the soil

BINA Annual Report 2011-12 Agricultural Engineering
275
moisture regime T3. Amount of irrigation water requirement and water productivity of mustard are shown in Table 120. It is observed that irrigation water productivity is highest in T0 treatment (control). Effect of irrigation on the yield and yield attributing characters of mungbean are shown in Table 122. Irrigation showed significant effect only on the seed yield. The highest seed yield of 1308.33 kg ha-1 was obtained under the soil moisture regime T3. Amount of irrigation water requirement and water productivity of mungbean are shown in Table 123. From table, it is observed that irrigation water productivity is highest in T3 treatment. Table 118. Yield and yield attributing characters of T. aman (Binadhan-7) rice at Vatpara, Dinajpur under
rainfed condition
Treatments Plant height (cm)
Tiller hill-1
(no.) Panicle length
(cm) 1000 seed wt.
(g) Grain yield
(t ha-1) Straw yield
(t ha-1) T0
T1
T2
T3
90.20 89.90 91.60 92.30
10.50 9.40
10.00 11.00
22.85 21.73 23.08 23.40
25.20 24.80 25.10 25.40
4.50 4.00 4.33 4.38
4.66 4.33 4.03 4.38
LSD(0.05) NS NS NS NS NS NS Table 119. Yield and yield attributing characters of Mustard (BARI Sharisha-14) at Vatpara, Dinajpur
Treatments Plant height (cm)
Branch plant-1
(no.)
Pod plant-1 (no.)
Pod length (cm)
Seed pod-1
(no.)
1000 seed wt.
(g)
Grain yield
(t ha-1)
Straw yield
(t ha-1) T0
T1
T2
T3
88.40 96.00 90.47 91.13
7.00 7.20 6.47 7.47
63.00 52.13 51.67 61.73
4.30 3.97 4.43 4.23
36.27 35.00 32.93 33.27
3.67 3.90 3.88 3.95
2.20 2.31 2.34 2.51
3.25 4.06 3.63 3.54
LSD(0.05) NS NS NS NS NS NS NS 0.25 Table 120. Water requirement and irrigation water productivity of Mustard (BARI sharisha14) at Vatpara,
Dinajpur
Treatments
Irrigation water, IR
(cm)
Effective rainfall, Re
(cm)
Seasonal soil moisture
depletion, ΔS (cm)
Water requirement, IR + Re + ΔS
(cm)
Yield
(kg ha-1)
Irrigation water productivity (kg ha-1cm-1)
T0
T1
T2
T3
0 3 3 6
0 0 0 0
10.75 11.00 11.83 9.28
10.75 14.00 14.83 15.28
2200 2310 2340 2510
204.65 165.00 157.78 164.26
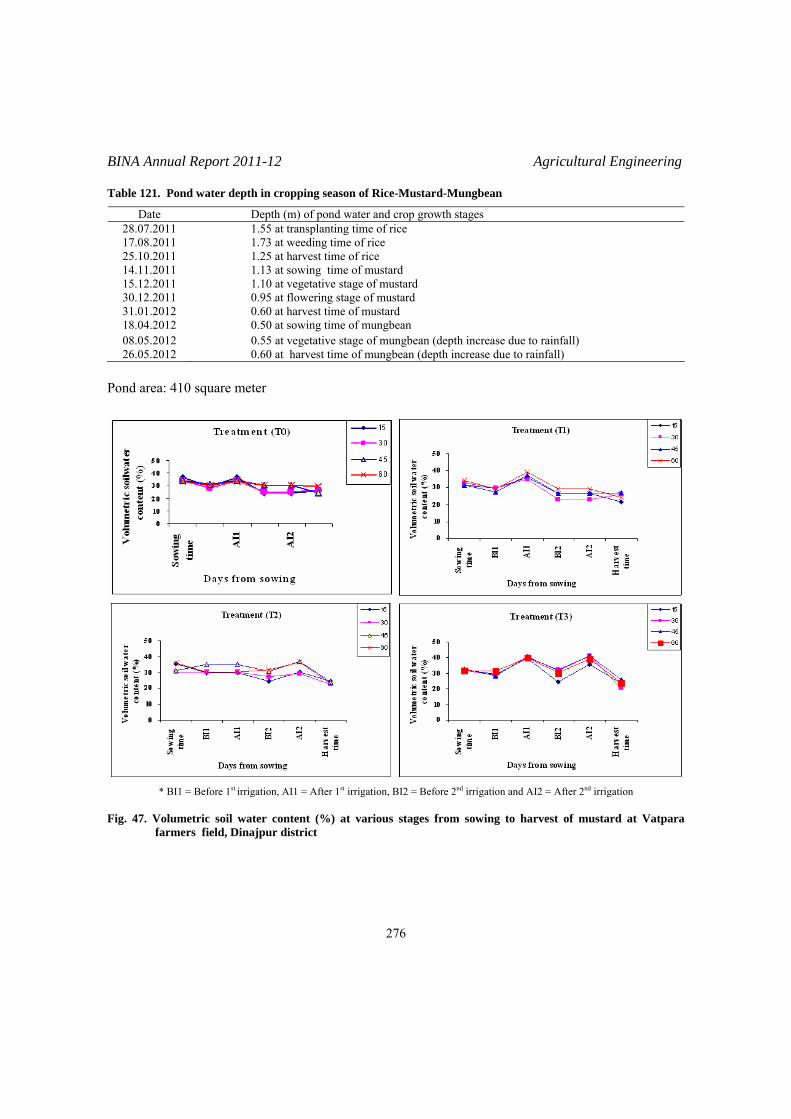
BINA Annual Report 2011-12 Agricultural Engineering
276
Table 121. Pond water depth in cropping season of Rice-Mustard-Mungbean
Date Depth (m) of pond water and crop growth stages 28.07.2011 1.55 at transplanting time of rice 17.08.2011 1.73 at weeding time of rice 25.10.2011 1.25 at harvest time of rice 14.11.2011 1.13 at sowing time of mustard 15.12.2011 1.10 at vegetative stage of mustard 30.12.2011 0.95 at flowering stage of mustard 31.01.2012 0.60 at harvest time of mustard 18.04.2012 0.50 at sowing time of mungbean 08.05.2012 0.55 at vegetative stage of mungbean (depth increase due to rainfall) 26.05.2012 0.60 at harvest time of mungbean (depth increase due to rainfall)
Pond area: 410 square meter
* BI1 = Before 1st irrigation, AI1 = After 1st irrigation, BI2 = Before 2nd irrigation and AI2 = After 2nd irrigation Fig. 47. Volumetric soil water content (%) at various stages from sowing to harvest of mustard at Vatpara
farmers field, Dinajpur district
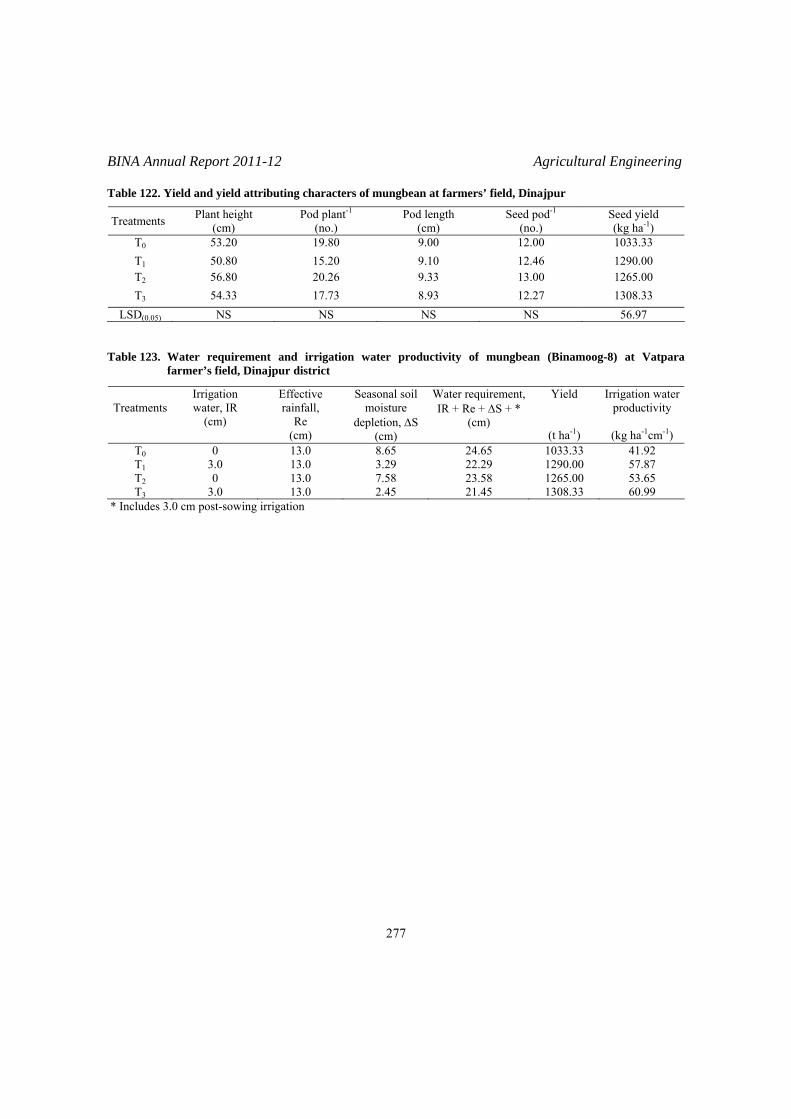
BINA Annual Report 2011-12 Agricultural Engineering
277
Table 122. Yield and yield attributing characters of mungbean at farmers’ field, Dinajpur
Treatments Plant height (cm)
Pod plant-1
(no.) Pod length
(cm) Seed pod-1
(no.) Seed yield (kg ha-1)
T0 53.20 19.80 9.00 12.00 1033.33 T1 50.80 15.20 9.10 12.46 1290.00 T2 56.80 20.26 9.33 13.00 1265.00 T3 54.33 17.73 8.93 12.27 1308.33
LSD(0.05) NS NS NS NS 56.97
Table 123. Water requirement and irrigation water productivity of mungbean (Binamoog-8) at Vatpara farmer’s field, Dinajpur district
Treatments Irrigation water, IR
(cm)
Effective rainfall,
Re (cm)
Seasonal soil moisture
depletion, ΔS (cm)
Water requirement,IR + Re + ΔS + *
(cm)
Yield
(t ha-1)
Irrigation water productivity
(kg ha-1cm-1)
T0 T1 T2T3
0 3.0 0
3.0
13.0 13.0 13.0 13.0
8.65 3.29 7.58 2.45
24.65 22.29 23.58 21.45
1033.33 1290.00 1265.00 1308.33
41.92 57.87 53.65 60.99
* Includes 3.0 cm post-sowing irrigation

BINA Annual Report 2011-12 Agricultural Engineering
278

AGRONOMY DIVISION

BINA Annual Report 2011-12 Agronomy
280

BINA Annual Report 2011-12 Agronomy
RESEARCH HIGHLIGHTS In boro season, aromatic fine grain rice varieties (Kalozira and Binadhan-9) produced highest grain yield in August 01 transplanting. The data recorded on crop duration from seed to seed revealed that Binadhan-9 required the least average of 119 days and Kalozira required 149 days. Delayed transplanting of both the varieties shortened the crop duration. Three rice lines/variety were evaluated under four dates of transplanting starting from Dec. 31 with an interval of 15 days at saline area of Kaligonj, Shamnagar Upazila of Satkhira during boro season of 2011-12. The salt tolerant line PBRC-37 produced the maximum grain yield (4.03 t ha-1) when transplanted on Feb. 15. Two drought tolerant exotic rice varieties (Nerica-1 and Nerica-10) were evaluated compared to one check variety in dibbling method at the farmers’ field of Godagari, Rajshahi district during Boro season, 2011-12. The results showed that highest grain yield (4.11 t ha-1) was obtained from the variety Nerica-10 when transplanted with 15 cm × 15 cm spacing. Three tomato mutants (TM-131, TM-134 and TM-219) with a check variety were assessed under three dates of transplanting started from Nov. 10 with an interval of ten days at the BINA sub-station, Magura during rabi season, 2011-2012. The mutant line-219 produced higher fruit yield in both Nov. 20 (116.19 t ha-1) and Nov. 30 (107.06 t ha-1). In a soybean experiment with different spacings showed that the seed yield of the line, BAU-S/70 with row spacing of 20 cm was the highest (2.94 t ha-1) followed by Binasoybean-1 (2.78 t ha-1) with the same spacing. Sesame trial with different row spacings showed that Binatil-1 and Binatil-2 produced the higher seed yield with 15 cm and 20 cm row spacing at Ishurdi and Magura. It meant that row spacings can be used for these varieties from 15 cm to 20 cm for maximizing seed yield. In herbicide trail in boro season, the highest grain yield was obtained (5.50 t ha-1 and 5.44 t ha-1) from two hands weeding at 30 and 50 DAT by Binadhan-5 and BRRI dhan29. The herbicide pre-chlor 500 EC with one hand weeding at 50 DAT produced also similar grain yield (5.42 t ha-1 and 5.27 t ha-1).
281

BINA Annual Report 2011-12 Agronomy
Effect of date of transplanting on the yield performance of aromatic long slender fine grain advanced mutants of rice in T. aman season
Two fine rice varieties were evaluated under three different dates of transplanting starting from August 01, 2011 with an interval of 10 days at the experimental farm of Bangladesh Institute of Nuclear Agriculture, Mymensingh during aman season of 2011-12. The objective was to determine the yield performances of the varieties affected by different dates of transplanting. The three different dates of transplanting were Aug. 01 (D1), Aug. 10 (D2), and Aug. 20 (D3). The advanced fine rice varieties were Kalozira (V1) and Binadhan-9 (V2). The experiment was laid out as factorial randomized complete block design with three replications. The unit plot size was 4 m × 3 m. Thirty days-old seedlings were transplanted @ 2-3 seedlings hill-1 with a planting spacing of 20 cm x 15 cm. The plots were fertilized with 105, 15, 60, 15 and1.5 kg ha-1 of N, P, K, S, Zn as urea, TSP, MOP, gypsum and zinc sulfate, respectively. All fertilizers except urea were applied at final land preparation in full doses. Urea was applied in three equal splits- at 7, 30 DAT and at before panicle initiation stage. The crop was harvested at different dates at maturity and data on yield and yield components were recorded at harvest and were statistically analyzed following the design used for the experiment and the means were compared with LSD. The results revealed that mean grain yield of Aug. 01 transplanting was the highest (2.88 t ha-1) and that of Aug. 10 was the second highest (2.29 t ha-1, Table 1). The mean grain yield of Binadhan-9 irrespective of transplanting dates was 2.25 t ha-1 which did not differ statistically from Kalozira (2.26 t ha-1). The interaction results showed that the variety, Kalozira when transplanted on Aug. 01 produced the maximum grain yield (2.90 t ha-1) but its grain yield did not show statistical differences with Binadhan-9 (2.87 t ha-1). Both the varieties showed decreased grain yield in late transplanting. The data recorded on crop duration from seed to seed revealed that Binadhan-9 required the least average maturity duration of 119 days and that of Kalozira required 149 days. Both the varieties with delayed transplanting shortened the crop duration. Table 1. Dates of transplanting of fine rice in T. aman season in Mymensingh during 2011-12
Treatments
Plant height (cm)
Tillers hill-1
(no.)
Panicles hill-1
(no.)
Panicle length (cm)
Filled grains
panicle-1
(no.)
Unfilled grains
panicle-1 (no.)
1000 seed wt.
(g)
Grain yield
(t ha-1)
Straw yield
(t ha-1)
Duration(days)
Transplant. date Aug.01(D1) Aug.10 (D2) Aug.20 (D3)
106.03 107.24 99.27
8.65 7.17 7.38
7.52 5.88 6.26
24.30 23.43 22.60
75.80 79.56 76.76
29.03 30.33 36.06
17.28 17.52 15.03
2.88 2.29 1.56
3.70 4.49 3.15
136 134 132
Lsd0.05 1.56 0.59 0.88 0.79 1.95 2.67 1.04 0.08 0.08 Varieties Kalozira (V1) Binadhan-9 (V2)
109.80 98.56
8.13 7.33
7.05 6.05
23.10 23.78
93.44 61.31
17.69 45.93
14.46 18.76
2.26 2.25
3.41 4.15
149 119
LSD0.05 ** ** ** * ** ** ** ns ** Date x Variety D1V1D1V2D2V1D2V2D3V1D3V2
110.20 101.87 110.60 103.87 108.60 89.93
9.70 7.60 6.73 7.60 7.96 6.80
8.37 6.67 6.06 5.70 6.73 5.80
24.23 24.36 22.60 24.26 22.46 22.73
98.86 52.73 91.46 67.67 90.00 63.53
9.46 48.60 19.80 40.86 23.80 48.33
15.04 19.53 14.47 20.58 13.89 16.17
2.90 2.87 2.15 2.44 1.68 1.44
3.90 3.50 3.56 3.42 2.77 3.53
151 121 149 119 147 118
LSD0.05 2.54 0.41 0.56 0.86 1.57 1.99 1.29 0.09 0.27
282

BINA Annual Report 2011-12 Agronomy
Evaluation of Binadhan-8 with some salt tolerant advanced rice lines transplanting at different dates in boro season
Three rice lines/variety were evaluated under four dates of transplanting starting from Dec. 31 with an interval of 15 days at saline area of Kaligonj, Shamnagar upazila of Satkhira during boro season of 2012. The objective was to observe how the yield performances of these lines were affected by different dates of transplanting. The four dates of transplanting were Dec. 31 (D1), Jan. 15 (D2), Jan. 31 (D3) and Feb. 15 (D4). The salt tolerant advanced rice lines/variety was PBRC-37, PBSAL-655 and Binadhan-8. The experiment was laid out in RCBD with three replications. The unit plot size was 4 m × 3 m. Forty days-old seedlings were transplanted @ 3-4 seedlings hill-1 with a planting spacing of 20 cm × 15 cm. The plots were fertilized @ 75, 20, 40, 10 and 2 kg ha-1 of N, P, K, S, Zn as urea, triple super phosphate, muriate of potash, gypsum and zinc oxide. All fertilizers except urea were applied at final land preparation in full amount. Urea was applied in three splits: 30% at 7-10 days after transplanting (DAT), 30% at 25-30 DAT and 40% at panicle initiations (PI) stage. The crop was harvested at different dates at maturity and data on yield and yield components were recorded at harvest and were statistically analyzed following the design used for the experiment and the means were compared with LSD. The mean grain yield due to date of transplanting was the highest (3.15 t ha-1) in Feb. 15 transplanting followed by Jan.31 while Dec. 31 and Jan. 15 transplanting had produced the least (Table 2). The results of mean grain yields among the lines, PBRC-37 irrespective of transplanting dates was the highest (3.39 t ha-1) followed by the rice line PBSAL-655. The interaction results showed that PBRC-37 when transplanted on Feb. 15 produced the maximum grain yield (4.03 t ha-1) and when transplanted on Jan. 31 (3.96 t ha-1). Table 2. Date of transplanting of Salt tolerant rice lines in Boro season at Satkhira during 2011-12.
Treatments Plant height (cm)
Total tillers hill-1
(no.)
Effective tillers hill-1
(no.)
Panicle length (cm)
Filled grains panicle-1
(no.)
Unfilled grains panicle-1
(no.)
1000-seed wt. (g)
Grain yield
(t ha-1) Transplant Date: Dec. 31 (D1) Jan. 15 (D2) Jan. 31 (D3) Feb. 15 (D4)
81.21 79.58 87.33 86.69
11.78 10.88 13.20 13.04
10.31 9.40
10.90 11.20
20.03 19.51 20.56 20.56
88.53 88.91
127.51 131.55
31.95 32.04 46.82 45.86
15.10 15.09 17.57 17.76
2.23 2.23 3.37 3.51
LSD0.05 2.73 1.27 0.99 0.77 4.03 1.57 0.29 0.13 Varieties: PBRC- 37 (V1) PBSAL- 655 (V2) Binadhan-8 (V3)
88.10 83.29 79.72
14.35 10.60 11.73
12.68 8.95 9.73
20.55 20.24 19.70
108.60 121.96 96.81
27.53 56.43 33.55
15.73 18.71 14.70
3.39 2.61 2.51
LSD0.05 2.36 1.10 0.85 0.67 3.34 1.36 0.25 0.11 Date × Variety: D1V1D1V2D1V3D2V1D2V2D2V3 D3V1D3V2D3V3 D4V1D4V2D4V3
86.73 80.92 76.00 81.26 83.20 74.26 92.86 85.07 84.07 91.53 84.00 84.53
12.60 10.80 11.93 10.86 11.00 10.80 17.13 10.00 12.46 16.80 10.60 11.73
11.33 9.33
10.26 9.73 9.53 8.93
14.66 8.06
10.00 15.00 8.86 9.73
21.50 19.88 18.73 19.76 19.83 18.93 20.66 20.56 20.43 20.26 20.70 20.70
97.46
100.00 68.13 96.80
102.53 67.40
119.00 142.66 120.86 121.13 142.66 130.87
16.20 59.33 20.33 16.67 58.40 21.06 38.67 54.33 47.46 38.60 53.67 45.33
15.23 18.59 11.48 15.35 18.33 11.57 16.14 19.04 17.53 16.21 18.87 18.20
2.80 2.42 1.47 2.78 2.47 1.45 3.96 2.73 3.43 4.03 2.83 3.68
LSD0.05 4.73 2.21 1.72 1.34 6.98 2.73 0.51 0.23
283
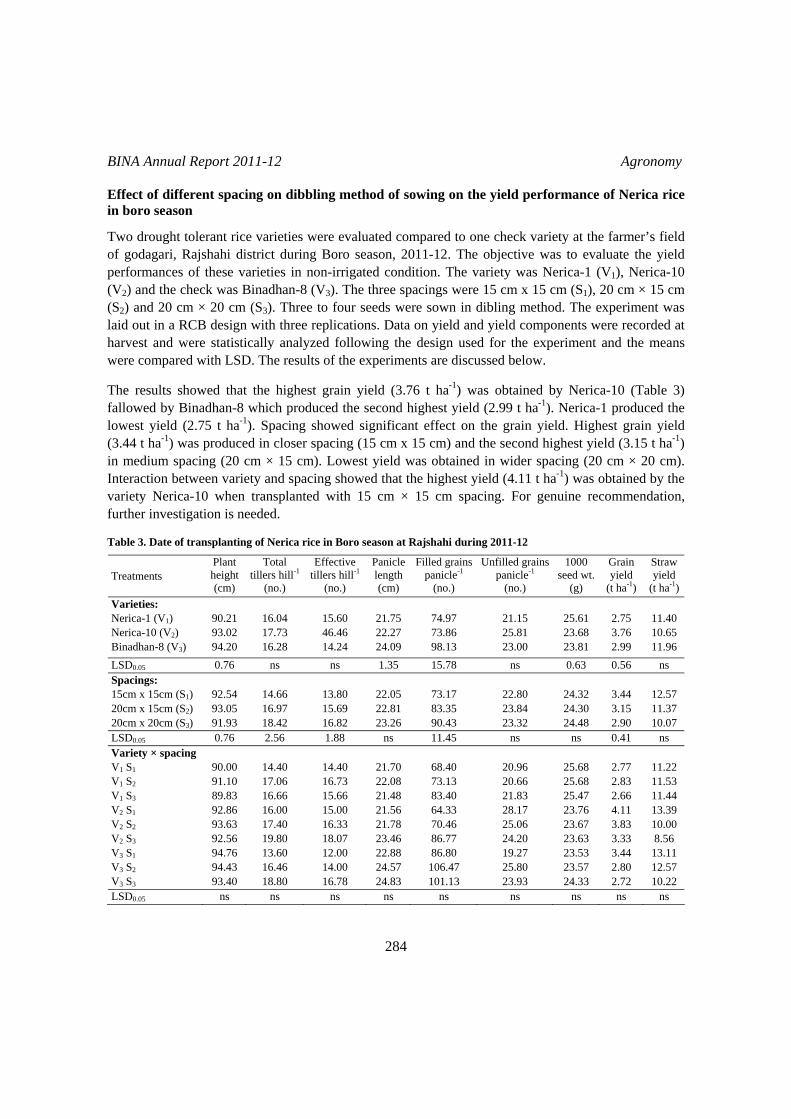
BINA Annual Report 2011-12 Agronomy
Effect of different spacing on dibbling method of sowing on the yield performance of Nerica rice in boro season
Two drought tolerant rice varieties were evaluated compared to one check variety at the farmer’s field of godagari, Rajshahi district during Boro season, 2011-12. The objective was to evaluate the yield performances of these varieties in non-irrigated condition. The variety was Nerica-1 (V1), Nerica-10 (V2) and the check was Binadhan-8 (V3). The three spacings were 15 cm x 15 cm (S1), 20 cm × 15 cm (S2) and 20 cm × 20 cm (S3). Three to four seeds were sown in dibling method. The experiment was laid out in a RCB design with three replications. Data on yield and yield components were recorded at harvest and were statistically analyzed following the design used for the experiment and the means were compared with LSD. The results of the experiments are discussed below. The results showed that the highest grain yield (3.76 t ha-1) was obtained by Nerica-10 (Table 3) fallowed by Binadhan-8 which produced the second highest yield (2.99 t ha-1). Nerica-1 produced the lowest yield (2.75 t ha-1). Spacing showed significant effect on the grain yield. Highest grain yield (3.44 t ha-1) was produced in closer spacing (15 cm x 15 cm) and the second highest yield (3.15 t ha-1) in medium spacing (20 cm × 15 cm). Lowest yield was obtained in wider spacing (20 cm × 20 cm). Interaction between variety and spacing showed that the highest yield (4.11 t ha-1) was obtained by the variety Nerica-10 when transplanted with 15 cm × 15 cm spacing. For genuine recommendation, further investigation is needed. Table 3. Date of transplanting of Nerica rice in Boro season at Rajshahi during 2011-12
Treatments Plant height (cm)
Total tillers hill-1
(no.)
Effective tillers hill-1
(no.)
Panicle length (cm)
Filled grainspanicle-1
(no.)
Unfilled grainspanicle-1
(no.)
1000 seed wt.
(g)
Grain yield
(t ha-1)
Straw yield
(t ha-1)Varieties: Nerica-1 (V1) Nerica-10 (V2) Binadhan-8 (V3)
90.21 93.02 94.20
16.04 17.73 16.28
15.60 46.46 14.24
21.75 22.27 24.09
74.97 73.86 98.13
21.15 25.81 23.00
25.61 23.68 23.81
2.75 3.76 2.99
11.40 10.65 11.96
LSD0.05 0.76 ns ns 1.35 15.78 ns 0.63 0.56 ns Spacings: 15cm x 15cm (S1) 20cm x 15cm (S2) 20cm x 20cm (S3)
92.54 93.05 91.93
14.66 16.97 18.42
13.80 15.69 16.82
22.05 22.81 23.26
73.17 83.35 90.43
22.80 23.84 23.32
24.32 24.30 24.48
3.44 3.15 2.90
12.57 11.37 10.07
LSD0.05 0.76 2.56 1.88 ns 11.45 ns ns 0.41 ns Variety × spacing V1 S1
V1 S2
V1 S3
V2 S1
V2 S2
V2 S3
V3 S1
V3 S2
V3 S3
90.00 91.10 89.83 92.86 93.63 92.56 94.76 94.43 93.40
14.40 17.06 16.66 16.00 17.40 19.80 13.60 16.46 18.80
14.40 16.73 15.66 15.00 16.33 18.07 12.00 14.00 16.78
21.70 22.08 21.48 21.56 21.78 23.46 22.88 24.57 24.83
68.40 73.13 83.40 64.33 70.46 86.77 86.80 106.47 101.13
20.96 20.66 21.83 28.17 25.06 24.20 19.27 25.80 23.93
25.68 25.68 25.47 23.76 23.67 23.63 23.53 23.57 24.33
2.77 2.83 2.66 4.11 3.83 3.33 3.44 2.80 2.72
11.22 11.53 11.44 13.39 10.00 8.56 13.11 12.57 10.22
LSD0.05 ns ns ns ns ns ns ns ns ns
284

BINA Annual Report 2011-12 Agronomy
Effect of different dates of transplanting on the growth and yield of tomato mutants
Three tomato mutants with a check variety were assessed under three dates of transplanting started from Nov. 10 with an interval of ten days at the BINA sub-station, Magura during rabi season, 2011-2012. The mutants were TM-131, TM-134, TM-219 and the check variety was Baritomato-5. The transplanting dates were Nov.10, Nov.20 and Nov.30. A unit plot size was 3 m x 4 m. The design used was RCBD with three replications. Data on yield and yield attributes were recorded at harvest. Yield and yield parameters did not show significant differences over transplanting dates (Table 4). The mean yield was highest 84.05 t ha-1 when transplanted on Nov. 20 followed by 80.1 t ha-1 when transplanted on Nov. 30. Among the mutant lines, highest fruit yield was obtained (102.66 t ha-1) by TM-219. The results of interaction between transplanting date and varieties showed that the mutant line-219 produced higher fruit yield in both Nov. 20 (116.19 t ha-1) and Nov. 30 (107.06 t ha-1). Table 4. Date of transplanting of Tomato at Magura during 2011-12
Treatments Plant height (cm)
Branches plant-1
(no.) Fruits plant-1
(no.) Fruit yield
(t ha-1) Transplanting Date: Nov. 10 (D1) Nov. 20 (D2) Nov. 30 (D3)
88.45 86.28 87.93
3.21 3.53 3.10
38.08 39.55 36.53
74.38 84.05 80.10
LSD0.05 ns ns ns ns Varieties: TM-131 (V1) TM-134 (V2) TM-219 (V3) Binatomato-5 (V4)
81.67 77.78 94.38 96.40
3.20 2.93 3.93 3.06
31.26 35.04 46.24 39.66
72.22 69.06 102.66 74.10
LSD0.05 5.04 0.67 8.93 18.03 Date × Variety: D1V1
D1V2
D1V3
D1V4
D2V1
D2V2
D2V3
D2V4
D3V1
D3V2
D3V3
D3V4
82.53 77.93 94.93 98.40 82.47 76.40 94.46 91.80 80.00 79.00 93.73 99.00
3.00 3.00 3.86 3.00 3.60 2.93 4.40 3.20 3.00 2.86 3.53 3.00
31.53 29.26 43.13 48.40 32.20 39.60 50.93 35.46 30.06 36.27 44.67 35.13
74.02 53.43 84.73 85.36 71.97 79.02 116.19 69.02 70.66 74.73 107.06 67.93
LSD0.05 ns ns ns ns
285

BINA Annual Report 2011-12 Agronomy
Determination of optimum spacing and seed rate for growth and yield of soybean lines
The experiment was conducted at two locations viz., BINA HQ farm at Mymensingh and sub-station farm at Magura to evaluate the effect of three row spacings such as 20 cm (S1), 25 cm (S2) and 30 cm (S3) on the yield and yield contributing characters of two advanced soybean lines viz., BAU-S/70 (V1), AVRDC-78 (V2) along with one check variety Binasoybean-1 (V3). The experiment was laid out in RCBD with 3 replications. The unit plot size was 4 m × 3 m. Recommended doses of fertilizers were applied. The seeds were sown on 1 January 2011 at both the locations. The experiment was harvested on different dates according to the maturity of the mutant lines/varieties at two locations. The data on yield attributes were recorded from randomly selected 10 plants while the yield data were recorded from the harvest of the whole plot. All the recorded data were statistically analyzed using MSTAT Statistical Computer Package Programme according to the design used for the experiment. Least significant difference (LSD) was used to compare variations among treatments. Results are discussed below in Table 5. The mean seed yield was highest (2.65 t ha-1) in Mymensingh contributed by higher number of population, pods plant-1, pod length-1 and seeds pod-1. Among different advance lines, BAU–S/70 produced highest seed yield (2.70 t ha-1) and AVRDC–78 produced second highest seed yield (2.49 t ha-1). The lowest seed yield was obtained by Binasoybean-1 (2.45 t ha-1). The closer spacing (20 cm row) yielded higher (2.79 t ha-1) than 25 cm and 30 cm row spacing. The interaction results presented in (Table 5) revealed that the seed yield of BAU-S/70 with row spacing of 20 cm was the highest (2.94 t ha-1) followed by Binasoybean-1 (2.78 t ha-1) with the same spacing. BAU-S/70 performs better in respect of yield in both 20 cm and 25 cm row spacing. Table 5. Determination of optimum spacing for growth and yield of soybean lines
Treatment Population stand (no. m-2)
Plant height (cm)
Pod plant-1 (no.)
Pod length (cm)
Seed pod-1 (no.)
Seed yield (t ha-1)
Location: Mymensingh (L1) Magura (L2)
51.926 40.889
61.44 67.05
49.28 44.03
3.80 3.69
2.74 2.58
2.65 2.44
T-Values ** ns ns * ** ns Varities: BAU-S/70 (V1) AVRDC78 (V2) Bina soybean 1 (V3)
45.05 37.00 57.16
82.48 50.71 59.54
48.86 53.66 37.43
3.72 3.76 3.74
2.54 2.68 2.76
2.70 2.49 2.45
LSD0.05 11.26 20.45 9.71 ns ns ns Row spacing: 20 cm (S1) 25 cm (S2) 30 cm (S3)
54.44 47.33 37.44
68.15 64.25 60.33
45.37 45.60 48.98
3.67 3.78 3.77
2.63 2.68 2.67
2.79 2.55 2.29
LSD0.05 4.86 7.11 ns ns ns 0.33
286

BINA Annual Report 2011-12 Agronomy
Table 5 Contd.
Treatment Population stand (no. m-2)
Plant height (cm)
Pod plant-1 (no.)
Pod length (cm)
Seed pod-1 (no.)
Seed yield (t ha-1)
Interaction: Location × Variety: L1V1L1V2L1V3L2V1L2V2L2V3
54.22 36.88 64.66 35.88 37.11 49.66
80.91 48.55 54.86 84.06 52.86 64.22
49.24 59.02 39.57 48.48 48.31 35.28
3.76 3.84 3.78 3.69 3.67 3.70
2.57 2.82 2.84 2.51 2.55 2.68
2.80 2.58 2.58 2.60 2.40 2.32
LSD0.05 ns ns ns ns ns ns Location × Spacing: L1S1L1S2L1S3L2S1L2S2L2S3
60.77 53.77 41.22 48.11 40.88 33.66
66.97 60.24 57.11 69.33 68.26 63.55
48.35 49.33 50.15 42.40 41.86 47.82
3.63 3.82 3.94 3.72 3.74 3.60
2.75 2.68 2.80 2.51 2.68 2.55
2.90 2.76 2.29 2.69 2.34 2.28
LSD0.05 ns ns ns 0.23 ns ns Variety × Spacing: V1 S1V1 S2V1 S3V2 S1V2 S2V2 S3 V3 S1 V3 S2 V3 S3
54.66 45.33 35.16 41.83 38.83 30.33 66.83 57.83 46.83
84.00 85.13 78.33 56.80 49.43 45.90 63.66 58.20 56.76
49.73 43.96 52.90 56.06 53.53 51.40 30.33 39.30 42.66
3.67 3.76 3.74 3.71 3.77 3.81 3.65 3.82 3.76
2.46 2.60 2.56 2.66 2.66 2.73 2.76 2.80 2.73
2.94 2.70 2.45 2.67 2.55 2.25 2.78 2.41 2.16
LSD0.05 ns ns ns ns ns ns Location × Variety × Spacing: L1V1 S1L1V1 S2L1V1 S3L1V2 S1L1V2 S2L1V2 S3 L1V3 S1 L1V3 S2 L1V3 S3 L2V1 S1L2V1 S2L2V1 S3L2V2 S1L2V2 S2L2V2 S3 L2V3 S1 L2V3 S2 L2V3 S3
65.00 57.00 40.66 41.33 39.33 30.00 76.00 65.00 53.00 44.33 33.66 29.66 42.33 38.33 30.66 57.66 50.66 40.66
84.66 83.93 74.13 55.40 46.33 43.93 60.86 50.46 53.26 83.33 86.33 82.53 58.20 52.53 47.86 66.46 65.93 60.26
49.73 46.06 51.93 60.33 59.00 57.73 35.00 42.93 40.80 49.73 41.86 53.86 51.80 48.06 45.06 25.66 35.66 44.53
3.53 3.86 3.90 3.78 3.80 3.96 3.60 3.80 3.96 3.82 3.66 3.58 3.64 3.73 3.66 3.70 3.83 3.57
2.53 2.46 2.73 2.86 2.80 2.80 2.86 2.80 2.86 2.40 2.73 2.40 2.46 2.53 2.66 2.66 2.80 2.60
3.15 2.68 2.56 2.93 2.70 2.10 2.61 2.90 2.22 2.72 2.72 2.35 2.41 2.39 2.40 2.94 1.92 2.09
LSD0.05 ns ns ns ns ns ns
287

BINA Annual Report 2011-12 Agronomy
Yield performance evaluation of sesame varieties with different row spacing
An experiment was conducted in the sub-station farms of BINA at Ishurdi and Magura to evaluate the effect of four row spacings viz., 15 cm, 20 cm, 25 cm and 30 cm on the yield and yield contributing characters of sesame varieties Binatil-1 and Binatil-2. The experiment was conducted following split- plot design with 3 replications. The unit plot size was 4.5 m × 2.5 m. Sesame varieties were placed in the main plot and row spacing in the sub plot. Fertilizers urea, TSP, MP, Gypsum, Zinc sulphate and borax were applied @ 125, 115, 75, 150, 2.5 and 2 kg ha-1. Half of urea and all other fertilizers were applied at final land preparation and rest half of urea was top dressed at the commencement of flowers. Plants were thinned in the lines according to the treatments after 15 days of seedling immergence. Data on yield attributes were recorded from randomly selected 10 plants from the middle of each plot. Plant population seed and straw yields were taken from the harvest of 5 middle lines and then converting per plot basis. All recorded data were statistically analyzed using the MSTAT Statistical Computer Package Program. Least significant difference (LSD) was used to compare variations among treatments. Results are discussed below. Table 6(a). Mean effect of mutant/variety, spacing and their interaction on the yield and yield attributes of
sesame at sub-station farm of BINA at Ishurdi during 2011-2012
Treatments Plant
population m-2
Plant height (cm)
Capsule plant-1
(no.)
Length capsule-1
(cm)
Seed capsule-1
(no.)
1000 seed weight
(g)
Seed yield
(kg ha-1) Varieties: Binatil-1 (V1) Binatil-2 (V2)
32.42 29.66
94.78 89.17
38.15 70.52
4.13 2.52
80.03 63.83
3.18 2.95
942.50 1084.83
T-values ** ** ** ** ** ** ** Spacings: 15 cm (S1) 20 cm (S2) 25 cm (S3) 30 cm (S4)
41.17 34.17 27.33 21.50
90.57 93.47 93.50 90.37
50.63 52.83 57.40 56.47
3.26 3.34 3.31 3.41
71.87 73.07 72.53 70.27
3.09 3.08 3.08 3.00
1080.83 1150.67 1027.00 796.17
LSD0.01 2.54 ns 3.84 ns ns ns 50.03 Interactions: V1 S1
V1 S2V1 S3
V1 S4
V2 S1
V2 S2
V2 S3
V2 S4
41.67 35.00 29.33 23.67 40.67 33.33 25.33 19.33
94.27 97.53 95.20 92.13 86.87 89.40 91.80 88.60
36.00 37.67 40.33 38.60 65.27 68.00 74.47 74.33
4.05 4.08 4.16 4.15 2.47 2.49 2.47 2.66
80.67 82.67 77.60 79.20 63.06 63.47 62.93 65.87
3.22 3.23 3.17 3.10 2.96 2.94 3.00 2.90
1091.67 994.33 98.33
695.67 1209.67 1167.33 1065.67 896.67
LSD 0.01 ns ns ns ns ns ns 50.98
288

BINA Annual Report 2011-12 Agronomy
Ishurdi:
Results of the experiment showed that none of the crop characters recorded at Ishurdi was significantly influenced by planting spacing except plant height. It was observed that the varieties produced mean seed yield of 1084 kg ha-1 which was higher than Binatil-1 and contributed by the higher number of capsule (Table 6.a). On the other hand, mean seed yield due to spacing was the highest 1150 kg ha-1
with the closest spacing (15 cm row) mostly contributed by higher number of plant population and 1000 seed weight. The interaction results showed that the varieties Binatil-2 produced the highest seed yield (1209 kg ha-1) at 15 cm row spacing and the second highest (1167 kg ha-1) yield at 20 cm row spacing. The another variety Binatil-1 yielded highest at 15 cm row spacing. It meant that row spacing can be used for these varieties from 15 cm to 20 cm. Table 6(b). Mean effects of mutant/variety, spacing and their interactions on the yield and yield attributes of
sesame at sub-station farm of BINA at Magura during 2011-2012
Treatments Plant
population m-2
Plant height (cm)
Capsule plant-1
(no.)
Length capsule-1
(cm)
Seed capsule-1
(no.)
1000 seed weight
(g)
Seed yield
(kg ha-1) Varieties: Binatil-1 (V1) Binatil-2 (V2)
41.36 40.15
102.80 92.47
37.91 63.07
4.37 2.68
80.18 64.06
3.30 2.99
930.17 997.33
T -values ns ** ** ** ** ** ** Spacings: 15 cm ( S1) 20 cm ( S2) 25 cm ( S3) 30 cm ( S4)
52.08 45.95 37.33 27.67
99.57 100.83 95.23 94.90
51.11 52.01 49.08 49.76
3.45 3.56 3.55 3.51
70.17 72.57 72.83 72.93
3.19 3.17 3.16 3.07
1038.33 1214.67 932.83 669.17
LSD (0.01) 5.49 ns ns ns ns ns 75.15 Interactions: V1 S1
V1 S2
V1 S3
V1 S4
V2 S1
V2 S2
V2 S3V2 S4
51.44 49.28 36.83 27.89 52.67 42.61 37.83 27.50
106.93 104.33 101.13 98.80
92.20 97.33 89.33 91.00
39.40 38.40 37.67 36.20
60.50 62.83 65.63 63.33
4.21 4.43 4.56 4.22 2.68 2.69 2.54 2.80
77.40 77.93 83.80 81.60 62.93 67.20 61.87 64.27
3.38 3.35 3.28 3.21 3.00 3.00 3.05 2.93
985.67 1199.67 874.00 661.33
1091.00 1229.67 991.67 677.00
LSD (0.01) ns ns ns ns ns ns ns Magura:
The released variety Binatil-2 produced maximum mean seed yield (997 kg ha-1) which was mainly due to higher number of capsule-1. Among the row spacing, 20 cm produced the highest mean seed yield (1214 kg ha-1) which was statistically significantly different. Higher number of capsule-1
contributed to their higher yields (Table 6.b). The interaction results depicted that Binatil-2 produced the highest seed yield (1229 kg ha-1) with the row spacing of 20 cm × 5 cm. On the other hand, the variety Binatil-1 produced second highest seed yield (1199 kg ha-1) with the spacing of 20 cm row. In closer spacing (15 cm) comparable yield was obtained by both variety (Table 6.b)
289

BINA Annual Report 2011-12 Agronomy
Effect of different herbicides on weed infestation and yield in boro rice
Two rice varieties were evaluated under six weed management comprising two herbicide. The experiment was conducted at the Bangladesh Institute of Nuclear Agriculture, farm Mymensingh during the Boro season of 2011-2012. The objective was to evaluate the effect of herbicides on weed attack and yield of boro rice. Six treatment combination are as follows; No weeding, two hand weeding at 30 DAT and 50 DAT, Pre-chlor 500 EC @ 1 Lha-1, Emchlor 5G @ 20 kg ha-1, Pre-chlor 500EC @ 1 L ha-1 + One hand weeding at 50 DAT, Emchlor 5G @ 20 kg ha-1 + One hand weeding at 50 DAT. In all cases herbicides were applied in 4-5 cm standing water in the plots. In case of manual weeding treatment it was included 2 weeding at 30 DAT and 50 DAT respectively whereas in weed free treatment weeding was done by hand when they were found. The experiment was laid in a Randomized Complete Block design with three replications. The size of the individual plot was 3 m × 3 m. Treatments were assigned in unit plots at random. Weed density was collected from each plot at vegetative stage at 30 DAT & 50 DAT of rice by using 0.5 m × 0.5 m quadrate. The weeds within the quadrate were counted species wise and converted to number m-2 multiplying by four. After counting the weed density the weeds inside each quadrate were uprooted, cleaned, separated species wise and dried first in the sun and then in an electric oven for 72 hours at a temperature of 800c. The dry weight of each species was taken with an electric balance and expressed in g m-2. Data on crop yield were collected at proper maturity of the crop. All the recorded data were compiled and analyzed using Mstat programme of computer and the means were judged by LSD. Table 7. Particulars of weed species in the weeded plots of the experiment at vegetative growth
Sl. no. Local name Scientific name Family Morphological type Life cycle
01. Khudey shama Echinochloa colomum Gramineae Grass Annual 02. Angta Paspalum scrobiculatum Gramineae Grass Perennial 03. Panikachu Monochoria vaginalis Pontederiaceae Broad-leaved perenial 04. Jaina Fembristylis miliacea Cyperaceae Sedge Annual 05. Arail Leersia hexandra L. Gramineae Grass Annual 06. Chechra Scirpus mucronatusL. Cyperaceae Sedge Perennial 07. Angule ghash Digitaria sanguinalis Gramineae Grass Annual 08. Amrul shak Oxalis europaea Pontederiaceae Broad leaved Annual 09. Chela ghash Parapholis incurva L. Gramineae Grass Perennial 10. Keshuti Eclipta alba Hassk. Compositae Broad leaved perennial
290

BINA Annual Report 2011-12 Agronomy
Table 8. Effect of weed control treatments on weed density and weed dry weight at 30 and 50 DAT
Treatment Weed density
(no.) 30 DAT
Weed density (no.)
50 DAT
Weed dry weight (g m-2)
at 30 DAT
Weed dry weight (g m-2)
at 50 DAT Varieties: Binadhan- 5(V1) 10.33 8.4 4.64 10.5 BRRI dhan29 (V2) 9.5 6.7 5.9 13.4 T -values ns ns ns 0.05 Herbicide: No weeding (H1) 17.33a 12.0a 11.4a 18.0a Weeding at 30 and 50 DAT (H2) 9.33b 7.1b 4.6b 10.8bcd Pre-chlor (H3) 8.83b 7.6b 3.5b 13.3b Emchlor (H4) 7.33b 5.8b 5.0b 8.7d Pre-chlor + Weeding at 50 DAT (H5) 8.33b 6.6b 3.5b 9.0cd Emchlor + Weeding at 50 DAT (H6) 8.33b 6.3b 3.3b 11.9bc LSD0.05 0.01 0.05 0.01 0.05 Interaction: V1H1 18.0 14.3 8.4 14.7bc V1H2 11.0 7.3 3.9 11.5cde V1H3 8.6 8.6 3.8 10.4def V1H4 7.3 6.3 4.2 7.5f V1H5 8.3 7.0 3.9 7.9ef V1H6 8.6 7.0 3.4 10.9def V2H1 16.6 9.6 14.5 21.4a V2H2 7.6 7.0 5.3 10.0def V2H3 9.0 6.6 3.3 16.2b V2H4 7.3 5.3 5.9 9.8def V2H5 8.3 6.3 3.0 10.2def V2H6 8.0 5.6 3.2 12.9bcd LSD0.05 ns ns 0.05 0.05 CV (%) 22.51 24.66 49.31 16.27
Ten weed species were infested the crop, which belong to five families. Among them three were broad- leaved, five were grasses and two were sedges. The particular of weeds is described in (Table 7). It was found that the density and dry weight of weeds varied considerably in different weed control treatments (Table 8). The highest weed dry weight 11.4 g m-2 and 18.0 gm-2 were observed in no weeding (control) treatment at 30 DAT and 50 DAT respectively. The lowest weed dry weight 3.3 g m-2 and 8.7 g m-2 were observed with Emchlor 5G @ 20 kg ha-1 + one hand weeding at 50 DAT and Emchlor 5G @ 20 kg ha-1 at 50 DAT weeding (Table 9). Among the weed control treatment highest grain yield (5.47 t ha-1) was produced with the treatment of two hand weeding at 30 DAT and 50 DAT followed by Pre-chlor 500EC @ 1 Lha-1 + One hand weeding at 50 DAT On the other hand, the lowest grain yield was recorded in (3.6 t ha-1) no weeding treatment. In most cases, the interaction effect between variety and herbicides management was significant. The highest grain yield produced (5.50 t ha-1 and 5.44 t ha-1) by two hands weeding at 30 and 50 DAT by both the variety. The herbicide pre-chlor 500EC with one hand weeding at 50 DAT produced also similar grain yield (5.42 t ha-1 and 5.27 t ha-1).
291

BINA Annual Report 2011-12 Agronomy
Table 9. Effect herbicide and weed management on the yield and yield contributing characters of Boro season
Treatment Plant height (cm)
Effective tillers hill-1
(no.)
Non-effective tillers hill-1
(no.)
Filled grains panicle-1
(no.)
Unfilled grains panicle-1 (no.)
Grain yield (t ha-1)
Straw yield (t ha-1)
Varieties: Binadhan-5 (V1) 103.11 7.1 1.1 112.8 14.6 4.9 7.02 BRRI dhan29 (V2) 95.0 74 1.0 107.2 15.7 4.4 6.06 T-Values 0.05 ns ns 0.01 ns 0.05 0.05 Herbicide: No weeding (H1) 100.0a 4.9d 1.4ab 100.8d 22.2a 3.6c 5.96b 2 weeding (H2) 97.2b 8.6ab 0.6b 117.2a 16.1b 5.47a 6.65ab Pre-chlor 500EC (H3) 99.5ab 6.5c 0.9b 104.9d 12.7b 4.61bc 7.2a Emchlor 5G (H4) 98.5ab 6.9c 2.1a 111.3bc 11.5b 4.55c 7.1a Pre-chlor + Weeding at 50 DAT (H5)
100.5a 8.9a 0.4b 115.4ab 14.8b 5.35ab 6.2b
Emchlor + Weeding at 50 DAT (H6)
98.7sb 7.9b 0.8b 110.3c 13.6b 4.76abc 6.1b
LSD0.05 0.05 0.01 0.01 0.01 0.01 0.05 0.01 Interaction: V1H1 120.4a 4.8 1.4 103.6f 22.1 3.67b 6.5b V1H2 103.2a 8.4 0.7 119.7a 14.4 5.50a 6.6b V1H3 104.4a 6.4 1.2 105.1ef 12.1 5.0ab 7.7a V1H4 102.8a 6.9 2.1 114.8b 11.5 4.92ab 7.6a V1H5 102.5a 8.8 0.4 120.5a 13.3 5.42a 6.8b V1H6 103.1a 7.6 0.5 113.1bc 14.2 5.20ab 6.7b V2H1 97.6a-c 5.0 1.4 98.0g 22.2 3.60c 5.3c V2H2 91.2c 8.8 0.5 114.8b 17.8 5.44a 6.6b V2H3 94.5bc 6.7 0.5 104.8b 13.3 4.22ab 6.6b V2H4 94.2bc 7.0 2.2 107.8ef 11.5 4.18ab 6.5b V2H5 98.4ab 9.0 0.4 110.3cd 16.4 5.27a 5.6c V2H6 94.4bc 8.2 1.0 107.6de 13.1 4.23ab 5.4c LSD0.05 0.05 ns ns 0.05 ns 0.05 0.05 CV (%) 1.37 6.04 46.6 2.01 14.05 5.66 5.03
292

TRAINING, COMMUNICATION AND PUBLICATION DIVISION

BINA Annual Report 2011-12 Training Communication & Publication
294

BINA Annual Report 2011-12 Training Communication & Publication
RESEARCH HIGHLIGHTS During 2011-12, a total of 555 block demonstrations with BINA developed crop varieties were conducted at the farmers’ field in collaboration with the Department of Agriculture Extension (DAE) and personnel of BINA sub-stations. Besides demonstrations farmers’ training, field days, publications, man power development and other assigned activities were implemented by TCP division. Thirtyfive block demonstrations with boro rice variety, Binadhan-5 were conducted in 7 districts. Binadhan-5 produced average grain yield of 5.92 t ha-1 and matured in 154 days. Some upazilas of Tangail, Pabna, Netrokona, Nawgaon and Mymensingh districts were identified for the large-scale extension of this variety. Eleven block demonstrations with boro rice variety, Binadhan-6 were conducted in 5 districts. Binadhan-6 produced average grain yield of 5.93 t ha-1 and matured in 158 days. Based on the better performance and farmers preference some upazilas of Jhalakathi, Barisal and Bhola districts were identified for the large-scale extension of this variety. Ninetythree block demonstrations with aman rice variety, Binadhan-7 were carried out in19 districts. It produced average grain yield of 4.26 t ha-1 and matured in 117 days, which was 2-3 weeks earlier than the existing cultivars of BR-11 and Sharna, respectively and around 10% higher yield as well. Popularity of Binadhan-7 is tremendously increasing in almost all areas demonstrated due to its better grain yield and earliness. It facilitates rabi crop cultivation timely after rice harvest. Adopting this variety an additional rabi crop can easily be cultivated. Fifty three block demonstrations with salt tolerant boro rice variety Binadhan-8 produced average grain yield of 5.54 t ha-1 and matured in 135 days. Based on the 12.09 percent higher yield and 10 days earlier than the salt tolerant check variety BRRI dhan47 Barisal, Cox’s Bazar, Satkhira and Chittagong districts were found suitable for Binadhan-8 extension. Twenty block demonstrations were carried out in Rabi season with mustard variety, Binasarisha-4 in four districts. Binasarisha-4 produced average seed yield of 1.40 t ha-1, which was 37.71 percent higher than the check variety, Tori-7. Sirajgonj, Jhenaidah, Chuadanga and Narail were identified as suitable area for large-scale cultivation of Binasarisha-4. Thirty nine block demonstrations were conducted in Kharif-1 and Kharif-2 season with groundnut variety, Binachinabadam-4 in four districts. In kharif-2 season, Binachinabadam-4 produced average seed yield of 2.53 t ha-1, which was 38.01 percent higher than the check variety, Dacca-1 (1.85 t ha-1). On the other hand, in kharif-1 season, Binachinabadam-4 produced average seed yield of 2.23 t ha-1, that was 38.96 percent higher than the check variety, Dacca-1 (1.62 t ha-1). Farmers showed their interest to cultivate Binachinabadam-4 for its higher yield and attractive pod size and acceptable crop duration. Natore, Lalmonirhat, Jhenaidah and Jessore were identified as suitable area for large-scale cultivation of Binachinabadam-4. Twelve block demonstrations were carried out with sesame variety, Binatil-2 in three Districts. Binatil-2 produced average seed yield of 1.61 t ha-1, which was 22.44 percent higher than the check variety, Atshira. Farmers showed their interest to cultivate Binatil-2 for its higher seed yield. Jessore, Chuadanga and Faridpur were identified as suitable area for its large-scale extension. Sixteen demonstrations with chickpea variety, Binasola-4 were conducted in two districts. It produced average seed yield of 1.52 t ha-1, which was 32.17% higher compared to local cultivar. Farmers of
295

BINA Annual Report 2011-12 Training Communication & Publication Jessore and Magura district were found interested to continue this variety for its higher seed yield. Thirteen demonstrations with Binasola-6 were carried out in Jessore and Magura. It produced average seed yield of 1.13 t ha-1 that was 21.53 % higher over the check variety. Twenty demonstrations with lentil variety, Binamasur-2 were conducted in Magura, Kushtia and Natore. It produced average seed yield of 1.43 t ha-1 which was 20.28 % higher than the check variety. Another 13 demonstrations with Binamasur-4 were carried out in Kustia and Natore. It produced average seed yield of 1.14 t ha-1 that was 7.32% higher over the local check variety. Fifty seven demonstrations with Binamoog-5 were conducted in five districts. It produced average seed yield of 1.16 t ha-1 that was 12.93% higher compared to check. For Binamoog-6, six demonstrations were conducted at Dinazpur and Magura and it produced average seed yield of 1.45 t ha-1, which was 37.24% higher than the check variety. Eight demonstrations with Binamoog-7 were carried out in Pabna, Barisal and Magura. Binamoog-7 produced average seed yield of 1.33 t ha-1. BINA technology villages, a approach to popularize BINA’s developed technologies among the neighboring farmers of BINA headquarter and substations. Demonstrations and other rational activities were carried out in order to establish BINA technology villages around BINA Headquarter and it’s five sub-stations. In sadar upazila of Mymensingh, established BINA technology villages are Paranganj and Sutiakhali, where Binadhan-5, Binadhan-7 and Binasarish-4 are adopted remarkably. Established BINA technology villages in Magura sadar are West Ramnagar, Khalimpur, Echhakhada and Alamkhali. About 15 promising varieties of different crops i.e. summar mungbean, mustard, sesame, aman and boro rice, lentil and chickpea are cultivating extensively in these villages. In Ishurdi, Pabna established BINA villages are Dulti, Auronkhola and Athaishimul. About 12 crop varieties have already been included in these villages. In Rangpur sadar upazila established BINA technology villages are Auvirampur and Parbotipur. Five crop varieties were adopted extensively in these villages. Two established BINA villages of Satkhira are Jhapaghat (Kalaroa upazila) and Daulatpur (sadar upazila). In these villages adopted crop varieties are Binadhan-7, Binadhan-8, Binamoog-5, Binamoog-7 and Binamoog-8, Binamasur-2 and Baisarisha-4. In Comilla sardar, promotional activities were carried out in Palpara and Rasulpur and BINA technology village establishment is in progess. TCP Division made necessary arrangements for nominating 43 Scientists/Staff in different training courses or workshop organized by other organizations in home and abroad. In order to promotion of BINA generated crop varieties 10 training courses were organized. During this period 210 male and female farmers including 40 Sub-Assistant Agricultural Officers were also trained on cultivation techniques of BINA developed improved crop varieties across the country. A total of 23 field days were also arranged in different areas of the country to motivate farmers and popularize the BINA developed crop varieties/technologies to the end users. For technology transfer through print media, publications were made on 6 types of leaflets total of 30,000 copies during this period. Besides these, five TV programmes were telecasted to popularize some promising BINA crop varieties.
296

BINA Annual Report 2011-12 Training Communication & Publication TECHNOLOGY TRANSFER AND IMPACT ASSESMENT
Farmer’s Observation Trials (FOTs)/Block Demonstration with rice varieties developed by BINA
Block dsemonstration with Binadhan-5 and Binadhan-6 compared to other popular HYV in different locations
During Boro season of 2011-12, 35 block demonstrations with Binadhan-5 and that of 11 with Binadhan-6 were conducted at the farmer’s field in different agro-ecological zones in collaboration with the Department of Agricultural Extension (DAE). The main objectives were to demonstrate the yield performance of these varieties and widening their adoption by the farmers. Area of each demonstration plot was 1 acre. Spacings between line to line and plant to plant were 20 cm × 15 cm. All fertilizers were applied as per recommendation. Transplanting dates ranged from 10 to 31 January, 2012 and age of seedlings was 40 to 50 days. The farmers used manage their own practices for the production. Based on the available reports, data of demonstration plots are presented in Table 1 and 2. Table 1. Performance of Binadhan-5 compared to other popular cultivar in different locations during 2011-12
Crop duration (days) Seed yield (t ha-1) Districts
Upazila No. of Demons.
Binadhan-5 Check* Binadhan-5 Check
Yield increased over
check (%) Sadar 1 153 145 V1 6.33 5.30 19.43 Muktagacha 1 150 155 V2 6.74 6.20 08.70 Fulbaria 1 148 143 V1 6.13 5.01 22.36 Gouripur 1 153 146 V1 5.97 5.85 2.05 Fulpur 1 157 158 V2 5.95 6.00 - 0.83
Mymensingh
BAUEC area 20 154 144 V1 6.10 5.30 15.09 Tangail Mirzapur 1 156 145 V1 6.10 6.25 -2.40 Netrokona Sadar 1 158 159 V2 6.55 6.98 -6.16
Manda 1 151 141 V1 7.11 5.93 19.90 Nawgoan Mahadebpur 2 155 145 V1 7.41 5.85 26.67
Jessore Jhikorgasa 1 151 144 V1 6.50 6.20 4.84 Khagrachori Sadar 1 148 145 V3 6.12 4.20 45.71 Matiranga 1 160 147V3 6.44 4.11 56.69 Pabna Ishurdi 2 155 146V1 7.02 5.50 27.64 Total 35
Mean (Total) 154 6.46 V1 Mean 144 5.69 13.35 V2 Mean 157 6.39 1.09 V3 Mean 145 4.16 27.59
*Note: V1 = BRRI dhan28, V2 = BRRI dhan29, V3 = BRRI dhan50 Data in Table1 reveal that Binadhan-5 produced average grain yield of 6.46 t ha-1. The highest yield of 7.41 t ha-1 of Binadhan-5 was recorded at Mohadevpur upazila of Nawgoan district, while the lowest yield of 5.95 t ha-1 was recorded at Fulpur upazila of Mymensingh district. On the other hand Binadhan-5 matured in 154 days, which was similar to BRRI dhan29 and 10 days later than the BRRI dhan28 and BRRI dhan50. Farmers reported that Binadhan-5 is easy to thresh and required low input cost than the BRRI dhan29 that encouraged them to cultivate Binadhan-5. Farmers expressed their
297

BINA Annual Report 2011-12 Training Communication & Publication satisfaction as the grain yield of Binadhan-5 was higher with less diseases and insect infestation. Considering all the attributes, Binadhan-5 was more profitable compared to other existing cultivars. Tangail, Mymensingh, Pabna, Netrokona, and Nawgoan districts are suitable area for Binadhan-5 cultivation. However, Farmer’s of Jessore and Khagrachori preferred short duration crop variety. Table 2. Performance of Binadhan-6 compared to other popular cultivar in different locations during 2011-12
Crop duration (days) Seed yield (t ha-1) Districts Upazila No. of Demons. Binadhan-6 *Check Binadhan-6 Check
Yield increase over check (%)
Khulna Fultola 01 160 - 4.25 - - Comilla Borichang 02 158 163 V3 4.88 5.63 -15.37
Nalchiti 01 160 155 V2 7.41 6.85 7.56 Sadar 01 160 150 V2 6.00 6.02 0.33
Jhalakathi
Kathalia 01 160 - 7.00 - - Sadar 01 160 148 V1 7.60 6.20 18.42 Barisal Uzirpur 01 165 - 6.67 - -
Bhola Dowlatkhan 03 160 160 V2 6.64 5.60 15.66 Total 11
Mean (Total) 160 5.93 V1 Mean 148 6.20 -4.55 V2 Mean 155 6.16 -3.87 V3 Mean 163 5.63 5.06
*Note: V1 = BRRI dhan28, V2 = Vozon, V3 = BRRI dhan29 Binadhan-6 (Table-2) produced the highest grain yield of 7.60 t ha-1 at sadar upazila of Barisal district and the lowest yield of 4.25 t ha-1 at Fultola upazila of Khulna district with an average of 5.93 t ha-1. Average crop duration of Binadhan-6 was 160 days that was 10 days longer than that of BRRI dhan28 and apparently similar to BRRI dhan29. Considering the higher grain yield and coarse grain, farmers showed interest to adopt Binadhan-6 in greater Barisal areas. Blok demonstrations with Binadhan-7 compared to other popular cultivar in different locations
During Aman season of 2011-12, 93 block demonstrations with Binadhan-7 were conducted at the farmer’s fields in 19 districts in collaboration with the Department of Agricultural Extension (DAE). The main objectives were to evaluate the performance of this variety at different sites and widening its adoption by the farmers. Area of each demonstration plot was one acre. Spacings between line to line and plant to plant was 20 cm × 15 cm. All fertilizers were applied as per recommendation. Transplanting dates ranged from 15 July to 05 September, 2011 and age of seedlings was 20 to 25 days. Based on the available reports, data of demonstration plots are presented in Table 3.
298

BINA Annual Report 2011-12 Training Communication & Publication Table 3. Performance of Binadhan-7 compared to other popular cultivar in different locations during 2011-12
Crop duration (days) Seed yield (t ha-1) Districts Upazila No. of Demons. Binadhan-7 Check* Binadhan-7 Check
Yield increased over Check (%)
Sadar 1 120 145 V2 4.54 3.90 14.10 Muktagacha 1 119 - 3.45 - - Fulbaria 1 115 143 V2 3.75 4.10 9.33 Trisal 1 120 120 V4 3.55 3.50 1.41 Bhaluka 1 120 - 3.45 - - Gafargoan 1 120 143 V2 3.65 3.85 5.09 Nandail 1 113 - 3.65 - -
Ishwargonj 1 113 - 4.44 - - Gouripur 1 120 121 V4 3.65 3.95 -8.22 Fulpur 1 120 120 V4 3.95 3.80 3.80 Haluaghat 1 120 - 4.14 - -
Mymensingh
Dhubaura 1 120 - 4.44 - - Sadar 1 114 150 V6 4.44 4.80 -8.11 Sarishabari 1 114 136 L 4.34 2.37 45.39 Melando 1 115 130 V6 4.05 3.66 9.63 Islampur 1 114 136 L 4.14 5.83 -40.82 Deoangonj 1 115 125 L 4.14 2.40 42.02 Madargonj 1 113 118 V4 4.24 3.46 18.40
Jamalpur
Bakshigonj 1 113 140 L 3.95 2.97 24.81 Sadar 1 117 145 V3 4.44 3.68 - Purbadhala 1 115 115 L 4.24 2.97 29.95 Durgapur 1 120 122 L 4.24 3.75 11.56 Kendua 1 120 120 L 3.45 2.97 13.91
Netrokona
Atpara 1 120 120 L 4.94 3.46 29.96 Hoshenpur 1 120 149 L 3.46 2.96 14.45 Pakundia 1 120 148 L 3.16 1.78 73.67 Katiadi 1 118 120 V4 4.89 4.45 8.99 Karimgonj 1 116 142 V3 4.45 4.20 5.62
Kishorgonj
Kuliarchar 1 120 141 L 4.45 3.85 13.48 Sadar 1 118 164 V6 4.45 4.15 6.74 Sribordi 1 115 119 L 3.65 2.47 32.33 Jhenaigati 1 117 144 L 4.64 3.95 14.87 Nalitabari 1 118 127 L 4.45 3.85 13.84
Sherpur
Nakla 1 115 - 3.46 - - Sakhipur 14 116 - 3.91 - - Tangail Ghatail 4 118 - 4.50 - - Boraigram 1 118 135 L 4.94 4.74 4.05 Natore Singra 1 120 118 V5 4.74 4.45 6.12
Gopalgonj Sadar 1 115 130 L 4.94 2.47 0.50 Sadar 1 120 138 V1 3.85 4.00 -3.89 Mohadebpur 1 110 141 V1 4.15 3.85 7.23
Nawgoan
Manda 1 120 136 V1 4.45 4.15 6.74 Kalapara 1 116 130 V1 4.84 3.46 28.51 Patuakhali
Sadar 1 115 - 3.75 - -
299

BINA Annual Report 2011-12 Training Communication & Publication
Table 3 Contd.
Crop duration (days) Seed yield (t ha-1) Districts Upazila No. of
Demons. Binadhan-7 Check* Binadhan-7 Check Yield increased over Check (%)
Sadar 1 120 - 4.15 - - Panchagor Tetulia 1 119 - 3.95 - -
Jhikorgacha 5 117 143 V2 4.45 3.46 22.25 Sadar 1 111 145 V3 4.15 4.45 -7.23
Jessore
Monirampur 1 114 120 V5 4.34 4.25 2.07 Sadar 2 114 142 V3 5.19 4.19 11.56 Satkhira Kaloroa 2 109 118V4 4.15 3.95 4.82 Sadar 2 108 - 4.60 - - Barisal Babugonj 4 112 - 5.40 - - Amtoli 1 115 140 4.00 3.50 12.50 Barguna Sadar 1 120 145 4.90 2.47 49.59 Sadar 1 118 148 4.96 4.05 -21.88 Soilokupa 1 116 136 5.03 4.44 11.73
Jhenaidah
Kaligonj 1 118 147 5.92 6.14 -3.72 Sadar 1 120 128 3.95 3.75 5.06 Faridpur Bowalmari 6 115 140 5.43 4.44 18.23
Chittagoan Puthia 2 120 - 4.90 - - Khagrachori Sadar 2 114 - 4.01 - - Total 95 Mean (Total) 117 4.26 V1 Mean 136 3.87 9.15 V2 Mean 132 3.83 10.09 V3 Mean 129 4.13 3.05 V4 Mean 121 3.85 9.62 V5 Mean 119 4.35 -2.11 V6 Mean 148 4.20 1.41 Local Mean 131 3.36 21.13
*V1= Swarna, V2= BR-11, V3= BRRI dhan30, V4= BRRI dhan33, V5= BRRI dhan39 , V6= Hori, L= Local Mean Data in Table 4 reveal that grain yields of Binadhan-7 ranged from 3.16 to 5.40 t ha-1 with an average of 4.26 t ha-1. Average maturity period of this variety was 117 days. Based on the location specific popularity, six cultivars were used as check, which were: Swarna, BR-11, BRRI dhan30, BRRI dhan33, BRRI dhan39, Hori and local cultivar. Binadhan-7 demonstrated better performance in terms of yield and duration. It was harvested about 3-4 weeks earlier, which facilitated rabi crop cultivation timely after rice harvest. Adopting this variety an additional rabi crop can easily be cultivated. That means Binadhan-7 enables farmers getting higher aman production with an additional rabi crop which encouraged farmers massive adoption of this variety. That’s why almost in all the locations farmers were found very much keen to cultivate Binadhan-7 in the upcoming years. The results of Binadhan-7 reveal that this variety is suitable for massive extension in all the districts mentioned above. All over Bangladesh, especially moderately high land is suitable areas for cultivation of Binadhan-7. Northern region of Bangladesh including Barisal, Jessore, Satkhira, Jhenaidah, Faridpur, Khulna, Chittagoan, Jamalpur, Netrokona, Kishorgonj, Sherpur, Tangail and Mymensingh were most suitable for Binadhan-7 cultivation.
300

BINA Annual Report 2011-12 Training Communication & Publication Block demonstrations with salt tolerant rice variety, Binadhan-8 compared to other popular cultivar in different locations
During Boro season of 2011-12, 53 block demonstration with Binadhan-8 were conducted at the farmer’s fields in different agro-ecological zones in collaboration with the Department of Agricultural Extension (DAE). The main objectives were to demonstrate the performance of these varieties and widening their adoption by the farmers. Area of each demonstration plot was 1 acre. Spacings between line to line and plant to plant were 20 cm × 15 cm. All fertilizers were applied as per recommendation. Transplanting dates ranged from 10 to 31 January, 2012 and age of seedlings was 40 to 50 days. The farmers used there own management practices for the production. Based on the available reports, data of demonstration plots are presented in Table 4. Table 4. Performance with salt tolerant rice variety, Binadhan-8 compared to other popular cultivar in different
locations during 2011-12
Crop duration (days) Seed yield (t ha-1) Districts Upazila No. of
Demons. Binadhan-8 Check* Binadhan-8 Check Yield increase over check (%)
Mymensingh Sadar (BAUEC) 06 139 - 5.04 - - Sadar 02 144 145 V1 5.48 5.82 6.20 Devhata 02 133 139 V1 5.82 6.03 -3.61 Kaligonj 02 130 136 V1 6.00 6.07 -1.17 Ashasuni 02 135 - 4.05 - -
Satkhira
Shamnagar 02 129 129 V1 5.93 4.95 16.53 Sadar 02 134 162 V2 5.20 7.20 38.46 Babuganj 03 145 7.30 -
Barisal
Gouronodi 02 134 6.80 - Chittagoan Bashkhali 10 134 137 V1 5.20 4.60 11.54 Cox’s Bazar Chokoria 10 138 - 6.35 - -
Sadar 01 130 145 V1 5.43 5.00 7.92 Fakirhat 01 129 150 V4 5.90 4.90 16.95 Mollarhat 02 130 135 V1 5.30 4.90 7.55 Rampal 02 137 138 V1 6.30 4.90 22.22 Kochua 01 139 131 V3 4.40 3.90 11.36 Morolgonj 01 128 145 V4 4.41 4.40 0.23 Soronkhola 01 144 148 V4 5.50 5.30 3.64
Bagerhat
Chitolmari 01 141 146 V3 4.90 4.70 4.08 Total 53 Mean (Total) 135 5.54 V1 Mean 138 5.28 4.70 V2 Mean 162 7.20 -29.96 V3 Mean 139 4.30 22.38 V4 Mean 148 4.87 12.09
*V1= BRRI dhan28, V2= BRRI dhan29, V3=Vozon, V4= BRRI dhan47 It is revealed that grain yields of Binadhan-8 ranged from 4.05 to 7.30 t ha-1 with an average of 5.54 t ha-1 (Table 4). Average maturity period of this variety was 135 days. Check varieties were BRRI dhan28, BRRI dhan29, Vozon and BRRI dhan47, which produced average grain yield of 5.28, 7.20, 4.30 and 4.87 t ha-1, respectively. Of these only check variety, BRRI dhan29 produced higher grain yield (7.20 t ha-1) though this was not recommended as a salt tolerant variety. Higher yield of BRRI dhan29 was due to cultivation in non saline plot. Farmers were found very much interested to cultivate
301

BINA Annual Report 2011-12 Training Communication & Publication Binadhan-8 for its salinity tolerance and it’s risk avoidence potentiality. They also requested BINA authority to conduct more demonstration at these localities for their better understanding about the variety. Bagerhat, Satkhira, Cox’s Bazar and Chittagong were found the most suitable areas for cultivation of Binadhan-8. It needs more trials in different locations for identifying suitable areas of Binadhan-8 cultivation and thereby massive promotion. Block Demonstration/Farmer’s Observation Trials with oilseeds varieties developed by BINA
Block demonstrations with mustard variety, Binasarisha-4 compared to local cultivar
During the Rabi season of 2011-12, 20 block demonstrations were conducted with Binasarisha-4 in four different districts in collaboration with the DAE. The main objectives were to demonstrate the performance of Binasarisha-4 to evaluate their location specific suitability and widen adoption by the farmers. Unit plot size of block demonstrations was 1 bigha at all the locations. Seeds were sown during October to November, 2010 at the rate of 7.5 kg ha-1. The local check varieties were Tori-7 and BARI Sarisha-9. All fertilizers were applied as per recommendation and 1-2 irrigation was applied in the demonstration plots. Pesticides were sprayed as and when necessary to control insects and pests. Data were recorded on crop duration and seed yield. The results are presented in Table 5. Table 5. Performance of Binasarisha-4 compared to local check variety at block demonstrations in different
districts during 2011-2012
Crop Duration (Seed to seed) in days
Seed yield (t ha-1) District Upazila
No. of Farmers’
Plot Binasarisha-4 Check* Binasarisha-4 Check*
Percent yield increased over
check (%) Sadar 1 85 80 1.63 1.18 38.14 1 86 75 1.48 1.11 33.33 1 85 77 1.53 1.10 39.09 1 84 78 1.61 1.14 41.23
Sirajgonj
1 85 78 1.58 1.04 51.92 Narail Sadar 1 83 75 1.48 1.09 35.78
1 82 77 1.47 0.99 48.48 1 80 74 1.34 0.87 54.02 1 86 83 1.49 1.08 37.96 1 88 78 1.37 1.03 33.01
Chuadanga Alamdanga 1 89 78 1.19 0.89 33.71 1 86 70 1.49 0.98 52.04 1 90 77 1.58 1.19 32.77 1 89 78 1.18 0.91 29.67 1 86 76 1.08 0.89 21.35
Jhenaidah Sadar 1 87 79 1.50 0.95 57.89 1 88 78 1.28 1.05 21.90 1 89 79 1.33 1.02 30.39 1 85 77 1.29 0.95 35.79 1 87 78 1.17 0.93 25.81
Total Mean 20 86 77 1.40 1.02 37.71 * Tori-7 and BARI Sarisha-9 Binasarisha-4 produced average seed yield of 1.40 t ha-1, which was 37.71 percent higher than the check varieties (1.02 t ha-1). The highest yield of Binasarisha-4 was produced at Sirajgonj sadar (1.63 t ha-1) while the lowest seed yield was at Alamdanga in Chuadanga (1.08 t ha-1). Comments of farmers’
302

BINA Annual Report 2011-12 Training Communication & Publication and extension personnel on Binasarisha-4 were that it was a long durative high yielding variety, almost no pest infestations and most of the farmers’ interested to cultivate this variety in next year. Therefore, to introduce the variety it is very important to timely sowing of Binasarisha-4 and previous aman variety should be short durative as well as high yielding like Binadhan-7. Block demonstrations with groundnut variety, Binachinabadam-4 compared to local variety
During Kharif-2 and kharif-1 season of 2011-2012, 39 block demonstrations with Binachinabadam-4 were conducted at farmers’ plots in four districts collaboration with the Demonstration of Agricultural Extension (DAE). The objectives were to demonstrate and evaluate the performance of Binachinabadam-4 for its dissemination and encourage the farmers for adopting these varieties as well as making available seeds for the farmers for the next seasons. Unit plot size of individual block demonstrations was 1 bigha at all the locations. Seeds were sown during July to September, 2011 in kharif-2 and January to February, 2012 in kharif-1 seasons. The local check variety was Dacca-1 in both seasons. Fertilizers were applied as per recommendation. Pesticides were also sprayed as and when necessary to control insects and pests. Data were recorded on crop duration and grain yield. The results are presented in Table 6 and 7. Table 6. Performance of Binachinabadam-4 compared to local check variety at block demonstrations in
different districts during Kharif-2 season of 2011-2012
Crop Duration (days)
Grain yield (t ha-1) District Upazila
No. of Farmers’
Plot Binachinabadam-4 Dacca-1 Binachinabadam-4 Dacca-1
Increased over check
(%) Jhenaidah Moheshpur 1 125 124 2.66 1.76 51.14 1 125 125 2.96 1.79 65.36 1 120 121 3.16 2.05 54.15 1 120 122 3.12 2.02 54.46 1 120 123 3.15 2.07 52.17 Jessore Sharsha 1 141 141 2.67 1.98 34.85 1 138 138 2.56 2.37 8.02 1 138 137 2.47 1.78 38.76 1 137 141 2.57 1.87 37.43 1 136 142 1.98 1.67 18.56 1 139 139 2.37 1.75 35.43 Natore Sadar 1 135 135 3.11 2.22 40.09
1 136 135 2.67 2.12 25.94 1 134 134 2.96 2.13 38.97 1 133 132 2.65 2.21 19.91 almonirhat Kaligonj 1 135 135 1.98 1.38 43.48
1 135 135 2.17 1.49 45.64 1 125 125 1.78 1.57 13.38 1 124 124 1.78 1.28 39.06 Aditmari 1 121 124 2.37 1.67 41.92 1 120 121 2.39 1.72 38.95 1 130 129 2.94 1.64 79.27 1 122 122 2.27 1.58 43.67 1 128 128 2.17 1.96 10.71 1 121 121 2.46 2.07 18.84
Total Mean 25 130 130 2.53 1.85 38.01
303
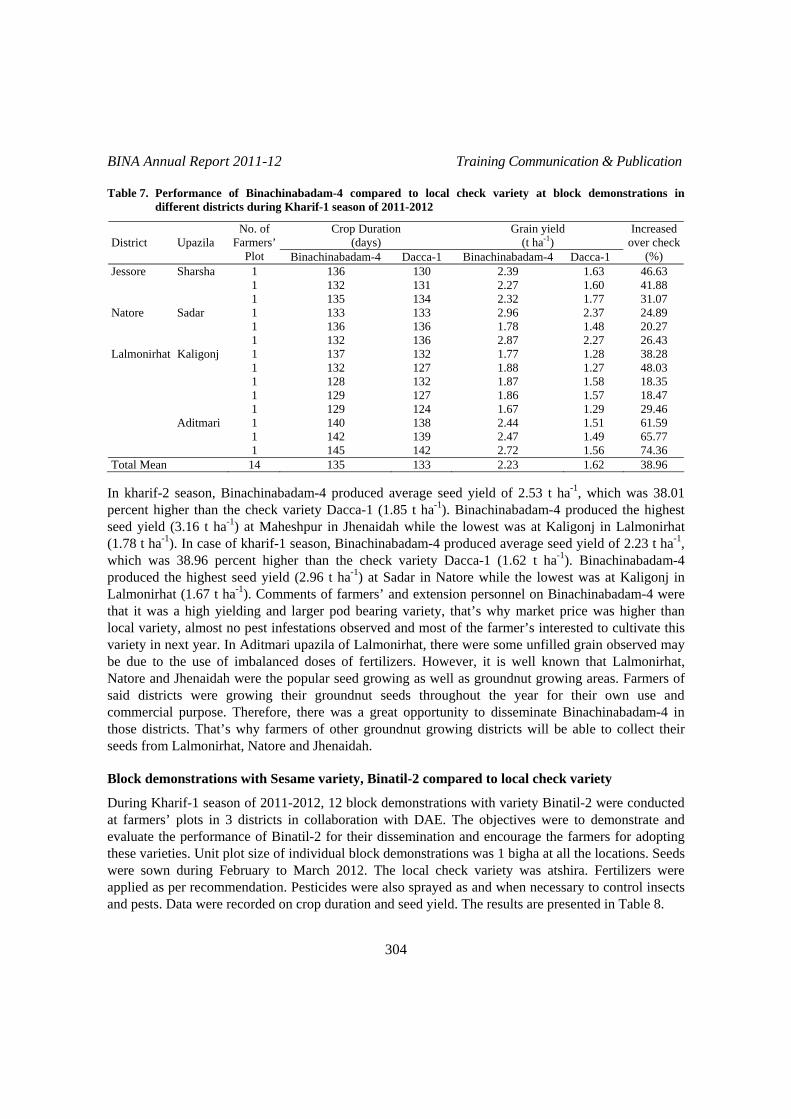
BINA Annual Report 2011-12 Training Communication & Publication Table 7. Performance of Binachinabadam-4 compared to local check variety at block demonstrations in
different districts during Kharif-1 season of 2011-2012
Crop Duration (days)
Grain yield (t ha-1) District Upazila
No. of Farmers’
Plot Binachinabadam-4 Dacca-1 Binachinabadam-4 Dacca-1
Increased over check
(%) Jessore Sharsha 1 136 130 2.39 1.63 46.63
1 132 131 2.27 1.60 41.88 1 135 134 2.32 1.77 31.07
Natore Sadar 1 133 133 2.96 2.37 24.89 1 136 136 1.78 1.48 20.27 1 132 136 2.87 2.27 26.43 Lalmonirhat Kaligonj 1 137 132 1.77 1.28 38.28 1 132 127 1.88 1.27 48.03 1 128 132 1.87 1.58 18.35 1 129 127 1.86 1.57 18.47 1 129 124 1.67 1.29 29.46 Aditmari 1 140 138 2.44 1.51 61.59 1 142 139 2.47 1.49 65.77 1 145 142 2.72 1.56 74.36 Total Mean 14 135 133 2.23 1.62 38.96
In kharif-2 season, Binachinabadam-4 produced average seed yield of 2.53 t ha-1, which was 38.01 percent higher than the check variety Dacca-1 (1.85 t ha-1). Binachinabadam-4 produced the highest seed yield (3.16 t ha-1) at Maheshpur in Jhenaidah while the lowest was at Kaligonj in Lalmonirhat (1.78 t ha-1). In case of kharif-1 season, Binachinabadam-4 produced average seed yield of 2.23 t ha-1, which was 38.96 percent higher than the check variety Dacca-1 (1.62 t ha-1). Binachinabadam-4 produced the highest seed yield (2.96 t ha-1) at Sadar in Natore while the lowest was at Kaligonj in Lalmonirhat (1.67 t ha-1). Comments of farmers’ and extension personnel on Binachinabadam-4 were that it was a high yielding and larger pod bearing variety, that’s why market price was higher than local variety, almost no pest infestations observed and most of the farmer’s interested to cultivate this variety in next year. In Aditmari upazila of Lalmonirhat, there were some unfilled grain observed may be due to the use of imbalanced doses of fertilizers. However, it is well known that Lalmonirhat, Natore and Jhenaidah were the popular seed growing as well as groundnut growing areas. Farmers of said districts were growing their groundnut seeds throughout the year for their own use and commercial purpose. Therefore, there was a great opportunity to disseminate Binachinabadam-4 in those districts. That’s why farmers of other groundnut growing districts will be able to collect their seeds from Lalmonirhat, Natore and Jhenaidah. Block demonstrations with Sesame variety, Binatil-2 compared to local check variety
During Kharif-1 season of 2011-2012, 12 block demonstrations with variety Binatil-2 were conducted at farmers’ plots in 3 districts in collaboration with DAE. The objectives were to demonstrate and evaluate the performance of Binatil-2 for their dissemination and encourage the farmers for adopting these varieties. Unit plot size of individual block demonstrations was 1 bigha at all the locations. Seeds were sown during February to March 2012. The local check variety was atshira. Fertilizers were applied as per recommendation. Pesticides were also sprayed as and when necessary to control insects and pests. Data were recorded on crop duration and seed yield. The results are presented in Table 8.
304

BINA Annual Report 2011-12 Training Communication & Publication Table 8. Performance of Binatil-2 compared to local check variety at block demonstrations in different districts
during 2011-2012
Crop duration (seed to seed) in days
Seed yield (t ha-1) District Upazila
No. of Farmers’
Plot Binatil-1 Atshira Binatil-1 Atshira
Yield increasedover check
(%) Chuadanga Alamdanga 1 98 97 1.97 1.77 11.30 1 97 95 1.77 1.68 5.36 1 97 95 1.98 1.78 11.24 1 98 96 1.87 1.67 11.98 Faridpur Madhukhali 1 96 93 1.38 1.09 26.61 1 89 88 1.38 0.99 39.39 1 95 93 1.48 1.08 37.04 1 94 92 1.38 0.98 40.82 Jessore Bagharpara 1 95 93 1.45 1.32 9.85 1 97 94 1.63 1.27 28.35 1 94 92 1.47 1.24 18.55 1 96 93 1.52 1.18 28.81 Total Mean 12 96 93 1.61 1.34 22.44 Binatil-2 produced average seed yield of 1.61 t ha-1, which was 22.44 percent higher than the control variety Atshira (1.34 t ha-1). Highest seed yield (1.98 t ha-1) was found at Alamdanga in Chuadanga while the lowest (1.47 t ha-1) was at Baghar para although the difference was not so remarkable. Comments of farmers’ and extension personnel on Binatil-2 were that it was a high yielding as well as attractive seed coated variety. Farmers’ of almost all locations were interested to cultivate the variety in the next year. Farmers observation trials (FOTs)/block demonstration with pulse varieties developed by BINA
Block demonstrations of chickpea variety, Binasola-4 at different AEZ in collaboration with DAE
During the Rabi season of 2011-12, a total of 16 demonstrations on Binasola-4 were set up at the farmer’s fields in three upazilas of two districts, Jessore and Magura. The main objectives were to demonstrate and evaluate the performance of Binasola-4 across the locations and encourage the farmers to continue the variety in their fields. The area for each of the demonstration plot was one acre where 5 decimal was allocated for local cultivar. Sowing time ranged from Mid November to Mid December, 2011. It is notable here that sowing dates within a month have been categorized into three intervals; first 10 days as early, middle 10 days as mid and last 10 days as late of the respective month. In all cases seeds were sown using broadcast method at the rate of 30 kg/ha. The fertilizers like urea, TSP, MoP, gypsum and zinc sulphate were applied at the rate of 35, 120, 70, 90 and 4 kg per hectare, respectively. All intercultural operations were managed by the farmers as and when required. Data on sowing time, crop duration, seed yield and insect and disease infestation were recorded. The results are presented in Table 9.
305

BINA Annual Report 2011-12 Training Communication & Publication Table 9. Performance of Binasola-4 compared to popular cultivar in different locations during 2011-12
Duration (days)
Yield (kg ha-1) District Upazila Date of sowing
(Binasola-4) No. of
demons. Binasola-4 check Binasola-4 check
Yield increased over check
(%) Magura Sadar 25-30 Nov. 04 123 118 1.80 1.20 33.33
Sadar 4-12 Dec. 09 111 111 1.20 1.00 16.67 Jessore Jhikorgacha 15-17 Nov. 03 122 125 1.55 1.25 19.35 Total Mean 16 119 119 1.52 1.15 32.17
It is evident from the Table 9 that average duration of Binasola-4 was 119 days and there were no significant differences in crop duration between the check and demo variety. The average yield of Binasola-4 was 1.52 t ha-1 which was higher than the check. The highest yield (1.8 t ha-1) was recorded at sadar upazila of Magura district. The lowest yield (1.2 t ha-1) was recorded at sadar upazila of Jessore. Late sowing might be one of the vital reasons for low yield. Shiny seed coat of Binasola-4 was also marked by the farmers as an additional advantage, especially for higher market price. However, farmers shown their deep interest to cultivate Binasola-4 due to its more yields, shiny seed coat, less pest and disease infestation. Block demonstration of chickpea variety Binasola-6 at different AEZ in collaboration with DAE With the same objectives, during the Rabi season of 2011-12, a total of 13 block demonstrations on Binasola-6 were set up at the farmer’s fields in three upazila of two districts, Jessore and Magura. In all cases seeds were sown using broadcast method at the rate of 30 kg ha-1. The fertilizers like urea, TSP, MoP, gypsum and zinc sulphate were applied at the rate of 35, 120, 70, 90 and 4 kg per hectare, respectively. The farmers used their own management all intercultural operations as and when required. Data on sowing time, crop duration, seed yield, insect and disease infestation were recorded. The results are presented in Table 10. Table 10. Performance of Binasola-6 compared to popular cultivar in different locations during 2011-12
Duration (days)
Yield (kg ha-1) District Upazila Date of sowing
(Binasola-6) No. of
demons. Binasola-6 check Binasola-6 check
Yield increased over check
(%) Magura Sadar 25-29 Nov. 04 129 122 1.50 1.20 20.00
Sadar 3-7 Dec. 06 110 110 1.20 1.00 16.61 Jessore Jhikorgacha 16-20 Nov. 03 124 126 1.63 1.20 26.38 Total Mean 13 121 119 1.44 1.13 21.53
The Table indicates the facts that the average duration of Binasola-6 was 121 days and there was no significant difference between the check and demo variety. But the average yield of Binasola-6 was 1.44 t ha-1 which was 21.53% higher than the check variety. The highest yield (1.63 t ha-1) was recorded at Jhikargacha of Jessore district and the lowest yield was recorded at sadar upazila of Magura district. The yield data revealed the facts that more area of Jessore district could be brought under the cultivation of Binasola-6 through exhaustive extension campaign among the farmers.
306

BINA Annual Report 2011-12 Training Communication & Publication Block demonstration of lentil variety, Binamasur-2 at different AEZ in collaboration with DAE
During the Rabi season of 2011-12, a total of 20 demonstrations with Binamasur-2 were set up at the farmers fields in three districts; Natore, Magura and Kustia. The main objectives were to demonstrate and evaluate the performance of Binamasur-2 across the locations and encourage the farmers to continue the variety in their fields. The area for each of the demonstration plots was one acre where, 5 decimal was allocated for check variety, seeds were sown in different dates of November, 2011 and using broadcast method at the rate of 25 kg ha-1. The fertilizers like urea, TSP, MoP, gypsum and zinc sulphate were applied at the rate of 35, 120, 70, 90 and 4 kg per hectare, respectively. The farmers managed all intercultural operations like thinning, weeding, measures against insects and pests as and when required. Data on crop duration, insect and disease infestation and seed yield were recorded. The results are presented in the Table 11. Table 11. Performance of Binamasur-2 compared to popular cultivar in different locations during 2011-12
Duration (days)
Yield (kg ha-1) District Upazila Date of
sowing No. of
demons. Binamasur-2 check* Binamusur-2 check
Yield increased over check
(%) Sadar 5-7 Nov 06 98 96 V1 1.40 0.90 35.71 Mirpur 7-9 Nov 03 106 112 V1 1.18 0.70 40.67
Kustia
Veramara 5-8 Nov 04 102 100 V1 1.50 1.10 26.67 Magura Sadar 1-4 Nov 04 99 104 V2 1.80 1.60 11.11 Natore Boraigram 14-18 Nov 03 110 115 V3 1.28 1.40 9.38 Total Mean 20 103 1.43 1.14 20.28
*V1= Local cultivar, V2 = BARI Masur-4, V2 = BARI Masur-6
Seed yields of Binamasur-2 varied from 1.18 to 1.80 t ha-1 across the locations. The highest yield (1.8 t ha-1) was recorded at sadar of Magura district while the lowest yield (1.18 t ha-1) was at Mirpur upazila of Khustia district. It could be seen from the Table that although in some cases check variety produced higher seed yield than the demo variety. The average performance of Binamasur-2 was 20.28% higher than the check variety. However, the comments of the farmers, on performance of Binamasur-2 at the farmers’ field were less diseases and insect infestation and cultivate in rain fed condition. Block demonstration of lentil variety, Binamasur-4 at different AEZ in Collaboration with DAE
A total of six block demonstrations with Binamasur-4 were set up at the farmer’s fields in five Upazila under two districts; Natore and Jessore. The main objectives were to demonstrate and evaluate the performance of Binamasur-4 compared to check variety across the locations and encourage the farmers to continue the variety in their fields. The area for each of the demonstration plots was one acre where, 5 decimal were allocated for control variety, BARI Masur-6. Data on crop duration, insect and disease infestation and seed yield were recorded. The results are presented in the Table 12.
307

BINA Annual Report 2011-12 Training Communication & Publication Table 12. Performance of Binamasur-4 compared to popular cultivar in different locations during 2011-12
Duration (days) Yield (kg ha-1) District Upazila Date of
sowing No. of
demons Binamasur-4 BARI Masur-6 Binamasur-4 BARI Masur-6
Yield increased
over check (%)
Sadar 4-7 Nov 03 123 113 1.42 1.11 21.83 Mirpur 13 Nov 01 110 - 1.10 -
Kustia
Veramara 9-10 Nov 02 106 106 1.00 0.90 10.00 Natore Boraigram 12 Nov 01 115 117 1.40 1.40 - Total Mean 6 114 1.23 1.14 7.32
The Table indicates that no significance difference was observed in duration of Binamasur-4 and the check variety. But the average yield of Binamasur-4 was 7.32% higher than the check variety. The highest seed yield (1.42 t ha-1) was recorded both at sadar upazila of Kustia district. No influence of sowing time was observed on yield of Binamasur-4. Block demonstration of mungbean variety, Binamoog-5 at different AEZ in Collaboration with DAE
During the Kharif-1 season of 2011, a total of 57 block demonstrations with mungbean variety, Binamoog-5 were conducted at farmers’ fields in five districts. The Department of Agricultural Extension (DAE) was the main collaborator in implementing the demonstrations programme. The main objectives were to demonstrate and evaluate the performance of Binamoog-5 for its dissemination and adoption among the farmers. The area of each of the demonstrations was one acre. The trials were conducted under farmers’ own management. Farmers of the southern districts like Patuakhali and Barisal have started sowing in mid of February and continued up to end of February. On the other hand, sowing started in late of March and continued up to end of April in the north-western districts: Dinajpur, Jessore and Pabna. In all cases, seeds were sown using broadcast method at the rate of 30 kg ha-1. The fertilizers like urea, TSP, MoP, gypsum and zinc sulphate were applied at the rate of 35, 120, 70, 90 and 4 kg per hectare, respectively. The available data on sowing time, crop duration and seed yield are presented in the Table 13. Table 13. Performance of Binamoog-5 compared to popular cultivar in different locations during 2011-12
Duration (days)
Yield (kg ha-1) District Upazila Date of
sowing No. of
demons. Binamoog-5 check Binamoog-5 check
Yield increased over check
(%) Dinajpur Birgonj 04 April 01 90 85 1.20 1.10 8.33
Chatmohor 20-23 Mar. 08 74 79 1.59 1.15 27.67 Pabna Atghoria 2-4 April 04 80 87 1.18 0.95 19.49 Babugonj 1-7 Feb. 25 83 90 1.30 1.06 18.46 Barisal Sadar 10-12 Feb. 03 63 88 1.20 0.99 17.50
Jessore Sadar 3-5 Mar. 04 95 94 1.52 1.00 32.21 Baufal 11-15 Feb 08 75 100 1.25 0.89 28.80 Patuakhali Sadar 13-15 Feb. 04 75 110 1.00 0.97 3.00
Total Mean 57 79 1.16 1.01 12.93
308

BINA Annual Report 2011-12 Training Communication & Publication It is revealed from the Table 13 that sowing started in the southern districts at least one month ahead of the northwestern districts. Binamoog-5 required an average of 79 days to maturity. The average yield of Binamoog-5 was 1.16 t ha-1 across the locations. However, the highest yield was recorded at Chatmohor of Pabna district and the lowest yield (1.10 t ha-1) was at sadar under Patuakhali district. Drought tolerance and short duration characteristics of Binamoog-5 might have influenced the farmers in taking decision to continue this variety in their fields. Farmers showed their interest to cultivate this variety for its shiny seed coat, short duration and suitable for rice-wheat-mungbean pattern. Block demonstration of mungbean variety, Binamoog-6 at different AEZ in Collaboration with DAE
A total of six block demonstrations with mungbean variety, Binamoog-6 were conducted at farmers’ fields in two districts. The Department of Agricultural Extension (DAE) was the main collaborator in making the demonstrations successful. The objectives were to demonstrate and evaluate the performance of Binamoog-6 for its dissemination and adoption among the farmers. The area of each of the demonstrations was one acre. The seed rate and fertilizer dose were similar as of Binamoog-5. The trials were conducted under farmers’ own management in rain-fed condition. Data on sowing time, crop duration and seed yield are presented in the Table 14. Table 14. Performance of Binamoog-6 compared to popular cultivar in different locations during 2011-12
Duration (days)
Yield (kg ha-1) District Upazila Date of
sowing No. of
demons.Binamoog-6 check Binamoog-6 check
Yield increased over check
(%) Dinajpur Birgonj 16-18 Mar. 02 74 68 1.60 1.02 36.25 Magura Sadar 12-15 Feb. 04 70 63 1.30 0.80 38.46 Total Mean 6 72 1.45 0.91 37.24
The average seed yield of Binamoog-6 was 1.45 t ha-1, which was 37.24% higher than the check variety. The highest yield was recorded at Birganj under Dinajpur district. Farmers shows their positive attitude to cultivate this variety. Block demonstration of mungbean variety, Binamoog-7 in different AEZ in Collaboration with DAE
A total of eight block demonstrations with mungbean variety, Binamoog-7 were conducted at farmers’ fields in three districts. The Department of Agricultural Extension (DAE) was the main collaborator in making the demonstrations successful. The objectives were to demonstrate and evaluate the performance of Binamoog-7 for its dissemination and adoption among the farmers. The area of each of the demonstrations was one acre. The seed rate and fertilizer dose were similar as of Binamoog-5. The trials were conducted under farmers’ own management. Data on sowing time, crop duration and seed yield are presented in the Table 15. The Table revealed that the duration of Binamoog-7 and the check variety was very much identical. Seed yield of Binamoog-7 was 21.05% higher than the check variety. The highest yield (1.7 t ha-1) was recorded at sadar upazila under Magura district.
309

BINA Annual Report 2011-12 Training Communication & Publication Table 15. Performance of Binamoog-7 compared to popular cultivar in different locations during 2011-12
Duration (days)
Yield (kg/ha) District Upazila Date of
sowing No. of
demons.Binamoog-7 check Binamoog-7 check
Yield increased over check
(%) Pabna Atghoria 1-3 Feb. 04 76 82 1.18 1.03 12.71 Barisal Babugonj 2 Feb. 01 80 88 1.20 1.00 16.67 Banaripara 17 Feb. 01 95 79 1.45 0.95 34.48 Magura Sadar 20-21 Mar. 02 70 80 1.50 1.20 20.00 Total Mean 8 80 82 1.33 1.05 21.05
Block demonstration of mungbean variety, Binamoog-8 at different AEZ in Collaboration with DAE
A total of thirty five block demonstrations with mungbean variety, Binamoog-8 were conducted at farmers’ fields in five districts. The Department of Agricultural Extension (DAE) was the main collaborator in making the demonstrations successful. The objectives were to demonstrate and evaluate the performance of Binamoog-8 for its dissemination and adoption among the farmers. The area of each of the demonstrations was one acre. The trials were conducted under farmers’ own management. Data on sowing time, crop duration and seed yield are presented in the Table 16. Table 16. Performance of Binamoog-8 compared to popular cultivar in different locations during 2011-12
Duration (days)
Yield (kg ha-1) District Upazila Date of
sowing No. of
demonsBinamoog-8 check Binamoog-8 check
Yield increased over check
(%)
Natore Singra 20-22 Mar. 02 67 80 1.42 0.92 35.21 Chatmohor 21-22 Mar 03 74 - 1.62 - -
Pabna Atgharia 25-28 Mar 07 81 88 1.21 0.98 19.00
Dinajpur Birgonj 2-4 April 03 90 78 1.20 1.05 12.50 Barisal Babugonj 1-5Feb. 17 75 85 1.40 1.15 17.86 Jessore Sadar 8-10 Mar. 03 100 96 1.60 1.00 31.25 Total Mean 35 81 85 1.41 1.02 27.66
The Table revealed that there was no significant difference between the duration of Binamoog-8 and the check variety. But the yield of Binamoog-8 was 27.66% higher than the check variety. The highest yield (1.62 t ha-1) was recorded at Chatmohor upazila under Natore district. Establishment of BINA-Technology Pilot Area (BINA-Village)
In order to establish BINA-Tech. village, block demonstrations and other extension work were done in collaboration with the Department of Agricultural Extension (DAE) and personnel of BINA-substations at the farmer’s fields around BINA Head quarter and its sub-stations. Results of block demonstrations of different locations and status of BINA technology village establishment are presented below.
310
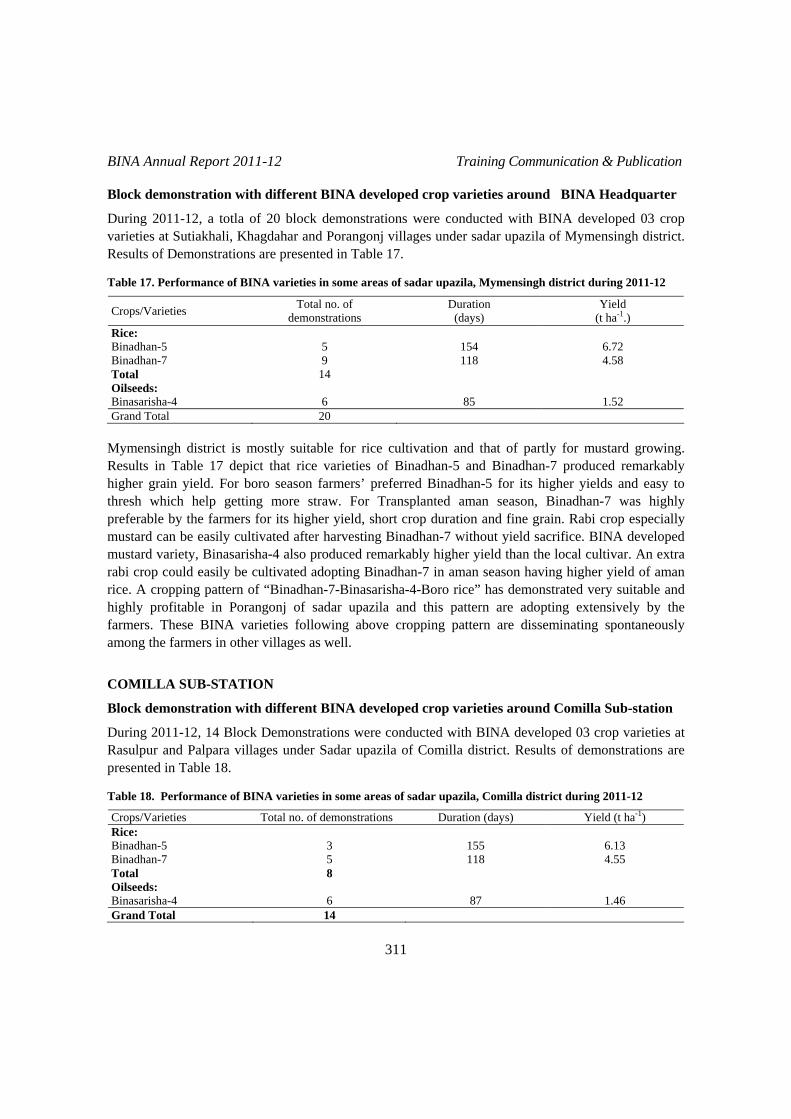
BINA Annual Report 2011-12 Training Communication & Publication Block demonstration with different BINA developed crop varieties around BINA Headquarter
During 2011-12, a totla of 20 block demonstrations were conducted with BINA developed 03 crop varieties at Sutiakhali, Khagdahar and Porangonj villages under sadar upazila of Mymensingh district. Results of Demonstrations are presented in Table 17. Table 17. Performance of BINA varieties in some areas of sadar upazila, Mymensingh district during 2011-12
Crops/Varieties Total no. of demonstrations
Duration (days)
Yield (t ha-1.)
Rice: Binadhan-5 5 154 6.72 Binadhan-7 9 118 4.58 Total 14 Oilseeds: Binasarisha-4 6 85 1.52 Grand Total 20
Mymensingh district is mostly suitable for rice cultivation and that of partly for mustard growing. Results in Table 17 depict that rice varieties of Binadhan-5 and Binadhan-7 produced remarkably higher grain yield. For boro season farmers’ preferred Binadhan-5 for its higher yields and easy to thresh which help getting more straw. For Transplanted aman season, Binadhan-7 was highly preferable by the farmers for its higher yield, short crop duration and fine grain. Rabi crop especially mustard can be easily cultivated after harvesting Binadhan-7 without yield sacrifice. BINA developed mustard variety, Binasarisha-4 also produced remarkably higher yield than the local cultivar. An extra rabi crop could easily be cultivated adopting Binadhan-7 in aman season having higher yield of aman rice. A cropping pattern of “Binadhan-7-Binasarisha-4-Boro rice” has demonstrated very suitable and highly profitable in Porangonj of sadar upazila and this pattern are adopting extensively by the farmers. These BINA varieties following above cropping pattern are disseminating spontaneously among the farmers in other villages as well.
COMILLA SUB-STATION
Block demonstration with different BINA developed crop varieties around Comilla Sub-station
During 2011-12, 14 Block Demonstrations were conducted with BINA developed 03 crop varieties at Rasulpur and Palpara villages under Sadar upazila of Comilla district. Results of demonstrations are presented in Table 18. Table 18. Performance of BINA varieties in some areas of sadar upazila, Comilla district during 2011-12
Crops/Varieties Total no. of demonstrations Duration (days) Yield (t ha-1) Rice: Binadhan-5 3 155 6.13 Binadhan-7 5 118 4.55 Total 8 Oilseeds: Binasarisha-4 6 87 1.46 Grand Total 14
311
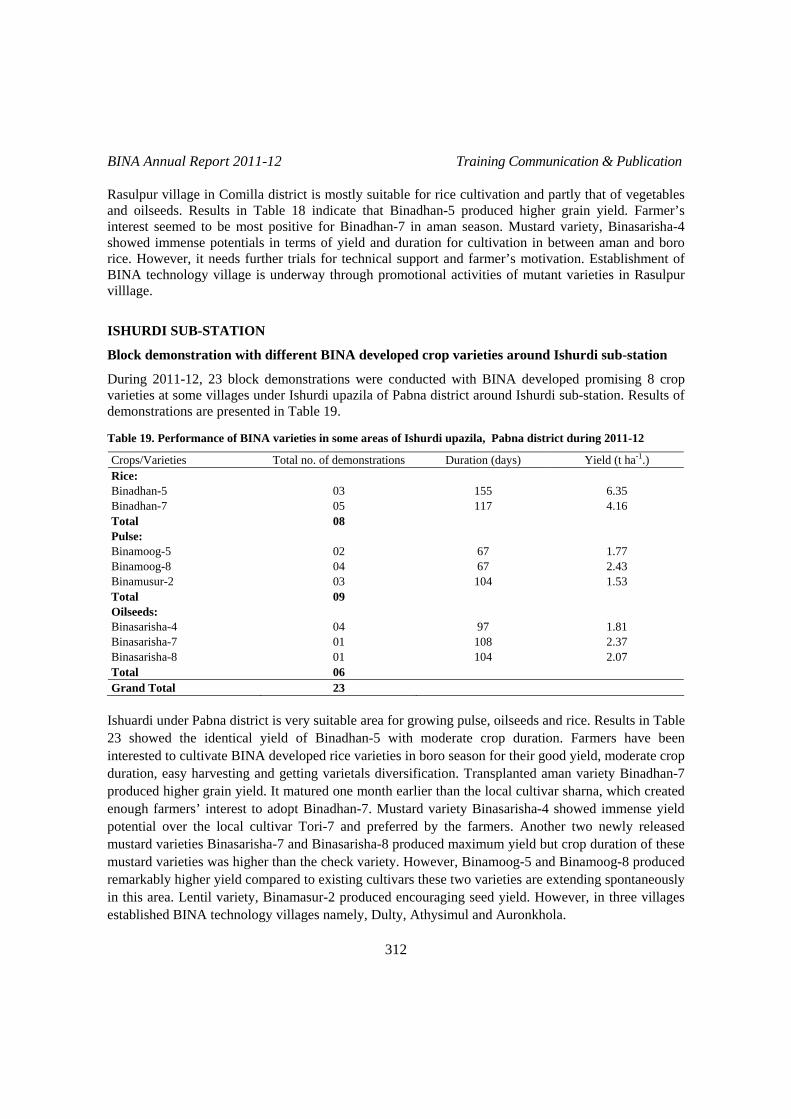
BINA Annual Report 2011-12 Training Communication & Publication Rasulpur village in Comilla district is mostly suitable for rice cultivation and partly that of vegetables and oilseeds. Results in Table 18 indicate that Binadhan-5 produced higher grain yield. Farmer’s interest seemed to be most positive for Binadhan-7 in aman season. Mustard variety, Binasarisha-4 showed immense potentials in terms of yield and duration for cultivation in between aman and boro rice. However, it needs further trials for technical support and farmer’s motivation. Establishment of BINA technology village is underway through promotional activities of mutant varieties in Rasulpur villlage.
ISHURDI SUB-STATION
Block demonstration with different BINA developed crop varieties around Ishurdi sub-station
During 2011-12, 23 block demonstrations were conducted with BINA developed promising 8 crop varieties at some villages under Ishurdi upazila of Pabna district around Ishurdi sub-station. Results of demonstrations are presented in Table 19. Table 19. Performance of BINA varieties in some areas of Ishurdi upazila, Pabna district during 2011-12
Crops/Varieties Total no. of demonstrations Duration (days) Yield (t ha-1.) Rice: Binadhan-5 03 155 6.35 Binadhan-7 05 117 4.16 Total 08 Pulse: Binamoog-5 02 67 1.77 Binamoog-8 04 67 2.43 Binamusur-2 03 104 1.53 Total 09 Oilseeds: Binasarisha-4 04 97 1.81 Binasarisha-7 01 108 2.37 Binasarisha-8 01 104 2.07 Total 06 Grand Total 23
Ishuardi under Pabna district is very suitable area for growing pulse, oilseeds and rice. Results in Table 23 showed the identical yield of Binadhan-5 with moderate crop duration. Farmers have been interested to cultivate BINA developed rice varieties in boro season for their good yield, moderate crop duration, easy harvesting and getting varietals diversification. Transplanted aman variety Binadhan-7 produced higher grain yield. It matured one month earlier than the local cultivar sharna, which created enough farmers’ interest to adopt Binadhan-7. Mustard variety Binasarisha-4 showed immense yield potential over the local cultivar Tori-7 and preferred by the farmers. Another two newly released mustard varieties Binasarisha-7 and Binasarisha-8 produced maximum yield but crop duration of these mustard varieties was higher than the check variety. However, Binamoog-5 and Binamoog-8 produced remarkably higher yield compared to existing cultivars these two varieties are extending spontaneously in this area. Lentil variety, Binamasur-2 produced encouraging seed yield. However, in three villages established BINA technology villages namely, Dulty, Athysimul and Auronkhola.
312
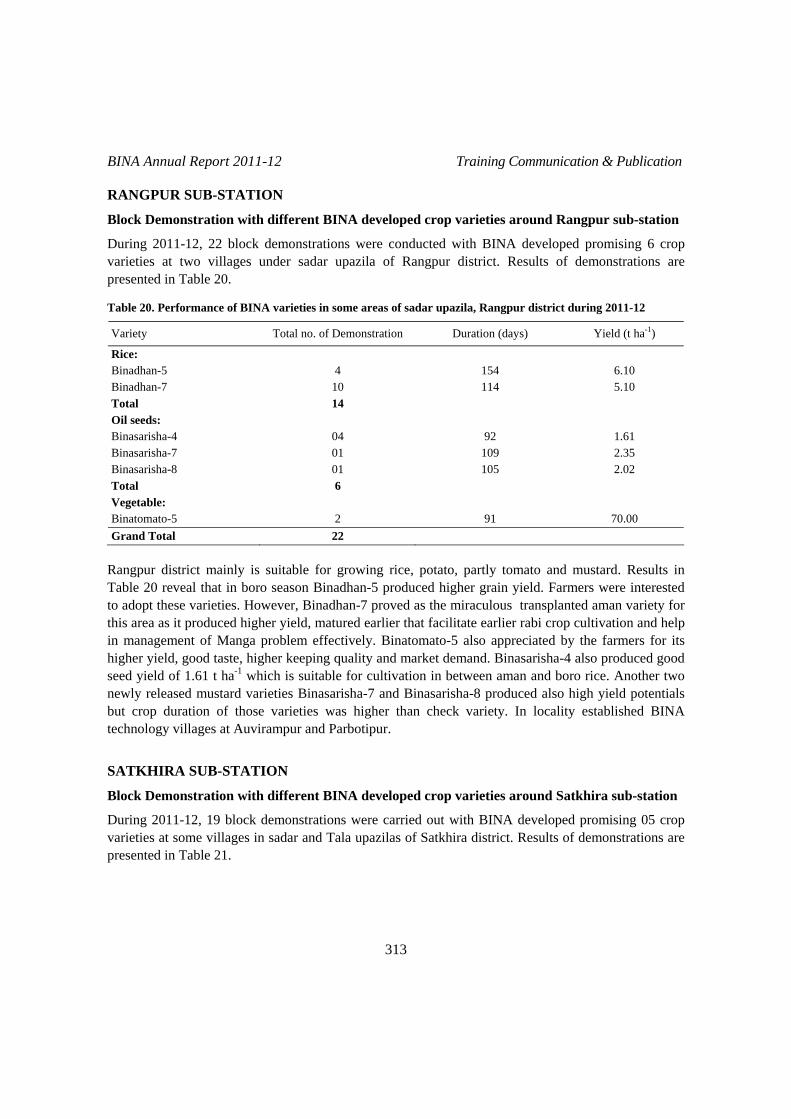
BINA Annual Report 2011-12 Training Communication & Publication RANGPUR SUB-STATION
Block Demonstration with different BINA developed crop varieties around Rangpur sub-station
During 2011-12, 22 block demonstrations were conducted with BINA developed promising 6 crop varieties at two villages under sadar upazila of Rangpur district. Results of demonstrations are presented in Table 20. Table 20. Performance of BINA varieties in some areas of sadar upazila, Rangpur district during 2011-12
Variety Total no. of Demonstration Duration (days) Yield (t ha-1)
Rice: Binadhan-5 4 154 6.10 Binadhan-7 10 114 5.10 Total 14 Oil seeds: Binasarisha-4 04 92 1.61 Binasarisha-7 01 109 2.35 Binasarisha-8 01 105 2.02 Total 6 Vegetable: Binatomato-5 2 91 70.00 Grand Total 22
Rangpur district mainly is suitable for growing rice, potato, partly tomato and mustard. Results in Table 20 reveal that in boro season Binadhan-5 produced higher grain yield. Farmers were interested to adopt these varieties. However, Binadhan-7 proved as the miraculous transplanted aman variety for this area as it produced higher yield, matured earlier that facilitate earlier rabi crop cultivation and help in management of Manga problem effectively. Binatomato-5 also appreciated by the farmers for its higher yield, good taste, higher keeping quality and market demand. Binasarisha-4 also produced good seed yield of 1.61 t ha-1 which is suitable for cultivation in between aman and boro rice. Another two newly released mustard varieties Binasarisha-7 and Binasarisha-8 produced also high yield potentials but crop duration of those varieties was higher than check variety. In locality established BINA technology villages at Auvirampur and Parbotipur.
SATKHIRA SUB-STATION
Block Demonstration with different BINA developed crop varieties around Satkhira sub-station
During 2011-12, 19 block demonstrations were carried out with BINA developed promising 05 crop varieties at some villages in sadar and Tala upazilas of Satkhira district. Results of demonstrations are presented in Table 21.
313
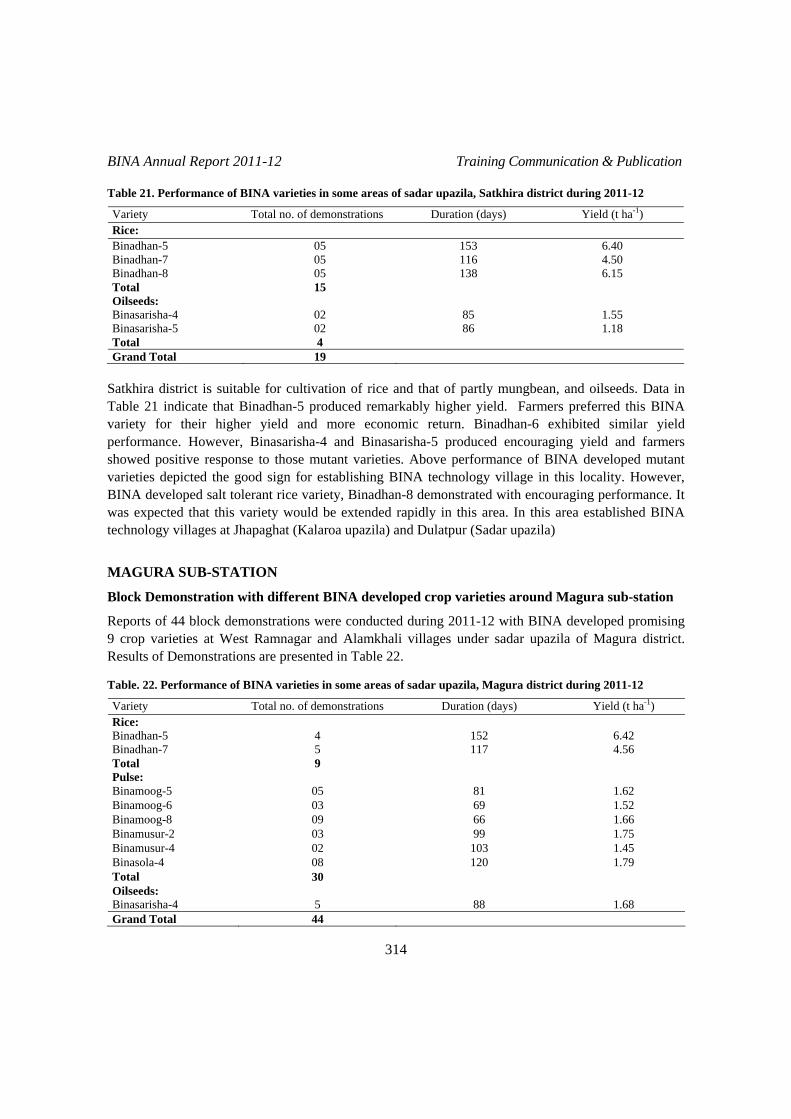
BINA Annual Report 2011-12 Training Communication & Publication Table 21. Performance of BINA varieties in some areas of sadar upazila, Satkhira district during 2011-12
Variety Total no. of demonstrations Duration (days) Yield (t ha-1) Rice: Binadhan-5 05 153 6.40 Binadhan-7 05 116 4.50 Binadhan-8 05 138 6.15 Total 15 Oilseeds: Binasarisha-4 02 85 1.55 Binasarisha-5 02 86 1.18 Total 4 Grand Total 19
Satkhira district is suitable for cultivation of rice and that of partly mungbean, and oilseeds. Data in Table 21 indicate that Binadhan-5 produced remarkably higher yield. Farmers preferred this BINA variety for their higher yield and more economic return. Binadhan-6 exhibited similar yield performance. However, Binasarisha-4 and Binasarisha-5 produced encouraging yield and farmers showed positive response to those mutant varieties. Above performance of BINA developed mutant varieties depicted the good sign for establishing BINA technology village in this locality. However, BINA developed salt tolerant rice variety, Binadhan-8 demonstrated with encouraging performance. It was expected that this variety would be extended rapidly in this area. In this area established BINA technology villages at Jhapaghat (Kalaroa upazila) and Dulatpur (Sadar upazila)
MAGURA SUB-STATION
Block Demonstration with different BINA developed crop varieties around Magura sub-station
Reports of 44 block demonstrations were conducted during 2011-12 with BINA developed promising 9 crop varieties at West Ramnagar and Alamkhali villages under sadar upazila of Magura district. Results of Demonstrations are presented in Table 22. Table. 22. Performance of BINA varieties in some areas of sadar upazila, Magura district during 2011-12
Variety Total no. of demonstrations Duration (days) Yield (t ha-1) Rice: Binadhan-5 4 152 6.42 Binadhan-7 5 117 4.56 Total 9 Pulse: Binamoog-5 05 81 1.62 Binamoog-6 03 69 1.52 Binamoog-8 09 66 1.66 Binamusur-2 03 99 1.75 Binamusur-4 02 103 1.45 Binasola-4 08 120 1.79 Total 30 Oilseeds: Binasarisha-4 5 88 1.68 Grand Total 44
314

BINA Annual Report 2011-12 Training Communication & Publication Magura district is suitable for growing almost all the crops. Some of the promising BINA developed pulses, oilseeds and rice varieties are demonstrating good yield and other better attributes. In this location demonstrations were conducted with 9 BINA varieties. Demonstrated varieties were Binasarisha-4, Binamoog-5, Binamoog-6, Binamoog-8, Binamasur-2, Binamasur-4, Binasola-4, Binadhan-5 and Binadhan-7 which produced remarkably higher yield. Farmers preferred all of the above BINA varieties and diffusing spontaneously among the farming community. However, established BINA technology villages at West Ram Nagar. Khalimpur, Ishakhada and Alamkhali. Progress in BINA technology Village establishment
Sl. No. Location Working village Establishment Status Most suitable BINA variety
Sutiakhali Poranganj Established BINA Technology village.
Binadhan-5, Binadhan-7 and Binasarisha-4
1. Mymensingh sadar
Khagdahar Underway do West Ramnagar, Khalimpur, Echakhada, Alamkhali
Established BINA Technology village.
Binamoog-5, Binamoog-6, Binamoog-8, Iratom-24, Binadhan-5, Binadhan-7, Binamasur-2, Binamasur-5, Binasola-4, Binasarisha-4, Binasarisha-7 and Binasarisha-8
2. Magura
Shidhrampur Underway do Dulti Aurankhola Athaishimul
Established BINA Technology village.
Binadhan-7, Binamasur-2, Binamoog-5, Binamoog-6, Binamoog-7, Binamoog-8, Binasarisha-4, 7, 8 and Binadhan-5
3. Ishurdi
Kalikapur Underway do Auviram, Parbotipur Established BINA
Technology village. Binadhan-5, Binadhan-7 and Binasarisha-4, Binasarisha-7 and Binasarisha-8,
4. Rangpur
Najirarhat Underway do 5. Jhapaghat in Kolaroa,
Daulatpur Established BINA Technology village.
Binadhan-8, Binadhan-7, Binamasur-2 and Binamoog-7,8
Satkhira
Brahmorajpur Shenergati in Tala
Underway Binadhan-8, Binasarisha-7 and 8
Palpara Underway Binasarisha-7, Binadhan-5 and Binadhan-7.
6. Comilla
Rasulpur do Binadhan-5, Binadhan-7 and Binasarisha-4.
Training of scientists, farmers, extension personnel and workers
Under this project manpower development and technology transfer activities are usually done through nomination of BINA personnel for participation in different national and overseas training programme, arranging training and workshops for extension personnel, farmers and field days. Training related functions which were done during this period were as follows:
315

BINA Annual Report 2011-12 Training Communication & Publication Manpower Development
Necessary arrangements were made to nominate 42 BINA personnel for participation in different in-country training courses/workshop/seminar organized by other national organizations. All process was also made to nominate 15 BINA personnel for participation in foreign training/workshop/seminar. Necessary arrangements were made for nomination of 7 BINA stuff for in country Training. Details of the nomination activities regarding national and overseas training courses are presented in Table 27, Table 28 and Table 29. Table 27. Arrangement of nomination of BINA personnel for foreign training course/workshop/seminar during
2011-12
Sl. no. Title of training/workshop Trainee Duration Venue
01. Ph.D Course Md. Harun-or-Rashid SO
01-03-2011 to 01-02-2013
Germany
02. Post Doctoral Fellowship Dr. Md. Abdul Malek PSO
13-06-2011 to 12-06-2012
Malaysia
03. Training Dr. Md. Manjorul Alam Mondol SSO
4-8 July 2011 Malaysia
04. Impact Assessment of Agricultural Research
Dr. M. Raisul Haider PSO
10-17 August 2011
Phillippine
05. Using climate scenarios and analogues for designing adaptation strategies in agriculture
Dr. Md. Asgar Ali Sarker CSO
19-23 September 2011
Nepal
06. Seminar on Hybrid rice for Bangladesh
Dr. Md. Monowar Karim Khan CSO
16 November to 05 Dec., 2011
China
07. Seminar on Hybrid rice for Bangladesh
Dr. Mirza Mofazzal Islam PSO
16 November to 05 Dec., 2011
China
08. Seminar on Hybrid rice for Bangladesh
Dr. Md. Rafiqual Islam SSO
16 November to 05 Dec., 2011
China
09. RC First Technical Meeting
Dr. M. A. Salam Director (Research)
12-16 Dec., 2011 Vienna, Austria
10. Scientific visit
Dr. Md. Asgar Ali Sarker CSO
16-25 December 2011
China
11. Society for the advanced of breeding research in Asia ... (SABRAO)
Dr. Mirza Mofazzal Islam PSO
13-17 January 2012
Thailand
12. Society for the advanced of breeding research in Asia ... (SABRAO)
Dr. Shamsun Nahar Begum SSO
13-17 January 2012
Thailand
13. Study Visit Dr. Reza Mohammad Emon SO
01 March to 30 April, 2012
China
14. Ph. D Course Md. Mahmudul Hasan SO
15-03-2012 to 30-09-2015
Malaysia
15. Post Doctoral Fellowship Dr. Md. Monjurul Alam Mandol SSO
01-05-2012 to 30-04-2013
University of Petra, Malaysia
316

BINA Annual Report 2011-12 Training Communication & Publication Table 28. Arrangement made for nomination of BINA personnel for in-country training curse/workshop/
seminar during 2011-12
Sl. no. Title of training/workshop/seminar Trainee Duration Venue
01. Adobe Illustrator and Adobe Photoshop software
Md. Sakawat Hossain Asst. Liberian
01-08-11 to 30-11-2011
Bhuiyan ComputerMymensingh
02. Research Methodology Dr. Md. Rafiqul Islam SSO
10-9-11 to 21-10-11
GTI
03. Research Methodology Md. Nurun Nobi Mazumder SO
10-9-11 to 21-10-11
GTI
04. Research Methodology Md. Faruk Hossain SO
10-9-11 to 21-10-11
GTI
05. Research Methodology Md. Md. Habibur Rahman SO
10-9-11 to 21-10-11
GTI
06. Research Methodology Khandaker Shamsul Arefin SSO
10-9-11 to 21-10-11
GTI
07. Water security and climate change Dr. Md. Tariqul Islam PSO
20-22 Sept. 2011 Dhaka
08. Food security and climate change Dr. Md. Monowar Karim Khan CSO (cc)
20-22 Sept. 2011 Dhaka
09. Research Methodology Md. Asadullah SO
22 Sept. to 06 Oct. 2011
GTI
10. Research Methodology Krishna Rani Das SO
08-20 Oct. 2011
GTI
11. Biotechnology food security and economic development
Dr. Md. Monowar Karim Khan CSO (cc)
30-31 Oct. 2011
BARI
12. Biotechnology food security and economic development
Dr. Mirza Mofazzal Islam PSO
30-31 Oct. 2011
BARI
13. Biotechnology food security and economic development
Dr. Samsun Nahar Begum SSO
30-31 Oct. 2011
BARI
14. Biotechnology food security and economic development
Dr. Md. Imtiaz Uddin SSO
30-31 Oct. 2011
BARI
15. Biotechnology food security and economic development
Dr. Reaz Mohammad Emon SO
30-31 Oct. 2011
BARI
16. Conduct and Discipline course Kazi Rafiqul Alam PS (AO), DG s Office
13-24 Nov. 2011 Dhaka
17. Excutive Management Seminar on Industrial Application of Gamma Radiation Bangladesh
Dr. Shariful Haque Bhuiyan, PSO Khondokar Shamsul Arafin SSO
11 Dec. 2011 Dhaka
18. Food Safety and phytosanitary measures
Dr. Hosna Ara Begum PSO
13-14 Dec. 2011 Dhaka
19. Post harvest management of fruits & vegetables
Dr. A F M Saiful Islam PSO
25-26 Jan. 2012 Dhaka
20. Organic pollutants in food agricultural products and environment
Dr. Md. Jahangir Alam PSO
17-18 Jan. 2012 Dhaka University
21. Organic pollutants in food agricultural products and environment
Dr. Md. Eqramul Haque PSO
17-18 Jan. 2012 Dhaka University
22. Organic pollutants in food agricultural products and environment
Dr. Md. Azizul Haque SSO
17-18 Jan. 2012 Dhaka University
317

BINA Annual Report 2011-12 Training Communication & Publication
Table 28 Contd. Sl. No. Title of training/workshop/seminar Trainee Duration Venue
23. Training Course Mohammad Maruf Hossain SO
5 Feb to 5 June, 2012
Comilla
24. Training Course Md Habibur Rahman SO
5 Feb to 5 June, 2012
Comilla
25. Information Md. Faruque Hossain
12-16 Feb. 12 Dhaka
26. Sustainable alternative agriculture Dr. Md. Monowar Karim Khan CSO (cc)
5 March 2012 Dhaka
27. National workshop on research achievement of past ten years of pules & oilseeds and their future research straties to sustain crop production and food security
Dr. Md. Raisul Haider PSO
20-21 March 2012 Dhaka
28. Crop production technologies under environmental strees condition fort NARS
Md. Siddiqur Rahman SSO
11-15 March Dhaka
29. Identification of major diseases and insect pests of important crops and their management for NARS scientists
Dr. Md. Abul Kashem SSO
4-8 March 2012 Gazipur
30. Data Management and Report writing
Dr. Md Monjurul Islam SSO
1-5 April 2012 Dhaka
31. Data Management and Report writing
Dr. Md Siddiqur Rahman SSO
8-12 April 2012 Dhaka
32. Project Development & Management Dr. Snigdha Roy SSO
8-12 April 2012 Dhaka
33. Regional workshops 11-12 on outreach & information dissemination
Dr. Rafiqul Islam SSO
8 May 2012 Chittagong
34. Regional workshops 11-12 on outreach & information dissemination
Dr. Rafiqul Islam SSO
10 May 2012 Comilla
35. Seed quality management Md. Ferdous Iqbal SO
21-23 May 2012 Dhaka
36. Regional workshops 11-12 on outreach & Information Dissemination
Dr. Md. Asgar Ali Sarker CSO
28 May 2012 Rangpur
37. Regional workshops 11-12 on outreach & information dissemination
Dr. Md. Raisul Haider PSO
20 May 2012 Mymensingh
38. Plant Breeding & Plant Genetic training course
Dr. Reza Mohammed Emon SO
3-16 June 2012 Gazipur
39. Plant Breeding & Plant Genetic training course
Mohammed Ferdous Iqbal SO
3-16 June 2012 Gazipur
40. Review workshop on plant protection
Dr. Hosna Ara Begum PSO
13-14 June 2012 Dhaka
41. Review workshop on crop improvement programme
Dr. M A Samad PSO
11-12 June 2012 Dhaka
318

BINA Annual Report 2011-12 Training Communication & Publication Table 29. Arrangement made for in country training of BINA stuff during 2011-12
SL. No. Title of training/workshop/seminar Trainee Duration Venue
1. Staff development course Md. Sahadul Islam MLSS
07-11 August 2011
RPATC Dhaka
2. Computer literacy and english language course
Md. Nasirul Haque Sharif Office Assistant-Cum-Computer Operator
09-27 October 2011
RPATC Dhaka
3. Conduct and discipline course Nilofa Begum MLSS
20-24 November 2011
RPATC Dhaka
4. Staff development course Md. Mojibor Rahman Bhoian Head Assistant
13-24 November 2011
RPATC Dhaka
5. Computer literacy and english language course
Md. Sarwar Hossain Mollah UDA
04-22 December 2011
RPATC Dhaka
6. Computer literacy and english language course
Md. Altab Masud Office Assistant-Cum-Computer Operator
04-22 March 2012
RPATC Dhaka
7. Basic office management course
Ratan Kumar Talukder Office Assistant-Cum-Computer Operator
01-26 March 2012
RPATC Dhaka
Training on the use of BINA developed technologies
In order to technology promotion 5 training courses were organized during the period of 2011-12. A total of 170 female and male farmers including some Sub-assistant Agriculture Officers were trained on cultivation of BINA developed improved crop varieties. Details of the training programme are presented in Table 25. Table 25. Farmers training on the use of BINA developed technologies during 2011-12
SL. No. Topic Place of
training Date of training
No. of participants
Source of fund
1. Farmers training on “Cultivation & seed preservation method of BINA developed high yielding salt tolerant rice, Binadhan-8”
Bashkhali, Chittagoan
01-02-2012 50
IRRI, Bangladesh
2. Sub-assistant Agriculture Officer(SAAO) training on “Cultivation & seed preservation method of BINA developed high yielding salt tolerant rice, Binadhan-8”
Bashkhali, Chittagoan
02-02-2012 40
IRRI, Bangladesh
3. Farmers training on “Demonastration set up, cultivation metod and management of sesame and mustard”
Baghar para, Jessore
16-03-2012 25 YMMSP
4. Farmers training on “Demonastration set up, cultivation method and management of sesame and mustard”
Madhukhali, Faridpur
17-03-2012 25 YMMSP
5. Farmers training on “Demonastration set up, cultivation method and management of Binachinabadam-4”
Kaliganj, Lalmonirhut
29-02-2012 30 SRSD Project
319

BINA Annual Report 2011-12 Training Communication & Publication Field Day
In order to motivate the farmers to adopt BINA developed varieties/technologies, 23 field days/on-farm farmer’s training on different crop varieties was organized across the country. Details of the field day activities are presented in Table 27. Table 27. Field days arranged in the farmers fields on different crop varieties during 2010-11
Sl. No. Crop Variety Locations Participants Remarks 1. Binadhan-8 Shamnagar, Satkhira 650 Farmers were
deeply impressed Binadhan-8 Sadar, Satkhira 200 Do
2. Binadhan-8 Dagonbhuiya, Feni 200 Do 3. Binadhan-8 Bashkhali, Chittagoan 200 Do 4. Binadhan-8 Bashkhali, Chittagoan 200 Do Binadhan-8 Bashkhali, Chittagoan 200 Do
5.
Rice
Binadhan-8 Chokoria, Cox`s bazar 200 Do 6. Sadar, Barisal 200 Do 7. Sadar, Rangpur 200 Do 8. Sadar, Magura 200 Do 9.
Participatory Variety Selection (PVS) on rice for short duration mutant line
Sadar, Mymensingh 200 Do 10. Mustard Binasarisha-4 Sadar, Mymensingh 200 Do 11. Do Binasarisha-7 Sadar, Rangpur 200 Do 12. Do Binasarisha-7 Ishurdi, Pabna 200 Do 13. Do Binamasur-4 Sadar, Magura 200 Do 14. Do Binasola-5 Sadar, Magura 200 Do 15. Sunflower Sadar, Satkhira 200 Do 16 Mustard Binasarisha-4 Aditmari, Lalmonirhat 200 DO 17 Sesame Binatil-1 and Binatil-2 Madhukhali, Faridpur 200 Do 18 Sesame Binatil-1 and Binatil-2 Baghar para, Jessore 200 Do 19 Sesame Binatil-1 and Binatil-2 Alamdanga, Chuadanga 200 Do 20 Mungbean Binamoog-5 Ishwardi, Pabna 200 Do 21 Groundnut Binachinabadam-4 Sadar, Natore 200 Do 22 Groundnut Binachinabadam-4 Sharsha, Jessore 200 DO 23 Groundnut Binachinabadam-4 Kaligonj, Lalmonirhat 200 Do
Publications and photographic enrichment
For technology transfer through printed media, publications were made on 6 types of leaflets total in 30,000 copies during this period. Besides these, three programmes were telecast to popularize some BINA crop varieties. Details of the publication activities are presented in Table 28.
320
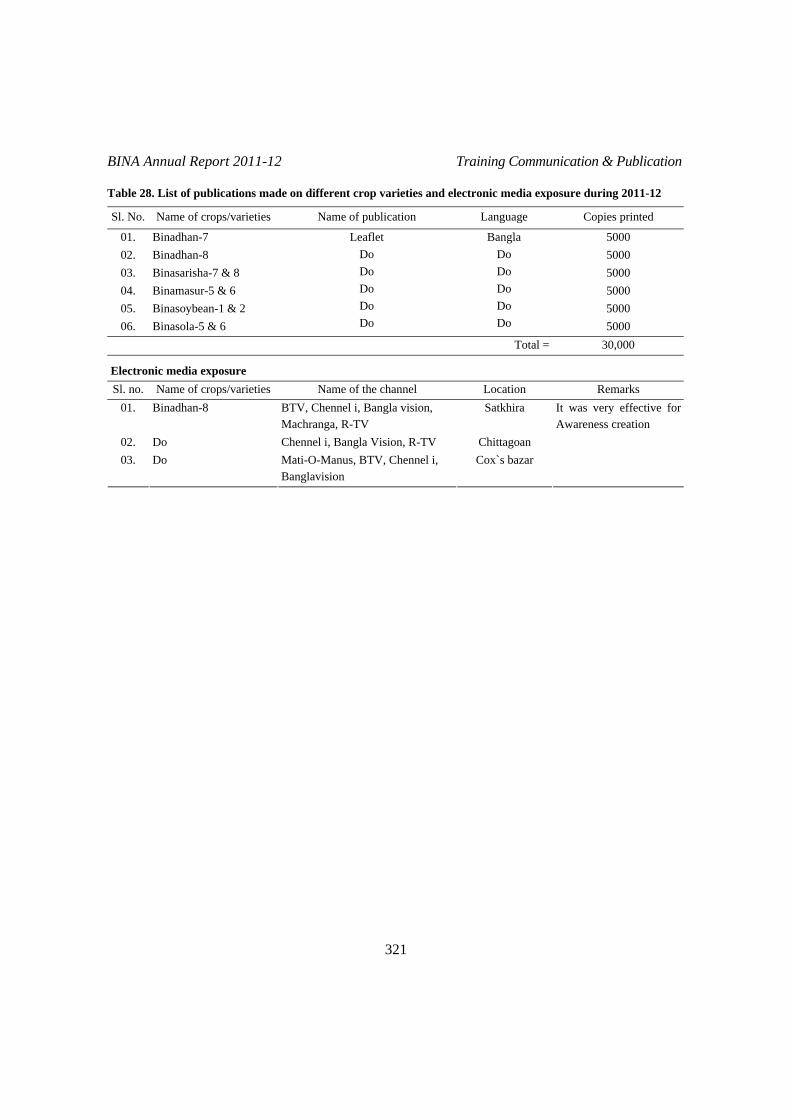
BINA Annual Report 2011-12 Training Communication & Publication Table 28. List of publications made on different crop varieties and electronic media exposure during 2011-12
Sl. No. Name of crops/varieties Name of publication Language Copies printed
01. Binadhan-7 5000 02. Binadhan-8 5000 03. Binasarisha-7 & 8 5000 04. Binamasur-5 & 6 5000 05. Binasoybean-1 & 2 5000 06. Binasola-5 & 6
Leaflet Do Do Do Do Do
Bangla Do Do Do Do Do 5000
Total = 30,000
Electronic media exposure Sl. no. Name of crops/varieties Name of the channel Location Remarks
01. Binadhan-8 BTV, Chennel i, Bangla vision, Machranga, R-TV
Satkhira
02. Do Chennel i, Bangla Vision, R-TV Chittagoan 03. Do Mati-O-Manus, BTV, Chennel i,
Banglavision Cox`s bazar
It was very effective for Awareness creation
321

BINA Annual Report 2011-12 Training Communication & Publication
322

BIOTECHNOLOGY DIVISION

BINA Annual Report 2011-12 Biotechnology
324

BINA Annual Report 2011-12 Biotechnology
RESEARCH HIGHLIGHTS
Three rice genotypes including PBRC-37 (Binadhan-10) were identified as salt tolerant with regard to RM 10772, RM 296 and RM 10701 markers. In Binadhan-7 × FL-378, out of 32 BC1F1, 5 lines (BC1F1-30, BC1F1-40, BC1F1-2, BC1F1-16 and BC1F1-34) were identified as introgressed salt tolerant rice lines when RM585 and RM296 markers were used and lines BC1F1-1 and BC1F1-3 were identified as introgressed salt tolerant rice lines by useing 3 primers (RM585, RM296 and OSR30). Foreground selection of Binadhan-7× FL-478 was performed and 32 BC1F1 population were selected with tightly linked salt tolerant markers RM585, RM10720 and RM310. Out of 32 BC1F1 populations, the marker RM585 identified 20 lines as salt tolerant, RM10720 identified 16 lines as salt tolerant and the marker RM310 identified 17 lines as salt tolerant. Two salt tolerant rice genotypes (FL-378 & FL-478) were selected as parent for transferring salt tolerant genes to high yielding rice varieties Binadhan-5 and Binadhan-7. A total of 454 F1 seeds were developed from this aman season 2011. For MAS, 800 BC1F1 populations were collected for genotyping. Morpho-molecular characterization of 22 lentil genotypes, RAPD markers viz. OPC-05, OPB-08 and OPB-10 showed good resolution and sufficient variations among the genotypes. Three primers produced polymorphic bands in 24 polymorphic loci. OPC-05 produced maximum polymorphic bands in 100-850 bp compare to OPB-08 and OPB-10. The proposed salt tolerant genotype, PBRC-37 exhibited 10 days earlier and higher yield (6.0 t ha-1) (20%) than Binadhan-8 under 10-12 dS/m. This genotype has been applied to SCA for variety release. Note: PBRC-37 has already been released as Binadhan-10 on September 2012. Line OMCS-2007 showed the earliest maturity (105 and 144 days in aman and boro, respectively), and higher yield among the tested entries. Ciherang- sub1 and Samba Mahsuri-sub1 have been selected for submergence tolerant under 25 days of complete submergence and possess higher yield (4.2 and 3.4 t ha-1) and early mature (110 and 120 days). SCA Team evaluated and reported to Technical Committee of NSB. Application has been made to SCA for variety release. NERICA-1, NERICA-4 and NERICA-10 were irradiated with γ-rays and selected 111 M5 generation which are being tested in drought and saline prone areas.
325

BINA Annual Report 2011-12 Biotechnology
Development of salt tolerant rice varieties using induced mutation and biotechnological approaches
Screening of salt tolerant rice genotypes at the seedling stage using phenotypic and micro satellite markers
Twenty seven rice germplasms (Table 1) were used to evaluate salinity tolerance at the seedling stage and to identify salt tolerant rice lines using SSR markers. Salinity screening was done at the seedling stage using hydroponic system in glasshouse following IRRI standard protocol. Based on 1-9 scale SES, 4 tolerant, 8 moderately tolerant and 15 susceptible rice genotypes were identified. These genotypes along with their check varieties (Binadhan-7 and Binadhan-8) were used with SSR markers for the identification of salt tolerant rice genotypes. Polymorphism survey was done with 8 SSR markers. Out of 8 markers, 3 polymorphic SSR markers viz., RM 10772, RM 296 and RM 10701 were selected to evaluate salt tolerant genotypes. Table 1. Performance of the rice genotypes under salinized condition (EC 12 dS/m) grown in hydroponic system
at the seedling stage
Genotypes SES Scoring Tolerance Set 37 L-22 Set 37 L- 41 Set 37 L-29 PBRC-37 Binadhan-8 (Check)
3
T
Set 37 L-15 Set 37 L-16 Set 39 L-8 Set 39 L-33 PBRC-4 PBRC-30 PBSAL 730
5 MT
Set 10 SL-2 Set 10 SL-10 Set 10 SL-15 Set 37 L-23 Set 37 L-36 Set 39 L-1 Set 39 L-3 Set 39 L-10 Set 39 L-13 Set 39 L-22 Set 39 L-25 Set 39 L-28 Set 39 L-29 PBRC-5 Binadhan-7 (Check)
7 S
T = tolerant, MT = Moderately Tolerant, S = susceptible. 1-9 scale, where 1 = highly tolerant and 9 = highly susceptible
326

BINA Annual Report 2011-12 Biotechnology
The marker RM 10772 identified 8 genotypes as salt tolerant, 3 genotypes as moderately tolerant and 16 genotypes as susceptible (Fig. 1). Marker RM 296 identified 7 genotypes as tolerant, 3 genotypes as moderately tolerant and 17 genotypes as susceptible in comparison with Binadhan-7 and Binadhan-8 (Fig. 2). Whereas marker RM 10701 was identified 7 genotypes as tolerant, 3 genotypes as moderately tolerant and rest of 17 genotypes as susceptible (Fig. 3). SET 37 L-29, SET 37 L-41 and PBRC-37 were identified as tolerant in comparison with Binadhan-8 (salt tolerant) when RM 10772, RM 296 and RM 10701 markers were used.
20 b
p B
inad
han
7
Bin
ahan
8
Set 1
0 SL
(10)
Se
t 37
L-1
Se
t 37
L-1
5 Se
t 37
L-2
2 Se
t 39
L-4
1 Se
t 39
L-2
2 Se
t 39
L-2
8 Se
t 39
L-3
Se
t 37
L-1
6 Se
t 39
L-3
3 Se
t 39
L-2
9 Se
t 39
L-1
3 Se
t 39
L-8
Se
t 10
SL (1
5)
Set 3
9 L
-25
Set 1
0 SL
(2)
PBR
C-3
0 PB
RC
-37
PBSA
L 7
30
Set 3
7 L
-23
Set 3
9 L
-10
Set 3
7 L
-29
Set 3
7 L
-36
PBR
C-4
PB
RC
-5
20 b
p
―160 ―100
―20
20 b
p B
inad
han
7
Bin
ahan
8
Set 1
0 SL
(10)
Se
t 37
L-1
Se
t 37
L-1
5 Se
t 37
L-2
2 Se
t 39
L-4
1 Se
t 39
L-2
2 Se
t 39
L-2
8 Se
t 39
L-3
Se
t 37
L-1
6 Se
t 39
L-3
3 Se
t 39
L-2
9 Se
t 39
L-1
3 Se
t 39
L-8
Se
t 10
SL (1
5)
Set 3
9 L
-25
Set 1
0 SL
(2)
PBR
C-3
0 PB
RC
-37
PBSA
L 7
30
Set 3
7 L
-23
Set 3
9 L
-10
Set 3
7 L
-29
Set 3
7 L
-36
PBR
C-4
PB
RC
-5
20 b
p
―160 ―100 ―20
Fig. 1. RM10772 marker showing banding pattern of 27 rice genotypes
327

BINA Annual Report 2011-12 Biotechnology
20 b
p B
inad
han
7
Bin
ahan
8
Set 1
0 SL
(10)
Se
t 37
L-1
Se
t 37
L-1
5 Se
t 37
L-2
2 Se
t 39
L-4
1 Se
t 39
L-2
2 Se
t 39
L-2
8 Se
t 39
L-3
Se
t 37
L-1
6 Se
t 39
L-3
3 Se
t 39
L-2
9 Se
t 39
L-1
3 Se
t 39
L-8
Se
t 10
SL (1
5)
Set 3
9 L
-25
Set 1
0 SL
(2)
PBR
C-3
0 PB
RC
-37
PBSA
L 7
30
Set 3
7 L
-23
Set 3
9 L
-10
Set 3
7 L
-29
Set 3
7 L
-36
PBR
C-4
PB
RC
-5
20 b
p
―160 ―100 ―20
Fig. 3. RM10701 marker showing banding pattern of 27 rice genotypes
Identification of introgressed rice lines of Binadhan-7 × FL-378 under salt stress via SSR markers
Salt tolerant genotype, FL-378 was crossed with high yielding variety, Binadhan-7. Seeds of BC1F1 population of Binadhan-7/FL-378 was derived from backcross population of F1 (Binadhan-7/FL-378). Thirty two rice lines of BC1F1 population (Binadhan-7/FL-378) were used to identify introgressed rice lines for salt tolerance using SSR markers. Randomly selected 32 BC1F1 progenies along with their two parents (Binadhan-7, FL-378) were genotyped with microsatellite or SSR markers for identification of introgressed rice lines. Parental polymorphism survey was assayed by 8 SSR markers and three polymorphic SSR markers viz., RM296, RM585 and OSR30 were selected to evaluate BC1F1 rice lines for salt tolerance. In respect of primer RM585, 16 lines were found as introgressed salt tolerant and 16 lines were susceptible in comparison with salt tolerant parent FL-378 and salt susceptible parent Binadhan-7 (Fig. 4). Primer RM296 identified 13 introgressed salt tolerant and 19 susceptible lines (Fig. 5). Nine introgressed salt tolerant and 23 susceptible lines were identified when BC1F1 lines were evaluated with marker OSR30 (Fig. 6). Line BC1F1-30, BC1F1-40, BC1F1-2, BC1F1-16 and BC1F1-34 were identified as introgressed salt tolerant rice lines in comparison with parent FL-378 (salt tolerant) when RM585 and RM296 markers were used but line BC1F1-1 and BC1F1-3 were identified as salt tolerant lines in case of 3 primers (RM585, RM296 and OSR30). Again the lines BC1F1-5, BC1F1-24, BC1F1-26, BC1F1-27, BC1F1-29, BC1F1-31, BC1F1-37 and BC1F1-38 were found susceptible as compared with parent Binadhan-7 when marker RM585, RM296 and OSR30 were used. The average gene diversity over all SSR loci for the 32 BC1F1 rice lines along with two parents was 0.4614, ranging from 0.4152 to 0.4844. Positive correlations were found between the genetic diversity and the maximum number of repeats. The UPGMA cluster tree analysis led to the grouping of the 32 BC1F1 populations of Binadhan-7 × FL 378 along with their parents in two major cluster. 24 genotypes belonged to cluster 1 and these genotypes are separated from other 10 genotypes in cluster 2. (Fig. 7).
328

BINA Annual Report 2011-12 Biotechnology
Bin
adha
n-7
FL-3
78
BC
1F1-1
B
C1F
1-2
BC
1F1-3
B
C1F
1-5
BC
1F1-6
B
C1F
1-8
BC
1F1-9
B
C1F
1-10
BC
1F1-1
1 B
C1F
1-12
BC
1F1-1
3 B
C1F
1-16
BC
1F1-1
7 B
C1F
1-18
BC
1F1-1
9 B
C1F
1-21
BC
1F1-2
2 B
C1F
1-23
BC
1F1-2
4 B
C1F
1-25
BC
1F1-2
6 B
C1F
1-27
BC
1F1-2
9 B
C1F
1-30
BC
1F1-3
1 B
C1F
1-32
BC
1F1-3
4 B
C1F
1-35
BC
1F1-3
7 B
C1F
1-38
BC
1F1-3
9 B
C1F
1-40
―800 ―400
―200 ―100 10
0 bp
ladd
er
Fig. 4. RM585 marker showing a segment of rice genome from FL-378 (P1) into Binadhan-7 (P2)
Bin
adha
n-7
FL-3
78
BC
1F1-1
B
C1F
1-2
BC
1F1-3
B
C1F
1-5
BC
1F1-6
B
C1F
1-8
BC
1F1-9
B
C1F
1-10
BC
1F1-1
1 B
C1F
1-12
BC
1F1-1
3 B
C1F
1-16
BC
1F1-1
7 B
C1F
1-18
BC
1F1-1
9 B
C1F
1-21
BC
1F1-2
2 B
C1F
1-23
BC
1F1-2
4 B
C1F
1-25
BC
1F1-2
6 B
C1F
1-27
BC
1F1-2
9 B
C1F
1-30
BC
1F1-3
1 B
C1F
1-32
BC
1F1-3
4 B
C1F
1-35
BC
1F1-3
7 B
C1F
1-38
BC
1F1-3
9 B
C1F
1-40
―800
―400
―200 ―100 10
0 bp
ladd
er
Fig. 5. RM296 marker showing a segment of rice genome from FL-378 (P1) into Binadhan-7 (P2)
Bin
adha
n-7
FL-3
78
BC
1F1-1
B
C1F
1-2
BC
1F1-3
B
C1F
1-5
BC
1F1-6
B
C1F
1-8
BC
1F1-9
B
C1F
1-10
BC
1F1-1
1 B
C1F
1-12
BC
1F1-1
3 B
C1F
1-16
BC
1F1-1
7 B
C1F
1-18
BC
1F1-1
9 B
C1F
1-21
BC
1F1-2
2 B
C1F
1-23
BC
1F1-2
4 B
C1F
1-25
BC
1F1-2
6 B
C1F
1-27
BC
1F1-2
9 B
C1F
1-30
BC
1F1-3
1 B
C1F
1-32
BC
1F1-3
4 B
C1F
1-35
BC
1F1-3
7 B
C1F
1-38
BC
1F1-3
9 B
C1F
1-40
―800
―400
―200 ―100 10
0 bp
ladd
er
Fig 6. OSR30 marker showing a segment of rice genome from FL-378 (P1) into Binadhan-7 (P2)
329

BINA Annual Report 2011-12 Biotechnology
Fig. 7 Dendogram for 32 BC1F1 along with two parents derived from a UPGMA cluster analysis
330

BINA Annual Report 2011-12 Biotechnology
Development of BC2F1 population from Binadhan-7 × FL-478 using phenotypic and marker assisted selection
Salt tolerant rice genotype (FL-478) was selected as parent for transferring salt tolerant genes to high yielding with short duration rice variety genotype Binadahan-7. Phenotypic performance of BC1F1 population of Binadhan-7 × FL-478 along with their parents was determined from a pot experiment. Backcrossing programme was conducted during aman season in 2011, where Binadhan-7 was the recurrent parent and FL-478 was the non-recurrent donor line. In BC1F1 population, average plant height was 85.5 cm. The average total number of tillers plant-1 was 39. The average number of productive tillers plant-1, days to flowering and days to maturity were 34, 93 days and 125 days, respectively. BC1F1 population was backcrossed with the recurrent parent Binadhan-7 and produced 285 BC2F1 seeds. Foreground selection was performed and 32 BC1F1 populations were selected with tightly linked salt tolerant markers RM585, RM10720 and RM310. Out of 32 BC1F1 populations, the marker RM585 identified 20 lines as salt tolerant (Fig. 8), RM10720 identified 16 lines as tolerant (Fig. 9), and the marker RM310 identified 17 tolerant (Fig. 10). B
INA
7
FL 4
78
BC
1F1-1
B
C1F
1-3
BC
1F1-4
B
C1F
1-5
BC
1F1-7
B
C1F
1-8
BC
1F1-9
B
C1F
1-10
B
C1F
1-12
B
C1F
1-14
B
C1F
1-17
B
C1F
1-18
B
C1F
1-19
B
C1F
1-21
B
C1F
1-22
B
C1F
1-24
B
C1F
1-25
B
C1F
1-28
B
C1F
1-30
B
C1F
1-33
B
C1F
1-34
B
C1F
1-37
B
C1F
1-39
B
C1F
1-41
B
C1F
1-43
B
C1F
1-47
B
C1F
1-49
B
C1F
1-50
B
C1F
1-55
B
C1F
1-57
B
C1F
1-59
BC
1F1-6
0
100b
p L
10
0bp
L
―800
―400
―200 ―100
Fig. 8. RM585 marker showing a segment of rice genome from FL-478 (P1) into
331

BINA Annual Report 2011-12 Biotechnology
Fig. 9. RM10720 marker showing a segment of rice genome from FL-478 (P1) into Binadhan-7 (p2)
Fig. 10. RM310 marker showing a segment of rice genome from FL-478 (P1) into Binadhan-7 (P2)
A dendrogram was constructed based on the Nei’s genetic distance calculated from the 32 BC1F1 population of Binadhan-7 × FL 478 along with their parents. All the BC1F1 populations of Binadhan-7 × FL 478 along with their parents were easily distinguished. The UPGMA cluster tree analysis led to the grouping of the 32 BC1F1 population of Binadhan-7 × FL 478 along with their parents in two major clusters (Fig. 11). Cluster 1 comprised Binadhan-7 and 12 BC1F1 populations. In this main cluster Binadha-7 and BC1F1-
5 were grouped in the same sub cluster, showed very close similarity. Cluster 2 comprised FL-378 and 22 BC1F1 populations. In this main cluster FL-378 was grouped with BC1F1- 18 and BC1F1- 21in the same sub cluster.
BIN
A 7
FL
478
B
C1F
1-1
BC
1F1-3
B
C1F
1-4
BC
1F1-5
B
C1F
1-7
BC
1F1-8
B
C1F
1-9
BC
1F1-1
0
BC
1F1-1
2
BC
1F1-1
4
BC
1F1-1
7
BC
1F1-1
8
BC
1F1-1
9
BC
1F1-2
1
BC
1F1-2
2
BC
1F1-2
4
BC
1F1-2
5
BC
1F1-2
8
BC
1F1-3
0
BC
1F1-3
3
BC
1F1-3
4
BC
1F1-3
7
BC
1F1-3
9
BC
1F1-4
1
BC
1F1-4
3
BC
1F1-4
7
BC
1F1-4
9
BC
1F1-5
0
BC
1F1-5
5
BC
1F1-5
7
BC
1F1-5
9 B
C1F
1-60
10
0bp
L
―800
―400
―200 ―100
10
0bp
L
332

BINA Annual Report 2011-12 Biotechnology
BC1F1-5
BINA 7
BC1F1-1
BC1F1-17
BC1F1-34
BC1F1-43
BC1F1-57
BC1F1-10
BC1F1-19
BC1F1-24
BC1F1-3
BC1F1-47
BC1F1-49
BC1F1-30
BC1F1-33
BC1F1-39
BC1F1-60
BC1F1-8
BC1F1-9
FL 478
BC1F1-18
BC1F1-21
BC1F1-37
BC1F1-4
BC1F1-50
BC1F1-55
BC1F1-59
BC1F1-7
BC1F1-12
BC1F1-14
BC1F1-25
BC1F1-28
BC1F1-22
BC1F1-41
Fig. 11. Dendrogram for 34 germplasm derived from a UPGMA cluster analysis
333

BINA Annual Report 2011-12 Biotechnology
Identification of salt tolerant rice lines of BC1F1 population (Binadhan-7 × FL-378) using SSR markers
Thirty two rice lines along with their parents were fingerprinted using 3 SSR primers. Eight SSR primers were tested for surveying of parental polymorphism. Among them 3 primers viz., RM585, RM296 and OSR30 were polymorphic and showed clear bands (Fig 12-14). PCR amplification were done and visualized by agarose gel electrophoresis. Selected BC1F1 lines were genotyped and evaluated for salt tolerance with SSR primers compared with banding pattern of salt tolerant (FL-378) and salt susceptible parent (Binadhan-7). Genotypically, BC1F1 rice lines showed wide variation with the three primers; RM585, RM296 and OSR30. According to Nei’s (1983), the highest level of gene diversity value (0.4567) was observed in loci RM296 and the lowest level of gene diversity value (0.3270) was observed in loci OSR30 with a mean diversity of 0.3996. The marker RM585 presented the smallest allele size range (31 bp); while OSR30 showed the largest allele size range (63 bp). As a measure of the informativeness of microsatellites, the PIC values ranged from a low of 0.2735 (OSR30) to a high of 0.3524 (RM296) and averaged 0.3183.
Bin
adha
n-7
FL-3
78
BC
1F1-1
B
C1F
1-2
BC
1F1-3
B
C1F
1-5
BC
1F1-6
B
C1F
1-8
BC
1F1-9
B
C1F
1-10
BC
1F1-1
1 B
C1F
1-12
BC
1F1-1
3 B
C1F
1-16
BC
1F1-1
7 B
C1F
1-18
BC
1F1-1
9 B
C1F
1-21
BC
1F1-2
2 B
C1F
1-23
BC
1F1-2
4 B
C1F
1-25
BC
1F1-2
6 B
C1F
1-27
BC
1F1-2
9 B
C1F
1-30
BC
1F1-3
1 B
C1F
1-32
BC
1F1-3
4 B
C1F
1-35
BC
1F1-3
7 B
C1F
1-38
BC
1F1-3
9 B
C1F
1-40
―800 ―400
―200 ―100 10
0 bp
ladd
er
Fig 12. RM585 marker showing a segment of rice genome from FL-378 (P1) into Binadhan-7 (P2)
Bin
adha
n-7
FL-3
78
BC
1F1-1
B
C1F
1-2
BC
1F1-3
B
C1F
1-5
BC
1F1-6
B
C1F
1-8
BC
1F1-9
B
C1F
1-10
BC
1F1-1
1 B
C1F
1-12
BC
1F1-1
3 B
C1F
1-16
BC
1F1-1
7 B
C1F
1-18
BC
1F1-1
9 B
C1F
1-21
BC
1F1-2
2 B
C1F
1-23
BC
1F1-2
4 B
C1F
1-25
BC
1F1-2
6 B
C1F
1-27
BC
1F1-2
9 B
C1F
1-30
BC
1F1-3
1 B
C1F
1-32
BC
1F1-3
4 B
C1F
1-35
BC
1F1-3
7 B
C1F
1-38
BC
1F1-3
9 B
C1F
1-40
―800
―400
―200 ―100
100
bp la
dder
Fig 13. RM296 marker showing a segment of rice genome from FL-378 (P1) into Binadhan-7 (P2)
334

BINA Annual Report 2011-12 Biotechnology
Bin
adha
n-7
FL-3
78
BC
1F1-1
B
C1F
1-2
BC
1F1-3
B
C1F
1-5
BC
1F1-6
B
C1F
1-8
BC
1F1-9
B
C1F
1-10
BC
1F1-1
1 B
C1F
1-12
BC
1F1-1
3 B
C1F
1-16
BC
1F1-1
7 B
C1F
1-18
BC
1F1-1
9 B
C1F
1-21
BC
1F1-2
2 B
C1F
1-23
BC
1F1-2
4 B
C1F
1-25
BC
1F1-2
6 B
C1F
1-27
BC
1F1-2
9 B
C1F
1-30
BC
1F1-3
1 B
C1F
1-32
BC
1F1-3
4 B
C1F
1-35
BC
1F1-3
7 B
C1F
1-38
BC
1F1-3
9 B
C1F
1-40
―800
―400
―200 ―100
10
0 bp
ladd
er
Fig 14. OSR30 marker showing a segment of rice genome from FL-378 (P1) into Binadhan-7 (P2) The UPGMA cluster analysis of genetic similarity showed that 11 genotypes belonged to cluster 1 and this genotype is separated from other 23 genotypes. The tolerant germplasm were grouped in same cluster due to higher genetic distance. While, the susceptible germplasm were grouped in same cluster due to lower genetic distance (Fig. 15). Fig 15. Dendrogram for 32 BC1F1 along with parents derived from a UPGMA cluster analysis
335
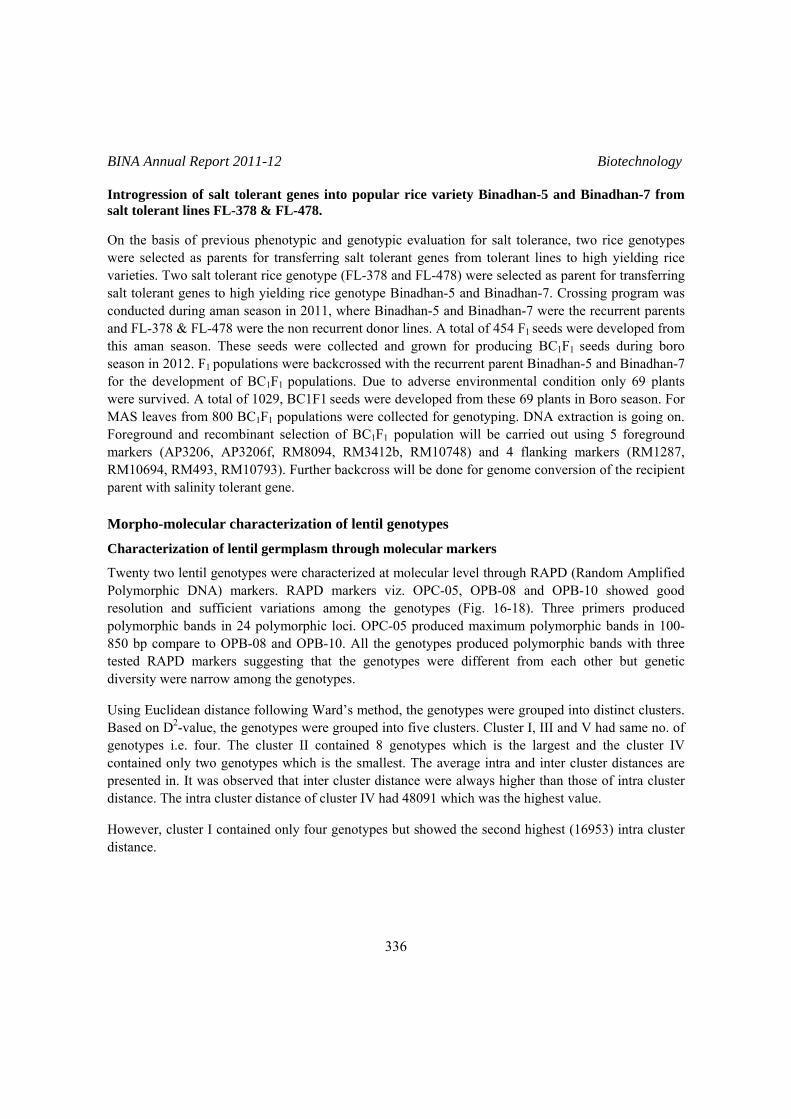
BINA Annual Report 2011-12 Biotechnology
Introgression of salt tolerant genes into popular rice variety Binadhan-5 and Binadhan-7 from salt tolerant lines FL-378 & FL-478. On the basis of previous phenotypic and genotypic evaluation for salt tolerance, two rice genotypes were selected as parents for transferring salt tolerant genes from tolerant lines to high yielding rice varieties. Two salt tolerant rice genotype (FL-378 and FL-478) were selected as parent for transferring salt tolerant genes to high yielding rice genotype Binadhan-5 and Binadhan-7. Crossing program was conducted during aman season in 2011, where Binadhan-5 and Binadhan-7 were the recurrent parents and FL-378 & FL-478 were the non recurrent donor lines. A total of 454 F1 seeds were developed from this aman season. These seeds were collected and grown for producing BC1F1 seeds during boro season in 2012. F1 populations were backcrossed with the recurrent parent Binadhan-5 and Binadhan-7 for the development of BC1F1 populations. Due to adverse environmental condition only 69 plants were survived. A total of 1029, BC1F1 seeds were developed from these 69 plants in Boro season. For MAS leaves from 800 BC1F1 populations were collected for genotyping. DNA extraction is going on. Foreground and recombinant selection of BC1F1 population will be carried out using 5 foreground markers (AP3206, AP3206f, RM8094, RM3412b, RM10748) and 4 flanking markers (RM1287, RM10694, RM493, RM10793). Further backcross will be done for genome conversion of the recipient parent with salinity tolerant gene. Morpho-molecular characterization of lentil genotypes
Characterization of lentil germplasm through molecular markers
Twenty two lentil genotypes were characterized at molecular level through RAPD (Random Amplified Polymorphic DNA) markers. RAPD markers viz. OPC-05, OPB-08 and OPB-10 showed good resolution and sufficient variations among the genotypes (Fig. 16-18). Three primers produced polymorphic bands in 24 polymorphic loci. OPC-05 produced maximum polymorphic bands in 100-850 bp compare to OPB-08 and OPB-10. All the genotypes produced polymorphic bands with three tested RAPD markers suggesting that the genotypes were different from each other but genetic diversity were narrow among the genotypes. Using Euclidean distance following Ward’s method, the genotypes were grouped into distinct clusters. Based on D2-value, the genotypes were grouped into five clusters. Cluster I, III and V had same no. of genotypes i.e. four. The cluster II contained 8 genotypes which is the largest and the cluster IV contained only two genotypes which is the smallest. The average intra and inter cluster distances are presented in. It was observed that inter cluster distance were always higher than those of intra cluster distance. The intra cluster distance of cluster IV had 48091 which was the highest value. However, cluster I contained only four genotypes but showed the second highest (16953) intra cluster distance.
336

BINA Annual Report 2011-12 Biotechnology
1000 bp
500 bp
300 bp
100 bp
100
bp D
NA
ladd
er
LM
-123
-7
LM
-132
-7
LM
-28-
2
LM
-14-
2
LM
-21-
6
LM
-24-
3
LM
-37-
8
LM
-48-
1
LM
-99-
4
LM
-95-
3
LM
-13-
1
LM
-156
-1
LM
-185
-2
LM
-20-
3
LM
-67-
5
LM
-75-
4
ICA
RD
A 2
348
ICA
RD
A 3
8211
ICA
RD
A 2
3136
ICA
RD
A 2
3121
ICA
RD
A 2
3105
ICA
RD
A 2
3128
Fig. 16 RAPD profiles of different 22 lentil genotypes using primer OPC-5
1000 bp
500 bp
300 bp
100 bp
100
bp D
NA
ladd
er
LM
-123
-7
LM
-132
-7
LM
-28-
2
LM
-14-
2
LM
-21-
6
LM
-24-
3
LM
-37-
8
LM
-48-
1
LM
-99-
4
LM
-95-
3
LM
-13-
1
LM
-156
-1
LM
-185
-2
LM
-20-
3
LM
-67-
5
LM
-75-
4
ICA
RD
A 2
348
ICA
RD
A 3
8211
ICA
RD
A 2
3136
ICA
RD
A 2
3121
ICA
RD
A 2
3105
ICA
RD
A 2
3128
Fig 17. RAPD profiles of different 22 lentil genotypes using primer OPB-8
337

BINA Annual Report 2011-12 Biotechnology
Fig. 18. RAPD profiles of different 22 lentil genotypes using primer OPB-10
Dendrogram based on Ward’s method indicated grouping of 22 genotypes of lentil into five clusters (Fig. 19). LM-123-7, LM-132-7, LM-13-1 and LM-24-3 were grouped in cluster I with high genetic (130) distance, while LM-28-2, LM-14-2, LM-21-6, LM-37-8, LM-48-1, LM-99-4, LM-95-3 and LM-75-4 in cluster II with 113 and LM-156-1, LM-185-2, LM-20-3 and LM-67-5 in cluster III with 113. ICARDA 2348 and ICARDA 23128 were grouped in cluster IV with the highest genetic (219) distance. ICARDA 38211, ICARDA 23136, ICARDA 23121 and ICARDA 23105 were grouped in cluster V with the lowest genetic (103) distance.
ICA
RD
A 23136
ICA
RD
A 23121
ICA
RD
A 23105
ICA
RD
A 38211
ICA
RD
A 23128
ICA
RD
A 2348
LM-67-5
LM-20-3
LM-185-2
LM-156-1
LM-37-8
LM-95-3
LM-99-4
LM-48-1
LM-21-6
LM-75-4
LM-28-2
LM-24-3
LM-13-1
LM-132-7
LM-123-7
Dis
tanc
e
Fig. 19. Dendrogram based on summarized data on differentiation among 22 genotypes of
lentil according to Ward’s method
338

BINA Annual Report 2011-12 Biotechnology
Evaluation of promising salt tolerant rice genotypes in saline areas
Performance of the proposed rice line PBRC-37 at on-farm trials under non saline and salt stress condition
Rice line PBRC 37 and salt tolerant check Binadhan-8 were evaluated for salt tolerance in farmer field at six location viz., Dumuria (Khulna); Gutodia (Khulna); Metro (Khulna); Fakirhat (Bagerhat); Sadar (Bagerhat); Bemorza (Bagerhat); Debhata (Satkhira); Shyamnagar (Satkhira) in Boro 2011-12. The unit plot size was 5 m × 5 m. Salinity level was 12-14 ds/m. Evaluation was done by SCA. Grain yield plant-1 in six locations range from 4.0 to 7.48 tons (Table 2). PBRC 37 recorded the highest yield at Metro (Khulna) followed by Debhata (Satkhira) and the lowest in Dumuria (Khulna). Proposed line PBRC-37 gave higher yield under high salt stress condition than Binadhan-8. Table 2. Performance of the proposed lines at on-farm trials under salt stress condition (EC 12-14 dS/m) during
boro 2011-12 (Evaluation was done by SCA)
Grain yield (t ha-1) Designation L1 L2 L3 L4 L5 L6 L7 L8 Mean PBRC-37 4.2 5.01 7.48 6.85 4.81 5.92 7.37 6.0 5.96 Binadhan-8 (check) 4.0 4.28 7.40 6.30 4.71 5.63 6.43 5.5 5.53
L1 = Dumuria (Khulna); L2 = Gutodia (Khulna); L3 = Metro (Khulna); L4 = Fakirhat (Bagerhat); L5 = Sadar (Bagerhat); L6 = Bemorta (Bagerhat); L7 = Debhata (Satkhira); L8 = Shyamnagar (Satkhira) During boro season in 2010-11 a zonal yield trial was conducted in Satkhira and Khulna districts in 6 different locations where salinity level ranges between 5-12 dS/m. The unit plot size was 5 m × 5 m. Grain yield data showed that PBRC-37 gave the highest yield at Fakirhat, Bagerhat followed by Dumuria (Khulna) and the lowest in Kaligonj (Satkhira). Proposed line gave higher yield than Binadhan-8 (Table 3). Table 3. Zonal yield trial of salt tolerant rice genotypes grown in saline (EC = 5-12 dS/m) areas at 6 locations in
boro season during 2010-11
Grain yield (t ha-1) Designation
L1 L2 L3 L4 L5 L6 Mean PBRC-37 5.91 5.80 6.51 6.71 6.80 5.90 6.27 Binadhan-8 (check) 5.60 5.34 6.45 6.62 6.30 5.80 5.97
L1 = Shyamnagar (Satkhira); L2 =Kaligonj (Satkhira); L3 = Sadar (Satkhira); L4 = Dumuria (Khulna); L5 = Fakirhat (Bagerhat); L6 = Mollarhat (Bagerhat) Morphological and agronomical characters of the proposed line PBRC-37 was evaluated with Binadhan-8 (check) under salt stress condition of 12-14 dS/m in boro season, 2011-12. The proposed line PBRC-37 was shorter in plant height, 9 days earlier and yielded 0.5 t ha-1 more than Binadhan-8 (Table 4). PBRC-37 was also evaluated for different morphological and agronomical characters with Binadhan-8 (check) in non-salinized condition in boro season, 2011-12. Proposed line perform better than Binadhan-8 for all the studied characters (Table 5).
339

BINA Annual Report 2011-12 Biotechnology
Table 4. Morphological and agronomical characters of the proposed lines under salt stress condition (12-14 dS/m) in boro season, 2011-12.
Proposed line Plant height (cm)
Days to maturity
1000 grain wt. (g)
Grain yield (t ha-1) (at EC level 10-12 dS/m)
PBRC-37 95 121 24.3 5.5 Binadhan-8 (check) 97 130 26.5 5.0
Table 5. Morphological and agronomical characters of the proposed lines under normal condition (non-salinized) in
boro season, 2011-12
Proposed line Plant height (cm)
Days to maturity
1000 grain wt. (g)
Grain yield (t ha-1)
PBRC-37 97 125 24.9 8.5 Binadhan-8 (check) 99 130 26.7 8.0
Grain characteristics, viz., milling yield (%), chalkiness, whole grain length, dehulled grain length, breadth, L/B ratio, size shape and amylose were measured/estimated following SES for rice. Milling yield of was PBRC-37- 76%, chalkiness less than 10%, size of the dehuled grain is medium and slender in shape with 26% amylose content (Table 6). Table 6. Grain characteristics of the proposed line PBRC-37.
Dehulled grain/kernel Proposed lines with std. checks
Milling yield (%)
Chalkinessa Whole grain length (mm)
length (mm)
Breadth (mm)
L/B ratio
Size and shape
Amylose(%)
PBRC-37 76 Wb1 8.5 6.7 2.6 2.58 Medium Slender 26.0 Binadhan-8 (check) 74 Wb1 8.2 6.2 3.0 2.06 Medium Medium 25.0
a Wb1 = Less than 10% chalkiness, Wb2 = Less than 20% chalkiness The proposed line PBRC-37 has been applied to SCA for variety release.
On-farm trial of one salt tolerant rice line in aman season
Rice line PBRC-37, including two salt tolerance check varieties (Binadhan-8 and BRRI dhan53) were evaluated for salt tolerance in farmer’s field at Kalikapoor Kaligong Satkira, Fakirhat Bagarhat and Paikgacha Khulna. The unit plot sige was 5 m × 5m. The average salinity level was 7 dS/m. Line PBRC-37 exhibited the highest number of tillers plant-1 in most of the locations (Table 7). PBRC-37 was early maturing than the check varieties. Binadhan-8 produced the highest grain yield.
340

BINA Annual Report 2011-12 Biotechnology
Table 7. Performance of salt tolerant rice line PBRC-37 in aman 2012
Location Variety Days
to maturity
Plant height (cm)
Tillers hill-1
(no.)
Effective tiller hill-1
(no.)
Plot yield (kg)
Yield (t ha-1)
Kaligonj, Satkhira PBRC-37 125 84.1 12 11 8.5 2.8 Binadhan-8 (Chk.) 128 81.7 11 11 9.0 3.0 BRRI dhan53 (Chk.) 130 97.4 10 9 5.6 1.8 LSD (0.05) 0.00 2.00 1.36 1.78 1.42 0.80 Saymanagar, Satkhira PBRC-37 125 79 18 16 6.1 2 Binadhan-8 (Chk.) 128 87.5 14 14 6.3 2.2 BRRI dhan53 (Chk.) 130 100.4 13 12 6.6 2.2 LSD (0.05) 0.00 2.65 2.26 1.86 3.64 1.79 Lobonchora, Khulna PBRC-37 126 102 11 10 10.5 3.5 Binadhan-8 (Chk.) 129 94.9 11 11 10.6 3.5 BRRI dhan53 (Chk.) 131 105.4 12 12 10.3 3.4 LSD (0.05) 0.00 1.34 2.54 2.34 8.83 4.79 Fakirhat, Bagerhat PBRC-37 125 98.1 10 9 11.6 3.8 Binadhan-8 (Chk.) 128 98.1 12 12 14.3 4.7 BRRI dhan53 (Chk.) 130 114.5 15 15 18.1 6 LSD (0.05) 0.00 1.02 1.31 0.89 1.43 0.82 Paikgacha, Khulna PBRC-37 126 93.1 16 15 15.6 5.2 Binadhan-8 (Chk.) 129 95.2 13 13 16.6 5.5 BRRI dhan53 (Chk.) 131 109.4 12 12 16 5.3 LSD (0.05) 0.00 1.13 1.51 1.41 2.95 1.78 Combined PBRC-37 125 91.2 13 12 10.4 3.4 Binadhan-8 (Chk.) 128 91.5 12 12 11.5 3.8 BRRI dhan53 (Chk.) 130 105.4 12 12 11.3 3.7 CV (%) 0.00 4.50 14.40 15.11 15.19 15.20 LSD (0.05) 0.00 2.15 3.53 0.00 3.12 1.75
Advanced yield trial of some selected early maturing rice lines
Eight rice genotypes along with one early check variety BRRI dhan28 were tested for early maturity during boro 2011-2012 in three locations, viz., BINA HQ (Mymensingh), BINA sub-stations Ishurdi and Magura. The experiment was laid out in RCBD with three replications. Unit plot size was 5 m × 4 m and spacing between hills and rows were 20 cm × 20 cm. Recommended fertilizer doses were applied. Data on plant height, no. of effective tillers hill-1, days to flowering, days to maturity, no. of filled grains plant-1, 1000 grain weight and grain yield plot-1 were recorded from five randomly selected plants from each plot. Plot yield was converted to t ha-1. The highest number of tillers hill-1 was found in ADT (R) 47 and the lowest in IR-71701-28-1-4 (58). The highest no. filled grains per panicle were found in CT-9882-16-4 and the lowest in ADT (R) 47 at Mymensingh and Ishurdi (Table 8). The lowest no. of filled grain was counted in BRRI dhan28 at Mymensingh and Ishurdi and the highest in CT-9882-16-4. For 1000 grain weight IR-71701-28-1-4(58) recorded the highest and the lowest in ADT (R) 47. Plot yield (t ha-1) was the highest IR-71701-28-1-4(58) at Ishurdi and Magura and the lowest in OMCS-2007 and the lowest yield (t ha-1) was recorded in OMCS 2007. OMCS 2007 was identified as the earliest maturing line. Based on different parameters three lines will be evaluated for zonal yield trial in the next season.
341
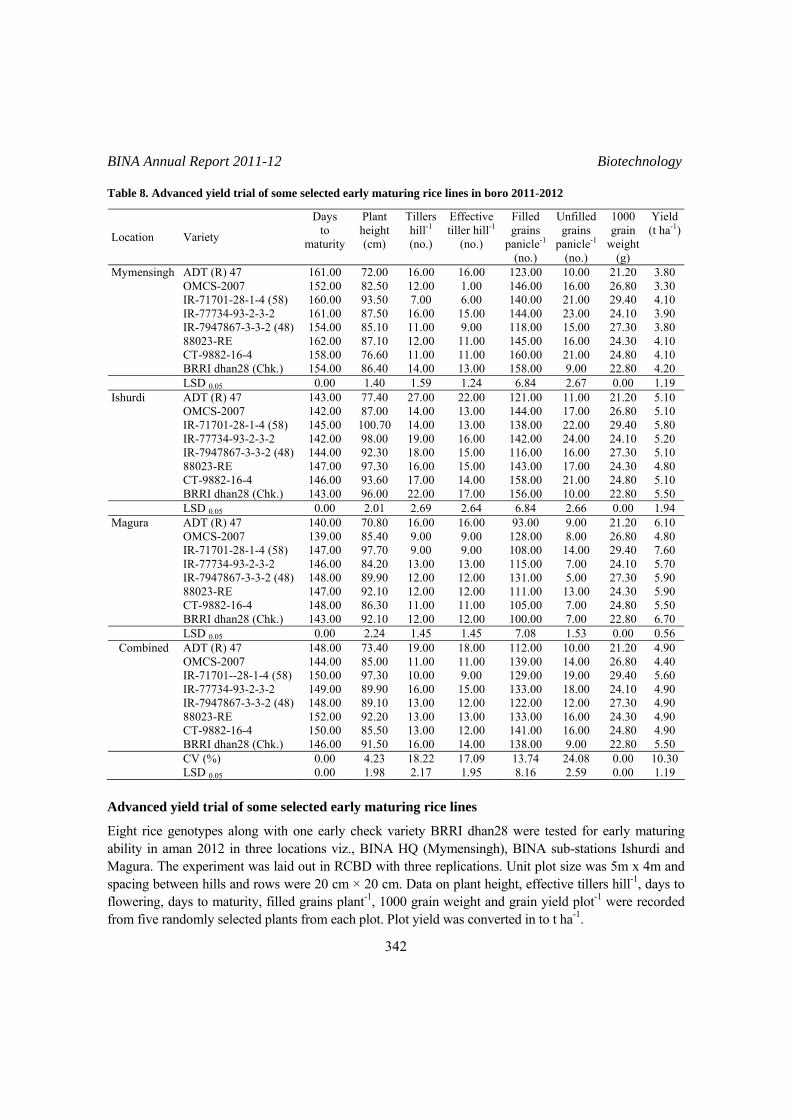
BINA Annual Report 2011-12 Biotechnology
Table 8. Advanced yield trial of some selected early maturing rice lines in boro 2011-2012
Location Variety
Days to
maturity
Plant height (cm)
Tillers hill-1
(no.)
Effective tiller hill-1
(no.)
Filled grains
panicle-1
(no.)
Unfilled grains
panicle-1
(no.)
1000 grain
weight (g)
Yield (t ha-1)
Mymensingh ADT (R) 47 161.00 72.00 16.00 16.00 123.00 10.00 21.20 3.80 OMCS-2007 152.00 82.50 12.00 1.00 146.00 16.00 26.80 3.30 IR-71701-28-1-4 (58) 160.00 93.50 7.00 6.00 140.00 21.00 29.40 4.10 IR-77734-93-2-3-2 161.00 87.50 16.00 15.00 144.00 23.00 24.10 3.90 IR-7947867-3-3-2 (48) 154.00 85.10 11.00 9.00 118.00 15.00 27.30 3.80 88023-RE 162.00 87.10 12.00 11.00 145.00 16.00 24.30 4.10 CT-9882-16-4 158.00 76.60 11.00 11.00 160.00 21.00 24.80 4.10 BRRI dhan28 (Chk.) 154.00 86.40 14.00 13.00 158.00 9.00 22.80 4.20 LSD 0.05 0.00 1.40 1.59 1.24 6.84 2.67 0.00 1.19 Ishurdi ADT (R) 47 143.00 77.40 27.00 22.00 121.00 11.00 21.20 5.10 OMCS-2007 142.00 87.00 14.00 13.00 144.00 17.00 26.80 5.10 IR-71701-28-1-4 (58) 145.00 100.70 14.00 13.00 138.00 22.00 29.40 5.80 IR-77734-93-2-3-2 142.00 98.00 19.00 16.00 142.00 24.00 24.10 5.20 IR-7947867-3-3-2 (48) 144.00 92.30 18.00 15.00 116.00 16.00 27.30 5.10 88023-RE 147.00 97.30 16.00 15.00 143.00 17.00 24.30 4.80 CT-9882-16-4 146.00 93.60 17.00 14.00 158.00 21.00 24.80 5.10 BRRI dhan28 (Chk.) 143.00 96.00 22.00 17.00 156.00 10.00 22.80 5.50 LSD 0.05 0.00 2.01 2.69 2.64 6.84 2.66 0.00 1.94 Magura ADT (R) 47 140.00 70.80 16.00 16.00 93.00 9.00 21.20 6.10 OMCS-2007 139.00 85.40 9.00 9.00 128.00 8.00 26.80 4.80 IR-71701-28-1-4 (58) 147.00 97.70 9.00 9.00 108.00 14.00 29.40 7.60 IR-77734-93-2-3-2 146.00 84.20 13.00 13.00 115.00 7.00 24.10 5.70 IR-7947867-3-3-2 (48) 148.00 89.90 12.00 12.00 131.00 5.00 27.30 5.90 88023-RE 147.00 92.10 12.00 12.00 111.00 13.00 24.30 5.90 CT-9882-16-4 148.00 86.30 11.00 11.00 105.00 7.00 24.80 5.50 BRRI dhan28 (Chk.) 143.00 92.10 12.00 12.00 100.00 7.00 22.80 6.70 LSD 0.05 0.00 2.24 1.45 1.45 7.08 1.53 0.00 0.56
Combined ADT (R) 47 148.00 73.40 19.00 18.00 112.00 10.00 21.20 4.90 OMCS-2007 144.00 85.00 11.00 11.00 139.00 14.00 26.80 4.40 IR-71701--28-1-4 (58) 150.00 97.30 10.00 9.00 129.00 19.00 29.40 5.60 IR-77734-93-2-3-2 149.00 89.90 16.00 15.00 133.00 18.00 24.10 4.90 IR-7947867-3-3-2 (48) 148.00 89.10 13.00 12.00 122.00 12.00 27.30 4.90 88023-RE 152.00 92.20 13.00 13.00 133.00 16.00 24.30 4.90 CT-9882-16-4 150.00 85.50 13.00 12.00 141.00 16.00 24.80 4.90 BRRI dhan28 (Chk.) 146.00 91.50 16.00 14.00 138.00 9.00 22.80 5.50 CV (%) 0.00 4.23 18.22 17.09 13.74 24.08 0.00 10.30 LSD 0.05 0.00 1.98 2.17 1.95 8.16 2.59 0.00 1.19
Advanced yield trial of some selected early maturing rice lines
Eight rice genotypes along with one early check variety BRRI dhan28 were tested for early maturing ability in aman 2012 in three locations viz., BINA HQ (Mymensingh), BINA sub-stations Ishurdi and Magura. The experiment was laid out in RCBD with three replications. Unit plot size was 5m x 4m and spacing between hills and rows were 20 cm × 20 cm. Data on plant height, effective tillers hill-1, days to flowering, days to maturity, filled grains plant-1, 1000 grain weight and grain yield plot-1 were recorded from five randomly selected plants from each plot. Plot yield was converted in to t ha-1.
342

BINA Annual Report 2011-12 Biotechnology
CMCS-2007 was found to be the earliest in all locations, while IR-7947867-3-3-2(48) took longest time to mature. The highest numbers of tillers/plant and effective tillers were found in ADT (RT) 47. The longest panicle length was recorded in IR77734-93-2-3-2 and the smallest in CT-9882-16-4. IR-71701-28-1-4(58) gave highest 1000 seed weight. Yield was highest in IR-7947867-3-3-2 (48) and 88023-RE and the lowest in OMCS-2007 (Table 9). Table 9. Advanced yield trial of some selected early maturing rice lines aman 2012
Location Variety
Days to
maturity
Plant height (cm)
Tillers hill-1
(no.)
Effective tiller hill-1
(no.)
Filled grains
panicle-1
(no.)
Unfilled grains
panicle-1
(no.)
1000 grain
weight (g)
Yield (t ha-1)
Mymensingh ADT (R) 47 109 86.1 15 14 20.3 90 19.5 3.3 OMCS-2007 107 98.6 10 9 22.4 107 27.6 1.9 IR-71701-28-1-4 (58) 110 107.1 9 8 22.2 106 27.9 2.7 IR-77734-93-2-3-2 110 108 13 13 27.3 104 22.4 2.9 IR-7947867-3-3-2 (48) 121 105.4 11 10 22.4 114 26.1 3 88023-RE 115 113.8 8 8 23 107 24.3 3 CT-9882-16-4 115 99.8 8 8 23.2 126 22.8 2.7 Binadhan-7 (Chk.) 119 99.3 9 9 23.7 99 22.7 2.8 LSD 0.05 1.38 1.31 1.94 1.87 1.32 1.20 1.31 1.56 Ishurdi ADT (R) 47 109 86.1 15 14 20.3 90 19.5 3.3 OMCS-2007 107 98.6 10 9 22.4 107 27.6 1.9 IR-71701-28-1-4 (58) 110 107.1 9 8 22.2 106 27.9 2.7 IR-77734-93-2-3-2 110 108 13 13 27.3 104 22.4 2.9 IR-7947867-3-3-2 (48) 121 105.4 11 10 22.4 114 26.1 3 88023-RE 115 113.8 8 8 23 107 24.3 3 CT-9882-16-4 115 99.8 8 8 23.2 126 22.8 2.7 Binadhan-7 (Chk.) 119 99.3 9 9 23.7 99 22.7 2.8 LSD 0.05 1.36 1.29 2.12 2.12 1.32 1.20 1.61 2.04 Magura ADT (R) 47 107 83.6 18 18 20.3 90 29.7 5.6 OMCS-2007 103 92.1 15 15 22.4 107 27.1 6 IR-71701-28-1-4 (58) 122 98.9 12 12 22.2 106 28.6 6 IR-77734-93-2-3-2 114 106.1 15 15 27.3 104 31.7 4.3 Binadhan-7 115 93.3 14 14 23.7 99 21.9 6 IR-7947867-3-3-2 (48) 122 98.9 14 14 22.4 114 28.4 6.6 88023-RE 122 106.5 12 12 23 107 26.3 6.6 CT-9882-16-4 122 99.2 12 12 23.2 126 23.2 6.2 Binadhan-7 (Chk.) 119 99.3 9 9 23.7 99 22.7 2.8 LSD 0.05 1.33 1.31 1.63 1.58 1.32 1.20 1.41 1.15 Combined ADT (R) 47 108 85.2 16 15 20.3 90 22.9 4.1 OMCS-2007 105 96.4 11 11 22.4 107 27.4 3.2 IR-71701--28-1-4 (58) 114 104.3 10 9 22.2 106 28.1 3.8 IR-77734-93-2-3-2 111 107.4 14 13 27.3 104 25.5 3.4 IR-7947867-3-3-2 (48) 121 103.2 12 11 22.4 114 26.8 4.2 88023-RE 117 111.3 9 9 23 107 24.9 4.2 CT-9882-16-4 117 99.6 9 9 23.2 126 22.9 3.9 Binadhan-7 (Chk.) 117 97.3 11 11 23.7 99 22.4 3.8 CV (%) 5.092 9.078 3.141 3.246 0.559 80.658 0.037 0.177 LSD 0.05 0.00 0.00 0.00 0.00 0.00 0.00 0.00 0.00
343

BINA Annual Report 2011-12 Biotechnology
Zonal Yield Trial of some promising green super rice lines in boro 2011-2012
The zonal yield trial was carried out with 3 promising/selected green super rice (GSR) lines, namely WANXIAN 77, SACG 7 and HUA-565 during Boro season 2011-2012 in three locations viz., BINA HQ (Mymensingh), BINA sub-stations Ishurdi and Magura. The experiment was laid out in RCBD with three replications. Unit plot size was 5 m × 4 m and spacing between hills and rows were 20 cm × 20 cm. Data on plant height, effective tillers hill-1, days to flowering, days to maturity, filled grains plant-1, 1000 grain weight and grain yield plot-1 were recorded from five randomly selected plants from each plot (Table 10). HUA 564 produced the highest number of filled grain plant and 1000 grain weight compared to other lines. WANXIAN77 was the earliest and HUA 564 was late maturing type. The highest yield was obtained in WANXIAN 77 and the lowest in HUA-564. 3ACG-7 had the lowest plant height and the highest effective tillers.
Table 10. Zonal Yield Trial of some promising green super rice lines in boro 2011-2012
Location Variety
Days to
maturity
Plant height (cm)
Tillers hill-1
(no.)
Effective tiller hill-1
(no.)
Filled grains
panicle-1 (no.)
Unfilled grains
panicle-1
(no.)
1000 grain
weight (g)
Plot yield (kg)
Yield (t ha-1)
Mymensingh WANXIAN 77 168.00 93.90 8.00 8.00 179.00 42.00 25.60 11.70 5.80 SACG 7 174.00 78.20 8.00 8.00 136.00 33.00 21.60 11.10 5.50 HUA 564 177.00 95.40 7.00 6.00 154.00 23.00 33.30 9.10 4.50 BRRI dhan29 177.00 95.80 11.00 10.00 155.00 28.00 22.20 9.10 4.50 LSD 0.05 0.00 1.12 1.47 1.38 3.59 1.52 0.00 1.02 0.72 Magura WANXIAN 77 155.00 100.60 11.00 12.00 225.00 21.00 25.60 5.30 5.50 SACG 7 161.00 91.30 14.00 15.00 218.00 17.00 21.60 5.90 6.20 HUA 564 159.00 97.30 9.00 11.00 196.00 18.00 33.30 5.10 5.30 BRRI dhan29 161.00 96.60 16.00 18.00 129.00 16.00 22.20 4.80 5.10 LSD0.05 0.00 0.98 2.08 1.61 4.46 1.09 0.00 1.00 1.02 Ishurdi WANXIAN 77 158.00 94.60 6.00 6.00 177.00 44.00 25.60 10.50 5.20 SACG 7 161.00 86.60 9.00 9.00 134.00 35.00 21.60 10.10 5.10 HUA 564 158.00 92.60 6.00 6.00 152.00 29.00 33.30 10.30 5.10 BRRI dhan29 162.00 97.60 11.00 11.00 153.00 34.00 22.20 9.20 4.60 LSD0.05 0.00 1.62 0.89 0.89 3.96 2.94 0.00 0.58 0.43 Combined WANXIAN 77 160.00 96.40 8.00 9.00 193.00 35.00 25.60 9.20 5.50 SACG 7 165.00 85.40 10.00 11.00 163.00 28.00 21.60 9.40 5.50 HUA 564 164.00 95.10 7.00 8.00 167.00 23.00 33.30 8.20 5.10 BRRI dhan29 166.00 96.70 12.00 13.00 145.00 26.00 22.20 7.70 4.70 CV (%) 0.00 2.48 17.54 14.76 9.18 11.57 0.00 7.39 7.59 LSD 0.05 0.00 1.41 1.66 1.46 4.89 2.08 0.00 0.99 0.91
Zonal Yield Trial of some promising green super Rice lines in Aman season 2012
The zonal yield trial was carried out with 3 promising/selected green super rice (GSR) lines, namely WANXIAN 77, SACG 7 and HUA-565 during aman season 2012 in three locations viz., BINA HQ (Mymensingh), BINA sub-station Ishurdi and Magura. The experiment was laid out in RCBD with three replications. Unit plot size was 5 m × 4 m and spacing between hills and rows were 20 cm × 20 cm. Data on plant height, effective tillers hill-1, days to flowering, days to maturity, filled grains plant-1, 1000 grain weight and grain yield plot-1 were recorded from five randomly selected plants from each plot.
344

BINA Annual Report 2011-12 Biotechnology
The result shows that HUA-564 produced the highest number of filled grain plant and 1000 grain weight compared to other lines. WANXIAN77 was the earliest and HUA 564 was late maturing type. The highest yield was obtained in WANXIAN77 and the lowest in HUA-564. 3ACG-7 had the lowest plant height and the highest effective tillers (Table 11). Table 11. Zonal Yield Trial of some promising green super Rice lines in aman season 2012
Location Variety
Days to
maturity
Plant height (cm)
Tillers hill-1
(no.)
Effective tiller hill-1
(no.)
Panicle length (cm)
Filled grains
panicle-1
(no.)
1000 grain
weight (g)
Yield (t ha-1)
Mymensingh WANXIAN 77 123 107.8 7 7 21.9 152 25 3.4 SACG 7 124 90.2 7 7 22.2 151.3 20.7 3.2 HUA 564 125 110.6 5 4 25.1 154.3 32.1 2.3 BR-11 121 107.4 8 8 23.2 145.3 23.8 3.4 LSD 0.05 1.68 0.97 2.13 1.67 0.78 6.30 0.00 1.35 Ishurdi WANXIAN 77 123 107.8 7 7 21.9 152 25 3.4 SACG 7 124 90.2 7 7 22.2 151.3 20.7 3.2 HUA 564 125 110.6 5 4 25.1 154.3 32.1 2.3 BR-11 121 107.4 8 8 23.2 145.3 23.8 3.4 LSD 0.05 2.417 4.347 2.861 2.417 0.436 76.25 0 0.476 Magura WANXIAN 77 123 107.8 7 7 21.9 152 25 3.4 SACG 7 124 90.2 7 7 22.2 151.3 20.7 3.2 HUA 564 125 110.6 5 4 25.1 154.3 32.1 2.3 BR-11 121 107.4 8 8 23.2 145.3 23.8 3.4 LSD 0.05 125 105.2 7 7 21.9 152 17.5 4.8 Combined WANXIAN 77 127 90.00 9 8 22.2 151.3 14.5 4.5 SACG 7 128 108.8 6 5 25.1 154.3 22.5 4.3 HUA 564 126 107.9 9 8 23.2 145.3 16.7 4.5 BR-11 123 107.8 7 7 21.9 152 25 3.4 CV (%) 1.49 1.50 1.67 1.60 0.70 5.70 0.03 1.72 LSD 0.05 0.95 3.05 17.91 17.41 17.41 2.58 5.24 12.05
Zonal Yield Trial of some selected aromatic rice lines in boro 2011-2012
Four promising high yielding aromatic rice lines namely: IR-50 (48), BINA Arom-5, BINA Arom-8 and BINA Aroma-9 were evaluated during boro season 2011-2012. The experiments were set at BINA HQ (Mymensingh), BINA sub-stations viz., Ishurdi, Magura and farmers field at Dinajpur. RCBD design was followed these experiments with three replications. Unit plot size was 5 m × 4 m and spacing was 20 cm × 20 cm. Normal cultural practices were done as and when necessary. Yield and yield components were analyzed and presented below (Table 12). It was observed that most of the lines were comparatively better in the experimental field with respect to filled grain plant-1, 1000 grain wt and yield. Crop duration of the entries ranged from 157-162 days. The earliest maturing line was IR 50, the highest number of tiller was produced by BINA aroma lines and the highest number of effective tiller was also found in these two lines. Though BINA Aroma-5 took longest period to mature but filled grain, 1000 seed weight and yield were found highest among all other lines/varieties.
345

BINA Annual Report 2011-12 Biotechnology
Table 12. Zonal Yield Trial of some selected aromatic rice lines in boro 2011-2012
Location Variety
Days to maturity
Plant height (cm)
Tillers hill-1
(no.)
Effective tiller hill-1
(no.)
Panicle length (cm)
Filled grains
panicle-1
(no.)
1000 grain
weight (g)
Yield (t ha-1)
Mymensingh IR-50 (48) 170.00 87.30 12.00 11.00 98.00 8.00 20.90 4.60 BINA Arom-5 171.00 83.60 16.00 15.00 142.00 15.00 33.30 4.90 BINA Arom-8 168.00 81.50 14.00 13.00 119.00 24.00 26.80 5.00 BINA Arom-9 166.00 88.30 10.00 10.00 142.00 23.00 28.30 5.00 BRRI dhan50 (Chk.) 170.00 79.70 12.00 11.00 82.00 19.00 19.40 4.00 LSD 0.05 0.00 1.50 1.03 1.19 1.45 2.75 0.00 1.22 Ishurdi IR-50 (48) 154.00 87.00 16.00 17.00 138.00 15.00 20.90 4.30 BINA Arom-5 154.00 85.60 17.00 18.00 134.00 25.00 33.30 5.10 BINA Arom-8 155.00 85.60 19.00 21.00 107.00 12.00 26.80 4.30 BINA Arom-9 155.00 94.60 14.00 17.00 123.00 16.00 28.30 4.90 BRRI dhan50 (Chk.) 154.00 82.00 19.00 21.00 101.00 15.00 19.40 4.30 LSD 0.05 0.00 0.85 2.79 2.78 4.86 1.50 0.00 0.94 Magura IR-50 (48) 147.00 84.00 10.00 11.00 96.00 10.00 20.90 5.30 BINA Arom-5 160.00 78.60 11.00 11.00 140.00 17.00 33.30 5.10 BINA Arom-8 158.00 82.60 13.00 13.00 117.00 26.00 26.80 4.80 BINA Arom-9 158.00 94.60 10.00 10.00 140.00 25.00 28.30 4.80 BRRI dhan50 (Chk.) 156.00 80.30 11.00 11.00 80.00 22.00 19.40 4.70 LSD 0.05 0.00 3.56 1.44 1.52 1.45 2.71 0.00 1.23 Combined IR-50 (48) 157.00 86.10 13.00 13.00 110.00 11.00 20.90 4.70 BINA Arom-5 162.00 82.60 15.00 15.00 139.00 19.00 33.30 5.00 BINA Arom-8 160.00 83.20 15.00 16.00 113.00 21.00 26.80 4.70 BINA Arom-9 160.00 92.50 11.00 12.00 135.00 21.00 28.30 4.90 BRRI dhan50 (Chk.) 160.00 80.60 14.00 14.00 87.00 19.00 19.40 4.30 CV (%) 0.00 4.33 12.96 13.35 7.52 21.33 0.00 9.53 LSD 0.05 0.00 2.83 1.97 2.15 2.71 2.75 0.00 1.25
Zonal Yield Trial of some selected aromatic rice lines in aman 2011-012
Four promising high yielding aromatic rice lines were evaluated during aman season of 2012. The experiments were set at BINA HQ (Mymensingh), BINA sub-stations Ishurdi, Magura and farmers field at Dinajpur. RCBD design was followed in this experiment with three replications. Unit plot size was 5 m × 4 m and spacing was 20 cm × 20 cm. Yield and yield component data were analyzed and presented in Table 13. Results show that BINA Aroma-9 was the earliest and Kalizira took the longest time to mature. BINA Aroma-9 was the shortest and Kalizira was the tallest for plant height. The highest no. of tiller and effective tiller per plant were found in BINA Aroma-9. Panicle length was the height in Kalizira and lowest in BINA Aroma-8. The highest 1000 seed weight was found in BINA Aroma-9 and the lowest in Kalizira. Highest yield was found in IR-50 (48) and the lowest in Kalizira.
346

BINA Annual Report 2011-12 Biotechnology
Table 13. Performance of aromatic rice lines grown in different locations in Aman season 2012
Location Variety
Days to
maturity
Plant height (cm)
Tillers hill-1
(no.)
Effective tiller hill-1
(no.)
Panicle length (cm)
Filled grains
panicle-1
(no.)
1000 grain
weight (g)
Plot yield (kg)
Yield (t ha-1)
Mymensingh IR-50 (48) 120 105.5 9 8 23.6 130 21 6.4 3.2 BINA Arom-5 122 102.6 8 8 26.7 135 21.6 6.4 3.2 BINA Arom-8 120 95.2 10 10 22.3 104 25.2 6.3 3.2 BINA Arom-9 115 91.2 8 8 23.4 129 25.9 5.5 2.7 Kalizira (Check) 128 160.1 10 10 28.5 165 15.2 4.5 2.2 LSD 0.05 1.26 0.72 1.39 1.44 0.34 2.09 0.00 1.56 1.06 Ishurdi IR-50 (48) 120 105.5 9 8 23.6 130 21 6.4 3.2 BINA Arom-5 122 102.6 8 8 26.7 135 21.6 6.4 3.2 BINA Arom-8 120 95.2 10 10 22.3 104 25.2 6.3 3.2 BINA Arom-9 115 91.2 8 8 23.4 129 25.9 5.5 2.7 Kalizira (Check) 128 160.1 10 10 28.5 165 15.2 4.5 2.2 LSD 0.05 1.26 0.72 1.39 1.44 0.34 2.09 0.00 1.56 1.06 Magura IR-50 (48) 124 104.8 13 13 23.6 130 21 13.3 6.6 BINA Arom-5 122 101.1 13 13 26.7 135 21.6 13.3 6.5 BINA Arom-8 119 101.6 13 13 22.3 104 25.2 10.9 5.4 BINA Arom-9 120 100.5 11 11 23.4 129 25.9 12.4 6.2 Kalizira (Check) 124 148.1 11 11 28.5 165 15.2 6.2 3.1 LSD 0.05 0.00 0.86 1.52 1.52 0.34 2.09 0.00 0.52 0.37 Combined IR-50 (48) 121 105.2 10 10 23.6 130 21 8.7 4.3 BINA Arom-5 122 102.1 10 9 26.7 135 21.6 8.6 4.3 BINA Arom-8 119 97.3 11 11 22.3 104 25.2 7.9 3.9 BINA Arom-9 117 94.3 9 9 23.4 129 25.9 7.8 3.9 Kalizira (Check) 126 156.3 10 10 28.5 165 15.2 5.1 2.5 CV (%) 1.26 2.73 10.2 10.89 1.44 4.8 0 10.93 10.93 LSD 0.05 1.22 0.85 1.82 1.74 0.32 1.94 0.00 0.98 0.69
Evaluation of submergence tolerant rice lines
Submergence tolerant rice lines, Ciherang-sub1 and Samba Mahsuri-sub1 along with 1 check variety BRRI dhan51 were evaluated with (check) in farmer field at 5 locations viz., Rangpur Sadar, Nalitabari (Sherpur), Nokla (Sherpur), Dhobaura (Mymensingh) and Dewangonj (Jamalpur) in aman 2011-12 . The unit plot sige was 5 m × 5 m. The tested entries were under complete submergence of 20-25 days. Ciherang-sub1 was 5-8 days more submergence tolerant, 1 month earlier and high yield (20%) more compared to BRRI dhan51 (Table 14). Samba Mahsuri-Sub1 was found to be 5 days more submergence tolerant, 10 days earlier and high yielder (Table 14). Table 14. Morphological and agronomical characters of the proposed lines Ciherang-Sub1 and Samba
Mahsuri-Sub1 in aman season at submerged condition
Proposed lines Plant height (cm)
Days to flowering
Days to maturity
1000 grain wt. (gm)
Grain yield (t ha-1)
Ciherang-Sub1 92 110 135 28.1 4.1 Samba Mahsuri-Sub1 84 120 151 16.0 3.8 BRRI dhan51 (Check) 82 130 165 20.3 3.9
347

BINA Annual Report 2011-12 Biotechnology
Ciherang-Sub1 showed the highest yield (4.2 t ha-1) at all location under 25 days complete submergence (Table 15). Table 15. Performance of the proposed lines at different on-farm trial under submerged condition in aman
season, 2010
Grain yield (t ha-1) Designation L1 L2 L3 L4 L5 Mean Ciherang-Sub1 4.0 3.9 4.1 4.4 4.8 4.2 Samba Mahsuri-Sub1 3.4 3.8 3.5 3.2 3.1 3.4 BRRI dhan51 (Check) 3.7 3.6 3.7 3.5 3.5 3.6
L1 = Sadar (Rangpur), L2 = Nalitabari (Sherpur), L3 = Nokla (Sherpur) L4 = Dhobaura (Mymensingh), L5 = Dewangonj (Jamalpur) With respect to grain quality, milling yield of Ciherang-Sub1 was 71%, chalkiness less than 10%, size of the dehuled grain is long and medium and 23.74 % amylose content (Table 16). Milling yield of Samba Masuri-Sub1 was 72%, chalkiness less than 10%, size of the dehuled grain is short and medium and 24.36 % amylase. Table 16. Grain characteristics of the proposed lines Ciherang-Sub1 and Samba Mahsuri-Sub1
Dehulled grain/kernel Proposed lines with std. checks
Milling Yield (%)
Head rice Yield (%)
Chalkinessa Whole grain length (mm)
length (mm)
Breadth (mm)
L/B ratio
Size and shape
Amylose(%)
Ciherang-Sub1 71 90 Wb1 9.0 7.1 2.4 2.96 Long Medium
23.74
Samba Masuri-Sub1 72 90 Wb1 7.1 5.3 2.0 2.65 Short Medium
24.36
BRRI dhan51(Check) 71 90 Wb1 7.5 6.0 2.3 2.60 Medium bold
28.12
a Wb1 = Less than 10% chalkiness, Wb2 = Less than 20% chalkiness Both the tested lines are intermediate amylose content which indicate higher consumer preferences because of tastiness of cooked rice. These two submergence tolarent rice lines have been applied to SCA for variety release. Screening for drought tolerance of M3 generation of NERICA-1, 4 and 10
New Rice for Africa (NERICA) was originated from progeny of O. sativa × O. glaberrima. NERICA is drought tolerant, growth duration ranges from 90-100 days and photo-insensitive which is suitable for cultivation in Aus, Aman and Boro season. Adaptability of NERICA lines in Bangladesh is being tested. Variability was created through gamma radiation (250, 300 and 350 Gy) in 2010 to develop drought tolerant rice varieties. Screening was done during aman-boro 2011-12 at BINA HQ Mymensingh, Godagari (Rajshahi), Nachole (Chapainawabgonj) and Kaliganj (Jhenaidah). Data were collected on plant height, effective tillers hill-1 and filled grains panicle-1. On the basis of the studied characters, a total of desired 111 mutant population were selected from NERICA-1, 4 and 10. Selected populations are now in M5 generation. This M5 mutants are being tested in drought (barind) and saline prone areas to observe their tolerance and yield potentiality as well.
348

HORTICULTURE DIVISION

BINA Annual Report 2011-12 Horticulture
350

BINA Annual Report 2011-12 Horticulture
RESEARCH HIGHLIGHTS Eggplant:
In the pot experiment at Head Quarter farm, the eggplant genotype FCI produced the highest yield (2055.0 g plant-1) than other genotypes (Purple long = 1904 g plant-1, Kansant local = 1896 g plant-1 and Pahuja-2 = 1833.0 g plant-1). In the field experiment at Magura substation, the eggplant genotype FCI produced the highest yield (57.33 t ha-1) over all of the genotypes and the other three genotypes Kansant local, Purple long and BARI Begun-5 showed yield 51.33 t ha-1, 49.51, t ha-1 and 51.16 t ha-1, respectively. The selected genotype will be tested in advanced yield trial in next season. Okra:
Under the pot condition, at Head quarter farm, the Okra genotype Patel Aunamica produced the highest fruit yield (658.1 g plant-1) which was similar to City Aunamica (613.7 g plant-1). The other two genotypes Pankoj Aunamica and Paravani Kanti showed yield of 530.4 g plant-1 and 562.2 g plant-
1, respectively. In field experiment at Magura substation, Patel Aunamica produced also the highest yield (74.1 t ha-1) of all the genotypes. The genotypes City Aunamica, Pankoj Aunamica and Bogra-1 produced yield 68.5 t ha-1, 67.5 t ha-1 and 61.5 t ha-1, respectively. The selected genotypes will be irradiated to create variability for desired types.
351

BINA Annual Report 2011-12 Horticulture
Eggplant
Evaluation of elite genotypes of eggplant
A pot experiment was conducted at the pot yard of the Bangladesh Institute of Nuclear Agriculture (BINA), Mymensingh during 20th November, 2011 to 25th March, 2012 during rabi season to select parents for irradiation. Fourteen genotypes including one exotic germplasm were used. The experiment was laid out in a randomized complete block design with three replications. Seedling was planted during last week of November 2011. Recommended production packages were followed to ensure normal plant growth and development. Data on various characters, such as plant height, number of branches per plant, flowers per plant, fruit number per plant and fruit weight per plant were recorded. Maturity period was counted starting from transplanting date till the leaves senesced. Fruit yield of each pot was recorded after harvest. The mean values for different characters of the selected genotypes are presented in Table 1. Significant variations were observed among the genotypes for all the characters. BAUBegun-2 took shorter period (70 days) followed by Pahuja-1, BARI Begun-1, BAUBegun-1 (79 days) and BARI Begun-5 took longer period (95 days) for maturing. The maturity of other genotypes ranged between 81-90 days. Three genotypes BARI Begun-7, BARI Begun-8 and Pahuja-2 had taller plants (81-86) while the genotypes BAUBegun-2, BAUBegun-1 and FCI genotypes had shorter plants (58-62 cm). Number of branches per plant was the highest in FCI genotype (12 plant-1) which was statistically similar to Kansant local (11 plant-1) followed by BARIBegun-5, BARIBegun-7 and BAUBegun-1 (9 plant-1). Flowers per plant were found highest in FCI genotype with statistically similar result of Pahuja-2, purple long and Pahuja-1. But fruits per plant were observed highest in BARI Begun-1 (19.33 plant-1) followed by BARI Begun-4 (16.33 plant-1), FCI (13 plant-1). The genotype FCI produced Table 1. Performance of eggplant genotypes under pot condition at BINA farm, Mymensingh grown during rabi
season 2011-2012.
Genotypes Plant height (cm)
Branches plant-1 (no.)
Flowers plant-1
(no.)
Fruits plant-1
(no.)
Fruit wt plant-1
(g)
Duration (days)
BARI Begun-1 75.0 cd 8.00 c 42.67 c 19.33 a 1174.0 d 79 d BARI Begun- 4 74.6 cd 8.00 cd 44.67 bc 16.33 b 1228.0 cd 90 b BARI Begun-5 71.6 d 9.00 bc 50.33 b 11.00 cd 1329.0 c 95 a BARI Begun-7 86.0 a 9.00 bc 34.33 d 7.00 e 653.0 g 90 b BARI Begun-8 81.3 ab 5.33 f 30.67 d 7.33 e 873.3 f 85 c BARI Begun-9 63.3 e 7.33 de 44.00 bc 9.66 d 1019.0 e 90 b BARI Begun-10 79.3 bc 7.00 de 46.00 bc 7.00 e 607.9 g 81 cd BAU Begun-1 62.0 e 9.00 bc 32.67 d 5.33 f 805.7 f 75 de BAUBegun-2 58.0 e 6.00 ef 31.67 d 8.00 e 546.7 g 79 d Pahuja-1 74.6 cd 5.33 f 61.00 a 6.66 ef 370.3 h 70 e Pahuja-2 85.0 ab 7.66 cd 65.00 a 10.33 d 1833.0 b 79 d Kansant local 75.0 cd 11.00 a 10.00 d 10.00 d 1896.0 b 85 c Purple long 70.0 d 9.00 bc 62.00 a 10.00 d 1904.0 b 82 cd FCI 59.0 e 12.00 a 65.00 a 13.00 c 2055.0 a 89 bc CV (%) 5.68 7.25 6.58 5.98 7.25 3.25
The common letter(s) in a column did not differ at 5% level of probability as per DMRT
352

BINA Annual Report 2011-12 Horticulture
highest fruit yield (2055 g plant-1) followed by Pahuja long (1904 g plant-1), Kansant local (1896 g plant-1) and Pahuja-2 (1833 g plant-1). FCI produced highest flowers per plant though its number of fruits per plant was not found highest. But due to produce highest yield per plant it can be said that FCI produced highest yield for higher fruit size. Although BARI Begun-1 and BARI Begun-4 produced the highest fruits per plant (19.33 and 16.33 respectively) but they did not show higher yield because of their smaller fruit size. There was no disease infestation observed in FCI genotype. The selected genotypes will be tested in advanced yield trial in next season. Fourteen genotypes of eggplant were also tested to evaluate for yield trial at Magura substation farm during rabi season (November 2011-May 2012) presented in Table 2. The experiment was laid out in RCBD with three replications. Unit plot size was 3 m × 2 m and spacing 75 cm × 60 cm. Seedling was planted during first week of November 2011. Recommended production packages were followed to ensure normal plant growth and development. Data on various characters, such as plant height, number of branches per plant, flowers per plant, fruit number per plant, and fruit weight per plant were taken from three replicated plots. Fruit yield of each plot was recorded after harvest. It was observed that among the tested genotypes, FCI had the shortest plant height of 62.67 cm while BARI Begun-7 and BARI Begum-8 had the tallest (92.00 cm and 90.67 cm, respectively). The genotype FCI produced the second highest number of fruits per plant (11.00 plant-1) with average fruit weight of 1849.0 g plant-1 and finally produced the highest fruit yield 57.33 t ha-1. Kansant local produced the second highest fruit yield (51.33 t ha-1) having non- significant difference with BARI Begum-5, which produced fruit yield of 51.16 t ha-1. The selected eggplant genotypes will be irradiated to create variability and to get desirable types (resistant to shoot and fruit borer, higher yield potential, early fruit bearing, photo insensitive characteristics) as well. Table 2. Performance of egg plant genotypes under field condition at BINA farm, Magura grown during rabi
season 2011-2012.
Genotypes Plant height (cm)
Branch plant-1 (no.)
Flowers plant-1
(no.)
Fruits plant-1
(no.)
Fruit wt plant-1
(g)
Yield (t ha-1)
Duration dyes
BARI Begun-1 77.00 d-f 9.33 bc 47.67 d 21.33 a 986.3 de 32.63 e 70 ef BARI Begun-4 74.93 ef 9.93 ab 51.33 d 20.67 a 1123.0 cd 42.13 d 85 bc BARI Begun-5 70.00 gh 9.00 b-e 57.67 c 10.00 b 1243.0 c 51.16 b 93 a BARI Begun-7 92.00 a 8.40 c-e 41.00 e 7.00 d-f 653.3 gh 46.70 c 86 b BARI Begun-8 90.67 a 7.73 ef 36.33 e 7.33 de 873.3 ef 25.00 f 78 d BARI Begun-9 64.67 ij 8.06 de 50.67 d 8.00 d 1052.0 d 32.16 e 83 c BARI Begun-10 88.33 ab 7.80 d-f 51.00 d 7.00 d-f 608.0 h 20.40 g 72 e BAUBegun-1 79.00 de 7.80 ef 39.33 e 5.33 f 805.7 fg 19.23 g 68 f BAUBegun-2 67.33 hi 6.13 g 38.33 e 8.00 cd 546.7 h 15.13 h 69 f Pahuja-1 81.33 cd 6.66 f g 64.67 b 6.66 d-f 370.3 i 06.76 i 64 g Pahuja-2 84.67 bc 7.86 d-f 70.67 a 5.66 ef 1266.0 c 46.12 c 78 d Kansant local 74.00 fg 8.00 de 58.33 bc 9.66 bc 1449.0 b 51.33 b 80 d Purple long 69.67 gh 9.06 b-d 61.00 bc 8.00 d 1598.0 b 49.51 b 79 d FCI 62.67 j 10.50 a 62.67 bc 11.00 b 1849.0 a 57.33 a 85 bc CV (%) 6.50 4.52 5.92 8.25 10.36 9.98 2.52
The common letter(s) in a column did not differ at 5% level of probability as per DMRT
353

BINA Annual Report 2011-12 Horticulture
Lady’s finger
Preliminary screening of elite genotypes of okra (Lady’s finger)
A pot experiment was conducted at the pot yard of BINA, Mymensingh during the Kharif-1 season, 2012 to screen Okra genotypes for selecting parent(s) for irradiation. Twelve genotypes were used in this experiment. The experiment was laid out in a randomized complete block design with three replications. Recommended production packages were followed to ensure normal plant growth and development. Data on various characters, such as plant height, number of branches per plant, flowers per plant, fruit number per plant, and fruit weight per plant were taken from three replicated pots containing one plant per pot. Maturity period was counted from date of planting till the leaves senesced. Fruit yield of each pot was recorded after harvest. Results showed significant variations in all the characters (Table 3). It was observed from results that the plant height of all genotypes ranged from 84-155 cm. The days of maturity ranged from 45 to 56 days with a City Aunamica being the longest (56 days) with statistically similar result of Pankoj Aunamica and Patel Aunamica. Patel Aunamica produced higher number of fruits per plant (28.33 plant-1) and also the highest fruit yield/plant (658.1 g plant-1) having non significant difference with City Aunamica which produced fruit weight per plant of 613.7 g plant-1. Paravani Kanti and Pankoj Aunamica also performed better in respect of fruit yield ranged 530.4-562.2 g plant-1. The selected okra genotypes will be irradiated to create variability and to get desirable types (higher yield potential, early fruit bearing, resistant to YMV, longer harvesting duration, increase of softness, small size with good taste) as well.
Table 3. Performance of okra genotypes under pot condition at BINA farm, Mymensingh grown during rabi season 2011-2012.
Genotypes Plant height (cm)
Branch plant-1 (no.)
Fruits plant-1
(no.) Fruit wt plant-1
(g) Duration
(days) Dev-403 84.6 g 2.6 a-c 26.00 ab 302.0 gh 48 d Dev-407 135.0 c 2.6 a-c 22.66 cd 472.5 e 48 d Dev-408 144.6 b 2.6 a-c 25.33 bc 486.7 de 53 b Paravani Kanti 116.0 d 2.3 b-d 24.33 bc 530.4 cd 50 cd City Aunamica 155.0 a 2.6 a-c 24.66 bc 613.7 ab 56 a Ispahani Aunamica 107.3 e 2.6 a-c 22.66 cd 567.2 bc 53 b Mollah Aunamica 153.0 a 2.0 cd 23.33 b-d 346.0 fg 45 e Patel aunamica 135.0 c 3.3 a 28.33 a 658.1 a 54 ab Sohid Ahunamica 120.0 d 1.6 d 23.66 bc 392.2 f 52 bc Pankoj Aunamica 121.3 d 3.0 ab 23.00 cd 562.2 bc 56 a Bogra-1 105.0 e 1.6 d 20.66 d 290.3 h 49 d Ufshi Aunmica 94.6 f 2.3 b-d 23.00 cd 290.3 h 49 d CV(%) 3.63 11.84 6.29 6.74 2.35 Level of Sig. 0.01 0.01 0.01 0.01 0.01 LSD0.05 7.54 0.745 2.55 49.73 2.03
The common letter(s) did not differ at 5% level of probability as per DMRT
354

BINA Annual Report 2011-12 Horticulture
Twelve genotypes of okra were tested to identify the higher fruit yield at Magura substation during Kharif-1 season 2012 (Table 4). The experiment was laid out in RCBD with three replications. Unit plot size was 4 m × 3 m and spacing 50 cm × 40 cm. Recommended production packages were followed to ensure normal plant growth and development. Data on various characters, such as plant height, number of branches per plant, flowers per plant, fruit number per plant and fruit weight per plant were taken from three randomly selected plants. Maturity period was counted starting from seedling planted till the plants turned into almost all the leaves dried. Fruit yield of each plot was recorded after harvest. Results showed that the tallest plant height was found in City Aunamica (125 cm) which was statistically similar to Mollah Aunamica (123.0 cm). The genotype DEV-403 showed the shortest plant (54.60 cm) of all the genotypes. Days to maturity ranged from 29 to 53 days with City Aunamica being the longest 53 days. Patel Aunamica produced higher number of fruits per plant (27.33 plant-1) and also the highest fruit yield plant-1 (74.10 t ha-1) having non significant difference with City Aunamica and Pankoj Aunamica which produced fruit yield of 68.5 t ha-1 and 67.5 t ha-1, respectively. Paravani Kanti and Ufshi Aunamica also performed better in respect of fruit yield ranged 55.8 -58.4 t ha-1. The selected genotypes will be irradiated to create variability also having desired types. Table 4. Performance of okra genotypes under field condition at BINA farm, Magura grown during Kharif-1
season 2012
Genotypes Plant height (cm)
Branch plant-1
(no.)
Fruits plant-1
(no.)
Fruits wt plant-1
(g)
Yield (t ha-1)
Duration (days)
Dev-403 54.6 g 2.6 a 15.00 e 315.6 f 21.2 g 29 i Dev-407 105.0 c 2.5 ab 25.33 bc 319.5 f 40.5 e 39 f Dev-408 114.6 b 1.3 d 26.00 a 496.7 cd 47.0 de 44 e Paravani Kanti 86.0 d 1.5 cd 24.33 bc 538.0 b-d 55.8 cd 32 h City Aunamica 125.0 a 1.4 d 24.66 bc 623.3 ab 68.5 ab 53 a Ispahani Aunamica 77.3 e 1.2 d 22.66 cd 577.5 a-c 60.5 bc 43 e Mollah Aunamica 123.0 a 1.7 cd 23.33 bcd 353.9 f 30.83 f 46 d Patel aunamica 105.0 c 1.5 cd 27.33 a 666.7 a 74.10 a 46 d Sohid Ahunamica 90.0 d 1.5 cd 23.66 bcd 404.2 ef 28.9 fg 48 c Pankoj Aunamica 91.3 d 2.5 a 25.00 bc 605.8 ab 67.5 ab 36 g Bogra-1 75.0 e 2.0 bc 20.66 d 457.7 de 61.5 bc 50 b Ufshi Aunmica 64.6 f 1.3 d 23.00 b-d 310.6 f 58.4 c 50 b CV (%) 481 11.73 7.16 10.0 10.29 2.81
The common letter(s) in a column did not differ at 5% level of probability as per DMRT
355

BINA Annual Report 2011-12 Horticulture
356

AGRICULTURAL ECONOMICS DIVISION

BINA Annual Report 2011-12 Agricultural Economics
358

BINA Annual Report 2011-12 Agricultural Economics
RESEARCH HIGHLIGHTS
During 2011-12, technical and economic potential of Binadhan-7 experiments were conducted at different three locations. Besides these, Participatory Varietal Selection (PVS) for stress tolerant varieties studies were implemented by Agricultural Economics Division.
The technical and economic potential of Binadhan-7 study was undertaken in three major rice growing areas, namely Rangpur, Comilla and Mymensingh representing three agro-ecological zones of Bangladesh. The study was mainly based on a set of field level primary data collected from 300 sample farmers from three respective areas. The Stochastic Frontier production function analysis was used to determine the technical, allocative and economic efficiency of Binadhan-7 production. The farmers of all locations achieved 4.07 t ha-1 average yield of Binadhan-7. On an average, BCR (full cost basis) and BCR (cash cost basis) were 1.88 and 1.81, respectively. This means that Binadhan-7 growers benefited of Tk. 1.88 and 1.81 per taka for both full and cash cost investment. It shows that per hectare Net Returns were Tk.21, 749/- and 9371/- for full and cash cost basis, respectively. The coefficients of plot size, power tiller, MP, sulphur, pesticide cost and crop duration are found to be significantly positive whereas human labour is negatively significant for small farms in the stochastic frontier. In the technical inefficiency effect model for small farms, the coefficients of age, household size and extension contact are negative and significant which indicates that an increase in the magnitudes of these variables results in the corresponding decrease in the technical inefficiency effect. The PVS study was conducted on the basis of these objectives; to identify the best variety/mutant line; to assess the acceptability of crop varieties/mutant lines; to identify the consumers preference (cooking quality, grain shape-size, aroma, tastiness etc); to determine the economic constraints of the worst varieties/mutant lines. In Labanchara of Khulna nine rice lines with one salt tolerant check variety (Binadhan-8), RCBD with 3 replications was considered for the study. Binadhan-8 provided the highest yield (4.53 t ha-1), but the yield of line P19S8 was not satisfactory, though the farmers preference was high. At Kaligonj, check variety Binadhan-8 performed well with highest yield (2.08 t ha-1) and its superior performance also exhibited at Shyamnagor.
359

BINA Annual Report 2011-12 Agricultural Economics
Economic impact assessment study of mutant crop varieties/technologies developed at BINA
Technical and Economic Potential of Binadhan-7 production (a aman rice variety)
The study was undertaken in three major rice growing areas, namely Rangpur, Comilla and Mymensingh representing three agro-ecological zones of Bangladesh. The analysis was mainly based on a set of field level primary data collected from 300 sample farmers from three respective areas. Tabular, statistical and project appraisal technique were used for analyzing the collected data. In the study, costs and return analysis were done on both cash cost and full cost basis and students t-test was applied to test the observed difference between means. The Stochastic Frontier production function analysis was used to determine the technical, allocative and economic efficiency of Binadhan-7 production. According to Table 1, the farmers of all locations achieved 4.07 t ha-1 average yield of Binadhan-7. On an average, the Benefit Cost Ratio (BCR-full cost basis) and BCR (cash cost basis) were 1.88 and 1.81, respectively. This means that Binadhan-7 growers benefited of Tk. 1.88 and 1.81 per taka for both full and cash cost investment. Table 1 shows that per hectare Net Returns (full cost basis) and Net return (cash cost basis) were Tk.21, 749/- and 9371/-, respectively. Table 1. BCR, net return and per hectare yield of Binadhan-7 in different areas
BCR Net return Area Farm category Yield (kg/ha) full cost basis cash cost basis full cost basis cash cost basis
Small 4705.63 1.88 1.42 24024.06 10378.57 Medium 4700.43 1.88 1.35 23900.16 10377.27 Large 4831.35 1.92 1.70 25037.30 10381.94
Comilla
Mean 4714.81 1.88 1.42 24064.45 10378.34 Small 3483.14 1.75 2.54 17468.88 7967.68 Medium 3657.10 1.87 2.06 20410.10 10109.88 Large 3385.81 1.67 2.12 15849.88 8276.06
Mymensingh
Mean 3528.50 1.78 2.20 18244.94 9008.93 Small 3876.90 1.97 2.33 21884.40 29961.72 Medium 4021.87 1.99 1.75 23317.68 8670.38 Large 3997.62 1.99 1.53 23252.19 8752.44
Rangpur
Mean 3977.87 1.98 1.83 22938.40 8724.91 Small 4110.56 1.80 1.65 19013.42 9216.28 Medium 4241.96 2.05 2.13 25105.38 9726.05 Large 3728.79 1.78 1.65 19574.81 8957.16
All three areas
Mean 4073.73 1.88 1.81 21749.26 9370.73 Table 2 presents estimates of the area-specific Cobb-Douglas Stochastic Frontier production function for Binadhan-7. The coefficients of plot size, seed, MP and pesticides are found to be positive and significant in the Comilla area. The coefficients of urea and land rent are negative and significant which indicates that the output of Binadhan-7 decreases with the increase in the magnitude of these variables. The function coefficients show that in Comilla area the production technology is characterized
360

BINA Annual Report 2011-12 Agricultural Economics
Table 2. Ordinary Least Squares (OLS) Estimates and Maximum Likelihood (ML) Estimates of Area-Specific Cobb-Douglas (C-D) Stochastic Production Frontier for Binadhan-7
Areas
Comilla Mymensingh Rangpur
Independent variables OLS Estimates
(SE)
ML Estimates
(Asymptotic SE)
OLS Estimates
(SE)
ML Estimates
(Asymptotic SE)
OLS Estimates
(SE)
ML Estimates
(Asymptotic SE)
Stochastic Frontier: symbols Intercept β0 0.006
(2.261) 0.013
(0.986) -2.770
(12.841) -1.541 (0.987)
16.755 (16.155)
18.400** (0.976)
Plot size β 1 3.165** (1.105)
3.162** (0.625)
0.758 (0.666)
0.041 (0.236)
-0.052 (0.288)
-0.607** (0.025)
Human labour β 2 0.044 (0.057)
0.044 (0.052)
-1.177** (0.543)
-0.381** (0.058)
-0.065* (0.029)
0.049** (0.003)
Power tiller cost β 3 -0.008 (0.034)
-0.008 (0.032)
0.128* (0.112)
0.168 (0.130)
0.099* (0.041)
0.022** (0.007)
Seed β 4 0.021* (0.009)
0.021* (0.008)
0.357 (0.247)
0.165 (0.143)
0.044* (0.023)
0.144** (0.004)
Urea β 5 -0.079** (0.028)
-0.079** (0.027)
0.010* (0.004)
0.067* (0.026)
-0.045 (0.229)
0.264** (0.011)
TSP β 6 -0.029 (0.016)
-0.029* (0.014)
-0.166 (0.262)
-0.246** (0.029)
-0.037 (0.085)
-0.006 (0.004)
MP β 7 0.048** (0.024)
0.048* (0.024)
0.118* (0.058)
0.209** (0.060)
0.061* (0.028)
0.061** (0.001)
Sulphur β 8 -0.024 (0.054)
-0.024 (0.048)
0.069 (0.067)
0.046* (0.023)
0.053 (0.389)
-0.450** (0.012)
Manure β 9 -0.001 (0.054)
-0.001 (0.049)
0.172 (0.174)
0.029 (0.076)
0.004 (0.149)
0.056** (0.010)
Pesticide cost β 10 0.089** (0.035)
0.089** (0.031)
0.038* (0.016)
-0.006 (0.021)
-0.008 (0.054)
0.002 (0.003)
Land rent β 11 -2.199* (1.341)
-2.196** (0.627)
-0.088 (0.133)
-0.001 (0.061)
0.007* (0.003)
0.074** (0.003)
Seedling age β 12 0.019 (0.104)
0.019 (0.099)
0.687* (0.313)
0.143 (0.148)
0.388 (0.664)
0.053** (0.013)
Crop duration β 13 2.076 (1.168)
2.074** (0.483)
1.428 (2.608)
1.694** (0.207)
-2.161 (3.175)
-1.950** (0.189)
Dummy for land type (1 = MHL, 0 = otherwise)
β 14 -0.025 (0.034)
-0.025 (0.031)
-0.125 (0.292)
0.049 (0.147)
-0.138 (0.372)
-0.287** (0.002)
Dummy for transplanting date (1 = optimum, 0 = otherwise)
β 15 -0.026 (0.042)
-0.026 (0.038)
0.432 (0.289)
0.818** (0.056)
-0.053 (0.278)
-0.276** (0.012)
Dummy for variety (1 = Binasail, 0 = otherwise)
β 16 0.014 (0.040)
0.014 (0.037)
-0.433 (0.265)
-0.881** (0.040)
-0.112 (0.254)
-0.158** (0.006)
Function Coefficient 1.01 1.03 0.99 1.01 0.93 0.94 F-statistic model 50.34* 45.22* 17.41* Adj. R2 0.84 0.80 0.71 Variance parameters Sigma squared σ2 0.207 0.406**
(0.001) 0.537 0.728**
(0.275) 0.602 0.944**
(0.570) Gamma γ 0.390
(0.227) 0.989**
(0.0001) 0.998**
(0.0002) Log likelihood function 118.560 118.560 -101.485 -74.859 -107.241 -82.515
** and * indicate significant at 1 percent and 5 percent level of probability, respectively. Figures in the parenthesis indicate standard error
361

BINA Annual Report 2011-12 Agricultural Economics
by increasing return to scale for Binadhan-7. In Mymensingh area the coefficients of power tiller, urea, MP and seedling age are significantly positive whereas the coefficient of human labour is significantly negative. The function coefficients show constant return to scale. The coefficients of power tiller cost, seed, MP and land rent are significantly positive in Rangpur area whereas coefficient of pesticide cost, land type, transplanting date and variety dummy are found to be negative but not significant. The production technology in Rangpur area for Binadhan-7 is characterized by decreasing return to scale. There are significant inefficiency effects in all areas. For Binadhan-7, the coefficient of plot size, seed, MP, pesticides and crop duration are found to be significant and positive in Comilla area in the Cobb-Douglas Stochastic Frontier production function (Table 3) while the coefficients of urea, TSP, land rent and land type (dummy) are significantly negative. In the inefficiency effect model, the coefficients of experience is found to be significant with positive signs and coefficients of farm size and extension contact are found to be significant with expected signs which means that the inefficiency effect in production decreases with the increase in farm size and extension contact. In Mymensingh area, the coefficients of power tiller, urea, MP, seedling age, crop duration and transplanting date (dummy) are found to be significant with positive signs whereas the coefficient of human labour, TSP and variety (dummy) is significantly negative in the stochastic frontier. The coefficients of education and occupation are significant with expected signs in the technical inefficiency effect model. The signs of the coefficients of experience, farm size, household size, extension contact and training (dummy) are also expected but these coefficients are not significant. In Rangpur area, the coefficient of power tiller, seed, MP and land rent are significant with positive sign but plot size, TSP, sulphur, crop duration, and land type (dummy) coefficient of variable are found to be negative and significant in the stochastic frontier. In the technical inefficiency effect model, the coefficient of occupation and experiences are negative and significant which means that the inefficiency effect decreases with the increase in the number of farmers with agriculture occupation and experience of farmers. The significantly large values of γ for all areas remind us that there are significant inefficiency effects in the production in all areas. Table 3. Maximum Likelihood (ML) Estimates for Parameters of Area-Specific Cobb-Douglas Stochastic
Frontier Production Functions and Technical Inefficiency Effect Model for Binadhan-7
Areas Independent variables Comilla Mymensingh Rangpur Stochastic Frontier: symbols Intercept β0 0.559
(1.129) -1.294 (1.547)
17.622** (0.957)
Plot size β 1 3.236** (0.565)
0.208 (0.123)
-0.493* (0.212)
Human labour β 2 -0.004 (0.094)
-0.430** (0.051)
0.023 (0.120)
Power tiller cost β 3 0.020 (0.051)
0.135** (0.031)
0.091* (0.044)
Seed β 4 0.043* (0.019)
0.052 (0.052)
0.080* (0.038)
Urea β 5 -0.098** (0.026)
0.065** (0.024)
0.136 (0.343)
362
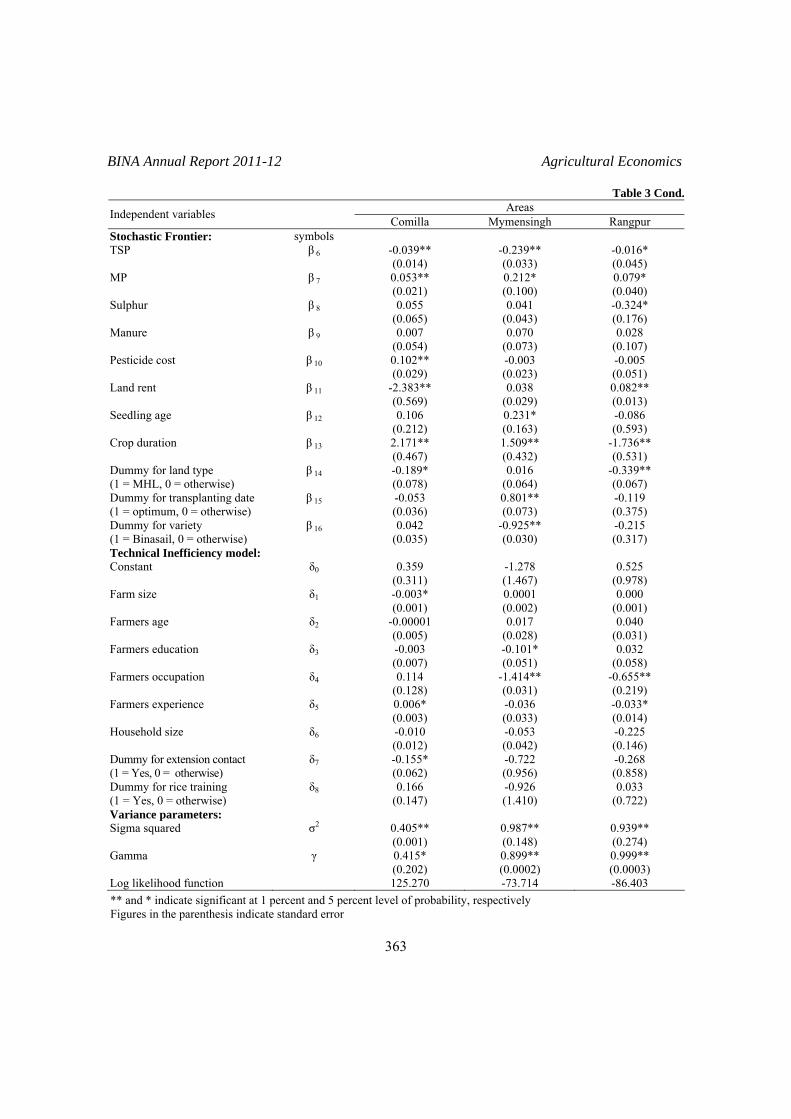
BINA Annual Report 2011-12 Agricultural Economics
Table 3 Cond. Areas Independent variables Comilla Mymensingh Rangpur
Stochastic Frontier: symbols TSP β 6 -0.039**
(0.014) -0.239** (0.033)
-0.016* (0.045)
MP β 7 0.053** (0.021)
0.212* (0.100)
0.079* (0.040)
Sulphur β 8 0.055 (0.065)
0.041 (0.043)
-0.324* (0.176)
Manure β 9 0.007 (0.054)
0.070 (0.073)
0.028 (0.107)
Pesticide cost β 10 0.102** (0.029)
-0.003 (0.023)
-0.005 (0.051)
Land rent β 11 -2.383** (0.569)
0.038 (0.029)
0.082** (0.013)
Seedling age β 12 0.106 (0.212)
0.231* (0.163)
-0.086 (0.593)
Crop duration β 13 2.171** (0.467)
1.509** (0.432)
-1.736** (0.531)
Dummy for land type (1 = MHL, 0 = otherwise)
β 14 -0.189* (0.078)
0.016 (0.064)
-0.339** (0.067)
Dummy for transplanting date (1 = optimum, 0 = otherwise)
β 15 -0.053 (0.036)
0.801** (0.073)
-0.119 (0.375)
Dummy for variety (1 = Binasail, 0 = otherwise)
β 16 0.042 (0.035)
-0.925** (0.030)
-0.215 (0.317)
Technical Inefficiency model: Constant δ0 0.359
(0.311) -1.278 (1.467)
0.525 (0.978)
Farm size δ1 -0.003* (0.001)
0.0001 (0.002)
0.000 (0.001)
Farmers age δ2 -0.00001 (0.005)
0.017 (0.028)
0.040 (0.031)
Farmers education δ3 -0.003 (0.007)
-0.101* (0.051)
0.032 (0.058)
Farmers occupation δ4 0.114 (0.128)
-1.414** (0.031)
-0.655** (0.219)
Farmers experience δ5 0.006* (0.003)
-0.036 (0.033)
-0.033* (0.014)
Household size δ6 -0.010 (0.012)
-0.053 (0.042)
-0.225 (0.146)
Dummy for extension contact (1 = Yes, 0 = otherwise)
δ7 -0.155* (0.062)
-0.722 (0.956)
-0.268 (0.858)
Dummy for rice training (1 = Yes, 0 = otherwise)
δ8 0.166 (0.147)
-0.926 (1.410)
0.033 (0.722)
Variance parameters: Sigma squared σ2 0.405**
(0.001) 0.987** (0.148)
0.939** (0.274)
Gamma γ 0.415* (0.202)
0.899** (0.0002)
0.999** (0.0003)
Log likelihood function 125.270 -73.714 -86.403 ** and * indicate significant at 1 percent and 5 percent level of probability, respectively Figures in the parenthesis indicate standard error
363

BINA Annual Report 2011-12 Agricultural Economics
Table 4 shows OLS estimates and ML estimates of farm-size-specific Cobb-Douglas stochastic production frontiers for Binadhan-7. The coefficients of human labour, power tiller, TSP, MP, pesticide cost, crop duration and land type dummy are positive and significant for small farms. The coefficients of plot size, TSP and pesticides are positively significant for all farm size groups. The quasi-function coefficient in both the frontier and the OLS model is 1.06 which shows increasing return to scale. For medium sized farms, the coefficient of plot size, human labour, seed, TSP and pesticides are found to be significantly positive whereas coefficients of urea are found to be significantly negative and all other coefficients of variables in the model are insignificant. The quasi-function coefficient which is the sum of all coefficients of all variables is about 1.01 for OLS model and 1.02 for the frontier model, which means increasing return to scale existed for medium farms. For large farms, the coefficients of plot size, TSP and pesticides are positive and significant whereas the coefficients of human labour are found to be significantly negative. The quasi-function coefficient is 1.02 for OLS model and 1.03 for the frontier model which reveals increasing return to scale. The models are well fitted to the data for all farm groups. The inefficiency effect is significant only in large farm group. The significant values of γ show that there are significant inefficiency effects in large farm groups of Binadhan-7.
364

BINA Annual Report 2011-12 Agricultural Economics
Table 4. Ordinary Least Squares (OLS) Estimates and Maximum Likelihood (ML) Estimates of Farm-Size-Specific Cobb-Douglas (C-D) Stochastic Production Frontiers for Binadhan-7
Farm groups
Small Medium Large
Independent variables OLS Estimates
(SE)
ML Estimates
(Asymptotic SE)
OLS Estimates
(SE)
ML Estimates
(Asymptotic SE)
OLS Estimates
(SE)
ML Estimates
(Asymptotic SE)
Stochastic Frontier: symbols Intercept β0 -1.238**
(1.926) -1.218 (0.990)
2.743 (2.202)
2.756* (1.228)
-1.236 (2.936)
1.316 (2.278)
Plot size β 1 0.934** (0.093)
0.934** (0.086)
0.841** (0.084)
0.841** (0.077)
0.966** (0.077)
0.979** (0.067)
Human labour β 2 0.229** (0.067)
0.229** (0.061)
0.109* (0.050)
0.109* (0.047)
-0.047* (0.023)
-0.046* (0.023)
Power tiller cost β 3 0.175* (0.067)
-0.175** (0.061)
-0.024 (0.028)
-0.024 (0.026)
0.037* (0.016)
0.034 (0.028)
Seed β 4 0.0001 (0.058)
0.0001 (0.054)
0.132** (0.040)
0.132** (0.036)
-0.043 (0.038)
-0.033 (0.031)
Urea β 5 0.016 (0.027)
0.016 (0.026)
-0.052* (0.026)
-0.052* (0.025)
-0.013 (0.033)
-0.053 (0.031)
TSP β 6 0.041* (0.021)
0.041* (0.019)
0.028* (0.012).
0.028** (0.011)
0.034* (0.022)
0.028* (0.014)
MP β 7 0.087* (0.040)
0.087* (0.038)
0.001 (0.017)
0.001 (0.016)
0.010 (0.024)
0.008 (0.020)
Sulphur β 8 0.022* (0.012)
0.022 (0.026)
-0.035 (0.022)
-0.035 (0.020)
-0.009 (0.027)
-0.003 (0.024)
Manure β 9 0.002 (0.063)
0.002 (0.059)
0.010 (0.025)
0.010 (0.024)
0.050 (0.044)
0.047 (0.036)
Pesticide cost β 10 0.034* (0.011)
0.034** (0.010)
0.023** (0.008)
0.023** (0.007)
0.045** (0.011)
0.046** (0.009)
Land rent β 11 -0.018 (0.029)
-0.018 (0.027)
-0.016* (0.008)
-0.016 (0.018)
-0.042 (0.100)
-0.047 (0.081)
Seedling age β 12 -0.196 (0.171)
-0.194 (0.163)
0.054 (0.102)
0.053 (0.096)
0.058 (0.181)
-0.048 (0.151)
Crop duration β 13 1.048* (0.383)
1.044** (0.228)
0.044 (0.427)
0.043 (0.215)
0.840 (0.534)
0.472 (0.425)
Dummy for land type (1 = MHL, 0 = otherwise)
β 14 0.118* (0.044)
0.118** (0.038)
0.035 (0.040)
0.035 (0.034)
0.043 (0.084)
-0.007 (0.072)
Dummy for transplanting date (1 = optimum, 0 = otherwise)
β 15 0.086 (0.067)
0.087 (0.061)
-0.042 (0.045)
-0.042 (0.043)
-0.022 (0.129)
0.044 (0.108)
Dummy for variety (1 = Binadhan-7, 0 = otherwise)
β 16 -0.064 (0.066)
-0.064 (0.060)
0.015 (0.041)
0.015 (0.038)
-0.045 (0.122)
-0.112 (0.104)
Function Coefficient 1.06 1.062 1.01 1.022 1.02 1.031 F-statistic model 80.11* 35.34* 98.38* Adj. R2 0.88 0.84 0.77 Variance parameters Sigma squared σ2
0.124 0.320** (0.005) 0.122 0.419**
(0.007) 0.147 0.388 (0.204)
Gamma γ 0.398 (0.216) 0.528
(0.442) 0.926** (0.083)
Log likelihood function 53.634 53.633 72.545 72.545 17.535 19.319 ** and * indicate significant at 1 percent and 5 percent level of probability, respectively. Figures in the parenthesis indicate standard error
365

BINA Annual Report 2011-12 Agricultural Economics
To identify the factors which influence technical inefficiency effects according to farm groups, farm size-specific Cobb-Douglas stochastic production frontier and technical inefficiency effect models were estimated for Binadhan-7. Table 5 shows simultaneous estimation of farm-size-specific Cobb-Douglas stochastic frontiers and technical inefficiency effect models for Binadhan-7. The coefficients of plot size, power tiller, MP, sulphur, pesticide cost and crop duration are found to be significantly positive whereas human labour is negatively significant for small farms in the stochastic frontier. In the technical inefficiency effect model for small farms, the coefficients of age, household size and extension contact are negative and significant which indicates that an increase in the magnitudes of these variables results in the corresponding decrease in the technical inefficiency effect. Table 5 reveals that the coefficients of human labour, seed and TSP are positive and significant whereas the coefficient of urea is significantly negative for medium farm size groups for Binadhan-7. In the technical inefficiency effect model for medium farms, the coefficient of extension contact is negative and significant which indicates that an increase in the magnitudes of extension contact variables results in the corresponding decrease in the technical inefficiency effect. For large farms, the coefficients of plot size, power tiller, TSP and pesticide cost are found to be positive and significant whereas the coefficients of human labour and variety (dummy) are significantly negative for medium farm size groups for Binadhan-7. In the technical inefficiency effect model for large farms, the coefficient of extension contact is negative and significant. Decreasing return to scale prevails in all farm size groups. The models are well fitted to the data for all farm size groups. The significant value of γ indicates that there are significant inefficiency effects in the large and small farms (Table 5). Table 5. Maximum Likelihood (ML) Estimates of Parameters of Farm-Size-Specific Cobb-Douglas Stochastic
Production Frontiers Function and Technical Inefficiency Effect Model for Binadhan-7
Farm groups Independent variables Para-meters Small Medium Large
Stochastic Frontier: Intercept β0 -2.457*
(1.140) 2.768** (1.000)
2.392 (3.267)
Plot size β 1 1.110** (0.182)
0.841 (0.990)
0.857** (0.069)
Human labour β 2 -0.239* (0.116)
0.109* (0.049)
-0.053* (0.027)
Power tiller cost β 3 0.256* (0.119)
-0.024 (0.099)
0.028* (0.013)
Seed β 4 -0.060 (0.045)
0.132* (0.059)
-0.003 (0.028)
Urea β 5 0.019 (0.025)
-0.052* (0.025)
-0.027 (0.031)
TSP β 6 0.020 (0.018)
0.027* (0.013)
0.036* (0.019)
MP β 7 0.071* (0.034)
0.001 (0.199)
0.016 (0.021)
366

BINA Annual Report 2011-12 Agricultural Economics
Table 5 Contd. Farm groups Independent variables Parameters
Small Medium Large Sulphur β 8 0.082*
(0.037) -0.035 (0.219)
0.020 (0.025)
Manure β 9 0.008 (0.056)
0.010 (0.197)
0.041 (0.034)
Pesticide cost β 10 0.025* (0.010)
0.023 (0.128)
0.027** (0.011)
Land rent β 11 -0.027 (0.027)
-0.016* (0.008)
0.078 (0.089)
Seedling age β 12 -0.162 (0.181)
0.054 (0.113)
0.036 (0.153)
Crop duration β 13 0.983** (0.244)
0.044 (0.775)
0.118 (0.547)
Dummy for land type (1 = MHL, 0 = otherwise)
β 14 -0.136 (0.105)
0.035 (0.539)
-0.088 (0.101)
Dummy for transplanting date (1 = optimum, 0 = otherwise)
β 15 0.008 (0.058)
-0.042 (0.678)
0.108 (0.100)
Dummy for variety (1 = Binadhan-7, 0 = otherwise)
β 16 -0.030 (0.060)
0.015 (0.214)
-0.150* (0.069)
Technical Inefficiency model: Constant δ0
0.333 (0.240)
-0.00000001 (0.00000001)
0.743** (0.279)
Farm size δ10.004
(0.003) 0.00000069 (0.0000007)
-0.000 (0.000)
Farmers age δ2-0.006* (0.003)
-0.00000025 (0.0000003)
0.004 (0.006)
Farmers education δ3-0.010 (0.009)
0.00000072 (0.0000007)
-0.053 (0.043)
Farmers occupation δ40.003
(0.049) 0.00000003
(0.00000003) -0.187 (0.172)
Farmers experience δ50.011* (0.004)
0.00000117 (0.0000012)
-0.008 (0.008)
Household size δ6-0.047** (0.015)
-0.000000055 (0.00000006)
-0.028 (0.030)
Dummy for extension contact (1 = Yes, 0 = otherwise) δ7
-0.197** (0.046)
-0.00000046* (0.00000024)
-0.865** (0.329)
Dummy for rice training (1 = Yes, 0 = otherwise) δ8
-0.028 (0.059)
-0.000000064 (0.00000006)
-0.052 (0.165)
Variance parameters Sigma squared σ2 0.311**
(0.002) 0.195
(0.099) 0.437** (0.008)
Gamma γ 0.431** (0.0001)
0.180 (0.099)
0.724** (0.080)
Log likelihood function 81.938 72.543 38.379 ** and * indicate significant at 1 percent and 5 percent level of probability, respectively. Figures in the parenthesis indicate standard error
367
BINA Annual Report 2011-12 Agricultural Economics
The coefficients of output, human labour wage, power tiller price and sulphur price are significantly positive whereas the coefficients of seed price, land rent and land type (dummy) are found to be significantly negative in the cost frontier in Comilla area for Binadhan-7 (Table 6). In Mymensingh area, the coefficients output and human labour wage significantly positive but the coefficient of pesticide price is significantly negative. The coefficient of output and human labour price are positive and significant whereas power tiller and seed price are negatively significant in Rangpur area for Binadhan-7. To identify factors which influence economic inefficiency for producing Binadhan-7 in all areas, area-specific Cobb-Douglas stochastic normalized cost frontiers and economic inefficiency effect models were estimated. Table-7 reveals that the coefficients of output and human labour are significantly positive in cost frontiers in all areas. In addition, the coefficients of seed, TSP, pesticide and land type (dummy) are found to be negative in the stochastic frontier in Comilla area for Binadhan-7. In the economic inefficiency effect model, the coefficient of farm size is significantly positive whereas the coefficients of training are significantly negative in Comilla area. In Mymensingh area, the coefficients of experience and extension contact are found to be significantly negative but in Rangpur area only the coefficient of experience, household size and extension contact (dummy) variable are significantly negative in the economic inefficiency effect model. The coefficients of output are positive and significant in all farm size groups for Binadhan-7 (Table 8). It reveals that in small farms, the coefficients of MP price and land type (dummy) are positive and significant whereas the coefficient of pesticide price and transplanting date (dummy) are significantly negative. In medium farms, the coefficients of human labour and TSP price are positive and significant in the cost frontier whereas the coefficient of land type (dummy) is significantly negative. The coefficients of human labour and land rent are significantly positive in large farm. The significant value of γ shows that there are significant economic inefficiency effects in small farm groups for Binadhan-7. Table 8 presents simultaneous estimation of farm-size-specific Cobb-Douglas stochastic normalized cost frontiers and economic inefficiency effect models for Binadhan-7. The coefficient of output is significantly positive in all farm groups in the cost frontiers. In addition, coefficients of TSP price and land type (dummy) are positively significant in small farms. The coefficients of human labour price and TSP price are significantly positive in medium farms whereas the coefficient of variety (dummy) is significantly positive in addition to other coefficients discussed earlier for large farms. Table 9 shows that in the economic inefficiency effect model, the coefficient of age is significant with negative signs in small farms whereas education, occupation, experience, household size, extension contact (dummy) are negative but insignificant. In medium farms, the coefficients of age and extension contact are found to be significant with expected (negative) signs. The coefficients of extension contact (dummy) and training (dummy) are also significant with the expected negative signs in large farm in the economic inefficiency effect model which means that the economic inefficiency effect decreases with the increase in the magnitudes of these variables.
368

BINA Annual Report 2011-12 Agricultural Economics
Table 6. Ordinary Least Square (OLS) and Maximum Likelihood (ML) Estimates for Parameters of Area-Specific Cobb-Douglas Stochastic Normalized Cost Frontiers for Binadhan-7
Areas Comilla Mymensingh Rangpur
Independent variables Parameters OLS Estimates
(SE)
ML Estimates
(Asymptotic SE)
OLS Estimates
(SE)
ML Estimates
(Asymptotic SE)
OLS Estimates
(SE)
ML Estimates
(Asymptotic SE)
Stochastic Frontier: Intercept β0 -5.351**
(0.492) -5.357** (0.408)
-5.453** (0.789)
-5.641** (0.997)
-3.608** (0.909)
-3.612** (0.970)
Output β 1 0.890** (0.019)
0.890** (0.017)
0.931** (0.031)
0.925 (0.526)
0.962** (0.026)
0.962** (0.025)
Human labour price β 2 0.980** (0.027)
0.980** (0.025)
0.803** (0.148)
0.784* (0.328)
0.814** (0.121)
0.814** (0.117)
Power tiller price β 3 0.112* (0.061)
0.112* (0.057)
-0.263 (0.163)
-0.248 (0.912)
-0.704** (0.263)
-0.705** (0.264)
Seed price β 4 -0.137* (0.068)
-0.137* (0.063)
-0.161 (0.123)
-0.149 (0.760)
-0.714** (0.252)
-0.714** (0.248)
TSP price β 5 -0.003 (0.003)
-0.003 (0.003)
-0.022 (0.020)
-0.029 (0.506)
0.002 (0.012)
0.002 (0.011)
MP price β 6 -0.005 (0.003)
-0.005 (0.003)
-0.029* (0.015)
-0.029 (0.361)
-0.001 (0.009)
-0.001 (0.009)
Sulphur price β 7 0.021* (0.009)
0.021* (0.009)
-0.022 (0.024)
-0.038 (0.506)
0.018 (0.025)
0.018 (0.023)
Manure price β 8 0.013 (0.008)
0.013 (0.008)
-0.012 (0.021)
-0.010 (0.203)
0.015 (0.031)
0.015 (0.030)
Pesticide price β 9 -0.005 (0.008)
-0.005 (0.008)
-0.042* (0.020)
-0.035* (0.018)
0.007 (0.029)
0.008 (0.028)
Land rent β 10 -0.019* (0.009)
-0.019* (0.008)
0.005 (0.024)
0.038 (0.541)
0.001 (0.025)
0.001 (0.024)
Dummy for land type (1 = MHL, 0 = otherwise)
β 11 -0.099** (0.031)
-0.099** (0.028)
-0.201** (0.068)
-0.042 (0.466)
-0.023 (0.102)
-0.023 (0.095)
Dummy for transplanting date (1 = optimum, 0 = otherwise)
β 12 0.041 (0.039)
0.041 (0.036)
-0.058 (0.079)
-0.103 (0.987)
-0.013 (0.064)
-0.013 (0.065)
Dummy for variety (1 = Binadhan-7, 0 = otherwise)
β 13 -0.020 (0.038)
-0.020 (0.036)
-5.453** (0.789)
0.143 (0.998)
-0.045 (0.062)
-0.045 (0.059)
F-statistic model 156.23* 127.25* 29.30* Adj. R2 0.91 0.89 0.74 Variance parameters Sigma squared σ2 0.205 0.455**
(0.001) 0.140 0.479**
(0.127) 0.137 0.532**
(0.009) Gamma γ 0.509
(0.303) 0.934*
(0.410) 0.408
(0.299) Log likelihood function 127.771 127.770 26.438 30.943 30.858 30.857
** and * indicate significant at 1 percent and 5 percent level of probability, respectively. Figures in the parenthesis indicate standard error
369

BINA Annual Report 2011-12 Agricultural Economics
Table 7. Maximum Likelihood Estimates of Area-Specific Cobb-Douglas Stochastic Normalized Cost Frontiers and Economic Inefficiency Effect Models for Binadhan-7
Areas Independent variables Parameters Comilla Mymensingh Rangpur Stochastic Frontier: Intercept β0 0.729
(1.179) -6.098** (0.707)
-4.246** (1.023)
Output β 1 0.741** (0.037)
0.975** (0.035)
0.830** (0.045)
Human labour price β 2 1.052** (0.038)
0.826** (0.129)
0.652** (0.145)
Power tiller price β 3 -0.053 (0.188)
-0.163 (0.102)
-0.278 (0.261)
Seed price β 4 -0.910** (0.070)
-0.143 (0.085)
-0.152 (0.253)
TSP price β 5 -0.012** (0.004)
-0.056** (0.015)
0.007 (0.010)
MP price β 6 0. 004 (0.003)
-0.044** (0.010)
0.001 (0.007)
Sulphur price β 7 0.019 (0.028)
-0.004 (0.013)
0.013 (0.020)
Manure price β 8 0.009 (0.010)
-0.003 (0.014)
0.005 (0.028)
Pesticide price β 9 -0.008** (0.003)
-0.025** (0.008)
0.002 (0.026)
Land rent β 10 -0.017 (0.010)
0.019 (0.021)
-0.004 (0.022)
Dummy for land type (1 = MHL, 0 = otherwise) β 11 -0.394** (0.067)
0.096 (0.062)
0.055 (0.101)
Dummy for transplanting date (1 = optimum, 0 = otherwise) β 12 0.040 (0.119)
-0.051 (0.056)
-0.025 (0.052)
Dummy for variety (1 = Binadhan-7, 0 = otherwise) β 13 -0.026 (0.103)
0.096 (0.051)
-0.022 (0.051)
Inefficiency effect model: Constant δ0 0.642
(0.498) 0.132
(0.192) 0.733** (0.168)
Farm size δ1 0.002* (0.001)
0.001 (0.002)
0.003 (0.003)
Farmers age δ2 -0.006 (0.007)
0.005 (0.007)
0.004 (0.003)
Farmers education δ3 0.003 (0.011)
-0.009 (0.019)
0.004 (0.007)
Farmers occupation δ4 -0.069 (0.104)
-0.037 (0.143)
-0.026 (0.047)
Farmers experience δ5 0.003 (0.011)
-0.013* (0.006)
-0.005* (0.002)
Household size δ6 0.002 (0.028)
-0.050 (0.034)
-0.029* (0.013)
Dummy for extension contact (1 = Yes, 0 = otherwise) δ7 -0.094 (0.093)
-2.402* (1.285)
-0.180** (0.030)
Dummy for rice training (1 = Yes, 0 = otherwise) δ8 -0.247** (0.048)
-0.798 (0.597)
-0.033 (0.049)
Variance parameters Sigma squared σ2 0.504**
(0.001) 0.504** (0.031)
0.415** (0.002)
Gamma γ 0.999** (0.013)
0.993** (0.013)
0.992** (0.149)
Log likelihood function 147.78 47.192 67.80 ** and * indicate significant at 1 percent and 5 percent level of probability, respectively Figures in the parenthesis indicate standard error
370

BINA Annual Report 2011-12 Agricultural Economics
Table 8. Ordinary Least Square (OLS) and Maximum Likelihood (ML) Estimates for Parameters of Farm-Size-Specific Cobb-Douglas Stochastic Normalized Cost Frontiers for Binadhan-7
Farm groups
Small Medium Large
Independent variables Parameters OLS Estimates
(SE)
ML Estimates
(Asymptotic SE)
OLS Estimates
(SE)
ML Estimates
(Asymptotic SE)
OLS Estimates
(SE)
ML Estimates
(Asymptotic SE)
Stochastic Frontier: Intercept β0 -2.403*
(1.100) -2.370* (0.858)
-3.975** (0.871)
-4.169** (0.580)
-1.380 (1.380)
-1.670 (1.330)
Output β 1 0.854** (0.227)
0.938** (0.080)
0.619** (0.060)
0.622** (0.039)
0.865** (0.065)
0.874** (0.067)
Human labour price β 2 -1.240 (1.210)
-1.100** (0.142)
0.747** (0.073)
0.751** (0.048)
0.496** (0.171)
0.485** (0.157)
Power tiller price β 3 -0.665 (1.340)
-0.459 (0.477)
-0.068 (0.145)
-0.028 (0.105)
0.362 (0.410)
0.358 (0.388)
Seed price β 4 0.369 (0.831)
0.214 (0.375)
0.118 (0.139)
0.146 (0.098)
0.066 (0.247)
0.078 (0.236)
TSP price β 5 0.601 (1.000)
0.497 (0.721)
0.027** (0.012)
0.024** (0.008)
0.011 (0.019)
0.009 (0.019)
MP price β 6 0.006* (0.003)
0.003** (0.001)
0.012 (0.010)
0.010 (0.007)
-0.007 (0.015)
-0.007 (0.013)
Sulphur price β 7 -0.001 (0.043)
0.012** (0.002)
-0.011 (0.034)
-0.007 (0.024)
-0.023 (0.026)
-0.020 (0.025)
Manure price β 8 -0.006 (0.055)
0.439 (0.710)
-0.027 (0.033)
-0.022 (0.023)
-0.011 (0.026)
-0.010 (0.024)
Pesticide price β 9 -2.840** (0.960)
-2.870** (0.587)
0.347 (0.800)
0.453 (0.662)
-0.003 (0.027)
-0.002 (0.024)
Land rent β 10 -0.879 (0.551)
-0.430 (0.705)
-0.616 (3.400)
-0.523 (0.750)
0.020* (0.010)
0.021* (0.010)
Dummy for land type (1 = MHL, 0 = otherwise)
β 11 2.870** (0.954)
2.810** (0.578)
-0.302** (0.060)
-0.302** (0.041)
-0.252** (0.087)
-0.244** (0.087)
Dummy for transplanting date (1 = optimum, 0 = otherwise)
Β12 -2.770** (0.954)
-2.800** (0.578)
0.017 (0.069)
0.018 (0.048)
0.026 (0.157)
0.007 (0.150)
Dummy for variety (1 = Binadhan-7, 0 = otherwise)
β13 -0.022 (0.085)
0.011 (0.042)
-0.016 (0.066)
-0.019 (0.045)
0.022 (0.140)
0.031 (0.128)
F-statistic model 158.71* 89.40* 108.71* Adj. R2 0.85 0.84 0.90 Variance parameters Sigma squared σ2 1.020
2.050** (0.392)
0.155
0.560** (0.104)
0.160
0.464** (0.081)
Gamma γ 0.998** (0.00002) 0.718
(0.474) 0.460
(0.785) Log likelihood function -134.000 -12.500 11.933 53.382 6.740 6.740
** and * indicate significant at 1 percent and 5 percent level of probability, respectively. Figures in the parenthesis indicate standard error
371

BINA Annual Report 2011-12 Agricultural Economics
Table 9. Maximum Likelihood Estimates of Farm-Size-Specific Cobb-Douglas Stochastic Normalized Cost Frontiers and Economic Inefficiency Effect Models for Binadhan-7
Farm groups Independent variables symbols Small Medium Large Stochastic Frontier: Intercept β0 -1.399
(0.996) -4.304** (0.692)
-1.275 (0.889)
Output β 1 0.870** (0.206)
0.622** (0.061)
0.581** (0.073)
Human labour price β 2 -0.950 (0.767)
0.844** (0.046)
0.583** (0.142)
Power tiller price β 3 -0.516 (0.750)
-0.011 (0.097)
-0.061 (0.341)
Seed price β 4 0.186 (0.764)
0.067 (0.089)
-0.062 (0.218)
TSP price β 5 0.532* (0.245)
0.009* (0.004)
-0.014 (0.013)
MP price β 6 0.004 (0.028)
0.001 (0.006)
-0.001 (0.010)
Sulphur price β 7 0.002 (0.012)
-0.056** (0.020)
-0.002 (0.011)
Manure price β 8 0.461 (0.710)
-0.036 (0.020)
-0.090** (0.026)
Pesticide price β 9 -2.842** (0.581)
0.456 (0.662)
0.009 (0.010)
Land rent β 10 0.408 (0.705)
-0.520 (0.750)
0.012 (0.022)
Dummy for land type (1 = MHL, 0 = otherwise) β 11 2.821** (0.576)
-0.270** (0.037)
-0.261** (0.083)
Dummy for transplanting date (1 = optimum, 0 = otherwise) β 12 -2.821** (0.576)
-0.008 (0.037)
-0.236* (0.112)
Dummy for variety (1 = Binasail, 0 = otherwise) β 13 -0.008** (0.034)
0.019 (0.036)
0.278** (0.109)
Inefficiency effect model: Constant δ0 -0.094
(0.998) 0.040
(0.179) 0.542** (0.197)
Farm size δ1 0.231 (0.997)
0.002* (0.001)
0.001 (0.001)
Farmers age δ2 -0.383* (0.191)
-0.002* (0.001)
0.005 (0.005)
Farmers education δ3 -0.374 (0.989)
0.001 (0.004)
-0.015 (0.022)
Farmers occupation δ4 -0.003 (0.030)
-0.101 (0.057)
-0.162 (0.146)
Farmers experience δ5 -0.032 (0.090)
0.004 (0.003)
-0.004 (0.006)
Household size δ6 -0.513 (0.887)
-0.014 (0.008)
-0.019 (0.020)
Dummy for extension contact (1=Yes, 0= otherwise) δ7 -0.350 (0.997)
-0.234** (0.053)
-0.183* (0.089)
Dummy for rice training (1=Yes, 0= otherwise) δ8 0.076 (0.116)
0.048 (0.046)
-0.303* (0.125)
Variance parameters Sigma squared σ2 0.621
(0.503) 0.515** (0.003)
0.520** (0.006)
Gamma γ 0.986** (0.006)
0.600 (0.366)
0.999** (0.013)
Log likelihood function -10.937 92.395 44.445 ** and * indicate significant at 1 percent and 5 percent level of probability, respectively. Figures in the parenthesis indicate standard error
372

BINA Annual Report 2011-12 Agricultural Economics
Conclusion:
It was found that the sampled farmers started Binadhan-7 cultivation during last two years as well as the areas under its cultivation increasing in the study areas. Participatory Variety Selection (PVS) for Stress (salinity, submergence, drought etc.) Tolerant Crop Varieties/Mutant Lines (Collaboration with Plant Breeding & Biotechnology Divisions)
The study was conducted on the basis of these objectives; to identify the best variety/mutant line; to assess the acceptability of crop varieties/mutant lines; to identify the consumers preference (cooking quality, grain shape-size, aroma, tastiness etc); to determine the economic constraints of the worst varieties/mutant lines Activity 1. Evaluation of Promising Salt-Tolerant germplasm in Multi-location Trials and with
Farmers (Mother Trials)
In Labanchara of Khulna nine rice lines with one salt tolerant check variety (Binadhan-8), RCBD with 3 replications was considered for the study. From table 10, Binadhan-8 achieved the highest vote and line P19S8 scored the second highest vote. Binadhan-8 provided the highest yield (4.53 t ha-1), but the yield of line P19S8 was not satisfactory, though the farmers preference was high. Farmer’s preference was based on the characters of Good yield, salt tolerant, long panicle, more number of tillers in a hill, attractive color of grain, fine grain etc Table 10. Preference analysis of Mother trial of salt tolerant lines/germplasms at, Labanchara, Khulna during
T. aman, November 17, 2011, Stress: Salinity
Entry Total farmers (n = 30) Code Name Positive Negative
Preference score
Yield (t ha-1)
PVS1 P27S5 0 29 -0.242 1.99 PVS2 P36S5 0 26 -0.217 1.45 PVS3 P25S1 0 1 -0.008 2.54 PVS4 P1L3 0 3 -0.025 2.72 PVS5 P29S7 0 1 -0.008 3.08 PVS6 P1L2 0 0 0.000 3.63 PVS7 P24L2 3 0 0.025 3.99 PVS8 P1L3 0 0 0.000 1.27 PVS9 Binadhan-8 29 0 0.242 4.53 PVS10 P19S8 28 0 0.233 2.72
Male (n = 19), Female (n = 11) and Researcher (n = 2) Table 11. Correlation analysis of Mother trial of salt tolerant lines/germplasms at, Labanchara, Khulna during
T. Aman, 2011
Variables Correlation Significance level of probability Male and female farmers r = 0.99 *** significant at 1% Farmers and researchers r = 0.95 *** significant at 1% Farmers and yields r = 0.62 * significant at 10%
373

BINA Annual Report 2011-12 Agricultural Economics
Table 12 shows that Check variety Binadhan-8 performed well with highest yield (2.08 t ha-1) and got all 30 positive votes from farmers. Two lines P25S1 and P24L2 drew almost similar number of farmer’s attention at Kaligonj Table 12. Preference analysis of Mother trial of salt tolerant lines/germplasms at Kaligonj, Satkhira during
T. aman November 13, 2011, Stress: Salinity
Entry Total Farmers (n = 30) Code Name Positive Negative
Preference score
Yield (t ha-1)
PVS1 P27S5 0 21 -0.175 0.33 PVS11 Binadhan-8 30 0 0.250 2.08
Table 13. Correlation analysis of Mother trial of salt tolerant lines/germplasm at Kaligonj, Satkhira,
Bangladesh during T. aman, 2011
Variables Correlation Significance level of probability Male and female farmers r = 0.79 *** Significant at 1% Farmers and researchers r = 0.71 ** Significant at 5% Farmers and yields r = 0.68 ** Significant at 5%
It was observed from table-14 that Check variety Binadhan-8 exhibited its superior performance also at Shyamnagor. Got all 30 positive votes along with the highest 5.0 t ha-1 yield. In terms of farmer’s preference, line P24L2 was the 2nd best among the tested entries.
Table 14. Preference analysis of mother trial of salt tolerant lines/germplasms at, Shyamnagar, Satkhira during T. aman 2011, November 10, 2011, Stress: Salinity
Entry Total farmers (n = 30) Code Name Positive Negative
Preference score
Yield (t ha-1)
PVS1 P27S5 0 22 -0.183 0.48 PVS11 Binadhan-8 30 0 0.250 5.00
Male (n = 20), Female (n = 10) and Researcher (n = 1)
Table 15. Correlation analysis of Mother trial of salt tolerant lines/germplasms at Shyamnagar, Satkhira during during T. aman, 2011
Variables Correlation Significance level of probability Male and female farmers r = 0.87 *** Significant at 1% Farmers and researchers r = 0.80 *** Significant at 1% Farmers and yields r = 0.77*** Significant at 1%
374

LLIST OF PUBLICATION

BINA Annual Report 2011-12 List of Publication
376

BINA Annual Report 2011-12 List of Publication
PLANT BREEDING DIVISION
M. A. Alam, U. K. Nath, M. A. Malek and M. A. Ali, 2011. Interspecific crossability between Brassica juncea and Brassica campestris and genetic performance of Brassica genotypes. Bangladesh Journal of Progressive Science and Technology, 1609-5260, vIX(1): pp. 037-040.
M. A. K. Azad, M. I. Uddin and M. A. Azam, 2012. Achievements in rice research at BINA through induced mutation. Bioremediation, Biodiversity and Bioavailability, 6 (Special issue 1): 53-57.
M. A. K. Azad, M. M. Haque, M. A. Hamid, F. Yasmine and M. A. W. Golder, 2012. Tolerance to salinity stress in peanut (Arachis hypogaea L.) through osmotic adjustment and undamaged chloroplast. Legume Res., 35(4): 271-284.
M. A. Malek, H. A. Begum, M. Begum, M. A. Sattar, M. R. Ismail and M. Y. Rafii. 2012. Development of two high yielding mutant varieties of mustard (Brassica juncea (L.) Czern.) through gamma rays irradiation. Australian Journal of Crop Science, 1835-2693, v6(5): pp. 922-927.
M. A. Malek, L. Rahman, M. L. Das, L. Hassan, M. I. Uddin, M. Y. Rafii and M. R. Ismail. 2012. Studies on morphological characters and yield attributes of synthetic Brassica hexaploids and their parents. Australian Journal of Crop Science, 1684-5315, v11(57): pp. 12030-12039, DOI: 10.5897/AJB12.1032.
M. A. Malek, M. M. A. Mondal, M. R. Islam, M. Y. Rafii and Z. Berahim. 2012. Physiology of seed yield in soybean: growth and dry matter production. African Journal of Biotechnology, 1684-5315, v11(30): pp. 7643-7649, DOI: 10.5897/AJB11.3879.
M. A. Malek, M. R. Ismail, F. I. Monshi, M. M. A. Mondal and M. N. Alam. 2012. Selection of promising rapeseed mutants through multi-location trials. Bangladesh Journal of Botany, 0253-5416, v41(2): pp. 111-114.
M. A. Malek, M. R. Ismail, M. Y. Rafii and M. M. Rahman. 2012. Synthetic Brassica napus L.: Development and Studies on Morphological Characters, Yield Attributes and Yield. The Scientific World Journal, 1537-744X, v2012, Article ID 416901, 6 pages, doi: 10.1100/2012/ 416901.
M. A. Malek, M. Shfiquzzaman, S. Rahman, M. Razi Ismail and M. M. A. Mondal. 2012. Standardization of soybean row spacing based on morpho-physiological characters. Legume Research, 0250-5371, v35(2): 138-143
M. A. Samad and S. Roy. 2011. Development of two high yielding varieties of lentil (Lens culinaris Medik.) through induced mutation. Bangladesh Journal of seed science and seed technology. 15(1&2): 39-44.
M. Arifunnahar, J. Halder, M. M. Islam, S. N. Begum and A. C. Manidas. 2011. Screening of F3 rice families under salinity condition and polymorphism study using RAPD primer. Bangladesh J. Seed Sci & Tech. 15 (1&2): 203-210.
M. Hasanuzzaman, S. N. Begum, M. M. Islam and A. A. Ibrahim. 2012. Genetic analysis and molecular characterization of F1 population of Binadhan-7 × FL-378. Bangladesh J. Seed Sci. & Tech. 6(1&2): 100-104.
377

BINA Annual Report 2011-12 List of Publication M. M. A. Mondal, M. S. A. Fakir, M. Nurul Islam, and M. A. Samad. 2011. Physiology of seed yield
in mungbean: growth and dry matter production. Bangladesh J. Bot. 40(2): 133-138.
M. Moniruzzaman, M. S. Alam, J. A. Rashid, S. N. Begum and M. M. Islam. 2012. Int. J. Agril. Res. Innov. & Tech. 2(2): 1-8.
M. S. Alam, S. N. Begum, M. M. Islam, M. Moniruzzaman and M. A. K. Patwary. Marker-assisted foreground selection for identification of salt tolerant rice genotypes. 2012. The Agriculturists. 10(2): 1-8.
M. S. Islam, H. C. Mohanta, M. R. Ismail, M. Y. Rafii and M. A. Malek. 2012. Genetic variability and trait relationship in cherry tomato (Solanum lycopersicum L. Var. Cerasiforme (Dunnal) A. Gray). Bangladesh Journal of Botany, 0253-5416, v41(2): pp. 163-167.
P. Dhar, M. Ashrafuzzaman, S.N. Begum, M. M. Islam and M. M. H. Chowdhury. 2012. Identification of salt tolerant rice genotypes and their genetic diversity analysis using SSR markers. Int. J. Biosci. 2(9):40-50.
R. Gupta, S. N. Begum, M. M. Islam and M. S. Alam. 2012. Characterization of lentil (Lens culinaris M.) germplasm through phenotypic marker. J. Bangladesh Agril. Univ. 10(2): 197-204.
S. Islam, M. S. Haque, R. M. Emon, M. M. Islam and S. N. Begum. 2012. Molecular characterization of wheat (Triticum aestivum) genotypes through SSR markers. Bangladesh J. Agric. Res. 37 (3): 389-398.
S. K. Deabsharma, U. K. Nath, A. K. Azad, M. J. Alam and C. Roy. 2011.Evaluation of groundnut mutants for disease reaction and flowering pattern. Bangladesh J. Seed Sci. & Tech., 15(1): 147-152.
S. K. Deabsharma, U. K. Nath, A. K. Azad, M. J. Alam and K. P. B. Das. 2011. Selection of groundnut lines for genetic diversity and high yield performance. Bangladesh J. Seed Sci. & Tech., 15(1): 173-180.
S. Roy, M. A. Islam, A. Sarker, M. R. Ismail, M. Y. Rafii, M. M. A. Mondal and M. A. Malek. 2012. Morphlogical characterization of lentil accession: qualitative traits. Bangladesh Journal of Botany, 0253-5416, v41(2): pp. 187-190.
S. Roy, M. A. Malek, M. A. Islam, A. Sarker, M. Y. Rafii, M. R. Ismail and M. M. A. Mondal. 2012. Agronomic performance of lentil accessions in lentil growing areas of Bangladesh. Legume Research. 35(4): 303-311.
CROP PHYSIOLOGY DIVISION
Mondal, M. M. A., Rahman, M. A., Akter, M. B. and Fakir, M. S. A. 2011. Effect of defoliation during reproductive stage on yield in mungbean. Legume Research, 34: 222-225.
Mondal, M. M. A., Rahman, M. A., Akter, M. B. and Fakir, M. S. A. 2011. Effect of foliar application of nitrogen and micronutrients on growth and yield of mungbean. Legume Research, 34: 166-171.
378

BINA Annual Report 2011-12 List of Publication
SOIL SCIENCE DIVISION
Ali, M. M. 2011. Environmental and natural resource degradation of agriculture: Bangladesh perspective. The Gardian. P. 52-56
Ali, M. M., M. H. Rahman, M. R. Khan and M. K. Khan. 2012. Assessment of arsenic contamination in agricultural soils of Rangpur area. Proc. research rev. and planning workshop on soils program of NARS institutes, 2011. BARC, Dhaka. p. 311-312
Ali, M. M., M. H. Rahman, M. R. Khan and M. K. Khan. 2012. Evaluation of Soil Characters for Assessment of Land Degradation Situation in Ganges Floodplain area. Proc. research rev. and planning workshop on soils program of NARS institutes, 2011. BARC, Dhaka. p. 169-173
Ali, M. M., M. H. Rahman, M. R. Khan and M. K. Khan. 2012. Physicochemical characterization of the BINA HQ farm soils of Mymensingh. Proc. research rev. and planning workshop on soils program of NARS institutes, 2011. BARC, Dhaka. p. 174-176
Ali, M. M., M. H. Rahman, M. R. Khan, M. F. Islam and M. K. Khan. 2012. Fertilizer requirement for BINA developed elite mutants. Proc. research rev. and planning workshop on soils program of NARS institutes, 2011. BARC, Dhaka. p. 177-178
Chowdhury, A. T. M. R. A, Khan, M. M. K., Haque M. E., Mahmud, H. and Biawas, B. K. 2011. Effect of Bio-Fertilizer (Bradyrhizobium) with Nitrogenous and Sulphur Fertilizers on Quality Attibutes of Summer Mungbean (Vigna radiate L.) Cv. Binamoog-6. J. Environ. Sci. & Natural Resources 4(1): 119-122.
Chowdhury, A. T. M. R. A, Khan. M. M. K, Islam M S, Biawas B. K. and Mahmud H. 2011. Effect of Different Levels of Nitrogen and Sulphur with or without Biofertilizer on Yield Contributing Characters of Binamoog-6. J. Environ. Sci. & Natural Resources 4(2): 155-158.
Haque M. A. and Khan, M. K. 2012. Effects of Phosphatic Biofertilizer with Inorganic and Organic Sources of Phosphorus on Growth and Yield of Lentil. J. Environ. Sci. & Natural Resources 5(2): 225-230.
Kalam M. A., Hossain M. B., Sarmin T., Moslehuddin A. Z. M. and Khan, M. M. K. 2011. Effect of different levels of nitrogen and phosphorus with or absence of VAM fungal inoculum on rice (Oryza sativa L.). J. Agrofor. Environ. 5(2): 7-10.
Tarafder, M. A. and Li Yong. 2012. Measurement of soil erosion-deposition using fallout radionuclides (FRN) technique on a cultivated slope. Bangladesh J. Nuclear Agric. 23: 11-16.
Tarafder, M. A., Tasmin, S., Khan, M. R. and Rahman, M. H. 2012. Effect of secondary nutrients, micronutrients and organic amendments on summer mungbean (cv. Binamoog 5). Bangladesh J. Environ. Sci. 23, 171-174.
Tarafder, M. A., Tasmin, S., Khan, M. R., Rahman, M. S. and M. K. Khan. 2012. Response of summer mungbean (Vigna radiata L.) to Sulphur, Zinc and Boron fertilization. Bangladesh J. Prog. Sci. & Tech. 10 (2): 169-172.
379

BINA Annual Report 2011-12 List of Publication
ENTOMOLOGY DIVISION
Mollah, M. L. R., M. A. Hossain, M. A. Samad and M. F. Khatun. 2011. Setting and feeding responses of brown planthopper to five rice cultivars. Int. J. Sustain. Crop Prod. 6(1): 10-13
PLANT PATHOLOGY DIVISION
Kashem, M. A., Hossain, I. and M. K. Hasna. 2011. Use of Trichoderma in biological control of Foot and root rot of lentil (Lens culinaris Medik). International J. Sustainable Crop Production. 6(1): 29-35.
M. K. Hasan and H. A. Begum. 2012. Eco-friendly management of fusarium wilt of tomato. 2012. Bangladesh J. of Nuclear Agric. 25 & 26, pp. 97-101.
M. K. Hasan and H. A. Begum. 2012. Improvement methods of application of Trichoderma harzianum for controlling fusarium wilt and late blight of tomato. Bangladesh J. of Nuclear Agric. 25 & 26, pp. 117-120.
Rahman, M. L., Kashem, M. A., Hassanin, M. M. and Hossain, I. 2011. Effect of inoculum levels of fusarium salini on the development of wilt in potato. Journal of Agroforestry and Environment. 5(1): 37-39.
AGRICULTURAL ENGINEERING DIVISION
Akter, T., M. S. U. Talukder, N. N. Karim, M. A. Rahman and M. N. N Mazumder (2011). Rainfall and Evapotranspiration based crop planning for Comilla district. J. Bangladesh Soc. Agric. Sci. Technol. 8 (1&2): 5-10
Ali, M. H., A. A. Sarkar, M. A. Rahman (2012). Analysis on groundwater-table declination and quest for sustainable water use in the North-western region (Barind area) of Bangladesh. J. of Agril. Sci. and Applications. 1(1): 26-32
Ali, M. H., A. A. Sarkar, M. A. Rahman (2012). Analysis on groundwater-table declination and quest for sustainable water use in the North-western region (Barind area) of Bangladesh. J. of Agril. Sci. and Applications. 1(1): 26-32
Ali, M. H., I. Abustan, M. A. Rahman, A. A. M. Haque (2011). Sustainability of Groundwater Resources in the North-Eastern Region of Bangladesh. Water Resour. Manage. 26: 623-641
Ferdous, M. Z., M. M.Anowar, M. A. Rahman, F. Yasmine and Julker Nain. (2011). Fertilizer management for maize-mungbean-T.Aman based cropping pattern. J. Agrofor. Environ. 5(2): 129-132
Karim, N. N. and Sarkar, A. A. 2012. Study on thermal and radiation based indices in relation to seed yield of mustard at different AEZ of Bangladesh. J. Agril. Engg., The Institution of Engineers.
380

BINA Annual Report 2011-12 List of Publication Karim, N. N., Talukder, M. S. U., Hassan, A. A. and Khair, M. A. 2011. Trend of reference crop
evapotranspiration and controlling factors for its variability under changing climatic condition in North Central Hydrological Region of Bangladesh. Paper Meet-2011. Agricultural Engineering Division, The Institution of Engineers, Bangladesh. pp. 01-10.
Rahman, M. M., F.Yasmine, M. A. Rahman, M.Z.Ferdous and P.S.Kar. (2011). Performance of poultry bio-slurry as a source of organic manure on potato production. J. Agrofor. Environ. 5(2): 81-84
Sarkar, A. A., M. H. Ali, (2012). Water-table dynamics and its long-term trend at some regions of Bangladesh. The Guardian, pp. 39-44
Yasmine, F., M. M. Hossain, M. N. N. Mazumder, M. H. Rahman and M. A. Rahman (2011). Effect of salinity levels on growth and yield of advanced mutant rice genotypes in Boro season. J. Bangladesh Soc. Agric. Sci. Technol. 8 (1&2): 23-28
TRAINING COMMUNICATION AND PUBLICATION DIVISION
Ferdous, M. Z., M. M. Anowar, M. A. Rahman, F. Yasmine and J. Nian. 2011. Fertilizer management of maize-mungbean-T. aman based cropping pattern. J. Agrofor. Environ. 5(2): 129-132.
Haider, M. R., J. Nain and G. A. Rab. 2012. Adoption of different varieties of boro rice in sadar upazila of Mymensingh district. Bangladesh J. Nuclear Agric. 23&24: 151-122.
Khan, M. R., M. A. Haque, M. A. Tarafder and J. Nain. 2011. Response of Soybean to intergraded use of urea, manure and biofertilizer. J. Bangladesh Soc. Agric. Technol., 8(3&4): 87-91.
BIOTECHNOLOGY DIVISION
F. D. Shams, M. M. A. Kuddus, K. M. Nasiruddin, S. N. Begum and M. M. Islam. 2012. Genetic analysis of aromatic and quality rice germplasm using Microsatellite Markers. Plant Tissue Cult. & Biotech. 22(1): 65-71.
K. A. Kana, M. A. H. Rashid, M. M. Islam and M. A. Baree. 2011. A comparative economic analysis of salt tolerant Binadhan-8 and BR-28 rice production in Satkhira district of Bangladesh. Progress. Agric. 22(1&2): 203-212.
L. Das, M. M. Islam, K. M. Nasiruddin, S. N. Begum and M. A. Haque. 2011. Molecular characterization of mustard genotypes using RAPD markers. Bangladesh J. Seed Sci & Tech. 15 (1&2): 195-202.
M. A. Haque, M. A. Mahmud, M. M. Islam and S. N. Begum. 2012. Identification of introgression rice lines of Binadhan-7 × FL-378 under salt stress through SSR markers. J. Bangladesh Agril. Univ. 10(1): 49-54.
M. M. H. Chowdhury, M. Ashrafuzzaman, S. N. Begum, M. M. Islam and P. Dhar. 2012. Regeneration of plantlets from Grape (Vitis vinifera L.) through different explants. Int. J. Sustain. Crop Prod. 7(2): 12-18.
381
BINA Annual Report 2011-12 List of Publication M. M. Islam, S. N. Begum, R. M. Emon, J. Halder and A.C. Manidas. 2012. Carbon isotope
discrimination in rice under salt affected conditions in Bangladesh. IAEA-TECDOC-1617: 7-23.
M. Pervin, M. K. Hassan, M. A. Siddique and N. Akhter. 2012. Field performance of twenty five garlic germplasm. J. Bangladesh Soc. Agric. Sci. Technol. 9(1&2): 143-148.
R. Gupta, L. Hassan, S. N. Begum, M. M. Islam and M.S. Alam. 2012. Characterization of lentil (Lens culinaris M.) germplasm through RAPD markers. Bangladesh J. Seed Sci. & Tech. 16(1&2): 48-56.
AGRICULTURE ECONOMICS DIVISION
Rahman, M. H. and M. R. Haque, 2011. Economics of Binadhan-5 cultivation in Bangladesh. Bangladesh Journal of Environ. Sci. Vol. 20: 112-114.
382


