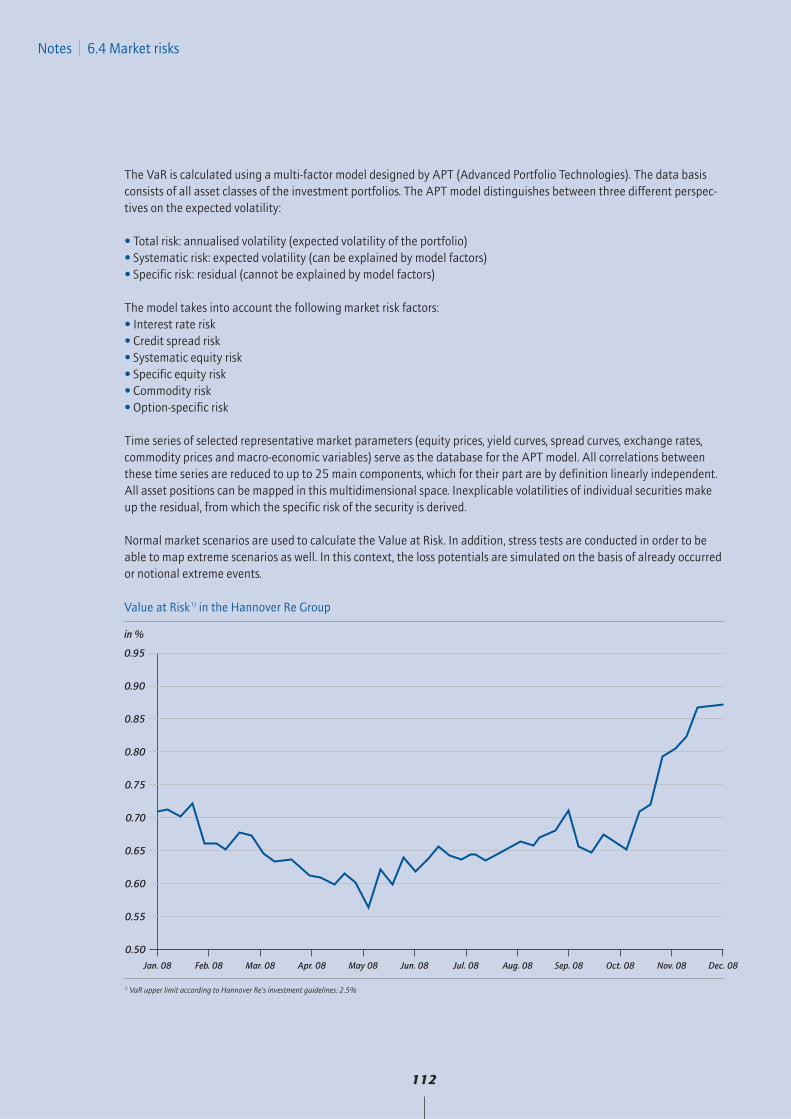
Annual Report 2008 +++ Financial year overshadowed by the financial market crisis +++ Net investment income: EUR 278.5 million (EUR 1,121.7 million) due to write- downs and losses realised on equities of EUR 640.9 million +++ Combined ratio in non-life reinsurance: 95.4% (99.7%) +++ Operating profit (EBIT): EUR 148.1 million (EUR 928.0 million) +++ Group net loss: EUR -127.0 million (Group net income: EUR 721.7 million) owing to negative tax effect +++ Very good earnings prospects for 2009 +++ hannover re R
Transcript
Annual Report 2008
+++ Financial year overshadowed by the financial market crisis +++ Netinvestment income: EUR 278.5 million (EUR 1,121.7 million) due to write-downs and losses realised on equities of EUR 640.9 million +++ Combinedratio in non-life reinsurance: 95.4% (99.7%) +++ Operating profit (EBIT):EUR 148.1 million (EUR 928.0 million) +++ Group net loss: EUR -127.0 million(Group net income: EUR 721.7 million) owing to negative tax effect +++ Verygood earnings prospects for 2009 +++
hannover re R
CONTENTS
Letter of the Chairman of the Executive Board . . . . . . . . . . . . . . . . . . . . . . . 1
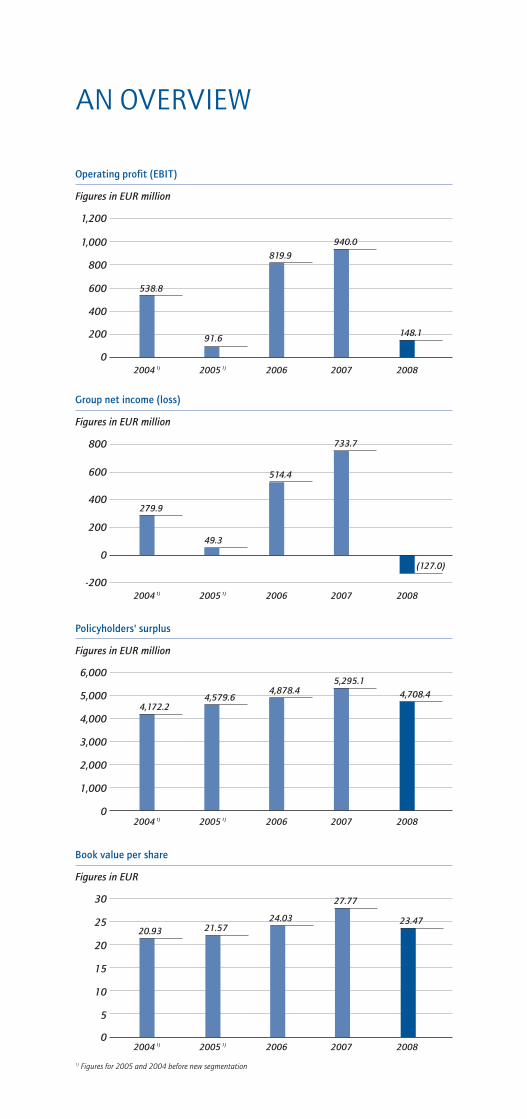
1) Figures for 2005 and 2004 before new segmentation2) Bonus3) Incl. funds held4) Natural catastrophes and other major losses in excess of EUR 5 million gross for the Hannover Re Group's share5) Operating profit (EBIT)/net premium earned
1
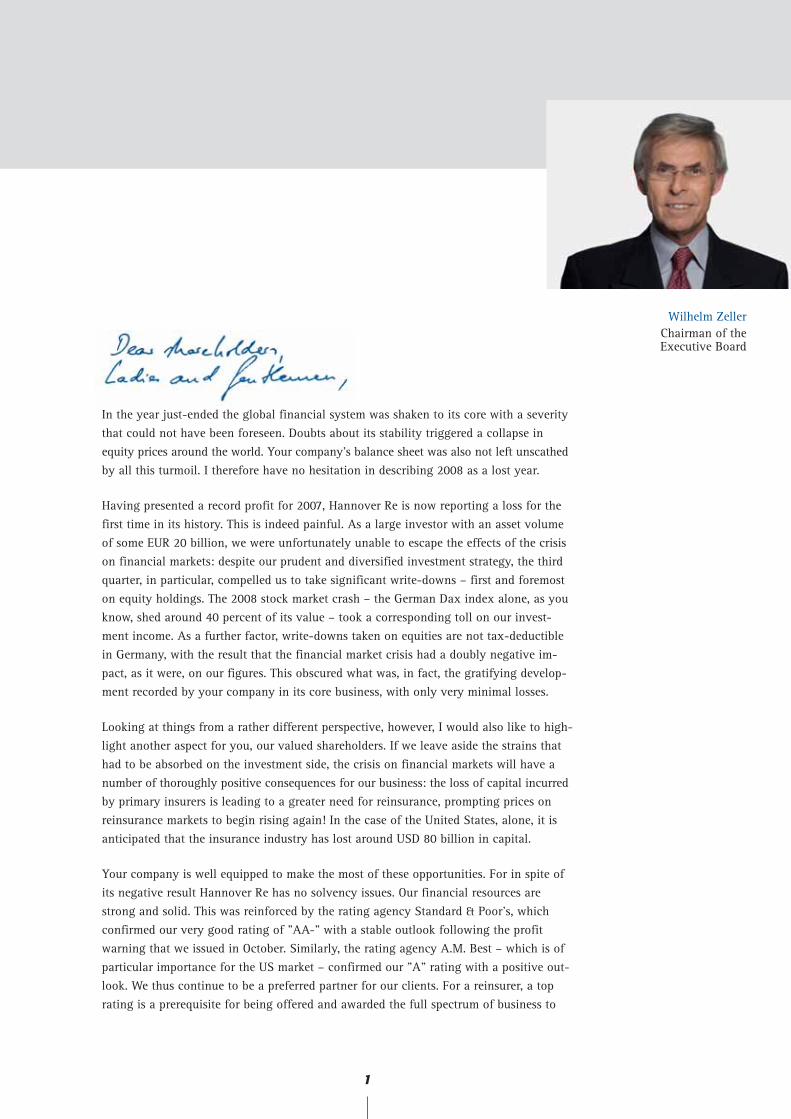
Wilhelm ZellerChairman of the Executive Board
In the year just-ended the global financial system was shaken to its core with a severitythat could not have been foreseen. Doubts about its stability triggered a collapse inequity prices around the world. Your company's balance sheet was also not left unscathedby all this turmoil. I therefore have no hesitation in describing 2008 as a lost year.
Having presented a record profit for 2007, Hannover Re is now reporting a loss for thefirst time in its history. This is indeed painful. As a large investor with an asset volumeof some EUR 20 billion, we were unfortunately unable to escape the effects of the crisison financial markets: despite our prudent and diversified investment strategy, the thirdquarter, in particular, compelled us to take significant write-downs – first and foremoston equity holdings. The 2008 stock market crash – the German Dax index alone, as youknow, shed around 40 percent of its value – took a corresponding toll on our invest-ment income. As a further factor, write-downs taken on equities are not tax-deductiblein Germany, with the result that the financial market crisis had a doubly negative im-pact, as it were, on our figures. This obscured what was, in fact, the gratifying develop-ment recorded by your company in its core business, with only very minimal losses.
Looking at things from a rather different perspective, however, I would also like to high-light another aspect for you, our valued shareholders. If we leave aside the strains thathad to be absorbed on the investment side, the crisis on financial markets will have anumber of thoroughly positive consequences for our business: the loss of capital incurredby primary insurers is leading to a greater need for reinsurance, prompting prices onreinsurance markets to begin rising again! In the case of the United States, alone, it isanticipated that the insurance industry has lost around USD 80 billion in capital.
Your company is well equipped to make the most of these opportunities. For in spite ofits negative result Hannover Re has no solvency issues. Our financial resources arestrong and solid. This was reinforced by the rating agency Standard & Poor's, whichconfirmed our very good rating of "AA-" with a stable outlook following the profitwarning that we issued in October. Similarly, the rating agency A.M. Best – which is ofparticular importance for the US market – confirmed our "A" rating with a positive out-look. We thus continue to be a preferred partner for our clients. For a reinsurer, a toprating is a prerequisite for being offered and awarded the full spectrum of business to
2
underwrite, while at the same time it is also the key to being able to select those treatiesthat promise the strongest profitability.
In view of our stable financial standing, our business prospects for 2009 are thereforeexceptionally bright.
Firstly, however, I would like to return to the year under review: I am satisfied with thetechnical development of our non-life reinsurance business group, even though theburden of major claims and catastrophe losses – principally due to the severe hurricane"Ike" – was somewhat higher than our expectations. Although prices in the year underreview were notable for softening tendencies in some major markets, conditions werevery largely acceptable. All in all, the prices that we obtained in 2008 were commen-surate with the risks.
We remained true to our maxim of "profit before growth" in the year under review; inareas where we did not consider rates to be adequate, such as US casualty business, wereduced our involvement – while at the same time tapping into new market and productniches. In Brazil, the largest insurance market on the South American continent, weestablished a representative office following the abolition of that country's reinsurancemonopoly. As an "admitted reinsurer", we thus enjoy an optimal platform for partici-pating in this up-and-coming market.
As you, our valued shareholders, are aware, your company has long made a name foritself with the innovative transfer of (re)insurance risks to the capital market – both innon-life and life/health reinsurance. In the year under review we went one step furtherand are now enabling our clients to access the capital market by appropriately packagingand structuring risks that do not lend themselves to such transactions on a stand-alonebasis. We successfully completed the first project of this type in June 2008 through"Globe Re". As far as our own risk management is concerned, we again transferredcatastrophe risks to the capital market in the year under review so as to better protectour equity base against exceptional major losses.
In life and health reinsurance, too, we were able to place a portfolio on the internationalcapital markets in 2008. By way of this transaction – designated "L7" – we continued todiversify our risk and secured for our company greater financial flexibility with an eyeto the further expansion of our life and health portfolio.
I am similarly satisfied with the development of our life and health reinsurance busi-ness: premium growth was by no means as vigorous as in previous years, reflecting therestraining effects of exchange rate movements – especially in the pound sterling andUS dollar. Nor was the result entirely convincing in comparison with the outstandingprevious year, which had been influenced by a number of special effects. Nevertheless,
Letter of the Chairman of the Executive Board
3
what is important here is that we clearly strengthened our international market positionin the year under review. In this context we have our sights set firmly on the Asiangrowth markets. We have been a locally licensed reinsurer in China since May 2008 andwere able to acquire several new accounts through our branch in Shanghai. In Korea,too, Asia's largest life reinsurance market, we optimised our business opportunities byopening a new branch office. Last but not least, we have taken the first steps towardstapping into the Indian market by entering into a multi-year exclusive cooperationagreement with the leading local reinsurer. In a parallel move we opened a representativeoffice in Mumbai to support our client relationships in life and facultative non-lifebusiness.
As I reported at the outset, our investment income in the year under review was over-shadowed by the upheavals on international capital markets. We were able to sidestepthe collapse on equity markets only with limited success. Particularly in the second halfof the year, substantially lower share prices necessitated significant write-downs – althoughlosses on fixed-income securities remained within manageable bounds. This was due notleast to the broad diversification and high quality of the portfolio. We closed the yearunder review with a marginally positive return on investment.
Having stood its ground superbly in the first half of the year, the Hannover Re sharethen fell sharply in value – especially at the peak of the financial market crisis inSeptember. In October, too, after massive liquidity problems came to light at a Germanbank, all financials – hence including the Hannover Re share – suffered extremely heavily,even though our share was able to make good some ground by year-end.
The next point that I would like to discuss is, understandably, a particularly disappointingone for you, our valued shareholders: the dividend. Given the negative result in the yearunder review, the Executive Board and Supervisory Board will propose to the AnnualGeneral Meeting that no dividend should be paid. Why is this? It has been pointed outto me on several occasions that in view of our retained earnings we would be in a posi-tion to make a distribution. That is true. Such a step would, however, reduce our capitalbase and hence restrict our opportunities to write profitable business in an increasinglyattractive market. For your company it has always proven worthwhile to grow whenrates are rising. In order to expand in this way we need capital that we can put toprofitable use. With this in mind, therefore, I hope that you will endorse our dividendproposal.
Let us now look to the future. What can you expect from the current financial year? Ourgoals are ambitious, and we are seeking to generate a return on equity of more than15% in 2009. The situation on international reinsurance markets is very favourable; thesoft market has come to an end earlier than expected. This was clearly reflected in thetreaty renewals as at 1 January 2009: in certain segments price increases sometimes ex-
Letter of the Chairman of the Executive Board
tending into double-digit percentages were obtained, including for example in US catas-trophe business but also more strikingly in credit and surety reinsurance. Our domesticmarket, especially in the area of non-proportional motor business, remains attractive.For our total portfolio we expect growth in premium income – and very healthy prof-itability – in the original currencies.
The business environment in life and health reinsurance is similarly favourable: here,too, the financial market crisis will raise awareness among the urban middle classes ofthe need for private provision, hence generating significant growth stimuli worldwide.What is more, with the acquisition of a US individual life reinsurance portfolio we havetaken a major step towards accomplishment of our global objectives in life and healthreinsurance. This acquisition will not only boost our premium volume to a level inexcess of USD 1 billion, it will also enhance the diversification of our earnings streams.Following this transaction, life reinsurance business – which is notable for its greaterstability – will account for a considerably larger share of the total portfolio going for-ward.
On behalf of all my colleagues on the Executive Board I would like to thank you, ourvalued shareholders, for your trust. Rest assured: we shall do everything in our power toequip Hannover Re to handle the opportunities and risks that lie ahead. Our goal, asalways, is to consistently improve the value of your company. With this in mind I lookforward to the challenges of 2009.
Yours sincerely,
Wilhelm ZellerChairman of the Executive Board
Letter of the Chairman of the Executive Board
4
5
SUPERVISORY BOARDof Hannover Re
Wolf-Dieter Baumgartl 1) 2) 3) Chairman of the Supervisory BoardBerg Talanx AGChairman HDI Haftpflichtverband der Deutschen Industrie V.a.G.
Dr. Klaus Sturany 1) Former Member of the Executive Board Dortmund RWE AktiengesellschaftDeputy Chairman
Herbert K. Haas 1) 2) 3) Chairman of the Executive BoardBurgwedel Talanx AG
HDI Haftpflichtverband der Deutschen Industrie V.a.G.
Uwe Kramp 4)
Hannover
Karl Heinz Midunsky 3) Former Corporate Vice President and TreasurerGauting Siemens AG
Ass. jur. Otto Müller 4)
Hannover
Dr. Immo Querner Member of the Executive BoardEhlershausen Talanx AG
HDI Haftpflichtverband der Deutschen Industrie V.a.G.
Dr. Erhard Schipporeit 2) Former Member of the Executive Board Hannover E.ON Aktiengesellschaft
Gert Waechtler4)
Burgwedel
1) Member of the Standing Committee2) Member of the Balance Sheet Committee3) Member of the Nomination Committee 4) Staff representative
Details of memberships of legally required supervisory boards and comparable control boards at other domestic and foreign business enterprises are contained in the individual report of Hannover Rückversicherung AG.
6
EXECUTIVE BOARDof Hannover Re
Dr. Michael Pickel
Non-Life TreatyReinsurance Germany,Austria, Switzerland andItaly; Credit, Surety &Political Risk worldwide;Group Legal Services;Compliance; Run Off Solutions
Controlling; InternalAuditing; RiskManagement; InvestorRelations, Public Relations; Corporate Development;Human ResourcesManagement
Dr. Wolf Becke
Life and Healthmarkets worldwide
7
André Arrago
Non-Life TreatyReinsurance Arab,European Romance andLatin American countries,Northern and EasternEurope, Asia andAustralasia
Dr. Elke König
Finance and Accounting;Asset Management; Information Technology;Facility Management
Jürgen Gräber
Coordination of entireNon-Life reinsurance;Quotations Non-Lifereinsurance; Non-LifeTreaty Reinsurance North America andEnglish-speaking Africa;Structured Productsworldwide
8
THE HANNOVER RE SHARE
The international financial market crisis dictated eventson the world's stock markets in 2008. At the very outsetof the year massive write-downs taken in the portfoliosof international financial institutions brought about asteep collapse on equity markets. News of the urgentneed for capital at some US bond guarantors and Germanregional banks as well as the forced sale of the fifth-largest investment bank in the United States promptedfurther price declines in the first quarter of 2008.
In the wake of the reporting season on the fourth quar-ter of 2007 equity markets steadied thanks to positivesignals until the end of May 2008, before growing fearsof recession and reports about the funding needs of vari-ous financial institutions triggered a fresh downwardslide. In mid-September news of the fire sale of anotherUS investment bank, the looming collapse of the world'slargest insurer and above all the insolvency of thefourth-largest US investment bank unleashed outrightpanic on the markets: despite moves by central banks toslash interest rates, the Dax and Dow Jones had shed20% by the end of October, while the Nikkei 225 Indexlost as much as 30%.
It was not until the start of November that extensivegovernment guarantees, rescue packages and supportmeasures by the US government, the German governmentand other nations succeeded in preventing a collapse ofthe global financial system. Disappointing quarterly fig-ures posted by many companies, news of a contractionin gross domestic product in the United States, Germanyand other countries as well as reports of rapidly shrink-ing order books nevertheless fanned fresh recession con-cerns. Finally, in December, a fraud scandal that eruptedaround an asset manager on a scale of some USD 50 bil-lion rocked the international world of finance.
While the Dow Jones ended 2008 down by altogether34%, the Dax closed the year under review some 40%lower at 4,810 points. The MDax gave back as much as43% of its value to stand at 5,602 points at year-end.
2008: The worst stock market year in recent decades
The movement of the Hannover Re share in the yearunder review was to a large extent similarly shaped bythe crisis on financial markets. After the sharp fall inJanuary, however, our business figures for the recordyear of 2007 initially prompted an upward climb and aclear decoupling from the general market trend. Ourshare reached its highest point of the year on 5 May2008 at EUR 35.79. In early June, however, a downwardtrend set in against the backdrop of the aforementionedcrisis news and gathered impetus from mid-Septemberonwards. Shortly after the release of our profit warning –motivated primarily by write-downs on equity invest-ments – our share touched its lowest point of the year ofEUR 15.70 on 28 October 2008. A rally followed, boostedby positive expectations for the upcoming treaty re-newals. Our share was listed at EUR 22.50 on 30 Decem-
An extremely volatile year for the Hannover Re share
ber 2008 and hence suffered a loss of EUR 9.05 or28.7% in the year under review. After allowance forreinvestment of the dividend paid in an amount of EUR2.30 the overall performance was -23.5% – and hencenot as poor as that recorded by the Dax and MDax.
In a three-year comparison (see chart) the Hannover Reshare including reinvested dividends delivered a perform-ance of -15.9%. It thus surpassed the MDax and PrimeInsurance Performance Index, but fell just short of theDax. In 2008 we did not achieve our strategic objectiveof outperforming the weighted ABN Amro Global Re-insurance Index in a three-year comparison.
9
The Hannover Re share
DaxHannover Re share
2 January
2006
30 March
2006
3 July 2006
29 Septe
mber 2006
14 Nove
mber 2006
2 January
2007
2 April
2007
5 July 2007
3 Octo
ber 2007
16 Nove
mber 2007
8 January
2008
9 April
2008
9 July 2008
22 August
2008
7 Octo
ber 2008
30 Dec
ember
2008
Prime Insurance Performance Index
MDax
ABN Amro Global Reinsurance Index
in %
Performance of the Hannover Re share in comparison with standard indices and the ABN Amro Global Reinsurance Index*
The market capitalisation of the Hannover Re Group to-talled EUR 2,713 million as at year-end. With a free floatmarket capitalisation of EUR 1,253 million our companyranked eighth in the MDax at the end of December,while our share came in at number 13 according to thecriterion "Trading volume over the past 12 months" witha traded volume of EUR 4,962 million for the year.According to both criteria, therefore, the Hannover ReGroup ranks among the 50 largest listed companies inGermany.
With a book value per share of EUR 23.47 the HannoverRe share recorded a price-to-book (P/B) ratio of 0.96 asat the end of December, compared with a higher MDaxaverage of 1.01.
In 2008 regular participation in investor conferencesand roadshows – at which we have the opportunity tomeet analysts and investors – as well as the holding ofnumerous telephone conferences once again formedthe core areas of our Investor Relations work. Yet we arenot the only ones to travel in our efforts to meet ourinvestors and analysts; we also enjoy hosting them forpersonal discussions at Hannover Re's offices.
Our Investor Relations activities
* Incl. reinvested dividend
200
150
100
50
Shareholding structure (in %)
Talanx AG (50.2)
Institutional investors (42.1)
Private investors (7.7)
10
The Hannover Re share
Interest in our company among analysts remained livelyin the year under review. According to Bloomberg andReuters, analysts handed down altogether 140 opinionsfor Hannover Re in 2008. Despite the turmoil on stockmarkets they recommended the Hannover Re share as"buy" or "overweight" on forty-two occasions. The vastmajority of opinions (67) were a "hold". Recommendationsto "underweight" or "sell" were issued thirty-one times.At the outset of the new 2009 financial year the pricetarget for our share – averaged across all analysts – wasaround EUR 23.
Our annual Investors' Day is another highlight of ourInvestor Relations activities. In 2008 we held this eventin London and were again pleased to welcome numer-ous financial analysts and investors. We use this gather-ing as an opportunity to provide our guests with first-hand insights from the Executive Board. Topics coveredin the year under review included risk management as it
Analysts' opinions of the Hannover Re share
Opinion
Buy 41 11 11 11 8
Overweight 1 – – 1 –
Hold 67 16 15 16 20
Underweight 13 3 5 3 2
Sell 18 3 4 4 7
Total 140 33 35 35 37
Q4Q3Q2Q1Number
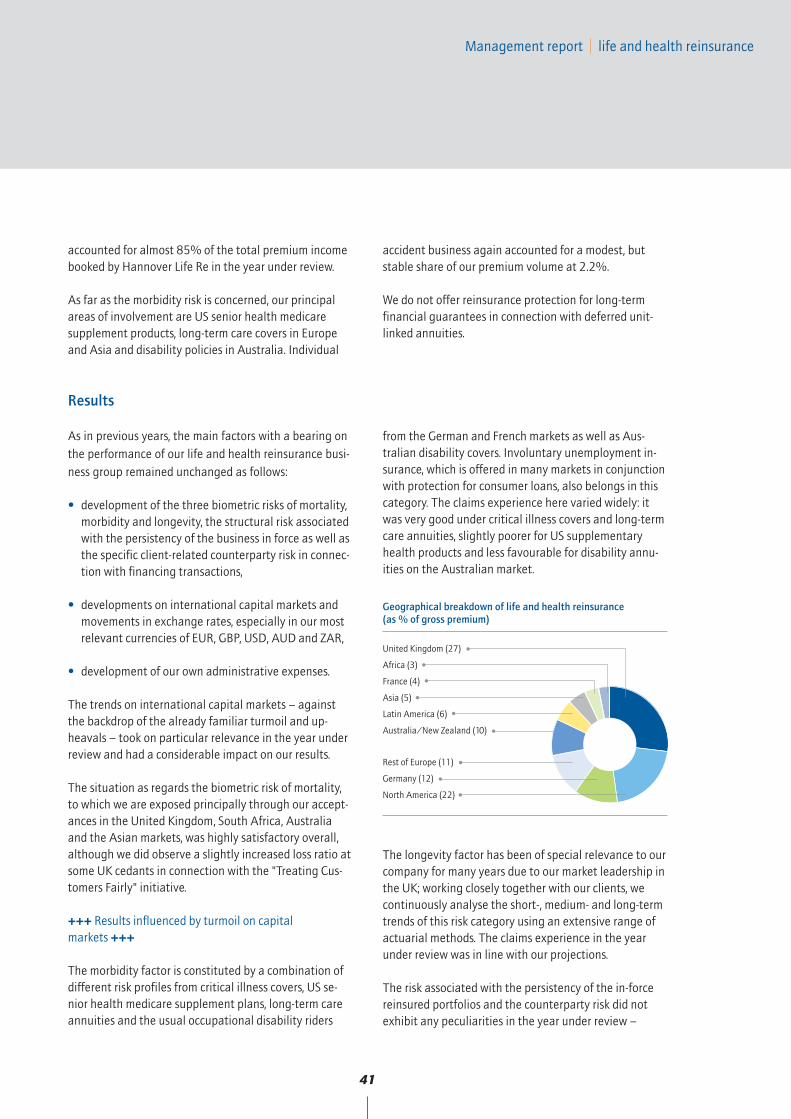
Shareholding structure by countries (as % of free float)
United Kingdom (21.3)
USA (21.8 )
Germany (42.5)
Other (2.1)
Luxembourg (2.3)
Switzerland (3.2)
Belgium (5.6)
France (1.2)
In the year under review, in view of the positive experi-ence in past years, we again held our analysts' confer-ences marking the unveiling of the annual financialstatements on the same day in Frankfurt and London. Inthis way we were able to brief the capital market on theoutcome of the year just-ended as promptly as possibleon a face-to-face basis.
relates to our non-life reinsurance business as well asexplanations of our securitisation transactions, althougha presentation on the growth potential inherent in lifeand health reinsurance was by no means neglected.
11
The Hannover Re share
in EUR 2008 2007 2006 2005 2004
Earnings per share (diluted) (1.05) 5.98 4.27 0.41 2.32
Dividend per share – 1.80 + 0.50 1) 1.60 – 1.00
Share information
1) Bonus
International Securities Identification Number (ISIN): DE 000 840 221 5
Common sharesas at 31 December 2008: EUR 120,597,134.00
Number of shares as at 31 December 2008: 120,597,134 no-par-value registered shares
Market capitalisation as at 31 December 2008: EUR 2,713.4 million
Highest share price on 5 May 2008: EUR 35.79
Lowest share price on 28 October 2008: EUR 15.70
Annual General Meeting: 5 May 2009, 10.30 a.m.Hannover Congress Centrum KuppelsaalTheodor-Heuss-Platz 1-330175 Hannover, Germany
12
OUR STRATEGYat a glance
Our Overriding Objective
• One of the three most profitable reinsurers in the world
• Increasing our profit and the value of the company by a double-digit percentage every year
„Somewhat different”
• Well-diversified Multi-Specialist
• Quick, flexible and undogmatic
• Frugal with lean structure
Strategic Objectives
1. Profitable Growth: Return on equity of at least 750 basis points above the "risk-free" interest rate – Triple-10 target – Allocation of capital to generate the maximum risk-weighted profit – Increase in the share price > Global Reinsurance Index – Lowest cost of capital in the industry
2. Capital Protection: Positive return on equity in at least nine out of ten years
3. Preferred Business Partner: Highly capable – Rating of at least "AA-" from S&P and "A+" from A.M. Best.
4. Motivated Employees: Skills and motivation just as crucial to success as capital resources
5. Lean Organisation: Effective and efficient organisation geared to business processes – Safeguarding of know-how and cost leadership
Strategic Action Fields
1. Performance Excellence: Holistic management system including regular external assessment
2. Corporate Governance: Integrity in our dealings with all stakeholders – high ethical standards
3. Compliance: Observance of all external requirements in order to avoid business, liability and reputational risks
13
Business Group Strategies
Non-Life Reinsurance: Not one of the largest, but one of the most profitable non-life reinsurers in the world – special attention paid to the correct assessment of risks – pricing and conditions guided by technical considerations,appropriate level of reserves
Life/Health Reinsurance: Within five years one of the three major, globally operating life and health reinsurers ofabove-average profitability – annual double-digit growth in volume and profit indicators – special attention devoted to the regional and biometric balance of the portfolio
Business Center Strategies/Service Center Strategies
These are derived from the Group and business group strategies.
in %
0
5
5
10
15
20
25
30
20001)
20011)
20021)
20031)
2004x)
Minimum Actual
2005x)
1) Based on US GAAP
19991) x
)
13.1
17.1
15.7
17.1
11.5
0.7
26.0
12.7 12.5 12.3 12.2 12.1
1.9
11.7
2006x)
2007x)
2008x)
18.7
11.5
23.1
11.4
(4.1)
11.4
After-tax return on equity
Strategy
THE WHOLE PROTECTS ALLOF ITS PARTS
A network of individual elements: they are
all interlinked and every one has its own
very par ticular place. This is how it might
look – the principle of solidarity on which
insurance is based. Each premium protects
the individual. All premiums combined
form a protective shield for all those behind
it. A well structured system – as is clearly
evident.
16
Economic climate
2008 was dominated by a worldwide financial marketcrisis on an unimagined scale. It was triggered by up-heavals on US real estate markets. Back in the secondhalf of 2007 rising interest rates and falling propertyprices had already led to a mortgage crisis. For yearsmortgage lenders – especially in the United States – hadhanded out loans to borrowers with little or no equity,and as interest rates rose these loans could no longer beserviced. Many banks did not hold these poorly securedloans in their own books, but instead restructured themand passed them on to various groups of investors, includ-ing for example hedge funds. As part of a trend originat-ing in the United States, hedge funds and banks beganto get into liquidity problems. The capital market's properfunctioning began to falter; banks lost confidence in oneanother and were scarcely willing to lend among them-selves.
Hitherto sound banks had to rely on state assistance inorder to stay afloat. The rescue packages put togetherby governments in the major industrial nations soughtto defuse the crisis and restore the trust in the financialsystem that had been lost. The crisis on financial marketsdid, however, signal the end for the "investment bank" asa business model: in September the last two remaininginstitutions relinquished their special legal status andwere transformed into commercial banks.
+++ Global crisis on financial markets dominates theyear under review +++
The concerns about the stability of the banking systemunleashed extraordinary turmoil on international capitalmarkets. The leading stock indices shed up to 40% of theirvalue in the year under review. Financials were especiallyhard hit by the stock market crash.
The economic climate around the world took a sharplydarker turn as a consequence of the financial market crisis.The recession in the United States began to spill over toother countries; this was especially true of economic re-gions in which the financial sector and building industry
contributed a large share of economic output. Yet thedownturn was considerable even in countries whose eco-nomic expansion is crucially driven by exports. Only inthreshold markets was it possible to boost output, althoughhere too it flagged towards year-end.
+++ Insurance industry a major factor in economic stability +++
The German economy initially stayed on its growth trackin the year under review despite the turmoil on capitalmarkets. Particularly in the second half of the year, how-ever, a plethora of bad news in connection with the diffi-cult state of financial markets cast a heavy shadow overeconomic prospects. Eventually, as German financial in-stitutions also got into difficulties over the course of theyear, the federal government responded with the FinancialMarkets Stabilisation Act in October. In a further step toconsolidate the German economy it also adopted a pack-age of measures designed to safeguard jobs.
With just a few exceptions, the impact of the financialmarket crisis on the insurance industry was nowhere nearcomparable with the toll it took on the banking sector.Rather, against the backdrop of wide-ranging uncertaintiesit again emerged as an important factor in economic sta-bility. In this context the Solvency II Directive Proposal ofthe European Commission is also taking on increasingsignificance: it is intended to provide Europe with risk-based regulatory legislation in order to secure the finan-cial market and strengthen the continent's own role as aglobal location for the insurance business.
MANAGEMENT REPORTof the Hannover Re Group
17
Management report business development
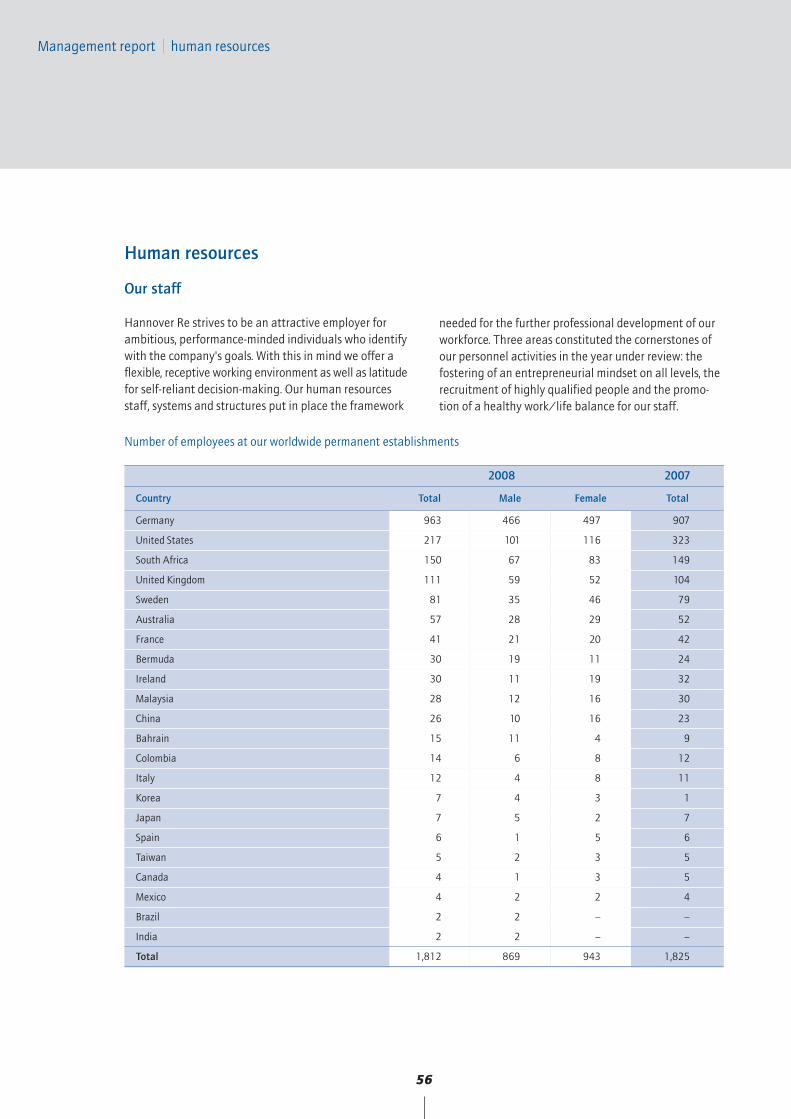
Business development
The effects of the financial market crisis onHannover Re
The international financial market crisis also influencedthe development of Hannover Re's business to a not in-considerable extent in the year under review. After ourinvestment portfolio had been affected only marginallyby subprime losses, write-downs on insolvent financialinstitutions also remained within tight limits. Our invest-ments were not, however, able to escape the turmoil oninternational equity markets entirely unscathed.
In the area of fixed-income securities the price rally –prompted by interest rate cuts on the part of centralbanks and the flight towards more secure assets – hadpositive implications for our shareholders' equity. Yetthis was significantly tempered by the rise in risk premiumsfor corporate bonds. Ultimately, though, the positive effectprevailed. On equity markets the downward trend thathad set in during the first six months of the year gainedadditional massive momentum in September/October.As a result, we were compelled to take considerablewrite-downs and realise sizeable losses on our equityportfolio, which were partially limited by the counter-effect of hedge instruments.
In view of the high volume of write-downs taken, wepublished an ad hoc disclosure on 21 October 2008 inwhich we reported on a substantial profit decline for thethird quarter.
+++ No solvency problems despite the financial marketcrisis +++
Irrespective of the appreciable value adjustments on ourequity portfolio, however, Hannover Re does not – unlikethe various banks that got into difficulties – have anyliquidity or solvency problems whatsoever. Our long-termfinancial strength remains robust. This was also reaffirmedby the rating agency Standard & Poor's, which confirmedour very good rating of "AA-" with a stable outlook inOctober after the issue of our profit warning.
With a clearly positive cash flow and no need for re-financing, the liquidity and solvency of the Hannover ReGroup are in no way impaired.
The repercussions of the financial market crisis on ourreinsurance business were as follows:
In life and health reinsurance the income statementtook a charge from derivatives embedded in US modifiedcoinsurance contracts. The total charges here amountedto EUR 72.1 million.
In non-life reinsurance the effects of the financial mar-ket crisis were particularly notable in the directors' andofficers' (D&O) and professional indemnity lines. Thenumber of our directly exposed D&O contracts in theUnited States – at nine – was minimal in 2008; this wasalso true of the maximum amount of liability. The pre-mium volume was in the order of EUR 35 million. Our ex-posure was even more modest in professional indemnitybusiness. Other contracts that could be affected in thewidest sense by the financial market crisis cover attor-neys, auditors, architects, small banks and real estatebrokers. The exposures under these contracts are appro-priately reflected in our IBNR reserves.
Our credit and surety business was not affected by thereal estate crisis since we do not write any mortgageguarantee contracts. An overall deterioration in the lossratios cannot, however, be ruled out. In this case, too,appropriate allowance has been made in our IBNR reserves.
All in all, though, the implications of the financial mar-ket crisis for the reinsurance industry are positive: theheavy loss of capital at primary insurers is promptinggrowing demand for reinsurance and hence rising rates.Early indications were already apparent in the year underreview. The round of treaty renewals completed on 1 Janu-ary 2009 impressively lived up to expectations. Detailedinformation in this regard is provided in the forecast.
18
Management report business development
Development of operating businessReinsurance business developed satisfactorily in theyear under review: the market environment for non-lifereinsurance was softer overall, as expected, and ratesdeclined in most lines. Nevertheless, for the most part wewere able to obtain prices that were commensurate withthe risks.
+++ Softer market environment in non-life reinsurance +++
The balance of major claims and catastrophe losses wasburdened by a number of severe natural disasters – es-pecially hurricane "Ike" – in the year under review andcame in slightly higher than the multi-year expected level.
In Brazil, the largest insurance market on the SouthAmerican continent, Hannover Re opened a representa-tive office following the lifting of the reinsurance monop-oly; since July of the year under review it has been licensedas an "admitted reinsurer". This gives us more direct accessto clients and puts in place an optimal platform for par-ticipating in the up-and-coming Brazilian market.
+++ Restrained growth in life and health reinsurance +++
Our second business group – life and health reinsurance– fell short of our expectations, principally due to the re-straining effects of movements in exchange rates in thefirst six months. In the medium term, however, we arestanding by our ambitious goal of generating double-digitgrowth in the original currencies. Both the demographictrend in industrialised nations and the growing urbanmiddle class in threshold markets offer a solid basis fordynamic growth and justify such ambitious plans. Wecontinue to participate in product development activitiesaimed at senior citizens, a customer group that is stillneglected in Germany. What is more, we are optimallypositioned in our largest market, the United Kingdom,thanks to our long-standing focus on enhanced annuitiesand the reinsurance of existing pension funds. In theUnited States, too, business with health insurance prod-ucts for seniors shows great promise.
Last but not least, we remain keenly interested in theAsian growth markets. Hannover Re commenced business
operations in China and South Korea in the year underreview through its newly established branches in Shang-hai and Seoul. In India, too, we have put in place a plat-form that will enable us to respond rapidly to marketopportunities as they present themselves: in June Han-nover Re concluded a cooperation agreement with theleading Indian reinsurer GIC Re regarding the joint de-velopment of a profitable portfolio with the promise offurther growth. These plans are supported by the servicecompany that we established in Mumbai.
Detailed information on both business groups is providedin the following sections.
Following the withdrawal from specialty business at thebeginning of 2007 and in the face of weak exchangerates – especially the US dollar and pound sterling in thefirst half-year – gross written premium in total businesscontracted by 1.7% to EUR 8.1 billion (EUR 8.3 billion).At constant exchange rates the premium volume wouldhave grown by 3.9%. The level of retained premium in-creased to 89.1% (87.4%) as a consequence of appreciablesavings on the costs of our own protection covers and re-duced proportional cessions; net premium earned fell by3.2% to EUR 7.1 billion (EUR 7.3 billion).
Investment performanceThe performance of our investments was overshadowedby the worldwide financial market crisis in the year under review. After international equity markets had already retreated in the first half of the year, the down-ward slide continued – especially in September and
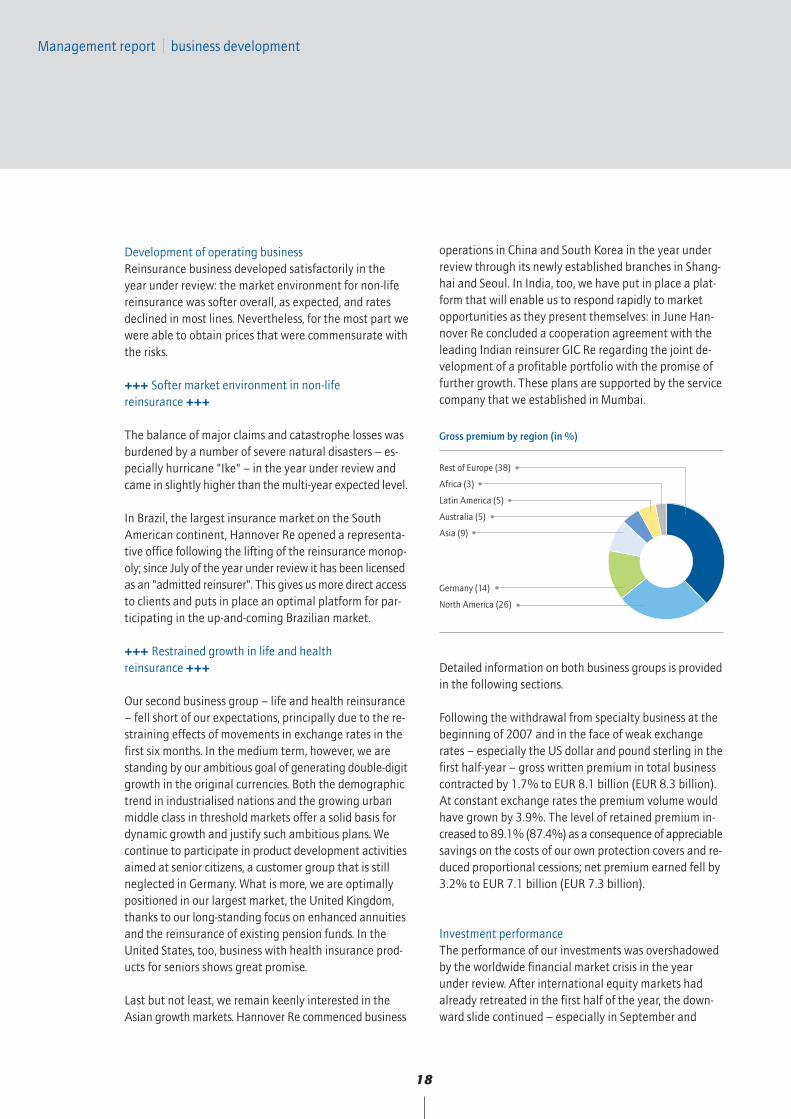
Gross premium by region (in %)
Germany (14)
North America (26)
Africa (3)
Latin America (5)
Australia (5)
Asia (9)
Rest of Europe (38)
19
Management report business development
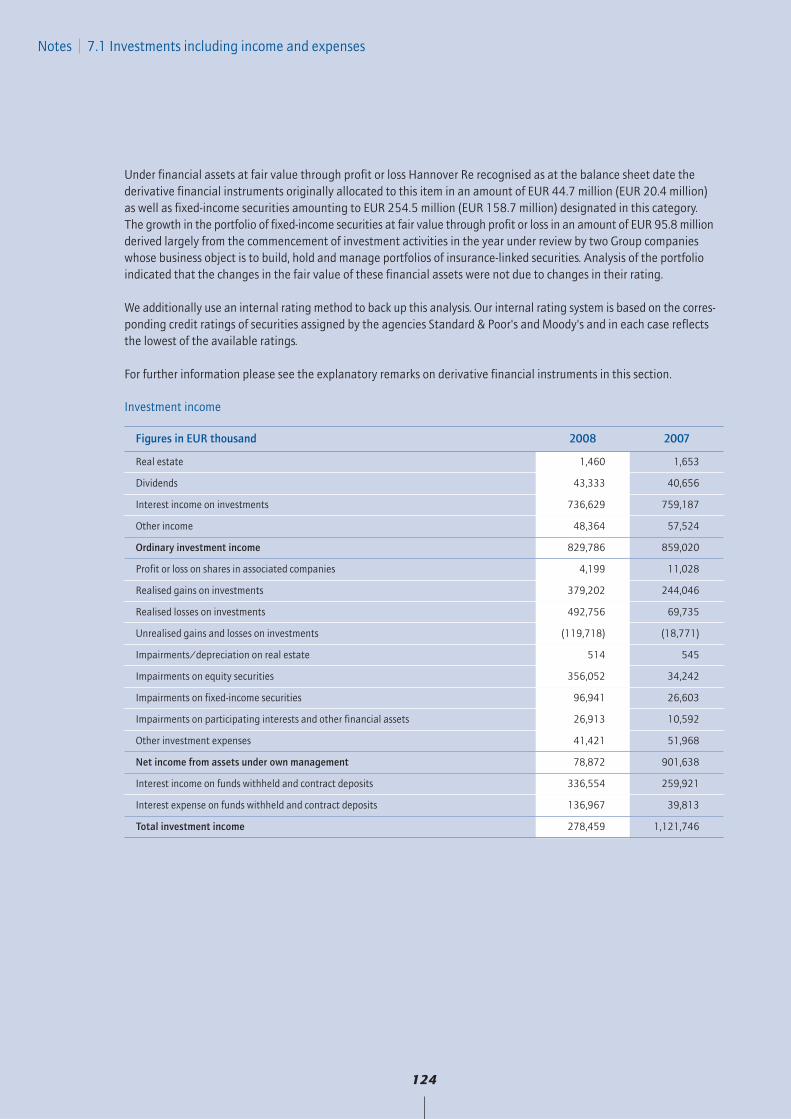
October. This was attributable to the loss of confidenceon financial markets triggered by the meltdown on theUS real estate market as well as the liquidity and capitalcrunch affecting the banks. While interest rate marketssoared, especially towards the end of the year, risk pre-miums on corporate bonds widened enormously. It isgratifying to note that our portfolio of assets under ownmanagement nevertheless grew to EUR 20.1 billionthanks to a positive cash flow from the technical accountand the rise of the US dollar towards year-end. This cor-responds to an increase of 1.6% compared to the levelas at 31 December 2007 (EUR 19.8 billion). Ordinary in-vestment income excluding deposit interest fell short ofthe previous year at EUR 829.8 million (EUR 859.0 mil-lion) owing to portfolio regrouping into low-interest government bonds.
A large portion of the realised gains totalling EUR 379.2million (EUR 244.0 million) can be explained by the tac-tical modification of durations in the US dollar portfolioundertaken in the first quarter as well as the liquidationof the hedge on around one-fifth of the equity portfolioin the fourth quarter. This contrasted with realised lossesof -EUR 492.8 (-EUR 69.7 million) attributable largely tothe sharp reduction of the equity allocation in the fourthquarter. The necessary write-downs of altogether EUR479.9 million (EUR 71.4 million) were due in very largemeasure to the downslide on equity markets during thefirst three quarters, while write-downs on fixed-incomesecurities accounted for an amount of EUR 96.9 million.The unrealised gains reported in the statement of in-come derived primarily from US quota share reinsurancetreaties with a retained deposit, under which the partialassumption of default risks is envisaged and appropri-ately recognised. Total net investment income contract-ed by 75.2% to EUR 278.5 million (EUR 1.1 billion).
+++ Financial market crisis leaves a clear mark oninvestment income +++
Result of total business We are not satisfied with the results trend in the yearunder review. The operating profit (EBIT) fell by 84.0%to EUR 148.1 million (EUR 928.0 million) owing to theeffects of the financial market crisis. Group net incomecontracted by 117.6% to -EUR 127.0 million (EUR721.7 million), although the previous year had been
assisted by a positive special effect associated with thereform of corporate taxation in an amount of EUR 191.5million (before minority interests). The result in the yearunder review was additionally hampered by the fact thatlosses on equities are not tax-deductible in Germany andhence a tax load of EUR 205.6 million was incurred des-pite posting a pre-tax result of 70.6 million. Earnings pershare stood at -EUR 1.05 (EUR 5.98).
in EUR million
4,000
5,000
6,000
2,000
3,000
0
1,000
2004
2005
2006
2007
2008
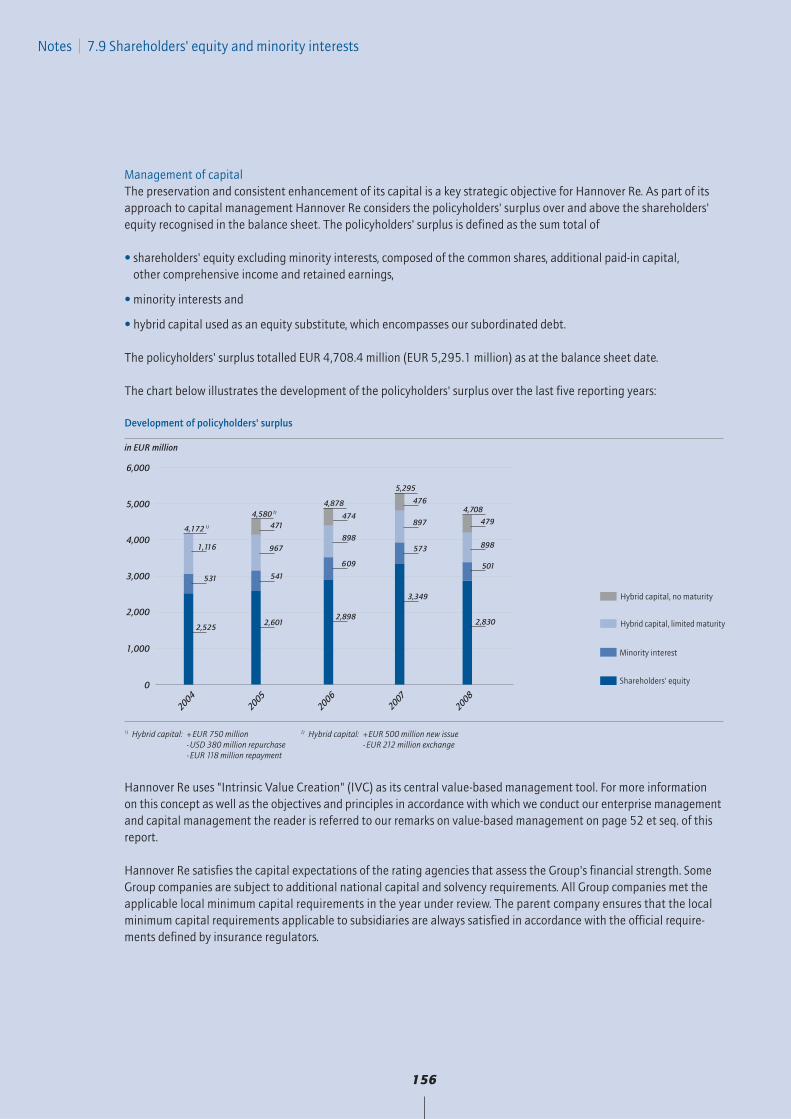
Policyholders' surplus
4,172.2
5,295.1
4,579.64,878.4 4,708.4
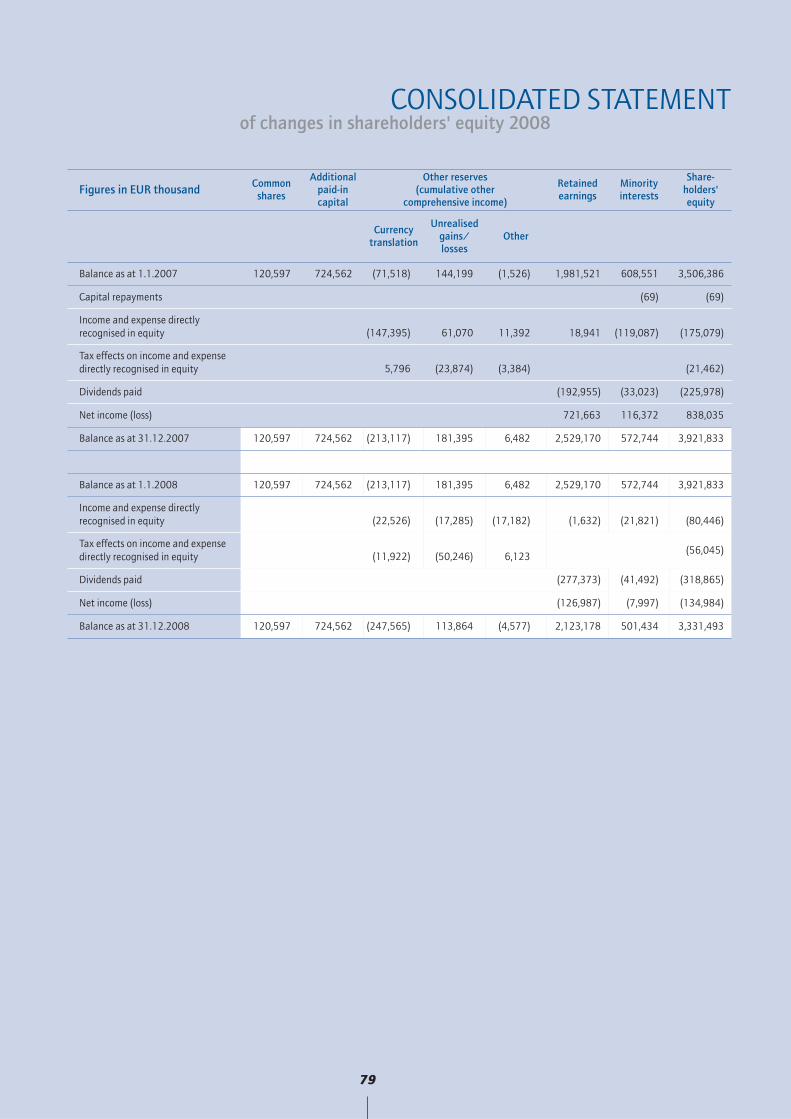
Compared to the position as at 31 December 2007,shareholders' equity decreased by EUR 519.0 million inthe year under review to EUR 2.8 billion. The book valueper share consequently fell by 15.5% to EUR 23.47. Thetotal policyholders' surplus – consisting of shareholders'equity, minority interests and hybrid capital – amountedto EUR 4.7 billion (EUR 5.3 billion).
We use retrocession, i.e. the passing on of portions of our covered risks to other reinsurers, as a means of riskreduction. In the course of the year the reinsurancerecoverables on unpaid claims – i.e. receivables due tous from our retrocessionaires – decreased to EUR 2.1 bil-lion (EUR 2.5 billion). We continue to attach consider-able importance to the quality of our retrocessionaires:more than 95% of the companies with which we main-tain such business relations have an investment graderating of "BBB" or better from Standard & Poor's.
Alongside traditional retrocessions we also conserve ourcapital by transferring insurance risks to the capital market.
20
Our business groups
In the following section we discuss the development ofthe financial year on the basis of our two strategic busi-ness groups, namely non-life reinsurance and life andhealth reinsurance. In addition, the segmental reportprovided in the annual financial statement shows thekey balance sheet items and profit components brokendown into the individual business groups.
Gross premium by business group (in %)
Non-life reinsurance (61)
Life and health reinsurance (39)
Management report our business groups
Non-life reinsurance
Non-life reinsurance is our largest and most importantbusiness group. Overall, business developed satisfactorilyin the year under review. Although some major marketsand lines exhibited softening tendencies (for exampleNorth America and marine business), the treaty renewalsas at 1 January 2008 – the time of the year when aroundtwo-thirds of our treaties are renegotiated – passed offlargely favourably. The rate reductions proved to besmaller than had been anticipated, and by and large wecontinued to obtain prices and conditions that werecommensurate with the risks. These tendencies werereaffirmed in the mid-year treaty renewals as at 1 July2008 in the United States; profitable acceptances werestill possible based on the appropriate selection. Similar-ly, we were broadly satisfied with the renewal of treatiesin Australia and New Zealand at the same point in time.Rates in non-proportional property business held stable;price increases were pushed through under programmesthat had suffered losses.
Cornerstones of our underwriting continue to be our ac-tive cycle management and profit-oriented underwritingpolicy, according to which we concentrate on those seg-ments that promise the greatest profitability. In the yearunder review we were able to largely offset more pro-
nounced premium declines in some areas with increasesin the German market and in worldwide credit and suretyreinsurance.
We were satisfied on balance with the rate level in generalUS property business. Property catastrophe business, onthe other hand, saw sharp rate cuts following the absenceof major claims in 2007. In the casualty sector pricescontinued to soften on the reinsurance side, promptingus to further scale back our involvement. Our total pre-mium volume in North America contracted as expected.In the second half of the year, however, it was alreadypossible to secure rate increases in some segments as aconsequence of the financial market crisis.
+++ Focus remains on cycle management +++
Our so-called retakaful business continues to fare well:thanks to the strong economic growth recorded to datein Southeast Asia and the Near East, we were able tosubstantially enlarge our premium volume in the yearunder review.
The Latin American insurance market is also developingsteadily: following the abolition of the reinsurance monop-
In the year under review Hannover Re was the recipientof several distinctions: the highly respected internationaltrade magazine "The Review" crowned us ReinsuranceCompany of the Year, and our Chief Executive Officer
Wilhelm Zeller was honoured with the Lifetime Achieve-ment Award. We were proud to accept further awards inRussia, where we were named as best foreign reinsureron two occasions.
21
Management report non-life reinsurance
oly in Brazil we established a representative office in Riode Janeiro and received a licence as an "admitted rein-surer" in July of the year under review.
Our strategy when it comes to covers for agricultural risksis to acquire additional market shares. We are thereforeexpanding this business in both Latin America and Asia.
In the field of structured products we are one of theleading providers worldwide. The year under review wasnotable for the ongoing regional diversification of ourportfolio, which in past years had been slanted heavilytowards the United States. On the back of the repercus-sions of the financial market crisis we observed growingdemand for such products in Europe and Asia. On the basisof tailored solutions and our long-standing actuarial expertisewe are able to offer our clients the best possible service.
Following the withdrawal of Clarendon Insurance Group,Inc. from active specialty business, only International In-surance Company of Hannover Ltd., London, and CompassInsurance Company Ltd., Johannesburg, continue totransact primary insurance. Both companies again signifi-cantly boosted their premium income in the year underreview. On account of several major loss events, however,the result posted by International Insurance Company ofHannover declined, while Compass Insurance Company'sperformance was highly gratifying.
In the year under review we again took steps to ensurethat our equity base is not strained by exceptionallylarge losses. On the one hand, for example, we furtherscaled back our peak exposures, while on the other wetopped up our "K5" capital market transaction by anextra USD 10 million.
+++ Further capital market transactions in the yearunder review +++
As part of our extended activities in the area of insurance-linked securities we completed our first transaction inthe year under review. Unlike Hannover Re's previous se-curitisations, it was not designed for our own protectionbut rather to directly transfer our clients' business to thecapital market. Property catastrophe risks of a number ofUS cedants were packaged and passed on to the capital
Percentage breakdown of gross premium income in non-life reinsurance by line of business
Property (34)
Other (5)
Aviation (6)
Credit/surety (7)
Marine (7)
Casualty (41)
market in several tranches. A special purpose entitynamed "Globe Re", which is capitalised at USD 133 million,was established in Bermuda for this transaction.
Owing to the restraining effects of exchange rate move-ments, primarily during the first half of the year, thegross premium volume booked in our non-life reinsurancebusiness group in the year under review contracted by3.9% to EUR 5.0 billion (EUR 5.2 billion). The withdrawalfrom specialty business was another factor that curbedpremium income. At constant exchange rates, especiallyagainst the US dollar, growth would have come in at1.3%. The level of retained premium climbed from85.2% to 88.9% as a consequence of appreciable savingson our own protection covers and reduced proportionalcessions. Net premium earned declined by 4.9% to EUR4.3 billion (EUR 4.5 billion).
The most striking feature of the major loss situation inthe year under review was a series of devastating naturaldisasters. These included, most notably, the snow and icestorms in several Chinese provinces, winter storm "Emma"in Europe, the severe earthquake in the Chinese provinceof Sichuan, hailstorms in Germany as well as the twohurricane events "Gustav" and "Ike". The latter produceda net strain of EUR 222.1 million for Hannover Re's ac-count. A number of other small and mid-sized naturaldisasters were also recorded.
Total net expenditure on catastrophe losses and majorclaims in 2008 amounted to EUR 457.8 million (EUR285.4 million). This figure corresponds to 10.7% of netpremium in non-life reinsurance and was thus only
Management report non-life reinsurance
22
slightly higher than the expected level of 10%, despitethe catastrophe losses indicated above. The combinedratio stood at 95.4% (99.7%) in the year under review.
The underwriting result improved to EUR 184.7 million,compared with a deficit of EUR 26.7 million in the previ-ous year. Net investment income fell by 98.6% in theyear under review to EUR 11.1 million (EUR 783.3 million)owing to the heavy write-downs that had to be taken onequities. It should be mentioned in this context that ourequity investments are traditionally allocated to non-lifereinsurance, and the strain in this business group wastherefore disprportionately higher than in life andhealth reinsurance. The operating profit (EBIT) in non-lifereinsurance consequently fell sharply by 99.7% to EUR2.3 million (EUR 656.7 million). Group net income con-tracted by 129.3% to -EUR 160.9 million (EUR 549.5million); the previous year's result included a positive
Geographical breakdown of non-life reinsurance (in % of gross premium income)
United Kingdom (12)
Germany (15)
Rest of Europe (22)
North America (27)
Australia (2)
Africa (4)
Latin America (6)
Asia (12)
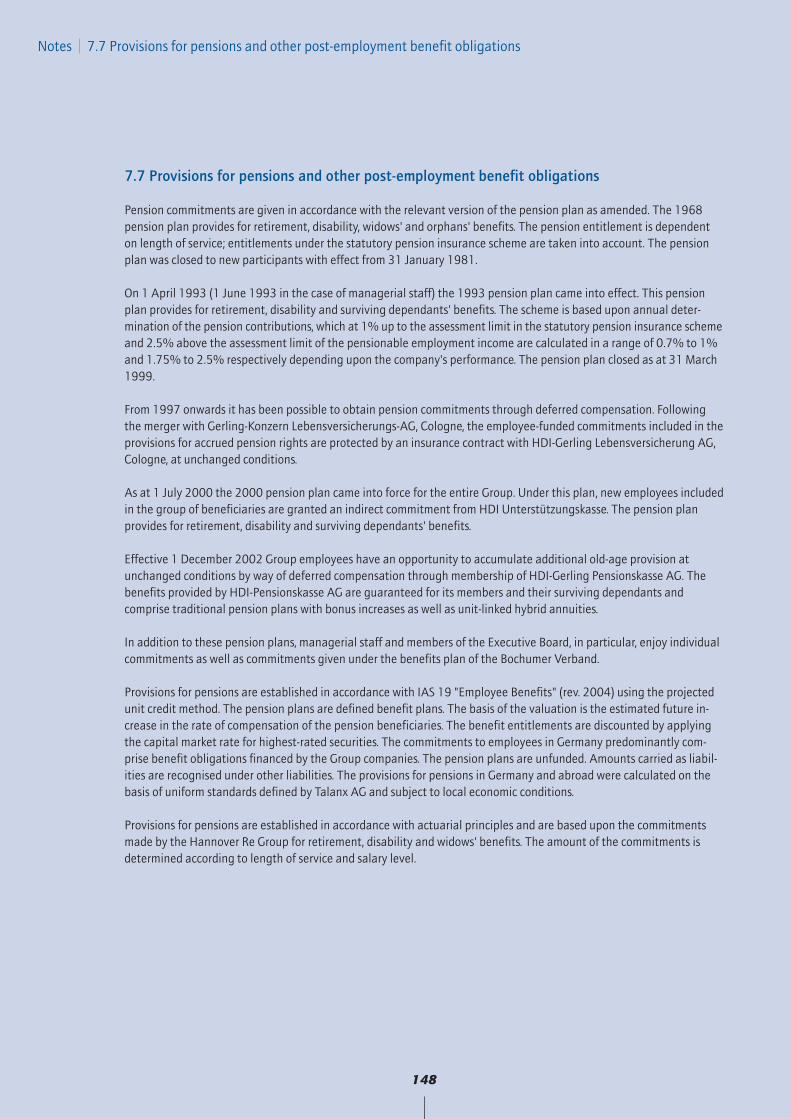
Figures in EUR million 2008 +/- previousyear 2007 2006 20051) 20041)
Gross written premium 4,987.8 -3.9% 5,189.5 6,495,7 4,639.3 4,211.1
Net premium earned 4,276.7 -4.9% 4,497.6 4,718,7 3,922.9 3,456.2
Underwriting result 184.7 -792.3% (26.7) (71.0) (500.5) 98.5
Net investment income 11.1 -98.6% 783.3 831.7 544.8 440.7
Operating result (EBIT) 2.3 -99.7% 656.7 670.1 (28.3) 463.0
Group net income (loss) (160.9) -129.3% 549.5 478.5 4.3 270.7
Earnings per share in EUR (1.33) -129.3% 4.56 3.97 0.04 2.24
Retention 88.9% 85.2% 72.4% 85.9% 83.0%
Combined ratio 2) 95.4% 99.7% 100.8% 112.8% 97.2%
Key figures for non-life reinsurance
1) Figures for 2005 and 2004 before new segmentation2) Incl. deposit interests
special effect of EUR 137.8 million associated with thereduction of deferred taxes. Earnings per share amountedto -EUR 1.33 (EUR 4.56).
Management report non-life reinsurance
23
Germany
The domestic market is served by our subsidiary E+S Rück.As the dedicated reinsurer for the German market, thecompany has for decades been a sought-after partner thanksto its excellent financial standing, highly developed cus-tomer orientation and the continuity of its business rela-tionships. E+S Rück continues to rank second in Germany,the second-largest non-life reinsurance market in the world.
In view of the competitive climate prevailing on the Ger-man primary insurance market, we expanded our port-folio very selectively. Overall, though, the favourable claimssituation enabled us to generate a satisfactory result.
Fierce competition continued to be the hallmark of theprimary sector – both in industrial lines and private cus-tomer insurance. In the latter case this was especiallytrue of motor business, an important line for our company.Compared to the original market, however, the climateon the reinsurance side was more favourable, i.e. ratesand conditions continued to be broadly adequate. Al-though softening tendencies made themselves felt here
too, we were able to act on attractive business oppor-tunities in the year under review.
In motor liability insurance the premium erosion – ataround 2% – took a more favourable turn than hadbeen initially anticipated. With the claims frequency alsofalling, profitability proved to be more than adequate.Results in motor own damage insurance, on the otherhand, were adversely impacted by the hailstorm events"Hilal" and "Naruporn". Our losses from these two eventsamounted to EUR 55.2 million and EUR 12.0 million respectively. Winter storm "Emma" also caused severedamage in Germany; the net strain from this event to-talled EUR 13.3 million.
Industrial property reinsurance lines suffered under premium reductions and increased losses in the yearunder review. Overall, though, a break-even result wasachieved. Homeowners' comprehensive, which had in-curred heavy strains in 2007 from winter storm "Kyrill",performed considerably better than in the previous year.
20022003
20042001
20001999
in EUR million
100
0
200
Major loss trend
300
600
500
400
Major loss burden 1)
1) Relative to premium in non-life reinsurance (1999–2006 adjusted to new segmentation)2) 1999–2004 = 5%, 2005 = 6%, from 2006–2007 = 8% from 2008 = 10% of net premium earned in non-life reinsurance
11% 8% 19% 4% 1% 10% 34% 2% 8% 13%
9% 5% 14% 4% 1% 7% 20% 2% 6% 11%
135
181
238240
497472
6651,775
370
8360
2005
775
377
20062007
2008
2,3731,070
Net Net expectancy for major losses 2)Gross
277311
378360
281
314
121 107
410
285
672
458
428
225
164
24
Management report non-life reinsurance
Terms and conditions were also gratifying in casualty in-surance, and here too we were able to post a good result.
+++ E+S Rück expands market share in Germany+++
Personal accident insurance, which remains one of ourtarget lines, continued to develop favourably. In additionto the traditional assumption of risks in treaty and facul-tative reinsurance, our clients again benefited from ourproduct innovations in the year under review; by way ofexample, we may cite here the combined personal acci-dent annuity product designed by our company that alsoprovides benefits in case of severe illnesses. Furthermore,we complemented our range of services in the year underreview through our cooperation with external providers.
By way of increased treaty shares under existing accountsand new customer relationships we were able to furtherenlarge our market share in the year under review andextend our position as one of the leading reinsurers inthe profitable German market.
The directive adopted by the EU on finite reinsurancewas implemented into national law in 2008 and incorp-
orated into the Insurance Supervision Act. Structuredproducts are explicitly recognised under these provisionsand their treatment is governed by binding rules. Aidedby intensive marketing efforts we further raised our pro-file in this sector, as a consequence of which ceding com-panies are increasingly including our products in theirreinsurance planning. All in all, we were satisfied withthe development of our business with structured productsin Germany.
United Kingdom and the London Market
In the year under review we acquired new accounts andfurther diversified our portfolio in the United Kingdom.In accordance with our marketing strategy the focus wason expanding specialised niche business, such as travelpersonal accident covers, while scaling back our catas-trophe-exposed business as planned.
In casualty business Hannover Re again profited from itsvery good rating. While the price level in the previousyear had held stable, the year under review saw a slightreduction in rates. Although in a few instances our in-volvement is of a long-term nature, we generally pursuean opportunistic underwriting policy in the London Market.
Our premium volume in the year under review remainedstable; all in all, the loss experience was moderate.
The London Market is also a prominent centre for theunderwriting of international marine and aviation risks; inboth lines Hannover Re ranks among the market leaders.
After the original market had seen sharp rate declines inaviation insurance in 2007, leaving insurers with theirfirst overall deficit, there was heavy pressure to stop thispremium erosion. The crisis on financial markets andassociated loss of capital among insurers also had afavourable effect on rate movements on both the insur-ance and reinsurance sides, with the result that initialtendencies towards stabilisation and rising rates couldbe discerned in the year under review. What is more, theopening up of the Brazilian insurance market presentednew business opportunities in aviation reinsurance.
Percentage breakdown of gross written premium in Germany by line of business
Property/casualty (44)
Motor (45)
Credit/surety (1)
Aviation (3)
Accident (6)
Other (1)
25
Management report non-life reinsurance
ations are therefore of major significance in relationsbetween insurers and reinsurers.
Notable major claims in the year under review includedthe deadly plane crash in Madrid as well as a satellitefailure, producing a total net burden of losses in theorder of EUR 13.9 million.
+++ Marine business impacted by hurricane losses +++
Following two years that were virtually spared majorclaims, rates in marine reinsurance softened slightly in2008. There were, however, regional differences. TheAsian market, for example – which is one of the mostfiercely competitive in the world – saw reductions ofaround 20%. Overall, we largely preserved our existingportfolio, although exposures in the Gulf of Mexico werepurposefully reduced. Our underwriting policy is slantedheavily towards non-proportional covers.
Along with higher basic losses on the primary side in off-shore energy business, it was hurricane "Ike" that inflictedsubstantial losses on the (re)insurance industry: despitethe relatively moderate intensity of its winds, the slowspeed of the hurricane's advance led to considerabledamage. The market loss for offshore business – i.e. thedrilling rigs and oil platforms in the Gulf of Mexico – wasput at around USD 3 billion. Prices for covers in the Gulfof Mexico are therefore likely to rise appreciably. As afurther factor, the crisis on financial markets has promptedgeneral market hardening as insurance and reinsurancecapacities contract.
Our net burden of losses from hurricane "Ike" was in theorder of EUR 222.1 million and encompassed not onlyoffshore but also onshore business, i.e. the insured prop-erty damage on land. Another hurricane – by the nameof "Gustav" – was recorded in the Caribbean in the yearunder review, although the resulting strain for HannoverRe's account was relatively modest at around EUR 18.1million.
+++ Hannover Re posts very good result in credit andsurety reinsurance +++
We were thoroughly satisfied with the development ofthe credit and surety lines in Europe. Business here istraditionally geared to continuity, and loyalty consider-
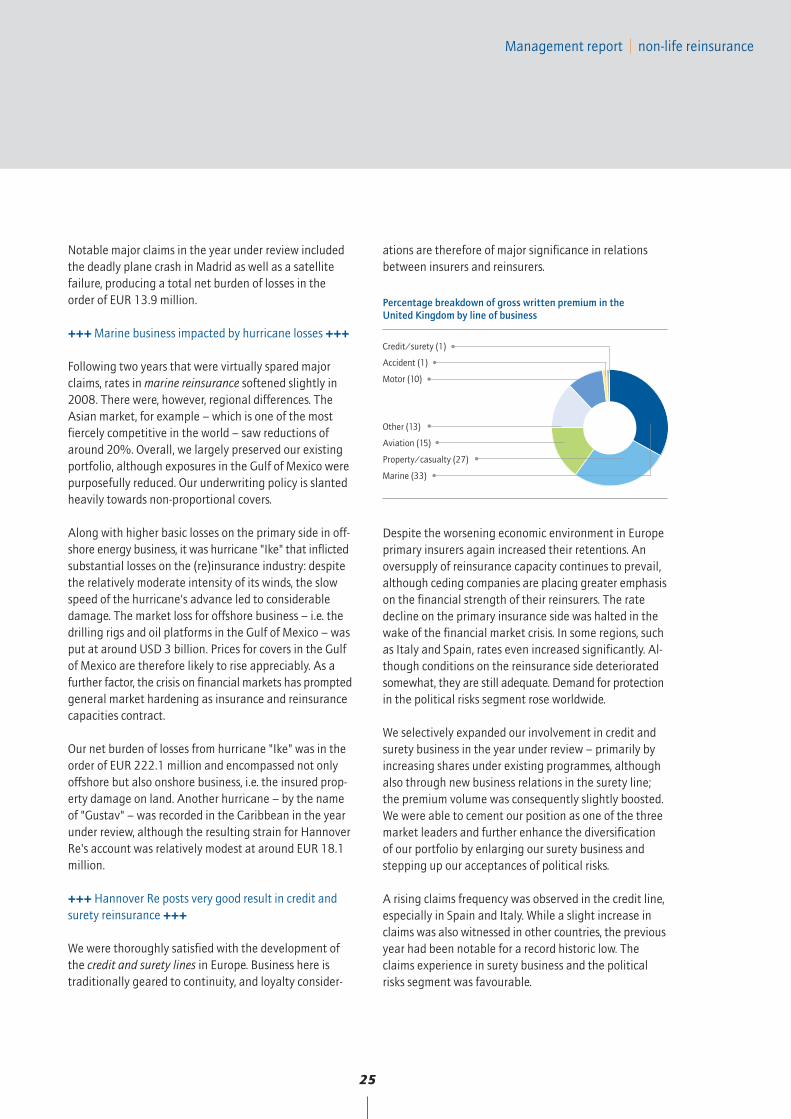
Percentage breakdown of gross written premium in the United Kingdom by line of business
Other (13)
Aviation (15)
Property/casualty (27)
Marine (33)
Accident (1)
Motor (10)
Credit/surety (1)
Despite the worsening economic environment in Europeprimary insurers again increased their retentions. Anoversupply of reinsurance capacity continues to prevail,although ceding companies are placing greater emphasison the financial strength of their reinsurers. The ratedecline on the primary insurance side was halted in thewake of the financial market crisis. In some regions, suchas Italy and Spain, rates even increased significantly. Al-though conditions on the reinsurance side deterioratedsomewhat, they are still adequate. Demand for protectionin the political risks segment rose worldwide.
We selectively expanded our involvement in credit andsurety business in the year under review – primarily byincreasing shares under existing programmes, althoughalso through new business relations in the surety line;the premium volume was consequently slightly boosted.We were able to cement our position as one of the threemarket leaders and further enhance the diversificationof our portfolio by enlarging our surety business andstepping up our acceptances of political risks.
A rising claims frequency was observed in the credit line,especially in Spain and Italy. While a slight increase inclaims was also witnessed in other countries, the previousyear had been notable for a record historic low. Theclaims experience in surety business and the politicalrisks segment was favourable.
APPEARANCES CAN BE DECEIVING
When the hype has subsided and the
glamour faded, true values shine through
once again. Experience and knowledge
regain their former status. Solidity is back
in demand, and tailored solutions are more
impor tant than ever.The vir tues of old
are also those of tomorrow. And a crisis
opens up new oppor tunities.
28
Management report non-life reinsurance
Western and Southern Europe
Primary insurance business in France fared satisfactorily.Rates bottomed out in 2008 after three years of declines.The motor line, in which the rate level on the reinsuranceside was still insufficient, remained problematic.
In light of this situation we are not seeking to increaseour market shares, but instead focus primarily on profit-ability.
In the year under review we continued to optimise ourportfolio in builder's risk insurance and pursued a long-term strategy of consistent expansion. Operations at ourParis office for life reinsurance business were extendedin 2008 to include facultative and treaty reinsurance inthe personal accident line.
+++ Involvement in builder's risk insurance stepped up +++
With the exception of the fire in the Eurotunnel therewere no significant loss events on the French market.The strain incurred by Hannover Re from this event wasin the order of EUR 6.3 million for net account.
Our premium volume was slightly scaled back in the yearunder review.
Amalgamations among smaller players were the hallmarkof the primary insurance market in the Netherlands inthe year under review. Further insurers will find themselvesforced to merge in the face of the looming high costs
associated with fulfilment of Solvency II standards. Thefinancial market crisis also hit a number of insurers in theNetherlands, who felt compelled to take up governmentoffers of assistance. The Dutch part of a major Belgian-Dutch group passed into state ownership. There were nonegative repercussions for the reinsurance industry.Rather, it can be anticipated that the crisis on financialmarkets will prompt stronger demand for reinsurancecovers. The intense price competition in industrial prop-erty business showed no signs of abating.
In the Netherlands we devoted special attention in theyear under review to non-proportional niche segments,including for example reinsurance for greenhouses andpublic entities liability business. In view of thefavourable rates in the casualty sector, we expanded ourportfolio in this line.
Our premium volume from the Dutch market remainedvirtually unchanged.
The burden of losses incurred by Hannover Re in theyear under review was moderate: while catastrophebusiness was spared losses – with the exception of asizeable regional hailstorm –, the blaze at Delft Univer-sity of Technology caused the largest fire claim hithertorecorded in Dutch property business. Based on the lossinformation currently available, the original claim is inthe order of EUR 140 million. Our share of this loss willcome in at a modest EUR 1 million.
All in all, we were satisfied with the development of ourbusiness in the Netherlands.
Italy
The Italian non-life market again generated only verymarginal growth in the year under review in the face ofan onerous economic climate; there were no significantshifts in market shares. The volume of business cededcontracted in 2008 as insurers raised their retentions.The consolidation phase on the Italian market has beenlargely completed; under currently applicable anti-trustlaws the present market leaders cannot take over anyfurther competitors.
+++ Premium volume enlarged +++
The positive claims trend in motor and industrial businessfanned fierce competition in these lines, putting ratesunder appreciable pressure. On the other hand, in privatecustomer business – with the exception of motor insur-ance – rates and conditions were adequate. Thanks toour selective underwriting policy we were able to achieve
29
Management report non-life reinsurance
Northern Europe
We strive to play a leading role in the markets of North-ern Europe, especially in the segment of mutual insurers.In general terms, we prefer client relationships that aregeared to the long term. In cases where we do not con-sider loyalty considerations a relevant factor, we writeour business opportunistically.
+++ Consequences of financial market crisis in Northern Europe have no adverse effects +++
The intense competition prevailing on Nordic marketscontinued unabated in the year under review. It can,however, be assumed that the downward slide in rates inoriginal business bottomed out in 2008. Conditions onthe reinsurance market were highly competitive, espe-cially with regard to covers for catastrophe, property andpersonal accident business. Only in the casualty sectordid prices hold stable, prompting us to make more cap-acity available in these lines.
Denmark launched a new insurance product on the marketin the year under review in the form of liability coveragefor latent construction defects. For new building projectsit must now be demonstrated that such a policy hasbeen taken out at the time of applying for a construction
permit. We expect this regulation to generate attractivenew business opportunities.
Insurers in Northern Europe, in common with players inother markets, had to take heavy write-downs as a con-sequence of the financial crisis – with Iceland being par-ticularly hard hit. The nationalisation of that country'sthree largest banks and the associated problems for Ice-landic captives – as owners of the major insurers – areenormous issues, and the repercussions of these devel-opments cannot as yet be clearly grasped. It is likely thatthe companies will sell foreign-based insurance sub-sidiaries. Hannover Re does not, however, expect thesecircumstances to have any adverse implications for itsreinsurance operations.
Premium income in Northern Europe contracted slightlyin 2008. On the claims side we were thoroughly satisfiedwith the situation: fire claims decreased in frequency inthe year under review, and our basic loss ratio in firebusiness therefore fell. Based on the loss informationcurrently available, we expect a major fire claim in Finlandto produce a strain in the lower single-digit millions forour account.
Central and Eastern Europe
The primary insurance markets of Central and EasternEurope enjoyed above-average growth in the first sixmonths of the year under review, although this slowed inthe second half on account of the global financial marketcrisis. Rates in original business continued to decline inthe face of undiminished intense competition.
+++ Strategic focus on Central and Eastern Europe +++
The situation on the reinsurance side was more favourable:conditions and rates held stable with few exceptions.
For Hannover Re the countries of Central and EasternEurope constitute a clear strategic focus as growth mar-kets. We rank among the three market leaders in thisregion and offer reinsurance covers across all lines. Aslong as profitable business opportunities continue to beavailable going forward, we intend to pursue furthergrowth.
Our underwriting policy in these markets is opportunistic,and we prefer non-proportional treaties. It is gratifyingto note that ceding companies are increasingly showing
technically acceptable prices overall. We enlarged ourpremium volume.
In light of a positive loss experience and adequate prices,we were once again thoroughly satisfied with our resultin Italy.
30
Management report non-life reinsurance
interest in replacing their proportional cessions with non-proportional covers. In the year under review we observedgrowing demand for higher limits – as clients raised theirretentions – and additional capacity for natural catas-trophe risks. Against this backdrop we continued to en-large our portfolio.
2008 was notable for an increased number of small andmid-sized claims. A severe fire claim occurred in Russia.Winter storm "Emma" caused relatively heavy losses inthe Czech Republic, Slovakia and Hungary, while Slovenia
was impacted by heavy hailstorms in July and August.The strain for Hannover Re's account was moderate,however, enabling us to generate another gratifyingprofit in this region.
Our expertise in the Russian market was also honouredby the award of two distinctions as best reinsurancecompany in the year under review. Hannover Re gainedplus points for its undogmatic and quick decision-makingas well as for its customer-oriented products.
North America
The North American (re)insurance market is the world'slargest single market and currently the second-mostimportant for Hannover Re's portfolio. It accounted for27.0% of our premium volume in non-life reinsurance.
The economic climate in North America was stretched tobreaking point in the year under review. Consumers ex-ercised considerable restraint in the face of the financialmarket crisis, and the economy slipped into recession. Thereal estate sector continued to be particularly heavilyovershadowed by the crisis. Yet a number of the market'slargest ceding companies also found themselves in finan-cial difficulties – most strikingly the market leader in theUnited States. As a consequence of a reduced capitalbase, not all insurers were able to run retentions on theircustomary level.
The economic downturn prompted a contraction in de-mand on the original market, especially in commercialbusiness – including for example covers for craft enter-prises, construction firms and haulage companies.
+++ No significant implications of the crisis on financialmarkets for North American business +++
Of special relevance here is the contraction in equity re-sources on the primary insurance side. The situation asat the end of the year under review was almost back ona par with the starting point in 2005. What this means isde facto zero growth in equity capital opposed by fouryears of exposure increases. Surplus capital has beenlargely exhausted, and the excess reserves of the hard
market have been released; declining investment incomeis another factor. All these considerations will serve topush up prices in 2009. On the reinsurance side too asignificant surge in demand and hence more attractiverates can therefore be expected, especially in the area ofcatastrophe reinsurance.
With a view to optimising the diversification of our port-folio we again scaled back larger shares with somecedants in the year under review, while at the same timeexpanding our business relationships with mid-sizedregional players and mutual insurers. This business seg-ment has been progressively enlarged over the past fiveyears and now accounts for around 20% of our totalportfolio. Going forward, the focus of our activities inNorth America will be on systematic adherence to ourclient segmentation, with greater weight attached tostrategically oriented customer relationships.
For marketing purposes we further strengthened ourpartnerships with selected brokerage firms in the yearunder review, a helpful move which gives us extensiveaccess to a cedant's entire portfolio. The positive effectsof these initiatives will make themselves felt in the up-coming market hardening and will serve to further opti-mise our portfolio mix.
Our long-established, tried and trusted anticyclical busi-ness policy lends itself to consolidating our profitabilityin the North American market across various cyclicalphases. Consequently, we did not seek to enlarge ourmarket shares in 2008. Instead, for example, we scaled
31
Management report non-life reinsurance
back our market shares in property and casualty busi-ness – which at the end of the harder market cycle in2004 and 2005 had still been in excess of 3% – to thecurrent levels of around 2.5%. We nevertheless continueto form part of the small group of reinsurers that areapproached for placement and pricing.
Given the cyclical nature of the North American market,it is absolutely essential to play such an active role evenin softer market phases so as to safeguard our capabilityfor renewed expansion of the portfolio in the cominghard market years. In this respect market surveys confirmthat we continue to be ranked first in qualitative termson the broker market.
+++ Premium volume in US D&O business furtherreduced +++
In most casualty segments – such as directors' and offi-cers' (D&O) covers – rates showed further single-digitdeclines in the first nine months of the year under review.In the shadow of the financial market crisis, however,they stabilised in the fourth quarter. We purposefullyrelinquished market shares and reduced our volume incasualty business, especially in the professional indem-nity and special liability lines.
The combined ratio climbed markedly in the year underreview, creeping close to the maximum level that we areprepared to tolerate. Only in routine casualty businessdid we maintain our volume, since conditions here wererelatively favourable and we were again able to generatea breakeven result.
While rate reductions in double digits were still the normin property business in the first half of the year under re-view, the onset of the hurricane season heralded a trendreversal. In particular, the repercussions of hurricane"Ike", which with a market loss of around USD 20 billioncame in as the third most expensive hurricane of alltime, halted the price decline.
We are one of the market leaders in credit and suretyreinsurance in North America. The protracted crisis onfinancial markets led to a drop in the solvency level ofbusinesses and hence to a rising number of bankruptciesin the year under review. The claims frequency in the
credit line consequently increased. Losses in surety busi-ness, on the other hand, rose only marginally. Nor hasthe crisis on the real estate market had any significantimplications for this line to date, whether in the primarysector or on the reinsurance side.
Rates in credit reinsurance climbed in the year under re-view in the face of a growing number of claims; the ratelevel in the surety line remained virtually unchanged.
+++ No negative repercussions of US mortgage marketmeltdown for credit and surety business +++
In view of the general economic environment we scaledback our involvement, albeit without relinquishing ourplace as the third-largest reinsurer. We selectively expand-ed our market position in the political risks segment.
The meltdown on the US mortgage market did not haveany repercussions for our credit and surety portfolio. Ourunderwriting guidelines preclude the writing of creditderivatives, i.e. including mortgage guarantee business.
We were satisfied with our performance in North Americancredit and surety reinsurance, although it did not matchup to the record result generated in the previous year.
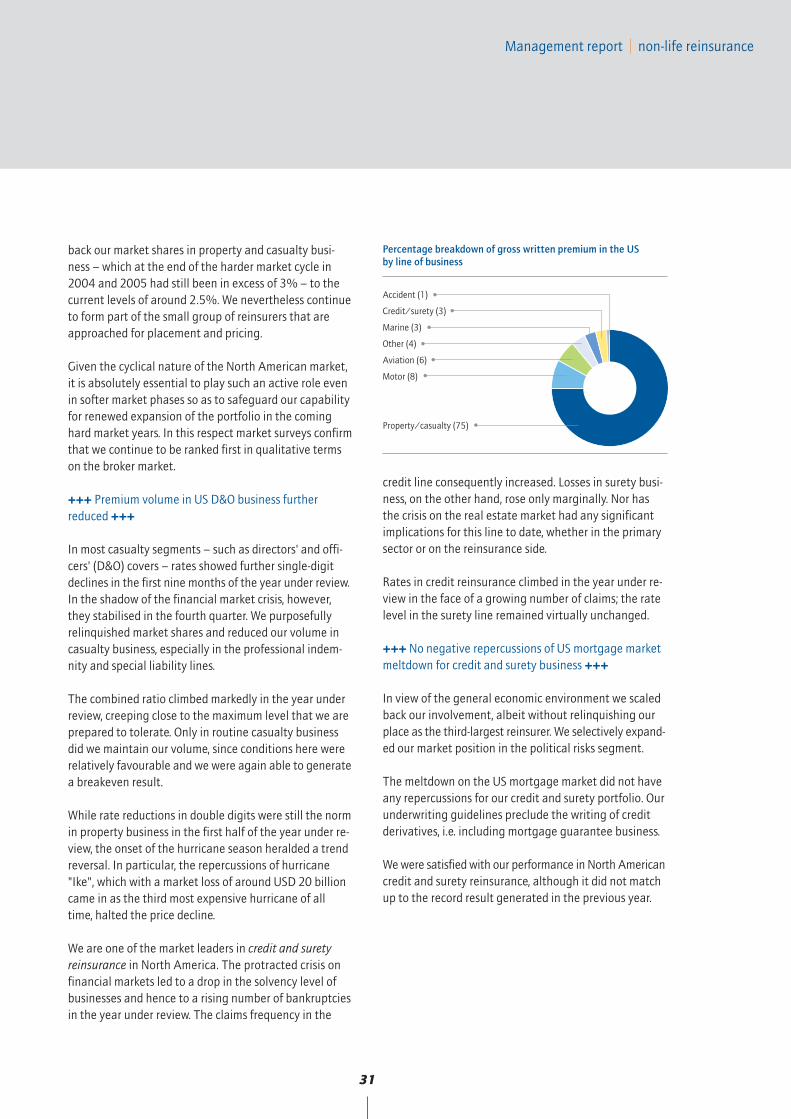
Percentage breakdown of gross written premium in the US by line of business
Accident (1)
Credit/surety (3)
Marine (3)
Other (4)
Aviation (6)
Motor (8)
Property/casualty (75)
32
Management report non-life reinsurance
Other international markets
Latin America The most important Latin American markets for ourcompany are Mexico, Columbia, Venezuela, Ecuador andArgentina. Both Mexico and Central America are regionswith a marked natural catastrophe exposure. HannoverRe is highly active in this segment. In these markets too –with the exception of the Caribbean – we stepped upour involvement.
Particularly in the first half of the year most lines sawrate reductions, although slight improvements wererecorded thereafter. All in all, prices were commensuratewith the risks.
+++ Hannover Re is an "admitted reinsurer" in Brazil +++
Following the abolition of Brazil's reinsurance monopolyin 2008, we opened a representative office in Rio deJaneiro and are now able to operate in the Brazilianmarket as an "admitted reinsurer". This gives us an opti-mal platform for acquiring a satisfactory market share inLatin America's largest market. The business written inBrazil encompasses both obligatory and facultative ac-ceptances in all lines, including motor, aviation, creditand surety, agricultural risks, structured products and lifereinsurance.
Our strategy in the agricultural risks segment is to acquireadditional market shares. State-run premium subsidyprogrammes in the primary sector and the promotion ofplant-based energy sources continued to stimulate de-mand for agricultural insurance – and hence led to agreater need for reinsurance capacities.
Our premium volume from Latin American markets grewslightly in the year under review. On the claims side thesevere hurricanes "Ike" and "Gustav" were the mostnotable events in the year just-ended, causing the lossratio to rise somewhat.
AfricaOur most important market on the African continent isSouth Africa, where we are represented by our Johan-nesburg-based subsidiary, Hannover Re Africa.
The South African insurance and reinsurance marketswere again notable in the year under review for fiercecompetition among foreign providers. The technicalresults posted by ceding companies came under appre-ciable pressure on account of a number of sizeable fireclaims, and prices in this area climbed. Insurers never-theless again raised their retentions and demand forfacultative covers fell.
Faced with regulations governing a revised risk-weight-ed capital calculation, which are expected to enter intoforce from 2011 onwards, insurers currently find them-selves needing either to develop an internal model or toturn to external providers for assistance. In future, riskcapital is to be geared to a reinsurer's size and the un-derlying risks; the guideline for measuring risk capitalhas hitherto been 25% of net premium. We expect thesemore exacting capital requirements and the repercussionsof the financial market crisis to deliver fresh impetus forbusiness – especially in the area of structured products.
In Africa Hannover Re predominantly reinsures specialtyrisks – such as building insurance for thatched homes –written by managing general agents. A portion of thisspecialty portfolio is assumed from our subsidiary Com-pass Insurance Company.
Our strategic objective in South Africa is to expand ourbusiness accepted through underwriting agencies. Weaccomplished this goal in the year under review andwere able to significantly boost our premium volume. Inaddition to setting up a new MGA in the year under re-view we acquired MUA Insurance Company, in which wealready held a 49% stake. It is envisaged that the com-pany – which has hitherto focused on the insurance ofluxury automobiles – will be transformed into a managinggeneral agent.
We were satisfied with the development of business andthe underwriting result in South Africa in the year underreview: despite poorer investment income as a conse-quence of the crisis on international financial marketsand a higher claims frequency, we generated an accept-able result.
33
Management report non-life reinsurance
Given the increased strategic importance of HannoverRe Africa within the Group, Standard & Poor's upgradedits rating in the autumn from "BBB+" to "A" with a stable outlook. This reflects our subsidiary's very goodcapitalisation as well as the favourable development of its operational business.
+++ Standard & Poor’s upgrades Hannover Re Africa +++
In Africa, too, Hannover Re is distinguished by the veryhigh quality of its management team: within the scopeof the Group-wide Performance Excellence assessmentconducted in accordance with the model of the EuropeanFoundation for Quality Management, our South Africansubsidiary delivered an outstanding performance andthus demonstrated the particularly impressive quality ofits enterprise management and supervision – somethingfrom which our clients profit.
AsiaJapan, where we support our clients through a local ser-vice company in Tokyo, is by far our largest Asian market.Hannover Re transacts business here across all segments– although natural catastrophe covers, which we writepredominantly on a non-proportional basis, constitutethe most important single line in Japan.
Business relations with our Japanese clients traditionallyemphasise continuity, and thanks to our very good ratingwe are a sought-after partner for reinsurance covers.
We therefore enjoy the status of "core reinsurer" withmost major primary insurers.
In the year under review the Japanese insurance marketrecorded negative growth as automobile and real estatesales declined. Although the financial market crisis didnot affect Japanese insurers as severely as it did providersin other countries, investment portfolios were neverthelessadversely impacted by the volatility on stock markets.
Overall, original rates remained on a stable, albeit low,level.
On the reinsurance side the picture in the various seg-ments was a mixed one. In property business, for example,stable prices prompted us to modestly enlarge our port-folio in this market. Windstorm and earthquake covers,on the other hand, saw sharp rate cuts as expectedowing to the absence of losses – although reinsurancecommissions for earthquake risks remained unchangedor even increased slightly. Personal accident business – a line that has been spared major claims in recent years –inevitably witnessed substantial price declines. In Japan-ese casualty business, however, prices held stable; trueto our strategy of further optimising the diversificationof our business, we therefore not only maintained thecasualty portfolio on a par with the previous year's volume,but actually stepped up our involvement in the yearunder review.
Despite the generally difficult environment, our premiumincome in Japan remained virtually unchanged in theyear under review. All in all, we were thoroughly satisfiedwith the development of our business in this market.
Further rate reductions were recorded throughout South-east Asia in 2008 in both the insurance and reinsurancesectors. Our main markets in this region are Malaysia,India, the Philippines and Indonesia.
Our portfolio here is composed principally of propertybusiness, which we further diversified in the year underreview. Lines such as personal accident, crop and livestockinsurance, motor with limited liability as well as structuredcovers were systematically expanded. Overall, we observedsustained demand in the year under review for structuredproducts in Asian markets, including for example inIndia, Indonesia, Thailand, South Korea and the Philip-pines. In China the global financial market crisis was akey driver of our business opportunities in the area ofstructured covers.
In facultative reinsurance we are a sought-after partnerin Southeast Asia for non-proportional property businessand liability covers.
34
Management report non-life reinsurance
The number of primary insurers in the Philippines andPakistan decreased in the year under review in the faceof new solvency regulations (risk capital requirements).In Malaysia, too, a number of providers have disappearedfrom the market – in this case due to mergers and acqui-sitions. The situation was quite different in India, wherenew competitors entered the arena.
Our premium volume contracted in light of the devalu-ation of most local currencies. On the claims side, however,the year under review passed off relatively unremarkably;only in South Korea did we incur a major loss, which pro-duced a moderate strain of around EUR 5 million forHannover Re.
+++ Development of retakaful business highlysatisfactory +++
Retakaful business – that is to say, insurance businesstransacted in accordance with Islamic law – once againgenerated dynamic growth for our portfolio both inSoutheast Asia and on the Arabian peninsula: this canbe attributed to the favourable state of the economy inthe Gulf States, which was supported by high oil prices –at least until the autumn – as well as a boom in publicand private investment. The effect of the financial marketcrisis on economic growth in the Gulf States has hithertobeen at most marginal.
Since 2006 Hannover Re has maintained a Bahrain-basedsubsidiary, Hannover ReTakaful, which bears exclusiveresponsibility for transacting our retakaful business; wealso have a local branch that writes traditional reinsur-ance in the region. Hannover ReTakaful serves a globalcustomer base. Along with the Gulf States, Malaysia isone of our largest markets. In the year under review weestablished relationships with clients in Syria, Egypt andLibya, and we currently do business with 66 takaful in-surers. It remains our goal to be the first and preferredpartner for these companies over the long term.
We considerably enlarged our premium volume in thissector in the year under review.
+++ Competition remains fierce in China +++
China continues to rank as the most prominent growthmarket in Asia. While there was little movement year-on-year in the established primary insurance markets ofHong Kong and Taiwan, the Chinese market once againrecorded disproportionately strong growth.
This expansion spanned all lines, although it was particu-larly noticeable in motor business and the casualty lines.China continues to be a target market for internationalinsurers and reinsurers, and competition is correspond-ingly fierce. The number of insurers is consistently rising,while at the same time an oversupply of reinsurancecapacity prevails on the market. Accounting for over65% of total volume, motor business is the dominantline in China. Hong Kong and Taiwan are markets heavilyslanted towards non-proportional covers – with propertylines dominant for our company in Taiwan and casualtybusiness generating the bulk of our premium volume inHong Kong.
Both regions saw appreciable rate reductions in the yearunder review. In China, however, reinsurance rates heldstable in view of the inadequate results recorded in2007; conditions improved slightly.
Hannover Re pursues an opportunistic underwriting pol-icy in the aforementioned markets. We accept primarilynon-proportional business that meets our profitabilitystandards; this is especially true of China, where themarket is dominated by proportional treaties. We stoodby this strategy in the year under review and enlargedour non-proportional portfolio, while at the same timestepping up our involvement in casualty lines. Our pre-mium volume consequently showed modest growth.
+++ Natural disasters are the dominant feature of thefinancial year in China +++
The business development in China was crucially shapedby a tense catastrophe loss situation in 2008, which ledto highly unsatisfactory results on the reinsurance side:
35
Management report non-life reinsurance
snow- and ice-storms between mid-January and mid-Feb-ruary left a trail of severe destruction and hence causedthe most expensive insured losses in the history ofChina. The net burden of these events for Hannover Rewas in the order of EUR 16.2 million. In May a severeearthquake in Sichuan Province resulted in a humantragedy, although the devastating economic losses boreno relation to the insured values. Hannover Re's lossexpenditure was therefore rather modest at around EUR8.3 million.
The loss scenario was more favourable in Hong Kongand Taiwan, where our account incurred only small andmid-sized claims.
AustraliaHannover Re still ranks third in the Australian non-lifereinsurance market. For more than 20 years we havebeen represented by a branch office in Sydney. Ourclients value us as a reliable and attractive partner onaccount of this local presence as well as our very goodrating.
In accordance with a decision of the Australian insuranceregulator, from 31 December 2008 onwards non-localreinsurers are required to furnish collateral for their con-tracts; as a locally based provider we therefore enjoy anedge over some market players.
A competitive climate prevailed on the Australian primaryinsurance market in the year under review. Since listed
companies are under special pressure to deliver profits,indications of market hardening could nevertheless bediscerned. On the reinsurance side, however, rate reduc-tions were for the most part the order of the day. Workers'compensation insurance came under heavy price pressure,and markdowns also had to be taken for catastrophecovers. Rates in non-proportional casualty business, onthe other hand, remained stable.
On the Australian continent, too, the overriding principleguiding our business strategy is adherence to our prof-itability targets: leaving aside a very small number ofproportional treaties, we therefore concentrate entirelyon non-proportional business. We make exceptions onlyfor customer relationships that have already existed forsome years – provided they generate sustained profits.We are a leading provider for the upper layers of catas-trophe programmes and for medical malpractice covers.
Following a very strained claims situation in Australia inthe previous year, the losses incurred by Hannover Re in2008 were moderate. A number of flood losses occurredin Queensland, although none of these developed into amajor claim for our company. In addition, a gas explosionresulted in a business interruption claim, the effects ofwhich for Hannover Re were, however, only minimal.
We were satisfied with the result generated on the Aus-tralian continent in the year under review.
IN SIMPLICITY LIES TRUTH
We’ve all seen them a thousand times.A roof somewhere down in the south ofEurope. It preserves walls and rooms againststorms, rain, heat and cold. It aver ts allrisks, yet without being overly protective.It allows the air to circulate, affords coolescape in summer and comfor ting warmthin winter. It costs little and endures.Perfect protection.
38
Management report life and health reinsurance
The operating units of Hannover Life Re are active atmore than twenty locations on all five continents in orderto offer our clients optimal local service. We operate as adecentralised network through our subsidiaries, branchesand service offices. This organisation safeguards therapid and efficient transfer of knowledge in the interestsof our clients at all times and all around the world.
Eight licensed life reinsurers (business centres) of Han-nover Life Re serve as the nodes of our network; theirshares of total gross premium income are set out below.
Along with Hannover Life Re Bermuda, which is reportingon a full financial year for the first time after receivingits licence in October 2007, our new branches in Shang-hai and Seoul commenced their operational activities; in the second half of 2008 we also established a service
Hannover Life Re – expanding the international network
Percentage breakdown of gross premium by business centers (before consolidation)
HLR International (29)
HLR Bermuda (1)
HLR Africa (2)
HLR United Kingdom (5)
HLR Australasia (8)
HLR Ireland (14)
HLR America (17)
HLR Germany (24)
Life and health reinsurance
The life and health reinsurance business group combinesunder the worldwide Hannover Life Re brand the interna-tional activities of the Hannover Re Group in the life, health,annuity and personal accident lines (the latter only insofaras they are transacted by life insurers). The strategic em-phasis is on building long-term, directly acquired customerrelationships that can generate discernible value-addedfor our cedants in risk and financial management.
The repercussions of the worldwide financial market crisis,which became especially apparent on an enormous scalein the second half of the year under review, also affectedthe operating result of Hannover Life Re. On the under-writing side, we did not observe any changes in theclaims experience for the biometric risks, and there werealso no unusual developments affecting structural risks –such as the persistency of the business in force and thecounterparty risk associated with ceding companies.
+++ Hannover Life Re ranks among the four most important internationally operating life reinsurers +++
Turning to the investments side, our life subsidiaries inthe United States and Ireland took particularly heavy
charges on account of the fair value adjustments madefor reinsurance funds deposited with US cedants. Theseadjustments (prompted by the so-called DIG B36 provi-sions of FAS 133) reached a record level of EUR 72.1 mil-lion – in particular due to the substantial widening ofrisk premiums on corporate bonds in the course of theyear – and were charged to the operating result (EBIT)accordingly. It should, however, be noted that fromtoday's perspective this involves unrealised losses thatmay be significantly reduced over the remaining termdepending upon movements on capital markets.
We appreciably strengthened our international marketposition in the year under review, with systematic expan-sion in the important threshold markets of Asia and LatinAmerica playing a key role. Despite adverse effects ofmovements in the exchange rates of all major currenciesrelative to the euro, we enlarged our premium incomeand currently enjoy a global market share of 10% to12%. Indeed, we rank first or second in a number of sig-nificant markets. In the worldwide arena Hannover LifeRe is one of the four most important life and health rein-surers and is distinguished by its excellent rating andglobal presence.
39
Management report life and health reinsurance
Hannover Life Re's tried and trusted business model isbased on a range of five structurally distinct product andservice offerings that are known as the "five pillars".Unique expertise is the feature of each pillar, and thisenables us to provide our cedants with solutions tailoredto their specific needs.
To a growing extent, it is the case that multiple businesscenters of Hannover Life Re participate in the implemen-tation of reinsurance solutions for our key account rela-tionships. In this way we are able to optimise our riskand financial resources in the best interest of the customerand efficiently bundle the worldwide capacities ofHannover Life Re. In this context, our two subsidiariesHannover Life Re Ireland and Hannover Life Re Bermudaplay a particularly pivotal strategic role.
Relationship Marketing (as an overarching conceptualbusiness approach) and Customer Relationship Manage-ment (as a package of actions to be implemented) con-tinue to play an essential role in our global acquisitionand underwriting policy.
As an inherent feature of this approach, priority is accord-ed to existing, value-creating customer relationships,while the acquisition of new clients is a secondary concern.
Hannover Life Re – the "Five Pillar" business model
Surveys of primary insurers again confirmed the successof this orientation in the year under review: the vast ma-jority of our existing loyal customers in Europe and Asiaattribute to Hannover Life Re the role of best or second-best life reinsurer.
The leading international rating agencies are also dis-playing growing interest in Hannover Life Re's uniquerisk and business model. In this connection Standard &Poor's recognised most foreign life subsidiaries of Han-nover Life Re as core companies of the Hannover ReGroup in the fourth quarter of 2008.
Breakdown of gross written premium according to the “five pillar model” (in %)
Bancassurance (14)
Development of new markets and products (23)
Conventional risk-oriented reinsurance (39)
Financial solutions (11)
Multinational insurers (13)
company in Mumbai – concentrating on life and fac-ultative non-life business – to serve the Indian market.
With a view to the further cultivation of this vital thresh-old market we were able to agree upon a strategic part-nership with the leading Indian reinsurer GIC Re; thiswas cemented in June 2008 with the official signing ofthe cooperation agreement in Mumbai. We also estab-lished a service company in Rio de Janeiro in the middleof the year under review, thereby completing our entryinto the Brazilian life market.
In 2008 we once again devoted special attention to ex-tending our presence in the Islamic life insurance market,which we support principally through our Bahrain-basedsubsidiary Hannover ReTakaful. With an eye to thegroup business that traditionally predominates in the
Islamic and Arab markets we substantially boosted ourpersonnel resources at this location in the fields of actu-arial marketing and product development.
Demand for financial reinsurance solutions rose steadilyin the course of the year under review – the worldwidecrisis on financial markets has damaged the solvencyand risk-carrying capacity of life insurers in many countries.Against this backdrop the focus has moved back to thereinsurance market as a partner, especially as solutionsdesigned for the capital market (securitisations) haveproven to be extremely challenging. We made the mostof this situation and completed several significant trans-actions of this type in the second half of 2008; these willmake themselves felt to positive effect in the statementof income from 2009 onwards.
40
Management report life and health reinsurance
Figures in EUR million 2008 +/- previousyear 2007 2006 20051) 20041)
Gross written premium 3,134.4 +1.7% 3,082.9 2,793.6 2,425.1 2,176.6
Change in benefit reserves 421.3 +5.9% 397.9 192.8 258.0 241.2
Commissions 743.4 -4.8% 780.5 831.7 684.1 589.6
Own administrative expenses 70.1 +14.5% 61.2 50.0 59.3 55.9
Other income/expenses -0.2 -100.4% 52.7 22.7 -23.1 -2.0
Operating result (EBIT) 120.7 -47.5% 229.8 139.5 93.1 76.7
Group net income (loss) 78.3 -58.3% 187.7 102.6 59.6 38.0
Earnings per share in EUR 0.65 -58.3% 1.57 0.85 0.49 0.32
Retention 89.3% 90.8% 85.4% 92.8% 90.2%
EBIT margin 2) 4.3% 8.2% 5.9% 4.1% 3.9%
Key figures for life and health reinsurance
1) Figures for 2005 and 2004 before new segmentation2) Operating profit (EBIT)/net premium earned
The gross premium income booked by Hannover Life Retotalled EUR 3.1 billion (EUR 3.1 billion) in the year underreview; this corresponds to growth of 1.7% year-on-year.The strength of the euro against our three most importantforeign currencies – namely the pound sterling, US dollarand Australian dollar – means that the real increase inthe international portfolio is not fully reflected; at constantexchange rates growth would have stood at 7.9%. Netpremium earned contracted by 0.4% to EUR 2.8 billion(EUR 2.8 billion) owing to a slight reduction in the levelof retained premium.
The United Kingdom reaffirmed its position as the largestmarket in our portfolio through significant expansion inthe area of impaired/enhanced annuities – despite thefact that we scaled back our involvement in risk-orientedcovers in the face of the competitive situation.
Development of premium income
The United Kingdom currently accounts for 27.3%(30.1%) of our premium, followed by the United States –where most notably we consolidated our position in theareas of private health insurance covers for senior citizensand block assumption transactions – with 21.6% (20.8%).Germany and Australia ranked third and fourth withshares of 12.2% (14.0%) and 9.6% (11.6%) respectively.Further key markets are Ireland, France, South Africa,Barbados, Italy, Luxembourg and Asia, with the lattermarket in particular recording above-average growth ofalmost 18%. Business in Latin America similarly generatedstrong growth rates.
Our preferred lines of life and annuity – in which thebiometric risks of mortality and longevity are of primaryrelevance from the standpoint of risk considerations –
41
Results
As in previous years, the main factors with a bearing onthe performance of our life and health reinsurance busi-ness group remained unchanged as follows:
• development of the three biometric risks of mortality, morbidity and longevity, the structural risk associated with the persistency of the business in force as well as the specific client-related counterparty risk in connec-tion with financing transactions,
• developments on international capital markets and movements in exchange rates, especially in our most relevant currencies of EUR, GBP, USD, AUD and ZAR,
• development of our own administrative expenses.
The trends on international capital markets – againstthe backdrop of the already familiar turmoil and up-heavals – took on particular relevance in the year underreview and had a considerable impact on our results.
The situation as regards the biometric risk of mortality,to which we are exposed principally through our accept-ances in the United Kingdom, South Africa, Australiaand the Asian markets, was highly satisfactory overall,although we did observe a slightly increased loss ratio atsome UK cedants in connection with the "Treating Cus-tomers Fairly" initiative.
+++ Results influenced by turmoil on capital markets +++
The morbidity factor is constituted by a combination ofdifferent risk profiles from critical illness covers, US se-nior health medicare supplement plans, long-term careannuities and the usual occupational disability riders
Management report life and health reinsurance
Geographical breakdown of life and health reinsurance (as % of gross premium)
United Kingdom (27)
Africa (3)
France (4)
Asia (5)
Latin America (6)
Australia/New Zealand (10)
Rest of Europe (11)
Germany (12)
North America (22)
from the German and French markets as well as Aus-tralian disability covers. Involuntary unemployment in-surance, which is offered in many markets in conjunctionwith protection for consumer loans, also belongs in thiscategory. The claims experience here varied widely: itwas very good under critical illness covers and long-termcare annuities, slightly poorer for US supplementaryhealth products and less favourable for disability annu-ities on the Australian market.
accounted for almost 85% of the total premium incomebooked by Hannover Life Re in the year under review.
As far as the morbidity risk is concerned, our principalareas of involvement are US senior health medicare supplement products, long-term care covers in Europeand Asia and disability policies in Australia. Individual
accident business again accounted for a modest, butstable share of our premium volume at 2.2%.
We do not offer reinsurance protection for long-termfinancial guarantees in connection with deferred unit-linked annuities.
The longevity factor has been of special relevance to ourcompany for many years due to our market leadership inthe UK; working closely together with our clients, wecontinuously analyse the short-, medium- and long-termtrends of this risk category using an extensive range ofactuarial methods. The claims experience in the yearunder review was in line with our projections.
The risk associated with the persistency of the in-forcereinsured portfolios and the counterparty risk did not exhibit any peculiarities in the year under review –
42
The amended Insurance Contract Act entered into forcein the German market on 1 January 2008. Key aims ofthis reform are to enhance the transparency of life andannuity insurance products, provide increased cash sur-render values in the event of premature contract ter-mination and facilitate timely participation of customersin life insurers' hidden reserves.
Implementation of the reform tied up considerable re-sources at providers, especially for the conversion of in-ternal processes; the restructuring of sales processes wassimilarly reflected in a drag on new business that wasparticularly visible in the first half of 2008.
On the other hand, new business profited from govern-ment-assisted "Riester" annuity products, for which the
Germany
fourth and last step increase came into force at the be-ginning of 2008. Many of our existing clients used thisincentive step as an opportunity to substantially raisepremiums and benefits.
E+S Rück, which serves the German market within theHannover Re Group, saw its premium income in life andhealth reinsurance decline to EUR 381.9 million (EUR428.6 million) in 2008. Key factors in this developmentwere the further planned run-off of a large transactionfrom 2004 and the reduction of our involvement in fi-nancing new business acquisition costs on the Germanmarket. In the fourth quarter of 2008 a mid-sized blockassumption transaction with a planned term of ten yearswas written with a life insurer in western Germany. Theoperating profit (EBIT) in 2008 was positive.
although a large international account based in the Unit-ed States, under which we reinsure more than 40 individ-ual life insurers, was heavily downgraded by the ratingagencies in connection with financial difficulties affect-ing the holding company. This downgrade did not haveany noticeable effect on the performance of the reinsur-ance treaties.
The impact of the risks associated with movements oncapital markets and fluctuations in exchange rates was,however, severe in the year under review. With respect tothe capital market risk, it should be borne in mind thatthe various operations of Hannover Life Re scarcely holdany equity securities or shares in their asset portfolios.We do, however, hold a high-quality portfolio of fixed-in-come securities – including corporate bonds – that opti-mally satisfies actuarial standards with respect to themix of durations and currencies.
The total investment income generated for the life andhealth reinsurance business group amounted to EUR245.5 million (EUR 293.9 million); this was equivalentto a decline of 16.4%.
As in the past, we attach considerable importance tolean processes and a flat management structure at all ouroperating units. With internal administrative expenses
of EUR 70 million – corresponding to an expense ratio of2.2% relative to gross written premium – we were againthe cost leader among highly reputed international lifeand health reinsurers in the year under review.
The operating profit (EBIT) generated for the life andhealth reinsurance business group amounted to EUR120.7 million (EUR 229.8 million); in this context, unlikein the previous year, allowance must be made for thenegative special effect totalling EUR 72.1 million. Had itnot been for this influencing factor, the operating profitwould have reached EUR 192.8 million. The EBIT mar-gin stood at 4.3%; it thus fell short of the previous yearand our target range of 6.5% to 7.5% (excluding thenegative special effect it would have reached 6.9%).
In the year under review we transferred a portfolio of lifeand annuity reinsurance to the capital market. Designated"L7", the transaction converts a future earnings streaminto a current liquidity position and monetises an em-bedded value of EUR 100 million.
With a tax ratio of 29.4% and after allowance for minor-ity interests, the consolidated net income of the life andhealth reinsurance business group came in at EUR 78.3million (EUR 187.7 million). This was equivalent to earn-ings of EUR 0.65 (EUR 1.57) per share.
Management report life and health reinsurance
43
United Kingdom
For many years we have devoted special attention to theUK market, the most significant European life reinsurancemarket. We participate not only in traditional risk-orient-ed business but also in the area of enhanced annuitieswith a reduced payment period.
While traditional reinsurance relationships were adverse-ly impacted by slowing new business on the back of themortgage crisis, the vitality of the private annuity segmentwas undiminished. We significantly extended our customerbase in this area and have considered ourselves the mar-ket-leading reinsurer for many years.
Ceding companies from this market are reinsured byvarious risk carriers within Hannover Life Re: the parentcompany Hannover Re, Hannover Life Re United King-dom, Hannover Life Re Ireland and – since 2008 – byour new subsidiary Hannover Life Re Bermuda. For thefirst time we concluded a number of block assumptiontransactions for existing pension funds under which weassume the longevity risk for a defined group of pensioners.
Ireland
significant strain on the company's profitability wasincurred in the investment sector, however, as a conse-quence of fair value adjustments (B36) in excess of EUR29 million for securities deposits furnished to UScedants.
Following the exceptionally high operating profit (EBIT)of the previous year (EUR 45.0 million), which had beenheavily shaped by positive special effects, net incomeafter tax amounted to EUR 0.7 million in the year underreview.
Gross written premium contracted by 7.6% to EUR857.1 million (EUR 927.4 million) on account of theweakness of the pound sterling; of this amount, 43.0%was attributable to business written by Hannover Re,21.4% to Hannover Life Re United Kingdom, 32.8% toHannover Life Re Ireland and 2.8% to Hannover Life ReBermuda.
The technical results from this market were once againmost gratifying for the mortality and critical illness riskcategories, while for the longevity risk they were withinthe actuarially expected bounds.
With net premium of EUR 100.7 million (+7.8%) and anoperating profit (EBIT) of EUR 22.8 million (EUR 26.3million), our UK subsidiary Hannover Life Re UnitedKingdom based in Virginia Water outside London delivereda very pleasing result; net income after tax came in atEUR 16.5 million (EUR 19.7 million).
Management report life and health reinsurance
Insurance solutions for the so-called "60-plus generation"are a focus of our activities, particularly in the area oflong-term care annuity insurance. We have amassed
special expertise, which is attracting growing interest inwhat is still – in Germany – a relatively rare form of indi-vidual risk provision.
Since its establishment in 1999 our Dublin-based Irishsubsidiary Hannover Life Re Ireland has designed andimplemented tailored reinsurance solutions for an inter-national clientele comprised primarily of large life insurerswith first-class ratings in the United States, United King-dom and Continental Europe.
The contraction in the premium volume to EUR 502.7million (EUR 586.8 million) in the year under review wascrucially driven by the strength of the euro against ourtwo main currencies – the pound sterling and US dollar.The technical result, especially from UK business, did notquite pick up on the previous year's performance. The
44
For some years these regional markets – excluding Russiaand the CIS states – have been handled by our life branchin Stockholm, with a concentration on Sweden, Norwayand Israel. These three markets account for 80.8% ofour business volume. Finland, the Baltic countries, Polandand Bulgaria also play a noteworthy role.
In the Scandinavian markets we support first and foremostlife insurers that focus on unit-linked products and banc-assurance models, while in Israel long-term morbiditypolicies such as long-term care and critical illness dom-inate.
In this context we are currently seeing rapidly growinginterest on the part of our cedants in efficient applicationsystems that can be integrated into the overall applicationprocess at point of sale, thereby ensuring prompt pro-cessing for policyholders – a precondition that is especiallyessential in bancassurance business. To this end, working
Scandinavia, Eastern Europe, Russia, CIS states, Turkey and Israel
in close cooperation with highly respected IT systemsproviders, we have developed a variety of state-of-the-artsystem solutions that we deploy at several ceding com-panies in Scandinavia and the Baltic markets.
The gross premium volume booked by the Stockholmbranch in the year under review was significantly influ-enced by the expiry of earlier financing business andtotalled EUR 81.3 million (EUR 86.9 million); profitabilitywas again highly gratifying.
Looking ahead to the future cultivation of life markets inRussia and the CIS states, we set up a new underwritingunit in Hannover in the year under review with actuarieswho are native speakers of Russian, Ukrainian and Geor-gian. In the coming years they will substantially reinforceour activities in this region. Particularly in the Russianmarket, where we have already acquired our first clients,we have identified a considerable long-term potential.
Management report life and health reinsurance
Life and health reinsurance business in these regions –also including French-speaking Canada – is lead-managedby our life branch in Paris. The premium volume in theyear under review climbed by 17% to EUR 372.0 million,and profitability was again very pleasing.
Key growth drivers – as in the previous year – were banc-assurance business, in which we successfully accompaniedmoves made by several life subsidiaries of major Frenchbanks into foreign markets, as well as the Near East. In
France, Maghreb and Arab countries
this region we were able to use structural changes atsome competitors as opportunities to initiate new businesscontacts within traditional reinsurance.
At our composite subsidiary Hannover ReTakaful basedin Manama, Bahrain, which focuses on the reinsuranceof Islamic insurance organisations, we put in place acomplete infrastructure for the life sector (so-called familytakaful) and acquired a number of new customers fromBahrain, Saudi Arabia and other countries in the region.
Reinsurance business in these Mediterranean nations iswritten from Hannover Home Office. Our offices in Milanand Madrid play a vital role in marketing, acquisitionand service activities and primarily serve bancassuranceclients in their region.
Italy, Spain and Southeastern Europe
Total premium income came in at EUR 70.4 million (EUR76.3 million) in the year under review; technical resultscan be described as satisfactory.
45
Responsibility for the US market is borne by our Orlando-based subsidiary Hannover Life Re America, which con-centrates on the underwriting of financially orientedcovers for US clients, supplementary private healthinsurance for seniors and a number of other US spe-cialty segments.
+++ Sharp rise in premium income at US subsidiaries +++
The English-speaking Canadian market plays a minorrole in our assumed business. Canada is, however, hometo Hannover Life Re's most important retrocessionaires,with whom we work together on a long-term basis; theyare of considerable significance to our worldwide riskmanagement with respect to large and complex individ-ual risks that surpass our retention.
In the United States we closed the largest block assump-tion transaction involving US individual life business inthe history of Hannover Life Re; the transaction encom-passed the monetisation of embedded values in severalportfolios of endowment insurance.
North America incl. Bermuda
The gross premium volume booked by Hannover Life ReAmerica totalled EUR 613.6 million (EUR 508.6 million)in the year under review, an increase of 20.7%.
This company too was significantly affected by fair-valueadjustments to securities deposits (B36), as a consequenceof which the operating result (EBIT) slipped into the redat -EUR 17.7 million (after an operating profit of EUR 8.7million in the previous year); net income after tax camein at -EUR 12.6 million (EUR 4.9 million).
The Hamilton-based Hannover Life Re Bermuda, oursubsidiary that was newly established in 2007, can reporta gratifying business development in its first full financialyear. It systematically consolidated its position as a spe-cialist within the Hannover Life Re network and acquiredits first clients in Bermuda, the Caribbean, the UnitedKingdom, South Africa and the United States. Gross pre-mium totalled EUR 29.5 million, producing an operatingprofit (EBIT) of EUR 9.2 million. This operating profit isidentical to the net income after tax.
AfricaOur subsidiary Hannover Life Re Africa, which is based inJohannesburg, serves South Africa and the English-speak-ing African markets. The company writes predominantlyrisk-oriented individual life business of mid-sized andlarger South African life insurers. In the fourth quarter of2008 the company – in cooperation with its affiliatesHannover Life Re Bermuda and Hannover Life Re Ireland– concluded a large block assumption transaction withone of South Africa's foremost life insurers.
Over the past two years we stepped up our expansion intoneighbouring African markets and improved our accessto Nigeria and Kenya by cooperating with a local profes-sional reinsurer outside South Africa.
Other international markets
The gross written premium generated by Hannover LifeRe Africa contracted to EUR 92.2 million (EUR 105.2million) due to the strength of the euro against theSouth African rand. Results were thoroughly satisfactory,however, producing an operating profit (EBIT) of EUR6.9 million (EUR 5.7 million).
Central and South AmericaCentral American markets are served by our office inMexico City, while South America is supported directlyfrom Hannover Home Office.
In the year under review, despite growing competitivepressure, we succeeded in cementing a leading positionin most of our target markets – especially the bancassur-
Management report life and health reinsurance
46
ance sector – and winning over clients through our clearcommitment to loyalty and continuity.
Premium income in 2008 climbed by 40.7% to EUR98.8 million, and profitability – as in previous years –can be described as good.
Events have taken a new turn in Brazil: following thelong-awaited opening up of the reinsurance market,Hannover Re has now secured the status of an "admit-ted reinsurer" and established a representative office inRio de Janeiro for life and non-life business. We intend tobe more of a pacesetter in this key market going for-ward.
AsiaThe Asian life markets in the Far East – encompassingthe Chinese-speaking economic region, Korea and Japan– are served by our regional centre in Hong Kong, whileresponsibility for the markets of Southeast Asia andSouth Asia rests with our branch office in Kuala Lumpur.
Our premium income climbed by 23.1% in the year underreview to EUR 103.9 million (EUR 84.4 million), with allmajor markets contributing to this growth. Results con-tinued to develop favourably.
+++ New customer relationships in China +++
In China we have been represented by a fully operationallife branch in Shanghai since May 2008. We made themost of the extended opportunities opened up by thestatus of a locally licensed reinsurer to acquire severalnew customer relationships and thus moved closer to
attaining our goal of ranking among the market's threeleading life reinsurers.
In the Korean market, the largest life reinsurance marketin Asia, we have also made significant progress since ournew life branch in Seoul commenced business operationsin May 2008.
We have successfully taken the first steps towards tappinginto the Indian market by concluding a multi-year cooper-ation agreement with the leading local reinsurer GIC Re.In a parallel move, we established our own service companyin Mumbai to support our customer relationships in lifeand facultative non-life business. This company starteddoing business on 1 December 2008.
Australia and New ZealandBusiness written in Australia and New Zealand is the re-sponsibility of our subsidiary Hannover Life Re Australasia.The company concentrates on risk-oriented treaty businessin the areas of life, critical illness and disability annuities.
Occupational retirement provision is becoming an increas-ingly important segment in Australia; in this context thecompany participates in the assumption of biometric risksbut plays no part in the capital accumulation process.
Owing to the planned reduction of a major individual ac-count, the premium volume contracted by 17% in 2008 toEUR 290.5 million (EUR 348.6 million). The operatingprofit (EBIT) of EUR 11.3 million was again satisfactory, al-though it failed to match up to the previous year's result ofEUR 34.5 million – which had been influenced by a non-recurring effect.
Investments
Stock markets around the world were plunged into anunparalleled downward slide in the year under review.The German stock index (Dax) had fallen by around40% by the end of the year. The EuroStoxx 50 and S&P500 experienced slumps of similar dimensions. Althoughequity markets rallied somewhat from their lows of Octo-ber and November, the Dax stood at just 4,810 points atthe end of December – compared to a level in excess of8,000 at the start of the year.
While the US Federal Reserve Board slashed its key lend-ing rates dramatically to 0% to 0.25%, the adjustmentsmade by the European Central Bank were more moder-ate. It too cut the base rate, albeit initially only to 2.5%.In view of the recessionary tendencies in virtually all ma-jor currency areas, a cycle of interest rate reductions wasset in motion worldwide.
Management report investments
47
The return on ten-year US treasury bonds declined ap-preciably to less than 2.8% in view of the economic out-look. In Europe, too, ten-year bonds paid a return of lessthan 3.0%, while highs markedly in excess of 4.0% wererecorded by the middle of the year. As the fourth quarterprogressed corporate bonds were listed with considerablerisk premiums – against a backdrop of extensive illiquidity.The euro slipped slightly against the US dollar in thecourse of the year, but held its ground – in some casesforcefully – against other currencies.
Hannover Re's investment policy continues to be guidedby the following core principles:
• generation of stable, plannable and tax-optimised returns while at the same time maintaining the high quality standard of the portfolio;
• ensuring the company's liquidity and solvency at all times;
• high diversification of risks;
• limitation of currency exposures in accordance with the principle of matching currencies.
With these goals in mind we engage in active risk man-agement on the basis of balanced risk/return analyses.In this context we observe centrally implemented invest-ment guidelines and are guided by the insights of dynam-ic financial analysis. These measures – in combinationwith a positive technical cash flow – ensure that at alltimes we are able to meet our payment obligations.
Within the scope of our asset/liability management ac-tivities, the allocation of investments by currency is de-termined by the development of underwriting items onthe liabilities side of the balance sheet. We are thus ableto achieve extensive currency matching of assets andliabilities, thereby ensuring that our result is not signifi-cantly affected by fluctuations in exchange rates. As atyear-end 43.8% of our asset portfolio was held in euros,40.3% in US dollars and 6.1% in pounds sterling.
Thanks to a positive cash flow from the technical accountand investments, and assisted by a slight recovery in theUS dollar, our portfolio of assets under own managementgrew to EUR 20.1 billion (EUR 19.8 billion) despite thefall in fair value.
Ordinary investment income, on the other hand, was flatand came in below the previous year at EUR 829.8 million(EUR 859.0 million). This was due to a lower average yieldthan a year earlier, attributable principally to tactical re-grouping into low-risk securities.
The balance of our deposit interest and expenses waslargely unchanged at EUR 199.6 million (EUR 220.1 mil-lion). Write-downs of EUR 479.9 million (EUR 71.4 million)were taken on securities. Gains of EUR 379.2 millionrealised on disposals were attributable to the tacticalmodification of durations in the US dollar portfolio under-taken in the first quarter as well as the liquidation of ahedge on around one-fifth of the equity holdings in thefourth quarter. This contrasted with realised losses ofEUR 492.8 million (EUR 69.7 million) that resulted prin-cipally from the significant reduction of the equity allo-cation in the fourth quarter. In light of the developmentsdescribed above, net investment income contracted ap-preciably to EUR 278.5 million (EUR 1,121.7 million).
For years we have actively managed the average durationof our fixed-income portfolio, thereby conserving ourshareholders' equity. In the course of the year under reviewwe initially reduced the modified duration of our bondportfolio. As at 31 December 2008 it was roughly backon a par with the previous year at 3.8.
The portfolio of fixed-income securities climbed sharplyto EUR 17.9 billion (EUR 15.7 billion), primarily as a con-sequence of the reduced equity allocation but also dueto inflows of cash from the technical account. The fundswere invested predominantly in government bonds.Hidden reserves for fixed-income securities recognised in
Management report investments
Breakdown of investments (in %)
Fixed-income securities (89)
Shares (<1)
Other (2)
Private Equity (3)
Short-term investments and cash (6)
Real estate (<1)
48
shareholders' equity totalled EUR 101.7 million, comparedto hidden losses of EUR 103.4 million in the previousyear. The quality of the bonds – measured in terms ofrating categories – was maintained on a consistentlyhigh level. The proportion of securities rated "A" or bet-ter – at 92.9% – was slightly higher than in the previousyear (92.3%).
The crash on the US real estate sector snowballed into acrisis on global credit and financial markets as the yearprogressed. After our investments had been only marginal-ly impacted by subprime losses, the value adjustmentsprompted by loan defaults and write-downs on financialsecurities also remained within bounds. It was thanks toour broad diversification and tight issuer limits that loss-es on other individual instruments were within the single-digit million euro range. What is more, not only is thecounterparty risk limited, the portfolio is also diversifiedby sectors and product types. This was another reasonwhy write-downs on fixed-income securities were restrictedto altogether EUR 96.9 million (EUR 26.6 million).
We held a total amount of EUR 1.2 billion (EUR 1.3 billion)in short-term assets and current assets as at the end ofthe year under review. Funds held by ceding companiesamounted to EUR 10.1 billion (EUR 9.2 billion).
The downward trend on equity markets that had startedin the first half of the year gathered pace on a massivescale in the fourth quarter. As a result, we were compelledto take write-downs of EUR 356.1 million (EUR 34.2 mil-lion). In addition, the equity allocation was reduced to aminimum in the fourth quarter, and it now stands at lessthan 1% (10.1%).
Management report investments
Rating of fixed-income securities (in %)
AA (17)
AAA (59)
< BBB (2)
BBB (5)
A (17)
Holdings of alternative investments continued to grow.As at 31 December 2008 an amount of EUR 751.8 million(including uncalled capital) was invested in private equi-ty funds, a further EUR 294.5 million in high-return bondfunds and loans as well as CDOs and altogether EUR139.1 million in structured real estate investments.
During the reporting period we also began to implementour real estate investment programme. An initial prop-erty has already been acquired, and further buildings areunder review; the real estate allocation will thereforerise progressively as planned, although it is currently stillbelow 1%.
2004 2005 2006 20070
15
20
25
30
35
Investments
5
10
in EUR million
25,168
9,184
15,984
8,447 9,292
19,079 19,494
27,52628,786
9,227
19,815
29,042
2008
10,065
20,137
30,202
Funds held by ceding companies and contract deposits
Self-managed assets
49
Management report value-based management
Figures in EUR million 2008 +/- previousyear 2007 2006 2005 2004
Ordinary investment income 1) 829.8 -3.4% 859.0 792.6 654.6 604.5
Results from participation in associated companies 4.2 -61.9% 11.0 6.3 3.9 2.2
Net investment income from assets under own management 78.9 -91.3% 901.6 967.0 764.3 697.8
Net investment income from funds withheld
199.6 -9.3% 220.1 221.9 351.6 382.1
Total investment income 278.5 -75.2% 1,121.7 1,188.9 1,115.9 1,079.9
Net investment income
1) Excluding expenses on funds withheld and contract deposits2) Portfolio at fair value through profit or loss and trading
Liquidity and financing
We generate liquidity primarily from our operating re-insurance business, investments and financing measures.Regular liquidity planning and a liquid investment struc-ture ensure that Hannover Re is able to make the neces-sary payments at all times. Hannover Re's cash flow isshown in the consolidated cash flow statement on page80 et seq. in the notes.
The cash flow from operating activities, which also in-cludes inflows from interest and dividend receipts, in-creased by a substantial EUR 546.8 million year-on-yearto EUR 1,458.9 million. The net inflow results from thepositive experience of our reinsurance business and isnotable, in particular, for appreciably lower claim pay-ments than in the previous year.
This inflow from operating activities enabled us to furtherenlarge our portfolio of high-quality fixed-income securi-ties. Overall, the allocation of funds in connection withinvesting activities grew by EUR 463.5 million to EUR1,034.1 million. The funds were for the most part investedwith durations that matched the technical liabilities.Against the backdrop of the illiquidity prevailing in someparts of the capital markets, liquidity management as-sumed greater importance, also prompting restructuring
measures in the existing asset portfolio. In this contextplease see our remarks in Section 6.6 "Liquidity risks" inthe notes.
A crucial factor in the outflow of funds from financingactivities in the year under review was our dividend pay-ment of EUR 318.9 million. Hannover Re's debt financ-ing was composed of subordinated loans and bonds thatwe issued in past years to ensure lasting protection ofour capital base. The total volume of loans and subordi-nated capital amounted to EUR 1,420.0 million (EUR1,414.9 million) as at the balance sheet date. In addition,unsecured syndicated guarantee facilities exist with anumber of financial institutions. For further explanatoryinformation please see our remarks in Section 7.8 "Debtand subordinated capital" and 7.9 "Shareholders' equityand minority interests".
Overall, the cash and cash equivalents increased by EUR94.8 million year-on-year to EUR 430.2 million.
For further information on our liquidity managementplease see page 63 et seq. of the risk report as well asthe explanatory remarks contained in Section 6 "Mana-gement of technical and financial risks" in the notes.
50
Management report value-based management
Value-based management
Our overriding strategic objective is to be one of the threemost profitable reinsurers in the world and to increaseour profit and the value of the company by a double-digit percentage every year.
In order to achieve this objective we have developedtools that enable us, on the one hand, to measure howclose we are to accomplishing our goal and, on the other,to break it down to the level of individual profit centres.
In non-life reinsurance we have many years of positiveexperience using a ratio based on underwriting years,namely "DB 5": level 5 of our contribution margin ac-counting method constitutes the clear profit after earningthe discounted claims expenditure (level 1) plus all direct(level 2) and indirect costs (level 3), including the cost ofcapital (level 4). We apply DB 5 to the non-life reinsurancetreaty departments as part of the fine tuning of portfoliosdown to the level of individual contracts.
In life and health reinsurance we use the Market-Consist-ent Embedded Value (MCEV). The MCEV is defined as
the intrinsic value of an enterprise, measured as the dis-counted profit flow until final run-off of the in-force port-folio – from the standpoint of the shareholder and aftertaxes. Both concepts reflect the specific characteristicsof the individual segments. Together, they constitute thebasis for our central management tool: Intrinsic ValueCreation (IVC).
With the aid of IVC it is possible to compare the valuecontributions of the Group as a whole, its two businessgroups and the individual operating units. This enablesus to reliably identify value creators and value destroyers.In this way, we can
• optimise the allocation of capital and resources,
• identify opportunities and risks and
• use IVC – as the core business result within the scope of our holistic management system Performance Excellence (PE) – to measure the extent to which we are able to execute our strategy.
* At the Global Management Forum (GMF) all senior managers of the worldwide Hannover Re Group come together once a year to define aspects of strategic orientation. The parameters elaborated here serve as the basis for the subsequent planning process.
System of value-based management: Performance Excellence (PE) combines the strategic and operational levels
Plan Implement Evaluate
2007 2008 2009
Strategy
Results
Risk
Resources
Managementby Objectives
PE
Closed-door Boardmeeting/GMF*
PE-Check PE-Check
Agreement on objectives
Plan
ning
pro
cess
ManagementReporting
PE-Check
Closed-door Boardmeeting/GMF*
Closed-door Boardmeeting/GMF*
Achievement of objectives
51
With PE we have at our disposal a consistent methodGroup-wide that enables us to measure how the com-pany is evolving and to what extent we have achievedour strategic objectives, while at the same time accom-modating the specific conditions of the various treatydepartments and service units. The local approach usedby PE is of special importance in this context: it is incum-bent upon every single organisational unit to continuallyreassess and enhance its value contribution to theHannover Re Group. In so doing, however, we never losesight of the big picture.
Performance Excellence Check The PE Check (consisting of Output, Strategy and InputChecks as well as Activity Planning) is used by the treatydepartments and service units to develop – making al-lowance for the strategic parameters – detailed strategiesand activity plans. These central documents also serveas a basis for the planning cycle – both for the operationalplanning and for the planning of resources and costs.The PE Check is carried out at closed-door meetings ofthe individual units.
Planning processThe planning process spans the three levels of Results,Risks and Resources, which are closely interrelated. Re-sults, Risks and Resources are planned by the responsibleofficers with the support of Group Controlling Servicesand Corporate Development and they are reconciled bythe Executive Board. Key pivot points are the detailedstrategies and activity plans drawn up by all treaty de-partments and service units. The planning is approvedby the Executive Board and subsequently communicatedwithin the Group.
Management by ObjectivesThe targets that emerge out of the planning process areintegrated into the individual agreements on objectiveswith managers. When defining targets the participantstake into account not only profit-oriented but also non-financial goals, including for example the activity planning.
Management report value-based management
Business group Key data Target 2008 2007 2006 20051) 20041)
Growth in earnings per share ≥ 10% 8.3%3) 942.7% (82.4%) (28.4%)
Growth in book value per share ≥ 10% (15.5%) 15.6% 11.4% 3.0% 6.3%
Profit growth targets
1) Figures for 2005 and 2004 in accordance with old segmentation2) Operating profit (EBIT)/net premium earned3) 750 basis points above the risk-free interest rate 4) Embedded value after consolidation, before minority interests
For 2005 to 2007 the European Embedded Value (EEV) was established according to the EEV principles of the CFO Forum. For 2006 and 2007 market-consistent assumptions were already used as a basis For 2008 a Market Consistent Embedded Value (MCEV) was calculated on the basis of the principles of the CFO Forum published in June 2008
5) The MCEV as at 31 December 2008 will be published on our website at the same time as the quarterly financial report for the first quarter of 20096) The decrease in the value of new business was due to three special effects: details are provided in the EEV report for 2006 published on our website7) Risk-free interest rate + cost of capital8) Excl. tax effect
Life and health reinsurance 1) 193.0 +28.8% 174.9 +40.1% 149.1 +35.7% 45.1 +13.3%
Consolidation 34.9 – (11.1) – (13.4) – – –
Group 413.5 +6.4% 406.2 +6.8% 34.7 +0.6% 167.3 +3.4%
Intrinsic Value Creation and excess return on capital allocated
1) 2004 the present value components is based on the value of in-force business. from 2005 to 2006 they are based on the European Embedded Value (EEV).
IVC – our key ratio
We use the following formula to calculate the IVC(Intrinsic Value Creation):
The adjusted operating profit (EBIT) consists principallyof the reported Group net income after tax and thechange in the balancing items for differences betweenpresent values and amounts stated in the balance sheet(one adjustment for non-life and one for life/healthreinsurance). In addition, the interest on hybrid capital,minority interest in profit and loss and extraordinaryprofits and losses are eliminated. We consider the allo-cated capital to be the shareholders' equity plus minorityinterests, the balancing items for differences betweenpresent values and carrying amounts as well as the hybridcapital. Capital is allocated to the profit centres accord-ing to the risk content of the business in question.
In calculating the cost of capital, our assumption for thecost of shareholders' equity – based on a Capital AssetPricing Model (CAPM) – is that the investor's opportunity
costs are 350 basis points above the risk-free interestrate. Value is created in excess of this return. The definitionof our targeted minimum return on equity as 750 basispoints above "risk-free" thus already contains a not in-significant target value creation. Interest is calculated onthe balancing items for present value at the underlyinginterest rates, and on debt capital at the actually paidinterest for our hybrid capital. Weighted according tothe composition of the allocated capital defined above,the weighted cost of capital applicable to all profit centresis calculated from these interest rates. We allocate equitysparingly and make efficient use of hybrid capital as wellas other equity substitutes; our weighted cost of capitalis consequently the lowest in the industry (6.6% in 2007).
Since comparison of absolute amounts is not alwaysmeaningful, we have introduced the xRoCA (excess returnon capital allocated) in addition to the IVC. This describesthe IVC in relation to the allocated capital and shows usthe relative excess return generated above and beyond theweighted cost of capital. Once they have been calculatedwe communicate the IVC and xRoCA for the reportingyear in various media, including on our website.
Management reporting
Internal Management Reporting is drawn up twice ayear, tiered according to areas of responsibility. In thefirst place, the achievement of objectives in the past yearis reviewed here, and secondly the planning is assessedwith an eye to the strategic objectives.
Both business groups of the Hannover Re Group haveclearly defined long-term objectives; in view of the cyclicalnature of non-life reinsurance we have not defined anytargets for premium growth here, but solely for profitgrowth.
53
Value drivers
Value management is not limited to the specificationand determination of a value-based ratio, but also en-compasses the definition of so-called value drivers.These describe action fields through which the IntrinsicValue Creation can be influenced.
When seeking to identify these value drivers, it is firstnecessary to break the IVC down into individual decisionfields. Even in the case of performance measurements,e.g. in connection with Management by Objectives, thisapproach makes it possible to take as a basis only thoseIVC components whose value drivers the manager inquestion can influence. Thus, for example, an under-writer at Hannover Home Office will only be accountablefor the "Underwriting" decision field, whereas the man-ager of a subsidiary will also bear responsibility for allother decision fields. With regard to the operational unitsthe IVC consists of six levels; its degree of detail variesaccording to Home Office and our foreign companies aswell as between non-life and life/health reinsurance:
1. IVC from gross underwriting (current business)
2. IVC from gross run-off (underwriting of previous years)
3. IVC from retrocession
4. IVC from investments
5. IVC from service center activities
6. IVC from excess capital
The IVC for the Group should be defined as close to theannual financial statements as possible so that it canalso be used for external reporting. On the other hand,the IVC calculation of the operational units is geared tothe explicit identification of value drivers that require amore detailed breakdown of the IVC.
Management report human resources
THE LESSON OF BAMBOO
Even in the global era a real understandingof markets is still the key to conqueringthem. A player like Hannover Re that strivesfor worldwide success adopts the bamboostrategy – by displaying flexibility and offer-ing reliability. Where some just see a wall,others find an opening.
56
Management report human resources
Number of employees at our worldwide permanent establishments
2008 2007
Country Total Male Female Total
Germany 963 466 497 907
United States 217 101 116 323
South Africa 150 67 83 149
United Kingdom 111 59 52 104
Sweden 81 35 46 79
Australia 57 28 29 52
France 41 21 20 42
Bermuda 30 19 11 24
Ireland 30 11 19 32
Malaysia 28 12 16 30
China 26 10 16 23
Bahrain 15 11 4 9
Colombia 14 6 8 12
Italy 12 4 8 11
Korea 7 4 3 1
Japan 7 5 2 7
Spain 6 1 5 6
Taiwan 5 2 3 5
Canada 4 1 3 5
Mexico 4 2 2 4
Brazil 2 2 – –
India 2 2 – –
Total 1,812 869 943 1,825
needed for the further professional development of ourworkforce. Three areas constituted the cornerstones ofour personnel activities in the year under review: thefostering of an entrepreneurial mindset on all levels, therecruitment of highly qualified people and the promo-tion of a healthy work/life balance for our staff.
Human resources
Our staff
Hannover Re strives to be an attractive employer forambitious, performance-minded individuals who identifywith the company's goals. With this in mind we offer aflexible, receptive working environment as well as latitudefor self-reliant decision-making. Our human resourcesstaff, systems and structures put in place the framework
57
Management report human resources
Fresh ideas and entrepreneurial thinking are especiallyimportant to Hannover Re if it is to enjoy a successfulfuture. Fostering the latter, in particular – among youngeremployees and not just seasoned staff – was the goal ofthe "Future Workshop" held for the first time in July 2008.Conducted in an informal atmosphere, the workshopgave 30 individuals who had been with Hannover Re forbetween two and five years the opportunity to put asidethe concerns of day-to-day business and discuss in gen-eral terms strategy, the future and Hannover Re as acompany.
At the conclusion of the "Future Workshop" the special-ists responsible for our strategic objectives – under whoseleadership the event had also been held – receiveddirect, knowledgeable feedback from the participants.
Future Workshop – entrepreneurial thinking on all levels
In this way, our junior staff were not only able to get toknow other areas and perspectives within Hannover Reand hence broaden their own working horizon; with thequestions and ideas that they had developed they alsoseized the chance to make a significant contribution toour company's strategy process – and what is more, theydid so in a direct dialogue with the responsible experts.
In view of the success of this concept we shall hence-forth hold the "Future Workshop" once a year. Over themedium to long term the purpose of this event will be toestablish a group of junior executives. We realise thatour younger staff, in particular, can contribute interestingsuggestions and a fresh perspective on Hannover Re –one which we would like to continue to benefit fromgoing forward.
Demand for motivated, well educated university gradu-ates – especially those with degrees in mathematics orbusiness mathematics – continued to intensify in theyear under review. Our company finds itself facing fiercecompetition from banks, management consultants andother financial services providers. Thanks to our long-standing involvement in university recruiting we have apresence at Germany's major job fairs. As a result, weare consistently able to fill new positions with highlyqualified young candidates.
Labour market for qualified university graduates remains fiercely competitive
With a view to consolidating and further extending ourposition as an attractive employer in the market, we sys-tematically seek to identify room for optimisation withinthe scope of our strategic human resources planning. In2008 we therefore set up a "Task Force" for the recruit-ment of mathematicians. Comprised of the managers ofdepartments which are especially reliant on mathem-aticians as well as representatives of Human Resources,it has set itself the task of further improving the way inwhich the company addresses this group of graduates
Key personnel data
The Hannover Re Group employed 1,812 (1,825) staffas at 31 December 2008. The turnover ratio at HomeOffice in Hannover of 3.3% (4.4%) was lower than inthe previous year. The rate of absenteeism – at 2.7% –was slightly higher than in the previous year (2.5%). Theturnover ratio and rate of absenteeism thus continuedto be comfortably below the industry average.
Staff turnover and absenteeism (Hannover Home Office)
20042005
20062007
2008
in %5
4
3
2
1
0
absenteeismturnover
2.32.8
3.23.7
2.5 2.5
4.4
2.7
3.3
2.7
58
Management report human resources
<20 years
20–29 years
30–39 years
40–49 years
50–59 years
>–60 y
ears
<5 years
5–9 years
10–14 ye
ars15–19 ye
ars
20–24 years
>–25 y
ears
in particular. Stepping up and expanding our contactswith universities – in part also through the sponsoring ofchairs in mathematics –, increasing the number of pos-itions offered to apprentices and soon-to-be graduatesas well as launching an employer branding project arejust the first measures undertaken by this task force.
Flanking these marketing-oriented approaches, we havealso created a trainee programme specially aimed atmathematicians: in the future, Hannover Re will offer
particularly well-suited graduates the opportunity toundergo an 18-month trainee programme for junior ex-ecutives and thereby familiarise themselves with thecompany from a broad variety of perspectives by spend-ing periods of six to twelve weeks in various areas of theorganisation. In this way, we shall be able to promptlyfill vacancies in these departments as they arise withwell-trained staff and further boost the appeal of Han-nover Re among university graduates with a backgroundin mathematics.
Demographic changes are leading to a shortage ofmanagers and junior executives. Hannover Re, just likeits competitors, must position itself in this battle formanagerial recruits. Our offer to qualified young applicantstherefore encompasses not only attractive compensa-tion and above-average development opportunities, butalso the possibility to strike a healthy balance in theirprofessional and private lives. After all, the range of pos-sible living and working models has multiplied in com-parison with the traditional allocation of roles. We seekto enable our staff to combine their individual life planswith their work for our company.
In addition to further steps aimed at simplifying theharmonisation of family life and career, Hannover Re istherefore funding the building of a new daycare centreon its premises at Hannover Home Office, which was
Work/life balance
commissioned in December 2008. The nursery is sup-ported by the parents' initiative "Hannover ReKids", asociety founded by Hannover Re staff; more informationon our daycare facility is provided in the SustainabilityReport.
in %
20
25
30
35
40
45
10
15
0
5
Age structure (Hannover Home Office)
in %
20
25
30
35
40
45
10
15
0
5
Length of service (Hannover Home Office)
0.5
13.3
36.8
32.3
14.4
2.7
31.427.6
13.4 14.3
7.1 6.2
59
Management report sustainability report
For a number of years Hannover Re has employedmanagement feedback as a personnel development toolwhich can be used to give managerial staff systematicfeedback on their leadership behaviour. In 2007 we re-vamped this tool – both in terms of content and process –,which has enjoyed high acceptance within the companysince its adoption in 2001: it is now implemented online,and the assessment also encompasses the supervisor'sperspective.
Successful implementation at Hannover Home Officeprompted initial inquiries in early 2008 from our per-manent establishments abroad with regard to the possi-
bilities for deploying management feedback on a localbasis. Once the necessary organisational adjustmentshad been made, the first run at an office abroad wascompleted before the end of the year under review.
Furthermore, building on the many years of wide-rangingexperience with management feedback on various levelsof management, the Executive Board also decided to usethe tool for itself and have an assessment performed bydirectly subordinate staff worldwide. This project toowas translated into practical reality in the year under re-view – with a very high rate of participation among thestaff concerned.
Management feedback
In the year under review we completed the company-wide roll-out of the new SAP module "Personnel Devel-opment" at Hannover Home Office. The goal is to opti-mally track and utilise our employees' existing skillsthroughout the organisation: staff potentials are to beidentified and cultivated, while shortcomings can bealleviated with targeted training activities.
Centralised data recording interlinks the appraisals fromvarious personnel development tools – while preservingthe greatest possible objectivity – and thus enables usto obtain a comprehensive overview of the highly diverseskills set available among our workforce. As a supportingmeasure, we use already established applications for theupdating and viewing of data by staff and managers.
Going hand-in-hand with the new module we haveimplemented self-assessment as a further criterion; in
New module for personnel development
future, this will complement the feedback obtained fromthe other tools. All in all, then, the following personneldevelopment tools are now available in addition to self-assessment and appraisal interviews: personnel develop-ment workshops, management feedback and projectmanager appraisals.
In the year under review we additionally included an as-sessment of specialist expertise as a further componentof our appraisal interview; the relevant lists are beingdrawn up progressively and stored for all departments ofour company in close consultation with the specialistareas. In the context of this project special referenceshould be made to the close and trusting cooperationwith our Employee Council.
Performance management is embedded into the Perform-ance Excellence process at our company. Departmentaland individual goals are derived from the strategic cor-porate objectives. By linking agreements on objectivesand Performance Excellence criteria we ensure that theefforts of our staff contribute directly to the success ofthe business strategy.
Fostering of a culture of achievement
We are convinced that performance-based remunerationelements foster individual initiative. Consequently, wemake every effort – where possible – to increase the per-formance-based salary component. The group of partici-pants in our variable systems of remuneration wastherefore further enlarged in the period under consider-ation.
60
Management report sustainability report
The Executive Board would like to thank all employeesfor their dedication in the past year. At all times theworkforce identified with the company's objectives andpurposefully pursued them. We would also like to ex-
Word of thanks to our staff
press our appreciation to the representatives of staffand senior management who participated in our co-determination bodies for their critical yet always con-structive cooperation.
Sustainability report
Profit and value creation are prerequisites for sustainabledevelopment in the interests of our clients, shareholders,staff and business partners as well as for the fulfilmentof our social responsibility. This includes the responsibleunderwriting of risks and diligent risk management,since these are vital conditions for assuring the qualityof our business over the long term. Hannover Re conse-quently strives to be one of the three most profitablereinsurers in the world and consistently enhances itsposition. In so doing, our premise of achieving growththrough self-generated profits and wherever possibleavoiding imbalances that could necessitate capitalmeasures continues to apply unchanged. We thus actguided solely by profitability considerations and concen-trate on attractive segments of reinsurance business.
High ethical and legal standards are the platforms forour strategy and daily actions alike. We recognise thatthe public image of the Hannover Re Group is shaped bythe manners and conduct of every single member ofstaff.
Successful, responsible and above all sustainable busi-ness management forms the basis for playing a positiverole in society. It establishes the foundation that enablesour company to continuously foster and advance its staffand support projects that are in the public interest.
Participation of staff in performance-based remuneration(Hannover Home Office)
2008 Number
Senior executives 66
Managerial levels up to the rank of Chief 403
Total participants 469
Proportion of the total workforce 48,7%
Employee shares are another means of enabling thelabour force to share in the company's success. For thefifth time Hannover Re arranged an employee sharepurchase scheme in the year under review, which offered841 members of staff the opportunity to acquire Han-nover Re shares at a preferential price; 389 employeestook up the offer and purchased altogether 13,984shares.
Employee shares
61
Management report sustainability report
We are aware of our responsible role as a major employerand contractor in the city of Hannover and surroundingregion, and we strive to award contracts locally wherepossible so as to foster businesses based here.
Social commitment is also something that Hannover Retakes very seriously, and the assumption of social re-sponsibility constitutes a core element of our corporateculture. In the year under review, for example, we fundedthe building of a new daycare centre on our premises inHannover. It is our hope that this facility will make iteasier for working mothers and fathers to re-enter pro-fessional life and, what is more, to better combine thejoys of parenting with their career. A maximum of 30 in-fants will be looked after at the nursery by trained child-care nurses. The staff at Hannover Re have taken up thisoffer of childcare very eagerly, as reflected in the factthat all 30 places for 2009 have already been filled. Asociety has been founded by Hannover Re employees –"Hannover ReKids e.V." – to support this institution.Going forward, Hannover Re will continue to cover themaintenance and operating costs for the daycare centre.
Social commitment
Yet our assistance is not limited to Germany alone, but isinstead geographically wide-ranging. A variety of pro-jects around the world are run under the auspices ofindividual subsidiaries and branch offices that collect do-nations for social causes through various staff activities.In Florida, for example, our subsidiary's workforce sup-ports the "New Hope for Kids" campaign: children andtheir families who find themselves in difficult life situ-ations are assisted with cash donations or other forms ofaid.
In Africa, too, Hannover Re has been active for a numberof years, inter alia in the project "Food for homeless chil-dren": twice a week employees at our South African sub-sidiary donate food to a centre for homeless children.
These are just two examples of Hannover Re's socialcommitment on the international level. Back in Hannoverwe launched a Christmas tree campaign this year – in-spired by the South African model: in this way, staff atHannover Re helped to realise the dreams of children ata local children's home during the Christmas season.
The transfer of knowledge between business and researchis an important element of our core commercial activities.Among other things, this exchange is indispensable forthe underwriting and assessment of catastrophe risks.For some years now we have therefore supported theGeo Research Center in Potsdam, which engages in thesystematic investigation and early detection of earth-quakes.
Research and development
Yet we also set great store by our dialogue with otheruniversities. We assist a number of institutions of higherlearning in Germany in a variety of ways – for examplethe University of Göttingen, where we sponsor a guestprofessorship in Anglo-American law to promote theinternationalisation of legal training.
Hannover Re recognises that business flights undertakenby its employees cause CO2 pollution. As a compensa-tory measure we pay a carbon offset levy for each kilo-metre flown to atmosfair, an international organisationthat puts the funds collected towards climate protection.atmosfair invests inter alia in solar, hydroelectric, bio-
Environment
mass and energy-saving projects so as to reduce green-house gases to an extent comparable with the effect onthe climate of the emissions produced by flying. Prefer-ential support is given to projects in developing coun-tries, although all projects must deliver a demonstrablecontribution to climate protection.
62
Management report risk report
In 2008, as in previous years, our subsidiary E+S Rückheld a so-called "examination concert" in Hannover.Every year this event offers three to four "master stu-dents" at Hannover University of Music and Drama theopportunity to play with the accompaniment of a largeorchestra. With this performance the students are ableto complete their final examination and satisfy the re-quirements for becoming a professional soloist. In addi-tion to advancing the career of the master students, theexamination concert – which was held for the eleventhtime in the year under review – served as the musicalhighlight of E+S Rück's annual "Hannover Forum" sem-inar event.
For many years our company has also dedicated itself tosupporting the fine arts, especially in Hannover. Seven-teen years ago, for example, we launched an art founda-tion that benefits the Sprengel Museum Hannover andwe regularly make works of art available to this institu-tion as permanent loans. The interest earned on thefoundation's capital is used to acquire these pieces. Spe-cially organised art tours make this collection accessibleto interested sections of the broader public.
Support for the arts
Our own art collection has enabled us to offer our staff,clients and other visitors an ambiance that presentsmultiple opportunities for contemplation and exploration.With the acquisition of Rolf Szymanski's six-metre highsculpture "Grosse Synagoge" we added another importantwork of contemporary art to our collection in the yearunder review.
Hannover Re also supports the Kestnergesellschaft inHannover through its participation in the latter's partnerprogramme: in our role as a "kestnerpartner" we are ableto promote the society's work on a continuous and last-ing basis. In addition, our Chief Executive Officer has setup a Board of Trustees for this art institution – whosereputation extends far beyond Hannover – under hisown chairmanship. The revenue from donations broughtin by this Board of Trustees will at least partially offsetthe sharp reduction in public subsidies.
In 2007 Hannover Re participated for the first time inthe "Ecological Project for Integrated EnvironmentalTechnology" (Ecoprofit). In the year under review wecontinued to pursue the basic idea underlying this
project – to combine economic profit with ecologicalbenefit – through preventive environmental protectionin order to bring about a further reduction in CO2
emissions.
63
Management report risk report
Risk report
Risk strategy
The risk strategy is an expression of Hannover Re's fun-damental approach to the identification and handling ofrisks. It is derived from the company strategy and con-stitutes a self-contained set of rules. At the same time itserves as the point of departure for the Group-wide
practice of risk management. Applicable right across theGroup, the risk strategy is an integral component ofentrepreneurial actions and is reflected in the detailedstrategies of the various divisions.
As an internationally operating reinsurer we are con-fronted with a broad diversity of risks that are directlyconnected with our entrepreneurial activities and whichmanifest themselves differently in the individual stra-tegic business groups and geographical regions. Ourconception of risk is holistic. For our company, risk meansthe entire spectrum of positive and negative randomrealisations in relation to planned or expected values.Negative random realisations, by which we understand
Risk conception
the possibility of non-attainment of an explicitly formu-lated or implicitly deduced goal, are of special impor-tance for risk management. The conservation of capitalis a decisive criterion for our risk tolerance. This necessi-tates a conscious approach to dealing with risks, both innon-life and life/health reinsurance and in the invest-ment sector.
With a view to conserving capital, we seek to control andmanage our specified individual risks in such a way thatthe total risk remains within the permissible, defined tol-erances. Risk management therefore forms an integralcomponent of our value-based enterprise managementand hence of all higher-order decision-making processes.In addition to conserving capital, we are careful to allo-cate our scarce equity resources flexibly to those areasthat promise the highest risk-weighted profit. Our insightsfrom the risk management system provide an overviewat all times of the Group's current and expected futureoverall risk situation. These insights thus establish aframework for decision-making on all levels of manage-ment by bringing transparency to the relationship be-
Overriding goals and organisation of our risk management
tween opportunities and risks. Operational realisation ofthese objectives is ensured inter alia through standardand ad hoc reports tailored to the risks, systematic andcomprehensive recording of all material risks and our re-view – based on a closed loop system – of the efficiencyof all relevant systems in risk management. Appropriaterules establish a separation between units that enterinto or manage risks, on the one hand, and those thatmonitor risks, on the other. Process-integrated monitoringis performed by the Risk Committee, the Chief Risk Officerand the supporting organisational units. Process-inde-pendent monitoring is the responsibility of InternalAuditing.
Company strategy Risk strategyDetailed strategies
(Central) divisions, subsidiaries
64
Management report risk report
Central elements of the risk management system
Hannover Re's risk management draws on quantitativesimulation models. The purpose of risk quantification isto calculate – with the aid of the internal risk capitalmodel – the risk capital on the basis of a Value at Risk(VaR) with a confidence level of 99.97% for an observa-tion period of one year. This consciously high confidencelevel ensures – as a vital subsidiary condition – that fu-ture regulatory capital requirements (confidence level of99.5%) will also be exceeded. Our qualitative processesand controls for risk identification, quantification and
Quantitative and qualitative risk management
steering are based upon recognised, advanced methods.Centrally defined guidelines, methods and processes aswell as systems of limits and thresholds provide theframework for decentralised implementation, monitoringand reporting. In addition, the central risk monitoringfunction quantifies and aggregates all risks on theGroup level. It performs central reporting and monitorsmeasures taken across the organisation to control risksthat could potentially jeopardise the Group's existence.
As far as technical risks affecting the non-life reinsurancebusiness group are concerned, we make a fundamentaldistinction between risks that result from business oper-ations in past years (reserving risk) and those stemmingfrom activities in the current or future years (price/pre-mium risk). The catastrophe risk is especially importantin the latter case.
Technical risks in non-life reinsurance
A significant technical risk is the risk of underreservingand the associated strain on the underwriting result. Wecalculate our loss reserves on an actuarial basis. Thepoint of departure here is always the information pro-vided by our cedants, where necessary supplemented byadditional reserves that may seem appropriate on thebasis of our own actuarial loss estimations. Furthermore,
Controlling elements Key risk management tasks
Supervisory Board • Advising and monitoring the Executive Board in its management of the company, inter alia with respect to risk management
Executive Board • Overall responsibility for risk management• Definition of the risk strategy • Responsible for the proper functioning of risk management
Risk Committee • Monitoring and coordinating body with respect to operational risk management• Decision-making power is within the bounds of the risk strategy defined by the Executive
Board
Chief Risk Officer • Responsibility for holistic risk monitoring across departments (systematic identificationand assessment, control/monitoring and reporting of risks) of all material assets- andliabilities-side risks from the Group perspective
Group Risk Management (central and decentralised risk monitoring function)
• Process-integrated risk monitoring function• Methodological competence, inter alia for
– development of processes/methods for risk assessment, management and analysis,– risk limitation and reporting,– risk monitoring and determination of the required risk capital across the Group
Business units • Primary risk responsibility, inter alia responsible for risk identification and assessment on the departmental level
• The task is performed on the basis of the guidelines set out by Group Risk Management
Internal Auditing • Process-independent review of all functional areas of Hannover Re
65
Management report risk report
we constitute an IBNR (incurred but not reported) re-serve for losses that have already occurred but have notyet been reported to us. Our own actuarial calculationsregarding the adequacy of the reserves are subject toannual quality assurance reviews conducted by externalactuaries and auditors. Catastrophe risks, especially thoseassociated with natural hazards such as earthquakes orwindstorm events, constitute another material risk forHannover Re. Licensed scientific simulation models, sup-plemented by our own expertise, are used to assess therisks posed by natural hazards. Within the scope of accu-mulation control the Executive Board defines the appe-tite for assuming natural hazards risks once a year onthe basis of our risk strategy. In order to manage the
portfolio with this consideration in mind, maximumunderwriting limits (capacities) are stipulated for variousextreme loss scenarios and return periods /probabilities,utilisation of which is monitored and reported to therelevant bodies. The price/premium risk lies primarily ina failure to correctly calculate the necessary premiumsin relation to the future loss experience. The risk arisesout of the incomplete or inaccurate estimation of futureclaims, especially over time. Regular and independentreviews of the models used for treaty quotation as wellas the implemented methods, e.g. our compulsory centraland local underwriting guidelines, are therefore essen-tial for the management of these risk potentials.
In life and health reinsurance biometric risks are ofspecial importance to our company. This term refers to allrisks directly connected with the life of an insured per-son, such as miscalculation of mortality, life expectancy,morbidity and occupational disability. Since we alsoprefinance our cedants' new business acquisition costs,lapse and catastrophe risks – e.g. with an eye to pan-demics – are of significance too.
We reduce these potential risks with a broad range ofrisk management measures. For example, the reserves inlife and health reinsurance are calculated in accordancewith actuarial principles using secure biometric actuarialbases and with the aid of portfolio information providedby our clients. Through our own quality assurance weensure that the reserves established by ceding companiesin accordance with local accounting principles satisfy allrequirements with respect to the calculation methodsused and assumptions made (e.g. use of mortality anddisability tables, assumptions regarding the lapse rateetc.). New business is written in all regions in compliancewith internationally applicable Global UnderwritingGuidelines, which set out detailed rules governing thetype, quality, level and origin of risks. These globalguidelines are revised every two years and approved bythe Executive Board. They are supplemented by country-specific special underwriting guidelines that cater to thespecial features of individual markets. In this contextthe quality standards set for the portfolio reduce the po-
Technical risks in life and health reinsurance
tential counterparty risk stemming from an inability topay or deterioration in the credit status of cedants. Wereview the risk feasibility of new business activities andof the assumed international portfolio on the basis of aseries of regularly performed, holistic analyses, inter aliawith an eye to the lapse risk. Quality is further assured –especially at the level of the subsidiaries – by the actuar-ial reports and documentation required by local regula-tors. A key tool of our value-based management and riskmanagement in the area of life and health reinsuranceis the European Embedded Value (EEV). This is calculatedas the present value of future earnings from the world-wide life and health reinsurance portfolio plus the allo-cated capital. In this context appropriate allowance ismade for all risks underlying the covered business. Sincethe 2006 financial year the EEV has been calculated ona market-consistent basis. In future, this Market Consis-tent Embedded Value (MCEV) is to be established on thebasis of the principles of the CFO Forum published inJune 2008. We publish the MCEV on our Internet web-site at the same time as the quarterly report for the firstquarter. The interest guarantee risk, which is importantin life business in the primary insurance sector, is of onlyminimal risk relevance to our business owing to thestructure of our contracts.
66
Management report risk report
The net income or loss generated by the Hannover ReGroup is fundamentally determined by two components,namely the "underwriting result" and the "investmentincome". The asset portfolios derive in substantial meas-ure from insurance premiums that must be set aside forfuture loss payments. The risks in the investment sectorencompass primarily market risks (share price, interestrate, real estate and currency risks as well as the spreadrisk). Credit risks are also relevant.
The share price risk results from volatilities on equitymarkets. Fixed-income securities are exposed to the in-terest rate risk when market interest rates change. De-clining market yields lead to increases and rising marketyields to decreases in the fair value of fixed-income se-curities portfolios. Real estate risks derive from unfavour-able changes in the value of our own real estate. Thismay be caused by a general downslide in market values(as seen with the present US real estate crash) or a de-terioration in the particular qualities of the property.Real estate risks are of subordinate importance for ourcompany owing to our minimal real estate portfolio.Currency risks result from fluctuations in exchange rates –especially if there is a currency imbalance between thetechnical liabilities and the investments. By systemati-cally adhering to matching currency coverage, i.e. exten-sive matching of currency distributions on the assets andliabilities side, we are able to minimise this risk. Thespread risk refers to the risk that the interest rate differ-ential between a risk-entailing bond and risk-free bondmay change while the quality remains unchanged.
We reduce these potential risks using a broad range ofrisk-controlling measures, the most significant of whichare monitoring of the Value at Risk (VaR), various stresstests that estimate the loss potential under extrememarket conditions as well as sensitivity and durationanalyses and our asset/liability management (ALM).Despite our conservative investment strategy, restrictivelimits and thresholds as well as the controlling tools de-scribed above, we cannot divorce ourselves entirely fromgeneral market developments. We took a number of risk-minimising measures in the year under review in re-sponse to the financial market crisis:
Capital market risks
• Limitation of the investment spectrum to governmentor supranational bonds in September 2008. Althoughthis step reduced the average yield for 2008, it alsolimited any new risk-taking on the credit markets inview of the uncertain state of the market.
• Elimination of all counterparty risks with respect toexisting options for equity hedging.
• Despite the already high diversification of the port-folio, further tightening of issuer limits for all invest-ments of the Hannover Re Group in September 2008in order to minimise potential accumulation risks.
• Near complete reduction of unhedged holdings oflisted equities in October 2008.
• Thorough review of the existing investment guidelinesin December 2008. Scarcely any adjustments werenecessary even in the present circumstances; the limits,especially in respect of covered bonds, ABS and MBS,were nevertheless further refined.
• Making available of a minimum level of liquidity orassets that can be realised at any time in an amountof at least EUR 4 billion or around 20% of the invest-ments under own management as the prevailingilliquidity of secondary markets that had begun inSeptember 2008 continued and in view of the risksarising in connection with the acceptance of LOCs by ceding companies.
67
Management report risk report
The credit risk consists primarily of the complete or partialfailure of the counterparty and the associated default on payment. Also significant, however, is the so-calledmigration risk, which results from a rating downgrade ofthe counterparty and is reflected in a change in fair value.
In reinsurance business the credit risk is material for ourcompany because the business that we accept is not al-ways fully retained, but instead portions are retrocededas necessary. These retrocessions conserve our capital,stabilise and optimise our results and enable us to derivemaximum benefit from a "hard" market (e.g. following acatastrophe loss event). Alongside traditional retro-cession we also transfer risks to the capital market. Over-
Credit risks
all, these tools support diversification within the totalportfolio and promote risk reduction. Credit risks are alsorelevant in life and health reinsurance because we pre-finance acquisition costs for our ceding companies. Ourinvestments similarly entail a credit risk. Our clients,retrocessionaires and broker relationships as well as ourinvestments are therefore carefully evaluated and limitedin light of credit considerations and are constantly moni-tored and controlled within the scope of our system oflimits and thresholds.
In our understanding, this category encompasses the riskof losses occurring because of the inadequacy or failureof internal processes or as a result of events triggered byemployee-related, system-induced or external factors.Operational risks also encompass legal risks, althoughthey do not extend to strategic or reputational risks.
Operational risks may derive, inter alia, from system fail-ures or unlawful or unauthorised acts. Given the broadspectrum of operational risks, there is a wide range of
Operational risks
different management measures tailored to individualrisks. Core elements of risk management are our contin-gency plans that ensure the continuity of mission-criticalenterprise processes and systems (recovery plans, back-up computer centre). The range of tools is rounded offwith external and internal surveys of clients and staff,the line-independent monitoring of risk management byInternal Auditing and the Internal Control System (ICS).
Under the heading of "Other risks" we primarily consideremerging risks, strategic risks, reputational risks and li-quidity risks.
The hallmark of emerging risks (such as obesity, nano-technology) is that the content of such risks is not as yetknown with any certainty and their implications – espe-cially for our portfolio – are difficult to assess. It is there-fore vital to detect such risks at an early stage and deter-mine their relevance. On this basis it is possible to decidewhich steps must be taken, e g. ongoing observation, theimplementation of contractual exclusions or the devel-
Other risks
opment of new reinsurance products. Strategic risksderive principally from an imbalance between the corpor-ate strategy and changing general economic conditions.Such an imbalance might be caused, for example, by in-correct strategic policy decisions, a failure to consistentlyimplement the defined strategies or by fundamentalchanges in court decisions or the regulatory environment.We therefore regularly review our strategy and system-atically adjust our structures and processes as and whenrequired. Our holistic management system of "Perform-ance Excellence" ensures that our strategy is constantlyreviewed and consistently translated into practice.
68
Management report forecast
Hannover Re's reputation as a company is one of its mostvital intangible assets. It often takes decades to build upa positive reputation, yet this reputation can be dam-aged or even destroyed within a very brief space of time.Like the strategic risk, the reputational risk usually mani-fests itself in combination with other risks, such as mar-ket or technical risks. Management of this risk is facilitatedby our mandatory communication channels and process-es that have been specified for defined crisis scenarios aswell as by our business principles. The liquidity risk refersto the risk of being unable to convert investments andothers assets into cash in order to meet our financialobligations when they become due. The liquidity risk consists of the refinancing risk, i.e. the necessary cash
cannot be obtained or can only be raised at increasedcosts, and the market liquidity risk, meaning that financialmarket transactions can only be completed at a poorerprice than expected due to a lack of market liquidity.Regular liquidity planning and a liquid asset structureare core elements of our ability to manage this risk. Ouractive liquidity management has helped to ensure thateven in times of financial crisis we are able to meet ourpayment obligations at all times without reservation.
In our view, there is very little risk that tax assessmentscontaining additional taxation of investment income atIrish companies will prevail.
The above remarks describe the diverse spectrum of po-tential risks to which we, as an internationally operatingreinsurance company, are exposed as well as the stepstaken to manage them. These risks can potentially have asignificant impact on our assets, financial position and netincome. Yet it is inappropriate to consider only the riskaspect, since risks always go hand-in-hand with opportun-ities. Thus, we have already explained that our conceptionof risk is holistic. With the aid of our effective controllingtools as well as our organisational structure and processorganisation, we ensure that we are able to identify risksin a timely manner and maximise our opportunities. Basedon our currently available insights arrived at from a holis-tic analysis of the risk situation, we cannot discern any
Assessment of the risk situation
risks that could jeopardise the continued existence of ourcompany in the short or medium term or have a signifi-cant, lasting effect on our assets, financial position or netincome. This remains true even against the backdrop ofthe recent upheavals on global financial markets. Furtherinformation on our risk management system, and in par-ticular quantitative data on individual risks, is provided inSection 6 of the Notes, "Management of technical andfinancial risks".
69
Management report forecast
Forecast
In 2009 we expect to see a sharp downturn in the globaleconomy and a continuing recession.
Monetary policy is currently tending towards an expan-sionary stance worldwide. In view of the drastic slow-down in economic activity and the risk of deflation, cen-tral banks have sharply eased their policy on interestrates. In the United States the Federal Reserve moved toa zero interest rate policy in the middle of December2008. Economic stimulus packages have already beenlaunched in many countries with a view to alleviatingthe slumping economy. Further measures intended to re-vive the economy will probably be unveiled in the courseof the year. Despite all the efforts of governments andcentral banks to stabilise the financial sector and stimu-late business activity, the global economy will probablyshow only very minimal growth in 2009.
With consumption already on the wane in the UnitedStates, exports are now also declining. This is likely to be
reflected in a sharp contraction in gross domestic prod-uct. The European Union is experiencing the most pro-nounced slump in manufacturing output in its existence.Domestic and foreign demand will drop significantly in2009 and real gross domestic product will fall. Prospectsfor the emerging markets have also taken a considerablydarker turn.
In Germany the recession is being driven first and fore-most by a sharp decline in exports. It is still uncertainwhether the steps taken by the federal government toboost the economy will begin to bite. Real gross domes-tic product will probably contract in 2009. Providedthere is no further bad news to reinforce the downwardtrend, the economic situation is expected to stabilisegradually in the second half of the year.
We were thoroughly satisfied with the treaty renewals asat 1 January 2009 – the date on which a good two-thirds of our treaties were renegotiated. The situationon the reinsurance markets has improved appreciably.This is due to the financial market crisis, which has led toa capital shortage throughout the worldwide insuranceindustry and hence fuelled demand for reinsurance covers.Hardly any further rate reductions were observed, andsome rate increases pushed into the double digits. This isparticularly true of catastrophe business, and especiallythose programmes that had suffered losses in 2008 –but it was also the case in worldwide credit and suretyreinsurance, which saw rate increases of up to 50%.German business continued to be attractive.
In the course of the renewal season it was again evidentthat ceding companies are attaching considerable im-portance to their reinsurers' ratings; this applies particu-larly to the underwriting of long-tail casualty business,
Non-life reinsurance
where a very good rating is an indispensable prerequis-ite in order simply to be asked to submit a quotation.With its very good ratings ("AA-" from Standard & Poor'sand "A" from A.M. Best), Hannover Re is one of the fewreinsurers to meet this condition without reservation.
We are very content with market conditions in Germany:our subsidiary E+S Rück enjoyed highly satisfactory treatyrenewals in its domestic market.
In motor liability business we obtained appreciable rateincreases after several years of reduced basic premiumsin the original market and claims inflation for bodilyinjuries. In view of the accumulation losses carried in2008, significant improvement in conditions were alsopossible in own damage business.
Prices and conditions in personal accident insuranceremained on a very pleasing level for E+S Rück. Going
70
Management report forecast
forward, as in the past, we shall support our clients inthis line not only by assuming risks in treaty and facul-tative reinsurance but also by offering them productinnovations.
Rates in property catastrophe business climbed sharplyas expected following a year of heavy losses.
We were able to further extend our already large marketshare in Germany thanks to new customer relationshipsand increased treaty shares under existing accounts,thereby cementing and expanding our position as one ofthe leading reinsurers in the profitable German market.
In the United Kingdom, too, we were satisfied with thetreaty renewals; in both motor insurance and casualtybusiness we enlarged our portfolio on the back of in-creased rates.
+++ 2009/2010 promise good business conditions +++
Owing partly to the heavy losses from hurricane "Ike" in2008, but also due to the worldwide financial marketcrisis, capacities in marine business contracted sharply inboth the primary and reinsurance sectors; rates conse-quently rose. Increases were recorded in regions thathad suffered heavy losses, such as the Gulf of Mexico,with prices here climbing by as much as 35%. In aviationbusiness, too, where Hannover Re ranks among theglobal market leaders, the premium erosion was halted.
In Northern European countries, too, the rate erosioncame to a halt in view of the repercussions of the finan-cial market crisis. Insurers are buying additional reinsur-ance capacity in order to protect their balance sheets.Given the fact that smaller insurers are likely to struggleto improve their strained capital position through theirown efforts alone, the current financial year is expectedto bring market consolidation.
In the Netherlands the financial market crisis led to a"revaluation" of the technical account, prompting ratesto rise again in industrial property insurance. In otherWestern European countries, too, business opportunitiesimproved and we were therefore able to enlarge ourpremium volume.
The outlook for rates in France has brightened. Furtherimprovement in prices for natural catastrophe risksshould be attainable on the back of the severe winterstorm "Klaus" in January. The net burden of losses forHannover Re is in the mid- to high double-digit millionsof euros.
The countries of Central and Eastern Europe are strategicgrowth markets for our company, insofar as we continueto be able to write profitable business going forward. Atthe time of the 2009 treaty renewals, as expected, weobserved an appreciable surge in demand among insurersfor high-quality reinsurance protection. As a result, wewere able to acquire new clients and enlarge our sharesin existing business, especially in Russia and other suc-cessor states of the former Soviet Union. Our premiumvolume was substantially expanded. The profitability ofthe written portfolio continues to be more than satisfac-tory.
For North America, too, we are looking to a significantlyimproved market environment in the current year; reduc-tions in rates or conditions are a thing of the past. Thediminished capital resources of primary insurers – in theaftermath of the financial market crisis – have fanneddemand for reinsurance covers and hence pushed upprices. Especially in areas where reinsurance capacity isscarce, e.g. catastrophe business in exposed zones suchas the Gulf of Mexico and California earthquake terri-tory, we are seeing double-digit price rises. It should,however, be noted that prices here were not alwayscommensurate with the risks.
+++ Rates for US catastrophe business still notadequate +++
In catastrophe-exposed US property business the marketbegan to harden – both in terms of rates and conditions.It was also gratifying to note that the premium erosionin US casualty business was halted. Indeed, it was evenpossible to push through rate increases in directors' andofficers' (D&O) and professional indemnity business.With the effects of the financial market crisis still rever-berating, we expect to see further price rises in the mid-dle of the year.
71
Management report forecast
All in all, we are looking to a slightly enlarged premiumvolume for North America in the current financial yearand stronger growth rates in 2010. In view of the favour-able general climate, we shall set aside our cautiousstance of the past year and step up our involvement. Ourgood market position and excellent contacts with allmajor market players should help us in this regard.
We are similarly very satisfied with the outcome of thetreaty renewals in China. Both the crisis on financialmarkets and the losses from the 2008 snowstorm gener-ated greater demand for reinsurance. Treaty conditionsin proportional property business, which accounts foraround 80% of the local market volume, showed substan-tial improvements – prompting us to appreciably ex-pand our involvement. In non-proportional propertybusiness prices held stable, while they showed double-digit gains under loss-affected programmes. We enlargedour premium volume in China by roughly 30%. Giventhe importance of the Chinese market, we stepped upour efforts to obtain a licence for a branch office servingnon-life reinsurance business.
The renewals picture in the other Asian markets was amixed one. The state of the market in Taiwan remainedbroadly unchanged; conditions in proportional treatiesare largely stable. In Japan – where the bulk of contractsare renewed on 1 April – we also expect rates to riseowing to the effects of the financial market crisis.
The retakaful segment continues to develop very well:here, too, the financial market crisis has positively im-pacted demand for Sharia-compliant products. Both oursubsidiary in Bahrain and our branch in Malaysia enjoyedappreciable increases in premium income.
+++ Substantially increased premium volume expectedin retakaful business +++
Along with our treaty business, we shall extend our in-volvement in the facultative segment – i.e. in the (re)in-surance of individual risks, particularly in engineeringbusiness. Numerous infrastructure-related constructionactivities are funded by Islamic financial institutions,which for their part obtain insurance from takaful com-panies. We expect the premium volume in the currentfinancial year to come in substantially higher.
In Latin America we extended our market presence byopening a new representative office in Brazil. The out-come of the treaty renewals as at 1 January, however,fell short of our expectations. Our interest is focused pri-marily on agricultural risks. Although only 15% of thetreaty portfolio was up for renewal on 1 January, it maybe observed that the trend in this segment is exception-ally favourable. We provide covers for agricultural risksnot only in Latin America but worldwide. Substantialpremium growth is anticipated for the current financialyear.
As far as our business in South Africa is concerned, weexpect 2009 to bring a rise in premium volume, which isdriven by specialty business. In the area of structuredproducts, too, we anticipate fresh business stimuli as aconsequence of more exacting capital requirements andthe repercussions of the financial market crisis.
In Australia we are looking to premium growth in theoriginal currency for 2009. During the current financialyear our subsidiary International Insurance Company ofHannover plans to open a branch office in Australia soas to further promote specialty business.
The financial crisis and economic crunch have had far-ranging repercussions on worldwide credit and suretyreinsurance. The number of insolvencies – and hence also the loss ratios – is set to rise. In the face of this busi-ness climate we are seeing appreciable hardening onthe markets to the benefit of reinsurers and were thusextraordinarily satisfied with the outcome of the treatyrenewals as at 1 January 2009. In proportional creditbusiness we were able to push through significantlyreduced commissions. Rate increases in the mid-double-digit percentage range were obtained for non-propor-tional covers. Although we appreciably enlarged ourpremium volume, we also significantly scaled back ouracceptances in some business segments. In these caseswe did not consider even high prices to be commensuratewith the risks.
The development of structured reinsurance products hasbeen highly satisfactory. The loss of capital at primaryinsurers has sharply boosted demand, especially for sur-plus relief contracts. Our goal is to further diversify ourbusiness and to expand in regions outside the United
72
Management report forecast
States. These efforts are proving successful. Especially inAsia, we have achieved sizeable growth. Yet in the USmarket, too, demand has risen.
In facultative reinsurance, which involves the writing ofindividual risks, around 40% of our treaty portfolio wasrenewed on 1 January. In this area we observed stablerates in virtually all markets. While a tendency towards ahardening market has made itself felt in the wake of thefinancial market crisis, the rate increases are still rela-tively insignificant. Only in US property business werewe able to secure price increases running into the lowdouble-digits. We anticipate further rate increases in thesecond half of the year.
+++ Reinsurers scarcely impacted by the recession +++
All in all, it may be stated that for our company – as areinsurer – conditions in non-life reinsurance are onceagain favourable and should improve even further in2010.
Although the recession continues to spread, it willscarcely affect us as a reinsurer since its primary impactis on the income statement of companies and less on thefixed assets to be insured. Conditions for a financiallystrong reinsurer such as Hannover Re are good. The in-creased demand among insurers – triggered by dimin-ished capital resources and greater risk awareness – iscoming up against a reduced supply, hence promptinghigher prices. A further positive factor is that the capitalmarket's interest in reinsurance products has faded. Inview of this environment and our very healthy diversifi-cation, and thanks to our excellent rating, we are able togenerate attractive business. In non-life reinsurance wecontinue to have a close eye on profitable niche busi-ness, as a consequence of which we are looking forwardto a very positive development in the current financialyear.
For the non-life reinsurance business group we expectnet premium growth of 10% in the original currencies aswell as a healthy profit contribution.
The general environment for international life andhealth reinsurance remains favourable – not only in theshort term but also from a medium-term perspective.Even against the backdrop of the current financial marketcrisis, the long-term demographic trends, heightened riskawareness among the urban middle classes, the openingup of the seniors' market and the creative design ofinnovative types of products should generate sustainedgrowth stimuli, especially in key threshold countries.
In this context we believe that Hannover Life Re is verywell positioned to share in these growth potentials to anabove-average extent. We intend to further refine ourtried and tested "Five Pillar model", with reinsurancesolutions for occupational pension funds set to play anespecially pivotal role in the new markets segment.
The application processes in life insurance, which weredeveloped more than 100 years ago, are to be subjectedto a thorough overhaul. The goal is to channel the pur-chase of life insurance policies into a process that – incommon with many straightforward bank products – can
Life and health reinsurance
be efficiently completed in a short space of time. To thisend Hannover Life Re offers expert, proven models ofvarying levels of complexity that are enjoying growingpopularity on the market.
+++ Significantly higher cession ratio expected formortality risks in the United States +++
The main drivers of our business will continue to be thedeveloped insurance markets of the United Kingdom,United States, Germany and Australia. In the long term,though, we see considerable potential in the four BRICmarkets of Brazil, Russia, India and China, and in 2009we are planning to enhance our network by opening arepresentative office in Beijing.
In many countries the international financial marketcrisis has brought about a considerable shift in life insurers'demand for reinsurance solutions and hence created –to the benefit of globally operating reinsurers with afirst-class rating – a continuously growing imbalance inthe dynamics of supply and demand.
73
Management report forecast
Owing to the visible weakening of their solvency posi-tion, primary insurers will find themselves compelled toadopt a significantly more cautious risk strategy andfinancial policy in the immediate future. This develop-ment is generating a wave of demand for both risk- andfinancially oriented reinsurance solutions – especiallybecause direct access to the capital markets by way ofsecuritisations is largely blocked.
This state of affairs is encapsulated especially succinctlyin the US life market, where the insurance industry suf-fered marked erosion of its capital base in the course ofthe year under review. In this market, therefore, we ex-pect 2009 and 2010 to bring an appreciable increase inthe cession ratio for mortality risks.
Similar developments are taking place in markets suchas the United Kingdom and Germany; the spotlight hereis on financially oriented solutions such as realising thevalue of in-force business. Overall, most life reinsurers
belong to the subsegment of the international financialservices industry that is currently profiting from theworldwide financial market crisis and for which attractivenew business opportunities are opening up on a scalethat would have been considered unrealistic just a fewyears ago.
In life and health reinsurance we expect annual growthof 12% to 15%. Due to our purchase of a US individuallife portfolio we anticipate growth of 35% for the cur-rent year. This acquisition is forecast to generate a pre-mium volume in the order of USD 1.2 billion for 2009.As early as 2009 the acquisition of this portfolio willhelp to boost Group net income.
For the current financial year and beyond we are lookingto an attractive EBIT margin in the range of 6.5% to7.5% as well as a better-than-average return on the in-vested capital.
Bearing in mind the favourable market conditions de-scribed above in non-life and life/health reinsurance aswell as our strategic orientation, we are looking forwardto another good financial year in 2009. In view of our ac-quisition in life reinsurance we expect our gross premiumin total business to grow by about 16%. This transactionwill also improve the diversification of our earningsstreams, since life reinsurance business – with its greaterstability – will account for a significantly larger share oftotal business going forward.
As things currently stand, we expect to generate a re-turn on equity in excess of 15%. This is subject to thepremise that the burden of catastrophe losses does notsignificantly exceed the expected level and that thereare no drastically adverse movements on capital mar-kets. As in past years, the company is aiming for a divi-dend in the range of 35% to 40% of Group net income.
The expected positive cash flow that we generate our-selves from the technical account and our investmentsshould – subject to stable exchange rates – lead to further
Overall business outlook
growth in our asset portfolio. In the area of fixed-incomesecurities we continue to stress the high quality anddiversification of our portfolio.
+++ Good prospects for a successful 2009 financial year +++
In the course of the current financial year and beyondwe expect further hardening of the non-life reinsurancemarkets and continuing favourable conditions in life andhealth reinsurance.
We define our long-term goals as follows:
In non-life reinsurance we are guided exclusively by profitrather than growth targets. Our goal here is to achievean EBIT margin of at least 12.5% each year.
In life and health reinsurance, on the other hand, wehave set ourselves an annual growth target of 12% –15% for both gross premium income and the operatingprofit (EBIT).
74
On the Group level our return-on-equity target is at least750 basis points above the risk-free interest rate.
Both the earnings per share and the book value per sharealso constitute central management ratios and perform-
ance indicators for our company. Our strategic objectiveis to increase these key figures – together with the oper-ating profit (EBIT) – by double-digit margins every year.
The common shares (share capital) of the companyamount to EUR 120,597,134.00. They are divided into120,597,134 registered no-par shares.
The Executive Board of the company is not aware of any restrictions relating to voting rights or the transferof shares, including cases where these may arise out of agreements between shareholders.
The following company holds direct or indirect capitalparticipations that exceed 10% of the voting rights:
Talanx AG, Riethorst 2, 30659 Hannover, holds 50.2%(rounded) of the company's voting rights. There are noshares with special rights granting their holders powersof control, nor is there any specially structured votingcontrol for employees who have capital participationsand do not directly exercise their rights of control.
The appointment and recall of members of the ExecutiveBoard are determined by §§ 84 et seq. Stock CorporationAct. Amendment of the Articles of Association is gov-erned by §§ 179 et seq. Stock Corporation Act in con-junction with § 16 Para. 2 and § 21 of the Articles ofAssociation of Hannover Re.
The powers of the Executive Board with respect to theissue and repurchase of shares are defined in § 6 "Con-tingent capital" and § 7 "Authorised capital" of Han-nover Re's Articles of Association as well as in §§ 71 etseq. Stock Corporation Act. In this connection the AnnualGeneral Meeting authorised the Executive Board on6 May 2008 pursuant to § 71 Para. 1 No. 8 Stock Corpor-ation Act to acquire treasury shares on certain conditions.
Information pursuant to § 315 Para. 4 German Commercial Code (HGB)
The following paragraphs explain major agreementsconcluded by the company that are subject to reservationin the event of a change of control following a takeoverbid and describe the resulting effects.
The two syndicated letter of credit lines extended toHannover Re in the amount of USD 2 billion each as wellas a syndicated line of credit in the amount of EUR 500million contain standard market change-of-control clausesthat entitle the participating banks to require early re-payment if Talanx AG loses its majority interest or dropsbelow the threshold of a 25 percent participation or if athird party acquires the majority interest in HannoverRückversicherung AG.
In addition, the retrocession covers in non-life and lifebusiness known as the "K" and "L" transactions containstandard market change-of-control clauses which ineach case grant the other contracting party a right oftermination if a significant change occurs in the owner-ship structure and participation ratios of the affectedcontracting party.
The company has not concluded any compensationagreements with the members of the Executive Board orwith employees in the event of a takeover bid beingmade.
Management report forecast
Consolidated Accountsof the Hannover Re Group
76
CONSOLIDATED BALANCE SHEETas at 31 December 2008
Figures in EUR thousand 2008 2007
Assets Notes 31.12. 31.12.
Fixed-income securities – held to maturity 7.1 1,475,202 1,488,816
Fixed-income securities – loans and receivables 7.1 1,680,857 1,537,889
Fixed-income securities – available for sale 7.1 14,482,832 12,477,055
Fixed-income securities – at fair value through profit or loss 7.1 254,528 158,740
Equity securities – available for sale 7.1 22,589 2,000,390
Other financial assets – at fair value through profit or loss 7.1 44,654 20,385
Real estate 7.1 25,514 16,962
Investments in associated companies 7.1 128,680 170,839
Other invested assets 7.1 784,421 677,957
Short-term investments 7.1 807,719 930,821
Cash 430,225 335,422
Total investments and cash under own management 20,137,221 19,815,276
Funds held 7.3 9,776,147 8,610,554
Contract deposits 7.3 288,782 616,134
Total investments 30,202,150 29,041,964
Reinsurance recoverables on unpaid claims 7.2 2,079,168 2,471,585
Reinsurance recoverables on benefit reserve 7.2 159,151 255,076
Prepaid reinsurance premium 7.2 29,733 92,322
Reinsurance recoverables on other technical reserves 7.2 9,928 5,574
Other changes in cumulative other comprehensive income (4,577) 6,482
Total other comprehensive income (138,278) (25,240)
Retained earnings 2,123,178 2,529,170
Shareholders' equity before minorities 2,830,059 3,349,089
Minority interests 501,434 572,744
Total shareholders' equity 3,331,493 3,921,833
38,001,743 37,068,407
78
CONSOLIDATED STATEMENT OF INCOMEfor the 2008 financial year
Figures in EUR thousand 2008 2007
Notes 1.1.–31.12. 1.1.–31.12.
Gross written premium 8,120,919 8,258,901
Ceded written premium 886,621 1,036,950
Change in gross unearned premium (113,480) 298,490
Change in ceded unearned premium (59,193) (227,511)
Net premium earned 7,061,625 7,292,930
Ordinary investment income 7.1 829,786 859,020
Profit/loss from investments in associated companies 7.1 4,199 11,028
Income/expense on funds withheld and contract deposits 7.1 199,587 220,108
Realised gains on investments 7.1 379,202 244,046
Realised losses on investments 7.1 492,756 69,735
Unrealised gains and losses on investments 7.1 (119,718) (18,771)
Total depreciation, impairments and appreciation of investments 7.1 480,420 71,982
Other investment expenses 7.1 41,421 51,968
Net investment income 278,459 1,121,746
Other technical income 7.13 7,294 1,130
Total revenues 7,347,378 8,415,806
Claims and claims expenses 7.2 4,702,127 5,031,071
Change in benefit reserves 7.2 421,342 397,934
Commission and brokerage, change in deferred acquisition costs 7.2, 7.13 1,635,941 1,759,010
Other acquisition costs 7.2 11,676 12,571
Other technical expenses 7.2, 7.13 12,166 20,081
Administrative expenses 7.13 216,047 204,358
Total technical expenses 6,999,299 7,425,025
Other income and expenses 7.14 (200,011) (62,779)
Operating profit/loss (EBIT) 148,068 928,002
Interest on hybrid capital 7.8 77,442 77,600
Net income before taxes 70,626 850,402
Taxes 7.5 205,610 47,452
Net income (loss) from continuing operations (134,984) 802,950
Net income (loss) from discontinued operations – 35,085
Net income (loss) (134,984) 838,035
thereof
Minority interest in profit and loss (7,997) 116,372
Group net income (loss) (126,987) 721,663
Earnings per share
Earnings per share in EUR 7.11 (1.05) 5.98
from continuing operations in EUR (1.05) 5.69
from discontinued operations in EUR – 0.29
79
CONSOLIDATED STATEMENTof changes in shareholders' equity 2008
Figures in EUR thousand Commonshares
Additionalpaid-incapital
Other reserves(cumulative other
comprehensive income)
Retainedearnings
Minorityinterests
Share-holders'equity
Currencytranslation
Unrealisedgains/losses
Other
Balance as at 1.1.2007 120,597 724,562 (71,518) 144,199 (1,526) 1,981,521 608,551 3,506,386
Capital repayments (69) (69)
Income and expense directly recognised in equity (147,395) 61,070 11,392 18,941 (119,087) (175,079)
Tax effects on income and expense directly recognised in equity 5,796 (23,874) (3,384) (21,462)
Dividends paid (192,955) (33,023) (225,978)
Net income (loss) 721,663 116,372 838,035
Balance as at 31.12.2007 120,597 724,562 (213,117) 181,395 6,482 2,529,170 572,744 3,921,833
Balance as at 1.1.2008 120,597 724,562 (213,117) 181,395 6,482 2,529,170 572,744 3,921,833
Income and expense directly recognised in equity (22,526) (17,285) (17,182) (1,632) (21,821) (80,446)
Tax effects on income and expense directly recognised in equity (11,922) (50,246) 6,123
(56,045)
Dividends paid (277,373) (41,492) (318,865)
Net income (loss) (126,987) (7,997) (134,984)
Balance as at 31.12.2008 120,597 724,562 (247,565) 113,864 (4,577) 2,123,178 501,434 3,331,493
80
CONSOLIDATED CASH FLOW STATEMENT2008
The reporting on cash flows within the Group is based on IAS 7 "Statement of Cash Flows". In addition, we observed theprinciples set out in German Accounting Standard No. 2 (DRS 2) of the German Standards Council regarding the prepa-ration of cash flow statements, which were supplemented by the requirements of DRS 2–20 that apply specifically toinsurance enterprises. In accordance with the recommendation of the German Standards Council for insurance enter-prises, we adopted the indirect method of presentation. The amounts taken into consideration are limited to cash andcash equivalents shown under the balance sheet item "Cash".
Figures in EUR thousand 2008 2007
1.1.–31.12. 1.1.–31.12.
I. Cash flow from operating activities
Net income (loss) (134,984) 838,035
Appreciation/depreciation 537,578 92,725
Net realised gains and losses on investments 113,554 (174,311)
Net realised gains and losses on discontinued operations – (92,080)
Amortisation of investments (8,737) (9,043)
Changes in funds held (1,735,801) (728,897)
Net changes in contract deposits1,645,271 155,984
Changes in prepaid reinsurance premium (net) 204,187 (71,536)
Changes in tax assets/provisions for taxes (12,341) (141,612)
Changes in benefit reserve (net) 399,654 566,914
Changes in claims reserves (net) 733,112 461,279
Changes in deferred acquisition costs (136,715) 83,135
Changes in other technical provisions (35,452) (956)
Changes in clearing balances (189,891) (161,390)
Changes in other assets and liabilities (net) 79,418 93,806
Cash flow from operating activities 1,458,853 912,053
II. Cash flow from investing activities
Fixed-income securities – held to maturity
Maturities 39,245 86,516
Purchases – (43,518)
Fixed-income securities – loans and receivables
Maturities, sales 86,975 129,315
Purchases (219,451) (490,617)
Fixed-income securities – available for sale
Maturities, sales 10,421,889 5,459,925
Purchases (12,558,404) (5,624,716)
Fixed-income securities – at fair value through profit or loss
Maturities, sales 34,663 23,602
Purchases (111,206) (25,001)
81
Figures in EUR thousand 2008 2007
1.1.–31.12. 1.1.–31.12.
Equity securities – available for sale
Sales 2,159,265 1,550,732
Purchases (1,010,888) (1,880,906)
Equity securities – at fair value through profit or loss
Sales – 20,340
Purchases – (13,830)
Other financial instruments – at fair value through profit or loss
Sales 156,010 –
Purchases (69,012) –
Other invested assets
Sales 19,962 93,616
Purchases (163,638) (137,436)
Affiliated companies and participating interests
Sales 41,405 591,223
Purchases (5,543) (1,663)
Real estate
Sales – 1
Purchases (10,076) (166)
Short-term investments
Changes 183,949 (279,507)
Other changes (net) (29,247) (28,464)
Cash flow from investing activities (1,034,102) (570,554)
III. Cash flow from financing activities
Contribution from capital measures 5,908 2,833
Structural change without loss of control (5,126) (108,157)
Dividends paid (318,865) (225,978)
Proceeds from long-term debts 39 –
Repayment of long-term debts (630) (10,006)
Cash flow from financing activities (318,674) (341,308)
IV. Exchange rate differences on cash (11,274) (16,545)
Change in cash and cash equivalents ( I+II+III+IV) 94,803 (16,354)
Cash and cash equivalents at the beginning of the period 335,422 351,776
Change in cash and cash equivalents according to cash flow statement 94,803 (16,354)
Cash and cash equivalents at the end of the period 430,225 335,422
Hannover Re's segmental report is based on IAS 14 "Segment Reporting" and on the principles set out in GermanAccounting Standard No. 3 "Segment Reporting" (DRS 3) of the German Standards Council, supplemented by the re-quirements of DRS 3–20 "Segment Reporting of Insurance Enterprises".
The segments are shown after consolidation of internal transactions within the individual segment, but before consoli-dation across the segments. This is reported separately in the "Consolidation" column.
SEGMENTAL REPORTas at 31 December 2008
Segmentation of assets
Figures in EUR thousand Non-life reinsurance
2008 2007
31.12. 31.12.
Assets
Held to maturity 1,262,866 1,262,619
Loans and receivables 1,418,271 1,263,764
Available for sale 11,244,214 11,387,469
At fair value through profit or loss 145,226 118,573
Other invested assets 871,345 808,047
Short-term investments 654,969 587,455
Cash 324,659 241,812
Total investments and cash under own management 15,921,550 15,669,739
Funds held by ceding companies 789,996 870,892
Contracts deposits – 137
Total investments 16,711,546 16,540,768
Reinsurance recoverables on unpaid claims 1,975,496 2,371,387
Reinsurance recoverables on benefit reserves – –
Prepaid reinsurance premium 23,582 86,217
Reinsurance recoverables on other reserves 9,813 3,031
1) After elimination of internal transactions within the Group across segments
Our secondary segmental reporting covers the continuing operations and is based on the regional origin of the invest-ments and gross written premium.
89
1. Company information 90
2. Accounting principles 90
3. Accounting policies 92
3.1 Change in accounting policies 92
3.2 Summary of major accounting policies 92
3.3 Major discretionary decisions and estimates 98
4. Consolidated companies and consolidation principles 99
5. Major acquisitions, new formations and other corporate changes 104
5.1 Acquisitions and new formations 104
5.2 Disposals and discontinued operations 104
5.3 Further corporate changes 106
6. Management of technical and financial risks 107
6.1 Quantitative risk management using the internal capital model 107
6.2 Technical risks in non-life reinsurance 108
6.3 Technical and financial risks in life and health reinsurance 111
6.4 Market risks 111
6.5 Credit risks 114
6.6 Liquidity risks 116
7. Notes on the individual items of the balance sheet and statement of income 117
7.1 Investments including income and expenses 117
7.2 Technical assets and liabilities 133
7.3 Funds held/contract deposits and contracts without sufficient technical risk 142
7.4 Goodwill; present value of future profits on acquired life reinsurance portfolios 143
7.5 Taxes and deferred taxes 144
7.6 Staff and expenditures on personnel 147
7.7 Provisions for pensions and other post-employment benefit obligations 148
7.8 Debt and subordinated capital 152
7.9 Shareholders' equity and minority interests 155
7.10 Treasury shares 157
7. 11 Earnings per share 157
7.12 Other assets and liabilities 158
7.13 Technical statement of income 164
7.14 Other income/expenses 166
8. Related party disclosures 167
8.1 Transactions with related parties 167
8.2 Remuneration and shareholdings of the management boards of the parent company 170
8.3 Share-based payment 170
8.4 Mortgages and loans 173
9. Other notes 173
9.1 Lawsuits 173
9.2 Contingent liabilities and commitments 173
9.3 Long-term commitments 175
9.4 Rents and leasing 175
9.5 Currency translation 176
9.6 Fee paid to the auditor 177
9.7 Events after the balance sheet date 177
NOTESContents
90
1. Company information
The parent company Hannover Rückversicherung AG ("Hannover Re") and its subsidiaries (collectively referred to asthe "Hannover Re Group") transact all lines of non-life and life/health reinsurance. The Group maintains business rela-tions with more than 5,000 insurance companies in about 150 countries. With gross premium of approximately EUR8.1 billion, Hannover Re is one of the largest reinsurance groups in the world. The Group's global network consists ofmore than 100 subsidiaries, affiliates, branches and representative offices in around 20 countries. The Group's Germanbusiness is conducted exclusively by the subsidiary E+S Rück. We employ over 900 staff in Hannover and roughly 1,800worldwide. The parent company is a joint-stock corporation, the registered office of which is located at Karl-Wiechert-Allee 50, 30625 Hannover, Germany.
Hannover Rückversicherung AG is a subsidiary of Talanx AG, which in turn is wholly owned by HDI Haftpflichtverbandder Deutschen Industrie V.a.G. (HDI).
2. Accounting principles
Hannover Re is obliged to prepare a consolidated financial statement and group management report in accordancewith § 290 German Commercial Code (HGB).
Pursuant to EU Regulation (EC) No. 1606/2002, the present consolidated financial statement and group managementreport of Hannover Re have been drawn up in accordance with the International Financial Reporting Standards (IFRS)that are to be used within the European Union. We have also made allowance for the supplementary regulations ap-plicable pursuant to § 315a Para. 1 German Commercial Code (HGB) and the supplementary provisions of the parentcompany's Articles of Association as amended on 3 August 2007.
The consolidated financial statement reflects all IFRS in force as at 31 December 2008 as well as all interpretationsissued by the International Financial Reporting Interpretations Committee (IFRIC), application of which was mandatoryfor the 2008 financial year.
Since 2002 the standards adopted by the International Accounting Standards Board (IASB) have been referred to as"International Financial Reporting Standards (IFRS)"; the standards dating from earlier years still bear the name "Inter-national Accounting Standards (IAS)". Standards are cited in our Notes accordingly; in cases where the Notes do notmake explicit reference to a particular standard, the term IFRS is used.
In addition, the German Accounting Standards (GAS) adopted by the German Accounting Standards Committee (GASC)have been observed insofar as they do not conflict with currently applicable IFRS.
The declaration of conformity required pursuant to § 161 German Stock Corporation Act (AktG) regarding compliancewith the German Corporate Governance Code has been submitted and made available to the shareholders.
The annual financial statements included in the consolidated financial statement were for the most part drawn up as at31 December. Pursuant to IAS 27.27 there is no requirement to compile interim accounts for Group companies with di-verging reporting dates because their closing dates are no earlier than three months prior to the closing date for theconsolidated financial statement.
The annual financial statements of all companies were initially drawn up in compliance with the provisions of the re-spective national laws and then transformed to IFRS in accordance with standard Group accounting and measurementrules.
NOTES
91
The consolidated financial statement was drawn up in euros (EUR), the amounts shown have been rounded to EURthousands and – provided this does not detract from transparency – to EUR millions. Figures indicated in brackets referto the previous year.
The present consolidated financial statement was examined by the Supervisory Board, adopted at the meeting of theSupervisory Board held on 10 March 2009 and hence released for publication.
New accounting principles
In November 2006 the IFRIC published IFRIC 11 "IFRS 2 – Group and Treasury Share Transactions". The interpretationprovides guidance on the application of IFRS 2 "Share-based Payment" to share-based payments involving an entity'sown equity instruments or rights to such equity instruments granted within the group. IFRIC 11 is mandatory for finan-cial years beginning on or after 1 March 2007. Application of the interpretation had no implications for Hannover Re'sconsolidated financial statement.
In July 2007 the IFRIC published IFRIC 14 "IAS 19 – The Limit on a Defined Benefit Asset, Minimum Funding Require-ments and their Interaction". The interpretation provides guidance inter alia for determining the limit on the amount ofa surplus in a pension plan that may be recognised as an asset pursuant to IAS 19. Application of the interpretationhad no implications for Hannover Re's consolidated financial statement.
On 13 October 2008, in response to the turmoil on international capital markets, the IASB adopted and published theamendments to "IAS 39 & IFRS 7 Reclassification of Financial Assets". By way of the Regulation (EC) No. 1004/2008the European Commission adopted the amendments in European law on 15 October 2008. The amendments permit, inparticular circumstances, reclassifications of (1.) non-derivative financial assets out of the fair value through profit orloss category and (2.) financial assets classified in the available-for-sale category to the loans and receivables category,and provide for additional disclosures in this regard. Hannover Re investigated the implications of the amendments andin view of the scarcely available scope for application did not avail itself of the facilities associated with the amend-ments as at the balance sheet date.
Standards or changes in standards that have not yet entered into force or are not yet applicable
The IASB has issued the following standards, interpretations and amendments to existing standards with possible impli-cations for the consolidated financial statement of Hannover Re, application of which is not yet mandatory for the yearunder review and which are not being applied early by Hannover Re:
In November 2006 the IASB issued IFRS 8 "Operating Segments", which replaces the previous IAS 14 "Segment Report-ing". IFRS 8 requires adoption of the "management approach" for reporting on the economic position of segments.Under this approach, the segmentation and the disclosures for the segments are based on the information used inter-nally by management for evaluating segment performance and deciding on the allocation of resources. IFRS 8 applies tofinancial years beginning on or after 1 January 2009. Hannover Re does not currently expect the standard to have anyinfluence on the presentation of segments in the consolidated financial statement.
In September 2007 the IASB issued a revised IAS 1 "Presentation of Financial Statements". The revision is aimed atimproving users' ability to analyse and compare the information given in financial statements. IAS 1 defines the basicprinciples for the presentation and structure of the annual financial statement. It also contains minimum requirementsfor the content of an annual financial statement. The revised standard is applicable to financial years beginning on orafter 1 January 2009; early adoption is permitted.
Notes 2. accounting principles
92
Notes 3.2 Summary of major accounting policies
In January 2008 the IASB published the revised versions of IFRS 3 "Business Combinations" and IAS 27 "Consolidatedand Separate Financial Statements". The new provisions primarily cover the recognition of minority interests, measure-ment issues in connection with successive acquisition, changes in a participating interest with or without a loss of con-trol and adjustments to acquisition costs depending upon future events and their effects on goodwill. The revised IFRS 3still does not apply to combinations of entities under common control. The amendments are mandatory for financialyears beginning on or after 1 July 2009. As at the balance sheet date neither of these revised versions had been ratifiedby the European Union.
In February 2008 the amendments to IAS 32 and IAS 1 "Puttable Financial Instruments and Obligations arising onLiquidation" were published. The revised version of IAS 32 permits the balance sheet classification of puttable financialinstruments as equity in the future under certain conditions. The amendment cannot be applied to the consolidatedfinancial statement, and in particular minority interests in partnerships shall continue to be recognised as a financialliability. The amendment of IAS 1 refers to revised disclosure requirements applicable to puttable financial instrumentsand obligations arising on liquidation. The application of both standards is mandatory from 1 January 2009 onwards.Hannover Re does not expect the amendments to have any effect on the consolidated financial statement.
In July 2008 the IFRIC published IFRIC 16 "Hedges of a Net Investment in a Foreign Operation". This interpretationprovides guidance on possible hedges of a net investment in a foreign operation and on the accounting thereof in anentity's consolidated financial statements. Application of the clarifications is mandatory for financial years beginningon or after 1 October 2008. Hannover Re does not expect application of the interpretation to have any effect on theconsolidated financial statement.
3. Accounting policies
3.1 Change in accounting policies
With effect from the second quarter of 2008 onwards Hannover Re made use of the option provided for in the currentlyvalid version of IFRS 3 to recognise outside income changes in shares in fully consolidated group companies with nochange of control status. In accordance with IAS 8 the figures for the previous year have been adjusted retrospectivelyfor the sake of comparison. As at 31 December of the previous year this change resulted in a profit reduction of EUR12.0 million, which was attributable to the changes in shares held in E+S Rück. A reclassification was made in the sameamount within retained earnings in the Group shareholders' equity of the previous year. The amount was reclassifiedfrom the net income recognised in shareholders' equity to the item "Income and expense directly recognised in equity".
3.2 Summary of major accounting policies
Reinsurance contracts: in March 2004 the IASB published IFRS 4 "Insurance Contracts". The first standard governingthe accounting of insurance contracts, it divides the "Insurance Contracts" project into two phases. IFRS 4 representsthe outcome of Phase I and serves as a transitional arrangement until the IASB defines the measurement of insurancecontracts after completion of Phase II. Underwriting business is to be subdivided into insurance or so-called "invest-ment contracts". Contracts with a significant insurance risk are considered to be insurance contracts, while contractswithout significant insurance risk are to be classified as investment contracts. The standard is also applicable to re-insurance contracts. IFRS 4 contains fundamental rules governing specific circumstances, such as the separation ofembedded derivatives and unbundling of deposit components. In conformity with these basic rules of IFRS 4 and theIFRS Framework, Hannover Re is availing itself of the option of retaining the previously used accounting policies forunderwriting items (US GAAP).
93
Notes 3.2 Summary of major accounting policies
Financial assets: as a basic principle we recognise the purchase and sale of directly held financial assets includingderivative financial instruments as at the settlement date.
Financial assets held to maturity are comprised of non-derivative assets that entail fixed or determinable payments ona defined due date and are acquired with the intent and ability to be held until maturity. They are measured at amort-ised cost. Payment of the corresponding premiums or discounts is spread across the duration of the instruments in thestatement of income using the effective interest rate method. Depreciation is taken in the event of permanent impair-ment. Please refer to our comments on impairments in this section.
Loans and receivables are non-derivative financial instruments that entail fixed or determinable payments on a defineddue date and are not listed on an active market or sold at short notice. They are carried at amortised cost; premiums ordiscounts are deducted or added within the statement of income using the effective interest rate method until theamount repayable becomes due. Depreciation is taken only to the extent that repayment of a loan is unlikely or nolonger expected in the full amount. Please refer to our comments on impairments in this section.
Financial assets at fair value through profit or loss consist of securities held for trading and those classified as measuredat fair value through profit or loss since acquisition. This refers principally to unsecured debt instruments issued bycorporate issuers and derivative financial instruments. Within the scope of the fair value option provided under IAS 39,according to which financial assets may be carried at fair value on first-time recognition subject to certain conditions,all structured securities that would have needed to have been broken down had they been recognised as available forsale or under loans and receivables are also recognised here. Hannover Re makes use of the fair value option solely forselected subportfolios of its assets. In addition, derivative financial instruments that Hannover Re does not recogniseas a valuation unit with underlying risks are recognised here. Securities held for trading and securities classified as mea-sured at fair value through profit or loss since acquisition are carried at their fair value on the balance sheet date. Ifstock market prices are not available for use as fair values, the carrying values are determined using generally acknow-ledged measurement methods. All unrealised gains or losses from this valuation are recognised in net investmentincome. The classification of financial assets at fair value through profit or loss is compatible with Hannover Re's riskmanagement strategy and investment strategy, which is oriented extensively towards economic fair value variables.
Establishment of the fair value of financial instruments carried as assets or liabilities: the fair value of a financial instru-ment corresponds to the amount that Hannover Re would receive or pay if it were to sell or settle the said financial in-strument on the balance sheet date. Insofar as market prices are listed on markets for financial instruments, these pricesare used. In other cases the fair values are established on the basis of the market conditions prevailing on the balancesheet date. These fair values are calculated using recognised models of mathematical finance. Hannover Re uses a num-ber of different valuation models, the details of which are set out in the following table.
94
Notes 3.2 Summary of major accounting policies
Valuation models
Financial instrument Pricing method Parameter Pricing model
Financial assets classified as available for sale are carried at fair value; accrued interest is recognised in this context.We allocate to this category those financial instruments that do not satisfy the criteria for classification as held tomaturity, loans and receivables, at fair value through profit or loss, or trading. Unrealised gains and losses arising outof changes in the fair value of securities held as available for sale are recognised – with the exception of currencyvaluation differences on monetary items – directly in shareholder's equity after deduction of deferred taxes.
The fair value of fixed-income and variable-yield securities is determined primarily by means of prices fixed on publiclyquoting markets or exchanges on the basis of "bid" prices. If such financial assets are not quoted on public markets, thefair value is calculated on the basis of the acknowledged effective interest rate method or estimated using other finan-cial assets with similar credit rating, duration and return characteristics. Under the effective interest rate method thecurrent market interest rate levels in the relevant fixed-interest-rate periods are always taken as a basis. The fair valueof equities and equity-like financial assets is also calculated primarily on the basis of prices fixed on publicly quotingmarkets and exchanges.
Impairments: As at each balance sheet date we review our financial assets with an eye to objective, substantial indica-tions of impairment. Permanent impairments on all fixed-income and variable-yield securities are recognised directly inthe statement of income. In this context we take as a basis the same indicators as those discussed below for securitieswith the character of equity. Qualitative case-by-case analysis is also carried out. IAS 39.59 contains a list of objective,substantial indications for impairments of financial assets. In the case of fixed-income securities and loans reference ismade, in particular, to the rating of the instrument, the rating of the issuer/borrower as well as the individual marketassessment in order to establish whether they are impaired. When held-to-maturity instruments measured at amortisedcost as well as loans and receivables are tested for impairment, we examine whether material items – looked at ontheir own – are impaired. The amount of the probable loss is arrived at from the difference between the book value ofthe asset and the present value of the expected future earnings flows. The book value is reduced directly by this amountand recognised as an expense. With the exception of value adjustments taken on accounts receivable, we recognizeimpairments directly on the assets side – without using an adjustment account – separately from the relevant items. Ifthe reasons for the write-down cease to apply, a write-up is made in income up to at most the original amortised costfor fixed-income securities.
95
Notes 3.2 Summary of major accounting policies
With respect to impairments on securities with the character of equity, IAS 39.61 (rev. 2003) states, in addition to theaforementioned principles, that a significant or prolonged decrease in fair value below acquisition cost constitutes ob-jective evidence of impairment. Hannover Re considers securities to be impaired under IAS 39 if their fair value falls sig-nificantly, i.e. by at least 20%, or for a prolonged period, i.e. at least nine months, below acquisition cost. In accordancewith IAS 39.69 the reversal of impairment losses on equities to the statement of income once impairment has been takenis prohibited, as is adjustment of the cost basis. Impairment is tested in each reporting period using the criteria definedby Hannover Re. If a security is considered to be impaired on the basis of these criteria, IAS 39.68 requires that a valueadjustment be recognised in the amount of the fair value less historical cost and less prior value adjustments, meaningthat depreciation is taken on the fair value as at the closing date – if available, on the publicly quoted stock exchangeprice.
Netting of financial instruments: financial assets and liabilities were only netted and recognised in the appropriate netamount where expressly permitted in law (reciprocity; similarity and maturity), in other words if the intention is to offsetsuch items on a net basis and this offsetting can be effected simultaneously.
Other invested assets are for the most part recognised at nominal value. Insofar as such financial assets are not listedon public markets (e.g. participating interests in private equity firms), they are carried at the latest available "net assetvalue" as an approximation of the fair value.
Investments in associated companies are valued at equity on the basis of the proportionate shareholders' equity attrib-utable to the Group. Under IAS 28.23, which requires the application of the equity method based on the investor's shareof the results of operations of the investee, the goodwill apportionable to the associated companies must be recog-nised together with the investments in associated companies. The year-end result of an associated company relatingto the Group's share is included in the net investment income and shown separately. As a general rule, the shareholders'equity and year-end result are taken from the associated company's latest available annual financial statement.
Real estate used by third parties (investment property) is valued at cost less scheduled depreciation and impairment.Straight-line depreciation is taken over the expected useful life – at most 50 years. Under the impairment test the mar-ket value of real estate for third-party use (recoverable amount) is determined using acknowledged valuation methodsand compared with the carrying value; unscheduled depreciation is taken where necessary. Maintenance costs andrepairs are expensed. Value-enhancing expenditures are capitalised if they extend the useful life.
Cash is carried at face value.
Funds held are receivables due to reinsurers from their clients in the amount of their contractually withheld cashdeposits; they are recognised at acquisition cost (nominal amount). Appropriate allowance is made for credit risks.
Accounts receivable: the accounts receivable under reinsurance business and the other receivables are carried atnominal value; value adjustments are made where necessary on the basis of a case-by-case analysis. We use adjustmentaccounts for value adjustments taken on reinsurance accounts receivable, while all other write-downs are bookeddirectly against the underlying position.
Deferred acquisition costs principally consist of commissions and other variable costs directly connected with theacquisition or renewal of existing reinsurance contracts. These acquisition costs are capitalised and amortised over theexpected period of the underlying reinsurance contracts. Deferred acquisition costs are regularly tested for impair-ment.
Reinsurance recoverables on technical reserves: shares of our retrocessionaires in the technical reserves are calculatedaccording to the contractual conditions on the basis of the gross technical reserves. Appropriate allowance is made forcredit risks.
96
Intangible assets: in accordance with IFRS 3 "Business Combinations" scheduled depreciation is not taken on goodwill;instead, unscheduled depreciation is taken where necessary after an annual impairment test. For the purposes of theimpairment test, goodwill is to be allocated pursuant to IAS 36 "Impairment of Assets" to so-called "cash generatingunits" (CGUs). Each CGU to which goodwill is allocated should represent the lowest level on which goodwill is monitoredfor internal management purposes and may not be larger than a primary or secondary segment. Following allocationof the goodwill it is necessary to determine for each CGU the recoverable amount, defined as the higher of the value inuse and the fair value less costs to sell. The recoverable amount is to be compared with the book value of the CGUincluding goodwill. When the latter exceeds the recoverable amount, an impairment expense is to be recognised. Theother intangible assets largely consist of purchased and self-developed software. This is recognised at acquisition costless scheduled depreciation. The other intangible assets also contain – within the scope of corporate acquisitions – theexpected present value of future profits (PVFP) at the time of acquisition of already existing life reinsurance portfolios;amortisation is taken according to the periods of the underlying acquired contracts. Intangible assets are regularlytested for impairment and unscheduled depreciation is taken where necessary.
Deferred tax assets: IAS 12 requires that assets-side deferred taxes be established if assets had to be recognised in alower amount or liabilities in a higher amount in the consolidated balance sheet than in the tax balance sheet and ifthese differences will be cancelled out again for tax purposes in the future (so-called temporary differences). Deferredtax assets are also to be recognised on tax loss carry-forwards. Insofar as unrealised losses on securities are carrieddirectly in shareholders' equity (cf. explanatory notes on financial assets held as available for sale), the resultingdeferred tax assets are also recognised outside the statement of income. Valuation allowances are made for deferredtax assets as soon as realisation of the receivable no longer appears likely.
Other assets are accounted for at amortised cost.
Own-use real estate is measured in the same way as investment property.
Technical reserves: the technical reserves are shown for gross account in the balance sheet, i.e. before deduction of theshare attributable to our reinsurers; cf. here the remarks concerning the corresponding assets. The reinsurers' portion iscalculated and accounted for on the basis of the individual reinsurance contracts.
Loss and loss adjustment expense reserves are constituted for payment obligations from reinsurance losses that haveoccurred but have not yet been settled. They are subdivided into reserves for reinsurance losses reported by the bal-ance sheet date and reserves for reinsurance losses that have already been incurred but not yet reported (IBNR) by thebalance sheet date. The loss and loss adjustment expense reserves are based on estimates that may diverge from theactual amounts payable. In reinsurance business a considerable period of time may elapse between the occurrence ofan insured loss, notification by the insurer and pro-rata payment of the loss by the reinsurer. For this reason the bestestimate of the future settlement amount is carried. With the aid of actuarial methods, the estimate makes allowancefor past experience and assumptions relating to the future development. With the exception of a few reserves, futurepayment obligations are not discounted.
Benefit reserves are comprised of the underwriting reserves for guaranteed claims of ceding companies in life andhealth reinsurance. Benefit reserves are determined using actuarial methods on the basis of the present value of futurepayments to cedants less the present value of premium still payable by cedants. The calculation includes assumptionsrelating to mortality, disability, lapse rates and the future interest rate development. The actuarial bases used in thiscontext allow an adequate safety margin for the risks of change, error and random fluctuation. They correspond tothose used in the premium calculation and are adjusted if the original safety margins no longer appear to be sufficient.
Unearned premium is premium that has already been collected but is allocated to future risk periods. In reinsurancebusiness flat rates are sometimes used if the data required for calculation pro rata temporis is not available.
Deferred tax liabilities: in accordance with IAS 12 deferred tax liabilities must be accounted for if assets are to berecognised in a higher amount or liabilities in a lower amount in the consolidated balance sheet than in the tax balance
Notes 3.2 Summary of major accounting policies
97
Notes 3.2 Summary of major accounting policies
sheet and if these differences will be cancelled out again in the future for tax purposes (so-called temporarydifferences).
Long-term liabilities principally consist of subordinated debts that can only be satisfied after the claims of other credit-ors in the event of liquidation or bankruptcy. They are measured at amortised cost. Liabilities to holders of minorityshares in partnerships arising out of long-term capital commitments are measured at the fair value of the redemptionamount as at the balance sheet date.
Financial liabilities at fair value through profit or loss: Hannover Re does not make use of the fair value option providedby IAS 39 to classify financial liabilities in this category upon first-time recognition.
Shareholders' equity: the items "common shares" and "additional paid-in capital" are comprised of the amounts paidin by the parent company's shareholders on its shares. In addition to the statutory reserves of the parent company andthe allocations from net income, the retained earnings consist of reinvested profits generated by the Hannover ReGroup companies in previous periods. What is more, in the event of a retrospective change of accounting policies, theadjustment for previous periods is recognised in the opening balance sheet value of the retained earnings and compar-able items of the earliest reported period. Unrealised gains and losses from the fair value measurement of financialinstruments held as available for sale are carried in cumulative other comprehensive income under unrealised pricegains/losses from investments. Translation differences resulting from the currency translation of separate financialstatements of foreign subsidiaries are recognised under gains and losses from currency translation.
Minority interests are shares in the equity of affiliated companies not held by companies belonging to the Group. IAS 1"Presentation of Financial Statements" requires that minority interests be recognised separately within Group share-holders' equity. The minority interest in profit or loss is shown separately as profit appropriation following the net income("thereof" note). This item refers mainly to minority interests in E+S Rück and its subsidiaries.
Disclosures about financial instruments: IFRS 7 "Financial Instruments: Disclosures" requires more extensive disclosuresaccording to classes of financial instruments. In this context, the term "class" refers to the classification of financial in-struments according to their risk characteristics. A minimum distinction between measurement at amortised cost or atfair value through profit or loss is required here. A more extensive or divergent distinction should, however, be geared tothe purpose of the corresponding disclosures in the notes. In contrast, the term "category" is used within the meaning ofthe measurement categories defined in IAS 39 (held to maturity, loans and receivables, available for sale and financialassets at fair value through profit or loss with the subcategories of trading and designated financial instruments).Essentially, the following classes of financial instruments were established:
• Fixed-income securities• Equities, equity funds and other variable-yield securities• Short-term investments• Other invested assets• Other financial assets – at fair value through profit or loss• Funds held and contract deposits (assets)• Accounts receivable• Other receivables• Funds held and contract deposits (liabilities)• Other liabilities• Long-term debt• Subordinated debt• Other long-term liabilities
This grouping into classes was not, however, solely determinative for the type and structure of each disclosure in thenotes. Rather, guided by the underlying business model of reinsurance, the disclosures were made on the basis of thefacts and circumstances existing in the financial year and in light of the principle of materiality.
98
Notes 3.3 Major discretionary decisions and estimates
3.3 Major discretionary decisions and estimates
In the consolidated financial statement it is to some extent necessary to make estimates and assumptions which affectthe assets and liabilities shown in the balance sheet, the information on contingent claims and liabilities as at the bal-ance sheet date and the disclosure of income and expenses during the reporting period. Key facts and circumstancessubject to such assumptions and estimates include, for example, the recoverability of contingent reinsurance liabilities,the valuation of derivative financial instruments as well as assets and liabilities relating to employee benefits. The actualamounts may diverge from the estimated amounts.
In order to measure the "ultimate liability" the expected ultimate loss ratios are calculated in non-life business with theaid of actuarial methods such as the "chain ladder" method. The development until completion of the run-off is projectedon the basis of statistical triangles from the original notifications of ceding companies. In this context it is generallyassumed that the future rate of inflation of the loss run-off will be analogous to the average rate of the past inflationcontained in the data. The more recent underwriting years in actuarial projections are of course subject to greateruncertainty, although this can be considerably reduced with the aid of a variety of additional information on improve-ments in the rates and conditions of the business written and on loss trends. The amounts arrived at as the differencebetween the ultimate losses and the reported losses are set aside as the IBNR reserve for losses that have been incurredbut are not yet known or have still to be reported.
By analysing a broad range of observable information it is possible to classify losses as major individual loss events.Measurement of the obligations existing in this connection is carried out using a separate process, which is based largelyon contract-specific estimates.
For further details, for example concerning the modelling of natural catastrophe scenarios and the assumptions relatingto asbestos and pollution risks, the reader is referred to our comments in Section 6 "Management of technical andfinancial risks". We would further refer to our explanatory remarks on the technical reserves in Section 3.2 "Summary ofmajor accounting policies" and Section 7.2 "Technical assets and liabilities".
In life business too the calculation of reserves and assets is crucially dependent on actuarial projections of the coveredbusiness. So-called model points are defined according to the type of business covered. The main distinguishing criteriaare the age, sex and (non-)smoker status of the insured, tariff, policy period, period of premium payment and amount ofinsurance. The portfolio development is simulated for each model point, in which regard the key input parameters areeither predefined by the tariff (e.g. allowance for costs, amount of premium, actuarial interest rate) or need to be esti-mated (e.g. mortality or disability rates, lapse rates). These assumptions are heavily dependent on country-specific para-meters and on the sales channel, quality of the cedant's underwriting and claims handling, type of reinsurance and otherframework conditions of the reinsurance treaty. The superimposition of numerous model points gives rise to a projec-tion, which incorporates inter alia assumptions concerning the portfolio composition and the commencement of coveredpolicies within the year. Such assumptions are estimated at the inception of a reinsurance treaty and subsequently ad-justed to the actual projection.
The projections, which cover various model scenarios ("conservative assumptions" versus "best estimate"), constitutethe starting point for numerous areas of application encompassing quotation, the determination of carrying values andembedded values as well as contract-specific analyses, e.g. regarding the appropriateness of the recognised reinsuranceliabilities ("liability adequacy test"). In this context we would refer the reader to our comments on technical assets andreserves in Section 3.2 "Summary of major accounting policies" and on the "liability adequacy test" in Section 7.2 "Tech-nical assets and liabilities".
In determining the carrying values for certain financial assets it is sometimes necessary to make assumptions in order tocalculate fair values. In this regard we would refer the reader to our remarks in Section 3.2 "Summary of major accountingpolicies" concerning financial assets at fair value through profit or loss and securities held as available for sale. Assump-tions concerning the appropriate applicability criteria are necessary when determining the need for impairments onnon-monetary financial assets held as available for sale. In this regard we would again refer the reader to our explanatoryremarks in Section 3.2 "Summary of major accounting policies".
99
Notes 4. Consolidated companies and consolidation principles
4. Consolidated companies and consolidation principles
Hannover Rückversicherung AG is the parent company of the Group. The consolidated financial statement includesfourteen (fourteen) German and nineteen (nineteen) foreign companies, as well as three (three) foreign subgroups.Three (three) German and two (three) foreign associated companies were consolidated using the equity method.
In conformity with Item 7.1.4 of the recommendations of the German Corporate Governance Code as amended on6 June 2008, the following table also lists major participations in unconsolidated third companies.
With regard to the major acquisitions and disposals in the year under review please see our remarks in Section 5 "Major acquisitions, new formations and other corporate changes".
The figures for the capital and capital reserves as well as the result for the last financial year are taken from the localfinancial statements drawn up by the companies.
Name and registered office of the company (Figures in currency units of 1,000)
Hannover Reinsurance Group Africa (Pty) Ltd., Johannesburg/South Africa 1) 100.0 ZAR 156,133 ZAR 33,712
Hannover Reinsurance Group Africa (Pty) Ltd. compiles its ownsubgroup financial statement in which the following majorcompanies are included:
Hannover Life Reassurance Africa Ltd., Johannesburg/South Africa 1) 100.0 ZAR 169,724 ZAR 60,091
Hannover Reinsurance Africa Ltd., Johannesburg/South Africa 1) 100.0 ZAR 686,963 ZAR 76,008
101
Notes 4. Consolidated companies and consolidation principles
1) Provisional (unaudited) figures2) Year-end result after profit transfer3) Formerly Zweite Hannover Rück Beteiligung Verwaltungs-GmbH4) Financial year as at 30 September 20085) Abbreviated financial year from 10 April - 30 September 20086) Company is inactive and does not compile an annual report
7) IFRS figures8) Financial year as at 31 December 20079) Formerly WeHaCo Unternehmensbeteiligungs-AG10) Company is in liquidation11) Figures as at 31 August 200612) Unaudited US GAAP figures, abbreviated financial year from 30 May - 30 September 2008
Name and registered office of the company (Figures in currency units of 1,000)
Participation in %
Capital and reserves
Result for the last
financial year
Hannover Re Real Estate Holdings, Inc., Orlando/USA 1) 95.2 USD 138,741 USD (11,498)
Hannover Re Real Estate Holdings, Inc. holds a subgroup in which the following major company is included:
Globe Re Ltd.,Hamilton/Bermuda 12) 15.2 USD 34,729 USD 1,729
Capital consolidation
The capital consolidation complies with the requirements of IAS 27 "Consolidated and Separate Financial Statements".Subsidiaries are consolidated as soon as Hannover Re acquires a majority voting interest or de facto controlling influ-ence. The same is true of special purpose entities, the consolidation of which is discussed separately below.
Only subsidiaries of minor importance for the assets, financial position and net income of the Hannover Re Group areexempted from consolidation. For this reason thirteen service companies and representative offices abroad, the busi-ness object of which is primarily the rendering of services for reinsurance companies within the Group, were not consoli-dated in the year under review.
The capital consolidation is based on the revaluation method. In the context of the "purchase accounting" method theacquisition costs of the parent company are netted with the proportionate shareholders' equity of the subsidiary atthe time when it is first included in the consolidated financial statement after the revaluation of all assets and liabilities.After recognition of all acquired intangible assets that in accordance with IFRS 3 "Business Combinations" are to beaccounted for separately from goodwill, the difference between the revalued shareholders' equity of the subsidiary and
102
the purchase price is recognised as goodwill. Under IFRS 3 scheduled amortisation is not taken on goodwill. Instead,unscheduled amortisation is taken where necessary on the basis of annual impairment tests. Immaterial and negativegoodwill are recognised in the statement of income in the year of their occurrence.
Minority interests in shareholders' equity are reported separately within Group shareholders' equity in accordance withIAS 1 "Presentation of Financial Statements". The minority interest in profit or loss, which forms part of net income and is shown separately after net income as a "thereof" note, amounted to -EUR 8.0 million (EUR 116.4 million) as at 31 December 2008.
Minority shares in partnerships are reported under long-term liabilities in accordance with the applicable version of IAS 32.
Companies over which Hannover Re is able to exercise a significant influence ("associated companies") are normallyconsolidated "at equity" with the proportion of the shareholders' equity attributable to the Group. A significant influenceis presumed to exist if a company belonging to the Hannover Re Group directly or indirectly holds at least 20% – but no more than 50% – of the voting rights. Income from investments in associated companies is recognised separately inthe consolidated statement of income.
Debt consolidation
Receivables and liabilities between the companies included in the consolidated financial statement were offset againsteach other.
Consolidation of expenses and profit
The effects of business transactions within the Group were eliminated.
Consolidation of special purpose entities
Securitisation of reinsurance risksThe securitisation of reinsurance risks is largely structured through the use of special purpose entities. The existence ofa consolidation requirement in respect of such entities is to be examined in accordance with SIC-12 "Consolidation –Special Purpose Entities". In cases where IFRS do not currently contain any specific standards, Hannover Re's analysis –in application of IAS 8.12 – also falls back on the relevant standards of US GAAP.
Since November 2000 Hannover Re had held voting equity interests in an amount of 33.3% in the special purposeentity Mediterranean Re PLC for the securitisation of reinsurance risks in France and Monaco. The securitisation endedas per the contractual agreement on 18 November 2005. The bonds issued as security were repaid in full to investors.The additional paid-in capital was repaid to the partners. The special purpose entity was liquidated effective 5 February2008.
Under a transaction designated "K5" Hannover Re uses the capital market to securitise reinsurance risks. The trans-action was increased to USD 540.0 million in January 2008 and had a volume of EUR 386.3 million (EUR 360.2 million)as at the balance sheet date. The securitisation was placed with institutional investors in North America, Europe andAsia. The portfolio assembled for the securitisation consists of non-proportional reinsurance treaties in the natural ca-tastrophe, aviation and marine lines, including offshore business. Kaith Re Ltd., a special purpose entity domiciled inBermuda, is used for the transaction. The planned term of the transaction runs until 31 December 2008. In accordancewith SIC 12 Kaith Re Ltd. is included in the consolidated financial statement.
Notes 4. Consolidated companies and consolidation principles
103
In the previous year Hannover Re placed on the capital market a protection cover on its worldwide natural catastrophebusiness in an amount of USD 200.0 million with a term of two years. It provides Hannover Re with aggregate excess ofloss coverage. The special purpose entity Kepler Re, a separate cell within Kaith Re Ltd., is used for the transaction. Thevolume as at the balance sheet date was EUR 143.1 million (EUR 135.9 million). The underlying portfolio consists ofthe natural catastrophe business retained under the existing "K5" securitisation. The cover attaches upon occurrence ofan aggregated 83-year-event for "K5" and is fully utilised upon occurrence of a 250-year accumulation. Within thisspread the outside investors in this and the "K5" transaction combined assume 90% of the "K5" losses, while the re-maining 10% remain with Hannover Re. Hannover Re does not bear the majority of the economic benefits or risks arisingout of this company's activities through any of its business relations with the special purpose entity.
In the previous year the Hannover Re Group also transferred risks from reinsurance recoverables to the capital market.By way of this securitisation in a nominal amount of EUR 95.0 million, which has a term of five years, Hannover Re re-duces the default risk associated with reinsurance recoverables. The portfolio of recoverables underlying the transactionhas a nominal value of EUR 1.0 billion and is comprised of exposures to retrocessionaires. The securities serving ascollateral are issued through the special purpose entity Merlin CDO I B.V. A payment to Hannover Re is triggered by theinsolvency of one or more retrocessionaires as soon as Hannover Re's contractually defined cumulative deductible ofEUR 60.0 million over the term of the contract is exceeded. In the months of May and November 2008 Hannover Repurchased securitisations issued by Merlin with a nominal value of altogether EUR 10.5 million on the secondary market,which it holds in its asset portfolio. Hannover Re does not derive the majority of the economic benefits or risks arisingout of the special purpose entity's activities through any of its business relations.
In June 2008 Hannover Re completed the first transaction as part of its extended Insurance-Linked Securities (ILS)activities. Property catastrophe risks of a number of US cedants were pooled and transferred to the capital market inseveral tranches. A special purpose entity named Globe Re was established in Bermuda for this transaction; it is capital-ised at USD 133.0 million. Globe Re is funded through the issue of an equity tranche of USD 33.0 million and a furtherUSD 100.0 million in bonds split into various rating categories. The term of the transaction is one year. Hannover Rehas a stake of USD 5.0 million – or 15.2% – in the equity tranche. Hannover Re does not exercise a controlling influenceover the special purpose entity through any of its business relations. Pursuant to IAS 28 "Investments in Associates"Globe Re is to be carried as an investment at cost or amortised cost and is recognised under other invested assets.
As a means of transferring peak exposures deriving from natural disasters to the capital market, Hannover Re issued acatastrophe ("CAT") bond that can be traded on a secondary market. The CAT bond, which has a volume of USD 150.0million and a term of 3 years, was placed with institutional investors from Europe and North America by Eurus Ltd., aspecial purpose entity domiciled in the Cayman Islands. In the third quarter of 2008 Hannover Insurance-Linked Secur-ities GmbH & Co. KG purchased catastrophe bonds issued by Eurus Ltd. with a nominal value of altogether EUR 6.0 mil-lion on the secondary market, which it holds in its asset portfolio. Hannover Re does not exercise a controlling influenceover the special purpose entity through any of its business relations.
InvestmentsWithin the scope of asset management activities Hannover Re has participated in numerous special purpose entitiessince 1988, which for their part transact certain types of equity and debt capital investments. On the basis of our analy-sis of our relations with these entities we concluded that the Group does not exercise a controlling influence in any ofthese transactions and a consolidation requirement therefore does not exist.
Hannover Re participates – primarily through the companies Hannover Re (Bermuda) Ltd. and Hannover Insurance-Linked Securities GmbH & Co. KG – in a number of special purpose entities for the securitisation of catastrophe risks bytaking up certain capital market securities known as "disaster bonds" (or "CAT bonds"). Since Hannover Re does notexercise a controlling influence in any of these transactions either there is no consolidation requirement.
Notes 4. Consolidated companies and consolidation principles
104
Notes 5.2 Disposals and discontinued operations
5. Major acquisitions, new formations and other corporate changes
5.1 Acquisitions and new formations
On 9 April 2008 the Cologne-based Hannover Re Euro PE Holdings GmbH & Co. KG commenced business operations.Hannover Re and E+S Rück hold interests of 75% and 25% respectively in the company. Payment of the limited partner'sshare in an amount of altogether EUR 4.5 million was made in the second quarter. The company's business object is tobuild, hold and manage a portfolio of assets.
On 19 May 2008 the Shanghai-based Hannover Rückversicherung AG Shanghai Branch commenced business oper-ations as a permanent establishment of Hannover Re. The business object of the branch is the writing of life and healthreinsurance business.
On 23 May 2008 the Seoul-based Hannover Rückversicherung AG Korea Branch commenced business operations as apermanent establishment of Hannover Re. The business object of the branch is the writing of life and health reinsur-ance business.
Effective 29 May 2008 Hannover Re participated as the first investor in Secquaero ILS Fund Ltd., which is domiciled inthe Cayman Islands. The fund in question is a so-called "Seed Money Fund", the business object of which is to under-write, hold and sell insurance-linked securitisations. As at the balance sheet date Hannover Re had invested altogetherUSD 50 million in this fund by way of several tranches. Hannover Re will consolidate this fund until such time as otherinvestors hold the majority stake in the fund.
In the context of the sale of the interest held by Hannover Re in ITAS Assicurazioni S.p.A., a portion of the purchaseprice was paid by the purchaser in the form of shares in E+S Rück. The stake of 1.41% in the common shares of E+SRück received in this way was transferred to Hannover Rück Beteiligung Verwaltungs-GmbH (HRBV) on 30 December2008 by way of a capital increase for a non-cash contribution. Upon closing of the transaction HRBV held 64.19% ofthe shares in E+S Rück. Please see our explanatory remarks in Section 5.2 "Disposals and discontinued operations".
5.2 Disposals and discontinued operations
Effective 3 March 2008 HRBV, which is wholly owned by Hannover Re, reached agreement with a third party outsidethe Group on the sale of 1% of its stake in E+S Rück – by way of a share reduction without a change of control status –in order to intensify the business relations. In the capital consolidation as at the balance sheet date this transaction wasrecognised directly in equity. Please see our explanatory remarks in Section 3.1 "Change in accounting policies".
Effective 30 December 2008 Hannover Re sold its interest of 43.7% in ITAS Assicurazioni S.p.A. at book value. The pro-ceeds from the sale totalled altogether EUR 26.4 million and were rendered in the form of a cash component amountingto EUR 7.4 million and a transfer of E+S Rück shares held by the purchaser worth EUR 19.0 million. Hannover Re trans-ferred these shares to HRBV by way of a capital increase for a non-cash contribution. Please see our explanatory remarksin Section 5.1 "Acquisitions and new formations".
After Hannover Re had already paid out the paid-in capital of WRH Offshore High Yield Partners L.P. in the 2007 finan-cial year and during the third quarter of 2008 by way of two distribution resolutions, the company's application for can-cellation was filed on 17 December 2008. Deconsolidation of the company gave rise to a loss of altogether EUR 13.6million, of which EUR 12.1 million was attributable to Hannover Re.
Notes 5.2 Disposals and discontinued operations
Major items in the statement of income of the discontinued operations
Figures in EUR thousand 2008 2007
Gross written premium – 287,114
Ceded written premium – 318,152
Net change in gross unearned premium – 178,494
Net premium earned – 147,456
Net investment income – 20,444
Net underwriting result – 11,430
Other income and expenses – (7,075)
Operating profit/loss (EBIT) – 24,799
Interest on hybrid capital – 2,283
Net income before taxes – 22,516
Taxes – 11,048
Acquirer's share of current income from discontinued operations – 12,833
Group share of current income from discontinued operations – 11,468
Income/loss from deconsolidation (after taxes) – 23,617
Net income – 35,085
Statement of cash flows from the discontinued operations
Figures in EUR thousand 2008 2007
Cash flow from operating activities – 172,834
Cash flow from investing activities – (18,125)
Change in cash and cash equivalents – 154,709
105
In the 2006 financial year Hannover Re reached agreement on the sale of its American subgroup Praetorian FinancialGroup, Inc., New York (PFG), to an Australian insurance group. Effective 31 May 2007 beneficial ownership of the assetsand liabilities belonging to the subgroup classified in the previous periods as discontinued operations was transferred.They were therefore no longer recognised as at the balance sheet date. In compliance with IFRS 5 "Non-Current AssetsHeld for Sale and Discontinued Operations", we recognise the profit or loss of PFG in the consolidated statement of in-come for the previous period after tax in a separate line.
The profit or loss and net cash flows of the discontinued operations for the comparative period of the previous year arepresented in the following tables and broken down into their major components.
106
Notes 5.3 Further corporate changes
5.3 Further corporate changes
Effective 1 January 2008 Hannover Rückversicherung AG, Bahrain Branch, which had received a corresponding licencein June 2007 from the Central Bank of Bahrain (CBB), commenced business operations alongside the already existingsubsidiary Hannover ReTakaful B.S.C. (c), which had been established in 2006.
Effective 1 January 2008 the company name of Hannover Rückversicherung AG Succursale Française pour la RéassuranceVie, a branch of Hannover Re, was changed to Hannover Rückversicherung AG Succursale Française and the object ofits business was expanded to include non-life reinsurance activities for the markets of France, Belgium and Luxembourg.The service company Hannover Re Gestion de Réassurance France S.A. was also merged into the new composite branchwith effect from the same date.
Effective 1 January 2008 Hannover Re and E+S Rück, which were equal partners in GbR Hannover RückversicherungAG/E+S Rückversicherung AG-Grundstücksgesellschaft (GbR), liquidated the company. The partnership assets of GbRwere divided equally between the former partners by way of de facto splitting. The transaction had no implications forthe consolidated financial statement as at 31 December 2008.
With effect from 10 January 2008 the majority interest in Hannover Re has been held in an unchanged amount(50.22%) exclusively by Talanx AG, into which both HDI Verwaltungs-Service GmbH and Zweite HDI Beteiligungs-gesellschaft mbH were merged with legal force on the same date.
In the previous year Hannover Re acquired the 50% stake held by E+S Rück in Hannover Life Re of Australasia Ltd.,Sydney, and thus held all shares in the company; full allowance was made for transaction costs. All intercompany profitsarising out of this transaction were eliminated. Effective 31 March 2008 Hannover Re transferred its shares in thecompany at book value by way of a capital increase for a non-cash contribution to the former Zweite Hannover RückBeteiligung Verwaltungs-GmbH, all shares of which were held by Hannover Re. Effective 1 July 2008 Zweite HannoverRück Beteiligung Verwaltungs-GmbH was converted to Hannover Life Re AG, the registered office of which is in Han-nover. The change in corporate form came into effect upon entry in the commercial register on 7 August 2008.
107
Notes 6.1 Quantitative risk management using the internal capital model
6. Management of technical and financial risks
6.1 Quantitative risk management using the internal capital model
Hannover Re's risk management makes use of appropriate quantitative simulation models. The purpose of risk quanti-fication – using the internal capital model – is inter alia to calculate the risk capital and determine the diversificationeffect. We also use the model to perform scenario analyses.
In determining our capital requirement we proceed on the assumption that an AA rating is equivalent to a defaultprobability of 0.03%. The breakdown of the risk capital is as follows:
Figures in EUR million 2008 2007
Risk
Technical risk in non-life reinsurance 3,559.2 3,593.8
Technical risk in life and health reinsurance 663.2 662.5
Investment risk 1,730.4 1,709.7
Diversification effect 2,415.8 2,356.8
Hannover Re Group 3,537.1 3,609.2
Internal capital model1)
As part of our holistic approach to risk management across all business groups, we take into account numerous relevantscenarios. In addition, we analyse extreme scenarios, determine their effect on key balance sheet variables and perform-ance indicators, evaluate them in relation to the planned figures and identify alternative courses of action.
Market scenarios
Figures in EUR million Effect on forecast shareholders' equity
2008 2007
Rise in the overall interest rate curve, from 200 basis points for the three-month interest rate to 100 basis points for the 10-year interest rate (with a linear interpolation between the two) (480.3) (485.8)
Parallel upward shift in the overall interest rate curve by 100 basis points (423.7) (401.3)
Decline of 35% in equities (6.0) (584.8)
European currency crisis (1992) 1) (295.2) (262.3)
Property crash associated with interest rate rise 1) (492.7) (401.3)
Stock market crash (2000/2001) 1) 4.1 (697.4)
1) Stress associated with the risk factors for these scenarios as specified by the Swiss Solvency Test
1) for the 99.97% VaR
Notes 6.2 Technical risks in non-life reinsurance
108
6.2 Technical risks in non-life reinsurance
The underreserving of claims constitutes a significant technical risk. Loss reserves are determined using actuarial methods,primarily based on information provided by our cedants, and supplemented as necessary by additional reserves estab-lished on the basis of our own loss assessments. Especially in liability business, reserves are also set aside for claims thathave been incurred but not yet reported (IBNR) owing to the long run-off periods for such claims. The additional IBNRreserve established by the Hannover Re Group amounted to EUR 3,236.2 million in the year under review. The IBNR re-serve is calculated on a differentiated basis according to risk categories and regions. All in all, the anticipated ultimateloss ratios are calculated in 76 subsegments. The correct measurement of loss reserves for asbestos- and pollution-relatedclaims is a highly complex matter since decades may elapse between causation of the loss and reporting of the claim.Hannover Re's exposure to asbestos-related claims and pollution damage is comparatively slight. The adequacy ofthese reserves is normally measured using the so-called "survival ratio". This ratio expresses how many years the reserveswould cover if the average level of paid claims over the past three years were to continue. At the end of the year underreview our survival ratio stood at 25.0 years.
Run-off triangles are another tool used to verify our assumptions. Such triangles show the changes over time in thereserves as a consequence of paid claims and in the recalculation of the reserves that are to be established as at eachbalance sheet date. Adequacy is monitored using actuarial methods (cf. here our explanatory remarks on technicalreserves in Section 7.2 "Technical assets and liabilities").
Stress tests for natural catastrophes after retrocessions
Figures in EUR million Effect on forecast net income
2008 2007
100-year loss California earthquake (260.2) (222.9)
Combined and catastrophe loss ratio over the past ten years
1) Based on figures reported in accordance with US GAAP2) Figures from 2006 onwards in accordance with new segmentation3) Natural catastrophes and other man-made major losses > EUR 5 million gross for the share of the Hannover Re Group as a percentage of net premium earned
Figures in EUR million Catastrophe losses and major claims in 2008
Gross Net
Snow- and ice-storm in China, 10 January – 15 February 16.2 16.2
Flooding in Queensland/Australia, 16 – 20 January 7.1 2.3
Flooding in Queensland/Australia, 12 – 16 February 6.4 2.2
Winter storm "Emma", 1 – 2 March 17.8 13.3
Earthquake in China, 12 May 8.4 8.3
Hail in southern Germany ("Hilal"), 28 May – 3 June 55.7 55.2
Flooding in the US, 28 May – 20 June 10.0 7.2
Hailstorms in southern Germany, 22 – 23 June 12.2 12.0
Hailstorms in Slovenia, 15 August 5.4 5.4
Hurricane "Gustav", 29 August – 2 September 24.9 18.1
Hurricane "Ike", 4 – 12 September 392.8 222.1
556.9 362.3
Industrial fire claim in the US, 5 – 6 January 8.1 8.1
Shipping accident in Brazil, 30 January 12.1 4.7
Industrial fire claim in the US, 18 February 10.7 10.7
Industrial fire claim in South Africa, 25 February 5.3 1.0
Industrial fire claim in Korea, 3 March 5.1 5.1
Industrial fire claim in Brazil, 6 March 7.5 3.6
Fraud claim in Japan, 12 March 6.6 6.6
Satellite failure, 15 March 5.2 5.2
Industrial fire claim in the US, 1 June 5.5 5.5
Energy claim in Australia, 3 June 13.2 10.3
Aviation claim in Spain, 20 August 9.6 8.7
Industrial fire claim in France/UK, 11 September 6.3 6.3
Industrial fire claim in Germany, 12 September 8.9 8.9
Industrial fire claim in Italy, 13 October 10.8 10.8
114.9 95.5
Total 671.8 457.8
110
Natural catastrophes and annual aggregate loss
Within the scope of accumulation control for natural catastrophe risks, the Executive Board defines the appetite forassuming natural hazards risks on the basis of the risk strategy derived from the overall corporate strategy. This specifi-cation of the risk appetite takes place once a year and thus constitutes a crucial basis for our underwriting approach inthis segment.
For the purpose of risk limitation, maximum underwriting limits (capacities) are stipulated for various extreme lossscenarios and return periods in light of profitability criteria. Adherence to these limits is constantly monitored by GroupRisk Management. The Risk Committee, Executive Board and the body responsible for managing non-life reinsuranceare regularly updated on the extent to which these capacities are utilised. The limits for the 100- and 250-year aggre-gate annual loss as well as the utilisation thereof were as follows:
Furthermore, we establish the portfolio risk for various scenarios (e.g. hurricanes in the US, windstorms in Europe,earthquakes in the US) in the form of probability distributions. The range of tools used for accumulation control issupplemented by the progressive inclusion of realistic extreme loss scenarios.
Figures in EUR million Limit 2008 Actual utilisation (July 2008)
All natural catastrophe risks, net exposure
100-year aggregate annual loss 864 93%
250-year aggregate annual loss 1.123 91%
As part of a holistic analysis of technical risks, the risk deriving from the accepted new business is considered in additionto the reserving risk. The risk capital for the premium and reserving risk per line of business is set out in the chart below.Risk spreading across lines of business is referred to as diversification. In this way we are able to enhance the efficiencyof the allocated capital while at the same time reducing the required equity resources. Depending upon the capitalrequired by our business segments and lines and their contribution to diversification, we define the cost of capital to begenerated for each business unit.
Diversification effect within the non-life reinsurance business group
46 % Diversification
Effective risk capital required
927
836
377201
347
300
653
134
2,445
�
�
In EUR million 4,559784
Proper
ty ca
tas-
trophe b
usines
s
Germany
Other
USA
Marine
Aviatio
n
Facu
ltativ
e
busines
s
Credit/
sure
ty,
politica
l risk
s
Stru
cture
d
product
sNon-lif
e
reinsu
rance
Risk capital* required per Multi-Specialist line without diversification effect
Corresponding to internal capital modell for the 99.5% VaR
Notes 6.2 Technical risks in non-life reinsurance
111
1) More extensive information is provided in the EEV reports for 2006 and 2007 published on our website. The presentation is based on the principles for publication of the EEVwhich were published for the first time in May 2004 and subsequently further expanded in September 2005 by the CFO Forum, an international organisation of Chief FinancialOfficers from major insurance and reinsurance enterprises
2) Before consolidation, without minority interests3) For contracts in foreign currencies
EEV 2)
Figures in EUR million 2007 2006
EEV (base value) 2,483.9 2,089.5
Interest rate curve -100 basis points -0.8% +0.8%
Fair value of equities and real estate -10% +0.0% -0.1%
Value of local currencies +5%3) -0.7% -0.9%
Costs -10% +0.8% +0.8%
Lapse -10% +0.4% -0.8%
Mortality -5% +7.8% +10.9%
Sensitivity analysis of the European Embedded Value (EEV)1)
The moderate change in the EEV under the scenarios set out above is in line with our expectation and reflects our port-folio's high degree of diversification. The consolidated EEV before minority interests amounted to EUR 1,715.1 million(EUR 1,527.6 million) as at 31 December 2007, an increase of 12.3% (16.3%) compared to the corresponding figurefor the previous year. Regarding the change relative to the previous year, please see our publication "European EmbeddedValue Report 2007". The operating embedded value earnings totalled EUR 280.0 million (EUR 185.6 million), whilethe value of new business stood at EUR 106.4 million (EUR 64.2 million). Leaving aside non-recurring special effects,the development relative to the previous year's figures was in line with our expectations.
6.3 Technical and financial risks in life and health reinsurance
A key tool of our risk management in the area of life and health reinsurance is the European Embedded Value (EEV).The EEV is a ratio used to evaluate life insurance and reinsurance business. It is comprised of the value of in-force busi-ness and the corresponding capital. The value of in-force business is determined as the present value of the futureshareholders' earnings from worldwide life and health reinsurance business after appropriate allowance for all risksunderlying this business. Since the 2006 financial year the EEV has been calculated on a basis that is consistent with themarket. Going forward, the Market Consistent Embedded Value (MCEV) will be determined on the basis of the principlespublished by the CFO Forum in June 2008. The MCEV will be published on our website at the same time as the quarterlyfinancial report on the first quarter of 2009.
Based on the latest available data published on 6 May 2008, the following table shows the EEV and its sensitivity toselected scenarios in comparison with the corresponding figures for the previous year.
6.4 Market risks
The overriding principle guiding our investment strategy is capital preservation while giving adequate consideration to the security, liquidity, mix and spread of the assets. Risks in the investment sector consist primarily of market, credit,spread and liquidity risks. The most significant market price risks are share price, interest rate and currency risks.
The "value at risk" (VaR) is a vital tool used for monitoring and managing market price risks. The VaR is determined onthe basis of historical data, e.g. for the volatility of the fair values and the correlation between risks. As part of thesecalculations a decline in the fair value of our portfolio is simulated with a given probability and within a certain period.The VaR of the Hannover Re Group determined in accordance with these principles specifies the decrease in the fairvalue of our total portfolio that with a probability of 95% will not be exceeded within ten trading days.
Notes 6.4 Market risks
112
The VaR is calculated using a multi-factor model designed by APT (Advanced Portfolio Technologies). The data basisconsists of all asset classes of the investment portfolios. The APT model distinguishes between three different perspec-tives on the expected volatility:
• Total risk: annualised volatility (expected volatility of the portfolio)• Systematic risk: expected volatility (can be explained by model factors)• Specific risk: residual (cannot be explained by model factors)
The model takes into account the following market risk factors:• Interest rate risk• Credit spread risk• Systematic equity risk• Specific equity risk• Commodity risk• Option-specific risk
Time series of selected representative market parameters (equity prices, yield curves, spread curves, exchange rates,commodity prices and macro-economic variables) serve as the database for the APT model. All correlations betweenthese time series are reduced to up to 25 main components, which for their part are by definition linearly independent.All asset positions can be mapped in this multidimensional space. Inexplicable volatilities of individual securities makeup the residual, from which the specific risk of the security is derived.
Normal market scenarios are used to calculate the Value at Risk. In addition, stress tests are conducted in order to beable to map extreme scenarios as well. In this context, the loss potentials are simulated on the basis of already occurredor notional extreme events.
Notes 6.4 Market risks
Value at Risk1) in the Hannover Re Group
1) VaR upper limit according to Hannover Re's investment guidelines: 2.5%
in %
0.95
0.90
0.85
0.80
0.75
0.70
0.65
0.60
0.55
0.50
Jan. 08 Feb. 08 Mar. 08 Apr. 08 May 08 Jun. 08 Jul. 08 Aug. 08 Sep. 08 Oct. 08 Dec. 08Nov. 08
113
In order to monitor interest rate risks and share price risks we also use stress tests that estimate the loss potential underextreme market conditions as well as sensitivity and duration analyses that complement our range of risk managementtools. Interest rate risks refer to an unfavourable change in the value of financial assets held in the portfolio due tochanges in the market interest rate level. Declining market yields lead to increases and rising market yields to decreasesin the fair value of fixed-income securities portfolios. One of the central objectives of our strategy in this regard is tomatch cash flows on the assets and liabilities sides as closely as possible. Quantitative support for this strategy is providedby Hannover Re's internal capital model as well as a broad diversity of value at risk calculations. In addition, tightlydefined tactical duration ranges are in place, within which asset managers can position themselves opportunisticallyaccording to their market expectations. The parameters for these ranges are directly linked to our risk-carrying capacity.
2008 Scenario Portfolio change based on fair value in EUR million
Scenarios for changes in the fair value of our securities
Share price risks derive from unfavourable changes in the value of equities and equity or index derivatives due, forexample, to downward movements on particular stock indices. We spread these risks through systematic diversificationacross various sectors and regions.
2008 Scenario Portfolio change based on fair value in EUR million
Equity securities Share prices +10% 2.3
Share prices +20% 4.5
Share prices -10% (2.3)
Share prices -20% (4.5)
Fair value as at 31.12.2008 22.6
Scenarios for changes in the fair value of our securities
Currency risks are of considerable importance to an internationally operating reinsurance enterprise that writes a sig-nificant proportion of its business in foreign currencies. These risks are, however, largely neutralised since we system-atically adhere to the principle of matching currency coverage.
Further information on the risk concentrations of our investments can be obtained from the tables on the rating structureof fixed-income securities as well as on the currencies in which investments are held. Please see our comments in Section7.1 "Investments including income and expenses".
We use short-call and long-put options as well as swaps to partially hedge portfolios, especially against price, exchangeand interest rate risks. In the year under review we also used derivative financial instruments to optimise our portfolioin light of risk/return considerations. The contracts are concluded solely with first-class counterparties and compliancewith the standards defined in the investment guidelines is strictly controlled in order to avoid risks – especially creditrisks – associated with the use of such transactions.
As a consequence of the crisis on international financial markets we took a number of further risk-minimising measuresin the second half of the year under review. In this regard please see our explanatory remarks on market risks in the riskreport on page 66 et seq.
Notes 6.4 Market risks
114
6.5 Credit risks
Bad debt risks in reinsurance are of relevance to our company because the business that we accept is not always fullyretained, but instead portions are retroceded as necessary. Our retrocession partners are therefore carefully selected inlight of credit considerations. This is also true of our broker relationships, under which risks may occur inter alia throughthe loss of the premium paid by the cedant to the broker or through double payments of claims. The associated risks aretherefore minimised with the aid of a number of mechanisms. For example, all broker relationships are reviewed once ayear with an eye to criteria such as the existence of professional indemnity insurance, payment performance and propercontract implementation.
Hannover Re counters the risk of default on reinsurance recoverables by carefully selecting its partners with the aid ofan expertly staffed Security Committee. The Security Committee continuously monitors the credit status of retro-cessionaires and approves measures where necessary to secure receivables. The Group Protections unit is responsiblefor the Hanover Re Group's ongoing cession management. This process is supported by our "Cession Limits" Web-basedrisk management application. This assists with the Group's cession management by specifying cession limits for the in-dividual retrocessionaires participating in protection cover programmes and determining the capacities still availablefor short-, medium- and long-term business. Depending on the type and expected run-off duration of the reinsured busi-ness, the selection of reinsurers takes account not only of the minimum ratings of the rating agencies Standard & Poor's(S&P) and A. M. Best but also internal and external (e.g. market information from brokers) expert assessments.
The key ratios for management of our bad debt risk are as follows:
• 95.5% of our retrocessionaires have an investment grade rating (AAA to BBB), and 95.3% thereof are rated "A" orbetter.
• Since 2004 we have reduced the level of recoverables by altogether 50.0%.
• 30.3% of our recoverables from reinsurance business are secured by deposits or letters of credit. What is more, for themajority of our retrocessionaires we also function as reinsurer, meaning that in principle recoverables can potentiallybe set off against our own liabilities.
• In terms of the Hannover Re Group's major companies, EUR 290.3 million (10.4%) of our accounts receivable fromreinsurance business totalling EUR 2,801.8 million were older than 90 days as at the balance sheet date.
• The average default rate over the past three years was 0.3%.
Retrocession, that is to say the passing on of portions of our assumed risks, gives rise to claims that we hold against ourretrocessionaires. These reinsurance recoverables – i.e. the reinsurance recoverables on unpaid claims – amounted toEUR 2,079.2 million (EUR 2,471.6 million) as at the balance sheet date.
The following chart shows the development of reinsurance recoverables on unpaid claims:
Notes 6.5 Credit risks
115
Retention as a percentage of gross written premium
in % 2008 2007 2006 20051) 20041)
Hannover Re Group 89.1 87.4 76.3 79.2 77.6
Non-life reinsurance 88.9 85.3 72.4 85.9 83.0
Life and health reinsurance 89.3 90.8 85.4 92.8 90.2
The chart shows the high quality of security backing our reinsurance recoverables. It also provides insight into theratings of our retrocessionaires.
1) Figures for 2004 – 2005 before new segmentation
The ratios shown below constitute further key tools for the monitoring and management of the credit risks associatedwith our entire business operations.
For further remarks on technical and other assets which are unadjusted but considered overdue as at the balance sheetdate as well as on significant unscheduled depreciation taken in the year under review please see Section 7.2 "Technicalassets and liabilities" and Section 7.12 "Other assets and liabilities".
Combined ratio (non-life reinsurance) 95.4% 99.7% 100.8% 112.8% 97.2%
1) (Shareholders' equity + minority interests + hybrid capital)/net written premium2) Hybrid capital/(shareholders' equity + minority interests)3) EBIT/interest on hybrid capital4) Net reserves/net premium earned (Group)
The retention, i.e. the portion of assumed risks that we do not retrocede, developed as follows in recent years:
Notes 6.5 Credit risks
Reinsurance recoverables as at the balance sheet date
Figures in EUR million
0
1,500
4,500
3,000
6,000
7,500
4,163
20042005
2006
Secured
AA
A
<– BBB, NR
AAA4,739
3,048
2007
2,472
-15,9 % p, a,
2008
2,079
116
6.6 Liquidity risks
We counter the liquidity risk by means of regular liquidity planning and a liquid asset structure. In this way we ensurethat Hannover Re is able to make the necessary payments at all times. We manage the liquidity risk inter alia by allocatinga liquidity code to every security. Adherence to the limits defined in our investment guidelines for each liquidity class issubject to daily control. The spread of investments across the various liquidity classes is specified in the monthly invest-ment reports and controlled by limits. The proportion of investment holdings that can be liquidated on any trading daywithout a mark-down was almost 60% as at the balance sheet date, a reflection of the high liquidity of our portfolio.Last but not least, active liquidity management in terms of portfolio regrouping and the continuing high level of diversi-fication has helped us to safeguard our unqualified ability to meet our payment obligations at all times in periods offinancial crisis.
On a fair value basis EUR 2,482.9 million of the corporate bonds held by our company were issued by entities in thefinancial sector. Of this amount, EUR 1,749.5 million was attributable to banks. The vast majority of these bank bonds(almost 90%) were rated "A" or better.
Against the backdrop of the US real estate crisis and credit crunch, it should be noted that our investment portfoliodoes not contain any directly written credit derivatives. We did not write any off-balance sheet risks through structuredtransactions with special purpose entities. Of our total portfolio of asset-backed securities, more than 88% were attrib-utable to mortgage bonds, municipal bonds and collateralised debt obligations as at the balance sheet date, 5% werecomprised of commercial mortgage-backed securities and 4% consisted of residential mortgage-backed securities.
The latter items, which also encompass lower-quality mortgage loans, had a fair value of altogether EUR 31.0 million as at the balance sheet date; the underlyings for these securities were in part subprime assets. The write-downs takenon this portfolio amounted to EUR 15.7 million. Similarly, the value adjustments prompted by insolvencies at financialinstitutions remained within comparatively modest bounds. The failures of Lehman Brothers, Washington Mutual andBradford & Bingley caused write-downs of EUR 28.1 million. Of this amount, EUR 25.6 million was apportionable tofixed-income securities and EUR 2.5 million to equity and equity-related securities.
In addition, we would refer the reader to our comments in the risk report on risk-minimising measures taken as a conse-quence of the crisis on international financial markets on page 66 et seq.
Rating structure of our fixed-income securities1)
Government bonds Securities issued by semi-governmental entities Corporate bonds Asset-backed securities
in % in EUR million in % in EUR million in % in EUR million in % in EUR million
Total 100.0 5.613.0 100.0 4,614.2 100.0 4,652.7 100.0 3,013.5
1) Securities held through investment funds are recognised pro rata with their corresponding individual ratings
Credit risks from investments may arise out of a failure to pay (interest and/or capital repayment) or change in thecredit status (rating downgrade) of issuers of securities. We attach vital importance to credit assessment conducted onthe basis of the quality criteria set out in the investment guidelines.
Notes 6.6 Liquidity risks
117
in % Parameter as per investment guidelines 2008 2007
Bonds (direct holdings and investment funds) At least 50.0 89.0 79.1
Listed equities (direct holdings and investment funds) At most 17.5 0.1 10.1
Real estate At most 5.0 0.1 0.1
Weighting of major asset classes1)
1) Calculated on a fair value basis
For basic qualitative statements, e.g. regarding organisation of our risk management or assessment of the risk situation,please see the risk report contained in the management report.
Notes 7.1 Investments including income and expenses
7. Notes on the individual items of the balance sheet and statement of income
7.1 Investments including income and expenses
Investments are classified and measured in accordance with IAS 39 "Financial Instruments: Recognition and Measure-ment".
Hannover Re classifies investments according to the following categories: held-to-maturity, loans and receivables,financial assets at fair value through profit or loss and available-for-sale. The allocation and measurement of invest-ments are determined by the investment intent.
The investments also encompass investments in associated companies, own-use real estate, investment property, otherinvested assets, short-term investments, cash and funds held/contract deposits.
In the case of financial assets that are not traded on an active market, the fair value is determined using a measure-ment method (e.g. effective interest rate method). The value determined in this way at time of acquisition can, however,diverge from the actual cost of acquisition. The resulting measurement difference constitutes a theoretical "day-oneprofit/loss". As at the balance sheet date this produced only an insignificant loss.
For further explanation please see Section 3.2 "Summary of major accounting policies".
118
Notes 7.1 Investments including income and expenses
Maturities of the fixed-income and variable-yield securities
1) Including accrued interest2) Including short-term investments and cash
Figures in EUR thousand 2008 2007
Cost or amortised
cost1)Fair value
Cost or amortised
costFair value
Held to maturity
Due in one year 12,087 9,803 34,241 32,885
Due after one through two years 29,736 30,260 1,705 1,662
Due after two through three years 197,804 206,450 34,779 34,363
Due after three through four years 255,693 267,561 194,052 195,724
Due after four through five years 297,477 304,497 251,385 254,908
Due after five through ten years 673,498 728,460 962,695 966,897
Due after ten years 8,907 8,978 9,959 10,396
Total 1,475,202 1,556,009 1,488,816 1,496,835
Loans and receivables
Due in one year 71,859 72,140 32,710 33,086
Due after one through two years 136,024 136,654 68,132 67,068
Due after two through three years 82,013 83,086 131,788 127,981
Due after three through four years 9,898 9,873 113,524 109,759
Due after four through five years 198,037 203,531 19,496 19,417
Due after five through ten years 970,241 996,374 1,037,707 1,002,324
Due after ten years 212,785 209,757 134,532 136,201
Total 1,680,857 1,711,415 1,537,889 1,495,836
Available for sale
Due in one year 2) 3,496,170 3,473,225 2,921,871 2,917,572
Due after one through two years 1,947,238 1,966,672 1,407,784 1,403,733
Due after two through three years 1,725,197 1,751,528 1,214,907 1,196,631
Due after three through four years 1,217,321 1,239,933 1,273,380 1,276,467
Due after four through five years 1,867,138 1,933,328 1,377,471 1,372,244
Due after five through ten years 4,021,163 4,059,484 3,854,813 3,813,167
Due after ten years 1,344,802 1,296,606 1,796,485 1,763,484
Total 15,619,029 15,720,776 13,846,711 13,743,298
Financial assets at fair value through profit or loss
Due in one year 68,553 65,907 66,784 66,784
Due after one through two years 4,788 4,991 29,087 29,087
Due after two through three years 71,132 70,476 – –
Due after three through four years 641 626 – –
Due after four through five years 56,687 58,560 – –
Due after five through ten years 34,675 34,529 34,133 35,089
Due after ten years 23,373 19,439 27,187 27,780
Total 259,849 254,528 157,191 158,740
119
Notes 7.1 Investments including income and expenses
The stated maturities may in individual cases diverge from the contractual maturities because borrowers may have theright to call or prepay obligations with or without penalty.
Variable-rate bonds (so-called "floaters") are shown under the maturities due in one year and constitute our interest-related, within-the-year reinvestment risk.
Figures in EUR thousand 2008
Cost or amortised
cost gains lossesAccrued interest
Fair value
Investments held to maturity
Fixed-income securities
Government debt securities of EU member states 41,342 3,181 – 641 45,164
US treasury notes 341,902 64,196 – 2,775 408,873
Other foreign government debt securities 14,268 969 – 22 15,259
Amortised cost, unrealised gains and losses and accrued interest on the portfolio of investments classified as held to maturity as well as their fair value
Unrealised
Figures in EUR thousand 2007
Cost or amortised
cost gains lossesAccrued interest
Fair value
Investments held to maturity
Fixed-income securities
Government debt securities of EU member states 49,589 – 827 760 49,522
US treasury notes 322,776 20,604 – 2,628 346,008
Other foreign government debt securities 18,315 121 52 26 18,410
From investment funds 179,356 11,663 45,963 – 145,056
14,143,126 477,173 375,502 238,035 14,482,832
Equity securities
Shares 19,711 1,830 734 – 20,807
From investment funds 1,897 82 197 – 1,782
21,608 1,912 931 – 22,589
Short-term investments 806,718 76 – 925 807,719
Total 14,971,452 479,161 376,433 238,960 15,313,140
121
Notes 7.1 Investments including income and expenses
Amortised cost, unrealised gains and losses and accrued interest on the portfolio of investments classified as available for sale as well as their fair value
Unrealised
The carrying amounts of the fixed-income securities and equity securities classified as available for sale as well as theshort-term investments allocated to this category correspond to their fair values including accrued interest.
122
Notes 7.1 Investments including income and expenses
Figures in EUR thousand 2007
Cost or amortised
cost gains lossesAccrued interest
Fair value
Available for sale
Fixed-income securities
Government debt securities of EU member states 901,704 4,112 5,851 16,732 916,697
US treasury notes 1,526,131 46,316 175 17,660 1,589,932
Other foreign government debt securities 376,357 2,266 2,471 3,265 379,417
From investment funds 842,933 13,547 45,534 8,111 819,057
12,382,761 148,855 252,268 197,707 12,477,055
Equity securities
Shares 701,961 84,757 23,583 – 763,135
From investment funds 1,107,388 129,867 – – 1,237,255
1,809,349 214,624 23,583 – 2,000,390
Short-term investments 929,976 – – 845 930,821
Total 15,122,086 363,479 275,851 198,552 15,408,266
Amortised cost, unrealised gains and losses and accrued interest on the portfolio of investments classified as available for sale as well as their fair value
123
Notes 7.1 Investments including income and expenses
Fair value of financial assets at fair value through profit or loss before and after accrued interest as well as accrued interest on such financial assets
The carrying amounts of the financial assets allocated to this category correspond to their fair values including accruedinterest.
Figures in EUR thousand 2008
Fair value before accrued
interest
Accrued interest
Fair value
Financial assets at fair value through profit or loss
Fixed-income securities
Other foreign government debt securities 2,577 – 2,577
Debt securities of semi-governmental entities 7,767 332 8,099
Corporate securities 176,237 3,730 179,967
Asset-backed securities 63,880 5 63,885
250,461 4,067 254,528
Other financial assets
Derivatives 44,654 – 44,654
44,654 – 44,654
Total 295,115 4,067 299,182
Figures in EUR thousand 2007
Fair value before accrued
interest
Accrued interest
Fair value
Financial assets at fair value through profit or loss
Fixed-income securities
Debt securities of semi-governmental entities 9,844 331 10,175
Corporate securities 146,280 1,631 147,911
Asset-backed securities 654 – 654
156,778 1,962 158,740
Other financial assets
Derivatives 20,385 – 20,385
20,385 – 20,385
Total 177,163 1,962 179,125
124
Under financial assets at fair value through profit or loss Hannover Re recognised as at the balance sheet date thederivative financial instruments originally allocated to this item in an amount of EUR 44.7 million (EUR 20.4 million) as well as fixed-income securities amounting to EUR 254.5 million (EUR 158.7 million) designated in this category. The growth in the portfolio of fixed-income securities at fair value through profit or loss in an amount of EUR 95.8 millionderived largely from the commencement of investment activities in the year under review by two Group companieswhose business object is to build, hold and manage portfolios of insurance-linked securities. Analysis of the portfolioindicated that the changes in the fair value of these financial assets were not due to changes in their rating.
We additionally use an internal rating method to back up this analysis. Our internal rating system is based on the corres-ponding credit ratings of securities assigned by the agencies Standard & Poor's and Moody's and in each case reflectsthe lowest of the available ratings.
For further information please see the explanatory remarks on derivative financial instruments in this section.
Notes 7.1 Investments including income and expenses
Figures in EUR thousand 2008 2007
Real estate 1,460 1,653
Dividends 43,333 40,656
Interest income on investments 736,629 759,187
Other income 48,364 57,524
Ordinary investment income 829,786 859,020
Profit or loss on shares in associated companies 4,199 11,028
Realised gains on investments 379,202 244,046
Realised losses on investments 492,756 69,735
Unrealised gains and losses on investments (119,718) (18,771)
Impairments/depreciation on real estate 514 545
Impairments on equity securities 356,052 34,242
Impairments on fixed-income securities 96,941 26,603
Impairments on participating interests and other financial assets 26,913 10,592
Other investment expenses 41,421 51,968
Net income from assets under own management 78,872 901,638
Interest income on funds withheld and contract deposits 336,554 259,921
Interest expense on funds withheld and contract deposits 136,967 39,813
Total investment income 278,459 1,121,746
Investment income
125
Carrying amounts before impairment
The unscheduled impairments of EUR 479.9 million (EUR 71.4 million) were predominantly attributable to assets clas-sified as available for sale. Of the impairments taken on fixed-income securities of EUR 96.9 million (EUR 26.6 million),an amount of EUR 15.7 million (EUR 9.6 million) related to structured products connected with the crisis on the UShousing market in respect of which Hannover Re identified a risk of default. The impairments on fixed-income securitieswere taken largely on structured assets and determined on the basis of a case-by-case analysis. In this context consider-ation was given not only to pure changes in the fair value of the securities, but also to qualitative criteria. The fair valueof the underlying instruments totalled EUR 77.7 million (EUR 66.8 million) as at 31 December 2008. They accountedfor accrued interest of EUR 0.5 million (EUR 0.1 million) as at the balance sheet date. In addition, an impairment loss ofEUR 356.1 million (EUR 34.2 million) was recognised on equities whose fair value had fallen significantly or for a pro-longed period below acquisition cost. The portfolio did not contain any overdue, unadjusted assets as at the balancesheet date since overdue securities are written down immediately.
For further explanatory remarks on the impairment criteria please see Section 3.2 "Summary of major accounting policies".
Notes 7.1 Investments including income and expenses
Fixed-income securities – held to maturity 1,475,202 – 1,488,816 –
Fixed-income securities – loans and receivables 1,680,857 – 1,537,889 –
Fixed-income securities – available for sale 14,579,773 96,941 12,503,658 26,603
Equity securities – available for sale 378,641 356,052 2,034,632 34,242
Participating interests and other invested assets 811,334 26,913 688,549 10,592
Total 18,925,807 479,906 18,253,544 71,437
Figures in EUR thousand 2008 2007
Fixed-income securities – held to maturity 59,748 66,680
Fixed-income securities – loans and receivables 52,749 45,898
Fixed-income securities – available for sale 551,848 558,477
Financial assets – at fair value through profit or loss 8,808 12,284
Other 63,476 75,848
Total 736,629 759,187
Interest income on investments
126
The net gains and losses on investments held to maturity, loans and receivables and the available-for-sale portfolioshown in the following table are composed of interest income, realised gains and losses and impairments. In the case ofthe fixed-income securities at fair value through profit or loss designated in this category and the other financial assets,which include the technical derivatives, changes in unrealised gains and losses are also recognised.
Making allowance for the other investment expenses of EUR 41.4 million (EUR 52.0 million), net income from assetsunder own management of altogether EUR 78.9 million (EUR 901.6 million) was recognised in the year under review.
Notes 7.1 Investments including income and expenses
Net gains and losses on investments
Figures in EUR thousand 2008
Ordinaryinvestment
income1)
Realised gains and losses Impairments Unrealised gains
Total investments and cash 775,600 453,964 8,855,332 1,323,556 86,415 7,637,135 270,972 412,302 19,815,276
130
Derivative financial instruments
Derivatives are financial instruments, the fair value of which is derived from an underlying instrument such as equities,bonds, indices or currencies. We use derivative financial instruments to a limited extent in order to hedge parts of ourportfolio against interest rate and market price risks, optimise returns or realise intentions to buy/sell. In this contextwe take special care to limit the risks, select first-class counterparties and adhere strictly to the standards defined byinvestment guidelines.
The fair values of the derivative financial instruments were determined on the basis of the market information availableat the balance sheet date and using the effective interest rate method. If the underlying transaction and the derivativeare not carried as one unit, the derivative is recognised under other financial assets at fair value through profit or loss or under the other liabilities.
In the course of the year put options and short positions on call options were entered into on stock indices. All positionswere liquidated by no later than November 2008. The transactions gave rise to realised gains of EUR 85.1 million.
Derivative financial instruments in connection with reinsuranceA small number of treaties in life and health reinsurance meet criteria which require application of the prescriptions inIFRS 4.7 to 4.9 governing embedded derivatives. These accounting regulations require that certain derivatives embeddedin reinsurance contracts be separated from the underlying insurance contract ("host contract"), reported separately atfair value in accordance with IAS 39 and recognised under investments. Fluctuations in the fair value of the derivativecomponents are to be recognised in income in subsequent periods.
Within the scope of the accounting of "modified coinsurance" and "coinsurance funds withheld" (Modco) reinsurancetreaties, under which securities deposits are held by the ceding companies and payments rendered on the basis of theincome from certain securities of the ceding company, the interest-rate risk elements are clearly and closely related tothe underlying reinsurance arrangements. Embedded derivatives consequently result solely from the credit risk of theunderlying securities portfolio.
Hannover Re calculates the fair value of the embedded derivatives in Modco treaties using the market informationavailable on the valuation date on the basis of a "credit spread" method. Under this method the derivative is valued atzero on the date when the contract commences and its value then fluctuates over time according to changes in thecredit spreads of the securities. The derivative had a negative value of EUR 89.1 million (EUR 13.0 million) as at thebalance sheet date and was recognised under other liabilities. The charge to investment income from the derivativeamounted to altogether EUR 72.1 million (EUR 20.0 million) before tax as at the balance sheet date. This developmentcan be attributed principally to the sustained widening of the credit spreads in the year under review – especially in the fourth quarter.
The derivative components of another group of contracts in the area of life and health reinsurance were measured onthe basis of stochastic considerations. The measurement produced a positive derivative value of EUR 11.1 million (EUR 12.7 million) on the balance sheet date. The derivative was recognised under other financial assets at fair valuethrough profit or loss. The valuation resulted in a charge against investment income of EUR 1.5 million (EUR 0.7 million)as at 31 December 2008.
Pursuant to IAS 39.9 the "Eurus" transaction gives rise to a derivative, the fair value of which as at 31 December 2008was EUR 3.9 million (-EUR 2.9 million) and which we recognised under other financial assets at fair value through profitor loss as at the balance sheet date. Measurement resulted in an improvement of EUR 6.9 million in investment income(previous year: charge to investment income of EUR 3.0 million) in the year under review. We would refer the reader tothe explanatory remarks in Section 4 "Consolidated companies and consolidation principles" regarding thesecuritisation of reinsurance risks.
Notes 7.1 Investments including income and expenses
131
Investments in associated companies
Associated companies
Public price listings are not available for companies valued at equity. The net book value of associated companiesincludes goodwill in the amount of EUR 17.9 million (EUR 21.6 million). For further details of our major participatinginterests please see Section 4 "Consolidated companies and consolidation principles".
The recognised disposals of EUR 28.5 million include the sale of ITAS Assicurazioni S.p.A., Trento, Italy. In this regardand for further information on our major participating interests please see Section 5 "Major acquisitions, new formationsand other corporate changes".
The "Merlin" transaction also gives rise to a derivative, the fair value of which as at the balance sheet date was EUR29.6 million (EUR 5.8 million) and which we recognised under other financial assets at fair value through profit or loss.Measurement of this derivative resulted in an increase in investment income of EUR 23.8 million (EUR 5.8 million) inthe year under review. We would refer the reader to the explanatory remarks in Section 4 "Consolidated companies andconsolidation principles" regarding the securitisation of reinsurance risks.
All in all, application of the standards governing the carrying of derivatives in connection with the technical accountled to recognition of assets totalling EUR 44.7 million (EUR 18.5 million) as well as recognition of liabilities from thederivatives resulting from technical items in an amount of EUR 91.2 million (EUR 15.9 million) as at the balance sheetdate. Increases in investment income amounting to EUR 30.7 million (EUR 5.8 million) as well as charges to income ofEUR 76.7 million (EUR 23.7 million) were brought to account from derivatives in connection with the technical accountin the year under review.
Notes 7.1 Investments including income and expenses
Figures in EUR thousand 2008 2007
Net book value at 31 December of the previous year 170,839 166,646
Currency translation at 1 January (756) (271)
Balance at 1 January of the year under review 170,083 166,375
Additions 356 –
Disposals 28,545 94
Adjustment recognised in income (11,412) 3,819
Adjustment recognised outside income (1,962) 743
Currency translation at 31 December 160 (4)
Net book value at 31 December of the year under review 128,680 170,839
132
Real estate
Real estate is divided into real estate for own use and third-party use (investment property). The real estate in theportfolio which is used to generate income is shown under the investments. Real estate is valued at cost of acquisitionless scheduled depreciation with useful lives of at most 50 years. Own-use real estate is recognised under other assets.
Income and expenses from rental agreements are included in the investment income.
In addition, we held indirect real estate investments for the first time in the year under review in an amount of EUR3.9 million.
The fair value of investment property amounted to EUR 23.9 million (EUR 21.3 million) as at the balance sheet date.The market value of the real estate was determined using the discounted cash flow method.
Other invested assets
The other invested assets consisted largely of participating interests in partnerships measured at fair value in anamount of EUR 622.6 million (EUR 528.2 million). The amortised cost of these participations amounted to EUR 504.6million (EUR 385.2 million); in addition, unrealised gains of EUR 135.8 million (EUR 155.1 million) and unrealisedlosses of EUR 17.8 million (EUR 12.1 million) were recognised from these participations.
Development of investment property
Notes 7.1 Investments including income and expenses
Figures in EUR thousand 2008 2007
Gross book value at 31 December of the previous year 41,370 42,215
Currency translation at 1 January 431 (957)
Gross book value after currency translation at 1 January of the year under review 41,801 41,258
Additions 7,028 166
Disposals – 58
Reclassification (3,571) –
Currency translation at 31 December – 4
Gross book value at 31 December of the year under review 45,258 41,370
Cumulative depreciation at 31 December of the previous year 24,408 24,236
Currency translation at 1 January 148 (302)
Cumulative depreciation after currency translation at 1 January of the year under review 24,556 23,934
Depreciation
scheduled 514 545
Disposals – 57
Reclassification (1,444) –
Currency translation at 31 December 14 (14)
Cumulative depreciation at 31 December of the year under review 23,640 24,408
Net book value at 31 December of the previous year 16,962 17,979
Net book value at 1 January of the year under review 17,245 17,324
Net book value at 31 December of the year under review 21,618 16,962
133
Short-term investments
This item comprises investments with a maturity of up to one year.
7.2 Technical assets and liabilities
Technical assetsThe retrocessionaires' portions of the technical provisions are based on the contractual agreements of the underlyingreinsurance treaties. For further details please refer to our comments on the technical provisions in this section as wellas to the explanatory remarks in Section 6 "Management of technical and financial risks".
SFAS 60 "Accounting and Reporting by Insurance Enterprises" requires that acquisition costs be capitalised as assetsand amortised via the statement of income in proportion to the earned premium.
In the case of reinsurance treaties for unit-linked life insurance policies classified as "universal life-type contracts"pursuant to SFAS 97, the capitalised acquisition costs are amortised on the basis of the estimated gross profit marginsfrom the reinsurance treaties, making allowance for the period of the insurance contracts. A discount rate based on the interest for medium-term government bonds was applied to such contracts. In the case of annuity policies with asingle premium payment, these values refer to the expected policy period or period of annuity payment.
In life and health reinsurance the deferred acquisition costs associated with life and annuity policies with regular premiumpayments are determined in light of the period of the contracts, the expected surrenders, the lapse expectancies andthe anticipated interest income.
In non-life reinsurance acquisition costs directly connected with the acquisition or renewal of contracts are deferred forthe unearned portion of the premium.
Notes 7.2 Technical assets and liabilities
Figures in EUR thousand 2008 2007
Net book value at 31 December of the previous year 1,807,143 1,980,102
Currency translation at 1 January (100,923) (94,434)
Balance at 1 January of the year under review 1,706,220 1,885,668
Changes in consolidated group (77) –
Additions 538,673 408,643
Amortisations 411,062 491,650
Portfolio entries/exits 12,551 (128)
Currency translation at 31 December 14,478 4,610
Net book value at 31 December of the year under review 1,860,783 1,807,143
Development of deferred acquisition costs
134
Age structure of overdue accounts receivable
Within the scope of our management of receivables we expect to receive payment of accounts receivable within threemonths of the date of creation of the debit entry – a period for which we also make allowance in our risk analysis.Please see our comments in Section 6.5 "Credit risks".
The default risks associated with accounts receivable under reinsurance business are determined and recognised on thebasis of case-by-case analysis.
The value adjustments on accounts receivable that we recognise in adjustment accounts changed as follows in the yearunder review:
Figures in EUR thousand 2008 2007
Three months to one year
More than one year
Three months to one year
More than one year
Accounts receivable 55,986 79,077 92,345 64,535
Value adjustments on accounts receivable
In addition, we took specific value adjustments on reinsurance recoverables on unpaid claims in the year under review.We would refer the reader to the corresponding remarks on the loss and loss adjustment expense reserve in this section.
With regard to the credit risks resulting from technical assets we would also refer the reader to our comments in Section 6"Management of technical and financial risks".
For further explanatory remarks please see Section 3.2 "Summary of major accounting policies".
The age structure of the accounts receivable which were unadjusted but considered overdue as at the balance sheetdate is presented below:
Notes 7.2 Technical assets and liabilities
Figures in EUR thousand 2008 2007
Changes in value adjustments
Cumulative value adjustments at 31 December of the previous year 127,733 76,626
Currency translation (2,011) 5,839
Cumulative value adjustments after currency translation 129,744 70,787
Value adjustments in the year under review 46,949 52,534
Write-ups 26,203 18,709
Allocation/reversal (24,917) 23,121
Cumulative value adjustments at 31 December of the year under review 125,573 127,733
Gross book value of accounts receivable at 31 December of the year under review 2,927,335 2,653,604
Value adjustments 125,573 127,733
Net book value of accounts receivable at 31 December of the year under review 2,801,762 2,525,871
135
Notes 7.2 Technical assets and liabilities
Technical reserves
In order to show the net technical provisions remaining in the retention the following table compares the gross provisionswith the corresponding retrocessionaires' shares shown as assets.
Technical provisions
The loss and loss adjustment expense reserves are in principle calculated on the basis of the information supplied byceding companies. Additional IBNR reserves are established for losses that have been incurred but not as yet reported.
Technical provisions were discounted at interest rates of between 6.5% and 8.5% (6.5% and 8.2%) with respect to acertain group of contracts relating to the Hannover Re Advanced Solutions division. The interest rates are determinedby the contractual agreements. The period from inception to expiry of such contracts is at least four years. The discountedamount totalled EUR 0.2 million (EUR 3.3 million). The discounted provisions as at year-end 2008 amounted to EUR4.2 million (EUR 25.9 million).
Figures in EUR thousand 2008 2007
Gross Retro Net Gross Retro Net
Loss and loss adjustment expense reserve 16,932,069 2,079,168 14,852,901 16,553,888 2,471,585 14,082,303
Other technical provisions 156,996 9,928 147,068 183,725 5,574 178,151
Total 24,335,996 2,277,980 22,058,016 24,067,455 2,824,557 21,242,898
136
Loss and loss adjustment expense reserve
In the year under review specific value adjustments on retrocessions, i.e. on the reinsurance recoverables on unpaidclaims, were on balance established in an amount of EUR 20.2 million (previous year: reversal of EUR 27.1 million).Consequently, cumulative specific value adjustments of EUR 46.7 million (EUR 26.4 million) were recognised in thesereinsurance recoverables as at the balance sheet date.
The total amount of the net reserve before specific value adjustments, to which the following remarks apply, was EUR 14,806.2 million (EUR 14,055.9 million) as at the balance sheet date.
1) Including expenses recognised directly in shareholders' equity
Notes 7.2 Technical assets and liabilities
Figures in EUR thousand 2008 2007
Gross Retro Net Gross Retro Net
Net book value at 31 December of the previous year 16,553,888 2,471,585 14,082,303 17,596,325 3,048,496 14,547,829
Currency translation at 1 January (84,534) 44,227 (128,761) (1,189,614) (265,602) (924,012)
Reserve at 1 January of the year under review 16,469,354 2,515,812 13,953,542 16,406,711 2,782,894 13,623,817
Incurred claims and claims expenses(net)1)
Year under review 4,039,386 451,563 3,587,823 3,704,393 329,803 3,374,590
Previous years 1,202,333 65,689 1,136,644 2,065,334 421,135 1,644,199
The development of the loss and loss adjustment expense reserve is shown in the following table. Commencing withthe gross reserve, the change in the reserve after deduction of the reinsurers' portions is shown in the year under reviewand the previous year.
137
Notes 7.2 Technical assets and liabilities
The table below shows the net loss reserve (loss and loss adjustment expense reserve) for non-life reinsurance in theyears 1998 to 2008 as well as the run-off of the reserve (so-called run-off triangle).
To some extent the loss and loss adjustment expense reserves are inevitably based upon estimations that entail anelement of uncertainty. The difference between the previous year's and current estimates is reflected in the net run-offresult. In addition, owing to the fact that the period of some reinsurance treaties is not the calendar year or becausethey are concluded on an underwriting-year basis, it is frequently impossible in reinsurance business to make an exactallocation of claims expenditures to the current financial year and the previous year. Consequently, the development of earlier years – and especially the immediately preceding year – may be distorted. In our assessment, therefore, in-formative analyses can only be performed after the elapse of at least two years.
The development of the euro relative to the most relevant foreign currencies is also a significant influencing factor inthis context. In particular, despite the opposing effects of other major foreign currencies, the appreciation of +5.0% inthe US dollar against the euro compared to the previous year led to a slight increase in the loss and loss adjustmentexpense reserve on a euro basis.
The run-off triangles show the run-off of the reserve established as at each balance sheet date, this reserve comprisingthe provisions constituted in each case for the current and preceding occurrence years. The run-off of the reserve forindividual occurrence years is not shown in this regard, but rather the run-off of the reserve constituted annually in thebalance sheet as at the balance sheet date.
138
Net loss reserve and its run-off
Figures in EUR million199831.12.
199931.12.
200031.12.
200131.12.
200231.12.
200331.12.
200431.12.
200531.12.
200631.12.
200731.12.
200831.12.
Loss and loss adjustmentexpense reserve (from balance sheet) 5,913.1 7,012.5 8,482.0 12,182.7 12,863.4 13,462.2 13,120.7 14,295.9 13,279.8 12,718.2 13,354.1
Cumulative payments for the year in question and previous years
One year later 1,448.3 1,583.3 2,108.2 2,242.2 2,118.1 3,622.7 4,495.8 3,051.1 2,664.8 2,476.2
Two years later 2,230.6 2,497.7 3,111.9 3,775.1 5,024.4 7,322.2 6,611.0 5,072.2 4,389.8
Three years later 2,711.7 3,226.2 4,174.2 6,032.1 7,764.8 8,780.2 7,590.1 6,204.5
Four years later 3,186.5 3,897.6 5,745.1 8,588.5 8,909.0 9,518.8 8,356.3
Five years later 3,561.1 5,119.7 7,581.3 9,399.8 9,467.1 10,101.6
Six years later 4,341.1 6,146.0 8,114.1 9,786.1 9,896.7
Seven years later 4,816.5 6,509.9 8,405.2 10,122.4
Eight years later 5,122.7 6,785.1 8,610.9
Nine years later 5,311.4 6,915.0
Ten years later 5,409.6
Loss and loss adjustment expense reserve (net) for the year in question and previous years plus payments made to date on the original reserve
End of year 5,913.1 7,012.5 8,482.0 12,182.7 12,863.4 13,462.2 13,120.7 14,295.9 13,279.8 12,718.2 13,354.1
One year later 6,363.0 7,525.6 9,421.6 11,604.4 11,742.7 13,635.5 14,433.1 13,074.2 12,365.8 12,171.4
Two years later 6,539.5 7,750.5 8,878.0 10,477.4 11,844.8 14,236.6 13,532.6 12,366.0 11,868.5
Three years later 6,512.1 7,311.6 8,186.1 10,743.8 12,373.3 13,596.5 13,061.2 11,977.1
Four years later 6,232.7 6,769.4 8,354.1 11,543.6 11,730.7 13,307.4 12,770.8
Five years later 5,772.0 6,820.9 9,102.6 11,051.2 11,666.2 13,122.5
Six years later 5,694.2 7,368.0 8,755.6 11,164.1 11,686.0
Seven years later 6,036.4 7,142.1 8,864.3 11,219.1
Eight years later 5,841.2 7,212.2 8,935.7
Nine years later 5,860.7 7,267.8
Ten years later 5,901.8
Net run-off result of the loss reserve (41.1) (55.6) (71.4) (55.0) (19.9) 184.9 290.4 388.9 497.9 546.7
Of which currency exchangerate differences (13.0) (19.1) (17.1) 27.8 30.8 10.4 (1.9) 14.6 33.1 24.5
Net run-off result excluding cur-rency exchange rate differences (54.0) (74.7) (88.5) (27.1) 10.9 195.3 288.5 403.5 530.9 571.3
As percentage of original loss reserve (0.9) (1.0) (1.0) (0.2) 0.1 1.5 2.2 3.3 4.3 4.5
Notes 7.2 Technical assets and liabilities
139
Duration of the technical reserves
IFRS 4.38 in conjunction with 4.39(d) requires information which helps to clarify the amount and timing of cash flowsexpected from reinsurance contracts. In the following tables we have shown the future maturities of the technical re-serves and broken them down by the expected remaining durations. As part of our duration analysis we have directlydeducted the deposits put up as security for these reserves, since the cash inflows and outflows from these deposits areto be allocated directly to the ceding companies. For further explanation of the recognition and measurement of thereserves please see Section 3.2 "Summary of major accounting policies".
Maturities of the technical reserves
Notes 7.2 Technical assets and liabilities
Figures in EUR thousand 2008
Loss and loss adjustment expense reserves Benefit reserve
Gross Retro Net Gross Retro Net
Due in one year 4,550,519 632,338 3,918,181 140,488 2,335 138,153
Due after one through five years 6,548,143 871,076 5,677,067 211,262 35,046 176,216
Due after five through ten years 2,346,469 243,109 2,103,360 308,077 2,154 305,923
Due after ten through twenty years 1,869,407 190,691 1,678,716 481,841 4,403 477,438
Due after twenty years 985,265 54,036 931,229 423,293 3,182 420,111
Total 16,553,888 2,498,024 14,055,864 6,143,460 255,076 5,888,384
140
The average duration of the loss and loss adjustment expense reserves was 5.5 years (6.1 years), or 5.7 years (6.4 years)after allowance for the corresponding retrocession shares. The benefit reserve had an average duration of 14.2 years(13.2 years) – or 14.4 years (13.3 years) on a net basis.
The average duration of the reserves is determined using actuarial projections of the expected future payments. A pay-ment pattern is calculated for each homogenous category of our portfolio – making allowance for the business sector,geographical considerations, treaty type and the type of reinsurance – and applied to the outstanding liabilities foreach underwriting year and run-off status.
The payment patterns are determined with the aid of actuarial estimation methods and adjusted to reflect changes inpayment behaviour and outside influences. The calculations can also be distorted by major losses, and these are there-fore considered separately using reference samples or similar losses. The payment patterns used can be compared yearfor year by contrasting the projected payments with the actual amounts realised.
Liabilities in liability and motor reinsurance traditionally have long durations, sometimes in excess of 20 years, whileliabilities in property business are settled within the first ten years.
The benefit reserve is established for life, annuity, personal accident and health reinsurance contracts. Based on theduration of these contracts, long-term reserves are constituted for life and annuity policies and predominantly short-term reserves are set aside for health and personal accident business.
The benefit reserve is calculated on the basis of the following parameters:
1. interest income;2. lapse rates;3. mortality and morbidity rates.
The values for the first two components differ according to the country concerned, product type, investment year etc.The mortality and morbidity rates used are chosen on the basis of national tables and the insurance industry standard.Empirical values for the reinsured portfolio, where available, are also taken into consideration. In this context insightsinto the gender, age and smoker structure are incorporated into the calculations, and allowance is also made for factorssuch as product type, sales channel and the frequency of premium payment by policyholders.
At the inception of every reinsurance contract, assumptions about the three parameters are made and locked in for thepurpose of calculating the benefit reserve. At the same time, safety / fluctuation loadings are built into each of thesecomponents. In order to ensure at all times that the originally chosen assumptions continue to be adequate throughoutthe contract, checks are made on a regular – normally annual – basis in order to determine whether these assumptionsneed to be adjusted ("unlocked').
Notes 7.2 Technical assets and liabilities
141
The benefit reserve is established in accordance with the principles set out in SFAS 60. The provisions are based on theGroup companies' information regarding mortality, interest and lapse rates.
Development of the benefit reserve
The unearned premium reserve derives from the deferral of ceded reinsurance premium. The unearned premium isdetermined by the period during which the risk is carried and established in accordance with the information suppliedby ceding companies. In cases where no information was received, the unearned premium was estimated using suitablemethods. Premium paid for periods subsequent to the date of the balance sheet was deferred from recognition withinthe statement of income.
Development of unearned premium reserve
The adequacy of the technical liabilities arising out of our reinsurance treaties is reviewed as at each balance sheetdate. As part of the adequacy test for technical liabilities the anticipated future contractual payment obligations arecompared with the anticipated future income. Hannover Re adopts the "loss recognition" method set out under USGAAP. Should the result of the test indicate that the anticipated future income will not be sufficient to fund futurepayments, the entire shortfall is recognised in income by first writing off capitalised acquisition costs corresponding tothe shortfall. Any remaining difference is constituted as an additional provision.
Notes 7.2 Technical assets and liabilities
Figures in EUR thousand 2008 2007
Gross Retro Net Gross Retro Net
Net book value at 31 December of the previous year 6,143,460 255,076 5,888,384 6,109,154 447,537 5,661,617
Currency translation at 1 January (483,382) (3,106) (480,276) (324,136) (3,763) (320,373)
Reserve at 1 January of the year under review 5,660,078 251,970 5,408,108 5,785,018 443,774 5,341,244
Currency translation at 31 December 16,711 -4,319 21,030 36,041 13,825 22,216
Net book value at 31 December of the year under review 1,333,856 29,733 1,304,123 1,186,382 92,322 1,094,060
142
7.3 Funds held/contract deposits and contracts without sufficient technical risk
IFRS 4 in conjunction with SFAS 113 "Accounting and Reporting for Reinsurance of Short-Duration and Long-DurationContracts" requires insurance contracts that transfer a significant technical risk from the ceding company to the reinsurerto be differentiated from those under which the risk transfer is of merely subordinate importance. Hannover Re adoptsthe same approach in its recognition of funds held / contract deposits by separating funds held under insurance con-tracts with a significant risk transfer from contract deposits in respect of which the risk transfer is of subordinate import-ance.
Funds held
Funds held under insurance contracts that satisfy the requirements of both IFRS 4 and SFAS 113 in relation to the risktransfer from the ceding company to the reinsurer are recognised under this item.
The funds held by ceding companies totalling EUR 9,776.1 million (EUR 8,610.6 million) represent the cash and secur-ities deposits furnished by our company to our cedants that do not trigger any cash flows and cannot be used by cedantswithout our consent. The durations of these deposits are matched to the corresponding provisions. In the event of de-fault on such a deposit our reinsurance commitment is reduced to the same extent. The rise in funds held by ceding com-panies was attributable principally to increased new business in the area of non-traditional life reinsurance.
The funds held under reinsurance treaties totalling EUR 566.0 million (EUR 956.9 million) represent the cash andsecurities deposits furnished to our company by our retrocessionaires that do not trigger any cash flows and cannot beused without the consent of our retrocessionaires. The durations of these deposits are matched to the correspondingshares of the reinsurers in the technical provisions. If such a share no longer exists the corresponding funds held are re-duced to the same extent.
Contract deposits
Hannover Re reports contract deposits under insurance contracts that satisfy the test of a significant risk transfer to thereinsurer as required by IFRS 4 but fail to meet the risk transfer required by US GAAP under the items "Contract deposits".Since the risk transfer under these transactions is of subordinate importance, these contracts were recognised using the"deposit accounting" method and hence eliminated from the technical account. The compensation elements for riskassumption booked to income under these contracts were netted under other income/expenses. The payment flows re-sulting from these contracts were reported in the cash flow statement under operating activities. The balances wereshown as contract deposits on the assets and liabilities sides of the balance sheet, the fair values of which correspondedapproximately to their book values.
The contract deposits on the assets side fell by EUR 327.3 million in the year under review from EUR 616.1 million toEUR 288.8 million. The decrease was attributable principally to the expiry of certain contracts in the area of non-trad-itional life reinsurance.
The contract deposits on the liabilities side increased by EUR 1,477.6 million in the year under review from EUR3,668.8 million to EUR 5,146.4 million. The contract deposits item on the liabilities side encompasses balances derivingfrom non-traditional life insurance contracts that are to be carried as liabilities. The rise was due principally to growth in new business in the area of non-traditional life reinsurance.
Notes 7.3 Funds held/contract deposits and contracts without sufficient technical risk
143
7.4 Goodwill; present value of future profits on acquired life reinsurance portfolios
In accordance with IFRS 3 "Business Combinations" scheduled amortisation was not taken on goodwill. Goodwill wassubject to an impairment test.
Development of goodwill
GoodwillAs at the balance sheet date this item principally included the goodwill from the acquisition of E+S RückversicherungAG. For further information on the method used to test impairment the reader is referred to our explanatory remarks inSection 3.2 "Summary of major accounting policies".
Of the disposals recognised in the previous year, an amount of EUR 107.5 million was attributable to the sale ofPraetorian Financial Group.
Notes 7.4 Goodwill; present value of future profits on acquired life reinsurance portfolios
Figures in EUR thousand 2008 2007
Net book value at 31 December of the previous year 45,438 152,639
Currency translation at 1 January (2,026) (12,440)
Net book value at 1 January of the year under review 43,412 140,199
Corporate changes (579) –
Additions – 6,785
Disposals – 108,653
Currency translation at 31 December – 7,107
Net book value at 31 December of the year under review 42,833 45,438
Income tax
7.5 Taxes and deferred taxes
Deferred tax assets and liabilities are booked in accordance with IAS 12 for tax reductions and additional tax chargesexpected in subsequent financial years, insofar as they result from different valuations of individual balance sheetitems. In principle, such valuation differences may arise between the national tax balance sheet and the national com-mercial balance sheet, the uniform consolidated balance sheet and the national commercial balance sheet as well asfrom tax loss carry-forwards and tax credits. Deferred tax assets and liabilities were not constituted on temporary differ-ences in conjunction with interests in subsidiaries and associated companies.
In July 2007 the German Federal Council approved the Business Tax Reform Act 2008. Among other things, this led toa reduction in tax rates for corporations domiciled in Germany effective 1 January 2008. Consequently, the tax expend-iture for the previous year recognised non-recurring income from this revaluation in an amount of EUR 191.5 million forthe parent company Hannover Re and E+S Rückversicherung AG.
Deferred taxes at the Group level were booked using the Group tax rate of 32%.
Breakdown of actual and deferred income taxes:
Development of the present value of future profits (PVFP) on acquired life reinsurance portfolios
The PVFP, the period of amortisation of which is 15 years, is recognised under other assets. For further informationplease refer to our explanatory notes on intangible assets in Section 3.2 "Summary of major accounting policies".
144
Notes 7.5 Taxes and deferred taxes
Figures in EUR thousand 2008 2007
Net book value at 31 December of the previous year 2,911 5,102
Currency translation at 1 January (683) (324)
Net book value at 1 January of the year under review 2,228 4,778
Disposal – 18
Amortisation 487 1,886
Currency translation at 31 December 82 37
Net book value at 31 December of the year under review 1,823 2,911
Figures in EUR thousand 2008 2007
Actual tax for the year under review 181,395 219,727
Actual tax for other periods 30,298 54,991
Deferred taxes due to temporary differences 13,216 (46,377)
Deferred taxes from loss carry-forwards (18,269) 12,364
Change in deferred taxes due to changes in tax rates (1,030) (193,253)
Recognised tax expenditure 205,610 47,452
145
Notes 7.5 Taxes and deferred taxes
Deferred tax assets and deferred tax liabilities of all Group companies
The following table presents a breakdown of the deferred tax assets and liabilities into the balance sheet items fromwhich they are derived.
Domestic/foreign breakdown of recognised tax expenditure/income
Figures in EUR thousand 2008 2007
Current taxes
Germany 159,797 214,538
Outside Germany 51,895 60,180
Deferred taxes
Germany (4,124) (282,152)
Outside Germany (1,958) 54,886
Total 205,610 47,452
Figures in EUR thousand 2008 2007
Deferred tax assets
Tax loss carry-forwards 88,809 74,422
Loss and loss adjustment expense reserves 138,699 244,360
Benefit reserve 223,418 147,626
Other provisions 54,227 46,495
Accounts receivable 84,280 83,232
Funds held 513 –
Valuation differences relating to investments 50,077 35,670
Contract deposits 1,465 34,108
Other valuation differences 27,835 21,550
Value adjustments (120,177) (109,732)
Total 549,146 577,731
Deferred tax liabilities
Loss and loss adjustment expense reserves 2,388 3,655
Benefit reserve 22,386 53,456
Other technical/non-technical provisions 10,778 15,054
Valuation differences relating to investments 128,380 96,642
Other valuation differences 13,789 7,351
Total 1,371,589 1,350,679
Deferred tax liabilities 822,443 772,948
146
Reconciliation of the expected expense for income taxes with the actual expense
Availability of capitalised loss carry-forwardsUnused tax loss carry-forwards of EUR 292.0 million (EUR 230.3 million) existed as at the balance sheet date. Makingallowance for local tax rates, EUR 249.6 million (EUR 210.2 million) thereof was not capitalised since realisation is notsufficiently certain.
In addition, available tax credits of EUR 20.3 million (EUR 17.2 million) were not capitalised.
Availability of loss carry-forwards and tax credits that have not been capitalised
Notes 7.5 Taxes and deferred taxes
The actual and deferred taxes recognised directly in shareholders' equity at the end of the financial year amounted to -EUR 53.5 million (EUR 2.5 million). They resulted from items that were charged or credited directly to equity.
Please refer to Section 3.2 "Summary of major accounting policies" regarding the recognition and measurement ofdeferred tax assets and liabilities.
The following table presents a reconciliation of the expected expense for income taxes with the actual provision forincome taxes reported in the statement of income. The pre-tax result is multiplied by the Group tax rate in order to cal-culate the Group's expected expense for income taxes. The Group tax rate used is rounded to take account of the cor-porate income tax rate including the German reunification charge levied on corporate income tax as well as trade earn-ings tax.
Value adjustments on deferred tax assets were recognised separately for the first time in the year under review. The figures for the previous year were adjusted accordingly.
Tax expense not attributable to the reporting period 31,793 56,073
Utilisation of previously adjusted loss carry-forwards – (61,309)
Other 19,186 14,871
Actual expense for income taxes 205,610 47,452
Figures in EUR thousand One to five years Six to ten years More than ten years Unlimited Total
Loss carry-forwards – – 138,667 110,941 249,608
Tax credits – – – 20,300 20,300
Total – – 138,667 131,241 269,908
147
Notes 7.6 Staff and expenditures on personnel
2008
Nationality of employees German USA South
African UK Irish Other Total
Number of employees 903 218 152 129 21 389 1,812
Expenditures on personnelThe expenditures on insurance business, claims expenses (claims settlement) and expenditures on the administration of investments include the following personnel expenditures:
The nationalities of the workforce as at the balance sheet date were as follows:
7.6 Staff and expenditures on personnel
StaffThe average number of staff at the companies included in the consolidated financial statement of the Hannover ReGroup was 1,790 (1,922). The decrease in the workforce was attributable to the disposal of North American RiskServices, Inc., Wilmington/USA, a subsidiary of Hannover Finance, Inc., Wilmington/USA, in the first quarter of 2008.
As at the balance sheet date altogether 1,812 (1,825) staff were employed by the Hannover Re Group, with 963 (907)employed in Germany and 849 (918) working for the consolidated Group companies abroad.
2008 2007
Personnel information 31.03. 30.06. 30.09. 31.12. Average 31.12. Average
Number of employees (excluding board members) 1,744 1,781 1,790 1,812 1,790 1,825 1,922
Figures in EUR thousand 2008 2007
a) Wages and salaries
aa) Expenditures on insurance business 101,065 98,396
ab) Expenditures on the administration of investments 10,115 8,015
111,180 106,411
b) Social security contributions and expenditure on provisions and assistance
ba) Social security contributions 15,261 13,397
bb) Expenditures for pension provision 12,644 11,686
bc) Expenditures for assistance 2,059 1,727
29,964 26,810
Total 141,144 133,221
148
7.7 Provisions for pensions and other post-employment benefit obligations
Pension commitments are given in accordance with the relevant version of the pension plan as amended. The 1968pension plan provides for retirement, disability, widows' and orphans' benefits. The pension entitlement is dependenton length of service; entitlements under the statutory pension insurance scheme are taken into account. The pensionplan was closed to new participants with effect from 31 January 1981.
On 1 April 1993 (1 June 1993 in the case of managerial staff) the 1993 pension plan came into effect. This pensionplan provides for retirement, disability and surviving dependants' benefits. The scheme is based upon annual deter-mination of the pension contributions, which at 1% up to the assessment limit in the statutory pension insurance schemeand 2.5% above the assessment limit of the pensionable employment income are calculated in a range of 0.7% to 1%and 1.75% to 2.5% respectively depending upon the company's performance. The pension plan closed as at 31 March1999.
From 1997 onwards it has been possible to obtain pension commitments through deferred compensation. Followingthe merger with Gerling-Konzern Lebensversicherungs-AG, Cologne, the employee-funded commitments included in theprovisions for accrued pension rights are protected by an insurance contract with HDI-Gerling Lebensversicherung AG,Cologne, at unchanged conditions.
As at 1 July 2000 the 2000 pension plan came into force for the entire Group. Under this plan, new employees includedin the group of beneficiaries are granted an indirect commitment from HDI Unterstützungskasse. The pension planprovides for retirement, disability and surviving dependants' benefits.
Effective 1 December 2002 Group employees have an opportunity to accumulate additional old-age provision atunchanged conditions by way of deferred compensation through membership of HDI-Gerling Pensionskasse AG. Thebenefits provided by HDI-Pensionskasse AG are guaranteed for its members and their surviving dependants andcomprise traditional pension plans with bonus increases as well as unit-linked hybrid annuities.
In addition to these pension plans, managerial staff and members of the Executive Board, in particular, enjoy individualcommitments as well as commitments given under the benefits plan of the Bochumer Verband.
Provisions for pensions are established in accordance with IAS 19 "Employee Benefits" (rev. 2004) using the projectedunit credit method. The pension plans are defined benefit plans. The basis of the valuation is the estimated future in-crease in the rate of compensation of the pension beneficiaries. The benefit entitlements are discounted by applyingthe capital market rate for highest-rated securities. The commitments to employees in Germany predominantly com-prise benefit obligations financed by the Group companies. The pension plans are unfunded. Amounts carried as liabil-ities are recognised under other liabilities. The provisions for pensions in Germany and abroad were calculated on thebasis of uniform standards defined by Talanx AG and subject to local economic conditions.
Provisions for pensions are established in accordance with actuarial principles and are based upon the commitmentsmade by the Hannover Re Group for retirement, disability and widows' benefits. The amount of the commitments isdetermined according to length of service and salary level.
Notes 7.7 Provisions for pensions and other post-employment benefit obligations
149
Change in the projected benefit obligation
Funding of the defined benefit obligation
The change in the projected benefit obligation of the pension commitments as well as their breakdown into plans thatare unfunded or are wholly or partially funded was as follows:
The calculation of the provisions for pensions is based upon the following assumptions:
Notes 7.7 Provisions for pensions and other post-employment benefit obligations
in % 2008 2007
Germany USA Australia Germany USA Australia
Discount rate 6.00 6.25 4.17 5.50 6.20 5.70
Projected long-term yield on plan assets – 7.50 7.00 – 7.50 7.00
Rate of compensation increase 3.00 – 4.50 3.00 – 5.00
Indexation 2.25 3.00 3.00 1.75 3.00 3.50
Measurement assumptions
Figures in EUR thousand 2008 2007
Projected benefit obligation at the beginning of the year under review 79,135 77,400
Current service cost for the year under review 2,789 2,722
Interest cost 4,009 3,654
Deferred compensation 13 632
Actuarial gain/loss (2,940) (3,450)
Currency translation (1,246) (160)
Benefits paid during the year (1,852) (1,662)
Business combinations, divestitures and other activities – 70
Plan curtailments – (71)
Projected benefit obligation at the end of the year under review 79,908 79,135
Figures in EUR thousand 2008 2007
Projected benefit obligation from unfunded plans 78,759 70,710
Projected benefit obligation from wholly or partially funded plans (before deduction of fair value of plan assets) 1,149 8,425
Projected benefit obligation at the end of the year under review 79,908 79,135
Fair value of plan assets 7,051 9,372
Funded status (present value of earned benefit entitlements less fund assets) 72,857 69,763
150
As % of plan assets 2008 2007
Equities 7 7
Other 93 93
Total 100 100
The structure of the asset portfolio underlying the plan assets was as follows:
The fair value of plan assets as at the balance sheet date included amounts totalling EUR 1.4 million (EUR 1.5 million)for own financial instruments.
The actual losses on plan assets amounted to –EUR 1.1 million in the year under review, compared with actual gains onplan assets of EUR 0.2 million in the previous year.
The following table presents a reconciliation of the funded status – calculated from the difference between the definedbenefit obligations and the plan assets – with the provision for pensions recognised as at the balance sheet date:
Reconciliation of the net provision for pensions
Portfolio structure of plan assets
Change in plan assets
The fair value of the plan assets developed as follows:
Figures in EUR thousand 2008 2007
Fair value at the beginning of the year under review 9,372 7,302
Expected return on plan assets 544 577
Actuarial gain/loss (1,830) (281)
Currency translation (1,265) (190)
Employer contributions 287 1,843
Contributions paid by plan participants 13 132
Benefits paid during the year (70) (11)
Fair value of plan assets 7,051 9,372
Figures in EUR thousand 2008 2007
Defined benefit obligations at the end of the year under review 79,908 79,135
Fair value of plan assets at the end of the year under review 7,051 9,372
Funded status 72,857 69,763
Unrealised actuarial gain/loss (650) (2,662)
Net provisions for pensions at 31 December of the year under review 72,207 67,101
Notes 7.7 Provisions for pensions and other post-employment benefit obligations
151
The components of the net periodic pension cost for benefit plans were as follows:
Net periodic pension cost
In determining the actuarial gains and losses to be recognised in the statement of income the corridor method providedfor as an option in IAS 19 continued to be applied even after the amendments to the standard.
The net periodic pension cost was recognised in the consolidated statement of income in amounts of EUR 5.8 million(EUR 3.8 million) under administrative expenses, EUR 0.6 million (EUR 1.4 million) under other expenses and EUR 1.0million (EUR 0.7 million) under other investment expenses.
Actuarial gains of EUR 0.1 million (EUR 0.4 million) were recognised as at the balance sheet date in other comprehen-sive income.
The following amounts were recognised for the current and previous reporting periods under the accounting of definedbenefit plans:
The recognised provision for pensions developed as follows in the year under review:
Change in the provisions for pensions
Notes 7.7 Provisions for pensions and other post-employment benefit obligations
Figures in EUR thousand 2008 2007
Net provisions for pensions at 31 December of the previous year 67,101 64,559
Currency translation (130) 24
Expense for the year under review 7,367 5,930
Deferred compensation – 500
Reclassification – 70
Amounts paid during the year (348) (2,021)
Benefits paid during the year (1,783) (1,651)
Other – (310)
Net provisions for pensions at 31 December of the year under review 72,207 67,101
Figures in EUR thousand 2008 2007
Current service cost for the year under review 2,789 2,731
Interest cost 4,054 3,669
Expected return on plan assets 607 598
Recognised actuarial gain/loss (1,116) (60)
Effect of plan curtailments or settlements (15) (68)
Total 7,367 5,930
152
7.8 Debt and subordinated capital
On 31 March 1999 Hannover Finance, Inc., Wilmington/USA, issued subordinated debt in the form of a floating-rateloan in the amount of USD 400.0 million with a term of 30 years. The due date of the loan is 31 March 2029. It maybe redeemed by the issuer no earlier than 31 March 2009. In order to hedge against the risk of interest rate changesassociated with this loan, the company purchased interest rate swaps in 1999 in the same amount which expire on31 March 2009. In this way, the interest rate is converted from a floating rate to a fixed rate for a period ending com-mensurate with the first opportunity to redeem the loan. In February 2004 and May 2005 Hannover Re bought backportions of the debt amounting to USD 380.0 million, equivalent to altogether 95% of the total volume. The interestrate swaps were closed out in the second quarter of 2006. Under a contract dated 1 June 2007 Hannover Finance, Inc.repurchased the subordinated debt in an amount of USD 380.0 million from Hannover Re. Effective 17 July 2007 theinterests in the loan amounting to USD 380.0 million were cancelled and have not been traded on the capital marketsince that date. The remaining portions of the debt totalling USD 20.0 million are held by investors outside the Groupand carry a coupon of LIBOR +80 basis points until 31 March 2009. Hannover Re intends to exercise the call optiongranted in the loan terms which provides for early repurchase of the debt at nominal value effective 31 March 2009.
In order to safeguard the sustained financial strength of the Hannover Re Group, Hannover Re issued additional subor-dinated debt. In February 2004 subordinated debt in the amount of EUR 750.0 million was placed through HannoverFinance (Luxembourg) S.A., a wholly owned subsidiary of Hannover Re, on the European capital markets. The bond wasplaced predominantly with institutional investors. The bond was priced at a spread of 163 basis points over the 10-yearmid-swap rate and has a final maturity of 20 years. It may be redeemed by Hannover Re after 10 years at the earliestand at each coupon date thereafter. If the bond is not called at the end of the tenth year, the coupon will step up to afloating-rate yield of quarterly EURIBOR +263 basis points.
In May 2005 Hannover Re issued further subordinated debt in the amount of EUR 500.0 million through its subsidiaryHannover Finance (Luxembourg) S.A. As part of the transaction, holders of Hannover Re's EUR 350.0 million subordi-nated debt placed in 2001 were offered an opportunity to exchange their existing issue for holdings in the new bond,which has a term of 30 years and may be called in prior to maturity by the issuer after 10 years. Participation in the
Amounts recognised
In the current financial year Hannover Re expects payments of EUR 6.5 million (EUR 6.2 million) under the pensionplans set out above.
Defined contribution plansIn addition to the defined benefit plans, some Group companies have defined contribution plans that are based onlength of service and the employee's income or level of contributions. The expense recognised for these obligations inthe year under review in accordance with IAS 19.46 was EUR 2.6 million (EUR 2.9 million), of which only a minimalamount was due to obligations to members of staff in key positions.
Notes 7.8 Debt and subordinated capital
Figures in EUR thousand 2008 2007
Present value of defined benefit obligation 79,908 79,135
Fair value of plan assets 7,051 9,372
Surplus / (deficit) in the plan (72,857) (69,763)
Experience adjustments on plan liabilities (649) (3,410)
Experience adjustments on plan assets – (374)
153
The carrying amount of this item corresponds to cost or amortised cost.
The aggregated fair value of the extended subordinated loans is based on quoted, active market prices. If such priceinformation was not available, fair value was determined on the basis of the recognised effective interest rate methodor estimated using other financial assets with similar rating, duration and return characteristics. Under the effectiveinterest rate method the current market interest rate levels in the relevant fixed-interest-rate periods are always takenas a basis.
Debt and subordinated capital
exchange was nominally EUR 211.9 million, corresponding to EUR 240.5 million of the new bond issue. The cash com-ponent of the new bond in the amount of nominally EUR 259.5 million was placed predominantly with institutionalinvestors in Europe. The remaining volume of the bond issued in 2001 after the exchange was unchanged at EUR138.1 million.
Other financial facilitiesIn order to protect against possible future major losses Hannover Re took out a new credit line of EUR 500.0 million in2004 in the form of a syndicated loan. The facility has a term of five years and ends in August 2009. It has not beenused to date.
In addition, facilities exist with various financial institutions for letters of credit, including two syndicated guaranteefacilities each in the amount of USD 2.0 billion from 2005 and 2006. 50% of the first of these lines matures in January2010 and the other 50% in January 2012, while the second line matures in January 2013. For further information onthe letters of credit provided please see our explanatory remarks in Section 9.2 "Contingent liabilities and commit-ments".
The ordinary expenses include interest expenses of EUR 77.4 million (EUR 77.6 million) resulting predominantly fromthe subordinated debt with coupons of between 5.0% and 6.25% placed through Hannover Finance (Luxembourg) S.A.in the years from 2001 to 2005. In addition, interest expenditures from the remaining portions of the floating-rate loanissued by Hannover Finance, Inc., Wilmington/USA are recognised here.
Net gains and losses from debt and subordinated capital
Notes 7.8 Debt and subordinated capital
Figures in EUR thousand 2008
Ordinary income /expenses Amortisation Net result
Debt (2,706) – (2,706)
Subordinated loans (77,442) (2,870) (80,312)
Total (80,148) (2,870) (83,018)
Figures in EUR thousand 2007
Ordinary income /expenses Amortisation Net result
Debt (3,312) – (3,312)
Subordinated loans (77,600) (2,841) (80,441)
Total (80,912) (2,841) (83,753)
155
7.9 Shareholders' equity and minority interests
Shareholders' equity is shown as a separate component of the financial statement in accordance with IAS 1 "Presenta-tion of Financial Statements" and subject to IAS 32 "Financial Instruments: Disclosure and Presentation" in conjunctionwith IAS 39 "Financial Instruments: Recognition and Measurement". The change in shareholders' equity comprises notonly the net income deriving from the statement of income but also the changes in the value of asset and liability itemsnot recognised in the statement of income.
The common shares (share capital of the parent company) amount to EUR 120,597,134.00. They are divided into120,597,134 voting and dividend-bearing registered no-par shares. The shares are paid in in full. Each share carries anequal voting right and an equal dividend entitlement.
Minority interests are established in accordance with the shares held by companies outside the Group in the shareholders’equity of the subsidiaries.
Authorised capital of up to EUR 60,299 thousand is available with a time limit of 31 May 2009.
New individual registered shares may be issued on one or more occasions for contributions in cash or kind. Of the totalamount, up to EUR 1,000 thousand may be used to issue employee shares.
In addition, conditional capital of up to EUR 60,299 thousand is available. It can be used to grant shares to holders ofconvertible bonds and bonds with warrants as well as to holders of participating bonds with conversion rights andwarrants and has a time limit of 11 May 2011.
1) excluding derivatives
1) excluding derivatives
Maturities of financial liabilities
Notes 7.9 Shareholders' equity and minority interests
Total 60,202 73,229 20,314 8,085 746,043 152,072 483,829
156
Management of capitalThe preservation and consistent enhancement of its capital is a key strategic objective for Hannover Re. As part of itsapproach to capital management Hannover Re considers the policyholders' surplus over and above the shareholders'equity recognised in the balance sheet. The policyholders' surplus is defined as the sum total of
• shareholders' equity excluding minority interests, composed of the common shares, additional paid-in capital, other comprehensive income and retained earnings,
• minority interests and
• hybrid capital used as an equity substitute, which encompasses our subordinated debt.
The policyholders' surplus totalled EUR 4,708.4 million (EUR 5,295.1 million) as at the balance sheet date.
The chart below illustrates the development of the policyholders' surplus over the last five reporting years:
Hannover Re uses "Intrinsic Value Creation" (IVC) as its central value-based management tool. For more information on this concept as well as the objectives and principles in accordance with which we conduct our enterprise managementand capital management the reader is referred to our remarks on value-based management on page 52 et seq. of thisreport.
Hannover Re satisfies the capital expectations of the rating agencies that assess the Group's financial strength. SomeGroup companies are subject to additional national capital and solvency requirements. All Group companies met theapplicable local minimum capital requirements in the year under review. The parent company ensures that the localminimum capital requirements applicable to subsidiaries are always satisfied in accordance with the official require-ments defined by insurance regulators.
Notes 7.9 Shareholders' equity and minority interests
Hybrid capital, limited maturity
Shareholders' equity
471
20052004
2006
3,000
4,000
5,000
6,000
2,000
1,000
0
Minority interest
Hybrid capital, no maturity
1) Hybrid capital: + EUR 750 million- USD 380 million repurchase- EUR 118 million repayment
2) Hybrid capital: +EUR 500 million new issue- EUR 212 million exchange
4,172 1)
1,116
in EUR million
2,525
2007
531
Development of policyholders' surplus
897
5,295
573
3,349
476
474
4,878
898
2,898
609
967
4,580 2)
541
2,601
2008
4,708
2,830
898
479
501
157
Notes 7.11 Earnings per share
7.10 Treasury shares
IAS 1 requires separate disclosure of treasury shares in shareholders' equity. By a resolution of the Annual GeneralMeeting of Hannover Rückversicherung AG adopted on 6 May 2008, the company was authorised until 31 October2009 to acquire treasury shares of up to 10% of the share capital existing on the date of the resolution. As part of thisyear's employee share option plan Hannover Re acquired altogether 13,984 treasury shares in the course of the fourthquarter of 2008 and delivered them to eligible employees at preferential conditions. These shares are blocked until30 November 2012. The company was no longer in possession of treasury shares as at the balance sheet date.
7.11 Earnings per share
Basic and fully diluted earnings per share
Due to the reduction in the interest held in E+S Rück in the third quarter of the 2007 financial year – which was recog-nised retrospectively in equity – the Group net income for the comparable period of the previous year decreased byaltogether EUR 12.0 million. As a result, both the earnings per share and the earnings per share from continuing oper-ations for the previous period had to be reduced by EUR 0.10 per share. For further details please see our comments inSection 3.1 "Change in accounting policies".
Neither in the year under review nor in the previous reporting period were there any dilutive effects. On account of thisyear's employee share option plan Hannover Re acquired treasury shares in the course of the fourth quarter of 2008and sold them to the eligible employees. The weighted average of shares in circulation during the reporting period wastherefore insignificantly lower than in the previous year. For further details please see our comments in Section 7.10"Treasury shares".
There were no other extraordinary components of income which should have been recognised or disclosed separately inthe calculation of the earnings per share.
The earnings per share could potentially be diluted in future through the issue of shares or subscription rights from theauthorised or conditional capital.
2008 2007
Result (in EUR thousand) No. of shares Per share
(in EUR)Result
(in EUR thousand) No. of shares Per share (in EUR)
Group net income (126,987) – – 721,663 – –
Weighted average of issued shares – 120,594,783 – – 120,597,134 –
Earnings per share (126,987) 120,594,783 (1.05) 721,663 120,597,134 5.98
from continuing operations (126,987) 120,594,783 (1.05) 686,578 120,597,134 5.69
from discontinued operations – 120,594,783 – 35,085 120,597,134 0.29
158
The portfolio of own-use real estate was measured at cost of purchase less scheduled straight-line depreciation overuseful lives of 10 to 50 years. The fair values were calculated using the discounted cash flow method.
Effective 1 July 2003 Hannover Re took out insurance for pension commitments. The commitments involve deferredannuities with regular premium payment under a group insurance policy. In accordance with IAS 19 they were carriedas a separate asset at fair value as at the balance sheet date in an amount of EUR 45.5 million (EUR 43.6 million).
7.12 Other assets and liabilities
Other assets
Dividend per share
Dividends and bonus dividends of EUR 277.4 million (EUR 193.0 million) were paid in the year under review for 2007.
On the occasion of the Annual General Meeting to be held on 5 May 2009 it will be proposed that a dividend should not bedistributed for the 2008 financial year. The dividend proposal does not form part of this consolidated financial statement.
Notes 7.12 Other assets and liabilities
Figures in EUR thousand 2008 2007
Own-use real estate 42,019 40,758
Other receivables 3,547 2,589
Present value of future profits on acquired life reinsurance portfolios 1,823 2,911
Fixtures, fittings and equipment 26,302 25,781
Other assets 1,034 4,684
Other intangible assets 61,310 56,390
Tax refund claims 26,823 23,304
Receivables from affiliated companies 153 861
Insurance for pension commitments 45,459 43,556
Other 51,795 43,444
Total 260,265 244,278
159
Development of fixtures, fittings and equipment
With regard to the measurement of fixtures, fittings and equipment, the reader is referred to our explanatory notes onthe other assets in Section 3.2 "Summary of major accounting policies".
Notes 7.12 Other assets and liabilities
Figures in EUR thousand 2008 2007
Gross book value at 31 December of the previous year 95,352 83,344
Currency translation at 1 January (6,244) (3,182)
Gross book value after currency translation 89,108 80,162
Change in consolidated group 233 –
Additions 11,774 16,399
Disposals 11,981 908
Reclassification (130) –
Currency translation at 31 December 106 (301)
Gross book value at 31 December of the year under review 89,110 95,352
Cumulative depreciation at 31 December of the previous year 69,571 59,612
Currency translation at 1 January (4,986) (2,167)
Cumulative depreciation after currency translation 64,585 57,445
Disposals 11,118 347
Depreciation
scheduled 9,497 12,953
Currency translation at 31 December (156) (480)
Cumulative depreciation at 31 December of the year under review 62,808 69,571
Net book value at 31 December of the previous year 25,781 23,732
Net book value at 31 December of the year under review 26,302 25,781
160
Development of other intangible assets
As at the balance sheet date the item included EUR 7.9 million (EUR 0.1 million) for self-provided software and EUR 39.9million (EUR 11.7 million) for purchased software. Scheduled depreciation is taken over useful lives of three to ten years.
The additions can be broken down into EUR 4.9 million (EUR 13.4 million) for purchased software and EUR 9.1 million(EUR 2.8 million) for advance payments on self-provided software.
Notes 7.12 Other assets and liabilities
Figures in EUR thousand 2008 2007
Gross book value at 31 December of the previous year 155,429 141,242
Currency translation at 1 January (739) (1,765)
Gross book value after currency translation 154,690 139,477
Change in consolidated group 497 –
Additions 14,382 16,390
Disposals 1,543 455
Currency translation at 31 December (2,067) 17
Gross book value at 31 December of the year under review 165,959 155,429
Cumulative depreciation at 31 December of the previous year 99,039 96,212
Currency translation at 1 January (233) (98)
Cumulative depreciation after currency translation 98,806 96,114
Disposals 44 –
Write-ups – 40
Depreciation
scheduled 5,893 2,965
Currency translation at 31 December 6 –
Cumulative depreciation at 31 December of the year under review 104,649 99,039
Net book value at 31 December of the previous year 56,390 45,030
Net book value at 31 December of the year under review 61,310 56,390
161
Other liabilities
The overdue other receivables of Hannover Finance, Inc., recognised here in the previous year were settled in the yearunder review.
Value adjustments were taken on other receivables in an amount of EUR 3.8 million (EUR 0.2 million) in the year underreview on the basis of specific impairment analyses.
Credit risks may result from other financial assets that were not overdue or adjusted as at the balance sheet date. In thisregard, the reader is referred in general to our comments in Section 6 "Management of technical and financial risks".
The liabilities from derivatives of EUR 91.7 million (EUR 15.9 million) consist principally of the embedded derivativesrecognised separately from the underlying insurance contract at fair value pursuant to IAS 39. Please see our remarkson derivative financial instruments in Section 7.1 "Investments including income and expenses".
The other liabilities include sundry non-technical provisions of EUR 57.6 million (EUR 67.4 million), which developed asshown in the following table.
The age structure of the other receivables which were unadjusted but considered overdue as at the balance sheet dateis presented below:
Figures in EUR thousand 2008 2007
Less thanthree months
Three months to one year
More than one year
Less thanthree months
Three months to one year
More than one year
Other receivables – – – 198 1,818 6,571
Accrued interest – – – 8 – –
Total – – – 206 1,818 6,571
Age structure of overdue other receivables
Notes 7.12 Other assets and liabilities
Figures in EUR thousand 2008 2007
Liabilities from derivatives 91,680 15,892
Interest 60,052 63,283
Deferred income 15,977 18,682
Costs of the annual financial statements 5,670 3,033
Liabilities to trustees – 8,494
Liabilities due to affiliated companies 5,849 552
Provisions arising out of employment relationships 28,582 29,521
Direct minority interests in partnerships 33,919 28,011
Other 77,454 109,569
Total 319,183 277,037
162
Development of sundry non-technical provisions
Notes 7.12 Other assets and liabilities
Figures in EUR thousand Balance at 31.12.2007
Currency translation at 1 January
Balance at 1 January of the year
under review
Provisions for
Audits and costs of publishing the annual financial statements 3,033 (186) 2,847
Consultancy fees 1,965 (7) 1,958
Suppliers' invoices 5,664 (212) 5,452
Partial retirement arrangements and early retirement obligations 5,193 (16) 5,177
Holiday entitlements and overtime 2,781 (128) 2,653
Anniversary bonuses 1,435 – 1,435
Management bonuses 20,112 (411) 19,701
Other 27,181 (422) 26,759
Total 67,364 (1,382) 65,982
163
Notes 7.12 Other assets and liabilities
Changes inconsolidated group Additions Utilisation Release Currency translation
at 31 DecemberBalance at31.12.2008
29 5,117 2,275 55 7 5,670
– 1,262 1,130 227 (16) 1,847
31 7,730 4,025 562 (223) 8,403
– 1,471 577 134 (26) 5,911
73 3,300 2,282 8 (30) 3,706
– 326 – – – 1,761
– 13,843 16,168 140 (32) 17,204
201 4,338 6,148 11,977 (98) 13,075
334 37,387 32,605 13,103 (418) 57,577
164
7.13 Technical statement of income
With regard to the claims and claims expenses as well as the change in the benefit reserve the reader is also referred toSection 7.2 "Technical assets and liabilities". The change in the benefit reserve relates exclusively to the life and healthreinsurance segment.
The administrative expenses amounted to altogether 3.1% (2.8%) of net premium earned.
Technical result
Notes 7.13 Technical statement of income
Figures in EUR thousand 2008 2007
Gross written premium 8,120,919 8,258,901
Ceded written premium 886,621 1,036,950
Change in unearned premium (113,480) 298,490
Change in ceded unearned premium (59,193) (227,511)
Net premium earned 7,061,625 7,292,930
Other technical income 7,294 1,130
Total net technical income 7,068,919 7,294,060
Claims and claims expenses paid 3,959,971 4,556,882
Change in loss and loss adjustment expense reserve 742,156 474,189
Claims and claims expenses 4,702,127 5,031,071
Change in benefit reserve 420,918 398,232
Premium refund (424) 298
Net change in benefit reserve 421,342 397,934
Commissions 1,788,833 1,671,783
Change in deferred acquisition costs 124,164 (83,007)
Change in provision for contingent commissions (28,728) 4,220
Other acquisition costs 11,676 12,571
Other technical expenses 12,166 20,081
Administrative expenses 216,047 204,358
Net technical result 69,620 (130,965)
165
Figures in EUR thousand 2008 2007
Other technical income (gross) 8,168 1,816
Reinsurance recoverables 874 686
Other technical income (net) 7,294 1,130
Other technical income
Commissions and brokerage, change in deferred acquisition costs
Figures in EUR thousand 2008 2007
Other technical expenses (gross) 12,209 20,034
Reinsurance recoverables 43 (47)
Other technical expenses (net) 12,166 20,081
Other technical expenses
Notes 7.13 Technical statement of income
Figures in EUR thousand 2008 2007
Commissions paid (gross) 2,048,951 1,857,719
Reinsurance recoverables 260,118 185,936
Change in deferred acquisition costs (gross) 199,213 (164,087)
Reinsurance recoverables 75,049 (81,080)
Change in provision for contingent commissions (gross) (31,429) (65)
Reinsurance recoverables (2,701) (4,285)
Commissions and brokerage, change in deferred acquisition costs (net) 1,635,941 1,759,010
166
7.14 Other income/expenses
Of the separate value adjustments, an amount of EUR 47.8 million (EUR 52.5 million) was attributable to accountsreceivable, EUR 27.0 million (EUR 2.0 million) to reinsurance recoverables on unpaid claims and EUR 3.8 million (EUR 0.2 million) to other receivables.
Notes 7.14 Other income/expenses
Figures in EUR thousand 2008 2007
Other income
Exchange gains 52,381 80,058
Income from contracts recognised in accordance with the deposit accounting method 25,654 75,383
Other interest income 3,513 2,154
Income from services 7,128 7,849
Reversals of impairments on receivables 32,960 47,686
Sundry income 42,955 27,509
164,591 240,639
Other expenses
Exchange losses 155,420 58,932
Other interest expenses 17,346 70,781
Depreciation 9,781 14,372
Expenses for services 6,366 7,591
Expenses for the company as a whole 43,362 37,044
Separate value adjustments 78,589 54,700
Sundry expenses 53,738 59,998
364,602 303,418
Total (200,011) (62,779)
167
8. Related party disclosures
8.1 Transactions with related parties
IAS 24 defines related parties inter alia as parent companies and subsidiaries, subsidiaries of a common parent company,associated companies, legal entities under the influence of management and the management of the company itself. Inthe year under review the following significant business relations existed with related parties.
Since 10 January 2008 HDI Haftpflichtverband der Deutschen Industrie V.a.G., Hannover, has held a majority interest in Hannover Re solely through Talanx AG, Hannover, into which both HDI Verwaltungs-Service GmbH, Hannover, andZweite HDI Beteiligungsgesellschaft mbH, Hannover, were merged on the same date.
The Hannover Re Group provides reinsurance protection for the HDI Group. To this extent, numerous underwriting busi-ness relations exist with related parties in Germany and abroad which are not included in Hannover Re's consolidation.This includes business both assumed and ceded at usual market conditions.
Protection Reinsurance Intermediaries AG grants Hannover Re and E+S Rück a preferential position as reinsurers whenit comes to placing reinsurance cessions of the Talanx Group's primary insurers (Group cedants). Under these arrange-ments, Hannover Re and E+S Rück are given the opportunity to write any desired share of placed reinsurance cessionsprovided this does not jeopardise overall placement in the interest of the Talanx Group. In addition, Hannover Re andE+S Rück are able to participate in the protection covers on the retention of Group cedants and share in the protectionafforded by them. Under certain conditions Hannover Re and E+S Rück are required to assume from Protection Re por-tions of the Group cedants' reinsurance cessions not placed on the global market. This agreement entered into force on1 January 2003 and may be terminated at four months' notice effective 30 June of any year.
Notes 8.1 Transactions with related parties
168
Business assumed and ceded in Germany and abroad
Major reinsurance relationships with related parties in the year under review are listed in the following table.
With effect from the 1997 financial year onwards all new business and renewals written on the German market havebeen the responsibility of E+S Rück, while Hannover Re has handled foreign markets. Internal retrocession arrangementsensure that the percentage breakdown of the business applicable to the previously existing underwriting partnership islargely preserved between these companies. Every reinsurance treaty subject to internal retrocession is allocated to apool. The assuming company participates in this pool with a fixed percentage share. Some individual retrocessions existalongside the pools.
Notes 8.1 Transactions with related parties
Figures in EUR thousand 2008
Related parties Premium Underwriting result
Business assumed
ASPECTA Assurance International AG 20,386 3,140
ASPECTA Assurance International Luxembourg S.A. 35,003 3,833
ASPECTA Lebensversicherung AG 118,717 12,891
CiV Lebensversicherung AG 43,571 (6,120)
CiV Versicherung AG 14,768 8,175
HDI Asekuracja Towarzystwo Ubezpieczen S.A. 22,071 15,171
HDI Assicurazioni S.p. A. 16,787 5,635
HDI Direkt Versicherung AG 565 (18,186)
HDI-Gerling Firmen und Privat Versicherung AG 12,824 6,241
HDI-Gerling Industrie Versicherung AG 166,279 (4,710)
HDI-Gerling Lebensversicherung AG 23,074 (1,446)
HDI-Gerling Verzekeringen N.V. 30,870 (1,548)
HDI HANNOVER International España, Cia. de Seguros y Reaseguros S.A. 22,740 679
HDI Hannover Versicherung AG 10,236 2,035
HDI Sigorta A.S. 24,955 (6,287)
Magyar Posta Biztositó Részvénytársaság 7,459 (1,410)
Postbank Lebensversicherung AG 48,428 (2,432)
Other companies 19,658 7,388
638,391 23,049
Business ceded
HDI-Gerling Industrie Versicherung AG (1,226) (1,084)
Other companies – 7
Total 637,165 21,972
169
Since the 2005 financial year Hannover Re had held participation certificates of HDI Haftpflichtverband der DeutschenIndustrie V.a.G. in an amount of EUR 18.5 million with a coupon of 7.25%; they became due on 1 October 2008. Theparticipation certificates were recognised under the portfolio of fixed-income securities held to maturity. The term ofthe participation certificates was limited to the end of the 2007 financial year. Repayment was made on the due date.
In the 2007 financial year Hannover Re (Bermuda) Ltd. extended a loan due on 31 May 2012 with a coupon of 4.98%to Talanx AG, the volume of which as at the balance sheet date was EUR 51.5 million (EUR 51.5 million). The carryingamount includes accrued interest of EUR 1.5 million (EUR 1.5 million). This instrument was recognised under other in-vested assets.
The Group companies E+S Rück, Hannover Finance (Luxembourg) S.A., Hannover Reinsurance (Ireland) Ltd. and Han-nover Re (Bermuda) Ltd. invested in an amount of altogether EUR 153.9 million in a bearer debenture of Talanx AGwith a term until 8 July 2013 and a coupon of 5.43%. The carrying amount of the instrument, which is recognised un-der fixed-income securities held to maturity, was EUR 154.9 million and included accrued interest of EUR 3.9 million(EUR 3.9 million) as at the balance sheet date.
As at 31 December 2008 Hannover Reinsurance (Ireland) Ltd. recognised loan receivables due from AspectaLebensversicherung AG and Aspecta Assurance International Luxembourg S.A. in an amount of altogether EUR 255.9million (EUR 249.8 million). The loans result from a group of reinsurance contracts for which Talanx AG had furnishedguarantees, which in 2007 were transferred to Hannover Reinsurance (Ireland) Ltd. In accordance with IAS 39 thecontracts in question were classified as financial instruments with the character of loans and receivables measured atamortised cost, and the corresponding changes in income are recognised in ordinary investment income.
Under articles of partnership dated 7 December 2007 HAPEP II Komplementär GmbH, Hannover – as general partner –and AmpegaGerling Asset Management GmbH, Cologne – as limited partner with the power to conduct business –established Hannover Re Euro PE Holdings GmbH & Co. KG, Cologne. Additional limited partners are Hannover Re andE+S Rück. Please see our remarks in Section 5.1 "Acquisitions and new formations".
As part of long-term lease arrangements companies belonging to the Hannover Re Group rented out business premisesin 2008 to HDI Direkt Versicherung AG and Protection Reinsurance Intermediaries AG, both based in Hannover. IT andmanagement services were also performed for the latter under service contracts.
Within the contractually agreed framework AmpegaGerling Asset Management GmbH performs investment and assetmanagement services for Hannover Re and some of its subsidiaries. Assets in special funds are managed by Ampega-Gerling Investment GmbH.
Companies belonging to the Talanx Group granted the Hannover Re Group insurance protection inter alia in the areasof public liability, fire, group accident and business travel collision insurance.
Talanx AG took out directors' and officers' (D&O) insurance for Praetorian Financial Group, Inc., New York, on behalf ofthe Hannover Re Group. The insurance premiums were billed to Hannover Re, which the latter on-debited to HannoverFinance, Inc.
In addition, divisions of Talanx AG also performed services for us in the areas of taxes and general administration.
All transactions were effected at usual market conditions. We gave an account of these transactions with regard toHannover Re and E+S Rück in the corresponding dependent company reports pursuant to § 312 Stock Corporation Act(AktG).
Notes 8.1 Transactions with related parties
170
8.2 Remuneration and shareholdings of the management boards of the parent company
With regard to this information please see in general the remuneration report included as part of our Corporate Govern-ance report, in particular page 187 et seq.
The remuneration report is based on the recommendation of the German Corporate Governance Code and containsinformation which also forms part of the notes to the 2008 consolidated financial statement as required by IAS 24"Related Party Disclosures". In addition, we took into account the more specific provisions of DRS 17 "Reporting on theRemuneration of Members of Governing Bodies". Under German commercial law, too, this information includes dataspecified as mandatory for the notes (§ 314 HGB) and the management report (§ 315 HGB). These details are discussedas a whole in the remuneration report. Consequently, we have not provided any further explanation in the notes ormanagement report.
8.3 Share-based payment
With effect from 1 January 2000 the Executive Board of Hannover Re, with the consent of the Supervisory Board, intro-duced a virtual stock option plan that provides for the granting of stock appreciation rights to certain managerial staff.The content of the stock option plan is based solely on the Conditions for the Granting of Stock Appreciation Rights. Allthe members of the Group's management are eligible for the award of stock appreciation rights. Exercise of the stockappreciation rights does not give rise to any entitlement to the delivery of Hannover Re stock, but merely to payment ofa cash amount linked to the performance of the Hannover Re share. Recognition of transactions involving stock appre-ciation rights with cash settlement is governed by the requirements of IFRS 2 "Share-based Payment".
Stock appreciation rights were first granted for the 2000 financial year and are awarded separately for each subsequentfinancial year (allocation year), provided the performance criteria defined in the Conditions for the Granting of StockAppreciation Rights are satisfied.
The internal performance criterion is achievement of the target performance defined by the Supervisory Board, which isexpressed in terms of the diluted earnings per share calculated in accordance with IAS 33 "Earnings Per Share" (EPS). If the target EPS is surpassed or undershot, the provisional basic number of stock appreciation rights initially granted isincreased or reduced accordingly to produce the EPS basic number. The external performance criterion is the develop-ment of the share price in the allocation year. The benchmark used in this regard is the (weighted) ABN Amro RothschildGlobal Reinsurance Index. This index encompasses the performance of listed reinsurers worldwide. Depending upon theoutperformance or underperformance of this index, the EPS basic number is increased – albeit by at most 400% of theEPS basic number – or reduced – although by no more than 50% of the EPS basic number.
The maximum period of the stock appreciation rights is ten years, commencing at the end of the year in which they areawarded. Stock appreciation rights which are not exercised by the end of the 10-year period lapse. Stock appreciationrights may only be exercised after a waiting period and then only within four exercise periods each year. For 40% of thestock appreciation rights (first tranche of each allocation year) the waiting period is two years; for each additional 20%of the stock appreciation rights (tranches two to four of each allocation year) the waiting period is extended by oneyear. Each exercise period lasts for ten trading days, in each case commencing on the sixth trading day after the date ofpublication of the quarterly report of Hannover Rückversicherung AG.
Upon exercise of a stock appreciation right the amount paid out to the entitled party is the difference between the basicprice and the current market price of the Hannover Re share at the time of exercise. In this context, the basic pricecorresponds to the arithmetical mean of the closing prices of the Hannover Re share on all trading days of the first fullcalendar month of the allocation year in question. The current market price of the Hannover Re share at the time whenstock appreciation rights are exercised is determined by the arithmetical mean of the closing prices of the Hannover Reshare on the last twenty trading days prior to the first day of the relevant exercise period.
Notes 8.3 Share-based payment
171
The amount paid out is limited to a maximum calculated as a quotient of the total volume of compensation to be grantedin the allocation year and the total number of stock appreciation rights awarded in the year in question.
In the event of cancellation of the employment relationship or termination of the employment relationship as a conse-quence of a termination agreement or a set time limit, a holder of stock appreciation rights is entitled to exercise allsuch rights in the first exercise period thereafter. Stock appreciation rights not exercised in this period and those in respectof which the waiting period has not yet expired shall lapse. Retirement, disability or death of the member of manage-ment shall not be deemed to be termination of the employment relationship for the purpose of exercising stock appre-ciation rights.
The allocations for the years 2000, 2002 to 2004 as well as 2006 and 2007 gave rise to the following commitments inthe 2008 financial year. No allocations were made for 2001 or 2005:
Stock appreciation rights of Hannover Re
* Although the maximum amount was reached some participants did not exercise all stock appreciation rights
Notes 8.3 Share-based payment
Allocation year
2007 2006 2004 2003 2002 2000
Award date 28.03.2008 13.03.2007 24.03.2005 25.03.2004 11.04.2003 21.06.2001
Period 10 years 10 years 10 years 10 years 10 years 10 years
Waiting period 2 years 2 years 2 years 2 years 2 years 2 years
Basic price (in EUR) 34.97 30.89 27.49 24.00 23.74 25.50
Participants in year of issue 110 106 109 110 113 95
Number of rights granted 926,565 817,788 211,171 904,234 710,429 1,138,005
Fair Value at 31.12.2008 (in EUR) 2.45 2.86 4.48 3.62 3.43 1.73
Maximum value (in EUR) 10.79 10.32 24.62 8.99 8.79 5.49
Number of rights existing at 31.12.2008 926,565 805,931 161,146 135,159 10,607 8,028
Provisions at 31.12.2008 (in EUR million) 0.79 1.63 0.69 0.50 0.04 0.01
Amounts paid out in the 2008 financial year(in EUR million) – – 0.01 1.06 0.82 0.00
Expense in the 2008 financial year (in EUR million) 0.79 (0.06) (0.77) (0.13) 0.04 (0.03)*
172
Development of the stock appreciation rights of Hannover Re
In the 2008 financial year the waiting period expired for 100% of the stock appreciation rights awarded in 2000 and2002, 80% of those awarded in 2003 and 60% of those awarded in 2004. 93,747 stock appreciation rights from the2002 allocation year, 121,117 stock appreciation rights from the 2003 allocation year and 1,699 stock appreciationrights from the 2004 allocation year were exercised. The total amount paid out stood at EUR 1.89 million.
The stock appreciation rights of Hannover Re have developed as follows:
The existing stock appreciation rights are valued on the basis of the Black/Scholes option pricing model.
Notes 8.3 Share-based payment
Allocation year
Number of options 2007 2006 2004 2003 2002 2000
Granted in 2001 – – – – – 1,138,005
Exercised in 2001 – – – – – –
Lapsed in 2001 – – – – – –
Number of options at 31.12.2001 – – – – – 1,138,005
Granted in 2002 – – – – – –
Exercised in 2002 – – – – – –
Lapsed in 2002 – – – – – 40,770
Number of options at 31.12.2002 – – – – – 1,097,235
Granted in 2003 – – – – 710,429 –
Exercised in 2003 – – – – – –
Lapsed in 2003 – – – – 23,765 110,400
Number of options at 31.12.2003 – – – – 686,664 986,835
Granted in 2004 – – – 904,234 – –
Exercised in 2004 – – – – – 80,137
Lapsed in 2004 – – – 59,961 59,836 57,516
Number of options at 31.12.2004 – – – 844,273 626,828 849,182
Granted in 2005 – – 211,171 – – –
Exercised in 2005 – – – – 193,572 647,081
Lapsed in 2005 – – 6,397 59,834 23,421 25,974
Number of options at 31.12.2005 – – 204,774 784,439 409,835 176,127
Granted in 2006 – – – – – –
Exercised in 2006 – – – 278,257 160,824 153,879
Lapsed in 2006 – – 14,511 53,578 22,896 10,467
Number of options at 31.12.2006 – – 190,263 452,604 226,115 11,781
Granted in 2007 – 817,788 – – – –
Exercised in 2007 – – 12,956 155,840 110,426 3,753
Lapsed in 2007 – 8,754 13,019 38,326 10,391 –
Number of options at 31.12.2007 – 809,034 164,288 258,438 105,298 8,028
Granted in 2008 926,565 – – – – –
Exercised in 2008 – – 1,699 121,117 93,747 –
Lapsed in 2008 – 3,103 1,443 2,162 944 –
Number of options at 31.12.2008 926,565 805,931 161,146 135,159 10,607 8,028
Exercisable at 31.12.2008 – – 93,991 10,574 10,607 8,028
173
9. Other notes
9.1 Lawsuits
In the context of the acquisition of Lion Insurance Company, Trenton/USA, by Hannover Finance, Inc., Wilmington/USA– a subsidiary of Hannover Re –, a legal dispute exists with the former owners of Lion Insurance Company regarding therelease of a trust account in amount of around USD 13 million that serves as security for liabilities of the former ownersin connection with a particular business segment.
With the exception of the aforementioned proceedings, no significant court cases were pending during the year underreview or as at the balance sheet date – with the exception of proceedings within the scope of ordinary insurance andreinsurance business activities.
9.2 Contingent liabilities and commitments
Hannover Re has secured by subordinated guarantee a subordinated debt in the amount of USD 400.0 million issued inthe 1999 financial year by Hannover Finance, Inc., Wilmington/USA. In February 2004 and May 2005 Hannover Rebought back portions of the subordinated debt in an amount of altogether USD 380.0 million, leaving USD 20.0 millionstill secured by the guarantee. For further details please see Section 7.8 "Debt and subordinated capital".
Hannover Re has placed three subordinated debts on the European capital markets through its subsidiary HannoverFinance (Luxembourg) S.A. Hannover Re has secured by subordinated guarantee both the debt issued in 2001, the vol-ume of which now stands at EUR 138.1 million, and the debts from financial years 2004 and 2005 in amounts of EUR750.0 million and EUR 500.0 million respectively. For further details please see Section 7.8 "Debt and subordinatedcapital".
The guarantees given by Hannover Re for the subordinated debts attach if the issuer in question fails to render paymentsdue under the bonds. The guarantees cover the relevant bond volumes as well as interest due until the repaymentdates. Given the fact that interest on the bonds is partly dependent on the capital market rates applicable at the interestpayment dates (floating rates), the maximum undiscounted amounts that can be called cannot be estimated withsufficient accuracy. Hannover Re does not have any rights of recourse outside the Group with respect to the guaranteepayments.
8.4 Mortgages and loans
Employees who are not members of the Executive Board or Supervisory Board were granted mortgages and mortgageloans to finance residential property. These loans are all secured by a first charge on property. Bad debt losses did notexist and are not anticipated.
The calculations were based on the price of the Hannover Re share of EUR 21.91 as at 19 December 2008, expectedvolatility of 34.54% (historical volatility on a five-year basis), a dividend yield of 0.00% and risk-free interest rates of1.96% for the 2000 allocation year, 2.37% for the 2002 allocation year, 2.56% for the 2003 allocation year, 2.74%for the 2004 allocation year, 3.06% for the 2006 allocation year and 3.20% for the 2007 allocation year.
The average fair value of each stock appreciation right was EUR 1.73 for the 2000 allocation year, EUR 3.43 for the2002 allocation year, EUR 3.62 for the 2003 allocation year, EUR 4.48 for the 2004 allocation year, EUR 2.86 for the2006 allocation year and EUR 2.45 for the 2007 allocation year.
On this basis the aggregate provisions for the 2008 financial year amounted to EUR 3.7 million (EUR 5.7 million).
Notes 9.2 Contingent liabilities and commitments
174
In July 2004 Hannover Re and the other shareholders sold the participation that they held through Willy Vogel Betei-ligungsgesellschaft mbH in Willy Vogel AG. In order to secure the guarantees assumed under the purchase agreement,Hannover Re and the other shareholders jointly gave the purchaser a directly enforceable guarantee limited to a totalamount of EUR 7.1 million. Furthermore, in the event of a call being made on the guarantee Hannover Re and the othershareholders agreed that settlement would be based upon the ratio of participatory interests.
As security for technical liabilities to our US clients, we have established a master trust in the United States. As at thebalance sheet date this master trust amounted to EUR 2,352.8 million (EUR 2,088.3 million). The securities held in themaster trust are shown as available-for-sale investments. In addition, we extended further collateral to our cedants inan amount of EUR 269.3 million (31 December 2007: EUR 328.7 million) through so-called "single trust funds".
As part of our business activities we hold collateral available outside the United States in various blocked custody accountsand trust accounts, the total amount of which in relation to the Group's major companies was EUR 1,388.8 million (31 December 2007: EUR 1,235.1 million) as at the balance sheet date.
As security for our technical liabilities, various financial institutions have furnished sureties for our company in the formof letters of credit. The total amount of the letters of credit as at the balance sheet date was EUR 2,470.9 million (EUR 2,150.0 million).
For liabilities in connection with participating interests in real estate companies and real estate transactions HannoverRe Real Estate Holdings has furnished the usual collateral under such transactions to various banks, the amount ofwhich totalled EUR 85.5 million as at the balance sheet date.
Outstanding capital commitments with respect to special investments exist on the part of the Group in an amount ofEUR 291.1 million (EUR 235.2 million). These primarily involve as yet unfulfilled payment obligations from participa-tions entered into in private equity funds and venture capital firms.
Within the scope of a novation agreement regarding a life insurance contract we assumed contingent reinsurance com-mitments with respect to due date and amount. Hannover Re decided to exercise its right of novation early and assumethe contract as at 31 December 2008. The payment of EUR 28.1 million due as a consequence of exercise of the rightof novation encompasses both the repurchase of the estimated reinsurance commitment amounting to EUR 10.3 millionand EUR 17.8 million in expected discounted repayments plus interest for the years 2009 to 2011.
By way of declarations dated 11 and 20 November 2008 E+S Rück participated in a counter-guarantee given by the in-surance industry in a maximum amount of EUR 8.5 billion for the guarantee put up by the Federal Republic of Germanyas part of a rescue package for Hypo Real Estate Holding AG, Munich, and its subsidiaries ("HRE Group"). In this connec-tion the Federal Republic of Germany guarantees repayment of capital and interest to the German Bundesbank, whichis to extend a loan to the HRE Group, as well as to the holders of newly issued debentures, through which further fundsare to be made available to the HRE Group. The insurance industry assumes a portion of this guarantee amount put upby the federal government through the aforementioned counter-guarantee. The participating insurers are liable sever-ally, but not jointly. E+S Rück's interest in this counter-guarantee is limited to a nominal amount of EUR 11.1 million(rounded).
Notes 9.2 Contingent liabilities and commitments
175
9.3 Long-term commitments
Following the termination of the German Aviation Pool with effect from 31 December 2003, our participation consistsof the run-off of the remaining contractual relationships.
Several Group companies are members of the association for the reinsurance of pharmaceutical risks and the associationfor the insurance of German nuclear reactors. In the event of one of the other pool members failing to meet its liabilities,an obligation exists to take over such other member's share within the framework of the quota participation.
9.4 Rents and leasing
Leased property
Future leasing commitments
Operating leasing contracts produced expenditures of EUR 2.7 million (EUR 3.5 million) in the year under review.
Rented propertyAltogether, non-cancellable contracts will produce the rental income shown below in subsequent years.
Figures in EUR thousandPayments
to be received
2009 1,447
2010 1,375
2011 588
2012 588
2013 588
Subsequent years –
Rental income
Rental income totalled EUR 1.5 million (EUR 1.7 million) in the year under review.
The rental income resulted principally from the renting out of a property by Hannover Real Estate Holdings. This non-cancellable transaction has a remaining term of two years with an option to renew for a further five years.
Notes 9.4 Rents and leasing
Figures in EUR thousand Payments
2009 3,362
2010 3,294
2011 2,773
2012 2,016
2013 1,468
Subsequent years 6,157
176
9.5 Currency translation
Items in the annual financial statements of Group subsidiaries were measured in the currencies of the economic envir-onment in which the subsidiary in question primarily operates. These currencies are referred to as functional currencies.The euro is the reporting currency in which the consolidated financial statement is prepared.
Foreign currency items in the individual companies' statements of income are converted into the respective functionalcurrency at the average rates of exchange. The individual companies' statements of income prepared in the nationalcurrencies are converted into euro at the average rates of exchange and transferred to the consolidated financial state-ment. The conversion of foreign currency items in the balance sheets of the individual companies and the transfer ofthese items to the consolidated financial statement are effected at the mean rates of exchange on the balance sheetdate. In accordance with IAS 21 "The Effects of Changes in Foreign Exchanges Rates" differences from the currencytranslation of financial statements of foreign Group companies must be recognised in the consolidated financial state-ment as a separate item in shareholders' equity. Currency translation differences resulting from long-term loans orlendings without specified maturity between Group companies are similarly recognised outside the statement of incomein a separate item of shareholders' equity.
Transactions in foreign currencies reported in Group companies' individual financial statements are converted into thereporting currency at the transaction rate. In accordance with IAS 21 the recognition of exchange differences on trans-lation is guided by the nature of the underlying balance sheet item.
Exchange differences from the translation of monetary assets and liabilities are recognised directly in the statement ofincome.
Currency translation differences from the translation of non-monetary assets measured at fair value via the statementof income are recognised with the latter as profit or loss from fair value measurement changes.
Exchange differences from non-monetary items – such as equity securities – classified as available for sale are initiallyrecognised outside income in a separate item of shareholders' equity and only booked to income when such non-monetaryitems are settled.
Notes 9.5 Currency translation
177
9.6 Fee paid to the auditor
Total fees of EUR 6.6 million (EUR 6.5 million) were incurred for accountants' services throughout the Hannover ReGroup worldwide in the year under review. They were principally comprised of auditing and tax consultancy fees.
Of this total amount, EUR 2.2 million (EUR 1.5 million) was attributable to the fee paid to the appointed auditor of theconsolidated financial statement as defined by § 318 German Commercial Code (HGB). The amount includes a fee ofEUR 2.0 million (EUR 1.2 million) for the auditing of the financial statement, EUR 0.1 million (EUR 0.2 million) for taxconsultancy services and EUR 0.1 million (EUR 0.1 million) for consultancy and other services performed for the parentor subsidiary companies.
9.7 Events after the balance sheet date
As notified in a press release dated 23 February 2009, the acquisition announced on 23 January 2009 of a significantUS individual life reinsurance portfolio under a reinsurance and asset purchase transaction with Scottish Re GroupLimited, Hamilton, Bermuda, has been completed. Hannover Re will assume all technical liabilities associated with thebusiness and will in turn receive assets to fund those liabilities from Scottish Re. In addition to assuming the business,Hannover Re will acquire the policy administration systems of Scottish Re as well as other assets supporting the USmortality reinsurance business. The acquisition includes all operating assets required to administer the business. Han-nover Re will also employ part of Scottish Re's staff, thus ensuring operational continuity and a transfer of know-how. In2009 this business is estimated to generate a premium volume of around USD 1.2 billion. The acquisition of the port-folio will be accretive to the Hannover Re's Group net income from 2009. The transaction has been approved by thecompetent regulatory authorities.
Winter storm “Klaus”, which moved across southern France and northern Spain at the end of January, caused insureddamage of around EUR 1.0 billion. In this connection Hannover Re anticipates a net burden of losses in the order ofEUR 70 million.
Notes 9.7 Events after the balance sheet date
Key exchange rates
1 EUR corresponds to: Mean rate of exchange on the balance sheet date Average rate of exchange
31.12.2008 31.12.2007 2008 2007
AUD 2.0257 1.6775 1.7437 1.6385
BHD 0.5312 0.5530 0.5563 0.5176
CAD 1.7160 1.4440 1.5561 1.4700
CNY 9.6090 10.7400 10.2693 10.4308
GBP 0.9600 0.7346 0.7985 0.6861
HKD 10.8323 11.4760 11.4733 10.7171
KRW 1,775.0000 1,377.0000 1,602.6923 1,274.6923
MYR 4.8700 4.8652 4.9064 4.7131
SEK 10.9150 9.4350 9.6662 9.2458
USD 1.3977 1.4716 1.4739 1.3743
ZAR 13.1698 10.0300 11.9514 9.6499
178
Responsibility statement
To the best of our knowledge, and in accordance with the applicable reporting principles, the consolidated financialstatements give a true and fair view of the assets, liabilities, financial position and profit or loss of the Group, and theGroup management report includes a fair review of the development and performance of the business and the positionof the Group, together with a description of the principal opportunities and risks associated with the expected devel-opment of the Group.
Hannover, 4 March 2009
Executive Board
Zeller Arrago Dr. Becke
Gräber Dr. König Dr. Pickel Wallin
Notes responsibility statement
179179
AUDITORS'report
We have audited the consolidated financial statements prepared by the Hannover Rückversicherung AG, Hannover,comprising the balance sheet, the income statement, statement of changes in equity, cash flow statement and thenotes to the consolidated financial statements, together with the group management report for the business year from1 January to 31 December 2008. The preparation of the consolidated financial statements and the group manage-ment report in accordance with IFRS, as adopted by the EU, and the additional requirements of German commercial lawpursuant to § 315a Para 1 HGB and supplementary provisions of the articles of incorporation are the responsibility ofthe parent company's management. Our responsibility is to express an opinion on the consolidated financial state-ments and on the group management report based on our audit.
We conducted our audit of the consolidated financial statements in accordance with § 317 HGB and German generallyaccepted standards for the audit of financial statements promulgated by the Institut der Wirtschaftsprüfer (IDW). Thosestandards require that we plan and perform the audit such that misstatements materially affecting the presentation ofthe net assets, financial position and results of operations in the consolidated financial statements in accordance withthe applicable financial reporting framework and in the group management report are detected with reasonable assur-ance. Knowledge of the business activities and the economic and legal environment of the Group and expectations asto possible misstatements are taken into account in the determination of audit procedures. The effectiveness of theaccounting-related internal control system and the evidence supporting the disclosures in the consolidated financialstatements and the group management report are examined primarily on a test basis within the framework of the audit.The audit includes assessing the annual financial statements of those entities included in consolidation, the determin-ation of entities to be included in consolidation, the accounting and consolidation principles used and significant esti-mates made by management, as well as evaluating the overall presentation of the consolidated financial statementsand group management report. We believe that our audit provides a reasonable basis for our opinion.
Our audit has not led to any reservations.
In our opinion, based on the findings of our audit, the consolidated financial statements comply with IFRS, as adoptedby the EU, the additional requirements of German commercial law pursuant to § 315a Abs. 1 HGB and supplementaryprovisions of the articles of incorporation and give a true and fair view of the net assets, financial position and results ofoperations of the Group in accordance with these requirements. The group management report is consistent with theconsolidated financial statements and as a whole provides a suitable view of the Group’s position and suitably presentsthe opportunities and risks of future development.
Hannover, 5 March 2009
KPMG AG Wirtschaftsprüfungsgesellschaft
(formerly KPMG Deutsche Treuhand-GesellschaftAktiengesellschaft Wirtschaftsprüfungsgesellschaft)
Husch Dr. DahlWirtschaftsprüfer Wirtschaftsprüfer
180
REPORT BY THE SUPERVISORY BOARD of Hannover Re for the Hannover Re Group
In our function as the Supervisory Board we considered at length during the 2008 financial year the position and devel-opment of the company and its major subsidiaries. We advised the Executive Board on the direction of the company andmonitored the management of business on the basis of written and verbal reports from the Executive Board. The Super-visory Board held four meetings in order to adopt the necessary resolutions after appropriate discussion. A resolutionwas adopted by a written procedure with respect to one matter requiring attention at short notice. Furthermore, we re-ceived quarterly written reports from the Executive Board on the course of business and the position of the companyand the Group pursuant to § 90 German Stock Corporation Act. No audit measures pursuant to § 111 Para. 2 GermanStock Corporation Act were required in the 2008 financial year. The reports provided by the Executive Board contain,inter alia, up-to-date details of the current planned and expected figures for the individual business groups. The report-ing also covers strains from major losses as well as the investment portfolio, investment income, the ratings of the vari-ous Group companies and the development of the Group's global workforce. The quarterly reports with the quarterlyfinancial statements and key figures for the Hannover Re Group constituted a further important source of informationfor the Supervisory Board. We received an analysis of the 2007 results in non-life and life/health reinsurance as well asa presentation from the Executive Board covering the profit expectations for the 2008 financial year and the oper-ational planning for the 2009 financial year. In addition, the Chairman of the Supervisory Board was constantly advisedby the Chairman of the Executive Board of major developments and impending decisions as well as of the risk situationwithin the company and the Group. All in all, we were involved in decisions taken by the Executive Board and assuredourselves of the lawfulness, regularity and efficiency of the company's management as required by our statutory re-sponsibilities and those placed upon us by the company's Articles of Association.
Key points of deliberation
In addition to its discussion of a sizeable planned acquisition, the Supervisory Board obtained information about theimplications for the year-end result of the international financial crisis and the above-average burden of losses, aboutthe effects of movements in exchange rates on the balance sheet and statement of income as well as about the impactof the Act on the Modernisation of Accounting Law (BilMoG) on the work of the Supervisory Board. The operationalplanning for 2009 was also the subject of intense discussion. The reasons for divergences in the course of business fromthe applicable planned figures and targets in the financial year just-ended were explained to us, and we reconciledthese deviations accordingly.
As part of its discussion of important individual projects the Supervisory Board considered, inter alia, the sale of a 1%interest and the granting of a purchase option on a further 2% interest in E+S Rückversicherung AG by Hannover RückBeteiligung Verwaltungs-GmbH to Mecklenburgische Versicherungsgruppe. It also examined the authorisation processfor real estate acquisitions and approved the revised strategic principles and objectives as well as updated Rules of Pro-cedure for the Executive Board, in which the canon of measures and transactions subject to approval was extended infavour of the Supervisory Board. Last but not least, the Supervisory Board approved a capital increase at Hannover LifeReassurance Company of America in Orlando/USA.
Committees of the Supervisory Board
Of the committees formed by the Supervisory Board within the meaning of § 107 Para. 3 German Stock CorporationAct, the Balance Sheet Committee met twice and the Standing Committee met on three occasions. The Chairman of theSupervisory Board updated the full Supervisory Board on the committees' major deliberations at the next meeting.
181
Report by the Supervisory Board
The Balance Sheet Committee considered inter alia the consolidated financial statement drawn up in accordance withIFRS and the individual financial statement of the parent company Hannover Re drawn up in accordance with theGerman Commercial Code (HGB) and discussed with the auditors the reports submitted by the independent auditor onthese financial statements. As in the previous year, an expert opinion on the adequacy of the loss reserves in non-lifereinsurance, a review of the accumulated prefinancing volume in life reinsurance including a comparison of the expectedreturn flows with the repayments actually made as well as the risk report pursuant to the Act on Control and Trans-parency (KonTraG), the report on compliance with Corporate Governance principles and reports on the major subsid-iaries were received and discussed. In addition, the Committee examined the investment structure and investment in-come – including stress tests with regard to the investments and their implications for net income and the equity base –and defined the audit concentrations for the 2008 financial year as well as the auditors' fee. The criteria used for equityallocation within the Group, a comparison of target returns with the actual returns delivered by the individual businessgroups as well as the equity resources and rating implications constituted further key areas of deliberation.
In view of the impending retirement of the Chief Executive Officer, the Standing Committee deliberated throughout theyear over the medium- and long-term planning for the overall composition of the Executive Board. As a result, it issuedrecommendations to the full Supervisory Board regarding the reappointment / non-reappointment of members of theExecutive Board. In particular, the committee attended to the identification of internal and external candidates for ap-pointment as the new Chief Executive Officer, undertook an in-depth evaluation of the short-listed candidates includingconsultations with an outside psychologist and on this basis submitted an appropriate proposal to the full SupervisoryBoard. In addition, the Standing Committee determined the performance bonuses of the members of the ExecutiveBoard for the 2007 financial year and the overall number of stock participation rights to be awarded to the ExecutiveBoard for the 2008 financial year. For the 2009 financial year recommendations were drawn up for the full SupervisoryBoard regarding the specification of the target performance (target EPS) and the total volume of remuneration to begranted.
Since no elections to the Supervisory Board were upcoming, the Nomination Committee set up in 2007 did not meet.
Corporate Governance
The Supervisory Board once again devoted considerable attention to the issue of Corporate Governance and closelyexamined, inter alia, the company's business principles, which were thoroughly revised against the backdrop of variouschanges in legislation and the amended version of the German Corporate Gover?nance Code (DCGK). A good deal oftime was also spent on the debate surrounding the recommendations of the German Corporate Governance Code Gov-ernment Commission as amended 6 June 2008 published by the Federal Ministry of Justice. In particular, the redefinedCode Items 4.2.3 Para. 4 (cap on severance payments in management board contracts) and 4.2.2 Para.1 (responsibilityof the full supervisory board for the system of remuneration paid to the management board) were discussed at length.Despite the high importance that the Supervisory Board attaches to the standards of good and responsible enterprisemanagement defined in the German Corporate Gover?nance Code, the Supervisory Board decided not to comply withthe recommendation concerning a cap on severance payments in management board contracts. The justification in thisrespect is provided in the Declaration of Conformity pursuant to § 161 German Stock Corporation Act regarding com-pliance with the German Corporate Governance Code, which is reproduced in this Annual Report in the Corporate Gov-ernance report together with further information on this topic. The reader is further referred to the company's publica-tions in the Internet in relation to this topic.
182
Report by the Supervisory Board
Audit of the annual financial statements and consolidated financial statements
The accounting, annual financial statements, consolidated financial statements and the corresponding managementreports were audited by KPMG AG Wirtschaftsprüfungsgesellschaft (KPMG AG), formerly KPMG Deutsche Treuhand-Gesellschaft Aktiengesellschaft Wirtschaftsprüfungsgesellschaft, Hannover. The Supervisory Board selected the auditorfor the audit and the Balance Sheet Committee awarded the concrete audit mandate. In addition to the usual audittasks, the audit focused particularly on the documentation of the internal control system for the preparation of the an-nual financial statements as well as the translation of foreign currencies in accordance with the German CommercialCode. In the context of the consolidated financial statements to be drawn up by Hannover Re in accordance with Inter-national Financial Reporting Standards (IFRS), the auditors were required to subject the implementation of IFRS 7(Financial Instruments), the preparation for implementation of IFRS 8 (Operating Segments) and the definition of thescope of consolidation, especially with respect to special purpose entities (IAS 27, SIC 12), to particular scrutiny. Themandate for the review report by the independent auditors on the interim financial report as at 30 June 2008 wasagain also awarded. The special challenges associated with the international aspects of the audits were met withoutreservation. Since the audits did not give rise to any objections KPMG AG issued unqualified audit certificates. TheBalance Sheet Committee discussed the annual financial statements and the management reports with the participa-tion of the auditors and in light of the audit reports, and it informed the Supervisory Board of the outcome of its exam-ination. The audit reports were distributed to all members of the Supervisory Board and scrutinised in detail – with theparticipation of the auditors – at the Supervisory Board meeting held to consider the annual results. The auditors willalso be present at the Annual General Meeting.
The report on the company's relations with affiliated companies drawn up by the Executive Board has likewise beenexamined by KPMG AG and given the following unqualified audit certificate:
"Having audited the report in accordance with our professional duties, we confirm that
1. its factual details are correct;
2. in the case of the transactions detailed in the report, the expenditure of the company was not unreasonably high.“
We have examined
a) the annual financial statements of the company and the management report prepared by the Executive Board,
b) the consolidated financial statements of the Hannover Re Group and the Group management report prepared by the Executive Board and
c) the report of the Executive Board pursuant to § 312 German Stock Corporation Act (Report on relations with affiliated companies)
– in each case drawn up as at 31 December 2008 – and have no objections. Nor do we have any objections to the state-ment reproduced in the dependent company report. The Supervisory Board thus concurred with the opinions of theauditors and approved the annual financial statements and the consolidated financial statements; the annual financialstatements are thereby adopted.
Report by the Supervisory Board
183
Changes on the Supervisory Board and the Executive Board
There were no changes in the composition of the Supervisory Board or the Executive Board in the year under review. Atits meeting on 5 November 2008 the Supervisory Board extended the appointment of Mr. André Arrago and Mr. UlrichWallin as members of the company's Executive Board until 31 August 2014. At an extraordinary meeting of the Super-visory Board held on 21 January 2009 Mr. Wallin was appointed as the new Chief Executive Officer of the company witheffect from 1 July 2009. Mr. Wallin will succeed Mr. Zeller, who is stepping down from the company's Executive Board atthe end of June 2009 at the age of 65.
At the same meeting the decision was taken to terminate the mandate of Dr. Elke König as a member of the company'sExecutive Board on the most amicable terms effective 31 March 2009. The Supervisory Board expressed its thanks andappreciation to Dr. König for her considerable personal dedication and her successful work on behalf of the HannoverRe Group. Mr. Roland Vogel was appointed to succeed Dr. König as a deputy member of the Executive Board with effectfrom 1 April 2009 for a period of three years.
Word of thanks to the Executive Board and members of staff
The Supervisory Board thanks the members of the Executive Board and all staff for their work in the year under review.
Hannover, 10 March 2009
For the Supervisory Board
Wolf-Dieter Baumgartl Chairman
184
In past years Hannover Re was in compliance with all recommendations of the German Corporate Governance Code(DCGK). This continued to be the case in the present year, insofar as implementation of the German Corporate Gover-nance Code as amended 14 June 2007 is concerned. We diverged with respect to one item of the Code as amended6 June 2008. The item in question involves a recommendation adopted with the most recent amendment of the Codeto the effect that a severance cap should be included when new management contracts are drawn up or existing onesrenewed. The reasons for our decision are explained in the Declaration of Conformity contained in this report.
An independent survey of acceptance of the Code's recommendations and suggestions conducted by the Berlin Centerof Corporate Governance found that Hannover Re once again – as in previous years – ranked as one of the leadersamong MDax-listed companies when it came to compliance with the provisions of the Code. On average, companies listedon the MDax satisfied just 74 of the 80 recommendations of the Code as amended 14 June 2007, leaving the level ofacceptance unchanged at 92.4%.
As we had already explained at this juncture in the previous year, good enterprise management and supervision in thespirit of state-of-the-art Corporate Governance continues to be enshrined in Hannover Re's business practices as amatter of course. This is already evident from the fact that the Executive Board and Supervisory Board consistently ad-dress changes in the relevant legal framework conditions in a timely manner and the latest legal developments arepromptly codified in internal corporate standards. The company's Business Principles, for example, were subjected to athorough review in order to maintain Hannover Re's very good reputation and – by setting high standards – to shape a lasting and above all favourable image of our company in the perception of our shareholders, business partners andthe public at large.
With an eye to the theme of compliance, we informed you last year that explicit responsibility for this issue is now en-shrined within the schedule of responsibility of the Executive Board and the Balance Sheet Committee of the SupervisoryBoard. Since then, the Executive Board has regularly briefed the Balance Sheet Committee in detailed reports on thelatest developments and activities in this area. The goal of these efforts is to prevent any infractions of the law and toensure that every single employee and officer at Hannover Re conducts themselves with integrity, irrespective ofwhether the matter at hand is one of antitrust law, compliance with national and international embargo regulations orequal treatment and non-discrimination.
The resolutions adopted by the Government Commission on the German Corporate Governance Code on 6 June 2008regarding the further refinement of the Code in the area of management board remuneration were discussed at lengthby the Supervisory Board. In this regard, it was agreed that the company should comply with the recommendationcontained in Item 4.2.2 Para. 1 of the Code. At its first meeting of 2009 the full Supervisory Board will therefore decideupon the remuneration system for the Executive Board, including the major contractual components, and subsequentlysubject this to regular review.
The activities described here testify to the considerable significance that the Executive Board and Supervisory Boardattach to the issue of Corporate Governance. All these efforts are driven by the goal of bringing about sustained growthin the value of the company and strengthening and consolidating on a lasting basis the trust placed in the enterprise byour shareholders, business partners, clients, employees and the general public. On this basis Hannover Re supports theprinciples of value-based and transparent enterprise management and supervision as defined in the German CorporateGovernance Code (DCGK) and recognises their importance in guiding its activities.
In the year just-ended we again devoted considerable attention to our communication with the financial market anddeveloped an impressive range of Investor Relations activities. For further details please see the section entitled "TheHannover Re share" in this Annual Report.
CORPORATE GOVERNANCE report
185
Corporate Governance report
Remuneration report for the Executive Board and individualised disclosure of theremuneration received by Supervisory Board members pursuant to Items 4.2.5 and 5.4.7 of the German Corporate Governance Code
The information regarding these items is provided in the remuneration report.
Securities transactions pursuant to Item 6.6 of the German Corporate Governance Code
With regard to this information we would also refer the reader to the remuneration report.
Shareholdings pursuant to Item 6.6 of the German Corporate Governance Code
Information in this respect is similarly provided in the remuneration report.
Share-based payment pursuant to Item 7.1.3of the German Corporate Governance Code
Information regarding this topic is provided under Item 8.3 of the notes and in the remuneration report with respect tothe members of the Executive Board.
Remuneration report
The remuneration report summarises the principles used to determine the remuneration of the Executive Board ofHannover Re and explains the amount of the income received by the Executive Board in the 2008 financial year on thebasis of the Board members' work for Hannover Re and its affiliated companies. In addition, the amount of the remuner-ation paid to the Supervisory Board on the basis of its work for Hannover Re and its affiliated companies and the prin-ciples according to which this remuneration is determined are explained.
The remuneration report is based on the recommendations of the German Corporate Governance Code and containsinformation which forms part of the notes to the 2008 consolidated financial statement as required by IAS 24 "RelatedParty Disclosures". In addition, we took into account the more specific provisions of DRS 17 "Reporting on the Remunerationof Members of Governing Bodies". Under German commercial law, too, this information includes data specified asmandatory for the notes (§ 314 HGB) and the management report (§ 315 HGB). These details are discussed as a wholein the remuneration report. Consequently, we have not provided any further explanation of the information discussed in the remuneration report in the Group management report or the notes to the consolidated financial statement.
186
Corporate Governance report
Remuneration of the Executive Board
ResponsibilityThe Supervisory Board has delegated responsibility for determination of the amount of the remuneration paid toHannover Re's Executive Board to the Standing Committee.
ObjectiveThe purpose of the remuneration system for the Executive Board is to appropriately recompense the members of theExecutive Board according to their scope of activity and responsibility. In this context, a large variable portion of thetotal remuneration makes direct allowance for the joint and individual performance of the Executive Board as well asfor the performance of the company.
Structure of the remuneration received by the Executive BoardWith this objective in mind, the remuneration system consists of three components: fixed emoluments, a variable bonusas well as a share-based remuneration component based on a virtual stock option plan with a long-term incentive effectand risk elements.
The fixed emoluments, paid in twelve monthly instalments, are guided by the professional experience and area ofresponsibility of the Board member in question.
The variable bonus is cash compensation measured by the performance in the financial year; half is based on the indi-vidual Board member's profit contribution and half on the net income generated by the Group as a whole.
The members of the Executive Board are entitled to receive stock appreciation rights under the virtual stock optionplan implemented in 2000 for certain members of the Group's management.
The content of the stock option plan is based solely on the Conditions for the Granting of Stock Appreciation Rights.Under these conditions, stock appreciation rights are awarded separately for each financial year provided the internaland external performance criteria defined in advance by the Supervisory Board are met.
The internal performance criterion is satisfied upon achievement of the target diluted earnings per share (EPS) calculatedin accordance with IAS 33 "Earnings Per Share". The external performance criterion is the increase in the value of theHannover Re share. The benchmark used to measure this increase in value is the weighted ABN Amro Global ReinsuranceIndex. The benchmarks cannot be retrospectively altered.
Exercise of the stock appreciation rights does not give rise to any entitlement to the delivery of Hannover Re stock, butmerely to payment of a cash amount linked to the performance of the Hannover Re share. The amount paid out is limitedto a maximum calculated as a quotient of the total volume of compensation to be granted in the allocation year andthe total number of stock appreciation rights awarded in the year in question.
For further details of the virtual stock option plan please see the explanations provided in the notes to this Group AnnualReport, Section 8.3 "Share-Based Payment".
187
Corporate Governance report
In the 2008 financial year 215,280 stock appreciation rights totalling EUR 0.5 million (EUR 1.2 million) were grantedfor the 2007 allocation year; stock appreciation rights granted in previous years were exercised in an amount of EUR0.4 million (EUR 0.4 million).
As at 31 December 2008 the members of the Executive Board had at their disposal a total of 484,232 (319,444)granted, but not yet exercised stock appreciation rights with a fair value of EUR 1.4 million (EUR 2.2 million).
The Annual General Meeting of Hannover Re held on 12 May 2006 resolved by a voting majority of 85.5% to avail itselfuntil 31 December 2010 of the option contained in the Act on the Disclosure of Management Remuneration (VorstOG)not to specify the remuneration of the Executive Board on an individualised basis by name for a period of at most fiveyears from the date when the resolution is adopted.
Retirement provisionThe pension agreements of the members of the Executive Board with Hannover Re contain commitments to an annualretirement pension calculated as a percentage of the fixed annual emoluments. There were seven individual com-mitments to the active Board members in the year under review. An amount of EUR 1.5 million (EUR 2.0 million) wasallocated to the provision for pensions in the year under review. This includes the allocation to the employee-fundedprovision constituted from deferred compensation – an allocation that was made from the variable bonus for the previousyear. The provision for pensions stood at EUR 9.9 million (EUR 8.4 million) as at 31 December 2008.
The remuneration paid to former members of the Executive Board and their surviving dependants, for whom elevenpension commitments existed, totalled EUR 1.3 million (EUR 0.9 million) in the year under review. Altogether, anamount of EUR 10.7 million (EUR 9.8 million) has been set aside for these commitments.
Amount of remuneration received by the Executive BoardThe total remuneration received by the Executive Board of Hannover Re on the basis of its work for Hannover Re and itsaffiliated companies is calculated from the sum of all compensation accruing in cash as well as in pecuniary advantagesfrom non-cash compensation. It can be broken down as follows in the year under review:
Figures in EUR thousand 2008 2007
Compensation in cash
Fixed emoluments 1,909.2 1,782.1
Variable bonuses for the previous year 2,689.2 2,228.7
Remuneration from Group companies netted with the bonus 145.3 145.7
(Stock appreciation rights awarded 527.3 1,197.9)
Stock appreciation rights executed 449.7 433.8
5,193.4 4,590.3
Taxable amount from non-cash compensation 91.1 84.9
Total 5,284.5 4,675.2
Total remuneration received by the Executive Board
188
Sideline activities of the members of the Executive BoardThe members of the Executive Board require the approval of the Supervisory Board to take on sideline activities. Thisensures that neither the remuneration granted nor the time required for this activity can create a conflict with theirresponsibilities on the Executive Board. If the sideline activities involve seats on supervisory boards or comparable con-trol boards, these are listed and published in the Annual Report of Hannover Re. The remuneration received for super-visory board seats at Group companies is deducted when calculating the variable bonus and shown separately in theabove table.
Remuneration of the Supervisory Board
The remuneration of the Supervisory Board is determined by the Annual General Meeting of Hannover Re and regulatedby the Articles of Association.
In accordance with § 12 of the Articles of Association as amended on 3 August 2007, the members of the SupervisoryBoard receive fixed annual remuneration of EUR 10,000 per member in addition to reimbursement of their expenses.Furthermore, each member of the Supervisory Board receives variable remuneration of 0.03%o of the operating profit(EBIT) reported by the company in the consolidated financial statement drawn up in accordance with InternationalFinancial Reporting Standards (IFRS). Variable remuneration is not paid if the EBIT is negative.
In addition, the members of the Balance Sheet Committee formed by the Supervisory Board receive an emolument of30% of the previously described fixed and variable remuneration for their committee work. The members of the StandingCommittee formed by the Supervisory Board receive an additional emolument of 15% of the previously described fixedand variable remuneration for their committee work.
The Chairman of the Supervisory Board or of a Committee receives three times the aforementioned amounts, while aDeputy Chairman receives one-and-a-half times the said amounts.
No remuneration was approved for the members of the Nomination Committee.
The remuneration for a financial year is due upon completion of the Annual General Meeting that ratifies the acts ofthe Supervisory Board for the financial year in question. Value-added tax payable upon the remuneration is reimbursedby the company.
Corporate Governance report
189
All the members of the Supervisory Board receive an attendance allowance of EUR 500 for their participation in eachmeeting of the Supervisory Board and the Committees. These fees are included in the reported remuneration.
In the year under review no payments or benefits were granted to members of the Supervisory Board in return for servicesprovided individually outside the committee work described above, including for example consulting or mediation services,with the exception of the remuneration paid to employee representatives on the basis of their employment contracts.
Corporate Governance report
* Employee representatives
Individual remuneration received by the members of the Supervisory Board in the year under review
Figures in EUR thousand 2008 2007
Name Function
Wolf-Dieter Baumgartl Chairman of the – Supervisory Board– Standing Committee– Balance Sheet Committee – Nomination Committee 243.0 185.6
Dr. Klaus Sturany Deputy Chairman of the Supervisory Board Member of the Standing Committee 71.6 49.7
Dr. Paul Wieandt Deputy Chairman of the Supervisory Board (until 20 March 2007) 17.7 74.1
Herbert K. Haas Member of the– Supervisory Board– Standing Committee– Balance Sheet Committee – Nomination Committee 163.9 107.9
Karl Heinz Midunsky Member of the– Supervisory Board– Nomination Committee 47.8 43.6
Dr. Erhard Schipporeit Member of the– Supervisory Board– Nomination Committee 42.9 3.6
Dr. Immo Querner Member of the Supervisory Board 87.8 35.7
Otto Müller* Member of the Supervisory Board 47.8 43.6
Renate Schaper-Stewart* Member of the Supervisory Board (until 2 May 2007) 15.2 42.4
Dipl.-Ing. Hans-Günter Siegerist* Member of the Supervisory Board (until 2 May 2007) 12.8 35.6
Uwe Kramp* Member of the Supervisory Board 32.0 1.2
Gert Waechtler* Member of the Supervisory Board 32.0 1.2
Total 814.5 624.2
190
Loans to members of the management boards and contingent liabilities
In order to avoid potential conflicts of interest, Hannover Re may only grant loans to members of the Executive Board orthe Supervisory Board or their dependants with the approval of the Supervisory Board.
In 2008 no loan relationships existed with members of Hannover Re's Executive Board or Supervisory Board, nor did thecompany enter into any contingent liabilities for members of the management boards.
Securities transactions and shareholdings (directors' dealings)
Dealings in shares, options and derivatives of Hannover Rückversicherung AG effected by members of the ExecutiveBoard or Supervisory Board of Hannover Re or by other persons with managerial functions who regularly have access toinsider information concerning the company and who are authorised to take major business decisions – as well as suchdealings conducted by certain persons closely related to the aforementioned individuals – in excess of EUR 5,000 are tobe reported pursuant to § 15a Securities Trading Act (WpHG). The following reportable transactions took place in the2008 financial year.
Members of the Supervisory Board and Executive Board of Hannover Re as well as their spouses or registered partnersand first-degree relatives hold less than 1.0% of the issued shares. As at 31 December 2008 the total holding amountedto 0.058% (0.031%) of the issued shares, i.e. 69,991 (37,096) shares.
German Corporate Governance Code
The company is in compliance with the recommendations of the Code as amended 14 June 2007 in all respects. Itdiverges from the recommendations of the Code as amended 6 June 2008 in one respect (cf. specifically the Declarationof Conformity below).
Name Type of transaction
Type of security ISIN Transaction
dateNumber ofsecurities
Price in EUR
Total volume in EUR
Wilhelm Zeller Sale Bond XS0126063386 23.01.2008 251) 101.95 25,487.50
Wilhelm Zeller Purchase Share DE0008402215 23.01.2008 1,000 28.00 28,000.00
Wilhelm Zeller Purchase Share DE0008402215 18.11.2008 2,115 20.902) 44,193.00
André Arrago Purchase Share DE0008402215 07.11.2008 4,100 16.80 68,880.00
André Arrago Purchase Share DE0008402215 11.11.2008 25,900 16.80 435,120.00
Securities transactions
1) The bonds have a nominal value of EUR 1,000.00 each2) Rounded, the average price was EUR 20.89504
Corporate Governance report
191
Declaration of Conformity pursuant to § 161 Stock Corporation Act (AktG) regardingcompliance with the German Corporate Governance Code at Hannover Rückversicherung AG
The German Corporate Governance Code sets out major statutory requirements governing the management and super-vision of German listed companies. It contains both nationally and internationally recognised standards of good andresponsible enterprise management. The purpose of the Code is to foster the trust of investors, clients, employees andthe general public in German enterprise management. Under § 161 Stock Corporation Act (AktG) it is incumbent onthe Management Board and Supervisory Board of German listed companies to provide an annual declaration of confor-mity with the recommendations of the "German Corporate Governance Code Government Commission" published bythe Federal Ministry of Justice or to explain which recommendations of the Code were/are not applied.
The Executive Board and Supervisory Board declare pursuant to § 161 Stock Corporation Act (AktG) that in its imple-mentation of the German Corporate Governance Code Hannover Rückversicherung AG was in compliance with allrecommendations contained in the version dated 14 June 2007, while it diverged in one respect in its implementationof the version of the Code dated 6 June 2008:
Code Item 4.2.3 Para. 4; Caps on severance payments in Management Board contractsPremature termination of a service contract without serious cause may only take the form of cancellation by mutualconsent. Even if the Supervisory Board insists upon setting a severance cap when concluding or renewing an ExecutiveBoard contract, this does not preclude the possibility of negotiations also extending to the severance cap in the eventof a member leaving the Executive Board. Whilst it is true that the legal literature discusses structuring options thatwould permit the legally secure implementation of the recommendation contained in Item 4.2.3 Para. 4, it is, however,open to question whether qualified candidates for a position on the company's Executive Board would accept appro-priate clauses. In addition, the scope for negotiation over a member leaving the Executive Board would be restricted,which could be particularly disadvantageous in cases where there is ambiguity surrounding the existence of seriouscause for termination. In the opinion of Hannover Rückversicherung AG, it is therefore in the interest of the company to diverge from the recommendation contained in Item 4.2.3 Para. 4.
Supplementary note on Code Item 4.2.4; disclosure of remuneration received by members of the Executive BoardWith respect to the non-mandatory provision of the Code requiring individualised specification of the remunerationreceived by members of the Executive Board, we are following the resolution of the Annual General Meeting of 12 May2006, according to which the disclosures required in § 285 Clause 1 No. 9 Letter a Sentences 5 to 9 and § 314 Para.1No. 6 Letter a Sentences 5 to 9 German Commercial Code as amended by the Act on Disclosure of Executive BoardCompensation (Vorstandsvergütungs-Offenlegungsgesetz) shall be omitted.
We are in compliance with all other recommendations of the Code.
International Insurance Companyof Hannover Ltd.Bracknell/London,United Kingdom(100.0%)
Hannover Life Reassurance (UK) LimitedVirginia Water/London, United Kingdom(100.0%)
Hannover Services (UK) Ltd.Virginia Water/London, United Kingdom(100.0%)
AustraliaHannover Rückversicherung AGAustralian Branch-Chief AgencySydney, Australia
Hannover Life Re of Australasia LtdSydney, Australia(100.0%)
194
BRANCH OFFICES AND SUBSIDIARIESof the Hannover Re Group abroad
BrazilHannover Re Escritório deRepresentação no Brasil Ltda.Praça Floriano 19/1701CEP 20 031 050Rio de JanerioTel: +55 21 22179500Fax +55 21 22179545Representative:Ivan G. Passos
CanadaHannover Rückversicherung AGCanadian Branch – Chief Agency3650 Victoria Park Avenue, Suite 201Toronto, Ontario M2H 3P7Tel. +1 416 4961148Fax +1 416 4961089Chief Agent:Laurel E. Grant
ChinaHannover Rückversicherung AGShanghai BranchSuite 1708, United Plaza1468 Nan Jing Xi Lu200040 ShanghaiTel. +86 21 62895959Fax +86 21 62898766General Manager:Michael Huang
Hannover Rückversicherung AGShanghai Representative OfficeSuite 1707, United Plaza1468 Nan Jing Xi Lu200040 ShanghaiTel. +86 21 62899578Fax +86 21 62899579Chief Representative:Christina J. Xu
Hannover Rückversicherung AGHong Kong Branch2008 Sun Hung Kai Centre30 Harbour RoadWanchai, Hong KongTel. +852 25193208Fax +852 25881136General Manager:Gerd Obertopp
AustraliaHannover Life Re of Australasia LtdLevel 770 Phillip StreetSydney NSW 2000Tel. +61 2 92516911Fax +61 2 92516862Managing Director:Steve Willcock
Hannover Rückversicherung AGAustralian Branch – Chief AgencyThe Re CentreLevel 21Australia Square264 George StreetSydney NSW 2000G. P. O. Box 3973Sydney NSW 2001Tel. +61 2 92743000Fax +61 2 92743033Chief Agent:Ross Littlewood
FranceHannover Rückversicherung AGSuccursale Française109 rue de la Boetie(Entrance: 52 avenue des Champs Elysées)75008 ParisLife +33 1 456173-00Non Life +33 1 456173-40Fax +33 1 456173-60General Manager: Claude Vercasson
IndiaHannover ReConsulting Services India Private LimitedExecutive CentreLevel 2, Kalpataru SynergyOpposite Grand HyattSantacruz (East)Mumbai 400055Tel. +91 22 3953-7150 or 7153Fax +91 22 3953-7200General Manager:Wesley Clay
IrelandHannover Life Reassurance(Ireland) LimitedNo. 4 Custom House Plaza, IFSCDublin 1Tel. +353 1 6125718Fax +353 1 6736917Managing Director:Debbie O’Hare
Hannover Reinsurance (Ireland) Ltd.No. 2 Custom House Plaza, IFSCDublin 1Tel. +353 1 6125715Fax +353 1 8291400Managing Director:Jürgen Lang
ItalyHannover Re Services Italy S.r.l.Via Mazzini, 1220123 MilanTel. +39 02 80681311Fax +39 02 80681349General Manager:Dr. Georg Pickel
195
JapanHannover Re Services Japan KK7th Floor, Hakuyo Building3-10 NibanchoChiyoda-kuTokyo 102-0084Tel. +81 3 52141101Fax +81 3 52141105General Manager:Mitsuharu Matsumoto
KoreaHannover Rückversicherung AG Korea BranchRoom 414, 4th fl. Gwanghwamoon Officia B/D163, Shinmunro-1ga, Jongro-guSeoul, 110-999Tel. +82 2 37000600Fax +82 2 37000699General ManagerFrank Park
MexicoHannover Services (México) S.A. de C.V.German CentreOficina 4-4-28Av. Santa Fé No. 170Col. Lomas de Santa FéC.P. 01210 México, D.F.Tel. +52 55 91400800Fax +52 55 91400815General Manager:Guadalupe Covarrubias
South AfricaCompass Insurance Company Ltd.P. O. Box 37226Birnam Park 2015JohannesburgTel. +27 11 7458333Fax +27 11 7458344www.compass.co.zaManaging Director:Angela Mhlanga
Hannover Life ReassuranceAfrica LimitedP. O. Box 10842Johannesburg 2000Tel. +27 11 4816500Fax +27 11 4843330/32Managing Director:Stuart Hill
Hannover Reinsurance Africa LimitedP. O. Box 10842Johannesburg 2000Tel. +27 11 4816500Fax +27 11 4843330/32Managing Director:Achim Klennert
SpainHR Hannover Re Correduría de Reaseguros, S.A.Paseo del General MartínezCampos 4628010 MadridTel. +34 91 3190049Fax +34 91 3199378General Manager:Eduardo Molinari
USAClarendon Insurance Group, Inc.Suite 1900466 Lexington AvenueNew York, NY 10017Tel. +1 212 790-9700Fax +1 212 790-9801President & CEO:Patrick Fee
Hannover Life Reassurance Company of America800 N. Magnolia AvenueSuite 1400Orlando, Florida 32803-3268Tel. +1 407 6498411Fax +1 407 6498322President & CEO:Peter R. Schaefer
Hannover Re Services USA, Inc.500 Park Blvd.Suite 1360Itasca, Illinois 60143Tel. +1 630 2505517Fax +1 630 2505583General Manager:Eric Arnst
Branch offices and subsidiaries
196
Accumulation loss: sum of several individual losses incurred byvarious policyholders as a result of the same loss event (e.g. wind-storm, earthquake). This may lead to a higher loss for the directinsurer or reinsurer if several affected policyholders are insured bythe said company.
Acquisition cost, deferred (DAC): cost of an insurance companythat arises from the acquisition or the renewal of an insurance con-tract (e.g. commission for the closing, costs of proposal assessmentand underwriting etc.). Capitalisation results in a distribution of thecost over the duration of the contract.
Aggregate excess of loss treaty: a form of excess of loss treaty re-insurance under which the reinsurer responds when a ceding in-surer incurs losses on a particular line of business during a specificperiod (usually 12 months) in excess of a stated amount.
Alternative risk financing: use of the capacity available on thecapital markets to cover insurance risks, e.g. through the securitisationof natural catastrophe risks.
American Depositary Receipt (ADR): share certificates written byUS banks on foreign shares deposited there. Instead of trading theforeign shares directly, US stock exchanges trade the ADRs.
Bancassurance: partnership between a bank and an insurancecompany for the purpose of selling insurance products through thebanking partner's branches. The link between the insurer and thebank is often characterised by an equity participation or a long-term strategic cooperation between the two parties.
Benefit reserves: value arrived at using mathematical methods forfuture liabilities (present value of future liabilities minus presentvalue of future incoming premiums), primarily in life and health in-surance.
Block assumption transaction (BAT): proportional reinsurancetreaty on a client's life or health insurance portfolio, by means ofwhich it is possible, inter alia, for our clients to realise in advance thefuture profits so as to be able to efficiently ensure the attainmentof corporate objectives, e.g. in the areas of financial or solvencypolicy.
CAPM: cf. ➞ Capital asset pricing model
Capital asset pricing model (CAPM): the CAPM is used to explainthe materialisation of prices/returns on the capital market basedon investor expectations regarding the future probability distribu-tion of returns. Under this method, the opportunity cost rate for theshareholders' equity consists of three components – a risk-averseinterest rate, a market-specific risk loading and an enterprise-specificrisk assessment, the beta coefficient. The cost of shareholders'equity is therefore defined as follows: risk-averse interest rate +beta * enterprise-specific risk assessment.
Cash flow statement: statement on the origin and utilisation ofcash and cash equivalents during the accounting period. It showsthe changes in liquid funds separated into cash flows from operating,investing and financing activities.
Catastrophe loss: loss which has special significance for the directinsurer or reinsurer due to the amount involved; it is defined as acatastrophe loss in accordance with a fixed loss amount or othercriteria.
Cedant: direct insurer or reinsurer which passes on (also: cedes)shares of its insured or reinsured risks to a reinsurer in exchange for premium.
Cession: transfer of a risk from the direct insurer to the reinsurer.
Claims and claims expenses: sum total of paid claims and provi-sions for loss events that occurred in the business year; this itemalso includes the result of the run-off of the provisions for loss eventsfrom previous years, in each case after the deduction of own re-insurance cessions.
Coinsurance Funds Withheld- (CFW) Treaty: type of coinsurancecontract where the ceding company retains a portion of the originalpremium at least equal to the ceded reserves. Similar to a ➞ Modcocontract the interest payment to the reinsurer reflects the invest-ment return on an underlying asset portfolio.
Combined ratio: sum of the loss ratio and expense ratio.
Confidence (also: probability) level: the confidence level definesthe probability with which the defined amount of risk will not beexceeded.
Contribution margin accounting level 5 (DB 5): this level ofcontribution margin accounting constitutes the clear profit afterearning the discounted claims expenditure plus all external andinternal costs including the cost of capital.
Corporate Governance: serves to ensure responsible managementand supervision of enterprises and is intended to foster the trust ofinvestors, clients, employees and the general public in companies.
Credit status (also: creditworthiness): ability of a debtor to meetits payment commitments.
DB 5: cf. ➞ Contribution margin accounting level 5
Deposit accounting: an accounting method originating in US ac-counting principles for the recognition of short-term and multi-yearinsurance and reinsurance contracts with no significant under-writing risk transfer. The standard includes inter alia provisions re-lating to the classification of corresponding contract types as wellas the recognition and measurement of a deposit asset or liabilityupon inception of such contracts.
Deposits with ceding companies/deposits received from retro-cessionaires (also: funds held by ceding companies/funds heldunder reinsurance treaties): collateral provided to cover insuranceliabilities that a (re-)insurer retains from the liquid funds which it is
GLOSSARY
197
to pay to a reinsurer under a reinsurance treaty. In this case, theretaining company shows a deposit received, while the companyfurnishing the collateral shows a deposit with a ceding company.
Derivatives, derivative financial instruments: these are financialproducts derived from underlying primary instruments such asequities, fixed-income securities and foreign exchange instruments,the price of which is determined on the basis of an underlying se-curity or other reference asset. Notable types of derivatives includeswaps, options and futures.
Direct (also: primary) insurer: company which accepts risks in ex-change for an insurance premium and which has a direct contractualrelationship with the policyholder (private individual, company,organisation).
Discounting of loss reserves: determination of the present value offuture profits through multiplication by the corresponding discountfactor. In the case of the loss reserves this is necessary because ofthe new profit calculation methods for tax purposes applicable toGerman joint-stock corporations.
Diversification: orientation of business policy towards variousrevenue streams in order to minimise the effects of economic fluc-tuations and stabilise the result. Diversification is an instrument of growth policy and risk policy for a company.
Dread disease (also: critical illness) coverages: personal riders onthe basis of which parts of the sum insured which would otherwiseonly become payable on occurrence of death are paid out in theevent of previously defined severe illnesses.
Due diligence: activity generally performed as part of a capitalmarket transaction or in the case of mergers and acquisitions,covering inter alia an examination of the financial, legal and taxsituation.
Earnings per share, diluted: ratio calculated by dividing the con-solidated net income (loss) by the weighted average number ofshares outstanding. The calculation of the diluted earnings pershare is based on the number of shares including subscription rightsalready exercised or those that can still be exercised.
Earnings retention: non-distribution of a company's profits leadingto a different treatment for tax purposes than if profits were dis-tributed.
EEV: cf. ➞ European embedded value
European embedded value (EEV): present value of shareholders'interests in the earnings distributable from assets allocated to thecovered business after sufficient allowance for the aggregate risksin the covered business.
Excess of loss treaty: cf. ➞ non-proportional reinsurance
Excess return on capital allocated (xRoCA): describes the ➞ IVC in relation to the allocated capital and shows the relative excessreturn generated above and beyond the weighted cost of capital.
Expense ratio: administrative expenses in relation to the (gross ornet) premiums written.
Exposure: level of danger inherent in a risk or portfolio of risks; thisconstitutes the basis for premium calculations in reinsurance.
Facultative reinsurance: participation on the part of the reinsurerin a particular individual risk assumed by the direct insurer. This isin contrast to ➞ obligatory (also: treaty) reinsurance.
Fair value: price at which a financial instrument would be freelytraded between two parties.
Financial Accounting Standards Board (FASB): committee in theUSA whose task is to determine and improve upon the standards ofaccounting and reporting.
Financial Solutions: targeted provision of financial support for pri-mary insurers through reinsurance arrangements under which thereinsurer participates in the original costs of an insurance portfolioand receives as a consideration a share of the future profits of thesaid portfolio. This approach is used primarily for long-term prod-ucts in personal lines, such as life, annuity and personal accident in-surance.
Free float: the free float refers to the part of the capital stock heldby shareholders with a low stockholding in both absolute and re-lative terms.
Funds held by ceding companies/funds held under reinsurancetreaties: cf. ➞ Deposits with ceding companies/deposits receivedfrom retrocessionaires
Goodwill: the excess of the cost of an acquired entity over the netof the amounts assigned to assets acquired and liabilities assumed.
Gross/Retro/Net: gross items constitute the relevant sum totalderiving from the acceptance of direct insurance policies or reinsur-ance treaties; retro items constitute the relevant sum total derivingfrom own reinsurance cessions. The difference is the correspondingnet item (gross – retro = net, also: for own account).
Hybrid capital: debt structure which because of its subordinationbears the character of both debt and equity
IBNR (Incurred but not reported) reserve: provision for claimswhich have already occurred but which have not yet been reported.
Impairment: extraordinary amortisation taken when the presentvalue of the estimated future cash flow of an asset is less than itsbook value.
International Accounting Standards (IAS): cf. ➞ InternationalFinancial Reporting Standards (IFRS)
Glossary
198
International Accounting Standards Board (IASB): committee in the EU whose task is to determine and improve upon the inter-national standards of accounting and reporting.
International Financial Reporting Standards (IFRS): standardspublished by the International Accounting Standards Board onaccounting and reporting (until 2002 they were named Inter-national Accounting Standards, IAS).
International Securities Identification Number (ISIN): ten-char-acter universal code used to identify securities internationally. It isprefixed by a country code that specifies the country where theissuer entity is legally registered or in which it has legal domicile,e.g. DE = Germany.
Intrinsic value creation (IVC): the IVC is calculated according to the following formula: real operating value creation = adjustedoperating profit (EBIT) – (capital allocated x weighted cost of cap-ital). IVC is a tool of value-based enterprise management used tomeasure the accomplishment of long-term targets on the level ofthe Group, the individual business groups and the operating units(profit centres).
Investment grade: investment grade ratings are awarded to com-panies and assigned to securities that have a low risk profile. Theycontrast with non-investment-grade ratings, which by definitioninclude speculative elements and therefore entail a significantlyhigher risk.
IVC: cf. ➞ Intrinsic value creation
Issuer: private enterprise or public entity that issues securities, e.g.the federal government in the case of German Treasury Bonds anda joint-stock corporation in the case of shares.
Leader: if several (re-)insurers participate in a contract, one com-pany assumes the role of leader. The policyholder deals exclusivelywith this lead company. The lead (re-) insurer normally carries ahigher percentage of the risk for own account.
Letter of credit (LOC): bank guarantee; at the request of the guar-anteed party, the bank undertakes to render payment to the saidparty up to the amount specified in the LOC. This method of provid-ing collateral in reinsurance business is typically found in the USA.
Life and health (re-)insurance: collective term for the lines of business concerned with the insurance of persons, i.e. life, pension,health and personal accident insurance.
Life business: this term is used to designate business activities inour life and health reinsurance business group.
Loss, economic: total loss incurred by the affected economy as awhole following the occurrence of a loss. The economic loss mustbe distinguished from the ➞ insured loss.
Loss, insured: the insured loss reflects the total amount of lossescovered by the insurance industry (insurers and reinsurers).
Loss ratio: proportion of loss expenditure in the ➞ retention relativeto the (gross or net) premiums earned.
Mark-to-market valuation: the evaluation of financial instrumentsto reflect current market value or ➞ fair value.
Matching currency cover: coverage of technical liabilities in foreigncurrencies by means of corresponding investments in the same cur-rency in order to avoid exchange-rate risks.
Modified Coinsurance- (Modco) Treaty: type of reinsurance treatywhere the ceding company retains the assets supporting the re-insured reserves by withholding a fund, thereby creating an obli-gation to render payments to the reinsurer at a later date. Suchpayments include a proportional share of the gross premium plus a return on the assets.
Net: cf. ➞ Gross/Retro/Net
Non-life business: by way of distinction from business activities inour life and health reinsurance business group, we use this umbrellaterm to cover our business groups of property and casualty reinsur-ance, financial reinsurance and specialty insurance.
Non-proportional reinsurance: reinsurance treaty under which thereinsurer assumes the loss expenditure in excess of a particularamount ( ➞ priority) (e.g. under an excess of loss treaty). This is incontrast to ➞ proportional reinsurance.
Obligatory (also: treaty) reinsurance: reinsurance treaty underwhich the reinsurer participates in a ➞ cedant's total, preciselydefined insurance portfolio. This is in contrast to ➞ facultativereinsurance.
Other securities, available-for-sale: securities that are notclassified as "trading" or "held-to-maturity"; these securities can be disposed of at any time and are reported at their market valueat the balance sheet date. Changes in market value do not affectthe statement of income.
Other securities, held-to-maturity: investments in debt securitiesintended to be held to maturity. They are measured at amortisedcost.
Other securities, trading: securities that are held principally forshort-term trading purposes. They are measured at their marketvalue at the balance sheet date.
(Insurance) Pool: a risk-sharing partnership under civil law formedby legally and economically independent insurers and reinsurers inorder to create a broader underwriting base for particularly large orunbalanced risks. The members undertake to write certain risks onlywithin the scope of the insurance pool. They include such risks –while maintaining their commercial independence – in the insur-ance pool against a commission fee. Each insurer participates inthe profit or loss of the insurance pool according to its proportionateinterest. Reinsurance is often ceded or accepted in order to furtherdiversify the risk. Pools can be divided into two types: coinsurancepools, in which all members take the role of primary insurers ac-cording to their interests, and reinsurance pools, in which a primaryinsurer writes the risks and then spreads them among the partici-pating insurers by way of reinsurance.
Glossary
199
Portfolio: a) all risks assumed by an insurer or reinsurer in a definedsub-segment (e.g. line of business, country) or in their entirety; b) group of investments defined according to specific criteria.
Premium: agreed remuneration for the risks accepted from aninsurance company. Unlike the earned premiums, the written pre-miums are not deferred.
Present value of future profits (PVFP): intangible asset primarilyarising from the purchase of life and health insurance companies orportfolios. The present value of expected future profits from theportfolio assumed is capitalised and amortised according to sched-ule.
Price earnings ratio (PER): ratio of the market value of a share tothe earnings per share of a publicly traded corporation.
Primary insurer: cf. ➞ direct insurer
Priority: direct insurer's loss amount stipulated under ➞ non-pro-portional reinsurance treaties; if this amount is exceeded, the rein-surer becomes liable to pay. The priority may refer to an individualloss, an ➞ accumulation loss or the total of all annual losses.
Probability level: cf. ➞ confidence level
Property and casualty (re-)insurance: collective term for all linesof business which in the event of a claim reimburse only the in-curred loss, not a fixed sum insured (as is the case in life and personalaccident insurance, for example). This principle applies in all linesof property and casualty insurance.
Proportional reinsurance: reinsurance treaties on the basis ofwhich shares in a risk or ➞ portfolio are reinsured under the relevantdirect insurer's conditions. ➞ Premiums and losses are shared pro-portionately on a pro-rata basis. This is in contrast to ➞ non-pro-portional reinsurance.
Protection cover: protection of segments of an insurer's portfolioagainst major losses (per risk/per event), primarily on a non-pro-portional basis.
Provision: liability item as at the balance sheet date to dischargeobligations which exist but whose extent and/or due date is/arenot known. Technical provisions, for example, are for claims whichhave already occurred but which have not yet been settled, or haveonly been partially settled (= provision for outstanding claims,abbreviated to: claims provision).
Provision for unearned premiums (also: unearned premium re-serve): premiums written in a financial year which are to be allo-cated to the following period on an accrual basis. This item is usedto defer written premiums.
Purchase cost, amortised: the cost of acquiring an asset item in-cluding all ancillary and incidental purchasing costs; in the case ofwasting assets less scheduled and/or special amortisation.
Quota share reinsurance: form of proportional reinsurance underwhich the reinsurer assumes a contractually set percentage share
of the written risk. Since the insurer is responsible for acquisition,pricing, policy administration and claims handling, the administra-tive expenditure for the reinsurer is very low. The latter thereforeparticipates in the aforementioned expenses through payment of areinsurance commission. This commission can amount to 15%–20%of the original premium depending upon the market and cost situ-ation.
Rate: percentage rate (usually of the premium income) of the re-insured portfolio which is to be paid to the reinsurer as reinsurancepremium under a ➞ non-proportional reinsurance treaty.
Rating: systematic evaluations of companies with respect to their➞ credit status or the credit status of issuers with regard to aspecific obligation. They are awarded by a rating agency or bank.
Reinsurer: company which accepts risks or portfolio segments froma ➞ direct insurer or another reinsurer in exchange for an agreedpremium.
Reserve ratio: ratio of (gross or net) technical provisions to the(gross or net) premiums.
Retention: the part of the accepted risks which an insurer/reinsurerdoes not reinsure, i.e. shows as ➞ net (retention ratio: percentageshare of the retention relative to the gross written premiums).
Retro: cf. ➞ Gross/Retro/Net
Retrocession: ceding of risks or shares in risks which have been re-insured. Retrocessions are ceded to other reinsurers in exchange fora pro-rata or separately calculated premium.
Risk, insured: defines the specific danger which can lead to theoccurrence of a loss. The insured risk is the subject of the insurancecontract.
Securitisation instruments: innovative instruments for transferringreinsurance business to the capital markets with the goal of refi-nancing or placing insurance risks.
Segmental reporting: presentation of items from the annual finan-cial statements separated according to functional criteria such assegments and regions.
Special Purpose Entity (SPE): legal structure with specific charac-teristics not bound to a certain form of organisation used to con-duct defined activities or to hold assets.
Specialty insurance: a specialty form of non-life primary insurancethat focuses on narrowly defined, homogenous portfolios of nicheor other non-standard risks (specialty business), whereby the typicalinsurer functions (acquisition, underwriting, policy issuing, premiumcollection, policy administration, claims settlement, etc.) can beoutsourced to specialized managing general agents (MGAs) orthird-party administrators (TPAs).
Statement of Financial Accounting Standards, SFAS (also:Financial Accounting Standards, FAS): standards published by theFinancial Accounting Standards Board on accounting and reporting.
Glossary
200
Spread loss treaty: treaty between an insurer and a reinsurer thatcovers risks of a defined portfolio over a multi-year period.
Structured products: reinsurance with limited potential for profitsand losses; the primary objective is to strive for risk equalisationover time and to stabilise the ➞ cedant's balance sheet.
Surplus reinsurance: form of proportional reinsurance under whichthe risk is not spread between the insurer and reinsurer on the basisof a previously agreed, set quota share. Instead, the insurer deter-mines a maximum sum insured per risk up to which it is prepared tobe liable. Risks that exceed the ceding company's retention (sur-pluses) are borne by the reinsurer. The reinsurer's lines thus varyaccording to the level of the retention and the sum insured of thereinsured contract. The reinsurer's liability is generally limited to a multiple of the ceding company's retention.
Surplus relief treaty: a portfolio reinsurance contract under whichan admitted reinsurer assumes (part of) a ceding company's busi-ness to relieve stress on the cedant's policyholders' surplus.
Survival ratio: reflects the ratio of loss reserves to paid losses undera specific contract or several contracts in a balance sheet year.
Technical result: the balance of income and expenditure allocatedto the insurance business and shown in the technical statement ofincome (after additional allowance is made for the allocation to/withdrawal from the equalisation reserve: net technical result).
Treaty reinsurance: cf. ➞ obligatory reinsurance
Underwriting: process of examining, accepting or rejecting (re-)in-surance risks and classifying those selected in order to charge theproper premium for each. The purpose of underwriting is to spreadthe risk among a pool of (re-)insureds in a manner that is equitablefor the (re-) insureds and profitable for the (re-)insurer.
Unearned premium reserve: cf. ➞ provision for unearned premiums
US GAAP (United States Generally Accepted Accounting Prin-ciples): internationally recognised US accounting principles. Not allthe provisions which together constitute US GAAP have been co-dified. US GAAP comprises not only defined written statements butalso, for example, standard accounting practices in specific indus-tries.
Value of in-force business (VIF): present value of expected futureprofit flows from the portfolio of in-force retained business, dis-counted by a currency-specific risk discount rate. It is determined inaccordance with local accounting principles.
Variable Interest Entity: legal entity not bound to a certain formof organisation for which the traditional approach to consolidationbased on voting rights is ineffective in identifying where control of the entity really lies, or in which the equity investors do not bearthe economic risks and rewards of the entity. The definition isbroader than the previously used term ➞ special-purpose entity(SPE).
Volatility: measure of the variability of stock prices, interest ratesand exchange rates. Standard practice is to measure the volatilityof a stock price by calculating the standard deviations of relativeprice differences.
xRoCA: cf. ➞ Excess return on capital allocated
Glossary
201
INDEX OF KEY TERMS
ABN Amro Global Reinsurance Index, weighted 8f, 170, 186Accident (insurance, line, business) 24f, 28f, 33, 38, 41, 69, 140, 197Agricultural risk(s) 21, 32, 71Annuity (re)insurance, business 38, 40ff, 133, 140, 197Asbestos, asbestos and pollution risks, asbestos- and pollution-related claims 98, 108Aviation 6, 21, 24f, 31f, 70, 102, 109f
Bancassurance 39, 44, 45fBook value per share 9, 19, 51, 74Builders’ risk insurance 28