61
–– Annual report 2008 Annual report 2008
–––
Annual report 2008
Annual report 2008
Annual report2 Group overview
3 From the chairman
4 Five-year summary
5 From the chief executive
6 Our brands
7 The Economist
10 Economist Intelligence Unit
11 CFO brand family
12 Government brands
Report and accounts16 Directors
17 Trustees, Board and management committees
18 Directors’ report
22 Directors’ report on remuneration
25 Financial review
27 Auditors’ report
28 Consolidated profit and loss account
29 Consolidated balance sheet
30 Consolidated cashflow statement
31 Other statements
32 Principal accounting policies
35 Notes to the financial statements
58 Notice of annual general meeting
The Economist Newspaper Limited registered number 236383
�
Group overview
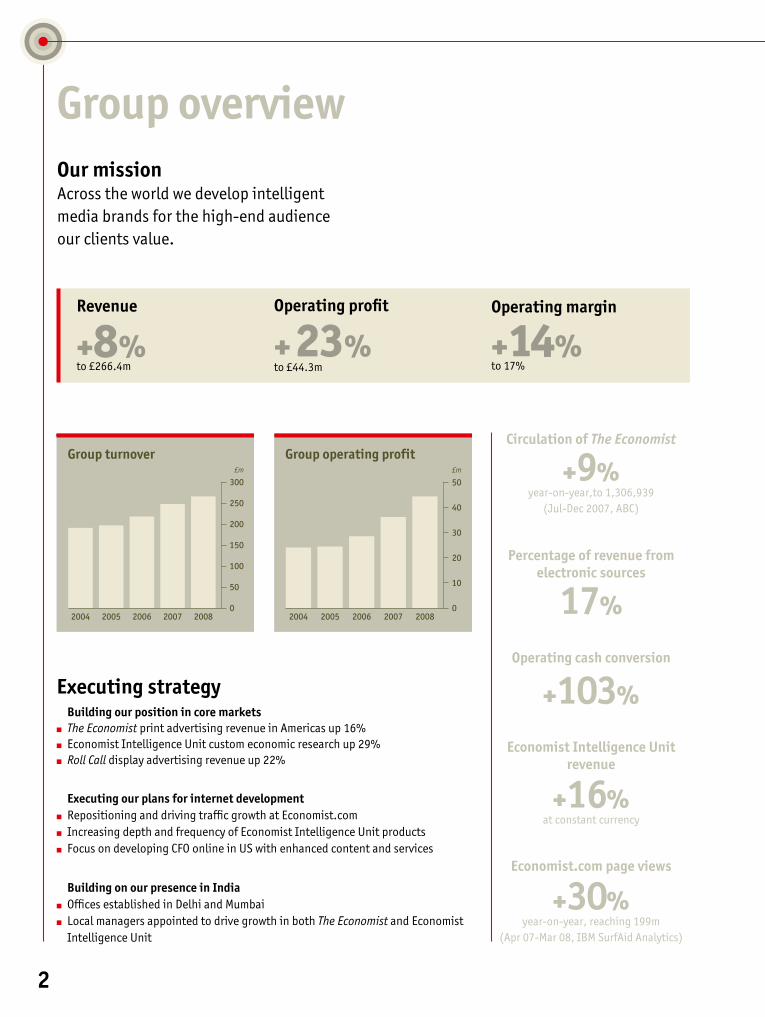
Executing strategy Building our position in core markets n The Economist print advertising revenue in Americas up 16% n Economist Intelligence Unit custom economic research up 29%n Roll Call display advertising revenue up 22%
Executing our plans for internet developmentn Repositioning and driving traffic growth at Economist.comn Increasing depth and frequency of Economist Intelligence Unit products n Focus on developing CFO online in US with enhanced content and services
Building on our presence in Indian Offices established in Delhi and Mumbai n Local managers appointed to drive growth in both The Economist and Economist Intelligence Unit
Circulation of The Economist
+9%year-on-year,to 1,306,939
(Jul-Dec 2007, ABC)
Revenue
+8% to £266.4m
Operating margin
+14%to 17%
Operating profit
+ 23% to £44.3m
Group turnover£m
0
300
250
100
150
200
2007 2008200620052004
50
Percentage of revenue from electronic sources
17%
Our missionAcross the world we develop intelligent media brands for the high-end audience our clients value.
Operating cash conversion
+103%
Economist Intelligence Unit revenue
+16%at constant currency
Economist.com page views
+30%year-on-year, reaching 199m
(Apr 07-Mar 08, IBM SurfAid Analytics)
Group operating profit£m
0
50
30
20
10
2007 2008200620052004
40
3
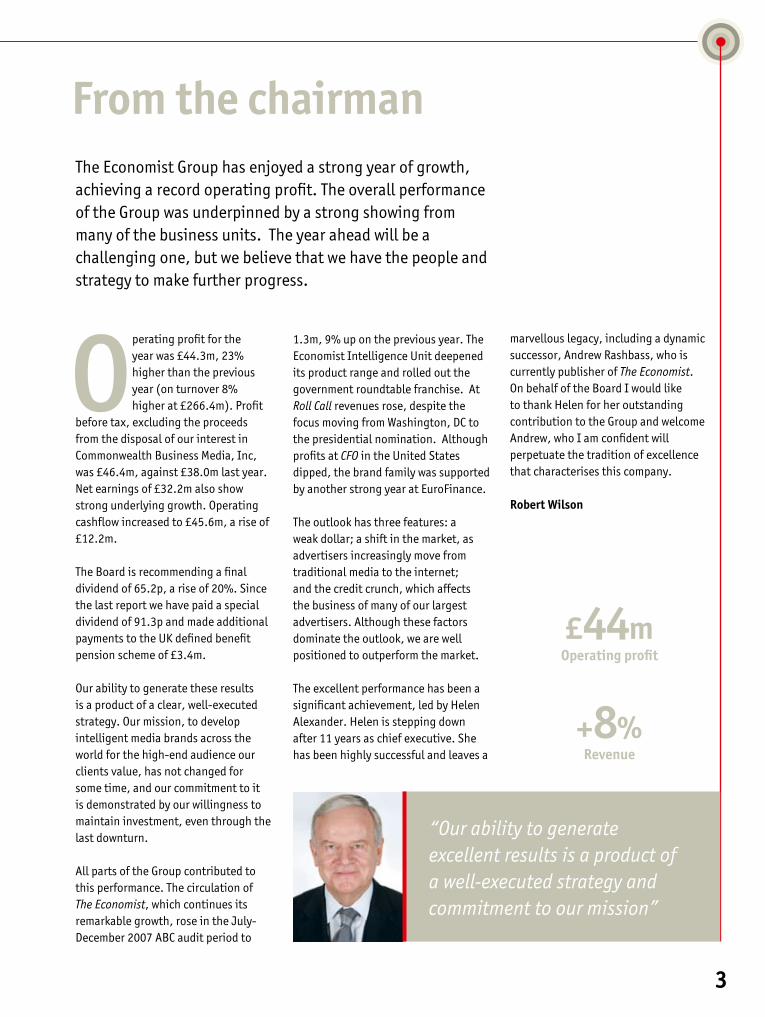
The Economist Group has enjoyed a strong year of growth, achieving a record operating profit. The overall performance of the Group was underpinned by a strong showing from many of the business units. The year ahead will be a challenging one, but we believe that we have the people and strategy to make further progress.
perating profit for the year was £44.3m, 23% higher than the previous year (on turnover 8% higher at £266.4m). Profit
before tax, excluding the proceeds from the disposal of our interest in Commonwealth Business Media, Inc, was £46.4m, against £38.0m last year. Net earnings of £32.2m also show strong underlying growth. Operating cashflow increased to £45.6m, a rise of £12.2m.
The Board is recommending a final dividend of 65.2p, a rise of 20%. Since the last report we have paid a special dividend of 91.3p and made additional payments to the UK defined benefit pension scheme of £3.4m.
Our ability to generate these results is a product of a clear, well-executed strategy. Our mission, to develop intelligent media brands across the world for the high-end audience our clients value, has not changed for some time, and our commitment to it is demonstrated by our willingness to maintain investment, even through the last downturn.
All parts of the Group contributed to this performance. The circulation of The Economist, which continues its remarkable growth, rose in the July-December 2007 ABC audit period to
1.3m, 9% up on the previous year. The Economist Intelligence Unit deepened its product range and rolled out the government roundtable franchise. At Roll Call revenues rose, despite the focus moving from Washington, DC to the presidential nomination. Although profits at CFO in the United States dipped, the brand family was supported by another strong year at EuroFinance.
The outlook has three features: a weak dollar; a shift in the market, as advertisers increasingly move from traditional media to the internet; and the credit crunch, which affects the business of many of our largest advertisers. Although these factors dominate the outlook, we are well positioned to outperform the market.
The excellent performance has been a significant achievement, led by Helen Alexander. Helen is stepping down after 11 years as chief executive. She has been highly successful and leaves a
O
From the chairman
“Our ability to generate excellent results is a product of a well-executed strategy and commitment to our mission”
marvellous legacy, including a dynamic successor, Andrew Rashbass, who is currently publisher of The Economist. On behalf of the Board I would like to thank Helen for her outstanding contribution to the Group and welcome Andrew, who I am confident will perpetuate the tradition of excellence that characterises this company.
Robert Wilson
£44mOperating profit
+8%Revenue
4
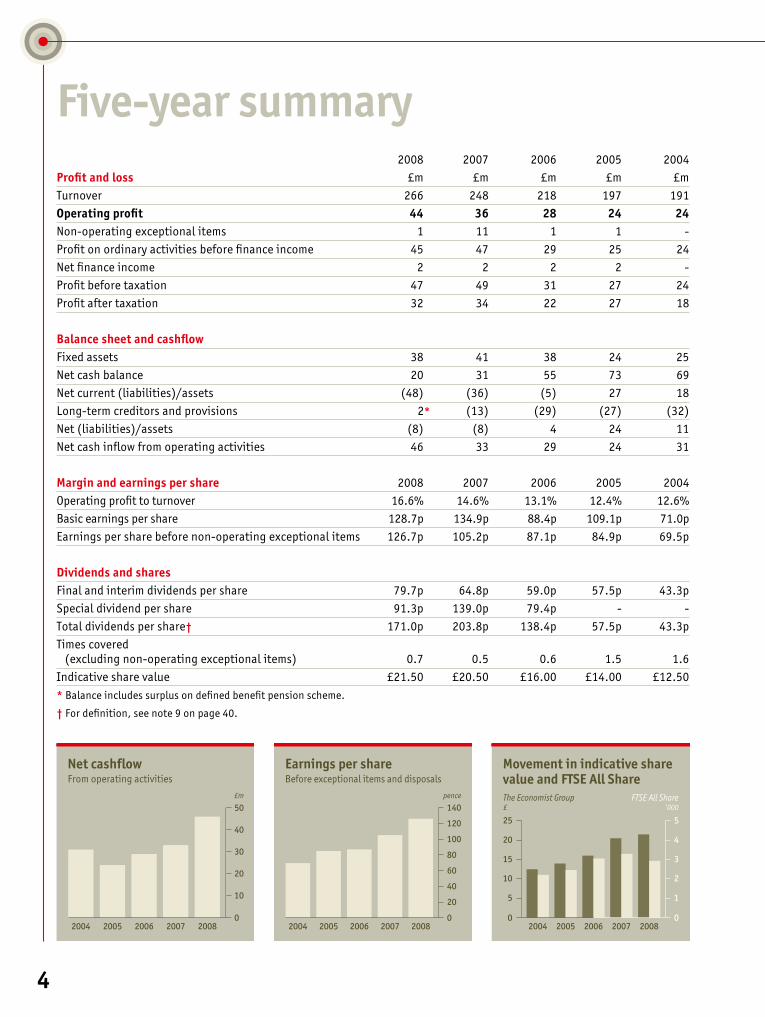
2008 2007 2006 2005 2004Profit and loss £m £m £m £m £m Turnover 266 248 218 197 191Operating profit 44 36 �8 �4 �4 Non-operating exceptional items 1 11 1 1 - Profit on ordinary activities before finance income 45 47 29 25 24Net finance income 2 2 2 2 - Profit before taxation 47 49 31 27 24 Profit after taxation 32 34 22 27 18
Balance sheet and cashflowFixed assets 38 41 38 24 25 Net cash balance 20 31 55 73 69Net current (liabilities)/assets (48) (36) (5) 27 18 Long-term creditors and provisions 2* (13) (29) (27) (32) Net (liabilities)/assets (8) (8) 4 24 11 Net cash inflow from operating activities 46 33 29 24 31
Margin and earnings per share 2008 2007 2006 2005 2004Operating profit to turnover 16.6% 14.6% 13.1% 12.4% 12.6%Basic earnings per share 128.7p 134.9p 88.4p 109.1p 71.0pEarnings per share before non-operating exceptional items 126.7p 105.2p 87.1p 84.9p 69.5p Dividends and sharesFinal and interim dividends per share 79.7p 64.8p 59.0p 57.5p 43.3p Special dividend per share 91.3p 139.0p 79.4p - - Total dividends per share† 171.0p 203.8p 138.4p 57.5p 43.3p Times covered (excluding non-operating exceptional items) 0.7 0.5 0.6 1.5 1.6 Indicative share value £21.50 £20.50 £16.00 £14.00 £12.50 * Balance includes surplus on defined benefit pension scheme.
† For definition, see note 9 on page 40.
Five-year summary
Net cashflowFrom operating activities
£m
0
50
30
20
10
2007 2008200620052004
40
Earnings per shareBefore exceptional items and disposals
pence
0
120
140
100
80
2007 2008200620052004
60
40
20
Movement in indicative sharevalue and FTSE All Share
0
5
3
2
1
2007 2008200620052004
4
0
25
15
10
5
20
The Economist Group£
FTSE All Share’000
�
I am delighted to report that we have had another good year in terms of growth in revenues, cash and another record operating profit. Our long-term focus on the audience (readers and users) and clients (advertisers and sponsors) has been consistent and well-informed.
e have taken a greater share in our core markets, sold more in emerging markets, and developed our products
and services. Print advertising continues to be a very healthy business for us, with revenues up 6% at The Economist, for example. We try to market to our readers and users intelligently and efficiently, so we provide an audience and an environment to advertisers for which they are prepared to pay a premium.
We set ourselves new challenges in the year, specifically to beat ambitious targets and to develop our internet offerings and our business in India. We beat the profit targets—the figures speak for themselves.
In revenue, the weak dollar held back the actual performance in sterling, though we were 11% ahead of the previous year at a constant exchange rate. Economist.com made good progress, from 153m page views in the year to March 2007 to 199m in the year to March 2008, with the addition of many new features and services. The Economist Intelligence Unit enhanced its digital offering, and we brought the careers and research sites at CFO.com to market. In India, the number of journalists rose, The Economist appointed an associate publisher and the Economist Intelligence Unit opened an office.
The medium- and long-term trends—wider use of English, globalisation and increasing attractiveness of our high-end audience—are all helpful. The growth of the internet is a structural change which means we must have a strong base there as well as in print products. Adjusting to this change is a challenge and an opportunity for the next few years. However, in the short term, we do not know the full effect of the credit crunch on our business, and a weak dollar will have an adverse impact.
We are well placed to continue to thrive, though. We have a mixture of revenue streams—both from advertising and sponsorship, and from subscriptions and news-stands. We operate across the world—increasingly in emerging markets as well as in the United States and Europe. We also focus hard on hiring and keeping the best people.
All this makes The Economist Group a very special company. Special because
WRanked
1stfor total shareholder returnwithin peer group of 14 companies
(source: Kepler)
1.3mThe Economist’s worldwide
circulation
From the chief executive
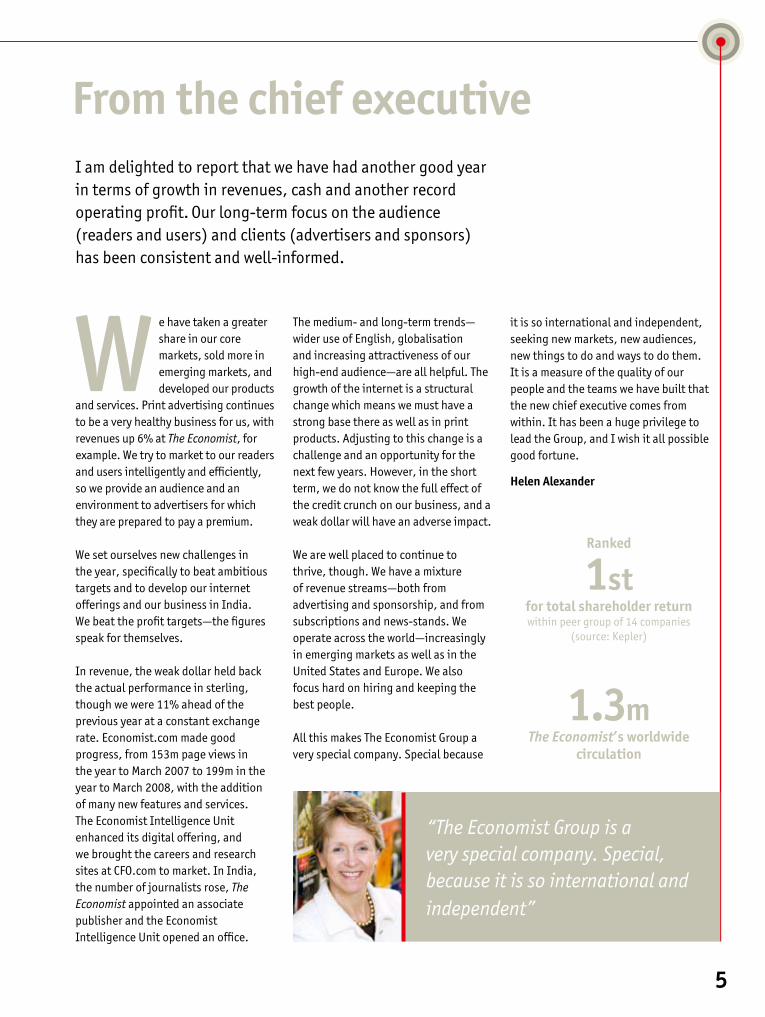
“The Economist Group is a very special company. Special, because it is so international and independent”
it is so international and independent, seeking new markets, new audiences, new things to do and ways to do them. It is a measure of the quality of our people and the teams we have built that the new chief executive comes from within. It has been a huge privilege to lead the Group, and I wish it all possible good fortune.
Helen Alexander
6
Our brandsThe Economist brand family
CFO brand family
The Economist has grown rapidly in recent years, reaching an average circulation of 1.3m worldwide. A number of sister businesses are managed alongside The Economist, including Economist.com, The World In..., an analytical assessment of the forthcoming year, and Intelligent Life, our eclectic take on life, culture and style.
The Economist Intelligence Unit is the banner under which the company produces business information. It is now primarily an electronic business and alongside the core country analysis and forecasting reports are industry specialist information and the ability to produce customised material. Economist Conferences and sponsored reports are also managed under this umbrella.
Operating under the CFO brand are several magazines and a research and conference business. There are US, European, Asian and Chinese editions of the magazine and a Russian edition under licence. CFO.com’s opportunity increases as clients of the franchise look for lead generation, and this has been the focus of recent product development.
EuroFinance is a leading brand in the cash, treasury and risk management sector. The business runs conferences round the world, including its premium international gathering, the largest event run by the Group. EuroFinance also offers training courses and a bespoke research service.
Government brands
Published from Monday to Thursday while Congress is in session, Roll Call provides timely news of backroom deals and political manoeuvres that characterise life on Capitol Hill. GalleryWatch, acquired in 2006, provides real-time intelligence on federal legislative and regulatory processes. CongressNow, launched in March 2007, is an online legislative wire service.
European Voice is an independent weekly newspaper that covers the European Union and is read by Europe’s most important decision-makers, providing in-depth analysis of developments within the institutions. In addition to its print and web editions, European Voice hosts EV50, the prestigious award to Europeans of the year, honouring the continent’s most influential people.
“The Economist has grown rapidly in recent years, reaching an average circulation of 1.3m worldwide”
“CFO.com’s opportunity increases as clients of the franchise look for lead generation”
“Roll Call provides readers with timely news of backroom deals and political manoeuvres that characterise life on Capitol Hill”
7
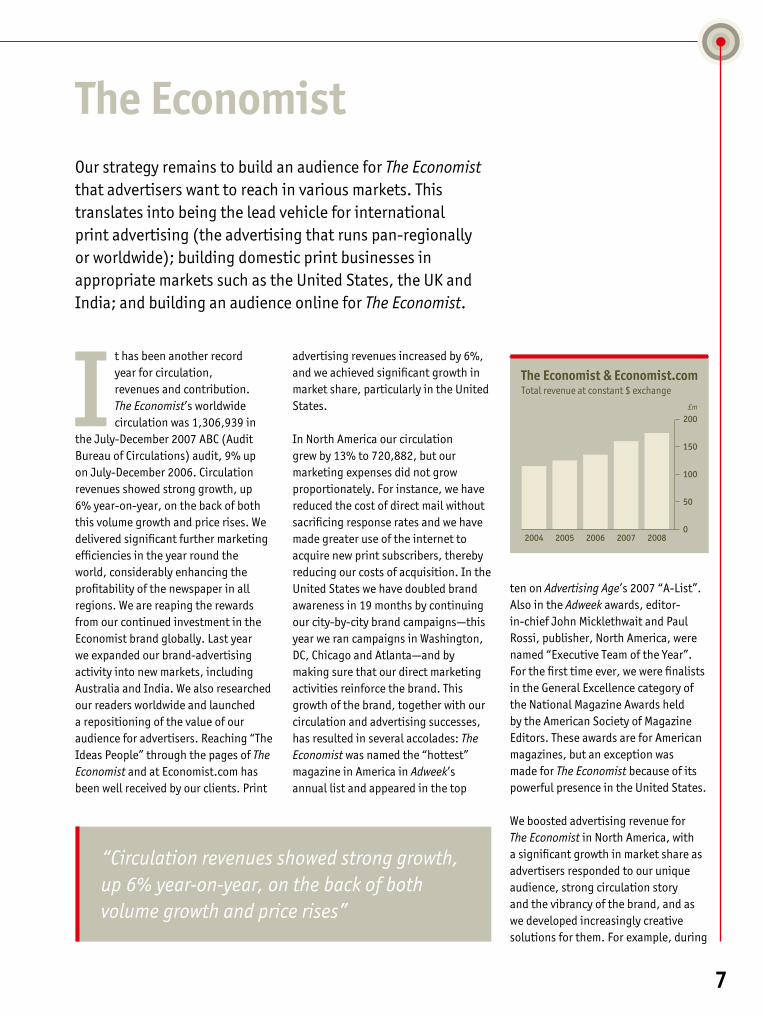
The EconomistOur strategy remains to build an audience for The Economist that advertisers want to reach in various markets. This translates into being the lead vehicle for international print advertising (the advertising that runs pan-regionally or worldwide); building domestic print businesses in appropriate markets such as the United States, the UK and India; and building an audience online for The Economist.
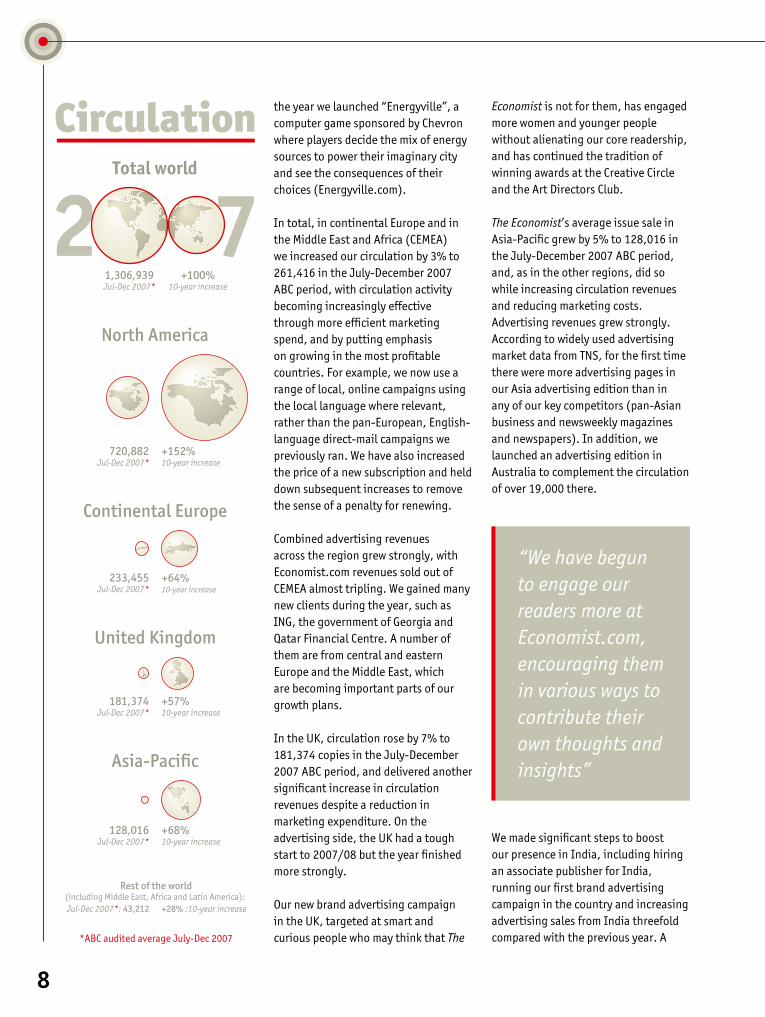
t has been another record year for circulation, revenues and contribution. The Economist’s worldwide circulation was 1,306,939 in
the July-December 2007 ABC (Audit Bureau of Circulations) audit, 9% up on July-December 2006. Circulation revenues showed strong growth, up 6% year-on-year, on the back of both this volume growth and price rises. We delivered significant further marketing efficiencies in the year round the world, considerably enhancing the profitability of the newspaper in all regions. We are reaping the rewards from our continued investment in the Economist brand globally. Last year we expanded our brand-advertising activity into new markets, including Australia and India. We also researched our readers worldwide and launched a repositioning of the value of our audience for advertisers. Reaching “The Ideas People” through the pages of The Economist and at Economist.com has been well received by our clients. Print
advertising revenues increased by 6%, and we achieved significant growth in market share, particularly in the United States.
In North America our circulation grew by 13% to 720,882, but our marketing expenses did not grow proportionately. For instance, we have reduced the cost of direct mail without sacrificing response rates and we have made greater use of the internet to acquire new print subscribers, thereby reducing our costs of acquisition. In the United States we have doubled brand awareness in 19 months by continuing our city-by-city brand campaigns—this year we ran campaigns in Washington, DC, Chicago and Atlanta—and by making sure that our direct marketing activities reinforce the brand. This growth of the brand, together with our circulation and advertising successes, has resulted in several accolades: The Economist was named the “hottest” magazine in America in Adweek’s annual list and appeared in the top
I
“Circulation revenues showed strong growth, up 6% year-on-year, on the back of both volume growth and price rises”
ten on Advertising Age’s 2007 “A-List”. Also in the Adweek awards, editor-in-chief John Micklethwait and Paul Rossi, publisher, North America, were named “Executive Team of the Year”. For the first time ever, we were finalists in the General Excellence category of the National Magazine Awards held by the American Society of Magazine Editors. These awards are for American magazines, but an exception was made for The Economist because of its powerful presence in the United States.
We boosted advertising revenue for The Economist in North America, with a significant growth in market share as advertisers responded to our unique audience, strong circulation story and the vibrancy of the brand, and as we developed increasingly creative solutions for them. For example, during
The Economist & Economist.comTotal revenue at constant $ exchange
£m
0
200
150
100
2007 2008200620052004
50
8
the year we launched “Energyville”, a computer game sponsored by Chevron where players decide the mix of energy sources to power their imaginary city and see the consequences of their choices (Energyville.com).
In total, in continental Europe and in the Middle East and Africa (CEMEA) we increased our circulation by 3% to 261,416 in the July-December 2007 ABC period, with circulation activity becoming increasingly effective through more efficient marketing spend, and by putting emphasis on growing in the most profitable countries. For example, we now use a range of local, online campaigns using the local language where relevant, rather than the pan-European, English-language direct-mail campaigns we previously ran. We have also increased the price of a new subscription and held down subsequent increases to remove the sense of a penalty for renewing.
Combined advertising revenues across the region grew strongly, with Economist.com revenues sold out of CEMEA almost tripling. We gained many new clients during the year, such as ING, the government of Georgia and Qatar Financial Centre. A number of them are from central and eastern Europe and the Middle East, which are becoming important parts of our growth plans.
In the UK, circulation rose by 7% to 181,374 copies in the July-December 2007 ABC period, and delivered another significant increase in circulation revenues despite a reduction in marketing expenditure. On the advertising side, the UK had a tough start to 2007/08 but the year finished more strongly.
Our new brand advertising campaign in the UK, targeted at smart and curious people who may think that The
Economist is not for them, has engaged more women and younger people without alienating our core readership, and has continued the tradition of winning awards at the Creative Circle and the Art Directors Club.
The Economist’s average issue sale in Asia-Pacific grew by 5% to 128,016 in the July-December 2007 ABC period, and, as in the other regions, did so while increasing circulation revenues and reducing marketing costs. Advertising revenues grew strongly. According to widely used advertising market data from TNS, for the first time there were more advertising pages in our Asia advertising edition than in any of our key competitors (pan-Asian business and newsweekly magazines and newspapers). In addition, we launched an advertising edition in Australia to complement the circulation of over 19,000 there.
We made significant steps to boost our presence in India, including hiring an associate publisher for India, running our first brand advertising campaign in the country and increasing advertising sales from India threefold compared with the previous year. A
+152%10-year increase
720,882Jul-Dec 2007*
North America
+64%10-year increase
233,455Jul-Dec 2007*
Continental Europe
United Kingdom
+57%10-year increase
181,374Jul-Dec 2007*
+68%10-year increase
128,016Jul-Dec 2007*
Asia-Pacific
Rest of the world(including Middle East, Africa and Latin America): Jul-Dec 2007*: 43,212 +28% :10-year increase
7Total world
+100%10-year increase
1,306,939Jul-Dec 2007*
2Circulation
*ABC audited average July-Dec 2007
“We have begun to engage our readers more at Economist.com, encouraging them in various ways to contribute their own thoughts and insights”
�
brand campaign with the strapline “Interpret the world” ran in Delhi, Mumbai and Bangalore. It was targeted at individuals who are looking to satisfy their curiosity and expand their minds. The weekly circulation of The Economist in India between July and December was 17,636.
Editorial highlights during the year included our coverage of the continuing credit crunch, the presidential primaries in the United States, the handover from Tony Blair to Gordon Brown, an investigation into “Putin’s people”, China’s relentless hunt for resources round the world, “the end of cheap food” and our coverage of the crisis in Tibet (the only western correspondent during the riots in Lhasa was from The Economist).
There were a number of exciting initiatives at Economist.com this year. Our news analysis has performed strongly, as has “At a glance”, our daily chart. Our blogs have begun to gain a following. As the primaries progress in the United States, the “Democracy in America” blog has been particularly popular. We launched a multimedia centre to house our audio and video content. The latter is in the early stages of evolution, but in audio we have developed a keen audience for our range of programming, including the full audio edition of The Economist for which every word of the newspaper is recorded and made available to subscribers. We now highlight features on Economist.com in a page in The Economist each week.
We have also begun to engage our readers more at Economist.com, encouraging them in various ways to contribute their own thoughts and insights. We launched a series of Oxford-style debates (Economist.com/debates) where hundreds of people join in and tens of thousands view the
discussion. Likewise, our readers are now able to contribute comments on our articles. Although we only switched on the facility to comment on all our articles in March, by the end of that month thousands of people had posted comments. An article often becomes just a starting point for a wide-ranging, intelligent discussion among our readers.
The combination of strong content and engaging our readers has led to an increase of 39% in the number of unique users of the site in March 2008, compared with a year earlier.
We re-launched Intelligent Life as a quarterly title from September 2007 under a new editor and with a new design. We are developing a distinctive editorial voice in a competitive luxury market, and have attracted many new advertisers who previously had not advertised in The Economist.
The World In… had another record year, with advertising revenues for The World In 2008 surpassing the previous record of The World In 2007.
We have made good progress during the year and our strong brand, audience, products and team position us well for the year ahead.
“As other news and business titles’ fortunes fade, this highbrow global phenomenon cashes in with major ad and circ momentum under Exec Team of the Year publisher Paul Rossi and editor John Micklethwait. Media directors call it a must-buy for ‘reaching thought leaders’”
AdweekMarch 31st 2008 (USA)
No1Adweek Hot List
Economist.com unique users
+3�%year-on-year, reaching 3m
(Mar 07, Mar 08, IBM SurfAid Analytics)
Combined net worth of Economist subscribers
$1,504bn(“The Ideas People”
research study, 2007)

10
Economist Intelligence UnitThe Economist Intelligence Unit continued its pattern of strong growth, with revenue rising by 12%. The business is affected by movements in the dollar exchange rate. On a constant currency basis revenue growth was even stronger at 16%.
evenue increased across all areas of the business but especially in conferences and custom research. Revenue at Economist
Conferences was up by 21%, driven particularly by a growth in the number of government roundtables. These bring government leaders together with an audience of senior business executives, and this year we ran a total of 34 events.
Revenue from custom research increased by 24% this year and we added editorial staff to handle the growing volume of business. We make a distinction between custom research projects that cover industry and management topics and those focusing on country and economic issues.
We continue to extend our portfolio of subscription services. We increased the amount of analysis and statistical data carried on our Industry Briefing service, and plan similar forecasting and data “deep drills” across the other sectors we cover to further enhance the offering to our users.
We also took our first steps to provide economic forecasts at a more detailed level than the national forecasts that have formed the core of our services to date. During the year we built an econometric model focused on
China that will allow us to forecast by province, reflecting a growing demand among our clients for more in-depth information. We plan to build further models that cover other important emerging markets.
Now that the internet has become the normal way for executives to access business information, so the expectations of those using our web services rise. To keep pace, we have embarked on a number of improvements to our websites. We have also built a capability to deliver and manipulate statistical data alongside our written analysis.
The Economist Intelligence Unit opened its first office in India during the year. Located in Gurgaon near New Delhi, this will be a base for local research, editorial and conference activity aimed at both foreign firms moving into India
Rand Indian firms that increasingly are going global.
We will maintain the momentum that the business has achieved not only through continued product development, but also through extending the size and geographical scope of our sales force. Demand for information services, custom research and conferences is growing as cross-border business expands, and we have identified some particular opportunities for growth in key markets round the world.
Although the economic outlook is uncertain, we are confident that the Economist Intelligence Unit is well positioned to weather a short-term reduction in demand. Businesses continue to globalise, and the Economist Intelligence Unit has assembled a compelling set of tools that help international executives in those businesses to take the best-informed decisions.
Economist Intelligence UnitTotal revenue
£m
0
50
30
20
10
2007 2008200620052004
40
“Revenue from custom research increased by 24% this year”
11
T
CFO brand familySenior financial executives remain a core part of the Group’s high-end audience, but the business-to-business advertising market, traditionally the main source of CFO’s revenues, continues to be affected by secular change as growth in spend on the internet and event and research sponsorship continues. CFO’s emphasis is also increasingly on generating sales leads for clients rather than simply promoting their brand.
hese trends are particularly strong in the United States. During the year we have therefore invested in CFO.com and in CFO’s
conference and research businesses. We launched an online library of white papers for our clients to publish research and analysis, which delivers valuable content to our audience of senior finance executives, and allows our clients to reach our readers. We also recently launched a careers channel on CFO.com, an area in which, our research tells us, our audience welcome us doing more. These investments will begin to bear fruit next year. However, this year, CFO in the United States (and to a lesser degree elsewhere) has, in common with most business-to-business publishers, been affected by the changes in the market. Total CFO revenues in the United States fell because of weakness in print advertising in the magazine. However, conference and research revenues grew well and our editorial proposition remains strong: CFO magazine won a gold award in the ASBPE National 2007 awards for “multiplatform general excellence”.
CFO in Europe had a good year. EuroFinance, the event business targeting corporate treasurers which
we bought in 2006, increased its revenues by 14%. Its contribution has tripled since 2005, driven by new events in China and Nigeria and by delegate and sponsorship growth in its flagship event, held in September 2007 in Vienna, which attracted over 2,000 delegates. CFO Europe also had a good year, with revenues growing strongly, driven by research and event sponsorship rather than by print advertising. The European editorial team won a number of prizes in the M&A International Media and Watson Wyatt HR awards.
Last year we identified India as a key market. We launched an India advertising edition of CFO Asia, signed our first research project there,
sponsored by Microsoft, and held our first CFO Rising India conference in Delhi. CFO China, our Chinese-language edition, continued to reach its unique and valuable audience. Overall, revenues from Asia were marginally down by 1% at constant currency, with sponsorship and event revenue up but print advertising revenue down.
We have had some changes in management and there is a new team and structure in place for CFO round the world, more closely aligned with The Economist, and we are integrating sales, marketing and editorial across the various CFO channels, particularly in the United States. The new management and the new structure will allow us to focus on operational excellence. We will continue to invest in and allocate resources to the areas that are important to our audience and to advertising and sponsorship clients, and we look forward to the year ahead with some confidence.
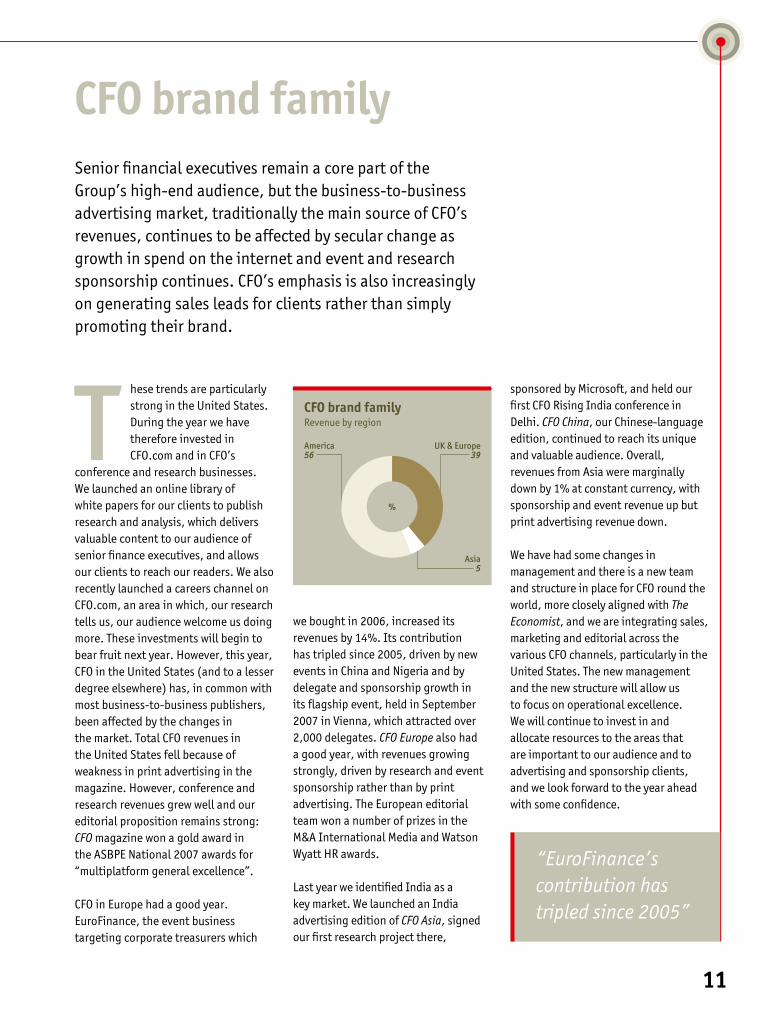
CFO brand familyRevenue by region
America56
UK & Europe39
Asia5
%
“EuroFinance’s contribution has tripled since 2005”
1�
Government brandsOur brands targeting decision-makers in government on Capitol Hill and in Brussels are Roll Call and European Voice. In autumn 2006 we bought GalleryWatch, an online legislative tracking business, to supplement Roll Call’s position on the internet and build its subscription revenues.
“Our brands perform well commercially because they are the leaders in their markets”A
nother excellent year for this business saw revenues rise by 16% to £16.8m. The bulk of the revenue comes from
Roll Call in Washington, DC, and so the business’s profit is particularly affected by the weak dollar. Operating profits increased by a healthy 12% after investment in GalleryWatch and European Voice.
Our brands perform well because they are the leaders in their markets. Roll Call continues to top the Erdos and Morgan readership survey and European Voice has no close competitor in the still-maturing Brussels market. Underpinning the leadership position of our titles is, of course, excellent editorial. Roll Call broke one of Washington, DC’s biggest stories last year, being the first to report Senator Larry Craig’s arrest for soliciting at a Minneapolis airport. Our content and people are promoted widely, the most recent example being “Roll Call TV with Robert Traynham” on CN8, The Comcast Network.
The Washington, DC media market has become more crowded with the arrival of new competitors, attracted by the growth of advocacy advertising, a niche in which we have a substantial position. However, we believe that there are a number of opportunities to enhance our subscription revenues,
the acquisition of GalleryWatch being an important first move.
GalleryWatch dollar revenues in the first full year of our ownership exceeded the prior year by 23%. Client renewal rates stand at 87% and we have begun a programme of adding content and services for the division, including the CongressNow electronic newsletter, which will extend our opportunity to sell electronic advertising and drive revenues further.
European Voice continues to be the largest media brand dedicated to the affairs of Brussels. We changed management mid-year and revenues increased by 6% over the prior year. Following research, we decided to redesign the paper, making it clearer for readers and a better environment for advertisers. We also saw the opportunity for a reinvigorated website. Both these initiatives are now successfully in place and they will drive what we anticipate to be a faster rate of growth in the coming year.
The Group’s government brands are read by an important constituent of
the high-end audience, and are an appealing part of a “Group sell” to advertisers who wish to use the whole portfolio. However, in their own right our titles in this unit have strong prospects because of the specialist niche they operate in, which, to a large extent, is insulated from the wider economic environment.
+16%Revenues
�9%Operating margin
87%GalleryWatch client
renewal rates

Report and accounts

16 Directors
17 Trustees, Board and management committees
18 Directors’ report
22 Directors’ report on remuneration
25 Financial review
27 Auditors’ report
28 Consolidated profit and loss account
29 Consolidated balance sheet
30 Consolidated cashflow statement
31 Other statements
32 Principal accounting policies
35 Notes to the financial statements
58 Notice of annual general meeting
16
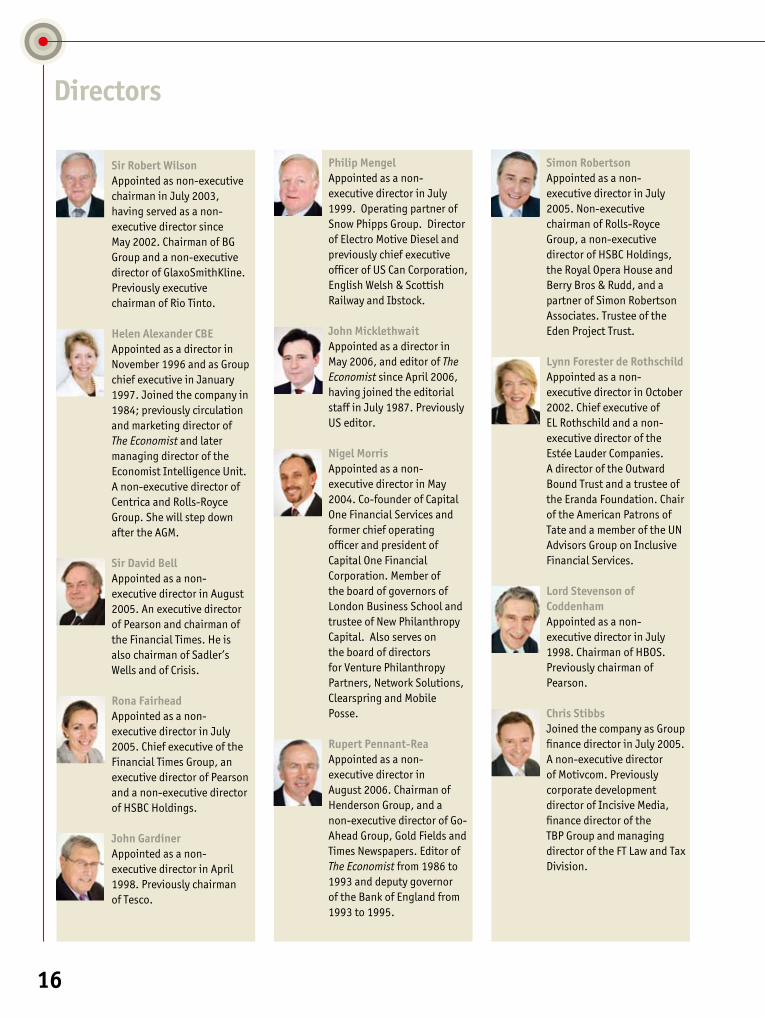
Directors
SirRobertWilsonAppointed as non-executive chairman in July 2003, having served as a non-executive director since May 2002. Chairman of BG Group and a non-executive director of GlaxoSmithKline. Previously executive chairman of Rio Tinto.
HelenAlexanderCBEAppointed as a director in November 1996 and as Group chief executive in January 1997. Joined the company in 1984; previously circulation and marketing director of The Economist and later managing director of the Economist Intelligence Unit. A non-executive director of Centrica and Rolls-Royce Group. She will step down after the AGM.
SirDavidBellAppointed as a non-executive director in August 2005. An executive director of Pearson and chairman of the Financial Times. He is also chairman of Sadler’s Wells and of Crisis.
RonaFairheadAppointed as a non-executive director in July 2005. Chief executive of the Financial Times Group, an executive director of Pearson and a non-executive director of HSBC Holdings.
JohnGardinerAppointed as a non-executive director in April 1998. Previously chairman of Tesco.
PhilipMengelAppointed as a non-executive director in July 1999. Operating partner of Snow Phipps Group. Director of Electro Motive Diesel and previously chief executive officer of US Can Corporation, English Welsh & Scottish Railway and Ibstock.
JohnMicklethwaitAppointed as a director in May 2006, and editor of The Economist since April 2006, having joined the editorial staff in July 1987. Previously US editor.
NigelMorrisAppointed as a non-executive director in May 2004. Co-founder of Capital One Financial Services and former chief operating officer and president of Capital One Financial Corporation. Member of the board of governors of London Business School and trustee of New Philanthropy Capital. Also serves on the board of directors for Venture Philanthropy Partners, Network Solutions, Clearspring and Mobile Posse.
RupertPennant-ReaAppointed as a non-executive director in August 2006. Chairman of Henderson Group, and a non-executive director of Go-Ahead Group, Gold Fields and Times Newspapers. Editor of The Economist from 1986 to 1993 and deputy governor of the Bank of England from 1993 to 1995.
SimonRobertsonAppointed as a non-executive director in July 2005. Non-executive chairman of Rolls-Royce Group, a non-executive director of HSBC Holdings, the Royal Opera House and Berry Bros & Rudd, and a partner of Simon Robertson Associates. Trustee of the Eden Project Trust.
LynnForesterdeRothschildAppointed as a non-executive director in October 2002. Chief executive of EL Rothschild and a non-executive director of the Estée Lauder Companies. A director of the Outward Bound Trust and a trustee of the Eranda Foundation. Chair of the American Patrons of Tate and a member of the UN Advisors Group on Inclusive Financial Services.
LordStevensonofCoddenhamAppointed as a non-executive director in July 1998. Chairman of HBOS. Previously chairman of Pearson.
ChrisStibbsJoined the company as Group finance director in July 2005. A non-executive director of Motivcom. Previously corporate development director of Incisive Media, finance director of the TBP Group and managing director of the FT Law and Tax Division.

17
LordRenwickofClifton Trustee since 1995. British ambassador to South Africa (1987-91) and to the United States (1991-95). Vice-chairman, Investment Banking of JPMorgan Europe and vice-chairman of JPMorgan Cazenove. A director of Fluor Corporation, Compagnie Financière Richemont, SABMiller and Kazakhmys. Chairman of Fluor.
BaronessBottomleyofNettlestonePC,DL Trustee since October 2005. Heads the board practice of Odgers Ray & Berndtson. Member of the House of Commons (1984-2005). Member of the Cabinet (1992-97), serving as Secretary of State, first for Health and then for National Heritage. Chancellor of the University of Hull, pro-chancellor of the University of Surrey and governor of the London School of Economics. Member of the UK Advisory Council of the International Chamber of Commerce, Cambridge University Judge Institute of Management Studies and the Supervisory Board of Akzo Nobel NV. Non-executive director of BUPA.
ClaytonBrendishCBE Trustee since 1999. Non-executive chairman of Anite, Echo Research, GlobeOp Financial Services and Close Beacon Investment Fund. Non-executive director of British Telecommunications and Herald Investment Trust, a trustee of the Foundation for Liver Research and a director of the Test and Itchen Association.
BryanSanderson Trustee since May 2006. Chairman of the Sunderland Area Regeneration Company, a governor of the London School of Economics and a director of Durham CCC.
AuditcommitteeJohnGardiner,chairmanNigelMorrisRupertPennant-ReaLynnForesterdeRothschildSirRobertWilson
RemunerationcommitteeSirRobertWilson,chairmanNigelMorrisLordStevensonofCoddenham
Trustees Boardcommittees
Groupmanagementcommittee
HelenAlexanderChrisStibbsJohnMicklethwait
MatthewBatstoneGroup marketing and strategy director. Joined the Group in January 2001, having worked at Carlton Communications and J Walter Thompson.
MartinGilesManaging director, North America, until December 2007. Stepped down from the GMC in December 2007 to take an editorial position at The Economist.
OscarGrutGroup general counsel and company secretary. Joined the company in 1998 from Linklaters.
NigelLudlowManaging director of the Economist Intelligence Unit. Joined the marketing team of The Economist in January 1984 and subsequently became global marketing director of the Economist Intelligence Unit.
PaulMcHaleGroup HR director. Joined the company in 1999 from United Biscuits and J Sainsbury.
AndrewRashbassPublisher and managing director of The Economist. Formerly Group chief information officer and managing director of Economist.com. Joined the Group in December 1997 from Associated Newspapers.He will take over as Group chief executive on July 16th 2008.
18
Directors’report
The directors present their report to shareholders, together with the audited financial statements, for the year ended March 31st 2008.
DevelopmentsandprincipalactivitiesThe principal activities of the Group consist of publishing, the supply of business information, conferences and the letting of property. Developments and likely future developments are referred to on pages 2 to 12.
Resultsanddividends The profit after tax for the financial year to March 31st 2008 was £32.2m (2007: £33.8m). A final dividend of 65.2p per share (2007: 54.5p) is proposed for the year to March 31st 2008. Together with the interim dividend already paid, this makes a total for the year of 90.4p (2007: 75.5p). In addition, a special dividend of 91.3p per share was paid in December 2007 (December 2006: 139p). The final dividend will be paid on July 23rd 2008 to shareholders on the register at the close of business on June 13th 2008.
Propertyvalues The directors have been advised that the open-market value of the Economist Complex at March 31st 2008 was £86.0m; the balance sheet value is £15.2m. Based on this information, the directors consider that the aggregate market value of all the Group’s properties exceeds their book value.
Transactionswithrelatedparties Details of transactions with related parties, which are to be reported under FRS 8, are set out in the notes to the financial statements on page 52.
Charitableandpoliticaldonations During the financial year, the Group
made contributions to charities amounting to £302,043 (2007: £225,250), including benefits granted in kind. No contributions were made for political purposes (2007: £nil).
Directors Profiles of the directors appear on page 16. All executive directors have contracts of employment.
Corporateinformation The share capital of the company is divided into ordinary shares, “A” special shares, “B” special shares and trust shares. The trust shares are held by trustees (who are described on page 17), whose consent is needed for certain corporate activities. The rights attaching to the trust shares provide for the continued independence of the ownership of the company and the editorial independence of The Economist. Apart from these rights, they do not include the right to vote, receive dividends or have any other economic interest in the company. The appointments of the editor of The Economist and of the chairman of the company are subject to the approval of the trustees, as are transfers of “A” special and “B” special shares.
The general management of the business of the company is under the control of the Board of directors. There are 13 seats allowable on the Board, seven of which may be appointed by holders of the “A” special shares and six by the holders of the “B” special shares. There are about 95 “A” special shareholders. The “B” special shares are all held by The Financial Times Limited. Sir Robert Wilson, John Micklethwait, Nigel Morris, Rupert Pennant-Rea, Simon Robertson, Lynn Forester de Rothschild and Chris Stibbs were appointed by
the “A” special shareholders. The “B” special shareholders appointed Helen Alexander, Sir David Bell, Rona Fairhead, John Gardiner, Philip Mengel and Lord Stevenson.
The ordinary shareholders are not entitled to participate in the appointment of directors, but in most other respects rank pari passu with the other shareholders. The transfer of ordinary shares must be approved by the Board of directors.
Corporategovernance As a private company, the company is not bound by the Listing Rules of the Financial Services Authority to report on compliance with the Principles of Good Governance and Code of Best Practice (“the Combined Code”). However, the company has always sought to run its corporate affairs in line with best practice and therefore follows the main principles of the Combined Code as closely as is reasonably practicable and useful to shareholders. The directors’ report, including the directors’ report on remuneration, which has been considered and approved by the Board, describes how the company has applied and complied with these principles, with the following main exceptions:
n Given the calibre and experience of the non-executive directors, the Board does not believe it is necessary to identify a senior independent director.
n The directors’ contracts of employment do not explicitly provide for compensation commitments in the event of early termination. n Some AGM procedures do not comply.
19
n Inviewofthecompany’suniquecapitalstructurewhichgivesthe“A”specialand“B”specialshareholderstherighttoappointdirectors,thedirectorsdonotstandforre-electionunderthecompany'sArticlesofAssociation.However,inJune2007theBoarddecidedthathenceforth"A"specialshareholderswouldbegiventheopportunitytovoteontherenewaloftheappointmentofdirectorselectedbythemoneachthree-yearanniversaryofsuchappointments.Thisdoesnotapplytothechairman.
n TheBoarddidnotundertakeaformalevaluationofitsperformanceorthatofitscommitteesandindividualdirectors.
BoardTheBoardcurrentlycomprisestennon-executivedirectorsandthreeexecutivedirectors.Thenon-executivedirectorshaveabreadthofsuccessfulcommercialandprofessionalexperienceandtheyexerciseindependentjudgment.SirDavidBellischairmanoftheFinancialTimesandRonaFairheadischiefexecutiveoftheFinancialTimesGroup;theyarealsoexecutivedirectorsofPearsonplc.LynnForesterdeRothschildandherspouse,SirEvelyndeRothschild,areeachinterestedinasignificantnumberofshares(seepage22).Detailsofdirectors’interestsand,inrelationtotheexecutivedirectorsonly,theirinterestsintheemployeeshareownershiptrust,aregiveninthedirectors’reportonremunerationonpages22to24.
TheBoardischairedbySirRobertWilsonandhasmetforregularbusinessfivetimesinthe12monthstoMarch31st2008.TheBoardalsoconvenesatothertimesonanadhocbasisorincommitteewhenevents
warrant.ItisresponsiblefortheoveralldirectionandstrategyoftheGroupandforsecuringtheoptimumperformancefromtheGroup’sassets.ItalsoexercisescontrolbydeterminingmattersspecificallyreservedforitinaformalschedulewhichonlytheBoardmaychange:thesemattersincludesignificantacquisitionsandmajorcapitalexpenditure.TheBoardcarriesoutregularreviewsofmattersundertakenbymanagementunderdelegatedauthority.Thecompany’sArticlesofAssociationrequiretheapprovalofthetrusteesforsomeactions.
Board committeesTheauditcommitteeismadeupoffivenon-executivedirectors.ItischairedbyJohnGardiner,andtheothermembersareNigelMorris,RupertPennant-Rea,LynnForesterdeRothschildandSirRobertWilson.ThecommitteeassiststheBoardtoensurethatthepublishedfinancialstatementsgiveatrueandfairviewofthebusinessandalsotoensurereliableinternalfinancialinformation.ThecommitteeisalsoresponsibleforreviewingthesuitabilityandeffectivenessoftheGroup’sinternalfinancialcontrols,theworkandfindingsofbothinternalandexternalauditors,andkeyaccountingpoliciesandjudgments.Theremunerationcommitteeismadeupofthreenon-executivedirectors:SirRobertWilson,NigelMorrisandLordStevenson.
Internal control TheBoardisresponsibleforthecompany’ssystemsofinternalcontrolandconsidersthatthecompanyhasputinplaceprocesseswhichfollowcloselythemainrecommendationsoftheTurnbullCommitteeandwhichfocusonmanagingtheGroup’skeybusinessrisks.
Ourannualreviewofriskhighlightedthefollowingprincipalareas:changestoourmarket(boththesecularchangesrelatedtothemigrationofadvertisingspendtotheinternetandthecontinuedcyclicalityoftheadvertisingmarket,aswellascompetitiveactivity);failuretoattractorretainthebestpeopleforthecompany;shareholderinstability;volatilityofthesurplus/deficitontheUKdefinedbenefitpensionscheme;integrationofnewbusinessesthecompanyisacquiring;businesscontinuity(includingthebreakdownofoperationalsystemsfromexternalattack,thefailureofkeysuppliersoraglobaldisasterlikeavianflu);brandandreputationalrisk(fromlibelactionorinfringementofourintellectualpropertyrights);regulatoryrisk,suchaschangestoprivacyoremploymentlaws;andthefinancialoperationsofthecompany,specificallyforeignexchange,cashmanagement,inaccuraciesinfinancialreporting,andtax.
TheinternalfinancialcontrolsystemhasbeendesignedanddevelopedoveranumberofyearstoprovidetheBoardwithreasonablebutnotabsoluteassurancethatitcanrelyupontheaccuracyandreliabilityofthefinancialrecords,anditseffectivenesshasbeenreviewedbytheBoard.Thecontrolsystemincludesthefollowingkeyfeatures:
n TheBoardreviewstheGroup’sstrategyandlong-termplanannually.Thestrategiesofspecificbusinessesarereviewedfromtimetotime.Long-termgoalsareapprovedbytheBoard.
n AbudgetingsystemwhichincludesanannualbudgetandforwardprojectionsisapprovedbytheBoard.Monthlyactualresultsarereported
20
against the annual budget and revised forecasts are prepared as necessary. The company reports to shareholders at least twice a year.
n Financial policies and procedures exist and senior managers and finance staff are responsible for ensuring that all relevant staff are familiar with their application.
n Written treasury procedures cover banking arrangements, hedging instruments, investments of cash balances and borrowing procedures. These procedures include staff responsibilities, segregation of duties and levels of delegated authority for treasury matters.
n The company has an audit and risk management function which has a dual role: it advises on and reviews the regular updating of business risk registers at both Group and business levels, and also carries out an independent risk-based programme of internal audit work in all parts of the Group. The manager reports to the Group finance director but also has direct access to the chairman of the audit committee. He attends all audit committee meetings and makes formal reports to the committee. The register of key business risks is reviewed by the Board.
n The company has clearly defined guidelines for the review and approval of capital and development expenditure projects, which include annual budgets, project appraisals and designated levels of authority.
TheEconomistGroup’sguidingprinciples The Board wishes the Group to operate in a clear and ethical context and
has therefore approved the following guiding principles:
n We aim to offer insight and analysis that are valued by our customers.
n Our ambition is to own and develop intelligent media brands across the world for the high-end audience that clients value. Underpinning our ability to fulfil this objective is our commitment to independence, integrity and delivering quality in everything we do. These values govern our relationships with readers, customers and clients, shareholders, staff, suppliers and the community at large.
n We believe in conducting business with common decency. We are opposed to bribery and do not engage in corrupt practices. We abide by strict guidelines governing the acceptance of gifts and the disclosure of potential conflicts of interest.
n As an international company, we conduct business in many different markets round the world. In the countries in which we operate, we abide by local laws and regulations. We make an active contribution to local charities by charitable giving. We encourage our people to participate in charitable and community activities and we permit them to take time off for this purpose.
n We respect environmental standards and comply with the relevant local laws. We take environmental issues seriously. The Group’s agreed objective is to investigate the viability of becoming carbon-neutral. We believe that this is what readers, advertisers and staff increasingly expect from us and that the ensuing cost savings would also represent a benefit.
The first step is measurement: we have recently reviewed the environmental impact of our four main offices in London, New York and Hong Kong. The plan is to extend this review round the world. We will also investigate the carbon output from the production, distribution and marketing of the Group’s products and services. Once the review is complete we will be able to identify areas for improvement and make a decision on environmental policy. We aim to complete the review in the next financial year.
Every year we ask our printers and paper manufacturers whether they conform to ISO 14001 standard, FSC (Forest Stewardship Council) accreditation or their regional equivalent. This year, 89% of our annual expenditure on printing and paper was with companies which comply and are certified.
n We value our colleagues and treat each other fairly. The Group is committed to equality of opportunity in all employment practices and policies. We do not discriminate against employees or job applicants based on the grounds of age, sex, sexual orientation, marital status, race, colour, religion, national origin or disability. For the last few years, we have had a regular programme of equal opportunities training for staff round the world. In addition, all new staff are required to participate in an induction programme, which includes equal opportunities training. We support staff who through disability or illness are unable to perform their duties, by adapting the work environment and hours of work to suit the employee where it is reasonable for the business.
During the year we commissioned a diversity survey. The research focused

21
on how people feel about their ability to contribute to, and progress in, our business. Overall the results told us that most staff feel the climate for equality is very positive. The majority who responded felt that the Group has a meritocratic, polite culture, respectful of individuals. Most agree that the management style is open and empowering, with a commitment to equality, diversity and flexible working. However, there were some areas where respondents felt we could do a lot better. The Group is committed to increasing the proportion of staff from diverse backgrounds. As part of our programme all senior managers are taking part in cultural awareness training and are required to check that all recruitment draws from the widest possible pool of talent.
We recognise that it is essential to keep employees informed of the progress of the Group. We regularly provide employees with information on the Group’s activities and its financial performance through staff meetings and communication through our intranet. We have a strong consultative culture and we follow legal and regulatory requirements to consult with staff on major issues affecting the company. Every two years the Group carries out a staff survey. The next survey is planned for September 2008.
Paymentofsuppliers The company aims to pay all of its suppliers within a reasonable period of their invoices being received and within any contractually agreed payment period, provided that the supplier also complies with all relevant terms and conditions. Subsidiary companies are responsible for agreeing the terms on which they trade with their suppliers.
Trade creditors as at March 31st 2008 for the company represented on average 33 days of purchases (2007: 16 days).
Annualgeneralmeeting The notice convening the annual general meeting, to be held at 12.15pm on Tuesday July 15th 2008 at the Institute of Directors, can be found on page 58.
Auditors A resolution to reappoint PricewaterhouseCoopers LLP as auditors to the company, and a further resolution to authorise the directors to fix their remuneration, will be proposed at the annual general meeting.
Auditorindependence In line with best practice, the audit committee operates a policy that defines those non-audit services that the independent auditors may or may not provide to the Group. The policy requires the provision of these services to be approved in advance by the audit committee. A statement of the fees for audit and non-audit services is provided in note 5 on page 38.
Disclosureofinformationtoauditors As far as each of the directors is aware, there is no relevant information that has not been disclosed to the company’s auditors, and each of the directors believes that all steps have been taken that ought to have been taken to make them aware of any relevant audit information and to establish that the company’s auditors have been made aware of that information.
Directors’statementofresponsibilities Company law requires the directors to prepare financial statements for
each financial year that give a true and fair view of the state of affairs of the company and the Group and of the profit or loss of the Group for that period. The directors have elected to prepare the financial statements in accordance with UK Generally Accepted Accounting Practice (UK Accounting Standards and applicable law). The directors are responsible for keeping proper accounting records which disclose with reasonable accuracy at any time the financial position of the company and the Group to enable them to ensure the financial statements comply with the Companies Act 1985, for safeguarding the assets of the company and the Group, and hence for taking reasonable steps to prevent and detect fraud and other irregularities. The directors confirm that suitable accounting policies have been used and applied consistently, and reasonable and prudent judgments and estimates have been made in the preparation of the financial statements. The directors also confirm that applicable UK accounting standards have been followed subject to any material departures disclosed and explained in the financial statements and that the financial statements have been prepared on the going-concern basis.
By order of the BoardOscarGrutSecretaryJune 13th 2008
22
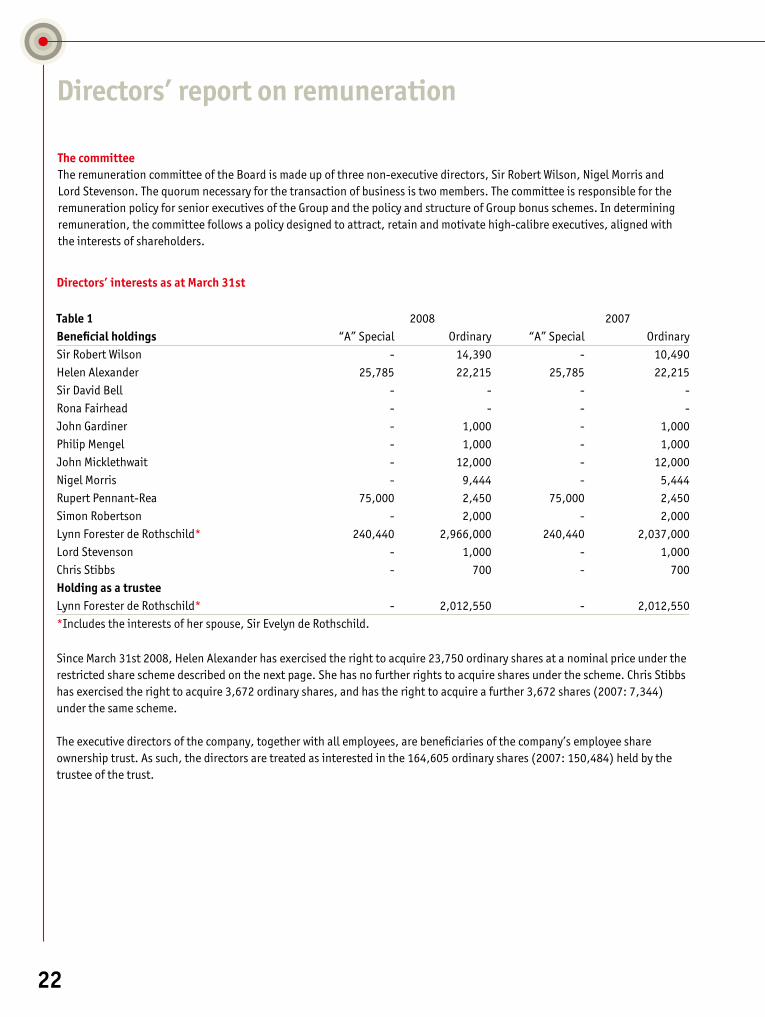
Directors’interestsasatMarch31st
Table1 2008 2007 Beneficialholdings “A” Special Ordinary “A” Special OrdinarySir Robert Wilson - 14,390 - 10,490Helen Alexander 25,785 22,215 25,785 22,215Sir David Bell - - - -Rona Fairhead - - - -John Gardiner - 1,000 - 1,000Philip Mengel - 1,000 - 1,000John Micklethwait - 12,000 - 12,000Nigel Morris - 9,444 - 5,444Rupert Pennant-Rea 75,000 2,450 75,000 2,450Simon Robertson - 2,000 - 2,000 Lynn Forester de Rothschild* 240,440 2,966,000 240,440 2,037,000Lord Stevenson - 1,000 - 1,000Chris Stibbs - 700 - 700Holdingasatrustee Lynn Forester de Rothschild* - 2,012,550 - 2,012,550*Includes the interests of her spouse, Sir Evelyn de Rothschild.
Since March 31st 2008, Helen Alexander has exercised the right to acquire 23,750 ordinary shares at a nominal price under the restricted share scheme described on the next page. She has no further rights to acquire shares under the scheme. Chris Stibbs has exercised the right to acquire 3,672 ordinary shares, and has the right to acquire a further 3,672 shares (2007: 7,344) under the same scheme.
The executive directors of the company, together with all employees, are beneficiaries of the company’s employee share ownership trust. As such, the directors are treated as interested in the 164,605 ordinary shares (2007: 150,484) held by the trustee of the trust.
ThecommitteeThe remuneration committee of the Board is made up of three non-executive directors, Sir Robert Wilson, Nigel Morris and Lord Stevenson. The quorum necessary for the transaction of business is two members. The committee is responsible for the remuneration policy for senior executives of the Group and the policy and structure of Group bonus schemes. In determining remuneration, the committee follows a policy designed to attract, retain and motivate high-calibre executives, aligned with the interests of shareholders.
Directors’reportonremuneration

23
Currentplans
(a)Annualbonusplans Executive directors and employees participated in annual bonus plans in which rewards were linked to Group performance and to improvements in key areas of the business which they could influence.
(b)Executivelong-termplan Executive directors and some other senior employees were awarded performance units under the executive long-term plan. The units are equivalent in value to the company’s ordinary shares. After a three-year performance period participants may receive payments depending on the Group’s performance against EPS hurdles and its total shareholder return compared with a selected group of companies.
(c)TheEconomisteditoriallong-termplan Some senior journalists who do not participate in the executive long-term plan participate in this three-year cash bonus scheme designed to help us retain key editorial staff. The size of the bonus pool is a percentage of Group cumulative operating profit at the end of three years. The amount paid to each participant is determined by how many units have been awarded to the participant at the start of the three-year period. Payout is also contingent on the Group achieving an earnings hurdle.
(d)Successionpoollong-termplan Some staff have been identified as having the potential to fill key senior positions in the medium to long term, or as having specialist skills that are very important for the business. They participate in this three-year cash bonus scheme designed to help us retain them. The size of the bonus pool is a percentage of Group cumulative operating profit at the end of three years. The amount paid to each participant is determined by how many units have been awarded to the participant at the start of the three-year period. Payout is also contingent on the Group achieving an earnings hurdle.
(e)Restrictedsharescheme The Group also has in place a restricted share scheme under which a small number of key employees have been awarded a right to acquire ordinary shares at a nominal price between two and five years after the date of the award. The Group has the discretion to pay out shares or cash on exercise.
TheGroupoperatedanumberofannualbonusandlong-termbonusplansduringtheyear,providingperformance-basedbonusesforexecutivedirectorsandemployees.
24
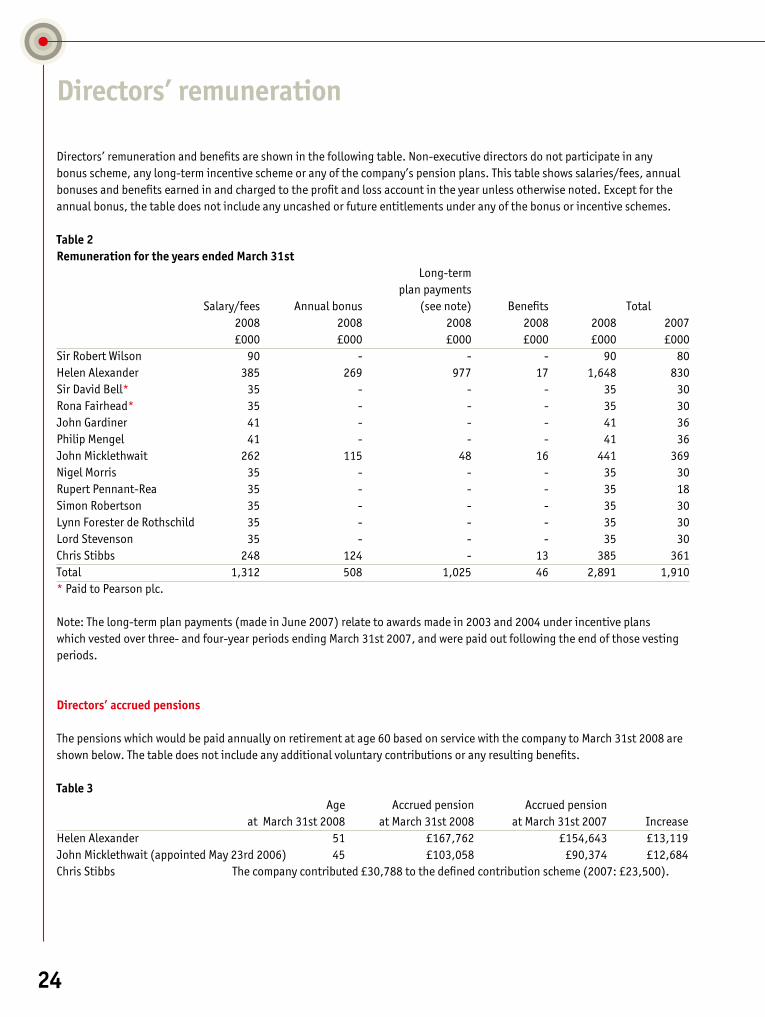
Directors’ remuneration and benefits are shown in the following table. Non-executive directors do not participate in any bonus scheme, any long-term incentive scheme or any of the company’s pension plans. This table shows salaries/fees, annual bonuses and benefits earned in and charged to the profit and loss account in the year unless otherwise noted. Except for the annual bonus, the table does not include any uncashed or future entitlements under any of the bonus or incentive schemes.
Table 2 Remuneration for the years ended March 31st Long-term plan payments Salary/fees Annual bonus (see note) Benefits Total 2008 2008 2008 2008 2008 2007 £000 £000 £000 £000 £000 £000 Sir Robert Wilson 90 - - - 90 80 Helen Alexander 385 269 977 17 1,648 830 Sir David Bell* 35 - - - 35 30 Rona Fairhead* 35 - - - 35 30 John Gardiner 41 - - - 41 36 Philip Mengel 41 - - - 41 36 John Micklethwait 262 115 48 16 441 369Nigel Morris 35 - - - 35 30 Rupert Pennant-Rea 35 - - - 35 18Simon Robertson 35 - - - 35 30 Lynn Forester de Rothschild 35 - - - 35 30 Lord Stevenson 35 - - - 35 30 Chris Stibbs 248 124 - 13 385 361 Total 1,312 508 1,025 46 2,891 1,910 * Paid to Pearson plc.
Note: The long-term plan payments (made in June 2007) relate to awards made in 2003 and 2004 under incentive plans which vested over three- and four-year periods ending March 31st 2007, and were paid out following the end of those vesting periods.
Directors’ accrued pensions
The pensions which would be paid annually on retirement at age 60 based on service with the company to March 31st 2008 are shown below. The table does not include any additional voluntary contributions or any resulting benefits.
Table 3 Age Accrued pension Accrued pension at March 31st 2008 at March 31st 2008 at March 31st 2007 Increase Helen Alexander 51 £167,762 £154,643 £13,119 John Micklethwait (appointed May 23rd 2006) 45 £103,058 £90,374 £12,684Chris Stibbs The company contributed £30,788 to the defined contribution scheme (2007: £23,500).
Directors’ remuneration
25
Operatingresult Operating profit at £44.3m is 23% higher than last year, driven by increasing revenue, up 8% on the prior year, and improving operating margins. Operating margin increased from 15% to 17%. The results have been affected by the weaker US dollar. At constant US-dollar exchange rates revenue would have increased by 11% and operating profit by 28%.
Costs Costs rose by 5% in the year. The Group benefited from greater efficiency in marketing spend. This was offset by investment to support growing revenues and inflation.
Profitbeforetax Profit before tax fell by £2.1m compared with 2007. The 2007 result was boosted by a profit of £11.1m from the disposal of the Group’s shareholding in CBMI. In addition, the payment of special dividends has resulted in the Group holding less cash than in 2007, which has reduced net interest income by £1.3m. In 2008 the Group received a £2.2m interest credit in respect of the defined benefit pension scheme (2007: £0.8m).
Taxation The effective rate of tax is 31.5% (2007: 31.3%). Ignoring the impact of exceptional items, the underlying tax rate is 33% (2007: 33%). The difference between the effective tax rate and the underlying tax rate is due to the use of carried-forward losses in Hong Kong and state tax losses in the United States.
Earningspershare Basic earnings per share fell from 134.9p in 2007 to 128.7p in 2008. The 2007 result was boosted by profits on
the sale of CBMI. Normalised earnings per share, which exclude non-operating exceptional items, increased from 105.2p to 126.7p, a rise of 20%.
Pensions The Group operates a number of pension schemes. The UK defined benefit plan is the only defined benefit scheme. As at March 31st 2008 the defined benefit pension scheme had a surplus, net of deferred tax, of £7.6m, compared with a deficit of £8.1m at March 31st 2007. The movement is largely due to the rise in corporate bond rates, which reduces the value of the long-term liabilities. The pension surplus remains sensitive to market conditions.
DividendThe cash dividend (£42.9m) accounted for in the annual report includes a further special dividend of £22.9m paid in December 2007 (2006: £34.8m). The Board has proposed increasing the final dividend by 20% to 65.2p (2007: 54.5p), giving a total dividend per share of 181.7p (2007: 214.5p). Excluding the special dividend, the total ongoing dividend is covered 1.4 times by current year basic earnings per share.
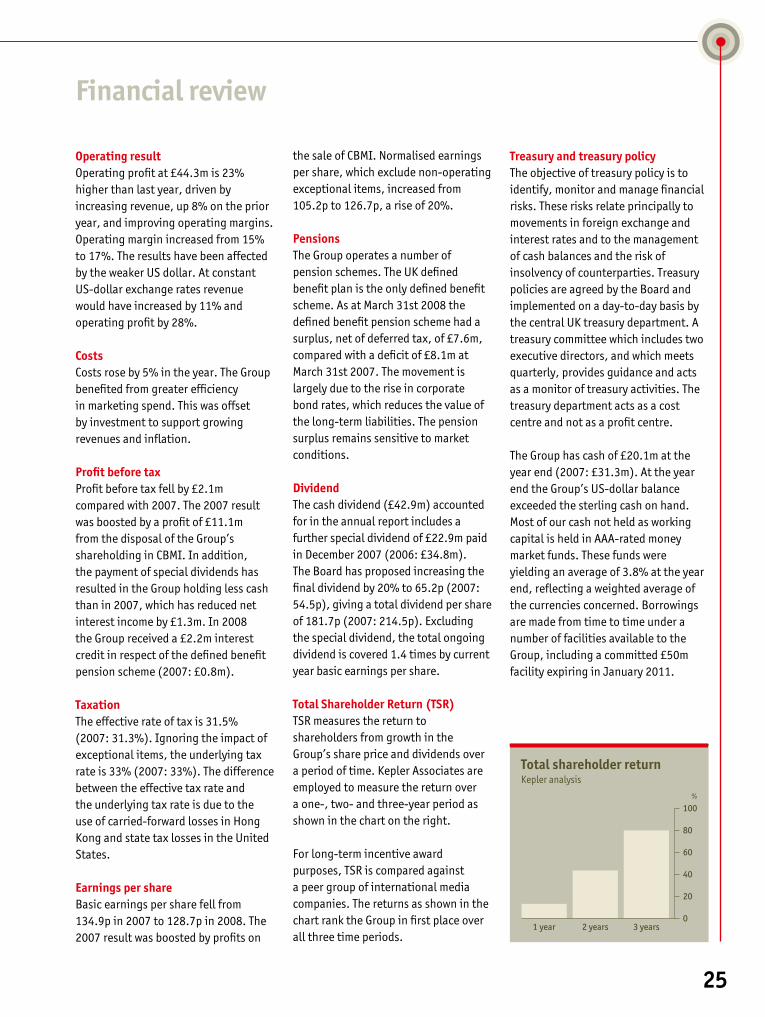
TotalShareholderReturn(TSR) TSR measures the return to shareholders from growth in the Group’s share price and dividends over a period of time. Kepler Associates are employed to measure the return over a one-, two- and three-year period as shown in the chart on the right.
For long-term incentive award purposes, TSR is compared against a peer group of international media companies. The returns as shown in the chart rank the Group in first place over all three time periods.
Financialreview
Treasuryandtreasurypolicy The objective of treasury policy is to identify, monitor and manage financial risks. These risks relate principally to movements in foreign exchange and interest rates and to the management of cash balances and the risk of insolvency of counterparties. Treasury policies are agreed by the Board and implemented on a day-to-day basis by the central UK treasury department. A treasury committee which includes two executive directors, and which meets quarterly, provides guidance and acts as a monitor of treasury activities. The treasury department acts as a cost centre and not as a profit centre.
The Group has cash of £20.1m at the year end (2007: £31.3m). At the year end the Group’s US-dollar balance exceeded the sterling cash on hand. Most of our cash not held as working capital is held in AAA-rated money market funds. These funds were yielding an average of 3.8% at the year end, reflecting a weighted average of the currencies concerned. Borrowings are made from time to time under a number of facilities available to the Group, including a committed £50m facility expiring in January 2011.
Total shareholder returnKepler analysis
%
0
100
80
3 years2 years1 year
60
40
20
26
Current facilities are considered to be adequate for the Group at this time. The only external debt at the year end was a finance lease on the Economist Complex. This means that refinancing risks are low.
The main currency exposure of business transactions relates to US-dollar receipts from sales in the United States. The foreign-exchange risk on this and other smaller currency exposures is managed by the treasury department mainly through use of forward foreign-exchange contracts and currency options. Foreign-exchange risk is only actively managed on currencies where the net exposure exceeds £3m, currency equivalent, per year. At present this includes US dollars. The disposition of net cash balances between dollars and sterling is kept under constant review. The Group does not hedge the translation of overseas profits or assets and liabilities into sterling.
Financial assets which potentially subject the Group to credit risk consist principally of debtors and cash. The concentration of credit risk associated with debtors is minimised due to distribution over many customers in different countries and in different industries. Risks associated with the Group’s cash are mitigated by the fact that these amounts are placed with high-quality financial institutions. Counterparty limits approved by the treasury committee and notified to the Board are used to manage the risk of loss on deposits. The Group has not experienced any losses to date on its deposited cash.
The treasury department monitors the Group’s exposure to changes in interest rates. At present no active hedging is being undertaken.
CashflowThe Group demonstrated strong cash generation from operating activities, with a healthy conversion ratio of operating profits of 111%, excluding special pension payments of £3.4m. After the special dividend and lump-sum pension payments, there was a Group cash outflow of £11.2m compared with an outflow last year of £23.5m.
ForeignexchangeThe translation of the Group’s overseas trading results was adversely affected by the weaker average US-dollar exchange rate. The average exchange rate was $2.01 in 2008, compared with $1.89 in 2007. Profit before tax was adversely affected by approximately £1.9m.
InternationalFinancial ReportingStandardsAs a private company, the Group is able voluntarily to adopt International Financial Reporting Standards (IFRS). The Group has considered the potential impacts of IFRS adoption. The Board has again agreed to defer adoption until a later date.
ChrisStibbs

27
We have audited the Group and parent company financial statements (the ‘‘financial statements’’) of The Economist Newspaper Limited for the year ended March 31st 2008, which comprise the Group profit and loss account, the Group and company balance sheets, the Group cashflow statement, the Group statement of total recognised gains and losses, and the related notes. These financial statements have been prepared under the accounting policies set out therein.
RespectiveresponsibilitiesofdirectorsandauditorsThe directors’ responsibilities for preparing the annual report and the financial statements in accordance with applicable law and UK Accounting Standards (UK generally accepted accounting practice) are set out in the directors’ statement of responsibilities.
Our responsibility is to audit the financial statements in accordance with relevant legal and regulatory requirements and International Standards on Auditing (UK and Ireland). This report, including the opinion, has been prepared for, and only for, the company’s members as a body in accordance with Section 235 of the Companies Act 1985 and for no other purpose. We do not, in giving this opinion, accept or assume responsibility for any other purpose or to any other person to whom this report is shown or into whose hands it may come, save where expressly agreed by our prior consent in writing.
We report to you our opinion as to whether the financial statements give a true and fair view and are properly prepared in accordance with the Companies Act 1985. We also report to you whether in our opinion the
information given in the directors’ report is consistent with the financial statements. The information given in the directors’ report includes that specific information presented in the operating and financial review that is cross-referred from the business review section of the directors’ report.
In addition we report to you if, in our opinion, the company has not kept proper accounting records, if we have not received all the information and explanations we require for our audit, or if information specified by law regarding directors’ remuneration and other transactions is not disclosed.
We read other information contained in the annual report, and consider whether it is consistent with the audited financial statements. This other information comprises only the directors’ report, the chairman’s statement and the operating and financial review. We consider the implications for our report if we become aware of any apparent misstatements or material inconsistencies with the financial statements. Our responsibilities do not extend to any other information.
BasisofauditopinionWe conducted our audit in accordance with International Standards on Auditing (UK and Ireland) issued by the Auditing Practices Board. An audit includes examination, on a test basis, of evidence relevant to the amounts and disclosures in the financial statements. It also includes an assessment of the significant estimates and judgments made by the directors in the preparation of the financial statements, and of whether the accounting policies are appropriate to the Group’s and company’s
Auditors’report
circumstances, consistently applied and adequately disclosed.
We planned and performed our audit so as to obtain all the information and explanations which we considered necessary in order to provide us with sufficient evidence to give reasonable assurance that the financial statements are free from material misstatement, whether caused by fraud or other irregularity or error. In forming our opinion we also evaluated the overall adequacy of the presentation of information in the financial statements.
OpinionIn our opinion:
n The financial statements give a true and fair view, in accordance with UK Generally Accepted Accounting Practice, of the state of the Group’s and the parent company’s affairs as at March 31st 2008 and of the Group’s profit and cashflows for the year then ended;
n the financial statements have been properly prepared in accordance with the Companies Act 1985; and
n the information given in the directors' report is consistent with the financial statements.
PricewaterhouseCoopersLLPChartered Accountants and Registered Auditors
LondonJune 17th 2008

28
Consolidatedprofitandlossaccount
YearsendedMarch31st 2008 2007 NOTE £000 £000 1 Turnover Continuing operations 266,399 247,077 Acquisitions - 669 266,399 247,746 Cost of sales (77,273) (69,908) Grossprofit 189,126 177,838 Distribution costs (26,332) (24,029) 2 Marketing, development and other administrative costs (117,619) (116,939) 12 Goodwill amortisation (856) (731) 1 Operatingprofit 44,319 36,139 Continuing operations 44,319 36,327 Acquisitions - (188) 44,319 36,139 3 Profit on sale of fixed asset investments 730 11,192 Profitonordinaryactivitiesbeforefinanceincome 45,049 47,331 4 Net finance income 2,040 1,859 1,5 Profitonordinaryactivitiesbeforetaxation 47,089 49,190 8 Taxation on profit on ordinary activities (14,856) (15,409) Profitfortheyear 32,233 33,781 The final dividend proposed for the year is £16,323,000 (2007: £13,652,000). Dividends paid in the year were £42,851,000 (2007: £51,013,000). 11 Basicearningspershare(pence) 128.7 134.9 11 Diluted earnings per share (pence) 128.4 134.6 9 Dividends paid per share (pence) 171.0 203.8 Dividend cover (times) before non-operating exceptional items 0.7 0.5
29
ConsolidatedbalancesheetatMarch31st
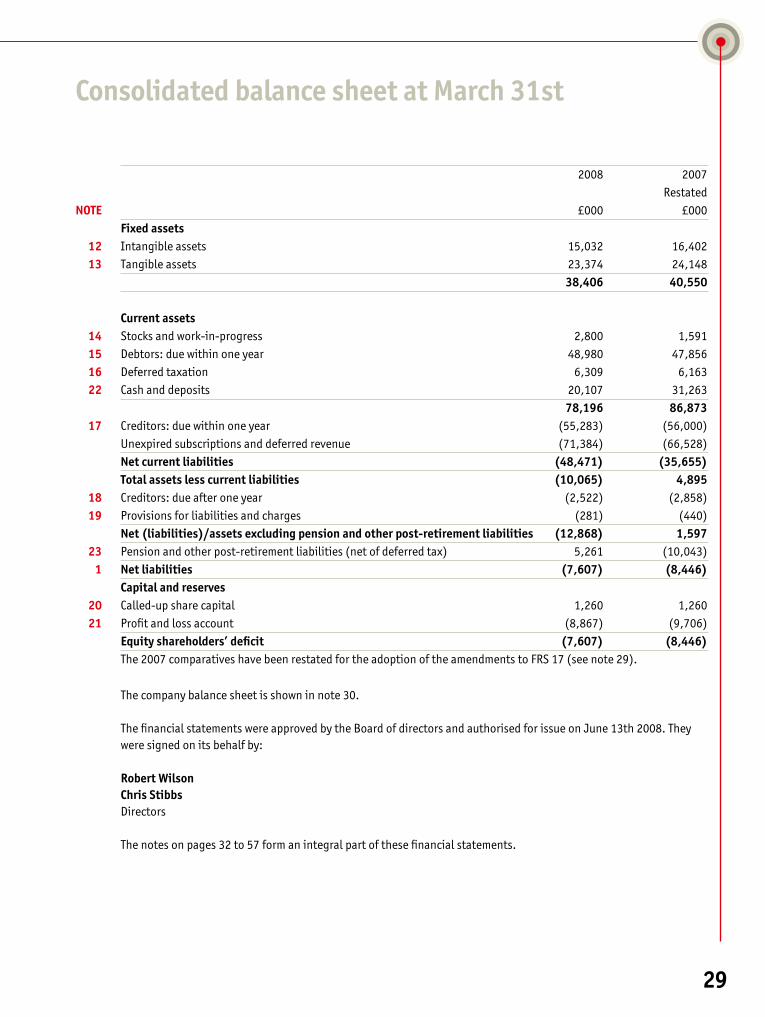
2008 2007 Restated NOTE £000 £000 Fixedassets 12 Intangible assets 15,032 16,402 13 Tangible assets 23,374 24,148 38,406 40,550 Currentassets 14 Stocks and work-in-progress 2,800 1,591 15 Debtors: due within one year 48,980 47,856 16 Deferred taxation 6,309 6,163 22 Cash and deposits 20,107 31,263 78,196 86,873 17 Creditors: due within one year (55,283) (56,000) Unexpired subscriptions and deferred revenue (71,384) (66,528) Netcurrentliabilities (48,471) (35,655) Totalassetslesscurrentliabilities (10,065) 4,895 18 Creditors: due after one year (2,522) (2,858) 19 Provisions for liabilities and charges (281) (440) Net(liabilities)/assetsexcludingpensionandotherpost-retirementliabilities (12,868) 1,597 23 Pension and other post-retirement liabilities (net of deferred tax) 5,261 (10,043) 1 Netliabilities (7,607) (8,446) Capitalandreserves 20 Called-up share capital 1,260 1,260 21 Profit and loss account (8,867) (9,706) Equityshareholders’deficit (7,607) (8,446) The 2007 comparatives have been restated for the adoption of the amendments to FRS 17 (see note 29). The company balance sheet is shown in note 30. The financial statements were approved by the Board of directors and authorised for issue on June 13th 2008. They were signed on its behalf by: RobertWilson ChrisStibbs Directors The notes on pages 32 to 57 form an integral part of these financial statements.
30
Consolidatedcashflowstatement
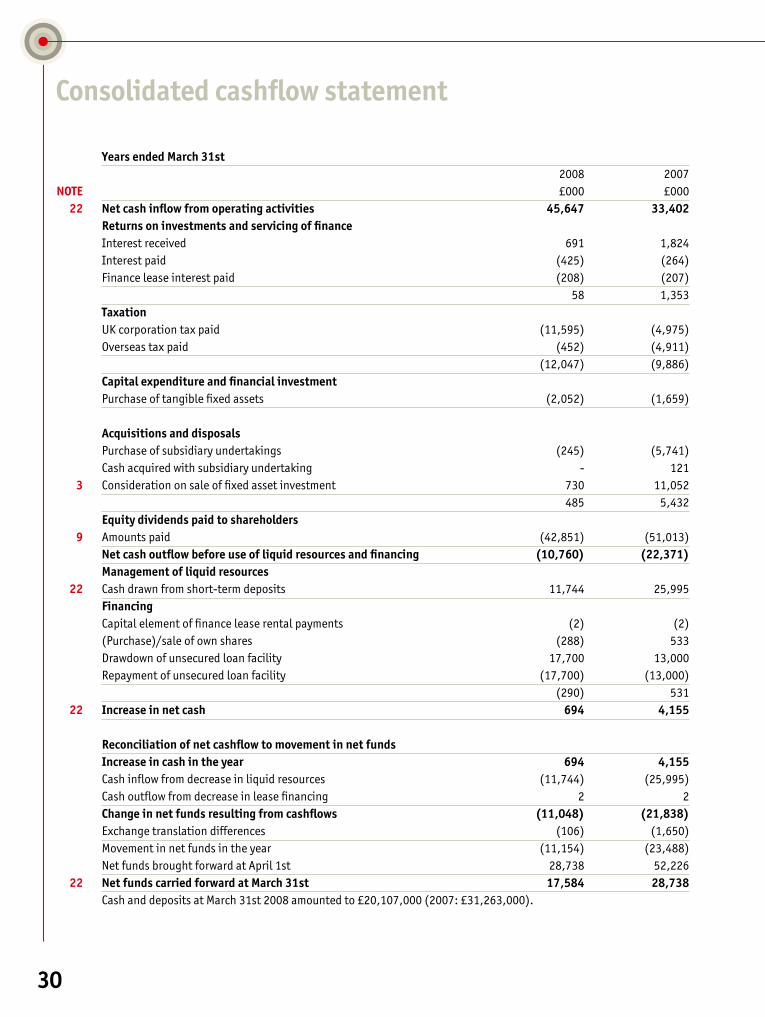
YearsendedMarch31st 2008 2007 NOTE £000 £000 22 Netcashinflowfromoperatingactivities 45,647 33,402 Returnsoninvestmentsandservicingoffinance Interest received 691 1,824 Interest paid (425) (264) Finance lease interest paid (208) (207) 58 1,353 Taxation UK corporation tax paid (11,595) (4,975) Overseas tax paid (452) (4,911) (12,047) (9,886) Capitalexpenditureandfinancialinvestment Purchase of tangible fixed assets (2,052) (1,659) Acquisitionsanddisposals Purchase of subsidiary undertakings (245) (5,741) Cash acquired with subsidiary undertaking - 121 3 Consideration on sale of fixed asset investment 730 11,052 485 5,432 Equitydividendspaidtoshareholders 9 Amounts paid (42,851) (51,013) Netcashoutflowbeforeuseofliquidresourcesandfinancing (10,760) (22,371) Managementofliquidresources 22 Cash drawn from short-term deposits 11,744 25,995 Financing Capital element of finance lease rental payments (2) (2) (Purchase)/sale of own shares (288) 533 Drawdown of unsecured loan facility 17,700 13,000 Repayment of unsecured loan facility (17,700) (13,000) (290) 531 22 Increaseinnetcash 694 4,155 Reconciliationofnetcashflowtomovementinnetfunds Increaseincashintheyear 694 4,155 Cash inflow from decrease in liquid resources (11,744) (25,995) Cash outflow from decrease in lease financing 2 2 Changeinnetfundsresultingfromcashflows (11,048) (21,838) Exchange translation differences (106) (1,650) Movement in net funds in the year (11,154) (23,488) Net funds brought forward at April 1st 28,738 52,226 22 NetfundscarriedforwardatMarch31st 17,584 28,738 Cash and deposits at March 31st 2008 amounted to £20,107,000 (2007: £31,263,000).

31
Otherstatements
Statementoftotalrecognisedgainsandlosses
YearsendedMarch31st 2008 2007 Restated NOTE £000 £000 Profit for the year 32,233 33,781 Exchange translation differences arising on foreign currency net investments 293 1,253 23 Actual return less expected return on pension scheme assets (14,389) 446 23 Experience losses arising on pension scheme liabilities (191) (433) 23 Changes in assumptions underlying the present value of pension scheme liabilities 31,294 5,361 Actuarial loss on other post-retirement benefits (496) (167) UK deferred tax attributable to the actuarial gain (4,766) (1,562) Totalrecognisedgainsfortheyear 43,978 38,679 29 Prior year adjustment due to adoption of the amendments to FRS 17 (550) Totalgainsrecognisedsincelastannualreport 43,428
Reconciliationofmovementsinequityshareholders’funds YearsendedMarch31st 2008 2007 Restated £000 £000 Profit for the year 32,233 33,781 Dividends paid (42,851) (51,013) Retained loss (10,618) (17,232) 21 Other recognised gains 11,452 3,645 21 Net (purchase)/sale of own shares (288) 533 21 Exchange translation differences arising on consolidation 293 1,253 Netaddition/(deduction)fromshareholders’funds 839 (11,801) 29 Opening shareholders’ funds (8,446) 3,355 Closingshareholders’deficit (7,607) (8,446) Noteofhistoricalcostprofitsandlosses As the financial statements are based on the historical cost convention, no separate statement of historical cost profits and losses is necessary.
32
Principalaccountingpolicies
A summary of the more important Group accounting policies is set out below. Accounting policies have been consistently applied, except that amendments to FRS 17 “Retirement benefits” have been early adopted in these statements. The adoption of this standard represents a change in accounting policy and the comparative figures have been restated accordingly (notes 23 and 29).
BasisofaccountingThe financial statements have been prepared under the historical cost convention and in accordance with the Companies Act 1985 applicable accounting standards.
Basisofconsolidation The consolidated accounts include the accounts of the company (The Economist Newspaper Limited) and its subsidiary undertakings (the Group/The Economist Group) made up to March 31st. The results of subsidiaries acquired are included in the consolidated profit and loss account from the date control passes.
The subsidiary’s assets and liabilities that exist at the date of acquisition are recorded at their fair values, reflecting their condition at that date. All changes to those assets and liabilities, and the resulting gains and losses, that arise after the Group has gained control of the subsidiary are charged to the post-acquisition profit and loss account. Acquisitions are accounted for using the acquisition method.
TurnoverTurnover represents sales to third parties from circulation, subscriptions, advertising, sponsorship, delegate fees and rental income net of advertising agency commissions and trade
discounts, and excluding intra-Group sales, value-added tax and other sales-related taxes.
Circulation and advertising revenue relating to a newspaper or other publication is recognised on the date it goes on sale, or is dispatched, in the case of free publications. Subscription revenues are recognised in the profit and loss account over the period of the subscription. Sponsorship and delegate revenue arising in the year relating to future events is deferred until those events have taken place.
Where a contractual arrangement consists of two or more separate elements that can be provided to customers either on a stand-alone basis or as an optional extra, turnover is recognised for each element as if it were an individual contractual arrangement.
ForeigncurrenciesBalance sheets have been translated into sterling at the rates of exchange ruling at the balance-sheet date. Exchange differences arising from the retranslation of the opening net investments to closing rates are recorded as movements on reserves. Exchange differences arising on the retranslation of borrowings taken out to finance overseas investments are taken to reserves, together with any tax-related effects. All other exchange differences are included in the profit and loss account. Profit and loss accounts and cashflows are translated into sterling at the average rate for the year. The Group enters into forward currency and option contracts to hedge currency exposures. Losses or realised gains arising from the closing of contracts are included within the trading results for the year. Other
gains or losses on open contracts are deferred.
Share-basedpayments The Group awards certain employees entitlements to cash-settled share-based payments in accordance with its long-term incentive scheme arrangements. The fair value of these awards is measured and updated using an appropriate option pricing model. The key assumptions used in calculating the fair value of the awards are the discount rate, the Group’s share price volatility, dividend yield, risk-free rate of return and expected option lives. These assumptions are set out in note 10. Management regularly performs a true-up of the estimate of the number of awards that are expected to vest. This is dependent on the anticipated number of leavers. In addition to the key assumptions above, the value of the awards is dependent upon the future profits of the Group and the Group’s relative market performance, which management is required to estimate. A liability equal to the portion of the services received is recognised at the current fair value determined at each balance sheet date for cash-settled share-based payments.
GoodwillGoodwill arising on the acquisition of subsidiary undertakings, representing the excess of the fair value of the consideration given over the fair value of the identifiable assets and liabilities acquired, is capitalised as an intangible asset and written off over its useful economic life. Prior to April 1st 1998, purchased goodwill arising on consolidation was written off to reserves in the year in which it arose in accordance with the accounting standards then in force. From April 1st 1998, the provisions of FRS 10
33
“Goodwill and intangible assets” have been adopted, and such goodwill for new acquisitions is now required to be shown as an asset on the balance sheet and amortised over its useful economic life. Goodwill arising on acquisitions before April 1st 1998 has been deducted from reserves and is charged to the profit and loss account on disposal or closure of the business to which it relates.
Goodwill is provided to write off cost over the acquisition’s useful economic life as follows: Useful economic Subsidiary acquired life (years)EuroFinance 20GalleryWatch 20
Where there has been an indication of impairment of goodwill, it is the Group’s policy to review its carrying value. In the case of goodwill previously written off directly against reserves, the impaired amounts are written back from reserves and then written off against the profit and loss for the year.
Stocksandwork-in-progress Stocks and work-in-progress are valued at the lower of cost and net realisable value. Cost includes all direct expenditure. Deferred conference costs represent costs incurred for conferences planned to be held after the balance sheet date.
Leasedassets Where the Group has entered into finance leases, the obligations to the lessor are shown as part of the borrowings and the corresponding assets are treated as fixed assets. Leases are regarded as finance leases where their terms transfer to the lessee
substantially all the benefits and burdens of ownership other than the right to retain legal title.
Depreciation is calculated in order to write off the amounts capitalised over the estimated useful lives of the assets by equal annual instalments. Rentals payable under finance leases are apportioned between capital and interest, the interest portion being charged to the profit and loss account and the capital portions reducing the obligations to the lessor.
Costs in respect of operating leases are charged on a straight-line basis over the lease term. Operating lease incentives received are initially deferred and subsequently recognised over the minimum contract period. Rental income is recognised on a straight-line basis over the lease term.
Provision is made for onerous lease rentals payable on empty properties and where letting receipts are anticipated to be less than cost. Provision is made for the period that the directors consider that the property will remain unlet or unutilised, or to the extent that there is a shortfall in net rental income. The time value of money in respect of onerous lease provisions has been recognised by discounting the future payments to net present values.
Investments Investments held as fixed assets are included at cost, less provisions for diminution in value.
Shareschemes Shares held by the employee share ownership plan (ESOP) are shown at cost and recorded as a deduction in arriving at shareholders’ funds. The
fair market value of shares granted to employees is charged to the profit and loss account over the period to which the employee’s performance relates.
Tradedebtors Trade debtors are stated less provision for bad and doubtful debts and anticipated future sales returns.
Taxation Current tax, including UK corporation tax and foreign tax, is provided at amounts expected to be paid (or recovered), using the tax rates and laws that have been enacted or substantively enacted by the balance sheet date.
Deferredtaxation Deferred taxation is fully provided, using the liability method, at the expected applicable rates, on all timing differences between accounting and taxation treatments which are expected to reverse in the foreseeable future.
No provision is made for any additional taxation which would arise on the remittance of profits retained, where there is no intention to remit such profits. A deferred tax asset is only recognised to the extent that it is more likely than not that there will be taxable profits from which the future reversal of the timing differences can be deducted.
UnexpiredsubscriptionsanddeferredrevenueUnexpired subscriptions represent the amount of subscription monies received in advance of supplying the publication or service, and which therefore remain a liability to the subscriber. Deferred revenue represents all other payments received in advance of services being provided, primarily conference fees, sponsorship and rental income.
34
Pensionandotherpost-retirementbenefits The cost of providing pensions under defined contribution schemes is charged against profits as they become payable.
For the defined benefit and post-retirement medical schemes, pension scheme assets are measured using fair values and the liabilities are measured using a projected unit method and discounted at the current rate of return on a high-quality corporate bond of equivalent term to the liability. The pension scheme deficit is recognised in full, net of deferred tax, and presented on the face of the balance sheet.
The movement in the scheme deficit is split between operating and financial items in the profit and loss account and the statement of total recognised
gains and losses. The full service cost of the pension provision is charged to operating profit. The net impact of the unwinding of the discount rate on scheme liabilities and the expected return of the scheme assets is charged to other finance costs. Any difference between the expected return on assets and that actually achieved is charged through the statement of total recognised gains and losses. Similarly, any differences that arise from experience or assumption changes are charged through the statement of total recognised gains and losses.
Financecosts Finance costs which are directly attributable to the cost of construction of a tangible fixed asset are capitalised as part of the costs of that tangible fixed asset.
Tangiblefixedassets Tangible fixed assets are stated at cost less accumulated depreciation. The cost of leasehold assets includes directly attributable finance costs. Depreciation is provided to write off cost over the asset’s useful economic life as follows:
Asset type Depreciation method Depreciation rate per year
Long and short leasehold property Straight-line basis Duration of lease
Fixtures and fittings Straight-line basis 14%
Plant and machinery Straight-line basis 10-33%
Equipment Straight-line basis 14-50%
Motor vehicles Straight-line basis 25%
Major software systems Straight-line basis 20-33%
Websitedevelopmentcosts Design and content costs are capitalised only to the extent that they lead to the creation of an enduring asset delivering benefits at least as great as the amount capitalised. If there is insufficient evidence on which to base reasonable estimates of the economic benefits that will be generated in the period until the design and content are next updated, the costs of developing the design and content are charged to the profit and loss account as incurred.

35
Notestothefinancialstatements
NOTE 1 Segment information
2008 2007Turnoverbybusiness £000 £000Economist brand family 221,080 205,457CFO brand family 24,673 24,324Government brands 16,775 14,414Other businesses 3,871 3,551 266,399 247,746Other businesses include Ryder Street Properties (which owns and manages the Economist Complex in London).Government brands’ turnover in 2007 includes £669,000 in respect of the acquisition of GalleryWatch. Turnover between brand families is not material.
2008 2007Operatingprofitbybusiness £000 £000Economist brand family 35,736 27,094 CFO brand family 1,408 2,361 Government brands 4,845 4,341 Other businesses 3,186 3,074 Goodwill amortisation (856) (731) 44,319 36,139 Government brands’ operating profit in 2007 includes a loss of £94,000 in respect of the acquisition of GalleryWatch.
2008 2007Net(liabilities)/assetsbybusiness £000 £000Economist brand family 320,133 283,452 CFO brand family (5,226) (8,056)Government brands 14,590 8,201 Other businesses 2,930 2,665 Shared activities (340,034) (294,708) (7,607) (8,446)Dividends of The Economist Newspaper Limited are charged to shared activities. Government brands’ net assets in 2007 include £23,000 in respect of the acquisition of GalleryWatch.
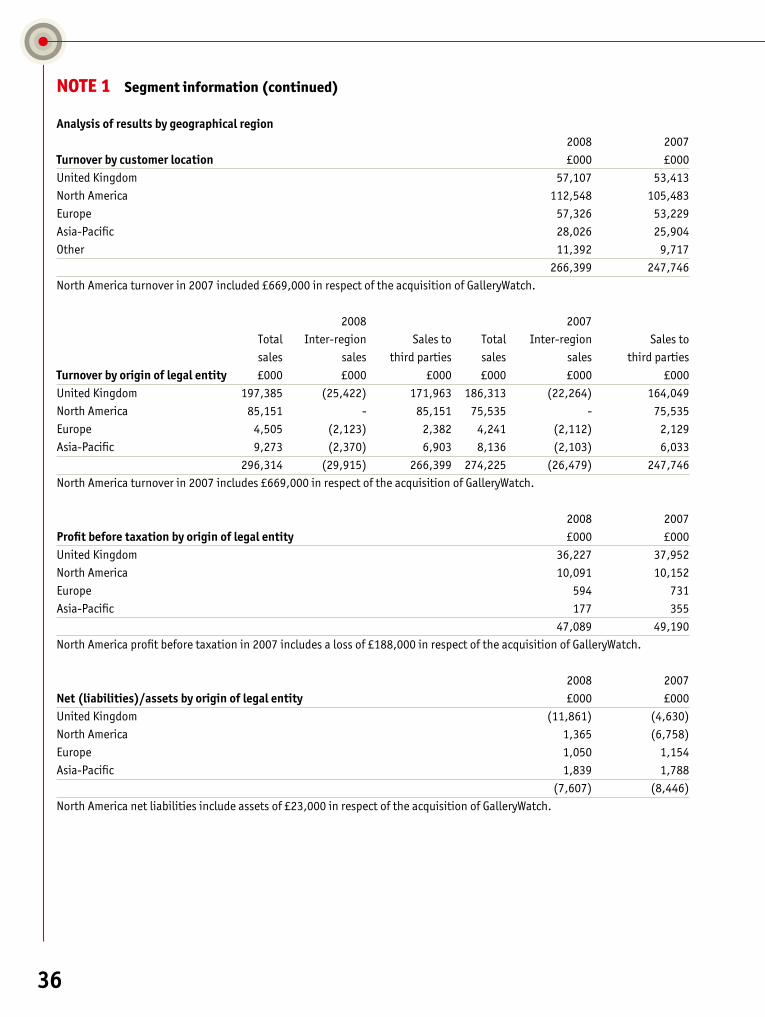
36
NOTE 1 Segment information (continued)
Analysisofresultsbygeographicalregion 2008 2007Turnoverbycustomerlocation £000 £000United Kingdom 57,107 53,413North America 112,548 105,483Europe 57,326 53,229Asia-Pacific 28,026 25,904Other 11,392 9,717 266,399 247,746North America turnover in 2007 included £669,000 in respect of the acquisition of GalleryWatch. 2008 2007 Total Inter-region Sales to Total Inter-region Sales to sales sales third parties sales sales third partiesTurnoverbyoriginoflegalentity £000 £000 £000 £000 £000 £000United Kingdom 197,385 (25,422) 171,963 186,313 (22,264) 164,049 North America 85,151 - 85,151 75,535 - 75,535 Europe 4,505 (2,123) 2,382 4,241 (2,112) 2,129 Asia-Pacific 9,273 (2,370) 6,903 8,136 (2,103) 6,033 296,314 (29,915) 266,399 274,225 (26,479) 247,746 North America turnover in 2007 includes £669,000 in respect of the acquisition of GalleryWatch. 2008 2007Profitbeforetaxationbyoriginoflegalentity £000 £000United Kingdom 36,227 37,952 North America 10,091 10,152 Europe 594 731 Asia-Pacific 177 355 47,089 49,190 North America profit before taxation in 2007 includes a loss of £188,000 in respect of the acquisition of GalleryWatch. 2008 2007 Net(liabilities)/assetsbyoriginoflegalentity £000 £000United Kingdom (11,861) (4,630) North America 1,365 (6,758)Europe 1,050 1,154 Asia-Pacific 1,839 1,788 (7,607) (8,446)North America net liabilities include assets of £23,000 in respect of the acquisition of GalleryWatch.
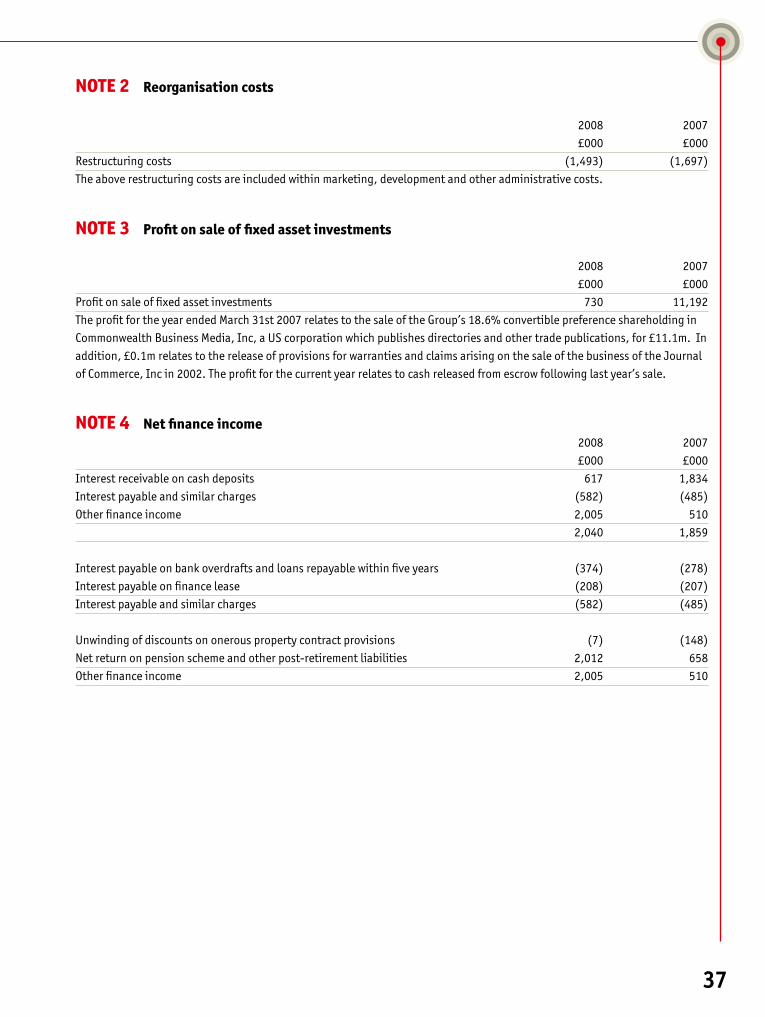
37
NOTE 3 Profit on sale of fixed asset investments
2008 2007 £000 £000Profit on sale of fixed asset investments 730 11,192 The profit for the year ended March 31st 2007 relates to the sale of the Group’s 18.6% convertible preference shareholding in Commonwealth Business Media, Inc, a US corporation which publishes directories and other trade publications, for £11.1m. In addition, £0.1m relates to the release of provisions for warranties and claims arising on the sale of the business of the Journal of Commerce, Inc in 2002. The profit for the current year relates to cash released from escrow following last year’s sale.
NOTE 4 Net finance income 2008 2007 £000 £000Interest receivable on cash deposits 617 1,834Interest payable and similar charges (582) (485)Other finance income 2,005 510 2,040 1,859
Interest payable on bank overdrafts and loans repayable within five years (374) (278)Interest payable on finance lease (208) (207)Interest payable and similar charges (582) (485)
Unwinding of discounts on onerous property contract provisions (7) (148)Net return on pension scheme and other post-retirement liabilities 2,012 658Other finance income 2,005 510
NOTE 2 Reorganisation costs
2008 2007 £000 £000Restructuring costs (1,493) (1,697)The above restructuring costs are included within marketing, development and other administrative costs.
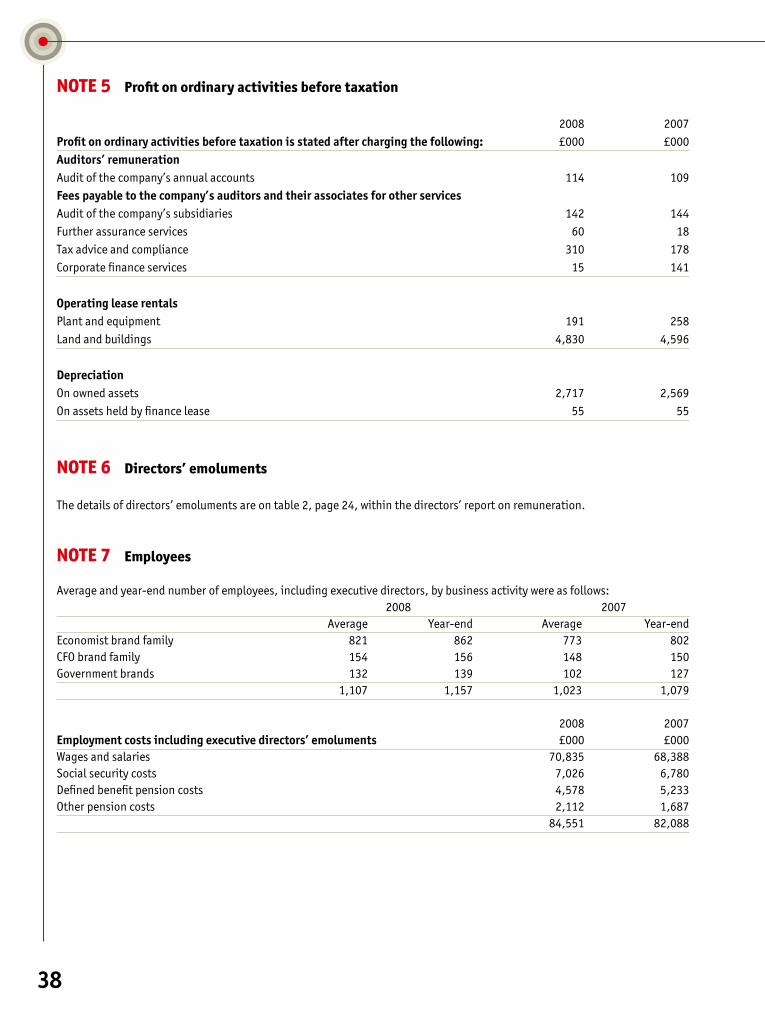
38
NOTE 5 Profit on ordinary activities before taxation
2008 2007Profitonordinaryactivitiesbeforetaxationisstatedafterchargingthefollowing: £000 £000Auditors’remuneration Audit of the company’s annual accounts 114 109Feespayabletothecompany’sauditorsandtheirassociatesforotherservices Audit of the company’s subsidiaries 142 144Further assurance services 60 18Tax advice and compliance 310 178Corporate finance services 15 141 Operatingleaserentals Plant and equipment 191 258 Land and buildings 4,830 4,596
Depreciation On owned assets 2,717 2,569 On assets held by finance lease 55 55
NOTE 6 Directors’ emoluments
The details of directors’ emoluments are on table 2, page 24, within the directors’ report on remuneration.
NOTE 7 Employees
Average and year-end number of employees, including executive directors, by business activity were as follows: 2008 2007 Average Year-end Average Year-endEconomist brand family 821 862 773 802 CFO brand family 154 156 148 150 Government brands 132 139 102 127 1,107 1,157 1,023 1,079 2008 2007Employmentcostsincludingexecutivedirectors’emoluments £000 £000Wages and salaries 70,835 68,388Social security costs 7,026 6,780Defined benefit pension costs 4,578 5,233Other pension costs 2,112 1,687 84,551 82,088

39
NOTE 8 Taxation on profit on ordinary activities 2008 2007Thetaxationchargebasedontheresultfortheyearismadeupasfollows: £000 £000UK corporation tax at 30% (2007: 30%) 8,346 7,419 Overseas taxation 3,305 2,151 UK deferred taxation 2,966 4,428UK deferred taxation–effect of UK tax rate decreasing in 2009 to 28% 119 -Overseas deferred taxation (402) 1,970 14,334 15,968 Adjustmentsinrespectofpreviousyears UK corporation tax (62) 425Overseas taxation 1,487 175UK deferred taxation (note 16) 97 (991) Overseas deferred taxation (1,000) (168) 14,856 15,409 Included within the deferred tax charge for the year is a FRS 17 charge of £1,501,000 (2007: £5,535,000). In the current year, the overseas deferred taxation charge derives from those tax losses the Group has available in the United States and Asia which have been recognised. 2008 2007Currenttaxratereconciliation % %UK tax rate 30.0 30.0 Expenses not deductible for tax purposes 1.1 0.9 Depreciation in excess of capital allowances 0.1 0.1Utilisation of general provisions (4.5) 2.4Overseas tax rates 0.5 0.5Overseas tax losses utilised - (3.4)Timing of US goodwill amortisation 0.5 0.1Deferred income 0.5 0.1 FRS 17 pension movement (3.4) (11.2)Adjustments to tax charge in respect of previous periods 3.0 1.2Current tax rate reflected in earnings 27.8 20.7The standard rate of corporation tax in the UK changed to 28% with effect from April 1st 2008.

40
NOTE 9 Dividends 2008 2007Cashdividendspaid £000 £000Final dividend paid of 54.5p per share (2007: 43.8p per share) 13,652 10,958Interim dividend paid of 25.2p per share (2007: 21.0p per share) 6,316 5,257Special dividend paid of 91.3p per share (2007: 139.0p per share) 22,883 34,798 42,851 51,013All shareholders other than holders of the trust shares (see note 20) receive the above dividend per share. Dividends amounting to £241,000 (2007: £345,000) in respect of the company’s shares held by the ESOP (note 21) have been deducted in arriving at the aggregate of dividends paid. 2008 2007Dividendsproposedinrespectoftheyear £000 £000Final dividend proposed of 65.2p per share (2007: 54.5p per share) 16,323 13,652Interim dividend paid of 25.2p per share (2007: 21.0p per share) 6,316 5,257Special dividend paid of 91.3p per share (2007: 139.0p per share) 22,883 34,798 45,522 53,707The directors are proposing a final dividend in respect of the financial year ending March 31st 2008 of 65.2p. Dividends amounting to £107,000 in respect of the company’s shares held by the ESOP have been deducted in arriving at the total dividend proposed of £16,323,000. The proposed dividend is subject to approval by shareholders and has not been recognised as a liability in these financial statements.
NOTE 10 Share-based payments The Economist Group operates two share-based incentive schemes.
The Group has recorded total liabilities on share-based incentive schemes at March 31st 2008 of £9,604,000 (2007: £11,708,000), of which £5,627,000 (2007: £8,118,000) relates to awards which had vested at the year end. The total expense recognised with respect to cash-settled share-based payment transactions was £5,981,000 (2007: £7,661,000). Executivelong-termplanUnits are granted to executive directors and senior employees. These awards are taken in cash form only after three years. The value of the award is based on share price, the earnings per share compound annual growth rate and the Group’s total shareholder return (TSR) compared with a group of selected comparator companies over the period of the scheme.
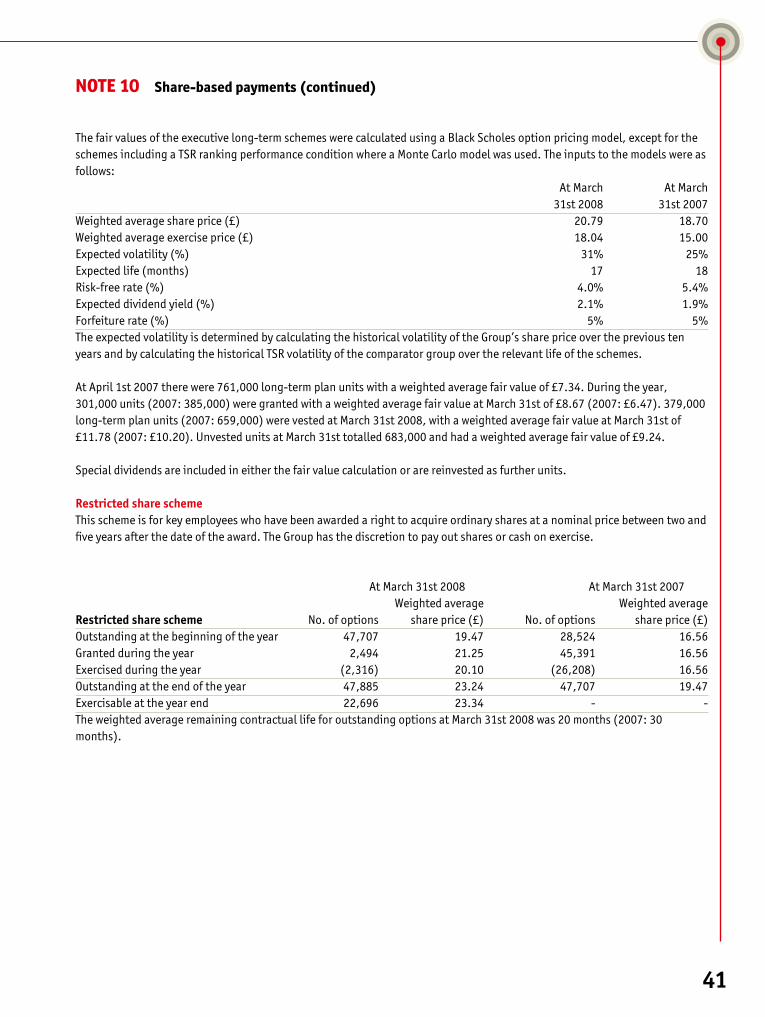
41
NOTE 10 Share-based payments (continued)
The fair values of the executive long-term schemes were calculated using a Black Scholes option pricing model, except for the schemes including a TSR ranking performance condition where a Monte Carlo model was used. The inputs to the models were as follows: At March At March 31st 2008 31st 2007Weighted average share price (£) 20.79 18.70Weighted average exercise price (£) 18.04 15.00Expected volatility (%) 31% 25%Expected life (months) 17 18Risk-free rate (%) 4.0% 5.4%Expected dividend yield (%) 2.1% 1.9%Forfeiture rate (%) 5% 5% The expected volatility is determined by calculating the historical volatility of the Group’s share price over the previous ten years and by calculating the historical TSR volatility of the comparator group over the relevant life of the schemes.
At April 1st 2007 there were 761,000 long-term plan units with a weighted average fair value of £7.34. During the year, 301,000 units (2007: 385,000) were granted with a weighted average fair value at March 31st of £8.67 (2007: £6.47). 379,000 long-term plan units (2007: 659,000) were vested at March 31st 2008, with a weighted average fair value at March 31st of £11.78 (2007: £10.20). Unvested units at March 31st totalled 683,000 and had a weighted average fair value of £9.24.
Special dividends are included in either the fair value calculation or are reinvested as further units.
RestrictedshareschemeThis scheme is for key employees who have been awarded a right to acquire ordinary shares at a nominal price between two and five years after the date of the award. The Group has the discretion to pay out shares or cash on exercise.
At March 31st 2008 At March 31st 2007 Weighted average Weighted averageRestrictedsharescheme No. of options share price (£) No. of options share price (£)Outstanding at the beginning of the year 47,707 19.47 28,524 16.56 Granted during the year 2,494 21.25 45,391 16.56 Exercised during the year (2,316) 20.10 (26,208) 16.56Outstanding at the end of the year 47,885 23.24 47,707 19.47Exercisable at the year end 22,696 23.34 - - The weighted average remaining contractual life for outstanding options at March 31st 2008 was 20 months (2007: 30 months).
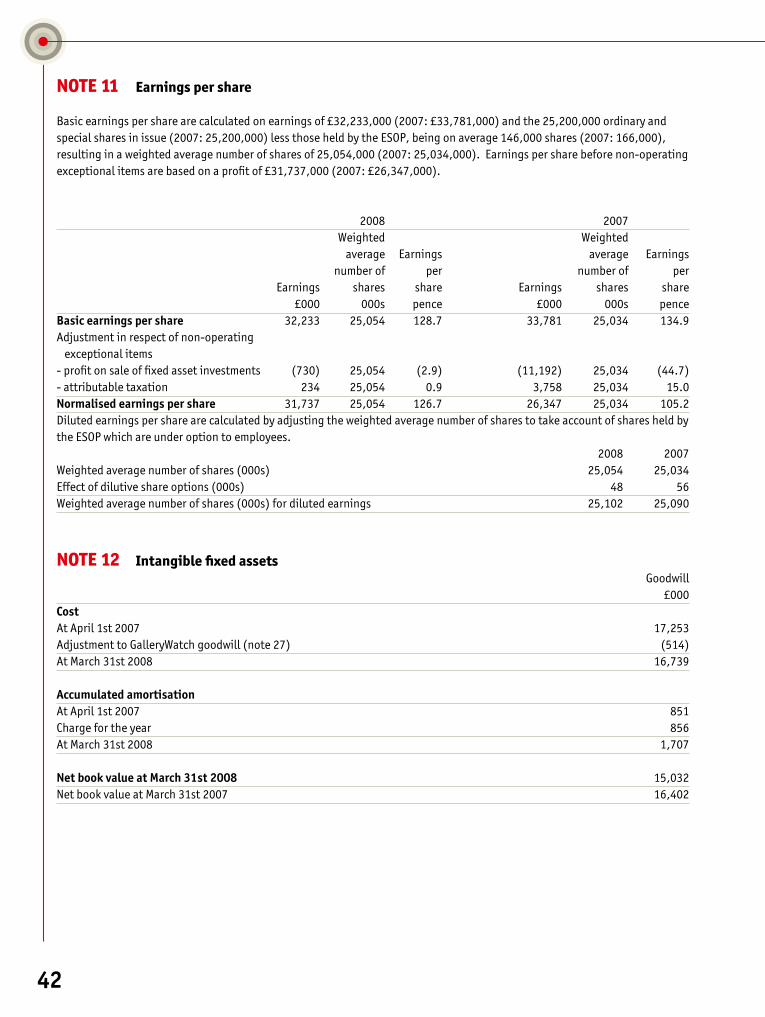
42
NOTE 11 Earnings per share Basic earnings per share are calculated on earnings of £32,233,000 (2007: £33,781,000) and the 25,200,000 ordinary and special shares in issue (2007: 25,200,000) less those held by the ESOP, being on average 146,000 shares (2007: 166,000), resulting in a weighted average number of shares of 25,054,000 (2007: 25,034,000). Earnings per share before non-operating exceptional items are based on a profit of £31,737,000 (2007: £26,347,000). 2008 2007 Weighted Weighted average Earnings average Earnings number of per number of per Earnings shares share Earnings shares share £000 000s pence £000 000s penceBasicearningspershare 32,233 25,054 128.7 33,781 25,034 134.9Adjustment in respect of non-operating exceptional items- profit on sale of fixed asset investments (730) 25,054 (2.9) (11,192) 25,034 (44.7) - attributable taxation 234 25,054 0.9 3,758 25,034 15.0 Normalisedearningspershare 31,737 25,054 126.7 26,347 25,034 105.2Diluted earnings per share are calculated by adjusting the weighted average number of shares to take account of shares held by the ESOP which are under option to employees. 2008 2007Weighted average number of shares (000s) 25,054 25,034Effect of dilutive share options (000s) 48 56 Weighted average number of shares (000s) for diluted earnings 25,102 25,090
NOTE 12 Intangible fixed assets Goodwill £000Cost At April 1st 2007 17,253 Adjustment to GalleryWatch goodwill (note 27) (514) At March 31st 2008 16,739
Accumulatedamortisation At April 1st 2007 851 Charge for the year 856At March 31st 2008 1,707
NetbookvalueatMarch31st2008 15,032 Net book value at March 31st 2007 16,402
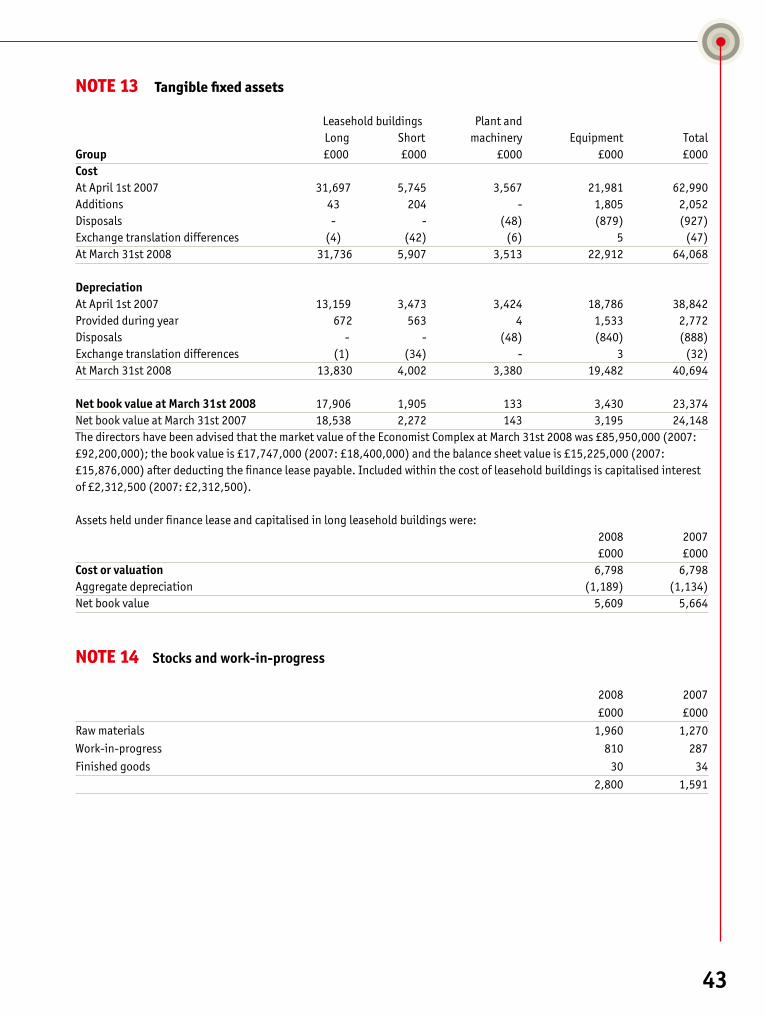
43
NOTE 13 Tangible fixed assets Leaseholdbuildings Plantand Long Short machinery Equipment TotalGroup £000 £000 £000 £000 £000Cost AtApril1st2007 31,697 5,745 3,567 21,981 62,990Additions 43 204 - 1,805 2,052Disposals - - (48) (879) (927)Exchangetranslationdifferences (4) (42) (6) 5 (47)AtMarch31st2008 31,736 5,907 3,513 22,912 64,068 Depreciation AtApril1st2007 13,159 3,473 3,424 18,786 38,842Providedduringyear 672 563 4 1,533 2,772Disposals - - (48) (840) (888)Exchangetranslationdifferences (1) (34) - 3 (32)AtMarch31st2008 13,830 4,002 3,380 19,482 40,694
Net book value at March 31st 2008 17,906 1,905 133 3,430 23,374NetbookvalueatMarch31st2007 18,538 2,272 143 3,195 24,148ThedirectorshavebeenadvisedthatthemarketvalueoftheEconomistComplexatMarch31st2008was£85,950,000(2007:£92,200,000);thebookvalueis£17,747,000(2007:£18,400,000)andthebalancesheetvalueis£15,225,000(2007:£15,876,000)afterdeductingthefinanceleasepayable.Includedwithinthecostofleaseholdbuildingsiscapitalisedinterestof£2,312,500(2007:£2,312,500). Assetsheldunderfinanceleaseandcapitalisedinlongleaseholdbuildingswere: 2008 2007 £000 £000Cost or valuation 6,798 6,798Aggregatedepreciation (1,189) (1,134)Netbookvalue 5,609 5,664
NOTE 14 Stocks and work-in-progress 2008 2007 £000 £000Rawmaterials 1,960 1,270Work-in-progress 810 287Finishedgoods 30 34 2,800 1,591
44
NOTE 15 Debtors
2008 2007Duewithinoneyear £000 £000Trade debtors 39,710 35,248Other debtors 1,572 1,974Prepayments and accrued income 7,419 6,753 Tax recoverable 279 3,881 48,980 47,856
NOTE 16 Deferred taxation
Summaryofmovementsindeferredtaxasset £000At April 1st 2007 6,163Transfer from creditors (58) Charge to the profit and loss account (279)Charge to the statement of recognised gains and losses 495Exchange difference (12)At March 31st 2008 6,309
The assets recognised for deferred taxation under the liability method are: 2008 2007 £000 £000Excess of depreciation over capital allowances 894 880 Loss relief 1,326 - Other timing differences 4,089 5,283 6,309 6,163All potential assets have been recognised except for taxation which would arise on the remittance of profits retained overseas. Losses in the United States and Asia have been recognised as noted below. The Group has accumulated trading losses of £5,013,815 (2007: £5,352,000) in Asia. The Group has recognised Hong Kong trading losses to the value of the losses expected to be used in the next four years. An asset has been recognised for carried-forward losses of £1,501,367 on the basis that forecast profits will arise in the United States against which the tax asset can be recovered. A deferred tax asset of £555,000 has been recognised in respect of state income tax losses in the United States which have been carried forward.
45
NOTE 17 Creditors: due within one year 2008 2007 £000 £000Trade creditors 9,121 4,649 Other creditors including taxation and social security 16,057 17,524 Accruals 30,105 33,827 55,283 56,000Other creditors including taxation and social security comprise: Corporation tax 6,365 8,919Other tax and social security payable 2,450 2,139Other creditors 7,242 6,466 16,057 17,524The Group had no bank loans as at March 31st 2008 (2007: £nil). During the year the Group increased its unsecured, three-year committed £25m facility to £50m. In addition, the Group has undrawn overdraft facilities which are subject to review by the end of December 2008.
NOTE 18 Creditors: due after one year 2008 2007 £000 £000Finance leases 2,522 2,524Other creditors - 334 2,522 2,858
Future minimum payments under finance leases were as follows:Within one year 1 1In more than one year but not more than five years 6 6After five years 2,516 2,518 2,523 2,525The finance lease on the Economist Complex is repayable in quarterly instalments until 2111, at an interest rate of 4.3%.
NOTE 19 Provisions for liabilities and charges Onerous property leases £000At April 1st 2007 440 Utilised in year (160)Unwinding of discount 7 Exchange difference (6)At March 31st 2008 281 The provision for onerous leases is expected to unwind over the next three years.

46
NOTE 20 Equity share capital Authorised Issued and fully paidAtMarch31st2008and2007 Number £000 Number £000“A” special shares of 5p each 1,575,000 79 1,260,000 63“B” special shares of 5p each 1,575,000 79 1,260,000 63Ordinary shares of 5p each 36,850,000 1,842 22,680,000 1,134Trust shares of 5p each 100 - 100 - 2,000 1,260 FRS 4, “Capital Instruments” requires the Group to provide a summary of the rights of each class of shares. This summary can be found in the directors’ report on pages 18 to 19. The trust shares participate in a distribution of capital only to a limited extent and accordingly are not treated as equity share capital.
NOTE 21 Reserves 2008 2007Consolidatedprofitandlossaccount £000 £000At April 1st as previously stated (9,156) 2,325Adoption of changes to FRS17 (550) (230)At April 1st as restated (9,706) 2,095Retained loss for the year (10,618) (17,232)Other recognised gains relating to the year 11,452 3,645Net (purchase)/sale of own shares (288) 533 Exchange translation differences arising on consolidation 293 1,253At March 31st (8,867) (9,706)The cumulative goodwill written off to profit and loss reserves by the Group is £22,800,000 (2007: £22,800,000) and arises mainly from the purchase of Business International in 1986, CFO Publishing Corporation in 1988 and Roll Call, Inc in 1992 and 1993.
At March 31st 2008, there were 164,605 ordinary shares (2007: 150,484) of 5p each with a nominal value of £8,230 (2007: £7,524) in The Economist Newspaper Limited (own shares) held by the ESOP. The ESOP provides a limited market for shares of The Economist Newspaper Limited to be bought and sold. Employees of the Group can apply to buy shares from the ESOP twice a year at the latest indicative share valuation and all other shareholders can offer to sell their shares to the ESOP. A subsidiary company, The Economist Group Trustee Company Limited, acts as trustee of the ESOP and handles all share transactions. The ESOP has not waived its entitlement to dividends on these shares. 47,885 (2007: 47,707) of the shares are under option to employees and have been conditionally granted to them. The interest in own shares, included within reserves, is as follows: £000At April 1st 2007 1,336 Net purchase of own shares 288 At March 31st 2008 1,624
47
NOTE 22 Notes to consolidated cashflow statement
2008 2007Reconciliationofoperatingprofittonetcashinflowfromoperatingactivities £000 £000Operating profit 44,319 36,139Depreciation of tangible fixed assets 2,772 2,624Goodwill amortisation 856 731 Loss on sale of tangible fixed assets 39 -(Increase)/decrease in stocks (1,211) 421Increase in debtors (4,851) (5,269)Increase in creditors 2,056 10,919Increase in unexpired subscriptions and deferred revenue 5,156 6,159Decrease in provisions (3,489) (18,322)Net cash inflow from operating activities 45,647 33,402Net cash inflow from operating activities was reduced by £3,400,000 due to special defined benefit pension contributions (2007: £17,100,000).
Other At April 1st non-cash Exchange At March 31st 2007 Cashflow changes movement 2008Analysisofnetfunds £000 £000 £000 £000 £000Cash in hand 11,492 694 - (63) 12,123 Cash placed on short-term deposits 19,771 (11,744) - (43) 7,984 Total cash balances 31,263 (11,050) - (106) 20,107 Finance leases due within one year (1) 2 (2) - (1)Finance leases due after one year (2,524) - 2 - (2,522)Net funds 28,738 (11,048) - (106) 17,584At March 31st 2008 cash balances included £1,939,000 (2007: £1,827,000) of deposits collected from tenants of the Group’s property business. This cash is only accessible in the event of the tenant defaulting.
48
NOTE 23 Pension and other post-retirement liabilities 2008 2007 RestatedAnalysisofpensionandotherpost-retirementliabilities(netofdeferredtax) £000 £000UK Group scheme surplus/(deficit) 7,553 (8,109)Post-retirement medical benefits liability (2,292) (1,934) 5,261 (10,043)The Group operates pension schemes for most of its employees throughout the world, which are funded by the Group. The main scheme for UK staff who joined before 2003 (the UK Group scheme) provides funded defined benefits. The scheme has a defined contribution underpin and provides for those employees who joined before 2003, for the better of defined benefit and defined contribution benefits. Defined contribution schemes are operated for UK and non-UK staff. In addition, the Group provides unfunded, unapproved pension arrangements in respect of certain employees. The assets of each scheme are held in separate trustee-administered funds with independent qualified actuaries or other professionals acting as advisers. Actuarial valuations are undertaken at regular intervals.
The UK Group scheme has been closed to new members since January 1st 2003; a defined contribution scheme is now available to new joiners. As a result, under the projected unit credit method, the current service cost is expected to increase as members approach retirement. Until November 30th 2007, the company contribution rate to the UK Group scheme during the year was 17.1% of pensionable salaries plus £350,000 per year to fund ongoing service costs and scheme expenses. The company also contributed £2,139,070 per year to repay the deficit. After November 30th 2007, the company contributed 21.7% of pensionable salaries and £350,000 per year to fund ongoing service costs and scheme expenses and £905,000 per year to repay the deficit. These arrangements have continued into 2008 except that the deficit payment increased to £1,040,000 per year. The best estimate of contributions expected to be paid to the scheme in 2008 is £5,438,000.
Special contributions of £900,000 and £2,500,000 were paid into the scheme in April 2007 and December 2007 respectively. Depending on whether the scheme is in deficit, further special contributions of £2,500,000 have been committed annually for the next two years.
The most recent full actuarial valuation of the UK defined benefit scheme was at January 1st 2007. This showed the market value of assets of the main UK scheme to be £156,656,000. The actuarial valuation of pension liabilities was £181,472,000, leaving a deficit of £24,816,000. The actuarial method used for the valuation was the projected unit credit method. The Minimum Funding Requirement was replaced by the Scheme Specific Funding (SSF) regulations from completion of the January 1st 2007 valuation. The foregoing liabilities represent the SSF Technical Provisions as agreed by the Group and the trustees. The SSF level of funding was 86%. The valuation was updated to March 31st 2007 and showed the market value of assets to be £159,218,000, the actuarial valuation of pension liabilities £171,112,000, leaving a deficit of £11,894,000. The March 2007 valuation was used as a basis for determining the ongoing company funding rate, effective December 1st 2007.
The FRS 17 valuation reflects HM Revenue and Custom (HMRC) rules relating to commutation of tax-free cash effective April 6th 2006. Past scheme experience indicates that the majority of retirees take the maximum level of cash available. Cash commutation factors, which are regularly reviewed by the trustees, remained based around a factor of 15:1 at age 60.
The main overseas schemes and one UK scheme are based on defined contributions; amounts totalling £121,000 (2007: £81,000) were accrued in respect of these schemes at year end.
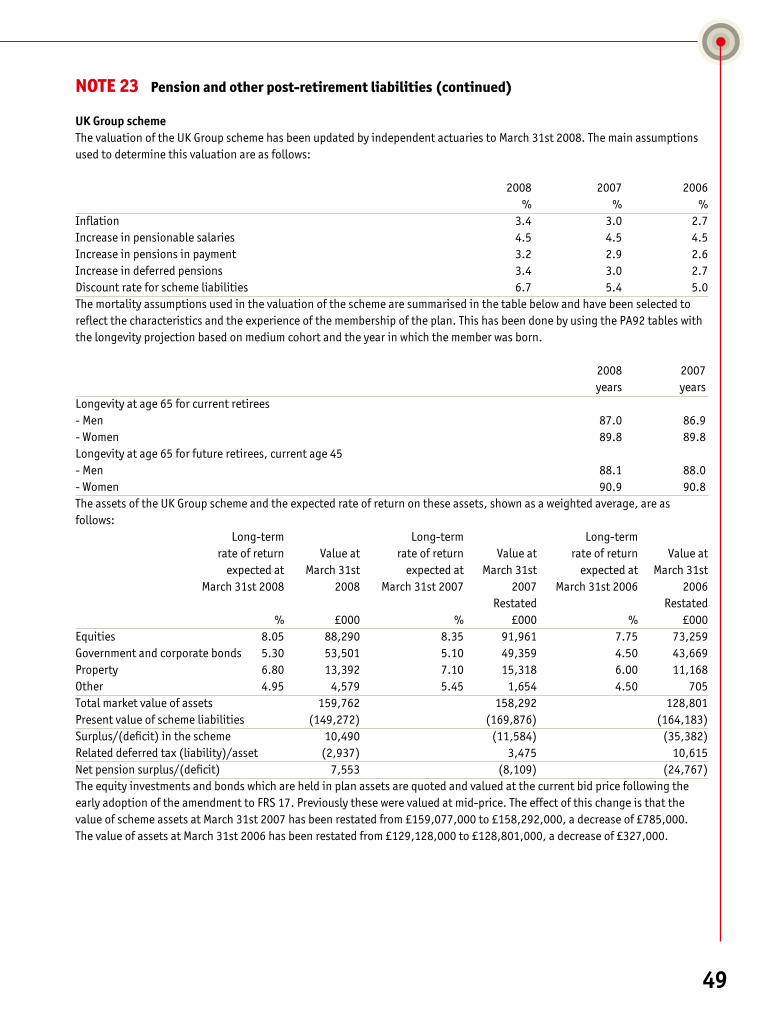
49
NOTE 23 Pension and other post-retirement liabilities (continued)
UKGroupscheme The valuation of the UK Group scheme has been updated by independent actuaries to March 31st 2008. The main assumptions used to determine this valuation are as follows: 2008 2007 2006 % % %Inflation 3.4 3.0 2.7Increase in pensionable salaries 4.5 4.5 4.5Increase in pensions in payment 3.2 2.9 2.6Increase in deferred pensions 3.4 3.0 2.7Discount rate for scheme liabilities 6.7 5.4 5.0The mortality assumptions used in the valuation of the scheme are summarised in the table below and have been selected to reflect the characteristics and the experience of the membership of the plan. This has been done by using the PA92 tables with the longevity projection based on medium cohort and the year in which the member was born.
2008 2007 years yearsLongevity at age 65 for current retirees - Men 87.0 86.9- Women 89.8 89.8Longevity at age 65 for future retirees, current age 45 - Men 88.1 88.0- Women 90.9 90.8The assets of the UK Group scheme and the expected rate of return on these assets, shown as a weighted average, are as follows: Long-term Long-term Long-term rate of return Value at rate of return Value at rate of return Value at expected at March 31st expected at March 31st expected at March 31st March 31st 2008 2008 March 31st 2007 2007 March 31st 2006 2006 Restated Restated % £000 % £000 % £000Equities 8.05 88,290 8.35 91,961 7.75 73,259Government and corporate bonds 5.30 53,501 5.10 49,359 4.50 43,669Property 6.80 13,392 7.10 15,318 6.00 11,168Other 4.95 4,579 5.45 1,654 4.50 705Total market value of assets 159,762 158,292 128,801Present value of scheme liabilities (149,272) (169,876) (164,183)Surplus/(deficit) in the scheme 10,490 (11,584) (35,382)Related deferred tax (liability)/asset (2,937) 3,475 10,615Net pension surplus/(deficit) 7,553 (8,109) (24,767)The equity investments and bonds which are held in plan assets are quoted and valued at the current bid price following the early adoption of the amendment to FRS 17. Previously these were valued at mid-price. The effect of this change is that the value of scheme assets at March 31st 2007 has been restated from £159,077,000 to £158,292,000, a decrease of £785,000. The value of assets at March 31st 2006 has been restated from £129,128,000 to £128,801,000, a decrease of £327,000.
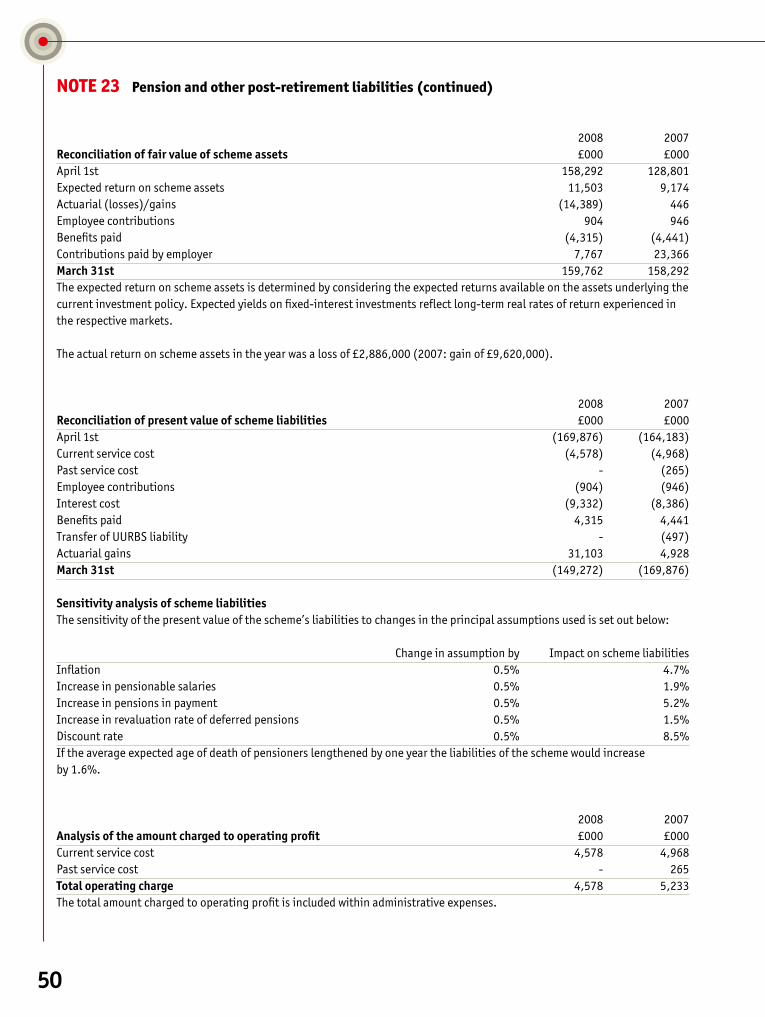
50
NOTE 23 Pension and other post-retirement liabilities (continued)
2008 2007Reconciliationoffairvalueofschemeassets £000 £000April 1st 158,292 128,801Expected return on scheme assets 11,503 9,174Actuarial (losses)/gains (14,389) 446Employee contributions 904 946Benefits paid (4,315) (4,441)Contributions paid by employer 7,767 23,366March31st 159,762 158,292The expected return on scheme assets is determined by considering the expected returns available on the assets underlying the current investment policy. Expected yields on fixed-interest investments reflect long-term real rates of return experienced in the respective markets.
The actual return on scheme assets in the year was a loss of £2,886,000 (2007: gain of £9,620,000).
2008 2007Reconciliationofpresentvalueofschemeliabilities £000 £000April 1st (169,876) (164,183)Current service cost (4,578) (4,968)Past service cost - (265)Employee contributions (904) (946)Interest cost (9,332) (8,386)Benefits paid 4,315 4,441Transfer of UURBS liability - (497) Actuarial gains 31,103 4,928March31st (149,272) (169,876) Sensitivityanalysisofschemeliabilities The sensitivity of the present value of the scheme’s liabilities to changes in the principal assumptions used is set out below: Change in assumption by Impact on scheme liabilitiesInflation 0.5% 4.7% Increase in pensionable salaries 0.5% 1.9% Increase in pensions in payment 0.5% 5.2%Increase in revaluation rate of deferred pensions 0.5% 1.5% Discount rate 0.5% 8.5%If the average expected age of death of pensioners lengthened by one year the liabilities of the scheme would increase by 1.6%.
2008 2007Analysisoftheamountchargedtooperatingprofit £000 £000Current service cost 4,578 4,968Past service cost - 265Totaloperatingcharge 4,578 5,233The total amount charged to operating profit is included within administrative expenses.

51
NOTE 23 Pension and other post-retirement liabilities (continued)
2008 2007Analysisoftheamountcreditedtootherfinanceincome £000 £000Expected return on pension scheme assets 11,503 9,174Interest on pension scheme liabilities (9,332) (8,386)Netincome 2,171 788 Historyofexperiencegainsandlosses Difference between the actual and As restated As restated expected return on scheme assets 2008 2007 2006 2005 2004Amount (£000) (14,389) 446 14,153 2,695 8,135Percentage of scheme assets (9%) 0% 11% 3% 10%Experience losses on scheme liabilities Amount (£000) (191) (433) (1,415) (257) (2,440)Percentage of the present value of the scheme liabilities (0%) (0%) (1%) (0%) (2%)Total actuarial gain/(loss) recognised in the statement of total recognised gains and losses Amount (£000) 16,714 5,374 (9,285) - 10,089Percentage of the present value of the scheme liabilities 11% 3% (6%) - 8%The Economist Group has elected not to restate amounts for 2005 and 2004, as permitted by the amendment to FRS 17.Since the adoption of FRS17 in 2006 a cumulative net gain of £12,803,000 has been released through the statement of total recognised gains and losses in respect of actuarial revaluations of the pension scheme.
Otherpost-retirementbenefits The Group provides post-retirement medical benefits to certain former employees. At March 31st 2008, 66 (2007: 67) retired employees were eligible to receive benefits. As at March 31st 2008, the Group estimated the present value of its accumulated post-retirement medical benefits obligation to be £2,292,000 (2007: £1,934,000), net of deferred taxation. These liabilities were confirmed by a qualified independent actuary. The principal assumptions used in estimating this obligation are healthcare premium cost escalation of 9% per year and a discount rate to represent the time value of money of 6.7%. Actual premiums paid are being set against this provision, which is periodically assessed for adequacy.
NOTE 24 Financial commitments
Operatingleases 2008 2007Landandbuildings,leasesexpiring £000 £000Within one year 896 135 Between two and five years 2,812 3,280 After five years 1,481 927 5,189 4,342
Plantandequipment,leasesexpiringWithin one year 19 33 Between two and five years 97 79 116 112
52
NOTE 27 Acquisitions
Prior year: acquisition of GalleryWatch
The fair value of the assets and liabilities, disclosed in the 2007 annual report, for the purchase of GalleryWatch in October 2006, have been adjusted by £514,000 to reflect GalleryWatch tax losses which the Group has recognised as a deferred tax asset. Goodwill is reviewed every year for any impairment. Given the performance of GalleryWatch no impairment is required.
NOTE 28 Derivative financial instruments
The Group enters into forward exchange contracts and foreign currency option contracts to mitigate US-dollar currency exposures. The Group does not recognise the fair value of these derivative instruments on the balance sheet. During the year, the Group entered into 30 (2007: 9) forward exchange contracts, 39 (2007: 16) nil premium barrier option contracts, and no premium option contracts (2007: 1). The fair value of forward contracts outstanding at the year end is a £167,000 asset (2007: £649,000 asset) and of the option contracts is a £435,000 liability (2007: £95,000 asset).
NOTE 29 Prior year adjustment
The adoption of amendments to FRS 17 has required the Group to change its method for valuing assets in the defined benefit pension scheme. Previously the assets were valued at mid-market price. Under the amended FRS 17 the assets are valued at bid price. As a result of this change of accounting policy, the prior year comparatives have changed. Pension and other post-retirement liabilities Equity (net of deferred tax) shareholders’ deficitConsolidated balance sheet £000 £0002007 as previously reported (9,493) (7,896)Adoption of FRS 17 amendments (550) (550)2007 restated (10,043) (8,446)
NOTE 26 Related party transactions
The Financial Times Limited holds 50% of the issued share capital in the company and is entitled to appoint six out of a total of 13 places for directors on the company’s Board. The Financial Times Limited is a wholly-owned subsidiary of Pearson plc. The Group sold goods and services to Pearson plc and subsidiary companies to a total value of £75,315 (2007: £141,711) in the normal course of trade during the year, and acquired goods and services to a total value of £63,709 (2007: £42,097). The aggregate balances outstanding with these companies as at March 31st 2008 were £3,101 (2007: £14,683) due to the Group and £188 (2007: £188) due from the Group.
NOTE 25 Capital commitments and contingent liabilities At March 31st 2008, there was £nil of capital expenditure contracted for but not provided in the financial statements (2007: £nil). There are contingent Group liabilities in respect of legal claims, indemnities, warranties and guarantees in relation to former businesses. None of these claims is expected to result in a material loss to the Group.
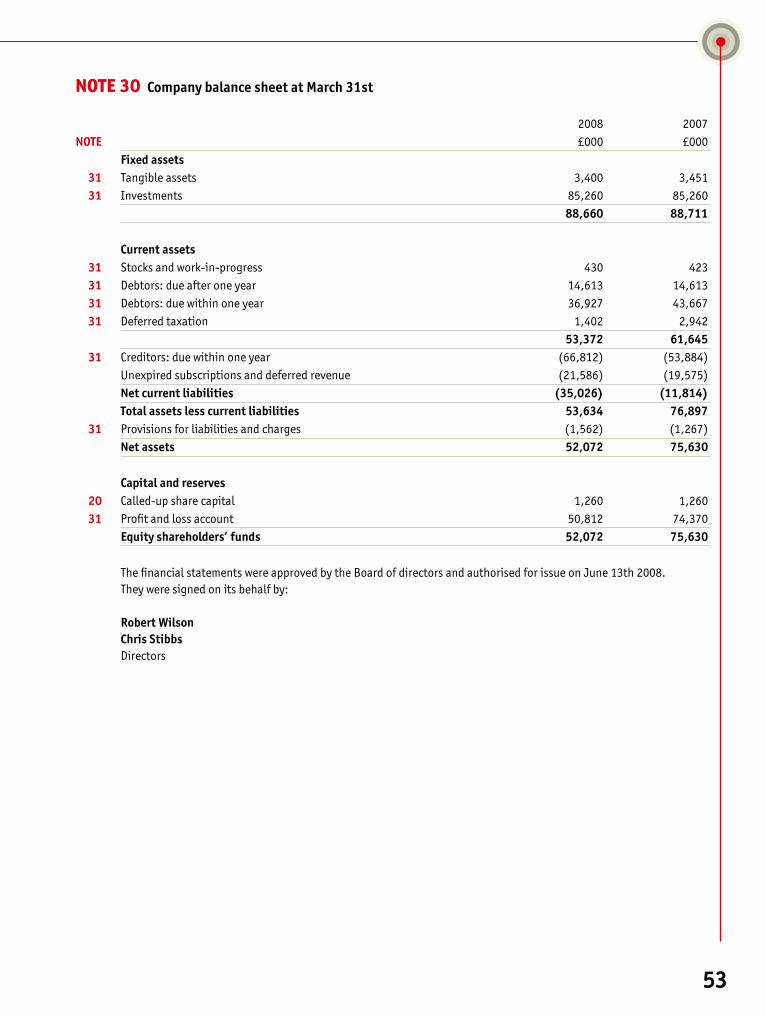
53
NOTE 30 CompanybalancesheetatMarch31st 2008 2007NOTE £000 £000 Fixedassets 31 Tangibleassets 3,400 3,451 31 Investments 85,260 85,260 88,660 88,711 Currentassets 31 Stocksandwork-in-progress 430 423 31 Debtors:dueafteroneyear 14,613 14,613 31 Debtors:duewithinoneyear 36,927 43,667 31 Deferredtaxation 1,402 2,942 53,372 61,645 31 Creditors:duewithinoneyear (66,812) (53,884) Unexpiredsubscriptionsanddeferredrevenue (21,586) (19,575) Netcurrentliabilities (35,026) (11,814) Totalassetslesscurrentliabilities 53,634 76,897 31 Provisionsforliabilitiesandcharges (1,562) (1,267) Netassets 52,072 75,630
Capitalandreserves 20 Called-upsharecapital 1,260 1,260 31 Profitandlossaccount 50,812 74,370 Equityshareholders’funds 52,072 75,630 ThefinancialstatementswereapprovedbytheBoardofdirectorsandauthorisedforissueonJune13th2008. Theyweresignedonitsbehalfby: RobertWilson ChrisStibbs Directors

54
NOTE 31 Notestocompanybalancesheet
Tangiblefixedassets Leasehold Plantand buildings:short machinery Equipment TotalCost £000 £000 £000 £000AtApril1st2007 2,067 1,038 16,455 19,560Additions - - 1,113 1,113Disposals - (48) (502) (550)AtMarch31st2008 2,067 990 17,066 20,123 Depreciation AtApril1st2007 387 1,036 14,686 16,109Providedduringyear 295 2 852 1,149Disposals - (48) (487) (535)AtMarch31st2008 682 990 15,051 16,723 NetbookvalueatMarch31st2008 1,385 - 2,015 3,400NetbookvalueatMarch31st2007 1,680 2 1,769 3,451
Investments(fixedassets) Sharesin GroupcompaniesCostandnetbookvalue £000AtApril1st2007andMarch31st2008 85,260
Theprincipalwholly-ownedsubsidiaryundertakingsofthecompanywhichareconsolidatedare:
TheEconomistIntelligenceUnit,NA,Inc(USA) CFOPublishingCorporation(USA)TheEconomistIntelligenceUnitLimited* TheEconomistGroup(Asia/Pacific)Limited(HongKong)TheEconomistGroup(Investments)Limited TheEconomistGroup(Jersey)Limited(Jersey)TheEconomistNewspaper,NA,Inc(USA) TheEconomistNewspaperGroup,Inc(USA)TEGNewJerseyLLC(USA) RollCall,Inc(USA)RyderStreetPropertiesLimited RyderStreetProperties(Management)Limited*TheEconomistGroupGmbH(Austria) TheEconomistGroup(Luxembourg)S.a.r.l.(Luxembourg)TheEconomistGroupTrusteeCompanyLimited* TheEconomistGroupFranceS.a.r.l.(France)*EuroFinanceConferencesLimited* LNNI.com,Inc(USA)GalleryWatch.com,Inc(USA) LNNIServices,Inc(USA) TheEconomistGroupIndiaPrivateLimited(India)
ThesecompaniesareengagedinpublishingandrelatedservicesandintheprovisionofbusinessinformationexceptforRyderStreetPropertiesLimitedandRyderStreetProperties(Management)Limitedwhichrentandletproperty.TheEconomistGroup(Jersey)Limited,TheEconomistGroup(Luxembourg)S.a.r.l.andTheEconomistGroup(Investments)LimitedactasinvestmentcompaniesfortheGroup.TheEconomistGroupTrusteeCompanyLimitedisthetrusteeoftheESOP.AllthecompaniesaboveareincorporatedandregisteredinEnglandandWaleswiththeexceptionofthoseindicated.Thecompaniesmarked*aredirectlyownedbyTheEconomistNewspaperLimited;allothercompaniesareownedthroughwholly-ownedsubsidiaries.AllsubsidiarieshaveafinancialyearendingMarch31st.

55
NOTE 31 Notes to company balance sheet (continued)
2008 2007Stocks and work-in-progress £000 £000Rawmaterials 400 389Finishedgoods 30 34 430 423
Debtors 2008 2007Due after one year £000 £000AmountsowedbyGroupcompanies 14,613 14,613 2008 2007Due within one year £000 £000Tradedebtors 23,226 19,166AmountsowedbyGroupcompanies 10,099 21,897Otherdebtors 757 725Prepaymentsandaccruedincome 2,821 1,879Taxrecoverable 24 - 36,927 43,667
Summary of movements in deferred tax asset £000AtApril1st2007 2,942Chargetotheprofitandlossaccount (1,510)Chargetothestatementofrecognisedgainsandlosses (30)AtMarch31st2008 1,402
2008 2007Assetsrecognisedfordeferredtaxationundertheliabilitymethodare: £000 £000Excessofdepreciationovercapitalallowances 217 279Post-retirementbenefits 4 4Othertimingdifferences 1,181 2,659 1,402 2,942Allpotentialassetshavebeenrecognisedexceptfortaxationwhichwouldariseontheremittanceofprofitsretainedoverseas.
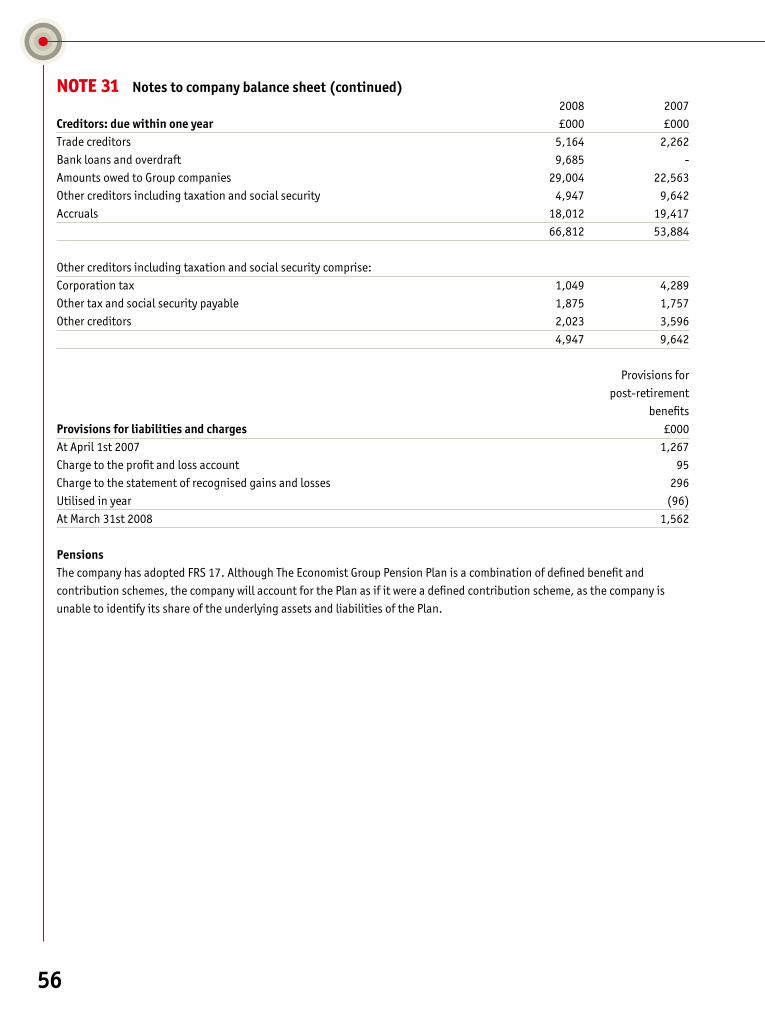
56
NOTE 31 Notestocompanybalancesheet(continued) 2008 2007Creditors:duewithinoneyear £000 £000Tradecreditors 5,164 2,262Bankloansandoverdraft 9,685 -AmountsowedtoGroupcompanies 29,004 22,563Othercreditorsincludingtaxationandsocialsecurity 4,947 9,642Accruals 18,012 19,417 66,812 53,884
Othercreditorsincludingtaxationandsocialsecuritycomprise:Corporationtax 1,049 4,289Othertaxandsocialsecuritypayable 1,875 1,757Othercreditors 2,023 3,596 4,947 9,642
Provisionsfor post-retirement benefitsProvisionsforliabilitiesandcharges £000AtApril1st2007 1,267Chargetotheprofitandlossaccount 95Chargetothestatementofrecognisedgainsandlosses 296Utilisedinyear (96)AtMarch31st2008 1,562
PensionsThecompanyhasadoptedFRS17.AlthoughTheEconomistGroupPensionPlanisacombinationofdefinedbenefitandcontributionschemes,thecompanywillaccountforthePlanasifitwereadefinedcontributionscheme,asthecompanyisunabletoidentifyitsshareoftheunderlyingassetsandliabilitiesofthePlan.
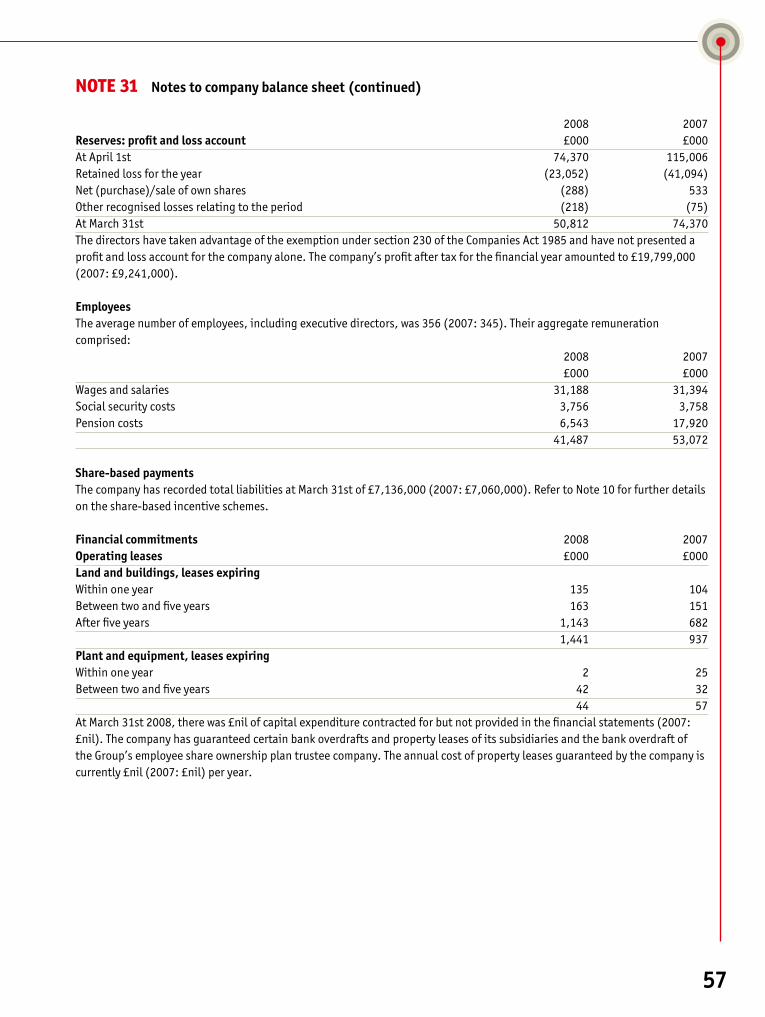
57
NOTE 31 Notestocompanybalancesheet(continued)
2008 2007Reserves:profitandlossaccount £000 £000AtApril1st 74,370 115,006Retainedlossfortheyear (23,052) (41,094)Net(purchase)/saleofownshares (288) 533Otherrecognisedlossesrelatingtotheperiod (218) (75)AtMarch31st 50,812 74,370Thedirectorshavetakenadvantageoftheexemptionundersection230oftheCompaniesAct1985andhavenotpresentedaprofitandlossaccountforthecompanyalone.Thecompany’sprofitaftertaxforthefinancialyearamountedto£19,799,000(2007:£9,241,000). EmployeesTheaveragenumberofemployees,includingexecutivedirectors,was356(2007:345).Theiraggregateremunerationcomprised: 2008 2007 £000 £000Wagesandsalaries 31,188 31,394Socialsecuritycosts 3,756 3,758Pensioncosts 6,543 17,920 41,487 53,072
Share-basedpaymentsThecompanyhasrecordedtotalliabilitiesatMarch31stof£7,136,000(2007:£7,060,000).RefertoNote10forfurtherdetailsontheshare-basedincentiveschemes. Financialcommitments 2008 2007Operatingleases £000 £000Landandbuildings,leasesexpiringWithinoneyear 135 104Betweentwoandfiveyears 163 151Afterfiveyears 1,143 682 1,441 937Plantandequipment,leasesexpiringWithinoneyear 2 25Betweentwoandfiveyears 42 32 44 57AtMarch31st2008,therewas£nilofcapitalexpenditurecontractedforbutnotprovidedinthefinancialstatements(2007:£nil).ThecompanyhasguaranteedcertainbankoverdraftsandpropertyleasesofitssubsidiariesandthebankoverdraftoftheGroup’semployeeshareownershipplantrusteecompany.Theannualcostofpropertyleasesguaranteedbythecompanyiscurrently£nil(2007:£nil)peryear.

Noticeofannualgeneralmeeting
Notice is hereby given that the annual general meeting of The Economist Newspaper Limited will be held at the Institute of Directors, 116 Pall Mall, London, SW1Y 5ED on Tuesday July 15th 2008 at 12.15pm, for the following purposes:
1. To receive the accounts and the reports of the directors and the auditors for the year ended March 31st 2008
2. To declare the final dividend
3. To reappoint PricewaterhouseCoopers LLP as the company’s auditors
4. To authorise the directors to fix the remuneration of the auditors
By order of the BoardOscarGrutSecretary
Registered Office25 St James’s StreetLondon SW1A 1HG
June 13th 2008
A member entitled to attend and vote at this meeting may appoint a proxy, who need not be a shareholder, to attend, speak and vote in his place.
A member may appoint more than one proxy, provided that each proxy is appointed to exercise the rights attached to a different share or shares held by him.
A form of proxy is enclosed. It must be completed in accordance with the instructions and delivered to the company’s registrars, Computershare Investor Services plc, The Pavilions, Bridgwater Road, Bristol, BS99 3FA at least 48 hours before the meeting.
58

59
NOTES

60
NOTES


