138
Annual Report 2009 Robeco Groep N.V.

Annual Report 2009
Robeco Groep N.V.

Corporate Statements 2009

2 Annual Report 2009 Robeco Groep N.V.

3Corporate Statements 2009
Corporate Statements
01 Preface
02 General information
03 Report of the Supervisory Board
04 Corporate & fund governance
05 Report of the Management Board
Robeco profile and key figures
Chapter 1 Market environment
Chapter 2 Strategy
Chapter 3 Organization
Chapter 4 Investment performance
Chapter 5 Business development 2009
Chapter 6 Financial results
Chapter 7 Compliance & Risk management
Chapter 8 Responsible Investing & Corporate responsibility
Chapter 9 Robeco in 2010
06 Special: Emerging Markets
07 Addresses
Financial Statements
5
6
8
12
18
20
22
29
29
32
36
38
49
52
54
58
61
Contents

4 Annual Report 2009 Robeco Groep N.V.
01 1

5Corporate Statements 2009
For Robeco, 2009 has been a year of mixed blessings.
For our clients, both returns and relative performance
have been good to excellent; a very welcome (albeit not
complete) rebound from the disastrous investment
year of 2008. Also, the record inflow of new money
(EUR 7.5 billion net) as well as the fact that clients
are daring to take risks again are both clearly positive
factors. However, it is a big disappointment to have
to announce Robeco’s first ever annual loss, amounting
to EUR 13.3 million.
The year 2009 can be described as a roller-coaster ride from
various perspectives. Financial markets, more specifically
equities, got off to a very negative start, followed by a
remarkably strong rebound from mid-March. Many markets
and also many of our funds and mandates were able to
record double-digit returns for the year. Investments that
took a big hit in 2008, like high-yield bonds and emerging-
markets equities, enjoyed excellent performance in 2009,
gaining 53% and 85% respectively and rewarding those
clients who stayed the course with us.
Robeco’s operations failed to produce a profit in 2009.
This is not so much a feature of last year alone, but in
previous years this failure to make profits was more than
offset by the performance fees generated by our subsidiary,
Transtrend. Although performance fees are indeed
pleasing, since we only receive them when our clients
are enjoying excellent returns, Robeco as an investment
manager may not solely rely on them to run a profitable
business.
In 2010, a year of change, Robeco will establish a new
strategy. It will build on our heritage, make use of our
skill sets and focus on the interests of our clients. We will
streamline our product offering, close a number of offices
and consolidate various business activities. Robeco will also
strengthen its market position, both internationally and in
the Netherlands. In addition to our recognized capabilities
in the equity and fixed-income markets, Robeco will
continue to offer clients innovative investment solutions.
A number of these will be geared towards producing
attractive inflation-adjusted returns, others will benefit
from the expertise and the network of our parent company,
Rabobank, in the Food & Agri business.
Over the next five years, greater efficiency, innovation and
growth will first benefit current and future clients, both
retail and wholesale, and will also contribute to producing
a healthier bottom line. To succeed with this, Robeco will
rely on the talent, creativity and energy of our employees.
Based on my first six months with ‘The Investment
Engineers’, I am confident of a favorable outcome.
Roderick Munsters
CEO Robeco Groep N.V.
Preface
6 Annual Report 2009 Robeco Groep N.V.
Composition of the Supervisory Board
D.P.M. (Dick) Verbeek, Chairman
P. J.A. (Piet) van Schijndel, Vice Chairman
A. (Bert) Bruggink (as from 1 April 2009)
W.H. (Willem) Buiter (1 April - 31 December 2009)
J.C. (Hans) ten Cate
G. (Gilles) Izeboud
Ph. (Philip) Lambert
D.J.M.G. (Rik) Baron van Slingelandt (until 1 May 2009)
Composition of the Management Board
R.M.S.M. (Roderick) Munsters, Chairman and CEO
as from 1 September 2009
G.A. (George) Möller, Chairman and CEO
until 1 September 2009
L.M.T. (Leni) Boeren
H.W.D.G. (Hester) Borrie (as from 5 November 2009)
S. (Sander) van Eijkern (until 1 February 2010)
C.T.L. (Constant) Korthout
F.L. (Frank) Kusse (until 1 October 2009)
J.L.N.A. (Jean-Louis) Laurens (20 February - 1 June 2009)
H.A.A. (Hans) Rademaker (as from 1 February 2010)
Company Secretary
D.H. (Dave) Cross
Members of the Supervisory Board
D.P.M. (Dick) Verbeek, Chairman (male, 59)
Dutch nationality. Appointed in 2001 and last reappointed
in 2007. Scheduled to resign and eligible for reappointment
in 2011. Former member of the Executive Board of Aon
Group in Chicago and former chairman/CEO of the Executive
Board of Aon Holdings in Rotterdam. Supervisory Director of
Aegon N.V., Robeco N.V., Rolinco N.V. and Rorento N.V.
P.J.A. (Piet) van Schijndel, Vice Chairman (male, 59)
Dutch nationality. Appointed in 2006. Scheduled to
resign and eligible for reappointment in 2010. Member of
the Executive Board of Rabobank Nederland.
A. (Bert) Bruggink (male, 46)
Dutch nationality. Appointed in 2009. Member of
the Executive Board of Rabobank Nederland, professor in
Financial Management and Business Administration at
Twente University.
J.C. (Hans) ten Cate, (male, 63)
Dutch nationality. Appointed in 2001 and last reappointed
in 2009. Former member of the Executive Board of
Rabobank Nederland.
G. (Gilles) Izeboud (male, 67)
Dutch nationality. Appointed in 2004 and reappointed in
2008. Scheduled to resign and eligible for reappoint ment in
2012. Partner and board member at Pricewater houseCoopers
(1977/2002). Former member of the Corporate Governance
Committee in the Netherlands. Deputy Justice at the Enter-
prise Section of the Amsterdam Court of Appeal. Supervisory
Director of Robeco N.V., Rolinco N.V. and Rorento N.V.
02 1
General information
7Corporate Statements 2009
Ph. (Philip) Lambert (male, 63)
Dutch nationality. Appointed in 2005 and last
reappointed in 2009. Scheduled to resign and eligible
for reappointment in 2013. Former Head of Corporate
Pensions at Unilever N.V. and PLC in London. Member
of the Investment Committee of the ABN AMRO Pension
Fund. Supervisory Director of Robeco N.V., Rolinco N.V. and
Rorento N.V.
Committees of the Supervisory Board
– Audit & Compliance Committee:
Gilles Izeboud (Chairman)
Bert Bruggink
Dick Verbeek
– Nomination, Remuneration & Corporate Governance
Committee:
Hans ten Cate (Chairman)
Philip Lambert
Dick Verbeek
– Investment Committee (started 1 January 2010):
Philip Lambert (Chairman)
Bert Bruggink
Dick Verbeek
Members of the Management Board
R.M.S.M. (Roderick) Munsters (male, 46)
Dutch and Canadian nationality. Employed at Robeco since
September 2009. Former member of the Executive Board
and Chief Investment Officer of APG All Pensions Group and
member of the Executive Board (investments) of PGGM.
Member of the Capital Market Committee of the Dutch
regulator Autoriteit Financiële Markten (AFM). Chairman
and Chief Executive Officer since September 2009.
L.M.T. (Leni) Boeren (female, 46)
Dutch nationality. Employed at Robeco since January 2005.
Former Managing Director of Information Services and
member of the Operational Committee of Euronext N.V.
Head of Robeco Direct N.V. since January 2005 and Chief
Operating Officer as of 1 January 2009.
H.D.W.G. (Hester) Borrie (female, 40)
Dutch nationality. Employed at Robeco since October
2009 as head of Global Distribution and Marketing.
Formerly held several sales positions at Morgan Stanley
in Amsterdam/London and was an associate in Corporate
Finance & Capital Markets at MeesPierson.
C.T.L. (Constant) Korthout (male, 47)
Dutch nationality. Employed at Robeco since 1992.
Chief Financial Officer since 2002, became member of
the Management Board in 2004.
H.A.A. (Hans) Rademaker (male, 48)
Dutch nationality. Employed at Robeco since February 2010
as head of Mainstream Investments. Former Director of
Fiduciary Management at Kempen Capital Management,
Director of Asset Management and head of Financial
Investments and Treasury at Mn Services.
General information
N.B. Supervisory directorships at listed companies only are given above.
8 Annual Report 2009 Robeco Groep N.V.
Composition of the Supervisory BoardMr. A. Bruggink and Mr. W.H. Buiter were appointed as
members of the Supervisory Board as of 1 April 2009.
Mr. D.J.M.G. Baron van Slingelandt resigned as member of
the Supervisory Board as of 1 May 2009. He has been
a member of the Supervisory Board since 1 June 2002.
We thank him for his valuable contribution during those
years. In the General Meeting of Shareholders held on
24 June 2009, Mr. J.C. ten Cate resigned as member of
the Supervisory Board, but was reappointed for the period
of one year with immediate effect.
Mr. Buiter, who became Chief Economist of Citigroup as
of 1 January 2010, resigned per the same date.
The supervisory directors, except Messrs. Bruggink, Ten Cate
and Van Schijndel are independent within the meaning
of the Dutch Corporate Governance Code. For information
about each of the supervisory directors, please refer to the
General Information in this annual report.
Meetings of the Supervisory BoardIn 2009 the Supervisory Board met five times. Most
of the Supervisory Board meetings were attended by
almost all the Supervisory Board members and by all
the Management Board members. The members of the
Management Board were not, however, present when their
performance and remuneration were discussed. The CEO
did attend these meetings but did not attend the discussion
on his own performance and remuneration. The meeting
in April, in which the 2008 annual report was discussed,
was also attended by the external auditor, Ernst & Young
Accountants LLP.
In September, the Supervisory Board met at the offices of
Robeco Investment Management (RIM) in Boston. Prior to
this meeting, the managers of RIM, Harbor Capital Advisors
03 1 (HCA) and Sage gave presentations and exchanged
ideas with the Supervisory Board on various issues, such
as business development, investment policies and the
situation in the markets where these entities operate.
The Supervisory Board used detailed, regularly updated
reports for its discussions with the Management Board
on the company’s quarterly and year-end results in terms
of budgetary targets, investment results and assets
under management. Based on reports from its Audit &
Compliance Committee, the Supervisory Board discussed
subjects such as the risks relating to investment policies and
the instruments to control these risks as well as financial
accounting, (internal-) audit and compliance-related issues.
Various strategic issues were extensively discussed,
particularly those relating to possible business
opportunities and synergies with third parties.
The Supervisory Board’s July meeting started with
a presentation of market observations given by an external
advisor, after which the members discussed possible
strategic opportunities.
The Supervisory Board paid considerable attention to
the project to integrate the various back-office and ICT
operations. As reported last year, this is a project that spans
several years, and is considered to be an important building
block in the process of internationalization through
the establishment of foreign operations.
The Supervisory Board evaluated the results of measures
taken to create a more efficient organization, which
resulted in considerable, structural cost reductions.
Responsible investing was a regular agenda item at
meetings of the Supervisory Board and the Management
Board’s proposed exclusion policy was a particularly
important issue which was discussed and approved.
Supervisory Board
Report of the Supervisory Board
9Corporate Statements 2009
Supervisory Board Committees
Audit & Compliance Committee
In 2009 the Audit & Compliance Committee met seven
times. The meetings of the Committee were attended by
the CEO and the CFO, together with the head of Internal
Audit and the external auditor Ernst & Young Accountants
LLP. These meetings were preceded by private sessions with
the external auditor. Discussions on compliance-related
issues were attended by the head of Corporate Compliance.
The follow-up to the recommendations made by
the internal and external auditor were also discussed.
On the basis of quarterly reports, the Audit & Compliance
Committee discussed various internal-audit and compliance
issues. Due attention was paid to the analysis of incidents
that had occurred and the consequences these may have
for processes and clients.
In the context of the Robeco fund-governance principles,
there was especially discussion on the issue of securities
lending.
The head of Group Risk Management gave a presentation
on the scope and activities of the risk-management
department, including the increasing role of operational
risk management.
Other subjects discussed included pending litigation issues,
the progress on integrating the back-office operations and
the HP/EDS transformation (see page 37 and 44).
The Audit & Compliance Committee agreed to the proposal
to change its charter to reflect the fact that from now on it
will also act as the audit committee of Robeco Direct N.V..
Nomination, Remuneration & Corporate Governance
Committee
In 2009, the Nomination, Remuneration & Corporate
Governance Committee met four times, in the presence
of the CEO, the head of Human Resources and, depending
on the subject discussed, the CFO.
The composition of the Management Board and proposals
for the appointment of new members were discussed.
The remuneration of the members of the Management
Board was discussed, including bonus and E-notes
allocation, while key performance indicators were also
an agenda item.
The group-wide bonus policy and the 2009 E-notes
allocation were both discussed, primarily in the context of
market circumstances.
Other issues on the agenda were succession and continuity
planning and talent development, while an analysis of
Robeco’s pension plan was also discussed.
Composition of the Management BoardThe composition of the Management Board changed
considerably in 2009 and was the subject of discussion
both in the Nomination, Remuneration & Corporate
Governance Committee and the full Supervisory Board.
Mr. George A. Möller resigned as CEO and was succeeded
by Mr. Roderick M.S.M. Munsters, both effective on
1 September 2009.
Mr. Jean-Louis Laurens, who was responsible for
Mainstream Investment Management, resigned from
the Management Board for personal reasons as of 1 June
Supervisory Board

10 Annual Report 2009 Robeco Groep N.V.
2009. Mr. Sander van Eijkern, who was responsible for
Alternative Investments and CEO of SAM, stepped down
from his position as of 1 February 2010.
Mr. Hans Rademaker was appointed head of Investments
as of 1 February 2010.
Mr. Frank Kusse, who was responsible for Marketing,
Sales and Distribution resigned as of 1 October 2009.
He was succeeded by Mrs. Hester W.D.G. Borrie who was
appointed as of 5 November 2009.
We thank all former members of the Management Board
for their contribution to the development of the company.
Remuneration report
Robeco’s remuneration policy
The structure of the remuneration policy for members
of the Management Board is in line with Robeco Groep
N.V.’s general remuneration policy. The objective of the
remuneration policy is to position Robeco Groep N.V.
competitively in the international asset-management
market, enabling it to attract and retain employees who
perform well and are expected to make an important
contribution to the firm. The employment package and
remuneration systems are also structured to promote
a long-term relationship between employees and
the organization. The Supervisory Board’s Nomination,
Remuneration & Corporate Governance Committee
decides on the employment benefits for the individual
members of the Management Board. The remuneration
package consists of the following components: fixed
remuneration, variable short-term remuneration (bonus),
variable long-term remuneration (equity notes) and fringe
benefits.
Fixed remuneration
The fixed-remuneration component aims to provide
a good, competitive base remuneration relative to
the international asset-management market, taking
into account the relevant function’s level of responsibility,
results and competences. The level of responsibility is
established using the Hay function-valuation system.
Variable remuneration (bonus)
The variable remuneration component for the
Management Board depends on Robeco Groep N.V.’s
gross result (worldwide) and the inflow of new assets
under management. If Management Board members
are responsible for an operational unit, this component
is also linked to the financial results relating to their
responsibilities. The ratio between the actual results
and the budgeted results determines the level of the
eventual payment. All bonus payments are made in
three installments. In the first year (after the applicable
financial year), 60% is paid, followed by two other
deferred portions. A 30% portion is paid in the second
year and a 10% portion in the third year. Both the
deferred portions are converted into Equity Notes (see
below) in the first year at the time when the 60% is paid.
These E-notes vest at the end of these deferred periods in
years two and three. If the recipient is no longer employed
by Robeco Groep N.V. or hands in his notice when the
60% payment is made – either on, or before the day of
vesting of the E-notes – his right to this remuneration
component lapses.
Equity notes (E-notes)
A limited group of employees (less than 5% of the total
workforce), including the Management Board, is given the
03 3
Report of the Supervisory Board - Remuneration report
11Corporate Statements 2009
opportunity to participate directly in Robeco’s future growth
through virtual shares in Robeco Groep N.V. E-notes are a
way of additionally rewarding key employees with the aim
of increasing their long-term commitment to the group.
In the case of the Management Board, the Nomination,
Remuneration & Corporate Governance Committee decides
whether or not to grant E-notes and on the quantity to
be granted. In the case of all other eligible employees,
the Management Board defines the group of personnel
that becomes eligible for E-notes and determines at its
discretion the level of allocation. The allocation of E-notes
is not only linked to the employee’s individual performance,
but also to the contribution they have made to achieving
the strategic targets of their own business unit and of
the Robeco Group as a whole. The E-notes represent a
value that, like shares, directly corresponds to the value of
Robeco Groep N.V., and is based on ‘profit from continuing
operations adjusted downward for the expenses related to
the long-term incentive plans and adjusted for the results
related to the foreign-currency hedge’. E-notes have a
maximum life of six years with a vesting period of at least
four years. During the vesting period E-notes cannot be
exercised.
Investment notes (I-notes)
In addition to the E-notes scheme, there is also
an Investment notes (I-notes) scheme. This scheme
enables employees, who are granted E-notes, to make
investments themselves in additional ‘virtual shares’.
Like E-notes, the I-notes are linked to the value/earnings
development of Robeco Groep N.V. I-notes have
a maximum life of 5 years, during which dividend is
generated. If I-notes are held for the full 5 years
investors receive a loyalty premium.
Fringe benefits
Robeco offers a competitive package of fringe benefits,
which may include a lease car, expense allowance,
insurance, supplementary mortgage benefit, and
a pension plan made up of a final-salary plan (defined
benefit, to a certain maximum) and a defined-contribution
scheme.
Recommendation to adopt the annual financial statementsThe Supervisory Board has taken note of the contents of
the report presented by Ernst & Young Accountants LLP,
which have given an unqualified opinion on the annual
financial statements as presented and recommend
approval thereof. We concur with the Management Board’s
proposal to distribute no dividend.
Rotterdam, 8 April 2010
The Supervisory Board

12 Annual Report 2009 Robeco Groep N.V.
As in previous years, in 2009 corporate governance
remained a widely discussed subject. Although Robeco
Groep N.V. is not a listed company and, as such, is
not bound by the Dutch Corporate Governance Code
(hereafter referred to as the Code), Robeco Groep
N.V. does find it important to comply with the Code’s
principles and best-practice provisions where possible.
Robeco strives to implement any amendments to the
Code if these are applicable. It should be noted here
that the shares of Robeco Groep N.V. are all held by
one shareholder, the Coöperatieve Centrale Raiffeisen-
Boerenleenbank B.A. (‘Rabobank Nederland’). This
means that those Code principles that relate to multiple
shareholders do not apply. Below an overview is given of
the issues covered by the Code that are most relevant to
Robeco Groep N.V.
The principles and best-practice provisions of
the Code that Robeco Groep N.V. does not or cannot
apply and the current corporate-governance structure
are also described and explained.
Compliance and enforcement of the CodeThe corporate-governance policy of Robeco Groep N.V. is
established in the company’s Articles of Association and
in the shareholder agreement between Robeco Groep
N.V. and Rabobank Nederland, which was entered into
in 1997 and amended in 2004. Within this framework,
Robeco Groep N.V.’s Management and Supervisory
Boards are responsible for the company’s corporate-
governance structure and compliance with the Code. They
are accountable to Robeco Groep N.V.’s only shareholder,
Rabobank Nederland. Robeco Groep N.V. intends to comply
as fully as possible with the Code.
04 1 The Management BoardRobeco Groep N.V. is managed by a Management Board,
currently consisting of five members. The Management
Board is supervised by a Supervisory Board. According to
the appointment procedure, a proposal is put forward at
the General Meeting of Shareholders and this should be
approved by the Supervisory Board before a member of the
Management Board is appointed at the General Meeting
of Shareholders. The Supervisory Board has undertaken
not to reject proposals for appointments without good
reason. On account of the above mentioned nature of the
company, the maximum four-year membership term for
board members recommended by the Code is not complied
with and some of the Robeco Groep N.V. Management
Board members are appointed for an indefinite period.
After prior consultation with the Supervisory Board, the
General Meeting of Shareholders appoints one of the
members of the Management Board as chairman. The
General Meeting of Shareholders is authorized to suspend
or dismiss any member of the Management Board at any
time. Dismissal terms for Management Board members are
determined reasonably and fairly on a case-by-case basis.
The Management Board is responsible for formulating and
executing the approved strategic and operational policy
of the company as well as managing its daily operations.
The Management Board reports to the Supervisory Board
and to the General Meeting of Shareholders. Furthermore,
the Management Board is also responsible for compliance
with all relevant legislation and regulations, for risk
management and for the financing of all corporate
activities. Finally, the Management Board is responsible for
providing the Supervisory Board with information, relating
to the company’s activities and on any developments
affecting the Robeco Group as a whole. The Supervisory
Corporate & fund governance
Corporate Governance
13Corporate Statements 2009
Board needs this information to carry out its supervisory
responsibilities in a satisfactory way. As recommended by
the Code, Robeco Groep N.V.’s regulatory environment and
its risk-management structure are explained in the Report
of the Management Board in the chapter Compliance &
Risk management. The remuneration policy for members
of the Management Board is explained in the Report of the
Supervisory Board. The way in which this policy has been
applied in this reporting period is explained in the notes to
the annual financial statements. The remuneration policy is
published on the company’s website and forms an integral
part of the Annual Report. The remuneration per individual
board member is found in the notes to the annual
financial statements. The value of the options granted to
the Management Board and staff is also shown there. An
explanation of how this is calculated can be found in the
Accounting Policies in the Annual Financial Statements.
As explained in the remuneration report, members of the
Management Board and certain employees are granted
E-notes. The number of options granted depends on an
employee’s income. The exercise price is based on the price
of the underlying shares at the time when the options are
granted. The company does not grant loans or guarantees
to members of the Management Board. Robeco Direct
N.V., which is a wholly-owned subsidiary of Robeco Groep
N.V. and a credit institution, can grant loans to members
of the Management Board under the same conditions
that apply to other Robeco employees. In the opinion
of the Management Board, there were no conflicts of
interest or semblance thereof between the company and
the members of the Management Board in 2009. Robeco
Groep N.V. does not have separate regulations covering
securities transactions by members of the Management
Board. The applicable ‘Rules and regulations regarding
private investment transactions by employees and insiders
of Robeco Nederland B.V.’ is published on the company’s
website. These rules should ensure that any insider trading
or a semblance thereof, and any mixing of business and
private interests is avoided. The company is continuously
striving to strengthen its internal risk-management and
control framework.
The Supervisory BoardIt is the duty of the Supervisory Board to supervise
the Management Board’s activities and any general
developments at the company and its affiliated enterprises.
The Supervisory Board also advises the Management
Board. Robeco Groep N.V. has laid down the specific tasks
of the Supervisory Board in the Articles of Association of
the company and in the above mentioned shareholder
agreement. These tasks are not, therefore, documented
in separate regulations. Information on the Supervisory
Board’s activities in the past financial year and the
information required by the Code can be found in the
Report of the Supervisory Board on pages 10 through 13
The Robeco Groep N.V.’s Supervisory Board consists of nine
persons: four supervisory directors A, four supervisory
directors B and one chairman. There are currently three
vacancies. The chair cannot be held by a supervisory
director B or by an employee of Rabobank Nederland.
Supervisory directors A cannot be or have been supervisory
directors B, nor can they be employees of Rabobank
Nederland. The General Meeting of Shareholders appoints
the supervisory directors and is authorized to dismiss any
supervisory director at any time. Supervisory directors will
be appointed on the basis of a binding proposal consisting
of at least two candidates, formulated by the Supervisory
Board. The Supervisory Board is structured in such a way
Corporate & fund governance

14 Annual Report 2009 Robeco Groep N.V.
that it can satisfactorily fulfill its tasks and that its members
can operate critically and independently of each other,
the Management Board and any other participating
interests. It should be noted that two of the supervisory
directors B are employed by Rabobank Nederland. In line
with the principle of the Code, each Robeco Groep N.V.
supervisory director is able to assess the general overall
policy and has the necessary expertise to fulfill his task. The
Supervisory Board meets the Code’s recommendation to
have at least one financial expert as supervisory director;
please refer to the short CVs of the supervisory directors in
the section General Information. In order to get a proper
insight into Robeco Groep N.V. and its activities, newly
appointed members of the Supervisory Board follow a
customized introduction program. All members of the
Supervisory Board also meet the recommendation on the
maximum number of supervisory directorships at Dutch
listed companies (please refer to the information regarding
supervisory directors in the section General Information)
and all the supervisory directors (except for Messrs.
Bruggink, Ten Cate and Van Schijndel ) are independent
within the meaning of the Code. In accordance with the
Articles of Association and the recommendation of the
Code, the Supervisory Board has drawn up a retirement
schedule. According to this schedule, supervisory directors
should, in principle, resign on the day of the General
Meeting of Shareholders four years after they were
appointed. Reappointment can take place with immediate
effect but only after careful consideration and not if the
person involved has reached or will reach the age of 72 in
that year. In contrast to the recommendation of the Code,
no maximum term is applied for supervisory directors. The
company publishes the retirement schedule on its website.
In close consultation with and after approval by the
Supervisory Board, the General Meeting of Shareholders
appoints a chairman and one of the supervisory directors
B as vice chairman. As mentioned above, the chairman
may not be a supervisory director B or an employee of
Rabobank Nederland. The chairman chairs the meetings
of the Supervisory Board and ensures that the Supervisory
Board functions satisfactorily. Furthermore, the chairman
of the Supervisory Board has regular contact with the
CEO on all issues relating to the responsibilities of the
Supervisory Board. The company secretary assists the
chairman of the Supervisory Board with the actual
organization of Supervisory Board meetings. In 2004 a
presidium was formed consisting of the chairman and the
vice chairman of the Supervisory Board. The vice chairman
is a supervisory director B who, in contrast to a supervisory
director A, may be an employee of Rabobank Nederland.
The CEO, in particular, keeps the presidium informed and
discusses issues with them. Prior to the meetings of the
Supervisory Board, the Audit & Compliance Committee and
the Nomination, Remuneration & Corporate Governance
Committee, the items on the agenda are discussed with
the presidium. The Supervisory Board has appointed
an Audit & Compliance Committee and a Nomination,
Remuneration & Corporate Governance Committee
from among its members. In conformity with the Code’s
recommendations, the two committees are not chaired by
the chairman of the Supervisory Board. Both committees
consist of three persons (see “General Information”).
The Audit & Compliance Committee, the Nomination,
Remuneration & Corporate Governance Committee and
the Investment Committee (as per 1 January 2010) have
taken on tasks recommended by the Code. The Report of
the Supervisory Board gives details about the composition
of the committees, the number of meetings and the main
04 3
Corporate Governance

15Corporate Statements 2009
items discussed in these meetings. In the opinion of
the Management Board there were no conflicts of interest
or semblance thereof between the company and the
members of the Management Board in 2009.
The remuneration for supervisory directors is agreed on at
the General Meeting of Shareholders. This remuneration is
not linked to the company’s results. The notes to the annual
financial statements contain the information required by
Dutch law (articles 2:383c through 2:383e of the Dutch
Civil Code) on the level and structure of the remuneration
for each supervisory director. The supervisory directors of
Robeco Groep N.V. do not receive shares and/or rights to
shares in the company as remuneration. The company does
not grant loans or guarantees to its supervisory directors.
Shareholders and the General Meeting of ShareholdersEach year within six months of the close of the financial
year, the General Meeting of Shareholders of Robeco Groep
N.V. is held in Rotterdam. At this meeting the reports of
the Management and Supervisory Boards are discussed,
the annual financial statements are approved/adopted and
decisions are taken on the proposed dividend and other
items on the agenda. The minutes of the General Meeting
of Shareholders are made available to the shareholder
within three months of the meeting, in accordance with
the Code’s recommendations. As Robeco Groep N.V. has
only one shareholder, the recommendations of the Code
relating to proxy voting are irrelevant. The company does
follow the other recommendations of the Code relating
to dividend and discharge. The Code’s recommendations
on the supply of information to the General Meeting of
Shareholders on price sensitive information or analysts’
reports do not apply, as Robeco Groep N.V. is not a listed
company. Finally, the recommendations relating to
the responsibilities of institutional investors do not apply
to Rabobank Nederland in its capacity as shareholder of
Robeco Groep N.V.
Robeco does pursue an active voting policy for most of its
investment funds and institutional mandates, on the basis
of which, voting rights are exercised on the underlying
stocks. For more information on this subject, please see
the company’s website and the Chapter Responsible
Investing & Corporate Responsibility of this report.
Financial reportingThe Management Board is responsible for the quality and
completeness of the published financial reports and the
Supervisory Board ensures that the Management Board
takes this responsibility. Each year at the General Meeting
of Shareholders, the external auditor is commissioned
to audit the annual financial statements, on the
recommendation of the Supervisory Board.
The external auditor reports his findings to the shareholder,
the Supervisory Board and the Management Board. Robeco
Groep N.V. complies with the Code’s recommendations
relating to internal and external auditors. Robeco Groep
N.V.’s annual financial statements are published on
the company’s website.

16 Annual Report 2009 Robeco Groep N.V.
Fund Governance
Fund GovernanceRobeco is committed to operating its fund-management
activities in a fair and responsible manner; that is in the
best interests of its customers. Several years ago, Robeco
adopted its own principles on fund governance in which it
addresses how conflicts of interest in its fund-management
activities should be handled.
In 2008, the Dutch Fund and Asset Management
Association (DUFAS) established a regulatory framework
on fund governance and Robeco’s principles were used as
a basis for this industry standard. This framework has now
been formally established as an effective self-regulatory
industry standard.
Robeco subscribes to the DUFAS principles and has
integrated them into its own principles on fund governance.
These principles, which also describe a number of potential
conflicts of interest, have been published on www.robeco.
com/corporate information/corporate governance.
MonitoringCorporate Compliance monitors these principles by
performing regular dedicated examinations in which
one or more potential conflicts of interest are reviewed.
The approach used for these examinations is divided
into three phases.
1. The selected potential conflict of interests is described
and the impact on the parties involved (fund/
participants versus fund-management company)
is analyzed. The measures and techniques that
can be used to manage this conflict of interests are
documented.
2. The international laws and regulations applicable
in a number of European countries and the United
States of America are reviewed with respect to these
types of conflicts of interest. Regulatory concepts
supported by industry networks such as IOSCO, EFAMA
and DUFAS are also taken into account. This review
provides us with a good insight into international
best practice.
Subsequently, the practices in place in Robeco’s
related business lines are reviewed. For practical
reasons, priority is given to Robeco’s Dutch and
Luxembourg-based funds.
3. Finally, Robeco practices are compared with
international best practice and legal frameworks.
On the basis of this comparison, Robeco’s principles
are assessed in terms of their content, implementation
and level of compliance.
Results of the examinationsCorporate Compliance has reported the outcome of these
examinations to the Audit and Compliance Committee.
The examination conducted in the course of 2009 dealt
with securities-lending transactions as an area of potential
conflicts of interest. The general conclusion of this
examination was that Robeco adheres to its principles
on securities lending as described in Robeco’s Principles
on Fund Governance.
04 5

17Corporate Statements 2009
18 Annual Report 2009 Robeco Groep N.V.
Robeco, established in Rotterdam in 1929, offers
investment products and services to institutional and
private investors worldwide. Assets under management
amounted to EUR 135 billion as of 31 December 2009.
Robeco advocates responsible investing. Environmental,
social and governance factors are integrated into the
investment processes, and there is an exclusion policy
in place. Robeco makes active use of its voting right and
enters into dialogue with the companies in which it invests.
The product range encompasses equity and fixed-
income investments, money-market funds and alternative
investments, including private equity, hedge funds and
structured products. The various strategies are managed
from Rotterdam (head office), Paris, Zurich, Boston,
New York and Hong Kong.
To service institutional and business clients, Robeco has
offices in Bahrain, Belgium, mainland China, Germany,
France, Hong Kong, Japan, Korea, Luxembourg, the
Netherlands, Singapore, Spain, Taiwan, the United States
and Switzerland. Through SAM Group Robeco also has a
sales office in Australia. Robeco has a license to operate as
a bank in France and the Netherlands, which enables it to
sell its products directly to private clients in those countries.
Robeco holds its interests through fully owned subsidiaries
or branches.
Robeco now holds a 100% interest in – amongst others –
Corestone (Zug, Switzerland), Harbor Capital Advisors
(Chicago, USA), SAM Group (Zurich, Switzerland), Robeco
Investment Management, Inc. (RIM, Boston and New
York) and Transtrend (Rotterdam, the Netherlands).
05 1 Furthermore, Robeco holds a 51% interest in Robeco Teda
(Tianjin) Investment Management Co Ltd. (Tianjin, China),
a 49% interest in Canara Robeco Investment Management
(Mumbai, India) and a 40% interest in AIM Trading N.V.
(Rijmenam, Belgium).
Robeco is part of Rabobank Group, one of the few privately
owned banks in the world with the highest credit ratings
from Moody’s and Standard & Poor’s. Furthermore, within
the banking sector, Rabobank is one of the global leaders in
terms of corporate social responsibility and sustainability.
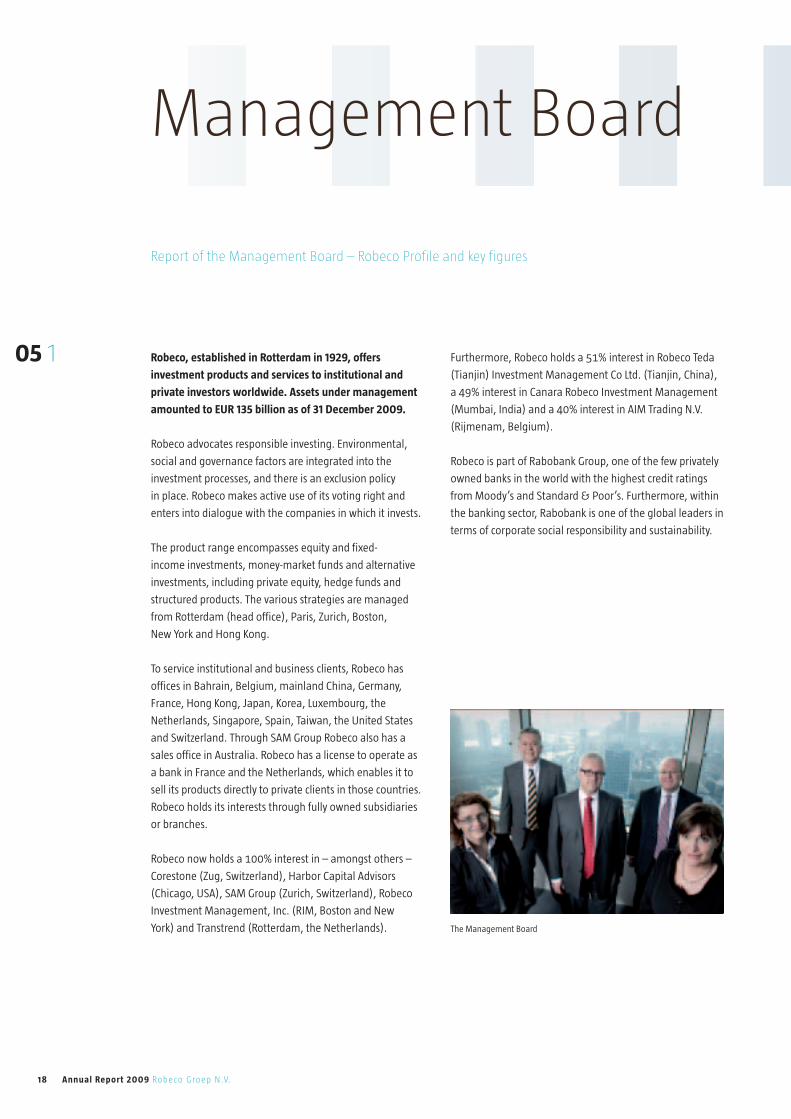
The Management Board
Management Board
Report of the Management Board – Robeco Profile and key figures

19Corporate Statements 2009
Assets under Management
EUR x billion
2005
622.8
2006 2007 2008 2009
657.5
819.6
888.9
512.2
Operating income
EUR x million
2005
233.6
2006 2007 2008 2009
221.0
276.6 270.2
–15.8
Operating result
EUR x million
Net result
EUR x million
Key figures
2005
152.0
2006 2007 2008 2009
193.0 200.2
174.5
–13.3
2005
131.6
2006 2007 2008 2009
141.7145.8
110.7
134.9
Management Board

20 Annual Report 2009 Robeco Groep N.V.
Bailing out the economyAlthough it is too soon to draw firm conclusions, 2009
may very well go down in history as the year in which the
worst recession since the 1930s came to an end. In the
first few months of the year, the economic outlook was still
very bleak - the economy had ground to a halt, industrial
production plummeted and it was extremely difficult to
obtain bank loans as the capital markets were frozen.
Concerns about the possibility of widespread bankruptcies
and mass unemployment caused companies to reduce
inventories on a massive scale and cut back production.
Fortunately, the situation turned out better than expected.
This was largely attributable to the decisive action taken
by central banks and governments, in the form of highly
stimulative policies. In the second half of 2009, global
economic growth exceeded expectations, whereas inflation
showed a downward trend. By the end of the year, the
decline in housing prices in the United States appeared to
have come to a standstill.
Equity markets rallyEquity markets got off to a very poor start. By the time
markets hit their lows on 9 March 2009, the Euro Stoxx
50 had lost 26% and the S&P 500 had plunged 25%.
Thereafter, the situation took a turn for the better. Several
reports on first-quarter corporate earnings turned out
to be better than anticipated. Capital markets started
to open up again. Companies were able to refinance
by issuing corporate bonds. Although some concerns
remained, stock prices recovered. Over the year as a
whole, the MSCI World Index gained a handsome 27%.
However this figure was surpassed by some considerable
margin by the performance in emerging markets: the
MSCI Emerging Markets Index (net return) soared by 73%.
At the end of the year, average stock-market valuations
were neutral.
Government bonds suffer after a flight to safety in 2009Government-bond yields showed a mixed picture over
the course of the year under review. They rose in the first
quarter, especially in the United States. This was partly
a correction following the bond rally of the last few months
of 2008, and also partly driven by worries about the
enormous supply of government bonds. However, the US
10-year yield took a nosedive following the Federal Reserve
Bank’s historical announcement in March that it would
purchase US Treasuries to support lending to consumers
and companies.
Later on in the year, government bonds came under
pressure again. Several positive reports on the economy
boosted optimism that the worst of the economic crisis
was over. As a result, risky assets such as stocks and credits
recovered. The situation was made worse by the fact that
significant fiscal and monetary stimulus pushed up long-
term inflation expectations, and the market had trouble
absorbing the new supply of US government bonds.
05 3
Chapter 1Market environment

21Corporate Statements 2009
Halfway through the year, long-term interest rates
started to decline again. The large supply of liquidity from
central banks pushed returns on cash to levels close
to zero, causing investors to turn to bonds. Despite this,
in December, US Treasuries were hit by favorable US labor-
market data, which supported investors’ belief in a global
economic recovery.
On balance, German ten-year bond yields rose from 2.96%
to 3.39% in 2009, while US ten-year Treasuries were hit
even harder, as yields surged from 2.84% to 3.84%.
Record issuance of corporate bondsThe corporate-bond market showed a strong rally.
Many companies were able to issue new bonds, making
2009 a record year for non-financial corporate issuance.
The Barclays Capital Euro Corporate Index gained 16%.
High-yield bonds performed even better. The benchmark
used by Robeco European Currencies High Yield Bonds
(EUR)1, for example, rocketed by 16%. Both institutional
and private investors started to invest in high yield again.
After the summer, the market was dominated by a large
number of bond issues, including issues by an increasing
number of low-rated companies. As a result, the number
of bankruptcies declined, boosting sentiment among
investors.
1 Barclays Capital Pan-European High Yield Corporate ex Financials 2.5% Issuer Constraint (hedged into EUR).

22 Annual Report 2009 Robeco Groep N.V.
Robeco’s ambition for 2005-2009 was to be a leading
international asset manager with a strong pan-European
base and prominent operations in the US, which
serves its clients by delivering best-in-class asset-
management capabilities in the major financial centers
and selected emerging markets worldwide. The main
strategic objectives in the past years were to strengthen
selected investment capabilities; optimize Robeco’s
global footprint; increase efficiency; and strengthen
Robeco’s position in the field of responsible investing.
These objectives have been realized to a great extent
(see below). In September 2009 Roderick Munsters
succeeded George Möller as Robeco’s CEO. Robeco’s
strategy for the coming years (see Robeco in 2010) was
established during a strategy review in Q4 of 2009 and
Q1 of 2010.
Strengthen selected investment capabilitiesIn the past years Robeco has strengthened several
investment capabilities, including its Emerging Markets
team and especially its sustainability investing capabilities;
its acquisition of SAM in 2006 was a major development in
this area. In 2007, Corestone Investment Managers AG, a
Swiss-based and independently operating asset manager,
was established. Corestone manages multi-discipline
open-architecture portfolios for institutional investors and
is an important feature of Robeco’s fiduciary-management
proposition. In 2009 Robeco transformed its sector funds
into theme funds, converted Rolinco into a pure thematic
growth fund and strengthened its Global Equities and
Credits capabilities.
Theme funds and Rolinco
Robeco believes that investing in themes is the best way to
benefit from the long-term changes occurring throughout
the world. This is the reason why Robeco transformed its
sector funds into theme funds at the end of 2009. Investors
in sector funds often end up with exposure to subsectors
that have very little to do with the underlying theme. One
example of this is the infrastructure theme. In the past
investors simply bought an industrials sector fund to exploit
the prevailing trend. The problem is that this included
positions in subsectors like employment agencies and
airlines, which in Robeco’s opinion are not directly relevant
to the infrastructure theme. This undesirable side effect can
be eliminated if investors buy into pure themed funds. The
conversion of our sector funds to themed funds will provide
our clients with a wide range of options, that enable them
to profit from long-term trends in a focused way. The global
equity growth fund Rolinco started to take a pure thematic
approach in 2009. It invests in the Robeco theme funds
as well as in the thematic funds managed by SAM out of
Switzerland. By investing in thematic funds, Rolinco offers
a well-diversified approach using thematic investment
strategies and aims to benefit from the long-term trends
and investment opportunities that arisein a continuously
changing world.
05 5
Chapter 2Strategy

23Corporate Statements 2009
Global Equities
Robeco strengthened its Global Equities capability in the
course of 2009. The sector coverage was enhanced by
adding dedicated analysts to the Global Equities team.
The team responsible for managing the Robeco fund,
the Robeco Global Stars high-conviction fund and global
institutional mandates, now consists of four portfolio
managers and ten analysts fully focused on global
developed equity markets. The team has the benefit
of a sound track record over the past five years and an
investment philosophy and process that has proven
itself over this period. Expanding this team will further
strengthen Robeco’s global equities capability.
Credits
Robeco’s Credits team was further strengthened in 2009.
This multi-national team now consists of five portfolio
managers and nine dedicated analysts, most of whom are
senior analysts. Each analyst focuses on a specific sector
and covers the entire rating spectrum within that sector.
All analysts have extensive experience in their sector. The
portfolio managers, who work as a team, are specialized in
either investment grade or high yield. In March 2009 the
range of credits’ strategies was expanded with the addition
of Robeco Investment Grade Corporate Bonds, which
invests in euro-denominated investment-grade corporate
bonds, excluding financials. This new strategy attracted
around EUR 600 million of investor money in the first year
of its existence.
Improve global distribution powerIn the past years, Robeco has opened offices in Tokyo,
Shanghai and Hong Kong, and established Canara Robeco
Asset Management in India. In 2009, Robeco’s efforts to
improve its global distribution power were focused on Asia,
especially Greater China and South Korea.
Greater China
In March, Robeco and TEDA International (Holding)
Corporation Limited announced the establishment of
Robeco TEDA (Tianjin) Investment Management Company.
TEDA International, a newly established company under
Tianjin Investment Holdings, is mandated to hold all the
financial assets under the Tianjin Government and is
responsible for the development of all financial-service
related areas. TEDA International is developing into the
national leader in sustainability as well as a national center
for private-equity investing by fully leveraging its position
in Tianjin, an ambition which is fully endorsed by Chinese
Government. For Robeco, TEDA International is a strong
partner with intimate knowledge of the Chinese market,
based in the heart of Tianjin Municipality. Robeco TEDA
will function as a platform for joint business development
in China, focused on Tianjin. Fund raising for the first
product, the Robeco TEDA Sustainable Private Equity Fund,
is currently underway and a significant close is expected
in Q3 2010. This fund will be the first yuan-denominated
cross-border private-equity fund with a focus on sustainable
investments. It brings together TEDA International’s unique

24 Annual Report 2009 Robeco Groep N.V.
knowledge and expertise in China and the international
clean tech investment expertise of Robeco and SAM.
In addition, Robeco has expanded into the Taiwanese
market, where it is targeting both the retail and the
institutional markets. In an important step forward, the
Securities & Futures Bureau granted Robeco a license to
open a local distribution and client service office, Robeco
Taiwan Ltd., in October 2009. Robeco has teamed up with
Shin Kong Investment Trust, Co., Ltd., part of the renowned
Shin Kong Financial Holding Group to handle the local
distribution of the Luxembourg fund range. In February
2010, the Taiwanese authorities approved a first batch
of five Robeco funds for distribution and Robeco and Shin
Kong are now finalizing the last administrative issues before
the implementation of Robeco’s retail distribution strategy
in Taiwan can commence in earnest.
On the institutional front, much progress was made in
2009. Robeco currently advises on five white-label products
for Taiwanese clients, based on capabilities such as
Emerging Markets, and Consumer Trends. The first offshore
mandate based on Robeco’s Indian equities capabilities
was realized through a China-India mandate that Robeco
advises for one of its local partners. A dedicated advisory
service team has been set up in Robeco’s regional head
office in Hong Kong to service Robeco’s Taiwanese advisory
partners.
South Korea
In August 2009 Robeco opened a representative office in
Seoul, South Korea, which operates under Robeco Japan’s
supervision. Robeco has been active in the Korean Market
since 2006 and these activities were increased at the end of
2007. The local team focuses on both institutional and B2B
clients. Robeco’s presence in Korea enables the company
to further enhance its relationship with the prestigious
institutional clients that it has gained over the years,
including a large bank and the National Pension Service.
Having a local presence also makes it easier to expand our
institutional clientele, and to further develop distribution
relationships for our top products with leading Korean
asset-management and securities companies. In April 2009
Korea Investment Corporation, South Korea’s sovereign-
wealth fund, awarded a US largecap value mandate to
Robeco Japan/Korea. In November 2009 a prestigious
distribution deal was formalized with Korea’s largest
independent asset-management company, Mirae Asset.
A specially tailored vehicle has been set up to give Korean
institutional investors direct exposure to Transtrend’s
Diversified Trend Program. In January 2010 this vehicle was
amongst the first hedge funds, being the only CTA in the
group, to receive formal approval from the Korean Financial
Regulator FSS for direct on-shore distribution.
05 7
Report of the Management Board – Strategy

25Corporate Statements 2009
Responsible Investing On 1 February 2010 Robeco introduced a comprehensive
policy on Responsible Investing (RI). An important pillar of
this policy is the integration of environmental, social and
governance (ESG) criteria into our investment processes.
We believe that this will add value by improving
the long-term risk-return profile of our clients’ portfolios.
The implementation of Robeco’s RI policy follows thorough
consultation with clients and years of research. For Robeco,
RI consists of five interrelated elements:
1. Active ownership (constructive dialogue and voting);
2. Transparency about risk, return and costs;
3. Sustainability theme investments;
4a. ESG integration;
4b. Exclusion policy;
5. Corporate Responsibility.
You can find more detailed information in the chapter
about Responsible Investing.
Optimizing organizational efficiencyAt the end of 2008, Robeco launched a program
(Top Shape) aimed at creating a more efficient
organization. Virtually all the initiatives relating to this
program had been realized by the end of 2009; some
outsourcing measures will be completed in 2010.
Top Shape will ultimately result in an annual saving of
EUR 78 million in operational costs and a more streamlined
and agile organization.

26 Annual Report 2009 Robeco Groep N.V.
05 9
In October 2008, Robeco launched a program
(Top Shape) to increase Robeco Group’s cost-effectiveness.
The decision to increase cost-effectiveness was made in
the first half of 2008, after a peer-group comparison proved
that our overhead costs are high compared with those of
our international competitors. So far, the execution of this
program has been successful. The Management Board
thanks the Works Council for the constructive cooperation
in particular with respect to the efforts in the context of
Top Shape.
The Management Board acts on the basis of shared
responsibility on the understanding that all members have
their own focus areas, per 1 March as follows.
Investments activities are headed by Hans Rademaker.
This includes equity, fixed-income, money-market
investment and securities lending activities in Europe,
the US (Robeco Investment Management) and Hong Kong.
Hans Rademaker is responsible for Pension Solutions and
Responsible Investing too.
All sales and marketing activities are concentrated in
Sales & Marketing, headed by Hester Borrie. Concentrating
all the sales and marketing activities increases client focus
and efficiency, stimulates cross-border cooperation and
improves the organization’s capacity to translate client
demand into product specifications for the Investments
division.
All IT and operating and support activities are grouped
together under Leni Boeren, the Chief Operating Officer.
Consolidation of all these operations creates a strong
focus on delivery. A sound infrastructure will give Robeco
a firm base enabling the company to benefit from the
consolidation opportunities within the asset-management
industry. Leni Boeren is also responsible for RIM, SAM and
the private equity activities.
Constant Korthout is the CFO, he is also responsible
for HCA, Robeco Sage, Robeco France and Canara Robeco.
Roderick Munsters, the CEO and Chairman, is also
responsible for product management and Transtrend.
Subsidiaries and joint ventures associates
Robeco Direct N.V.
Robeco’s direct distribution channel. In the Netherlands,
the bank serves approximately half a million retail clients
via Internet and telephone, and offers a wide range of
financial products and services which include mutual funds,
savings products, mortgages, insurances and brokerage
services. Robeco Direct also has a 100% subsidiary in
France: Banque Robeco SA.
AIM Trading N.V.
Belgium-based systematic high-frequency data currency
trader, that uses quantitative models to determine its
trading strategy (40% stake).
Chapter 3Organization

27Corporate Statements 2009
Canara Robeco Asset Management Company Ltd.
Joint venture with Canara Bank, one of the largest banks
in India (49% stake). Canara Robeco’s assets under
management amount to around EUR 1.3 billion
(at 31 December 2009).
Corestone Investment Management A.G.
Swiss-based independently operating investment
manager, Corestone manages multi-discipline open-
architecture portfolios for institutional investors
(100% stake).
Harbor Capital Advisors Inc.
Chicago-based Harbor Capital Advisors offers a family
of mutual funds through selecting and monitoring best-
of-breed external managers. HCA provides management
services to Harbor Funds, a mutual-fund complex,
and to institutional segregated accounts. HCA’s assets
under management amount to around EUR 33.9 billion
(at 31 December 2009).
Robeco Teda (Tianjin) Investment Management Co. Ltd
Joint venture with TEDA International Holding Corporation
Limited (51% stake), based in Tianjin, China. TEDA
International, a newly established company under Tianjin
Investment Holdings, is mandated to hold all the financial
assets under the Tianjin Government and is responsible
for the development of all financial service related
areas. TEDA International, the financial holding arm of
the Tianjin government, is developing into the national
leader in sustainability as well as a national center for
private equity investing by fully leveraging its position in
Tianjin, an ambition which is fully endorsed by the Chinese
Government.
SAM Group Holding AG
SAM is a Swiss based global investment boutique
focused exclusively on Sustainability Investing. The firm’s
offering comprises asset management, indexes and clean
tech private equity. SAM partners with Dow Jones Indexes
and STOXX Ltd. in the publication and development of
the Dow Jones Sustainability Indexes (DJSI). As of
31 December 2009, SAM’s total assets amount to
EUR 10.3 billion (100% stake).
Transtrend B.V.
Rotterdam-based research-driven and system-based
managed-futures trader, with track record going
back to 1992 (100% stake). Transtrend’s assets under
management amount to around EUR 6 billion
(at 31 December 2009).
28 Annual Report 2009 Robeco Groep N.V.
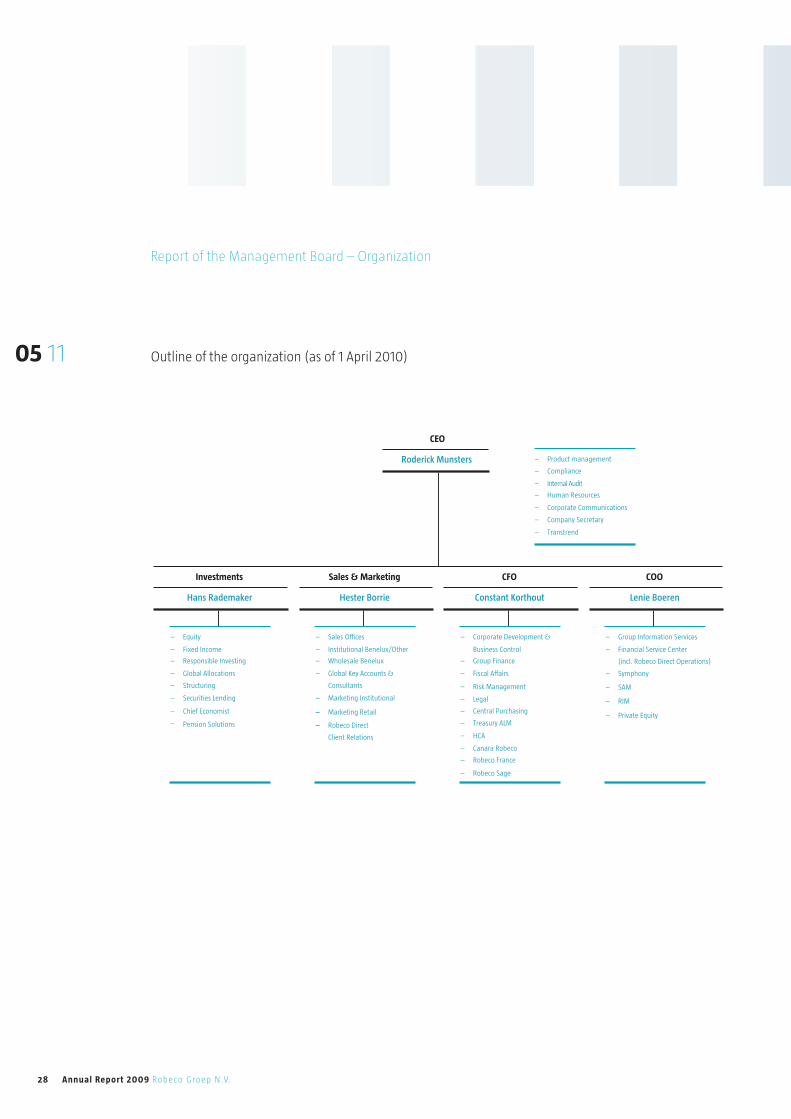
05 11 Outline of the organization (as of 1 April 2010)
CEO
Roderick Munsters – Product management
– Compliance
– Internal Audit
– Human Resources
– Corporate Communications
– Company Secretary
– Transtrend
Investments
Hans Rademaker
– Equity
– Fixed Income
– Responsible Investing
– Global Allocations
– Structuring
– Securities Lending
– Chief Economist
– Pension Solutions
Sales & Marketing
Hester Borrie
– Sales Offices
– Institutional Benelux/Other
– Wholesale Benelux
– Global Key Accounts &
Consultants
– Marketing Retail
– Marketing Institutional
– Robeco Direct
Client Relations
CFO
Constant Korthout
– Corporate Development &
Business Control
– Group Finance
COO
Lenie Boeren
– Group Information Services
– Financial Service Center
(incl. Robeco Direct Operations)
– Symphony
– SAM
– RIM
– Private Equity
– Fiscal Affairs
– Risk Management
– Legal
– Central Purchasing
– Treasury ALM
– HCA
– Canara Robeco
– Robeco France
– Robeco Sage
Report of the Management Board – Organization

29Corporate Statements 2009
Chapter 4Investment performance
Group performancePerformance is dependent on general market
developments and on the outperformance and
underperformance of the different investment programs.
Market developments are covered in detail elsewhere in
this report. At group level, in 2009, 73% (2008: 44%) of
the assets under management outperformed compared
to the relevant benchmark.
Equity:
A very positive year both in absolute and relative terms
The year 2009 was a very positive year for equity
investments. At group level, 89% of equity investments
outperformed their benchmark on a gross-of-fee basis.
At business-line level, the percentage of outperforming
equity assets was 81% for Mainstream Investments
Rotterdam, 100% for Mainstream Investments Gestions,
86% for Mainstream Investments RIM, 98% for HCA, 89%
for SAM and 88% for Canara Robeco Asset Management.
The Harbor International Fund, the largest Robeco
Group fund (EUR 18.6 billion) added another year of
outperformance to its very impressive long-term track
record. The excess return versus the benchmark was
6.0% gross of fees. The Harbor Capital Appreciation Fund
outperformed by 4.1% over 2009.
The Robeco fund outperformed its benchmark by
3.8%, Rolinco by 2.0% and Robeco Emerging Markets
Equities by 7.2%. Robeco European Equities achieved an
outperformance of 2.0% and Robeco Chinese Equities
realized an excess return of 5.7% over 2009.
The two largest products managed in Boston by Main-
stream Investments RIM, BPAM Large Cap Value and
BPAM Premium Equity outperformed their benchmarks by
5.9% and 11.2% respectively.
The two largest funds managed by SAM both outperformed
the MSCI World Index. SAM Sustainable Water Fund
realized an excess return of 8.5% while SAM Smart Energy
Fund achieved an outperformance of 44 % over 2009.
Fixed Income:
Difficult year for Lux-o-rente and Rorento;
high absolute returns for High Yield
Most Robeco fixed-income products generated a positive
absolute return in 2009, 46% of the assets outperformed
the benchmark. Over a three-year period this figure is
41%. Robeco Lux-o-rente had a difficult year; its absolute
return was –1.6%, underperforming the benchmark by
2.4%. Rorento realized an excess return of –1.3% over
2009. Robeco All Strategy Euro Bonds outperformed the
benchmark by 1.5%. HCA Bond Fund achieved an excess
return of 8.1%.
Absolute returns for the high-yield funds are high; the
absolute return for Robeco High Yield Bonds was 53.0%, on
a relative basis the fund underperformed the benchmark
by 1.3%.

30 Annual Report 2009 Robeco Groep N.V.
Alternatives:
Negative results for Transtrend; positive returns for Sage
Transtrend’s Enhanced Risk USD had a very difficult year
with a performance of -11.3% net of fees. Robeco Multi
Market Bonds (which are largely invested in a Transtrend
product) were affected by these results. The hedge fund
of funds Robeco Sage Capital International realized an
absolute return of 12.0% net of fees over 2009.
Returns of Robeco´s flagships
In order to highlight the general developments in
the market in 2009, an overview of the absolute returns
of Robeco´s flagships is given in the table below.
The table shows the gross-of-fee absolute returns of
the most important funds (net of fees for alternatives)
arranged according to investment type and assets under
management. The excess returns indicated are the out- or
underperformance of the fund versus its benchmark.
* As of 31 December 2009** Returns in USD*** No appropriate benchmark available
05 13
Flagship StrategyAuM
in bn EUR*
Absolute Return
(in currency) Excess return
Harbor International Equity - Large Cap Value 18.6 39.7** 6.0**
Harbor Capital Appreciation Equity - Large Cap Growth 6.2 42.8** 4.1**
Robeco Equity - Global 4.1 31.5 3.8
Robeco Emerging Markets Equities Equity - Emerging Markets 2.2 85.4 7.2
BPAM Premium Equity composite Equity - Premium Equity 1.4 33.1** 11.2**
SAM Sustainable Water Equity - Global Sustainability 1.2 36.7 8.5
Robeco Emerging Stars Equities Equity - Emerging Markets Focus 0.8 99.9 15.6
Rolinco Equity - Thematic Investing 0.7 34.9 2.0
Harbor Bond Fixed Income - US 4.3 14.5** 8.1**
Robeco Lux-o-rente Fixed Income - Quantative Global 2.7 -1.6 –2.4
Rorento Fixed Income - Global 1.9 4.8 –1.3
Robeco High Yield Bonds Fixed Income – Global High Yield 1.7 53.0 –1.3
Robeco Euro Cash Fixed Income - Money Market 1.5 1.2 0.5
Transtrend Enhanced Risk USD Alternative Investments – Diversified Trend Program 3.3 –11.3** ***
Report of the Management Board – Investment performance
Performance of Robeco’s flagships
31Corporate Statements 2009
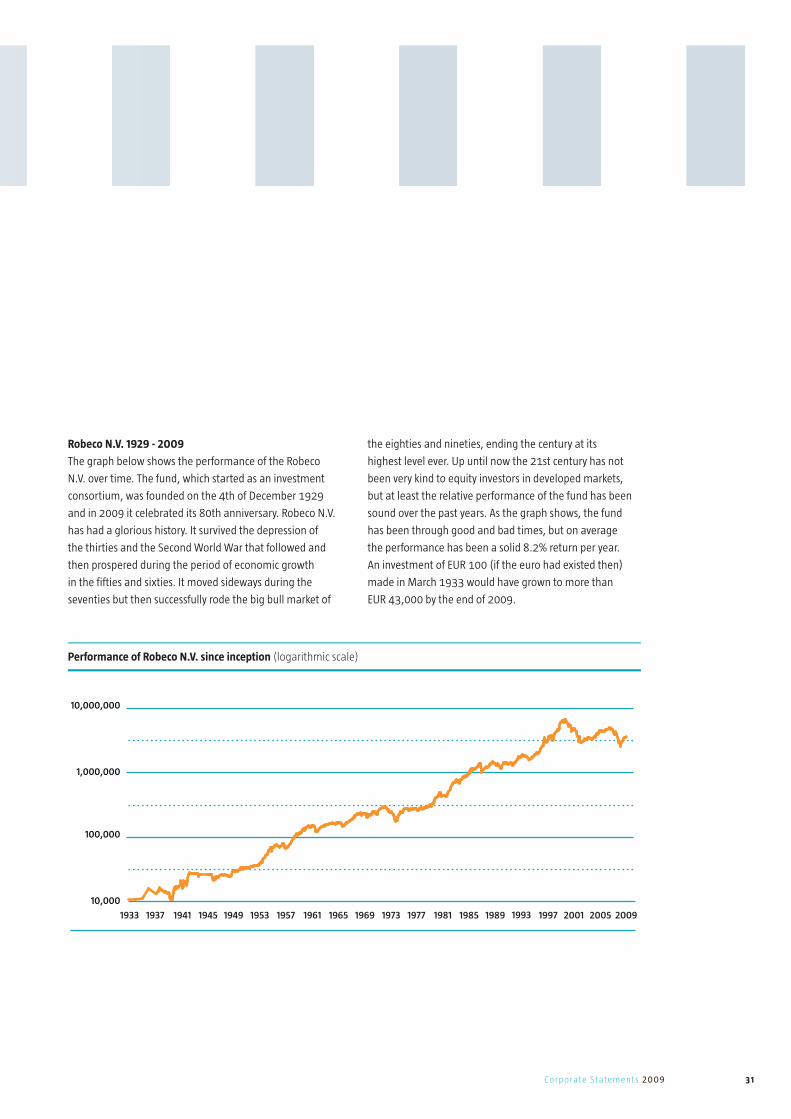
Robeco N.V. 1929 - 2009
The graph below shows the performance of the Robeco
N.V. over time. The fund, which started as an investment
consortium, was founded on the 4th of December 1929
and in 2009 it celebrated its 80th anniversary. Robeco N.V.
has had a glorious history. It survived the depression of
the thirties and the Second World War that followed and
then prospered during the period of economic growth
in the fifties and sixties. It moved sideways during the
seventies but then successfully rode the big bull market of
the eighties and nineties, ending the century at its
highest level ever. Up until now the 21st century has not
been very kind to equity investors in developed markets,
but at least the relative performance of the fund has been
sound over the past years. As the graph shows, the fund
has been through good and bad times, but on average
the performance has been a solid 8.2% return per year.
An investment of EUR 100 (if the euro had existed then)
made in March 1933 would have grown to more than
EUR 43,000 by the end of 2009.
1933 1937 1941 1945 1949 1953 1957 1961 1965 1969 1973 1977 1981 1985 1989 1993 1997 2001 2005 2009
10,000,000
1,000,000
100,000
10,000
Performance of Robeco N.V. since inception (logarithmic scale)

32 Annual Report 2009 Robeco Groep N.V.
05 15
Global business development
EUR x billion
AuM at opening date
Investment result
Net cash flow
Other gains / losses
AuM at closing date
Total
110.7
19.2
7.5
– 2.5
134.9
2009
Retail
52.9
10.8
3.9
– 0.5
67.1
Institutional
57.8
8.4
3.6
– 2.0
67.8
Total
145.8
– 29.1
0.6
– 6.6
110.7
2008
Retail
71.8
– 19.5
1.4
– 0.8
52.9
Institutional
74.0
– 9.6
– 0.8
– 5.8
57.8
Chapter 5Business development 2009
Growth of assets under management
Robeco’s assets under management showed a growth
of 21.9% in 2009. This increase resulted from a positive
net investment result of EUR 19.2 billion and a net cash
inflow of EUR 7.5 billion. The remarkable recovery in the
financial markets in 2009 affected Robeco’s assets under
management considerably. The investment result was
negatively affected by a EUR 1.2 billion loss caused by the
depreciation of the US dollar. Annual dividend payments
and interest distributions as well the fact that a fee-
generating agreement for Robeco CDO VII was unwound at
maturity, caused a EUR 2.5 billion decline in assets under
management.
Net cash flow
In terms of net cash flow, Robeco saw its best annual
performance ever in 2009. The net cash inflow of EUR 7.5
billion was well diversified over products and continents.
The retail cash inflow was strong in the US, particularly
into the mutual funds of Harbor Capital Advisors. Also in
Europe, cash inflow into retail products was strong but
was negatively affected by the fact that some structured
products were unwound at maturity. The net cash inflow
from European institutional business was strong, with
positive cash inflow particularly in emerging-markets
products. In Europe, managed-futures investment advisor
Transtrend, was able to attract significant net cash
inflow, despite the fact that its Diversified Trend Program
experienced negative returns.

33Corporate Statements 2009
European business development
EUR x billion
AuM at opening date
Investment result
Net cash flow
Other gains / losses
AuM at closing date
2009
79.0
9.8
3.8
– 2.5
90.1
2008
96.5
– 12.5
– 2.4
– 2.6
79.0
In 2009, institutional products generated considerable
cash inflows with Emerging Market Equity, Quant Equity
and High Yield Bonds being the most successful. On the
retail business side, all European wholesale distribution
channels generated substantial inflow into Emerging
Markets Equities and Value Equity in particular. However,
the fact that some structured products including Robeco
CDO VII were unwound at maturity resulted in considerable
cash outflow in 2009. Robeco Lux-o-rente received the
Morningstar 2009 Manager of the Year award in the
Netherlands and Robeco US Premium Equities received
this award in Belgium. These awards highlighted the good
performance of these funds in 2008. Robeco US Premium
Equities contributed well to the inflow that was generated
in 2009. The traditional Dutch equity funds Robeco and
Rolinco also outperformed their benchmarks last year.
Compared with previous years there was hardly any cash
outflow for these equity funds.
Specialty products distributed in Japan generated
significant profitable inflow with the Transtrend product
range, in particular, attracting new investments.

34 Annual Report 2009 Robeco Groep N.V.
05 17 US business development
EUR x billion
AuM at opening date
Investment result
Net cash flow
Other gains / losses
AuM at closing date
2009
30.5
9.0
3.1
0.0
42.6
2008
47.8
– 16.2
2.9
– 4.0
30.5
Harbor Capital Advisors contributed substantial new
investment from clients. The Harbor International Fund
together with the Harbor Bond fund were the main
beneficiaries of the net cash inflow. Harbor International
fund is Robeco’s largest fund (EUR 18.6 billion asstes under
management) and has shown outstanding and stable
performance results. The Harbor Bond fund showed an
excellent outperformance versus its benchmark and with
a net cash inflow of EUR 1.1 billion, this mutual fund had
EUR 4.3 billion in asstes under management by the end of
2009. Robeco Investment Management generated cash
inflow after some difficult years and its overall investment
results outperformed the benchmarks.
Report of the Management Board – Business Development 2009
Rest of the World business development
EUR x billion
AuM at opening date
Investment result
Net cash flow
Other gains / losses
AuM at closing date
2009
1.2
0.4
0.6
0.0
2.2
2008
1.5
– 0.4
0.1
0.0
1.2
Joint venture company Canara Robeco performed well
both in terms of investment results and net cash flow in
2009. Canara Robeco’s Gilt PGS received the Morningstar
2009 Manager of the Year award in India and the company
also received several other awards for its bond funds. The
main reason for the net cash inflow was the Canara Robeco
money-market product range, which doubled in size.
Segmentation of the assets under management
During 2009 the segmentation of the AuM by asset
class changed. The proportion of equities increased from
40 percent to 49 percent. The AuM segmentation according
to client type between retail and institutional was equal.
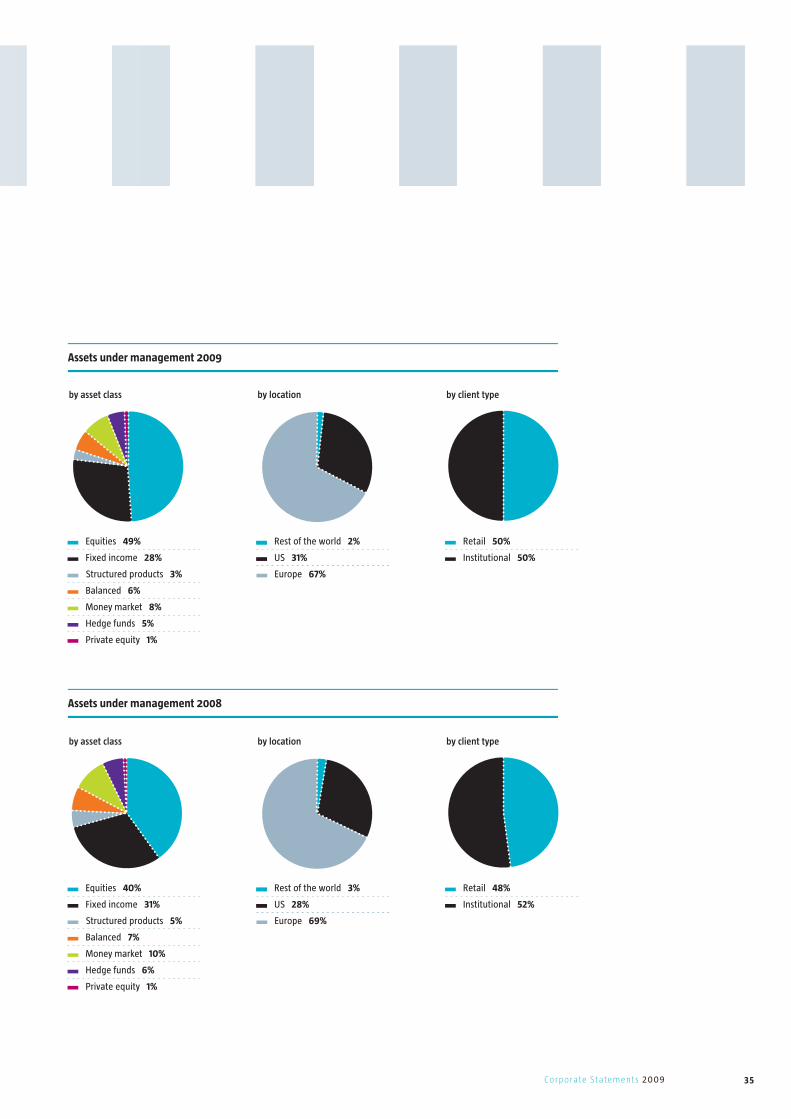
35Corporate Statements 2009
by asset class
Equities 49%
Fixed income 28%
Europe 67%
Balanced 6%
Money market 8%
Hedge funds 5%
Private equity 1%
by location
Rest of the world 2%
US 31%
Structured products 3%
by client type
Retail 50%
Institutional 50%
Assets under management 2009
by asset class
Equities 40%
Fixed income 31%
Europe 69%
Balanced 7%
Money market 10%
Hedge funds 6%
Private equity 1%
by location
Rest of the world 3%
US 28%
Structured products 5%
by client type
Retail 48%
Institutional 52%
Assets under management 2008
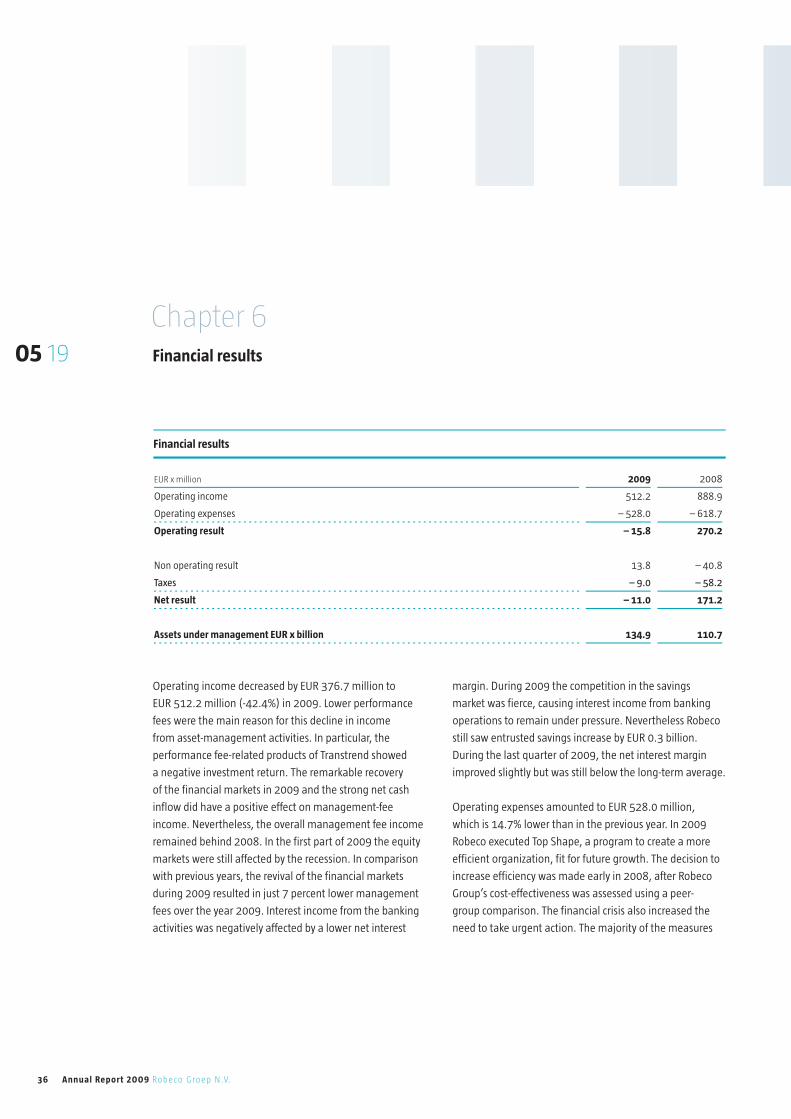
36 Annual Report 2009 Robeco Groep N.V.
05 19
Financial results
EUR x million
Operating income
Operating expenses
Operating result
Non operating result
Taxes
Net result
Assets under management EUR x billion
2009
512.2
– 528.0
– 15.8
13.8
– 9.0
– 11.0
134.9
2008
888.9
– 618.7
270.2
– 40.8
– 58.2
171.2
110.7
Chapter 6Financial results
Operating income decreased by EUR 376.7 million to
EUR 512.2 million (-42.4%) in 2009. Lower performance
fees were the main reason for this decline in income
from asset-management activities. In particular, the
performance fee-related products of Transtrend showed
a negative investment return. The remarkable recovery
of the financial markets in 2009 and the strong net cash
inflow did have a positive effect on management-fee
income. Nevertheless, the overall management fee income
remained behind 2008. In the first part of 2009 the equity
markets were still affected by the recession. In comparison
with previous years, the revival of the financial markets
during 2009 resulted in just 7 percent lower management
fees over the year 2009. Interest income from the banking
activities was negatively affected by a lower net interest
margin. During 2009 the competition in the savings
market was fierce, causing interest income from banking
operations to remain under pressure. Nevertheless Robeco
still saw entrusted savings increase by EUR 0.3 billion.
During the last quarter of 2009, the net interest margin
improved slightly but was still below the long-term average.
Operating expenses amounted to EUR 528.0 million,
which is 14.7% lower than in the previous year. In 2009
Robeco executed Top Shape, a program to create a more
efficient organization, fit for future growth. The decision to
increase efficiency was made early in 2008, after Robeco
Group’s cost-effectiveness was assessed using a peer-
group comparison. The financial crisis also increased the
need to take urgent action. The majority of the measures

37Corporate Statements 2009
were implemented in the course of 2009, mainly at the
operations of Robeco in Rotterdam. This restructuring
program aims to cut annual costs by EUR 78 million and in
2009 already realized EUR 41 million in cost reduction. The
measures implemented reduced the workforce by 300 staff.
As a consequence of Top Shape, and the fact that there
were fewer projects, the level of out-of-pocket expenses
for temporary staff was reduced by 33 percent. Compared
with 2008, consultancy fees decreased by EUR 18.5
million (48%). In addition, the housing and marketing
expenses were lower. In order to make Robeco ‘fit for
future growth’ several information technology (IT) projects
were carried out, which led to higher IT expenses in
2009. Robeco outsourced its IT infrastructure activities to
EDS as of 1 January 2009. The scope of this outsourcing
extends to both operational IT infrastructure and IT
infrastructure projects. This transition started in 2009
and will continue into the first quarter of 2010. In 2009
important progress was made on the Symphony project
that sets out the IT strategy and architecture for Robeco
Mainstream Investments, Alternative Investments and
for its Financial Service Center and Risk Management in
Rotterdam. There were some important developments in
relation to Symphony; the ‘Sophis’ project was completed,
providing Front Office (Structuring and Robeco Direct
ALM), Risk Management and Middle Office with a powerful
application to support their daily activities. Furthermore,
projects relating to a front-office equity-trading system and
fund risk management were finalized.
The regular assessment on whether it was necessary to
record an impairment on financial instruments (especially
asset-backed securities) was made. In some cases, it was
concluded that – due to some still unfavorable ratings,
macro-economic indicators and excess spreads –
impairment was inevitable. An impairment charge of
EUR 25.2 million (in 2008: EUR 52.8 million) for
the asset-backed-securities portfolio was recorded under
operating expenses.
As a consequence of the bankruptcy of one of the Dutch
registered banks in 2009, under the deposit guarantee
scheme, other Dutch banks have an obligation to
compensate a specific group of clients. Robeco recorded
its share of the total compensation which is linked to its
share of the total Dutch savings market, under operating
expenses.
In 2009 the non-operating result was positively
affected by an increase in the fair value of the seeding
and co-investment positions compared with 2008.
A lower impairment loss was recognized in 2009 for the
co-investment available-for-sale portfolio. Furthermore
hedge positions associated with foreign currency and
interest-rate fluctuations resulted in gains.
The 2009 consolidated result before tax was negative.
It was mainly the positive US taxable results and the higher
effective local tax rate there that resulted in income-tax
expenses for 2009. Furthermore, for some net operational
losses of foreign loss-making operations, no deferred
tax asset was recognized. The effective corporate tax rate
was extreme and due to the different tax rates within
the Company are not comparable with the normal effective
rate within the Netherlands. Although there was a negative
net result of EUR 13.3 million, the shareholders’ equity
increased by EUR 68.2 million to EUR 1,366.7 million due
to positive unrealized results within the available-for-sale
reserve and other revaluation reserves.

38 Annual Report 2009 Robeco Groep N.V.
05 21
Chapter 7Compliance and risk management
The credit crisis that erupted in 2008, and continued in
2009, also had an impact on Robeco. This chapter will
address a number of topics related to the credit crisis
from a risk-management perspective. In addition to
elaborating on the credit crisis, this chapter discusses
Robeco’s risk-management and compliance functions.
2009: Weathering the stormThe economic crisis in the financial markets which started
in 2007 spread to the real economy in 2008 and 2009,
leading to reorganizations and bankruptcies in virtually all
sectors. The impact was not limited to financial institutions
and businesses, but entire countries such as Iceland,
Greece and Dubai were also hit, causing parties in the
financial markets to have serious doubts about their credit
worthiness. The first signs of recovery emerged in the
second half of 2009 when share prices started to rise and
credit spreads fell. By the end of 2009, most markets were
more liquid than in 2008, but various asset categories
remained volatile and the solvency of banks and other
financial institutions remained a source of concern.
In the past year, Robeco Group has expanded and
optimized the measures it had previously taken to protect
its clients. These measures mainly relate to various ways
of limiting losses resulting from counterparty bankruptcy.
The frequency of collateral exchange in derivatives
transactions has been increased and more restrictions
have been established for the types of collateral supplied
by counterparties that borrow securities. Also, measures
have been taken to spread outstanding cash positions over
more credit-worthy counterparties and to segregate these
amounts wherever possible.
Liquidity risks are assessed thoroughly, especially for fixed-
income portfolios, for both investments in the portfolio and
purchases and sales by clients. These risks are monitored
and reported in an integrated manner within a specifically
designed framework.
More strict regulations have been implemented or
announced in various areas. Robeco Group maintains close
contact with local regulators and will always meet any
requirements applicable to portfolio management.
A number of measures have been taken to further improve
the management of financial risks relating to positions
for Robeco Group’s own risk and account. An application,
Sophis, has been implemented to monitor and report on
the market risk of the trading books. In this area, we are
also working on further integrating our systems with the
infrastructure of Rabobank Group. In terms of credit risk, we
are working on developing stress tests to enable the bank
to ascertain whether there is sufficient capital available to
cover potential losses in extreme situations. An internal
framework has been developed for liquidity risk that makes
it possible to make independent liquidity assumptions
for all types of assets and liabilities, and to assess effects
on the bank’s net liquidity position. Every quarter, a
39Corporate Statements 2009
capital-adequacy analysis will be performed by the bank’s
management and the Asset & Liability Committee to
supplement the annual ICAAP analysis that RDNV makes
for the regulator. The conclusions from this analysis will be
actively used in establishing limits for different types of risks
and for the bank’s capitalization.
Risk ManagementRobeco is firmly committed to the development of quality
products and services, and to careful compliance with
agreements made with clients. In addition, Robeco strives
to achieve efficient use of shareholder capital. Although
Robeco actively stimulates entrepreneurship throughout
the organization and encourages its staff to identify and
seize opportunities, it recognizes that the risks inherent in
entrepreneurship must be assessed and controlled. Robeco
aims for maximum transparency in terms of those risks that
might influence the results of the organization.
Risk Control Governance
Risk management is one of the responsibilities of line
management, but ultimately the responsibility of the
Management Board.
The Global Risk Management department (GRM) supports
management by developing and implementing policies,
methodologies and infrastructures for measuring,
monitoring and reporting on the different types of risk
inherent in the activities of the Group. More specifically,
GRM is responsible for risk oversight of client portfolios,
risk management for Robeco’s own account positions
and for advising the Management Board on strategic
capital allocation based on economic capital calculations.
Together with Group Information Services (GIS), GRM
manages information security risk ensuring that principles
and regulations for information security are understood,
adhered to and monitored. The overall coordination and
monitoring of the business-continuity-management process
is also a responsibility of GRM. In addition, GRM provides
assistance in performing risk & control self-assessments
is responsible for operational incident management
and facilitates the documentation of Robeco’s business
processes. GRM has a global mandate and reports directly
to Robeco’s Chief Financial Officer (CFO), independent from
Robeco’s business.
The Corporate Compliance department is responsible for
ensuring compliance with the rules and regulations, and
the Internal Audit department monitors the effectiveness
of the management control framework as well as the
design, existence and effectiveness of processes and related
process controls. Internal Audit has a global mandate and
reports directly to the Chief Executive Officer (CEO) of the
Management Board.
Several committees are in place to ensure that there is
comprehensive and consistent risk oversight throughout
the different business lines and entities within the Group.
– The Group Risk & Compliance Committee (GR&CC)
ensures that there is comprehensive and consistent
risk oversight throughout the different entities within
the Group. This committee evaluates and ratifies
group-wide policies relating to compliance and
risk-management topics, and is chaired by the CEO.
Meetings are held on a quarterly basis.
– The Financial Crisis Committee is responsible for
identifying the risks that could arise from a financial
distress event, as well as identifying the impact that
such an event would have on client portfolios and
40 Annual Report 2009 Robeco Groep N.V.
05 23
Report of the Management Board – Compliance and risk-management
Robeco’s reputation. This committee formulates,
initiates and coordinates necessary actions, and is
chaired by the Head of GRM. Meetings are held when
there is any indication that a financial distress event
may occur.
– As a sub committee of the GR&CC, the Asset and
Liability Committee is responsible for setting limits and
monitoring financial risk types for Robeco’s banking
activities (credit risk, interest-rate risk, liquidity risk and
market risk). In addition, it monitors the regulatory
capital, economic capital and RAROC figures at Robeco
Group level for internal management purposes and to
ensure that the entities under regulatory supervision
comply with the capital and solvency requirements. The
Committee is chaired by the CFO and meetings are held
on a monthly basis.
– The Valuation Committee is responsible for establishing
valuation methodologies for the instruments on
Robeco’s trading and investment books. The Valuation
Committee also decides on trading-book/investment-
book classifications and the use of specific models and
parameters to determine economic and regulatory
capital. This committee convenes on a monthly basis
and is chaired by the Head of GRM.
– The In Control Board was established in 2009 and is
responsible for ensuring effective governance of the
different internal control topics, such as SOx 404,
SAS70, business continuity management, information
security and internal control awareness. The In Control
Board decides on and monitors the scope, annual
planning, progress, and prioritization of the different
internal control topics. The In Control Board is chaired
by the CFO, also Robeco’s Chief Operational Officer
(COO) as a member of the Management Board
participates in the In Control Board. Meetings are held
once every two months.
– The Local Risk-Management Committees are
responsible for policy implementation and monitoring
the quality and comprehensiveness of risk oversight
within a business line or entity. The committees focus
on client portfolios, the composition of participants and
the frequency of gathering may differ, depending on
the scope and complexity of the activities.
– The Local Valuation Committees review and approve
the appropriateness and accuracy of the methods
used by Robeco’s administrators for the valuation of
securities (including derivatives) in client and fund
portfolios managed and / or (sub)advised by Robeco.
They meet on a regular basis and are composed of
senior representatives of both line management and
Robeco’s Group Risk Management and Compliance.
Robeco Control Framework
Robeco considers maintaining stakeholder confidence
and ensuring compliance with relevant regulations to
be essential. These topics have been on the corporate
agenda for a number of years. In order to give stakeholders
confidence in its operational management, Robeco is
continuously building and strengthening its internal
control framework. In close cooperation with Corporate
Compliance and Internal Audit, GRM organized an Internal
Control Awareness session for the Management Board to
further increase risk awareness.
Robeco has developed a sound management control
framework, mainly based on COSO, Basel II, SOx and
Robeco’s corporate policies for IT security, compliance and
business continuity management. This framework sets the
41Corporate Statements 2009
standards for the management controls that are required
to be in place within the different Robeco entities. This
framework is assessed on a regular basis.
Centralized and appropriate process documentation
within Robeco, including risk and control reporting, is
essential for maintaining and extending the internal
control framework. In 2009, the organization changed as
the measures resulting from the cost reduction program
(Top Shape) were incorporated in the business processes.
Monitoring activities are regularly carried out via internal
control procedures, risk & control self-assessments,
compliance reviews and internal audits. A group-wide
action management tool was implemented in 2009 that
promotes timely execution of risk mitigating actions and
encompasses a procedure and tooling to record, monitor
follow-up and report on these actions.
To provide stakeholders assurance on the performance of
processes and internal controls a number of reports are
made available. In 2009, Robeco issued a SAS 70 report on
its institutional asset-management activities, its pension
services and fiduciary management. Robeco also contributed
successfully to the Rabobank ‘In Control Statement on
financial reporting’ and the Management Board of Robeco’s
Dutch retail funds will issue an In Control Statement over
2009 as part of the annual reports of the funds.
Risk Types
Robeco recognizes several types of risk that are actively
managed throughout the Robeco organization. This
chapter covers those risks that are currently considered
to be significant within the Robeco Group. The list of risks
covered is, therefore, not exhaustive. There may be other
significant risks that Robeco has not yet identified or that
have been assessed as not having a significant potential
impact on the business, but that could materialize as
such at a later stage. Our systems for controlling risk are
designed to provide timely insight into such risks.
Strategic risk
Robeco’s ambition level for 2009 is captured in the
following statement:
“A leading international asset manager with a strong
pan-European base and prominent operations in the US,
which serves its clients by delivering best-in-class asset-
management capabilities in the major financial centers and
selected emerging markets worldwide.”
In its ambition to be a leading asset manager, Robeco
advocates the principle of Responsible Investing. Robeco is
convinced that solid corporate governance and corporate
responsibility will increase shareholder value. Robeco
is truly committed to Responsible Investing and strives
to give responsibility and sustainability a prominent
position in its strategy and operations. Robeco expects
responsible investing, especially the further integration of
environmental, social and governance (ESG) factors into
the investment-analysis and decision-making process in
2010, to improve risk/return in the long run. Policy setting
and the implementation of the ESG-related processes
will be monitored to avoid discrepancies between actual
implementation and expectations, both within and outside
Robeco.
In order for Robeco to execute its strategy, long-term
profitability is critical. In 2009, the profitability of Robeco

42 Annual Report 2009 Robeco Groep N.V.
Report of the Management Board – Compliance and risk-management
05 25 was not satisfactory. The contribution from various entities
to Robeco’s overall financial results remains a concern for
the Management Board. In 2008, in order to reduce costs,
Robeco initiated a cost-reduction program (Top Shape).
This program aimed to reduce costs and complexity, and
to streamline the organization. In 2009, this program was
completed. As expected, the reorganization had a significant
impact on Robeco’s business operations and employees;
our organization is still adapting to the new functional
organizational structure and governance. During 2009,
the implementation of measures resulting from Top Shape
was closely monitored by Robeco’s Management Board and
Robeco achieved the financial targets set by Top Shape and
managed to reduce the company’s overall cost level.
The change in market conditions, unsatisfactory
profitability, appointments of a number of new
Management Board members and the necessity to
update the strategic ambition for the next period led
to the need for a reassessment of the current strategy.
This reassessment started in Q4 of 2009 and includes a
review of the existing business mix in relation to market
developments. The results of this reassessment are
expected to be communicated in the first half of 2010.
Operational risk
Robeco defines operational risk as the risk of loss resulting
from inadequate or failed processes, people and systems,
or from external events. Operational risk is recognized as
a risk category for which appropriate control is necessary
and as such is managed on an ongoing and structural
basis throughout the Robeco organization. A qualitative
operational risk appetite is used to determine the degree of
risk that the Robeco Group is willing to accept in pursuit of
its commercial targets and in terms of the cost of control:
“Finding a healthy balance between becoming a leader in
specialized investment management, gaining revenues and
lowering costs while preventing material fraud and avoiding
the occurrence of operational risks which could cause
catastrophic damage to the Robeco Group, its clients and the
Robeco Group’s reputation.”
Robeco’s main operational risks are described below,
together with the mitigating measures that are
applied. Wherever possible, the potential impact on the
organization is mentioned. Risks relating to the investment-
management process, transaction processing, valuation,
outsourcing of activities and IT-related risks are considered
the most significant operational risks.
Investment management process
In order for Robeco to be a key international asset-
manager and to offer investment products and services to
institutional and private investors worldwide, it is essential
that the company focuses strongly on the needs of its
clients in terms of the products and services it provides. An
inherent risk to Robeco’s key activities is the possibility of
clients being misinformed as to the nature or design of a
Robeco product, resulting in negative effects for our clients
and for Robeco’s reputation.
In order to minimize this risk, Robeco is committed to
developing and offering high-quality products that are
transparent and that meet compliance and integrity
standards. A formal approval process has been put in
place to ensure this. This process entails products being
approved, prior to launch, by the Product Approval
43Corporate Statements 2009
Committee (PAC). This committee convenes every two
weeks and consists of the Management Board plus the
head of Global Risk Management and the Chief Compliance
Officer. In 2010, the current product-approval process will
be further enhanced to improve efficiency.
At the end of 2009, a formal Middle Office was established.
The objective of the Middle Office is to increase control
over several investment related operational processes.
Previously, these activities took place on a more
fragmented basis throughout Robeco. The Middle
Office will improve the link between the activities of the
investment departments (front office) and those of the
back office. In addition, the Middle Office will assist the
investment departments by giving them a solid operational
environment allowing them to focus on launching and
managing innovative products. The Middle Office is
expected to be fully operational by the end of the first
quarter of 2010.
Transaction processing
Several trading desks within Robeco process a large
number of transactions on a daily basis. A key operational
risk for Robeco lies in possible deficiencies that occur in the
daily processing and settlement of transactions with clients
or other parties, e.g. incorrectly executed transactions due
to entry mistakes, processing failures or mistakes, resulting
in financial losses for the Robeco Group.
Robeco mitigates this risk with an extensive set of controls
that are embedded in business processes for transaction
processing. Important controls are the individual matching
of transactions by Robeco’s Financial Service Center and the
regular reconciliation of holdings and cash. The automated
registration and execution of transactions with relevant
audit trails is in place, in addition to the four-eyes principle
and the segregation of duties within the transaction-
processing departments.
Valuation
The daily calculation of the Net Asset Value (NAV) of all
portfolios is an important process for both our portfolio
managers and our clients. An incorrect NAV may lead
to incorrect or incomplete investment decisions. The
valuation process consists of the pricing of holdings and
the subsequent calculation of the NAV. Both elements
have their own specific controls, such as automatically
imported prices and exception reporting, the four- eyes
principle applied to actions carried out by individuals, and a
simultaneous second NAV calculation to verify the outcome
of the first NAV calculation. The methods used are validated
by the Valuation Committee.
In 2009, the volatility of the financial markets was
substantially higher normal, which affected the process
of importing prices provided by external pricing vendors.
The process is controlled using the principle of exception
reporting. Due to the overwhelming number of exceptions,
the process was temporary adjusted to be able to cope with
the effects of the increased volatility in markets.
Outsourcing of activities
In several areas of Robeco’s business, activities are
outsourced to third parties. The decision to outsource
activities creates a long-term relationship with a third-
party service provider. This is critical, as Robeco remains
responsible for all outsourced activities. Robeco has
established an outsourcing policy that provides a
framework to support the decision-making process

44 Annual Report 2009 Robeco Groep N.V.
05 27 regarding the outsourcing of activities and contains
a number of prerequisites that are conditional to the
decision. An In Control report (i.e. SAS70), as well as
the right to audit, are considered prerequisites. These
prerequisites do not, however, provide an absolute
guarantee of success in outsourcing to third parties.
At the start of 2009, Robeco outsourced the IT
infrastructure and related activities for Robeco’s Rotterdam
based operations to Hewlett Packard (HP). In 2009 HP
started the transformation of the Robeco IT infrastructure
to the HP datacenters, hardware, services and standards.
This transformation is expected to be completed in
the first half of 2010. Such a transformation process is
inherently complex as IT applications need to be moved to
new infrastructure, processes and procedures need to be
adapted, and improved services need to be implemented.
Robeco and HP established extensive contractual
agreements as a basis for the outsourcing, detailing the
scope and services included in the outsourcing and the
responsibilities of both parties. However, experience shows
that not all operational details can be covered by such a
contract. Therefore there is a risk that a lack of clarity on the
division of responsibilities and the scope of services may
result in a decline of in the level of service and a weakening
of the control environment. To address this risk Robeco
has formed a joint program team with HP to ensure that
all changes resulting from the migration are executed in a
coordinated and controlled manner, with sufficient testing
and additional resources to ensure effective aftercare in
the immediate period after the changes have occurred. In
addition to the transfer program, strong governance at a
strategic, tactical and operational level was implemented.
Where any weaknesses were detected in the control
environment, Robeco initiated the necessary remedial
action in cooperation with HP. In cases where service levels
declined initially, HP started service-improvement initiatives
to meet the agreed service levels.
IT-related risks
Given the nature of trading and transaction processes, the
investment-management industry is heavily dependent on
IT systems and data. This also applies to Robeco and results
in a high dependency on the reliability of systems and
data, and on the availability of such systems. Deficiencies
in these areas might result in a significant threat to
Robeco’s continuity and financial position. Robeco has now
integrated the information-security-management function,
responsible for policy setting and overall monitoring, into
the Global Risk Management department. By doing so,
Robeco aims to achieve maximum alignment between both
operational-risk management and information security
management. In 2009, Robeco adopted the renewed
Group Information Security Policy, issued by Rabobank.
Another IT risk that Robeco recognizes is the risk of Robeco’s
key business processes or critical systems failing as a result
of a severe disruption or complete interruption. This would
result in Robeco’s key business processes or critical systems
being unavailable for a number of hours, causing financial
damage for Robeco and its clients. In order to limit this risk,
Robeco has taken appropriate measures and incorporated
these into a group-wide business-continuity-management
program to minimize the damage resulting from such an
interruption to its services. In the context of outsourcing
the IT infrastructure and related activities to HP, GRM has
imposed requirements on HP to ensure effective IT disaster
recovery.
Report of the Management Board – Compliance and risk-management
45Corporate Statements 2009
The ability to adjust IT systems to changing business
requirements is critical to Robeco in the demanding
and quickly developing market in which it operates. It
is important to have processes in place to ensure the
controlled management of such changes, especially if
they involve significant changes to IT systems. To address
this, Robeco has implemented a project-management
methodology for IT projects. In 2009, Robeco enhanced this
project management methodology by establishing periodic
project reviews, a formal project-closure process and by
strengthening the Project Office within Robeco. Robeco
is in the process of executing a comprehensive program
to update its IT-application landscape in the investment
and fund-management area. Given the complexity of this
program, there is a risk that the expected benefits will not
be realized within the established timeframes and budgets.
To mitigate this risk, a clear governance structure under the
leadership of the Management Board has been established
to manage this program and any underlying projects.
Additional quality assurance efforts have been initiated
on both program and project level. Going forward, strong
focus will remain on the execution of this program and
realization of the program benefits.
Financial risk
In terms of financial risk, Robeco makes a distinction
between credit risk, market risk, liquidity risk and interest-
rate risk, all of which are actively managed and monitored
by Robeco’s Global Risk Management department.
IFRS 7 has been in effect since 1 January 2007. This
accounting standard focuses on ensuring insight into
financial instruments and their effects on the financial
positions and results of a company. The diversity of the
applicable financial risks, their size, and the policies
that are in place to mitigate these risks need to be stated
explicitly. Note 47 to the Financial Statements provides
further qualitative and quantitative information on
financial instruments and financial-risk management.
Compliance
The compliance function supports the Management Board
and the departmental management teams in maintaining
a high level of compliance and aims to ensure that all
business principles are understood and implemented.
License to operate
Robeco operates in markets that are regulated by financial
regulators and holds all necessary licenses to operate in
these markets. It is essential to Robeco’s business interests
to retain these licenses. In order to do this Robeco must
maintain a high level of compliance with the license
requirements and all other requirements set by financial and
national legislators. Robeco therefore continually works on
maintaining an excellent relationship with all our regulators
through open and transparent communication, and by
ensuring that it is not necessary for any regulator to take any
formal measures against the company. Robeco therefore
works continually on a level of compliance with all relevant
rules and regulations. Besides this form of compliance, we
are also committed to operating in compliance with the
legal and investment agreements that we have with our
customers. Any investment restriction that has been agreed
upon with our customer is monitored by the investment-
restrictions team that forms part of Robeco’s Corporate
Compliance department. Compliance with the agreements
with our customers is a cornerstone for Robeco’s business.
46 Annual Report 2009 Robeco Groep N.V.
05 29 New legislation
As a result of the increasing number of rules and
regulations and their diversity and complexity, the
inherent risk of non-compliance is increasing. This could
have a negative impact on Robeco’s reputation as well
as its financial results if penalties were to be imposed by
authorities. To manage and mitigate this risk, Robeco’s
Corporate Compliance department employs specialists for
designated compliance areas. The Compliance department
initiates and monitors implementation of new regulations
and thus ensures that Robeco’s conduct is in line with the
expectations of stakeholders. The Compliance department
also initiates, implements and monitors global compliance
policies which define the minimum compliance standards
for activities within Robeco. Robeco is active in many
countries, each with its own laws and regulations. Although
Robeco’s products and services differ per country, high
standards of integrity and conduct are always required.
Embedding compliance policies
One way to enhance the understanding of Robeco’s
compliance policies is to embed knowledge regarding
these items firmly within the organization. The compliance
policies lay down Robeco’s principles in four different areas:
retail and institutional clients; products and services;
investment management and personnel and organization.
In 2009, we took the following additional steps:
– The globally applicable Code of Conduct was rolled
out. This code integrates rules on integrity and staff
conduct, and acts as an umbrella for all other policies
and regulations. A booklet was distributed to all
personnel worldwide and awareness was heightened
via internet. This is a significant cornerstone of sound
operational management.
– In order to strengthen the whistle blowing policy, we
appointed an external confidant to whom internal
issues or abuses can be reported, in addition to the
existing whistle blowing committee.
– We started to hold monthly workshops for all new
Dutch employees to give them an ‘introduction to
compliance and integrity’, in which dilemmas are
extensively discussed.
Monitoring adherence and enforcing compliance policies
Robeco’s Corporate Compliance department monitors its
own activities as well as all global compliance activities
through a planning and control cycle designed to fulfill
its global mandate. The 2010 agenda was drawn up in
late 2009, during the annual World Wide Compliance
Meeting held for all compliance officers worldwide.
Corporate Compliance also participates in local and group
risk- management committees. The Local Compliance
Officers and their teams perform the day-to-day compliance
activities (e.g. checks on know-your-customer, anti-money-
laundering, approving marketing materials and investment
restrictions). In 2009, as a result of the Top Shape program,
all the compliance departments in the Benelux merged into
one Corporate Compliance department.
Moreover, Robeco has established a global corporate-fund
governance standard, in which special attention is given
to managing potential conflicts of interest relating to
fund-management activities. Robeco’s fund governance is
tested by a regular fund-governance examination carried
out within all Robeco’s business operations. The outcome is
reported to the Audit & Compliance committee of Robeco
Groep N.V.’s Supervisory Board. A description of these
activities for 2009 can be found in the chapter relating to
principles of fund governance.
Report of the Management Board – Compliance and risk-management

47Corporate Statements 2009
Internal AuditInternal Audit is well positioned within Robeco Group.
The department reports to the Chief Executive Officer. The
independence of this function is safeguarded by having
a second reporting line, to the Chairman of the Audit &
Compliance Committee.
Based on an in-depth annual risk analysis, a medium-
term audit plan is maintained and executed by Internal
Audit. In assessing risks and setting the audit plan, input is
received from senior management, Compliance and Risk
Management. Every quarter the audit plan is adjusted
for developments, keeping overall audit coverage at an
appropriate level and evenly spread over the group.
Besides operational audits, IT audits, project reviews and
management-control assessments, Internal Audit performs
SOx testing for operational effectiveness. In executing
its audit plan, Internal Audit cooperates closely with the
external auditors Ernst & Young on a global level.
Internal Audit’s quarterly reports are discussed in detail
with the Management Board, the Audit & Compliance
Committee and Audit Rabobank Group. Every two years,
Audit Rabobank Group also reviews the risk analysis,
audit plan and audit coverage, and the Internal Audit
department as a whole.
Audits generally result in audit reports with an audit
rating, where everything is discussed with the responsible
Management-Board member. If and when necessary during
the audit, measures of improvement are agreed upon with
management and for each measure an owner, deadline
and its significance are documented. Every quarter Internal
Audit monitors the progress of implementation and reports
on this to the Management Board, enabling it to take
timely corrective action.
Internal Audit considers the implementation of
measures of improvement with the Robeco Group to
have been satisfactory, which shows the willingness
of the organization to improve or optimize design,
documentation, effectiveness and efficiency of processes,
risk management and risk control.
Management ReviewIn 2009, Internal Audit assessed Robeco’s risk management
and internal control practices on a regular basis. This
provided insight into the significant risks that are applicable
to the Robeco Group. All such significant aspects are
discussed with senior management and the Audit &
Compliance Committee. Regular reports on these aspects
are submitted to the Supervisory Board.
It is important to note that the proper design and
implementation of internal risk management and control
systems significantly reduces, but cannot fully eliminate,
the possibility of poor judgment in decision-making;
human error; control processes being deliberately
circumvented by employees and others; management
overriding controls; and the occurrence of unforeseen
circumstances.
Another limiting factor is the need to consider the relative
costs and benefits of risk responses. Properly designed
and implemented internal risk-management and control
systems will therefore provide reasonable, but not absolute
assurance that a company will not be hindered in achieving
its business objectives, or in the orderly and legitimate
conduct of its business. In this context, reasonable

48 Annual Report 2009 Robeco Groep N.V.
assurance refers to a degree of certainty that would be
satisfactory for prudent managers in the management of
their affairs in the given circumstances. Projections of any
evaluation of effectiveness for future periods are subject
to the risk that controls may become inadequate because
of changes in conditions, or that the degree of compliance
with Robeco policies, procedures and instructions may
deteriorate.
Based on the review of Robeco’s risk management and
internal control systems, and awareness of their inherent
limitations as described above, we have concluded that
there is reasonable assurance that:
– we have sufficient insight into the extent to
which Robeco’s targets will be realized;
– Robeco’s internal and external (financial) reporting
is reliable;
– the applicable laws and regulations are being
complied with.
Audit & Compliance CommitteeAs a sub committee of the Supervisory Board, the Audit
& Compliance Committee, oversees governance and risk
control related topics. In addition to the management
attention, the Audit & Compliance Committee discusses
the risks and progress made with the implementation of
control measures as described in this chapter. Please refer
to Chapter 3 of the Annual Report for further details on
the Audit & Compliance Committee.
05 31
Report of the Management Board – Compliance and risk-management

49Corporate Statements 2009
Chapter 8Responsible Investing & Corporate responsibility
Responsible Investment objectives well on trackFor Robeco, Responsible Investing (RI) is a true
commitment. Through Responsible Investing, we strive to
give responsibility and sustainability a prominent position
in our strategy and operations. Robeco expects responsible
investing, especially the integration of Environmental,
Social and Governance (ESG) factors into the investment-
analysis and decision-making process, to improve risk/
return. RI leads to more comprehensive company
assessments, improves our corporate risk management and
enables us to discover new business opportunities at an
earlier stage. By advocating responsible investing, we live
up to the expectations of our clients and society at large.
Robeco acts as a committed owner, and actively advocates
developing the process of responsible investing. Robeco’s
ambition for responsible investing is based on the United
Nations Principles for Responsible Investing (UN PRI).
Robeco has identified four key two-year objectives for
responsible investing in 2009 and 2010. We are well on
the way to realizing these key objectives. The first objective
is to produce responsible-investment models to cover
all products in the investment categories of equity, fixed
income and private equity. The second objective is to
provide all portfolio managers with a set of instruments to
enable them to carry out ESG analysis. The third objective is
to have integrated ESG factors into the investment analyses
and investment decisions for at least 60% of Robeco´s
assets under management by the end of 2010. During
2009 Robeco developed models, policies and instruments
relating to these objectives. The implementation of these
objectives will continue in 2010. The fourth objective
is to substantially expand the application of Robeco’s
engagement services to at least EUR 25 billion by the
end of 2010. Assets under engagement per end of 2009
were EUR 15.4 billion. In 2010 Robeco will also extend its
engagement services to institutional funds.
Developments in responsible investing in 2009For Robeco, Responsible Investing consists of five
interrelated elements. We are a responsible investor
that engages in an active dialogue with companies and
makes use of its voting rights. Robeco is transparent
about product risks, costs and returns, has a wide range
of sustainable and responsible investment products and is
further integrating environmental, social and governance
criteria into its investment analysis. Furthermore, we ensure
that we apply the principles of corporate responsibility to
our own operational management. We will now assess
developments in each of the categories under the headings
on the next page.

50 Annual Report 2009 Robeco Groep N.V.
05 33
Active ownership
Active ownership is the active use of investors´ rights to
exercise an influence on corporate management. Its aim
is to increase the long-term value of a company for its
shareholders and other stakeholders. We seek to engage
companies in an active dialogue on good corporate
governance and responsibility. In 2009 Robeco held
188 active dialogues with companies on ESG issues and
achieved successful results in over half of the engagement
cases closed in the course of the year. Robeco participates
in a wide variety of investor networks, working groups and
collaborative engagement initiatives. These initiatives
Report of the Management Board – Responsible Investing & Corporate responsibility
Responsible Investing
Activeownership
Corporateresponsibility
Sustainability themeinvestments
Transparencyabout risk, return andcosts
ESG integration
Exclusion policy
urge companies to improve their performance in terms
of ESG, for example, by signing the UN Global Compact,
by ensuring that they report on the impact they have on
forests, or by encouraging them to sign the CEO Water
Mandate and establish a water policy. In 2010 Robeco will
extend its engagement services – currently applied to retail
funds and some client mandates – to its institutional funds.
Robeco will also be expanding its engagement coverage
in 2010, by including a substantial number of emerging-
market companies and credits.
In 2009 Robeco voted at 1,854 shareholder meetings,
more or less equally divided over Europe, North America,
Asia Pacific and Emerging Markets. In some of these
meetings, shareholders used their rights to place a
shareholder proposal on the agenda. Robeco voted on
589 shareholder proposals (80% of these were in North
America) and supported 57% of the proposals.
Transparency about risk, return and costs
Current markets and clients demand transparency about
risk, return and costs. Transparency helps clients to gain a
better understanding of their investments and to be aware
of the risks involved. Robeco actively communicates its
investment philosophy and is clear about product risks,
costs and returns. From 2010 onwards, Robeco will classify
all investment products, including third-party funds sold by
Robeco. This classification will show how RI is incorporated
into each mutual fund.

51
Sustainability theme investments
SAM is Robeco’s boutique for sustainability investing.
A member of Robeco since 2007, SAM offers a range of
world class sustainability theme funds, such as its Water
Fund, Smart Energy Fund, and Climate Fund. Sustainability
investing forms part of the concept of Responsible
Investing. It is an investment approach that enhances
traditional valuation models by integrating extra-financial
criteria which influence shareholder value.
Implications for analysis and investment policy
a. ESG integration: Robeco is currently working to
integrate ESG criteria more broadly into its mainstream
investment-analysis and decision-making processes.
ESG integration requires an investment-analysis
and investment-decision process that takes into
account the ESG aspects within a context of rigorous
financial analysis. We expect ESG integration to
improve risk return, to lead to more comprehensive
company assessments, to improve our corporate risk
assessment, and to enable us to discover new business
opportunities more quickly.
b. Exclusion policy: In 2010, Robeco will implement a
company-wide exclusion policy for all its investment
products.
Corporate Responsibility
Robeco’s strategic ambition is to retain its leading position
in the field of responsible investing. In order to support
this ambition, we will further incorporate responsible
approaches in our own operational management. In 2009
Robeco established an internal environmental policy, a
responsible purchasing policy and a social policy for its
operational management.
Robeco’s internal environmental policy is aimed at
saving energy, using sustainable energy and separating
and reducing waste and paper. This will reduce both
our environmental footprint and our costs. Robeco can
only be successful if its employees are involved with and
feel committed to the ambitions and core values of our
company. We recognize that people are vital in realizing
our corporate goals. The ambitions, targets and concrete
measures defined in our social policy are based on this
basic assumption.
Robeco feels responsible for its role in society. As in previous
years, in 2009 Robeco supported the mentor project
Benefits for Kids, the Workmate project focusing on instant
volunteer work, the youth initiative More and several other
initiatives put forward by its local offices. The projects are
focused on employees voluntarily dedicating time and
effort to the community.
Corporate Statements 2009

52 Annual Report 2009 Robeco Groep N.V.
Chapter 9Robeco in 2010
The global financial markets have had a shaky start to the
year. Worries over tightening monetary policy in China,
some weaker-than-expected macro data, the Greek
debt crisis and harsh banking-regulation proposals are
all weighing on sentiment. However, in our view, these
concerns appear to be overdone. We expect the global
economy to continue to strengthen, although regional
differences are increasing, and in a few years time
inflation is bound to raise its head. This is one of the main
challenges investors will be facing in the longer term.
For Robeco 2010 marks the start of a new strategic period.
At the beginning of March the strategy was established for
2010 - 2014:
“To offer institutional and retail clients in the Netherlands and
in a limited number of countries in Europe, Asia, the Middle
East and the United States a compact, client-oriented and
competitive range of responsible, actively managed investment
strategies and pension/investment solutions. In addition:
sustained focus on cooperation, effectiveness and efficiency.”
This strategy has been translated into five spearheads for
the coming years. The first spearhead is to increase focus,
both in terms of clients/markets and products. Robeco
intends to regain the position of clear market leader in the
Netherlands and will streamline its international ambitions,
discontinuing sales efforts in some smaller countries and
scaling down the number of international offices.
The product range will be rationalized
Robeco will discontinue small-scale capabilities and
capabilities that underperform and focus on a compact
range of actively managed ‘basic’ products (for example
Global Equities and Global Bonds) supplemented with
a select number of proven successes such as Emerging
Markets Equities, US Premium Equities, SAM and Transtrend
products. In addition, Robeco will create or strengthen
strategies and investment solutions where it has or can
create a defensible competitive edge, including:
1. Responsible investing;
2. Inflation-linked products;
3. Food & Agri funds for the institutional market,
developed together with Rabobank;
4. Pension and investment solutions, e.g. defined-
contribution solutions, manager selection, life-cycle
products and fiduciary management;
5. Research and quant products, building on Robeco’s
long-standing expertise in this area.
The above also implies that Robeco will increasingly offer
investment solutions, in addition to investment products.
Robeco will stay committed to both the institutional and
retail markets, aiming to further increase the relative share
of institutional assets under management.
The second spearhead of Robeco’s strategy is to restructure
and develop the organization, thus improving cooperation,
management, control and effectiveness and ultimately
increasing added value for our clients. Spearhead number
05 35

53Corporate Statements 2009
three is to increase efficiency. Robeco will further reduce its
fixed costs, especially IT and back-office costs, in order to
lift profitability to a healthy and sustainable level. Making
choices and improving effectiveness and efficiency will
reduce overall costs at a corporate level by EUR 75 million
from current levels by 2014.
The fourth spearhead is to expand the synergy with
Robeco’s parent company Rabobank significantly. Robeco
and Rabobank will increasingly join forces in terms of
business development, both in the Netherlands and
internationally, both in the retail and institutional markets.
Robeco will also maximize its use of Rabobank’s expertise
in the area of food & agribusiness, enabling our clients to
invest in agriculture and the food industry, one of the major
themes for the coming decades.
Disciplined implementation of these four elements will
translate into growth and create a stronger Robeco profile
in the market, which is spearhead number five. We are
well aware that this can only be realized if we consistently
think and act in the best interests of our clients, within
the framework of a profitable investment-management
company.
Rotterdam, 8 April 2010
The Management Board
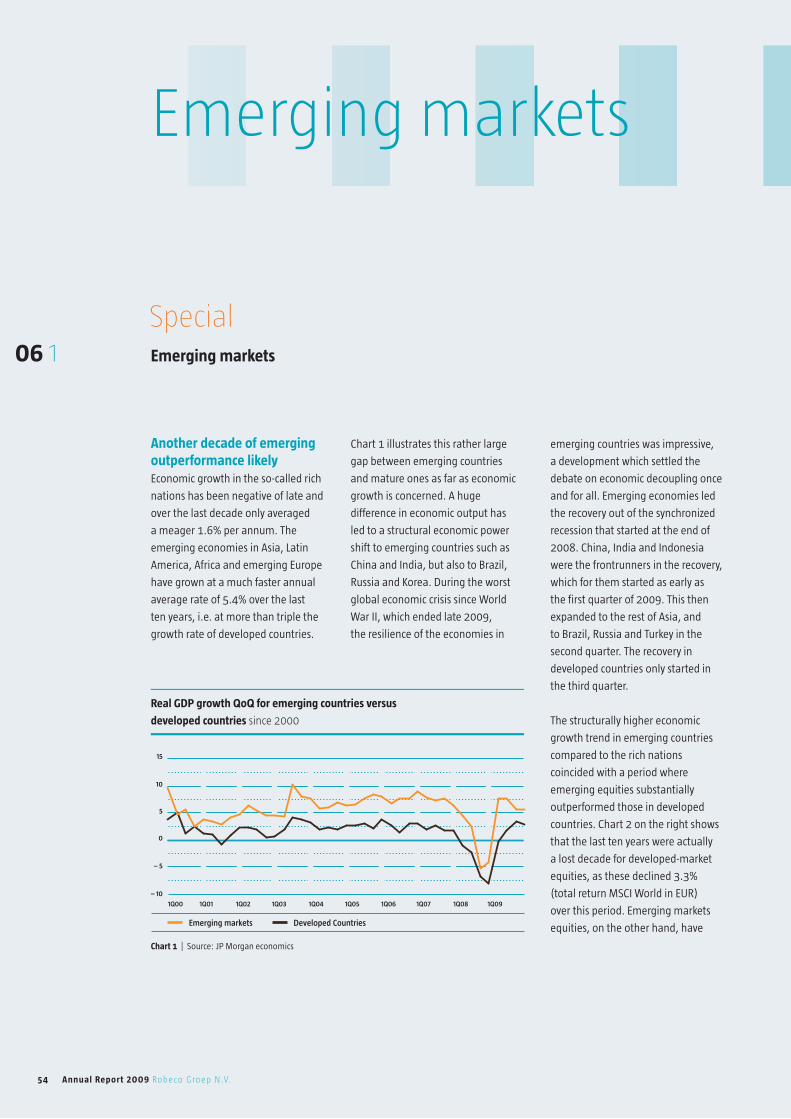
06 1
Another decade of emerging outperformance likelyEconomic growth in the so-called rich
nations has been negative of late and
over the last decade only averaged
a meager 1.6% per annum. The
emerging economies in Asia, Latin
America, Africa and emerging Europe
have grown at a much faster annual
average rate of 5.4% over the last
ten years, i.e. at more than triple the
growth rate of developed countries.
Chart 1 illustrates this rather large
gap between emerging countries
and mature ones as far as economic
growth is concerned. A huge
difference in economic output has
led to a structural economic power
shift to emerging countries such as
China and India, but also to Brazil,
Russia and Korea. During the worst
global economic crisis since World
War II, which ended late 2009,
the resilience of the economies in
Real GDP growth QoQ for emerging countries versus
developed countries since 2000
1Q00 1Q01 1Q02 1Q03 1Q04 1Q05 1Q06 1Q07 1Q08 1Q09
15
10
5
– 10
– 5
0
Emerging markets Developed Countries
Chart 1 | Source: JP Morgan economics
emerging countries was impressive,
a development which settled the
debate on economic decoupling once
and for all. Emerging economies led
the recovery out of the synchronized
recession that started at the end of
2008. China, India and Indonesia
were the frontrunners in the recovery,
which for them started as early as
the first quarter of 2009. This then
expanded to the rest of Asia, and
to Brazil, Russia and Turkey in the
second quarter. The recovery in
developed countries only started in
the third quarter.
The structurally higher economic
growth trend in emerging countries
compared to the rich nations
coincided with a period where
emerging equities substantially
outperformed those in developed
countries. Chart 2 on the right shows
that the last ten years were actually
a lost decade for developed-market
equities, as these declined 3.3%
(total return MSCI World in EUR)
over this period. Emerging markets
equities, on the other hand, have
SpecialEmerging markets
Emerging markets
54 Annual Report 2009 Robeco Groep N.V.

risen an annualized 7.0% over the
last 10 years (total return MSCI EM
in EUR). This is more than a ten
percentage point difference every
year from 2000 to 2009.
We argue that over the next decade,
on average, emerging markets will
again outperform mature markets.
There are five main arguments as to
why emerging-country equities will
continue to achieve superior equity
returns.
1. The higher economic growth
figures in emerging countries
will most likely persist. Higher
economic growth does not
automatically lead to higher
equity returns, but does boost the
profitability of listed companies
as they operate in a high-growth
environment.
2. Stronger macroeconomic
Performance of MSCI EM and MSCI World
since 2000
2000 2001 2002 2003 2004 2005 2006 2007 2008 2009
250
250
200
150
0
50
100
MSCI EM MSCI World
Mar 08: DM low
Mar 08: DM low
Chart 2 | Source: MSCI, Datastream
fundamentals such as healthier
balance sheets at government
level lessen sovereign risk. Some
of the larger emerging countries
enjoy substantial current-account
surpluses. Furthermore, the vast
majority of foreign-exchange
reserves worldwide are located
in emerging countries. Their
monetary mountains enable
these countries to finance the
large budget deficit of the
United States, for example.
These massive financial buffers
also mean that in years when
the economy is weaker, the
authorities have ample room
to implement stimulus policies.
China for instance has over USD
2,500 billion in its coffers. Last
year the Chinese injected USD
500 billion (one fifth of their total
reserves) into their economy.
This was one of the catalysts for
recovery in the global financial
markets.
3. The ability of emerging countries
to convert higher economic
growth figures into superior
Emerging markets
55Corporate Statements 2009

56 Annual Report 2009 Robeco Groep N.V.
06 3
Special – Emerging markets
earnings growth has improved
substantially since the end of
the nineties. The management
teams of many emerging-market
companies are very capable of
increasing their company’s global
market share and simultaneously
improving operating margins.
This means that the ability to
increase shareholder value is no
longer exclusively restricted to
western companies.
Corporate balance sheets
in emerging countries are in
better shape than those in
mature markets, which reduces
companies’ interest burdens and,
therefore, also improves their
earnings outlook (see Chart 3).
4. Improvements in transparency
in terms of corporate reporting
methodology and increased focus
on sustainability will attract even
the more risk-averse investors.
Many emerging companies
already report according to IFRS
Corporate net debt-to-equity ratio since 1992
1992 1994 1996 1998 2000 2002 2004 2006 2008 2010
80
90
70
60
0
40
50
30
10
20
Emerging Markets Developed Markets
Chart 3 | Source: MSCI, Datastream
and are therefore more or less
in line with western companies
in terms of the reporting and
accounting standards they
apply. In addition, an increasing
number of managers working
in emerging-market companies
are being educated at the same
universities as their western
peers. This does not necessarily
prevent fraud and corruption
as this still also occurs in the
developed world, for example,
in cases such as those involving
Ahold, Enron and Worldcom.
It does, however, remove the
argument for discounted equity
valuations for emerging-market
stocks and means that price-
earnings multiples in emerging
markets should more or less
trade on a par with those in
developed markets.
5. The flow of funds is very much
in favor of emerging markets
equities. The weight of emerging
markets in the MSCI All Country
World index now amounts to
13%, up from 5% ten years ago,
56 Annual Report 2009 Robeco Groep N.V.

57Corporate Statements 2009
as illustrated in Chart 4
Most large institutional investors in
the world are still underweight in
terms of asset allocation to emerging
equities. In the coming years, many
initial public offerings (IPOs) will
occur in Asia, Latin America, Africa
and emerging Europe. In Brazil, China
and India, listings of new companies
totaling hundreds of billions of
dollars in value will take place.
Eventually most of these new listings
will be included in the global equity
indices, leading to an increased
weight for emerging markets.
As most of the largest institutional
investors follow global benchmarks in
some way, they will be forced to shift
substantial additional funds from
their asset allocation into emerging
stock markets, even just to remain
neutrally positioned in emerging-
market equities.
The next decade will be a time
when emerging countries continue
to play catch-up with developed
countries in many areas. China
and India will move up the ladder
to take their places in the top five
largest economies in the world.
Since the end of 2009, China has
replaced Germany as the world’s
largest exporting nation. In 2010,
the Chinese economy will surpass
that of Japan to become the largest
economy in the world after the
United States.
The robust economic outlook
and high earnings growth in the
emerging equity markets mean
that they are likely to outperform
their developed peers for the
coming decade as well. Following
a decade when people discovered
the emerging-equity markets, in the
next decade increasing evidence will
emerge of the leading role they are to
play in the global portfolios of every
type of investor.
Corporate Statements 2009 57
Weight of MSCI EM in MSCI AC World
2000 2001 2002 2003 2004 2005 2006 2007 2008 2009
10
12
14
8
6
0
2
4
Emerging markets
Chart 4 | Source: MSCI, Datastream
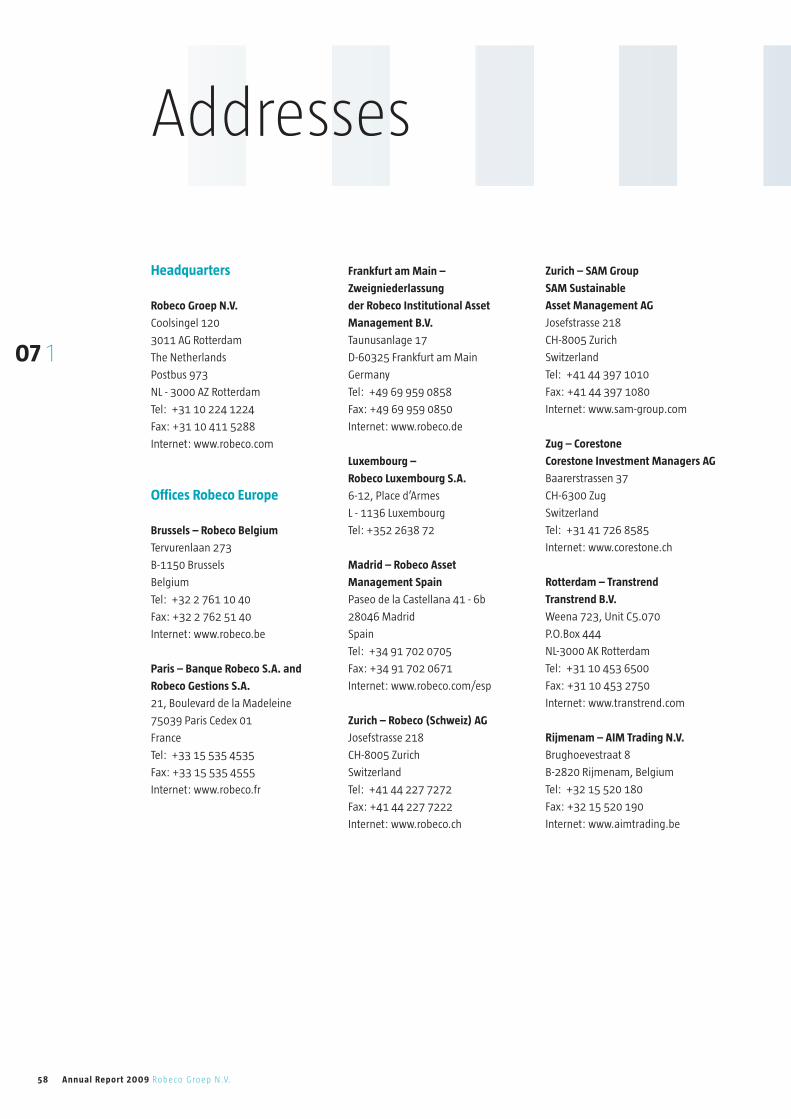
58 Annual Report 2009 Robeco Groep N.V.
07 1
Headquarters
Robeco Groep N.V.
Coolsingel 120
3011 AG Rotterdam
The Netherlands
Postbus 973
NL - 3000 AZ Rotterdam
Tel: +31 10 224 1224
Fax: +31 10 411 5288
Internet: www.robeco.com
Offices Robeco Europe
Brussels – Robeco Belgium
Tervurenlaan 273
B-1150 Brussels
Belgium
Tel: +32 2 761 10 40
Fax: +32 2 762 51 40
Internet: www.robeco.be
Paris – Banque Robeco S.A. and
Robeco Gestions S.A.
21, Boulevard de la Madeleine
75039 Paris Cedex 01
France
Tel: +33 15 535 4535
Fax: +33 15 535 4555
Internet: www.robeco.fr
Frankfurt am Main –
Zweigniederlassung
der Robeco Institutional Asset
Management B.V.
Taunusanlage 17
D-60325 Frankfurt am Main
Germany
Tel: +49 69 959 0858
Fax: +49 69 959 0850
Internet: www.robeco.de
Luxembourg –
Robeco Luxembourg S.A.
6-12, Place d’Armes
L - 1136 Luxembourg
Tel: +352 2638 72
Madrid – Robeco Asset
Management Spain
Paseo de la Castellana 41 - 6b
28046 Madrid
Spain
Tel: +34 91 702 0705
Fax: +34 91 702 0671
Internet: www.robeco.com/esp
Zurich – Robeco (Schweiz) AG
Josefstrasse 218
CH-8005 Zurich
Switzerland
Tel: +41 44 227 7272
Fax: +41 44 227 7222
Internet: www.robeco.ch
Zurich – SAM Group
SAM Sustainable
Asset Management AG
Josefstrasse 218
CH-8005 Zurich
Switzerland
Tel: +41 44 397 1010
Fax: +41 44 397 1080
Internet: www.sam-group.com
Zug – Corestone
Corestone Investment Managers AG
Baarerstrassen 37
CH-6300 Zug
Switzerland
Tel: +31 41 726 8585
Internet: www.corestone.ch
Rotterdam – Transtrend
Transtrend B.V.
Weena 723, Unit C5.070
P.O.Box 444
NL-3000 AK Rotterdam
Tel: +31 10 453 6500
Fax: +31 10 453 2750
Internet: www.transtrend.com
Rijmenam – AIM Trading N.V.
Brughoevestraat 8
B-2820 Rijmenam, Belgium
Tel: +32 15 520 180
Fax: +32 15 520 190
Internet: www.aimtrading.be
Addresses

59Corporate Statements 2009
Offices Robeco USA
Harbor Capital Advisors Inc.
Chicago
111 South Wacker Drive, 34th floor
Chicago, IL 60606
United States
Tel: +1 800 422 1050
Internet: www.harborfunds.com
Boston
33 Arch Street, Suite 2001
Boston, MA 02110
United States
Tel: +1 800 422 1050
Robeco Investment
Management (RIM)
Boston
28 State Street, 21st floor
Boston, MA 02109
United States
Tel: +1 617 832 8200
Fax: +1 617 832 8222
Internet: www.robecoinvest.com
New York
909, Third Avenue, 32st floor
New York, NY 10022
United States
Tel: +1 212 908 9576
Fax: +1 212 908 9672
Internet: www.robecoinvest.com
Sage Capital
909, Third Avenue, 31st floor
New York, NY 10022
United States
Tel: +1 212 908 9660
Internet: www.robecoinvest.com
Other
Robeco Middle-East
Robeco Institutional Asset
Management B.V. – Bahrain
Representative Office
The world trade center,
West tower
35th Floor
P.O. Box 1552
Manama
Kingdom of Bahrain
Tel: +973 17 517 820
Fax: +973 17 131 068
Robeco Japan
Robeco Institutional Asset
Management B.V. Japan Branch
Tokyo Sankei Building 16F
1-7-2 Otemachi, Chiyoda-ku
Tokyo 100-0004
Japan
Tel: +81 3 5200 8222
Fax: +81 3 5200 8229
Robeco Shanghai
Robeco Institutional Asset
Management B.V. – Shanghai
Representative Office
18F, HSBC Tower, room 42
1000 Lujiazui Ring Road
Pudong New Area
Shanghai 200120, PRC
Tel: +86 21 6841 2668
Fax: +86 21 6841 2608
Robeco Korea
Robeco Institutional Asset
Management B.V. – Korea
Representative Office
21/F Seoul Finance Center
84 Taepyungro 1-ga, Jung-gu
Seoul 100-768, Korea
Tel: +82 2 3782 4694
Fax: +82 23782 4697
Robeco India
Canara Robeco Asset
Management Company Ltd.
Construction House, 4th Floor,
5, Walchand Hirachand Marg,
Ballard Estate,
Mumbai, India
Tel: +91-022-6658 5000
Fax: +91-022-6658 5011/5012/5013
Internet: www.canararobeco.com
Robeco Hong Kong
Robeco Hong Kong Ltd.
Unit 4912-13, 49/F The Center
99, Queen’s Road Central
Central, Hong Kong
Tel: +852 3719 7400
Robeco Singapore
Robeco Hong Kong Ltd.
Singapore Branch
77 Robinson Road #09-00
Singapore 068896
Tel: +65 6513 3320
Robeco Taiwan Ltd.
Room 3, Floor 2, no 77,
Section 2, Dunhua South Road
Taipei City 10682
Taiwan
Tel: +886 2 2708 7171
Fax: +886 2 2708 7571
Addresses


Financial Statements 2009
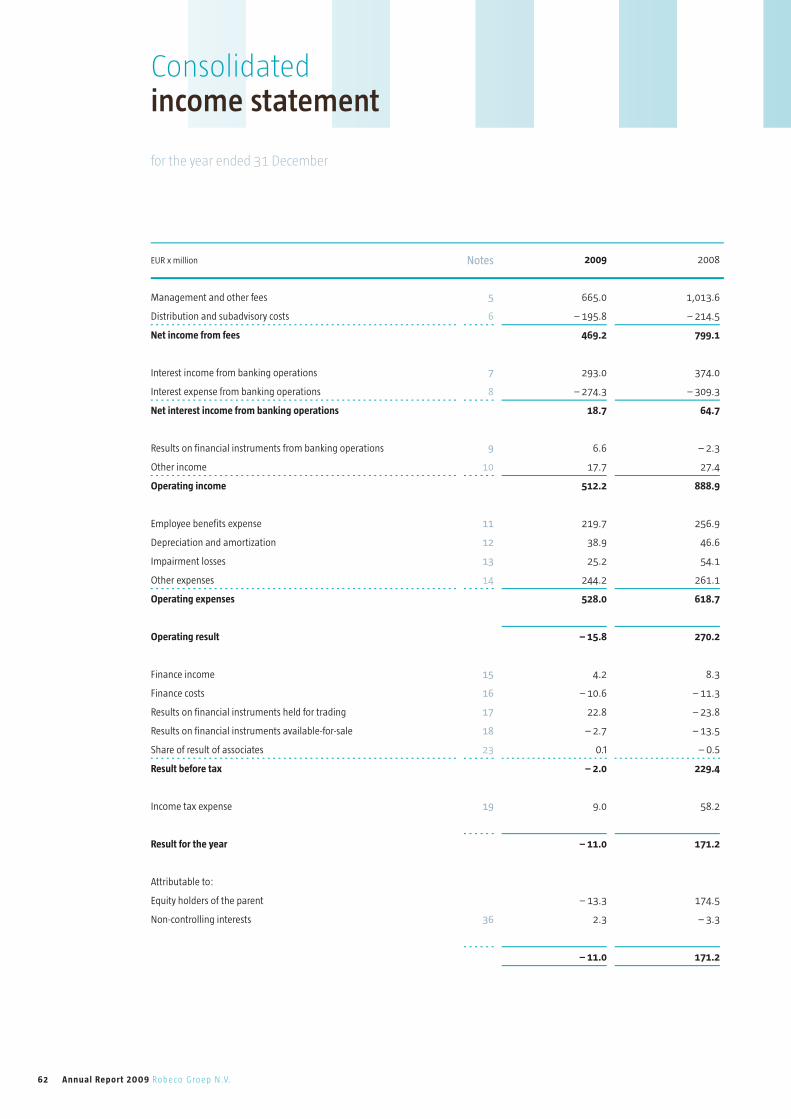
62 Annual Report 2009 Robeco Groep N.V.
Consolidatedincome statement
for the year ended 31 December
EUR x million Notes 2009 2008
Management and other fees 5 665.0 1,013.6
Distribution and subadvisory costs 6 – 195.8 – 214.5
Net income from fees 469.2 799.1
Interest income from banking operations 7 293.0 374.0
Interest expense from banking operations 8 – 274.3 – 309.3
Net interest income from banking operations 18.7 64.7
Results on financial instruments from banking operations 9 6.6 – 2.3
Other income 10 17.7 27.4
Operating income 512.2 888.9
Employee benefits expense 11 219.7 256.9
Depreciation and amortization 12 38.9 46.6
Impairment losses 13 25.2 54.1
Other expenses 14 244.2 261.1
Operating expenses 528.0 618.7
Operating result – 15.8 270.2
Finance income 15 4.2 8.3
Finance costs 16 – 10.6 – 11.3
Results on financial instruments held for trading 17 22.8 – 23.8
Results on financial instruments available-for-sale 18 – 2.7 – 13.5
Share of result of associates 23 0.1 – 0.5
Result before tax – 2.0 229.4
Income tax expense 19 9.0 58.2
Result for the year – 11.0 171.2
Attributable to:
Equity holders of the parent – 13.3 174.5
Non-controlling interests 36 2.3 – 3.3
– 11.0 171.2

63Financial Statement 2009
for the year ended 31 December
EUR x million 2009 2008
Result for the year – 11.0 171.2
Other comprehensive income
Net unrealized results on financial assets available-for-sale 83.5 – 228.6
Realized gains and losses on financial assets available-for-sale reclassified
to the income statement on disposal 2.5 0.8
Impairment of financial assets available-for-sale 28.6 68.2
Income tax effect – 29.5 39.0
85.1 – 120.6
Net result on hedge of net investments 5.1 – 10.3
5.1 – 10.3
Exchange differences on translation of foreign operations – 8.6 24.8
Other items – 0.1 – 14.6
Other comprehensive income for the year, net of tax 81.5 – 120.7
Total comprehensive income for the year, net of tax 70.5 50.5
Attributable to:
Equity holders of the parent 68.2 53.8
Non-controlling interests 2.3 – 3.3
70.5 50.5
Consolidatedstatement of comprehensive income
for the year ended 31 December
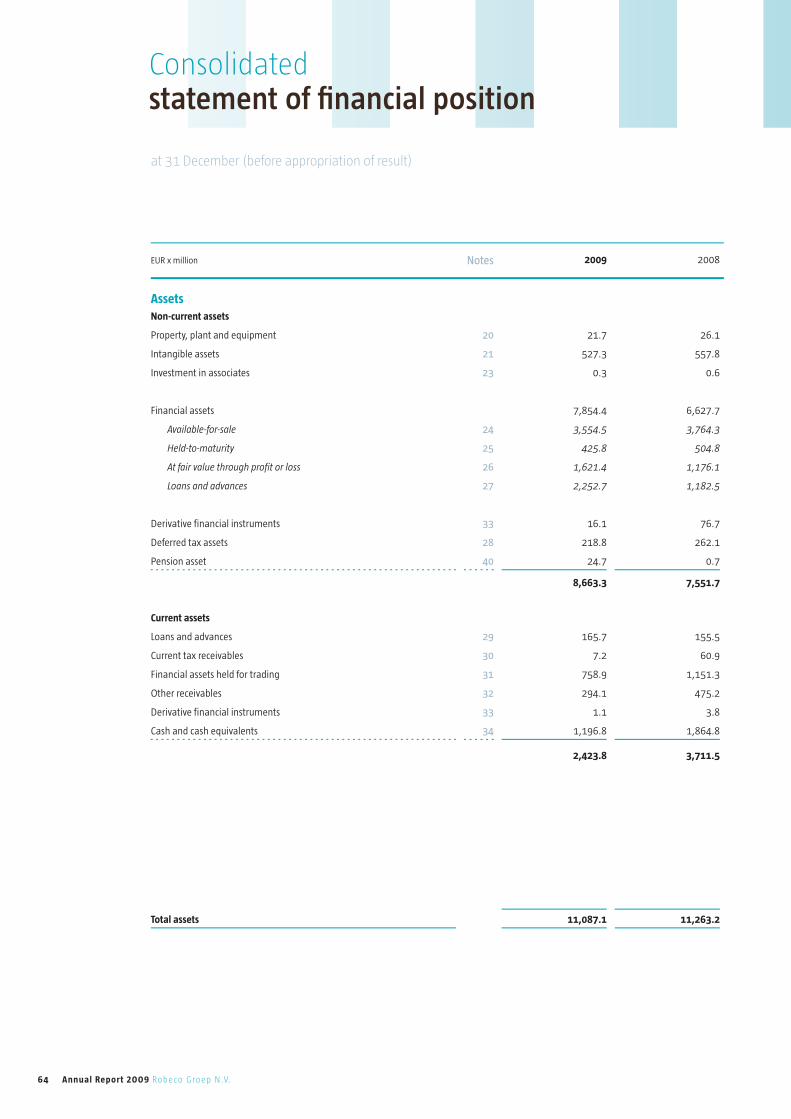
64 Annual Report 2009 Robeco Groep N.V.
EUR x million Notes 2009 2008
Assets Non-current assets
Property, plant and equipment 20 21.7 26.1
Intangible assets 21 527.3 557.8
Investment in associates 23 0.3 0.6
Financial assets 7,854.4 6,627.7
Available-for-sale 24 3,554.5 3,764.3
Held-to-maturity 25 425.8 504.8
At fair value through profit or loss 26 1,621.4 1,176.1
Loans and advances 27 2,252.7 1,182.5
Derivative financial instruments 33 16.1 76.7
Deferred tax assets 28 218.8 262.1
Pension asset 40 24.7 0.7
8,663.3 7,551.7
Current assets
Loans and advances 29 165.7 155.5
Current tax receivables 30 7.2 60.9
Financial assets held for trading 31 758.9 1,151.3
Other receivables 32 294.1 475.2
Derivative financial instruments 33 1.1 3.8
Cash and cash equivalents 34 1,196.8 1,864.8
2,423.8 3,711.5
Total assets 11,087.1 11,263.2
Consolidatedstatement of fi nancial position
at 31 December (before appropriation of result)

65Financial Statement 2009
EUR x million Notes 2009 2008
Equity and liabilitiesEquity attributable to equity holders of the parent 35
Issued capital 4.5 4.5
Share premium 1,119.5 1,119.5
Available-for-sale reserve – 75.4 – 160.5
Foreign currency translation reserve – 9.8 – 6.3
Other revaluation reserve 51.9 62.0
Retained earnings 276.0 279.3
1,366.7 1,298.5
Non-controlling interests 36 16.7 20.1
Total equity 1,383.4 1,318.6
Non-current liabilities
Subordinated loans 37 37.7 37.7
Other interest-bearing loans and borrowings 38 199.3 206.1
Provisions 39 2.9 8.9
Employe benefit liability 40 15.4 40.8
Deferred tax liabilities 28 66.4 78.0
Total return swaps 44 243.4 620.2
Other derivative financial instruments 33 134.1 79.4
Other non-current liabilities 41 1.3 2.8
700.5 1,073.9
Current liabilities
Interest-bearing loans due to customers 42 7,143.5 7,527.0
Interest-bearing loans due to banks 43 1,061.9 684.2
Other derivative financial instruments 33 2.0 11.0
Current tax payable 30 25.3 2.9
Provisions 39 3.8 4.7
Trade and other payables 45 766.7 640.9
9,003.2 8,870.7
Total liabilities 9,703.7 9,944.6
Total equity and liabilities 11,087.1 11,263.2
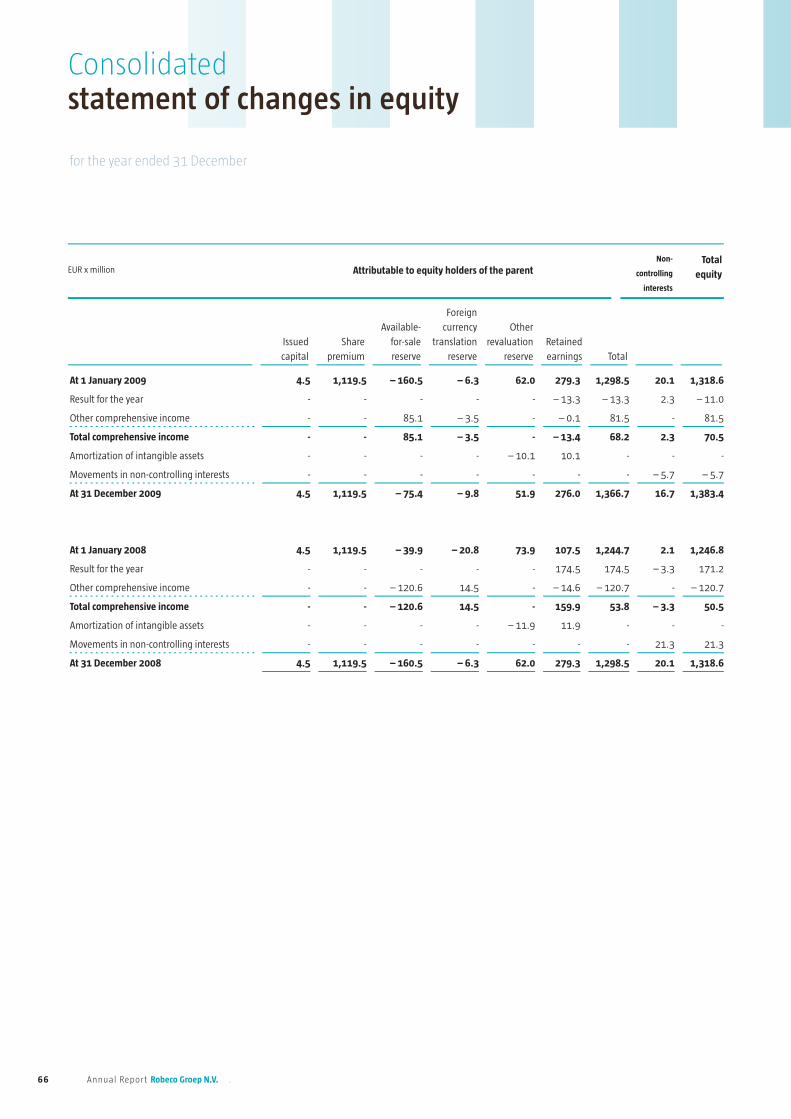
66 Annual Report 2009 Robeco Groep N.V.
EUR x million Attributable to equity holders of the parentNon-
controlling
interests
Total
equity
Issued
capital
Share
premium
Available-
for-sale
reserve
Foreign
currency
translation
reserve
Other
revaluation
reserve
Retained
earnings Total
Consolidatedstatement of changes in equity
for the year ended 31 December
66 Annual Repor t Robeco Groep N.V.
At 1 January 2009 4.5 1,119.5 – 160.5 – 6.3 62.0 279.3 1,298.5 20.1 1,318.6
Result for the year - - - - - – 13.3 – 13.3 2.3 – 11.0
Other comprehensive income - - 85.1 – 3.5 - – 0.1 81.5 - 81.5
Total comprehensive income - - 85.1 – 3.5 - – 13.4 68.2 2.3 70.5
Amortization of intangible assets - - - - – 10.1 10.1 - - -
Movements in non-controlling interests - - - - - - - – 5.7 – 5.7
At 31 December 2009 4.5 1,119.5 – 75.4 – 9.8 51.9 276.0 1,366.7 16.7 1,383.4
At 1 January 2008 4.5 1,119.5 – 39.9 – 20.8 73.9 107.5 1,244.7 2.1 1,246.8
Result for the year - - - - - 174.5 174.5 – 3.3 171.2
Other comprehensive income - - – 120.6 14.5 - – 14.6 – 120.7 - – 120.7
Total comprehensive income - - – 120.6 14.5 - 159.9 53.8 – 3.3 50.5
Amortization of intangible assets - - - - – 11.9 11.9 - - -
Movements in non-controlling interests - - - - - - - 21.3 21.3
At 31 December 2008 4.5 1,119.5 – 160.5 – 6.3 62.0 279.3 1,298.5 20.1 1,318.6
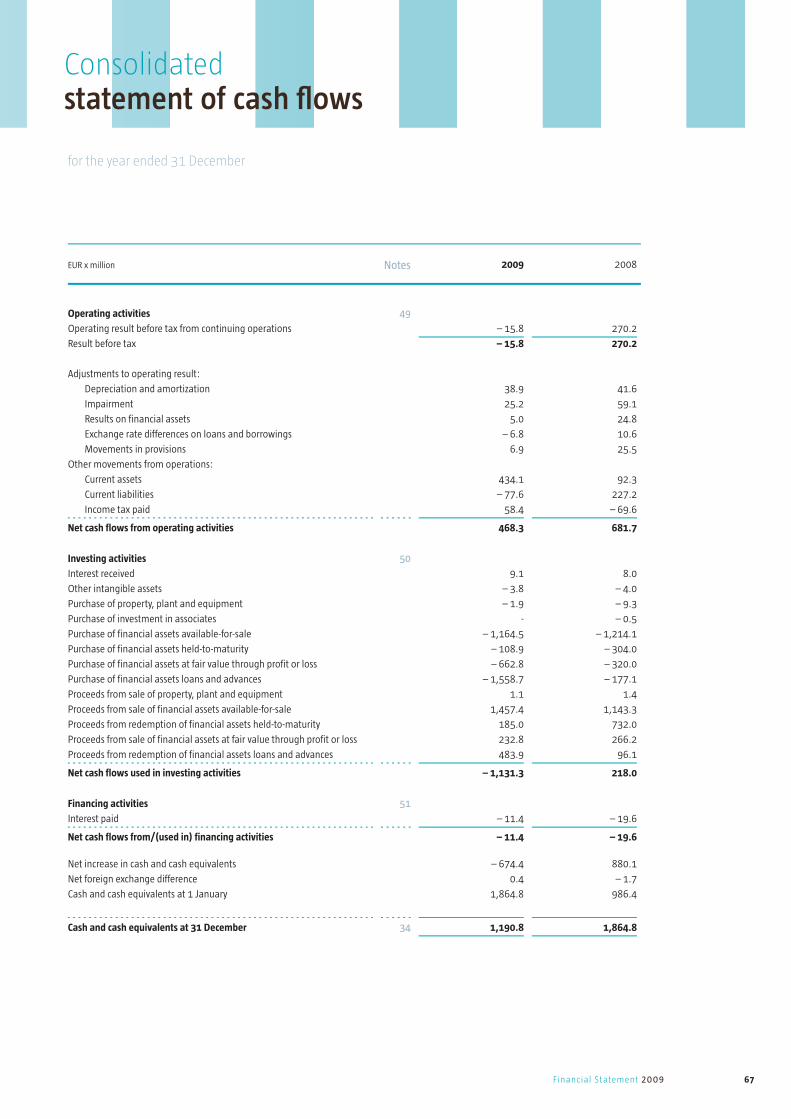
67Financial Statement 2009
EUR x million Notes 2009 2008
Operating activities 49
Operating result before tax from continuing operations – 15.8 270.2
Result before tax – 15.8 270.2
Adjustments to operating result:
Depreciation and amortization 38.9 41.6
Impairment 25.2 59.1
Results on financial assets 5.0 24.8
Exchange rate differences on loans and borrowings – 6.8 10.6
Movements in provisions 6.9 25.5
Other movements from operations:
Current assets 434.1 92.3
Current liabilities – 77.6 227.2
Income tax paid 58.4 – 69.6
Net cash flows from operating activities 468.3 681.7
Investing activities 50
Interest received 9.1 8.0
Other intangible assets – 3.8 – 4.0
Purchase of property, plant and equipment – 1.9 – 9.3
Purchase of investment in associates - – 0.5
Purchase of financial assets available-for-sale – 1,164.5 – 1,214.1
Purchase of financial assets held-to-maturity – 108.9 – 304.0
Purchase of financial assets at fair value through profit or loss – 662.8 – 320.0
Purchase of financial assets loans and advances – 1,558.7 – 177.1
Proceeds from sale of property, plant and equipment 1.1 1.4
Proceeds from sale of financial assets available-for-sale 1,457.4 1,143.3
Proceeds from redemption of financial assets held-to-maturity 185.0 732.0
Proceeds from sale of financial assets at fair value through profit or loss 232.8 266.2
Proceeds from redemption of financial assets loans and advances 483.9 96.1
Net cash flows used in investing activities – 1,131.3 218.0
Financing activities 51
Interest paid – 11.4 – 19.6
Net cash flows from/(used in) financing activities – 11.4 – 19.6
Net increase in cash and cash equivalents – 674.4 880.1
Net foreign exchange difference 0.4 – 1.7
Cash and cash equivalents at 1 January 1,864.8 986.4
Cash and cash equivalents at 31 December 34 1,190.8 1,864.8
Consolidatedstatement of cash fl ows
for the year ended 31 December
Financial Statement 2009
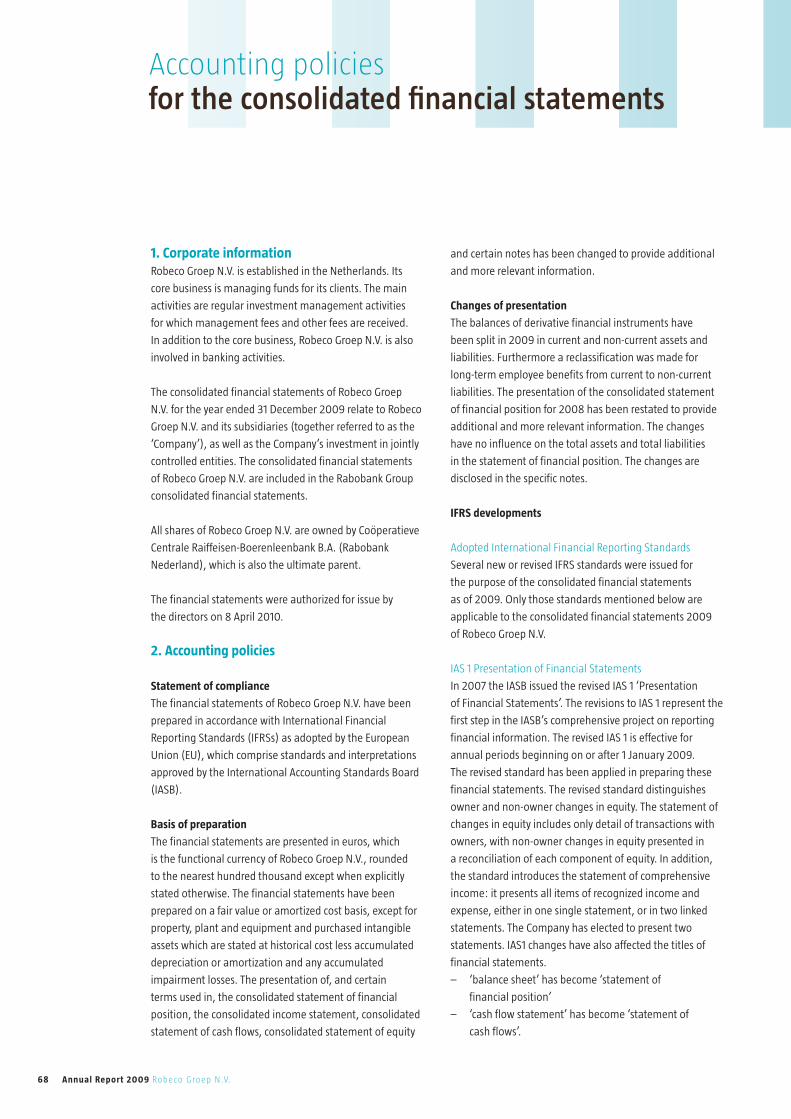
68 Annual Report 2009 Robeco Groep N.V.
1. Corporate informationRobeco Groep N.V. is established in the Netherlands. Its
core business is managing funds for its clients. The main
activities are regular investment management activities
for which management fees and other fees are received.
In addition to the core business, Robeco Groep N.V. is also
involved in banking activities.
The consolidated financial statements of Robeco Groep
N.V. for the year ended 31 December 2009 relate to Robeco
Groep N.V. and its subsidiaries (together referred to as the
‘Company’), as well as the Company’s investment in jointly
controlled entities. The consolidated financial statements
of Robeco Groep N.V. are included in the Rabobank Group
consolidated financial statements.
All shares of Robeco Groep N.V. are owned by Coöperatieve
Centrale Raiffeisen-Boerenleenbank B.A. (Rabobank
Nederland), which is also the ultimate parent.
The financial statements were authorized for issue by
the directors on 8 April 2010.
2. Accounting policies
Statement of compliance
The financial statements of Robeco Groep N.V. have been
prepared in accordance with International Financial
Reporting Standards (IFRSs) as adopted by the European
Union (EU), which comprise standards and interpretations
approved by the International Accounting Standards Board
(IASB).
Basis of preparation
The financial statements are presented in euros, which
is the functional currency of Robeco Groep N.V., rounded
to the nearest hundred thousand except when explicitly
stated otherwise. The financial statements have been
prepared on a fair value or amortized cost basis, except for
property, plant and equipment and purchased intangible
assets which are stated at historical cost less accumulated
depreciation or amortization and any accumulated
impairment losses. The presentation of, and certain
terms used in, the consolidated statement of financial
position, the consolidated income statement, consolidated
statement of cash flows, consolidated statement of equity
and certain notes has been changed to provide additional
and more relevant information.
Changes of presentation
The balances of derivative financial instruments have
been split in 2009 in current and non-current assets and
liabilities. Furthermore a reclassification was made for
long-term employee benefits from current to non-current
liabilities. The presentation of the consolidated statement
of financial position for 2008 has been restated to provide
additional and more relevant information. The changes
have no influence on the total assets and total liabilities
in the statement of financial position. The changes are
disclosed in the specific notes.
IFRS developments
Adopted International Financial Reporting Standards
Several new or revised IFRS standards were issued for
the purpose of the consolidated financial statements
as of 2009. Only those standards mentioned below are
applicable to the consolidated financial statements 2009
of Robeco Groep N.V.
IAS 1 Presentation of Financial Statements
In 2007 the IASB issued the revised IAS 1 ‘Presentation
of Financial Statements’. The revisions to IAS 1 represent the
first step in the IASB’s comprehensive project on reporting
financial information. The revised IAS 1 is effective for
annual periods beginning on or after 1 January 2009.
The revised standard has been applied in preparing these
financial statements. The revised standard distinguishes
owner and non-owner changes in equity. The statement of
changes in equity includes only detail of transactions with
owners, with non-owner changes in equity presented in
a reconciliation of each component of equity. In addition,
the standard introduces the statement of comprehensive
income: it presents all items of recognized income and
expense, either in one single statement, or in two linked
statements. The Company has elected to present two
statements. IAS1 changes have also affected the titles of
financial statements.
– ‘balance sheet’ has become ‘statement of
financial position’
– ‘cash flow statement’ has become ‘statement of
cash flows’.
Accounting policiesfor the consolidated fi nancial statements
69Financial Statement 2009
Also IAS 1 revised also introduced the following word
changes that are reflected in the financial statements
and the notes:
– ‘balance sheet date’ has been changed to
‘reporting date’
– ‘reporting date’ has been changed to
‘end of reporting period’
– ‘minority interest’ has been changed to
‘non-controlling interest’.
IFRS 2 Share-based payments – vesting conditions
and cancellations
This amendment to IFRS 2 was issued in January 2008
and is effective for annual periods beginning on or after
1 January 2009. The amendment clarifies the definition
of a vesting condition and prescribes the treatment of an
award that is effectively cancelled because a non-vesting
condition is not satisfied. It did not have an impact on
the financial position or performance of the Company.
IFRS 7 Financial Instruments Disclosures
The amended standard requires additional disclosures of
fair value measurement and liquidity risk and is effective for
annual periods beginning on or after 1 January 2009. Fair
value measurements related to items recorded at fair value
are to be disclosed by source of inputs using a three level
fair value hierarchy, by class, for all financial instruments
recognized at fair value. In addition, a reconciliation
between the opening and closing balance for level-3 fair
value measurements is required, as well as significant
transfers between levels in the fair value hierarchy.
The amendments also clarify the requirements for liquidity
risk disclosures with respect to derivative transactions
and assets used for liquidity management. The fair value
measurement and liquidity risk disclosures are presented in
note 47 Financial risk management objectives and policies.
IFRS 8 Operating Segments
IFRS 8 Operating Segments, which specifies how an
entity should report information about its operating
segments, was issued in November 2006 and is effective
for annual periods beginning on or after 1 January 2009.
IFRS 8 applies to the separate or individual (consolidated)
financial statements of an entity:
– whose debt or equity instruments are traded in a public
market; or
– that files, or is in the process of filing, its (consolidated)
financial statements with a securities commission or
other regulatory organization for the purpose of issuing
any class of instruments in a public market.
Robeco Groep N.V. does not meet abovementioned criteria
and therefore has not applied IFRS 8 in these financial
statements.
IAS 16 Property, Plant and Equipment
In the amendment to IAS 16 Property, Plant and Equipment
the term ‘net selling price’ has been replaced by ‘fair value
less costs to sell’ in the definition of recoverable amount.
The Company amended its accounting policy accordingly,
which did not result in any change in the financial position.
Future IFRS developments
Of all future IFRS developments, only those mentioned
below are considered to be applicable to the financial
statements of Robeco Groep N.V.
IFRS 3 Revised Business Combinations
IFRS 3 Revised business combinations was issued in
January 2008 in combination with IAS 27 and will apply to
business combinations for which the acquisition date is on
or after the beginning of the first annual reporting period
beginning on or after 1 July 2009. Amongst other changes,
the new standard will require recognition of subsequent
changes in the fair value of contingent consideration in
the income statement rather than against goodwill, and
transaction costs to be recognized immediately in the
income statement. Fair value gains or losses on existing
investments in an acquired company will be recognized
in the income statement at the date of acquisition. This
statement will affect future business combinations and as
a consequence this standard will not impact the business
combinations currently recorded in the Company’s financial
statements.
IFRS 9 Classification and measurement,
first phase of the IAS 39 replacement project
In this IFRS standard, which was published in July 2009,
a reduction is made in the categories of financial assets
and liabilities. This standard has not yet been adopted by
the EU and will be effective for annual periods beginning on
or after 1 January 2013. Earlier adoption is permitted.

70 Annual Report 2009 Robeco Groep N.V.
Interest in investment funds
Interests in investment funds managed by the Company
are recognized as equity securities and stated at fair value.
Depending on the IFRS classification the gains and losses
are taken to the statement of comprehensive income or
the income statement. For interests in investment funds
for which the IFRS control criteria are met, the Company
consolidates the underlying interests in full.
Basis of consolidation
The consolidated financial statements include Robeco
Groep N.V., its subsidiaries and its joint ventures as at
31 December of each year. The financial statements of
the subsidiaries are prepared for the same reporting period
as the parent company, using consistent IFRS accounting
policies.
Subsidiaries
Subsidiaries are entities controlled by the Company.
Control exists when the Company has the power, directly
or indirectly, to govern the financial and operating
policies of an entity so as to obtain benefits from its
activities. In assessing control, potential voting rights that
are exercisable or convertible are taken into account to
determine if the Company holds more than 50% of
the voting rights.
The financial statements of the subsidiaries are included in
the consolidated financial statements from the date control
commences until the date control ceases. A complete list of
the subsidiaries is shown in the disclosure Related parties.
The subsidiaries are accounted for by integral consolidation
showing a non-controlling interest in the statement of
changes in equity.
Joint ventures
The Company’s interests in jointly controlled entities
are accounted for by proportionate consolidation. Under
this method the Company includes its share of the joint
ventures’ individual income and expenses, assets and
liabilities and cash flows in the relevant components of
the financial statements.
Transactions eliminated on consolidation
Intragroup balances, any unrealized gains or losses and
income and expenses arising from intragroup transactions,
are eliminated in preparing the consolidated financial
statements. Unrealized gains arising from transactions
with associates and jointly controlled entities are
eliminated in proportion to the Company’s interest in
the entity. Unrealized losses are eliminated in the same
way as unrealized gains, unless it provides an evidence of
impairment.
3. Significant accounting judgments, estimates and assumptionsThe preparation of financial statements in conformity
with IFRS requires the use of judgment and estimates that
affect the recognition and valuation of assets and liabilities,
the disclosure of contingent liabilities as of the date of
the financial statements and the reported amounts
of income and expenses during the reporting period.
Although these estimates are based on management’s
best knowledge of current events and actions, the actual
results may differ ultimately from these estimates.
The estimates and underlying assumptions are reviewed
on an ongoing basis. Revisions to accounting estimates are
recognized in the period in which the estimate is revised.
Judgments made by management in the application of
IFRS that might have a significant impact on the financial
statements are:
Goodwill and other identified intangibles
Goodwill arises on the acquisition of group companies,
joint ventures and associates, when the costs of acquisition
exceeds the fair value of the Company’s share of the
identifiable assets, liabilities and contingent liabilities
acquired. Goodwill related to associates is included in the
carrying amount of the associate. Annually the Company
performs a goodwill impairment test and assesses whether
there are indications of impairment of other identified
intangibles. Management judgment is involved for the
calculation of the values of the expected future cash flow,
the cost of capital and the value in use. See also note 4.15
Impairment testing of non financial assets for further
details.
Fair value of financial instruments
For financial assets classified as available-for-sale, financial
assets and liabilities classified as at fair value through
Accounting policies for the consolidated financial statements

71Financial Statement 2009
profit or loss and held for trading and derivative financial
instruments, determining the fair values is based on quoted
market prices where available. If no active market price
or rate is available, the fair values are estimated using
appropriate discounted cash-flow models and option
valuation models, using inputs based on market conditions
existing at the reporting dates. Some of the inputs to these
models may not be market observable and are therefore
estimated based on assumptions. For some financial
instruments the Company adjusts the latest valuation in
order to limit the time lag between moment of valuation
and availability of information at reporting dates by
assessing additional required information from underlying
independent fund managers. These valuation adjustments
are necessary and appropriate to fairly determine the
values of financial instruments carried at fair value on
the statement of financial position.
Impairment of financial instruments available-for-sale
The Company reviews its financial assets classified as
available-for-sale at each reporting date to assess whether
they are impaired. See also note 4.20 Impairment of
financial assets for further details.
Share-based payments
The Group measures the cost of cash-settled transactions
with employees by reference to the fair value of the equity
instruments at the date at which they are granted. For
the estimation of the fair value, the Company uses an
appropriate valuation formula for the grant of equity
instruments, which is dependent on the terms and conditions
of the grant. The assumptions used are disclosed in note 40.
Deferred tax asset
The Company tests annually whether the deferred tax
asset related to the capitalized and amortized goodwill of
several acquired entities for tax purposes is still appropriate.
To recognize the deferred tax asset in full, the future taxable
profit of the operations concerned has to be estimated.
At the moment of recognition the Company is satisfied that,
based on current assumptions regarding growth of business
and profitability, the relevant future tax benefits can be
realized within the obligatory legal timeframe.
For the subsidiaries in the US, the existence of a US-based
consolidated tax group contributes to the utilization of
potential losses.
Capitalized fees
For certain structured products the Company records
an asset in relation to structuring fees recognized upfront.
The Company recognizes part of the future management
fee upfront in the income statement for which upfront fees
to distributors and all costs relating to the structuring of
this type of products are also recognized. During the life of
the product the asset will be amortized against the actual
management fees received. Due to the structuring of the
products these upfront fees are guaranteed with a limited
residual risk. The Company regularly reviews the risk to
establish that the capitalized fees are recoverable. Regarding
certain private equity products some expenses have been
paid in advance. Those expenses are also capitalized and will
be amortized against the management fees received.
Pension benefits
The cost of defined benefit plans and the present value
of the pension asset are determined using actuarial
valuations. An actuarial valuation involves making various
assumptions. These include the determination of the
discount rate, future salary increases, mortality rates and
future pension increases. Owing to the complexity of
the valuation, the underlying assumptions and its long
term nature, a defined benefit obligation is highly sensitive
to changes in these assumptions. All assumptions are
reviewed at each reporting date. Further details about
the assumptions used are given in note 40 Pension asset
and employee benefit liability.
4. Summary of significant accounting policiesThe principal accounting policies adopted in the
preparation of these consolidated financial statements
are set out below. These accounting policies are applied
consistently in all periods presented in the consolidated
financial statements.
The Company presents its income statement using
a nature of expense view. This presentation gives a clear
insight in the profitability of its main activities.
4.1 Foreign currency translation
As stated before, the euro is the functional currency of
Robeco Groep N.V. Each entity of the Company determines
its own functional currency and items included in the
financial statements of each entity are measured using
that functional currency.

72 Annual Report 2009 Robeco Groep N.V.
Foreign currency
Monetary assets and liabilities denominated in foreign
currencies are translated into euros at the spot rates
prevailing at the reporting date.
Non-monetary items measured at historical cost in
a foreign currency are translated using the exchange rates
prevailing at the dates of the initial transactions. Non-
monetary items measured at fair value in a foreign currency
are translated using the exchange rates at the date when
the fair value was determined. Any goodwill arising on
the acquisition of a foreign operation is translated using
the exchange rates at the date when the fair value was
determined. Any fair value adjustments to the carrying
amounts of assets and liabilities arising on the acquisition
of a foreign operation are treated as assets and liabilities of
the foreign operation and are translated using the spot rate
prevailing at the reporting date.
Purchases and sales of securities are translated at the
exchange rates prevailing at the relevant transaction date.
The same applies to both income and expenses. Forward
transactions in foreign currencies for funds withdrawn and
settled are converted at the exchange rates at the closing
date. Other forward exchange transactions not settled at
the reporting date are valued at the forward rate for
the contract’s remaining term to maturity at closing date.
In general the exchange rate differences are taken to
the income statement.
Exchange rate differences on non-monetary items classified
as available-for-sale are taken to other comprehensive
income. Exchange rate differences for non-monetary items
classified as at fair value through profit or loss are taken to
the income statement.
Changes in the valuation of investments in foreign
operations are recorded in other comprehensive
income. Changes in the valuation of derivative financial
instruments, which are designated as a hedge against
the foreign operations currency risk, are also recorded in
other comprehensive income.
4.2 Management and other fees
Management and other fees include service fees,
performance fees, transaction fees, structuring fees and
securities lending commission. Fees are recognized when
the services have been performed and can be reliably
measured. Management and service fees are primarily
based on predetermined percentages of the market value
of the assets under management, including investment
performance and net subscriptions or redemptions.
Transaction fees are based on predetermined percentages of
transaction volumes. Performance fees are calculated as
a percentage of the performance of the relevant assets
under management and recorded when earned. Structuring
fees, technically locked in with limited risk, are recognized
and earned immediately after completion and distribution
of a product. Securities lending commissions are recognized
in the period in which the services are rendered.
4.3 Distribution and subadvisory costs
Distribution and subadvisory costs include trailer fees,
one-off distribution expenses and subadvisory costs
payable to third and related parties. Trailer fees, one-off
distribution expenses and subadvisory costs are recorded
when the services have been performed and can be reliably
measured. Trailer fees are primarily based on predetermined
percentages of the market values of the assets under
management of the investments, including investment
performance and net subscriptions or redemptions.
One-off distribution expenses are upfront fees to distributors
related to structured products. Subadvisory costs are paid
to third party asset managers. These costs are based on
predetermined percentages of the market values of
the average assets under management of the investments.
4.4 Interest income from banking operations
Interest income from banking operations consists of
the interest income generated by banking activities on
both the mortgage portfolios, the investment portfolio
and derivative financial instruments. Interest earned
on financial assets related to banking operations is also
reported as interest income from banking operations.
4.5 Interest expense from banking operations
Interest expense from banking operations mainly relates
to expenses incurred on entrusted funds from customers
and banks as well as gross interest expenses on derivative
financial instruments.
4.6 Results on financial instruments from
banking operations
The results on financial instruments from banking
Accounting policies for the consolidated financial statements
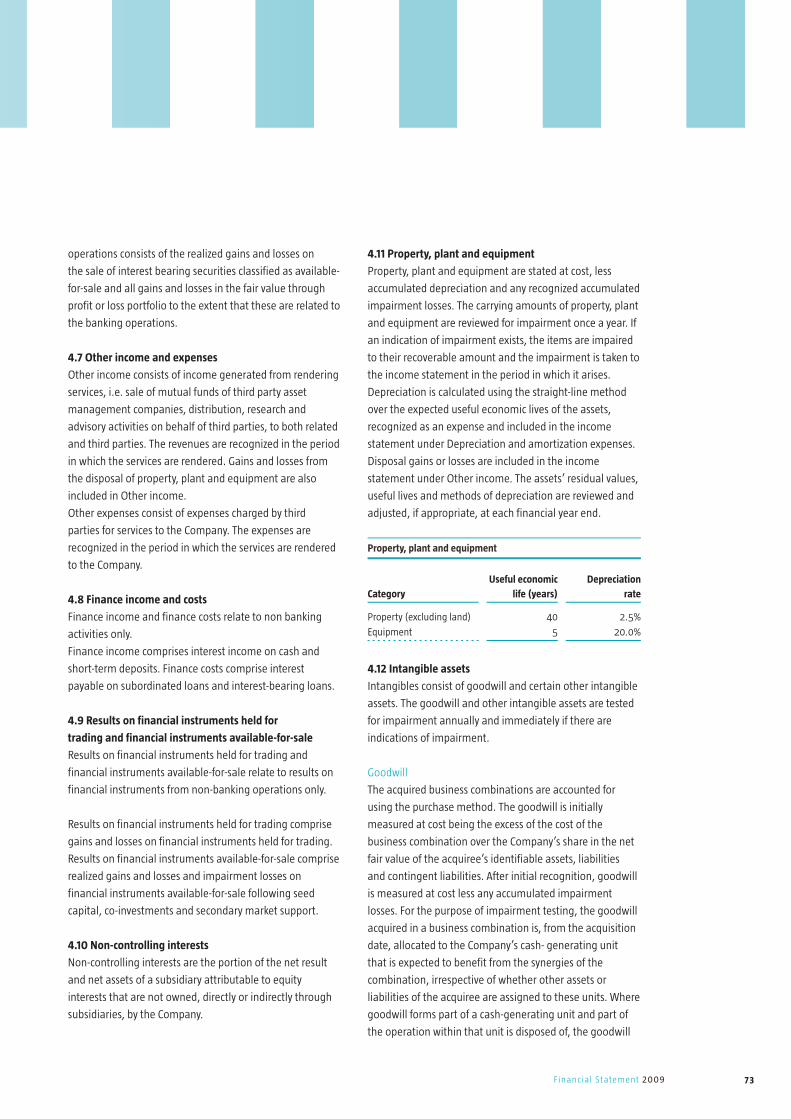
73Financial Statement 2009
operations consists of the realized gains and losses on
the sale of interest bearing securities classified as available-
for-sale and all gains and losses in the fair value through
profit or loss portfolio to the extent that these are related to
the banking operations.
4.7 Other income and expenses
Other income consists of income generated from rendering
services, i.e. sale of mutual funds of third party asset
management companies, distribution, research and
advisory activities on behalf of third parties, to both related
and third parties. The revenues are recognized in the period
in which the services are rendered. Gains and losses from
the disposal of property, plant and equipment are also
included in Other income.
Other expenses consist of expenses charged by third
parties for services to the Company. The expenses are
recognized in the period in which the services are rendered
to the Company.
4.8 Finance income and costs
Finance income and finance costs relate to non banking
activities only.
Finance income comprises interest income on cash and
short-term deposits. Finance costs comprise interest
payable on subordinated loans and interest-bearing loans.
4.9 Results on financial instruments held for
trading and financial instruments available-for-sale
Results on financial instruments held for trading and
financial instruments available-for-sale relate to results on
financial instruments from non-banking operations only.
Results on financial instruments held for trading comprise
gains and losses on financial instruments held for trading.
Results on financial instruments available-for-sale comprise
realized gains and losses and impairment losses on
financial instruments available-for-sale following seed
capital, co-investments and secondary market support.
4.10 Non-controlling interests
Non-controlling interests are the portion of the net result
and net assets of a subsidiary attributable to equity
interests that are not owned, directly or indirectly through
subsidiaries, by the Company.
4.11 Property, plant and equipment
Property, plant and equipment are stated at cost, less
accumulated depreciation and any recognized accumulated
impairment losses. The carrying amounts of property, plant
and equipment are reviewed for impairment once a year. If
an indication of impairment exists, the items are impaired
to their recoverable amount and the impairment is taken to
the income statement in the period in which it arises.
Depreciation is calculated using the straight-line method
over the expected useful economic lives of the assets,
recognized as an expense and included in the income
statement under Depreciation and amortization expenses.
Disposal gains or losses are included in the income
statement under Other income. The assets’ residual values,
useful lives and methods of depreciation are reviewed and
adjusted, if appropriate, at each financial year end.
Property, plant and equipment
Category
Useful economic
life (years)
Depreciation
rate
Property (excluding land) 40 2.5%
Equipment 5 20.0%
4.12 Intangible assets
Intangibles consist of goodwill and certain other intangible
assets. The goodwill and other intangible assets are tested
for impairment annually and immediately if there are
indications of impairment.
Goodwill
The acquired business combinations are accounted for
using the purchase method. The goodwill is initially
measured at cost being the excess of the cost of the
business combination over the Company’s share in the net
fair value of the acquiree’s identifiable assets, liabilities
and contingent liabilities. After initial recognition, goodwill
is measured at cost less any accumulated impairment
losses. For the purpose of impairment testing, the goodwill
acquired in a business combination is, from the acquisition
date, allocated to the Company’s cash- generating unit
that is expected to benefit from the synergies of the
combination, irrespective of whether other assets or
liabilities of the acquiree are assigned to these units. Where
goodwill forms part of a cash-generating unit and part of
the operation within that unit is disposed of, the goodwill
74 Annual Report 2009 Robeco Groep N.V.
associated with the operation disposed of is included in
the carrying amount of the operation when determining
the gain or loss on disposal of the operation. Goodwill
disposed of in this circumstance is measured based on the
relative values of the operation disposed of and the portion
of the cash-generating unit retained.
Other intangible assets
Other intangible assets consist of capitalized software,
customer relations, licenses and sustainability databases.
Other intangible assets are stated at cost less any
accumulated amortization and any accumulated
impairment losses determined individually for each asset.
The assets are reviewed for impairment annually.
The intangible assets of the Company are all finite
and acquired. Amortization is on a straight-line basis.
The amortization periods are as follows:
CategoryAmortization period (years)
Customer relations 5-15
Databases 7
Purchased software 4
4.13 Acquisitions of group companies
The identified intangible assets meet the recognition
criteria of IAS 38 and IFRS 3 standards and are amortized
through the income statement between 4 to 15 years
as from the acquisition date. The intangible assets
are reviewed for impairment on an annual basis; they
are reviewed immediately if there are indications of
impairment.
Measurement of the fair value of the assets and liabilities
of the business combinations, identification of goodwill
and the purchase price allocation for Transtrend B.V.,
Analytic Investment Management Trading N.V. and SAM
Group Holding A.G. were supported by an independent
valuer. The purchase price allocation of Canara Robeco
Asset Management Company Ltd. was finalized in the first
months of 2008 and recognized in the financial statements
for 2008.
4.14 Investment in associates
An associate is an entity over which the Company has
significant influence (normally 20%-50% of the voting
rights) and which is neither a subsidiary nor a joint venture.
The financial statements of the associate are used by the
Company to apply the equity method. The reporting dates
of the associate and the Company are identical and both
use uniform accounting policies. The income statement
reflects the Company’s share of the associate’s operating
profit. Where a change has been recognized directly in
the associate’s equity, the Company recognizes its share of
that change and discloses this in the statement of changes
in equity.
On acquisition of an investment any difference between
the cost of an investment and the investor’s share of the
net fair value of the associate’s identifiable assets, liabilities
and contingent liabilities is accounted for as goodwill,
which is included in the carrying amount of the associate.
4.15 Impairment testing of non financial assets
In accordance with IAS 36, Impairment of Assets, the
Company performs an impairment test on goodwill and
intangible assets with an indefinite life. For intangible
assets with a finite life the Company assesses at each
reporting date whether there are any indications of
impairment. Implicated in the assessment are the
goodwill and other intangible assets of the acquired group
companies Transtrend B.V., SAM Group Holding AG and
Canara-Robeco Asset Management Company Ltd. For
impairment testing purposes, the goodwill of Transtrend
B.V. and SAM Group Holding AG was allocated to
the cash-generating unit Robeco Alternative Investments.
In 2009 Robeco changed its organization structure from
a business unit model into a functional management
model. Transtrend B.V. and SAM Group Holding AG have
remained in the same cash-generating unit, which is now
called Alternative & Sustainable Investments.
The goodwill of Canara-Robeco Asset Management
Company Ltd. has been allocated to the smallest cash-
generating unit to which the goodwill can be allocated,
Robeco India Holding B.V. This cash-generating unit also
remained unchanged in 2009.
4.16 Financial assets available-for-sale
Financial assets available-for-sale are non-derivative
financial instruments that are designated as available-for-
sale or are not classified as (a) loans and advances, (b)
held-to-maturity, (c) financial assets at fair value through
Accounting policies for the consolidated financial statements

75Financial Statement 2009
profit or loss. Those financial assets are recorded on
a trading date basis. Financial assets available-for-sale are
instruments which, in management’s opinion, may be
sold in response to or in anticipation of needs for liquidity
or changes in interest rates, foreign exchange rates or
equity prices. Financial assets available-for-sale consist of
money market paper, other debt instruments and equity
instruments.
Financial assets available-for-sale are initially recognized at
fair value plus directly attributable transaction costs.
After initial measurement, financial assets available-for-
sale are subsequently measured at fair value. Unrealized
gains or losses on financial assets available-for-sale are
reported as other comprehensive income and recognized in
the available-for-sale reserve, net of taxes until such assets
are sold, collected or otherwise disposed of, or until such
assets are impaired.
On disposal of an available-for-sale asset, the accumulated
unrealized gain or loss included in the available-for-sale
reserve is transferred to the income statement. Gains and
losses on disposal are determined using the average cost
method. If a financial asset available-for-sale is impaired,
the cumulative unrealized loss recognized in the available-
for-sale reserve is included in the income statement.
Interest earned on financial assets available-for-sale related
to banking operations is reported as Interest income from
banking operations. Realized gains and losses on financial
assets available-for-sale related to banking operations
are recognized as Results on financial instruments from
banking operations. Interest earned on financial assets
available-for-sale not related to banking operations
is recognized under Results on financial instruments
available-for-sale. Realized gains and losses on financial
assets available-for-sale not related to banking operations
are also recognized as Results on financial instruments
available-for-sale.
If a financial asset available-for-sale is impaired, the
amount comprising the difference between its costs (net of
any principal payment and amortization) and its current fair
value, less any impairment loss previously recognized in the
income statement, is removed from other comprehensive
income and recognized in the income statement. For
fixed income financial assets available-for-sale reversals
of impairment losses are reversed through the income
statement, if the increase in fair value of the instrument
can be objectively related to an event occurring after the
impairment loss was recognized in the income statement.
For available-for-sale equity securities however, reversals of
impairment losses are not recognized through the income
statement; increases in their fair value after impairment
are recognized directly in other comprehensive income.
4.17 Financial assets held-to-maturity
When management has both the intention and the ability
to hold financial assets to maturity, securities with fixed or
determinable payments and fixed maturity are classified as
financial assets held-to-maturity. Management determines
the appropriate classification of its financial assets at
the time of purchase. The financial assets are recorded on
a trading date basis.
Financial assets held-to-maturity are carried at amortized
cost using the effective-yield method. Interest earned on
financial assets held-to-maturity is reported as Interest
income from banking operations.
If there is objective evidence that an impairment loss
on financial assets carried at cost or amortized cost has
been incurred, the amount of the loss is measured as
the difference between the asset’s carrying amount and
the present value of estimated future cash flows (excluding
future expected credit losses that have not been incurred),
discounted at the financial asset’s original effective interest
rate (i.e. the effective interest rate computed at initial
recognition). The amount of the loss shall be recognized
in the income statement. If, in a subsequent period, the
amount of the impairment loss decreases and the decrease
can be related objectively to an event occurring after
the impairment was recognized, the previously recognized
impairment loss is reversed. Any subsequent reversal of
an impairment loss is recognized in the income statement,
to the extent that the carrying amount of the asset does
not exceed its amortized cost at the reversal date.
4.18 Financial assets designated at fair value
through profit or loss
Financial assets designated at fair value through profit
or loss are non-trading financial assets that have been

76 Annual Report 2009 Robeco Groep N.V.
designated on initial recognition at fair value through
profit or loss, using the ‘fair value option’. These financial
assets are recorded on a trading date basis and are initially
recognized at fair value.
The management of the Company chooses to designate
non-trading financial assets at fair value through profit or
loss on initial recognition when the following criteria are
met:
– the designation eliminates or significantly reduces
the inconsistent treatment that would otherwise arise
from measuring the assets or recognizing gains or
losses on them on a different basis; or
– the assets are part of a group of financial assets
which are managed and their performance evaluated
on a fair value basis in accordance with a risk
management strategy; or
– the financial instruments contain an embedded
derivative, unless the embedded derivative does
not significantly modify the cash flows or if it is clear
that it would not be separately recorded.
Interest earned on these assets is reported as Interest
income from banking operations. All realized and
unrealized gains and losses from re-measurement at fair
value are included in Results on financial instruments
from banking operations. The fair value of financial assets
actively traded in organized financial markets is determined
by reference to quoted market prices at the close of
business on the reporting date. The fair value of all other
financial assets is determined using valuation techniques,
which include net present value techniques, the discounted
cash flow method, comparison to similar instruments for
which market prices do exist, and valuation models.
The input into these valuation models is practically always
market observable.
As the market risk of purchased loans and mortgages is
considered to be nil as these positions are fully hedged,
changes in the fair value of these financial assets are fully
attributed to credit risk.
4.19 Financial assets loans and advances
Loans and advances with a maturity of more than one
year are non-derivative financial assets with fixed or
determinable payments that are not quoted on an active
market. Such assets are carried at amortized cost using the
effective interest rate method less any impairment losses.
Gains and losses are recognized in the income statement
upon derecognition or impairment as well as through
amortization. Transaction costs are taken into account at
initial recognition and are amortized over the remaining
term. The assets are recorded on a trading date basis.
4.20 Impairment of financial assets
The Company assesses at each reporting date whether
there is any objective evidence that a financial asset or
a group of financial assets is impaired. A financial asset
is deemed to be impaired if there is objective evidence of
impairment as a result of one or more events that
has occurred after the initial recognition of the asset
(an incurred ‘loss event’) and that loss event has an impact
on the estimated future cash flows of the financial asset or
the group of assets that can be reliably estimated.
Objective evidence of impairment includes observable
data about:
– significant financial difficulty of the issuer;
– an actual breach of contract, such as a default or
delinquency in interest or principal payments;
– probability of bankruptcy or other financial
reorganization of the borrower;
– the disappearance of an active market for that financial
asset due to financial difficulties;
– observable data indicating that there is a measurable
decrease in the estimated future cash flows from
a group of financial assets since the initial recognition
of those assets.
For debt instruments classified as available-for-sale,
held-to-maturity or loans and advances, impairment is
assessed if there is objective evidence that an impairment
loss has been incurred.
Objective evidence of impairment for Available-for-sale
equity instruments may include specific information
about the issuer as detailed above, but may also include
a significant or prolonged decline in the fair value of
the asset. In assessing whether it is significant, the decline
in fair value is evaluated against the original cost of
the asset at initial recognition. In assessing whether it is
prolonged, the decline is evaluated against the period in
Accounting policies for the consolidated financial statements
77Financial Statement 2009
which the fair value of the asset has been below its original
cost at initial recognition. ‘Significant’ and ‘prolonged’
are interpreted on a case-by-case basis for specific equity
instruments; as general guideline the Company considers
a decline of 25% as ‘significant’ and a period of more than
six months as ‘prolonged’.
For loans and advances to customers carried at amortized
cost, the Company assesses individually whether objective
evidence of impairment exists. If there is objective evidence
that an impairment loss has been incurred, the amount
of loss is measured as the difference between the asset’s
carrying amount and the present value of estimated future
cash flows (excluding future expected credit losses that
have not yet been incurred). The carrying amount of the
asset is reduced through the use of an allowance account
and the loss is recognized in the income statement. Loans
together with the associated allowance are written off
when there is no realistic prospect of future recovery and
all collateral has been realized or has been transferred to
the Company. In determining the extent of the impairment,
management evaluates the risk in the portfolio, current
economic conditions, loss experiences in recent years
and credit concentration trends. The identification of
impairment and determination of the recoverable amount
are a process involving assumptions and factors including
the financial condition of the counterparty, expected future
cash flows and expected net selling prices.
4.21 Share-based payments
To certain employees and the Board of Directors of
a subsidiary of the Company share-based payment
transactions are part of the local remuneration, whereby
employees render services as consideration for equity
instruments. The costs of cash-settled transactions are
measured by reference to the fair value at the date on
which they are granted. The fair value is determined by
a formula disclosed in more detail in note 40.
The costs of cash-settled transactions are recognized
over the period in which the performance and/or service
conditions are fulfilled, ending on the date on which
the relevant employees become fully entitled to the award.
The accumulated expenses recognized for equity-settled
transactions at each reporting date until the vesting date
reflects the extent to which the vesting period has expired
and the Company’s best estimate of the number of equity
instruments that will ultimately vest. The income statement
expenses or income for a period represents the movement
in cumulative expense recognized as at the beginning and
end of that period.
4.22 Taxes
Income tax
Income tax on the profit or loss for the year comprises
current and deferred tax. Income tax is recognized in
the income statement except to the extent that it relates to
items recognized in other comprehensive income, in which
case it is recognized in other comprehensive income.
Current tax
Current tax assets and liabilities for the current and prior
periods are measured at the amount expected to be
recovered from or paid to tax authorities. The tax rates and
laws used to compute taxable amounts are those enacted
or substantially enacted at the reporting date.
Deferred tax
Deferred tax is provided using the liability method on
temporary differences at the reporting date between
the carrying amounts of assets and liabilities for financial
reporting purposes and the amounts used for tax purposes.
The following temporary differences are not accounted for:
– the initial recognition of assets and liabilities
that affects neither the accounting profit nor
the taxable profit;
– differences relating to investments in
subsidiaries to the extent that they will not
reverse in the foreseeable future;
– the recognition of carry-forward losses that will be set
off against expected taxable profits in the future that
are still uncertain according to management judgment.
The amount of deferred tax provided is based on
the expected manner of realization or settlement of the
carrying amount of assets and liabilities, using tax rates
enacted or substantively enacted at the reporting date.
A deferred tax asset is recognized for tax benefits relating to
the carry forward of unused tax losses when it is probable
78 Annual Report 2009 Robeco Groep N.V.
that estimated future taxable profits will be available for
which these losses can be utilized.
The carrying amount of deferred income tax assets is
reviewed annually and reduced to the extent that it
is no longer probable that sufficient taxable profit will
be available to allow all or part of the deferred income
tax asset to be utilized. Unrecognized deferred income
tax assets are reassessed at each reporting date and are
recognized to the extent that it has become probable that
future taxable profit will allow the deferred tax asset to
be recovered.
A deferred tax liability is provided for the recognized fair
value identification on the intangible assets.
Sales tax
Revenues, expenses and assets are recognized net of
the amount of sales tax except:
– where the sales tax incurred on a purchase of assets
or services is not recoverable from the taxation
authority, in which case the sales tax is recognized
as part of the costs of acquisition of the asset or
as part of the expense item as applicable; and
– receivables and payables that are stated with
the amount of sales tax included.
The net amount of sales tax recoverable from, or payable
to, the taxation authority is included as part of receivables
or payables in the statement of financial position.
4.23 Financial assets held for trading
Financial assets are classified as held for trading if they
are acquired for the purpose of selling in the near future.
Financial assets held for trading are initially recognized
at fair value, and transaction costs are expensed in the
income statement. The financial assets held for trading
are presented in the statement of financial position under
Current assets. Interest earned and dividends received
on these assets are reported as Results on financial
instruments held for trading. All other realized and
unrealized gains and losses on re-measurement of these
financial instruments at fair value are also included in
Results on financial instruments held for trading.
All purchases and sales of financial assets held for trading
that require delivery within the time frame established by
regulation or market convention, i.e. regular-way
purchases and sales, are recognized at the trading date.
4.24 Other receivables
Other receivables are valued at amortized cost.
4.25 Derivative financial instruments
The Company enters into transactions in derivative financial
instruments which are designated and qualified as net
investment hedges of foreign operations and as derivative
transactions to hedge against economic risk exposure to
which no hedge accounting is applied.
The Company uses derivative financial instruments,
such as foreign currency forwards, interest rate and credit
default swaps to hedge foreign currency risk, interest rate
risk, credit risk and market risk. Such derivative financial
instruments are initially recognized at fair value on the date
on which the derivative financial instruments were entered
into and subsequently re-measured. Gains and losses on
the re-measurement of derivative financial instruments
are included in Result on financial assets held for trading.
Derivative financial instruments are carried as assets
if the fair value is positive and as liabilities if the fair value
is negative.
The recognition of the resulting fair value gain or loss
depends on whether the derivative financial instrument is
designated as a hedging instrument and, if so, the nature
of the item being hedged. The Company has designated
certain derivative financial instruments as net investment
hedges of foreign operations.
The effective portion of changes in the fair value of hedges
of net investments in foreign operations is recognized in
other comprehensive income. The gain or loss relating to
the ineffective portion is recognized immediately in the
income statement.
When a financial instrument is designated as a hedge, the
Company documents the relationship between the hedging
instrument and the hedged item. Accordingly, the Company
documents its assessment, both at hedge inception and on
an ongoing basis, of how effective the derivative financial
instruments used in hedging transactions are in offsetting
changes in the fair values of hedged items. This assessment
Accounting policies for the consolidated financial statements

79Financial Statement 2009
includes a way of assessing the hedging instrument’s
effectiveness in offsetting the exposure to changes in the
hedged item’s fair value attributable to the hedged risk.
The fair value gain or loss from the interest-rate swaps
related to banking operations is recognized as Results on
financial instruments from banking operations. All other
fair value gain or loss from derivative financial instruments
which are designated as economic hedges but which do not
qualify for hedge accounting are recognized as results on
financial instruments held for trading.
4.26 Cash and cash equivalents
Cash and cash equivalents comprise cash at banks, cash
in hand and short-term deposits with an original maturity
of three months or less and an insignificant risk of change
in fair value. Certain cash and short-term deposits that
are held to satisfy regulatory liquidity requirements are
disclosed as restricted cash. Bank overdrafts are classified
as current liabilities.
For the purposes of the consolidated statement of
cash flows, cash and cash equivalents consist of cash and
short-term deposits as defined above, net of outstanding
bank overdrafts.
4.27 Equity attributable to equity holders of the parent
Equity is accounted for as the residual interest of the
Company after deducting all its liabilities. The amount at
which equity is shown in the statement of financial position
is dependent on the measurement of assets and liabilities.
Dividends for distribution are recognized as a liability
in the period when they are declared. Dividends declared
after the reporting date are not retroactively reflected
in the financial statements of the period just ended.
Non-controlling interests are presented in the consolidated
statement of financial position as part of total equity
attributable to equity holders of the parent, separately from
the Company’s equity.
4.28 Other interest-bearing loans and borrowings
Other interest-bearing loans and borrowings are recognized
at amortized cost using the effective interest method.
Gains and losses are recognized in the income statement
when the liabilities are derecognized as well as through
the amortization process. Transaction costs are taken into
account at initial recognition and amortized over
the remaining term.
4.29 Provisions
A provision is recognized in the statement of financial
position when the Company has a legal or constructive
obligation as a result of a past event, for which it is
probable that an outflow of economic benefits will be
required to settle the obligation and a reliable estimate
of the amount of the obligation can be made. If the effect
of time value is material, provisions are determined by
discounting the expected future cash flows at a pre-tax rate
that reflects current market rates and, where appropriate,
the risks specific to the liability.
4.30 Pension asset and employee benefit liability
Pensions
The asset and liability recognized in the statement of
financial position in respect of the defined benefit pension
plan is the value of the defined benefit obligation at the
reporting date less the fair value of plan assets, together
with adjustments for unrecognized actuarial gains or losses
or past service costs. The defined benefit plan applies to
employees in the Netherlands and Switzerland. Employees
outside the Netherlands and Switzerland are entitled to
defined contribution plans. The defined benefit obligation
is calculated annually by independent actuaries using
the project unit credit method.
The present value of the defined benefit obligation is
determined by discounting the estimated future cash
outflows using interest rates of high quality corporate
bonds that are denominated in the currency in which
the benefits will be paid and that have terms to maturity
approximating the terms of the related pension liability.
In the Eurozone region the yields on the 1-3, 3-5, 5-7, 7-10
and over 10 year iBoxx indices (not constituents) are
turned from gross redemption yields to zero-coupon yields.
They are then interpolated and extrapolated to form
an AA corporate bond yield curve.
Actuarial gains and losses arising from experience
adjustments and changes in actuarial assumptions in
80 Annual Report 2009 Robeco Groep N.V.
excess of the greater of 10% of the value of plan assets
or 10% of the defined benefit obligation are charged or
credited to the income statement as employee benefit costs
over the employees’ expected average remaining working
lives.
Past-service costs arising from new plans or changes
to existing plans are recognized on a straight-line basis
over the average service period until the amended
benefits become vested. Vested benefits are recognized
immediately.
Settlements and curtailments during the year are
recognized in the income statement in the year they
occur. A pro-rata share of unrecognized gains and losses
is recognized immediately if curtailments occur.
Under the defined contribution plan, the Company
pays contributions to publicly or privately administered
insurance plans on a mandatory, contractual or voluntary
basis. The Company has no further payment obligations
once the contributions have been paid. The contributions
are recognized as employee benefit expense when they
are due.
Other long-term employee benefits
In addition to fixed annual income, all employees have
a variable income component. The variable component
is expressed as a percentage of fixed annual income.
The percentage awarded depends on the realization
of predefined targets. The seniority of the employees
concerned determines the range set for the variable
income percentage. If the absolute amount of variable
income exceeds a threshold, it is partially postponed over
several years.
The Company also has a staff option plan for its employees
in the Netherlands as well as a management option plan
in place. The costs of these option plans are borne in
full by the Company and have no impact on the annual
performance of the funds. The costs are recognized as
employee benefits by the Company at the date of granting
as these are fully vested from that date of granting.
The estimated fair value of the options is calculated
using the Cox, Ross & Rubinstein model, which is closely
related to the methodology of the Black & Scholes option
valuation model. The underlying value of the options
granted is related to the fixed income of the employees.
The percentages for the management option plan vary
according to the seniority of the position. The staff
option plan uses a fixed percentage of fixed income for
all employees. As from 1 January 2010 no options will be
granted on funds managed by the Company.
The Company has a long-term Incentive Plan for key
employees. This plan is an Equity Notes Plan eligible for
certain employees. These Equity Notes are recorded at
a value that is related to the Company’s valuation basis of
profit from continuing operations, adjusted downwards
for expenses related to the long-term Incentive Plan and
adjusted for the results related to the foreign currency
hedge.
The Equity Notes are vested according to a specific
timetable or subject to pre-defined conditions, but in
general they mature between four and six years after
granting. Based on the fact that the Equity Notes Plan is
a long-term employee benefit plan as bonuses are vested
and paid more than one year after the period in which they
are earned, the projected unit credit method is applied for
accounting purposes. This leads to a straight-line allocation
of the total expected amount of the benefit over the
vesting period. The Equity Notes are recorded in the income
statement after granting to the key employees.
In addition to the Equity Notes Plan, the Company has
an Investment Notes Plan. The Investment Notes Plan is
positioned next to – but separate from – the Equity Notes
Plan as an investment opportunity for key employees who
have been granted Equity Notes. Only participants in
the Equity Notes Plan can purchase Investment Notes.
The Investment Notes are recorded at a value that is partly
related to the Company’s valuation basis of profit from
continuing operations and partly to the development in
profitability of a specified group of Dutch and UK financial
institutions. The Investment Notes have a maximum life
of five years, but can be converted into cash at any time
before the end of their life. The Investment Notes are not
conditional, are not subject to vesting conditions and
are not forfeited upon termination of the employment
relationship. If Investment Notes remain outstanding
during their maximum life of five years, the conversion
into cash will be increased by 25%, as an investor’s loyalty
Accounting policies for the consolidated financial statements

81Financial Statement 2009
premium. The Investment Notes are recorded in the
income statement after granting to the key employees in
the period in which the aforementioned value increased.
The investor’s loyalty premium is recorded in the income
statement annually, based on the estimated expected
remaining Investment Notes after five years.
Equity Notes that have been awarded but have not yet
vested generate a yield in cash of 5% of the base value
per year. Vested Equity Notes do not generate any yield.
Investment Notes generate a yield in cash of 5% of
the base value each year.
4.31 Other non-current liabilities
Other non-current liabilities include management fees
received in advance, which are stated at nominal value.
The management fees are recognized in the income
statement once the services have been performed.
The current portion of the non-current liabilities is classified
as Trade and other payables.
4.32 Total return swaps
The Company entered into structured transactions on
behalf of clients, which result in total return swaps and
certain financial instruments on the Company’s statement
of financial position. Total return swaps are financial
instruments whose value is derived from an underlying
instrument or product. Through total return swaps the
market risk and the economic returns from the underlying
financial instrument are transferred to clients. Total return
swaps are recognized at fair value at reporting date.
The gains or losses arising from changes in fair value and
the economic returns on underlying financial instruments
are recognized under Results on financial instruments held
for trading.
4.33 Other liabilities
Other liabilities such as Interest-bearing loans due to
customers and due to banks are valued at nominal value.

82 Annual Report 2009 Robeco Groep N.V.
5. Management and other feesManagement and other fees represent management fees,
service fees, performance fees, transaction fees, structuring
fees and stock-lending commissions.
EUR x million 2009 2008
Management fees 616.5 959.0
Other fees 48.5 54.6
Total 665.0 1,013.6
Lower performance fees were the main reason for the
decline in management fees. The performance fee in 2009
amounted to EUR 16.1 compared with EUR 311.1 million in
the previous year.
Geographical information
Robeco Groep N.V. has no debt or equity instruments
traded in a public market and is not in the process of issuing
any class of instrument in a public market. As a result, IFRS
8 ‘Operating segments’ does not apply to Robeco Groep
N.V. The following information is included to comply with
Section 380 of Book 2 of the Dutch Civil Code.
EUR x million 2009 2008
Total revenue by region
Netherlands 243.0 36% 547.8 54%
Rest of Europe 166.5 25% 198.5 20%
United States 250.5 38% 264.6 26%
Asia 5.0 1% 2.7 0%
Total revenue 665.0 100% 1,013.6 100%
EUR x billion 2009 2008
Assets under management by region
Netherlands 70.8 52% 66.8 60%
Rest of Europe 20.5 15% 13.0 12%
United States 42.6 32% 30.3 27%
Asia 1.0 1% 0.6 1%
Total 134.9 100% 110.7 100%
6. Distribution and subadvisory costsThe costs can be broken down as follows:
EUR x million 2009 2008
Distribution costs 105.5 115.2
Subadvisory costs 90.3 99.3
Total 195.8 214.5
7. Interest income from banking operationsInterest income from banking operations can be broken
down as follows:
EUR x million 2009 2008
Financial assets available-for-sale 122.9 169.6
Financial assets held-to-maturity 19.0 24.3
Financial assets at fair value through
profit or loss 21.7 25.0
Loans and advances 97.9 76.4
Cash and balances with central banks 2.2 7.4
Due from other banks 11.4 43.6
Derivative financial instruments 17.9 27.6
Other - 0.1
Total 293.0 374.0
The interest income as generated by the investment
portfolio declined considerably as a result of ongoing
interest rate decreases as observed in the money and bond
market.
8. Interest expense from banking operations Interest expense from banking operations can be broken
down as follows:
EUR x million 2009 2008
Due to customers 227.3 251.1
Due to other banks 4.5 33.7
Derivative financial instruments 41.3 23.5
Other 1.2 1.0
Total 274.3 309.3
The interest expenses on fixed-term deposits represent a
material part of the entrusted funds and have not kept pace
with the interest rate reduction as observed in the money
market. Only in the latter part of 2009, interest expenses
normalized.
Notes to the consolidated income statement
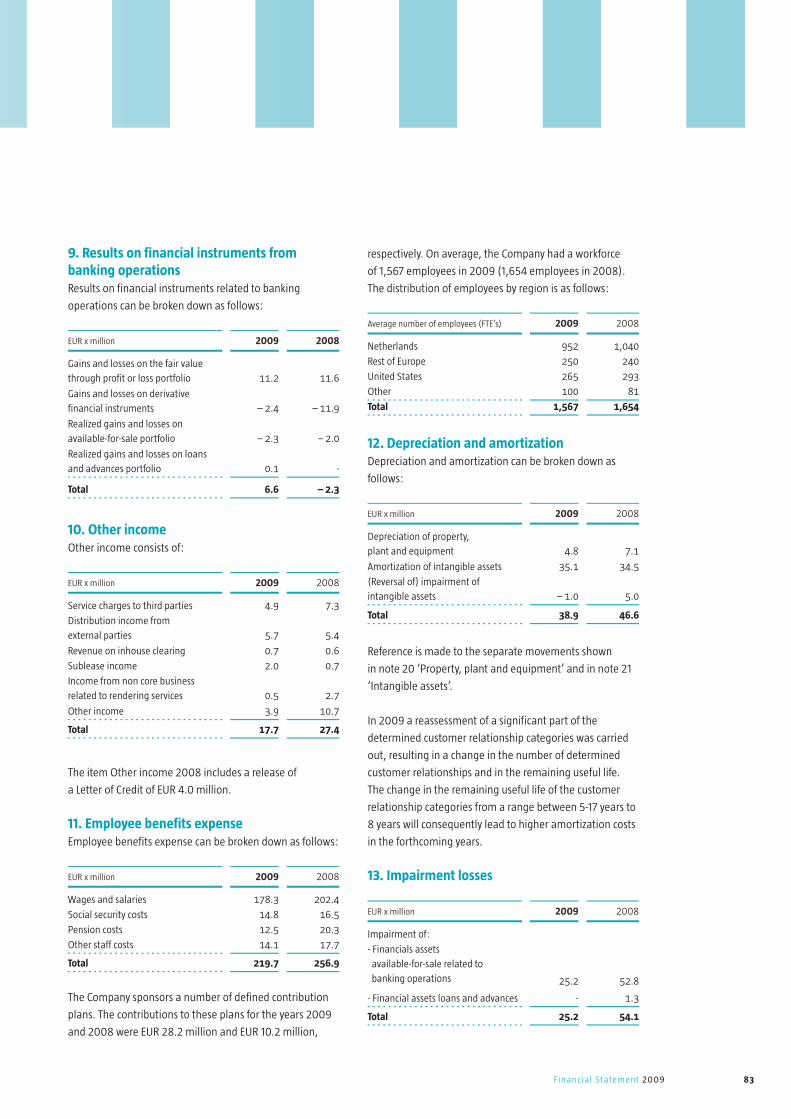
83Financial Statement 2009
9. Results on financial instruments from banking operations Results on financial instruments related to banking
operations can be broken down as follows:
EUR x million 2009 2008
Gains and losses on the fair value
through profit or loss portfolio 11.2 11.6
Gains and losses on derivative
financial instruments – 2.4 – 11.9
Realized gains and losses on
available-for-sale portfolio – 2.3 – 2.0
Realized gains and losses on loans
and advances portfolio 0.1 -
Total 6.6 – 2.3
10. Other incomeOther income consists of:
EUR x million 2009 2008
Service charges to third parties 4.9 7.3
Distribution income from
external parties 5.7 5.4
Revenue on inhouse clearing 0.7 0.6
Sublease income 2.0 0.7
Income from non core business
related to rendering services 0.5 2.7
Other income 3.9 10.7
Total 17.7 27.4
The item Other income 2008 includes a release of
a Letter of Credit of EUR 4.0 million.
11. Employee benefits expenseEmployee benefits expense can be broken down as follows:
EUR x million 2009 2008
Wages and salaries 178.3 202.4
Social security costs 14.8 16.5
Pension costs 12.5 20.3
Other staff costs 14.1 17.7
Total 219.7 256.9
The Company sponsors a number of defined contribution
plans. The contributions to these plans for the years 2009
and 2008 were EUR 28.2 million and EUR 10.2 million,
respectively. On average, the Company had a workforce
of 1,567 employees in 2009 (1,654 employees in 2008).
The distribution of employees by region is as follows:
Average number of employees (FTE’s) 2009 2008
Netherlands 952 1,040
Rest of Europe 250 240
United States 265 293
Other 100 81
Total 1,567 1,654
12. Depreciation and amortizationDepreciation and amortization can be broken down as
follows:
EUR x million 2009 2008
Depreciation of property,
plant and equipment 4.8 7.1
Amortization of intangible assets 35.1 34.5
(Reversal of) impairment of
intangible assets – 1.0 5.0
Total 38.9 46.6
Reference is made to the separate movements shown
in note 20 ‘Property, plant and equipment’ and in note 21
‘Intangible assets’.
In 2009 a reassessment of a significant part of the
determined customer relationship categories was carried
out, resulting in a change in the number of determined
customer relationships and in the remaining useful life.
The change in the remaining useful life of the customer
relationship categories from a range between 5-17 years to
8 years will consequently lead to higher amortization costs
in the forthcoming years.
13. Impairment losses
EUR x million 2009 2008
Impairment of:
- Financials assets
available-for-sale related to
banking operations 25.2 52.8
- Financial assets loans and advances - 1.3
Total 25.2 54.1

84 Annual Report 2009 Robeco Groep N.V.
The impairment of financial assets available-for-sale
relates to the Asset-backed securities (ABSs). Based on
the economic circumstances and the market situation in
2008 and 2009, the Company made assessments of its
ABS portfolio. The outcome of these in-depth analyses
resulted in impairments of a few titles in 2008 and
additional impairments as well as recognition of the fair
value changes of earlier impaired ABSs in 2009.
14. Other expensesOther expenses can be broken down as follows:
EUR x million 2009 2008
Information technology 57.0 31.3
Fund and client related costs 41.1 37.6
Temporary staff 36.6 54.4
Marketing 27.1 33.3
Housing and furniture 27.1 32.4
Advisory fees 18.5 35.5
Market data 10.8 10.2
Travel and accommodation 5.8 8.4
Recruitment and courses 3.3 4.6
Other 16.9 13.4
Total 244.2 261.1
15. Finance income Finance income comprises interest income on cash and
short-term deposits.
16. Finance costsFinance costs can be broken down as follows:
EUR x million 2009 2008
Interest expense on
interest-bearing loans 9.8 9.4
Interest expense on
subordinated loans 0.8 1.9
Total 10.6 11.3
17. Results on financial instruments held for trading Results on financial instruments held for trading can
be broken down as follows:
EUR x million 2009 2008
Gains and losses on the financial
instruments held for trading portfolio – 180.2 159.4
Dividend received on financial
instruments held for trading portfolio 26.8 43.8
Gains and losses on total return swaps 178.2 – 213.2
Gains and losses on other derivative
financial instruments – 12.3 – 5.6
Results on foreign currency contracts 2.1 – 26.5
Exchange rate differences 8.2 18.3
Total 22.8 – 23.8
A major part of the Results on financial instruments held for
trading relates to seed capital investments. From time to time,
the Company injects capital – on a temporary basis –
into funds managed by the Company at the time of their
inception. These ‘seed capital’ investments are included in
the financial instruments held for trading portfolio. As the
gains and losses on total return swaps are strongly related
to the financial instruments held for trading portfolio, they
are both presented under result of financial assets held for
trading. These derivative financial instruments are designated
as economic hedges but do not qualify for hedge accounting.
18. Results on financial instruments available-for-saleResults on financial instruments available-for-sale can
be broken down as follows:
EUR x million 2009 2008
Realized gains and losses on
the financial assets available-for-sale
portfolio – 0.3 1.2
Dividend and interest on the financial
assets available-for-sale portfolio 1.0 0.7
Impairment of financial assets
available-for-sale debt instruments
not related to banking operations – 1.7 – 7.3
Impairment of financial assets
available-for-sale equity instruments
not related to banking operations – 1.7 – 8.1
Total – 2.7 – 13.5
Notes to the consolidated income statements
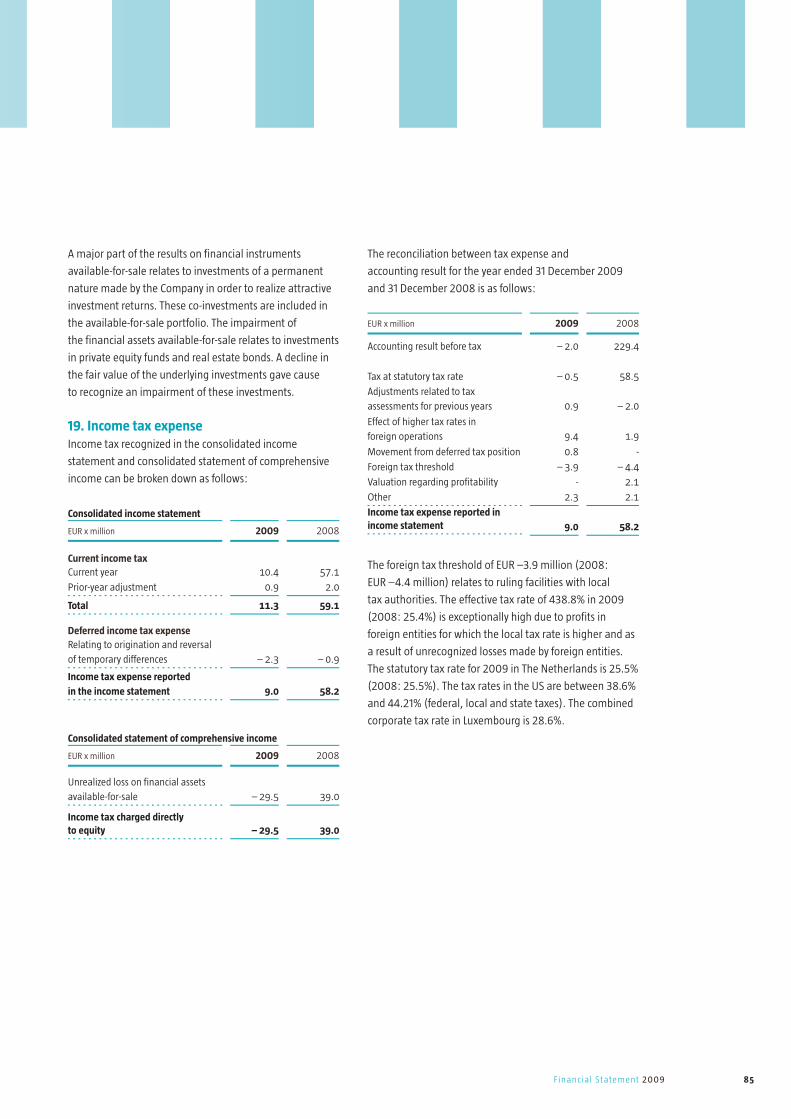
85Financial Statement 2009
A major part of the results on financial instruments
available-for-sale relates to investments of a permanent
nature made by the Company in order to realize attractive
investment returns. These co-investments are included in
the available-for-sale portfolio. The impairment of
the financial assets available-for-sale relates to investments
in private equity funds and real estate bonds. A decline in
the fair value of the underlying investments gave cause
to recognize an impairment of these investments.
19. Income tax expense Income tax recognized in the consolidated income
statement and consolidated statement of comprehensive
income can be broken down as follows:
Consolidated income statement
EUR x million 2009 2008
Current income taxCurrent year 10.4 57.1
Prior-year adjustment 0.9 2.0
Total 11.3 59.1
Deferred income tax expenseRelating to origination and reversal
of temporary differences – 2.3 – 0.9
Income tax expense reported
in the income statement 9.0 58.2
Consolidated statement of comprehensive income
EUR x million 2009 2008
Unrealized loss on financial assets
available-for-sale – 29.5 39.0
Income tax charged directly to equity – 29.5 39.0
The reconciliation between tax expense and
accounting result for the year ended 31 December 2009
and 31 December 2008 is as follows:
EUR x million 2009 2008
Accounting result before tax – 2.0 229.4
Tax at statutory tax rate – 0.5 58.5
Adjustments related to tax
assessments for previous years 0.9 – 2.0
Effect of higher tax rates in
foreign operations 9.4 1.9
Movement from deferred tax position 0.8 -
Foreign tax threshold – 3.9 – 4.4
Valuation regarding profitability - 2.1
Other 2.3 2.1
Income tax expense reported in income statement 9.0 58.2
The foreign tax threshold of EUR –3.9 million (2008:
EUR –4.4 million) relates to ruling facilities with local
tax authorities. The effective tax rate of 438.8% in 2009
(2008: 25.4%) is exceptionally high due to profits in
foreign entities for which the local tax rate is higher and as
a result of unrecognized losses made by foreign entities.
The statutory tax rate for 2009 in The Netherlands is 25.5%
(2008: 25.5%). The tax rates in the US are between 38.6%
and 44.21% (federal, local and state taxes). The combined
corporate tax rate in Luxembourg is 28.6%.

86 Annual Report 2009 Robeco Groep N.V.
EUR x million Buildings Equipment Total
Cost at 1 January 2009, net of accumulated depreciation 2.9 23.2 26.1
Additions - 1.9 1.9
Disposals – 1.0 – 0.1 – 1.1
Depreciation charge for the year – 0.2 – 4.6 – 4.8
Foreign exchange differences - – 0.4 – 0.4
Net carrying amount at 31 December 2009 1.7 20.0 21.7
At 1 January 2009
Cost 3.5 61.5 65.0Accumulated depreciation – 0.6 – 38.3 – 38.9
2.9 23.2 26.1
At 31 December 2009
Cost 2.1 60.7 62.8Accumulated depreciation – 0.4 – 40.7 – 41.1
1.7 20.0 21.7
EUR x million Buildings Equipment Total
Cost at 1 January 2008, net of accumulated depreciation 3.7 21.3 25.0
Additions 0.1 9.2 9.3
Disposals – 0.6 – 0.8 – 1.4
Depreciation charge for the year - – 7.1 – 7.1
Foreign exchange differences – 0.3 0.6 0.3
Net carrying amount at 31 December 2008 2.9 23.2 26.1
At 1 January 2008
Cost 4.4 57.3 61.7Accumulated depreciation – 0.7 – 36.0 – 36.7
3.7 21.3 25.0
At 31 December 2008
Cost 3.5 61.5 65.0Accumulated depreciation – 0.6 – 38.3 – 38.9
2.9 23.2 26.1
Notes to the consolidated statement of fi nancial position
20. Property, plant and equipmentMovements in property, plant and equipment are as follows:

87Financial Statement 2009
Notes to the consolidated statement of fi nancial position
EUR x million GoodwillOther
intangible Assets Total
Cost at 1 January 2009, net of accumulated amortization and impairment 360.3 197.5 557.8
Changes – 0.4 3.8 3.4
Amortization - – 35.1 – 35.1
Reversal of impairment - 1.0 1.0
Foreign exchange differences 0.2 - 0.2
Net carrying amount at 31 December 2009 360.1 167.2 527.3
At 1 January 2009
Cost 360.3 275.6 635.9Accumulated amortization and impairment - – 78.1 – 78.1
360.3 197.5 557.8
At 31 December 2009
Cost 360.1 275.7 635.8Accumulated amortization and impairment - – 108.5 – 108.5
360.1 167.2 527.3
EUR x million GoodwillOther
intangible Assets Total
Cost at 1 January 2008, net of accumulated amortization and impairment 353.4 231.6 585.0
Additions 2.3 1.4 3.7
Reclassification – 2.6 2.6 -
Amortization - – 34.5 – 34.5
Impairment - – 5.0 – 5.0
Foreign exchange differences 7.2 1.4 8.6
Net carrying amount at 31 December 2008 360.3 197.5 557.8
At 1 January 2008
Cost 353.4 275.3 628.7
Accumulated amortization and impairment - – 43.7 – 43.7
353.4 231.6 585.0
At 31 December 2008
Cost 360.3 275.6 635.9
Accumulated amortization and impairment - – 78.1 – 78.1
360.3 197.5 557.8
21. Intangible assetsMovements in intangible assets are as follows:

88 Annual Report 2009 Robeco Groep N.V.
The goodwill of EUR 360.1 million comprises the fair
value of expected synergies arising from the acquired
entities Canara Robeco Asset Management Company
Ltd., SAM Group Holding AG and Transtrend B.V. In 2009
a reassessment of Transtrend’s customer relationship
categories was carried out, as well as a review of the
remaining useful life of these assets. This reassessment
resulted in a revised grouping of determined customer
relationships and a shorter remaining useful life (from
a range between 5-17 years to 8 years). These changes
in estimate had a financial impact on the amortization
schedule and impairments of EUR 0.4 million.
The Company tested the goodwill and the other identified
intangible assets for impairment. In 2009 the other
intangibles were not impaired (2008: EUR 5.0 million of
which EUR 1.0 million is reversed in 2009). During 2009
and 2008 the goodwill was not impaired.
The total carrying amount of the cash-generating unit
Alternative & Sustainable Investments as at 31 December
2009 amounted to EUR 559.5 million (2008: EUR 781.0
million), of which EUR 350.3 million (2008: EUR 350.6
million) concerned goodwill.
For 2009 the goodwill arising from the 49% acquisition
of Canara Robeco Asset Management Company ltd. was
tested for the smallest cash- generating unit to which
the goodwill can be allocated. The total carrying amount at
31 December 2009 amounted to EUR 12.7 million (2008:
EUR 12.3 million) of which EUR 9.9 million (2008: EUR 9.7
million) concerned goodwill.
The recoverable amount has been determined based on
a value-in-use calculation using cash flow projections
from financial forecasts approved by senior management
covering a multiple-year period. For 2008 and 2009 the
pre-tax discount rates used in cash flow projections varied
between 15% and 17%. Cash flows beyond the five-year
period are extrapolated using long-term average growth
rates between 2% and 10%, in line with the expected long-
term average growth rates for the underlying businesses.
22. Impairment testing of non financial assetsThe calculation of value in use for the cash-generating unit
Alternative & Sustainable Investments is most sensitive to
the following assumptions:
– Investment performance of the underlying
investment engines
– Cash flows invested by clients in the underlying
investment funds
– Discount rates
– Growth rate used to extrapolate cash flows
beyond the five-year period
Investment performance – the forecast investment
performances of the underlying investment engines varies
between 0% and 12% (2008: between 6% and 13%),
depending on the type of products managed and
the markets invested in.
Cash flows of clients – the cash flows of clients highly
correlate to a large extent with the market appetite for
investment management in general and the success and/
or (out)performance of the products offered in particular.
Based on the forecast cash flows for 2010, cash flows for
subsequent years are extrapolated.
Discount rates – Discount rates reflect management’s
estimate of the risks specific to each unit. This is the cost of
equity used when performing the purchase price allocation.
In determining appropriate discount rates for each unit,
regard has been given to the yield on a long term risk free
government bond at the beginning of the year, adjusted for
a market risk premium and multiplied by a relevant beta
coefficient and a small firm premium.
Long-term average growth rate – Rates are based on
the judgments and estimates made by senior management
as no reliable public information was available for the
specific underlying business.
With regard to the assessment of value in use of the cash-
generating units Alternative & Sustainable Investments
and Robeco India Holding B.V., management believes that
no reasonably possible change in any of the above key
assumptions would cause the carrying amount of the unit
to materially exceed its recoverable amount.
23. Investment in associates and joint ventures The Company has a 40% interest in the share capital
of Analytic Investment Management Trading N.V. This
Notes to the consolidated statement of financial position
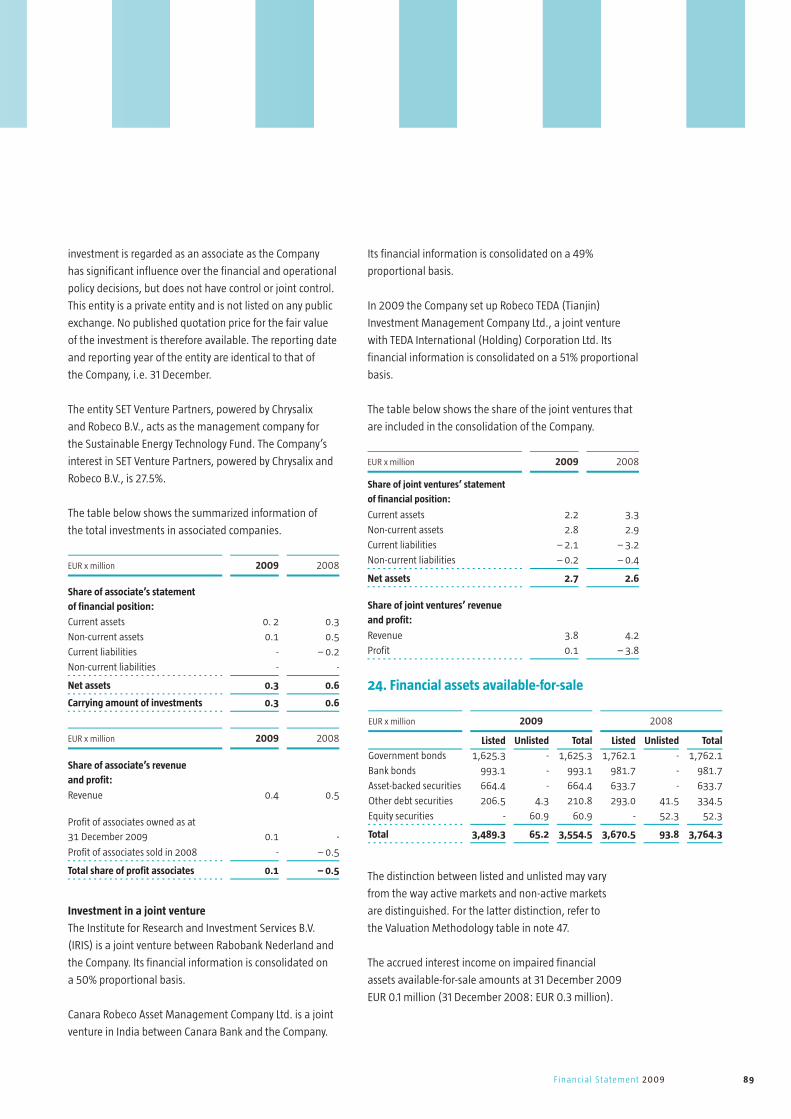
89Financial Statement 2009
investment is regarded as an associate as the Company
has significant influence over the financial and operational
policy decisions, but does not have control or joint control.
This entity is a private entity and is not listed on any public
exchange. No published quotation price for the fair value
of the investment is therefore available. The reporting date
and reporting year of the entity are identical to that of
the Company, i.e. 31 December.
The entity SET Venture Partners, powered by Chrysalix
and Robeco B.V., acts as the management company for
the Sustainable Energy Technology Fund. The Company’s
interest in SET Venture Partners, powered by Chrysalix and
Robeco B.V., is 27.5%.
The table below shows the summarized information of
the total investments in associated companies.
EUR x million 2009 2008
Share of associate’s statement
of financial position:
Current assets 0. 2 0.3
Non-current assets 0.1 0.5
Current liabilities - – 0.2
Non-current liabilities - -
Net assets 0.3 0.6
Carrying amount of investments 0.3 0.6
EUR x million 2009 2008
Share of associate’s revenue
and profit:
Revenue 0.4 0.5
Profit of associates owned as at
31 December 2009 0.1 -
Profit of associates sold in 2008 - – 0.5
Total share of profit associates 0.1 – 0.5
Investment in a joint venture
The Institute for Research and Investment Services B.V.
(IRIS) is a joint venture between Rabobank Nederland and
the Company. Its financial information is consolidated on
a 50% proportional basis.
Canara Robeco Asset Management Company Ltd. is a joint
venture in India between Canara Bank and the Company.
Its financial information is consolidated on a 49%
proportional basis.
In 2009 the Company set up Robeco TEDA (Tianjin)
Investment Management Company Ltd., a joint venture
with TEDA International (Holding) Corporation Ltd. Its
financial information is consolidated on a 51% proportional
basis.
The table below shows the share of the joint ventures that
are included in the consolidation of the Company.
EUR x million 2009 2008
Share of joint ventures’ statement
of financial position:
Current assets 2.2 3.3
Non-current assets 2.8 2.9
Current liabilities – 2.1 – 3.2
Non-current liabilities – 0.2 – 0.4
Net assets 2.7 2.6
Share of joint ventures’ revenue
and profit:
Revenue 3.8 4.2
Profit 0.1 – 3.8
24. Financial assets available-for-sale
The distinction between listed and unlisted may vary
from the way active markets and non-active markets
are distinguished. For the latter distinction, refer to
the Valuation Methodology table in note 47.
The accrued interest income on impaired financial
assets available-for-sale amounts at 31 December 2009
EUR 0.1 million (31 December 2008: EUR 0.3 million).
EUR x million 2009 2008
Listed Unlisted Total Listed Unlisted Total
Government bonds 1,625.3 - 1,625.3 1,762.1 - 1,762.1
Bank bonds 993.1 - 993.1 981.7 - 981.7
Asset-backed securities 664.4 - 664.4 633.7 - 633.7
Other debt securities 206.5 4.3 210.8 293.0 41.5 334.5
Equity securities - 60.9 60.9 - 52.3 52.3
Total 3,489.3 65.2 3,554.5 3,670.5 93.8 3,764.3

90 Annual Report 2009 Robeco Groep N.V.
Notes to the consolidated statement of financial position
25. Financial assets held-to-maturity
The distinction between listed and unlisted may vary
from the way active markets and non-active markets
are distinguished. For the latter distinction, refer to the
Valuation Methodology table in note 47.
26. Financial assets designated at fair value through profit or lossThe table below provides the fair values of the Company’s
non-trading financial assets designated at Fair value
through profit or loss.
The distinction between listed and unlisted may vary
from the way active markets and non-active markets
are distinguished. For the latter distinction, refer to the
Valuation Methodology table in note 47.
In addition to the existing mortgage portfolio with
a nominal value of EUR 400 million, the Company acquired
a EUR 200 million tranche in 2008. The mortgage portfolio
was purchased together with the accompanying saving
deposits and interest rate swaps. The package is part of
the fair value portfolio following the fair value option,
which the Company could apply as it manages the financial
assets and liabilities in the package as a group, while
evaluating its performance on a fair value basis. From
an interest rate perspective, there is no accounting
mismatch. The package’s total nominal value equaled
the total fair value on all of the above dates. Hence, there
are no revaluation results. The fair value of this particular
package at year-end amounted to:
(EUR x million) 2009 2008
Mortgage portfolio 663.0 652.2
Less: Saving deposits – 27.0 – 24.8
Less: Interest rate swaps – 47.9 – 41.8
Total 588.1 585.6
The government bonds, bank bonds and other debt
securities (all with fixed rates) are managed as a single
portfolio. Although the interest rate risk of this portfolio
is largely hedged using Interest Rate Swaps, the Company
decided not to apply hedge accounting.
The maximum credit exposure of the loans and mortgages
amounts to EUR 667.8 million (2008: EUR 657.0 million).
The change in fair value of the purchased loans and
mortgages attributable to changes in credit risk amounts
to a gain/loss of EUR 0.0 million (2008: a loss of
EUR 0.2 million).
27. Financial assets loans and advances
EUR x million 2009 2008
Loans originated from Robeco:
Private sector loans and advances
to customers
Mortgages 967.9 1,011.0
Public sector loans 462.4 54.5
Private sector loans 754.0 60.4
Bankers loans 66.9 55.1
Other 1.5 1.5
Total 2,252.7 1,182.5
The company holds collateral relating to private sector
loans consisting of securities and properties.
EUR x million 2009 2008
Listed Unlisted Total Listed Unlisted Total
Government bonds 359.5 - 359.5 463.3 - 463.3
Bank bonds 66.3 - 66.3 41.5 - 41.5
Total 425.8 - 425.8 504.8 - 504.8
EUR x million 2009 2008
Listed Unlisted Total Listed Unlisted Total
Mortgages - 663.0 663.0 - 652.2 652.2
Government bonds 439.5 - 439.5 129.3 - 129.3
Bank bonds 367.2 4.8 372.0 311.5 4.8 316.3
Other debt securities 131.8 - 131.8 69.1 - 69.1
Equity securities 15.1 - 15.1 9.2 - 9.2
Total 953.6 667.8 1,621.4 519.1 657.0 1,176.1

91Financial Statement 2009
28. Deferred tax assets and liabilities Deferred tax assets and liabilities are attributable to
the following items:
The Company paid goodwill for the acquired entities in
the United States in previous years. The related goodwill
was immediately deducted from equity prior to the
adoption of IFRS. As the amortization of goodwill for tax
purposes requires at least 15/20 years of substantial gross
profits, the Company estimates the growth of the business,
taking into account the specific assumptions of future cash
flows and market performance.
Movements in the deferred tax asset are as follows:
EUR x million 2009 2008
Balance at 1 January 262.1 255.0
Release to current tax – 30.8 – 24.1
Addition from current tax - 15.8
Currency exchange difference – 8.4 15.3
Taken to profit and loss in respect of
new temporary differences - 9.4
Valuation allowance - – 16.8
Unrealized result on investments – 4.4 7.6
Other 0.3 – 0.1
Balance at 31 December 218.8 262.1
The valuation allowance in 2008 relates to a change
in probability of utilizing the state portion that has been
recognized as a deferred tax asset in previous years.
Movements in the deferred tax liabilities are as follows:
EUR x million 2009 2008
Balance at 1 January 78.0 110.1
Change in value of financial assets
available-for-sale 0.0 – 0.1
Release to current tax – 9.4 – 22.5
Fair value adjustment of assets and
liabilities acquired in acquisitions - 0.9
Amortization of intangible assets – 8.3 – 10.4
Pensions 6.0 -
Other 0.1 0.0
Balance at 31 December 66.4 78.0
Unrecognized deferred tax assets
Deferred tax assets have not been recognized for a taxable
loss of EUR 62.5 million (2008: EUR 50.6 million) of which
EUR 51.9 million (2008: EUR 43.8 million) relates to Robeco
Gestions S.A. The remaining taxable loss relates to other
subsidiaries.
The recognition of deferred taxes is based on management
judgment to which extent the taxable profits are expected
to arise in the near future.
EUR x million
Consolidated statement of
financial positionConsolidated
income statement
2009 2008 2009 2008
Deferred tax asset
Goodwill 199.8 223.8 0.6 -
Net operating losses 7.5 22.0 – 0.5 11.2
Pensions 1.3 0.8 - -
Unrealized loss on investments
in partnerships 5.6 10.0 - -
Others 4.6 5.5 – 0.1 – 1.8
Total deferred tax assets 218.8 262.1 0.0 9.4
Deferred tax liability
Pensions 6.3 - 6.0 -
Revaluation of foreign subsidiaries 18.7 28.1 - -
Fair value adjustment of assets and
liabilities acquired in acquisitions 41.0 49.3 – 8.3 – 10.4
Other 0.4 0.6 0.0 0.1
Total deferred tax liability 66.4 78.0 – 2.3 – 10.3
Deferred tax income – 2.3 – 0.9
Deferred tax assets net 152.4 184.1

92 Annual Report 2009 Robeco Groep N.V.
Maturity of deferred tax asset and liabilities:
EUR x million 2009 2008
Deferred tax assets
Deferred tax asset to be recovered
after more than 12 months 174.4 214.7
Deferred tax asset to be recovered
within 12 months 44.4 47.4
Total deferred tax assets 218.8 262.1
EUR x million 2009 2008
Deferred tax liabilities
Deferred tax liability to be realized
after more than 12 months 49.1 60.8
Deferred tax liability to be realized
within 12 months 17.3 17.2
Total deferred tax liabilities 66.4 78.0
29. Loans and advances Total loans and advances can be broken down as follows:
EUR x million 2009 2008
Receivables securities transactions 25.3 70.5
Private sector loans and overdrafts 55.6 63.6
Placements with other banks 51.7 -
Credits collateralized by securities 33.0 21.3
Other 0.1 0.1
Total 165.7 155.5
Placements with other banks include deposits not
withdrawable on demand with terms between three
months and one year.
30. Current tax receivable and payableThe current tax receivable consists of corporate income tax
of EUR 7.2 million (2008: EUR 60.9 million). The current
tax payable consists of corporate income tax of EUR 25.3
million (2008: EUR 2.9 million).
There is no offset of income tax receivable and payable
due to the different tax jurisdictions in which the Company
is located.
Notes to the consolidated statement of financial position
31. Financial assets held for trading The fair values of the Company’s financial assets held for
trading can be broken down as follows:
The distinction between listed and unlisted may
vary from the way active markets and non-active markets
are distinguished. For the latter distinction, refer to
the Valuation Methodology table in note 47.
Financial assets held for trading include EUR 243.4 million
(2008: EUR 620.2 million) that is held to back the total
return swaps (presented as non-current liability) entered
into with Rabobank and Deutsche Bank in order to meet
specific investment objectives of note holders bearing the
investment risk arising from financial assets held for trading.
32. Other receivablesOther receivables can be broken down as follows:
EUR x million 2009 2008
Accrued income 187.7 373.3
Prepayments 7.6 5.4
Cash transfer 42.2 4.3
Other 56.6 92.2
Total 294.1 475.2
The item accrued income includes mainly items yet to
be invoiced or received, such as accrued interest and
management fees. The item Other includes an amount of
EUR 19.0 million (2008: EUR 23.0 million) for structuring
fees recognized upfront.
33. Derivative financial instrumentsThe Company hedges the foreign currency-conversion risk
of net investments in foreign entities using forward currency
contracts. At 31 December 2009 forward contracts with
a notional amount of EUR 364.1 million (2008: EUR 228.5
EUR x million 2009 2008
Listed Unlisted Total Listed Unlisted Total
Subordinated
bank bonds - - - 2.9 - 2.9
Other debt securities 227.5 - 227.5 402.1 2.7 404.8
Equity securities 64.5 464.9 529.4 84.4 658.1 742.5
Other 1.0 1.0 2.0 - 1.1 1.1
Total 293.0 465.9 758.9 489.4 661.9 1,151.3

93Financial Statement 2009
million) and a fair value of EUR -0.3 million (2008: EUR
–2.6 million) were designated as net investment hedges.
This resulted in a currency gain for the year under review
of EUR 5.1 million (2008: EUR 10.3 million loss) that was
taken to other comprehensive income. In 2009 and 2008
no amounts were withdrawn from other comprehensive
income and no amounts were recognized as ineffective
portion in the income statement.
The notional amounts and/or contract sizes of certain types
of financial instruments provide a basis for comparison
with instruments recognized in the statement of financial
position, but do not necessarily indicate the value of
future cash flows involved or the current fair value of the
instruments and, therefore, do not indicate the Company’s
exposure to credit or price risks. The notional amount
represents the value of a derivative financial instrument’s
underlying asset, reference rate or index and forms the
basis for measuring the value of the derivative financial
instrument. It provides an indication of the volume of
the Company’s business transactions but does not provide
any measure of risk. Some derivative financial instruments
are standardized in terms of their notional amounts and
settlement dates, and these are designed to be bought or
sold in active markets (exchange traded).
Others are packaged specifically for individual customers
and are not publicly listed, as they may be bought and sold
between counterparties at negotiated prices (Over the
Counter instruments).
Positive fair value represents the cost to the Company
of replacing all transactions with a receivable amount
if all the counterparties were to default. Negative fair
value represents the cost incurred by the counterparties
in replacing all the transactions if the Company were
to default. The total positive and negative fair values
are included separately in the statement of financial
position. The derivative financial instruments become
favorable (assets) or unfavorable (liabilities) as a result
of fluctuations in the underlying risk factors, like interest
rate or foreign exchange rate movements relative to their
terms. The total contract or notional amount of derivative
financial instruments held, the degree to which these
instruments are favorable or not favorable, and hence
the total fair value of the derivative financial assets and
liabilities may fluctuate significantly.
The table below provides the notional amounts and
the positive and negative fair values of the Company’s
derivative transactions.
EUR x million 2009 2008
Contract/Notional Fair values Contract/ Notional Fair values
Amount Assets Liabilities Amount Assets Liabilities
Net Investment hedge
Forward currency 364.1 - 0.3 228.5 - 2.6
Derivatives held for hedge accounting - 0.3 - 2.6
Funded total return swaps 4.0 4.0 - 56.3 56.3 -
Forward currency 129.6 0.1 0.4 184.8 1.9 2.8
Interest rate swaps 2,064.0 8.6 112.0 1,882.4 7.0 80.6
Swaptions 71.7 0.8 - 85.3 2.1 2.1
Equity swaps 18.4 2.6 21.0 7.9 8.7 0.8
Credit default swaps 133.0 0.1 1.9 69.6 2.6 0.2
Other - 1.0 0.5 - 1.9 1.3
Derivatives not held for hedge accounting 17.2 135.8 80.5 87.8
Total recognized derivatives financial
instrument 17.2 136.1 80.5 90.4
Of which:
Non-current 16.1 134.1 76.7 79.4
Current 1.1 2.0 3.8 11.0
Total 17.2 136.1 80.5 90.4
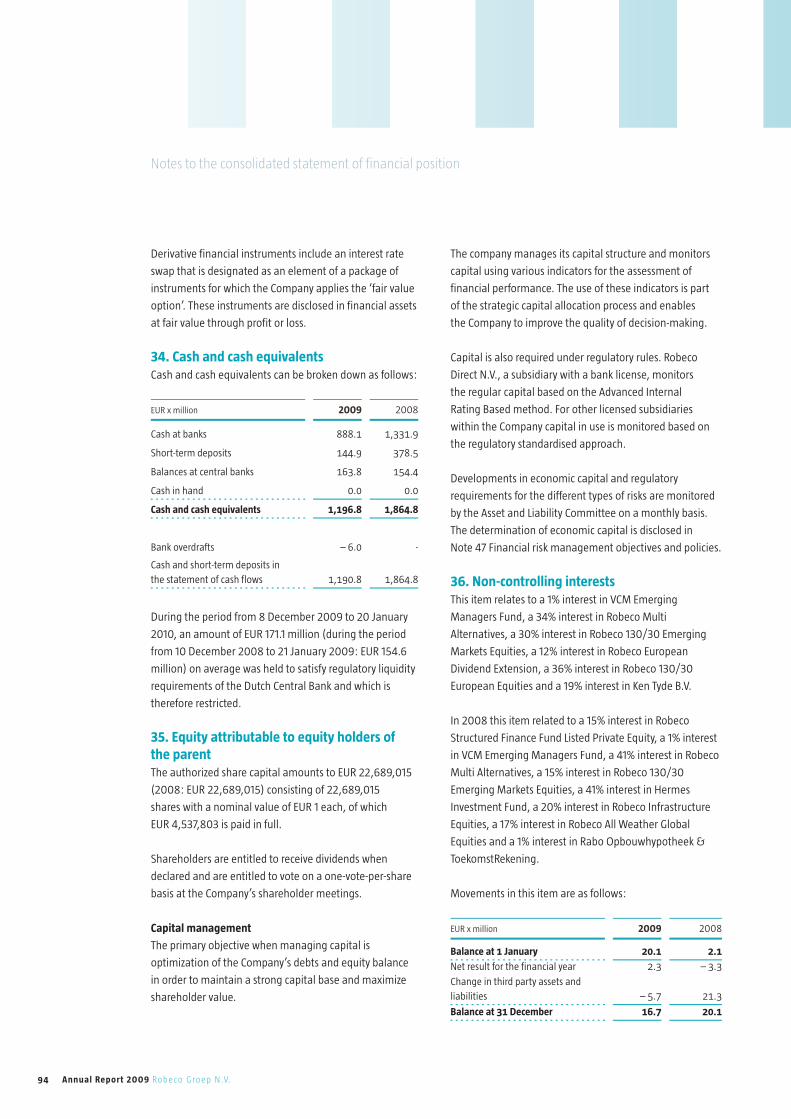
94 Annual Report 2009 Robeco Groep N.V.
Notes to the consolidated statement of financial position
Derivative financial instruments include an interest rate
swap that is designated as an element of a package of
instruments for which the Company applies the ‘fair value
option’. These instruments are disclosed in financial assets
at fair value through profit or loss.
34. Cash and cash equivalentsCash and cash equivalents can be broken down as follows:
EUR x million 2009 2008
Cash at banks 888.1 1,331.9
Short-term deposits 144.9 378.5
Balances at central banks 163.8 154.4
Cash in hand 0.0 0.0
Cash and cash equivalents 1,196.8 1,864.8
Bank overdrafts – 6.0 -
Cash and short-term deposits in
the statement of cash flows 1,190.8 1,864.8
During the period from 8 December 2009 to 20 January
2010, an amount of EUR 171.1 million (during the period
from 10 December 2008 to 21 January 2009: EUR 154.6
million) on average was held to satisfy regulatory liquidity
requirements of the Dutch Central Bank and which is
therefore restricted.
35. Equity attributable to equity holders of the parentThe authorized share capital amounts to EUR 22,689,015
(2008: EUR 22,689,015) consisting of 22,689,015
shares with a nominal value of EUR 1 each, of which
EUR 4,537,803 is paid in full.
Shareholders are entitled to receive dividends when
declared and are entitled to vote on a one-vote-per-share
basis at the Company’s shareholder meetings.
Capital management
The primary objective when managing capital is
optimization of the Company’s debts and equity balance
in order to maintain a strong capital base and maximize
shareholder value.
The company manages its capital structure and monitors
capital using various indicators for the assessment of
financial performance. The use of these indicators is part
of the strategic capital allocation process and enables
the Company to improve the quality of decision-making.
Capital is also required under regulatory rules. Robeco
Direct N.V., a subsidiary with a bank license, monitors
the regular capital based on the Advanced Internal
Rating Based method. For other licensed subsidiaries
within the Company capital in use is monitored based on
the regulatory standardised approach.
Developments in economic capital and regulatory
requirements for the different types of risks are monitored
by the Asset and Liability Committee on a monthly basis.
The determination of economic capital is disclosed in
Note 47 Financial risk management objectives and policies.
36. Non-controlling interestsThis item relates to a 1% interest in VCM Emerging
Managers Fund, a 34% interest in Robeco Multi
Alternatives, a 30% interest in Robeco 130/30 Emerging
Markets Equities, a 12% interest in Robeco European
Dividend Extension, a 36% interest in Robeco 130/30
European Equities and a 19% interest in Ken Tyde B.V.
In 2008 this item related to a 15% interest in Robeco
Structured Finance Fund Listed Private Equity, a 1% interest
in VCM Emerging Managers Fund, a 41% interest in Robeco
Multi Alternatives, a 15% interest in Robeco 130/30
Emerging Markets Equities, a 41% interest in Hermes
Investment Fund, a 20% interest in Robeco Infrastructure
Equities, a 17% interest in Robeco All Weather Global
Equities and a 1% interest in Rabo Opbouwhypotheek &
ToekomstRekening.
Movements in this item are as follows:
EUR x million 2009 2008
Balance at 1 January 20.1 2.1
Net result for the financial year 2.3 – 3.3
Change in third party assets and
liabilities – 5.7 21.3
Balance at 31 December 16.7 20.1

95Financial Statement 2009
37. Subordinated loansTwo loans totaling EUR 37.7 million (2008: EUR 37.7
million) have been granted by Rabobank Nederland at
a variable interest rate to Robeco Direct N.V. The loans are
subordinated to all other present and future liabilities of
Robeco Direct N.V. The term is indefinite and subject to
a five-year notice period. The loans were granted as a result
of the solvency rules set by the Dutch Central Bank and can
only be repaid when the Dutch Central Bank removes
the subordination in writing.
The average variable interest rates paid on the loans
were as follows:
EUR x million Average Interest rate (Euribor + 40bp)
EUR 2009 2008
Rabobank Nederland 26.3 2.01% 5.02%
Rabobank Nederland 11.4 2.08% 5.08%
38. Other interest-bearing loans and borrowingsTotal other interest-bearing loans and borrowings
amounted to EUR 199.3 million (2008: EUR 206.1 million).
To finance acquisitions, Rabobank Nederland has granted
loans to Robeco Groep N.V. subsidiaries. The loans
have a fixed interest rate for a period of ten, eleven or
fifteen years. On the interest-adjustment date, the loan
is repayable by the borrower at par value. In principle
the loans are non-current.
These amounts can be broken down as follows:
(EUR x million) Year
Effective interest
rateOriginal
Maturity Currency 2009 2008
Robeco Institutional
Asset Management B.V. 2006 4.19% 10 Yrs EUR 1.6 1.6
Robeco Institutional
Asset Management B.V. 2007 3.13% 15 Yrs CHF 7.0 7.0
Robeco US Holding, Inc. 2007 4.82% 11 Yrs USD 278.2 278.2
39. ProvisionsThe components of provisions are as follows:
EUR x million 2009 2008
Provision for onerous contracts 6.3 5.5
Legal, tax and social security
provisions 0.1 3.8
Restructuring provision 0.3 4.3
Total 6.7 13.6
The provisions mainly relate to a rental agreement
for office space, tax issues and termination benefits.
]Movements in provisions are as follows:
Maturity dates of provisions at 31 December 2009:
The maturity and amounts of the provisions are based on
management’s best estimate.
EUR x millionProvision for onerous contracts
Legal, tax and social securityprovisions
Restructuring provision
2009 2008 2009 2008 2009 2008
Balance at 1 January 5.5 0.6 3.8 3.3 4.3 -
Disposals - – 0.1 – 0.5 – 0.6 - -
Additions 1.4 5.3 0.4 1.8 - 4.9
Charged – 0.6 – 0.3 – 3.6 – 0.7 – 3.8 – 1.2
Exchange rate differences - - - - – 0.2 0.6
Balance at 31 December 6.3 5.5 0.1 3.8 0.3 4.3
EUR x millionUp to 1 year 1 -5 years
More than 5 years Total
Provision for onerous
contracts 3.4 2.9 - 6.3
Legal, tax and social
security provisions 0.1 - - 0.1
Restructuring provision 0.3 - - 0.3
Total 3.8 2.9 - 6.7

96 Annual Report 2009 Robeco Groep N.V.
Notes to the consolidated statement of financial position
40. Pension asset and employee benefit liability
EUR x million 2009 2008
Pension asset 24.7 0.7
Pension asset 24.7 0.7
Pension liability 1.2 1.0
Other employee benefits 14.2 39.8
Balance pension liability 15.4 40.8
Net balance 9.3 – 40.1
The 2008 figure regarding other employee benefits
has been adjusted with EUR 27.6 million to include all
liabilities related to postponed payments. This amount was
previously categorized under Trade and other payables.
In The Netherlands, the Company grants non-contributory
pension benefits based on a final pay scheme to all
employees on attaining 65 years of age. This defined
benefit plan consists of a retirement pension, a widow/
widower’s- and orphans pension and a disability pension.
The plan only applies to salaries up to EUR 72,703 (2008:
EUR 72,703). A defined contribution plan is applied for
salaries exceeding that amount.
The amounts recognized as a pension asset/liability in the
statement of financial position are determined as follows:
The movement in the asset/liability recognized in
the statement of financial position is as follows:
EUR x million 2009 2008
Balance at 1 January – 0.3 – 1.4
Total company expense – 4.4 – 9.1
Actual employer contributions 28.2 10.2
Balance at 31 December 23.5 – 0.3
EUR x million 2009 2008 2007 2006 2005
Defined benefit
obligation – 250.7 – 190.5 – 194.1 – 203.9 – 196.7
Fair value of plan assets 241.1 195.3 203.3 182.6 165.9
Funded status of plan – 9.6 4.8 9.2 – 21.3 – 30.8
Unrecognized actuarial
gains and losses 33.1 – 5.1 – 10.6 18.0 24.0
Net liability 23.5 – 0.3 – 1.4 – 3.3 – 6.8
The movement in the defined benefit obligation is as
follows:
EUR x million 2009 2008
Balance at 1 January 190.5 194.1
Net service cost 10.2 9.2
Interest cost 12.3 10.0
Curtailment gain – 5.9 -
Benefits paid – 8.1 – 4.7
Participant contributions 0.4 0.4
Actuarial gains and losses – 12.6 – 18.5
Liability gains and losses due to
assumption changes 63.9 -
Balance at 31 December 250.7 190.5
The disclosed amount of EUR 63.9 million, under Liability
gains and losses due to assumption changes, comprises of
EUR 21.1 million related to 2009 and EUR 42.8 million
to 2008. For 2008 in particular the developments in
the yields of the iBoxx indices of AA-rated corporate bonds in
the Eurozone region resulted in a change of the discount rate.
The movement in the fair value of the plan assets is as
follows:
EUR x million 2009 2008
Balance at 1 January 195.3 203.3
Expected return on plan assets 12.1 12.0
Actual employer contributions 28.2 10.2
Participant contributions 0.4 0.4
Benefits paid – 8.1 – 4.7
Actuarial gain and losses 13.2 – 25.9
Balance at 31 December 241.1 195.3
The amounts recognized in the income statement are
as follows:
EUR x million 2009 2008
Net service costs 10.2 9.2
Interest expense 12.3 10.0
Expected return on plan assets – 12.1 – 12.0
Amortization of actuarial gains
and losses 1.7 -Amortization of past service costs - 0.1
Curtailment gain – 5.9 -
Changes in irrevocable surplus – 1.8 1.8
Total pension expense 4.4 9.1

97Financial Statement 2009
In 2009 actuarial gains and losses were amortized due to
curtailments and the corridor being exceeded. All costs
are classified as employee benefit expenses. Effective
1 January 2008 the Company adopted IFRIC 14 which is
an interpretation of IAS 19 accounting standard published
by the IASB. It provides guidance on how the economic
benefit available to the employer in the form of surplus
refunds and reductions in contributions should be
determined, in particular when a minimum funding
requirement exists. The application of the Standard
resulted in a EUR 1.9 million additional pension expense
in 2008. In 2009 it became apparent that the limitation
applied in 2008 no longer existed and had been reversed.
This is reflected in the line Changes in irrevocable surplus.
Restructuring and outsourcing activities were carried out
in 2009. The pension accrual for employees concerned
was discontinued and the accrued rights became vested.
The curtailment recorded in 2009 reflects the related
financial impact.
The principal actuarial assumptions used are as follows:
EUR x million 2009 2008
Discount rate 4.90% at 31-12-‘09 5.60% at 31-12-’08
Expected return on plan assets 6.00% at 31-12-‘09 6.00% at 31-12-’08
Inflation 2.00% per annum 2.00% per annum
General salary increase 3.00% per annum 3.00% per annum
Future pension increase 1.60% per annum 2.00% per annum
Career salary progression
AGE (male - female):
20-30 6.89%-5.73% per annum 10.76%-8.44% per annum
31-35 5.49%-5.10% per annum 7.93%-6.71% per annum
36-39 4.80%-3.87% per annum 6.92%-4.75% per annum
40-44 3.96%-3.34% per annum 5.35%-4.02% per annum
45-49 2.93%-2.67% per annum 4.16%-3.34% per annum
>50 2.36%-2.35% per annum 2.79%-2.31% per annum
Increase in social security offset 2.00% per annum 2.00% per annum
Increase in accrued pensions of
active participants 1.60% per annum 2.00% per annum
Increase in pensions in payment
and vested benefits of deferred
pensioners 1.60% per annum 2.00% per annum
Mortality rates According to mortality
tables, age setback of
two years for men and
one year for women
According to mortality
tables, age setback of two
years for men and one
year for women
Disability rates (male – female)
AGE:
<20 0.07%-0.12% -
20-24 0.07%-0.12% 0.07%-0.12%
25-29 0.12%-0.23% 0.12% -0.23%
30-34 0.18%-0.32% 0.18% - 0.32%
35-39 0.25%-0.42% 0.25% -0.42%
40-44 0.33%-0.53% 0.33% -0.53%
45-49 0.44%-0.65% 0.44% - 0.65%
50-54 0.57%-0.80% 0.57% - 0.80%
55-59 0.73%-0.98% 0.73% - 0.98%
60-65 0.93%-1.22% 0.93% - 1.22%
Correction factor on disability rates 0.77 0.77
Withdrawal rates (male – female)
AGE:
20-39 6.34%-3.53% 6.45% - 3.95%
40-44 1.16%-0.39% 1.07% - 0.43%
45-49 0.50%-0.33% 0.48% - 0.29%
50-54 0.19%-0.21% 0.19% - 0.17%
55-65 0.43%-0.12% 0.56% - 0.10%

98 Annual Report 2009 Robeco Groep N.V.
Notes to the consolidated statement of financial position
With respect to the pension plan the actual allocation of
the plan assets is as follows:
Percentage of the plan assets 2009
Percentage of the plan assets 2008
Equity securities 40.0% 38.0%
Debt securities 60.0% 62.0%
Total 100.0% 100.0%
The item Other employee benefits consists mainly of long
term liabilities regarding equity notes and postponed
employee’s variable income.
Share-based payments
One of the subsidiaries of the Company has share-based
payment arrangements in place for employees and
members of the Board of Directors of the subsidiary. For
this purpose 225,000 start shares have been created from
authorized share capital of the subsidiary. The rights of
employee shareholders will vest over a period of three
years in equal portions. In 2008 75,000 start shares were
allotted to employees. The allotments of the start shares
are made by the Board of Directors of the subsidiary
countersigned by the Company. The allotment was in full
at the Closing Date.
In addition to the start shares the subsidiary could create
a maximum of 456,917 shares for allotment to employees
as bonus shares for the years 2007 to 2009. The rights
of employee shareholders will vest over a period of three
years, not necessarily in equal portions. The rights of
employee shareholders to whom bonus shares were
allotted will vest immediately and might be sold to the
Company at any time. In total 150,000 bonus shares were
allotted in 2007 and 187,701 bonus shares were allotted
in 2008.
The Company did not allot start shares or bonus shares in
2009 as it agreed to accelerate the full closing of the share-
based payment arrangement. The arrangements are to
be replaced by a new (share-based) incentive plan effective
as of 1 July 2010. The number of shares to be allotted
in the future under the new incentive plan depends on
the actually achieved EBIT (Earnings before interest and
tax) in future years.
The Company pays the nominal value of both the start
shares and the bonus shares.
The fair value of the abovementioned arrangements is
based on 75% of the cumulative EBIT for the four business
year quarters immediately preceding the option’s effective
date plus 25% of the cumulative EBIT for the business
year quarters immediately preceding said four business
quarters. The EBIT is established by the subsidiary and
has to be mutually agreed upon by the Company and the
Employee Shareholder Representative of the subsidiary.
As at 31 December 2009 the Company had no liability
(2008: EUR 3.8 million). The total expense related to share
based payments recognized for the period is reported under
Employee benefits expense.
41. Other non-current liabilities The amount of EUR 1.3 million (2008: EUR 2.8 million)
relates to management fees received in advance.
42. Interest-bearing loans due to customers
EUR x million 2009 2008
Savings available on demand 6,491.5 4,444.4
Savings not available on demand 648.6 3,080.2
Current accounts / settlement accounts 2.2 2.2
Other 1.2 0.2
Total 7,143.5 7,527.0
The savings available on demand refer to the saving
accounts of private customers and non-private customers.
Savings not available on demand are fixed-term savings
accounts and deposits provided by customers and some of
the funds managed by the Company. The current accounts
and settlement accounts consist of non-private customers.
43. Interest-bearing loans due to banks
(EUR x million) 2009 2008
Call money / balances available
on demand 1,018.1 666.5
Liability securities transactions 43.8 17.7
Total 1,061.9 684.2

99Financial Statement 2009
Call money / balances available on demand refer to saving
accounts via third party distributors.
44. Total return swapsThe fair value of the funded total return swaps, of which
EUR 227.8 million (2008: EUR 608.0 million) was entered
into with Rabobank and EUR 15.6 million with Deutsche
Bank (2008: EUR 12.2 million) depends on the value of
the underlying investments (see note 31 ‘Financial assets
held for trading’) that are held to meet the specific
investment objectives of note holders who bear
the investment risk arising from these investments.
The total return swaps can be broken down as follows:
All funded total return swaps have maturities longer than
one year.
45. Trade and other payables
EUR x million 2009 2008
Accrued interest 159.7 197.5
Issued securities designated at fair
value through profit or loss 358.7 165.1
Issued securities at amortized cost 2.2 2.3
Financial liabilities held for trading 6.2 0.7
Creditors 93.3 117.2
Employee benefits obligation 40.4 40.3
Other non financial liabilities 106.2 117.8
Total 766.7 640.9
Accrued interest relates to customers savings. The item
Other includes obligations accrued subadvisor fees, VAT
payable and other accrued expenses payable.
A reclassification has been made for 2008 from this item
to Other employee benefits liability because the settlement
will not take place within one year.
Issued securities are mainly stated at fair value. At
31 December 2009, the nominal amount equals EUR 386.8
million (2008: EUR 216.9 million). The Company issued
principal protected (EUR 207.8 million nominal value;
EUR 204.8 million fair value) and non-principal protected
(EUR 179.0 million nominal value; EUR 156.1 million fair
value) structured notes. All notes are linked to Robeco’s
private equity, commodity trading advisor and fixed-income
capabilities. The Company did not observe any credit events
during 2009 and 2008 that affected the fair value of the
issued securities.
46. Contingent assets and liabilities
Operating lease, rental commitments and IT services
The Company has entered into commercial leases
regarding the car fleet. The term of these leases is between
1 and 5 years. The Company and its subsidiaries have
rental commitments regarding buildings. These rental
commitments have remaining terms of between 1 and
10 years. The Company outsourced the IT infrastructure
activities to EDS as of 1 January 2009. The outsourcing
scope covers the operational IT infrastructure as well
as IT infrastructure projects.
Future minimum payments and rentals are as follows:
Employee benefits
Robeco Nederland B.V. guarantees the obligations
of Stichting Pensioenfonds Robeco. This includes a
commitment to achieve a funding level of at least 105% of
the obligation. This minimum funding requirement was
met at 31 December 2009. As at 31 December 2008 a
contribution of EUR 12.7 million was required, which was
settled in January 2009.
EUR x million 2009 2008
Contract/
notional
Amount
Fair values
Liabilities
Contract/
notional
Amount
Fair values
Liabilities
Derivatives not designated
for hedge accounting
Funded total return swaps 243.4 243.4 620.2 620.2
EUR x million 2009 2008
Operating
lease
Rental
commit-
ments
IT
services
Operating
lease
Rental
commit-
ments
IT
services
Less than one year 2.0 12.9 11.4 2.7 14.8 -
Between one and five years 3.1 39.0 34.2 2.5 53.1 -
More than five years - 17.2 - - 31.5 -
Total 5.1 69.1 45.6 5.2 99.4 -
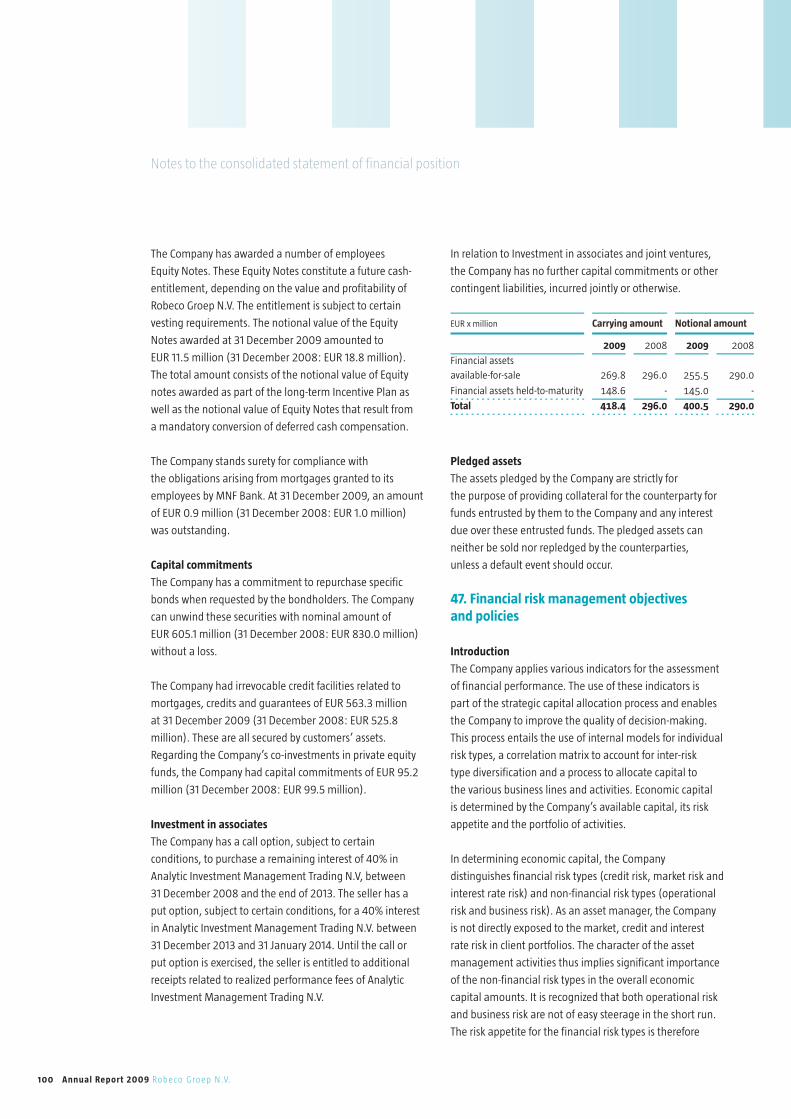
100 Annual Report 2009 Robeco Groep N.V.
The Company has awarded a number of employees
Equity Notes. These Equity Notes constitute a future cash-
entitlement, depending on the value and profitability of
Robeco Groep N.V. The entitlement is subject to certain
vesting requirements. The notional value of the Equity
Notes awarded at 31 December 2009 amounted to
EUR 11.5 million (31 December 2008: EUR 18.8 million).
The total amount consists of the notional value of Equity
notes awarded as part of the long-term Incentive Plan as
well as the notional value of Equity Notes that result from
a mandatory conversion of deferred cash compensation.
The Company stands surety for compliance with
the obligations arising from mortgages granted to its
employees by MNF Bank. At 31 December 2009, an amount
of EUR 0.9 million (31 December 2008: EUR 1.0 million)
was outstanding.
Capital commitments
The Company has a commitment to repurchase specific
bonds when requested by the bondholders. The Company
can unwind these securities with nominal amount of
EUR 605.1 million (31 December 2008: EUR 830.0 million)
without a loss.
The Company had irrevocable credit facilities related to
mortgages, credits and guarantees of EUR 563.3 million
at 31 December 2009 (31 December 2008: EUR 525.8
million). These are all secured by customers’ assets.
Regarding the Company’s co-investments in private equity
funds, the Company had capital commitments of EUR 95.2
million (31 December 2008: EUR 99.5 million).
Investment in associates
The Company has a call option, subject to certain
conditions, to purchase a remaining interest of 40% in
Analytic Investment Management Trading N.V, between
31 December 2008 and the end of 2013. The seller has a
put option, subject to certain conditions, for a 40% interest
in Analytic Investment Management Trading N.V. between
31 December 2013 and 31 January 2014. Until the call or
put option is exercised, the seller is entitled to additional
receipts related to realized performance fees of Analytic
Investment Management Trading N.V.
In relation to Investment in associates and joint ventures,
the Company has no further capital commitments or other
contingent liabilities, incurred jointly or otherwise.
Pledged assets
The assets pledged by the Company are strictly for
the purpose of providing collateral for the counterparty for
funds entrusted by them to the Company and any interest
due over these entrusted funds. The pledged assets can
neither be sold nor repledged by the counterparties,
unless a default event should occur.
47. Financial risk management objectives and policies
Introduction
The Company applies various indicators for the assessment
of financial performance. The use of these indicators is
part of the strategic capital allocation process and enables
the Company to improve the quality of decision-making.
This process entails the use of internal models for individual
risk types, a correlation matrix to account for inter-risk
type diversification and a process to allocate capital to
the various business lines and activities. Economic capital
is determined by the Company’s available capital, its risk
appetite and the portfolio of activities.
In determining economic capital, the Company
distinguishes financial risk types (credit risk, market risk and
interest rate risk) and non-financial risk types (operational
risk and business risk). As an asset manager, the Company
is not directly exposed to the market, credit and interest
rate risk in client portfolios. The character of the asset
management activities thus implies significant importance
of the non-financial risk types in the overall economic
capital amounts. It is recognized that both operational risk
and business risk are not of easy steerage in the short run.
The risk appetite for the financial risk types is therefore
Notes to the consolidated statement of financial position
EUR x million Carrying amount Notional amount
2009 2008 2009 2008
Financial assets
available-for-sale 269.8 296.0 255.5 290.0
Financial assets held-to-maturity 148.6 - 145.0 -
Total 418.4 296.0 400.5 290.0

101Financial Statement 2009
the result of the available capital and the required capital
for the non-financial risk types.
The Company does however allocate capital to the financial
risk types, notably market risk and credit risk, since banking
activities form an integral part of the Company’s activities.
This capital allocation is influenced by the requirements for
seed capital and co-investments, secondary market support
and (dynamic) hedging of structured products issued by
Robeco. The provision of seed capital and co-investments
serves to build a track record for a fund or trading
strategy and/or to achieve alignment of interest between
investment manager and the investor. Limits for these
activities, both in terms of notional amounts and in terms
of risk and risk capital are reviewed on an annual basis.
The objective of the Company’s Asset and Liability
Management activities is geared towards optimizing
interest rate risk results within the risk and other
boundaries set by the Asset and Liability Committee.
These boundaries and the allocation of capital to credit risk
and interest rate risk depend on availability of risk capital
and on the opportunities in the markets.
The financial crisis broken out in 2008 produced a second
wave at the beginning of 2009. Close monitoring of
the risks continued to be required in times where the
robustness of financial institutions, the financial system as
a whole and even sovereigns were put under great stress.
The crisis consultation committee consisting of members
of the board of the Robeco Group’s various companies,
supported by representatives of several departments such
as Corporate Compliance and Risk Management continued
to show its value.
Credit risk
Credit risk is governed by the Credit Risk Policies, which
are approved by the Asset and Liability Committee and the
Management Board of the bank, Robeco Direct N.V. Credit
risk mainly relates to the Asset and Liability Management
activity in this banking entity of the Group, whereby
entrusted savings are invested in predominantly investment
grade bonds. Additional sources of credit risk are domestic
residential mortgages, private loans collateralized by
securities, counterparty credit risk in the trading and
investment books of the Bank and the Company and
the co-investment positions (mainly private equity).
The Company has significantly revised its credit risk
monitoring process over the past years. Robeco Direct N.V.
received approval for the use of the Advanced Internal
Rating Based (‘IRB-A’) approach to calculate regular capital
requirements for credit risk as per 1 January 2009. As
a Rabobank entity, the Company also reports to Rabobank
Group on an IRB-A basis.
An overall limit in terms of Economic Capital applies.
For most credit exposures, the calculation of capital
requirements is based on the use of internal models for
Probability of Default, Loss Given Default, Exposure At
Default and Maturity. For securitizations Robeco applies the
Rating Based Approach capital requirement methodology
of the Basel II Securitization Framework. For equity
exposures in the banking book, the Simple Risk Weight
approach applies. For the immaterial portfolios (loans
collateralized by securities, non-retail mortgages and the
corporate bonds in the banking portfolio) the Company
applies the Standardized Approach.
The overall Economic Capital limit is complemented
by a set of controls aiming to prevent concentration risk
in the portfolio. Controls relate to the exposure by issuer,
issue and by sector. Additionally, the size of portfolios
of corporate exposures, mortgages and Asset Backed
Securities is contained by a strict limit and control structure.
Dealings may only be undertaken in authorized products
to secure correct processing through front, mid and back
office systems.
The management of Robeco Direct N.V. receives credit
risk reports on a weekly basis. The Asset and Liability
Committee receives monthly credit risk reports containing
a detailed overview of the different types of exposures
and the corresponding capital requirements, as well as an
analysis of the changes in the credit risk exposures. The
report also includes a description of market developments.
The table below shows the maximum exposure to credit
risk for the components of the statement of financial
position, including derivative financial instruments.
The maximum exposure is shown gross, before the effect of
mitigation through the use of master netting and collateral
agreements.

102 Annual Report 2009 Robeco Groep N.V.
Notes to the consolidated statement of financial position
EUR x million Notes 2009 2008
Non-current assets Financial assets
Available-for-sale 24 3,554.5 3,764.3
Held-to-maturity 25 425.8 504.8
At fair value through profit or loss 26 1,621.4 1,176.1
Loans and advances 27 2,252.7 1,182.5
Derivative financial instruments 33 16.1 76.7
Current assets Loans and advances 29 165.7 155.5
Derivative financial instruments 33 1.1 3.8
Cash and cash equivalents (excluding cash in hand) 34 1,196.8 1,864.8
Total 9,234.1 8,728.5
Off-balance sheet itemsCredit-related obligations 46 658.5 625.3
Total maximum credit risk exposure 9,892.6 9,353.8
Where financial instruments are recorded at fair value
the amounts shown above represent the current credit
risk exposure but not the maximum risk exposure that
could arise in the future as a result of changes in values.
The credit-related obligations consist of irrevocable credit
facilities related to mortgages, credits and guarantees of
EUR 562.8 million at 31 December 2009 (31 December
2008: EUR 525.8 million). These are secured by customers’
assets. Regarding the Company’s co-investments in private
equity funds, the Company has capital commitments of
EUR 95.3 million at 31 December 2009 (31 December
2008: EUR 99.5 million).
Risk concentrations of the maximum exposure to
credit risk
Concentration of risk is managed by counterparty.
The maximum credit exposure to one client or counterparty
as of 31 December 2009 was EUR 1,006 million in
the category Institutional investors (31 December 2008:
EUR 1,654 million).
EUR x million 2009 2009 2008 2008
EUR % EUR %
Counterparty risk concentrations of the maximum exposure to credit risk
Central governments and central banks 4,001.2 40.5 2,673.8 28.6
Institutional investors 2,448.0 24.7 3,262.9 34.9
Corporates 231.7 2.3 396.5 4.2
Retail 2,204.4 22.3 2,142.4 22.9
Equity 187.0 1.9 169.5 1.8
Securitizations 820.3 8.3 708.7 7.6
Total maximum credit risk exposure 9,892.6 100.0 9,353.8 100.0
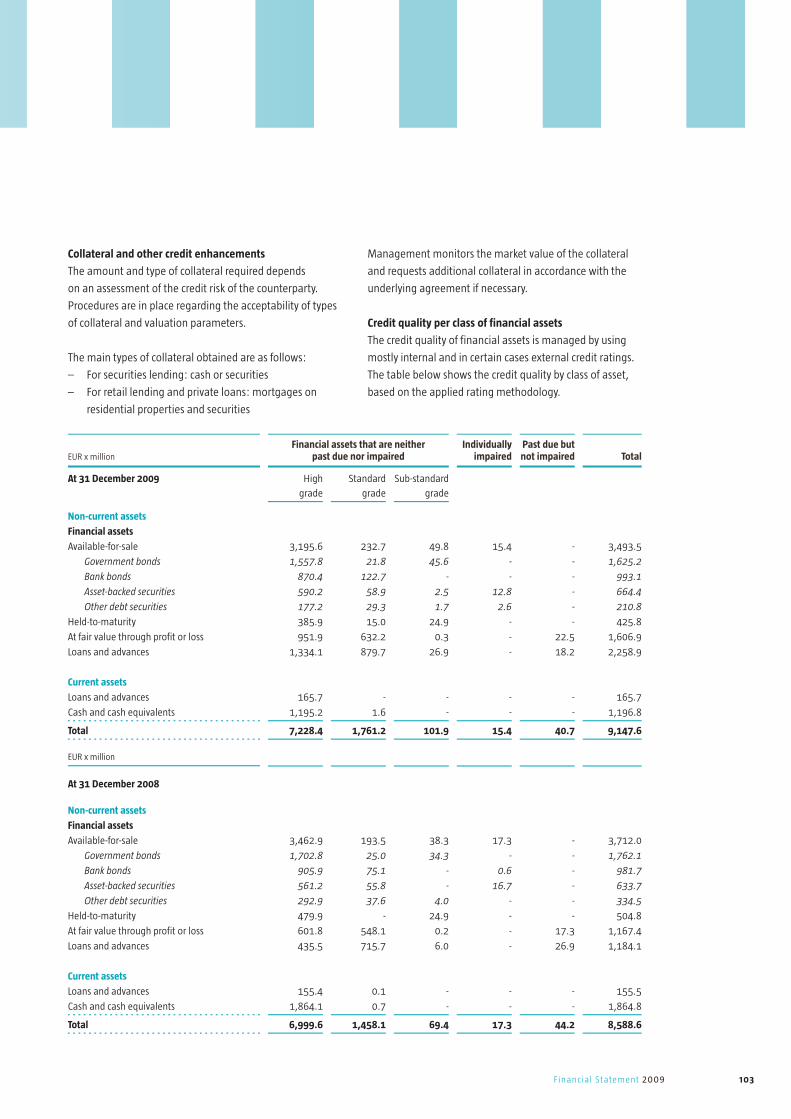
103Financial Statement 2009
Collateral and other credit enhancements
The amount and type of collateral required depends
on an assessment of the credit risk of the counterparty.
Procedures are in place regarding the acceptability of types
of collateral and valuation parameters.
The main types of collateral obtained are as follows:
– For securities lending: cash or securities
– For retail lending and private loans: mortgages on
residential properties and securities
Management monitors the market value of the collateral
and requests additional collateral in accordance with the
underlying agreement if necessary.
Credit quality per class of financial assets
The credit quality of financial assets is managed by using
mostly internal and in certain cases external credit ratings.
The table below shows the credit quality by class of asset,
based on the applied rating methodology.
EUR x million Financial assets that are neither
past due nor impairedIndividually
impairedPast due but not impaired Total
At 31 December 2009 High
grade
Standard
grade
Sub-standard
grade
Non-current assets
Financial assets
Available-for-sale 3,195.6 232.7 49.8 15.4 - 3,493.5
Government bonds 1,557.8 21.8 45.6 - - 1,625.2
Bank bonds 870.4 122.7 - - - 993.1
Asset-backed securities 590.2 58.9 2.5 12.8 - 664.4
Other debt securities 177.2 29.3 1.7 2.6 - 210.8
Held-to-maturity 385.9 15.0 24.9 - - 425.8
At fair value through profit or loss 951.9 632.2 0.3 - 22.5 1,606.9
Loans and advances 1,334.1 879.7 26.9 - 18.2 2,258.9
Current assets
Loans and advances 165.7 - - - - 165.7
Cash and cash equivalents 1,195.2 1.6 - - - 1,196.8
Total 7,228.4 1,761.2 101.9 15.4 40.7 9,147.6
EUR x million
At 31 December 2008
Non-current assets
Financial assets
Available-for-sale 3,462.9 193.5 38.3 17.3 - 3,712.0
Government bonds 1,702.8 25.0 34.3 - - 1,762.1
Bank bonds 905.9 75.1 - 0.6 - 981.7
Asset-backed securities 561.2 55.8 - 16.7 - 633.7
Other debt securities 292.9 37.6 4.0 - - 334.5
Held-to-maturity 479.9 - 24.9 - - 504.8
At fair value through profit or loss 601.8 548.1 0.2 - 17.3 1,167.4
Loans and advances 435.5 715.7 6.0 - 26.9 1,184.1
Current assets
Loans and advances 155.4 0.1 - - - 155.5
Cash and cash equivalents 1,864.1 0.7 - - - 1,864.8
Total 6,999.6 1,458.1 69.4 17.3 44.2 8,588.6
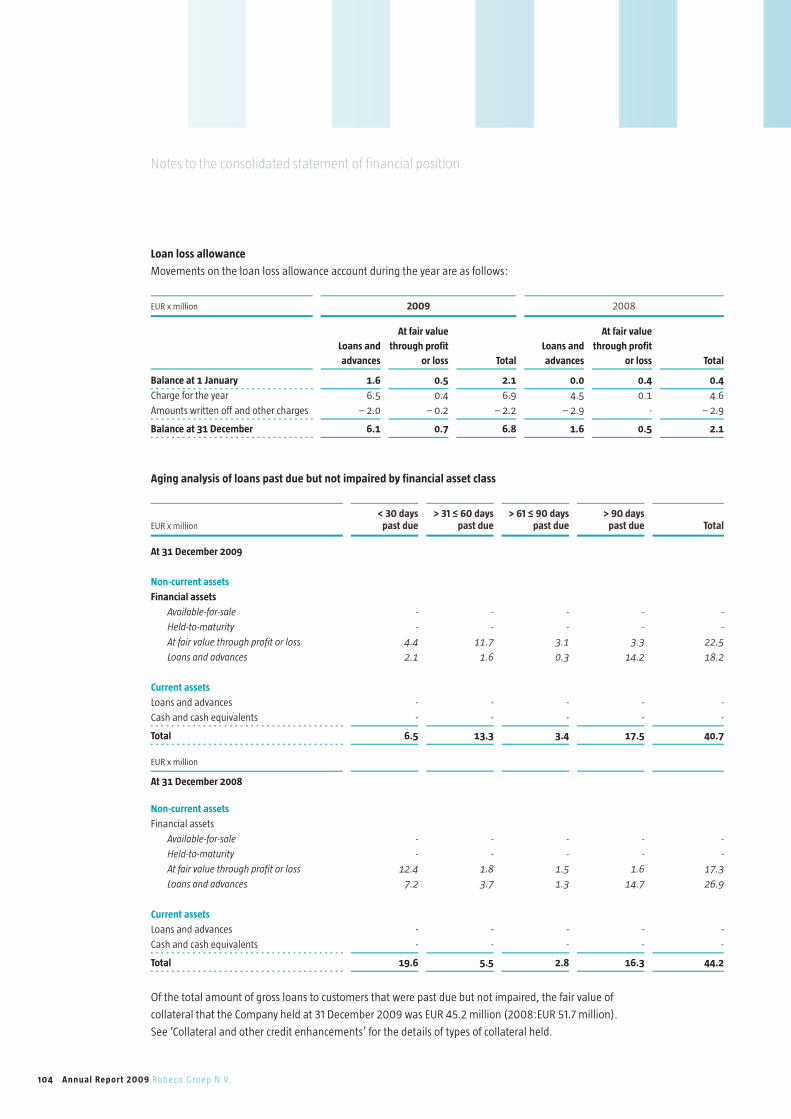
104 Annual Report 2009 Robeco Groep N.V.
Loan loss allowance
Movements on the loan loss allowance account during the year are as follows:
Aging analysis of loans past due but not impaired by financial asset class
Notes to the consolidated statement of financial position
EUR x million 2009 2008
Loans and
advances
At fair value
through profit
or loss Total
Loans and
advances
At fair value
through profit
or loss Total
Balance at 1 January 1.6 0.5 2.1 0.0 0.4 0.4
Charge for the year 6.5 0.4 6.9 4.5 0.1 4.6
Amounts written off and other charges – 2.0 – 0.2 – 2.2 – 2.9 - – 2.9
Balance at 31 December 6.1 0.7 6.8 1.6 0.5 2.1
EUR x million< 30 days
past due> 31 ≤ 60 days
past due> 61 ≤ 90 days
past due> 90 days
past due Total
At 31 December 2009
Non-current assets
Financial assets
Available-for-sale - - - - -
Held-to-maturity - - - - -
At fair value through profit or loss 4.4 11.7 3.1 3.3 22.5
Loans and advances 2.1 1.6 0.3 14.2 18.2
Current assets
Loans and advances - - - - -
Cash and cash equivalents - - - - -
Total 6.5 13.3 3.4 17.5 40.7
EUR x million
At 31 December 2008
Non-current assets
Financial assets
Available-for-sale - - - - -
Held-to-maturity - - - - -
At fair value through profit or loss 12.4 1.8 1.5 1.6 17.3
Loans and advances 7.2 3.7 1.3 14.7 26.9
Current assets
Loans and advances - - - - -
Cash and cash equivalents - - - - -
Total 19.6 5.5 2.8 16.3 44.2
Of the total amount of gross loans to customers that were past due but not impaired, the fair value of
collateral that the Company held at 31 December 2009 was EUR 45.2 million (2008:EUR 51.7 million).
See ‘Collateral and other credit enhancements’ for the details of types of collateral held.

105Financial Statement 2009
Interest rate risk
Interest rate risk is governed by the Interest Rate Risk
Policies, which are approved by the Asset and Liability
Committee and the Management Board of Robeco Direct
N.V. Interest rate risk relates to the Asset and Liability
activities within the Company. The sensitivity of trading
book positions to changes in interest rates is measured,
monitored and controlled as an integral part of market risk.
Interest rate risk in the banking book is part of the Pillar II
capital adequacy assessment.
Interest rate risk is measured through the Value at Risk of
equity, on a mark-to-market (fair value) basis. Value at Risk
is calculated using historical simulation; seven years’ price
history, a 99% one-tailed confidence level and a 1-month
holding period. The Value at Risk at 31 December 2009, at
a 99% confidence level and 1-month holding period amounts
EUR 5.6 million (year end 31 December 2008: EUR 6.4
million) versus a limit of EUR 15 million, excluding the trading
positions that are included in the market risk Value at Risk.
Given the positions in the investment books, the Value at
Risk calculations provide senior management with insight
into a potential loss threshold (EUR 5.6 million at year-
end) and the (inverse) probability (1%) that this threshold
is exceeded due to extreme interest rate movements in
the holding period. The main benefit of the historical
simulation approach is that it does not rely on statistical
assumptions regarding the price/interest rate changes.
The main disadvantage is the relative importance of
the definition of the sample period and the implicit
assumption that the 7 years of history are representative
for the next holding period. Therefore, from a risk
management perspective, the Value at Risk calculations are
complemented by several trading controls. Delta vectors are
calculated representing the absolute change in the market
value of equity following from a 1 bp shock in a single
maturity (time bucket) of the yield curve. Level Control is a
control on the overall level of deltas. Curvature Control is
in place to detect positions that have an extreme barbell
character. Barbell positions tend to be duration-neutral.
Finally, steepness control restricts an unequal distribution
of positive and negative deltas over the time buckets.
Additional risk measures applied by the Company are:
Income at Risk, Earnings at Risk and Equity at Risk:
– Income at Risk is a short-term indicator defined as
a possible decline in interest income during the next
12 months if interest rates change by a maximum
size compared to the interest income if interest rates
stay constant. The statement of financial position is
assumed to be stable. Income at Risk is calculated
by running 3 scenarios (stable, up, down) and by
determining the worst interest income downswing.
– Earnings at Risk measure an estimate of change in
earnings when interest rates change. Earnings at Risk
is calculated during the first and second 12-month
period after the reporting date, based on scenarios
of gradual shifts away from the yield curve, over the
course of 12 months, to a value 200 bps above and
below the baseline projection.
– Equity at Risk is a measure of long-term interest rate
risk. It expresses the sensitivity of the market value of
equity to interest rate fluctuations and is defined as
the relative (%) change of the market value of equity
resulting from a parallel shift of the relevant yield
curves of 100 bps. For regulatory reporting, shifts of
200 bps are used.
The management of Robeco Direct N.V. receives interest
rate risk reports on a weekly basis. The Asset and Liability
Committee receives monthly interest rate risk reports
containing an extensive analysis of the interest rate risk
exposures and their changes. The report includes
a description of market developments, an explanation of
changes in the value of the different risk measures,
a description of cash flow developments and activities
related to portfolio maintenance. It also contains an
outlook for the next period.
The tables below summarize the Company’s exposure to
interest rate risk. Included in the table are the Company’s
assets and liabilities at carrying amounts, categorized by
the earlier of contractual repricing or maturity dates.
The carrying amounts of derivative financial assets which are
principally used to reduce the Company’s exposure to interest
rate movements are included in ‘Other derivates’. The off-
balance sheet gap represents the net notional amounts of all
interest-rate sensitive derivative financial instruments.
Expected repricing and maturity dates do not differ
significantly from the contractual dates, except for the

106 Annual Report 2009 Robeco Groep N.V.
maturity of EUR 503.4 million (2008: EUR 476.8 million)
of ‘Loans and advances’ and EUR 7,561 million (2008:
EUR 5,126 million) of ‘Due to customers and banks’ up
to one month, of which 73.6% (2008: 86.1%) represents
balances on current accounts considered by the Company
as a relatively stable core source of funding of its
operations. The change in the interest sensitivity gap (up
to one month) mirrors the changed retail client behavior.
Clients abruptly converted their savings into time deposits
at the end of 2008, during 2009 this trend reversed.
EUR x millionUp to 1 month
1-3 months
3-12 months
1-5 years
More than 5 years
Non-interest-bearing Total
At 31 December 2009
Non-current assets
Financial assets 1,178.1 1,123.0 841.9 3,190.1 1,445.2 76.1 7,854.4
Available-for-sale 484.9 745.4 514.5 1,694.0 61.9 53.8 3,554.5
Held-to-maturity 53.5 - 123.6 248.7 - - 425.8
At fair value through profit or loss 5.6 17.9 111.6 562.4 903.4 20.5 1,621.4
Loans and advances 634.1 359.7 92.2 685.0 479.9 1.8 2,252.7
Derivative financial instruments 0.1 0.7 8.7 4.6 2.0 - 16.1
Current assets
Loans and advances 52.0 0.5 33.7 - - 79.5 165.7
Financial assets held for trading - - 0.6 151.0 75.9 531.4 758.9
Other receivables 16.0 0.1 - - - 278.0 294.1
Derivative financial instruments - 0.1 - - - 1.0 1.1
Cash and cash equivalents 1,171.0 25.0 - - - 0.8 1,196.8
Total assets 2,417.2 1,149.4 884.9 3,345.7 1,523.1 966.8 10,287.1
EUR x millionUp to 1 month
1-3 months
3-12 months
1-5 years
More than 5 years
Non-interest-bearing Total
At 31 December 2009
Non-current liabilities
Subordinated loans - 37.7 - - - - 37.7
Other interest-bearing loans and
borrowings - - - - 199.3 - 199.3
Total return swaps - - - - - 243.4 243.4
Other derivative financial instruments 81.6 11.8 17.8 - - 22.9 134.1
Other non-current liabilities - - - - - 1.3 1.3
Current liabilities
Interest-bearing loans due to customers 6,834.5 268.1 10.6 1.1 25.8 3.4 7,143.5
Interest-bearing loans due to banks 1,018.1 - - - - 43.8 1,061.9
Other derivative financial instruments 0.4 0.3 0.1 - - 1.2 2.0
Financial liabilities at fair value - - - - - 364.9 364.9
Financial liabilities at amortized cost - - - - 2.2 - 2.2
Other non financial liabilities 7.0 - - - - 392.6 399.6
Total liabilities 7,941.6 317.9 28.5 1.1 227.3 1,073.5 9,589.9
On-balance sheet interest sensitivity gap – 5,524.4 831.5 856.4 3.344.6 1,295.8 – 106.7 697.2
Off-balance sheet interest sensitivity gap – 5.1 - – 25.0 – 977.9 – 1,116.3 -
Total interest sensitivity gap – 5,529.5 831.5 831.4 2,366.7 179.5 – 106.7
Notes to the consolidated statement of financial position
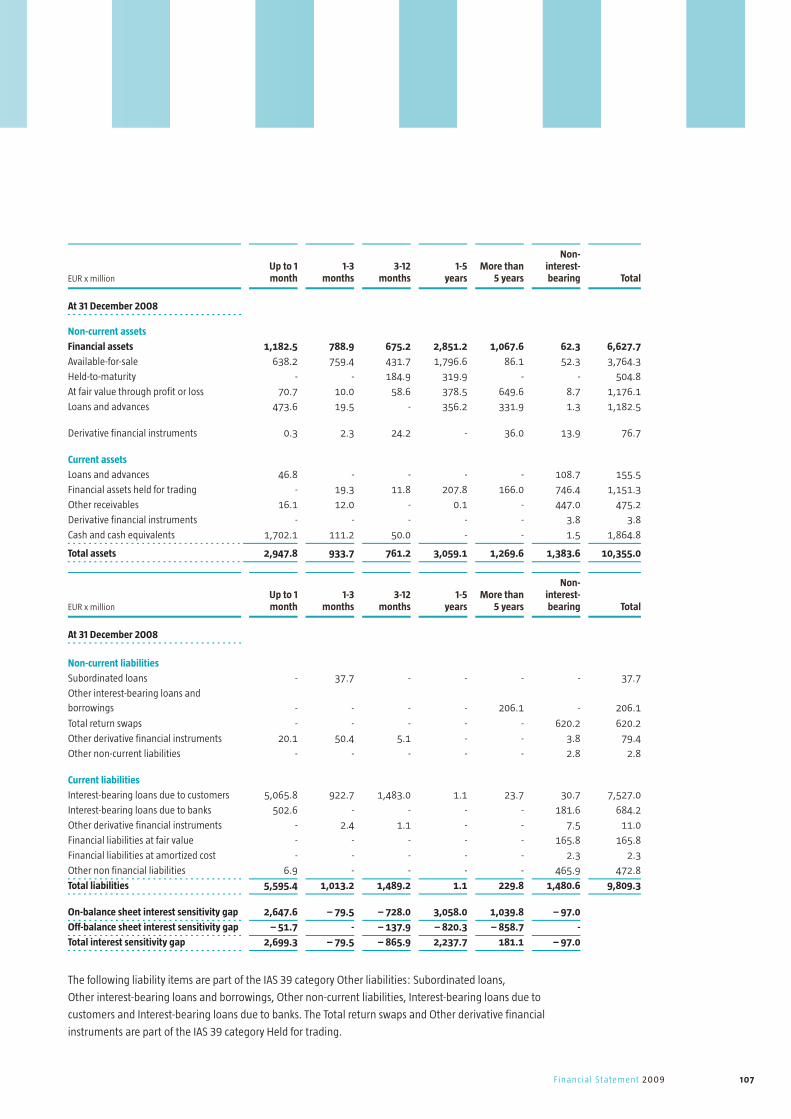
107Financial Statement 2009
The following liability items are part of the IAS 39 category Other liabilities: Subordinated loans,
Other interest-bearing loans and borrowings, Other non-current liabilities, Interest-bearing loans due to
customers and Interest-bearing loans due to banks. The Total return swaps and Other derivative financial
instruments are part of the IAS 39 category Held for trading.
EUR x millionUp to 1 month
1-3 months
3-12 months
1-5 years
More than 5 years
Non-interest-bearing Total
At 31 December 2008
Non-current assets
Financial assets 1,182.5 788.9 675.2 2,851.2 1,067.6 62.3 6,627.7
Available-for-sale 638.2 759.4 431.7 1,796.6 86.1 52.3 3,764.3
Held-to-maturity - - 184.9 319.9 - - 504.8
At fair value through profit or loss 70.7 10.0 58.6 378.5 649.6 8.7 1,176.1
Loans and advances 473.6 19.5 - 356.2 331.9 1.3 1,182.5
Derivative financial instruments 0.3 2.3 24.2 - 36.0 13.9 76.7
Current assets
Loans and advances 46.8 - - - - 108.7 155.5
Financial assets held for trading - 19.3 11.8 207.8 166.0 746.4 1,151.3
Other receivables 16.1 12.0 - 0.1 - 447.0 475.2
Derivative financial instruments - - - - - 3.8 3.8
Cash and cash equivalents 1,702.1 111.2 50.0 - - 1.5 1,864.8
Total assets 2,947.8 933.7 761.2 3,059.1 1,269.6 1,383.6 10,355.0
EUR x millionUp to 1 month
1-3 months
3-12 months
1-5 years
More than 5 years
Non-interest-bearing Total
At 31 December 2008
Non-current liabilities
Subordinated loans - 37.7 - - - - 37.7
Other interest-bearing loans and
borrowings - - - - 206.1 - 206.1
Total return swaps - - - - - 620.2 620.2
Other derivative financial instruments 20.1 50.4 5.1 - - 3.8 79.4
Other non-current liabilities - - - - - 2.8 2.8
Current liabilities
Interest-bearing loans due to customers 5,065.8 922.7 1,483.0 1.1 23.7 30.7 7,527.0
Interest-bearing loans due to banks 502.6 - - - - 181.6 684.2
Other derivative financial instruments - 2.4 1.1 - - 7.5 11.0
Financial liabilities at fair value - - - - - 165.8 165.8
Financial liabilities at amortized cost - - - - - 2.3 2.3
Other non financial liabilities 6.9 - - - - 465.9 472.8
Total liabilities 5,595.4 1,013.2 1,489.2 1.1 229.8 1,480.6 9,809.3
On-balance sheet interest sensitivity gap 2,647.6 – 79.5 – 728.0 3,058.0 1,039.8 – 97.0
Off-balance sheet interest sensitivity gap – 51.7 - – 137.9 – 820.3 – 858.7 -
Total interest sensitivity gap 2,699.3 – 79.5 – 865.9 2,237.7 181.1 – 97.0

108 Annual Report 2009 Robeco Groep N.V.
Notes to the consolidated statement of financial position
Liquidity risk
The Company is exposed to daily calls on its available cash
resources from overnight deposits, maturing deposits
and other financial instruments, non-maturity retail
saving accounts, guarantees and commitments and from
margin and other calls on cash settled derivative financial
instruments. The Company does not maintain cash
resources to meet all these needs as experience shows
that withdrawal of funds (mainly retail savings) usually
goes smoothly and a minimum level of reinvestment
of maturing funds can be predicted with a high level of
certainty. The Asset and Liability Committee monitors the
liquidity position of the asset and liability activities on
a monthly basis.
The Asset and Liability activities of the Company can
best be described as a liability driven banking operation.
Entrusted funds come predominantly from savings from
retail clients, whereby statistical research and behavioral
observation based savings are matched by corresponding
investments. As part of the ongoing efforts to improve
the risk management framework, management, in close
cooperation with Group Risk Management and Group
Finance has further enhanced its liquidity risk toolbox
enabling management to swiftly respond to potential
liquidity opportunities and risks.
The Asset and Liability Committee receives a monthly
liquidity risk report in which daily, weekly and monthly
liquidity indicators are shown for normal and stressed
circumstances. The report contains assessments on
potential clients behavior and the most recent insights
on the marketability of financial assets held. The analysis
made is in supplement to the liquidity reports as prepared
for regulatory purposes.
The table below summarizes the maturity profile of
the Company’s financial assets and liabilities as at
31 December. Trading derivatives are shown at fair value
in a separate column. All derivatives used for hedging
purposes are shown by maturity, based on their contractual
undiscounted repayment obligations.
Repayments which are subject to notice are treated as
if notice were to be given immediately. However,
the Company expects that many customers will not request
repayment on the earliest date the Company could be
required to pay and the table does not reflect the expected
cash flows indicated by the Company’s deposit retention
history.
In the tables on the next page equity securities are
classified as no maturity, unless they regard participations
in special purpose companies, established for the issuance
of bonds. In those cases the maturity of the equity equals
that of the issued bonds. Financial instruments held
for trading (other than equities) are classified based on
the maturity dates of these instruments.
Future interest receivables have been included in
the line item Other receivables and future interest payables
in the line item Other non financial liabilities.

109Financial Statement 2009
EUR x millionOn
demandUp to 1 month
1-3 months
3-12 months
1-5 years
More than 5 years
No maturity
date Total
At 31 December 2009
Financial assets
Non-current assets - 275.4 306.2 1,071.4 4,005.2 2,226.3 54.7 7,939.2
Available-for-sale - 137.4 257.2 696.9 2,437.7 157.7 40.3 3,727.2
Held-to-maturity - 53.5 - 122.8 244.5 - - 420.8
At fair value through profit or loss - - 10.0 106.5 518.5 889.7 14.4 1,539.1
Loans and advances - 84.5 39.0 145.2 804.5 1,178.9 - 2,252.1
Derivative financial instruments - 0.2 - 9.6 15.8 9.8 - 35.4
Current assets
Loans and advances 1.6 78.6 18.9 34.0 27.7 - 4.9 165.7
Financial assets held for trading - - - 0.4 151.5 71.1 530.4 753.4
Other receivables 23.0 96.4 85.6 196.6 545.7 206.5 2.5 1,156.3
Derivative financial instruments 0.4 0.7 - - - - - 1.1
Cash and cash equivalents 1,047.6 124.2 25.0 - - - - 1,196.8
Total undiscounted financial assets 1,072.6 575.5 435.7 1,312.0 4,745.9 2,513.7 592.5 11,247.9
Total undiscounted non derivative
financial assets 1,072.2 574.6 435.7 1,302.4 4,730.1 2,503.9 592.5 11,211.4
Financial liabilities
Non-current assets
Subordinated loans - - - - - 37.7 - 37.7
Other interest-bearing loans and
borrowings- - - - - 199.3 - 199.3
Total return swaps - 0.1 - - 147.2 96.1 - 243.4
Other derivative financial instruments - 1.3 2.6 33.0 72.4 107.8 - 217.1
Other non-current liabilities - - - - 1.3 - - 1.3
Current liabilities
Interest-bearing loans due to customers 4,315.9 2,447.9 342.1 10.6 1.0 26.0 - 7,143.5
Interest-bearing loans due to banks 490.3 571.6 - - - - - 1,061.9
Other derivative financial instruments 0.1 1.0 - 0.9 - - - 2.0
Financial liabilities at fair value - - 67.2 153.6 163.8 - 6.2 390.8
Financial liabilities at amortized cost - - - - 2.2 - - 2.2
Other non financial liabilities 17.5 214.6 110.9 42.8 11.8 3.0 0.5 401.1
Total undiscounted financial liabilities 4,823.8 3,236.5 522.8 240.9 399.7 469.9 6.7 9,700.3
Total undiscounted non derivative
financial liabilities 4,823.7 3,234.2 520.2 207.0 327.3 362.1 6.7 9,481.2
Commitments and guarantees 658.5 - - - - - - 658.5
Net undiscounted financial assets/
liabilities – 4,409.7 – 2,661.0 – 87.1 1,071.1 4,346.2 2,043.8 585.8
889.1

110 Annual Report 2009 Robeco Groep N.V.
The 2009 total amounts presented above do not reconcile
with the consolidated statement of financial position, due
to recognition of the undiscounted cash flows. The 2008
amounts do however reconcile with the consolidated
statement of financial position due to the recognition of
discounted cash flows.
The Company maintains a portfolio of highly marketable
and diverse assets that are assumed to be easily liquidated
in the event of an unforeseen interruption of cash flow.
In addition, the Company maintains a statutory deposit
with the Dutch Central Bank equal to 2% of customer
deposits. Also a relatively large cash amount is currently
held at banks. In accordance with the Company’s policy the
liquidity position is assessed and managed under a variety
of scenarios, giving due consideration to stress factors
relating to both the market in general and specifically to
the Company.
Currency risk
The Company is exposed to the impact of fluctuations in
the prevailing foreign currency rates on its financial position
and cash flows. The Management Board sets limits on
the level of exposure by currency and in total which are
monitored on a daily basis (trading financial assets and
liabilities) or on a monthly basis for non-trading currency
exposures as part of managing translation risks as detailed
in note 33 Derivative financial instruments.
Market risk
Market risk is governed by the Market Risk Policies that
are approved by the Asset and Liability Committee.
The purpose of these policies is to protect the capital of
the Company and to allow market risk exposures without
duly compromising the group’s or bank’s capital or
the stability of its earnings. The Company’s use of market
risk capacity is primarily oriented towards the facilitation
of seeding requests (to build track records or to provide
initial or temporary capital) and the hedging of structured
products issued by the Group.
The Value at Risk of a portfolio is the maximum loss in
the portfolio over a given holding period, at a particular
confidence level, assuming that positions cannot be
adjusted during the holding period. At a confidence level
of 97.5%, for example, the daily VaR figure represents
the threshold for the potential trading loss that will not
be exceeded in 195 out of 200 trading days. The main
Notes to the consolidated statement of financial position
EUR x millionOn
demandUp to 1 month
1-3 months
3-12 months
1-5 years
More than 5 years
No maturity
date Total
At 31 December 2008
Non-current liabilities
Subordinated loans - - - - - 37.7 - 37.7
Other interest-bearing loans and
borrowings
- - - - - 206.1 - 206.1
Total return swaps - - - - 7.3 238.1 374.8 620.2
Other derivative financial instruments - 2.4 3.5 24.0 5.0 50.2 - 85.1
Other non-current liabilities - - - 2.8 - - - 2.8
Current liabilities
Interest-bearing loans due to customers 4,932.0 625.8 1,925.3 19.1 - 24.8 - 7,527.0
Interest-bearing loans due to banks 658.5 25.7 - - - - - 684.2
Other derivative financial instruments - 4.2 1.1 - - - - 5.3
Financial liabilities at fair value - - 0.7 - - - 165.1 165.8
Financial liabilities at amortized cost - - - - - - 2.3 2.3
Other non financial liabilities 108.2 203.6 101.9 63.4 1.3 - 22.0 500.4
Commitments and guarantees 625.3 - - - - - - 625.3
Total liabilities 6,324.0 861.7 2,032.5 109.3 13.6 556.9 564.2 10,462.2
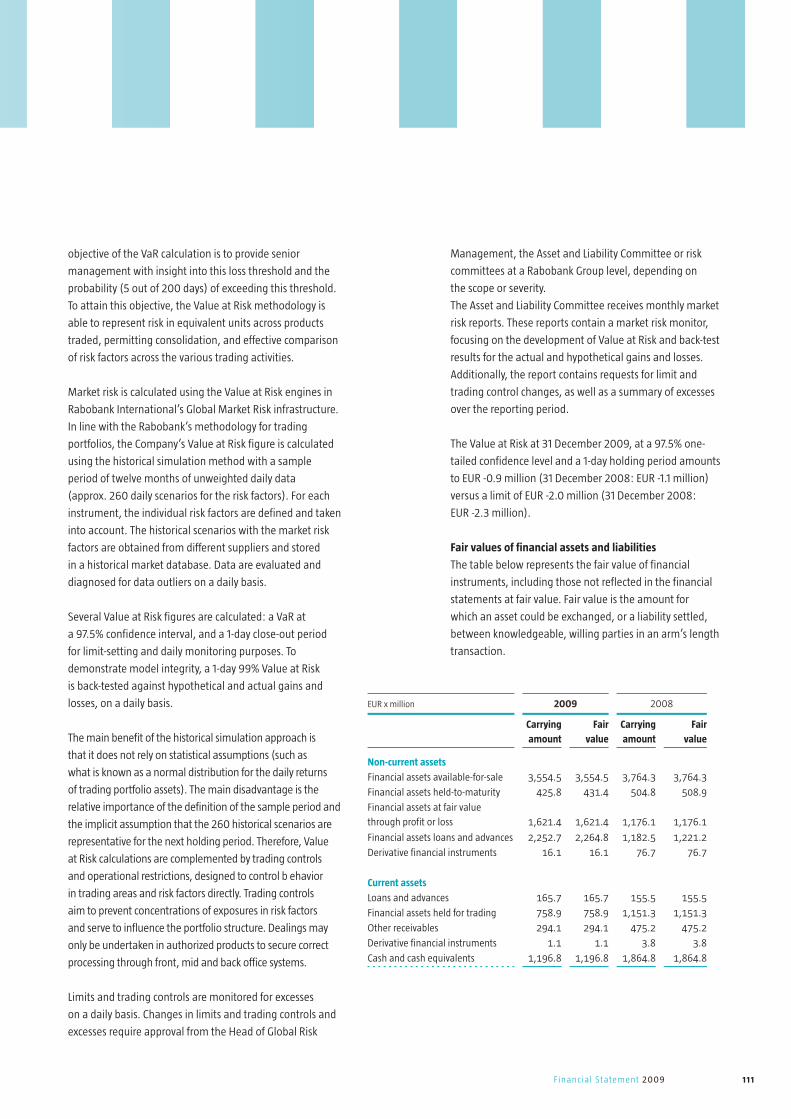
111Financial Statement 2009
objective of the VaR calculation is to provide senior
management with insight into this loss threshold and the
probability (5 out of 200 days) of exceeding this threshold.
To attain this objective, the Value at Risk methodology is
able to represent risk in equivalent units across products
traded, permitting consolidation, and effective comparison
of risk factors across the various trading activities.
Market risk is calculated using the Value at Risk engines in
Rabobank International’s Global Market Risk infrastructure.
In line with the Rabobank’s methodology for trading
portfolios, the Company’s Value at Risk figure is calculated
using the historical simulation method with a sample
period of twelve months of unweighted daily data
(approx. 260 daily scenarios for the risk factors). For each
instrument, the individual risk factors are defined and taken
into account. The historical scenarios with the market risk
factors are obtained from different suppliers and stored
in a historical market database. Data are evaluated and
diagnosed for data outliers on a daily basis.
Several Value at Risk figures are calculated: a VaR at
a 97.5% confidence interval, and a 1-day close-out period
for limit-setting and daily monitoring purposes. To
demonstrate model integrity, a 1-day 99% Value at Risk
is back-tested against hypothetical and actual gains and
losses, on a daily basis.
The main benefit of the historical simulation approach is
that it does not rely on statistical assumptions (such as
what is known as a normal distribution for the daily returns
of trading portfolio assets). The main disadvantage is the
relative importance of the definition of the sample period and
the implicit assumption that the 260 historical scenarios are
representative for the next holding period. Therefore, Value
at Risk calculations are complemented by trading controls
and operational restrictions, designed to control b ehavior
in trading areas and risk factors directly. Trading controls
aim to prevent concentrations of exposures in risk factors
and serve to influence the portfolio structure. Dealings may
only be undertaken in authorized products to secure correct
processing through front, mid and back office systems.
Limits and trading controls are monitored for excesses
on a daily basis. Changes in limits and trading controls and
excesses require approval from the Head of Global Risk
Management, the Asset and Liability Committee or risk
committees at a Rabobank Group level, depending on
the scope or severity.
The Asset and Liability Committee receives monthly market
risk reports. These reports contain a market risk monitor,
focusing on the development of Value at Risk and back-test
results for the actual and hypothetical gains and losses.
Additionally, the report contains requests for limit and
trading control changes, as well as a summary of excesses
over the reporting period.
The Value at Risk at 31 December 2009, at a 97.5% one-
tailed confidence level and a 1-day holding period amounts
to EUR -0.9 million (31 December 2008: EUR -1.1 million)
versus a limit of EUR -2.0 million (31 December 2008:
EUR -2.3 million).
Fair values of financial assets and liabilities
The table below represents the fair value of financial
instruments, including those not reflected in the financial
statements at fair value. Fair value is the amount for
which an asset could be exchanged, or a liability settled,
between knowledgeable, willing parties in an arm’s length
transaction.
EUR x million 2009 2008
Carrying
amount
Fair
value
Carrying
amount
Fair
value
Non-current assets
Financial assets available-for-sale 3,554.5 3,554.5 3,764.3 3,764.3
Financial assets held-to-maturity 425.8 431.4 504.8 508.9
Financial assets at fair value
through profit or loss 1,621.4 1,621.4 1,176.1 1,176.1
Financial assets loans and advances 2,252.7 2,264.8 1,182.5 1,221.2
Derivative financial instruments 16.1 16.1 76.7 76.7
Current assets
Loans and advances 165.7 165.7 155.5 155.5
Financial assets held for trading 758.9 758.9 1,151.3 1,151.3
Other receivables 294.1 294.1 475.2 475.2
Derivative financial instruments 1.1 1.1 3.8 3.8
Cash and cash equivalents 1,196.8 1,196.8 1,864.8 1,864.8

112 Annual Report 2009 Robeco Groep N.V.
For financial instruments carried at fair value, market prices
or rates are used to determine the fair value where an
active market exists (such as a recognized stock exchange),
as it is the best evidence of the fair value of a financial
instrument. If therefore no active market price or rate is
available, fair values are estimated using present value or
other valuation techniques, using inputs based on market
conditions existing at the reporting dates.
The values derived from applying these techniques are
significantly affected by the choice of valuation model used
and the underlying assumptions made concerning factors
such as the amounts and timing of future cash flows,
discount rates, volatility and credit risk.
For the valuation of the Transtrend options in structured
products, a (standard) option valuation model is used in
combination with a ‘Volatility observing Rule’. The initial
Volatility Rule methodology was set by the Valuation
Committee in 2008. This initial methodology did not
distinguish between different option maturities. With
a growing number of option positions (with all different
maturities), in 2009 the Valuation Committee decided
to refine the Volatility Rule methodology by introducing
a term structure of volatilities: the new methodology
differentiates between volatilities for different option
maturities.
In the valuation model for employee stock options the
Company revised one of the underlying assumptions in
2009. The change concerns the exclusion of management
fees and the assumption of a fixed dividend percentage.
This change had a negative impact of EUR 0.5 million.
The following methods and assumptions have been applied
in determining the fair values of the financial instruments
presented in the table above, both for financial instruments
carried at fair value, and those carried at cost (for which fair
values are provided as a comparison):
1. Trading financial assets and liabilities, financial assets
designated at fair value and derivative financial
instruments are measured at fair value by reference to
quoted market prices when available. If quoted market
prices are not available, the fair value is estimated from
appropriate discounted cash-flow models and option
valuation models;
2. Financial assets classified as available-for-sale are
measured at fair value by reference to quoted market
prices when available. If quoted market prices are not
available, the fair value is estimated from appropriate
discounted cash-flow models and option valuation
models;
3. The fair value of demand deposits and savings accounts
with no specific maturity is assumed to be the amount
payable on demand at the reporting date, i.e. their
carrying amounts at this date;
4. The carrying amount of cash and cash equivalent assets
and other assets maturing within 12 months is assumed
to approximate their fair values. This assumption is
applied to cash and cash equivalent assets and the short-
term elements of all other financial assets and liabilities;
5. The fair value of variable rate financial assets is based
on the carrying amount until maturity. Changes in
the credit quality of loans within the portfolio are not
taken into account in determining the fair value. The
impact of credit risk is recognized separately by the use
of an allowance account which is determined by an
individually assessment of the loans whether objective
evidence of impairment exists. The fair value of the loans
is reduced by this allowance account;
6. The fair value of fixed rate loans and mortgages carried
at amortized cost is estimated by using discounted
cash flow calculations based upon current market
rates offered on similar loans. Changes in the credit
Notes to the consolidated statement of financial position
EUR x million 2009 2008
Carrying
amount
Fair
value
Carrying
amount
Fair
value
Non-current liabilities
Subordinated loans 37.7 37.7 37.7 37.7
Other interest-bearing loans
and borrowings 199.3 196.6 206.1 207.4
Employee benefit liability 15.4 15.4 8.9 8.9
Total return swaps 243.4 243.4 620.2 620.2
Other derivative financial
instruments 134.1 134.1 79.4 79.4
Other non-current liabilities 1.3 1.3 2.8 2.8
Current liabilities
Interest-bearing loans due
to customers 7,143.5 7,144.8 7,527.0 7,541.8
Interest-bearing loans due to banks 1,061.9 1,061.9 684.2 684.2
Other derivatives financial
instruments 2.0 2.0 11.0 11.0
Trade and other payables 766.7 766.7 640.9 640.9
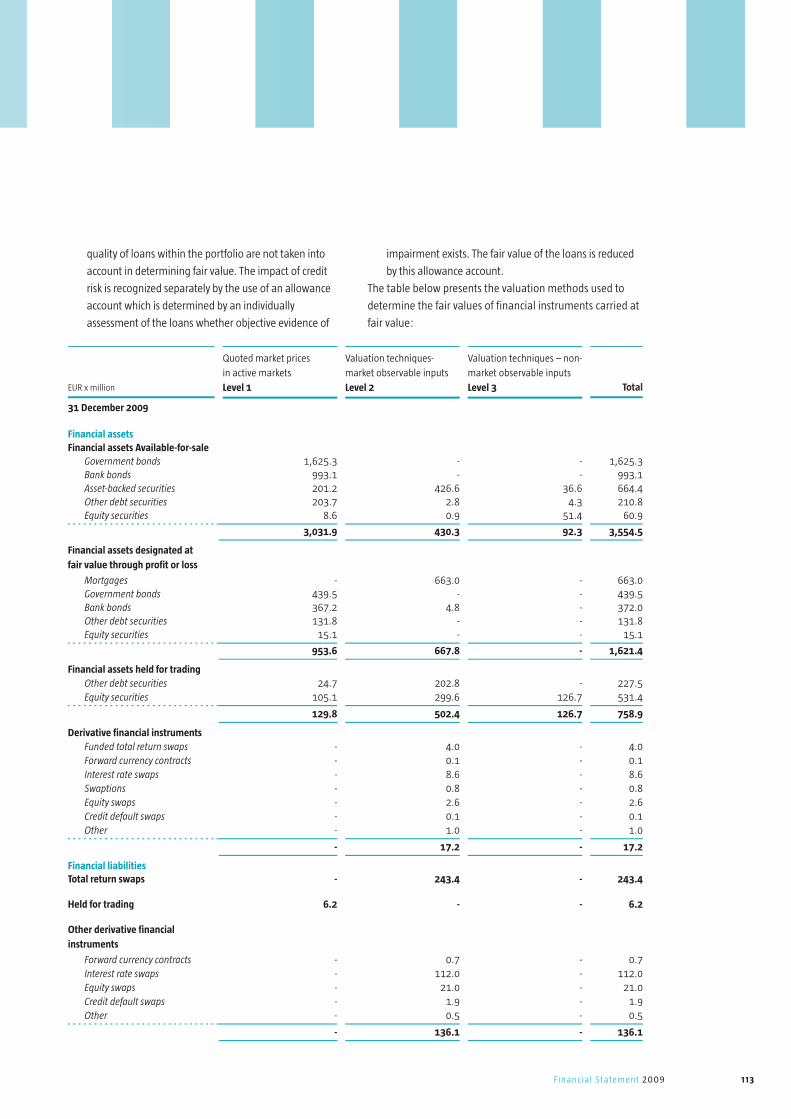
113Financial Statement 2009
quality of loans within the portfolio are not taken into
account in determining fair value. The impact of credit
risk is recognized separately by the use of an allowance
account which is determined by an individually
assessment of the loans whether objective evidence of
impairment exists. The fair value of the loans is reduced
by this allowance account.
The table below presents the valuation methods used to
determine the fair values of financial instruments carried at
fair value:
EUR x million
Quoted market prices
in active markets
Level 1
Valuation techniques-
market observable inputs
Level 2
Valuation techniques – non-
market observable inputs
Level 3 Total
31 December 2009
Financial assetsFinancial assets Available-for-sale Government bonds 1,625.3 - - 1,625.3 Bank bonds 993.1 - - 993.1 Asset-backed securities 201.2 426.6 36.6 664.4 Other debt securities 203.7 2.8 4.3 210.8 Equity securities 8.6 0.9 51.4 60.9
3,031.9 430.3 92.3 3,554.5
Financial assets designated at
fair value through profit or loss
Mortgages - 663.0 - 663.0 Government bonds 439.5 - - 439.5 Bank bonds 367.2 4.8 - 372.0 Other debt securities 131.8 - - 131.8 Equity securities 15.1 - - 15.1
953.6 667.8 - 1,621.4
Financial assets held for trading Other debt securities 24.7 202.8 - 227.5 Equity securities 105.1 299.6 126.7 531.4
129.8 502.4 126.7 758.9
Derivative financial instruments Funded total return swaps - 4.0 - 4.0 Forward currency contracts - 0.1 - 0.1 Interest rate swaps - 8.6 - 8.6 Swaptions - 0.8 - 0.8 Equity swaps - 2.6 - 2.6 Credit default swaps - 0.1 - 0.1 Other - 1.0 - 1.0
- 17.2 - 17.2
Financial liabilitiesTotal return swaps - 243.4 - 243.4
Held for trading 6.2 - - 6.2
Other derivative financial
instruments
Forward currency contracts - 0.7 - 0.7 Interest rate swaps - 112.0 - 112.0 Equity swaps - 21.0 - 21.0 Credit default swaps - 1.9 - 1.9 Other - 0.5 - 0.5
- 136.1 - 136.1
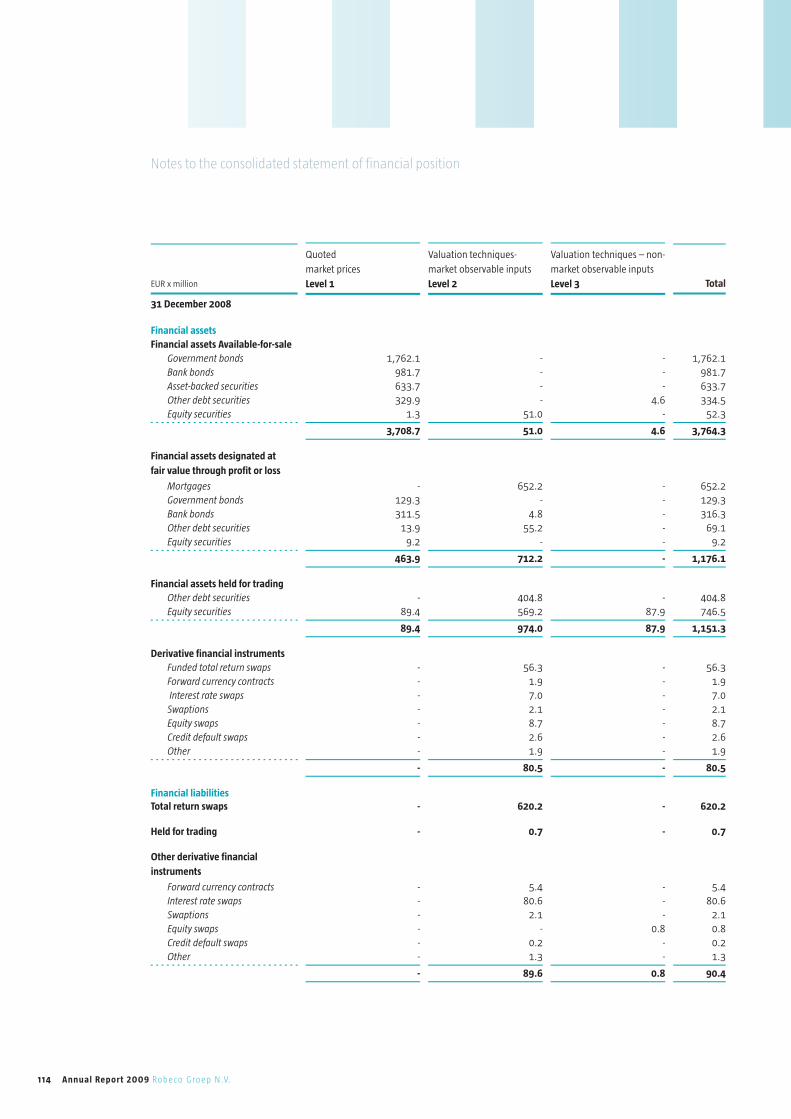
114 Annual Report 2009 Robeco Groep N.V.
Notes to the consolidated statement of financial position
EUR x million
Quoted
market prices
Level 1
Valuation techniques-
market observable inputs
Level 2
Valuation techniques – non-
market observable inputs
Level 3 Total
31 December 2008
Financial assetsFinancial assets Available-for-sale Government bonds 1,762.1 - - 1,762.1 Bank bonds 981.7 - - 981.7 Asset-backed securities 633.7 - - 633.7 Other debt securities 329.9 - 4.6 334.5 Equity securities 1.3 51.0 - 52.3
3,708.7 51.0 4.6 3,764.3
Financial assets designated at
fair value through profit or loss
Mortgages - 652.2 - 652.2 Government bonds 129.3 - - 129.3 Bank bonds 311.5 4.8 - 316.3 Other debt securities 13.9 55.2 - 69.1 Equity securities 9.2 - - 9.2
463.9 712.2 - 1,176.1
Financial assets held for trading Other debt securities - 404.8 - 404.8 Equity securities 89.4 569.2 87.9 746.5
89.4 974.0 87.9 1,151.3
Derivative financial instruments Funded total return swaps - 56.3 - 56.3 Forward currency contracts - 1.9 - 1.9 Interest rate swaps - 7.0 - 7.0 Swaptions - 2.1 - 2.1 Equity swaps - 8.7 - 8.7 Credit default swaps - 2.6 - 2.6 Other - 1.9 - 1.9
- 80.5 - 80.5
Financial liabilitiesTotal return swaps - 620.2 - 620.2
Held for trading - 0.7 - 0.7
Other derivative financial
instruments
Forward currency contracts - 5.4 - 5.4 Interest rate swaps - 80.6 - 80.6 Swaptions - 2.1 - 2.1 Equity swaps - - 0.8 0.8 Credit default swaps - 0.2 - 0.2 Other - 1.3 - 1.3
- 89.6 0.8 90.4

115Financial Statement 2009
The following table shows transfers between Level 1
and Level 2 of the fair value hierarchy for financial assets
and liabilities recorded at fair value:
(EUR x million) 2009
Transfers from Level 1 to Level 2
Financial assets Available-for-sale
Asset-backed securities 426.6
Other debt securities 2.8
Transfers from Level 2 to Level 1
Financial assets held for trading
Equity securities 6.2
The above financial assets were transferred from Level 1 to
Level 2 as their values were obtained applying valuation
techniques using market-observable inputs, as the majority
of asset-backed securities were not actively traded during
the year. The financial liabilities were transferred from Level
2 to Level 1, as the short position in equity securities were
valued applying quoted market prices during the year.
During the year, certain asset-backed securities were
transferred from Level 1 to Level 3, the reason being that
the securities ceased to be actively traded and that their
valuation incorporated non-market observable inputs.
Moreover, certain equity securities were transferred from
Level 2 to Level 3 of the fair value hierarchy. The reason for
transferring these equity securities to Level 3 is that the
effect of non-market observable inputs on prices calculated
by the applied valuation models deemed to have increased
from minor to significant. The carrying amount of the
assets transferred totaled EUR 116.3 million.
For Level-3 financial instruments held for trading, the
Company adjusted the latest valuations to reduce the time
lag between the moment of valuation and the availability
of information at reporting dates by assessing additional
required information from underlying independent fund
managers. The fair value sensitivity of Level-3 financial
instruments mainly consists of held for trading securities.
After the reporting date, the sensitivity analysis results in
a fair value variance of about 6% representing EUR 4.9
million for these titles.
Movements in level 3 financial instruments
measured at fair value
The following table shows a reconciliation of the opening
and closing amount of Level 3 financial assets and liabilities
which are recorded at fair value:
EUR x million
At
1 January
2009
Total gains/
losses recorded
in income
statement
Total gains/
losses recorded
in other
comprehensive
income Purchases Sales Redemption
Transfers
from level 1
and level 2
At
31 December
2009
Financial assets
Financial assets available-for-sale
Asset-backed securities - – 4.5 – 11.9 - - – 0.7 53.7 36.6
Other debt securities 4.6 – 1.8 – 0.2 1.7 - - - 4.3
Equity securities - – 1.6 1.0 3.0 – 1.3 - 50.3 51.4
4.6 – 7.9 – 11.1 4.7 – 1.3 – 0.7 104.0 92.3
Financial assets held for trading
Equity securities 87.9 – 1.4 - 36.4 – 8.5 - 12.3 126.7
Total level 3 financial assets 92.5 – 9.3 – 11.1 41.1 – 9.8 – 0.7 116.3 219.0
Financial liabilities
Other derivative financial
instruments
Equity swaps 0.8 - - - - - – 0.8 -
Total level 3 financial liabilities 0.8 - - - - - – 0.8 -
Total net level 3
financial assets / liabilities 91.7 – 9.3 – 11.1 41.1 – 9.8 – 0.7 117.1 219.0

116 Annual Report 2009 Robeco Groep N.V.
Notes to the consolidated statement of financial position
Gains or losses on level 3 financial instruments
Gains or losses on level 3 financial instruments included in
the income statement for the year 2009 comprise:
During the year, certain financial instruments (equity
securities) were transferred from Level 2 to Level 3 of
the fair value hierarchy. The carrying amount of the total
assets transferred was EUR 62.6 million. The reason for
transferring these equity securities from Level 2 to Level 3
is that the effect of non-market-observable inputs on prices
calculated by the applied valuation models was deemed to
have increased from minor to significant.
EUR x million
Realized gains/losses
Unrealized gains/losses Total
Impairment losses – 4.5 - – 4.5
Results on financial instruments
available-for-sale– 3.4 - – 3.4
Results on financial instruments
held for trading - – 1.4 – 1.4
Total gains or (losses) recognized in
profit or loss – 7.9 – 1.4 – 9.3
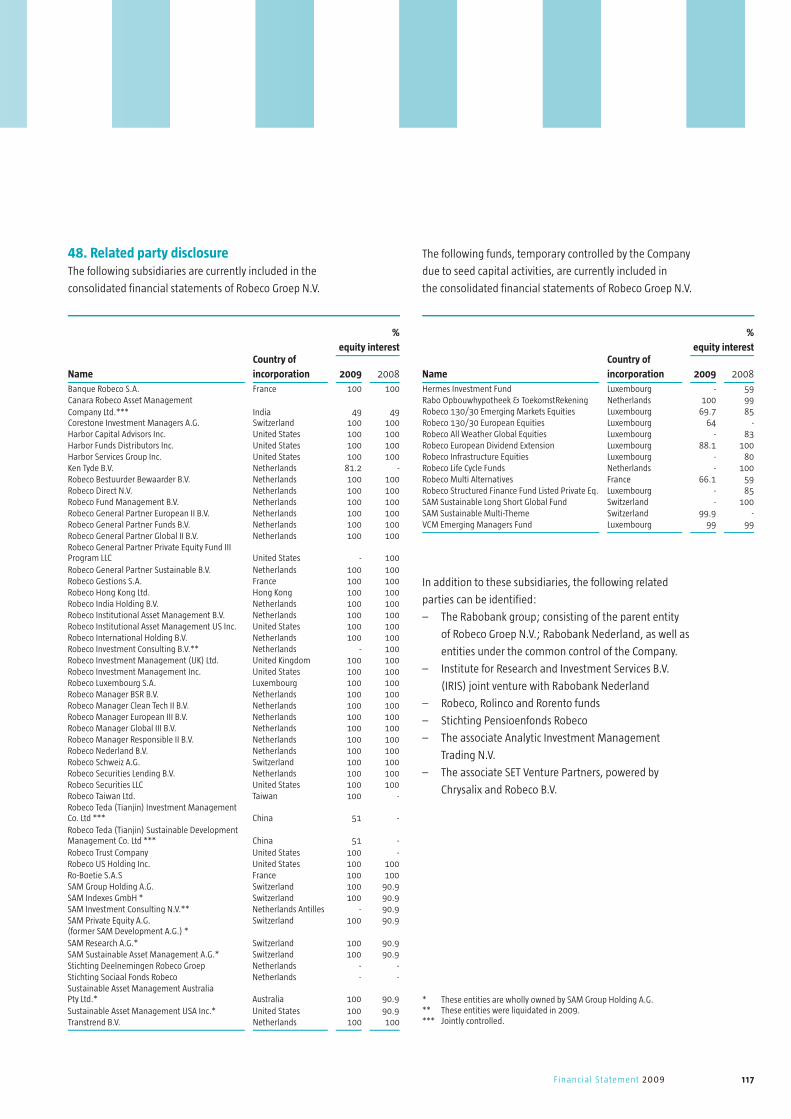
117Financial Statement 2009
* These entities are wholly owned by SAM Group Holding A.G.** These entities were liquidated in 2009.*** Jointly controlled.
%
equity interest
Name
Country of
incorporation 2009 2008
Banque Robeco S.A. France 100 100Canara Robeco Asset Management Company Ltd.*** India 49 49Corestone Investment Managers A.G. Switzerland 100 100Harbor Capital Advisors Inc. United States 100 100Harbor Funds Distributors Inc. United States 100 100Harbor Services Group Inc. United States 100 100Ken Tyde B.V. Netherlands 81.2 -Robeco Bestuurder Bewaarder B.V. Netherlands 100 100Robeco Direct N.V. Netherlands 100 100Robeco Fund Management B.V. Netherlands 100 100Robeco General Partner European II B.V. Netherlands 100 100Robeco General Partner Funds B.V. Netherlands 100 100Robeco General Partner Global II B.V. Netherlands 100 100Robeco General Partner Private Equity Fund III Program LLC United States - 100Robeco General Partner Sustainable B.V. Netherlands 100 100Robeco Gestions S.A. France 100 100Robeco Hong Kong Ltd. Hong Kong 100 100Robeco India Holding B.V. Netherlands 100 100Robeco Institutional Asset Management B.V. Netherlands 100 100Robeco Institutional Asset Management US Inc. United States 100 100Robeco International Holding B.V. Netherlands 100 100Robeco Investment Consulting B.V.** Netherlands - 100Robeco Investment Management (UK) Ltd. United Kingdom 100 100Robeco Investment Management Inc. United States 100 100Robeco Luxembourg S.A. Luxembourg 100 100Robeco Manager BSR B.V. Netherlands 100 100Robeco Manager Clean Tech II B.V. Netherlands 100 100Robeco Manager European III B.V. Netherlands 100 100Robeco Manager Global III B.V. Netherlands 100 100Robeco Manager Responsible II B.V. Netherlands 100 100Robeco Nederland B.V. Netherlands 100 100Robeco Schweiz A.G. Switzerland 100 100Robeco Securities Lending B.V. Netherlands 100 100Robeco Securities LLC United States 100 100Robeco Taiwan Ltd. Taiwan 100 -Robeco Teda (Tianjin) Investment Management Co. Ltd *** China 51 -Robeco Teda (Tianjin) Sustainable Development Management Co. Ltd *** China 51 -Robeco Trust Company United States 100 -Robeco US Holding Inc. United States 100 100Ro-Boetie S.A.S France 100 100SAM Group Holding A.G. Switzerland 100 90.9SAM Indexes GmbH * Switzerland 100 90.9SAM Investment Consulting N.V.** Netherlands Antilles - 90.9SAM Private Equity A.G. (former SAM Development A.G.) *
Switzerland 100 90.9
SAM Research A.G.* Switzerland 100 90.9SAM Sustainable Asset Management A.G.* Switzerland 100 90.9Stichting Deelnemingen Robeco Groep Netherlands - -Stichting Sociaal Fonds Robeco Netherlands - -Sustainable Asset Management Australia Pty Ltd.* Australia 100 90.9Sustainable Asset Management USA Inc.* United States 100 90.9Transtrend B.V. Netherlands 100 100
The following funds, temporary controlled by the Company
due to seed capital activities, are currently included in
the consolidated financial statements of Robeco Groep N.V.
%
equity interest
Name
Country of
incorporation 2009 2008
Hermes Investment Fund Luxembourg - 59Rabo Opbouwhypotheek & ToekomstRekening Netherlands 100 99Robeco 130/30 Emerging Markets Equities Luxembourg 69.7 85Robeco 130/30 European Equities Luxembourg 64 -Robeco All Weather Global Equities Luxembourg - 83Robeco European Dividend Extension Luxembourg 88.1 100Robeco Infrastructure Equities Luxembourg - 80Robeco Life Cycle Funds Netherlands - 100Robeco Multi Alternatives France 66.1 59Robeco Structured Finance Fund Listed Private Eq. Luxembourg - 85SAM Sustainable Long Short Global Fund Switzerland - 100SAM Sustainable Multi-Theme Switzerland 99.9 -VCM Emerging Managers Fund Luxembourg 99 99
48. Related party disclosureThe following subsidiaries are currently included in the
consolidated financial statements of Robeco Groep N.V.
In addition to these subsidiaries, the following related
parties can be identified:
– The Rabobank group; consisting of the parent entity
of Robeco Groep N.V.; Rabobank Nederland, as well as
entities under the common control of the Company.
– Institute for Research and Investment Services B.V.
(IRIS) joint venture with Rabobank Nederland
– Robeco, Rolinco and Rorento funds
– Stichting Pensioenfonds Robeco
– The associate Analytic Investment Management
Trading N.V.
– The associate SET Venture Partners, powered by
Chrysalix and Robeco B.V.

118 Annual Report 2009 Robeco Groep N.V.
The table below shows the total income and expenses
as well as positions in the statement of financial
position which are the result of transactions with the
aforementioned related parties for the relevant year.
Transactions with related parties regarding management
fees received from the funds as well as maintenance
fees paid are included in operating income. In addition,
interest results are realized on transactions with Rabobank.
Operating expenses consist mainly of expenses paid to
the Stichting Pensioenfonds Robeco relating to long-term
employee benefits. Finance costs and income relate to
the interest paid to Rabobank regarding among other,
the subordinated loans as well as interest received and
results realized on investments not part of the banking
operations. Results on financial instruments relates to
results on derivative financial instruments with Rabobank.
The assets shown consist mainly of investments, derivative
financial instruments and cash and short term deposits
for which the Company has relationships with Rabobank.
The liabilities relate to the equity and loans supplied by
Rabobank as well as among others a total return swap for
which Rabobank is the counterparty.
Terms and conditions
The sales to and purchases from related parties are made
at arm’s length market prices. Outstanding receivables or
payables at year–end are unsecured and interest free, with
settlement being in cash. The Company has not formed
a provision for doubtful debts relating to amounts owed by
related parties (2008: nil), because the risks involved are
not considered material enough to do so. This assessment
is made each year by examining the financial position
of the related party and the market in which the party
operates.
Remuneration of key management personnel
Both the Management Board and the Supervisory Board
are acknowledged as key management personnel due to
having authority and responsibility for planning, directing
and controlling activities of the Company.
Salaries and benefits of EUR 3.6 million (2008: EUR 4.7
million) were awarded to current and former members of
the Management Board. In 2009 no salary increase has
been awarded to the members of the Management Board.
Included in salaries and benefits are pension contributions
of EUR 0.4 million (2008: EUR 0.5 million) as well as profit-
related bonuses of EUR 0.9 million (2008: EUR 1.7 million).
Besides the salaries and benefits a severance payment of
EUR 1.1 million (2008: EUR 2.0 million) was made to former
key management.
Total related parties
EUR x million 2009 2008
Income statement regarding related parties
Operating income – 13.5 60.4
Operating expenses 6.6 15.3
Operating result – 20.1 45.1
Finance income / costs – 6.6 – 8.1
Results on financial instruments held for trading 179.1 – 239.2
Share of profit of associates - -
Result before tax 152.4 – 202.2
Total related parties
EUR x million 2009 2008
Statement of financial position regarding
related parties
Assets
Non-current assets 285.0 268.9
Current assets 877.3 1,599.1
Total assets 1,162.3 1,868.0
Total related parties
EUR x million 2009 2008
Equity and liabilities
Total equity 1,380.1 1,124.1
Non-current liabilities 531.8 890.0
Current liabilities 1,218.1 1,599.1
Total liabilities 1,749.9 1,741.6
Total equity and liabilities 3,130.0 2,865.7
Notes to the consolidated statement of financial position

119Financial Statement 2009
2009 2008
Number of
underlying
shares
Number of
underlying
shares
Robeco N.V. 7,735 11,093
Rolinco N.V. 9,052 13,080
Robeco European Equities (EUR) D-shares 5,733 8,252
Robeco North American Equities (EUR) D-Shares 4,756 6,700
Robeco Emerging Markets Equities (EUR) D-shares 2,397 3,683
Robeco MultiManager Asia Pacific Equities (EUR) D-shares 2,794 4,127
Base salary Performance related bonuses 1 Long term employee benefits Total
Cash bonus
current year
Deferred bonus
previous years Pension costs Other 2
EUR x thousand 2009 2008 2009 2008 2009 2008 2009 2008 2009 2008 2009 2008
R.M.S.M. Munsters 3 162 - 120 - - - 39 - 13 - 334 -
L.M.T. Boeren 324 324 90 99 99 196 81 78 40 39 634 736
H.W.D.G. Borrie 4 81 - - - - - 18 - 9 - 108 -
C.T.L. Korthout 324 324 90 81 93 198 81 80 40 39 628 722
Former members 5 1,114 1,547 177 245 258 926 217 340 115 180 1,881 3,238
Total 2,005 2,195 477 425 450 1,320 436 498 217 258 3,585 4,696
1 Performance related bonuses relate to other long term employee benefi ts (see accounting policy 4.30).2 Includes social-security costs, social allowances and holiday allowance.3 As from 1 September 20094 As from 12 October 20095 Former Management Board members: G.A. Möller, S. van Eijkern, F.L. Kusse, J.N.A. Laurens, N.F. Molenaar
Remuneration of the Management Board in 2009 and 2008:
The option rights referred to above consist of the right
to buy shares in the funds over a period of five years,
the value of the shares being not less than the opening
price on the first trading day following the grant date.
The total theoretical value of the option rights granted to
the Management Board members in 2009 amounted
to EUR 0.02 million (2008: EUR 0.01 million).
The theoretical value of all outstanding option rights
granted to personnel amounted to EUR 4.4 million
(2008: EUR 2.0 million) of which those granted to the
current Management Board amounted to EUR 0.2 million
(2008: 0.1 million).
The Company has a Long-term Incentive Plan in place for
key employees within the Company. This plan consists of
an Equity Notes Plan. The purpose of the plan is to reward
and retain key employees of the Company by providing
a share of the value of Robeco Groep N.V. The stake consists
of units Equity Notes representing a cash value directly
related to the Robeco Groep N.V. valuation based on profit
for the year from continuing operations.
At 31 December 2009 and 2008 the following option rights
were outstanding for the current Management Board
members:
Equity Notes will produce a cash yield of 5% of the
basic value (the award date value for Equity Notes) per
annum until the vesting date. Equity Notes will under no
circumstances confer any vested contingent or conditional
rights to or any interest in income or assets of any
Group Company, but will merely represent an unfunded,
unsecured notional credit to a participant’s account under
the plan, for purposes of facilitating the calculation of any
value which may become due to a participant upon vesting
at a later date.

120 Annual Report 2009 Robeco Groep N.V.
To current Management Board members Equity Notes were
granted and their number outstanding in 2009 and 2008
were as follows:
For 2009 no Equity Notes are granted. The presented
granted Equity Notes 2009 are the awarded Equity Notes
with respect of the performance in 2008, as they were
awarded early 2009. The number of Equity Notes granted
consists of Equity Notes awarded as part of the long-term
incentive program as well as Equity Notes that result from
a mandatory conversion of deferred cash compensation.
Mortgages granted to members of the Management Board
have interest rates, ranging between 3.1% and 4.1%
(2008: between 3.1% and 4.1%). The mortgages and
loans granted to members of the Management Board are
granted in the normal course of business, subject to terms
applicable to all employees.
Remuneration of current and former members of
the Supervisory Board:
The remuneration of the members of the Supervisory
Board as presented does not include remuneration for
the Supervisory Board activities in Robeco funds.
Total remuneration costs are included in employee benefits
expense. The remuneration of the Management Board is
set by the Supervisory Board on the recommendation of
the Nomination, Remuneration & Corporate Governance
Committee. The total remuneration package is compared
with external market conditions every two years and
adjusted accordingly, if necessary.
2009 2009 2009 2009 2008 2008 2008 2008
Number of
outstanding
equity Notes
1 January
Granted
Equity Notes
Equity
Notes sold
Number of
outstanding
Equity Notes
31 December
Number of
outstanding
Equity Notes
1 January
Granted
Equity Notes
Equity
Notes sold
Number of
outstanding
Equity Notes
31 December
R.M.S.M. Munsters - - - - - - - -
L.M.T. Boeren 1,895 610 – 348 2,157 2,359 - – 464 1,895
H.W.D.G. Borrie - - - - - - - -
C.T.L. Korthout 1,902 569 – 353 2,118 2,367 - – 465 1,902
Members of the Supervisory Board
EUR x thousand 2009 2008
P.C. van den Hoek 1 - 28
D.P.M. Verbeek 2 76 68
A. Bruggink 3 38 -
W.H. Buiter 4 22 -
J.C. Ten Cate 49 49
G. Izeboud 49 49
D.J.M.G. Baron van Slingelandt 5 10 32
P.J.A. van Schijndel 36 49
Ph. Lambert 49 49
Total 329 324
1 Until 1 May 2008 Chairman of the Supervisory Board.
2 As from 1 May 2008 Chairman of the Supervisory Board.
3 As from 1 April 2009 Member of the Supervisory Board.
4 As from 1 April 2009 Member of the Supervisory Board
5 Until 1 May 2009 Member of the Supervisory Board.
Notes to the consolidated statement of financial position

121Financial Statement 2009
49. Cash flows from operating activitiesAn adjustment is made to the operating result for
the depreciation of property, plant and equipment and
the amortization of intangible assets. The results on
financial assets are related to the gains and losses from
financial assets available-for-sale, at fair value through
profit and loss and held for trading.
50. Cash flows from investing activitiesInterest received relates to the amounts received on
the current accounts of the Company. The interest received
from banking operations is included in the result.
Purchases and sales of property, plant and equipment
and financial fixed assets are based on the consolidated
purchase and selling prices. Deferred payments on the
purchases and sales are reported as movements in working
capital (short-term payments) or under long-term liabilities
for the payment obligations due after more than one year.
The intangible assets are related to capitalized software.
In general the movement in the purchase and proceeds
of financial assets are a direct consequence of the regular
banking activities within the Company.
51. Cash flows from financing activitiesInterest paid relates to the amounts paid on the current
accounts and the long-term liabilities of the Company.
The interest paid from banking operations is included in
the result.
Notes to the consolidated statement of cash fl ows


Company Financial Statements 2009

124 Annual Report 2009 Robeco Groep N.V.
Company income statement
for the year ended 31 December
EUR x million Notes 2009 2008
Income statement
Operating income - 2.6
Non-operating income 1.6 9.7
Interest income 1.7 9.1
Interest expense – 0.1 – 0.3
Result on financial assets held for trading - 0.9
Result before tax 1.6 12.3
Tax – 1.4 – 2.0
Income from investments in group and associated
companies after tax 53 – 13.5 164.2
Result for the year – 13.3 174.5

125Financial Statement 2009
Company statement of comprehensive income
for the year ended 31 December
EUR x million Notes 2009 2008
Result for the year – 13.3 174.5
Other comprehensive income
Net unrealized results on financial assets available-for-sale 83.5 – 228.6
Realized gains and losses on financial assets available-for-sale reclassified to
the income statement on disposal 2.5 0.8
Impairment of financial assets available-for-sale 28.6 68.2
Income tax effect – 29.5 39.0
85.1 – 120.6
Net result on hedge of net investments 5.1 – 10.3
5.1 – 10.3
Exchange differences on translation of foreign operations – 8.6 24.8
Other items – 0.1 – 14.6
Other comprehensive income for the year, net of tax 81.5 – 120.7
Total comprehensive income for the year, net of tax 68.2 53.8

126 Annual Report 2009 Robeco Groep N.V.
Company statement of fi nancial position
at 31 December (before appropriation of result)
EUR x million Notes 2009 2008
Assets
Non-current
Investments in subsidiaries and associates 54 1,181.7 1,073.6
Total non-current 1,181.7 1,073.6
Deferred tax assets - 15.9
Current assets
Accounts receivable 7.0 103.1
Subsidiaries and associates 6.9 0.7
Current tax receivable - 97.9
Other receivables 0.1 4.5
Cash and cash equivalents 55 256.3 160.7
Total current assets 263.3 263.8
Total assets 1,445.0 1,353.3
Equity and liabilities
Shareholders’ equity
Issued capital 4.5 4.5
Share premium 1,119.5 1,119.5
Available-for-sale reserve – 75.4 – 160.5
Foreign currency translation reserve – 9.8 – 6.3
Other revaluation reserve 51.9 62.0
Retained earnings 276.0 279.3
Total shareholders’ equity 56 1,366.7 1,298.5
Non-current liabilities
Provisions 57 18.7 28.1
Current liabilities
Subsidiaries and associates 58 35.8 26.6
Other liabilities 59 23.8 0.1
Total current liabilities 59.6 26.7
Total liabilities 78.3 54.8
Total equity and liabilities 1,445.0 1,353.3

127Financial Statement 2009
52. General accounting policiesThe accounting policies used in the corporate financial
statements are based on Part 9 of Book 2 of the Dutch
Civil Code. The valuation of the items is identical to the
valuation used in the consolidated financial statements.
53. Income from investment in subsidiaries and associates after tax
EUR x million 2009 2008
Robeco Institutional Asset
Management B.V. 3.2 86.8
Robeco International Holding B.V. 22.5 9.9
Robeco Direct N.V. – 34.1 – 41.4
Robeco Nederland B.V. – 5.1 108.9
Total share of result of subsidiaries
and associates at 31 December – 13.5 164.2
54. Investment in subsidiaries and associatesMovements in Investment in group and associated
companies were as follows in 2008 and 2009:
EUR x million 2009 2008
Value of subsidiaries and associates
at 1 Januari 1,073.6 1,194.8
Revaluation of subsidiaries 71.6 – 120.7
Net result for the financial year – 13.5 164.2
Dividend distributions - – 214.7
Capital increase 50.0 50.0
Investment in subsidiaries and
associates at 31 December 1,181.7 1,073.6
The Company filed a statement under Section 403 (1)(f)
of Book 2 of the Dutch Civil Code for the period starting
1 January 2009 and ending 31 December 2009 with
the Trade Registry for the following companies:
Robeco Direct N.V.
Robeco International Holding B.V.
Robeco Nederland B.V.
Robeco India Holding B.V.
55. Cash and cash equivalentsCash and cash equivalents are all cash at banks.
Notes to the company fi nancial statements

128 Annual Report 2009 Robeco Groep N.V.
Notes to the company financial statements
EUR x million Attributable to equity holders of the parent
Issued
share
capital
Share
premium
Available-
for-sale
reserve
Foreign
currency
translation
reserve
Other
revaluation
reserve
Retained
earnings Total
At 1 January 2009 4.5 1,119.5 – 160.5 – 6.3 62.0 279.3 1,298.5
Result for the year - - - - - – 13.3 – 13.3
Other comprehensive income - - 85.1 – 3.5 - – 0.1 81.5
Total comprehensive income - - 85.1 – 3.5 - – 13.4 68.2
Amortization of intangible assets - - - - – 10.1 10.1 -
At 31 December 2009 4.5 1,119.5 – 75.4 – 9.8 51.9 276.0 1,366.7
EUR x million Attributable to equity holders of the parent
Issued
share
capital
Share
premium
Available-
for-sale
reserve
Foreign
currency
translation
reserve
Other
revaluation
reserve
Retained
earnings Total
At 1 January 2008 4.5 1,119.5 – 39.9 – 20.8 73.9 107.5 1,244.7
Result for the year - - - - - 174.5 174.5
Other comprehensive income - - – 120.6 14.5 - – 14.6 – 120.7
Total comprehensive income - - – 120.6 14.5 - 159.9 53.8
Amortization of intangible assets - - - - – 11.9 11.9 -
At 31 December 2008 4.5 1,119.5 – 160.5 – 6.3 62.0 279.3 1,298.5
56. Shareholders’ equity
Issued share capital
The authorized share capital amounts to EUR 22,689,015
(2008: EUR 22,689,015) consisting of 22,689,015
shares with a nominal value of EUR 1 each, of which
EUR 4,537,803 is paid in full.
Shareholders are entitled to receive dividends when
declared and are entitled to vote on a one-vote-per share
basis at the Company’s shareholder meetings.
Share premium
The share premium was set at the time of the sale of
the shares at a price above the par value.
Available for sale reserve
The available-for-sale reserve concerns the fair value
changes on the available-for-sale investments.
Foreign currency translation reserve
The foreign currency translation reserve includes
the exchange rate differences arising from the translation
of the financial statements of foreign subsidiaries.
It also includes the effect of hedging the net investments
in the foreign subsidiaries.
Retained earnings
Movements result from the deduction of the result for
the year and an adjustment to the deferred tax assets
regarding US State and local taxes.
Other revaluation reserve
The other revaluation reserve is used to record the
amortization of intangible assets.
57. ProvisionsThe deferred tax liability relates to the temporary
differences between the carrying amounts of assets and
liabilities of the foreign companies acquired in previous
years and the amounts used for tax purposes. The deferred
tax liability will be released in the coming years.

129Financial Statement 2009
Movements in provisions are as follows:
(EUR x million) 2009 2008
Balance at 1 January 28.1 42.5
Released to the current tax payable – 9.4 – 14.4
Balance at 31 December 18.7 28.1
58. Subsidiaries and associatesThe Company has current accounts with several
subsidiaries. These balances are interest-bearing.
59. PersonnelThe Company does not employ any personnel.
The Management Board is employed by its subsidiary
Robeco Nederland B.V.
60. OtherAs the Company’s income statement for 2009 is included
in the consolidated financial statements, a summary
income statement is sufficient to comply with the provisions
of Section 402 of Book 2 of the Dutch Civil Code.
For more detailed information, please refer to the section
Basis of consolidation drawn up for the consolidated
statement of financial position and income statement of
Robeco Groep N.V.
Rotterdam, 8 April 2010
The Management Board The Supervisory Board
Other information
Articles of Association rules governing
appropriation of result
Under Article 22 of the Articles of Association,
the result available for distribution shall be at
the disposal of the General Meeting of Shareholders.
Appropriation of result
The result of EUR –13.3 million will be charged
to the retained earnings.

130 Annual Report 2009 Robeco Groep N.V.
Auditor’sreport
To the Shareholder, the Supervisory Board and the
Management Board of Robeco Groep N.V.
Report on the financial statementsWe have audited the accompanying financial statements
2009 of Robeco Groep N.V., Rotterdam (as set out on
pages 62 to 129). The financial statements consist of
the consolidated financial statements and the company
financial statements. The consolidated financial statements
comprise the consolidated statement of financial position
as at 31 December 2009, the income statement, the
statements of comprehensive income, changes in equity
and cash flows for the year then ended, and notes
comprising a summary of significant accounting policies
and other explanatory information.The company financial
statements comprise the company statement of financial
position as at 31 December 2009, the company income
statement, the company statement of comprehensive
income for the year then ended and the notes.
Management’s responsibility
Management is responsible for the preparation and fair
presentation of the financial statements in accordance with
International Financial Reporting Standards as adopted
by the European Union and with Part 9 of Book 2 of the
Netherlands Civil Code, and for the preparation of the
management board report in accordance with Part 9 of
Book 2 of the Netherlands Civil Code. This responsibility
includes: designing, implementing and maintaining
internal control relevant to the preparation and fair
presentation of the financial statements that are free from
material misstatement, whether due to fraud or error;
selecting and applying appropriate accounting policies;
and making accounting estimates that are reasonable in
the circumstances.
Auditor’s responsibility
Our responsibility is to express an opinion on the financial
statements based on our audit. We conducted our audit
in accordance with Dutch law. This law requires that we
comply with ethical requirements and plan and perform
the audit to obtain reasonable assurance whether the
financial statements are free from material misstatement.
An audit involves performing procedures to obtain audit
evidence about the amounts and disclosures in the
financial statements. The procedures selected depend on
the auditor’s judgment, including the assessment of the
risks of material misstatement of the financial statements,
whether due to fraud or error. In making those risk
assessments, the auditor considers internal control relevant
to the entity’s preparation and fair presentation of the
financial statements in order to design audit procedures
that are appropriate in the circumstances, but not for
the purpose of expressing an opinion on the effectiveness
of the entity’s internal control. An audit also includes
evaluating the appropriateness of accounting policies
used and the reasonableness of accounting estimates
made by management, as well as evaluating the overall
presentation of the financial statements. We believe that
the audit evidence we have obtained is sufficient and
appropriate to provide a basis for our audit opinion.
Opinion with respect to the consolidated
financial statements
In our opinion, the consolidated financial statements
give a true and fair view of the financial position of Robeco
Groep N.V. as at 31 December 2009, and of its result
and its cash flows for the year then ended in accordance
with International Financial Reporting Standards as
adopted by the European Union and with Part 9 of Book 2
of the Netherlands Civil Code.
Opinion with respect to the company
financial statements
In our opinion, the company financial statements give
a true and fair view of the financial position of Robeco
Groep N.V. as at 31 December 2009, and of its result for
the year then ended in accordance with Part 9 of Book 2
of the Netherlands Civil Code.
Report on other legal and regulatory requirementsPursuant to the legal requirement under 2:393 sub 5 part
f of the Netherlands Civil Code, we report, to the extent
of our competence, that the Management Board report
is consistent with the financial statements as required by
2:391 sub 4 of the Netherlands Civil Code.
The Hague, 8 April 2010
Ernst & Young Accountants LLP
Signed by Joost Hendriks

131Financial Statement 2009

132 Annual Report 2009 Robeco Groep N.V.
Consolidated income statement
Consolidated statement of financial position
Summary assets under management (AuM)
1 Distributions consist of dividends and interest paid.
Key fi gures 2005 - 2009
EUR x million 2009 2008 2007 2006 2005
Operating income 512.2 888.9 819.6 657.5 622.8
Operating expenses – 528.0 – 618.7 – 543.0 – 436.5 – 389.2
Operating result – 15.8 270.2 276.6 221.0 233.6
Non-operating income 13.8 – 40.8 2.3 31.9 – 8.3
Result before tax – 2.0 229.4 278.9 252.9 225.3
Tax – 9.0 – 58.2 – 78.8 – 59.5 – 72.8
Non-controlling interest – 2.3 3.3 0.1 – 0.4 – 0.5
Net result – 13.3 174.5 200.2 193.0 152.0
EUR x million 2009 2008 2007 2006 2005
Banking operations 9,047 8,612 8,203 8,899 10,179
Asset management
operations 2,040 2,651 2,471 2,150 2,318
Total assets 11,087 11,263 10,674 11,049 12,497
Group capital 1,383 1,319 1,247 961 797
- of which equity 1,367 1,299 1,245 954 787
Banking operations 8,717 8,544 7,973 8,633 10,047
Asset management
operations 987 1,400 1,454 1,455 1,653
Total liabilities 11,087 11,263 10,674 11,049 12,497
EUR x billion 2009 2008 2007 2006 2005
AuM as of 1 January 110.7 145.8 141.7 131.6 111.1
Investment result 19.2 – 29.1 3.0 5.0 18.8
Regular net cash flow 7.5 0.6 – 0.3 5.8 1.7
Non-regular net cash flow – 2.0 – 2.1 - - 0.7
Distributions 1 – 0.5 – 0.5 – 0.5 – 0.7 – 0.7
Acquisitions - – 4.0 1.9 - -
AuM at 31 December 134.9 110.7 145.8 141.7 131.6
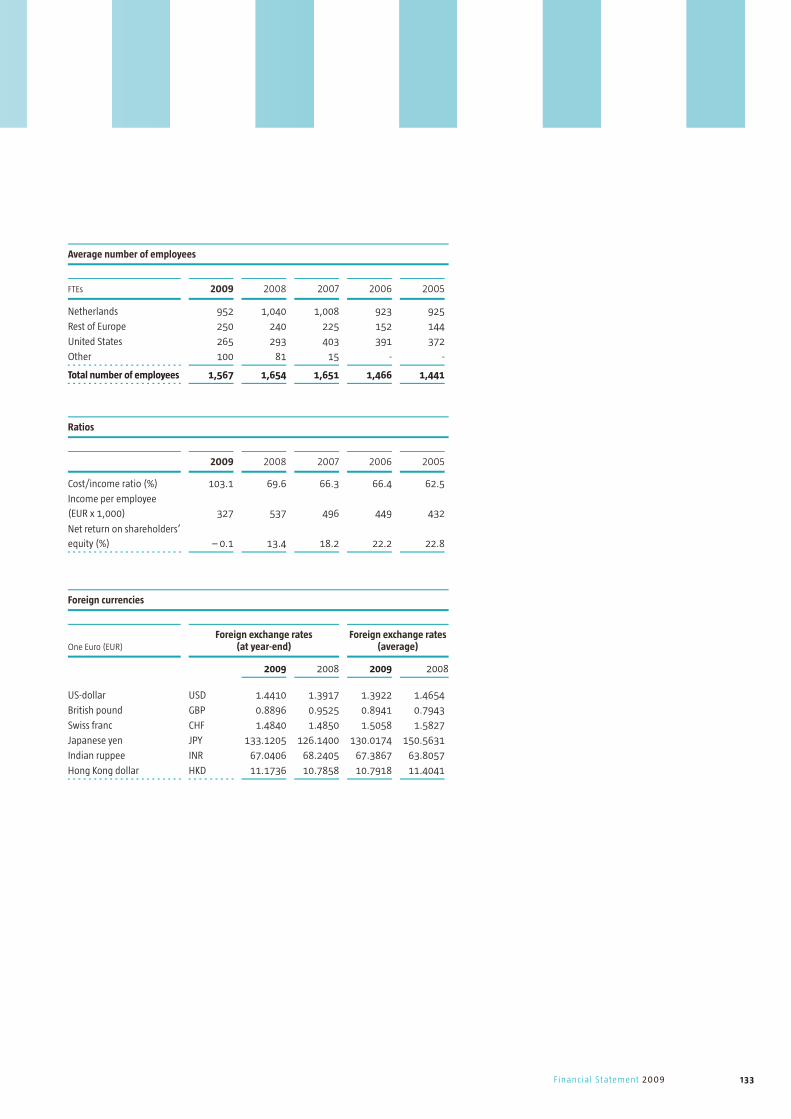
133Financial Statement 2009
Average number of employees
Ratios
Foreign currencies
FTEs 2009 2008 2007 2006 2005
Netherlands 952 1,040 1,008 923 925
Rest of Europe 250 240 225 152 144
United States 265 293 403 391 372
Other 100 81 15 - -
Total number of employees 1,567 1,654 1,651 1,466 1,441
2009 2008 2007 2006 2005
Cost/income ratio (%) 103.1 69.6 66.3 66.4 62.5
Income per employee
(EUR x 1,000) 327 537 496 449 432
Net return on shareholders’
equity (%) – 0.1 13.4 18.2 22.2 22.8
One Euro (EUR)Foreign exchange rates
(at year-end)Foreign exchange rates
(average)
2009 2008 2009 2008
US-dollar USD 1.4410 1.3917 1.3922 1.4654
British pound GBP 0.8896 0.9525 0.8941 0.7943
Swiss franc CHF 1.4840 1.4850 1.5058 1.5827
Japanese yen JPY 133.1205 126.1400 130.0174 150.5631
Indian ruppee INR 67.0406 68.2405 67.3867 63.8057
Hong Kong dollar HKD 11.1736 10.7858 10.7918 11.4041


136 Annual Report 2009 Robeco Groep N.V.
I
This Robeco annual report and the information contained
herein has been prepared and is presented by Robeco
Groep N.V., incorporated in the Netherlands. It is solely
intended to supply the reader with general information
about the investment-management activities and
Assets under Management of Robeco Groep N.V. and its
subsidiaries worldwide. It does not constitute an offer
to sell or solicitation of an offer to buy any investment
product or program offered by Robeco Groep N.V. or any
of its subsidiaries, and is not intended to be used as the
basis for an investment decision with respect to any such
product or program or a decision to retain Robeco Groep
N.V. or any of its subsidiaries to provide such services.
Readers should be aware of the fact that the shares in
the capital of Robeco Groep N.V. and the shares in the
capital of all its subsidiaries are not listed on any stock
exchange and are not otherwise for sale to the public.
The information in this Robeco annual report is not
intended to solicit the purchase or sale of any securities in
any investment funds or other financial products of Robeco
Groep N.V. and its subsidiaries in any country where the
offering and/or distribution thereof is not allowed or not
available to the public. Readers of this Robeco annual
report should be aware of the fact that they are solely
responsible for full compliance with all laws and/or other
regulations in their respective jurisdictions with respect
to any decision on such purchase or sale. Robeco Groep
N.V. only provides investment-advisory services, including
investment advice with respect to investment products
and programs, through its authorized local subsidiaries.
All its banks, investment-adviser subsidiaries and affiliates
are registered with their respective local regulators.
II
This annual report may contain statements that amongst
others relate to future net result and operating expenses.
These statements are not historical facts nor do they
contain any guarantee of future performance, but they are
statements of future expectations or forward-looking
statements based on management’s current views and
assumptions and involve known and unknown risks and
uncertainties that could cause actual results, performance
or events to differ materially from those expressed or
implied in such statements.
Actual results, performance or events may differ materially
from those expressed or implied in such statements due
to, without limitation, [I] general economic conditions,
[II] performance of financial markets, [III] interest-rate
levels, [IV] currency exchange rates, including but not
limited to the EUR/USD exchange rate, [V] changes in
laws and regulations, including monetary convergence
and the European Monetary Union, [VI] changes in
the policies of central banks and/or foreign governments,
[VII] cost overruns and [VIII] competitive factors, in each
case on a global, regional and/or national basis.
Except as required by law Robeco Groep N.V. on behalf
of itself and its subsidiaries expressly disclaims any
obligation or undertaking to update or revise any
statements of future expectations or other forward looking
statements contained herein whether as a result
of new information, change of events, circumstances
or conditions on which any such statement is based on,
or otherwise.
Disclaimer


![In d e x [bib.kuleuven.be] fileCorporate Governance 15 ... Marketing strategy 19 Product policy 19 Marketing and sales policy 19 2. Investments and industrial operation 24 3 ...](https://static.documents.pub/doc/80x56/5d3d29ba88c993c11a8b7273/in-d-e-x-bib-governance-15-marketing-strategy-19-product-policy-19-marketing.jpg)


