Annual Report 2009 Annual Report 2009 has been dispatched to all shareholders. The Report presents a comprehensive account of the financial and operational performance of the Company. We have named it the “dh Green Report ” because it highlights our increasing focus on adopting environment-friendly practices at all levels of the organization. In line with the foregoing, the Report has been printed on environment-friendly paper certified by the Forest Stewardship Council (FSC), which means that it comes from forests that are managed to meet the social, economic and ecological needs of the present and future generations.The envelopes used for dispatch of Report are also made of recycled paper.
Transcript
Annual Report 2009
Annual Report 2009 has been dispatched to all shareholders. The Report presents a comprehensive account of
the financial and operational performance of the Company. We have named it the “dh Green Report ” because it
highlights our increasing focus on adopting environment-friendly practices at all levels of the organization.
In line with the foregoing, the Report has been printed on environment-friendly paper certified by the Forest
Stewardship Council (FSC), which means that it comes from forests that are managed to meet the social,
economic and ecological needs of the present and future generations. The envelopes used for dispatch of Report
are also made of recycled paper.
In this report
This Report presents a comprehensive account of the financial and operational performance of Dawood Hercules
Chemicals Limited during the year 2009. Our guiding principal during the preparation of the Report was to
provide accurate and relevant information in a professional and reader-friendly format in an aesthetically
pleasing layout.
The Report documents all the major events and activities that have taken place in the year. It provides the
stakeholder with the usual Operating Highlights, Financial Statements, Company Information, Vision and
Mission, Business Ethics and Core Values and Directors' Report. We have also added the records that the
Company has broken; the awards received; a calendar of the events in the forthcoming year and the Company
organisational chart.
The Company has over the course of the year, increased its production, gross profit, capacity utilisation and sales.
DH also commissioned and completed various in-house engineering projects such as coil replacement,
overhauling of the main generator and ID fan turbine, the replacement of the supporting structure of the urea
reactor at the Plant. All of these projects were done before the time allotted, showing the commitment and
expertise of the DH team.
The DH Corporate Social Responsibility team has also undertaken a number of projects within the organisation as
well as in the community. Within the Company we have instituted recycling of paper and waste, as well as ways to
reduce the consumption of water. The CSR committee has worked with several reputable NGOs, which is
described in detail within the Report. We hope that we have satisfied all aspects of our stakeholders’ queries and
curiosity regarding their Company.
The Future of Earth lies in our hands.
“Climate Change” and “Global Warming” - two favourite catch phrases of the environmental activists have now
entered the everyday vocabulary of the people. The sustainability threat is real and serious – the world is
getting warmer; clean water is in short supply for agriculture and the polluted environment is posing serious
health risks. The truth is that every single thing we do in our daily lives has an impact on the earth, good or bad.
“Environmental friendliness” is neither a fad nor an option, it is a must for all of earth’s inhabitants. We owe this
earth to our future generations and are individually and collectively answerable to what we are doing with it.
At Dawood Hercules, we have embarked on a journey to establish an eco-friendly culture at all levels of the
organization. We believe that all economic activities must be carried out in a responsible manner to ensure
zero or minimum impact on the environment. To quote Henry David Thoreau, “What's the use of a house if you
haven't a tolerable planet to put it on?”. We want environment consciousness to become as much a part of our
work habits as safety-consciousness. Over the years, safety has become a way of life in our organization – all our
activities and operations have safety as the most fundamental prerequisite and the attitude and approach of
our people reflects it. We now want to take environment-consciousness to the same level. We want to think
green and act green, or in other words, live green. Small things like turning the lights off while leaving, reducing
paper waste, using recycled paper and envelopes; buying energy efficient office equipment; using recycling
bins; not leaving water taps dripping; etc. can make a huge difference. A cleaner and greener working
env ironment a lso ensures enhanced
productivity and efficiency. We are
undertaking an awareness drive in the
entire organization and devising a
communication mechanism
regarding our green initiatives.
Think Green, Act Green
dh Annual Report 2009
Achievements 2009
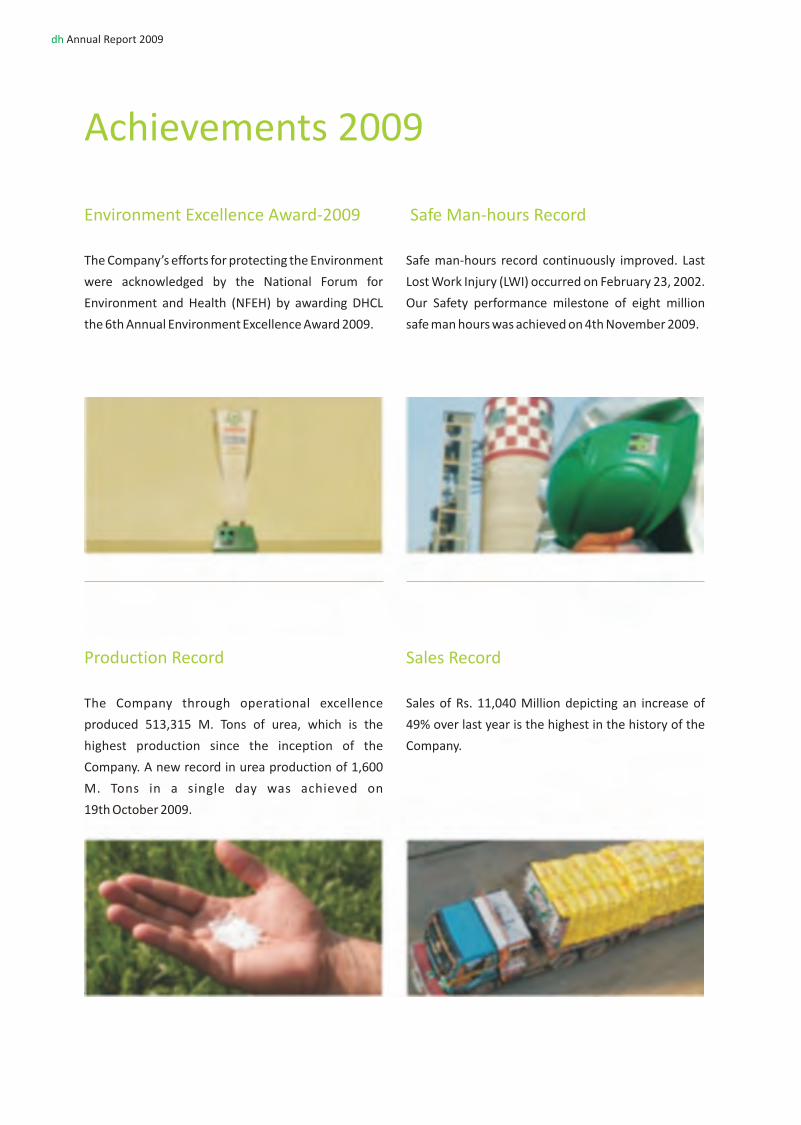
Environment Excellence Award-2009
The Company’s efforts for protecting the Environment
were acknowledged by the National Forum for
Environment and Health (NFEH) by awarding DHCL
the 6th Annual Environment Excellence Award 2009.
Safe Man-hours Record
Safe man-hours record continuously improved. Last
Lost Work Injury (LWI) occurred on February 23, 2002.
Our Safety performance milestone of eight million
safe man hours was achieved on 4th November 2009.
The Company through operational excellence
produced 513,315 M. Tons of urea, which is the
highest production since the inception of the
Company. A new record in urea production of 1,600
M. Tons in a single day was achieved on
19th October 2009.
Sales Record
Sales of Rs. 11,040 Million depicting an increase of
49% over last year is the highest in the history of the
Company.
dh Annual Report 2009
Production Record
Table of Contents
Statement Of Compliance With The
Code Of Corporate Governance
Auditors’ Report to the Members
Review Report to the Members
Profit and Loss Account
Statement of Comprehensive Income
Balance Sheet
Cash Flow Statement
Statement of Changes in Equity
Notes to the Financial Statements
Pattern of Shareholding
Form of Proxy
Vision
Mission
Strategy & Objectives
Business Ethics and Core Values
Performance Highlights
Operating Highlights
Notice of Annual General Meeting
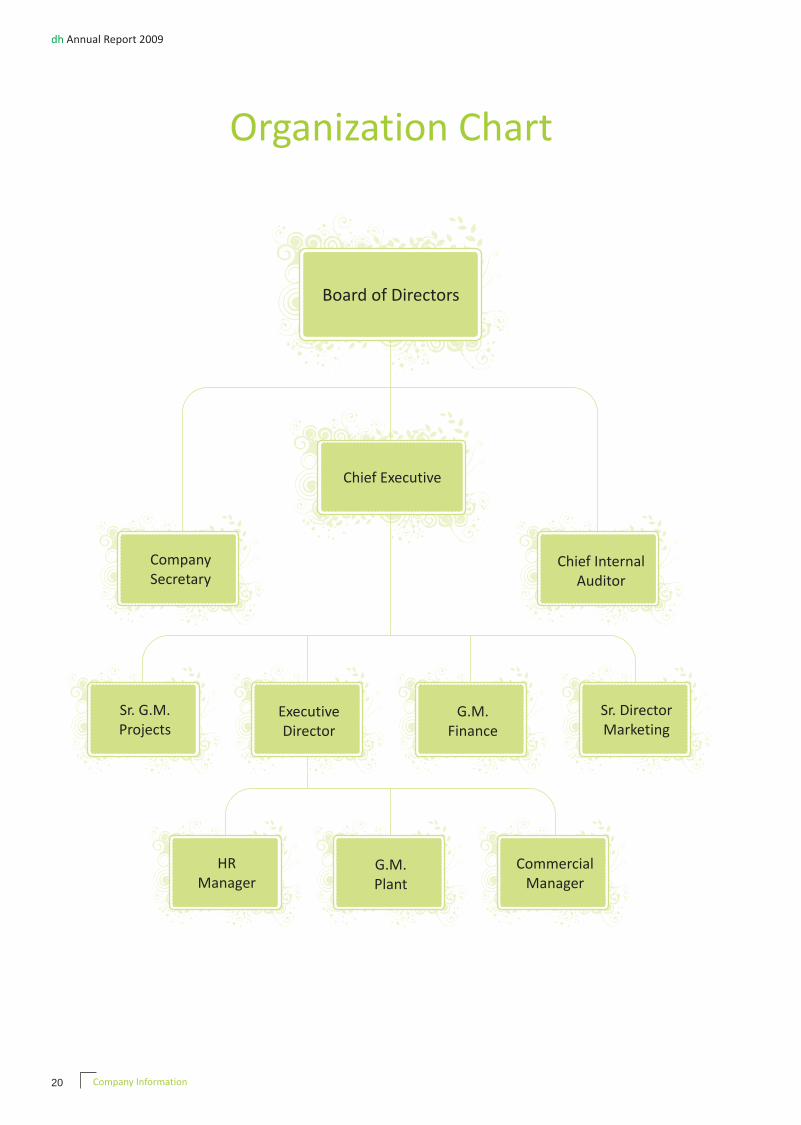
Organization Chart
Company Information
Board of Directors
Committees
Director’s Report
Fertilizer Marketing Review
Performance Review
Corporate Affairs
Business Risks and Challenges
Health, Safety and Environment
Corporate Social Responsibility
Human Resource Management
Outlook 2010
Acknowledgment
8-16
32-62
Financial Statements
32
38
44
47
48
52
57
62
62
18
20
21
22
26
8
10
12
14
16
16
Ten Years at a Glance
Graphical Presentation
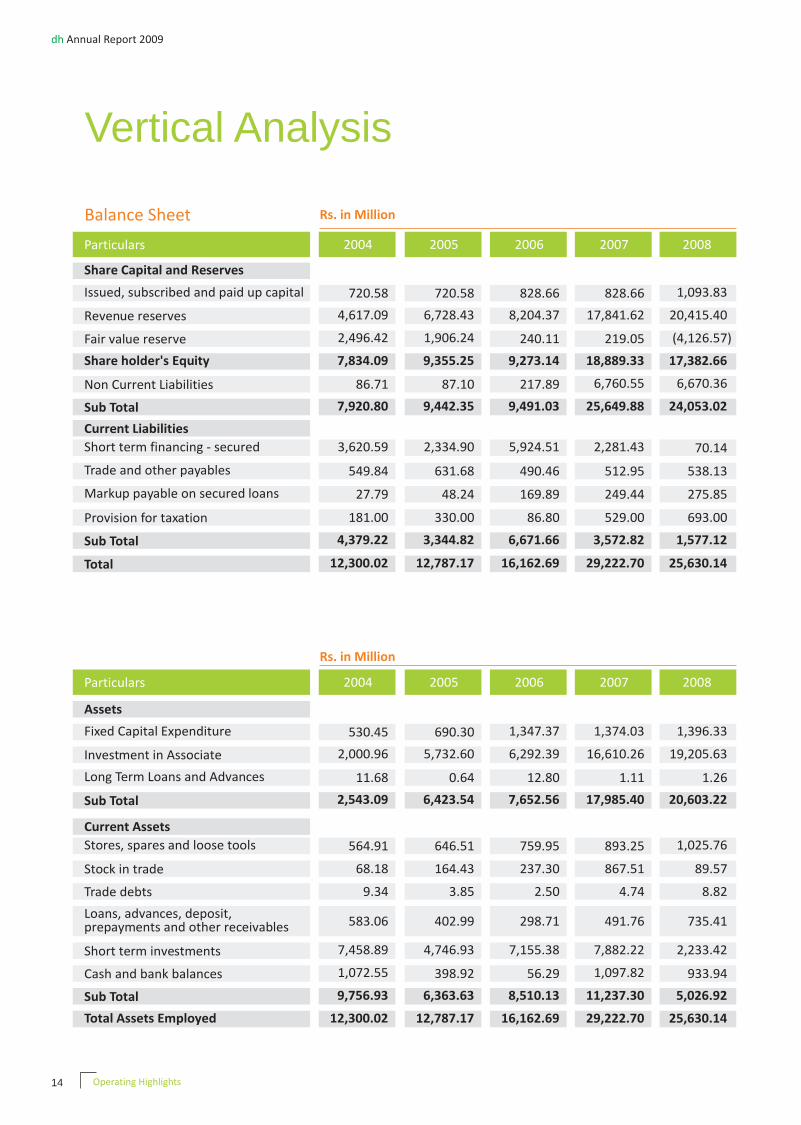
Horizontal Analysis (Balance Sheet)
Vertical Analysis (Balance Sheet)
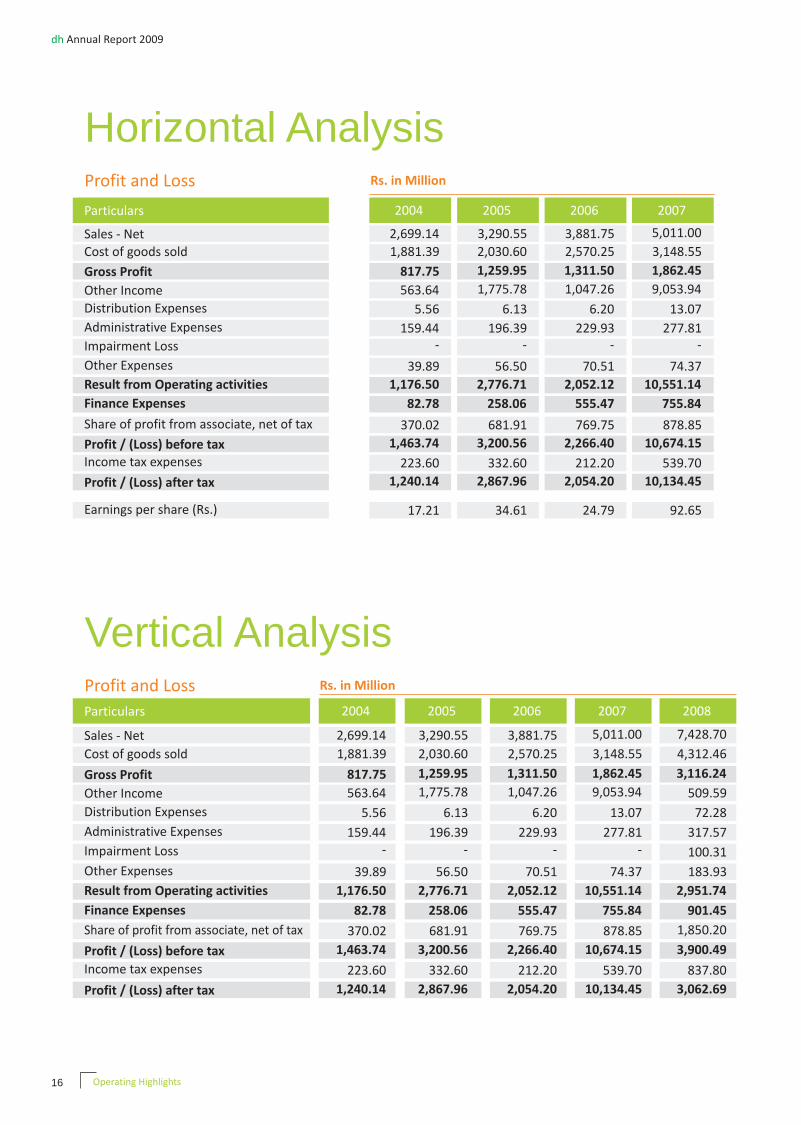
Horizontal Analysis (Profit and Loss)
Vertical Analysis (Profit and Loss)
4
4
5
5
6
Quality Management System
Business Process Re-Engineering
Engineering Excellence
dh Annual Report 2009
68
70
71
72
73
74
76
77
78
105
68-105
63
64
65
To excel in the fertilizer and allied business at national and international level by maintaining highest
standards of product quality thereby playing our role in the development of the country's economy and
adding value to the shareholders' investment.
To offer consistent dividends to the shareholders.
To chalk out a plan to improve production techniques and quality standards.
To provide career grooming opportunities to the talented professionals.
To become a good corporate citizen.
To develop long-term relationship with the employees.
To create high performing organizational environment in which bright ideas are generated and nurtured.
To inculcate honest and ethical behaviour.
To create safe and healthy environment and friendly atmosphere for the employees.
To improve quality of life for the employees.
dh Environmental Impact
Our fertilizer helps to replace nutrients removed
from the soil through harvesting and therefore it
supports the sustainable production of food, fibre
and fuel. By optimizing production on existing farm
land we contribute in minimizing the destruction of
habitat and recreational land.
Vision
Mission
4 Vision & Mission
dh Annual Report 2009
Strategy & Objectives
Business Ethics and Core Values
Professionalism through leadership and integrity.
Innovation, teamwork and partnership.
Long term profitability and growth.
Perpetual commitment to quality and continuous improvement.
5Strategy & Objectives , Business Ethics and Core Values
Our corporate strategy is aimed at developing and
maintaining long term competitive advantage. For
this, we constantly strive to develop systems which
are not only consistent with our current needs but are
also enablers of a futuristic culture. We want to make
the best use of our resources and turn every challenge
into an opportunity. While building upon our core
strengths, we always explore new avenues for further
growth.
“Value addition” and “sustainable development” are
the most significant aspects of our corporate strategic
objectives. Our goal is to add value to whatever we do
and whoever we deal with. This is achieved through
consistent focus on the concepts of continuous
improvement and customer-orientation. The impact
created in this way is not only profound but self-
sustaining.
dh Annual Report 2009
2009
6 Performance Highlights
dh Annual Report 2009
Performance Highlights
Key Figures
1%Increase5,265 M. Tons
Production
2009 513,315 M. Tons
2008 1%508,050 M. Tons
27%IncreaseRs. 844 Million
Gross Profit
2008 27%
2009
2008 1%
115%
114%
2009
49%IncreaseRs. 3,611 Million
Sales
2008 49%
Achieved Record Annual Production of 513,315
M. Tons.
Record Sales of Rs. 11,040 Million
Attainment of eight million safe man-hours.
ICAP and ICMAP Award for the best presented
annual report 2008
March
Safety Week Celebration
Sports Week Celebration
Annual General Meeting
April Q1 - 2010 Board Meeting
May Hajj Draw Ceremony
July Q2 - 2010 Board Meeting
August -
SeptemberCBA Agreement 2010 -2012
October
Tree Plantation - A Green
DH Project
Q3 - 2010 Board Meeting
January Annual TurnaroundQ4-2009 Board Meeting
3,960 Million
3,116 Million
11,040 Million
7,429 Million
1%Increase
Capacity Utilization
Key Events
2009
Key Events
2009
Calendar of Major Events
2010
7
dh Annual Report 2009
Food Security
Feeding a growing population is a major global challenge.The world agricultural productivity needs to be greatlyimproved, with a doubling of food production in order tocreate food security for a global population expected toreach 9.2 billion by 2050.
Urea is the world's most produced chemical, at around 140 million tonnes per year.
Demand for urea is growing at 3.7% globally – higher even than the rise in population.
Infact, around 90% of the world's urea is used to fertilize crops.
And more than 40% of all food grown in the world is fertilized by urea.
Performance Highlights
Operating Highlights
PARTICULARS UNIT 20082009 2007
8 Operating Highlights
dh Annual Report 2009
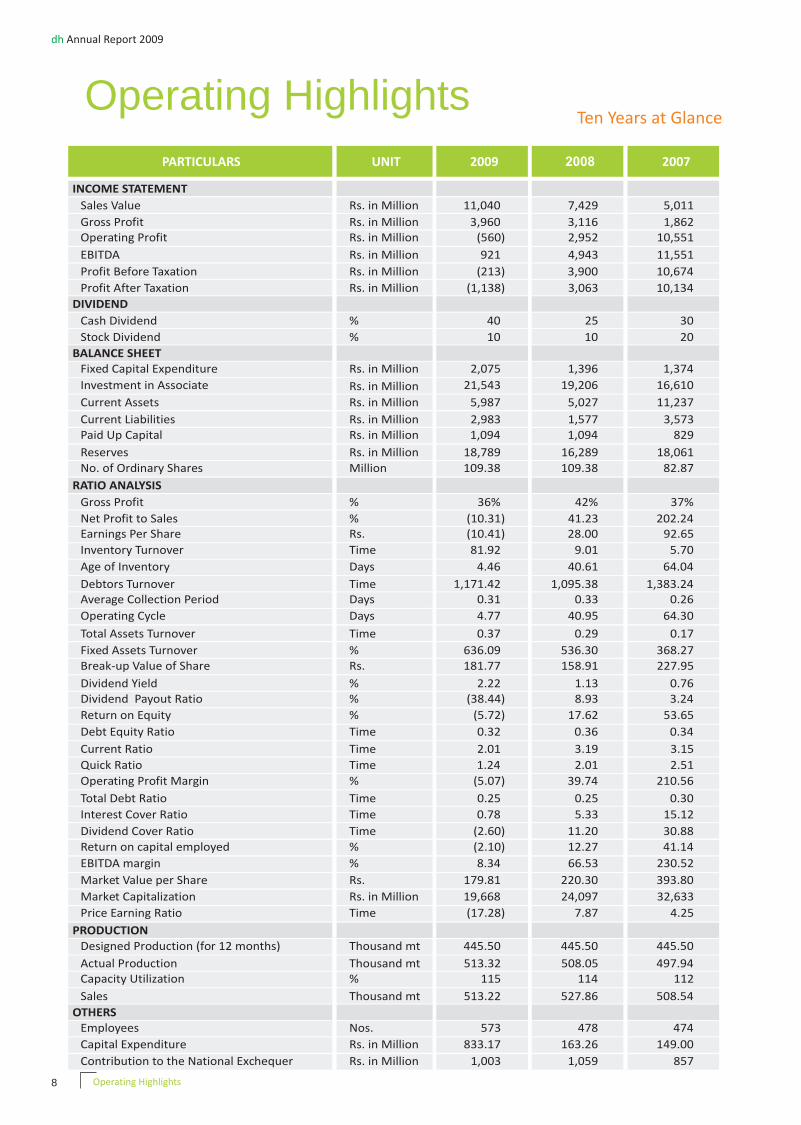
Ten Years at Glance
INCOME STATEMENT
Sales Value
Gross ProfitOperating Profit
EBITDA
Profit Before Taxation
Profit After Taxation
DIVIDEND
Cash Dividend
Stock Dividend
BALANCE SHEETFixed Capital Expenditure
Investment in Associate
Rs. in Million
Rs. in MillionRs. in Million
Rs. in Million
Rs. in Million
Rs. in Million
%
%
Rs. in Million
Rs. in Million
11,040
3,960(560)
921
(213)
(1,138)
40
10
2,075
7,429
3,1162,952
4,943
3,900
3,063
25 10
1,396
5,011
1,86210,551
11,551
10,674
10,134
30 20
1,374
Paid Up Capital
Reserves
No. of Ordinary Shares
RATIO ANALYSIS
Gross Profit
Net Profit to SalesEarnings Per Share
Inventory Turnover
Age of Inventory
Debtors TurnoverAverage Collection Period
Operating Cycle
Total Assets Turnover
Fixed Assets TurnoverBreak-up Value of Share
Dividend YieldDividend Payout Ratio
Return on Equity
Debt Equity Ratio
Current Ratio
Quick Ratio
Operating Profit Margin
Total Debt Ratio
Interest Cover Ratio
Dividend Cover Ratio
Return on capital employed
EBITDA margin
Market Value per Share
Market Capitalization
Price Earning Ratio
PRODUCTION
Designed Production (for 12 months)
Actual ProductionCapacity Utilization
Sales
OTHERSEmployees
Capital Expenditure
Contribution to the National Exchequer
Current Assets
Current Liabilities Rs. in Million
Rs. in Million
Million
%
%Rs.
Time
Days
TimeDays
Days
Time
%Rs.
%%
%
Time
Time
Time
%
Time
Time
Time
%
%
Rs.
Rs. in Million
Time
Thousand mt
Thousand mt%
Thousand mt
Nos.
Rs. in Million
Rs. in Million
Rs. in Million
Rs. in Million1,094
18,789
109.38
36%
(10.31)(10.41)
81.92
4.46
1,171.420.31
4.77
0.37
636.09181.77
2.22(38.44)
(5.72)
0.32
2.01
1.24
(5.07)
0.25
0.78
(2.60)
(2.10)
8.34
179.81
19,668
(17.28)
445.50
513.32115
513.22
573
833.17
1,003
5,987
2,9831,094
16,289
109.38
42%
41.2328.00
9.01
40.61
1,095.380.33
40.95
0.29
536.30158.91
1.138.93
17.62
0.36
3.19
2.01
39.74
0.25
5.33
11.20
12.27
66.53
220.30
24,097
7.87
445.50
508.05114
527.86
478
163.26
1,059
5,027
1,577829
18,061
82.87
37%
202.2492.65
5.70
64.04
1,383.240.26
64.30
0.17
368.27227.95
0.763.24
53.65
0.34
3.15
2.51
210.56
0.30
15.12
30.88
41.14
230.52
393.80
32,633
4.25
445.50
497.94112
508.54
474
149.00
857
11,237
3,573
21,543 19,206 16,610
2006 2005 2004 2003 2002 2001 2000
9
dh Annual Report 2009
FOR THE YEAR ENDED 31st DECEMBER
2,851
745823
906
823
595
100
20
400
2,886
9701,057
1,140
1,057
764
100
Nil
419
2,810
1,0101,132
1,214
1,131
793
95
50
334
3,882
1,3122,052
2,903
2,266
2,054
80
Nil
1,347
3,291
1,2602,777
3,534
3,201
2,868
85
15
690
2,699
8181,176
1,663
1,464
1,240
105
Nil
530
2,983
1,0601,721
1,810
1,686
1,379
100
Nil
464
2,111
758480
3,055
48.04
26%
20.8612.38
12.96
28.16
342.461.07
29.23
0.65
696.9073.58
13.7080.78
16.82
Nil
2.79
1.78
28.87
-
-
1.24
22.71
31.78
73.00
3,507
5.90
445.50
381.9586
396.82
533
42.00
615
1,902
698400
3,020
40.00
34%
26.4919.11
8.25
44.37
302.981.21
45.58
0.69
629.8885.51
12.3552.33
22.35
Nil
2.72
1.03
36.63
-
-
1.91
30.22
39.50
81.00
3,240
4.24
445.50
436.9098
456.63
554
12.00
633
2,267
520480
4,010
48.04
36%
28.2311.01
14.18
25.74
384.430.95
26.69
0.55
766.0293.47
7.0986.29
17.67
Nil
4.36
2.99
40.29
-
1,233.31
1.16
24.78
43.21
134.00
6,437
12.17
445.50
414.6293
415.31
525
11.00
767
829
8,444
82.87
34%
52.9224.79
12.80
28.52
1,221.980.30
28.82
0.24
381.00111.90
2.7132.27
22.15
Nil
1.28
1.08
52.86
0.37
5.08
3.10
21.62
74.79
295.00
24,446
11.90
445.50
446.70100
437.73
485
740.65
773
8,510
6,672721
8,635
72.06
38%
87.1634.61
17.46
20.91
499.030.73
21.64
0.26
539.10129.83
3.3224.56
30.66
Nil
1.90
1.54
84.39
0.18
13.40
4.07
29.41
107.40
256.00
18,447
7.40
445.50
428.7896
405.67
472
235.84
665
6,364
3,345721
7,114
72.06
30%
45.9517.21
21.90
16.71
364.091.01
17.72
0.22
543.08108.72
5.3461.01
15.83
Nil
2.23
1.95
43.57
0.29
18.68
1.64
14.85
61.63
196.50
14,159
11.42
445.50
351.1279
361.20
481
328.15
724
9,757
4,379721
5,645
72.06
36%
46.22
19.13
17.08
21.38
475.90
0.77
22.14
0.32
748.09
88.34
5.69
52.26
21.66
Nil
2.06
1.61
57.69
0.19
49.27
1.91
26.85
60.67
175.60
12,653
9.18
445.50
430.6097
436.83
498
189.81
857
6,180
2,994
6,292 5,733 2,001 2,758 2,487 1,869 1,869
Operating Highlights
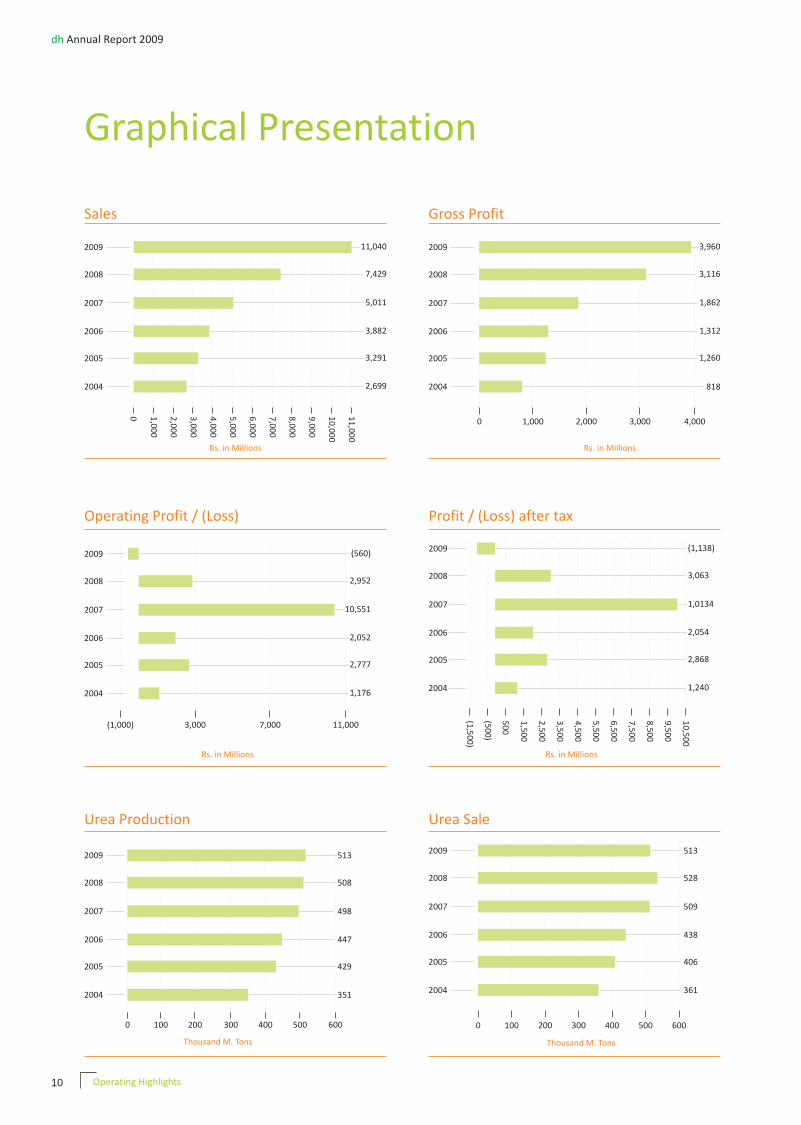
Graphical Presentation
10
dh Annual Report 2009
Rs. in Millions
Gross Profit
2004
2005
2006
2007
2008
2009
0
818
1,260
1,312
1,862
3,116
3,960
1,000 2,000 3,000 4,000
Operating Profit / (Loss)
(1,000) 3,000 7,000 11,000
2004
2005
2006
2007
2008
2009 (560)
2,952
10,551
2,052
2,777
1,176
Rs. in Millions
Profit / (Loss) after tax
2004
2005
2006
2007
2008
2009 (1,138)
3,063
1,0134
2,054
2,868
1,240
10
,50
0
9,5
00
8,5
00
7,5
00
6,5
00
5,5
00
4,5
00
3,5
00
2,5
00
1,5
00
50
0
(50
0)
(1,5
00
)
Rs. in Millions
11
,00
0
10
,00
0
9,0
00
8,0
00
7,0
00
6,0
00
5,0
00
4,0
00
3,0
00
2,0
00
1,0
00
0
Rs. in Millions
2004
2005
2006
2007
2008
2009 11,040
7,429
5,011
3,882
3,291
2,699
Sales
0 100 200 300 400 500 600
Urea Production
2004
2005
2006
2007
2008
2009 513
508
498
447
429
351
Thousand M. Tons
2004
2005
2006
2007
2008
2009
0 100 200 300 400 500 600
513
528
509
438
406
361
Urea Sale
Thousand M. Tons
Operating Highlights
Investments
ShortTermInvestment
LongTermInvestment
2,2333,399
19,206
21,543
0 1,0
00
2,0
00
3,0
00
4,0
00
5,0
00
6,0
00
7,0
00
8,0
00
9,0
00
10
,00
01
1,0
00
12
,00
01
3,0
00
14
,00
01
5,0
00
16
,00
01
7,0
00
18
,00
01
9,0
00
20
,00
02
1,0
00
22
,00
0
2009 2008
Break-up Value of Share (Rs.)
25
0
23
0
(10
)
10
30
50
70
90
11
0
13
0
15
0
17
0
19
0
21
0
2004
2005
2006
2007
2008
2009 181.177
158.91
227.95
111.90
129.83
108.72
11
dh Annual Report 2009
Total Assets Employed
2004
2005
2006
2007
2008
2009 29,607
25,630
29,223
16,163
12,787
12,300
30
,00
0
27
,00
0
21
,00
0
18
,00
0
15
,00
0
12
,00
0
9,0
00
6,0
00
3,0
00
0 24
,00
0
Rs. in Millions
Year End Market Value per Share (Rs)
2004
2005
2006
2007
2008
2009
0 50 100 150 200 250 300 350 400
179.81
220.30
393.80
295.00
256.00
196.50
2004
2005
2006
2007
2008
2009
0 5,000 10,000 15,000 20,000
Shareholder Equity
Rs. in Million
19,883
17,383
18,889
9,273
9,355
7,834
2004
2005
2006
2007
2008
2009
Capital Expenditure
Rs. in Millions
0
833
163
149
741
236
328
10
0
20
0
30
0
40
0
50
0
60
0
70
0
80
0
90
0
Operating Highlights
dh Annual Report 2009
12
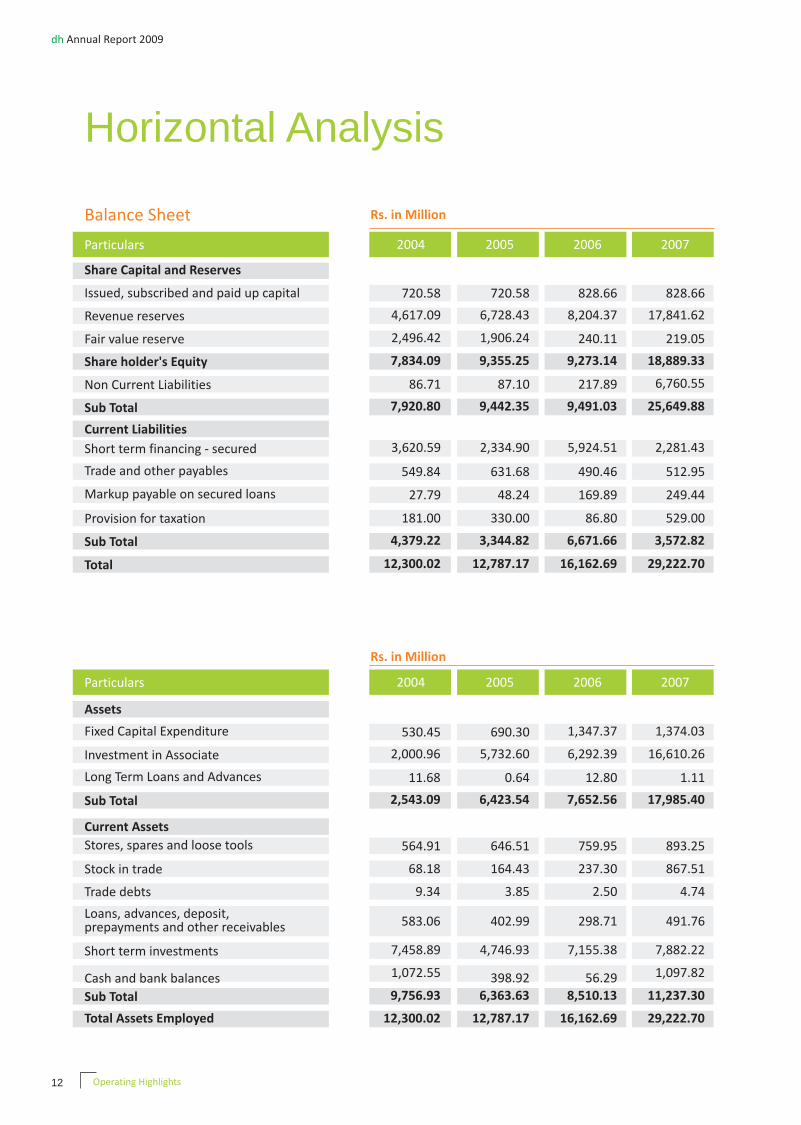
Horizontal Analysis
Share holder's Equity
Balance Sheet
Particulars
Share Capital and Reserves
Issued, subscribed and paid up capital
Revenue reserves
Fair value reserve
Non Current Liabilities
Sub Total
Current Liabilities
Short term financing - secured
Trade and other payables
Markup payable on secured loans
Provision for taxation
Sub Total
Total
Particulars
Assets
Fixed Capital Expenditure
Investment in Associate
Long Term Loans and Advances
Sub Total
Current Assets
Stores, spares and loose tools
Stock in trade
Trade debts
Loans, advances, deposit,prepayments and other receivables
Short term investments
Cash and bank balances
Sub Total
Total Assets Employed
Rs. in Million
2004 2005 2006 2007
720.58 720.58 828.66 828.66
4,617.09 6,728.43 8,204.37 17,841.62
2,496.42 1,906.24 240.11 219.05
7,834.09 9,355.25 9,273.14 18,889.33
86.71 87.10 217.89 6,760.55
7,920.80 9,442.35 9,491.03 25,649.88
3,620.59 2,334.90 5,924.51 2,281.43
549.84 631.68 490.46 512.95
27.79 48.24 169.89 249.44
181.00 330.00 86.80 529.00
4,379.22 3,344.82 6,671.66 3,572.82
12,300.02 12,787.17 16,162.69 29,222.70
Rs. in Million
2004 2005 2006 2007
530.45 690.30 1,347.37 1,374.03
2,000.96 5,732.60 6,292.39 16,610.26
11.68 0.64 12.80 1.11
2,543.09 6,423.54 7,652.56 17,985.40
564.91 646.51 759.95 893.25
68.18 164.43 237.30 867.51
9.34 3.85 2.50 4.74
583.06
402.99
298.71 491.76
7,458.89 4,746.93 7,155.38 7,882.22
1,072.55 398.92
56.29 1,097.82
9,756.93 6,363.63 8,510.13 11,237.30
12,300.02 12,787.17 16,162.69 29,222.70
Operating Highlights
dh Annual Report 2009
13
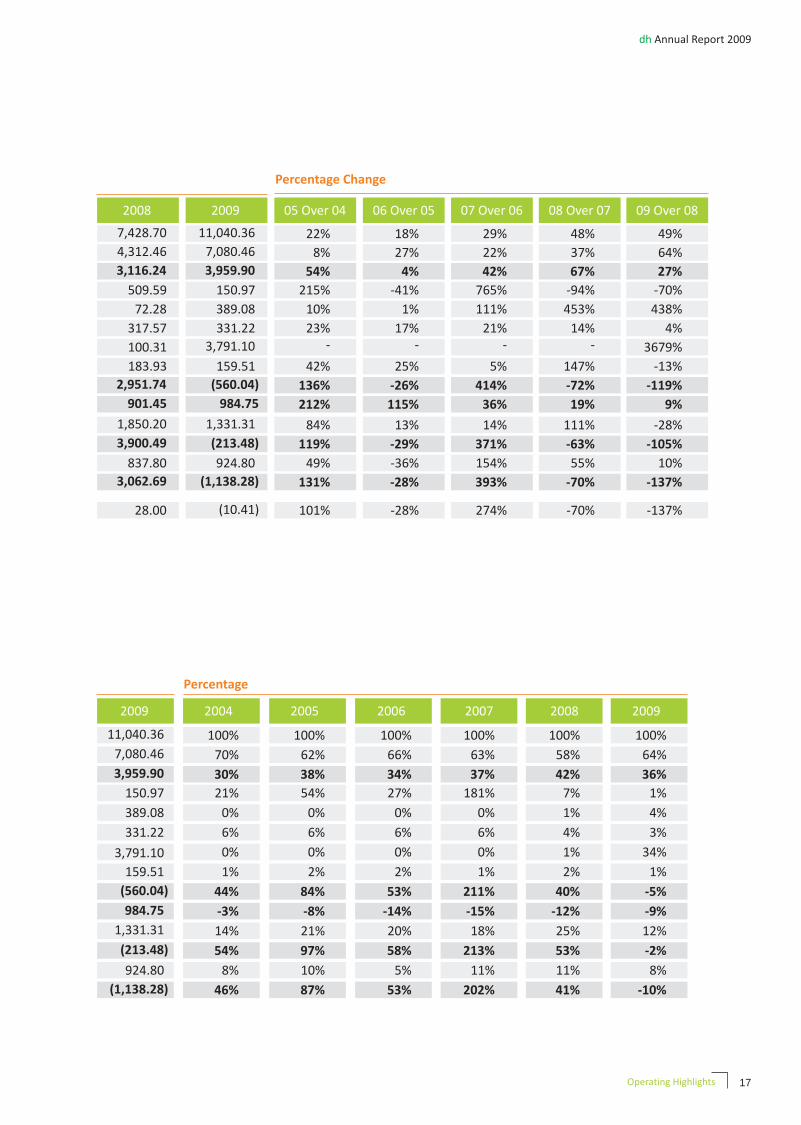
Percentage Change
2008 2009 05 Over 04 06 Over 05 07 Over 06 08 Over 07 09 Over 08
1,093.83 1,093.83 0% 15% 0% 32% 0%
20,415.40 18,784.89 46% 22% 117% 14% -8%
(4,126.57) 3.99 -24% -87% -9% -1984% -100%
17,382.66 19,882.71 19% -1% 104% -8% 14%
6,670.36 6,741.59 0% 150% 3003% -1% 1%
24,053.02 26,624.30 19% 1% 170% -6% 11%
70.14 1,196.60 -36% 154% -61% -97% 1606%
538.13 648.24 15% -22% 5% 5% 20%
275.85 280.27 74% 252% 47% 11% 2%
693.00 858.00 82% -74% 509% 31% 24%
1,577.12 2,983.11 -24% 99% -46% -56% 89%
25,630.14 29,607.41 4% 26% 81% -12% 16%
Percentage Change
2008 2009 05 Over 04 06 Over 05 07 Over 06 08 Over 07 09 Over 08
Legal AdvisorsBankersBank Al-Habib Ltd.Habib Bank Ltd.Habib Metropolitan Bank Ltd.MCB Bank Ltd.Allied Bank Ltd.United Bank Ltd.Meezan Bank Ltd.Emirates Global Islamic Bank Ltd.
were available in the distribution system worldwide.
During the year buyers used those stocks while
limiting the purchase of additional products
consequently by the end of 2009. Global consumption
exceeded over all sale and left the supply pipelines
rather empty.
In the nitrogen sector, Ammonia production was
rather stable while Urea output expanded
moderately, due to its rising store in global nitrogen
fertilizer mix. Phosphate Acid production declined
moderately in 2009 while that of Phosphate Rock
dropped.
The Urea Industry operated at close to 95 percent of
its effective capacity, on the basis of firm fertilizer
demand and also from a combination of supply-driven
factor, such as delays in the commissioning of new
capacity and a much higher numbers of idled plants in
2009, due to shortfalls in some domestic supply of
natural gas.
In November, 2009, the IFA Agriculture Committee
projected global fertilizer demand in calendar year
2009 at 156.3 million tons nutrients showing a slight
decline from the previous year on a nutrient basis,
nitrogen and phosphate fertilizer consumption was
relatively stagnant, while Potassium Fertilizer use
dropped for the second consecutive year, by almost
9 percent over 2008.
Global fertilizer demand in 2010 would recover to
164.1 million tons nutrients. This would equate to an
overall 5 percent growth over 2009.
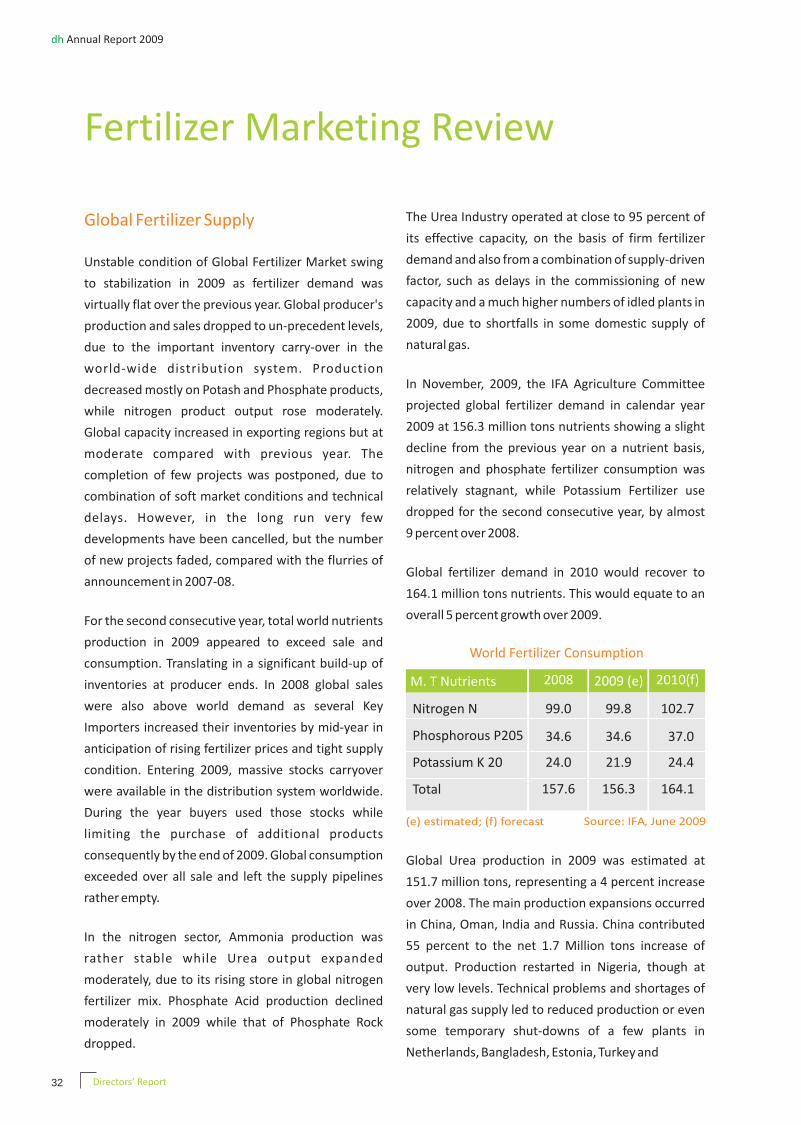
World Fertilizer Consumption
2009 (e) 2010(f)M. T Nutrients
Nitrogen N
Phosphorous P205
Potassium K 20
Total
2008
99.0
34.6
99.8
34.6
24.0 21.9
157.6 156.3
102.7
37.0
24.4
164.1
(e) estimated; (f) forecast Source: IFA, June 2009
Global Urea production in 2009 was estimated at
151.7 million tons, representing a 4 percent increase
over 2008. The main production expansions occurred
in China, Oman, India and Russia. China contributed
55 percent to the net 1.7 Million tons increase of
output. Production restarted in Nigeria, though at
very low levels. Technical problems and shortages of
natural gas supply led to reduced production or even
some temporary shut-downs of a few plants in
Netherlands, Bangladesh, Estonia, Turkey and
32 Directors’ Report
dh Annual Report 2009
Ukraine. One plant closed permanently in Portugal in
2009, a total of 15 plants world-wide were idled,
representing 5.4 million tons of Urea capacity.
The global demand of urea is estimated at 148 million
tons in 2009, up 1.2 percent over 2008, and at 156.4
million tons in 2010, representing an increase of 5.7
percent over 2009.
The global supply /demand balances shows a
potential surplus of 10.5 million tons in 2009
compared with 5.4 million tons in 2008 and slightly
reduced balance in 2010 at 8.9 million tons. Such
surpluses are possible, but production level may vary
in accordance with world demand and inventory
changes.
IFA estimated world urea trade in 2009 at 34 million
tons representing 2.9% increase over 2008. Imports
declined in virtually all countries, but a few showed
distinct growth patterns in 2009, these included
Bangladesh, Pakistan and Thailand. Firm import
demand also prevailed in Viet Nam and Mexico. India
Global Urea Production and Trade
World Urea Supply / Demand
(1)
(2)
(1) (2)
and United States were the main importing countries,
accounting for 65% of global trade.
Keeping in view the above facts and figures there will
be no major downward change in price in the global
Urea market. We do not expect any price
deterioration in the local Urea market also. The world
average price of urea remained around USD 300 per
metric ton throughout the year. The DAP price
remained between 370 to 430 USD per metric tons
during this period.
The world phosphate market was stagnant in 2009,
following a drastic 10 percent plunge in demand in
2008. Indeed world phosphate fertilizer consumption
was static in 2009 while sale in the Industrial Sector
became further depressed.
Only three countries registered a significant positive
growth, namely China, India and Pakistan. Almost all
the other countries showed reduced consumption.
Imports demand grew only in India and Pakistan.
Pakistan’s Fertilizer Industry comprises of 9 Urea and
one DAP plant, having total production capacity of
4,922 thousand metric tons per annum. Recently few
Pakistan Fertilizer Scenario
33
Production Trade
160140120100806040200
2005
2006
2007
2008
2009e
Million Tons of Urea
Demand Production
2009
2008
2010
170165160155150145140135
Million Tons of Urea
Directors’ Report
dh Annual Report 2009
plants of Single Super Phosphate (SSP) fertilizer have
commenced their production.
Although all urea plants are running over their
designed capacities still there is shortage of urea in
the Country. To fill this gap between supply and
demand, Government had to resort to imports for
making available this important agricultural input.
Fertilizer Sector is the one of the major consumer of
gas in the Country. Three companies namely
Sui Northern Gas Pipelines Limited, Sui Southern Gas
Company Limited and Mari Gas Company Limited are
providing gas to Fertilizer Sector.
Fertilizer consumption in Pakistan is closely linked to
the economic growth of the country. This fact is
proved by the positive correlation between the
fertilizer consumption per hectare and nominal GDP.
The government has increased the support prices of
wheat, and the prices of other cereals have also gone
up. Therefore consumption of fertilizer in year 2009
was very high and expected to increase in near future.
In year 2008-09 the availability of urea in the country
Urea / DAP Local Market Scenario
was 5.8 million tons. Production of urea remained
4.9 million tons and balance quantity was imported
from different countries. Total consumption of urea
during the year was 5.75 million tons.
During 2009-10 production of urea is estimated to be
5.2 million tons.
In view of new forthcoming plants, the gap between
supply and demand is likely to narrow down.
During Kharif 2009 DAP consumption increased by
382% over last year’s kharif. In calendar year 2009 this
increase was 126% over last calendar year with sale of
1.7 million tons .The reasons for such a tremendous
increase in DAP consumption was directly related to
the increase in wheat support price by the
Government. Another factor that influenced such a
tremendous increase in DAP sales was very
acceptable international DAP price. A major
percentage of DAP in Pakistan is imported and only
0.675 million tons is expected to be produced
indigenously. Hence domestic sale price index for DAP
is highly dictated by the international market price. In
the forecast no DAP plant has been planned for
production in Pakistan and our supply chain shall
remain dependent on the international DAP
procurement. By year 2013 phosphate demand is
34
The 3 staple grainsthree grains dominate world cereal production,
and play a particularly crucial role in feeding people.
Human beings, on average, get 48% of the calories
from grain. Of these, wheat is the dominant grain as
it feeds one third of the world population. It is also a
staple cereal in the Pakistani diet. 36% of the total
cropped areas is used to grow wheat.
Therefore, Pakistan faces considerable pressure to
feed 167 million Pakistanis, making the role of fertilizers
vital in food production.
1. Maize 2. Wheat and 3. Rice
Directors’ Report
dh Annual Report 2009
35
anticipated to reach 2.0 million tons. Import of
phosphates are handled only by the Private Sector;
the number of players has increased in recent years
and the share of imports attributable to various
companies changes frequently from year to year.
Credit requirements of the farming sector have been
increasing over the year mainly due to the rise in the
use of Seed, Fertilizer, Pesticides as well as for
purchase of agricultural machinery, etc. In order to
cope with the increasing demand for agriculture
credit, institutional credit to farmer is being provided
thorough Zarai Tarqiate Bank Limited, (ZTBL),
Commercial Banks, Punjab Provincial Cooperative
Bank Limited (PPCBL) and domestic private banks. The
government has allocated Rs. 250 billion for
agriculture credit disbursement for the year 2008-09
which is 25% higher than the allocation of the
preceding year i.e. Rs.200 billions .Out of the total
credit target of Rs.250 billions Rs.119.5 billions were
allocated to commercial banks, Rs.72 billions to ZTBL,
Rs.6 billions to PPCBP and 52.5 billion to domestic
private commercial banks.
Agriculture Credit
Distribution Network
In the year 2008-09 indigenous production of urea
was far less than demand. The gap between
production and demand was met through huge
imports of urea by the federal government. High price
of fuel has compelled your company to restrain its
sales to the adjoining districts of our plant. This
measure besides giving us financial benefits has made
our dispatches time efficient.
An agricultural adage says the tiny animals that live
below the surface of a healthy pasture weigh more
than the cows grazing above it. In a catalogue selling
composting equipment I read that two handfuls of
healthy soil contain more living organisms than there
are people on the earth. What these beings are and
what they can be doing is difficult to even begin to
comprehend, but it helps to realize that even
though they are many, they work as one.
Carol Williams, Bringing a Garden to Life, 1998
Directors’ Report
4 R Policy
dh has devised a 4 R Policyto educate the farmers.
dh: The Farmer’s Friend
Right Product
Right Rate
Right Time
Right PlacePlacing
Employing the right kind of fertilizer is critical to
harnessing the maximum yield.
Applying the right amount of fertilizer is essential
to avoid fertilizer burn.
Using fertilizers at the right time is fundamental for
ensuring maximum output.
nutrients appropriately for each farm situation
reduces losses to the environment and maximises
crop uptake.
Why Fertilizer?
World Population
195020092050 (f)
2.5 Billion
6.9 Billion
9.2 Billion
Fertilizer is a major input in agricultural
production
Fertilizer application yields higher crop
and returns
Food insecurity affects close to one
billion people
Food production lies at the heart of
dh business
Food production per capita has
declined since 1980s
Source: UN
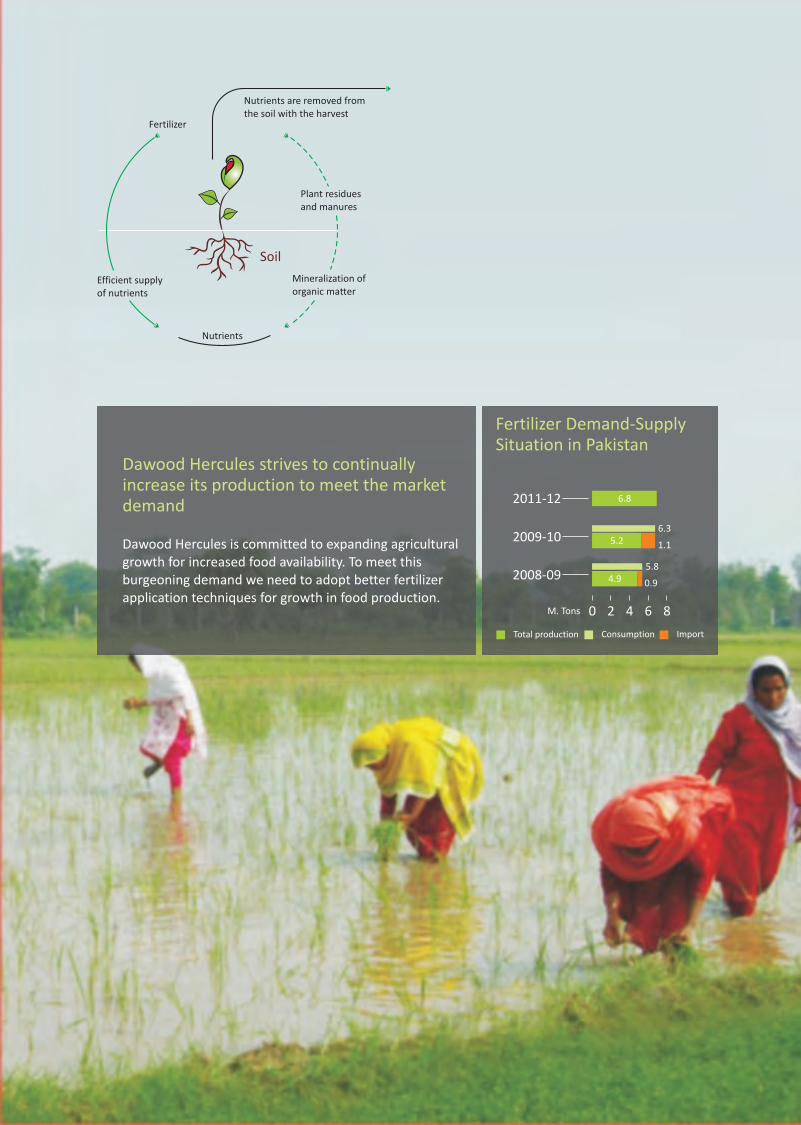
Nutrients are removed fromthe soil with the harvest
Fertilizer
Soil
Efficient supplyof nutrients
Nutrients
Mineralization oforganic matter
Plant residuesand manures
Dawood Hercules is committed to expanding agriculturalgrowth for increased food availability. To meet thisburgeoning demand we need to adopt better fertilizerapplication techniques for growth in food production.
Dawood Hercules strives to continuallyincrease its production to meet the marketdemand
Fertilizer Demand-SupplySituation in Pakistan
Total production Consumption Import
0 2 4 6 8
2008-090.94.95.8
M. Tons
2009-101.15.26.3
2011-12 6.8
dh Annual Report 2009
Performance Review
The Board of Directors is delighted to present its
review for the year 2009.
Country wide off take of urea for the year 2009 was
6.463 Million tons as against 5.494 Million tons
depicting an improvement of 18% over the last year.
Domestic production of 5.042 Million tons of urea
depicts an improvement of 1% over the last year.
Import of 1.532 Million tons of urea by the
Government as against 0.434 Million tons last year has
helped in reducing the gap between demand and local
production. Inventory of urea in the country as of
31st December 2009 was approximately 0.178 Million
tons as against 0.061 Million tons a year before.
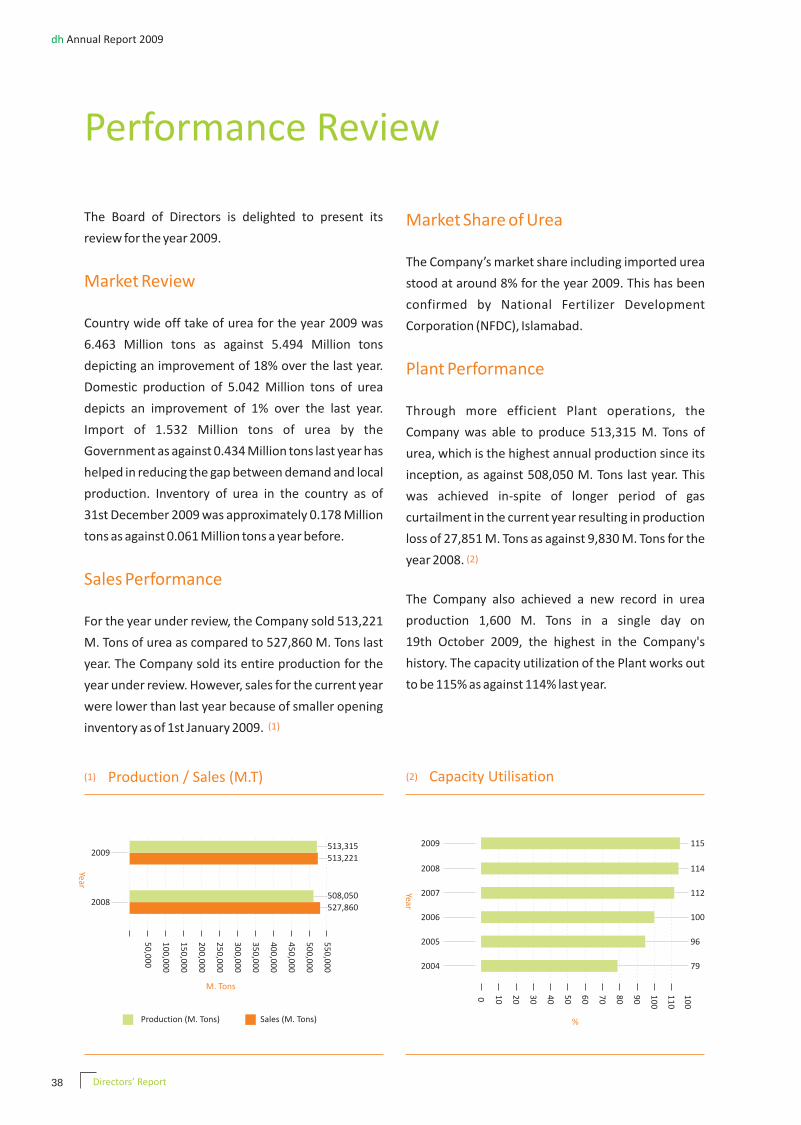
For the year under review, the Company sold 513,221
M. Tons of urea as compared to 527,860 M. Tons last
year. The Company sold its entire production for the
year under review. However, sales for the current year
were lower than last year because of smaller opening
inventory as of 1st January 2009.
Market Review
Sales Performance
Market Share of Urea
Plant Performance
The Company’s market share including imported urea
stood at around 8% for the year 2009. This has been
confirmed by National Fertilizer Development
Corporation (NFDC), Islamabad.
Through more efficient Plant operations, the
Company was able to produce 513,315 M. Tons of
urea, which is the highest annual production since its
inception, as against 508,050 M. Tons last year. This
was achieved in-spite of longer period of gas
curtailment in the current year resulting in production
loss of 27,851 M. Tons as against 9,830 M. Tons for the
year 2008.
The Company also achieved a new record in urea
production 1,600 M. Tons in a single day on
19th October 2009, the highest in the Company's
history. The capacity utilization of the Plant works out
to be 115% as against 114% last year.
(1)
(2)
(1) Production / Sales (M.T)
2008
2009
50
,00
0
M. Tons
10
0,0
00
15
0,0
00
20
0,0
00
25
0,0
00
30
0,0
00
35
0,0
00
40
0,0
00
45
0,0
00
50
0,0
00
55
0,0
00
527,860
508,050
513,221
513,315
Year
Production (M. Tons) Sales (M. Tons)
38
(2) Capacity Utilisation
%
2005
2006
2007
2008
2009
0 10
20
30
40
50
60
70
80
90
10
0
11
0
Year
96
100
112
114
10
0
2004 79
115
Directors’ Report
dh Annual Report 2009
Financial Performance
The Company recorded sales of Rs. 11,040 Million as
compared to Rs. 7,429 Million for the year 2008,
depicting an increase of 49% in sales value over last
year, which is the highest in the history of the
Company. Gross Profit for the year under review stood
at Rs. 3,960 Million as against the gross profit of
Rs. 3,116 Million for the year 2008.
The Company suffered a loss of Rs. 1,138 Million for
the year 2009 as against a net profit of Rs. 3,063
Million against last year. The main reasons for the loss
are recognition of impairment loss of Rs. 3,791 Million
pursuant to SRO 150(1) 2009 dated
13th February 2009 issued by the Securities &
Exchange Commission of Pakistan and decline in share
of profit from associate by Rs. 519 Million during the
year.
Securities and Exchange Commission of Pakistan
(SECP) granted relaxation in the accounting treatment
for equity securities held by companies under the
head 'Available for Sale' as required under the
International Accounting Standard 'Financial
Instrument' Recognition and Measurement (IAS-39)
vide SRO 150(I)/2009 dated 13th February 2009 due
Impairment Loss
(3)
2009 2008
Sales
Cost ofSales
Gros Profit
DistributionExpenses
Administrative Expenses
OperatingProfit / (Loss)
11
,00
0
10
,00
0
9,0
00
8,0
00
7,0
00
6,0
00
5,0
00
4,0
00
3,0
00
2,0
00
1,0
00
-(1,0
00
)
(2,0
00
)
11,040
7,429
7,080
4,312
3,960
3,116
389
72
332
318
(560)
2,952
Rupees in Millions
Financial Results(3) (4) Earnings Per Share (Rs.)
10(10) 30 50 70 90 110
17.21
34.61
24.79
92.65
28.00
(10.41)
2004
2005
2006
2007
2008
2009
39
The summary of the operating results of the Company for the year 2009 along with comparatives for the
year 2008 are as under:
1
2
3
4
5
6
7
Sr. No. Particulars
Sales
Gross Profit
Impairment Loss
Results from operating activities
Share of Profit from Associate, net of income tax
(Loss) / Profit for the year from continuing operations
Earnings per share (Rupees)
2009 2008
11,040
3,960
(3,791)
(560)
1,331
(1,138)
7,429
3,116
(100)
2,952
1,850
3,063
Rupees in Million
(10.41) 28.00
Directors’ Report
dh Annual Report 2009
Your Company follows a pro-active approach of
managing its cash and liquidity. Excess cash is invested
and funds are borrowed on short term and long term
basis as and when the situation warrants. At present,
the Company sees no immediate pressure on its short
term and long term financing needs. There are
adequate back up arrangements with the banks to
meet any contingency in liquidity.
Earnings per share for the year 2009, including the
share of profit from associate, stood at Rs. (10.41) as
compared to Rs. 28.00 per share for the year 2008.
The main reasons for the loss are the impairment loss
on short term investments and decline in the share of
profit from associate.
At the close of the year, the market capitalization was
Rs. 19,668 Million, with a market value of Rs. 179.81
per share and break-up value of Rs. 181.77 per share.
Earnings Per Share
Market Capitalization
to prevalent market conditions, closure of stock
markets for four months and very low trading volumes
on stock markets, which has made the application of
impairment test (i.e. arriving at fair value) difficult as
the current economic conditions in the country were
'rare circumstances' and the plunge in the equity
markets cannot be considered to be a fair reflection of
the equity values, in the light of representations from
various stakeholders.
In accordance with said notification, an impairment
loss of Rs. 335 Million has been reversed during the
year due to improvement in market price of equity
shares of the SNGPL and impairment loss of Rs. 3,791
million has been charged to Profit and Loss Account
for the year ended 31st December 2009 based on
market price prevailing at Balance Sheet date. Had
impairment loss not been charged, the loss after tax of
Rs. 1,138 Million could have been a profit after tax of
Rs. 2,653 Million.
The following is the abridged statement of funds
generated and applied during the year as compared to
The highest value of the share during the year reached
Rs. 215.26 on 8th October 2009 and the lowest price
of Rs. 98.75 was hit on 27th January 2009.
The net worth of the Company stood at Rs. 19,883
Million as against Rs. 17,383 Million last year depicting
an increase of 2,500 Million over the last year.
During the year, the KSE 100 Index increased by 60%
whereas the stock of your Company decreased by
18%.
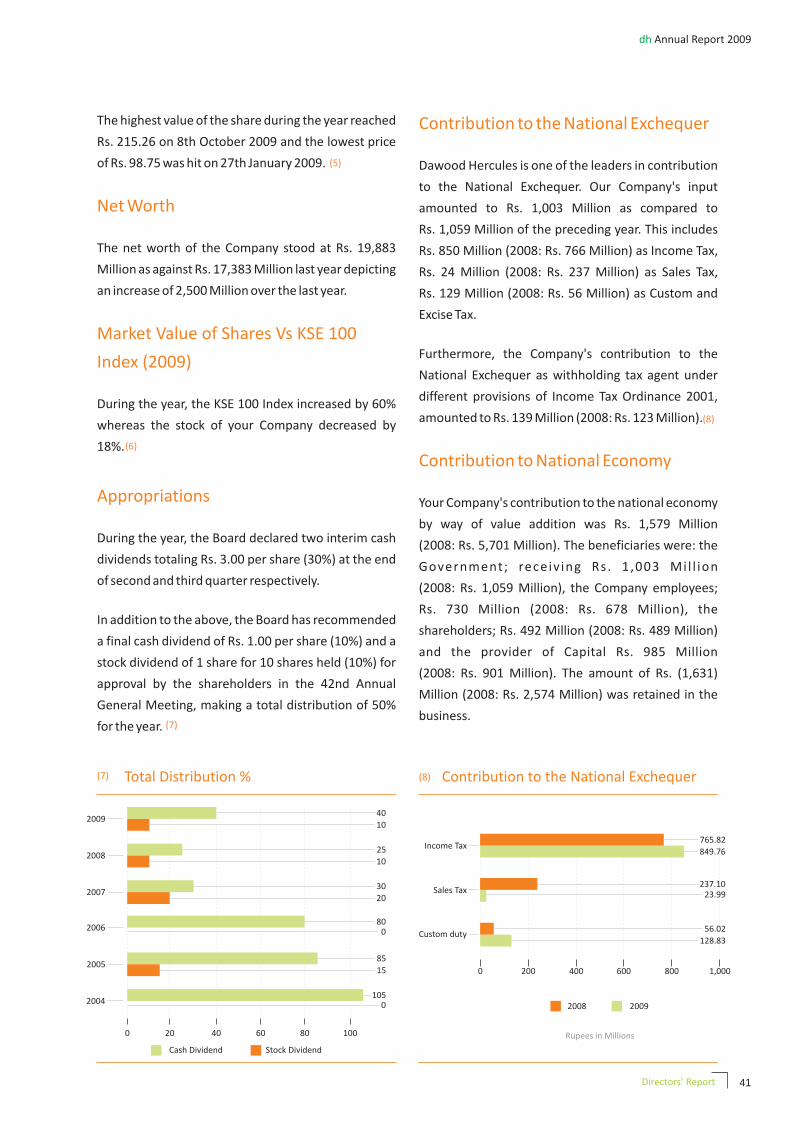
During the year, the Board declared two interim cash
dividends totaling Rs. 3.00 per share (30%) at the end
of second and third quarter respectively.
In addition to the above, the Board has recommended
a final cash dividend of Rs. 1.00 per share (10%) and a
stock dividend of 1 share for 10 shares held (10%) for
approval by the shareholders in the 42nd Annual
General Meeting, making a total distribution of 50%
for the year.
Net Worth
Market Value of Shares Vs KSE 100
Index (2009)
Appropriations
(5)
Contribution to the National Exchequer
Contribution to National Economy
Dawood Hercules is one of the leaders in contribution
to the National Exchequer. Our Company's input
amounted to Rs. 1,003 Million as compared to
Rs. 1,059 Million of the preceding year. This includes
Rs. 850 Million (2008: Rs. 766 Million) as Income Tax,
Rs. 24 Million (2008: Rs. 237 Million) as Sales Tax,
Rs. 129 Million (2008: Rs. 56 Million) as Custom and
Excise Tax.
Furthermore, the Company's contribution to the
National Exchequer as withholding tax agent under
different provisions of Income Tax Ordinance 2001,
amounted to Rs. 139 Million (2008: Rs. 123 Million).
Your Company's contribution to the national economy
by way of value addition was Rs. 1,579 Million
(2008: Rs. 5,701 Million). The beneficiaries were: the
Government; receiv ing Rs. 1 ,003 Mi l l ion
(2008: Rs. 1,059 Million), the Company employees;
Rs. 730 Million (2008: Rs. 678 Million), the
shareholders; Rs. 492 Million (2008: Rs. 489 Million)
and the provider of Capital Rs. 985 Million
(2008: Rs. 901 Million). The amount of Rs. (1,631)
Million (2008: Rs. 2,574 Million) was retained in the
business.
(6)
(7)
(8)
41
(7) Total Distribution %
2009
2008
2007
2006
2005
2004
0 20 40 60 80 100
0105
15
85
080
20
30
10
25
10
40
Cash Dividend Stock Dividend
(8) Contribution to the National Exchequer
20092008
Custom duty
Sales Tax
Income Tax
0 200 400 600 800 1,000
128.83
56.02
23.99237.10
849.76
765.82
Rupees in Millions
Directors’ Report
In 1972, Plant production ratio was
(7.88%)which was less than the designed capacity,with some major changes in 2006, Plantproduction ratio exceeds the designedcapacity. In 2009, the production ratio is
15.2%highest in dh history
dh Annual Report 2009
44 Directors’ Report
The design capacity of dh Plant was 345,000 M. Tons when it
was commissioned in 1971. In the year 1972, we produced
317,826 M. Tons which was less than the design due to
problem in Syn. gas compressor and waste heat boiler (101-C).
Capacity was increased to 445,500 M. Tons after
implementation of BMR in 1991. In the year 2006, primary
reformer Harp Assembly and WHB (1101-C) were replaced. In
the year 2008, we crossed 500,000 M. Tons dh had the ever
highest production in the year 2009, when we produced
513,315 M. Tons. This was higher than the design capacity.
600
500
400
300
200
100
01972
Tho
usa
nd
M. T
on
s
2009
Design Capacity Production Ratio
dh Annual Report 2009
45Directors’ Report
Corporate Affairs
Corporate Governance
Board Meetings
We promote the principles of corporate governance
by being honest, trustworthy, open and committed to
the company. Your Company is committed to high
standards of corporate governance. The Company
remains committed to conduct its business in line with
the listing regulations of the Stock Exchanges. We
respect the rights of shareholders and help them to
exercise those rights by effectively communicating the
information that is understandable and accessible and
also encourage them to participate in the general
meetings.
We have the fiduciary responsibility, which requires us
to act in good faith and trust for the benefit of the
Company. We are loyal and the company's interest
always takes precedence over personal interests of
individual Board members. We recognize that we
have legal and other obligations to all legitimate
stakeholders. Apart from internal stakeholders like
shareholders, directors, management and
employees, there are several external stakeholders
including Government, Regulatory Authorities,
Customers, Creditors and Public-at-large.
As a good corporate citizen, we recognize that we have
a responsibility to respect the individuals, the
community and the environment in a way that when
devising or implementing any rightful business
strategy, it will abide by laws and regulations by
maintaining a high standard of business ethics,
working as part of the community, protecting the
environment and by engaging in fair trade and
business practices, as well as fair workplace relations.
Four meetings of the Board were held during the year
2009, which were all presided over by the Chairman.
Name of the Director
4
2
1
3
1
4
4
4
2
3
Mr. Hussain Dawood
Mr. Isar Ahmad
Khawaja Amanullah
Mr. S.M. Asghar
Mr. Aleem A. Dani
Mr. A. Samad Dawood
Mr. Shahzada Dawood
Mr. Abdul Ghafoor Gohar
Mr. Haroon Mahenti
Mr. Shahid Hamid Pracha
Meetings Attended
As required under listing regulation 35(xxiv) of the
Karachi Stock Exchange, the financial statements, duly
endorsed under the respective signatures of Chief
Executive and Chief Financial Officer were presented
for consideration and approval of the Board.
The half-yearly and annual financial statements were
initialed by the external auditors before presentation
to the Audit Committee and the Board for approval.
The agenda along with details were circulated to all
the Board members seven days before the meeting.
The minutes of the Audit and Board meetings were
circulated within 14 days of the holding of meeting
and were accordingly signed by the respective
Chairman.
The Company Secretary and Chief Financial Officer
also attended the meetings as required by the Code of
Corporate Governance.
It was ensured that the quorum should be present for
all the Board meetings in accordance with the
Memorandum and Articles of Association of the
Company.
Attendance of each Director was as under:
Best CorporateReport Award 2008
For the 4th consecutive year
Mr. Aftab Ahmed Qaiser, theCompany Secretary receivingthe award.
Investment in Engro Corporation
Limited (Engro) Shares
Listing of Shares at Islamabad Stock
Exchange (Guarantee) Limited
We treat Investment in Engro as strategic with the goal
of generating safe and steady returns for the
shareholders.
The Board of Engro in its meeting held on
21st January 2009 decided to issue 40% Right Shares
at a price of Rs. 50/- per share. By virtue of its holding
in Engro, DHCL became entitled to 32,462,963
ordinary shares of Engro to be issued as Right Shares.
The Directors of DHCL recommended subscription of
these shares not only because it was required to
maintain the Company's holding percentage but also
because the price of Rs. 50/- per share was much
below its real worth.
At the 41st Annual General Meeting (AGM) of the
Company held on 16th April 2009, the shareholders
gave their approval under section 208 of the
Companies Ordinance, 1984 for this investment.
Accordingly, your Company had subscribed to the full
entitlement of 32,462,963 Ordinary Shares of Engro at
a cost of Rs. 1,623 Million.
The Islamabad Stock Exchange (Guarantee) Limited,
being the youngest Stock Exchange of the Country, is
known for high standards of transparency in its
operations, excellent risk management and dynamic
market technology.
The shares of the Company were listed at Islamabad
Stock Exchange in April 2009 and trading was started
with effect from 23rd April 2009.
To facilitate the shareholders in the best possible way,
the final cash dividend for the year 2008, approved by
the shareholders of the Company in the Annual
General Meeting (AGM) held on 16th April 2009 was
delivered to the shareholders attending the AGM on
the same day. The dividend warrants of the remaining
shareholders were also dispatched on the date of
AGM.
Both the interim cash dividends for the year 2009
were also dispatched to the shareholders within 10
days instead of the statutory period of 30 days.
As per requirements of Central Depository Company
of Pakistan Limited (CDC), an audit was conducted by
M/s. KPMG Taseer Hadi & Co., the external auditors of
the Company, relating to CDS transactions, and we
feel pleased to inform our shareholders, that: No Non-
Compliance Issues were reported by the Auditors.
The annual financial statements of the Company since
the year 2003 along with all relevant quarterly
financial statements can be accessed at the website of
the Company i.e. www.dawoodhercules.com. The
information regarding Board of Directors,
M a n a g e m e n t , C S R a c t i v i t i e s a n d o t h e r
Announcements is also available at the website.
The Annual Report 2008 of the Company has won the
Shareholder Value
Best Corporate Report Award 2008
dh Annual Report 2009
46
been consistently applied in the preparation of the
financial statements and accounting estimates are
based on reasonable and prudent judgment.
The system of internal control is sound in design and
has been effectively implemented and monitored.
There are no significant doubts upon the Company's
ability to continue as a going concern.
The annual report including the annual audited
financial statements are circulated well before the
prescribed time. There has been no departure from
the best practices of Code of Corporate Governance,
as detailed in the listing regulations of the Stock
Exchanges.
The Company's Statement of Compliance with the
Code of Corporate Governance as set out in the listing
regulations of the Karachi, Lahore and Islamabad
Stock Exchanges, and the review report of the
auditors to the members on the statement of
compliance with the best practices of code of
corporate governance is annexed to this report.
The Board has adopted the Statement of Ethics and
Business Practices. All employees have been informed
and are required to observe the Rules of Conduct in
relation to business and its regulations.
The Company Secretary furnished a Secretarial
Compliance Certificate, in the prescribed form, as
required under listing regulation 37 (xxv) of Karachi
Stock Exchange, as part of the annual return filed with
the Registrar of Companies to certify that the
secretarial and corporate requirements of the
Compliance with the Code of Corporate
Governance
Statement of Ethics and Business
Practices:
Compliance with Secretarial Practices
4th position in the Chemical & Fertilizer category,
assessed by the joint committee of the Institute of
Chartered Accountants of Pakistan and the Institute of
Cost and Management Accountants of Pakistan.
The Company has been awarded the National
Environment Excellence Award 2009 by the National
Forum for Environment & Health (NFEH).
To comply with the requirements of Companies (Audit
of Cost Accounts), Rules, 1998, the Board of Directors
of your Company has approved the appointment of
M/s. Anjum Asim Shahid Rahman, Chartered
Accountants, as Cost Auditors of the Company for the
year ended 31st December 2009.
In order to comply with the requirements of listing
regulations, the Company presented all related party
transactions before the Audit Committee and Board
for their review and approval. These transactions are
approved by the Audit Committee and Board of
Directors in their respective meetings.
The Financial Statements together with the notes
thereto have been drawn up by the management in
conformity with the Companies Ordinance, 1984.
International Accounting and Reporting Standards, as
applicable and notified by the SECP, have been
followed in the preparation of the financial
statements. These statements present the Company's
state of affairs, the results of its operations, cash flow
and changes in equity.
Proper books of accounts have been maintained by
the Company. Appropriate accounting policies have
National Environment Excellence
Award 2009
Appointment of Cost Auditors
Related Party Transactions
Corporate and Financial Reporting
Directors’ Report
dh Annual Report 2009
47
Auditors
Notice Received from Competition
Commission of Pakistan (CCP)
Date of Authorization of Financial
Statements
M/s. KPMG Taseer Hadi & Co., Chartered Accountants,
the retiring auditors of the Company, offer themselves
for re-appointment. The Board Audit Committee and
the Board of Directors recommend their
re-appointment by the shareholders at the 42nd
Annual General Meeting, as auditors of the Company
violation charges as well as the very status of it being a
dominant position holder. It is hope that the
information and explanations provided by the
Company will satisfy the Commission.
These financial statements were authorized for issue
on 23rd January 2010 by the Board of Directors of the
Company.
Companies Ordinance, 1984, and listing regulations
have been duly complied with.
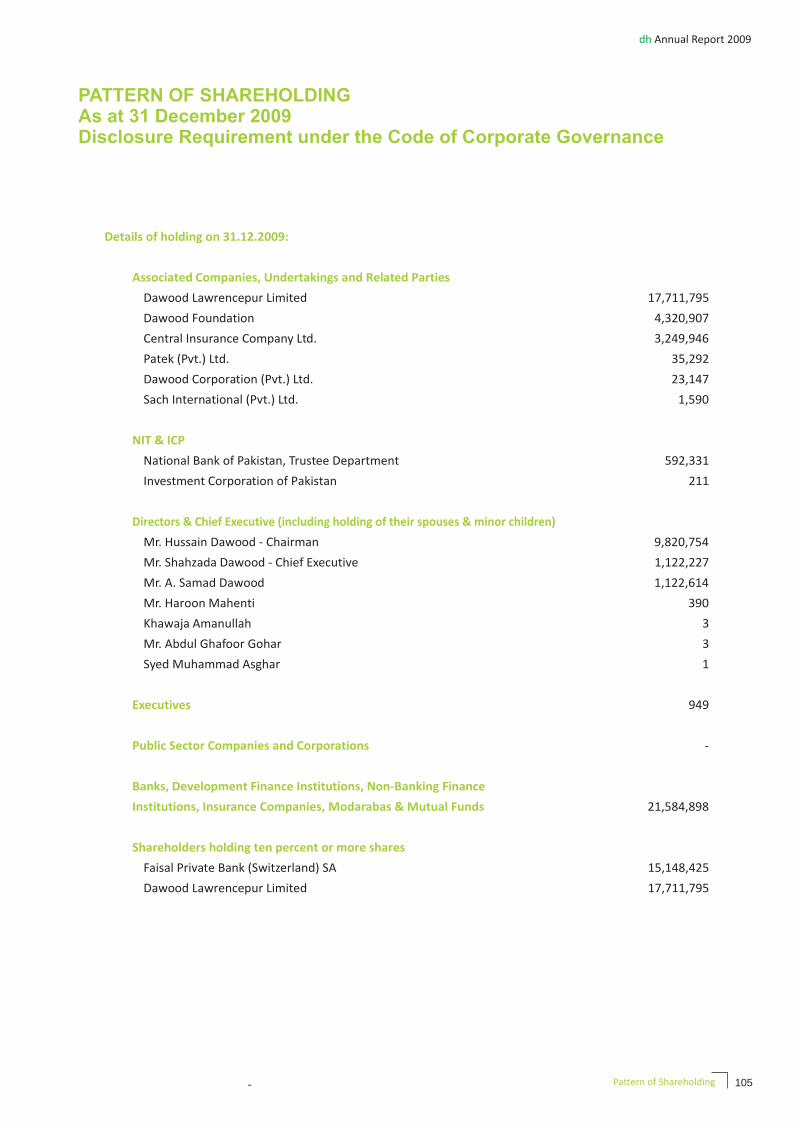
As at 31st December 2009, there were 2,763
shareholders on the record of the Company.
The Pattern of Shareholding of the Company as at
31st December 2009, along with the necessary
information is available at the end to this report along
with the proxy form.
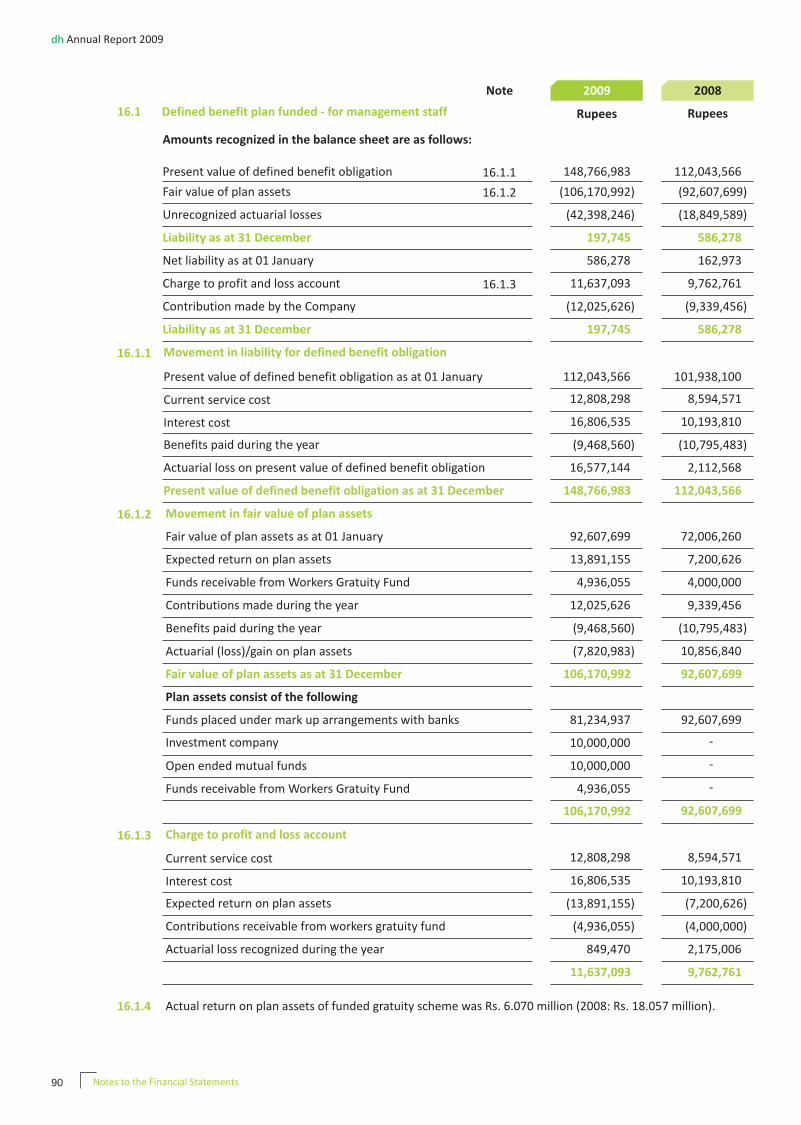
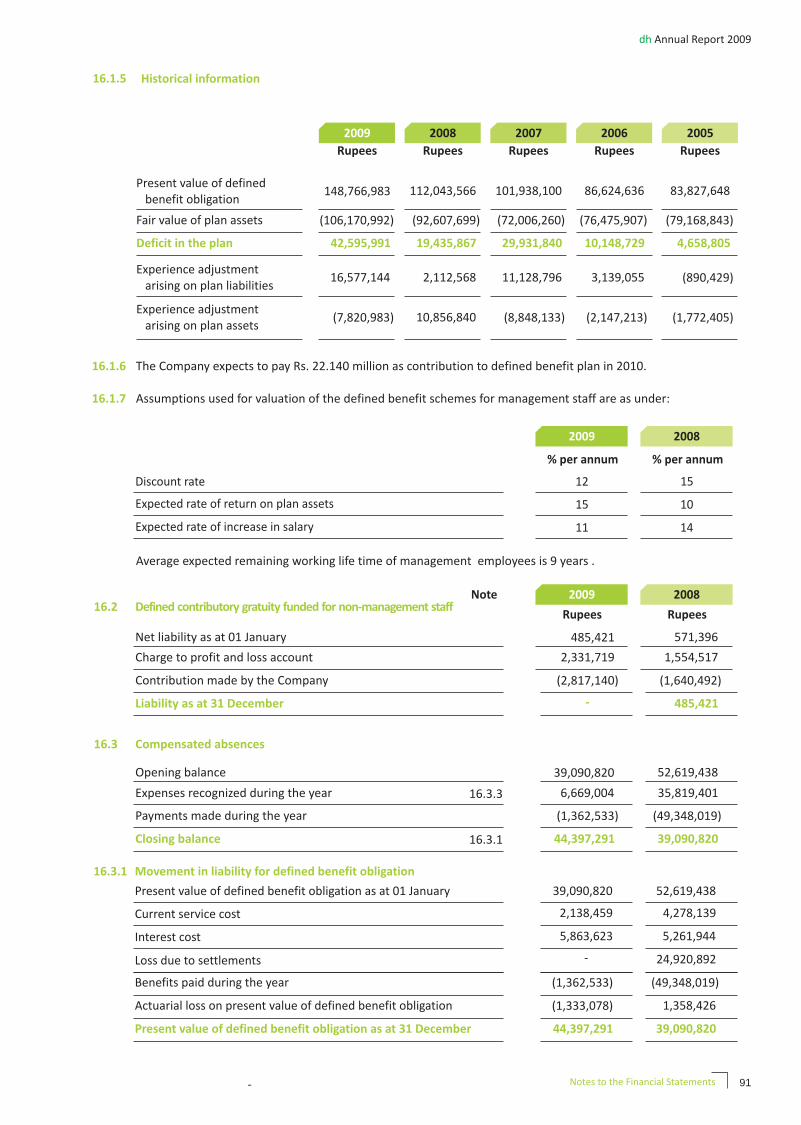
The funded retirement benefits of the employees of
the Company are audited at regular intervals and are
adequately covered by appropriate investments. The
value of the investments of the two provident funds as
per the last audited accounts aggregated to
Rs. 719.75 million. Fair value of the assets of the
funded defined benefit gratuity plan for management
staff was Rs. 106.17 million as at 31st December 2009,
according to the actuarial valuation, whereas the
value of assets of defined contribution plan for
non-management staff was Rs. 41.16 million as on
30th June 2009.
Ownership
Pattern of Shareholding
Provident and Gratuity Funds
Business Risks and Challenges
Your Company is committed to mitigate the threats to
its business activities in the form of risk, through its
risk management system.
The Company has exposure to the following risks:
The Company's manufacturing risks includes
Manufacturing Risk
obsolescence, innovation, gas load shedding and
restricted supply of gas.
The availability of DAP and other Urea substitutes
depicts marketing risk of the Company.
Marketing Risk
Directors’ Report
dh Annual Report 2009
48
Health, Safety and Environment
Sustained economic success is impossible without
Health, Safety and Environmental Protection. We
must continue to strive towards excellence and
leadership for our Health, Safety, and Environment
programs. HSE is one of our core values that will not be
sacrificed in the name of profits. The health and safety
of our employees and those we work with are vitally
important. The protection of the environment is
Financial Risk
Financial Market Risk
Human Resources Risk
Environmental/Natural Disaster Risk
Global Risk
Your Company is exposed to equity risk, interest rate
risk, currency risk, commodity risk and withdrawn of
feed gas stock subsidiary.
The Company is exposed the reduction in the value of
its portfolio, either as investment portfolio or trading
portfolio due to change in the market risk factor such
as interest rates, foreign exchange rate sand
commodity prices.
The Company's Human Resources Risks includes
dearth of trained personnel, attrition of manpower,
frauds and incompetence.
Your Company is exposed to earthquakes, fires and
other regularity laws.
Global risks includes restrictions imposed by foreign
supplier and cyclically oil prices.
The Board of Directors has the overall responsibility
for mitigation and risk management. The Board has
delegated the responsibility of the risk management
to the Chief Executive of the Company.
The Board oversees how management monitors the
Company's risk management process adopted by the
Company. The Board is assisted in its oversight role by
Internal Audit. Internal Audit undertakes both regular
and ad-hock reviews of risk facing the Company, the
results of which are reported to the Board.
Your Company uses a structured approach in
identifying, assessing and controlling risks to support
better decision making for effective and efficient use
of resources. The Company endeavors to mitigate its
risk through hedging Biz-planning, succession
planning, training and internal audit.
The Company mitigates the risks of fire of its assets
viz-a-viz - urea stocks, stores and spares, plant and
machinery, building, furniture and fixture, equipment
and electrical appliances by acquiring fire insurance,
while the Company has a comprehensive insurance
cover for its vehicles. The Company also insures its
imported and local consignments of goods by
employing marine insurance cover.
equally important.
To DHCL, HSE excellence means working towards an
incident-free workplace, finding business-driven
value in HSE, integrating HSE into operations, and
using our HSE programs to provide competitive
advantage. We are continually working to improve in
each of these areas. Our lost time incident and
Directors’ Report
dh Annual Report 2009
49
HSE Strategy
·
·
·
·
·
·
Our Performance in 2009
1.
2.
We will achieve our vision by:
Conducting business in a manner that protects
public and occupational health, the environment
and employees safety.
Striving to eliminate all accidents and
environmental incidents.
Complying with all applicable HSE laws and
regulations.
Reducing emissions and waste and using energy
and natural resources efficiently and intelligently.
Working with our employees, suppliers,
customers, contractors and partners to promote
responsible management of products and
processes.
Encouraging constructive communication with
our employees, suppliers, customers, neighbor
and stockholders about managing health, safety
and environmental issues.
HSE performance during the year was consistent,
which reflects management commitment towards
safe work practices and spirit of continual
improvement. First time in the history of company,
new safety performance milestone of 8 million safe
man-hours and 7 years of safe operation days without
any lost work injury were achieved this year.
Annual surveillance audit 2009 of ISO-14001
(Environment) and OHSAS-18001 (Safety)
standards conducted by MOODY International.
There was no major or minor nonconformance.
New breathing air (16 cylinders) system with
dedicated breathing air mask system installed
and commissioned.
recordable incident rates continue to improve as a
result of our emphasis on hazard identification and
risk analysis.
We will strive to make DHCL a recognized leader in
Health, Safety and Environment in our industrial
sector and across all industries. This is our goal, and
we look forward to working together with all of our
employees and stakeholders to make it happen.
We want to make sure that the company's
commitment to HSE excellence is reflected in
management's day-to-day activities. One injury, one
near mishap, even one unsafe practice is too many.
We are committed to an incident-free workplace, and
that includes environmental incidents as well as
health and safety incidents.
From a safety performance perspective, 2009 was the
most successful year in the history of our company.
TRIR (Total Recordable Incident Rate) of the Company
was 0.28 during the year 2009 and fortunately all of
the incidents were without long-term health effects.
Nevertheless, we need to work together with our
contractors to improve their HSE Performance.
The health of its employees, customers and public
is protected.
All of our activities will be carried out safely with a
commitment of Zero Injury.
Environmental Performance meets legislative
requirements.
To see health, safety & environment as a cornerstone
of a civilized society and, with that, to achieve a record
of workplace health, safety & environment that leads
the world.
Mission Statement
·
·
·
Vision
Directors’ Report
dh Annual Report 2009
50
Safety Statistics for the year 2009
LWI (dh)
LWI (Contractor)
Injury (dh)
Injury (contractor)
Fire Incidents
Near Miss
Highway Accidents
Work Accidents
Occupational Illness
Jan Feb Mar April May June July Aug Sep Oct Nov Dec
0
0
0
0
3
8
0
0
0
0
0
0
0
0
2
0
0
0
0
0
0
0
0
1
1
0
0
0
0
0
0
1
2
0
1
0
0
0
0
0
2
1
3
0
0
0
0
0
1
2
0
0
0
0
0
0
0
0
0
1
3
0
0
0
0
0
0
0
1
1
0
0
0
0
0
0
0
0
0
1
0
0
0
0
0
1
0
0
0
0
0
1
0
1
0
0
2
2
0
0
0
0
1
0
2
0
1
0
Safety Statistics and Trends
DHCL Employees----Safe Man-hours Record
0
2005
2006
2007
2008
2009
1,0
0,0
00
0
2,0
0,0
00
0
3,0
0,0
00
0
4,0
0,0
00
0
5,0
0,0
00
0
6,0
0,0
00
0
7,0
0,0
00
0
8,0
0,0
00
0
9,0
0,0
00
0
8,164,700
7,016,629
5,938,328
4,858,108
3,841,945
This clean breathing air emergency supply will be
an alternative source in case of normal supplied
air contamination.
DuPont consultant conducted in-house Process
Hazard Analysis (PHA) training workshop and first
ever PHA of plant site was started this year.
New Management Safety Audit (MSA) program
started in which all management employees
including CEO participated. The purpose of this
safety audit program is to create safety
awareness, improve two-way communication
between workers and management and
strengthen concept of visible management
commitment.
Unsafe situation per audit hour started to explore
unsafe situations at plant site.
Environment day was celebrated on June 22,
2009. Banners were displayed and awareness
sessions were also conducted.
New trees including fruit trees plantation carried
out as a part of green dh project. About 700 new
fruit trees were planted.
As a part of green dh project 42 acres of
agricultural land was developed and wheat crop
was cultivated in record shortest time.
3.
4.
5.
6.
7.
8.
Safe Man-hours Record
·
·
Safe man-hours record in earlier years was not
impressive but with Management commitment
for safe work practices and objective of continual
improvement, our safe man-hours record
continually improved. Last LWI (Lost Work Injury)
occurred on February 25, 2002.
Safe operation till December 2009 reflected in
new safety performance milestone of 8 million
safe man-hours on November 04, 2009.
Directors’ Report
dh Annual Report 2009
51
The Nutrients Supply Chain
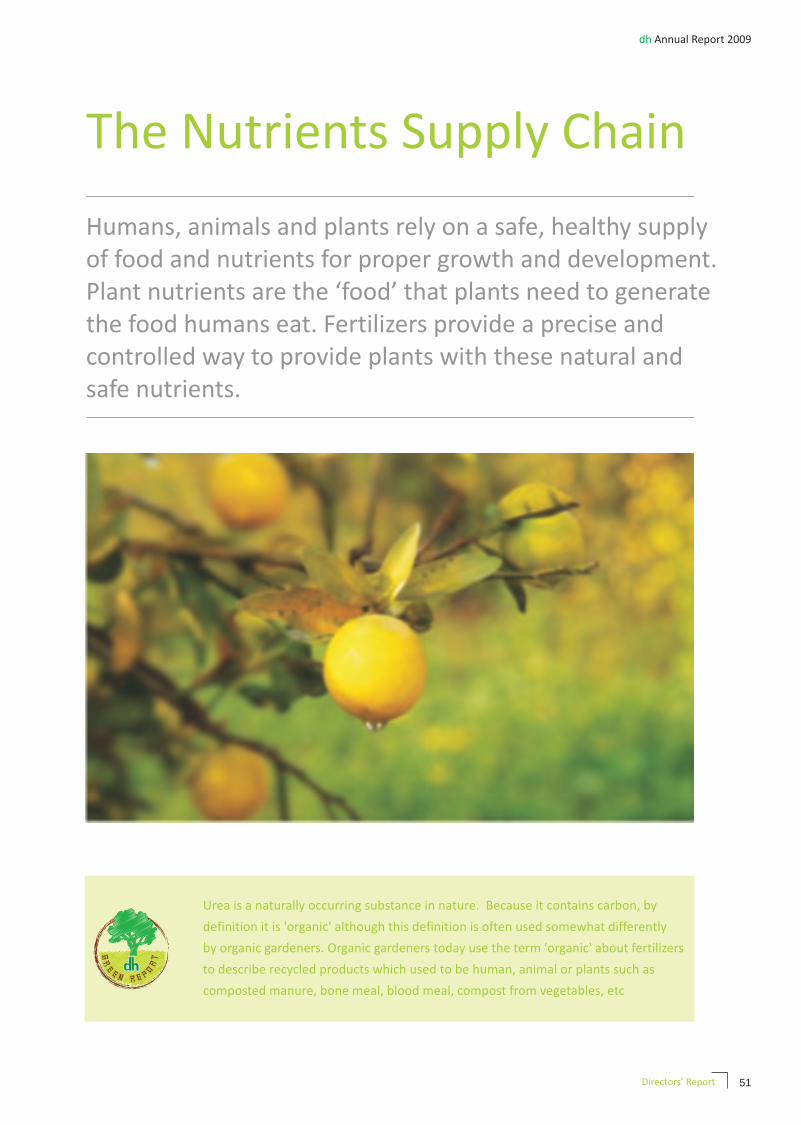
Humans, animals and plants rely on a safe, healthy supplyof food and nutrients for proper growth and development.Plant nutrients are the ‘food’ that plants need to generatethe food humans eat. Fertilizers provide a precise and controlled way to provide plants with these natural andsafe nutrients.
Urea is a naturally occurring substance in nature. Because it contains carbon, by
definition it is 'organic' although this definition is often used somewhat differently
by organic gardeners. Organic gardeners today use the term 'organic' about fertilizers
to describe recycled products which used to be human, animal or plants such as
composted manure, bone meal, blood meal, compost from vegetables, etc
Directors’ Report
Corporate Social Responsibility
Corporate Social Responsibility (CSR) is increasingly
becoming one of the major yardsticks for judging a
Company's performance. Your Company considers
sustainability initiatives and social causes as strategic
imperatives for business growth and is therefore,
proactively working to integrate it into the overall
objectives of the organization. We believe that good
corporate citizenship is an integral part for
sustainability and value addition. Our vision is to
become a leading enterprise with strong sense of
social consciousness. We intend to achieve this vision
through a two-pronged strategy, internal and
external.
As a responsible corporate entity, we have established
an enabling and high-energy environment where
people get opportunities for decent work and
personal and professional growth. We continuously
endeavour to further improve our working
conditions. Employee engagement is an integral part
of our CSR strategy and we are working to foster a
culture of philanthropy and promote employee
volunteering for community service.
We strictly adhere to the principles of good corporate
governance and comply with all applicable laws and
regulations. Whatever we do is coherent with our
business ethics and core values i.e.
Professionalism through leadership and integrity
Innovation, teamwork and partnership
Long term profitability and growth
Perpetual commitment to quality and continual
improvement
Adherence to safety requirements has become a part
of our work culture - a way of life. We have established
the highest safety standards and integrated them into
Internal Perspective
·
·
·
·
all our activities and operations. The 8 million safe
man-hours milestone achieved during the year is a
manifestation of this commitment.
We continuously strive to ensure that our production
activities do not harm the environment. We follow the
best safe operating practices and have set up state-of-
the-art treatment facilities. We have been
consistently complying with National Environment
Quality Standards (NEQs) over the years. This year we
got ISO 14001 certification and received 6th Annual
Environment Excellence Award.
We are actively working to establish a culture of
environment friendliness at all levels of the
organization. Our aim is to make environment
consciousness as much a part of our work culture as
safety consciousness. Recycling and energy saving are
fast becoming a trend at our places.
In our ever deteriorating environment the importance
of trees as absorbers and removers of carbon dioxide
from air cannot be ignored and as good corporate
citizens it becomes our responsibility to contribute
towards their protection and preservation. One step
towards this commitment can be to recycle our paper
waste, as for every one ton of paper that is recycled we
save 17 trees. For realization of this goal CSR
Committee decided to recycle all paper waste
available at DH Plant and Head Office. The envelope
in which you received this Report is made of recycled
paper.
We understand our social obligations and consider
ourselves a part of the local social, cultural &
economic life and are always willing to give back to the
communities in which we work and live. Health,
education, environment and emergency relief are the
four focus areas of our social efforts.
In the Society
dh Annual Report 2009
52 Directors’ Report
Health
Eye Camps
Free eye camp held every Wednesday at the Plant has
become one of the flagship CSR initiatives of Dawood
Hercules. Since inception on 26 November 2007, the
camp has been attracting large number of needy
patients who are provided quality treatment for
various eye ailments free of cost. Over 275 patients
are attended in every camp. The Company also
sponsors cataract operations which are carried out in
a hospital in Lahore. Free transportation and food is
provided to these patients. The following figures
reflect the impact these camps have so far made:
Camps held
Visits recorded
Cataract surgeries
conducted
2009 2008
44
12,504
615
48
11,399
788
Total sinceinauguration
150
34,796
1,671
Camps held
Visits recorded
2009 2008
49
8,690
28
3,575
Total sinceinauguration
77
12,265
Considering the immense utility of this initiative, the
CSR Committee has decided to continue funding it in
the year 2010.
Weekly free health camp for women was initiated on
22 May 2008. The objective was to provide free
medical assistance to the less privileged women of the
area who otherwise do not have access to proper
medical care and to save them from quackery. The
Camp is conducted every Thursday at the Plant and
around 175 women patients visit it every week. The
patients are provided free consultation, medicines
and ultrasound facility. Female employees of the
Company volunteer to assist the doctor. Comparative
figures are given below:
Women Health Camps
Health and Hygiene Awareness
Water Purification Plant
Misc. Operations
A new initiative was undertaken during the year
whereby awareness sessions on health and hygiene
were arranged for the people visiting the eye camps
and women health camps. Company Medical
Consultant conducted a series of such sessions
covering various diseases and health related issues.
This activity will continue during next year. We also
plan to arrange such sessions for the children of TCF-
School – DH Campus.
Dawood Hercules donated a water filtration plant to
the Children's Hospital, Lahore . The plant has been
installed near the Emergency Block of the Hospital.
Around 500 patients visit the emergency every day.
These patients, their attendants and the hospital staff
will benefit from this facility. This is the fifth water
filtration plant that DH has sponsored so far. Before
this, three plants have been installed in villages near
the Plant and another at Mayo Hospital in Lahore.
As reported last year, a seven year student of the TCF
School, born with a cleft lip was picked up for
operation. All costs were borne by the Company to
repair the child's lip and teeth. He is currently
undergoing post-operation dental and medical care.
We are also sponsoring reconstructive surgery of a
young girl with multiple deformities and functional
disturbances. She is undergoing multiple operative
procedures including repair of palatal fistula and
lateral lip scars, complete secondary repair of upper
lip including vermillion and closure of upper sulcus-
nasal fistula and reconstruction of nasal deformity.
These operations besides culminating the woes of
these individuals and their families will, InshaAllah,
completely change the quality of their lives helping
them recover from the social and emotional scars
which such deformities usually leave.We intend to continue this activity in the year 2010.
dh Annual Report 2009
53Directors’ Report
dh Annual Report 2009
Education
TCF School-Dawood Hercules Campus
Vocational Education
Vocational Training for Boys
The school set up in collaboration with The Citizen
Foundation is providing quality education to the
under-privileged children near the Plant area.
Currently 320 students are enrolled with the school.
In today's knowledge-based economy the role of
skilled and technically educated manpower cannot be
over-emphasized. The aim of vocational education is
to impart specialized and practical knowledge and
skills to a person thus enabling him or her to start
decent work in an industry or through self
employment. There is a huge mismatch between the
skilled manpower required and that available.
Considering its importance, the CSR Committee
decided to start focusing on vocational training of
both boys and girls.
We have decided to collaborate with Aabroo
Educational Welfare Organization for imparting free
vocational training to the poor children in the slum
areas. The objective is to help them take up decent
employment after acquiring necessary skills.
Aabroo Educational Welfare Organization is a non-for-
profit organization with focus on getting the
impoverished students off the streets and lure them
into class rooms for academic and vocational pursuits.
Currently 1,500 students are enrolled in three schools
where besides free education, books, clothes and free
meals are also provided to them.
Dawood Hercules is sponsoring two vocational
training programs for boys.
Mobile phone repairing course is for Aabroo school
students and young people living in the adjoining
areas. This is a one-year course for which laboratory
and equipment already exist. Dawood Hercules is
sponsoring the salary of the teacher and recurring
expenses. Five batches of 16 students each will
complete 100 hours of training in one year duration.
Home Appliances repair and maintenance course is a
new initiative of the Aabroo Educational Welfare
Organization. Dawood Hercules is providing
laboratory tools and equipment and sponsor the
salary of the teacher and recurring expenses. Five
batches of 16 students each will complete 100 hours
of training in one year duration.
A total of 160 students will benefit from these two
courses.
Course content is 20% theoretical and 80% hands on
practical. The course syllabi have special focus on
safety aspects and job ethics.
To raise money for their projects and help protect the
environment, M/s Aabroo are running a waste
management programme. The trash collected is sold
to raise funds and provide free meals to their
students. We have joined hands with them in this
programme by donating our canteen/cafeteria trash
(empty milk/food packs and pet bottles).
We are also very keen to do our bit to help the poor
women of Sheikhupura so as to enable them to start a
decent life and live respectfully. For this, we have
collaborated with Sanatzar, a vocational training
institute for women in Sheikhupra. As a first step, we
sponsored a three months stitching course.
Participants for this course were selected from
villages surrounding our manufacturing facility. A
batch of 25 ladies were trained and to help them start
a life of self employment, sewing machines were
gifted to them for this purpose.
Vocational Training for Girls
54 Directors’ Report
dh Annual Report 2009
Training & Apprenticeship
Opportunities
Creating Opportunities
Dawood Hercules provides practical training to young
engineering graduates, operators, diploma holders
and matriculate apprentices. The interactive teaching
methodology includes hands-on practical experience
and class room sessions. The passouts of these
courses are providing valuable services not only at
Dawood Hercules but also at numerous leading
industries throughout the country. This year, batches
of trainee engineers, diploma holders and matriculate
apprentices completed training.
We are equal opportunity employers but at the same
time actively pursuing to create opportunities for the
marginalized sections of the society. The 25th batch of
the Graduate Engineers Training Programme which
completed training this year had a distinct feature i.e.
induction of three female engineers - 10% quota was
reserved for girls in this batch. Two girls were inducted
on special quota while one qualified on open merit.
This affirmative action reflects the Company's social
consciousness and is aimed at encouraging and
developing young female engineers in the country
and promoting diversity in the organization. In the
26th batch, three female engineers have been
inducted on special quota. Additionally, in order to
provide opportunity to students from remote areas,
two engineers from Balochistan have also been
inducted on special quota.
Dissemination ofinformation throughstreet theater onbetter managementpractices in agricultureto reduceenvironmental effect,in collaboration with
WWF-Pakistan
Internship Opportunities
Factory Visits for Students
Plantation Drive
We believe that university-industry liaison is a must if
we want to make education, especially professional
education, relevant and market-specific. On our part,
we have increased internships for young students
from engineering universities and business schools to
provide them an opportunity to acquire hands-on and
practical knowledge in their respective areas of
studies. This year a total of 49 (2008:36) students
underwent a systemized internship programme at our
plant and the head office. The feedback we received
from these students was very positive.
Dawood Hercules welcomes students/trainees of
various institutions to visit its manufacturing facility.
Apart from introducing them to the fertilizer
manufacturing technology, these visits give these
young men and women a peek into the working of a
large professional organization. This year 731 (2008:
875) students and trainees visited the factory from all
over Pakistan.
The 37,000 trees planted on the land adjacent to the
Plant have now reached the self-sustaining stage and
are already making valuable contribution towards
Environment
55Directors’ Report
dh Annual Report 2009
making the environment of the area cleaner. In a few
years from now, these trees will be mature enough to
not only trap significant amounts of CO2 and
contaminants from the air but will also provide the
much needed habitat for birds. Trees are also good
sound absorbers and will, therefore, be instrumental
in reducing noise pollution in the area.
We have decided to work with Word Wide Fund for
Nature Pakistan (WWF-Pakistan) to pursue joint
projects in the filed of environment protection. This
year, we collaborated with them on their initiative on
Better Management Practices (BMPs) in agriculture.
The objective of this initiative is to promote
sustainable practices to reduce environmental impact
of agriculture in the rural areas of Pakistan . Dawood
Hercules sponsored street theatres which involved
disseminat ion of BMP messages through
performance by the professional stage artists. Street
theatre as a form of communication is deeply rooted
in our rural traditions. In recent times this form has
been used to propagate social and political messages
and to create awareness amongst the masses
regarding critical issues. Street theatre breaks the
formal barriers and approaches the people directly.
A total of 14 performances were arranged in remote
villages of Jhang and Faisalabad. Apart from providing
opportunity for fun and entertainment, the play
aimed at educating the farmers in better agriculture
practices like balanced use of fertilizer; impact of
pesticides on the environment; better soil and seed
health; best sowing/tilling methods, etc. The play
demonstrated through a well plotted story that
sustainable crop production is possible through
efficient use of inputs.
It turned out to be a very successful activity.
Approximately 4,000 people, including women and
children, watched the shows. The CSR team spoke to
local farmers who were very excited about these
shows and gave an encouraging feedback on the
Better Management Practices in
Agriculture
usefulness of such street plays.
Your CSR team has always acted swiftly whenever
there is a natural or man-made catastrophe in any part
of the country.
The military action against the militants in Swat and
Wana unfortunately resulted in the biggest ever
displacement of the innocent and peace loving people
of Swat. These internally displaced persons (IDPs)
were accommodated in make shift camps where they
struggled to cope with the rigors of living refugees' life
in their own country. The CSR Committee decided to
send food and essential household items to bring
some relief in the lives of some of these IDPs. All
logistic and administrative arrangements were made
in the shortest possible time. Packets containing food
items (flour, cooking oil, pulses, sugar, tea, rice, salt
and dry milk), blankets and utensils (cooking pot,
spoon, plate, soap-cakes, etc) were dispatched. A total
of 400 families were catered for during two rounds of
this relief activity. The swift action was made possible
by the employees who volunteered in large number.
Aabroo Educational Welfare Organization, Lahore
Pakistan Poverty Alleviation Fund
Roshni Foundation
Sanatzaar
The Children's Hospital & the Institute of Child
Health, Lahore
The Citizens Foundation
WWF-Pakistan
We recognize that all these activities are successful
only because of continuous engagement of the
communit ies themselves; support of our
shareholders and enthusiasm of our employees. We
express our gratitude for all of them.
Emergency Relief
1.
2.
3.
4.
5.
6.
7.
Help for IDPs of Swat and Wana
Non-Profit Organizations supported
during 2009
56 Directors’ Report
dh Annual Report 2009
57
Human Resource Management
2009 was one of the most challenging years for
businesses in Pakistan owing largely to the global
economic slowdown, energy crisis and security
situation in the country. Workers become the first
victim of a precarious and uncertain economy. We
have seen large scale layoffs throughout the world,
Pakistan not being an exception. For a people-centric
organization like Dawood Hercules, the challenges
become even greater due to the need for a strategic
alignment of people's economic and social needs with
the overall objectives of the business. With the Grace
of Allah, your Company was able to continue its
strategic imperative of investing in its people and
there was not a single layoff at any level. We believe
that the extraordinary production, sales and safety
records achieved during the year are the outcome of
the combined efforts of a highly competent and
committed workforce operating in a performance
driven high-energy environment .
We hire employees considering them as soft assets in
the company who will manage and optimize the use of
the hard assets of the company in future. Employees
are the only physical assets that appreciate in value.
As the employees, learn more and more about the
business and about their own role, their performance
increases over the time.
Following is a brief description of HR related initiatives
undertaken during the year:
Inspection and testing function is very critical in a
process industry for ensuring integrity of the plant
equipment and machinery. A full-fledged and
independent Inspection Department was set up
during the year to streamline the inspection activities.
For this purpose, a gap-analysis was carried out
Organizational Development
through interaction with other industries having
professional inspection setup to get a better
understanding of the best practices in this field.
The Department will have two sections: Machinery
Inspection and Equipment & Piping Inspection. The
following shall be the core responsibilities of the
Department:
·Equipment integrity assessment
·Machinery condition monitoring
·Corrosion monitoring and protection
·Shutdown / turnaround inspections
·Failure analysis / post-failure analysis
·Material Inspection
The preventive maintenance function of the
Engineering Department and corrosion control
function of the Technical Department have been
transferred to the new department. Inspection
Department is being equipped with state-of-the-art
inspection, testing and measuring tools and necessary
trainings of all personnel is also being arranged.
Shipments coordination and ammonia sales functions
were merged into the AgriDivision. The objective was
to consolidate the sales function and optimize
resource allocation.
Company's training & development efforts are aimed
at increasing its current and future ability to meet its
goals. As a responsible corporate citizen, the
Company has played a significant role in training
young people for highly technical jobs.
A total of 478 graduates in the fields of chemical,
mechanical, electrical, electronics and metallurgical
engineering as well as master degree holders in
Training & Development
Directors’ Report
batch completed training this year. Selection of next
batch has been finalized and the candidates will start
training in January 2010.
The Company continued to invest in the professional
development of its employees. Various in-house and
outside training programs, seminars and workshops in
the areas of management, plant operation and
maintenance, information technology, finance,
training etc were arranged throughout the year. A
total of 68 employees attended management training
courses in reputed institutions of the country. Various
in-house training workshops and seminars were also
arranged by the Training Department attended by 436
employees.
Two team building adventure tours for employees
were arranged during the year. Employees trekked to
Nanga Parbat Base Camp and Mukhspuri Top. The trip
involved extensive traveling, trekking, hiking,
camping, and group activities. Such trips involve
participants in pursuing real and tangible results and
are very effective on account of being
a good team building exercise
a good training tool for developing leadership
qualities through exposure to physical challenge
an opportunity for stepping out of the everyday
routine and getting recharged for performance
optimization in personal and professional lives.
The management of the Company is actively trying to
develop an enabling framework whereby various HR
policies and procedures are being updated.
Company Car Policy was revised to upgrade car
entitlements for the management employees. A
Laptop Policy has been formulated to provide Laptop
Computers to management employees for efficient
and effective performance of their duties. All other HR
policies, procedures and standards are being updated
to make them consistent with the Company's overall
strategic objectives.
o
o
o
Policy Formulation
Chemistry have so far benefited from the Graduate
Engineers Training Program (GETP) since its inception
in August 1975. This is an extensive training program
for entry level engineers with equal focus on
theoretical and practical training. During the year, the
25th batch completed its training. The distinctive
feature of this batch was the induction of three female
engineers. As a gesture of a responsible corporate
citizen, the Company reserved a 10% quota for girls in
this batch. Resultantly, two girls were inducted on
special quota while one qualified on open merit. This
affirmative action reflects the Company's social
consciousness and is aimed at encouraging and
developing young female engineers in the country
and promoting diversity in the organization. The 25th
batch undertook a team building adventure trip to the
base camp of Malika Parbat in July this year. This
provided them with an opportunity to develop their
leadership, coordination, team building and problem
solving skills. 26th batch has been inducted. This year,
three seats have been reserved for girls. Additionally,
two engineers from remote areas of Bolochistan
province have also been inducted on special quota.
Under Company's Diploma Apprentices Training
Scheme (DAS), 217 young people with three year
diploma from a polytechnic institute have undergone
training for various maintenance related technical
disciplines since March 1974. 15th batch of the
scheme will complete training in February 2010.
Operators Training Scheme (OTS) trains young science
graduates and diploma holders in chemical
technology for operating a chemical plant. A total of
315 persons have been trained since the start of the
scheme in September 1977. 22nd batch completed
training this year; all trainees were inducted on
permanent role. Induction process for next batch is
under process.
Matriculate Apprentices Scheme (MAS) is a statutory
scheme under Apprenticeship Ordinance, 1962. 384
young people with basic qualification of matriculation
have benefited from it since November 1974. 16th
dh Annual Report 2009
58 Directors’ Report
CBA elections were held and a new CBA was sworn in.
The whole process was conducted in a peaceful and
amicable manner.
16 employees performed Hajj under Company's Hajj
Scheme. A total of 357 employees have performed the
sacred pilgrimage since 1988 under this scheme.
This year, 36 employees performed Umrah under
Company's Production Incentive Umrah Scheme
making the aggregate of 336 employees since the
inception of the scheme in 1997. Under this scheme,
four employees are sent for Umrah in the month when
a specified production target is achieved.
Employees Welfare
Compensation & Benefits
Industrial Relations
For the last three years running, significant
remuneration adjustments have been made for the
management cadre employees so that the
competitive edge could be retained. This year the
Company plans to undertake another salary
adjustment exercise. For this purpose, the Company
participated in a salary survey to gauge its competitive
position. Salaries of the non-management staff were
also significantly increased under Settlement.
The Company continued to benefit from the
exemplary management-employees relationship.
HR
Productivity
QualityInnovation
HR Fulfilment
Industrial Relations
tnemeganaM ecnamrofreP
Primary HRM Disciplines & Functions
ecnialpmoC/serudecorP
Reward & Recognition
gninnalP cigetartS
ss ein u s PB artnership
Change Man
ageme
nt
dh Annual Report 2009
59Directors’ Report
dh Annual Report 2009
Dawood Hercules Green Projects
60
Save Water Save life Plant Trees for your Future
Our forest covered area is fast depleting because tree
cutting rate in Pakistan is the highest in the world. We at
dh are well aware of the positive impact of tree
plantation on the environment. We have initiated a
Green DH project whereby large scale tree plantation is
being carried out within and around the plant area.
A careful planning and management is needed to
address rapidly increasing scarcity of water, one of the
most precious necessities of life. We have successfully
completed many projects for economizing water use
and maximizing re-utilization of effluents.
Water Purification Plant
Waste Water Treatment
Chromate Omission
Drinking contaminated water is one of the major health risks
in the Third World countries. As a CSR initiative, DHCL has so
far installed five Water Purification Plants, three in villages
around our Plant and two in Hospitals of Lahore (Mayo and
Children Hospital).
Packing water return from HP Ammonia pumps is
contaminated. A system was developed whereby ammonia
pollution from this source has not only been curtailed but
overall condensate drainage has also significantly reduced.
The sewerage water of plant is carried to the three septic
ponds at the offsite area. A blower is provided there to add
additional oxygen in sewage before its discharge to septic
ponds to ensure BOD (Biochemical Oxygen Demand)
requirements. This water is then reused for watering of trees
in the forest area.
Chromium, previously used as a corrosion inhibitor in cooling
water system is a recognized heavy metal and acts as a
carcinogenic agent in animals and humans. This
environmental hazard is completely removed. DHCL decided
to eliminate use of hazardous material and adopted cooling
water new environment friendly phosphate system.
Land for Forest
Fruit Plantation
Wheat Cultivation
We have dedicated around 50 acres of land solely for the
purpose of tree plantation. During the past four years,
approximately 50,000 trees have been planted. Most of these
trees have reached the self-sustaining stage. This year
another 6000 trees were planted on 3 acres of land. A new
raw water tanker has been arranged for watering of
embryonic stage plants in offsite area.
During 2009 , another 700 trees of different verities
including 300 fruit trees (mango , citrus and jamboline) were
planted at plant site and the forest area. We now have plans
to plant fruit trees in open area near the warehouse.
A large area (42 acres) covered with root mat of grass was
turned into a model agriculture farm . The land was properly
developed, channels for irrigation were constructed in record
shortest time and tube-well water was provided along with
canal water supply. The result: an excellent crop of wheat.
Directors’ Report
dh Annual Report 2009
61
Shifting to Low Carbon LifestylesSustainable Agricultural Environment
Our country has been facing significant food shortage
forcing us to rely on imports. Our business is directly
related to agriculture and our mission is to increase
yield so that the country could achieve self-reliance. In
order to cater to the need for balanced used of
fertilizers, we are importing DAP along with
manufacturing urea fertilizer
We have undertaken many projects to minimize the
impact of our operations. New gas turbine generator
has been successfully commissioned. This project shall
help to reduce considerable amount of natural gas in
combined cycle gas turbine project. Another project is
aimed at using solar cells to provide power supply to
street lights of housing colony.
Best Management Practices (BMPs)
Reducing Emissions
Production Portfolio
People must learn not be wasteful and adopt practices which
help them to indulge in judicious use of agriculture inputs so
as to reduce the environmental impact on agriculture in the
rural areas. DH collaborated with W.W.F. Pakistan on their
initiative on Best Management Practices (BMPs) in
agriculture by sponsoring street theatres involving
dissemination of BMP messages through performance by
professional stage artists. The shows were well attended
showing a growing interest of farmers in these messages.
Air pollution is considered as major environmental hazard.
We have contributed by decreasing substantial amount of
Green House Gas (GHG) at our Plant site. New gas turbine
project has been successfully commissioned and this project
shall help to reduce Co (GHG) by 72 tons per day. 2
Agriculture is our biggest sector and the exploding population
is our biggest concern. To feed these growing numbers we
need to increase our agriculture produce. Without fertilizer
inputs this goal cannot be realized as fertilizers play a vital
role in enhancing agriculture yields. With this mission in mind,
despite the gas constraint, DH has continually improved its
urea production from 1350 MT/day to 1600 MT/day.
Energy Efficiency
Environment day
Waste Segregation for Recycling
Some of the measures taken for energy efficiency during
2009:
Rewinding of two 11 kv existing motors and installation of
two new ones.
Installation of automatic ON/OFF system for street lights at
the plant.
Replacements of lights with energy savers at Plant site and
head office.
Every year, 5 June is celebrated as Environment Day in the
organization whereby an awareness campaign is launched.
Topic for this year' campaign was “Ozone Depletion,
Consequences and Mitigation Measures”.
Separate bins have been provided for handling different
categories of waste. Metal waste is collected and stored at
scrap yard and then sold. Glass, plastic and rubber waste is
disposed off in an environment friendly manner. Paper waste
is being used for recycling purposes.
·
·
·
Directors’ Report
dh Annual Report 2009
62 Outlook 2010, Acknowledgment
Outlook 2010
We plan to enter the year 2010 with full vigor and
determination, as your Company is built on good
financial foundation and its corporate governance is
among one of the best.
On behalf of the Board
Shahzada Dawood
Chief Executive
We would like to express our gratitude to all the
shareholders for their confidence in these challenging
times and also express hope that their confidence will
be rewarded in the years to come.
We would like to thank the Government, financial
institutions, all stakeholders and those who have been
associated with us for their support, understanding &
co-operation.
We would also like to extend our thanks to the
management and employees for their sincere
contributions to the ongoing success of the Company.
Urea demand for 2010 is expected to show a
moderate growth of around 4%. This, however, is
subject to adequate water availability. Consumption
of phosphatic fertilizer will react inversely, to the price
changes, which in turn will be driven by fluctuations in
the international prices and the amount of subsidy.
Local production of urea will be augmented by the
commissioning of two new plants during the year
2010 and the import thereof will be reduced
accordingly.
To maintain its competitive edge, the Company is
undertaking technical studies to maximize the plant's
production and energy efficiency.
Acknowledgment
dh Annual Report 2009
Quality Management SystemThe vision of our Quality Management System (QMS)
is to fully utilize state of the art technologies in order
to improve processes and operations applying both
proactive and reactive techniques.
The Company's QMS is built upon a set of policies,
processes and procedures that have been specifically
formulated for the efficient execution of the
Company's core business activities. It enables the
Company to identify, measure, control and integrate
various processes within the organisation for a
systematic approach leading to continuous
improvement of business performance.
The compatibility of the Company's existing QMS with
internationally recognised standards for Quality
Management System provides a framework to ensure
customer satisfaction about the quality of our
product.
The Company's policy towards professionalism,
quality consciousness and customer satisfaction has
given it the privilege of being the first Pakistani
fertilizer manufacturer to obtain ISO 9002:1994
certification and subsequently certification for
compliance to the requirements of ISO 9001:2000 for
review of quality management system. Now it is being
further upgraded to ISO-9001:2008. The
Management Review Meetings are held on a regular
basis for effective adherence and system control
requirements.
The essential elements of Company's QMS are as
under:
Improving personnel skills through training and
qualification.
Controlling the Product Specifications.
Controlling Documentation.
Controlling Purchase.
Defining and Controlling Production Processes.
Constituting Corrective and Preventive Action
against errors.
Installation of Product Handling, Storage and
Distribution.
·
·
·
·
·
·
·
63
There is a great pleasure in
working in the soil, apart
from the ownership of it.
The man who has planted
a garden feels that he has
done something for the
good of the world.
Charles Dudley Warner, 1870
Quality Management System
dh Annual Report 2009
Business Process Re-Engineering
Reduction of
85 M. Tons / day
Greenhouse Gases (Co2) andsaving of
1.5 MMSCFD
Natural Gas Fuel
Implementing the concept of Process Re-Engineering
in DHCL and reap its benefits, both short and long
term projects have been undertaken. The salient
features of these projects are cost reducing, efficiency
improvements, energy conservation through
interception of latest innovations in technology.
Among the long term projects are intervention of
latest innovative technologies in Ammonia and Urea
Plants original processes through revamp
incorporating the advanced state of the art
technologies currently offered by internationally
renowned Process Licensors. Feasibility study is being
performed by expert firms to enhance production
capacities of Ammonia and Urea Plants to 1,200 and
plus 2,000 MTPD respectively and curtailment of
energy consumption to 7.0~7.5 Giga calories / Metric
ton Ammonia.
The short term projects underway includes re-
engineering of power generation system and
addressing safety concerns thereby mitigate
Ammonia leakage risk from existing 38 years old single
walled liquid Ammonia Storage Tank.
The installation of Gas Turbine Power generator with
Heat Recovery Steam Generator (HRSG) in co-
generation scenario at Utility Plant will replace
existing steam turbo generator and direct fired Utility
Boiler affecting 1.5 MMSCFD natural gas fuel saving.
This replacement is also of vital importance to avert
the power outages for ensuring sustained plant
production.
The fabrication and installation of new double walled
Ammonia Storage Tank adjacent to the existing tank
will ensure safety of plant personnel in particular and
plant site vicinity population in general.
64 Business Process Re-Engineering
dh Annual Report 2009
Engineering Excellence
CO Compressor Motor Stator Rewinding (MC-201A)2
Compressor motor damaged stator winding coils were replaced
with new coils. Rotor poles were also repaired. This job was done
by M/S Intersel Dubai in 21 days against the planned duration of
30 days. Motor was successfully commissioned. This job was the
first ever job of coil replacement in DH. All difficult and heavy
rigging, dismantling and assembling jobs were done by DH staff.
Overhauling of Main Generator (G-401B)
Generator was completely overhauled by M/S Intersell Dubai.
All stator winding wedges were replaced and rotor was tested &
varnished. Job was completed in record time of 12 days against
planned duration of 15 days. The job was completed at one -
fourth cost of the previous overhaul thus having a cost saving of
Rs. 5 Million
Replacement of Supporting Structure of Urea
Reactor (V-2201B)
Bundle supporting structure alongwith all new baffle plates were
replaced with modified material 2RE69 (Sandvik) due to
decrease in thickness over 19 years of service life. The whole job
was done without the services of VSM. The job was completed in
15 days against vendor's proposal of 21 days. Total saving
achieved was Rs. 25 million.
Overhaul of ID Fan Turbine (1101-BJT)
Complete overhauling of turbine was carried out without the
services of VSM. It was successfully put on load. The vibration
levels and temperature at the bearings were within the
prescribed limits. Total saving achieved was Rs. 3.3 Million
Local Development of Critical Spares.
Total saving achieved due to the local development of critical
parts for ammonia, urea, utilities & Bagging shipping units was
Rs. 6.38 million
65Business Process Re-Engineering
dh Annual Report 2009
"When you plant a tree, never plant only one. Plant three one for shade, one for fruit, one for beauty."
African proverb
Statement Of Compliance With TheCode Of Corporate Governance
Auditors’ Report to the Members
Review Report to the Members
Profit and Loss Account
Statement of Comprehensive Income
Balance Sheet
Cash Flow Statement
Statement of Changes in Equity
Notes to the Financial Statements
Pattern of Shareholding
Form of Proxy
68
70
71
72
73
74
76
77
78
105
dh Annual Report 2009
67Financial Statement
Financial Statements
Did you know trees are longestliving organism on earth?
A single tree produces up to 260 pounds of oxygen a year. That is
more than enough to supply oxygen to a family of four people.
Trees get about 90% of their nutrition from the atmosphere
(carbon dioxide, etc), and only about 10% from the soil.
Trees help cool down the atmosphere. They can bring down your
air conditioning costs by up to 20 percent.
Trees improve water quality by slowing and filtering rain water, as
well as protecting aquifers and watersheds.
The statement is being presented to comply with the requirements of the Code of Corporate Governance contained in the listing regulations of the stock exchanges for the purpose of establishing a framework of good governance, whereby a listed company is managed in compliance with the best practices of corporate governance.
The Company has applied the principles contained in the Code in the following manner:
The Company encourages representation of independent non-executive Directors. At present, the Board
comprises of ten Directors including the Chief Executive.
The Directors have confirmed that none of them is serving as a Director in more than ten listed companies,
including this Company.
All the Directors of the Company are registered as taxpayers and none of them has defaulted in payment of any
loan to a banking company, a Development Financial Institution (DFI) or a Non-Banking Financial Institution (NBFI)
or, being a member of a Stock Exchange, has been declared as a defaulter by that Stock Exchange.
No causal vacancy occurred in the Board during the year.
The Company has prepared a “Statement of Ethics and Business Practices”, which has been signed by all the
Directors and employees of the Company.
The Board of Directors has developed a Vision/Mission statement. All significant policies of the Company are
revised and updated from time to time as appropriate.
All the powers of the Board have been duly exercised and decisions on material transactions, including
appointment and determination of remuneration and terms and conditions of employment of the Chief Executive
has been taken by the Board.
During the year four meetings of the Board were held, which were all presided over by the Chairman and the
Board met at least once in every quarter. Written notices of the Board meetings, along with agenda and working
papers, were circulated seven days before the meetings. The minutes of the Board meetings were appropriately
recorded, circulated within 14 days from the date of meetings and signed by the Chairman.
All material information as required under the relevant rules has been provided to the stock exchanges and to the
Securities & Exchange Commission of Pakistan within the prescribed time limit.
Orientation courses for Directors and Executives were arranged to apprise them of their duties and
responsibilities.
The Board approves appointment of CFO, Company Secretary and Head of Internal Audit, including their
remuneration and terms and conditions of employment, as determined by the Chief Executive.
The Directors' Report for the year has been prepared in compliance with the requirements of the Code and fully
describes the salient matters required to be disclosed.
The financial statements of the Company were duly endorsed by the Chief Executive and CFO before approval of
the Board. The half-yearly and annual financial statements were also initialed by the external auditors before
presentation to the Board.
1
2
3
4
5
6
7
8
9
10
11
12
13
STATEMENT OF COMPLIANCE WITH THECODE OF CORPORATE GOVERNANCE
Statement of Compliance with the Code of Corporate Governance
dh Annual Report 2009
68
14
15
16
17
18
19
20
21
22
The Directors, Chief Executive and Executives do not hold any interest in the shares of the Company other than
that disclosed in the pattern of shareholding.
The Company has complied with all the corporate and financial reporting requirements of the Code.
The Board has formed an audit committee. It comprises of four members, majority of whom are non-executive
Directors.
The meetings of the Audit Committee were held at least once in every quarter prior to the approval of interim and final results of the Company and as required by the Code. The terms of reference of the committee have been
formed and advised to the Committee for compliance.
The Board has setup an effective internal audit function. The function is managed by suitably qualified staff,
involved in the internal audit function on a full time basis.
All related party transactions entered during the year were on arm's length basis and these have been placed
before the Audit Committee and Board of Directors. These transactions are duly reviewed and approved by the
Audit Committee and Board of Directors.
The statutory auditors of the Company have confirmed that they have been given a satisfactory rating under the
Quality Control Review Program of the Institute of Chartered Accountants of Pakistan and that they or any of the
partners of the firm, their spouses and minor children do not hold shares of the Company and that the firm and all
its partners are in compliance with the International Federation of Accountants (IFAC) guidelines on code of ethics
as adopted by the Institute of Chartered Accountants of Pakistan.
The statutory auditors or the persons associated with them have not been appointed to provide other services
except in accordance with the listing regulations and the auditors have confirmed that they have observed IFAC
guidelines in this regard.
We confirm that all other material principles contained in the Code have been complied with.
rd23 January 2010
Statement of Compliance with the Code of Corporate Governance
Karachi Shahzada Dawood
Chief Executive
dh Annual Report 2009
69
We have audited the annexed balance sheet of Dawood Hercules Chemicals Limited (“the Company”) as at 31 December 2009 and the related profit and loss account, statement of comprehensive income, cash flow statement and statement of changes in equity together with the notes forming part thereof, for the year then ended and we state that we have obtained all the information and explanations which, to the best of our knowledge and belief, were necessary for the purposes of our audit.
It is the responsibility of the Company's management to establish and maintain a system of internal control, and prepare and present the above said statements in conformity with the approved accounting standards and the requirements of the Companies Ordinance, 1984. Our responsibility is to express an opinion on these statements based on our audit.
We conducted our audit in accordance with auditing standards as applicable in Pakistan. These standards require that we plan and perform the audit to obtain reasonable assurance about whether the above said statements are free of any material misstatement. An audit includes examining, on a test basis, evidence supporting the amounts and disclosures in the above said statements. An audit also includes assessing the accounting policies and significant estimates made by management, as well as, evaluating the overall presentation of the above said statements. We believe that our audit provides a reasonable basis for our opinion and, after due verification, we report that:
a) in our opinion, proper books of account have been kept by the Company as required by the Companies Ordinance, 1984;
b) in our opinion:
i) the balance sheet and profit and loss account together with the notes thereon have been drawn up in conformity with the Companies Ordinance, 1984, and are in agreement with the books of account and are further in accordance with accounting policies consistently applied except for changes referred to in note 2.2 to the financial statements with which we concur;
ii) the expenditure incurred during the year was for the purpose of the Company's business; and
iii) the business conducted, investments made and the expenditure incurred during the year were in accordance with the objects of the Company;
c) in our opinion and to the best of our information and according to the explanations given to us, the balance sheet, profit and loss account, statement of comprehensive income, cash flow statement and statement of changes in equity together with the notes forming part thereof conform with approved accounting standards as applicable in Pakistan, and, give the information required by the Companies Ordinance, 1984, in the manner so required and respectively give a true and fair view of the state of the Company's affairs as at 31 December 2009
` and of the loss, its comprehensive income, its cash flows and changes in equity for the year then ended; and
d) in our opinion Zakat deductible at source under the Zakat and Ushr Ordinance, 1980, was deducted by the Company and deposited in the Central Zakat Fund established under section 7 of that Ordinance.
Auditors' Report to the Members
Lahore:rd23 January 2010
KPMG Taseer Hadi & Co. Chartered Accountants
dh Annual Report 2009
70 Auditors’ Report to the Members
We have reviewed the Statement of Compliance with the best practices contained in the Code of Corporate Governance prepared by the Board of Directors of Dawood Hercules Chemicals Limited (“the Company”) to comply with the Listing Regulations of Karachi, Lahore and Islamabad Stock Exchanges.
The responsibility for compliance with the Code of Corporate Governance is that of the Board of Directors of the Company. Our responsibility is to review, to the extent where such compliance can be objectively verified, whether the Statement of Compliance reflects the status of the Company's compliance with the provisions of the Code of Corporate Governance and report if it does not. A review is limited primarily to inquiries of the Company personnel and review of various documents prepared by the Company to comply with the Code. As part of our audit of financial statements we are required to obtain an understanding of the accounting and internal control systems sufficient to plan the audit and develop an effective audit approach. We have not carried out any special review of the internal control system to enable us to express an opinion as to whether the Board's statement on internal control covers all controls and the effectiveness of such internal controls.
Further, Sub- Regulation (xiii a) of Listing Regulation No. 35 (previously Regulation No. 37) notified by The Karachi Stock Exchange (Guarantee) Limited vide circular KSE/N-269 dated 19 January 2009 requires the Company to place before the Board of Directors for their consideration and approval related party transactions distinguishing between transactions carried out on terms equivalent to those that prevail in arm's length transactions and transactions which are not executed at arm's length price recording proper justification for using such alternate pricing mechanism. Further, all such transactions are also required to be separately placed before the audit committee.
We are only required and have ensured compliance of requirement to the extent of approval of related party transactions by the Board of Directors and placement of such transactions before the audit committee. We have not carried out any procedures to determine whether the related party transactions were under taken at arm's length price.
Based on our review, nothing has come to our attention which causes us to believe that the Statement of Compliance does not appropriately reflect the Company's compliance, in all material respects, with the best practices contained in the Code of Corporate Governance as applicable to the Company the year ended 31 December 2009.
Review Report to the Members on Statement of Compliancewith best practices of Code of Corporate Governance
KPMG Taseer Hadi & Co.
Chartered Accountants
Lahore:rd23 January 2010
dh Annual Report 2009
71Review Report to the Members
Karachi23 January 2010
Shahzada DawoodChief Executive
A.G. GoharDirector
PROFIT AND LOSS ACCOUNTFor the year ended 31 December 2009
Note 2009
The annexed notes 1 to 35 form an integral part of these financial statements.
5
6
7
Sales - net
Cost of sales
Gross Profit
Rupees
2008
Continuing operation
11,040,361,936 7,428,702,879
(7,080,456,675) (4,312,462,959)
3,959,905,261 3,116,239,920
Other operating income 150,966,516
509,591,425
Distribution expenses 8 (388,784,294)
(72,275,770)
Administrative expenses 9 (331,518,806)
(317,571,019)
Impairment loss 27.3 (3,791,096,493)
(100,310,990)
Other operating expenses 10 (159,508,447)
(183,934,447)
Results from operating activities (560,036,263)
2,951,739,119
Finance costs 11 (984,747,229)
(901,450,815)
(Loss)/Profit before share of associate and tax (1,544,783,492)
2,050,288,304
Share of profit from associate, net of income tax 1,331,306,662
1,850,199,953
(Loss)/Profit before tax (213,476,830)
3,900,488,257
Income tax expenses 12 (924,800,000)
(837,800,000)
(Loss)/Profit for the year from continuing operation (1,138,276,830)
3,062,688,257
(Loss)/Profit attributable to owners of the Company (1,138,276,830) 3,062,688,257
Earnings per share - basic and diluted 30 (10.41) 28.00
Rupees
dh Annual Report 2009
72 Profit and Loss Account
STATEMENT OF COMPREHENSIVE INCOMEFor the year ended 31 December 2009
2009
The annexed notes 1 to 35 form an integral part of these financial statements.
(Loss)/Profit for the year (1,138,276,830)
Adjustment arising from measurement to fair value of investment and others 339,462,639
Fair value reserve transferred to profit and loss account on disposal of investments
Other Comprehensive Income net of tax 339,462,639
Total Comprehensive Income for the year (798,814,191)
Rupees
2008
3,062,688,257
(4,127,014,788)
(218,609,980)
(4,345,624,768)
(1,282,936,511)
-
Rupees
Karachi23 January 2010
Shahzada DawoodChief Executive
A.G. GoharDirector
dh Annual Report 2009
73Statement of Comprehensive Income
LIABILITIES
SHARE CAPITAL AND RESERVESAuthorized capital
1,000,000,000 ordinary shares of Rs. 10 each
NON CURRENT LIABILITIES
CURRENT LIABILITIES
CONTINGENCIES AND COMMITMENTS 19
10,000,000,000
10,000,000,000
BALANCE SHEETAs at 31 December 2009
Note 2009 2008
Rupees
14
15
16
17
18
Issued, subscribed and paid up capital
Revenue reserves
Fair value reserve
Long term loans
Deferred taxation
Staff retirement and other service benefits
Short term financing - secured
Trade and other payables
Accrued markup
Provision for taxation
1,093,834,360
20,415,396,327
(4,126,573,941)
17,382,656,746
6,302,500,000
327,700,000
40,162,519
6,670,362,519
70,139,213
538,132,695
275,848,576
693,000,000
1,577,120,484
25,630,139,749
1,093,834,360
18,784,894,035
3,985,191
19,882,713,586
6,302,500,000
394,500,000
44,595,036
6,741,595,036
1,196,603,573
648,227,335
280,268,454
858,000,000
2,983,099,362
29,607,407,984
The annexed notes 1 to 35 form an integral part of these financial statements.
13
Rupees
Karachi23 January 2010
Shahzada DawoodChief Executive
A.G. GoharDirector
dh Annual Report 2009
74 Balance Sheet
ASSETS
NON - CURRENT ASSETS
FIXED CAPITAL EXPENDITURE
Property, plant and equipment
Capital work in progress
INVESTMENT IN ASSOCIATE
LONG TERM LOANS AND ADVANCES
CURRENT ASSETS
Stores, spares and loose tools
Stock in trade
Trade debts
Loans, advances, deposits, prepayments and
other receivables
Advance income tax
Short term investments
Cash and bank balances
BALANCE SHEET
The annexed notes 1 to 35 form an integral part of these financial statements.
BALANCE SHEETAs at 31 December 2009
Note 20082009
20
21
22
23
24
25
26
27
28
1,340,587,535
734,408,738
2,074,996,273
21,543,286,520
2,423,235
1,303,296,999
83,285,699
10,028,308
92,723,661
819,907,916
3,399,312,900
278,146,473
5,986,701,956
29,607,407,984
1,328,779,975
67,553,966
1,396,333,941
19,205,628,008
1,259,750
1,025,764,636
89,568,216
8,821,267
72,251,421
663,149,343
2,233,424,979
933,938,188
5,026,918,050
25,630,139,749
Rupees Rupees
Karachi23 January 2010
Shahzada DawoodChief Executive
A.G. GoharDirector
-
dh Annual Report 2009
75Balance Sheet
CASH FLOW STATEMENTFor the year ended 31 December 2009
The annexed notes 1 to 35 form an integral part of these financial statements.
Cash flow from operating activities
(Loss) / Profit before taxation
Adjustment for non cash expenses and other items:
Depreciation
Finance costs
Profit on sale of property, plant and equipment
Profit before working capital changes
Working capital changes
(Increase)/decrease in current assets:
28
2008 2009
Rupees
Note
Profit on sale of short term investments available for sale
Unrealized (gain)/loss due to fair value adjustment of investment at fair value through profit or loss
Impairment loss on available for sale investments
Share of profit of associate, net of tax
Dividend income
Provision for staff retirement and other service benefits
(213,476,830)
149,784,249
984,747,229
(3,169,502)
(27,467,091)
(14,821,940)
3,791,096,493
(1,331,306,662)
-
20,637,816
3,569,500,592
3,356,023,762
3,900,488,257
140,571,813
901,450,815
(135,709)
(88,968,571)
3,891,637
100,310,990
(1,850,199,953)
(351,548,225)
47,136,679
(1,097,490,524)
2,802,997,733
Stocks, stores and spares
Trade debtors
Loans, advances, prepayments and other receivables
Increase/(decrease) in current liabilities:
Trade and other payables
Cash generated from operations
Finance costs paid
Taxes paid
Staff retirement and other service benefits paid
(Increase) in long term loans and advances
Net cash inflow from operating activities
(271,249,846)
(1,207,041)
(20,472,240)
108,428,021
(184,501,106)
3,171,522,656
(980,327,351)
(849,758,573)
(16,205,299)
(1,163,485)
1,324,067,948
645,431,803
(4,078,784)
(6,833,364)
24,671,615 659,191,270
3,462,189,003
(875,038,320)
(765,816,009)
(60,327,967)
(146,625)
1,760,860,082
Cash flow from investing activities
Fixed capital expenditure (833,174,164)
(163,260,995)
Proceeds from sale of property, plant and equipment 7,897,085
519,583
Proceeds from disposal of available for sale short-term investments 1,145,648,750 573,313,944
Proceeds from disposal of investments at fair value through profit or loss - 4,199,230,015
Investment at fair value through profit and loss (1,929,785,000) (3,508,904,290)
Investment in associated company (1,623,148,150) (1,291,140,550)
Dividends received 616,796,300 897,516,243
Net cash (outflow) / inflow from investing activities (2,615,765,179) 707,273,950
Cash flow from financing activities
Short term financing 1,126,464,360 (2,211,288,896)
Long term loans - (197,500,000)
Dividends paid (490,558,844) (223,231,063)
Net cash inflow/(outflow) from financing activities 635,905,516 (2,632,019,959)
Net decrease in cash and cash equivalents (655,791,715) (163,885,927)
Cash and cash equivalents at the beginning of year 933,938,188 1,097,824,115
Cash and cash equivalents at the end of year 278,146,473 933,938,188
Rupees
Karachi23 January 2010
Shahzada DawoodChief Executive
A.G. GoharDirector
dh Annual Report 2009
76 Cash Flow Statement
Generalreserve
Unappropriatedprofit
Revenue reserves
Total
STATEMENT OF CHANGES IN EQUITYFor the year ended 31 December 2009
Balance as on 31 December 2007
Comprehensive income for the year
Final cash dividend @15% for the year ended 31 December 2007
Final stock dividend @ 20 % for the year ended 31 December 2007
1st interim stock dividend @ 10% for the year ended 31 December 2008
1st interim cash dividend @ 10% for the year ended 31 December 2008
Balance as on 31 December 2008
Comprehensive income for the year
Final cash dividend @15% for the year ended 31 December 2008
1st interim cash dividend @ 15% for the year ended 31 December 2009
2nd interim cash dividend @ 15% for the year ended 31 December 2009
Balance as on 31 December 2009
828,662,400
-
-
165,732,480
99,439,480
-
265,171,960
1,093,834,360
-
-
-
-
-
-
1,093,834,360
700,000,000
-
-
-
-
-
-
700,000,000
-
-
-
-
-
-
700,000,000
17,141,618,878
3,062,688,257
(124,299,360)
(165,732,480)
(99,439,480)
(99,439,488)
(488,910,808)
19,715,396,327
(1,138,276,830)
(1,138,276,830)
(164,075,154)
(164,075,154)
(164,075,154)
(492,225,462)
18,084,894,035
17,841,618,878
3,062,688,257
(124,299,360)
(165,732,480)
(99,439,480)
(99,439,488)
(488,910,808)
20,415,396,327
(1,138,276,830)
(1,138,276,830)
(164,075,154)
(164,075,154)
(164,075,154)
(492,225,462)
18,784,894,035
219,050,827
(4,345,624,768)
-
-
-
-
-
(4,126,573,941)
339,462,639
4,130,559,132
-
-
-
-
3,985,191
18,889,332,105
(1,282,936,511)
(124,299,360)
-
-
(99,439,488)
(223,738,848)
17,382,656,746
(798,814,191)
Impairment on available for sale investment transferred to profit
and loss account as permitted under SRO 150(1)/2009 (Note# 27.3) - - - - 3,791,096,493 3,791,096,493
2,992,282,302
(164,075,154)
(164,075,154)
(164,075,154)
(492,225,462)
19,882,713,586
Sharecapital
Fair valuereserve
Total
Rupees
Karachi23 January 2010
Shahzada DawoodChief Executive
A.G. GoharDirector
The annexed notes 1 to 35 form an integral part of these financial statements.
dh Annual Report 2009
77Statement of Changes in Equity
1 LEGAL STATUS AND NATURE OF BUSINESS
2 BASIS OF PREPARATION
2.1 Statement of compliance
2.2 Change in accounting policies
2.3 Standards, interpretations and amendments to published approved accounting standards
Effective in current year
“Effective but not relevant”
Dawood Hercules Chemicals Limited ("the Company") is a public limited company. It was incorporated in Pakistan in 1968 under the Companies, Act 1913 (now the Companies Ordinance, 1984) and is listed on Karachi, Lahore and Islamabad Stock Exchanges. The principal activity of the Company is production, purchase and sale of fertilizer. The registered office of the Company is situated at 35-A, Shahrah-e-Abdul Hameed Bin Baadees, Lahore.
These financial statements have been prepared in accordance with approved accounting standards as applicable in Pakistan. Approved accounting standards comprise of such International Financial Reporting Standards (IFRS) issued by the International Accounting Standards Board as are notified under the Companies Ordinance, 1984, provisions of and directives issued under the Companies Ordinance, 1984. In case requirements differ, the provisions or directives of the Companies Ordinance, 1984 shall prevail.
Starting 01 January 2009, the Company has changed its accounting policies in the following areas:
IAS 1 (revised), ‘Presentation of Financial Statements’. The revised standard prohibits the presentation of items of income and expenses (that is ‘non-owner changes in equity’) in the statement of changes in equity, requiring ‘non-owner changes in equity’ to be presented separately from owner changes in equity. All ‘non- owner changes in equity’ are required to be shown in a performance statement. Companies can choose whether to present one performance statement (the statement of comprehensive income) or two statements (profit and loss account and statement of comprehensive income).
The Company has preferred to present two statements; a profit and loss account and a statement of comprehensive income. The financial statements have been prepared under the revised disclosure requirements.
The SECP vide S.R.O. 411 (1) / 2008 dated 28 April 2008 notified the adoption of IFRS 7 ‘Financial Instruments: Disclosures’. IFRS 7 is mandatory for Company’s accounting periods beginning on or after the date of notification i.e. 28 April 2008. IFRS 7 has superseded IAS 30 ' Disclosures in Financial Statements of Banks and Similar Financial Institutions' and disclosure requirements of IAS 32, ' Financial Instruments: Presentation' . Adoption of IFRS has only impacted the format and extent of disclosures presented in the financial statements.
Following new standards and amendments to standards are mandatory for the first time for the financial year beginning 1 January 2009 and are also relevant to the Company. However, the adoption of these new standards and amendments to standards did not have any significant impact on the financial statements of the Company.
IFRS 2 (Amendment), Share based payment;IFRS 8 Operating segments;IAS 23 (Amendment) Borrowing costs;IAS 28 (Amendment) Investment in associates;IAS 36 (Amendment) Impairment of assets;
NOTES TO THE FINANCIAL STATEMENTSFor the year ended 31 December 2009
dh Annual Report 2009
78 Notes to the Financial Statements
IAS 38 (Amendment) Intangible assets; IAS 39 (Amendment) Embedded derivatives;IFRIC 4 Insurance contracts;IFRIC 13 Customers loyalty programmes;IFRIC 15 Agreement for the construction of real estate; IFRIC 16 Hedges of a net investment in a foreign operation; andIAS 41 Agriculture
The following standards, amendments and interpretations of approved accounting standards will be effective for accounting periods beginning on or after 1 January 2010.
IFRS 3 (Revised) Business combinations;IAS 27 (Revised) Consolidated and separate financial statements;IAS 39 (Amendments) Financial instruments: recognition and measurement;IFRIC 15 Agreement for the construction of real estate;IFRIC 17 Distributions of non-cash assets to owners;IFRS 5 (Amendments) - improvements to IFRSs - IFRS 5 Non-current assets held for sale and discontinued operations.
These financial statements have been prepared on the basis of historical cost convention, except for revaluation of certain financial instruments at fair value and recognition of certain employee retirement benefits at present value.
The preparation of financial statements in conformity with approved accounting standards requires management to make judgments, estimates and assumptions that affect the application of policies and reported amounts of assets and liabilities, income and expenses. The estimates and associated assumptions and judgments are based on historical experience and various other factors that are believed to be reasonable under the circumstances, the result of which form the basis of making the judgments about carrying values of assets and liabilities that are not readily apparent from other sources. Actual results may differ from these estimates.
The estimates and underlying assumptions are reviewed on an ongoing basis. Revision to accounting estimates are recognized in the period in which the estimate is revised if the revision affects only that period, or in the period of revision and future periods if the revision effects both current and future periods. The areas where various assumptions and estimates are significant to Company's financial statements or where judgments were exercised in application of accounting policies are:
Noteretirement and other benefits 4.2residual value and useful life of depreciable assets 4.3provision for taxation 4.6provisions and contingencies 4.13
Revenue represents the fair value of the consideration received or receivable for goods sold, net of discounts and sales tax. Revenue is recognized when it is probable that the economic benefits associated with the transaction will flow to the Company and the amount of revenue, and the associated cost incurred, or to be incurred, can be measured reliably.
Revenue from sale of goods is recognized when the significant risk and rewards of ownership of the goods are transferred to the buyer.
Return on deposits is accrued on a time proportion basis by reference to the principal outstanding and the applicable rate of return.
Dividend income is recognized as income when the right of receipt is established.
Standard, amendments and interpretations effective in 2010
3 BASIS OF MEASUREMENT
4 SIGNIFICANT ACCOUNTING POLICIES
4.1 Revenue Recognition
-
dh Annual Report 2009
79Notes to the Financial Statements
The Company operates an approved funded defined benefit gratuity plan for management staff having a service period of more than five years . Provisions are made in the financial statements to cover obligations on the basis of actuarial valuations carried out annually. The most recent valuation was carried out on 31 December 2009 using the "Projected Unit Credit Method".
The amount recognized in balance sheet represents the present value of the defined benefit obligation as on 31 December 2009 as adjusted for unrecognized actuarial gains and losses.
Cumulative net unrecognized actuarial gains and losses at the end of the previous year which exceed 10% of the greater of the present value of the Company obligations and the fair value of plan assets are amortized over the expected average working lives of the participating employees.
Provisions are made annually to cover the obligation for accumulating compensated absences based on actuarial valuation and are charged to profit and loss. The most recent valuation was carried out on 31 December 2009 using the "Projected Unit Credit Method".
The amount recognized in the balance sheet represents the present value of the defined benefit obligations. Actuarial gains and losses are charged to income immediately in the period when these occur.
The Company maintains a defined contributory Gratuity Fund for its non-management staff. Monthly contributions are made to the fund by the Company as per agreement with the Union.
The Company also operates approved contributory provident funds for all employees. Equal contribution is made both by employees and the Company. The funds are administrated by the Trustees.
Property, plant and equipment except freehold land are stated at cost less accumulated depreciation and any identified impairment loss. Freehold land is stated at cost less any identified impairment loss.
The Company provides depreciation under the "straight line method" so as to write off the historical cost of the asset over its estimated useful life at the following rates:
Depreciation is provided at the above rates subject to 1% retention of the original cost except for Catalysts, which are fully depreciated over their estimated useful lives.
4.2 Retirement and other benefits
Defined benefit plan- Gratuity
Accumulated compensated absences
Other benefits
Defined contribution plan
Provident Fund
4.3 Fixed capital expenditure
Property, plant and equipment
Percentage
Buildings on freehold land 5
Railway siding 5
Plant and machinery 7.5
Furniture 10
Fittings and equipment 12.5
Motor vehicles 20
Data processing equipment 33.33
Catalysts 10 to 50
dh Annual Report 2009
80 Notes to the Financial Statements
Assets residual values' and useful lives' are reviewed at each financial year end and adjusted if impact on depreciation is significant.
Depreciation is charged on prorata basis on additions from the following month in which the asset is put to use and on disposals up to the month of disposal.
The Company assesses at each balance sheet date whether there is any indication that property, plant and equipment may be impaired. If such indication exists, the carrying amounts of such assets are reviewed to assess whether they are recorded in excess of their recoverable amount. Where carrying values exceed the respective recoverable amount, assets are written down to their recoverable amounts and the resulting impairment loss is recognized in income currently. The recoverable amount is the higher of an asset's fair value less costs to sell and value in use. Where an impairment loss is recognized, the depreciation charge is adjusted in the future periods to allocate the asset's revised carrying amount over its estimated useful life.
Subsequent costs are included in the asset's carrying amount or recognized as a separate asset, as appropriate, only when it is probable that future economic benefits associated with the item will flow to the Company and the cost of the item can be measured reliably. All other repair and maintenance costs are charged to income during the period in which they are incurred.
The initial catalysts cost in Ammonia plant was capitalized with plant and machinery whereas costs of subsequent replacement of such catalysts are separately included in property, plant and equipment and depreciated over their estimated useful life.
The gain or loss on disposal or retirement of an asset represented by the difference between the sale proceeds and the carrying amount of the asset is recognized as an income or expense.
Capital work in progress is stated at cost less any identified impairment loss and represents expenditure incurred on property, plant and equipment during the construction and installation. Cost also includes applicable borrowing costs. Transfers are made to relevant property, plant and equipment category as and when assets are available for use.
Inventories are valued at lower of cost and net realizable value. Cost is determined as follows:
Cost of work in process and finished goods comprises of cost of direct materials, labour and appropriate manufacturing overheads.
Net realisable value signifies the estimated selling price in the ordinary course of business less costs of completion and selling expenses.
All monetary assets and liabilities in foreign currencies are translated into rupees at exchange rates prevailing at the balance sheet date. Transactions in foreign currencies are translated into rupees at exchange rates prevailing at the date of transaction. Non-monetary assets and liabilities that are measured in terms of historical cost in a foreign currency are translated into rupees at exchange rates prevailing at the date of transaction. Non-monetary assets and liabilities denominated in foreign currency that are stated at fair value
Capital work-in-progress
4.4 Inventories
4.5 Foreign Currencies
Stocks
Raw material at moving average cost
Materials in process at average cost
Finished goods at average cost
Stores, spares and loose tools
Stores and spares in transit
at moving average cost. Items which are identified asslow moving and are surplus to the Company's requirements are written down to their estimated net realisable value.
at cost, comprising invoice value plus other charges incurred thereon.
-
dh Annual Report 2009
81Notes to the Financial Statements
are translated into rupees at exchange rates prevailing at the date when fair values are determined. Exchange gains and losses are included in the income currently.
Income tax expense comprise current and deferred tax. Income tax is recognized in profit and loss except to the extent that it relates to items recognized directly in equity, in which case it is recognized in equity.
Provision of current tax is based on the taxable income for the year determined in accordance with the prevailing law for taxation of income. The charge for current tax is calculated using prevailing tax rates or tax rates expected to apply to the profit for the year if enacted after taking into account tax credits, rebates and exemptions, if any. The charge for current tax also includes adjustments, where considered necessary, to provision for tax made in previous years arising from assessments framed during the year for such years.
Deferred tax is accounted for using the balance sheet liability method in respect of all temporary differences arising from differences between the carrying amount of assets and liabilities in the financial statements and the corresponding tax bases used in the computation of the taxable profit. Deferred tax liabilities are generally recognized for all taxable temporary differences and deferred tax assets are recognized to the extent that it is probable that taxable profits will be available against which the deductible temporary differences, unused tax losses and tax credits can be utilised.
Deferred tax assets and liabilities are calculated at the rates that are expected to apply to the period when the asset is realized or the liability is settled, based on the tax rates (and tax laws) that have been enacted or substantively enacted by the balance sheet date. Deferred tax is charged or credited to the income statement, except in the case of items credited or charged to equity in which case it is included in equity.
Associated companies, where the Company holds 20% or more of the voting power of the investee company and where the Company has significant influence, but not control, over the financial and operating policies, are accounted for using the equity method.
The financial statements of the Company include the Company's share of the income and expenses of the associate accounted for under equity method, after adjustments, if required, to align the accounting policies of associate with those of the Company from the date when significant influence is established until the date when that significant influence ceases. When the Company's share of losses exceed its interest in associate accounted for under equity method, the carrying amount of that interest is reduced to zero and recognition of further losses is discontinued except to the extent that the Company has an obligation or has made payments on behalf of the investee.
Unrealised gains arising from transactions, if any, with the associate accounted for under equity method are eliminated against the investment to the extent of the Company's interest in the associate. Unrealised losses are eliminated in the same way as unrealised gains, but only to the extent that there is no evidence of impairment.
Investments which are intended to be held for an indefinite period of time but may be sold in response to the need for liquidity are classified as available for sale. Available for sale investments are recognized initially at cost being the fair value of the consideration given plus any directly attributable transaction costs. After initial recognition, these are stated at fair values unless fair values can not be measured reliably, with any resulting gains and losses being taken directly to equity until the investment is disposed or impaired. At each reporting date, these investments are remeasured at fair value, unless fair value cannot be reliably measured. At the time of disposal, the respective surplus or deficit is transferred to income currently. Fair value of quoted investments is their bid price on Karachi Stock Exchange at the balance sheet date.
4.6 Taxation
Current
Deferred
4.7 Investments
Investment in Associate
Available for Sale Investments
dh Annual Report 2009
82 Notes to the Financial Statements
Unquoted investments, where active market does not exist, are carried at cost as it is not possible to apply any other valuation methodology.
Investments intended to be held for less than twelve months from the balance sheet date or to be sold to raise operating capital, are included in current assets, all other investments are classified as non-current.
Management determines the appropriate classification of its investments at the time of the purchase and re-evaluates such designation on a regular basis.
All purchases and sales of investments are recognized on the trade date which is the date that the Company commits to purchase or sell the investment.
Available for sale investments are tested for impairment at each reporting date. Investments are considered to be impaired if there is a significant or prolonged decline in the fair value of the investments at the reporting date.
Investments which are acquired principally for the purpose of generating profits from short term fluctuations in price or dealer margin are classified as “Investments at fair value through profit or loss” these are initially recognized on trade date at cost being the fair value of the consideration given and derecognized by the Company on the date it commits to sell them off. Transaction costs are charged to profit and loss account as and when incurred. At each balance sheet date, fair value is determined on the basis of year-end bid prices obtained from stock exchange quotations. Any resultant increase/(decrease) in fair value is recognized in the profit and loss account for the year.
Financial assets and liabilities are recognized when the Company becomes a party to the contractual provisions of the instrument. All financial assets and liabilities are initially measured at cost, which is the fair value of the consideration given and received respectively. These financial assets and liabilities are subsequently measured at fair value, amortised cost or cost, as the case may be. The particular measurement methods adopted are disclosed in the individual policy statements associated with each item. The Company derecognizes the financial asset and financial liability when it ceases to be a party to such contractual provisions of the instrument.
A financial asset and a financial liability is offset and the net amount is reported in the balance sheet if the Company has a legally enforceable right to set-off the recognized amounts and intends either to settle on a net basis or to realize the asset and settle the liability simultaneously.
Trade debts are recognized initially at original invoice amount which is the fair value of consideration to be received in future and subsequently measured at amortized cost less an estimate made for doubtful debts based on a review of all outstanding amounts at the year end. A provision for impairment of trade debts is established when there is objective evidence that the Company will not be able to collect all amounts due according to the original terms of receivables. Bad debts are written off when identified.
Cash and cash equivalents are carried in the balance sheet at cost. For the purpose of cash flow statement, cash and cash equivalents comprise cash in hand and cash with banks in current and saving accounts.
Liabilities for trade and other amounts payable are initially recognized at cost which is the fair value of the consideration to be paid in future for goods and services and subsequently at amortized cost using effective interest rate method.
Investments at fair value through profit or loss
4.8 Financial Assets and Liabilities
4.9 Offsetting of Financial Assets and Liabilities
4.10 Trade Debts
4.11 Cash and Cash Equivalents
4.12 Trade and Other Payables
-
dh Annual Report 2009
83Notes to the Financial Statements
Provisions are recognized when the Company has a legal or constructive obligation as a result of past events and it is probable that an outflow of resources embodying economic benefits will be required to settle the obligation and a reliable estimate of the amount can be made. However, provisions are reviewed at each balance sheet date and adjusted to reflect current best estimate.
Mark-up, interest and other charges on borrowings are capitalised up to the date of commissioning of the related property, plant and equipment acquired out of the proceeds of such borrowings. All other mark-up, interest and other charges are charged to income in the period in which they are incurred.
The Company assesses at each balance sheet date, whether there is any indication that asset may be impaired. If such an indication exists, the carrying amount of such assets is reviewed to assess whether they are recorded in excess of their recoverable amount. Where carrying values exceed their respective recoverable amounts, assets are written down to their recoverable amount and resulting impairment loss is recognised in income currently. The recoverable amount is higher of an asset’s fair value less costs to sell and value in use.
The Company enters into transactions with related parties on an arm's length basis. Prices for transactions with related parties are determined using admissible valuation methods, except in extremely rare circumstances where, subject to approval of the Board of Directors, it is in the interest of the Company to do so.
Dividend distribution to the Company's shareholders is recognized as a liability in the period in which the dividends are approved.
4.13 Provisions
4.14 Borrowing Costs
4.15 Impairment
4.16 Related party transactions
4.17 Dividend
5 SALES - NET
Own manufactured 7,369,483,426
6,381,652,996
Less: Sales tax 21,119,946
222,546,528
7,348,363,480
6,159,106,468
Purchased product 3,691,998,456
1,283,552,991
Less: Sales tax - 13,956,580
3,691,998,456 1,269,596,411
11,040,361,936 7,428,702,879
20082009
RupeesRupees
dh Annual Report 2009
84 Notes to the Financial Statements
6 COST OF SALES
6.2 Salaries, wages, benefits and staff welfare include Rs. 9.650 million (2008: Rs. 7.582 million) in respect of contribution to staff gratuity funds and Rs. 17.367 million (2008: Rs. 14.244 million) in respect of provident funds.
Raw and packing materials consumed 6.1 1,721,209,295
1,585,352,674 Fuel and power 1,043,770,526
860,132,540
Catalysts and chemicals 50,456,381
37,009,876
Salaries, wages, benefits and staff welfare 6.2 507,907,809
487,080,799
Stores and spares consumed 341,250,736
241,688,565
Repairs and maintenance 101,020,126
51,759,132
Travel and conveyance 56,767,935
49,065,658
Rent, rates and taxes 2,216,075
2,191,778
Insurance 22,610,268
22,243,496
Depreciation 20 131,272,508
123,586,514
Communication, stationery and office supplies 3,537,426
3,236,669
Other expenses 10,537,808
7,999,709
3,992,556,893
3,471,347,410
Add: Opening stock of work-in-process 8,033,236
9,643,989
Less: Closing stock of work-in-process 25 10,366,776
8,033,236
(2,333,540)
1,610,753
Cost of goods manufactured 3,990,223,353
3,472,958,163
Add: Opening stock of finished goods 50,092,662
150,131,038
Less: Closing stock of finished goods 25 58,218,429
50,092,662
(8,125,767)
100,038,376
Cost of sales - Own manufactured 3,982,097,586 3,572,996,539
Purchased product 3,098,359,089 739,466,420
Cost of sales 7,080,456,675 4,312,462,959
20082009
6.1 Raw and packing materials consumed
Opening stock 31,442,318
3,777,142
Add: Purchases 1,704,467,471
1,613,017,850 1,735,909,789
1,616,794,992
Less: Closing stock 25 14,700,494
31,442,318
1,721,209,295 1,585,352,674
Note
Rupees Rupees
dh Annual Report 2009
85Notes to the Financial Statements
Salaries, wages, benefits and staff welfare include Rs. 0.710 million (2008: Rs.Nil) in respect of provident funds.
8.1
7 OTHER OPERATING INCOME
Income from financial assets
Realized gain on disposal of short term investments available for sale 4,194,400
Realized gain on disposal of investments at fair value through profit or loss 23,272,691
Unrealized gain/(loss) due to fair value adjustment of investment at fair value through profit or loss
14,821,940
Profit on bank deposits 63,670,466
105,959,497
Income from related parties
Dividend income from
Sui Northern Gas Pipelines Limited -
Income from non-financial assets
Sale of scrap 8,976,392
Gain on redemption of Sukuks from Meezan Islamic Income fund -
Profit on sale of property, plant and equipment 3,169,502
Compensation received from income tax department 21,109,516
Liabilities no longer payable written back 1,471,637
Other income 10,279,972
45,007,019
150,966,516
8 DISTRIBUTION EXPENSES
Product transportation and handling cost 328,664,215
Salaries, wages, benefits and staff welfare 8.1 43,844,495
Communication, stationery and office supplies 1,796,262
Rent, rates and taxes 3,440,927
Travel and conveyance 2,836,649
Repairs and maintenance 1,282,000
Sales promotion, advertising and market development 6,886,906
Other expenses 32,840
388,784,294
48,241,570
40,727,001
(3,891,637)
41,648,350
126,725,284
351,548,225
11,116,520
15,331,925
135,709
-
-
4,733,762
31,317,916
509,591,425
40,686,140
21,750,309
697,431
1,265,726
528,962
470,065
6,855,445
21,692
72,275,770
20082009
Note9 ADMINISTRATIVE EXPENSES
Salaries, wages, benefits and staff welfare 9.1 178,015,489
169,111,296
Communication, stationery and office supplies 37,793,850
45,791,858
Rent, rates and taxes 24,870,464
28,690,192
Travel and conveyance 22,490,802
25,658,650
Repairs and maintenance 24,912,600
18,183,303
Depreciation 20 18,511,741
16,985,299
Legal and professional charges 11,528,750
2,175,801
Insurance 2,034,690
331,162
Donations 868,333
962,799
Other expenses 10,492,087 9,680,659
331,518,806 317,571,019
20082009
Note
Rupees Rupees
Rupees Rupees
dh Annual Report 2009
86 Notes to the Financial Statements
9.1
9.2
10 OTHER OPERATING EXPENSES
11 FINANCE COSTS
12 INCOME TAX EXPENSES
13 ISSUED, SUBSCRIBED AND PAID UP CAPITAL
Salaries, wages, benefits and staff welfare include Rs. 4.318 million (2008: Rs. 3.735 million) in respect of contribution to staff gratuity funds and Rs. 7.649 million (2008: Rs. 6.327 million) in respect of provident funds.
None of the Directors of the Company or any of their spouses have any interest in or are otherwise associated with any of the recipients of donations made by the Company during the year.
The provision for workers' profits participation fund is based on profits caused by business and trade, and excludes other income in accordance with the law, as advised by the legal advisors of the Company.
In view of accounting loss, tax reconciliation has not been presented for the current year.
Workers' profits participation fund 18.3 112,702,447 91,210,941
Workers' welfare fund 18 46,000,000 92,000,000
Auditors' remuneration:
Audit fee 600,000 600,000
Half year review and other certifications 150,000
80,000
Out of pocket expenses 56,000
43,506
159,508,447
183,934,447
20082009Note
Mark-up:
Short term borrowings 100,314,620 90,811,676
Long term loans 884,171,679 810,593,802
Interest on workers' profits participation fund 18.3 260,930 45,337
984,747,229 901,450,815
2008 2009Note
Current - for the year 858,000,000
693,000,000
Deferred 66,800,000
144,800,000
924,800,000
837,800,000
% %12.1 Reconciliation of tax charge for the year
Applicable tax rate 35.00 35.00
Tax effect of amounts that are not deductible for tax purposes - 1.35
Tax effect of amounts exempt from tax -
(0.76)
Tax effect of amount taxed at lower rate -
(2.25)
Tax effect of associate -
(11.86)
-
21.48
20082009
13,900,000 Ordinary shares of Rs. 10 each fully paid in cash 139,000,000 139,000,000
95,483,436
Ordinary shares of Rs. 10 each issued as bonus shares 954,834,360
Participatory redeemable capital represents Islamic Sukuk certificates issued to banks/financial institution under musharaka arrangements. The facility is secured by a first charge created by way of hypothecation over the specific fixed assets of the Company up to the extent of Rs. 7.72 billion, comprising various machinery of urea and ammonia plant. The facility carries mark-up at average six months ask side KIBOR plus 120 bps payable half yearly subject to a minimum of 3.5% per annum and a maximum of 25% per annum.
13.1 Reconciliation of Issued, subscribed and paid up capital
14 LONG TERM LOANS
Participatory redeemable capital - secured
Long term loans
Participatory
14.1
14.2
Outstanding as at 01 January 109,383,436 82,866,240
Bonus shares issued during the year - 26,517,196
Closing as at 31 December 109,383,436 109,383,436
sharesNumber of
sharesNumber of
2008 2009
13.2 Shares held by related parties
17,711,795 17,711,795 Dawood Lawrencepur LimitedPercentage of equity held 16.19% (2008: 16.19%)
23,147 23,147 Dawood Corporation (Private) LimitedPercentage of equity held 0.02% (2008: 0.02%)
4,320,907 4,320,907 The Dawood FoundationPercentage of equity held 3.95% (2008: 3.95%)
3,249,946 3,249,946 Central Insurance Company LimitedPercentage of equity held 2.97% (2008: 2.97%)
35,292 35,292 Patek (Private) LimitedPercentage of equity held 0.032% (2008: 0.032%)
1,590 1,590 Sach International (Private) LimitedPercentage of equity held 0.001% (2008: 0.001%)
Opening balance 6,302,500,000 6,500,000,000
Redemption during the year - (197,500,000)
Closing balance 6,302,500,000 6,302,500,000
Rupees
2008 2009
Rupees
Banks/Financial Institution
Habib Bank Limited 60,000 3,000,000,000 3,000,000,000
Meezan Bank Limited 20,000 1,000,000,000 1,000,000,000
Allied Bank Limited 20,000
1,000,000,000
1,000,000,000
United Bank Limited 12,000
600,000,000
600,000,000
MCB Bank Limited 14,000
700,000,000
700,000,000
Meezan Tahaffuz Pension Fund 50
2,500,000
2,500,000
Total 126,050
6,302,500,000
60,000
20,000
20,000
12,000
14,000
50
126,050
6,302,500,000
2009 2008
Number of Sukuk Certificates
Number of Sukuk Certificates
Face value of Consolidated
Sukuk Certificates
Face value of Consolidated
Sukuk Certificates
RupeesRupees
dh Annual Report 2009
88 Notes to the Financial Statements
In order to protect the interest of the Certificate Holders, an investment agent (Meezan Bank Limited) has been appointed as trustee under a trust deed dated 12 September 2007 at a fee of Rs. 500,000 each year till the expiry of the agreement. In case the Company defaults on any of its obligations, the trustee may enforce the Company's obligations in accordance with the terms of the trust deed.
The principal amount is repayable according to the following schedule:
In case of default in payment, the Company will be liable to pay an markup at the rate six month KIBOR plus 200 bps per annum of the unpaid amount.
Face value of each Sukuk certificate is Rs. 50,000 which consist of 13 Sukuk units.
Under the Musharaka arrangement the Company carries a right to exercise "Call Option" to purchase all or any of the Sukuk units from certificate holders at their applicable Buy Out Prices (Pre Purchase) at any time after the expiry of one year from the issue date. The "Call Option" can be exercised by the Company after giving a prior written notice of at least thirty days of its intention to purchase all or any of the remaining Sukuk Units having aggregate face value of multiple of Rs. 100 million.
Trustee
Term of payment
Payment
Call option
15 DEFERRED TAXATION
16 STAFF RETIREMENT AND OTHER SERVICE BENEFITS
First tranche due on 17 September 2011 1,102,500
Second tranche due on 18 March 2012 2,600,000
Third tranche due on 18 September 2012 2,600,000
6,302,500
Rs. in 000’
Deferred liability arising due to accelerated depreciation allowance
Deferred liability arising due to unrealized profits from associate
Deferred (asset)/liability arising in respect of provision for leave encashment
Defined benefit plan funded for management staff
Defined contributory gratuity funded for non-management staff
184,700,000
187,500,000
225,300,000
153,800,000
(15,500,000) (13,600,000)
394,500,000 327,700,000
16.1 197,745
586,278
16.2 -
485,421
Compensated absences 16.3 44,397,291
39,090,820
44,595,036 40,162,519
2008 2009
RupeesRupees
Note
-
dh Annual Report 2009
89Notes to the Financial Statements
112,043,566
(92,607,699)
(18,849,589)
586,278
162,973
9,762,761
(9,339,456)
586,278
Rupees
101,938,100
8,594,571
10,193,810
(10,795,483)
2,112,568
112,043,566
72,006,260
7,200,626
4,000,000
9,339,456
(10,795,483)
10,856,840
92,607,699
92,607,699
- - -
92,607,699
8,594,571
10,193,810
(7,200,626)
(4,000,000)
2,175,006
9,762,761
16.1
Defined benefit plan funded - for management staff
Amounts recognized in the balance sheet are as follows:
Present value of defined benefit obligation 16.1.1 148,766,983
Fair value of plan assets 16.1.2 (106,170,992)
Unrecognized actuarial losses (42,398,246)
Liability as at 31 December 197,745
Net liability as at 01 January 586,278
Charge to profit and loss account 16.1.3 11,637,093
Contribution made by the Company (12,025,626)
Liability as at 31 December 197,745
Rupees
16.1.1 Movement in liability for defined benefit obligation
Present value of defined benefit obligation as at 01 January 112,043,566
Current service cost 12,808,298
Interest cost 16,806,535
Benefits paid during the year (9,468,560)
Actuarial loss on present value of defined benefit obligation 16,577,144
Present value of defined benefit obligation as at 31 December 148,766,983
16.1.2 Movement in fair value of plan assets
Fair value of plan assets as at 01 January 92,607,699
Expected return on plan assets 13,891,155
Funds receivable from Workers Gratuity Fund 4,936,055
Contributions made during the year 12,025,626
Benefits paid during the year (9,468,560)
Actuarial (loss)/gain on plan assets (7,820,983)
Fair value of plan assets as at 31 December 106,170,992
Plan assets consist of the following
Funds placed under mark up arrangements with banks 81,234,937
Investment company 10,000,000
Open ended mutual funds 10,000,000
Funds receivable from Workers Gratuity Fund 4,936,055
106,170,992
16.1.3 Charge to profit and loss account
Current service cost 12,808,298
Interest cost 16,806,535
Expected return on plan assets (13,891,155) Contributions receivable from workers gratuity fund (4,936,055)
Actuarial loss recognized during the year 849,470 11,637,093
2008 2009 Note
16.1.4 Actual return on plan assets of funded gratuity scheme was Rs. 6.070 million (2008: Rs. 18.057 million).
dh Annual Report 2009
90 Notes to the Financial Statements
The Company expects to pay Rs. 22.140 million as contribution to defined benefit plan in 2010.
Assumptions used for valuation of the defined benefit schemes for management staff are as under:
Average expected remaining working life time of management employees is 9 years .
16.2 Defined contributory gratuity funded for non-management staff
Net liability as at 01 January 485,421 571,396
Charge to profit and loss account 2,331,719 1,554,517
Contribution made by the Company (2,817,140) (1,640,492)
Liability as at 31 December - 485,421
16.3 Compensated absences
Opening balance 39,090,820 52,619,438
Expenses recognized during the year 16.3.3 6,669,004 35,819,401
Payments made during the year (1,362,533) (49,348,019)
Closing balance 16.3.1 44,397,291 39,090,820
20082009
Rupees Rupees
16.3.1 Movement in liability for defined benefit obligation
Present value of defined benefit obligation as at 01 January 39,090,820
52,619,438
Current service cost 2,138,459
4,278,139
Interest cost 5,863,623
5,261,944
Loss due to settlements -
24,920,892
Benefits paid during the year (1,362,533)
(49,348,019)
Actuarial loss on present value of defined benefit obligation (1,333,078) 1,358,426
Present value of defined benefit obligation as at 31 December 44,397,291 39,090,820
Note
-
dh Annual Report 2009
91Notes to the Financial Statements
This represents utilized portion of short term running finance facility available from Habib Bank Limited under mark-up arrangement. This facility aggregates Rs. 398 million (2008: Rs. 398 million) and expires on 31 December 2009, carries mark-up at the rate of one month KIBOR plus 150 bps (2008: one month KIBOR plus 200 bps) per annum. The facility is secured by pledge of shares held as investments and firsthypothecation charge of Rs. 427 million on finished goods, stores and spares. The market value of these investments as at 31 December 2009 was Rs. 595 million (2008: Rs. 515 million).
This represents balance amount of short term Murabaha finance facility availed during the year from Meezan Bank Limited to subscribe to the right issue of Engro Chemical Pakistan Limited. The facility aggregates to Rs. 800 million and expires on 19 May 2010. The facility carries markup @ 6 months KIBOR plus 40 bps payable in two equal installments and is secured against pledge of shares having market value of Rs.1,246 million (2008: Rs. Nil).
This represents balance amount of short term Murabaha finance facilities availed from Bank AL Habib Limited for import of DAP Fertilizer. The facility carries markup @ 3 months average KIBOR plus 50 bps payable in monthly instalments and expires on latest by 08 April 2010. This facility is secured against pledge of shares having market value of Rs. 2,126 million (2008:Rs. Nil).
17.1
17.2
17.3
16.3.2 Balance Sheet liability as on 31st December 2009
Present value of defined benefit obligations as on 31 December 2009 44,397,291 -
16.3.3 Charge to profit and loss account
Current service cost 2,138,459
4,278,139
Interest cost 5,863,623
5,261,944
Actuarial (gains) / loss charge (1,333,078)
1,358,426
Loss due to settlements -
24,920,892
6,669,004 35,819,401
16.3.4% per annum % per annum
Discount rate 12 15
Expected rate of eligible salary increase in future years 11 14
Assumptions used for valuation are as under:
Running finance 17.1 122,324,265 70,139,213
Murabaha finance 17.2 400,000,000 -
Murabaha finance 17.3 674,279,308 -
1,196,603,573 70,139,213
RupeesRupees
2008 2009
2008 2009
SHORT TERM FINANCING - SECURED17
RupeesRupees
2008 2009
Note
Notes to the Financial Statements
dh Annual Report 2009
92
-
18 TRADE AND OTHER PAYABLES
18.1
18.2
18.3 Workers' profits participation fund
19 CONTINGENCIES AND COMMITMENTS
19.1 Contingent liabilities
This includes amount payable to SNGPL against purchase of Sui Gas amounting to Rs. 228.111 million and amount payable to Engro Polymer Chemicals Limited against purchase of chemicals amounting to Rs. 0.288 million. The maximum aggregate amount due to related parties at the end of any month during the year was Rs. 240.538 million (2008: Rs. 869.320 million).
The above deposits are interest free and repayable on demand or otherwise adjustable in accordance with the Company's policy.
Trade creditors
Related parties 18.1 228,399,979
6,947,626
Others 37,663,969
46,361,842
266,063,948
53,309,468
Advances from customers 10,402,106
163,106,101
Unclaimed dividends 17,777,177
16,110,559
Accrued expenses 117,934,990
97,234,387
Sales tax payable 907,713
-
Deposits 18.2 11,422,678
14,573,293
Workers' profits participation fund 18.3 112,963,377
91,479,433
Workers' welfare fund 10 96,994,234
92,000,000
Others 13,761,112 10,319,454
648,227,335 538,132,695
Note 2008 2009
RupeesRupees
Balance at the beginning of the year 91,479,433 40,978,956
Add: Allocation for the year 10 112,702,447
91,210,941
11 260,930
45,337
204,442,810
132,235,234
Less: Amount paid to the fund 91,479,433 40,755,801
112,963,377 91,479,433
Interest on funds used in the Company's business
The Company is contingently liable for:
Counter guarantees given to the bank
Pending law suits
2,171,467
2,959,510
1,650,770
120,000
2,171,467
2,959,510
1,650,770
120,000
Indemnity bonds/guarantees given to Customs authorities equivalentto duties chargeable on import of machinery payable if matter is decided by the FBR against the Company regarding the eligibility ofcertain machinery and equipment for duty free import under BMRprogramme (contingent liability of capital nature)
Indemnity bonds given to Customs authorities equivalent to duties chargeable on import of machinery which shall be released on production of installation certificate from competent authority (contingent liability of capital nature)
2009
Note 2008 2009
RupeesRupees
Notes to the Financial Statements
dh Annual Report 2009
93
19.2 Commitments
20 PROPERTY, PLANT AND EQUIPMENT - AT COST LESS ACCUMULATED DEPRECIATION
Commitments in respect of contracts for capital expenditure
Commitments in respect of store purchases
253,604,000 416,880,644
158,916,140 119,711,876
As at As at As at01 January Additions Disposals 31 December 01 January
Depreciation charge for the year has been allocated as follows:
Cost of sales - (Note 6)
Administrative expenses - (Note 9)
Property, plant and equipment that are fully depreciated amounts to Rs. 1,791,288,331 (2008 : Rs. 1,743,453,325)
Rupees
131,272,508
18,511,741
149,784,249
123,586,514
16,985,299
140,571,813
2008
Rupees
2009
250,656,856
114,635,802
2,314,451
2,531,689,209
137,640,283
47,725,400
96,540,902
96,102,060
3,277,304,963
-
-
-
174,214,162
78,572,268
2,405,027
1,292,558
24,587,275
281,071,290
-
-
-
-
-
-
-
776,807
776,807
250,656,856
114,635,802
2,314,451
2,705,903,371
216,212,551
50,130,427
97,833,460
119,912,528
3,557,599,446
-
1,744,388,878
2,088,640,591
73,641,339
2,291,307
94,300,162
39,750,764
83,614,966
50,653,175
-
3,920,237
-
75,819,782
34,459,838
1,319,381
8,447,888
16,604,687
140,571,813
-
-
-
-
-
-
-
392,933
392,933
Freehold land
Buildings on freehold land
Railway siding
Plant and machinery
Catalysts
Furniture, fittings and equipment
Data processing equipment
Motor vehicles
2008
DEPRECIATIONCOST
-
77,561,576
2,291,307
1,820,208,660
128,760,000
41,070,145
92,062,854
66,864,929
2,228,819,471
250,656,856
37,074,226
23,144
885,694,711
87,452,551
9,060,282
5,770,606
53,047,599
1,328,779,975
2008 2009
RupeesRupees
Rupees
Net book value
31 DecemberAs at
As at As at As at01 January Additions Disposals 31 December 01 January
2008 2008 2008
For theyear
DisposalsAs at
31 December
2008 2008
Net book value
31 DecemberAs at
-
Rupees
dh Annual Report 2009
94 Notes to the Financial Statements
-
20.1 Disposal of property, plant and equipment
Motor vehicles Employees
Honda Civic Mr. Shahid Pracha 1,500,500 525,175 975,325 1,087,863 As per Company Policy
Toyota Corolla Ashraf Rashid Karimi 1,034,000 430,833 603,167 710,875 As per Company Policy
Toyota Corolla GLI Mr. Isar Ahmad 1,309,000 850,850 458,150 670,863 As per Company Policy
Suzuki Potohar Ch. Abdul Mughni 686,000 297,267 388,733 615,200 As per Company Policy
Toyota Corolla GLI Dr. Sajid Hassan 1,004,650 636,279 368,371 695,956 As per Company Policy
Suzuki Cultus Mr. Muhammad Saleem 613,157 245,263 367,894 520,831 As per Company Policy
Honda Civic Mr. Aleem A. Dani 1,288,000 944,533 343,467 660,100 As per Company Policy
Honda City Syed Ahmad Ashraf 500,007
200,002
300,005
350,005
As per Company Policy
Suzuki Alto Mr. S. Hamid M. Qadri 520,250
225,442
294,808
360,919
As per Company Policy
Toyota Corolla XLI Mr. Gulzar Saleem 905,555
618,796
286,759
441,458
As per Company Policy
Suzuki Alto Mr. Shakeel Ahmad 518,490
319,735
198,755
294,876
As per Company Policy
Suzuki Mehran Mr. Abdul Aziz 388,310
310,649
77,661
151,764
As per Company Policy
Aggregate of other items of property, plant and equipment with individual book values not exceeding Rupees 50,000 3,764,279 3,699,791 64,488 1,336,375 As per Company Policy
14,032,198 9,304,615 4,727,583 7,897,085
Rupees21 CAPITAL WORK IN PROGRESS
Plant and machinery 734,408,738 1,853,966
Advance for plant and machinery - 65,700,000
734,408,738 67,553,966
2008
Rupees
22 INVESTMENT IN ASSOCIATE
Engro Chemical Pakistan Limited (ECPL)
81,157,408 (2008: 73,779,462) ordinary shares of Rs. 10 each 19,205,628,008
16,610,255,523 Add: Cost of 32,462,963 (2008:7,377,946) right shares acquired during the year 1,623,148,150
1,291,140,550
Share of post acquisition profits 1,331,306,662
1,850,199,953
2,954,454,812
3,141,340,503
Percentage of equity held - 38.13% (2008: 38.13%) 22,160,082,820
19,751,596,026
Less: Dividends received during the year 616,796,300 545,968,018
21,543,286,520 19,205,628,008
Type of property, plant and equipment
Sold toOriginal
cost
Rupees
Accumulateddepreciation
Written downvalue
Sale proceeds
Mode of disposal
2009
Rupees Rupees Rupees
dh Annual Report 2009
95Notes to the Financial Statements
Fair value of investments in associate Rs. 20,823 million (2008: Rs. 7,828 million).
The financial year end of ECPL is 31 December and due to non-availability of the financial statements of ECPL at the time of preparation of these financial statements, the financial results as of 30 September have been used for the purpose of application of equity method.
Summarized financial information of ECPL is as follows:
Subsequent to year end, the fertilizer business of Engro Chemical Pakistan Limited has been demerged and the Scheme of Arrangement for the demerger of Engro Chemical Pakistan Limited into a fertilizer company business (Engro Fertilizers Limited) and rest of the undertaking’s business into Engro Chemical Pakistan Limited has been approved by Honorable Sindh High Court, Karachi vide its order dated 09 December 2009 and is effective from 01 January 2010. In accordance with the scheme of arrangement, fertilizer business has been transferred to Engro Fertilizers Limited, a wholly owned subsidiary of Engro Chemical Pakistan Limited. Moreover, in accordance with the Scheme of Arrangement, Sindh High Court, Karachi has approved the change of name of Engro Chemical Pakistan Limited to Engro Corporation Limited.
Loans to executives are provided interest free as temporary financial assistance and are repayable in 18 equal monthly installments.
Loans to other employees are interest free and repayable within two years. These include loans to workers under agreement with the Workers Union.
None of the loans are outstanding for periods exceeding three years.
The maximum amount due from executives at any month end during the year was Rs.9.875 million (2008 : Rs. 8.076 million)
22.1
22.2
22.3
22.4
23 LONG TERM LOANS AND ADVANCES - UNSECURED CONSIDERED GOOD
23.1
23.2
23.3 Reconciliation of carrying amounts of loans to executives
23.4
23.5
2008 2009
Rupees Rupees
Total assets as at 30 September 124,193,084,000 73,689,867,000
Total liabilities as at 30 September 95,635,234,000 52,085,942,000
Revenue (12 months period from 01 October to 30 September) 53,410,778,000
41,077,709,000 Profit after taxation (12 months period from 01 October to 30 September) 3,491,037,000
4,851,712,000
Executives 23.1 & 23.3 1,852,500 416,660
Other employees 23.2 570,735 843,090
2,423,235 1,259,750
2008 2009
Rupees Rupees
2008 2009
Rupees Rupees
Opening balance 5,942,610 3,301,690
Disbursement during the year 11,549,405 5,549,400
Promotion of non-executive employees as executives 864,070 3,159,385
Loan recovered during the year (8,481,030) (6,067,865)
Closing balance 9,875,055 5,942,610
Less: Current portion shown under current assets 8,022,555 5,525,950
1,852,500
416,660
Note
dh Annual Report 2009
96 Notes to the Financial Statements
-
24 STORES, SPARES AND LOOSE TOOLS
25 STOCK IN TRADE
26 LOANS, ADVANCES, DEPOSITS, PREPAYMENTS AND OTHER RECEIVABLES
26.1
26.2
26.3
27 SHORT TERM INVESTMENTS
Stores and spares include items which may result in fixed capital expenditure but are not distinguishable.
This includes due from related parties, i.e. Inbox Business Technology and Avanceon Limited amounting to Rs. 0.448 million (2008: Rs. 2.433 million) and 0.423 million (2008: Rs. Nil) respectively. Maximum aggregate amount due from at the end of any month during the year was Rs. 9.076 million (2008:Rs. 2.762 million).
Chief Executive and directors have not taken any loan/advance from the Company (2008: Rs. Nil).
Advances and loans to executives and employees include Rs. 23.394 million (2008: Rs. 11.757 million) being current portion of the loans described under note 23 and the balance represents interest free advance.
Stores
Spares
Loose tools
Stores and spares in transit
Less: Provision for obsolete items
433,458,784
793,661,275
13,060,775
298,781,165
1,538,961,999
235,665,000
1,303,296,999
367,278,446
750,143,399
12,066,057
131,941,734
1,261,429,636
235,665,000
1,025,764,636
2008 2009
RupeesRupees
Raw and packing materials 14,700,494 31,442,318
Material in process 10,366,776 8,033,236
Finished goods - own manufactured 58,218,429 50,092,662
83,285,699 89,568,216
2008 2009
RupeesRupees
These receivables are all unsecured and considered good:
Advances to suppliers for goods and services 26.1 40,118,497
35,037,713
Advances and loans:
Executives 8,022,555
5,525,950
Employees 20,678,294
8,149,025
Sales Tax receivable -
7,952,358
Prepayments 2,956,345
6,726,477
Deposits 2,109,318
2,100,118
Others 18,838,652 6,759,780
92,723,661 72,251,421
Note
Available for sale 27.1 2,505,425,652 2,173,613,132
Financial assets at fair value through profit and loss 27.2 893,887,248
59,811,847
3,399,312,900
2,233,424,979
2008 2009
RupeesRupees
Note
dh Annual Report 2009
97Notes to the Financial Statements
27.1 Available for sale
27.2 Financial assets at fair value through profit or loss classified as held for trading
Related parties - Quoted
Sui Northern Gas Pipelines Limited
Opening cost of 100,442,350 ( 2008 : 108,672,850 ) ordinary shares of Rs. 10 each - at cost 6,282,066,773
6,796,835,201
Cost of Nil (2008 : 8,230,500) shares disposed off during the year - (514,768,428)
Closing cost of 100,442,350 shares of Rs. 10 each - at cost 6,282,066,773
6,282,066,773
Percentage of equity held: 18.29% (2008 : 18.29%)
Impairment loss 27.3 (3,791,096,493)
(4,126,573,941)
2,490,970,280 2,155,492,832
Others - Quoted
Southern Electric Power Company Limited
6,270,000 (2008 : 6,270,000) ordinary shares of Rs.10 each at carrying cost 18,120,300 118,431,290
Cost of 2,647,100 shares disposed off during the year (7,650,119) -
Closing carrying cost of 3,622,900 (2008 : 6,270,000) shares of Rs. 10 each
10,470,181 118,431,290
Percentage of equity held: below 10% (2008 : below 10%)
Adjustment arising from measurement to fair value 3,985,191 -
Impairment loss - (100,310,990)
3,985,191 (100,310,990)
14,455,372 18,120,300
2,505,425,652 2,173,613,132
2008 2009
Rupees Rupees
Note
ABL Income Fund29,611,770.2888 (2008: Nil) units of Rs. 10 each 288,458,012 -
Adjustment arising from measurement to fair value 7,935,080 -
296,393,092 -
Meezan Cash Fund-Growth Units
5,655,874.2274 (2008: Nil) units of Rs. 50 each 293,807,759 -
Adjustment arising from measurement to fair value 3,012,520 -
296,820,279
UBL Liquidity Plus Fund-Class C
2,929,825.0073 (2008: Nil) units of Rs. 100 each 296,799,537 -
Adjustment arising from measurement to fair value 3,874,340 -
300,673,877 -
KASB Islamic Income Fund
Nil (2008: 640,247) units of Rs. 100 each - 63,703,484
Adjustment arising from measurement to fair value - (3,891,637)
- 59,811,847
893,887,248 59,811,847
-
dh Annual Report 2009
98 Notes to the Financial Statements
27.3
28 CASH AND BANK BALANCES
28.1
29 REMUNERATION OF CHIEF EXECUTIVE, DIRECTORS AND EXECUTIVES
30 EARNINGS PER SHARE
As directed by the SECP vide SRO 150(I) dated 13 February 2009, the Company has taken the amount of impairment on available for sale investments after adjustment/effect for price movements in 2009 from equity to Profit and Loss account on quarterly basis during the calendar year ended on 31 December 2009. The impairment loss recognised in profit and loss account during the year is as follows:
These carry mark up at the rate ranging from 5% to 11% per annum (2008: 5% to 10.9%).
Chief Executive, 6 directors (2008: 4) and 89 executives of the Company (2008: 66) are provided with free use of cars owned and maintained by the Company.
Meeting fees amounting to Rs. 22,000 (2008: 36,000) were paid to 10 (2008: 10) directors including Chief Executive.
There is no dilution effect on the basic earnings per share of the Company.
Impairment loss as on 31st December 2008 recognised in equity 4,126,573,941
Price improvement during the year (335,477,448)
Impairment loss charged to profit and loss 3,791,096,493
(Loss) / Profit after taxation Rupees (1,138,276,830)
3,062,688,257
Weighted average number of ordinary shares No. of shares 109,383,436
109,383,436
Earnings per share- basic Rupees (10.41)
28.00
Basic and diluted
2008 2009
RupeesRupees
Note
2008 2009
dh Annual Report 2009
-
99Notes to the Financial Statements
The Company has exposure to the following risks from its use of financial instruments.
- Credit risk- Liquidity risk - Market risk
The Board of Directors have the overall responsibility for the establishment and oversight of Company’s risk management framework. The Board is also responsible for developing and monitoring the Company's risk management policies.
This note presents information about the Company’s exposure to each of the above risks, the Company’s objectives, policies and processes for measuring and managing risk and the Company’s management of capital.
The Company's risk management policies are established to identify and analyse the risks faced by the Company, to set appropriate risk limits and controls, and to monitor risks and adherence to limits. Risk management policies and systems are reviewed regularly to react to changes in market conditions and the Company's activities.
Credit risk is the risk of financial loss to the Company if a customer or counter party to a financial instrument fails to meet its contractual obligations, and arises principally from the Company's receivables from customers and loans to/due from related parties.
The Company's exposure to credit risk is influenced mainly by the individual characteristics of each customer. To manage exposure to credit risk in respect of trade receivables, management reviews credit worthiness, references, establish purchase limits taking into account the customer's financial position, past experience and other factors. Limits are reviewed periodically and the customers may transact with the Company only on a prepayment basis.
Concentration of credit risk arises when a number of counter parties are engaged in similar business activities or have similar economic features that would cause their abilities to meet contractual obligation to be similarly effected by the changes in economic, political or other conditions. The Company believes that it is not exposed to major concentration of credit risk.
The carrying amount of financial assets represents the maximum credit exposure before any credit enhancements. The maximum exposure to credit risk at the reporting date is:
The trade debts as at the balance sheet date are classified as follows:
31 FINANCIAL INSTRUMENTS
31.1 Credit risk
Available for sale financial assets
Financial assets at fair value through profit or loss
Long term loans and advances
Trade debts
Other receivables
Bank balances
Deposits
2,173,613,132
59,811,847
11,756,670
8,821,267
6,759,780
933,446,826
2,093,597
3,196,303,119
2,505,425,651
893,887,248
26,663,912
10,028,308
18,838,652
277,866,156
2,112,153
3,734,822,080
2008 2009
Rupees Rupees
Domestic 10,028,308 8,821,267
dh Annual Report 2009
100 Notes to the Financial Statements
Based on past experience the management believes that no impairment allowance is necessary in respect of trade receivables past due as some receivables have been recovered subsequent to the year end and for other receivables there are reasonable grounds to believe that the amounts will be recovered in short course of time.
Liquidity risk is the risk that the Company will not be able to meet its financial obligations as they fall due. The Company's approach to managing liquidity is to ensure, as far as possible, that it will always have sufficient liquidity to meet its liabilities when due, under both normal and stressed conditions. For this purpose the Company has sufficient running finance facilities available from various commercial banks to meet its liquidity requirements. Further liquidity position of the Company is closely monitored through budgets, cash flow projections and comparison with actual results by the Board.
Following is the maturity analysis of financial liabilities:
Market risk is the risk that changes in market prices, such as foreign exchange rates, interest rates and equity prices will affect the Company's income or the value of its holdings of financial instruments. The objective of market risk management is to manage and control market risk exposures within acceptable parameters, while optimising the return.
Interest rate risk is the risk that the value of financial instrument will fluctuate due to changes in market interest rates. Significant interest rate risk exposures are primarily managed by a mix of borrowings at fixed and variable interest rates and entering into interest rate swap contracts. At the reporting date the interest rate profile of the Company's significant interest bearing financial instruments was as follows:
The aging of trade receivables at the reporting date is:
31.2 Liquidity risk
31.3 Market risk
31.3.1 Interest rate risk
Past due 1 - 3 months 9,349,838 8,187,202
Past due 4 - 6 months 36,500 5,599
Past due 7 - 10 months 9,706 -
Past due above one year 632,264 628,466
10,028,308 8,821,267
2008 2009
RupeesRupees
RupeesNon derivative financial liabilities
Short term financing - secured - - 1,196,603,573
Long term finances - - 6,302,500,000 6,302,500,000
Trade and other payables - - 397,760,050
Accrued markup - 280,268,454
2009
1,196,603,573
397,760,050
280,268,454
1,874,632,077 - 6,302,500,000 8,177,132,077
Non derivative financial liabilities
Short term financing - secured - - 70,139,213
Long term finances - - 6,302,500,000 6,302,500,000
Trade and other payables - - 160,863,309
Accrued markup - - 275,848,576
2008
70,139,213
160,863,309
275,848,576
506,851,098 - 6,302,500,000 6,809,351,098
Less than 6 months
Between 6 to 12 months
Between 1 to 5 years Total
Rupees Rupees Rupees
-
dh Annual Report 2009
-
101Notes to the Financial Statements
The Company does not account for any fixed rate financial assets and liabilities at fair value through profit or loss. Therefore a change in interest rates at the reporting date would not affect profit and loss account.
A change of 100 basis points in interest rates at the reporting date would have increased/ (decreased) loss for the year by the amounts shown below. This analysis assumes that all other variables, in particular foreign currency rates, remain constant. The analysis is performed on the same basis for 2008.
The sensitivity analysis prepared is not necessarily indicative of the effects on loss for the year and assets / liabilities of the Company.
Other price risk is the risk that the fair value or future cash flows of a financial instrument will fluctuate because of changes in market prices (other than those arising from interest rate risk or currency risk). Equity price risk arises from available-for-sale equity securities held. Material investments within the portfolio are managed on an individual basis and all buy and sell decisions are approved by the Board. The primary goal of the Company's investment strategy is to maximise investment returns.
The table below summarises the impact of increase/decrease in the Karachi Stock Exchange (KSE) Index on the Company's loss after tax for the year and on equity ( fair value reserve). The analysis is based on the assumption that the equity index had increased / decreased by 5% with all other variables held constant and all the Company's equity instruments moved according to the historical correlation with the index:
Equity (fair value reserve) would increase/decrease as a result of gains / losses on equity investments classified as available for sale.
Cash flow sensitivity analysis for variable rate instruments
31.3.2 Other price risk
Sensitivity analysis
Financial liabilities
Variable rate instruments:
Long term finances 13.64 to 15.19 11.21 to 15.19 6,302,500,000 6,302,500,000
Short term financing 13.07 to 14.67 10.29 to 13.53 1,196,603,573 70,139,213
Effective rate(in Percentage)
Carrying amount(Rupees)
2008200920082009
Increase Decrease
Effect on loss - 31 December 2009 (70,328,597) 70,328,597
Effect on profit - 31 December 2008 (73,041,889) 73,041,889
Impact on (Loss)/ Profit after taxation Impact on other components of equity (fair value reserve)
2009 2008 2009 2008
dh Annual Report 2009
Notes to the Financial Statements102
-
The carrying values of the financial assets and financial liabilities approximate their fair values. Fair value is the amount for which an asset could be exchanged, or a liability settled, between knowledgeable, willing parties in an arm’s length transaction.
The Board’s policy is to maintain an efficient capital base so as to maintain investor, creditor and market confidence and to sustain the future development of its business. The Board of Directors monitors the return on capital employed, which the Company defines as operating income divided by total capital employed. The Board of Directors also monitors the level of dividends to ordinary shareholders.
The Company's objectives when managing capital are:
i) to safeguard the entity's ability to continue as a going concern, so that it can continue to provide returns for shareholders and benefits for other stakeholders, and
ii) to provide an adequate return to shareholders.
The Company manages the capital structure in the context of economic conditions and the risk characteristics of the underlying assets. In order to maintain or adjust the capital structure, the Company may, for example, adjust the amount of dividends paid to shareholders, issue new shares, or sell assets to reduce debt.
The Company monitors capital on the basis of the debt-to-equity ratio - calculated as a ratio of total debt to equity.
The debt-to-equity ratios as at 31 December 2009 and at 31 December 2008 were as follows:
The increase in the debt-to-equity ratio in 2009 has resulted primarily from increase in short term borrowings amounting to Rs. 1,126 million and placement of funds in open ended mutual funds.
Neither there were any changes in the Company’s approach to capital management during the year nor the Company is subject to externally imposed capital requirements.
The related parties comprise local associated companies, related group companies, directors of the Company, companies where directors also hold directorship, and key management employees. The Company in the normal course of business carries out transactions with various related parties. Amounts due from and to related parties are shown under receivables and payables. Details of transactions with related parties, other than those which have been specifically disclosed elsewhere in these accounts are as follows:
31.3.3 Fair value of financial instruments
Capital management
32 RELATED PARTY TRANSACTIONS
6,372,639,213
(278,146,473) (933,938,188)
5,438,701,025
17,382,656,746
0.36 0.31
7,499,103,573
7,220,957,100
19,882,713,586
Total debt Less: Cash and cash equivalents
Net debt
Total equity
Debt -to -equity ratio
2008 2009
RupeesRupees
Associated company
Sale of goods and services 5,745,161 3,260,708,720
Purchase of goods and services 2,575,550,006 2,331,658,187
Right issue 1,623,148,150 1,291,140,550
Dividend Income 616,796,300 545,968,018 Gratuity funds 13,968,812
11,317,278
Provident funds 25,726,000 20,571,000
2008 2009
RupeesRupees
dh Annual Report 2009
Notes to the Financial Statements 103
No buying or selling commission has been paid to any related party.
As against the annual production capacity of 445,500 tons (2008: 445,500 tons) of urea fertilizer the plant produced 513,315 tons (2008: 508,050 tons) which was 115.22 % (2008: 114.04%) of designed capacity.
The Board of Directors at its meeting held on 23 January 2010 has proposed a final cash dividend @ Rs.1.00 per share amounting to Rs.109,383,436 and 10% stock dividend for the year ended 31 December 2009 for approval of the members at the Annual General Meeting to be held on 29 March 2010. These financial statements do not reflect this proposed dividend.
These financial statements have been authorised for issue by the Board of Directors of the Company on 23 January 2010.
Administrative and selling expenses for 2008 amounting to Rs. 389,846,789 have been reclassified as Administrative expenses amounting to Rs. 317,571,019 and Distribution expenses amounting to Rs. 72,275,770 respectively, for better presentation.
Figures have been rounded off to the nearest rupee.
33 PRODUCTION CAPACITY
34 POST BALANCE SHEET EVENTS
35 GENERAL
35.1
35.2
35.3
Karachi23 January 2010
Shahzada DawoodChief Executive
A.G. GoharDirector
dh Annual Report 2009
Notes to the Financial Statements104
-
PATTERN OF SHAREHOLDINGAs at 31 December 2009Disclosure Requirement under the Code of Corporate Governance
Details of holding on 31.12.2009:
Associated Companies, Undertakings and Related Parties
Dawood Lawrencepur Limited 17,711,795
Dawood Foundation 4,320,907
Central Insurance Company Ltd. 3,249,946
Patek (Pvt.) Ltd. 35,292
Dawood Corporation (Pvt.) Ltd. 23,147
Sach International (Pvt.) Ltd. 1,590
NIT & ICP
National Bank of Pakistan, Trustee Department 592,331
Investment Corporation of Pakistan 211
Directors & Chief Executive (including holding of their spouses & minor children)
Mr. Hussain Dawood - Chairman 9,820,754
Mr. Shahzada Dawood - Chief Executive 1,122,227
Mr. A. Samad Dawood 1,122,614
Mr. Haroon Mahenti 390
Khawaja Amanullah 3
Mr. Abdul Ghafoor Gohar 3
Syed Muhammad Asghar 1
Executives 949
Public Sector Companies and Corporations -
Banks, Development Finance Institutions, Non-Banking Finance