90
TUOTERYHMÄT 1 2009 Annual Report
TUOTERYHMÄT 1
20
09
Ann
ual R
epor
t
Contents
The Year 2009 in Brief 3
Strategic Policies 4
Product Groups 5
Managing Director’s Review 6
Fireplaces 8
Natural Stone Products 11
Corporate Responsibility 12
Highlights of the Year 2009 17
Corporate Governance 18
Board of Directors 18
Management Group 20
Corporate Governance Statement 2009 23
Salary and Remuneration Report 27
Information for Shareholders 28
Tulikivi Corporation’s Stock Exchange Releases in 2009 29
Board of Directors’ Report and Financial Statements 30
Board of Directors’ Report 31
Consolidated Financial Statements, IFRS 36
Key Financial Indicators 74
Calculation of Key Ratios 76
Parent Company Financial Statements, FAS 77
Tulikivi Corporation’s Shareholders and
Management Ownership 86
Signatures to Report of the Board and
Financial Statements 87
Auditor’s Report 87
Contact Information 88-89
THE YEAR 2009 IN BRIEF 3
RETURN ON INVESTMENTS, % INVESTMENTS AND DEPRECIATION, MEUR SHARE PRICE OF THE A SHARE, DECEMBER 31, EUR
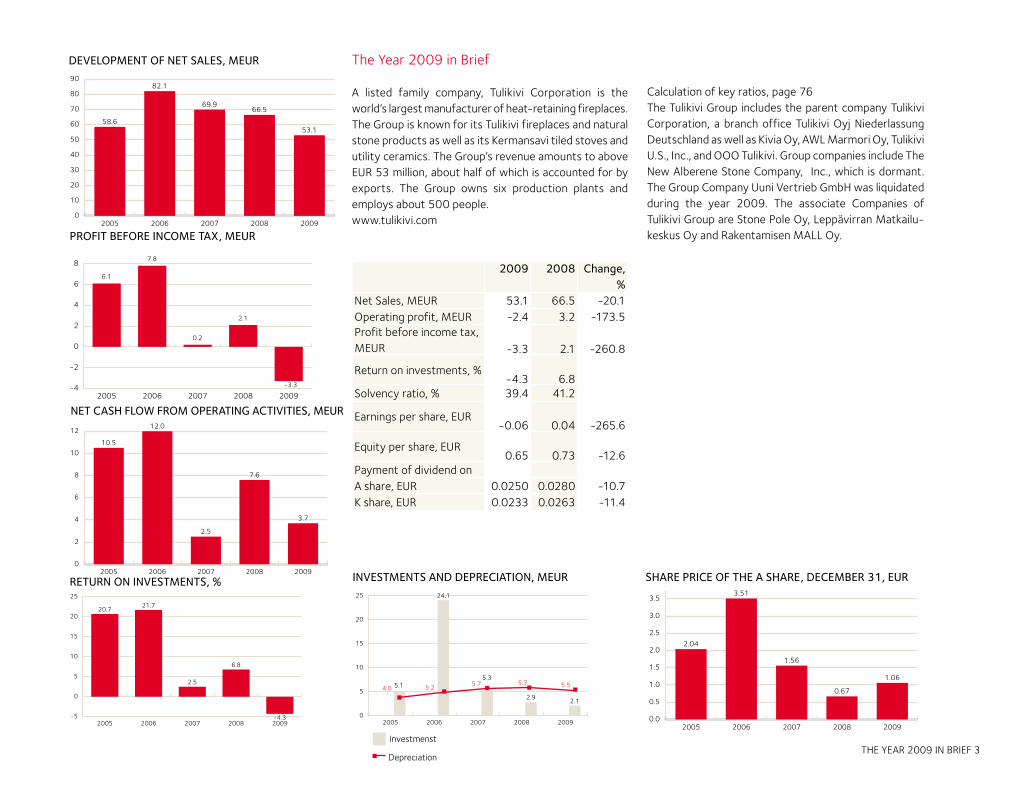
The Year 2009 in Brief
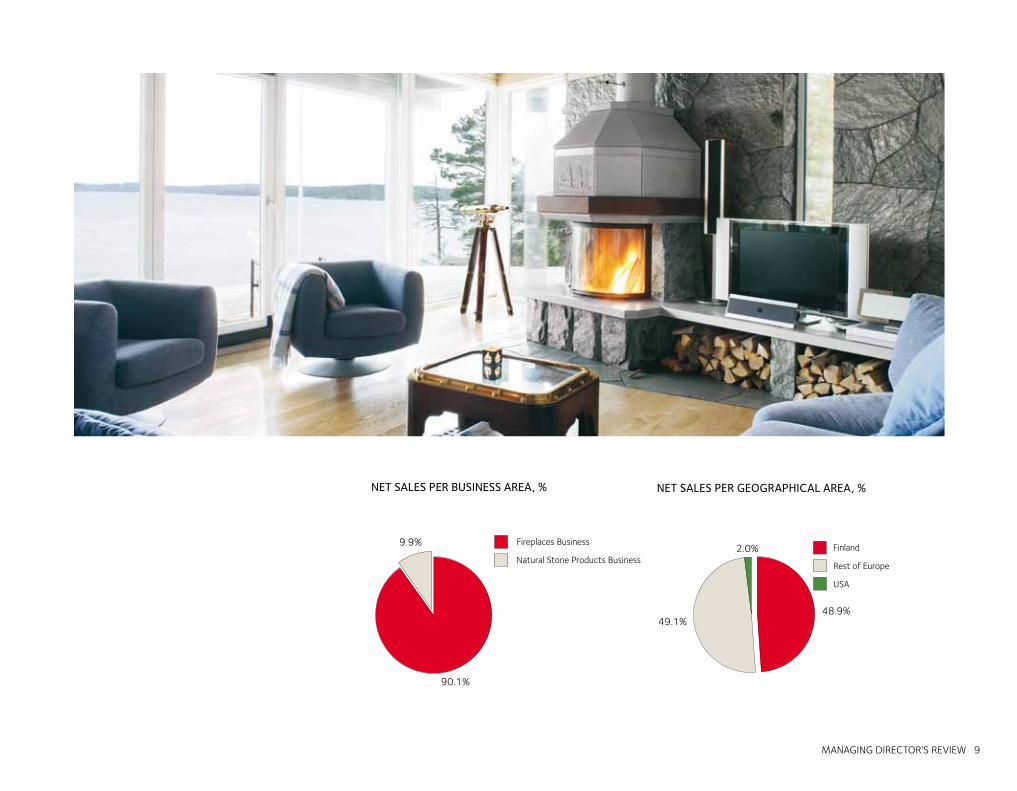
A listed family company, Tulikivi Corporation is the world’s largest manufacturer of heat-retaining fireplaces. The Group is known for its Tulikivi fireplaces and natural stone products as well as its Kermansavi tiled stoves and utility ceramics. The Group’s revenue amounts to above EUR 53 million, about half of which is accounted for by exports. The Group owns six production plants and employs about 500 people. www.tulikivi.com
2009 2008 Change, %
Net Sales, MEUR 53.1 66.5 -20.1Operating profit, MEUR -2.4 3.2 -173.5Profit before income tax, MEUR -3.3 2.1 -260.8
Return on investments, %-4.3 6.8
Solvency ratio, % 39.4 41.2
Earnings per share, EUR-0.06 0.04 -265.6
Equity per share, EUR0.65 0.73 -12.6
Payment of dividend onA share, EUR 0.0250 0.0280 -10.7K share, EUR 0.0233 0.0263 -11.4
Calculation of key ratios, page 76The Tulikivi Group includes the parent company Tulikivi Corporation, a branch office Tulikivi Oyj Niederlassung Deutschland as well as Kivia Oy, AWL Marmori Oy, Tulikivi U.S., Inc., and OOO Tulikivi. Group companies include The New Alberene Stone Company, Inc., which is dormant. The Group Company Uuni Vertrieb GmbH was liquidated during the year 2009. The associate Companies of Tulikivi Group are Stone Pole Oy, Leppävirran Matkailu-keskus Oy and Rakentamisen MALL Oy.
DEVELOPMENT OF NET SALES, MEUR
PROFIT BEFORE INCOME TAX, MEUR
NET CASH FLOW FROM OPERATING ACTIVITIES, MEUR
���
���
���
���
����
���� ���� ���� ���� ������
��
�
�
�
�
�
���
����
���
��� ���
���� ���� ���� ���� �����
�
��
��
��
��
��� ��� ��� ���
�����������
��������
���
��������
���
���
�������� ���� ���� ���� ����
��
�
�
��
��
��
��
����
����
���
���
���
���� ���� ���� ���� �����
�
�
�
�
��
��
����
����
����
����
����
���� ���� ���� ���� �������
���
���
���
���
���
���
���
���
����
����
��������
����
���� ���� ���� ���� �����
��
��
��
��
��
��
��
��
��
4 STRATEGIC POLICIES
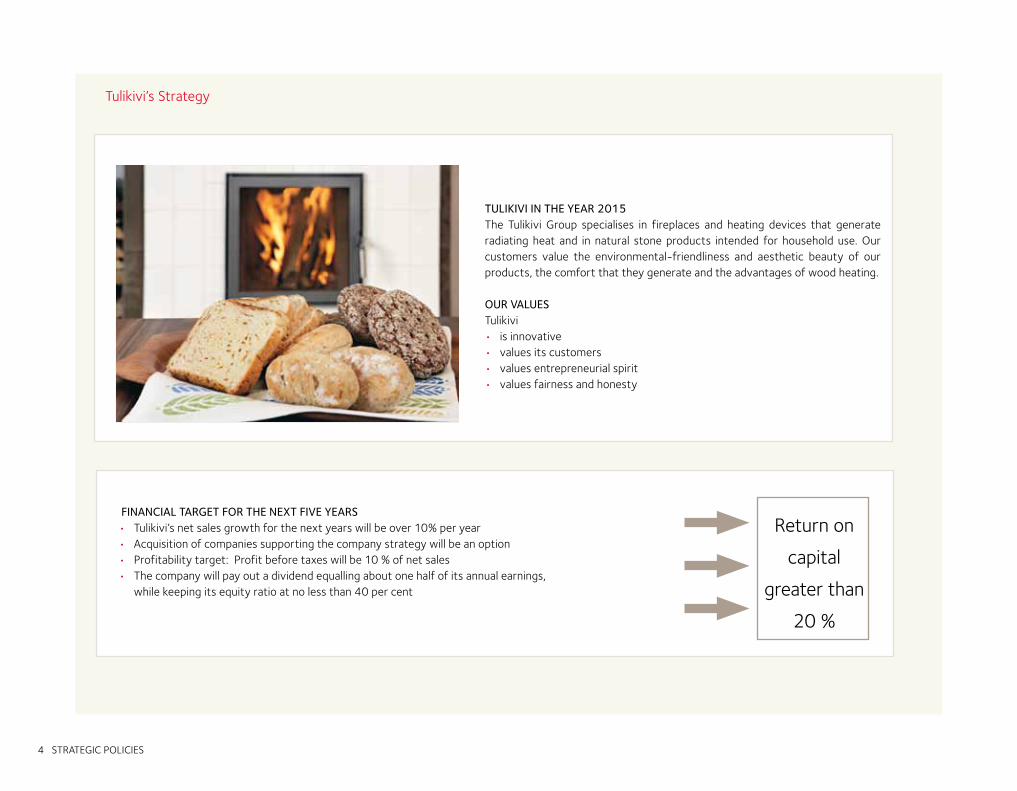
Tulikivi’s Strategy
TULIKIVI IN THE YEAR 2015The Tulikivi Group specialises in fireplaces and heating devices that generate radiating heat and in natural stone products intended for household use. Our customers value the environmental-friendliness and aesthetic beauty of our products, the comfort that they generate and the advantages of wood heating.
OUR VALUESTulikivi • is innovative• values its customers• values entrepreneurial spirit • values fairness and honesty
Return on
capital
greater than
20 %
• Tulikivi’s net sales growth for the next years will be over 10% per year • Acquisition of companies supporting the company strategy will be an option• Profitability target: Profit before taxes will be 10 % of net sales• The company will pay out a dividend equalling about one half of its annual earnings, while keeping its equity ratio at no less than 40 per cent
FINANCIAL TARGET FOR THE NEXT FIVE YEARS
STRATEGIC POLICIES 5
OPERATING ENVIRONMENT• Use of bioenergy will increase prompted by ecological and economic considerations• Aesthetic beauty and user-friendliness are important to consumers• Consumers attach great importance to well-being and comfortable living• People spend a lot of time at home: home furnishing and comfortable living are a high priority• There are many competitive products in the market, efficiency of sales is a decisive factor
COMPETITIVENESS• Product concepts tailored to customer needs• A comprehensive delivery and service network• A well-known company and highly valued products• An efficient network-based approach• An ample supply of high-quality raw materials• Innovative and committed staff• A cost-effective manufacturing process
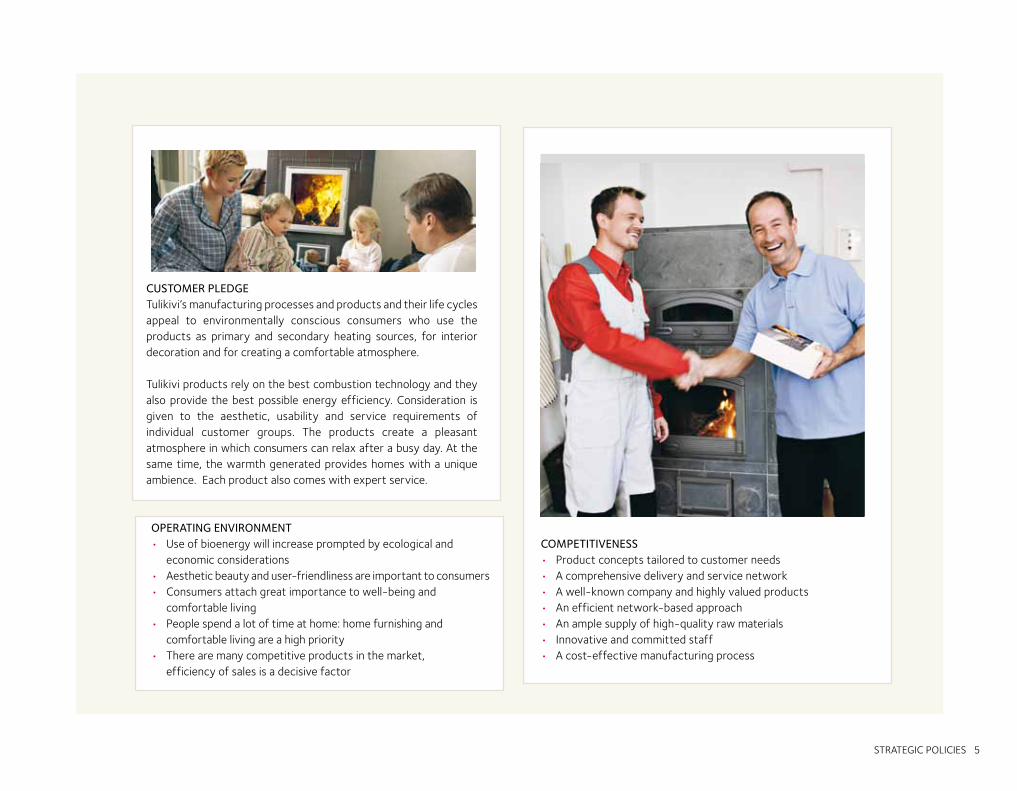
CUSTOMER PLEDGETulikivi’s manufacturing processes and products and their life cycles appeal to environmentally conscious consumers who use the products as primary and secondary heating sources, for interior decoration and for creating a comfortable atmosphere.
Tulikivi products rely on the best combustion technology and they also provide the best possible energy efficiency. Consideration is given to the aesthetic, usability and service requirements of individual customer groups. The products create a pleasant atmosphere in which consumers can relax after a busy day. At the same time, the warmth generated provides homes with a unique ambience. Each product also comes with expert service.
6 STRATEGIC POLICIES
Product Groups
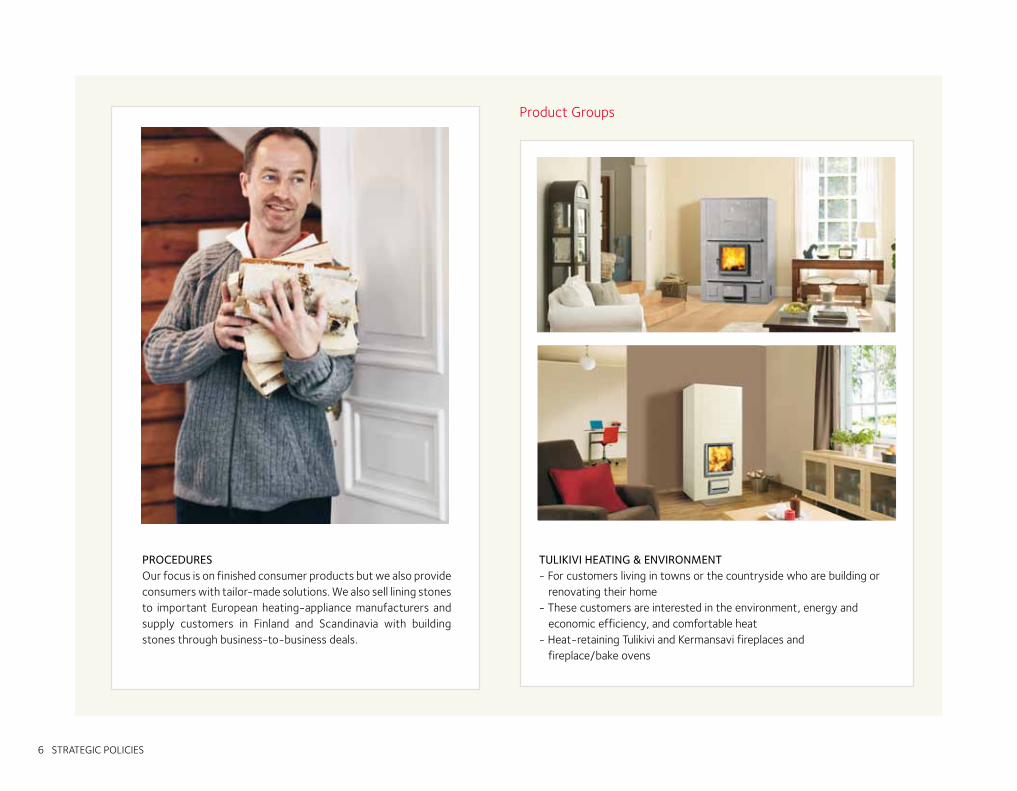
TULIKIVI HEATING & ENVIRONMENT- For customers living in towns or the countryside who are building or renovating their home - These customers are interested in the environment, energy and economic efficiency, and comfortable heat- Heat-retaining Tulikivi and Kermansavi fireplaces and fireplace/bake ovens
PROCEDURESOur focus is on finished consumer products but we also provide consumers with tailor-made solutions. We also sell lining stones to important European heating-appliance manufacturers and supply customers in Finland and Scandinavia with building stones through business-to-business deals.
STRATEGIC POLICIES 7
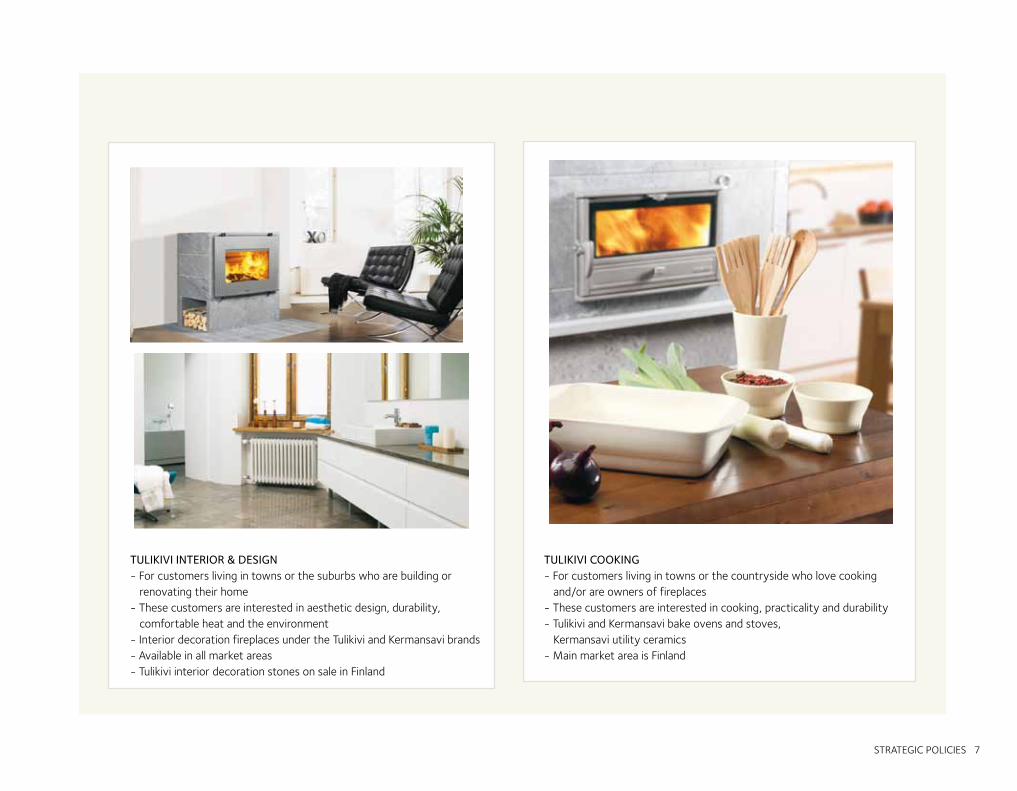
TULIKIVI INTERIOR & DESIGN- For customers living in towns or the suburbs who are building or renovating their home- These customers are interested in aesthetic design, durability, comfortable heat and the environment - Interior decoration fireplaces under the Tulikivi and Kermansavi brands- Available in all market areas- Tulikivi interior decoration stones on sale in Finland
TULIKIVI COOKING- For customers living in towns or the countryside who love cooking and/or are owners of fireplaces - These customers are interested in cooking, practicality and durability- Tulikivi and Kermansavi bake ovens and stoves, Kermansavi utility ceramics- Main market area is Finland
8 MANAGING DIRECTOR’S REVIEW
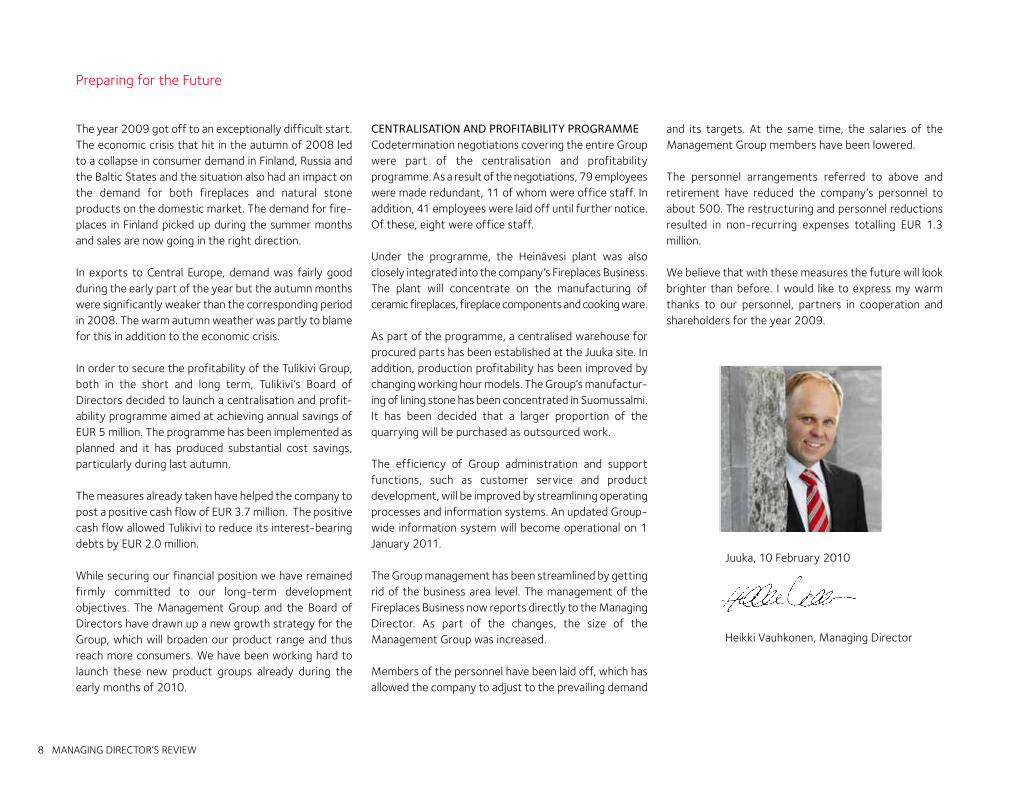
Juuka, 10 February 2010
Heikki Vauhkonen, Managing Director
The year 2009 got off to an exceptionally difficult start. The economic crisis that hit in the autumn of 2008 led to a collapse in consumer demand in Finland, Russia and the Baltic States and the situation also had an impact on the demand for both fireplaces and natural stone products on the domestic market. The demand for fire-places in Finland picked up during the summer months and sales are now going in the right direction.
In exports to Central Europe, demand was fairly good during the early part of the year but the autumn months were significantly weaker than the corresponding period in 2008. The warm autumn weather was partly to blame for this in addition to the economic crisis.
In order to secure the profitability of the Tulikivi Group, both in the short and long term, Tulikivi’s Board of Directors decided to launch a centralisation and profit-ability programme aimed at achieving annual savings of EUR 5 million. The programme has been implemented as planned and it has produced substantial cost savings, particularly during last autumn.
The measures already taken have helped the company to post a positive cash flow of EUR 3.7 million. The positive cash flow allowed Tulikivi to reduce its interest-bearing debts by EUR 2.0 million.
While securing our financial position we have remained firmly committed to our long-term development objectives. The Management Group and the Board of Directors have drawn up a new growth strategy for the Group, which will broaden our product range and thus reach more consumers. We have been working hard to launch these new product groups already during the early months of 2010.
CENTRALISATION AND PROFITABILITY PROGRAMMECodetermination negotiations covering the entire Group were part of the centralisation and profitability programme. As a result of the negotiations, 79 employees were made redundant, 11 of whom were office staff. In addition, 41 employees were laid off until further notice. Of these, eight were office staff.
Under the programme, the Heinävesi plant was also closely integrated into the company’s Fireplaces Business. The plant will concentrate on the manufacturing of ceramic fireplaces, fireplace components and cooking ware.
As part of the programme, a centralised warehouse for procured parts has been established at the Juuka site. In addition, production profitability has been improved by changing working hour models. The Group’s manufactur-ing of lining stone has been concentrated in Suomussalmi. It has been decided that a larger proportion of the quarrying will be purchased as outsourced work.
The efficiency of Group administration and support functions, such as customer service and product development, will be improved by streamlining operating processes and information systems. An updated Group-wide information system will become operational on 1 January 2011.
The Group management has been streamlined by getting rid of the business area level. The management of the Fireplaces Business now reports directly to the Managing Director. As part of the changes, the size of the Management Group was increased.
Members of the personnel have been laid off, which has allowed the company to adjust to the prevailing demand
Preparing for the Future
and its targets. At the same time, the salaries of the Management Group members have been lowered.
The personnel arrangements referred to above and retirement have reduced the company’s personnel to about 500. The restructuring and personnel reductions resulted in non-recurring expenses totalling EUR 1.3 million.
We believe that with these measures the future will look brighter than before. I would like to express my warm thanks to our personnel, partners in cooperation and shareholders for the year 2009.
MANAGING DIRECTOR’S REVIEW 9
NET SALES PER BUSINESS AREA, % NET SALES PER GEOGRAPHICAL AREA, %
�����
���� �������������������
���������������������������
����������
���� �������
���� �� ����
���
10 FIREPLACES
The bioenergy sector and consequently the fireplace business face major challenges but also great opportunities. Therefore we have not abandoned our product development work in the current difficult financial situation. We have continued working on key projects from the perspective of the Group’s revised strategy and new projects have been started.
A significant development for heat-retaining fireplaces was the expiry of the Europe-wide transition period relating to the CE marking. Any heat-retaining fireplaces sold within the European Union must meet the compliance requirements for the CE marking. During the past year we completed the related tests, and Tulikivi now has the most comprehensive range of approved heat-retaining products. Tulikivi’s whirlbox represents the most advanced combustion technology on the market and it has now been modulated for almost all Tulikivi’s heat- retaining fireplaces. In deviation to the transition period
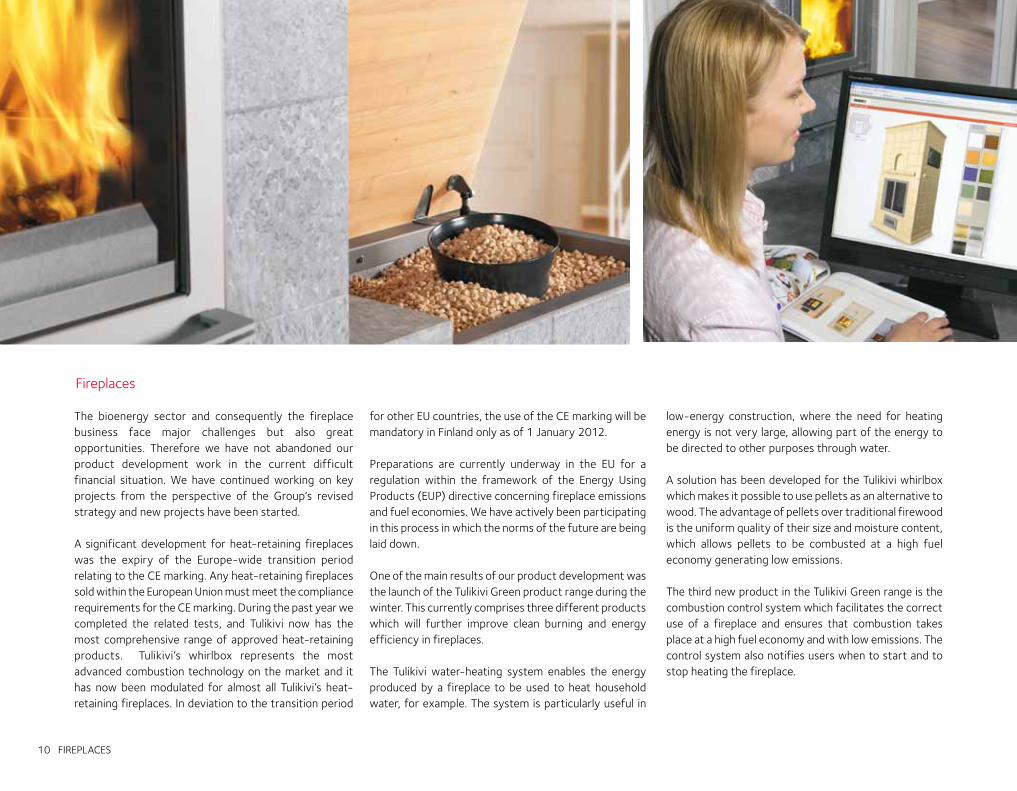
Fireplaces
for other EU countries, the use of the CE marking will be mandatory in Finland only as of 1 January 2012.
Preparations are currently underway in the EU for a regulation within the framework of the Energy Using Products (EUP) directive concerning fireplace emissions and fuel economies. We have actively been participating in this process in which the norms of the future are being laid down.
One of the main results of our product development was the launch of the Tulikivi Green product range during the winter. This currently comprises three different products which will further improve clean burning and energy efficiency in fireplaces.
The Tulikivi water-heating system enables the energy produced by a fireplace to be used to heat household water, for example. The system is particularly useful in
low-energy construction, where the need for heating energy is not very large, allowing part of the energy to be directed to other purposes through water.
A solution has been developed for the Tulikivi whirlbox which makes it possible to use pellets as an alternative to wood. The advantage of pellets over traditional firewood is the uniform quality of their size and moisture content, which allows pellets to be combusted at a high fuel economy generating low emissions.
The third new product in the Tulikivi Green range is the combustion control system which facilitates the correct use of a fireplace and ensures that combustion takes place at a high fuel economy and with low emissions. The control system also notifies users when to start and to stop heating the fireplace.
FIREPLACES 11
In addition to customers who are interested in heating products, our product strategy work has also identified customers who are interested in interior design as a target group. The product strategy work is guided by Hannu Kähönen from Creadesign Oy who is in charge of Tulikivi’s design management. As a result of this work, we have launched the first new products for this target group.
FINNISH MARKET As a result of the uncertainty brought about by the economic crisis and the sharp drop in new construction, the performance of the domestic market was weak, particularly early in the year. On the annual level, sales in terms of number of products sold are estimated to have declined by about 20 per cent. Consumer interest in fire-places started to increase again during the summer.
Finnish legislation does not favour industrially manufactured high-quality fireplaces. In spite of the promises, no emission norms have entered into force for fireplaces. The tax credit for domestic help does not treat industrially manufactured fireplaces kindly either; instead, it encourages consumers to purchase untested fireplaces that are built on-site out of brick.
In recent years, an increasing number of international companies have entered the Finnish fireplace market, which has intensified competition and made new product groups available to consumers. However, the popularity of heat-retaining fireplaces has remained strong in Finland.
The development of Tulikivi’s own distribution channel has continued according to plan. At present, there are around 40 Tulikivi Showrooms and 60 Tulikivi Service Points. A good, competent service is the key competitive advantage for our distribution channel. Thus we established the Tulikivi academy in collaboration with the North Karelia Educational Federation of
Municipalities. Participating in the pilot group customised for Tulikivi are some 20 Tulikivi Showroom entrepreneurs and salespersons.
The significance of our online services is growing all the time alongside our stores. So in 2009 we launched the Uuniräätäli (Tulikivi Tailor) online service in Finland which allows consumers to design a fireplace to suit their own needs.
EXPORT MARKETIn 2009 the differences in the development of exports of Tulikivi fireplaces between the market areas were unusually large. Demand collapsed in the Baltic countries and Russia due to the economic crisis. Demand was fairly good in Central Europe, particularly early in the year, because demand was at a good level in the early winter of 2009 in the wake of the previous winter’s gas crisis. The main fireplace export markets were France, Germany and Belgium. Demand has also been steady in Austria and Switzerland. In France, the demand for fire-places has been boosted by the energy efficiency subsidy granted by the government. Consumers buying a fireplace are entitled to a tax credit of up to 40 percent of the price of the product.
Small-scale combustion of wood has been considered an important factor in the fight against climate change also in the United States, where someone purchasing a fire-place is entitled to a tax credit of USD 1,500 for their purchase.
In Germany, authorities have issued increasingly stringent emission regulations for fireplaces in order to cut down particle emissions. This has resulted in uncertainty among consumers when purchasing fireplace.
In exports, we have continued to systematically develop the distribution channel, thereby laying a foundation for new product groups and new product launches. There is demand for both Tulikivi Green products and interior decoration fireplaces in our distribution channel.
On the Russian market in 2009, our focus was on developing logistics and introducing ceramic products to the market.
LINING STONES The demand for lining stones followed the general declining trend of the markets. During last year we allocated more resources to sales and cost calculation. This helped us to improve our competitiveness. We also expanded our customer base from heater lining stones to other components as well. The concentration of lining stone production to Suomussalmi has increased our operating efficiency and thus improved our price competitiveness.
UTILITY CERAMICSIn the past year, the utility ceramics range focused on improving profitability. In addition to personnel and cost adjustments, we reduced the capital tied up in inventories.
The strategic position of the range was also streamlined, with the focus now on the manufacture of oven and kitchen utility ceramics. They are best suited to the technical and production strengths of the Heinävesi plant and support the fireplace business.
The delivery chain of the utility ceramics range comprises the major retail chains, on-line stores and our own shops. In 2010, the Group will introduce new products in accordance with its strategy.
12 LUONNOKIVITUOTTEET
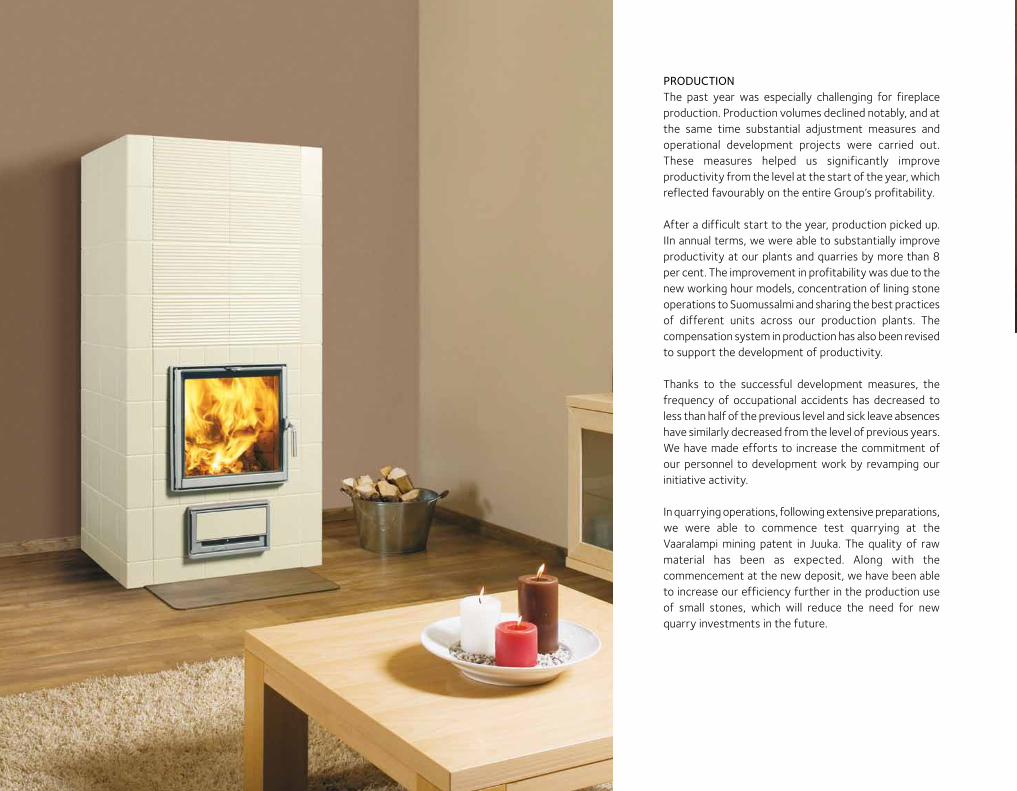
PRODUCTIONThe past year was especially challenging for fireplace production. Production volumes declined notably, and at the same time substantial adjustment measures and operational development projects were carried out. These measures helped us significantly improve productivity from the level at the start of the year, which reflected favourably on the entire Group’s profitability.
After a difficult start to the year, production picked up. IIn annual terms, we were able to substantially improve productivity at our plants and quarries by more than 8 per cent. The improvement in profitability was due to the new working hour models, concentration of lining stone operations to Suomussalmi and sharing the best practices of different units across our production plants. The compensation system in production has also been revised to support the development of productivity.
Thanks to the successful development measures, the frequency of occupational accidents has decreased to less than half of the previous level and sick leave absences have similarly decreased from the level of previous years. We have made efforts to increase the commitment of our personnel to development work by revamping our initiative activity.
In quarrying operations, following extensive preparations, we were able to commence test quarrying at the Vaaralampi mining patent in Juuka. The quality of raw material has been as expected. Along with the commencement at the new deposit, we have been able to increase our efficiency further in the production use of small stones, which will reduce the need for new quarry investments in the future.
NATURAL STONE PRODUCTS 13
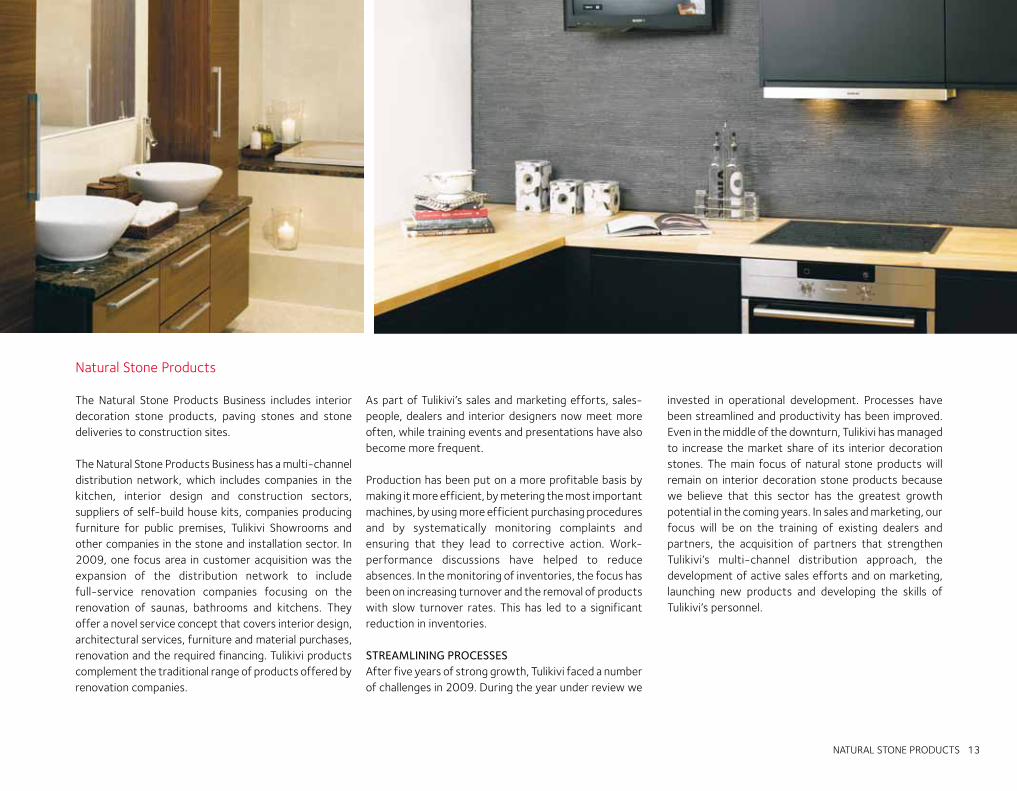
Natural Stone Products
The Natural Stone Products Business includes interior decoration stone products, paving stones and stone deliveries to construction sites.
The Natural Stone Products Business has a multi-channel distribution network, which includes companies in the kitchen, interior design and construction sectors, suppliers of self-build house kits, companies producing furniture for public premises, Tulikivi Showrooms and other companies in the stone and installation sector. In 2009, one focus area in customer acquisition was the expansion of the distribution network to include full-service renovation companies focusing on the renovation of saunas, bathrooms and kitchens. They offer a novel service concept that covers interior design, architectural services, furniture and material purchases, renovation and the required financing. Tulikivi products complement the traditional range of products offered by renovation companies.
As part of Tulikivi’s sales and marketing efforts, sales-people, dealers and interior designers now meet more often, while training events and presentations have also become more frequent.
Production has been put on a more profitable basis by making it more efficient, by metering the most important machines, by using more efficient purchasing procedures and by systematically monitoring complaints and ensuring that they lead to corrective action. Work- performance discussions have helped to reduce absences. In the monitoring of inventories, the focus has been on increasing turnover and the removal of products with slow turnover rates. This has led to a significant reduction in inventories.
STREAMLINING PROCESSESAfter five years of strong growth, Tulikivi faced a number of challenges in 2009. During the year under review we
invested in operational development. Processes have been streamlined and productivity has been improved. Even in the middle of the downturn, Tulikivi has managed to increase the market share of its interior decoration stones. The main focus of natural stone products will remain on interior decoration stone products because we believe that this sector has the greatest growth potential in the coming years. In sales and marketing, our focus will be on the training of existing dealers and partners, the acquisition of partners that strengthen Tulikivi’s multi-channel distribution approach, the development of active sales efforts and on marketing, launching new products and developing the skills of Tulikivi’s personnel.
14 CORPORATE RESPONSIBILITY
Corporate Responsibility
Tulikivi’s operations are guided by the company’s values. The company complies with laws and statutes in every facet of its work. We act responsibly towards our stakeholders, of whom the most important are our customers, personnel, shareholders and cooperation partners, both in Finland and abroad.
CLEANER-BURNING FIREPLACES FOR FINLANDThe ‘Cleaner-burning fireplaces for Finland’ programme launched by Tulikivi in autumn 2007 continues. Through the programme, Tulikivi aims to promote a cleaner environment in various ways by increasing public awareness of the following: correct wood burning techniques, the potential for increasing the use of fire-wood, and the new, environmentally-friendly options created by firebox solutions that are based on modern technology.
In 2009, Tulikivi representatives met politicians and civil servants as part of the programme. Early in 2010, Tulikivi organised the third ‘Cleaner-burning fireplaces for Finland’ seminar.
ENVIRONMENTAL RESPONSIBILITYTulikivi calculated the carbon footprint of its fireplaces at the end of 2009. We decided to perform the calculation in order to provide our environmentally aware customers with research-based environmental information on our products and their manufacture. The material choices and energy consumption of suppliers in the production chain as well as the modes of transport we select play an essential role in the environmental impact of our products. Additionally, environmental and material efficiency create financial savings, as energy costs and waste charges are constantly on the increase.
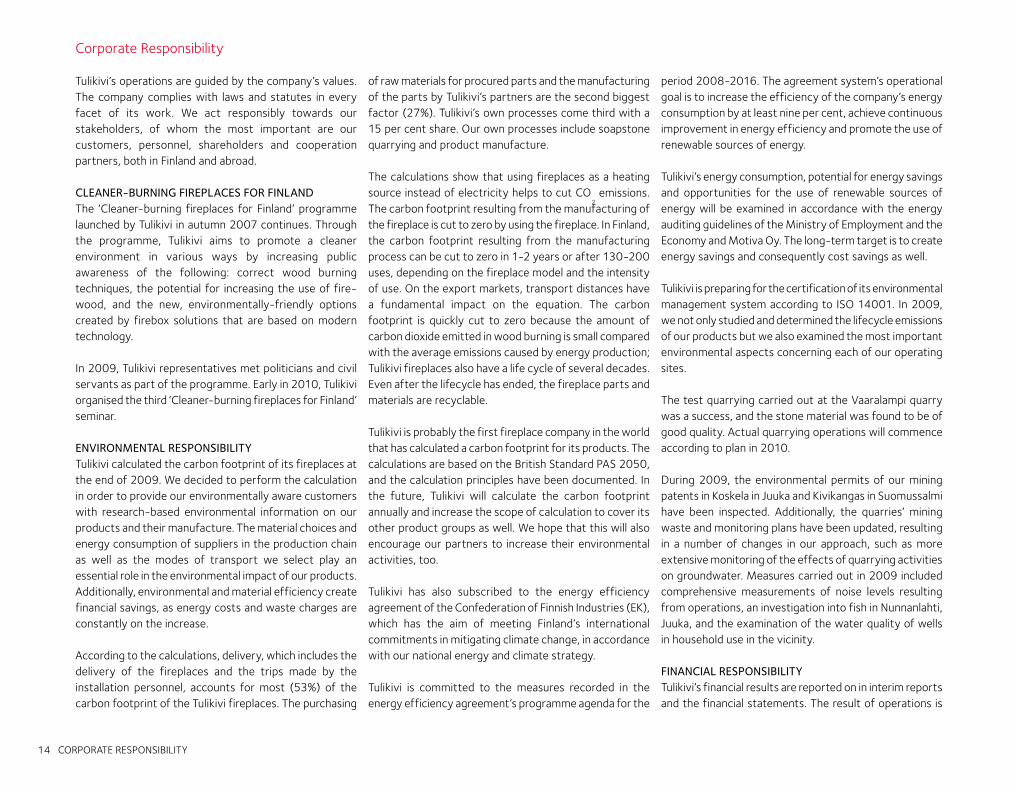
According to the calculations, delivery, which includes the delivery of the fireplaces and the trips made by the installation personnel, accounts for most (53%) of the carbon footprint of the Tulikivi fireplaces. The purchasing
of raw materials for procured parts and the manufacturing of the parts by Tulikivi’s partners are the second biggest factor (27%). Tulikivi’s own processes come third with a 15 per cent share. Our own processes include soapstone quarrying and product manufacture.
The calculations show that using fireplaces as a heating source instead of electricity helps to cut CO
2 emissions.
The carbon footprint resulting from the manufacturing of the fireplace is cut to zero by using the fireplace. In Finland, the carbon footprint resulting from the manufacturing process can be cut to zero in 1-2 years or after 130-200 uses, depending on the fireplace model and the intensity of use. On the export markets, transport distances have a fundamental impact on the equation. The carbon footprint is quickly cut to zero because the amount of carbon dioxide emitted in wood burning is small compared with the average emissions caused by energy production; Tulikivi fireplaces also have a life cycle of several decades. Even after the lifecycle has ended, the fireplace parts and materials are recyclable.
Tulikivi is probably the first fireplace company in the world that has calculated a carbon footprint for its products. The calculations are based on the British Standard PAS 2050, and the calculation principles have been documented. In the future, Tulikivi will calculate the carbon footprint annually and increase the scope of calculation to cover its other product groups as well. We hope that this will also encourage our partners to increase their environmental activities, too.
Tulikivi has also subscribed to the energy efficiency agreement of the Confederation of Finnish Industries (EK), which has the aim of meeting Finland’s international commitments in mitigating climate change, in accordance with our national energy and climate strategy.
Tulikivi is committed to the measures recorded in the energy efficiency agreement’s programme agenda for the
period 2008-2016. The agreement system’s operational goal is to increase the efficiency of the company’s energy consumption by at least nine per cent, achieve continuous improvement in energy efficiency and promote the use of renewable sources of energy.
Tulikivi’s energy consumption, potential for energy savings and opportunities for the use of renewable sources of energy will be examined in accordance with the energy auditing guidelines of the Ministry of Employment and the Economy and Motiva Oy. The long-term target is to create energy savings and consequently cost savings as well.
Tulikivi is preparing for the certification of its environmental management system according to ISO 14001. In 2009, we not only studied and determined the lifecycle emissions of our products but we also examined the most important environmental aspects concerning each of our operating sites.
The test quarrying carried out at the Vaaralampi quarry was a success, and the stone material was found to be of good quality. Actual quarrying operations will commence according to plan in 2010.
During 2009, the environmental permits of our mining patents in Koskela in Juuka and Kivikangas in Suomussalmi have been inspected. Additionally, the quarries’ mining waste and monitoring plans have been updated, resulting in a number of changes in our approach, such as more extensive monitoring of the effects of quarrying activities on groundwater. Measures carried out in 2009 included comprehensive measurements of noise levels resulting from operations, an investigation into fish in Nunnanlahti, Juuka, and the examination of the water quality of wells in household use in the vicinity.
FINANCIAL RESPONSIBILITYTulikivi’s financial results are reported on in interim reports and the financial statements. The result of operations is
CORPORATE RESPONSIBILITY 15
reported on simultaneously, truthfully, openly and in compliance with legislation.
By keeping the Tulikivi Group’s finances on a solid footing, we can provide its shareholders with steady returns and fulfil its obligations as a responsible employer.
The Tulikivi Group has an incentive system in place. Its fundamental component is the incentive pay scheme, based on the achievement of the Group’s earnings, productivity and personal targets. This scheme covers all employees. The incentive plan also includes a share-based incentive system for key personnel.
SOCIAL RESPONSIBILITYThe amount of Tulikivi Group’s personnel has been adjusted in accordance with the programme to improve profitability and concentration; the adjustments focused on Juuka and Heinävesi. As part of the programme, lining stone production was concentrated in Suomussalmi, resulting in improved employment at the plant over a longer time span.
The partnership agreement signed with the North Karelia Adult Education Centre, part of the North Karelia Educational Federation of Municipalities, had a successful first year of operation as all the targets were met. More than 20 training sessions were provided. The training focus was on supervisory work, language skills, information technology and financial management.
September saw the start of our second management training programme for key personnel. Altogether nine of our younger employees holding positions of responsibility at Tulikivi took part. The training programme comprises an extensive business development task, group training and personal coaching led by an occupational psychologist.A development programme for the company’s Management Group commenced during the autumn. To provide a foundation for the programme, an assessment
of operating style was carried out, and the results and the related development needs will be dealt with in an annual development discussion headed by the Managing Director.
Tulikivi revamped its initiative activity in the autumn. Initiative activity provides personnel with a way of participating in the development of the company’s competitiveness and working conditions. The model for the activity, called ‘TOIMI!’ (’Act!’), covers conventional individual initiatives as well as team-based initiatives, ’close-call’ notifications and product improvement proposals. The ‘TOIMI!’ model functions entirely online and a person submitting an initiative will receive a reply regarding its approval or rejection within 48 hours. During the last two months of 2009, around 120 initiatives were submitted through the ‘TOIMI!’ system.
The pilot project under the ‘Työkuntoon’ (fit for work) model was continued in Juuka, Espoo and Helsinki, with good results. The focus in occupational health care is heavily on preventative work. Supervisors monitor personnel sick leave absences and carry out working capacity discussions with employees at 40-hour monitoring intervals to assess employee working capacity. The number of sick leave absences decreased further, and during the year only 4.6 per cent of the total working hours were lost to absences due to illness or accidents.
Development of occupational safety was continued with good results. Through regular safety rounds by supervisor-employee pairs, more than 300 points of improvement were identified. By the end of the year, over 90 per cent of these had already been dealt with.
The company’s equality plan is reviewed and updated annually at a joint meeting. The equality plan is the responsibility of the Human Resources Director.
FORMATION OF CARBON FOOTPRINT IN TULIKIVI’S OWN PRODUCTION
The carbon equivalent was calculated per a kilo of soapstone; the result is 0,612 CO2 eqv kg/kg.
������������������
���������������
������� �
��� �
��
�� ���
���
���
�������������� �����
��� ����������� ����������������� ��������
�����������
�����
FORMATION OF CARBON FOOTPRINT IN TULIKIVI FIREPLACE’S LIFE CYCLE
16 COMMUNITY SPIRIT
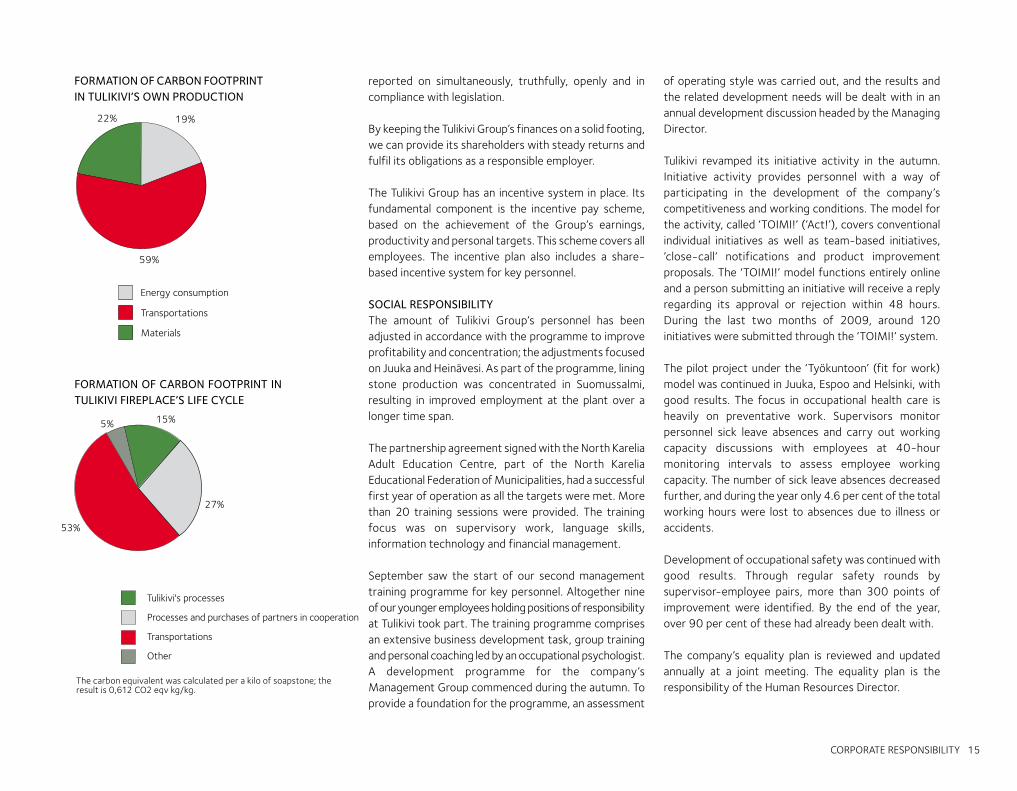
AGE DISTRIBUTION OF PERSONNEL, DECEMBER 31, 2009
PERSONNEL PER SEGMENTS AVERAGE DURING THE YEAR
GENDER DISTRIBUTION DECEMBER 31, 2009
COMMUNITY SPIRITThe Tulikivi Group’s head office is located in Juuka, Northern Karelia, and the company plays an active social role in the area. Besides Juuka, Tulikivi also has operations in Heinävesi, Suomussalmi, Taivassalo and Espoo. Being local is an important part of Tulikivi’s identity.
The primary recipient of Tulikivi’s sponsorship is the Finnish Stone Centre in Juuka and its exhibitions. The Stone Centre has four main missions: raising the profile of stone, stone research, teaching stone construction and encouraging entrepreneurship in the stone business. Tulikivi also sponsors selected sports and hobbies for children and young people in the municipalities where its plants are located.
Tulikivi Corporation is a member of numerous organizations and forums, such as: the Confederation of Finnish Construction Industries, the Federation of Finnish Enterprises, FINBIO – the Bioenergy Association of Finland, the Fine Particle Forum, the Finnish Family Firms Association, the Finnish Chamber of Commerce, Finpro, TTS (Work Efficiency Institute), North Karelia Enterprise Agency, the Finnish Society of Indoor Air Quality and Climate (FiSIAQ), the Association for Finnish Work, the Finnish Natural Stone Association, Euroroc and the Tulisija- ja savupiippuyhdistys TSY (Fireplace and Chimney Association).
���
����
�
��
���
���
���
���
���
���
���
����������
������� ���� �������
����� ���������
�
��
��
��
���� ��
� ��
�� ��
��
�� ��
��
� �
����� ����� ����� ����� ����� ����� ����� ����� ����� ����
��
��
��
��
��
��
��
��
�������� �����
��
��
���
��
������� ����������
��
��
��
���
���
���
���
�� ���
HIGHLIGHTS OF THE YEAR 2009 17
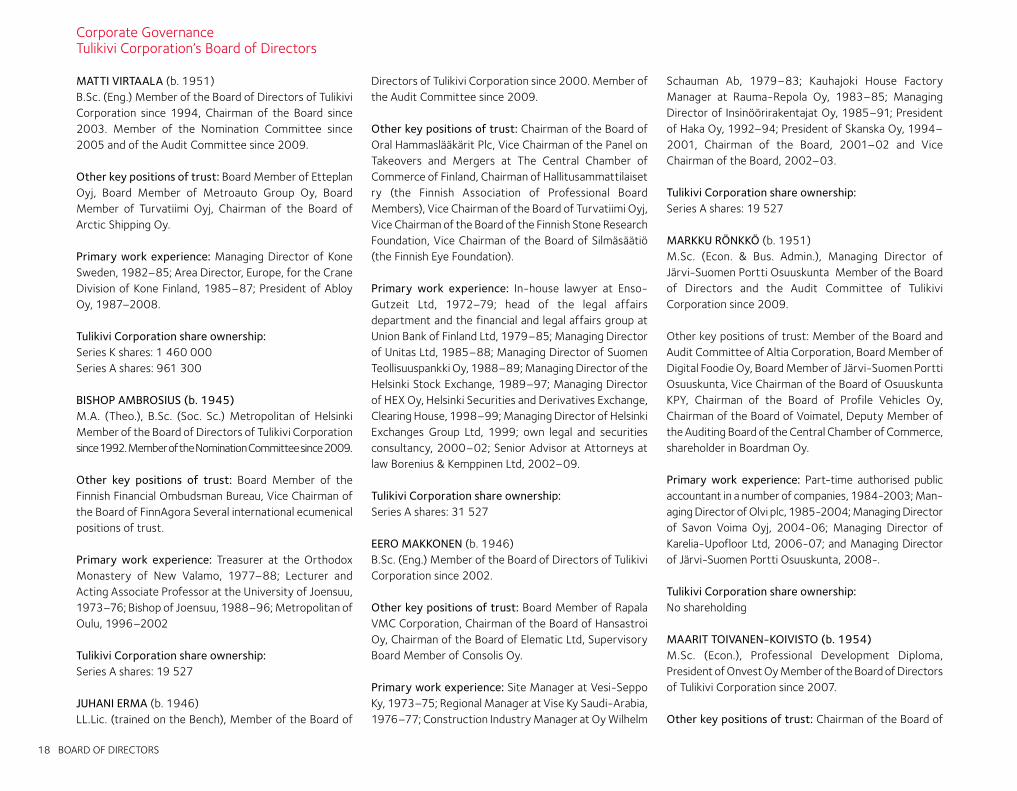
The Tulikivi range now boasts the latest combustion technology
Since 2009, all heat-retaining Tulikivi fireplaces have been equipped with the new whirlbox technology. The technology has already been used in Tulikivi’s flagship models.
The whirlbox is a Tulikivi innovation in which combustion gases and the combustion air are mixed efficiently in the combustion chamber. This improves combustion, provides excellent efficiency and results in exceptionally clean combustion. The emissions generated by a whirlbox fireplace are only a fraction of what is allowed under the world’s strictest emission standards. Thanks to its simple structure, the whirlbox is also very reliable and easy to use.
The entire Tulikivi range of fireplaces now displays the CE marking. With the CE marking the product manufacturer or an authorised dealer is indicating to customers and to the authorities that the product meets the essential safety requirements of the relevant EU directives. The Tulikivi product range has been tested in accordance with the new EN 15250 test standard for slow heat release appliances.
The carbon footprint of Tulikivi fireplaces was calculated during the year under review. The results show that using fireplaces as a heating source instead of electricity helps to cut CO2 emissions. The carbon footprint resulting from the manufacturing of the fireplace is cut to zero by using the fireplace. In Finland, the carbon footprint resulting from the manufacturing process can be cut to zero in 1-2 years or after 130-200 uses, depending on the fireplace model and the intensity of use. On the export markets, transport distances must also be added to the equation. The carbon footprint is quickly cut to zero because Tulikivi fireplaces have a life cycle of several decades.
According to the calculations, delivery, which includes the delivery of the fireplaces and the trips made by the installation personnel, accounts for most (53%) of the carbon footprint of the Tulikivi fireplaces. The purchasing of raw materials for procured parts and the manufacturing of the parts by Tulikivi’s partners are the second biggest factor (27%), followed by Tulikivi’s own processes (15%).
Tulikivi is probably the first fireplace company in the world that has calculated a carbon footprint for its products.
Carbon footprint of Tulikivi fireplaces now known
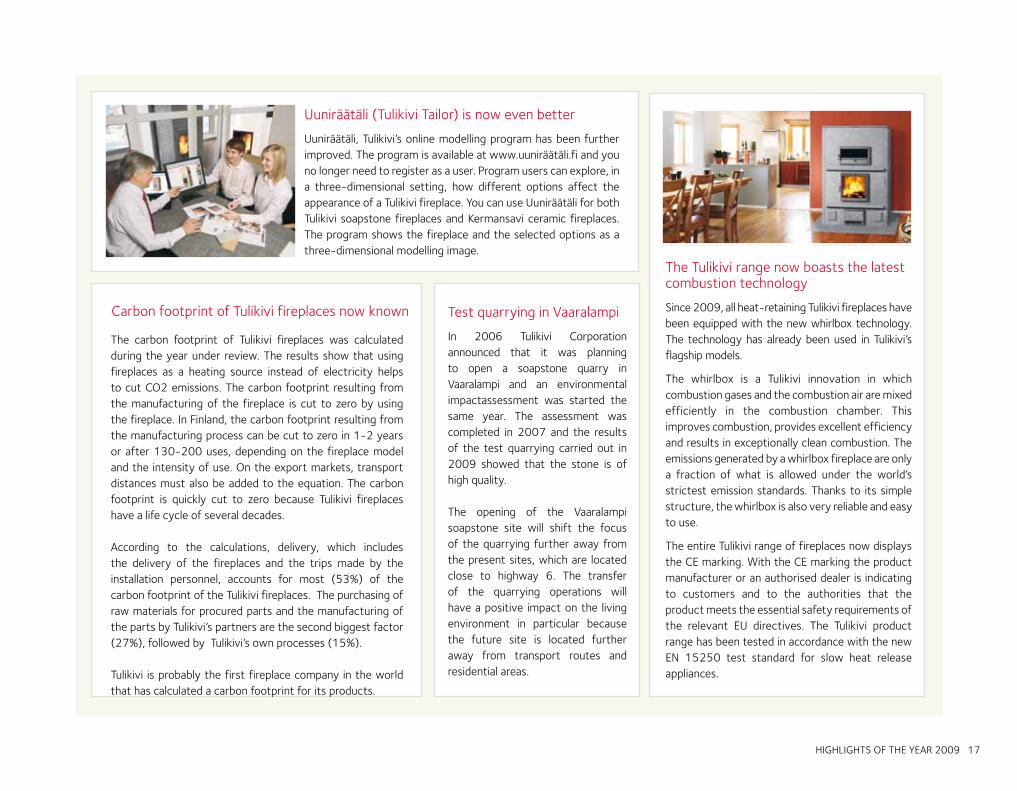
Uuniräätäli (Tulikivi Tailor) is now even better
Uuniräätäli, Tulikivi’s online modelling program has been further improved. The program is available at www.uuniräätäli.fi and you no longer need to register as a user. Program users can explore, in a three-dimensional setting, how different options affect the appearance of a Tulikivi fireplace. You can use Uuniräätäli for both Tulikivi soapstone fireplaces and Kermansavi ceramic fireplaces. The program shows the fireplace and the selected options as a three-dimensional modelling image.
Test quarrying in Vaaralampi
In 2006 Tulikivi Corporation announced that it was planning to open a soapstone quarry in Vaaralampi and an environmental impact assessment was started the same year. The assessment was completed in 2007 and the results of the test quarrying carried out in 2009 showed that the stone is of high quality.
The opening of the Vaaralampi soapstone site will shift the focus of the quarrying further away from the present sites, which are located close to highway 6. The transfer of the quarrying operations will have a positive impact on the living environment in particular because the future site is located further away from transport routes and r esidential areas.
18 BOARD OF DIRECTORS
Corporate Governance Tulikivi Corporation’s Board of Directors
MATTI VIRTAALA (b. 1951) B.Sc. (Eng.) Member of the Board of Directors of Tulikivi Corporation since 1994, Chairman of the Board since 2003. Member of the Nomination Committee since 2005 and of the Audit Committee since 2009.
Other key positions of trust: Board Member of Etteplan Oyj, Board Member of Metroauto Group Oy, Board Member of Turvatiimi Oyj, Chairman of the Board of Arctic Shipping Oy.
Primary work experience: Managing Director of Kone Sweden, 1982–85; Area Director, Europe, for the Crane Division of Kone Finland, 1985–87; President of Abloy Oy, 1987–2008.
Tulikivi Corporation share ownership: Series K shares: 1 460 000Series A shares: 961 300
BISHOP AMBROSIUS (b. 1945)M.A. (Theo.), B.Sc. (Soc. Sc.) Metropolitan of Helsinki Member of the Board of Directors of Tulikivi Corporation since 1992. Member of the Nomination Committee since 2009.
Other key positions of trust: Board Member of the Finnish Financial Ombudsman Bureau, Vice Chairman of the Board of FinnAgora Several international ecumenical positions of trust.
Primary work experience: Treasurer at the Orthodox Monastery of New Valamo, 1977–88; Lecturer and Acting Associate Professor at the University of Joensuu, 1973–76; Bishop of Joensuu, 1988–96; Metropolitan of Oulu, 1996–2002
Tulikivi Corporation share ownership: Series A shares: 19 527
JUHANI ERMA (b. 1946) LL.Lic. (trained on the Bench), Member of the Board of
Directors of Tulikivi Corporation since 2000. Member of the Audit Committee since 2009.
Other key positions of trust: Chairman of the Board of Oral Hammaslääkärit Plc, Vice Chairman of the Panel on Takeovers and Mergers at The Central Chamber of Commerce of Finland, Chairman of Hallitusammattilaiset ry (the Finnish Association of Professional Board Members), Vice Chairman of the Board of Turvatiimi Oyj, Vice Chairman of the Board of the Finnish Stone Research Foundation, Vice Chairman of the Board of Silmäsäätiö (the Finnish Eye Foundation). Primary work experience: In-house lawyer at Enso-Gutzeit Ltd, 1972–79; head of the legal affairs department and the financial and legal affairs group at Union Bank of Finland Ltd, 1979–85; Managing Director of Unitas Ltd, 1985–88; Managing Director of Suomen Teollisuuspankki Oy, 1988–89; Managing Director of the Helsinki Stock Exchange, 1989–97; Managing Director of HEX Oy, Helsinki Securities and Derivatives Exchange, Clearing House, 1998–99; Managing Director of Helsinki Exchanges Group Ltd, 1999; own legal and securities consultancy, 2000–02; Senior Advisor at Attorneys at law Borenius & Kemppinen Ltd, 2002–09.
Tulikivi Corporation share ownership: Series A shares: 31 527
EERO MAKKONEN (b. 1946)B.Sc. (Eng.) Member of the Board of Directors of Tulikivi Corporation since 2002.
Other key positions of trust: Board Member of Rapala VMC Corporation, Chairman of the Board of Hansastroi Oy, Chairman of the Board of Elematic Ltd, Supervisory Board Member of Consolis Oy.
Primary work experience: Site Manager at Vesi-Seppo Ky, 1973–75; Regional Manager at Vise Ky Saudi-Arabia, 1976–77; Construction Industry Manager at Oy Wilhelm
Schauman Ab, 1979–83; Kauhajoki House Factory Manager at Rauma-Repola Oy, 1983–85; Managing Director of Insinöörirakentajat Oy, 1985–91; President of Haka Oy, 1992–94; President of Skanska Oy, 1994–2001, Chairman of the Board, 2001–02 and Vice Chairman of the Board, 2002–03.
Tulikivi Corporation share ownership: Series A shares: 19 527
MARKKU RÖNKKÖ (b. 1951) M.Sc. (Econ. & Bus. Admin.), Managing Director of Järvi-Suomen Portti Osuuskunta Member of the Board of Directors and the Audit Committee of Tulikivi Corporation since 2009.
Other key positions of trust: Member of the Board and Audit Committee of Altia Corporation, Board Member of Digital Foodie Oy, Board Member of Järvi-Suomen Portti Osuuskunta, Vice Chairman of the Board of Osuuskunta KPY, Chairman of the Board of Profile Vehicles Oy, Chairman of the Board of Voimatel, Deputy Member of the Auditing Board of the Central Chamber of Commerce, shareholder in Boardman Oy.
Primary work experience: Part-time authorised public accountant in a number of companies, 1984-2003; Man-aging Director of Olvi plc, 1985-2004; Managing Director of Savon Voima Oyj, 2004-06; Managing Director of Karelia-Upofloor Ltd, 2006-07; and Managing Director of Järvi-Suomen Portti Osuuskunta, 2008-.
Tulikivi Corporation share ownership: No shareholding
MAARIT TOIVANEN-KOIVISTO (b. 1954) M.Sc. (Econ.), Professional Development Diploma, President of Onvest Oy Member of the Board of Directors of Tulikivi Corporation since 2007.
Other key positions of trust: Chairman of the Board of
BOARD OF DIRECTORS 19
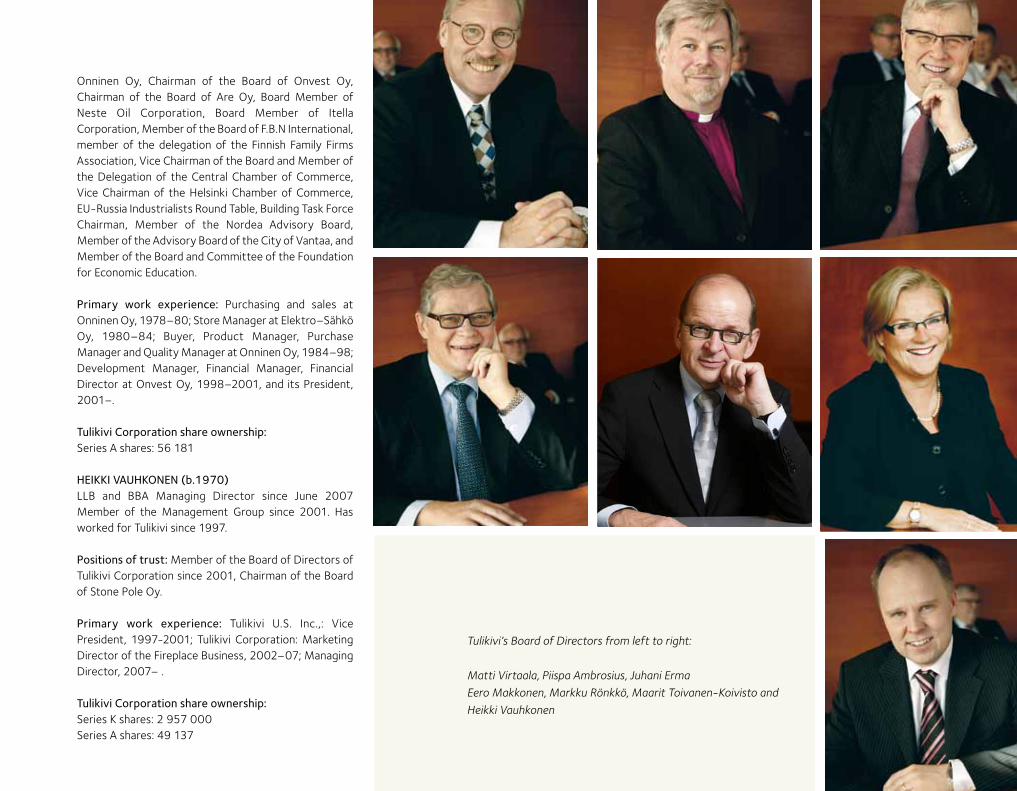
Tulikivi’s Board of Directors from left to right:
Matti Virtaala, Piispa Ambrosius, Juhani Erma
Eero Makkonen, Markku Rönkkö, Maarit Toivanen-Koivisto and
Heikki Vauhkonen
Onninen Oy, Chairman of the Board of Onvest Oy, Chairman of the Board of Are Oy, Board Member of Neste Oil Corporation, Board Member of Itella Corporation, Member of the Board of F.B.N International, member of the delegation of the Finnish Family Firms Association, Vice Chairman of the Board and Member of the Delegation of the Central Chamber of Commerce, Vice Chairman of the Helsinki Chamber of Commerce, EU-Russia Industrialists Round Table, Building Task Force Chairman, Member of the Nordea Advisory Board, Member of the Advisory Board of the City of Vantaa, and Member of the Board and Committee of the Foundation for Economic Education.
Primary work experience: Purchasing and sales at Onninen Oy, 1978–80; Store Manager at Elektro–Sähkö Oy, 1980–84; Buyer, Product Manager, Purchase Manager and Quality Manager at Onninen Oy, 1984–98; Development Manager, Financial Manager, Financial Director at Onvest Oy, 1998–2001, and its President, 2001–.
Tulikivi Corporation share ownership: Series A shares: 56 181 HEIKKI VAUHKONEN (b.1970)LLB and BBA Managing Director since June 2007 Member of the Management Group since 2001. Has worked for Tulikivi since 1997.
Positions of trust: Member of the Board of Directors of Tulikivi Corporation since 2001, Chairman of the Board of Stone Pole Oy.
Primary work experience: Tulikivi U.S. Inc.,: Vice President, 1997-2001; Tulikivi Corporation: Marketing Director of the Fireplace Business, 2002–07; Managing Director, 2007– .
Tulikivi Corporation share ownership:Series K shares: 2 957 000Series A shares: 49 137
20 MANAGEMENT GROUP
Tulikivi-konsernin johtoryhmä vasemmalta oikealle:
Heikki Vauhkonen, Juha Sivonen, Jouko Toivanen,
Mirja Vänttinen, Anu Vauhkonen ja Arja Lehikoinen.
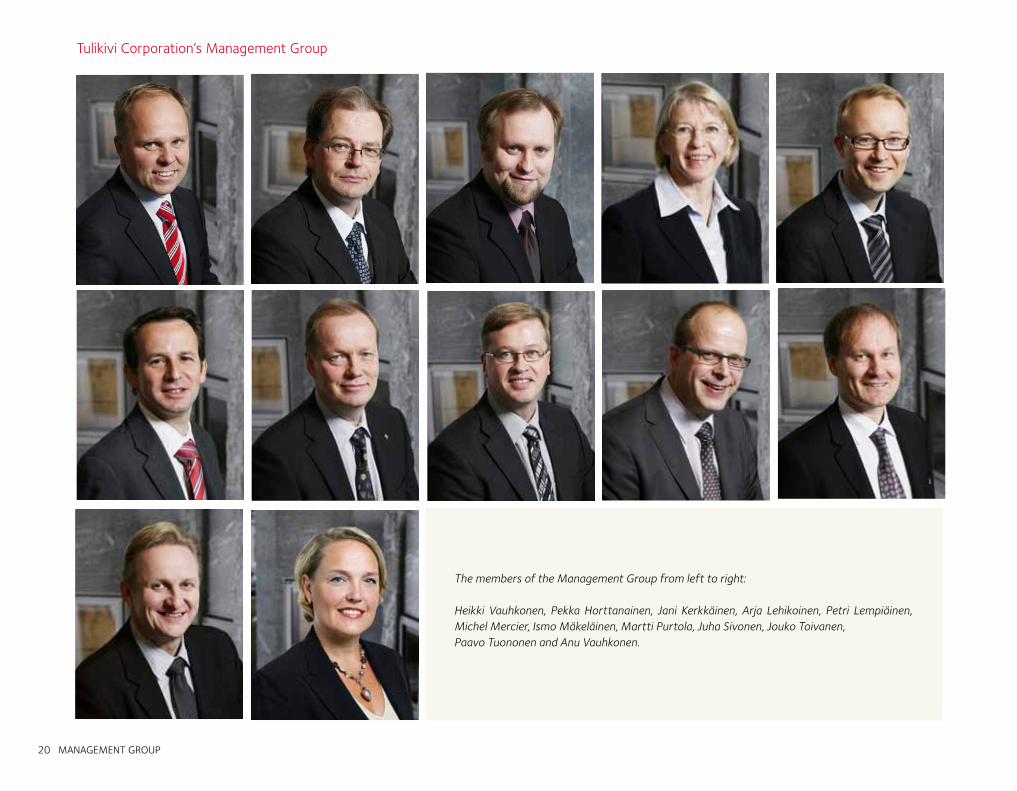
Tulikivi Corporation’s Management Group
The members of the Management Group from left to right:
Heikki Vauhkonen, Pekka Horttanainen, Jani Kerkkäinen, Arja Lehikoinen, Petri Lempiäinen, Michel Mercier, Ismo Mäkeläinen, Martti Purtola, Juha Sivonen, Jouko Toivanen, Paavo Tuononen and Anu Vauhkonen.
MANAGEMENT GROUP 21
HEIKKI VAUHKONEN (b. 1970)LLB and BBA. Managing Director since June 2007. Member of the Management Group since 2001. Has worked for Tulikivi since 1997.
Positions of trust: Member of the Board of Directors of Tulikivi Corporation since 2001, Chairman of the Board of Stone Pole Oy.
Primary work experience: Tulikivi U.S. Inc.: Vice President, 1997-2001; Tulikivi Corporation: Marketing Director of the Fireplace Business, 2002-2007, Managing Director 2007-.
Tulikivi Corporation share ownership:Series K shares: 2 957 000Series A shares: 49 137
PEKKA HORTTANAINEN (b. 1963) B.Sc. (Eng.). Director, product development, purchases and technical customer service. Member of the Management Group since 2009. Has worked for Tulikivi since 2001.
Positions of trust: No positions of trust.
Primary work experience: Halton Oy: Product Development Engineer 1988, Project Manager 1989, Halton Bethune S.A. France: Product Development Manager 1992-1994, Halton Oy: Technical Expert 1994, Product Manager 1997–2007, Tulikivi Corporation Product Development Manager 2001, Product Development Director 2003, Product Development Manager 2006, Development Manager 2008, Product Development Director 2009-.
Tulikivi Corporation share ownership:No shareholding
JANI KERKKÄNEN (b.1978) B.Sc. (Eng.). Financial Director. Member of the Management Group since 2009. Has worked for Tulikivi since 2004.
Positions of trust: No positions of trust.
Primary work experience: Tulikivi Group: Project Manager 2004, Accounting Manager 2005-2007, Financial Manager 2007-2009, Financial Director 2009-.
Tulikivi Corporation share ownership:Series A shares: 300
ARJA LEHIKOINEN (b.1954) M.Sc. (Econ.), MBA. Financing Director. Member of the Management Group since 1984. Has worked for Tulikivi since 1984.
Positions of trust: Finnish Stone Research Foundation, Board member 2003-2009.
Primary work experience: Tilitoimisto Tietokate Oy (accounting firm): Office Manager 1979-1982; Juuan Tili-ja kiinteistötoimisto (accounting and real estate firm): Office Manager 1982-1984; Tulikivi Corporation and the Tulikivi Group: Financial Manager/Financial Director 1984-2001, the Tulikivi Group: Financing Director 2001-.
Tulikivi Corporation share ownership:Series A shares: 66 120
PETRI LEMPIÄINEN (b.1969) Master of Education. Human Resources Director. Member of the Management Group since 2009. Has worked for Tulikivi since 2006
Positions of trust: No positions of trust.
Primary work experience: Abloy Oy, Personnel Development Manager 1998-2004, Production Manager 2004-2006; Tulikivi Corporation, Human Resources Manager 2006-2009, Human Resources Director 2009-.
Tulikivi Corporation share ownership:Series A shares: 500
MICHEL MERCIER (b.1966) B.Sc. (Eng.) (ISARA, France) Export Director. Member of the Management Group since 2009. Has worked for Tulikivi since 1997.
Positions of trust: No positions of trust.
Primary work experience: Rhône-Poulenc Pepro: Sales Representative 1990-1993, Rhône-Poulenc Ceres: Head of Finance and Logistics 1993-1994, Export Manager 1994-1997, Tulikivi Corporation: Export Man-ager, France and Benelux 1997-2002, Area Manager Middle Europe 2002-2006, Export Manager 2006-2009, Export Director 2009-.
Tulikivi Corporation share ownership:Series A shares: 1 000
ISMO MÄKELÄINEN (b.1962) Master Builder. Head of Production. Member of the Management Group since 2009. Has worked for Tulikivi subsidiary Kivia Oy since 1999. Has worked for Tulikivi since 2007.
Positions of trust: No positions of trust.
Primary work experience: Municipality of Nurmes: Master Builder, Planning 1987, Teollisuuden Voima Oy/Posiva Oy: General Foreman 1987-1990, Rakennusliike Mustonen Ky: General Foreman 1990-1991, Kainuu
22 MANAGEMENT GROUP
Regional Environment Centre: Site Manager 1991, Kuhmon Lämpö Oy: General Foreman/Construction Supervisor 1991-1992, Posiva Oy: Site Manager 1993-1998, Kivia Oy: Production Manager 1999-2004/Sales Manager 2002-2004, Kivia Oy/Tulikivi Corporation: Plant Manager at Kuhmo and Suomussalmi 2005-2007, Tulikivi Corporation: Production Manager, Soapstone Business 2007-2008, Production Manager, Fireplace Business 2008-2009, Head of Production 2009-.
Tulikivi Corporation share ownership:Series A shares: 1 000
MARTTI PURTOLA (b. 1966) B.Sc. (Eng.). Director, Business Development and Lining Stone Business. Member of the Management Group since 2009. Has worked for Tulikivi between 1999-2006 and from December 2008.
Positions of trust: No positions of trust.
Primary work experience: Ilmair Oy: Product Development Manager 1992-1997, Halton Oy: Project Manager 1997-1999, Tulikivi Corporation: Manager of the Lining Stone Business 1999-2001, Director of the Lining Stone Business 2001-2003, Area Manager Germany 2003-2005, Product Manager, Fireplaces Business 2005-2006; Kesla Oyj: Business Development Manager 2007-2008, Tulikivi Corporation: Business Development Manager 2008-.
Tulikivi Corporation share ownership:No shareholding
JUHA SIVONEN (b.1962) M.Sc. (Civil Eng.). Sales Director. Member of the Management Group since 1987. Has worked for Tulikivi since 1987.
Positions of trust: Chairman of the Board of Tulisija- ja savupiippuyhdistys TSY ry (Fireplace and Chimney Association).
Primary work experience: Suomen Vuolukivi Oy: Development Engineer 1987-1988, sales engineer, 1988–1989 and Production Manager, 1989-1990, The New Alberene Stone Co Virginia, USA: Project Manager 1991, President 1992; Tulikivi Corporation: Production Manager 1993-1996, Exel Oy: Product Manager 1997, Tulikivi Corporation: Marketing Director 1998–1999, Business Unit Manager 2000-2001, Managing Director 2001–2007, Director of the Fireplace Business, 2007-2009, Sales Director 2009-.
Tulikivi Corporation share ownership:Series K shares: 100 000Series A shares: 1 000
JOUKO TOIVANEN (b.1967) D.Sc. (Tech.), M.Sc. (Eng.). Director of the Natural Stone Products Business. Member of the Management Group since 1995. Has worked for Tulikivi since 1993.
Positions of trust: Member of the Board of the Finnish Natural Stone Association.
Primary work experience: Tulikivi Corporation: Accounting Assistant 1993-1994, Accounting Manager 1995-1997, Tulikivi Corporation Financial Manager 1997-1999, Tulikivi Group: Manager, operational accounting and management systems 1999–2001, Tulikivi Group: Financial Director 2001-2007, Director of the Natural Stone Products Business 2003–.
Tulikivi Corporation share ownership:Series A shares: 1 250
PAAVO TUONONEN (b.1961) Economist. Information Management Director. Member of the Management Group since 2009. Has worked for Tulikivi since 1994.
Positions of trust: No positions of trust.
Primary work experience: Tietotehdas Oy: Designer 1985-1989, Piitteri Oy: Managing Director 1990, Erisoft Oy: System Designer 1991-1992, Piitteri Oy: Managing Director 1993, Tulikivi Corporation: IT support 1994, Mittakivi Oy: Office/Finance Manager 1995-2002, Tulikivi Corporation: IT Manager 1997-2001, Information Management Director 2001-2006, Head of Customer Service Centre 2002-2006, IT Manager 2006-2009, Information Management Director 2009-.Tulikivi Corporation share ownership:No shareholding.
ANU VAUHKONEN (b.1972) M.A., Communication management training at The Insti-tute of Marketing. Communications Director. Member of the Management Group since 2001. Has worked for Tulikivi since 1997.
Positions of trust: Board Member of the Family Business Network Finland and Chairman of its PR work group.
Primary work experience: Wärtsilä Diesel Oy: PR 1995-1997, Tulikivi Corporation: PR 1998, Tulikivi U.S. Inc.: PR and Communications Manager 1998-2001, Tulikivi Corporation: Communications Director 2001-.
Tulikivi Corporation share ownership:Series K shares: 500Series A shares: 500
CORPORATE GOVERNANCE STATEMENT 23
Stone Company, Inc, which currently has no business operations, is also a Group company. The Group has interests in associated companies Stone Pole Oy and Leppävirran Matkailukeskus Oy. The Board of Directors, which is elected by the Annual General Meeting, the Board committees, the Managing Director and the Management Group, which assists the Managing Director, are responsible for the Tulikivi Group’s administration and operations.
DESCRIPTION OF THE COMPOSITION AND OPERATIONS OF THE BOARD OF DIRECTORS AND THE BOARD COMMITTEESThe Board of Directors is responsible for the company’s administration and the due organisation of operations. The Board of Directors is composed of no less than five and no more than seven members. The Annual General Meeting elects the members for terms of one year. The Board of Directors elects a Chairman from among its members. The Board of Directors of the Group’s parent company decides on the composition of the subsidiaries’ Boards of Directors.
The governance of Tulikivi Corporation and its subsidiaries is based on the law, the Articles of Association and the Finnish Corporate Governance Code which entered into force on 1 January 2009. This Corporate Governance Statement has been prepared in accordance with rec-ommendation 51 of the Finnish Corporate Governance Code and Chapter 2(6)(3) of the Finnish Securities Markets Act.
Tulikivi Corporation diverges from recommendation 22 of the Corporate Governance Code, according to which the board should appoint its committee members and chairmen from among the directors. The Nomination Committee has three members, one of whom may be elected from outside the Board of Directors. The reason for the divergence from the Corporate Governance Code is that, in view of the company’s ownership structure and stage of development, it is appropriate to aim for a Nomination Committee composition that reflects the owners’ views directly, from outside the Board, while at the same time guaranteeing a sufficiently wide range of contacts via which suitable Board candidates can be found.
The Corporate Governance Code is available to the public at the website of the Securities Market Association, www.cgfinland.fi.
Tulikivi Corporation prepares the consolidated financial statements and interim reports in accordance with the International Financial Reporting Standards (IFRS), which have been adopted by the EU. In communications, the Group complies with the Securities Markets Act, applicable standards of the Financial Supervisory Authority and NASDAQ OMX Helsinki’s regulations. The Board of Directors’ Report and the parent company’s financial statements are prepared in accordance with the Finnish Accounting Act and the instructions and statements of the Finnish Accountancy Board.
ORGANISATION OF THE TULIKIVI GROUPThe companies included in the Tulikivi Group are the parent company Tulikivi Corporation, its branch in Germany, Tulikivi Oyj Niederlassung Deutschland, and the subsidiaries Kivia Oy, AWL-Marmori Oy, Tulikivi U.S. Inc. (USA) and OOO Tulikivi (Russia). The New Alberene
Corporate Governance Statement 2009
24 CORPORATE GOVERNANCE STATEMENT
Composition of the Board of DirectorsTulikivi Corporation’s Annual General Meeting of 31 March 2009 elected seven members to the Board:
• Matti Virtaala, born 1951, Chairman of the Board. M.Sc. (Tech.). Board membership in several companies.
• Bishop Ambrosius, born 1945. M.Theol., B.Soc.Sc. Metropolitan of the Helsinki Orthodox Diocese.
• Juhani Erma, born 1946. LL.Lic., (trained on the Bench). Board membership in several companies.
• Eero Makkonen, born 1946. B.Sc.(Eng.). Board membership in several companies.
• Markku Rönkkö, born 1951. M.Sc. (Econ. & Bus. Admin.). Managing Director of the Järvi-Suomen Portti co-operative. Board membership in several companies.
• Maarit Toivanen-Koivisto, born 1954. M.Sc. (Econ.), Professional Development Diploma. Chairman of the Boards of Onninen Oy and Onvest Oy, Board membership in several companies.
• Heikki Vauhkonen, born 1970. LLB and BBA. Managing Director of Tulikivi Corporation.
The Board members who are independent of the company are Bishop Ambrosius, Juhani Erma, Eero Makkonen, Markku Rönkkö, Maarit Toivanen-Koivisto and Matti Virtaala. The Board members who are independent of the company’s major shareholders are Bishop Ambrosius, Juhani Erma, Eero Makkonen, Markku Rönkkö and Maarit Toivanen-Koivisto
Primary duties of the Board of DirectorsPursuant to the Limited Liability Companies Act, the Board of Directors must see to the administration of the company and the appropriate organisation of its operations. The Board of Directors is responsible for the appropriate arrangement of the control of the company accounts and finances. The Board directs and supervises the company’s operational management, appoints and dismisses the Managing Director, approves the company’s strategic objectives, budget, total invest-ments and
their allocation, and the incentive systems employed, decides on agreements that are of far-reaching consequence and the principles of risk management, ensures that the management system is operational, confirms the company’s vision, values to be complied with in operations and organisational model, approves and publishes the interim reports, annual report and financial statements, determines the company’s dividend policy and summons the General Meeting. It is the duty of the Board of Directors to promote the best interests of the company and all its shareholders.
In 2009, the company’s Board of Directors convened 21 times. The average attendance at Board meetings was 93.2 per cent.
Board CommitteesTulikivi Corporation’s Board of Directors has two committees, namely the Nomination Committee and the Audit Committee. The Board of Directors appoints the members and Chairmen of the committees.
The Nomination Committee has three members. In 2009, the committee was composed of Reijo Vauhkonen (Chairman), Bishop Ambrosius and Matti Virtaala. One member of the Nomination Committee may be elected from outside the Board of Directors. The reasons for diverging from the recommendation of the Corporate Governance Code are presented at the beginning of this Corporate Governance Statement. The duties of the Nomination Committee include the preparation of proposals for the election of directors to be presented to the general meeting, the preparation of matters relating to the compensation of directors and succession planning with respect to the directors. The Nomination Committee met three times in 2009. The average attendance at commit-tee meetings was 100 per cent.
The Audit Committee is made up of three members, who are appointed by the Board from among its members. In 2009, the committee was composed of Juhani Erma (Chairman), Markku Rönkkö and Matti Virtaala. The Audit
Committee’s task is to assist and expedite the work of the Board by dealing with issues associated with the company’s financial reporting and control and taking care of communications with the auditors. The Audit Committee met on four occasions in 2009. The average attendance at committee meetings was 87.5 per cent.
Managing DirectorTulikivi Corporation’s Managing Director is Heikki Vauhkonen. Pursuant to the Limited Liability Companies Act, the Managing Director sees to the executive management of the company in accordance with the instructions and orders given by the Board of Directors. The Managing Director must see to it that the accounts of the company are in compliance with the law and that its financial affairs have been arranged in a reliable manner. The Managing Director must supply the Board and its members with the information necessary for the Board to perform its duties. The Managing Director may undertake measures that are unusual or extensive in view of the scope and nature of the ac-tivities of the company only if so authorised by the Board of Directors or if it is not possible to wait for a decision of the Board of Directors without causing essential harm to the business operations of the company. In the latter case, the Board of Directors must be notified of the measures as soon as possible. The Managing Director is responsible for line operations, the implementation of the budget, the Tulikivi Group’s financial result, and the activities of his subordinates.
Management GroupIn the management and planning of line operations, the Managing Director is assisted by the Management Group, whose members, in addition to the Managing Director, are Pekka Horttanainen, Product Development Manager, Jani Kerkkänen, Chief Financial Officer, Arja Lehikoinen, Financial Director, Petri Lempiäinen, Human Resources Director, Michel Mercier, Export Director, Ismo Mäkeläinen, Head of Production, Martti Purtola, Head of the Lining Stone Business, Juha Sivonen, Sales Director, Jouko Toivanen, Head of the Natural Stone
eerikavoitko jatkaa tästä enkuksi + korjata taulukot
CORPORATE GOVERNANCE STATEMENT 25
Business, Paavo Tuononen, Information Management Director, and Anu Vauhkonen, Corporate Communications Director (on nursing leave).
Description of the main characteristics of the internal control and risk management systems associated with the financial reporting process
1. Description of the control environmentTulikivi’s business idea and values The Tulikivi Group specialises in fireplaces and heating equipment that produce radiant heat, and in household natural stone products. Our customers appreciate the environmentally friendly and aesthetically pleasing nature of our products, the comfort created by these products, and the benefits of wood heating. Tulikivi is a versatile company that appreciates its customers, entrepreneurship and fair play.
Environmental PolicyEngaging in mining activities requires the forming of a mining concession and an environmental permit. Produc-tion activities require an environmental permit. Mining operations are regulated by the Mining Act and environ-mental legislation. The director in charge of quarrying is responsible for making sure that mining permits are valid and up-to-date.
Tulikivi’s environmental strategy is geared towards sys-tematic progress in environmental efforts in specified sub-areas. The aim of environmental work is to improve the company’s ability to use natural resources sparingly, as well as to manage processes and products in a way that minimizes their environmental loading. The Group complies with the environmental legislation and norms that concern its operations and seeks, through continuo-us improvement of operations, to engage in anticipatory environmental work to meet the Group’s internal requi-rements and the challenges posed by stakeholders. The Group acknowledges and is aware of its responsibility as an environmental operator.
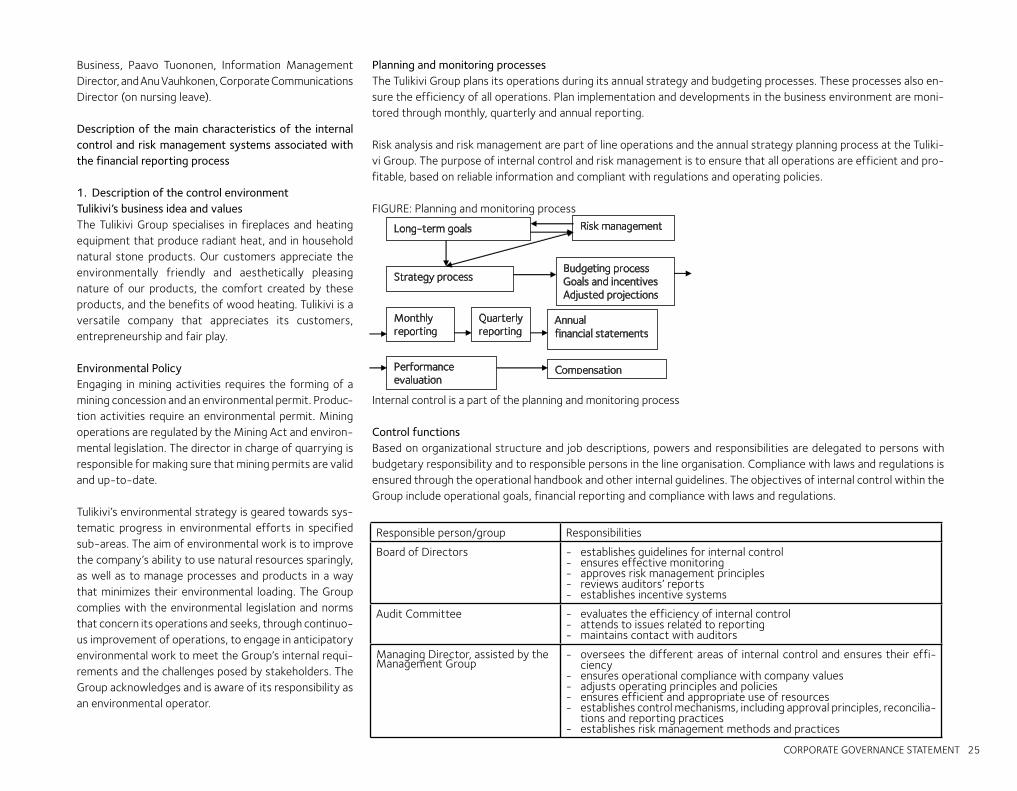
Planning and monitoring processesThe Tulikivi Group plans its operations during its annual strategy and budgeting processes. These processes also en-sure the efficiency of all operations. Plan implementation and developments in the business environment are moni-tored through monthly, quarterly and annual reporting.
Risk analysis and risk management are part of line operations and the annual strategy planning process at the Tuliki-vi Group. The purpose of internal control and risk management is to ensure that all operations are efficient and pro-fitable, based on reliable information and compliant with regulations and operating policies.
FIGURE: Planning and monitoring process
Internal control is a part of the planning and monitoring process
Control functionsBased on organizational structure and job descriptions, powers and responsibilities are delegated to persons with budgetary responsibility and to responsible persons in the line organisation. Compliance with laws and regulations is ensured through the operational handbook and other internal guidelines. The objectives of internal control within the Group include operational goals, financial reporting and compliance with laws and regulations.
Responsible person/group Responsibilities
Board of Directors - establishes guidelines for internal control- ensures effective monitoring- approves risk management principles- reviews auditors’ reports- establishes incentive systems
Audit Committee - evaluates the efficiency of internal control- attends to issues related to reporting- maintains contact with auditors
Managing Director, assisted by the Management Group
- oversees the different areas of internal control and ensures their effi-ciency
- ensures operational compliance with company values- adjusts operating principles and policies- ensures efficient and appropriate use of resources- establishes control mechanisms, including approval principles, reconcilia-
tions and reporting practices- establishes risk management methods and practices
Long-term goals
Strategy process Budgeting process Goals and incentives Adjusted projections
Monthly reporting
Quarterly reporting
Annual financial statements
Risk management
Performance evaluation
Compensation
eerikavoitko jatkaa tästä enkuksi + korjata taulukot
26 CORPORATE GOVERNANCE STATEMENT
Internal control is carried out not only by responsible persons within the company, but also by the auditors through expanded audits on specific items and operations. In 2009, the auditors performed expanded audits on inventories, billing and receivables, internal reporting for management, and payment transaction arrangements. Expanded audits are also used to monitor and evaluate the efficiency of operation-specific control mechanisms.
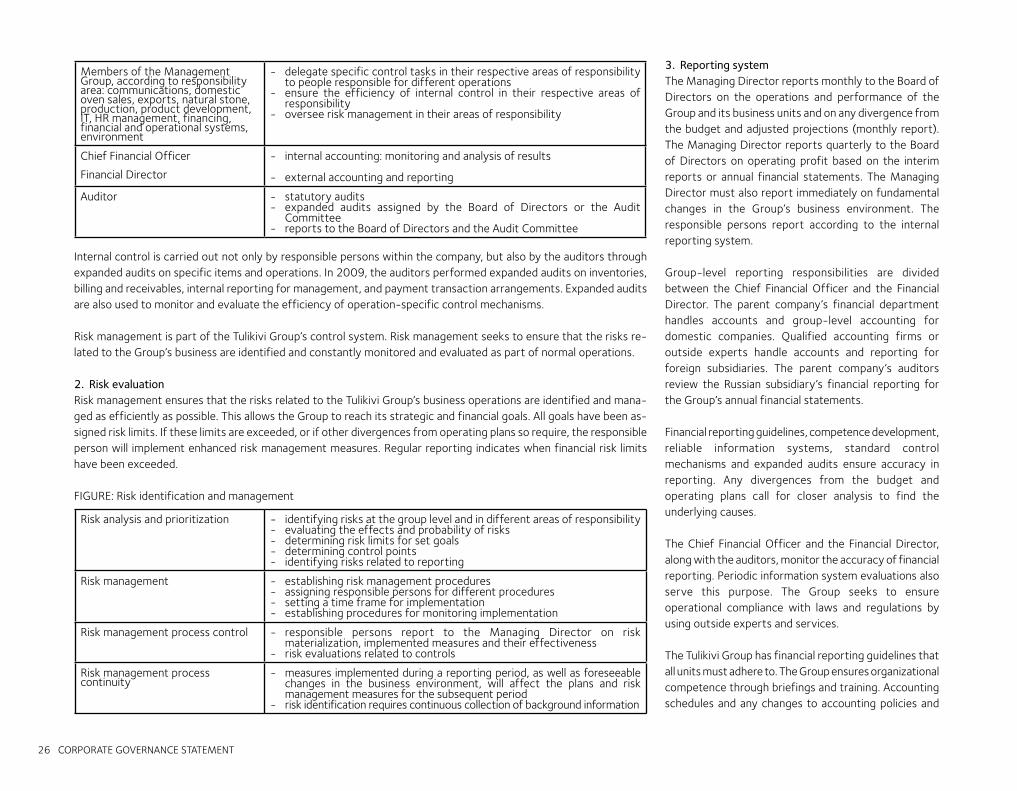
Risk management is part of the Tulikivi Group’s control system. Risk management seeks to ensure that the risks re-lated to the Group’s business are identified and constantly monitored and evaluated as part of normal operations.
2. Risk evaluationRisk management ensures that the risks related to the Tulikivi Group’s business operations are identified and mana-ged as efficiently as possible. This allows the Group to reach its strategic and financial goals. All goals have been as-signed risk limits. If these limits are exceeded, or if other divergences from operating plans so require, the responsible person will implement enhanced risk management measures. Regular reporting indicates when financial risk limits have been exceeded.
FIGURE: Risk identification and management
3. Reporting systemThe Managing Director reports monthly to the Board of Directors on the operations and performance of the Group and its business units and on any divergence from the budget and adjusted projections (monthly report). The Managing Director reports quarterly to the Board of Directors on operating profit based on the interim reports or annual financial statements. The Managing Director must also report immediately on fundamental changes in the Group’s business environment. The responsible persons report according to the internal reporting system.
Group-level reporting responsibilities are divided between the Chief Financial Officer and the Financial Director. The parent company’s financial department handles accounts and group-level accounting for domestic companies. Qualified accounting firms or outside experts handle accounts and reporting for foreign subsidiaries. The parent company’s auditors review the Russian subsidiary’s financial reporting for the Group’s annual financial statements.
Financial reporting guidelines, competence development, reliable information systems, standard control mechanisms and expanded audits ensure accuracy in reporting. Any divergences from the budget and operating plans call for closer analysis to find the underlying causes.
The Chief Financial Officer and the Financial Director, along with the auditors, monitor the accuracy of financial reporting. Periodic information system evaluations also serve this purpose. The Group seeks to ensure operational compliance with laws and regulations by using outside experts and services.
The Tulikivi Group has financial reporting guidelines that all units must adhere to. The Group ensures organizational competence through briefings and training. Accounting schedules and any changes to accounting policies and
Members of the Management Group, according to responsibility area: communications, domestic oven sales, exports, natural stone, production, product development, IT, HR management, financing, financial and operational systems, environment
- delegate specific control tasks in their respective areas of responsibility to people responsible for different operations
- ensure the efficiency of internal control in their respective areas of responsibility
- oversee risk management in their areas of responsibility
Chief Financial Officer
Financial Director
- internal accounting: monitoring and analysis of results
- external accounting and reporting
Auditor - statutory audits- expanded audits assigned by the Board of Directors or the Audit
Committee- reports to the Board of Directors and the Audit Committee
Risk analysis and prioritization - identifying risks at the group level and in different areas of responsibility- evaluating the effects and probability of risks- determining risk limits for set goals- determining control points- identifying risks related to reporting
Risk management - establishing risk management procedures- assigning responsible persons for different procedures- setting a time frame for implementation- establishing procedures for monitoring implementation
Risk management process control - responsible persons report to the Managing Director on risk materialization, implemented measures and their effectiveness
- risk evaluations related to controls
Risk management process continuity
- measures implemented during a reporting period, as well as foreseeable changes in the business environment, will affect the plans and risk management measures for the subsequent period
- risk identification requires continuous collection of background information
SALARY AND REMUNERATION REPORT 27
laws are reviewed in preparatory meetings related to the annual financial statements.
4. CommunicationsThe Communications Director is responsible for communications at the Tulikivi Group. The Group’s communications guidelines define the persons responsible for internal, external and crisis communications and the persons with the right to speak on behalf of the company. The Financial Director is responsible for compliance with the regulations related to stock exchange releases.
5. MonitoringThe efficiency of internal control is evaluated regularly in conjunction with management and governance and, specifically, based on audit reports. In financial reporting, continual monitoring measures include comparing goals with actual results, implementing reconciliations and monitoring the regularity of operational reports.
The Board of Directors’ annual plan includes planning and monitoring meetings. The Group’s information systems are largely well established, and outside experts regularly evaluate their reliability. 6. AuditingThe Auditor is elected at the Annual General Meeting for a term ending at the conclusion of the subsequent Annual General Meeting. The auditor has been KPMG Oy Ab, Authorized Public Accountants.
Board membersThe annual remuneration of Board members is EUR 15 600, of which 60 per cent will be paid in cash and 40 per cent in the form of Series A shares in Tulikivi Corporation. Each Board member received 4 837 Series A shares. Unless the Board of Directors grants express permission in advance, members of the Board are not allowed to surrender any shares received in this manner until they leave the Board. In addition, the Chairman of the Board of Directors will be paid a EUR 6 240 monthly fee and the director serving as secretary to the Board of Directors a EUR 728 monthly fee. Board members who perform non-Board assignments for the company shall be reimbursed on the basis of time rates and bills approved by the Board of Directors.
Managing DirectorThe salary of the Managing Director amounted to EUR 296 890 in 2009 including EUR 60 000 in incentive pay for 2008 and 4 000 Tulikivi Corporation A shares in accordance with the share-based incentive plan presented below. The Managing Director will not receive incentive pay for 2009. In addition to his statutory pension, supplementary pension plans entitle the Managing Director to retire at the age of 60. Supplementary pension accrues as agreed relative to the salary paid during the years of employment. The Managing Director’s period of notice is three months. If the company terminates his employment contract, the period of notice is 12 months. The Managing Director does not receive redundancy pay if his employment is terminated.
Incentive Plan Tulikivi Corporation has an incentive plan which includes a share-based incentive plan for key personnel of the company / it´s business areas and an incentive pay scheme for all personnel.
The Board decides on the calculation method and amount of these incentive plan each year. The incentive plan’s
principles and decision-making process are outlined in the annual report and on the Internet.
Share based incentive planThe Plan includes three earning periods which are calendar years 2008, 2009 and 2010. Under the plan, the bonus would be based on any improvement in Group’s result after financial items and on any improvement in cash flow from operating activities. A maximum total of about 360 000 Series A shares and a cash payment corresponding to the value of the shares can be paid as rewards on the basis of the entire share-based incentive plan. The bonus could amount to a maximum of 175 000 Tulikivi Corporation Series A shares and a cash payment corresponding to the value of the shares in 2009. No incentive plan bonus was accumulated on the 2009 earnings period. Based on the terms of the plan 5 800 Series A shares were granted to the members of management group and key personnel in 2008.
Incentive pay schemeThe incentive pay scheme covers all personnel and is based on the Group’s earnings and productivity, and the managing director and key persons also have personal targets in addition to this. For 2009, the members of the Management Group will receive EUR 33 225 (for 2008 EUR 26 158) incentive pay (not including the Managing Director’s incentive pay). The basis of incentive pay was the achievement of personal goals in 2009. The result for 2009 did not justify the payment of incentive pay.
AuditThe auditor is elected at the Annual General Meeting for a term ending at the conclusion of the subsequent Annual General Meeting. The auditor has been KPMG Oy Ab, Authorized Public Accountants. In 2009, the auditing firm were paid a total of EUR 101 223 salaries and fees by the Group, of which the audit accounted for EUR 46 421.
A Salary and Remuneration report
28 INFORMATION FOR SHAREHOLDERS
Information for Shareholders
ANNUAL GENERAL MEETINGThe Annual General Meeting of Tulikivi Corporation will be held in the Kivikylä auditorium in Nunnanlahti, Juuka, on April 14, 2009, starting at 13:00. Financial statement documents will be available for inspection at the company’s Internet site and head office in Nunnanlahti as from March 16, 2009. Copies of these documents will be sent to shareholders upon request. The right to participate in the Annual General Meeting rests with a shareholder who by March 31, 2009 at the latest has been registered in the company’s shareholder list that is maintained by Euroclear Finland Ltd. Shareholders who wish to attend the Annual General Meeting must notify the company thereof by April 4, 2009, either by telephoning at +358 207 636 251 OR +358 207 636 322; by emailing [email protected] or by writing to the address Tulikivi Corporation / Annual General Meeting, FI-83900 Juuka. Holders of nominee registered shares: instructions for the partisipants in the general meeting in address www.tulikivi.com >Investors>General Meetings
PAYMENT OF DIVIDENDSThe Board of Directors proposes to the Annual General Meeting that the following dividends be paid for the fiscal year 2009:
On Series A shares 0.0250/shareOn Series K shares 0.0233/share
Dividends decided by the Annual General Meeting will be paid on shares that have been recorded on the record date in the shareholder list that is maintained by Euro-clear Finland Ltd. The record date for the dividend payout is April 19, 2009. The Board of Directors proposes to the Annual General Meeting that the dividend payout date be April 26, 2009.
SHARE REGISTER We request shareholders to report any changes in their personal details, address and share ownership to the book-entry register in which the shareholder has a bookentry securities account.
FINANCIAL REPORTS Tulikivi Corporation will publish the following financial reports in 2009:
Financial statement bulletin for 2009 February 11, 2010Annual Report for 2009 week 11Interim Report for January-March April 21, 2010Interim Report for January-June August 12, 2010Interim Report for January-September October 20, 2010
The Annual Report, Interim Reports and the company’s stock exchange bulletins are published in Finnish and English.
INFORMATION FOR SHAREHOLDERS 29
The Annual Report is published on the company’s website on the week 11. Financial reports are posted on the company’s site, www.tulikivi. com, on their day of publication. If you have questions concerning investor relations, please contact the company’s Financing Director Arja Lehikoinen at tel. +358 207 636 260.
Analysts following Tulikivi Corporation: Hanna-Maria Heikkinen / Nordea Markets,tel. +358 9 1655 9926, [email protected]; Antti Koskivuori / Evli Equity Research, tel. +358 9 4766 9773, [email protected] and Matias Rautionmaa / Pohjola Bank, tel. +358 10 252 4408, [email protected].
19.2. Share repurchase 19.2.200910.2. Financial Statement Release 1-12/20082.2. Invitation to Tulikivi Corporation s financial review 2008 press conference on 10 February 200930.1. Tulikivi to launch a programme of profitability and concentration measures29.1. Tulikivi Corporation s Annual Summary 200823.1. Share repurchase 23.1.200922.1. Share repurchase 22.1.200921.1. Share repurchase 21.1.200920.1. Share repurchase 20.1.200919.1. Share repurchase 19.1.200916.1. Share repurchase 16.1.200915.1. Share repurchase 15.1.200912.1. Share repurchase 12.1.20099.1. Share repurchase 9.1.20098.1. Share repurchase 8.1.20097.1. Share repurchase 7.1.20095.1. Share repurchase 5.1.2009
Tulikivi Corporation’s Stock Exchange releases 2009
20.10.2009 Interim report 01-09/200924.9. Tulikivi Corporation’s General meeting and Financial Releases in 2010 21.7. Interim report 01-06/200916.6. Changes in ownership of treasury shares 21.4. Interim report 01-03/2009 31.3. Resolutions of the Annual General Meeting of Tu-likivi Corporation30.3. Share repurchase 30.3.200927.3. Share repurchase 27.3.200926.3. Share repurchase 26.3.200924.3. Share repurchase 24.3.200923.3. The Tulikivi Group has concluded its codetermina-tion talks23.3. Share repurchase 23.3.200920.3. Share repurchase 20.3.200919.3. Share repurchase 10.3.200918.3. Share repurchase 18.3.200916.3. Share repurchase 16.3.200913.3. Share repurchase 13.3.200912.3. Share repurchase 12.3.200911.3. Share repurchase 11.3.200910.3. Annual Report 200810.3. Share repurchase 10.3.20099.3. Share repurchase 9.3.20096.3. Summons to the Annual General Meeting of Tulikivi Corporation 6.3. Share repurchase 6.3.20094.3. Share repurchase 4.3.20093.3. Share repurchase 3.3.20092.3. Share repurchase2.3.200927.2. Share repurchase 27.2.200926.2. Share repurchase 26.2.200925.2. Share repurchase 25.2.200924.2. Share repurchase 24.2.200923.2. Share repurchase 23.2.200920.2. Share repurchase 20.2.2009
Board of Directors’ Report and Financial Statements of Tulikivi Corporation for year 2009
Board of Directors’ Report 31-35Consolidated Financial Statements, IFRS 36Consolidated Statement of Comprehensive Income 36Consolidated Statement of Financial Position 37Consolidated Statement of Cash Flows 38Consolidated Statement of Changes in Equity 39Notes to the Consolidated Financial Statements 40-73Key Financial Indicators 74-75Calculation of Key Ratios 76Parent Company Financial Statements, FAS 77Parent Company Income Statement 77Parent Company Balance Sheet 78Parent Company Cash Flow Statement 79Notes to the Parent Company Financial Statements 80-85Shares and Shareholders of Tulikivi Corporation 86Signatures to Report of the Board and Financial Statements 87Auditors’ Report 87 These are the financial statements of Tulikivi Corporation, that have been prepared in accordance with International Financial Reporting Standards (IFRS) and in compliance with the IAS and IFRS standards as well as the SIC and IF-RIC interpretations upon force as at December 31, 2009.
The term IFRS refers to the standards and interpretations upon these in the Finnish Accounting Act and regulations issued by virtue to it and endorsed in the EU in accordan-ce with the procedure defined in the EU Regulation (EY) No 1606/2002. The notes to the consolidated financial statements also conform with Finnish Accounting and Corporate Legislation.
The consolidated financial statements are presented in thousands of Euros.
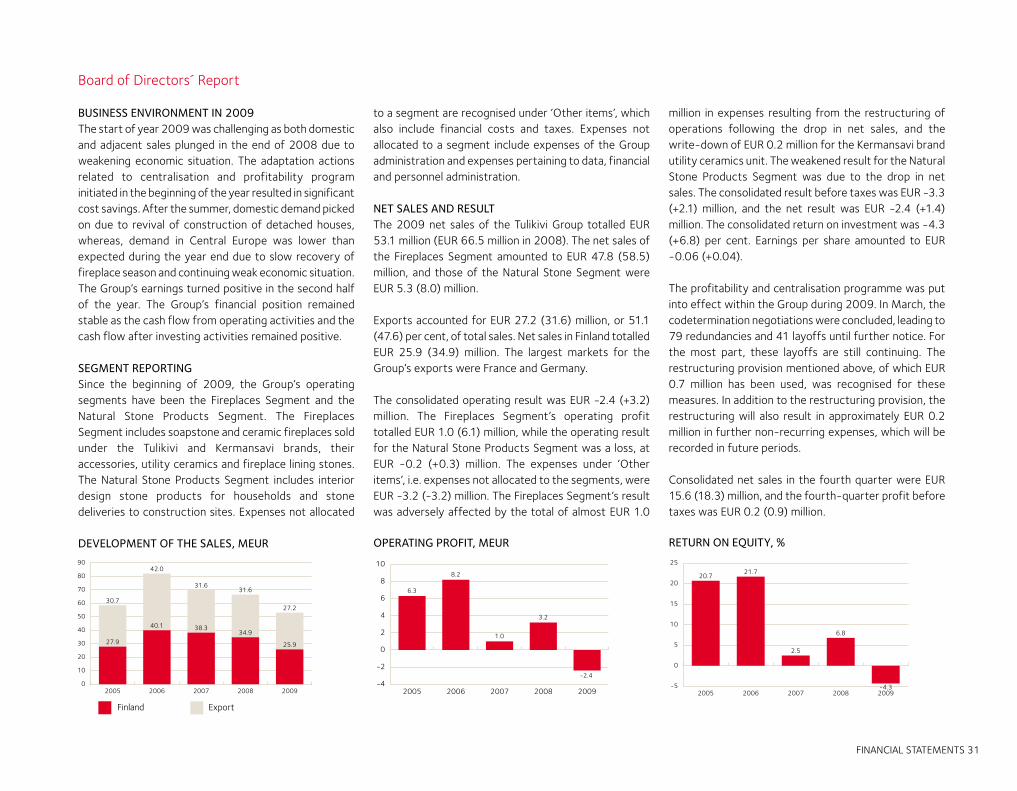
FINANCIAL STATEMENTS 31
Board of Directors´ Report
BUSINESS ENVIRONMENT IN 2009The start of year 2009 was challenging as both domestic and adjacent sales plunged in the end of 2008 due to weakening economic situation. The adaptation actions related to centralisation and profitability program initiated in the beginning of the year resulted in significant cost savings. After the summer, domestic demand picked on due to revival of construction of detached houses, whereas, demand in Central Europe was lower than expected during the year end due to slow recovery of fireplace season and continuing weak economic situation. The Group’s earnings turned positive in the second half of the year. The Group’s financial position remained stable as the cash flow from operating activities and the cash flow after investing activities remained positive.
SEGMENT REPORTINGSince the beginning of 2009, the Group’s operating segments have been the Fireplaces Segment and the Natural Stone Products Segment. The Fireplaces Segment includes soapstone and ceramic fireplaces sold under the Tulikivi and Kermansavi brands, their accessories, utility ceramics and fireplace lining stones. The Natural Stone Products Segment includes interior design stone products for households and stone deliveries to construction sites. Expenses not allocated
to a segment are recognised under ‘Other items’, which also include financial costs and taxes. Expenses not allocated to a segment include expenses of the Group administration and expenses pertaining to data, financial and personnel administration.
NET SALES AND RESULTThe 2009 net sales of the Tulikivi Group totalled EUR 53.1 million (EUR 66.5 million in 2008). The net sales of the Fireplaces Segment amounted to EUR 47.8 (58.5) million, and those of the Natural Stone Segment were EUR 5.3 (8.0) million.
Exports accounted for EUR 27.2 (31.6) million, or 51.1 (47.6) per cent, of total sales. Net sales in Finland totalled EUR 25.9 (34.9) million. The largest markets for the Group’s exports were France and Germany.
The consolidated operating result was EUR -2.4 (+3.2) million. The Fireplaces Segment’s operating profit totalled EUR 1.0 (6.1) million, while the operating result for the Natural Stone Products Segment was a loss, at EUR -0.2 (+0.3) million. The expenses under ‘Other items’, i.e. expenses not allocated to the segments, were EUR -3.2 (-3.2) million. The Fireplaces Segment’s result was adversely affected by the total of almost EUR 1.0
million in expenses resulting from the restructuring of operations following the drop in net sales, and the write-down of EUR 0.2 million for the Kermansavi brand utility ceramics unit. The weakened result for the Natural Stone Products Segment was due to the drop in net sales. The consolidated result before taxes was EUR -3.3 (+2.1) million, and the net result was EUR -2.4 (+1.4) million. The consolidated return on investment was -4.3 (+6.8) per cent. Earnings per share amounted to EUR -0.06 (+0.04).
The profitability and centralisation programme was put into effect within the Group during 2009. In March, the codetermination negotiations were concluded, leading to 79 redundancies and 41 layoffs until further notice. For the most part, these layoffs are still continuing. The restructuring provision mentioned above, of which EUR 0.7 million has been used, was recognised for these measures. In addition to the restructuring provision, the restructuring will also result in approximately EUR 0.2 million in further non-recurring expenses, which will be recorded in future periods. Consolidated net sales in the fourth quarter were EUR 15.6 (18.3) million, and the fourth-quarter profit before taxes was EUR 0.2 (0.9) million.
����
����
��������
����
����
���� ��������
����
���� ���� ���� ���� �����
��
��
��
��
��
��
��
��
��
������� � ��
DEVELOPMENT OF THE SALES, MEUR
���
���
���
���
����
���� ���� ���� ���� ������
��
�
�
�
�
�
��
OPERATING PROFIT, MEUR
��������
���
���
�������� ���� ���� ���� ����
��
�
�
��
��
��
��
RETURN ON EQUITY, %
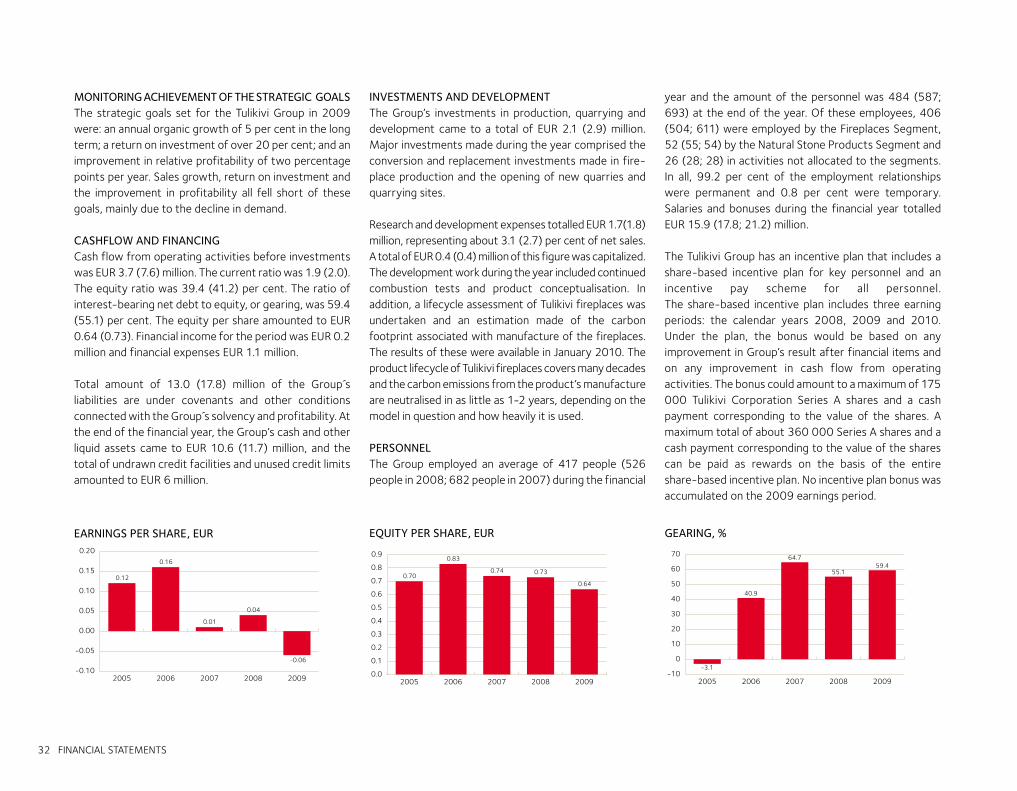
32 FINANCIAL STATEMENTS
MONITORING ACHIEVEMENT OF THE STRATEGIC GOALSThe strategic goals set for the Tulikivi Group in 2009 were: an annual organic growth of 5 per cent in the long term; a return on investment of over 20 per cent; and an improvement in relative profitability of two percentage points per year. Sales growth, return on investment and the improvement in profitability all fell short of these goals, mainly due to the decline in demand.
CASHFLOW AND FINANCING Cash flow from operating activities before investments was EUR 3.7 (7.6) million. The current ratio was 1.9 (2.0). The equity ratio was 39.4 (41.2) per cent. The ratio of interest-bearing net debt to equity, or gearing, was 59.4 (55.1) per cent. The equity per share amounted to EUR 0.64 (0.73). Financial income for the period was EUR 0.2 million and financial expenses EUR 1.1 million.
Total amount of 13.0 (17.8) million of the Group´s liabilities are under covenants and other conditions connected with the Group s solvency and profitability. At the end of the financial year, the Group’s cash and other liquid assets came to EUR 10.6 (11.7) million, and the total of undrawn credit facilities and unused credit limits amounted to EUR 6 million.
INVESTMENTS AND DEVELOPMENTThe Group’s investments in production, quarrying and development came to a total of EUR 2.1 (2.9) million. Major investments made during the year comprised the conversion and replacement investments made in fire-place production and the opening of new quarries and quarrying sites. Research and development expenses totalled EUR 1.7(1.8) million, representing about 3.1 (2.7) per cent of net sales. A total of EUR 0.4 (0.4) million of this figure was capitalized. The development work during the year included continued combustion tests and product conceptualisation. In addition, a lifecycle assessment of Tulikivi fireplaces was undertaken and an estimation made of the carbon footprint associated with manufacture of the fireplaces. The results of these were available in January 2010. The product lifecycle of Tulikivi fireplaces covers many decades and the carbon emissions from the product’s manufacture are neutralised in as little as 1-2 years, depending on the model in question and how heavily it is used.
PERSONNELThe Group employed an average of 417 people (526 people in 2008; 682 people in 2007) during the financial
year and the amount of the personnel was 484 (587; 693) at the end of the year. Of these employees, 406 (504; 611) were employed by the Fireplaces Segment, 52 (55; 54) by the Natural Stone Products Segment and 26 (28; 28) in activities not allocated to the segments. In all, 99.2 per cent of the employment relationships were permanent and 0.8 per cent were temporary. Salaries and bonuses during the financial year totalled EUR 15.9 (17.8; 21.2) million.
The Tulikivi Group has an incentive plan that includes a share-based incentive plan for key personnel and an incentive pay scheme for all personnel. The share-based incentive plan includes three earning periods: the calendar years 2008, 2009 and 2010. Under the plan, the bonus would be based on any improvement in Group’s result after financial items and on any improvement in cash flow from operating activities. The bonus could amount to a maximum of 175 000 Tulikivi Corporation Series A shares and a cash payment corresponding to the value of the shares. A maximum total of about 360 000 Series A shares and a cash payment corresponding to the value of the shares can be paid as rewards on the basis of the entire share-based incentive plan. No incentive plan bonus was accumulated on the 2009 earnings period.
����
����
����
����
�����
���� ���� ���� ���� ���������
�����
����
����
����
����
����
EARNINGS PER SHARE, EUR
����
����
���� ����
����
���� ���� ���� ���� �������
���
���
���
���
���
���
���
���
���
EQUITY PER SHARE, EUR GEARING, %
����
����
����
��������
���� ���� ���� ���� �������
�
��
��
��
��
��
��
��
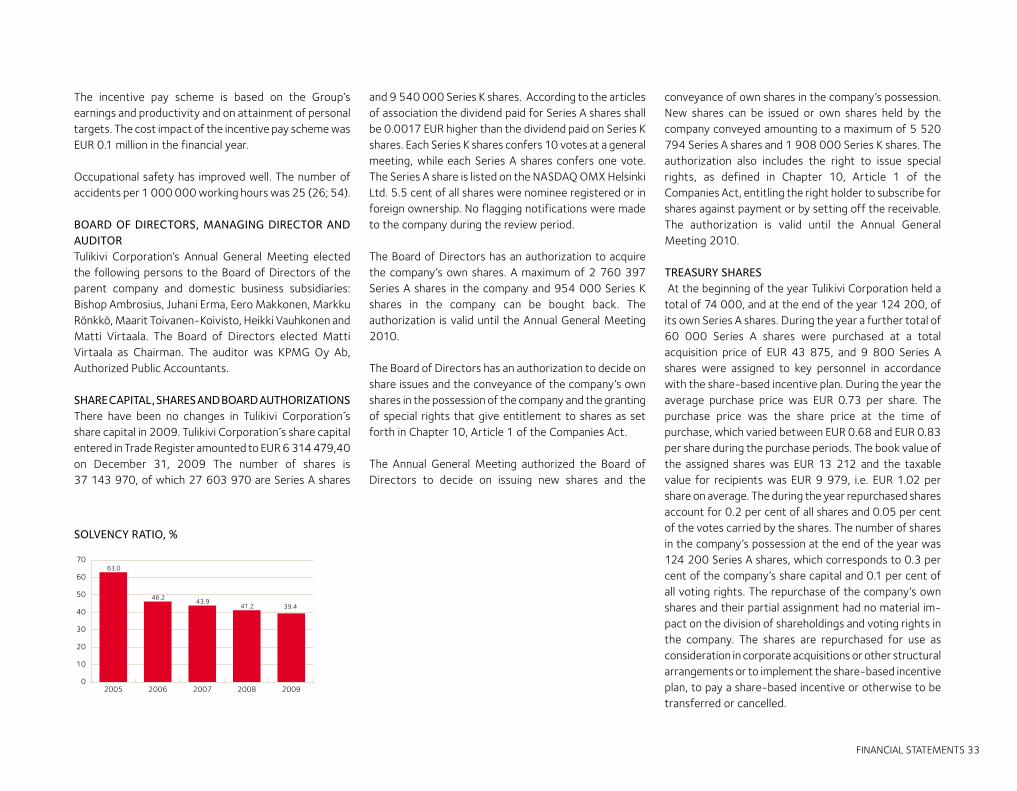
FINANCIAL STATEMENTS 33
The incentive pay scheme is based on the Group’s earnings and productivity and on attainment of personal targets. The cost impact of the incentive pay scheme was EUR 0.1 million in the financial year. Occupational safety has improved well. The number of accidents per 1 000 000 working hours was 25 (26; 54).
BOARD OF DIRECTORS, MANAGING DIRECTOR AND AUDITOR Tulikivi Corporation’s Annual General Meeting elected the following persons to the Board of Directors of the parent company and domestic business subsidiaries: Bishop Ambrosius, Juhani Erma, Eero Makkonen, Markku Rönkkö, Maarit Toivanen-Koivisto, Heikki Vauhkonen and Matti Virtaala. The Board of Directors elected Matti Virtaala as Chairman. The auditor was KPMG Oy Ab, Authorized Public Accountants.
SHARE CAPITAL, SHARES AND BOARD AUTHORIZATIONS There have been no changes in Tulikivi Corporation s share capital in 2009. Tulikivi Corporation s share capital entered in Trade Register amounted to EUR 6 314 479,40 on December 31, 2009 The number of shares is 37 143 970, of which 27 603 970 are Series A shares
and 9 540 000 Series K shares. According to the articles of association the dividend paid for Series A shares shall be 0.0017 EUR higher than the dividend paid on Series K shares. Each Series K shares confers 10 votes at a general meeting, while each Series A shares confers one vote. The Series A share is listed on the NASDAQ OMX Helsinki Ltd. 5.5 cent of all shares were nominee registered or in foreign ownership. No flagging notifications were made to the company during the review period.
The Board of Directors has an authorization to acquire the company’s own shares. A maximum of 2 760 397 Series A shares in the company and 954 000 Series K shares in the company can be bought back. The authorization is valid until the Annual General Meeting 2010.
The Board of Directors has an authorization to decide on share issues and the conveyance of the company’s own shares in the possession of the company and the granting of special rights that give entitlement to shares as set forth in Chapter 10, Article 1 of the Companies Act.
The Annual General Meeting authorized the Board of Directors to decide on issuing new shares and the
����
���� ��������
����
���� ���� ���� ���� �����
��
��
��
��
��
��
��
����
SOLVENCY RATIO, %
conveyance of own shares in the company’s possession. New shares can be issued or own shares held by the company conveyed amounting to a maximum of 5 520 794 Series A shares and 1 908 000 Series K shares. The authorization also includes the right to issue special rights, as defined in Chapter 10, Article 1 of the Companies Act, entitling the right holder to subscribe for shares against payment or by setting off the receivable. The authorization is valid until the Annual General Meeting 2010.
TREASURY SHARES At the beginning of the year Tulikivi Corporation held a total of 74 000, and at the end of the year 124 200, of its own Series A shares. During the year a further total of 60 000 Series A shares were purchased at a total acquisition price of EUR 43 875, and 9 800 Series A shares were assigned to key personnel in accordance with the share-based incentive plan. During the year the average purchase price was EUR 0.73 per share. The purchase price was the share price at the time of purchase, which varied between EUR 0.68 and EUR 0.83 per share during the purchase periods. The book value of the assigned shares was EUR 13 212 and the taxable value for recipients was EUR 9 979, i.e. EUR 1.02 per share on average. The during the year repurchased shares account for 0.2 per cent of all shares and 0.05 per cent of the votes carried by the shares. The number of shares in the company’s possession at the end of the year was 124 200 Series A shares, which corresponds to 0.3 per cent of the company’s share capital and 0.1 per cent of all voting rights. The repurchase of the company’s own shares and their partial assignment had no material im-pact on the division of shareholdings and voting rights in the company. The shares are repurchased for use as consideration in corporate acquisitions or other structural arrangements or to implement the share-based incentive plan, to pay a share-based incentive or otherwise to be transferred or cancelled.
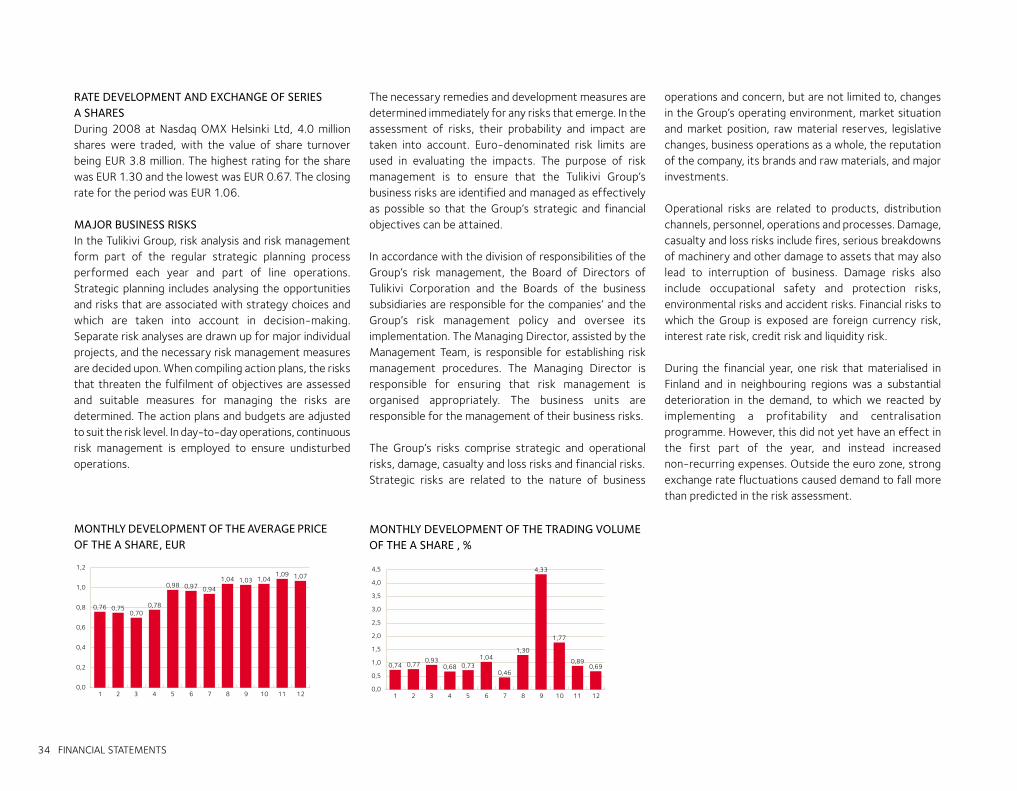
34 FINANCIAL STATEMENTS
RATE DEVELOPMENT AND EXCHANGE OF SERIES A SHARES During 2008 at Nasdaq OMX Helsinki Ltd, 4.0 million shares were traded, with the value of share turnover being EUR 3.8 million. The highest rating for the share was EUR 1.30 and the lowest was EUR 0.67. The closing rate for the period was EUR 1.06.
MAJOR BUSINESS RISKSIn the Tulikivi Group, risk analysis and risk management form part of the regular strategic planning process performed each year and part of line operations. Strategic planning includes analysing the opportunities and risks that are associated with strategy choices and which are taken into account in decision-making. Separate risk analyses are drawn up for major individual projects, and the necessary risk management measures are decided upon. When compiling action plans, the risks that threaten the fulfilment of objectives are assessed and suitable measures for managing the risks are determined. The action plans and budgets are adjusted to suit the risk level. In day-to-day operations, continuous risk management is employed to ensure undisturbed operations.
The necessary remedies and development measures are determined immediately for any risks that emerge. In the assessment of risks, their probability and impact are taken into account. Euro-denominated risk limits are used in evaluating the impacts. The purpose of risk management is to ensure that the Tulikivi Group’s business risks are identified and managed as effectively as possible so that the Group’s strategic and financial objectives can be attained.
In accordance with the division of responsibilities of the Group’s risk management, the Board of Directors of Tulikivi Corporation and the Boards of the business subsidiaries are responsible for the companies’ and the Group’s risk management policy and oversee its implementation. The Managing Director, assisted by the Management Team, is responsible for establishing risk management procedures. The Managing Director is responsible for ensuring that risk management is organised appropriately. The business units are responsible for the management of their business risks.
The Group’s risks comprise strategic and operational risks, damage, casualty and loss risks and financial risks.Strategic risks are related to the nature of business
operations and concern, but are not limited to, changes in the Group’s operating environment, market situation and market position, raw material reserves, legislative changes, business operations as a whole, the reputation of the company, its brands and raw materials, and major investments.
Operational risks are related to products, distribution channels, personnel, operations and processes. Damage, casualty and loss risks include fires, serious breakdowns of machinery and other damage to assets that may also lead to interruption of business. Damage risks also include occupational safety and protection risks, environmental risks and accident risks. Financial risks to which the Group is exposed are foreign currency risk, interest rate risk, credit risk and liquidity risk. During the financial year, one risk that materialised in Finland and in neighbouring regions was a substantial deterioration in the demand, to which we reacted by implementing a profitability and centralisation programme. However, this did not yet have an effect in the first part of the year, and instead increased non-recurring expenses. Outside the euro zone, strong exchange rate fluctuations caused demand to fall more than predicted in the risk assessment.
���� ��������
����
���� ���� ����
���� ���� �������� ����
���
���
���
���
���
���
���
� � � � � � � � � �� �� ��
MONTHLY DEVELOPMENT OF THE AVERAGE PRICEOF THE A SHARE, EUR
���� ��������
���� ��������
����
����
����
����
��������
���
���
���
���
���
���
���
���
���
���
� � � � � � � � � �� �� ��
MONTHLY DEVELOPMENT OF THE TRADING VOLUMEOF THE A SHARE , %
FINANCIAL STATEMENTS 35
The Group’s near-term risks are increased uncertainty among consumers and the effect of this on consumers’ building and fireplace projects.
Risks and the means of preventing and controlling them are presented in greater detail in note 38 to the consolidated financial statements.
ENVIRONMENTAL OBLIGATIONS Tulikivi’s environmental strategy is geared towards making systematic progress in environmental matters in specified areas. All of Tulikivi Corporation’s operational quarries have the environmental permits they require. Permit renewals are also in progress. The Group’s operations comply with the environmental permits, the requirements of the authorities and the environmental protection requirements.
The company is responsible for the environmental impacts of its operations. Under the Mining Act and environmental legislation, the Tulikivi Group has landscaping obligations that must be met when operating its quarries and after the quarries and plants are eventually shut down. No hazardous or poisonous substances are left in the environment as a result of the Group’s operations. The content and recognition principles of environmental management expenditure are presented in greater detail in notes 26 and 34 and the key figures for environmental responsibilities in note 35.
The Group is neither party to judicial or administrative procedures concerning environmental issues nor is it aware of any environmental risks that would have a significant effect on its financial position.
EVENTS FOLLOWING THE END OF THE FINANCIAL YEARAt the end of the financial year, order books were at EUR 4.8 (4.9) million. Order books for the Tulikivi Group have since grown, and stood at EUR 6.1 million on 11 February 2010.
The Tulikivi Group has drawn up and, since the start of the year, put into effect a revised strategy, which covers the key operational and financial goals for the period to 2015, and a new division of product groups. The product group division does not affect the current segment reporting. According to the strategic goals, the company’s organic growth target is an annual growth of over 10 per cent in the next few years, the target for profit before taxes is to reach the level of 10 per cent of net sales over the next five years, and the target for return on capital is more than 20 per cent. Corporate acquisitions in support of the strategy are also possible.
FUTURE OUTLOOKPrivate house building, and along with it the demand for fireplaces, increased in Finland last autumn and this positive trend is expected to continue. The trough in demand in Russia and the Baltic countries is also behind us. In Central Europe sales of lining stones have increased significantly, but securing a market for fireplaces continues to be a challenge. New products will increase the company’s net sales during the second half of the year. Adjustment measures will be continued in the Group, with layoffs where necessary. With the company’s recovering sales and improved cost efficiency, the full-year net sales are expected to be up from the previous year and the result is expected to turn positive during the year.
KEY RATIOS AND OWNERSHIP INFORMATION The Group s order book, financial ratios and key indicators per share together with their definitions as well as i nformation on shareholders and management ownership are presented in connection with the financial statements.
GROUP STRUCTUREThe companies included in the Group are the parent company Tulikivi Corporation, its fixed establishment in Germany Tulikivi Oyj Niederlassung Deutschland and the subsidiaries Kivia Oy, AWL-Marmori Oy, Tulikivi U.S. Inc. and OOO Tulikivi. Group companies include The New Alberene Stone Company, Inc., which is dormant. The Group company Uuni Vertriebs GmbH was liquidated during the year. The Group has interests in associated companies Stone Pole Oy, Leppävirran Matkailukeskus Oy and Rakentamisen MALL Oy.
CORPORATE GOVERNANCE STATEMENTTulikivi Corporation will issue its Corporate Governance Statement for 2009 separately from the Report of the Board. The Corporate Governance Statement has been prepared in accordance with Recommendation 51 of Corporate Governance Code and chapter 2, section 6 of the Securities Markets Act. Information on Corporate Governance can be found on Tulikivi’s website, at www.tulikivi.com/Investors/Corporators/Corporate Governance and Management.
THE BOARD’S PROPOSAL FOR THE DISTRIBUTION OF PROFITS The parent company’s distributable equity following the financial year’s result of EUR -1.2 million amounts to EUR 4.7 million.
Dividend DistributionEUR 0.0250/share for Series A shares EUR 0.0233/share for Series K sharesin total approximately EUR 0.9 million and EUR 3.8 million will be left to equity. In the Board’s view, the proposed distribution of profits will not jeopardise the company’s solvency.
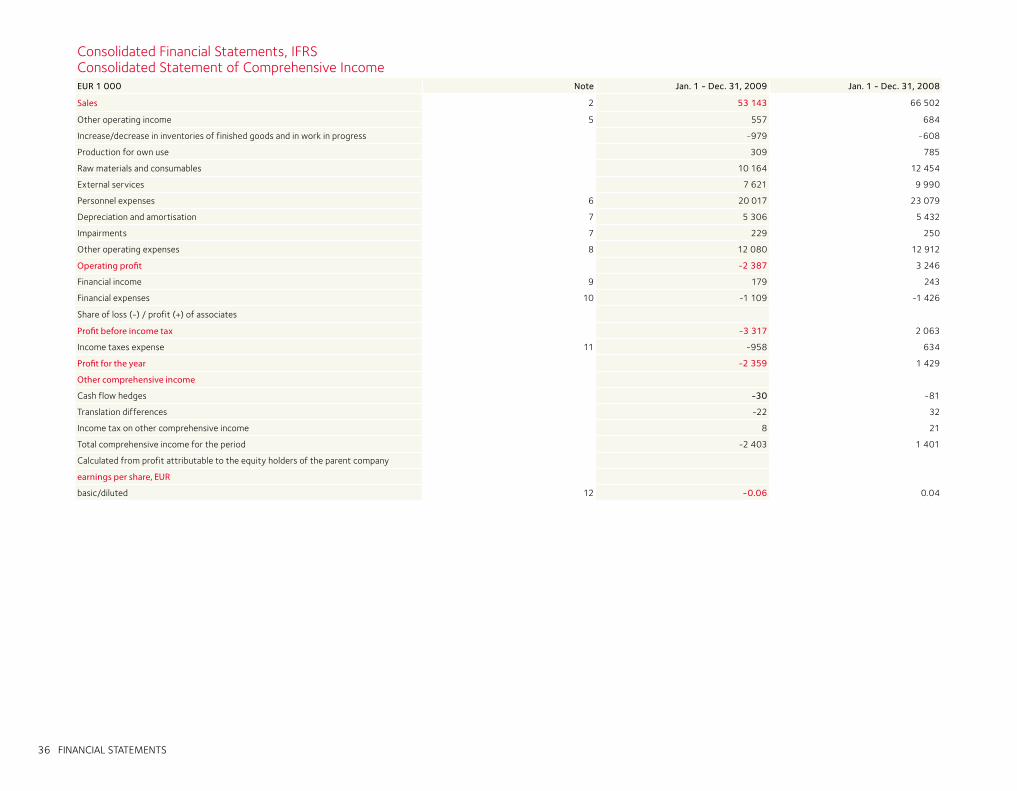
36 FINANCIAL STATEMENTS
Consolidated Financial Statements, IFRSConsolidated Statement of Comprehensive IncomeEUR 1 000 Note Jan. 1 - Dec. 31, 2009 Jan. 1 - Dec. 31, 2008
Sales 2 53 143 66 502
Other operating income 5 557 684
Increase/decrease in inventories of finished goods and in work in progress -979 -608
Production for own use 309 785
Raw materials and consumables 10 164 12 454
External services 7 621 9 990
Personnel expenses 6 20 017 23 079
Depreciation and amortisation 7 5 306 5 432
Impairments 7 229 250
Other operating expenses 8 12 080 12 912
Operating profit -2 387 3 246
Financial income 9 179 243
Financial expenses 10 -1 109 -1 426
Share of loss (-) / profit (+) of associates
Profit before income tax -3 317 2 063
Income taxes expense 11 -958 634
Profit for the year -2 359 1 429
Other comprehensive income
Cash flow hedges -30 -81
Translation differences -22 32
Income tax on other comprehensive income 8 21
Total comprehensive income for the period -2 403 1 401
Calculated from profit attributable to the equity holders of the parent company
earnings per share, EUR
basic/diluted 12 -0.06 0.04
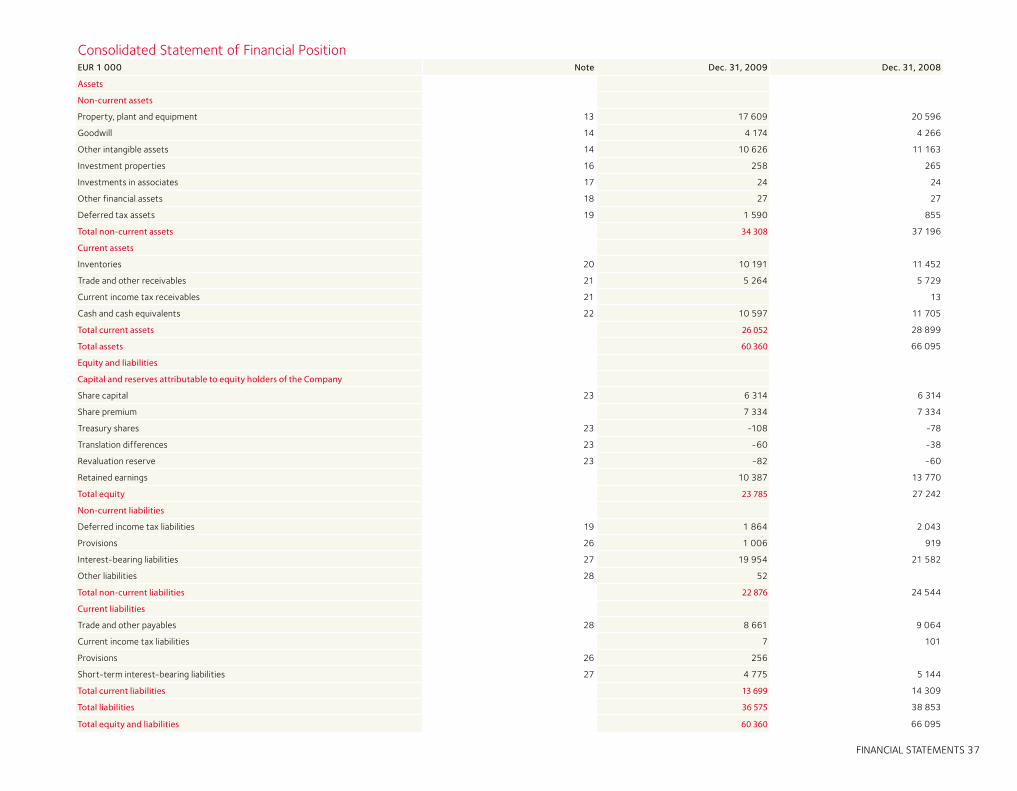
FINANCIAL STATEMENTS 37
Consolidated Statement of Financial PositionEUR 1 000 Note Dec. 31, 2009 Dec. 31, 2008
Assets
Non-current assets
Property, plant and equipment 13 17 609 20 596
Goodwill 14 4 174 4 266
Other intangible assets 14 10 626 11 163
Investment properties 16 258 265
Investments in associates 17 24 24
Other financial assets 18 27 27
Deferred tax assets 19 1 590 855
Total non-current assets 34 308 37 196
Current assets
Inventories 20 10 191 11 452
Trade and other receivables 21 5 264 5 729
Current income tax receivables 21 13
Cash and cash equivalents 22 10 597 11 705
Total current assets 26 052 28 899
Total assets 60 360 66 095
Equity and liabilities
Capital and reserves attributable to equity holders of the Company
Share capital 23 6 314 6 314
Share premium 7 334 7 334
Treasury shares 23 -108 -78
Translation differences 23 -60 -38
Revaluation reserve 23 -82 -60
Retained earnings 10 387 13 770
Total equity 23 785 27 242
Non-current liabilities
Deferred income tax liabilities 19 1 864 2 043
Provisions 26 1 006 919
Interest-bearing liabilities 27 19 954 21 582
Other liabilities 28 52
Total non-current liabilities 22 876 24 544
Current liabilities
Trade and other payables 28 8 661 9 064
Current income tax liabilities 7 101
Provisions 26 256
Short-term interest-bearing liabilities 27 4 775 5 144
Total current liabilities 13 699 14 309
Total liabilities 36 575 38 853
Total equity and liabilities 60 360 66 095
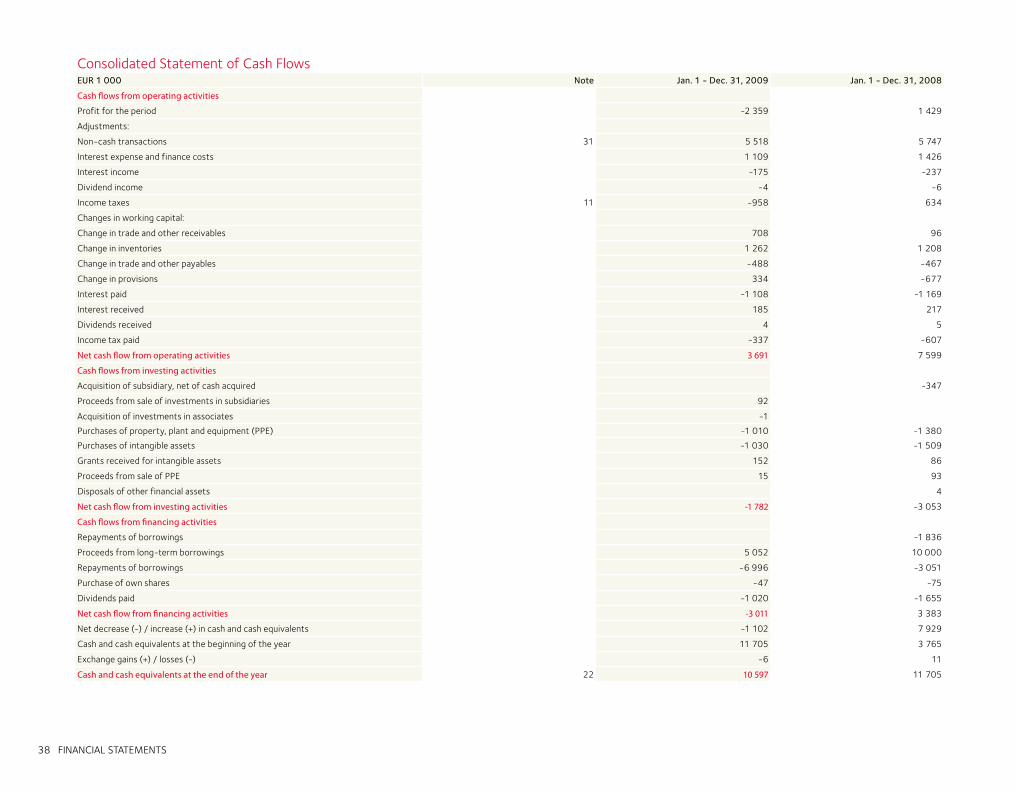
38 FINANCIAL STATEMENTS
Consolidated Statement of Cash FlowsEUR 1 000 Note Jan. 1 - Dec. 31, 2009 Jan. 1 - Dec. 31, 2008
Cash flows from operating activities
Profit for the period -2 359 1 429
Adjustments:
Non-cash transactions 31 5 518 5 747
Interest expense and finance costs 1 109 1 426
Interest income -175 -237
Dividend income -4 -6
Income taxes 11 -958 634
Changes in working capital:
Change in trade and other receivables 708 96
Change in inventories 1 262 1 208
Change in trade and other payables -488 -467
Change in provisions 334 -677
Interest paid -1 108 -1 169
Interest received 185 217
Dividends received 4 5
Income tax paid -337 -607
Net cash flow from operating activities 3 691 7 599
Cash flows from investing activities
Acquisition of subsidiary, net of cash acquired -347
Proceeds from sale of investments in subsidiaries 92
Acquisition of investments in associates -1
Purchases of property, plant and equipment (PPE) -1 010 -1 380
Purchases of intangible assets -1 030 -1 509
Grants received for intangible assets 152 86
Proceeds from sale of PPE 15 93
Disposals of other financial assets 4
Net cash flow from investing activities -1 782 -3 053
Cash flows from financing activities
Repayments of borrowings -1 836
Proceeds from long-term borrowings 5 052 10 000
Repayments of borrowings -6 996 -3 051
Purchase of own shares -47 -75
Dividends paid -1 020 -1 655
Net cash flow from financing activities -3 011 3 383
Net decrease (-) / increase (+) in cash and cash equivalents -1 102 7 929
Cash and cash equivalents at the beginning of the year 11 705 3 765
Exchange gains (+) / losses (-) -6 11
Cash and cash equivalents at the end of the year 22 10 597 11 705
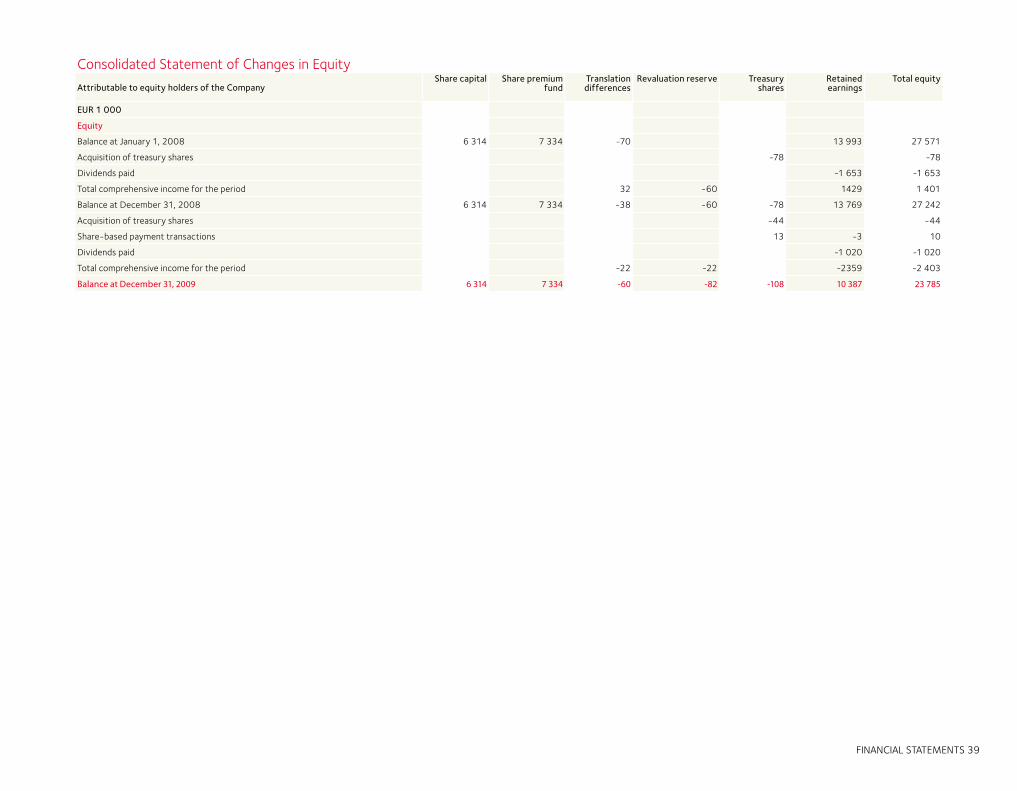
FINANCIAL STATEMENTS 39
Consolidated Statement of Changes in Equity
Attributable to equity holders of the CompanyShare capital Share premium
fundTranslation differences
Revaluation reserve Treasury shares
Retainedearnings
Total equity
EUR 1 000
Equity
Balance at January 1, 2008 6 314 7 334 -70 13 993 27 571
Acquisition of treasury shares -78 -78
Dividends paid -1 653 -1 653
Total comprehensive income for the period 32 -60 1429 1 401
Balance at December 31, 2008 6 314 7 334 -38 -60 -78 13 769 27 242
Acquisition of treasury shares -44 -44
Share-based payment transactions 13 -3 10
Dividends paid -1 020 -1 020
Total comprehensive income for the period -22 -22 -2359 -2 403
Balance at December 31, 2009 6 314 7 334 -60 -82 -108 10 387 23 785
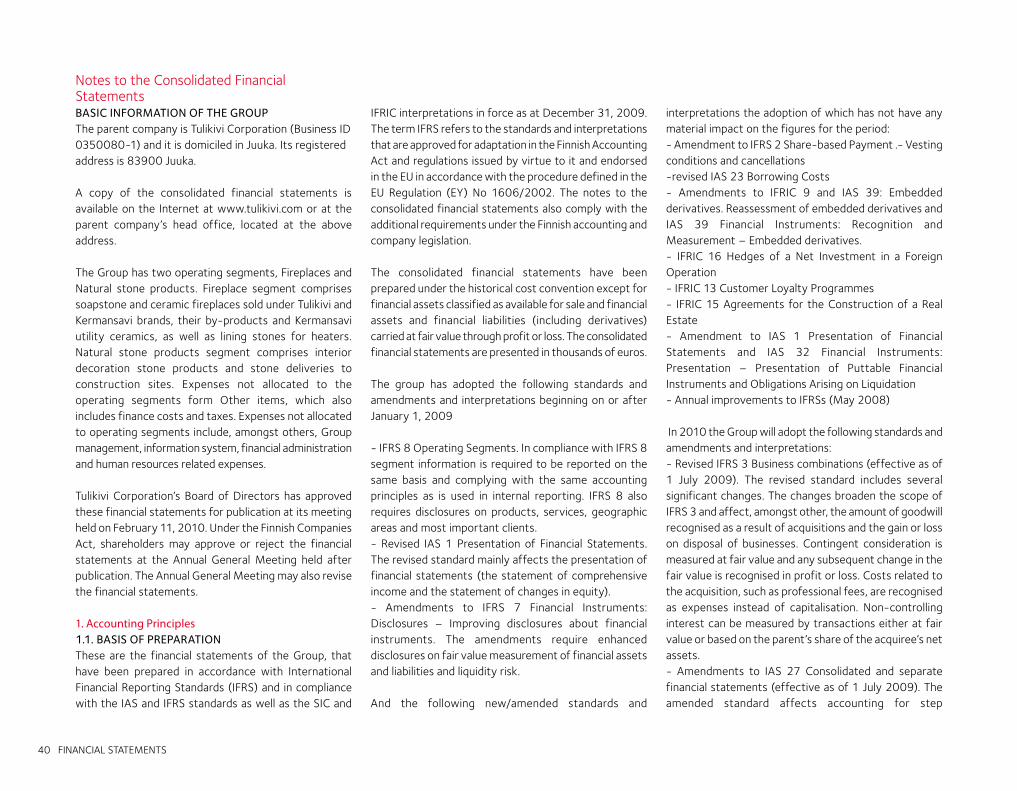
40 FINANCIAL STATEMENTS
Notes to the Consolidated Financial StatementsBASIC INFORMATION OF THE GROUP The parent company is Tulikivi Corporation (Business ID 0350080-1) and it is domiciled in Juuka. Its registered address is 83900 Juuka.
A copy of the consolidated financial statements is available on the Internet at www.tulikivi.com or at the parent company’s head office, located at the above address.
The Group has two operating segments, Fireplaces and Natural stone products. Fireplace segment comprises soapstone and ceramic fireplaces sold under Tulikivi and Kermansavi brands, their by-products and Kermansavi utility ceramics, as well as lining stones for heaters. Natural stone products segment comprises interior decoration stone products and stone deliveries to construction sites. Expenses not allocated to the operating segments form Other items, which also includes finance costs and taxes. Expenses not allocated to operating segments include, amongst others, Group management, information system, financial administration and human resources related expenses.
Tulikivi Corporation’s Board of Directors has approved these financial statements for publication at its meeting held on February 11, 2010. Under the Finnish Companies Act, shareholders may approve or reject the financial statements at the Annual General Meeting held after publication. The Annual General Meeting may also revise the financial statements.
1. Accounting Principles 1.1. BASIS OF PREPARATION These are the financial statements of the Group, that have been prepared in accordance with International Financial Reporting Standards (IFRS) and in compliance with the IAS and IFRS standards as well as the SIC and
IFRIC interpretations in force as at December 31, 2009. The term IFRS refers to the standards and interpretations that are approved for adaptation in the Finnish Accounting Act and regulations issued by virtue to it and endorsed in the EU in accordance with the procedure defined in the EU Regulation (EY) No 1606/2002. The notes to the consolidated financial statements also comply with the additional requirements under the Finnish accounting and company legislation.
The consolidated financial statements have been prepared under the historical cost convention except for financial assets classified as available for sale and financial assets and financial liabilities (including derivatives) carried at fair value through profit or loss. The consolidated financial statements are presented in thousands of euros. The group has adopted the following standards and amendments and interpretations beginning on or after January 1, 2009
- IFRS 8 Operating Segments. In compliance with IFRS 8 segment information is required to be reported on the same basis and complying with the same accounting principles as is used in internal reporting. IFRS 8 also requires disclosures on products, services, geographic areas and most important clients. - Revised IAS 1 Presentation of Financial Statements. The revised standard mainly affects the presentation of financial statements (the statement of comprehensive income and the statement of changes in equity). - Amendments to IFRS 7 Financial Instruments: Disclosures – Improving disclosures about financial instruments. The amendments require enhanced disclosures on fair value measurement of financial assets and liabilities and liquidity risk.
And the following new/amended standards and
interpretations the adoption of which has not have any material impact on the figures for the period: - Amendment to IFRS 2 Share-based Payment .- Vesting conditions and cancellations-revised IAS 23 Borrowing Costs - Amendments to IFRIC 9 and IAS 39: Embedded derivatives. Reassessment of embedded derivatives and IAS 39 Financial Instruments: Recognition and Measurement – Embedded derivatives.- IFRIC 16 Hedges of a Net Investment in a Foreign Operation- IFRIC 13 Customer Loyalty Programmes - IFRIC 15 Agreements for the Construction of a Real Estate - Amendment to IAS 1 Presentation of Financial Statements and IAS 32 Financial Instruments: Presentation – Presentation of Puttable Financial Instruments and Obligations Arising on Liquidation- Annual improvements to IFRSs (May 2008)
In 2010 the Group will adopt the following standards and amendments and interpretations:- Revised IFRS 3 Business combinations (effective as of 1 July 2009). The revised standard includes several significant changes. The changes broaden the scope of IFRS 3 and affect, amongst other, the amount of goodwill recognised as a result of acquisitions and the gain or loss on disposal of businesses. Contingent consideration is measured at fair value and any subsequent change in the fair value is recognised in profit or loss. Costs related to the acquisition, such as professional fees, are recognised as expenses instead of capitalisation. Non-controlling interest can be measured by transactions either at fair value or based on the parent’s share of the acquiree’s net assets. - Amendments to IAS 27 Consolidated and separate financial statements (effective as of 1 July 2009). The amended standard affects accounting for step
FINANCIAL STATEMENTS 41
acquisitions and divestments. The effects of all transactions with non-controlling interests are recorded directly in equity if there is no change in control. Such transactions carried out with non-controlling interests do not generate goodwill or income or expenses in profit or loss. If control is lost, the remaining interest in the en-tity is remeasured at fair value in profit or loss. Corresponding method of accounting is applied to investments in associates and interests in joint ventures. In the future, losses can be allocated to the non-control-ling interests in excess of the non-controlling interests in the equity of a subsidiary- Amendment to IAS 39 Financial Instruments: Recognition and Measurement - Eligible hedged items (effective as of 1 July 2009) - IFRIC 17 Distributions of Non-cash Assets to Owners (effective as of 1 July 2009)- IFRIC 18 Transfers of assets from customers (effective as July 1, 2009)- Improvements to IFRSs (April 2009, mainly effective as of 1 January 2010). The improvements are still subject to endorsement by the European Union.- Amendments to IFRS 2 Share-based Payment – Intra-group cash-settled share-based payment transaction (effective as of 1 January 2010). The amendments provide additional guidance on the accounting for intra-group share-based payment transactions. The amended standard is still subject to endorsement by the European Union.
The Group will adopt the following new/revised standards and interpretations in 2011:
- Amendments to IAS 32 Financial instruments: Presentation – Classification of Rights Issues (effective as of 1 February 2010). The amended standard is still subject to endorsement by the European Union. - Revised IAS 24 Related Party Disclosures (effective as
of 1 January 2011). The revised standard is still subject to endorsement by the European Union.- Amendments to IFRIC 14 (IAS 19) The Limit on a Defined Benefit Asset, Minimum Funding Requirements and their Interaction - Prepayments of a Minimum Funding Requirement (effective as of 1 January 2011). The amended standard is still subject to endorsement by the European Union.- IFRIC 19 Extinguishing Financial Liabilities with Equity Instruments (effective as of 1 July 2010). IFRIC 19 requires retrospective application. The amended standard is still subject to endorsement by the European Union.
The Group will adopt the following new / revised standards and interpretations in 2013:- IFRS 9 Financial Instruments (effective as of 1 January 2013). IFRS 9 is part of IASB’s project to replace IAS 39 Financial Instruments: Recognition and Measurement standard. IFRS 9 is still subject to endorsement by the European Union.
The Group’s view is that the adoption of the standards and interpretations mentioned above will not have any significant effect on the financial statements of 2010 reporting period, with the exemption of amendments to IFRS 3. IFRS 3 includes several changes that affect the accounting for potential future business combinations but do not affect the measurement of business combi-nations already taken place.
The preparation of the consolidated financial statements in conformity with IFRS requires the management use of certain estimates and exercise of judgment in the process of applying the Group’s accounting policies. Information about the areas where the management has exercised judgment in the application of the Group accounting principles is presented under “Critical Accounting Judgments in applying the Entity’s Accounting Principles”.
1.2. CONSOLIDATION PRINCIPLES SUBSIDIARIES The consolidated financial statements include the parent company Tulikivi Corporation and all its subsidiaries. Subsidiaries are companies, over which the Group has control. Control exists when the Group owns more than half of the voting rights, or it has otherwise control. Also the existence of potential voting rights is considered when assessing the conditions of control if the instruments entitling to potential voting rights are exercisable. Control means the power to govern financial and operating policies of an entity so as to obtain benefits from its activities.
Intragroup share holdings are eliminated according to the purchase method. Subsidiaries are consolidated from the date on which control is transferred to the Group, and disposed subsidiaries until the control ceases. Intragroup transactions, balances and unrealized gains on transactions between group companies, and intragroup distribution of profits are eliminated. Unrealized losses are also eliminated unless the loss is due to impairment. Tulikivi Corporation has a full ownership in its all subsidiaries and therefore no profit or loss attributable to minority interest is included in the consolidated result nor is minority interest presented within equity.
ASSOCIATED COMPANIESAssociated companies are all entities over which the Group has significant influence. Significant influence is realized when the Group holds over 20 per cent of the voting rights or otherwise has significant influence, but no control. Investments in associates are accounted for using the equity method. When the Group’s proportionate share of the associated company’s result exceeds the book value, the investment is recognized in the balance sheet to zero value and the exceeding losses are not recognized unless the Group has incurred obligations or made payments on behalf of the associate company.
42 FINANCIAL STATEMENTS
FOREIGN CURRENCY TRANSLATION The results and financial positions of subsidiaries are measured using the currency of the primary economic environment (Functional currency) in which the entity operates. The consolidated financial statements are presented in euros, which is the parent company’s functional and presentation currency.
FOREIGN CURRENCY TRANSACTIONSTransactions in foreign currencies are translated into the functional currency using the foreign exchange rate prevailing at the transaction date. In practice, exchange rates close to the rates prevailing at the dates of the transactions are usually used. Monetary items are translated into functional currency using the exchange rates prevailing at the reporting date. Non-monetary items are translated using the exchange rate at the transaction date.
Exchange differences of transactions in foreign currencies and translation of monetary items are recognized in profit or loss. Exchange differences resulting from operations are recognized in the income statement as part of the operating profit. Gains or losses arising from loans and cash in bank are recognized in the income statement within financial income and expense.
TRANSLATION OF FINANCIAL STATEMENTS OF FOREIGN SUBSIDIARIESThe statements of comprehensive income of foreign subsidiaries are translated using the exchange rates at the dates of transactions and the statements of financial position of foreign subsidiaries are translated using the exchange rates ruling at the reporting date. Foreign currency difference arising on the translation of statements of comprehensive income and financial position with different exchange rates is recognised in other comprehensive income and presented within
accumulated currency differences in equity. Translation differences arising from eliminating the acquisition cost of foreign subsidiaries and from translating the foreign subsidiaries’ accumulated equity subsequent to acquisition are recognised in other comprehensive income.
Goodwill arisen from acquisition of foreign entities and related fair value adjustments to the assets and liabilities of the acquired entity are recognized as assets and liabilities of the said foreign entities and are translated to euro using the exchange rates at the reporting date.
PROPERTY, PLANT AND EQUIPMENTTangible assets are measured in the balance sheet at cost less accumulated depreciation and impairment charges.
When the asset consists of several items with different useful lives, each item will be dealt with as a separate asset. In this case the replacement costs of the item are capitalized and the remaining part of the asset is expensed. Otherwise subsequent costs are included in the book value of property, plant and equipment only when it is probable that the future economic benefits associated with the item will flow to the Group and that the cost can be measured reliably. Other repair and main-tenance costs are charged to the income statement when they occur.
Depreciation has been calculated using the straight-line method based on the useful lives of the assets. Land areas are not depreciated except for mining areas, where depreciations are recognised based on the consumption of the rock material and stacking area filling time. The useful lives are as follows:
Buildings 25 to 30 yearsConstructions 5 years Process machinery 3 to10 years
Motor vehicles to 8 yearsOther property, plant and equipment 3 to 5 years
The acquisition cost of the equipment is amortised by 25 per cent outlay residue write-offs. Investment property buildings have a depreciation period of 10 to 20 years.
The assets’ residual values and useful lives are reviewedat least at each reporting date and adjusted if needed to reflect the changes occurred in the expected economic benefit.
Gains and losses on disposal of property, plant and equipment are recognised in profit or loss.
The Group has adopted the revised IAS 23 Borrowing costs standard. During 2009, the Group did not acquire, construct or produce any qualifying assets with directly attributable borrowing costs.
PUBLIC GRANTSGovernment and other public grants related to the purchase of property, plant and equipment or intangible assets are deducted from the carrying amount of the asset when there is a reasonable assurance that the grant will be received and the group will comply with attached conditions. The grants are recognised in profit or loss through the depreciations made over the useful live of an asset. Grants received as compensation for costs are deferred and recognised in profit or loss over the period necessary to match them with the costs that they are intended to compensate. Government grants are presented within other operating income.
INVESTMENT PROPERTIES Investment properties are properties held in order to obtain rental revenues or capital appreciation. Investment properties are valued at cost less accumulated depreciation.
FINANCIAL STATEMENTS 43
INTANGIBLE ASSETSGoodwillGoodwill represents the excess of the cost of the business combination (acquired after Jan. 1, 2004) over the Group’s share in the net fair value of the identifiable assets, liabilities and contingent liabilities at the date of acquisition. Cost includes expenditure that is directly attributable to the acquisition, such as professional fees. Goodwill arising from acquisitions before January 1, 2004 represents the carrying amount of goodwill at the date of transition to IFRS based on the previous accounting principles. Goodwill is not amortised but tested annually for impairment. For this purpose the goodwill has been allocated to cash generating units. The goodwill is valued at historical cost less impairment.
Research and Development CostsResearch costs are recognized as expenses in the income statement are capitalised. Development costs arising from planning of new or improved products are capitalized as intangible assets in the balance sheet when the entity can demonstrate the technological and commercial feasibility of the product. Capitalised development costs comprise material, labour and test costs incurred in bringing the assets capable of operating in the manner intended by management. Development costs previously expensed cannot be capitalized later.
Amortisations of an asset are started when the asset is available for use. Assets not available for use are annually tested for impairment. After initial recognition, intangible assets shall be carried at cost less any accumulated amortisation and any accumulated impairment losses. The useful life of the capitalized development costs is 5 to 10 years during which the capitalized assets are recognized as expenses using the straight-line method.
Costs of Exploration and Evaluation ofMineral ResourcesCosts of exploration and evaluation of soapstone are mainly capitalised. However, costs of exploration and evaluation of soapstone are expensed in statement of comprehensive income when there is significant uncertainty related to commercial viability. Elements of cost of exploration and evaluation are geographical studies, exploration drilling, trenching, sampling and activities in relation to evaluating the technical feasibility and commercial viability of extracting mineral resources. After initial recognition Group applies the cost model and assets are amortised between 5 – 10 years. Exploration and evaluation the assets are classified as a separate intangible asset until technical feasibility and commercial viability is demonstrable. Afterwards the exploration and evaluation assets are classified to other intangible assets. The Exploration and evaluation activities start when the Ministry of Employment and the Economy has granted a right of appropriation.
Other intangible assetsIntangible assets should be recognized in the balance sheet only if the cost of the item can be measured reliably and it is probable that the future economic benefits associated with the asset will flow to the entity.
Costs arising from establishing the soapstone quarries and construction of roads, dams and other site facilities related to the quarry are also capitalised. It can take years to establish a quarry. Depreciation of quarry lands, basins and other auxiliary structures is commenced when the quarry is ready and taken into production use, and the depreciations are made over the useful life of the quarry, that is, over the extraction period using the unit of production method. The extraction periods vary by quarries and can reach tens of years. The amount of depreciation in unit of production method is the portion
of acquisition cost equalling to the portion of extracted rock during the reporting period from the estimated total extractable amount of rock of the quarry.
The amortisation of construction expenses of roads and dams is started in the construction year. Intangible assets with a finite useful life are amortised over their useful live using the straight-line method.
Amortisation periods of intangible assets are as follows:
Patents and trademarks 5 to 10 yearsDevelopment costs 5 to 10 yearsDistribution channel 10 yearsMineral resource exploration andevaluation costs 5 to 10 yearsQuarrying areas and basins unit of production methodQuarrying area roads and dams 5 yearsComputer Software 3 to 5 yearsOthers 5 years
Intangible assets that have an indefinite useful life are not subject to amortization and are tested annually for impairment.
The useful live of trademarks related to Fireplaces Business –segment and to Other Operations -segment has been assessed to be indefinite, because there is no foreseeable limit to the period which these assets are expected to generate net cash inflows.
INVENTORIES Inventories are measured at the lower of cost and net realisable value. The cost is determined using the weighted average cost method. The cost of quarried blocks is affected by the stone yield percentage. The cost of finished goods and work in progress consists of raw
44 FINANCIAL STATEMENTS
materials, direct labor, other direct costs and related variable and fixed production overheads allocated on a reasonable basis on a normal capacity of the production facilities. Net realisable value is the estimated selling price in the ordinary course of business, less the estimated costs of completion and selling expenses.
LEASES
Group as LesseeThe leases of the Group are agreements under which substantially all the risks and rewards incident to the leased assets is retained by the lessor and the agreements are therefore classified as operating leases. Payments made under operating leases are charged to the income statement as rental expenses on a straight-line basis over the lease term.
Group as LessorAssets leased out by the Group are leased under operating leases. The assets are included in property, plant and equipment or investment properties in the balance sheet. They are depreciated over their economic useful lives consistent with the Group’s normal depreciation policy. Part of the leased assets are subleased. Lease income from operating leases is recognized in income on a straight-line basis over the lease term.
IMPAIRMENTIt is assessed at each reporting date whether there is any indication that an asset may be impaired. If any such indication exists, the recoverable amount of the asset is assessed. The recoverable amount is annually tested for impairment for the following assets independent of the existence of indicators of impairment: goodwill and intangible assets in progress. Mineral resource exploration and evaluation assets are tested always before a change in classification of the assets in question. For the purpose
of assessing impairment assets are grouped at the lowest levels for which there are separately identifiable cash- generating units with separately identifiable cash flows.
The recoverable amount of and asset is the higher of fair value less costs to sell and value in use. Value in use is the present value of the future cash flows expected to be derived from an asset or cash-generating unit. A pre-tax rate, which reflects the market view on the time value of money and asset specific risks is used as discount rate.
An impairment loss is recognized when the carrying amount exceeds the recoverable amount. The impairment loss is immediately recognized in profit or loss. If an impairment loss is allocated to a cash-generating unit, it is first recognised as deduction of the goodwill allocated to the unit and then on pro-rata basis to unit’s other assets. By recognition of impairment loss the useful life of the asset to be depreciated is reassessed. For other assets except goodwill, impairment loss is reversed in case there is a change in those estimates that were used when recoverable amount of the assets was determined. The increased carrying amount must not, however, exceed the carrying amount that would have been determined if no impairment loss had been recognized in prior years. Previously recognized impairment loss of goodwill is not reversed under any conditions.
EMPLOYEE BENEFITS
Pension obligationsPension obligations are classified as defined benefit plans and defined contribution plans. In defined contribution plans the group makes fixed contributions into a separate entity. The group has no legal or constructive obligation to pay any further contributions if the receiver of payments is not able to pay the pension benefits in question. All other pension plans that do not fill these
conditions are defined benefit plans. The contributions made to defined contribution plans are recognised in the income statement in the period, which they are due.
Group’s pension plans are defined contribution plans.
Share-based paymentsThe Group has an incentive plan in which payments are settled in equity instruments and in cash. The benefits granted are measured at fair value at the grant date and recognized as an expense in the income statement on the straight-line basis over the vesting and restriction period. For the cash-settled part the related liability and the change of the liability’s fair value are expensed correspondingly. The impact of the incentive plan on the i ncome statement is presented under personnel expenses. PROVISIONSA provision is recognized when the Group has a present legal or constructive obligation as a result of past events and it is probable that an outflow of resources will be required to settle the obligation, and when a reliable estimate of the amount can be made. A provision is measured at the present value of the expenditure required to settle the obligation. The discount factor used in the calculation of the present value is determined so that it reflects the current market assessment of the time value of money and the risks specific to the liability.
A warranty provision is recognized when the product subject to the warranty is sold. The amount of the warranty provision relies on the statistical information of historical warranty realization.
A provision for restructuring is recognised when the Group has prepared a detailed restructuring plan and the restructuring either has commenced or has been announced publicly.
FINANCIAL STATEMENTS 45
A provision of onerous contracts is recognized when the incremental costs exceed the benefits received from the contract. Based on environmental legislation the group has restoration obligations related to factory and quarry areas. A provision is recognised in the consolidated financial statements for the estimable environmental obligations.
A contingent liability is a contingent obligation as a result of a past event and its existence will be confirmed by the occurrence or non-occurrence of one or more uncertain future events not wholly within the control of the Group. An existing obligation which probably does not require settling the payment obligation or which can not be reliably estimated is also considered a contingent liability. A contingent liability is disclosed in the notes.
INCOME TAXESTax expense is the aggregate amount included in the determination of profit and loss for the period in respect of current tax and deferred tax. The tax effects of items recognised directly in equity are recognised in equity correspondingly. Current tax is the amount of income taxes payable in respect of the taxable profit for the p eriod and is calculated on the basis of the local tax legislation.
Deferred taxes are calculated on temporary differences between the carrying amounts of balance sheet items and their taxable values. However, the deferred tax is not accounted for if it arises from initial recognition of an asset or liability in a transaction other than business combination that at the time of the transaction affects neither accounting nor taxable profit or loss.
Deferred tax is recognised for investments in subsidiaries and associates, with the exception that the Group can determine the moment of reversal of the temporary
difference and it is not probable that the temporary difference will reverse in the foreseeable future.
Most significant temporary differences arise from depreciation of property, measuring derivatives at fair value, tax losses carried forward and fair value measurement associated to acquisitions.
Deferred tax is determined using tax rates that have been enacted by the balance sheet date.
Deferred tax assets are recognized to the extent that it is probable that future taxable profit will be available against which the temporary differences can be utilized.
REVENUE RECOGNITIONRevenue includes the consideration received from sale of goods and services the considerations received for sales measured at fair value adjusted with indirect taxes, rebates, and translation differences from sales in foreign currency.
Sold Goods and Rendered Services Revenues of sold goods are recognized when the risks, rewards and control have been transferred to the buyer. Generally this coincides with the delivery of products in accordance with the terms of contract. Revenue from installing and services is recognised in the period when the service is rendered. Lease revenue is recognised on a straight-line basis over the lease term.
Construction Contracts The Group did not have any construction contract revenues in 2009 and 2008.
Interest and DividendsInterest income is recognized according to the effective
interest rate method and dividends when the right to the dividend is arisen.
CLASSIFIED AS HELD FOR SALE NON-CURRENT ASSETS AND DISCONTINUED OPERATIONSThe Group did not have non-current assets held for sale nor discontinued operations during 2009 and 2008 reporting periods.
FINANCIAL ASSETSThe Group classifies its financial assets in the following categories in following categories: financial assets at fair value through profit or loss, loans and receivables and available-for-sale financial assets. The classification depends on the purpose for which the financial asset was acquired and is made at initial acquisition.
Transaction costs are included in the initial value of all the financial assets not carried at fair value through profit or loss. Regular purchases and sales of financial assets are recognised on the trade date, which is the date when the Group commits to purchase or sell the financial asset.
Financial assets are derecognized when the rights to receive cash flows from the investments have expired or have been transferred and the Group has transferred substantially all risks and rewards of ownership.
Assets at fair value through profit or loss are financial assets held for trading or financial assets which are classified at initial recognition in this category. The classification can only be changed under extremely rare conditions.
The financial assets measured at fair value through profit or loss include the financial assets held for trading or financial asset items that include one or more embedded
46 FINANCIAL STATEMENTS
derivatives that alter significantly the cash flows under contract. Assets classified as held for trading have been acquired principally for the purpose of short-term profit taking from market price changes. Derivatives that are not financial guarantee contracts or that do not qualify for hedge accounting are classified as held for trading. Derivatives and financial assets with maturities less than 12 months are included in current assets. The Group had no embedded derivatives or financial guarantee contracts during 2009 and 2008.
Financial assets at fair value through profit or loss are measured at fair value based on quoted market prices at the reporting date. Fair values of interest rate swaps are determined based on the present value of future cash flows and fair values of forward exchange agreements based on forward exchange rates at the reporting date. The Group applies commonly accepted valuation methods in measuring derivatives and other financial instruments that are not held for sale.
Unrealized and realized gains and losses from changes in fair value are recognized in the income statement in the active period.
Held to maturity financial assets are non-derivative financial assets with fixed or determinable payments and a maturity date, and the Group intents to and is able to hold the financial assets to the maturity. They are measured at amortised cost using the effective interest method, and they are included in the non-current assets. The Group had no held to maturity financial assets during years 2009 and 2008.
Loans and receivables are non-derivative financial assets with fixed or determinable payments that are not quoted in an active market and the Group does not held for trading or are not designated as available for sale at initial recognition. They are recognised at amortised cost using
the effective interest method. Loans and receivables are included in trade and other receivables and are classified as current or non-current based on their maturity, to the latter if they have a maturity of more than 12 months.
The financial assets available for sale are non-derivative financial assets, that are specifically designated this group of assets or that are not classified into any other category. They are recognized as non-current assets in the balance sheet except when the management intends to dispose of the investment within 12 months from the reporting date. In this case the investment is classified as a current asset. Available-for-sale financial assets can contain investments in shares and interest-bearing investments. Available-for-sale financial assets are carried at fair value, or when the fair value can not be measured reliably, at cost. The fair value of financial assets is determined based on market bid prices. If no quoted market prices are available for the available for sale financial assets, the Group applies other methods of measurement. These can include, for example, recent transactions between independent parties, discounted cash flows and measurements of similar instruments. Market information is mainly applied in measurement minimising the application of factors determined by the Group itself. The changes in fair value of available for sale financial assets are recognised in other comprehensive income net of tax effect and presented in revaluation reserve within equity. When securities classified as available for sale are sold or impaired, the accumulated fair value adjustments recognised in equity are included in the income statement as gains and losses from available-for-sale financial assets. Interest income from available for sale interest investments are recognised in finance income using the effective interest method.
Cash and Cash EquivalentsCash and cash equivalents includes cash in hand, deposits held at call with banks and other short-term highly liquid
investments which are easily tradable for a known amount of cash and for which the risk of changes in fair value is minor. Cash and cash equivalents maturities in three months or less. Credit accounts are included in current interest-bearing liabilities.
Impairment of Financial AssetsThe Group assesses at each balance sheet date whether there is objective evidence that a financial asset or a group of financial assets is impaired. If the fair value of financial assets is significantly lower compared to the acquisition cost and time period defined by the Group, this is indication of impairment. If there is indication of impairment, the loss accumulated in the revaluation reserve is transferred in profit or loss. Impairment losses on equity instruments designated as available for sale financial assets are not reversed in profit or loss, whereas, subsequent reversal of impairment losses on interest instruments are recognised in profit or loss.
The group recognises an impairment loss when there is objective evidence that the trade receivables are not collectible in full. Significant financial difficulties of a debtor, probability of bankruptcy or delay of payments exceeding 90 days are considered as evidence of the impairment of trade receivables. An impairment loss to be recognised in the income statement is determined as the difference between the carrying amount of a receivable less the present value of the estimated future cash flows discounted with the effective interest rate. If, in a subsequent period, the amount of the impairment loss decreases and the decrease can be related objectively to an event occurring after the impairment was recognised, the previously recognised impairment loss shall be reversed through the income statement.
FINANCIAL LIABILITIESFinancial liabilities are initially recognized at fair value on the basis of the consideration received. Subsequently, all
FINANCIAL STATEMENTS 47
financial liabilities are measured at amortized cost using the effective interest rate method. Financial liabilities may comprise of current and non-current, and interest-bearing and non-interest-bearing items. Financial liabilities are classified as current liabilities if the Group does not have an unconditional right to defer the settlement of the liability for at least 12 months after the balance sheet date.
Borrowing costs directly attributable to the acquisition, construction or production of a qualifying asset are capitalised as a part of the cost of that asset when it is probable that they will result in future economic benefits and the costs can be measured reliably. Other borrowing costs are recognised as an expense in the period in which they are incurred. Transaction fees related to loan commitments are recognised as transaction costs to the extent that it is probable that the loan commitment will be acquired fully or in part. In these cases, the fees are capitalised until the loan is taken out. As the loan is taken out, any related transaction fees are recognised as part of transaction costs. To the extent that it is probable that the loan commitment will not be acquired, transactions fees are recognised as prepayments for liquidity services and amortised as expenses during the loan commitment period.
The principles applied in determination of fair values of all financial assets and financial liabilities are presented in note 30.
DERIVATIVE CONTRACTS AND HEDGE ACCOUNTINGDerivatives are initially recognized at fair value on the date a derivative contract is entered into and are subsequently remeasured their fair value. Gains and losses from the fair value measurement are recognized following the purpose of use of the underlying derivative. Changes in the fair value of derivatives that are designated and qualify as effective hedges are presented in the
income statement, together with any changes in the hedged item. When the group enters into a derivative contract, it is accounted for either as a hedge of the fair value of receivables or liabilities or firm commitments (fair value hedge), or in respect of foreign currency risk, as a cash flow hedge or as a derivative not qualifying for hedge accounting.
At the inception of hedge accounting the group documents the relationship between hedging instruments and hedged items, as well as its risk management objectives and strategy for undertaking various hedging transactions. The group also documents its assessment, both at hedge inception and at least each balance sheet date, of whether the derivatives that are used in hedging transactions are highly effective in offsetting changes in fair values or cash flows of hedged items.
Cash flow hedgesThe effective portion of changes in the fair values of derivatives designated and qualifying as cash flow hedges are recognised in other comprehensive income and presented in the revaluation reserve in equity. The cumulative gain or loss presented in equity is removed and included in profit or loss in the same period as the hedged cash flows affect profit or loss. Gains or losses on derivatives hedging predicted foreign currency denominated sales cash flows are recognised as sales adjustments when sales are realised. The ineffective portion of the changes in fair values is recognised in profit or loss in finance income or finance costs. If the hedged predicted transaction results in acquisition of an item not included in financial assets, such as an item of property, plant and equipment, gains and losses recognised in equity are transferred as acquisition cost adjustment of the item in question.
When a hedging instrument designated as a cash flow hedge expires or is sold or when a hedge no longer meets
the criteria for hedge accounting, any cumulative gain or loss remains in equity until the forecast transaction realizes. However, if the forecast transaction is no longer expected to occur, the cumulative gain or loss deferred in equity is immediately transferred to the profit or loss.
EQUITYIf Tulikivi Corporation repurchases its own equity instruments the cost of these instruments is deducted from equity. OPERATING PROFITThe IAS 1 Presentation of financial statements does not define the concept of operating profit. The Group has defined it as following: The operating profit is the net amount attained when the net sales are added by other operating income, deducted by costs of goods sold adjusted with finished and costs of production for own use, by employee benefit expenses, by depreciation and amortisation, by possible impairment charges and by other operating expenses. All other items are presented below operating profit in the income statement. Exchange rate differences and the fair value changes of derivatives are included in operating profit if they result from operations, otherwise they are recognised in the financial items.
CRITICAL ACCOUNTING JUDGMENTS IN APPLYING THE ENTITY’S ACCOUNTING PRINCIPLESIn preparing the consolidated financial statements critical assumptions and judgments are made, the actual outcome of which might differ from the assumptions and estimates made previously. In addition, judgment is exercised in applying the accounting principles.
Critical accounting JudgmentsJudgments and assumptions are based on the Directors best estimate as at the reporting date. The estimates are based on earlier experience and assumptions of the
48 FINANCIAL STATEMENTS
future considered to be most probable at the balance sheet date, relating to i.a. expected development of the economic environment in which the Group operates affecting the sales volumes and expenses. The Group follows realisation of the estimates, the assumptions and the changes in underlying factors regularly in co- operation with business units by using various, both internal and external sources of information. Possible changes in the estimates and assumptions are recognized as expenses during the period they occurred and during the periods following.
The estimates of the future and assumptions as at the reporting date, that have a significant risk of causing a material adjustment to the carrying amounts of assets and liabilities within the next financial year are related to, amongst others, deferred tax assets, measurement of inventories, property, plant and equipment related to excavations, fair value measurement and impairment testing of assets acquired in business combinations, that are described in detail below. The Group management believes that these are the key areas in the financial statement, since they include the most complex accounting policies and require most significant estimates and assumptions. In addition, changes in the estimates and assumptions used in these areas of financial statements are estimated to have the most significant effects.
Impairment testingThe Group tests goodwill and intangible assets under progress annually for potential impairment and estimates the indicators of impairment according to the abovementioned accounting policies. In addition, for mineral resource exploration and evaluation assets’ part impairment tests are performed when the classification of the assets changes. The recoverable amounts of cash generating units are assessed based on their value in use. The assessment of these values requires the use of estimates, especially in respect of future growth estimates of the cash-generating units and changes in profitability.
Further information on the sensitivity of the recoverable amount to the changes in the assumptions used is in Notes 15.
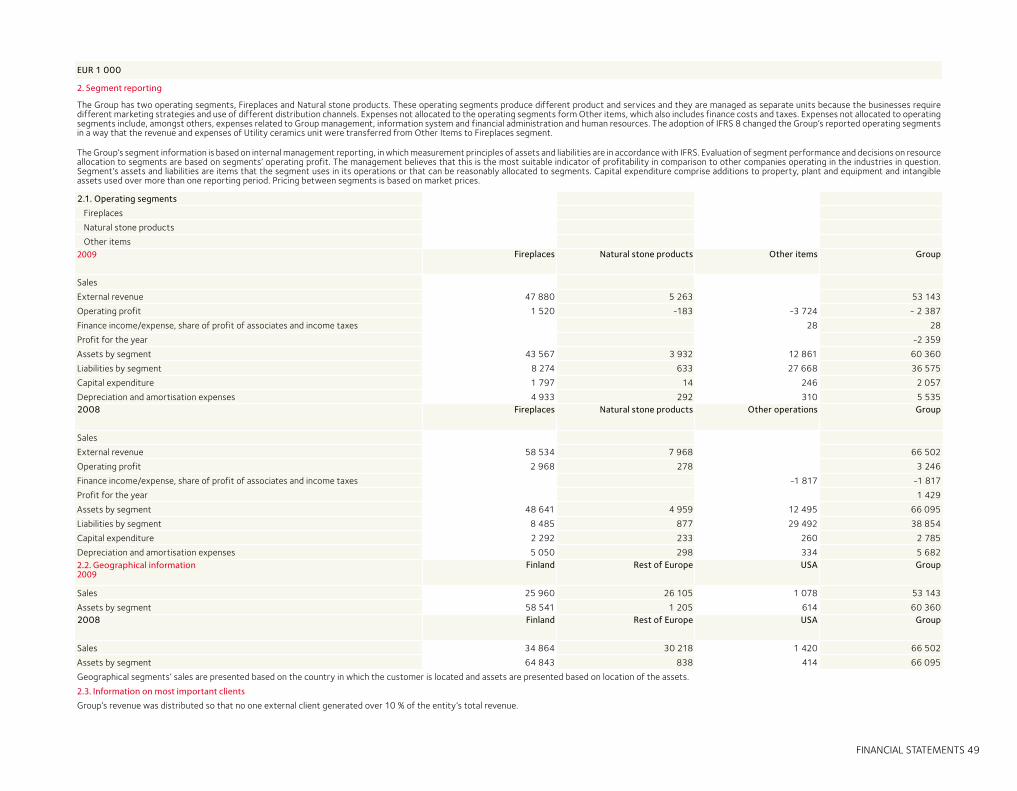
FINANCIAL STATEMENTS 49
EUR 1 000
2. Segment reporting
The Group has two operating segments, Fireplaces and Natural stone products. These operating segments produce different product and services and they are managed as separate units because the businesses require different marketing strategies and use of different distribution channels. Expenses not allocated to the operating segments form Other items, which also includes finance costs and taxes. Expenses not allocated to operating segments include, amongst others, expenses related to Group management, information system and financial administration and human resources. The adoption of IFRS 8 changed the Group’s reported operating segments in a way that the revenue and expenses of Utility ceramics unit were transferred from Other Items to Fireplaces segment.
The Group’s segment information is based on internal management reporting, in which measurement principles of assets and liabilities are in accordance with IFRS. Evaluation of segment performance and decisions on resource allocation to segments are based on segments’ operating profit. The management believes that this is the most suitable indicator of profitability in comparison to other companies operating in the industries in question. Segment’s assets and liabilities are items that the segment uses in its operations or that can be reasonably allocated to segments. Capital expenditure comprise additions to property, plant and equipment and intangible assets used over more than one reporting period. Pricing between segments is based on market prices.
2.1. Operating segments
Fireplaces
Natural stone products
Other items2009 Fireplaces Natural stone products Other items Group
Sales
External revenue 47 880 5 263 53 143
Operating profit 1 520 -183 -3 724 - 2 387
Finance income/expense, share of profit of associates and income taxes 28 28
Profit for the year -2 359
Assets by segment 43 567 3 932 12 861 60 360
Liabilities by segment 8 274 633 27 668 36 575
Capital expenditure 1 797 14 246 2 057
Depreciation and amortisation expenses 4 933 292 310 5 5352008 Fireplaces Natural stone products Other operations Group
Sales
External revenue 58 534 7 968 66 502
Operating profit 2 968 278 3 246
Finance income/expense, share of profit of associates and income taxes -1 817 -1 817
Profit for the year 1 429
Assets by segment 48 641 4 959 12 495 66 095
Liabilities by segment 8 485 877 29 492 38 854
Capital expenditure 2 292 233 260 2 785
Depreciation and amortisation expenses 5 050 298 334 5 6822.2. Geographical information 2009
Finland Rest of Europe USA Group
Sales 25 960 26 105 1 078 53 143
Assets by segment 58 541 1 205 614 60 3602008 Finland Rest of Europe USA Group
Sales 34 864 30 218 1 420 66 502
Assets by segment 64 843 838 414 66 095
Geographical segments’ sales are presented based on the country in which the customer is located and assets are presented based on location of the assets.
2.3. Information on most important clients
Group’s revenue was distributed so that no one external client generated over 10 % of the entity’s total revenue.
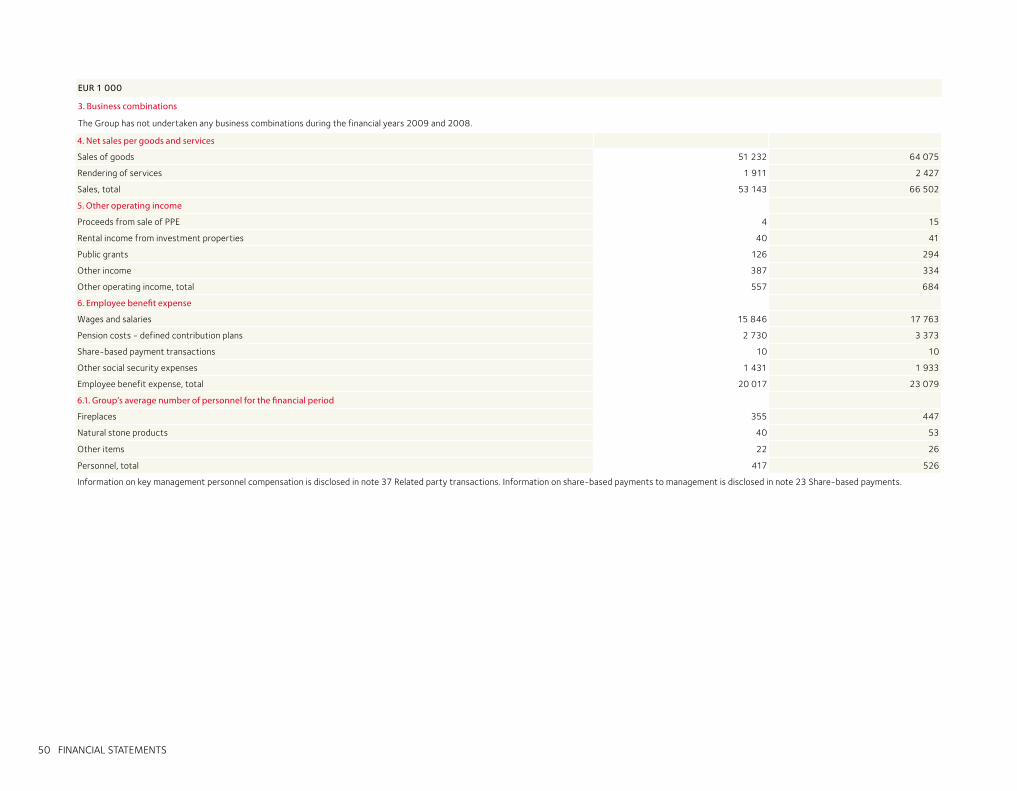
50 FINANCIAL STATEMENTS
EUR 1 000
3. Business combinations
The Group has not undertaken any business combinations during the financial years 2009 and 2008.
4. Net sales per goods and services
Sales of goods 51 232 64 075
Rendering of services 1 911 2 427
Sales, total 53 143 66 502
5. Other operating income
Proceeds from sale of PPE 4 15
Rental income from investment properties 40 41
Public grants 126 294
Other income 387 334
Other operating income, total 557 684
6. Employee benefit expense
Wages and salaries 15 846 17 763
Pension costs - defined contribution plans 2 730 3 373
Share-based payment transactions 10 10
Other social security expenses 1 431 1 933
Employee benefit expense, total 20 017 23 079
6.1. Group’s average number of personnel for the financial period
Fireplaces 355 447
Natural stone products 40 53
Other items 22 26
Personnel, total 417 526
Information on key management personnel compensation is disclosed in note 37 Related party transactions. Information on share-based payments to management is disclosed in note 23 Share-based payments.
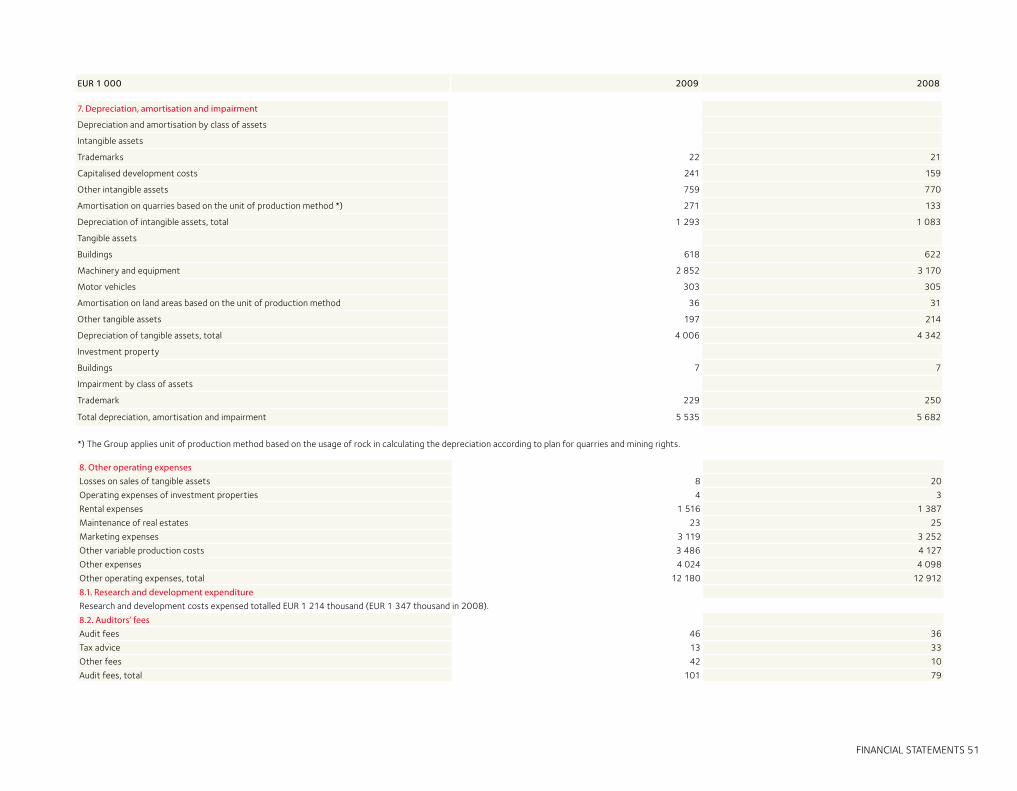
FINANCIAL STATEMENTS 51
EUR 1 000 2009 2008
7. Depreciation, amortisation and impairment
Depreciation and amortisation by class of assets
Intangible assets
Trademarks 22 21
Capitalised development costs 241 159
Other intangible assets 759 770
Amortisation on quarries based on the unit of production method *) 271 133
Depreciation of intangible assets, total 1 293 1 083
Tangible assets
Buildings 618 622
Machinery and equipment 2 852 3 170
Motor vehicles 303 305
Amortisation on land areas based on the unit of production method 36 31
Other tangible assets 197 214
Depreciation of tangible assets, total 4 006 4 342
Investment property
Buildings 7 7
Impairment by class of assets
Trademark 229 250
Total depreciation, amortisation and impairment 5 535 5 682
*) The Group applies unit of production method based on the usage of rock in calculating the depreciation according to plan for quarries and mining rights.
8. Other operating expensesLosses on sales of tangible assets 8 20
Operating expenses of investment properties 4 3
Rental expenses 1 516 1 387
Maintenance of real estates 23 25
Marketing expenses 3 119 3 252
Other variable production costs 3 486 4 127
Other expenses 4 024 4 098
Other operating expenses, total 12 180 12 912
8.1. Research and development expenditureResearch and development costs expensed totalled EUR 1 214 thousand (EUR 1 347 thousand in 2008).
8.2. Auditors’ feesAudit fees 46 36
Tax advice 13 33
Other fees 42 10
Audit fees, total 101 79
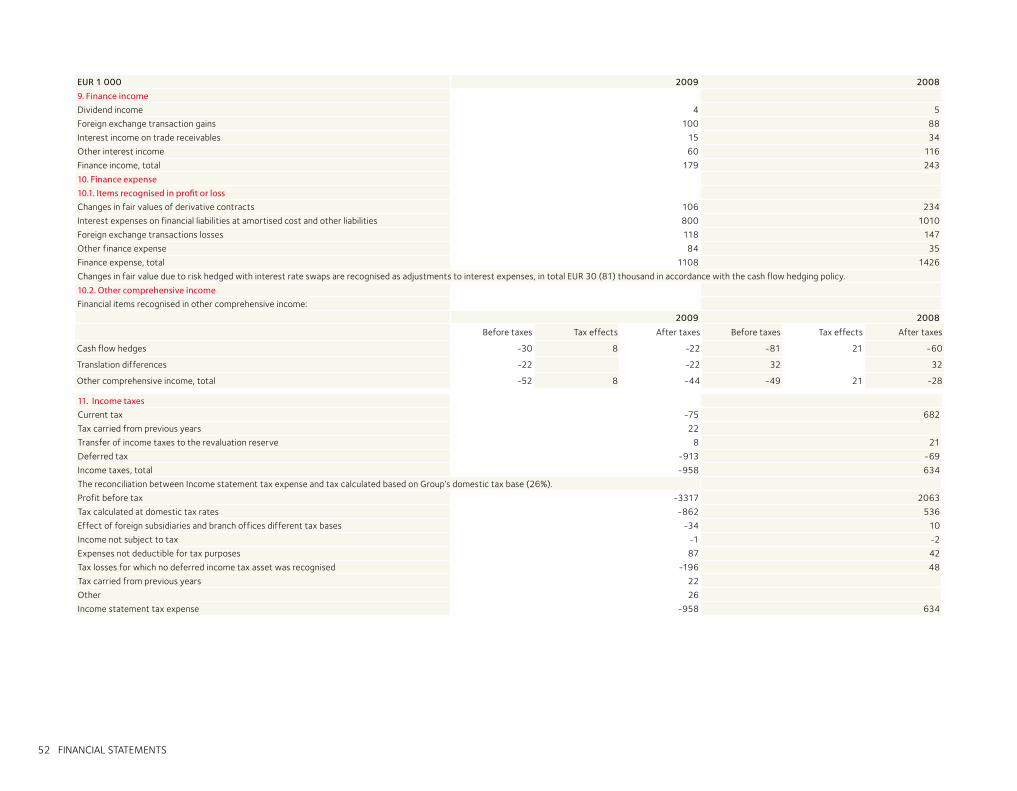
52 FINANCIAL STATEMENTS
EUR 1 000 2009 2008
9. Finance incomeDividend income 4 5
Foreign exchange transaction gains 100 88
Interest income on trade receivables 15 34
Other interest income 60 116
Finance income, total 179 243
10. Finance expense 10.1. Items recognised in profit or lossChanges in fair values of derivative contracts 106 234
Interest expenses on financial liabilities at amortised cost and other liabilities 800 1010
Foreign exchange transactions losses 118 147
Other finance expense 84 35
Finance expense, total 1108 1426
Changes in fair value due to risk hedged with interest rate swaps are recognised as adjustments to interest expenses, in total EUR 30 (81) thousand in accordance with the cash flow hedging policy.
10.2. Other comprehensive incomeFinancial items recognised in other comprehensive income:
2009 2008
Before taxes Tax effects After taxes Before taxes Tax effects After taxes
Cash flow hedges -30 8 -22 -81 21 -60
Translation differences -22 -22 32 32
Other comprehensive income, total -52 8 -44 -49 21 -28
11. Income taxesCurrent tax -75 682
Tax carried from previous years 22
Transfer of income taxes to the revaluation reserve 8 21
Deferred tax -913 -69
Income taxes, total -958 634
The reconciliation between Income statement tax expense and tax calculated based on Group’s domestic tax base (26%).
Profit before tax -3317 2063
Tax calculated at domestic tax rates -862 536
Effect of foreign subsidiaries and branch offices different tax bases -34 10
Income not subject to tax -1 -2
Expenses not deductible for tax purposes 87 42
Tax losses for which no deferred income tax asset was recognised -196 48
Tax carried from previous years 22
Other 26
Income statement tax expense -958 634
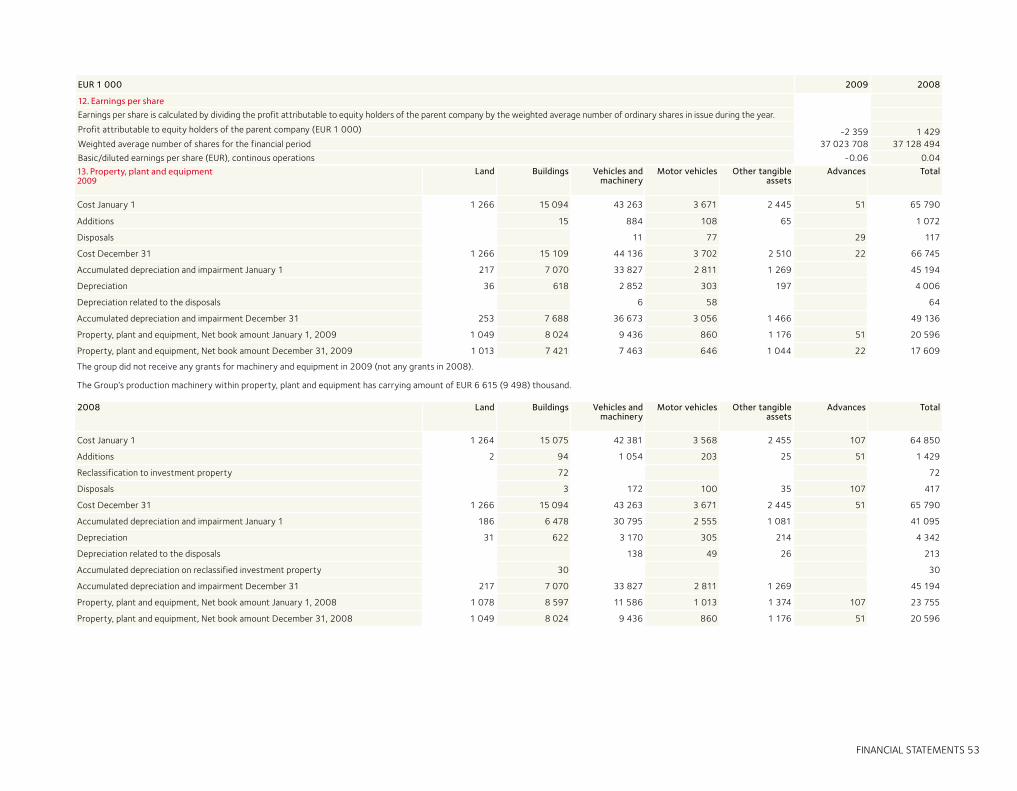
FINANCIAL STATEMENTS 53
EUR 1 000 2009 2008
12. Earnings per shareEarnings per share is calculated by dividing the profit attributable to equity holders of the parent company by the weighted average number of ordinary shares in issue during the year.
Profit attributable to equity holders of the parent company (EUR 1 000) -2 359 1 429Weighted average number of shares for the financial period 37 023 708 37 128 494
Basic/diluted earnings per share (EUR), continous operations -0.06 0.04
13. Property, plant and equipment2009
Land Buildings Vehicles and machinery
Motor vehicles Other tangible assets
Advances Total
Cost January 1 1 266 15 094 43 263 3 671 2 445 51 65 790
Additions 15 884 108 65 1 072
Disposals 11 77 29 117
Cost December 31 1 266 15 109 44 136 3 702 2 510 22 66 745
Accumulated depreciation and impairment January 1 217 7 070 33 827 2 811 1 269 45 194
Depreciation 36 618 2 852 303 197 4 006
Depreciation related to the disposals 6 58 64
Accumulated depreciation and impairment December 31 253 7 688 36 673 3 056 1 466 49 136
Property, plant and equipment, Net book amount January 1, 2009 1 049 8 024 9 436 860 1 176 51 20 596
Property, plant and equipment, Net book amount December 31, 2009 1 013 7 421 7 463 646 1 044 22 17 609
The group did not receive any grants for machinery and equipment in 2009 (not any grants in 2008).
The Group’s production machinery within property, plant and equipment has carrying amount of EUR 6 615 (9 498) thousand.
2008 Land Buildings Vehicles and machinery
Motor vehicles Other tangible assets
Advances Total
Cost January 1 1 264 15 075 42 381 3 568 2 455 107 64 850
Additions 2 94 1 054 203 25 51 1 429
Reclassification to investment property 72 72
Disposals 3 172 100 35 107 417
Cost December 31 1 266 15 094 43 263 3 671 2 445 51 65 790
Accumulated depreciation and impairment January 1 186 6 478 30 795 2 555 1 081 41 095
Depreciation 31 622 3 170 305 214 4 342
Depreciation related to the disposals 138 49 26 213
Accumulated depreciation on reclassified investment property 30 30
Accumulated depreciation and impairment December 31 217 7 070 33 827 2 811 1 269 45 194
Property, plant and equipment, Net book amount January 1, 2008 1 078 8 597 11 586 1 013 1 374 107 23 755
Property, plant and equipment, Net book amount December 31, 2008 1 049 8 024 9 436 860 1 176 51 20 596
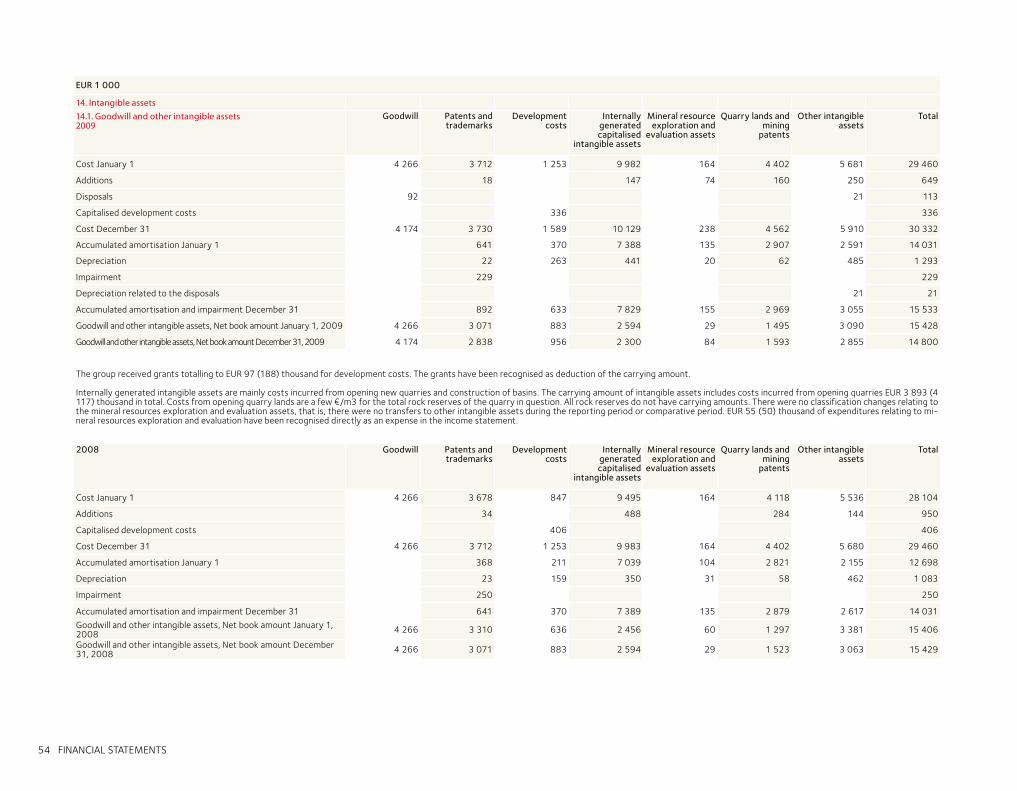
54 FINANCIAL STATEMENTS
EUR 1 000
14. Intangible assets14.1. Goodwill and other intangible assets2009
Goodwill Patents and trademarks
Development costs
Internally generated capitalised
intangible assets
Mineral resource exploration and
evaluation assets
Quarry lands and mining
patents
Other intangible assets
Total
Cost January 1 4 266 3 712 1 253 9 982 164 4 402 5 681 29 460
Additions 18 147 74 160 250 649
Disposals 92 21 113
Capitalised development costs 336 336
Cost December 31 4 174 3 730 1 589 10 129 238 4 562 5 910 30 332
Accumulated amortisation January 1 641 370 7 388 135 2 907 2 591 14 031
Depreciation 22 263 441 20 62 485 1 293
Impairment 229 229
Depreciation related to the disposals 21 21
Accumulated amortisation and impairment December 31 892 633 7 829 155 2 969 3 055 15 533
Goodwill and other intangible assets, Net book amount January 1, 2009 4 266 3 071 883 2 594 29 1 495 3 090 15 428
Goodwill and other intangible assets, Net book amount December 31, 2009 4 174 2 838 956 2 300 84 1 593 2 855 14 800
The group received grants totalling to EUR 97 (188) thousand for development costs. The grants have been recognised as deduction of the carrying amount. Internally generated intangible assets are mainly costs incurred from opening new quarries and construction of basins. The carrying amount of intangible assets includes costs incurred from opening quarries EUR 3 893 (4 117) thousand in total. Costs from opening quarry lands are a few €/m3 for the total rock reserves of the quarry in question. All rock reserves do not have carrying amounts. There were no classification changes relating to the mineral resources exploration and evaluation assets, that is, there were no transfers to other intangible assets during the reporting period or comparative period. EUR 55 (50) thousand of expenditures relating to mi-neral resources exploration and evaluation have been recognised directly as an expense in the income statement.
2008 Goodwill Patents and trademarks
Development costs
Internally generated capitalised
intangible assets
Mineral resource exploration and
evaluation assets
Quarry lands and mining
patents
Other intangible assets
Total
Cost January 1 4 266 3 678 847 9 495 164 4 118 5 536 28 104
Additions 34 488 284 144 950
Capitalised development costs 406 406
Cost December 31 4 266 3 712 1 253 9 983 164 4 402 5 680 29 460
Accumulated amortisation January 1 368 211 7 039 104 2 821 2 155 12 698
Depreciation 23 159 350 31 58 462 1 083
Impairment 250 250
Accumulated amortisation and impairment December 31 641 370 7 389 135 2 879 2 617 14 031
Goodwill and other intangible assets, Net book amount January 1, 2008 4 266 3 310 636 2 456 60 1 297 3 381 15 406
Goodwill and other intangible assets, Net book amount December 31, 2008 4 266 3 071 883 2 594 29 1 523 3 063 15 429
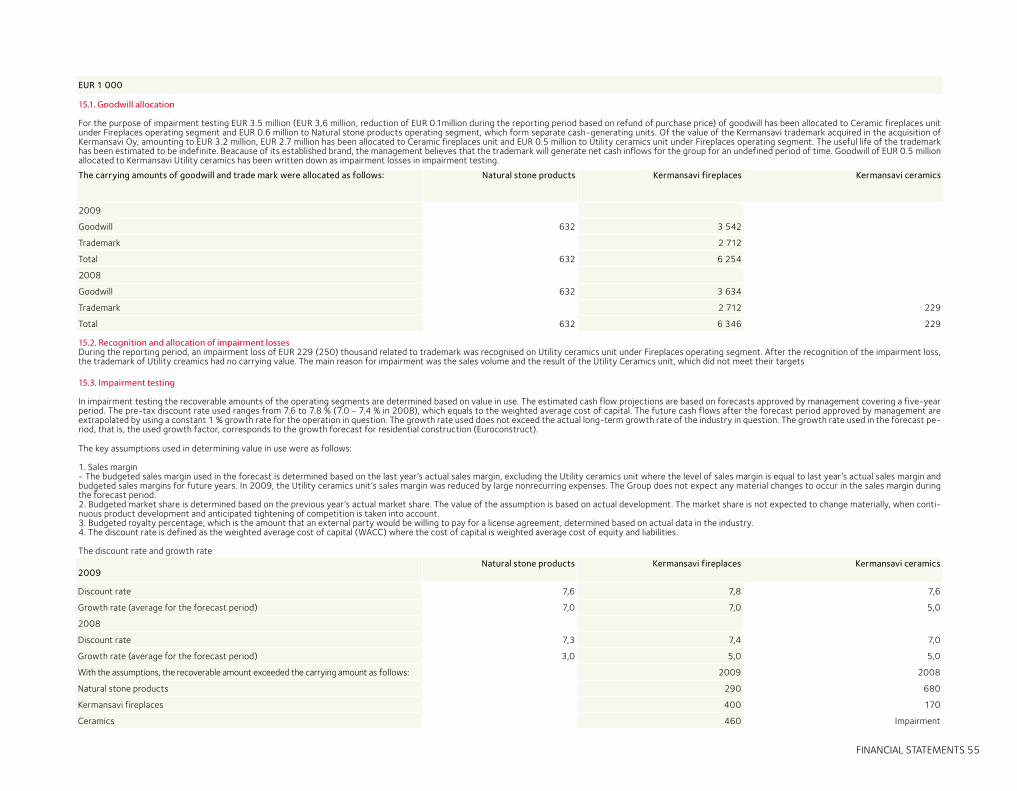
FINANCIAL STATEMENTS 55
EUR 1 000
15.1. Goodwill allocation
For the purpose of impairment testing EUR 3.5 million (EUR 3,6 million, reduction of EUR 0.1million during the reporting period based on refund of purchase price) of goodwill has been allocated to Ceramic fireplaces unit under Fireplaces operating segment and EUR 0.6 million to Natural stone products operating segment, which form separate cash-generating units. Of the value of the Kermansavi trademark acquired in the acquisition of Kermansavi Oy, amounting to EUR 3.2 million, EUR 2.7 million has been allocated to Ceramic fireplaces unit and EUR 0.5 million to Utility ceramics unit under Fireplaces operating segment. The useful life of the trademark has been estimated to be indefinite. Beacause of its established brand, the management believes that the trademark will generate net cash inflows for the group for an undefined period of time. Goodwill of EUR 0.5 million allocated to Kermansavi Utility ceramics has been written down as impairment losses in impairment testing.
The carrying amounts of goodwill and trade mark were allocated as follows: Natural stone products Kermansavi fireplaces Kermansavi ceramics
2009
Goodwill 632 3 542
Trademark 2 712
Total 632 6 254
2008
Goodwill 632 3 634
Trademark 2 712 229
Total 632 6 346 229
15.2. Recognition and allocation of impairment lossesDuring the reporting period, an impairment loss of EUR 229 (250) thousand related to trademark was recognised on Utility ceramics unit under Fireplaces operating segment. After the recognition of the impairment loss, the trademark of Utility creamics had no carrying value. The main reason for impairment was the sales volume and the result of the Utility Ceramics unit, which did not meet their targets
15.3. Impairment testing
In impairment testing the recoverable amounts of the operating segments are determined based on value in use. The estimated cash flow projections are based on forecasts approved by management covering a five-year period. The pre-tax discount rate used ranges from 7.6 to 7.8 % (7.0 - 7.4 % in 2008), which equals to the weighted average cost of capital. The future cash flows after the forecast period approved by management are extrapolated by using a constant 1 % growth rate for the operation in question. The growth rate used does not exceed the actual long-term growth rate of the industry in question. The growth rate used in the forecast pe-riod, that is, the used growth factor, corresponds to the growth forecast for residential construction (Euroconstruct).
The key assumptions used in determining value in use were as follows:
1. Sales margin - The budgeted sales margin used in the forecast is determined based on the last year’s actual sales margin, excluding the Utility ceramics unit where the level of sales margin is equal to last year’s actual sales margin and budgeted sales margins for future years. In 2009, the Utility ceramics unit’s sales margin was reduced by large nonrecurring expenses. The Group does not expect any material changes to occur in the sales margin during the forecast period. 2. Budgeted market share is determined based on the previous year’s actual market share. The value of the assumption is based on actual development. The market share is not expected to change materially, when conti-nuous product development and anticipated tightening of competition is taken into account.3. Budgeted royalty percentage, which is the amount that an external party would be willing to pay for a license agreement, determined based on actual data in the industry. 4. The discount rate is defined as the weighted average cost of capital (WACC) where the cost of capital is weighted average cost of equity and liabilities.
The discount rate and growth rate
2009Natural stone products Kermansavi fireplaces Kermansavi ceramics
Discount rate 7,6 7,8 7,6
Growth rate (average for the forecast period) 7,0 7,0 5,0
2008
Discount rate 7,3 7,4 7,0
Growth rate (average for the forecast period) 3,0 5,0 5,0
With the assumptions, the recoverable amount exceeded the carrying amount as follows: 2009 2008
Natural stone products 290 680
Kermansavi fireplaces 400 170
Ceramics 460 Impairment
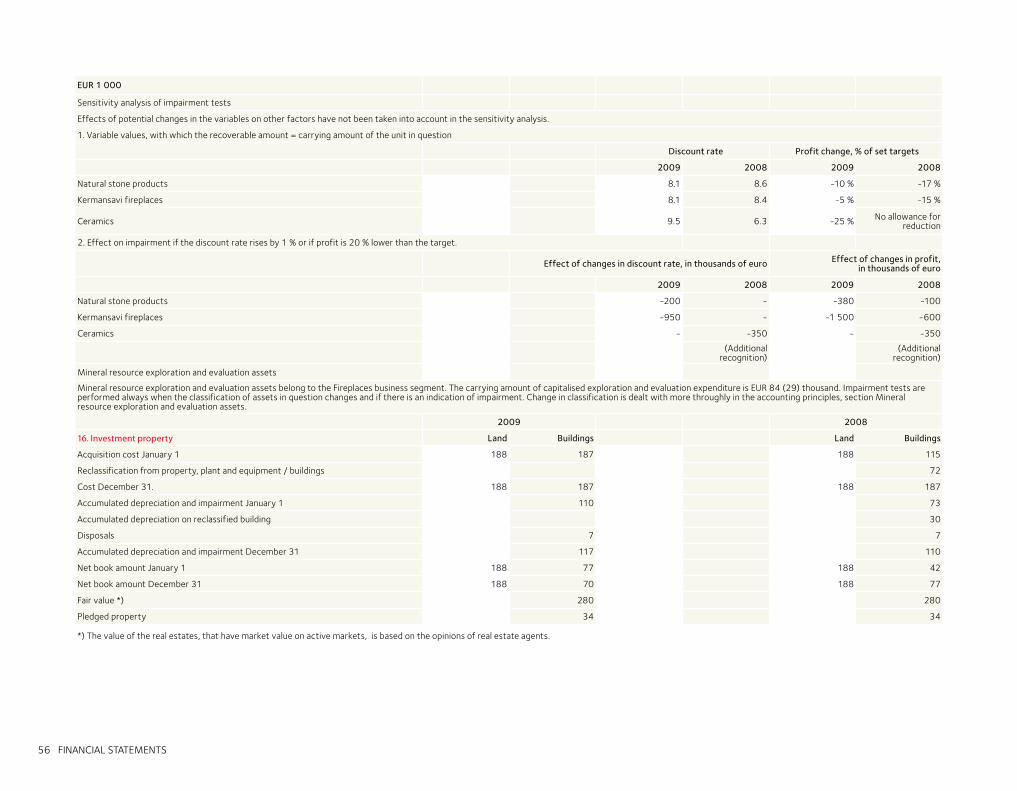
56 FINANCIAL STATEMENTS
EUR 1 000
Sensitivity analysis of impairment tests
Effects of potential changes in the variables on other factors have not been taken into account in the sensitivity analysis.
1. Variable values, with which the recoverable amount = carrying amount of the unit in question
Discount rate Profit change, % of set targets
2009 2008 2009 2008
Natural stone products 8.1 8.6 -10 % -17 %
Kermansavi fireplaces 8.1 8.4 -5 % -15 %
Ceramics 9.5 6.3 -25 % No allowance for reduction
2. Effect on impairment if the discount rate rises by 1 % or if profit is 20 % lower than the target.
Effect of changes in discount rate, in thousands of euro Effect of changes in profit,in thousands of euro
2009 2008 2009 2008
Natural stone products -200 - -380 -100
Kermansavi fireplaces -950 - -1 500 -600
Ceramics - -350 - -350
(Additional recognition)
(Additional recognition)
Mineral resource exploration and evaluation assets
Mineral resource exploration and evaluation assets belong to the Fireplaces business segment. The carrying amount of capitalised exploration and evaluation expenditure is EUR 84 (29) thousand. Impairment tests are performed always when the classification of assets in question changes and if there is an indication of impairment. Change in classification is dealt with more throughly in the accounting principles, section Mineral resource exploration and evaluation assets.
2009 2008
16. Investment property Land Buildings Land Buildings
Acquisition cost January 1 188 187 188 115
Reclassification from property, plant and equipment / buildings 72
Cost December 31. 188 187 188 187
Accumulated depreciation and impairment January 1 110 73
Accumulated depreciation on reclassified building 30
Disposals 7 7
Accumulated depreciation and impairment December 31 117 110
Net book amount January 1 188 77 188 42
Net book amount December 31 188 70 188 77
Fair value *) 280 280
Pledged property 34 34
*) The value of the real estates, that have market value on active markets, is based on the opinions of real estate agents.
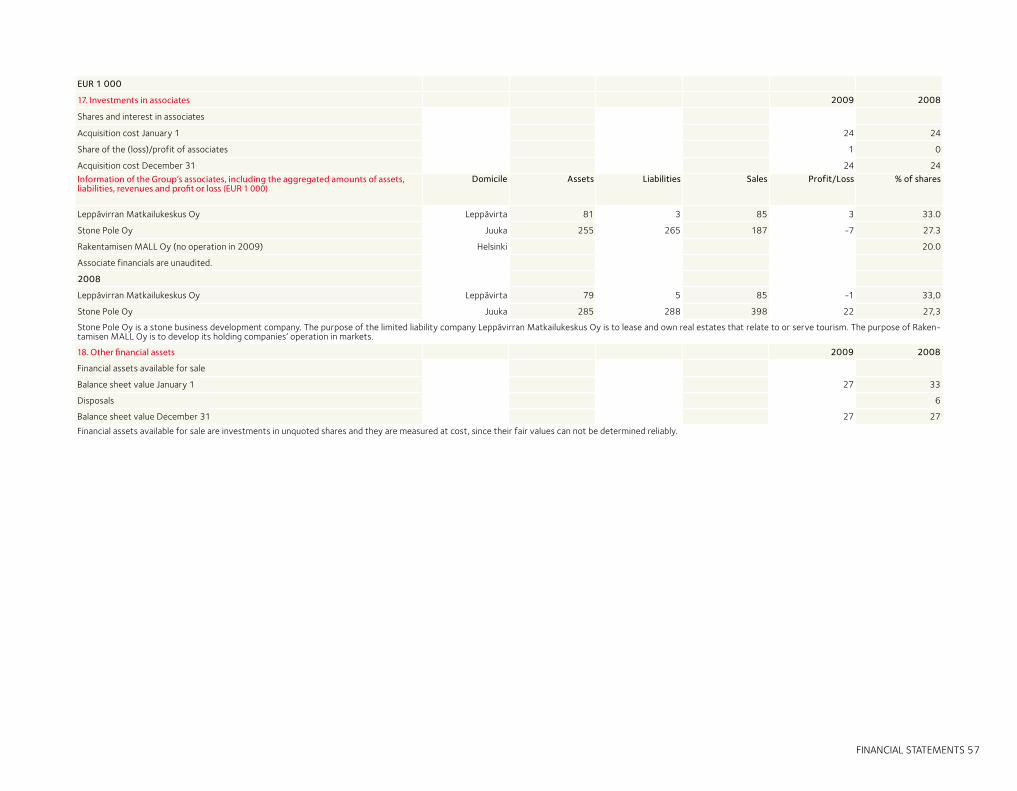
FINANCIAL STATEMENTS 57
18. Other financial assets 2009 2008
Financial assets available for sale
Balance sheet value January 1 27 33
Disposals 6
Balance sheet value December 31 27 27
Financial assets available for sale are investments in unquoted shares and they are measured at cost, since their fair values can not be determined reliably.
EUR 1 000
17. Investments in associates 2009 2008
Shares and interest in associates
Acquisition cost January 1 24 24
Share of the (loss)/profit of associates 1 0
Acquisition cost December 31 24 24
Information of the Group’s associates, including the aggregated amounts of assets, liabilities, revenues and profit or loss (EUR 1 000)
Domicile Assets Liabilities Sales Profit/Loss % of shares
Leppävirran Matkailukeskus Oy Leppävirta 81 3 85 3 33.0
Stone Pole Oy Juuka 255 265 187 -7 27.3
Rakentamisen MALL Oy (no operation in 2009) Helsinki 20.0
Associate financials are unaudited.
2008
Leppävirran Matkailukeskus Oy Leppävirta 79 5 85 -1 33,0
Stone Pole Oy Juuka 285 288 398 22 27,3
Stone Pole Oy is a stone business development company. The purpose of the limited liability company Leppävirran Matkailukeskus Oy is to lease and own real estates that relate to or serve tourism. The purpose of Raken-tamisen MALL Oy is to develop its holding companies’ operation in markets.
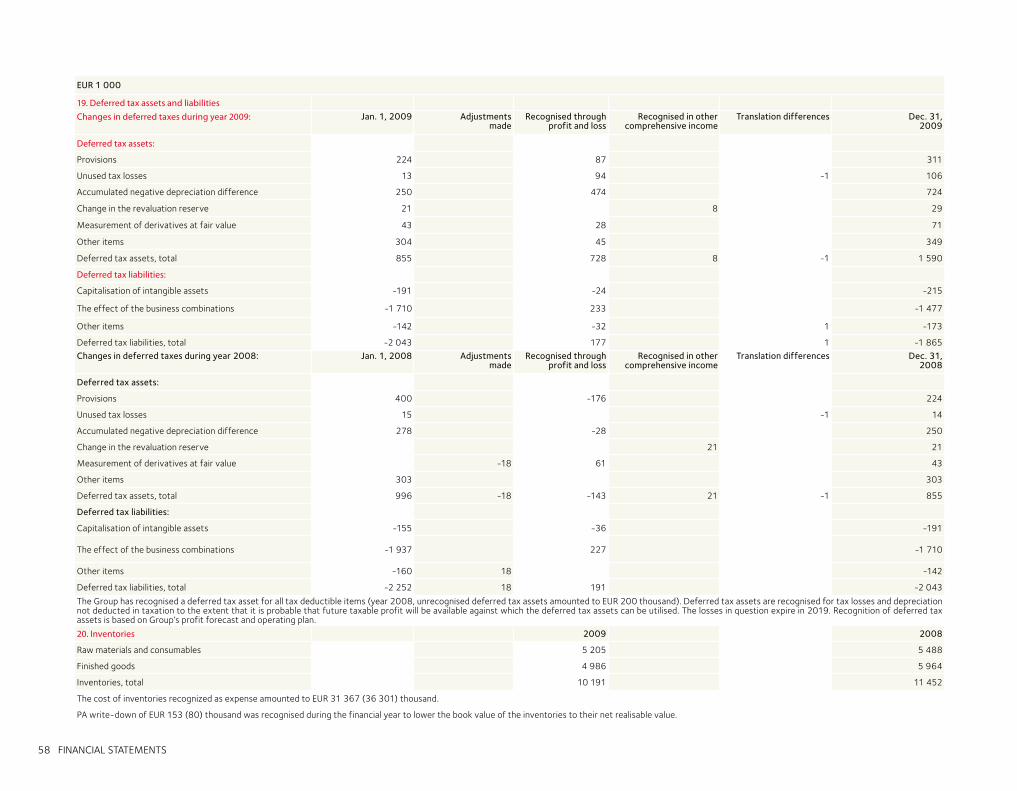
58 FINANCIAL STATEMENTS
EUR 1 000
19. Deferred tax assets and liabilitiesChanges in deferred taxes during year 2009: Jan. 1, 2009 Adjustments
madeRecognised through
profit and lossRecognised in other
comprehensive incomeTranslation differences Dec. 31,
2009
Deferred tax assets:
Provisions 224 87 311
Unused tax losses 13 94 -1 106
Accumulated negative depreciation difference 250 474 724
Change in the revaluation reserve 21 8 29
Measurement of derivatives at fair value 43 28 71
Other items 304 45 349
Deferred tax assets, total 855 728 8 -1 1 590
Deferred tax liabilities:
Capitalisation of intangible assets -191 -24 -215
The effect of the business combinations -1 710 233 -1 477
Other items -142 -32 1 -173
Deferred tax liabilities, total -2 043 177 1 -1 865
Changes in deferred taxes during year 2008: Jan. 1, 2008 Adjustments made
Recognised through profit and loss
Recognised in other comprehensive income
Translation differences Dec. 31, 2008
Deferred tax assets:
Provisions 400 -176 224
Unused tax losses 15 -1 14
Accumulated negative depreciation difference 278 -28 250
Change in the revaluation reserve 21 21
Measurement of derivatives at fair value -18 61 43
Other items 303 303
Deferred tax assets, total 996 -18 -143 21 -1 855
Deferred tax liabilities:
Capitalisation of intangible assets -155 -36 -191
The effect of the business combinations -1 937 227 -1 710
Other items -160 18 -142
Deferred tax liabilities, total -2 252 18 191 -2 043
The Group has recognised a deferred tax asset for all tax deductible items (year 2008, unrecognised deferred tax assets amounted to EUR 200 thousand). Deferred tax assets are recognised for tax losses and depreciation not deducted in taxation to the extent that it is probable that future taxable profit will be available against which the deferred tax assets can be utilised. The losses in question expire in 2019. Recognition of deferred tax assets is based on Group’s profit forecast and operating plan.
20. Inventories 2009 2008
Raw materials and consumables 5 205 5 488
Finished goods 4 986 5 964
Inventories, total 10 191 11 452
The cost of inventories recognized as expense amounted to EUR 31 367 (36 301) thousand.
PA write-down of EUR 153 (80) thousand was recognised during the financial year to lower the book value of the inventories to their net realisable value.
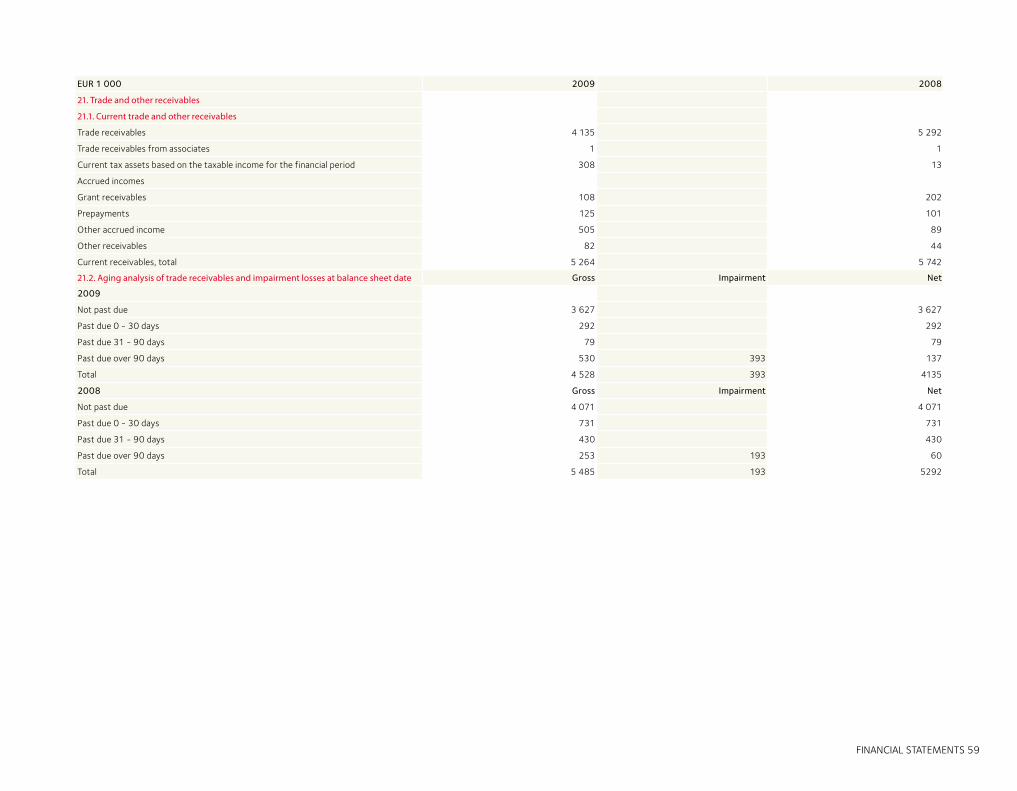
FINANCIAL STATEMENTS 59
EUR 1 000 2009 2008
21. Trade and other receivables
21.1. Current trade and other receivables
Trade receivables 4 135 5 292
Trade receivables from associates 1 1
Current tax assets based on the taxable income for the financial period 308 13
Accrued incomes
Grant receivables 108 202
Prepayments 125 101
Other accrued income 505 89
Other receivables 82 44
Current receivables, total 5 264 5 742
21.2. Aging analysis of trade receivables and impairment losses at balance sheet date Gross Impairment Net
2009
Not past due 3 627 3 627
Past due 0 - 30 days 292 292
Past due 31 - 90 days 79 79
Past due over 90 days 530 393 137
Total 4 528 393 4135
2008 Gross Impairment Net
Not past due 4 071 4 071
Past due 0 - 30 days 731 731
Past due 31 - 90 days 430 430
Past due over 90 days 253 193 60
Total 5 485 193 5292
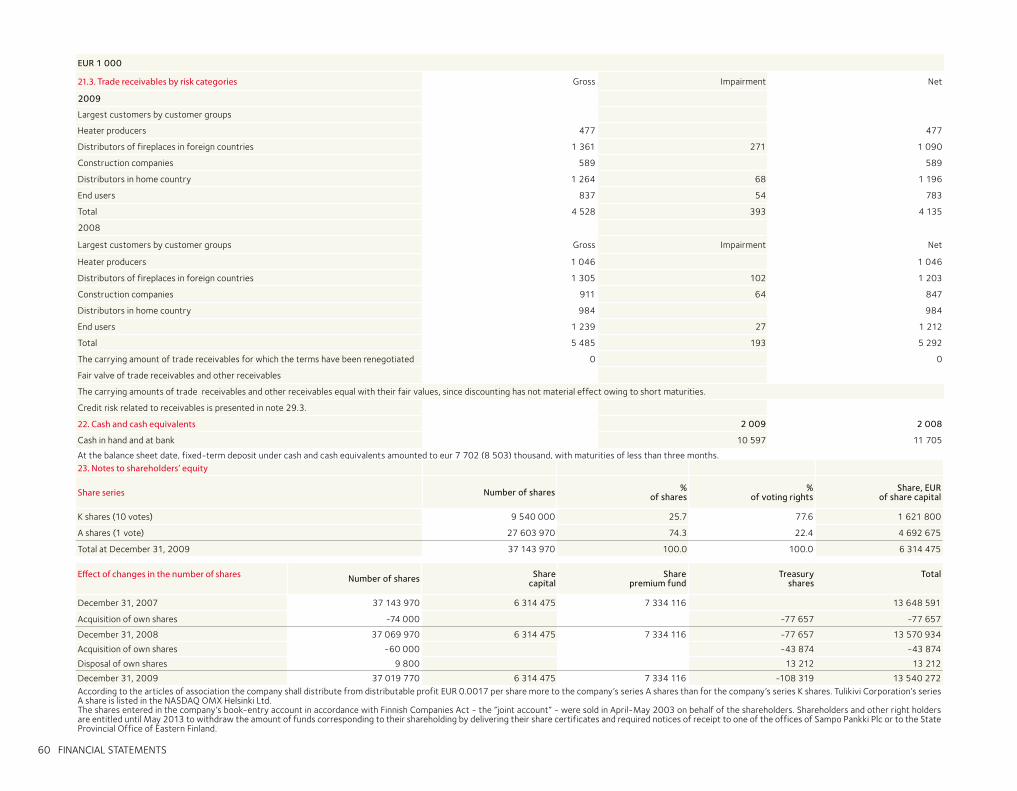
60 FINANCIAL STATEMENTS
EUR 1 000
21.3. Trade receivables by risk categories Gross Impairment Net
2009
Largest customers by customer groups
Heater producers 477 477
Distributors of fireplaces in foreign countries 1 361 271 1 090
Construction companies 589 589
Distributors in home country 1 264 68 1 196
End users 837 54 783
Total 4 528 393 4 135
2008
Largest customers by customer groups Gross Impairment Net
Heater producers 1 046 1 046
Distributors of fireplaces in foreign countries 1 305 102 1 203
Construction companies 911 64 847
Distributors in home country 984 984
End users 1 239 27 1 212
Total 5 485 193 5 292
The carrying amount of trade receivables for which the terms have been renegotiated 0 0
Fair valve of trade receivables and other receivables
The carrying amounts of trade receivables and other receivables equal with their fair values, since discounting has not material effect owing to short maturities.
Credit risk related to receivables is presented in note 29.3.
22. Cash and cash equivalents 2 009 2 008
Cash in hand and at bank 10 597 11 705
At the balance sheet date, fixed-term deposit under cash and cash equivalents amounted to eur 7 702 (8 503) thousand, with maturities of less than three months.
Effect of changes in the number of shares Number of shares Sharecapital
Sharepremium fund
Treasuryshares
Total
December 31, 2007 37 143 970 6 314 475 7 334 116 13 648 591
Acquisition of own shares -74 000 -77 657 -77 657
December 31, 2008 37 069 970 6 314 475 7 334 116 -77 657 13 570 934
Acquisition of own shares -60 000 -43 874 -43 874
Disposal of own shares 9 800 13 212 13 212
December 31, 2009 37 019 770 6 314 475 7 334 116 -108 319 13 540 272According to the articles of association the company shall distribute from distributable profit EUR 0.0017 per share more to the company’s series A shares than for the company’s series K shares. Tulikivi Corporation’s series A share is listed in the NASDAQ OMX Helsinki Ltd. The shares entered in the company’s book-entry account in accordance with Finnish Companies Act - the ”joint account” - were sold in April-May 2003 on behalf of the shareholders. Shareholders and other right holders are entitled until May 2013 to withdraw the amount of funds corresponding to their shareholding by delivering their share certificates and required notices of receipt to one of the offices of Sampo Pankki Plc or to the State Provincial Office of Eastern Finland.
23. Notes to shareholders’ equity
Share series Number of shares %of shares
%of voting rights
Share, EURof share capital
K shares (10 votes) 9 540 000 25.7 77.6 1 621 800
A shares (1 vote) 27 603 970 74.3 22.4 4 692 675
Total at December 31, 2009 37 143 970 100.0 100.0 6 314 475
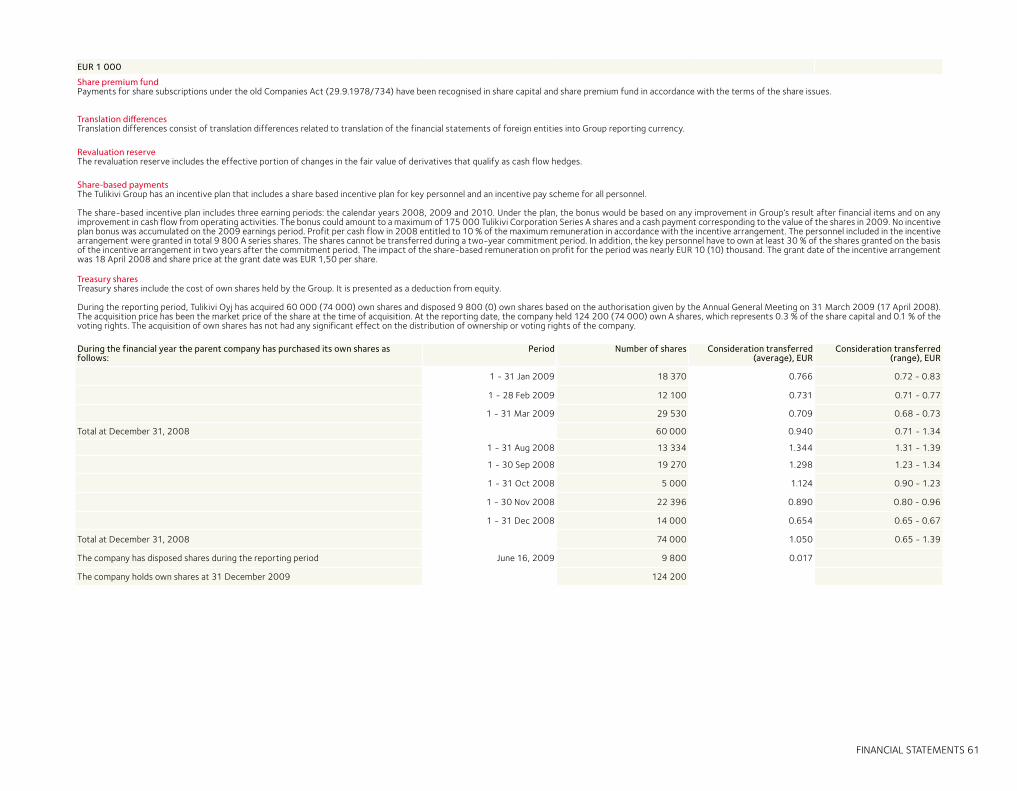
FINANCIAL STATEMENTS 61
EUR 1 000
Share premium fund Payments for share subscriptions under the old Companies Act (29.9.1978/734) have been recognised in share capital and share premium fund in accordance with the terms of the share issues.
Translation differencesTranslation differences consist of translation differences related to translation of the financial statements of foreign entities into Group reporting currency.
Revaluation reserveThe revaluation reserve includes the effective portion of changes in the fair value of derivatives that qualify as cash flow hedges.
Share-based paymentsThe Tulikivi Group has an incentive plan that includes a share based incentive plan for key personnel and an incentive pay scheme for all personnel.
The share-based incentive plan includes three earning periods: the calendar years 2008, 2009 and 2010. Under the plan, the bonus would be based on any improvement in Group’s result after financial items and on any improvement in cash flow from operating activities. The bonus could amount to a maximum of 175 000 Tulikivi Corporation Series A shares and a cash payment corresponding to the value of the shares in 2009. No incentive plan bonus was accumulated on the 2009 earnings period. Profit per cash flow in 2008 entitled to 10 % of the maximum remuneration in accordance with the incentive arrangement. The personnel included in the incentive arrangement were granted in total 9 800 A series shares. The shares cannot be transferred during a two-year commitment period. In addition, the key personnel have to own at least 30 % of the shares granted on the basis of the incentive arrangement in two years after the commitment period. The impact of the share-based remuneration on profit for the period was nearly EUR 10 (10) thousand. The grant date of the incentive arrangement was 18 April 2008 and share price at the grant date was EUR 1,50 per share.
Treasury sharesTreasury shares include the cost of own shares held by the Group. It is presented as a deduction from equity.
During the reporting period, Tulikivi Oyj has acquired 60 000 (74 000) own shares and disposed 9 800 (0) own shares based on the authorisation given by the Annual General Meeting on 31 March 2009 (17 April 2008). The acquisition price has been the market price of the share at the time of acquisition. At the reporting date, the company held 124 200 (74 000) own A shares, which represents 0.3 % of the share capital and 0.1 % of the voting rights. The acquisition of own shares has not had any significant effect on the distribution of ownership or voting rights of the company.
During the financial year the parent company has purchased its own shares as follows:
Period Number of shares Consideration transferred (average), EUR
Consideration transferred (range), EUR
1 - 31 Jan 2009 18 370 0.766 0.72 - 0.83
1 - 28 Feb 2009 12 100 0.731 0.71 - 0.77
1 - 31 Mar 2009 29 530 0.709 0.68 - 0.73
Total at December 31, 2008 60 000 0.940 0.71 - 1.34
1 - 31 Aug 2008 13 334 1.344 1.31 - 1.39
1 - 30 Sep 2008 19 270 1.298 1.23 - 1.34
1 - 31 Oct 2008 5 000 1.124 0.90 - 1.23
1 - 30 Nov 2008 22 396 0.890 0.80 - 0.96
1 - 31 Dec 2008 14 000 0.654 0.65 - 0.67
Total at December 31, 2008 74 000 1.050 0.65 - 1.39
The company has disposed shares during the reporting period June 16, 2009 9 800 0.017
The company holds own shares at 31 December 2009 124 200
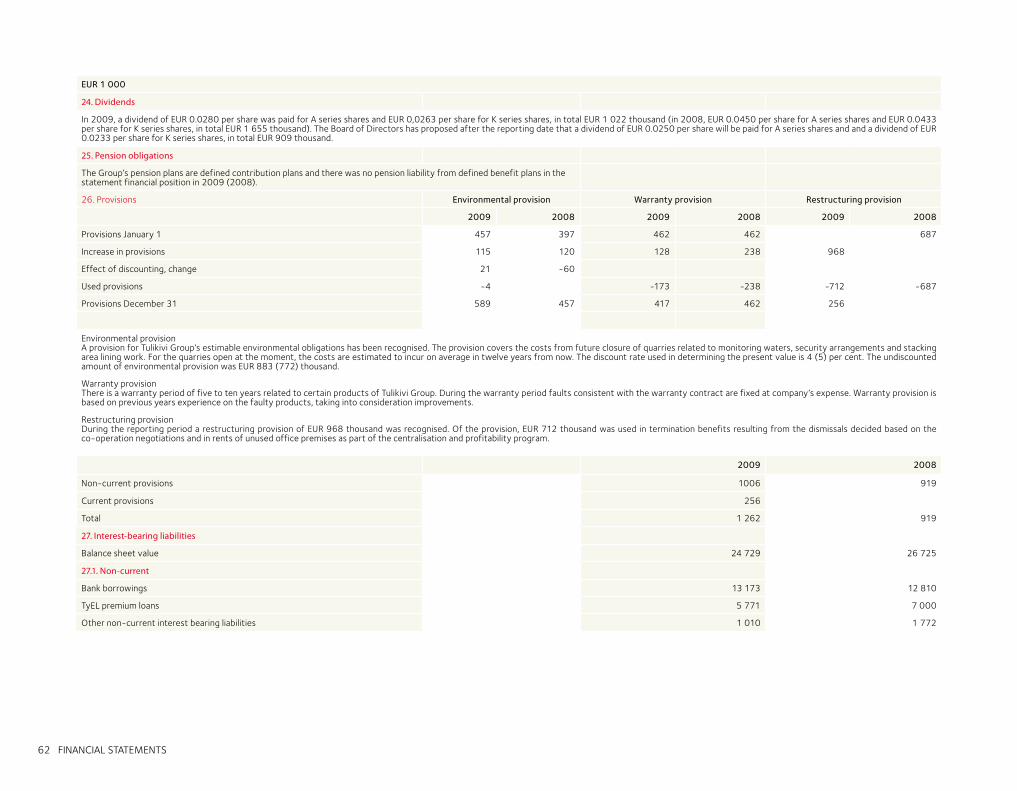
62 FINANCIAL STATEMENTS
EUR 1 000
24. Dividends
In 2009, a dividend of EUR 0.0280 per share was paid for A series shares and EUR 0,0263 per share for K series shares, in total EUR 1 022 thousand (in 2008, EUR 0.0450 per share for A series shares and EUR 0.0433 per share for K series shares, in total EUR 1 655 thousand). The Board of Directors has proposed after the reporting date that a dividend of EUR 0.0250 per share will be paid for A series shares and and a dividend of EUR 0.0233 per share for K series shares, in total EUR 909 thousand.
25. Pension obligations
The Group’s pension plans are defined contribution plans and there was no pension liability from defined benefit plans in the statement financial position in 2009 (2008).
26. Provisions Environmental provision Warranty provision Restructuring provision
2009 2008 2009 2008 2009 2008
Provisions January 1 457 397 462 462 687
Increase in provisions 115 120 128 238 968
Effect of discounting, change 21 -60
Used provisions -4 -173 -238 -712 -687
Provisions December 31 589 457 417 462 256
Environmental provisionA provision for Tulikivi Group’s estimable environmental obligations has been recognised. The provision covers the costs from future closure of quarries related to monitoring waters, security arrangements and stacking area lining work. For the quarries open at the moment, the costs are estimated to incur on average in twelve years from now. The discount rate used in determining the present value is 4 (5) per cent. The undiscounted amount of environmental provision was EUR 883 (772) thousand.
Warranty provisionThere is a warranty period of five to ten years related to certain products of Tulikivi Group. During the warranty period faults consistent with the warranty contract are fixed at company’s expense. Warranty provision is based on previous years experience on the faulty products, taking into consideration improvements.
Restructuring provisionDuring the reporting period a restructuring provision of EUR 968 thousand was recognised. Of the provision, EUR 712 thousand was used in termination benefits resulting from the dismissals decided based on the co-operation negotiations and in rents of unused office premises as part of the centralisation and profitability program.
2009 2008
Non-current provisions 1006 919
Current provisions 256
Total 1 262 919
27. Interest-bearing liabilities
Balance sheet value 24 729 26 725
27.1. Non-current
Bank borrowings 13 173 12 810
TyEL premium loans 5 771 7 000
Other non-current interest bearing liabilities 1 010 1 772
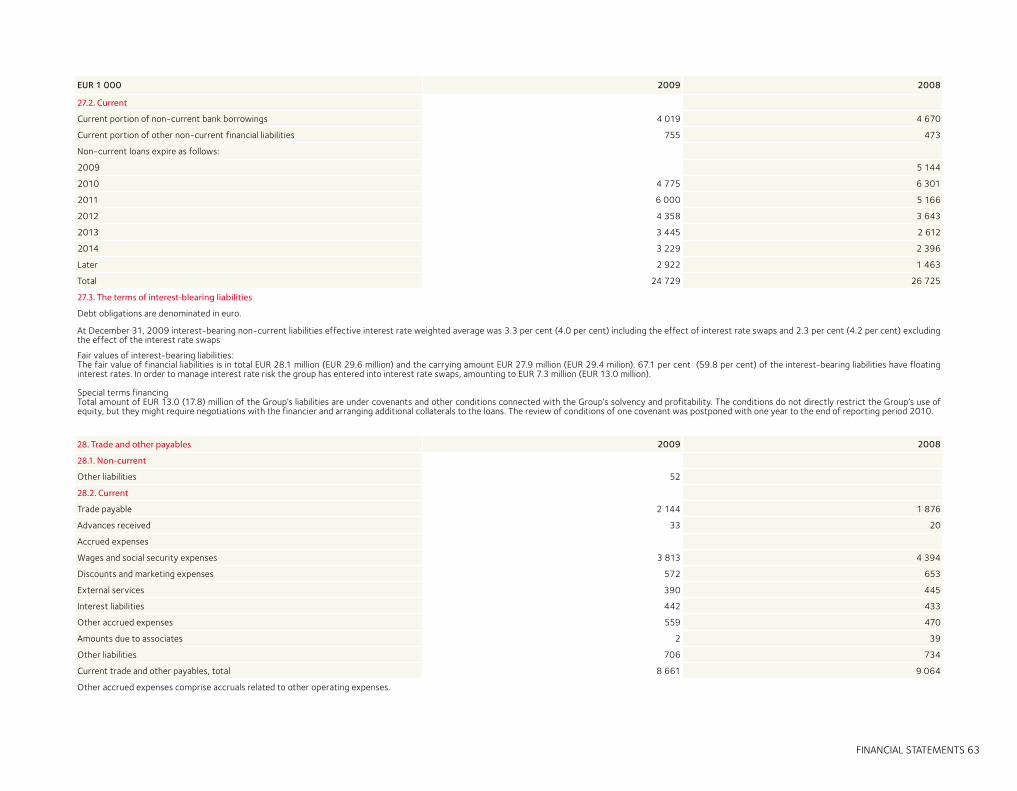
FINANCIAL STATEMENTS 63
EUR 1 000 2009 2008
27.2. Current
Current portion of non-current bank borrowings 4 019 4 670
Current portion of other non-current financial liabilities 755 473
Non-current loans expire as follows:
2009 5 144
2010 4 775 6 301
2011 6 000 5 166
2012 4 358 3 643
2013 3 445 2 612
2014 3 229 2 396
Later 2 922 1 463
Total 24 729 26 725
27.3. The terms of interest-blearing liabilities
Debt obligations are denominated in euro.
At December 31, 2009 interest-bearing non-current liabilities effective interest rate weighted average was 3.3 per cent (4.0 per cent) including the effect of interest rate swaps and 2.3 per cent (4.2 per cent) excluding the effect of the interest rate swaps
Fair values of interest-bearing liabilities:The fair value of financial liabilities is in total EUR 28.1 million (EUR 29.6 million) and the carrying amount EUR 27.9 million (EUR 29.4 milion). 67.1 per cent (59.8 per cent) of the interest-bearing liabilities have floating interest rates. In order to manage interest rate risk the group has entered into interest rate swaps, amounting to EUR 7.3 million (EUR 13.0 million).
Special terms financingTotal amount of EUR 13.0 (17.8) million of the Group’s liabilities are under covenants and other conditions connected with the Group’s solvency and profitability. The conditions do not directly restrict the Group’s use of equity, but they might require negotiations with the financier and arranging additional collaterals to the loans. The review of conditions of one covenant was postponed with one year to the end of reporting period 2010.
28. Trade and other payables 2009 2008
28.1. Non-current
Other liabilities 52
28.2. Current
Trade payable 2 144 1 876
Advances received 33 20
Accrued expenses
Wages and social security expenses 3 813 4 394
Discounts and marketing expenses 572 653
External services 390 445
Interest liabilities 442 433
Other accrued expenses 559 470
Amounts due to associates 2 39
Other liabilities 706 734
Current trade and other payables, total 8 661 9 064
Other accrued expenses comprise accruals related to other operating expenses.
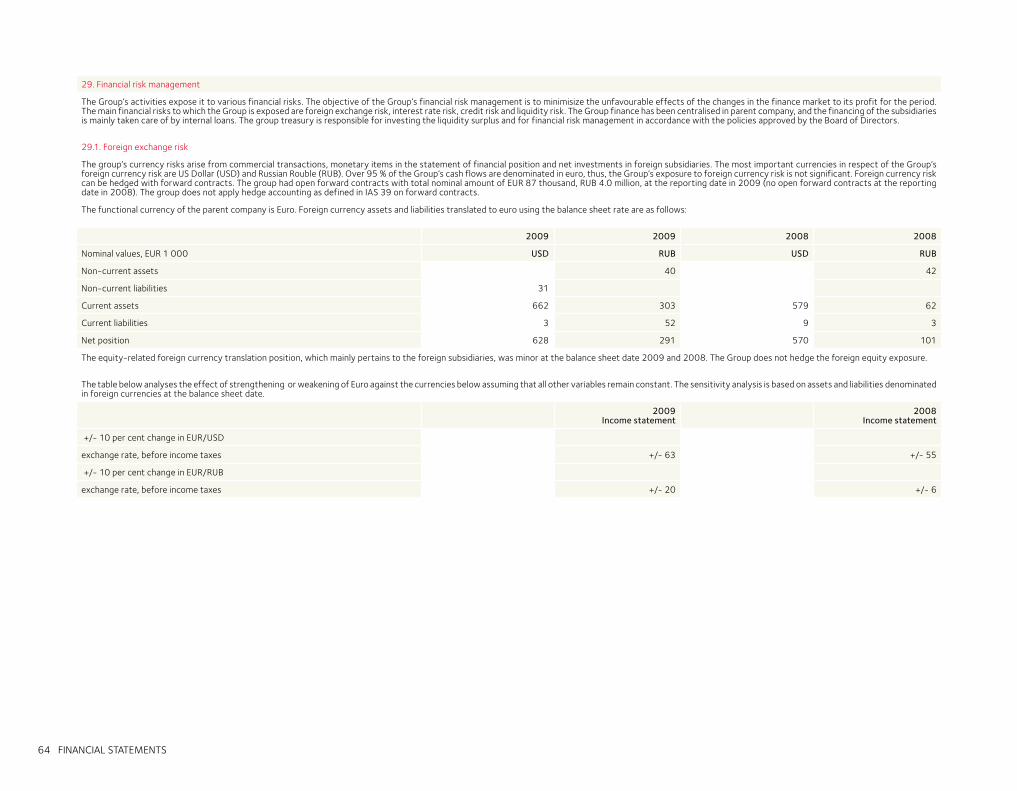
64 FINANCIAL STATEMENTS
29. Financial risk management
The Group’s activities expose it to various financial risks. The objective of the Group’s financial risk management is to minimisize the unfavourable effects of the changes in the finance market to its profit for the period. The main financial risks to which the Group is exposed are foreign exchange risk, interest rate risk, credit risk and liquidity risk. The Group finance has been centralised in parent company, and the financing of the subsidiaries is mainly taken care of by internal loans. The group treasury is responsible for investing the liquidity surplus and for financial risk management in accordance with the policies approved by the Board of Directors.
29.1. Foreign exchange risk
The group’s currency risks arise from commercial transactions, monetary items in the statement of financial position and net investments in foreign subsidiaries. The most important currencies in respect of the Group’s foreign currency risk are US Dollar (USD) and Russian Rouble (RUB). Over 95 % of the Group’s cash flows are denominated in euro, thus, the Group’s exposure to foreign currency risk is not significant. Foreign currency risk can be hedged with forward contracts. The group had open forward contracts with total nominal amount of EUR 87 thousand, RUB 4.0 million, at the reporting date in 2009 (no open forward contracts at the reporting date in 2008). The group does not apply hedge accounting as defined in IAS 39 on forward contracts.
The functional currency of the parent company is Euro. Foreign currency assets and liabilities translated to euro using the balance sheet rate are as follows:
2009 2009 2008 2008
Nominal values, EUR 1 000 USD RUB USD RUB
Non-current assets 40 42
Non-current liabilities 31
Current assets 662 303 579 62
Current liabilities 3 52 9 3
Net position 628 291 570 101
The equity-related foreign currency translation position, which mainly pertains to the foreign subsidiaries, was minor at the balance sheet date 2009 and 2008. The Group does not hedge the foreign equity exposure.
The table below analyses the effect of strengthening or weakening of Euro against the currencies below assuming that all other variables remain constant. The sensitivity analysis is based on assets and liabilities denominated in foreign currencies at the balance sheet date.
2009Income statement
2008Income statement
+/- 10 per cent change in EUR/USD
exchange rate, before income taxes +/- 63 +/- 55
+/- 10 per cent change in EUR/RUB
exchange rate, before income taxes +/- 20 +/- 6
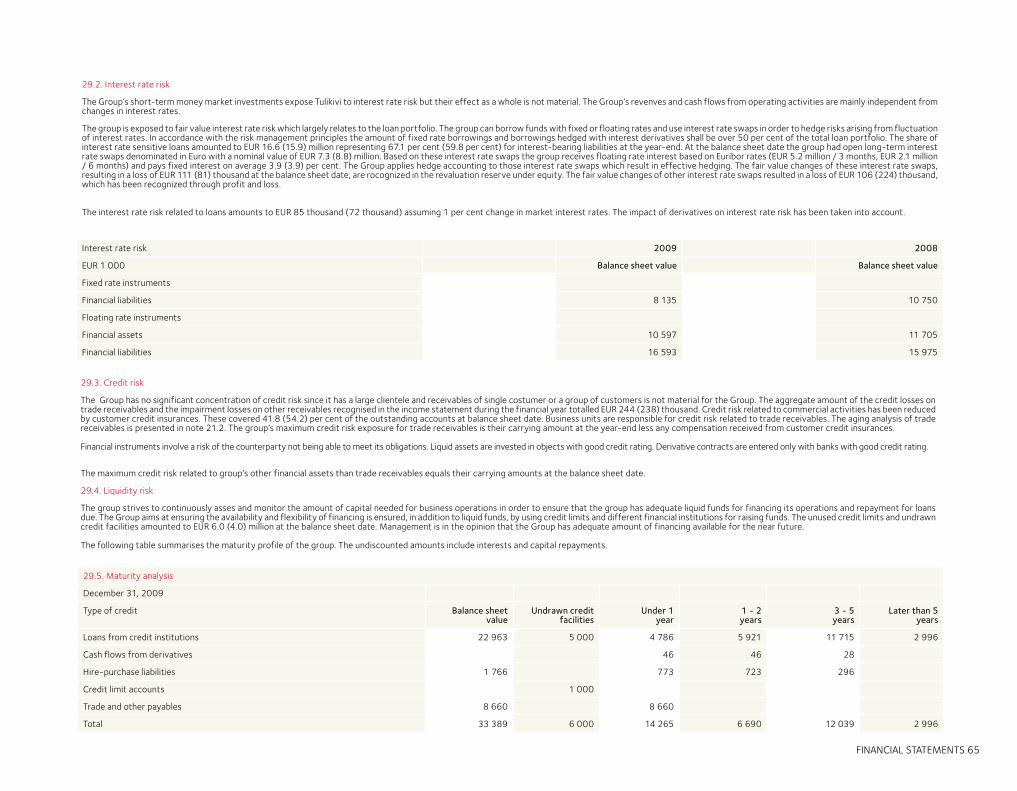
FINANCIAL STATEMENTS 65
29.2. Interest rate risk
The Group’s short-term money market investments expose Tulikivi to interest rate risk but their effect as a whole is not material. The Group’s revenves and cash flows from operating activities are mainly independent from changes in interest rates.
The group is exposed to fair value interest rate risk which largely relates to the loan portfolio. The group can borrow funds with fixed or floating rates and use interest rate swaps in order to hedge risks arising from fluctuation of interest rates. In accordance with the risk management principles the amount of fixed rate borrowings and borrowings hedged with interest derivatives shall be over 50 per cent of the total loan portfolio. The share of interest rate sensitive loans amounted to EUR 16.6 (15.9) million representing 67.1 per cent (59.8 per cent) for interest-bearing liabilities at the year-end. At the balance sheet date the group had open long-term interest rate swaps denominated in Euro with a nominal value of EUR 7.3 (8.8) million. Based on these interest rate swaps the group receives floating rate interest based on Euribor rates (EUR 5.2 million / 3 months, EUR 2.1 million / 6 months) and pays fixed interest on average 3.9 (3.9) per cent. The Group applies hedge accounting to those interest rate swaps which result in effective hedging. The fair value changes of these interest rate swaps, resulting in a loss of EUR 111 (81) thousand at the balance sheet date, are rocognized in the revaluation reserve under equity. The fair value changes of other interest rate swaps resulted in a loss of EUR 106 (224) thousand, which has been recognized through profit and loss.
The interest rate risk related to loans amounts to EUR 85 thousand (72 thousand) assuming 1 per cent change in market interest rates. The impact of derivatives on interest rate risk has been taken into account.
Interest rate risk 2009 2008
EUR 1 000 Balance sheet value Balance sheet value
Fixed rate instruments
Financial liabilities 8 135 10 750
Floating rate instruments
Financial assets 10 597 11 705
Financial liabilities 16 593 15 975
29.3. Credit risk
The Group has no significant concentration of credit risk since it has a large clientele and receivables of single costumer or a group of customers is not material for the Group. The aggregate amount of the credit losses on trade receivables and the impairment losses on other receivables recognised in the income statement during the financial year totalled EUR 244 (238) thousand. Credit risk related to commercial activities has been reduced by customer credit insurances. These covered 41.8 (54.2) per cent of the outstanding accounts at balance sheet date. Business units are responsible for credit risk related to trade receivables. The aging analysis of trade receivables is presented in note 21.2. The group’s maximum credit risk exposure for trade receivables is their carrying amount at the year-end less any compensation received from customer credit insurances.
Financial instruments involve a risk of the counterparty not being able to meet its obligations. Liquid assets are invested in objects with good credit rating. Derivative contracts are entered only with banks with good credit rating.
The maximum credit risk related to group’s other financial assets than trade receivables equals their carrying amounts at the balance sheet date.
29.4. Liquidity risk
The group strives to continuously asses and monitor the amount of capital needed for business operations in order to ensure that the group has adequate liquid funds for financing its operations and repayment for loans due. The Group aims at ensuring the availability and flexibility of financing is ensured, in addition to liquid funds, by using credit limits and different financial institutions for raising funds. The unused credit limits and undrawn credit facilities amounted to EUR 6.0 (4.0) million at the balance sheet date. Management is in the opinion that the Group has adequate amount of financing available for the near future.
The following table summarises the maturity profile of the group. The undiscounted amounts include interests and capital repayments.
29.5. Maturity analysis
December 31, 2009
Type of credit Balance sheet value
Undrawn credit facilities
Under 1year
1 - 2years
3 - 5years
Later than 5years
Loans from credit institutions 22 963 5 000 4 786 5 921 11 715 2 996
Cash flows from derivatives 46 46 28
Hire-purchase liabilities 1 766 773 723 296
Credit limit accounts 1 000
Trade and other payables 8 660 8 660
Total 33 389 6 000 14 265 6 690 12 039 2 996
66 FINANCIAL STATEMENTS
December 31, 2008
Type of credit Balance sheet value
Undrawn credit facilities
Under 1year
1 - 2years
3 - 5 years
Later than 5years
Loans from credit institutions 24 480 5 659 6 324 11 549 4 028
Cash flows from derivatives 17 20 28
Hire-purchase liabilities 2 246 581 829 1 052
Credit limit accounts 4 000
Trade and other payables 9 210 9 210
Total 35 936 4 000 15 467 7 173 12 629 4 028
Derivatives, nominal valueInterest rate swaps 2009 2008
Arrive at maturity 2009 5 735
Arrive at maturity 2010 1 498 1 498
Arrive at maturity 2011 4 615 4 615
Arrive at maturity 2012 471 471
Arrive at maturity 2013 471 471
Arrive at maturity 2014 236 236
Total Interest rate swaps 7 291 13 026
The fair values of interest rate swaps are determined using a method based on the present value of future cash flows, supported by market interest rates at the balance sheet date and other market information.
FINANCIAL STATEMENTS 67
29.6. Capital management
The objective of the Group’s capital management is through an optimal capital structure to support the business operations by ensuring the normal operating conditions and increase shareholder value by striving at the best possible return. An optimal capital structure also guarantees lower cost of capital. The capital structure is effected i.a. through dividend distribution and share issues. The Group may change and adjust the dividends distributed and capital repaid to the shareholders or the number of new shares issued or decide on sales of assets in order to repay liabilities.
The group monitors capital on the basis of the equity ratio, for which 40 per cent is set as the lowest limit for dividend distribution.
The group calculates equity ratio using the following formula:
100*Equity / (Balance sheet total - Advances received)
2009 2008
Equity 23 785 27 242
Balance sheet total 60 360 66 095
Advances received 33 21
Solvency ratio, % 39.4 41.2
30. Currying amounts of financial assets and financial liabilities by categories and their fair values
Balance sheet, 2009
Financial assets or liabilities at fair
value through profit or loss
Loans and other receivables
Available-for-sale financial
assets
Financial liabilities at amortised cost
Carrying amounts of balance sheet
items
Fair value
Long-term assets
Other financial assets 51 51 51
Short-term assets
Trade and other receivables 4 217 4 217 4 217
Cash and cash equivalents 10 597 10 597 10 597
Carrying amounts of financial assets by categories 14 814 51 14 865 14 865
Long-term liabilities
Interest bearing liabilities 19 954 19 954 19 903
Derivatives 311*) 311 311
Other long-term liabilities 52 52 52
Short-term liabilities
Interest bearing liabilities 4 775 4 775 4 964
Trade and other payables 2 852 2 852 2 852
Carrying amounts of financial liabilities by categories 311 27 633 27 944 28 082
68 FINANCIAL STATEMENTS
EUR 1 000
Balance sheet, 2008
Financial assets or liabilities at fair
value through profit or loss
Loans and receivables
Available-for- sale financial
assets
Financial liabilities at amortised cost
Carrying amounts of balance sheet
items
Fair value
Long-term assets
Other financial assets 51 51 51
Short-term assets
Trade and other receivables 5 336 5 336 5 336
Cash and cash equivalents 11 705 11 705 11 705
Carrying amounts of financial assets by categories 17 041 51 17 092 17 092
Long-term liabilities
Interest bearing liabilities 21 582 21 582 21 529
Derivatives 177*) 177 177
Short-term liabilities
Interest bearing liabilities 5 144 5 144 5 402
Trade and other payables 2 472 2 472 2 472
Carrying amounts of financial liabilities by categories 177 29 198 29 375 29 580
*) Includes cash flow hedging instruments recognized in the revaluation reserve, amounting to EUR 82 (60) thousand.
31. Adjustments of cash generated from operations 2009 2008
Non-cash transactions:
Depreciations and amortizations 5 306 5 432
Impairment 229 250
Exchange differences -37 59
Other 20 6
Non-cash transactions, total 5 518 5 747
32. Leases
Operating leases
32.1. Group as lessee
Future aggregate minimum lease payments under non-cancellable operating leases:
Not later than 1 year 979 1 004
Later than 1 year and not later than 5 years 116 163
The Group has leased several production and office facilities. The agreements are mainly made for the time being.
Fixed-term leases include an option to continue the agreement after the initial date of expiration.
The income statement for 2009 includes expensed lease rentals EUR 1 229 (1 129) thousand.
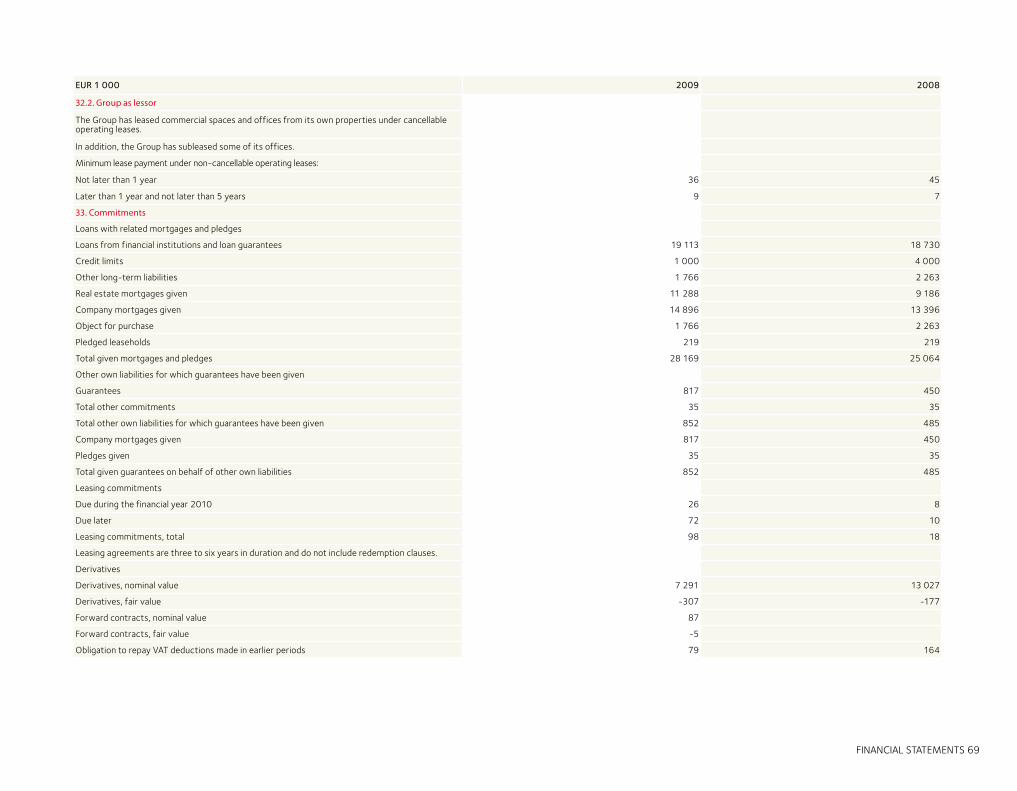
FINANCIAL STATEMENTS 69
EUR 1 000 2009 2008
32.2. Group as lessor
The Group has leased commercial spaces and offices from its own properties under cancellable operating leases.
In addition, the Group has subleased some of its offices.
Minimum lease payment under non-cancellable operating leases:
Not later than 1 year 36 45
Later than 1 year and not later than 5 years 9 7
33. Commitments
Loans with related mortgages and pledges
Loans from financial institutions and loan guarantees 19 113 18 730
Credit limits 1 000 4 000
Other long-term liabilities 1 766 2 263
Real estate mortgages given 11 288 9 186
Company mortgages given 14 896 13 396
Object for purchase 1 766 2 263
Pledged leaseholds 219 219
Total given mortgages and pledges 28 169 25 064
Other own liabilities for which guarantees have been given
Guarantees 817 450
Total other commitments 35 35
Total other own liabilities for which guarantees have been given 852 485
Company mortgages given 817 450
Pledges given 35 35
Total given guarantees on behalf of other own liabilities 852 485
Leasing commitments
Due during the financial year 2010 26 8
Due later 72 10
Leasing commitments, total 98 18
Leasing agreements are three to six years in duration and do not include redemption clauses.
Derivatives
Derivatives, nominal value 7 291 13 027
Derivatives, fair value -307 -177
Forward contracts, nominal value 87
Forward contracts, fair value -5
Obligation to repay VAT deductions made in earlier periods 79 164
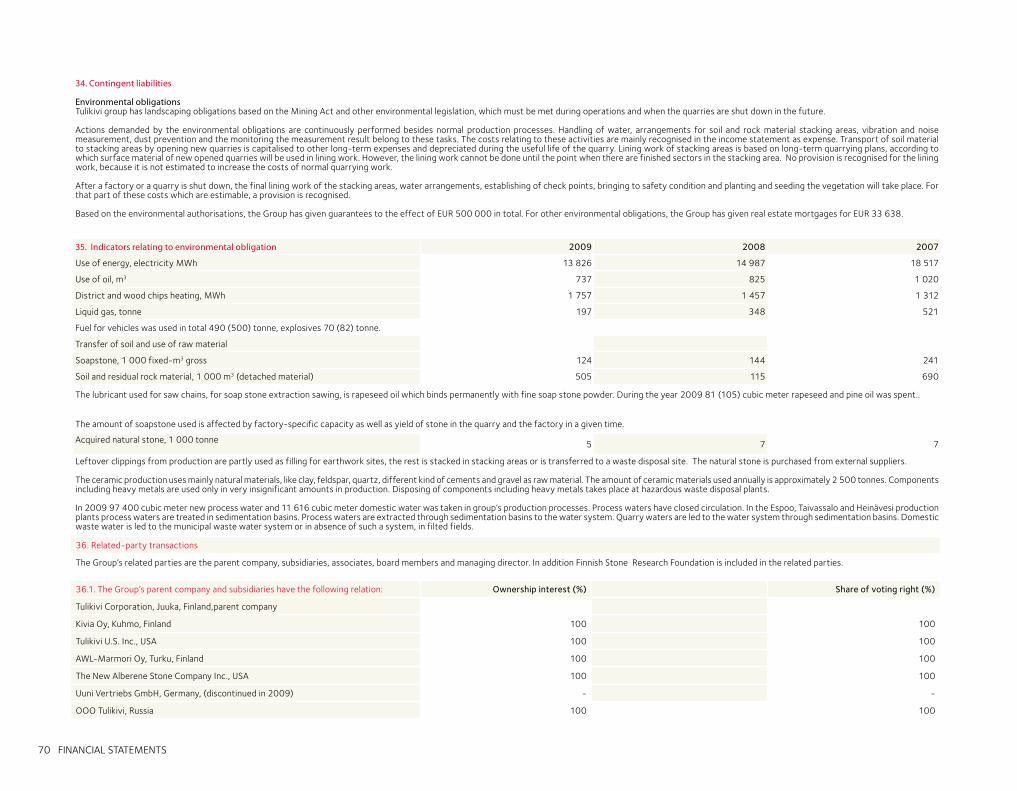
70 FINANCIAL STATEMENTS
35. Indicators relating to environmental obligation 2009 2008 2007
Use of energy, electricity MWh 13 826 14 987 18 517
Use of oil, m3 737 825 1 020
District and wood chips heating, MWh 1 757 1 457 1 312
Liquid gas, tonne 197 348 521
Fuel for vehicles was used in total 490 (500) tonne, explosives 70 (82) tonne.
Transfer of soil and use of raw material
Soapstone, 1 000 fixed-m3 gross 124 144 241
Soil and residual rock material, 1 000 m3 (detached material) 505 115 690
The lubricant used for saw chains, for soap stone extraction sawing, is rapeseed oil which binds permanently with fine soap stone powder. During the year 2009 81 (105) cubic meter rapeseed and pine oil was spent..
The amount of soapstone used is affected by factory-specific capacity as well as yield of stone in the quarry and the factory in a given time.
Acquired natural stone, 1 000 tonne 5 7 7
Leftover clippings from production are partly used as filling for earthwork sites, the rest is stacked in stacking areas or is transferred to a waste disposal site. The natural stone is purchased from external suppliers. The ceramic production uses mainly natural materials, like clay, feldspar, quartz, different kind of cements and gravel as raw material. The amount of ceramic materials used annually is approximately 2 500 tonnes. Components including heavy metals are used only in very insignificant amounts in production. Disposing of components including heavy metals takes place at hazardous waste disposal plants. In 2009 97 400 cubic meter new process water and 11 616 cubic meter domestic water was taken in group’s production processes. Process waters have closed circulation. In the Espoo, Taivassalo and Heinävesi production plants process waters are treated in sedimentation basins. Process waters are extracted through sedimentation basins to the water system. Quarry waters are led to the water system through sedimentation basins. Domestic waste water is led to the municipal waste water system or in absence of such a system, in filted fields.
34. Contingent liabilities
Environmental obligations Tulikivi group has landscaping obligations based on the Mining Act and other environmental legislation, which must be met during operations and when the quarries are shut down in the future.
Actions demanded by the environmental obligations are continuously performed besides normal production processes. Handling of water, arrangements for soil and rock material stacking areas, vibration and noise measurement, dust prevention and the monitoring the measurement result belong to these tasks. The costs relating to these activities are mainly recognised in the income statement as expense. Transport of soil material to stacking areas by opening new quarries is capitalised to other long-term expenses and depreciated during the useful life of the quarry. Lining work of stacking areas is based on long-term quarrying plans, according to which surface material of new opened quarries will be used in lining work. However, the lining work cannot be done until the point when there are finished sectors in the stacking area. No provision is recognised for the lining work, because it is not estimated to increase the costs of normal quarrying work.
After a factory or a quarry is shut down, the final lining work of the stacking areas, water arrangements, establishing of check points, bringing to safety condition and planting and seeding the vegetation will take place. For that part of these costs which are estimable, a provision is recognised.
Based on the environmental authorisations, the Group has given guarantees to the effect of EUR 500 000 in total. For other environmental obligations, the Group has given real estate mortgages for EUR 33 638.
36. Related-party transactions
The Group’s related parties are the parent company, subsidiaries, associates, board members and managing director. In addition Finnish Stone Research Foundation is included in the related parties.
36.1. The Group’s parent company and subsidiaries have the following relation: Ownership interest (%) Share of voting right (%)
Tulikivi Corporation, Juuka, Finland,parent company
Kivia Oy, Kuhmo, Finland 100 100
Tulikivi U.S. Inc., USA 100 100
AWL-Marmori Oy, Turku, Finland 100 100
The New Alberene Stone Company Inc., USA 100 100
Uuni Vertriebs GmbH, Germany, (discontinued in 2009) - -
OOO Tulikivi, Russia 100 100
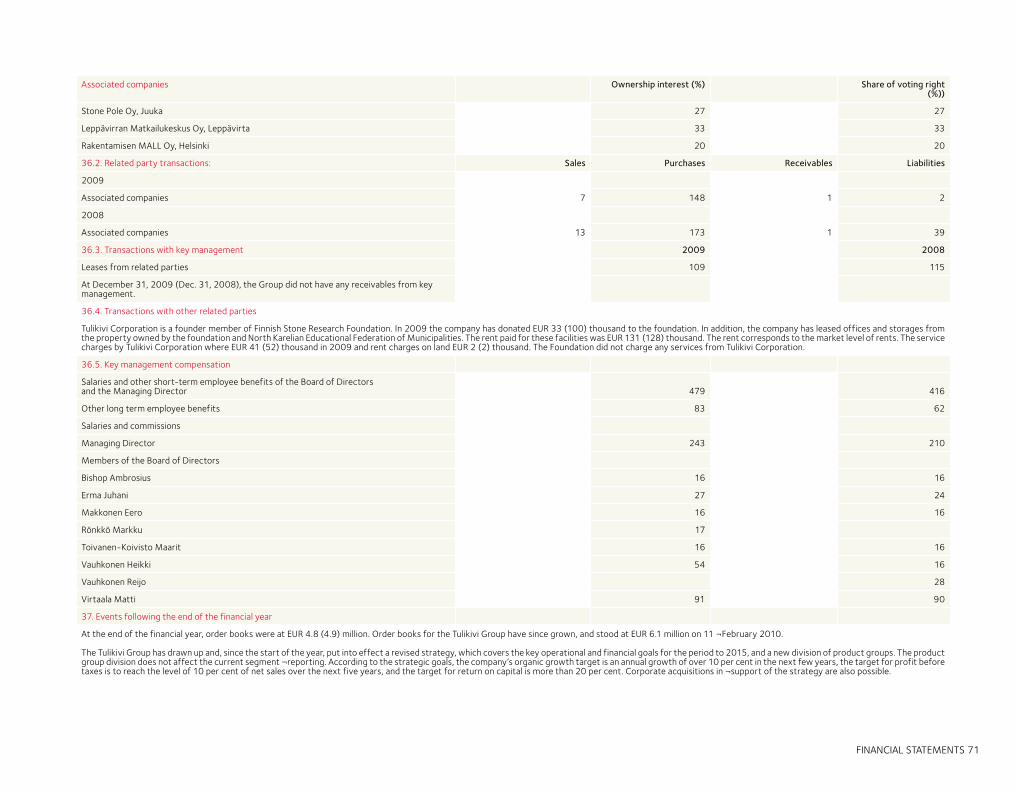
FINANCIAL STATEMENTS 71
Associated companies Ownership interest (%) Share of voting right (%))
Stone Pole Oy, Juuka 27 27
Leppävirran Matkailukeskus Oy, Leppävirta 33 33
Rakentamisen MALL Oy, Helsinki 20 20
36.2. Related party transactions: Sales Purchases Receivables Liabilities
2009
Associated companies 7 148 1 2
2008
Associated companies 13 173 1 39
36.3. Transactions with key management 2009 2008
Leases from related parties 109 115
At December 31, 2009 (Dec. 31, 2008), the Group did not have any receivables from key management.
36.4. Transactions with other related parties
Tulikivi Corporation is a founder member of Finnish Stone Research Foundation. In 2009 the company has donated EUR 33 (100) thousand to the foundation. In addition, the company has leased offices and storages from the property owned by the foundation and North Karelian Educational Federation of Municipalities. The rent paid for these facilities was EUR 131 (128) thousand. The rent corresponds to the market level of rents. The service charges by Tulikivi Corporation where EUR 41 (52) thousand in 2009 and rent charges on land EUR 2 (2) thousand. The Foundation did not charge any services from Tulikivi Corporation.
36.5. Key management compensation
Salaries and other short-term employee benefits of the Board of Directors and the Managing Director 479 416
Other long term employee benefits 83 62
Salaries and commissions
Managing Director 243 210
Members of the Board of Directors
Bishop Ambrosius 16 16
Erma Juhani 27 24
Makkonen Eero 16 16
Rönkkö Markku 17
Toivanen-Koivisto Maarit 16 16
Vauhkonen Heikki 54 16
Vauhkonen Reijo 28
Virtaala Matti 91 90
37. Events following the end of the financial year
At the end of the financial year, order books were at EUR 4.8 (4.9) million. Order books for the Tulikivi Group have since grown, and stood at EUR 6.1 million on 11 ¬February 2010.
The Tulikivi Group has drawn up and, since the start of the year, put into effect a revised strategy, which covers the key operational and financial goals for the period to 2015, and a new division of product groups. The product group division does not affect the current segment ¬reporting. According to the strategic goals, the company’s organic growth target is an annual growth of over 10 per cent in the next few years, the target for profit before taxes is to reach the level of 10 per cent of net sales over the next five years, and the target for return on capital is more than 20 per cent. Corporate acquisitions in ¬support of the strategy are also possible.
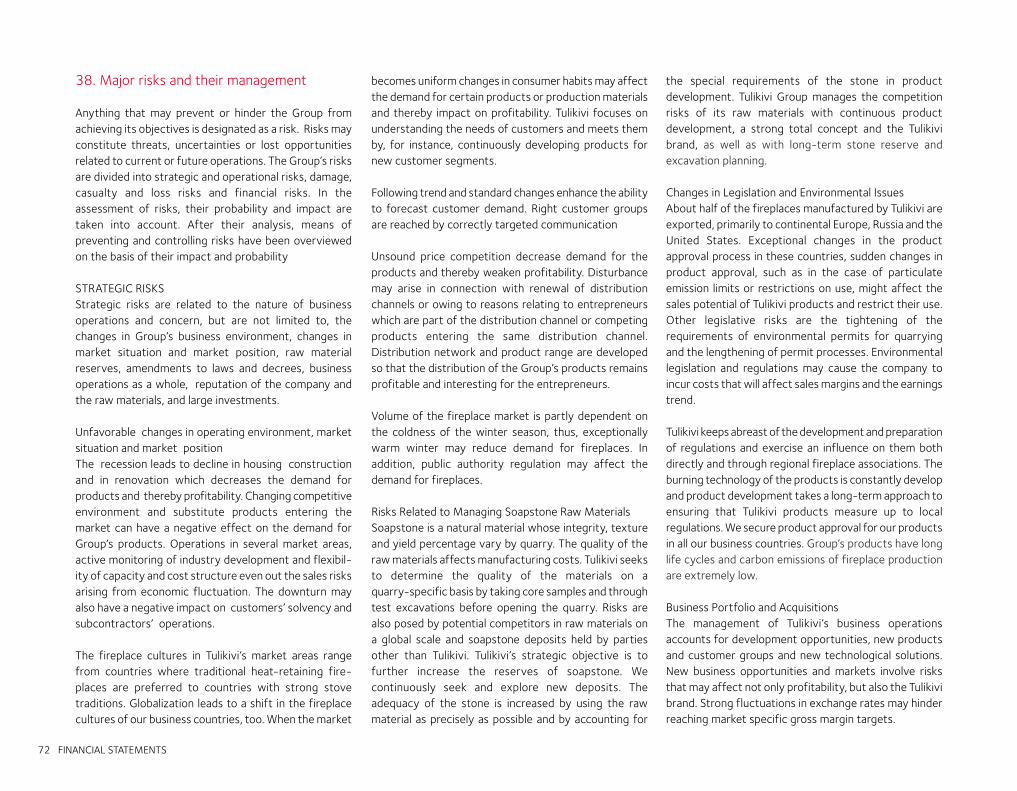
72 FINANCIAL STATEMENTS
38. Major risks and their management Anything that may prevent or hinder the Group from achieving its objectives is designated as a risk. Risks may constitute threats, uncertainties or lost opportunities related to current or future operations. The Group’s risks are divided into strategic and operational risks, damage, casualty and loss risks and financial risks. In the assessment of risks, their probability and impact are taken into account. After their analysis, means of preventing and controlling risks have been overviewed on the basis of their impact and probability
STRATEGIC RISKS Strategic risks are related to the nature of business operations and concern, but are not limited to, the changes in Group’s business environment, changes in market situation and market position, raw material reserves, amendments to laws and decrees, business operations as a whole, reputation of the company and the raw materials, and large investments.
Unfavorable changes in operating environment, market situation and market positionThe recession leads to decline in housing construction and in renovation which decreases the demand for products and thereby profitability. Changing competitive environment and substitute products entering the market can have a negative effect on the demand for Group’s products. Operations in several market areas, active monitoring of industry development and flexibil-ity of capacity and cost structure even out the sales risks arising from economic fluctuation. The downturn may also have a negative impact on customers’ solvency and subcontractors’ operations.
The fireplace cultures in Tulikivi’s market areas range from countries where traditional heat-retaining fire-places are preferred to countries with strong stove traditions. Globalization leads to a shift in the fireplace cultures of our business countries, too. When the market
becomes uniform changes in consumer habits may affect the demand for certain products or production materials and thereby impact on profitability. Tulikivi focuses on understanding the needs of customers and meets them by, for instance, continuously developing products for new customer segments.
Following trend and standard changes enhance the ability to forecast customer demand. Right customer groups are reached by correctly targeted communication
Unsound price competition decrease demand for the products and thereby weaken profitability. Disturbance may arise in connection with renewal of distribution channels or owing to reasons relating to entrepreneurs which are part of the distribution channel or competing products entering the same distribution channel. Distribution network and product range are developed so that the distribution of the Group’s products remains profitable and interesting for the entrepreneurs.
Volume of the fireplace market is partly dependent on the coldness of the winter season, thus, exceptionally warm winter may reduce demand for fireplaces. In addition, public authority regulation may affect the demand for fireplaces.
Risks Related to Managing Soapstone Raw Materials Soapstone is a natural material whose integrity, texture and yield percentage vary by quarry. The quality of the raw materials affects manufacturing costs. Tulikivi seeks to determine the quality of the materials on a quarry-specific basis by taking core samples and through test excavations before opening the quarry. Risks are also posed by potential competitors in raw materials on a global scale and soapstone deposits held by parties other than Tulikivi. Tulikivi’s strategic objective is to further increase the reserves of soapstone. We continuously seek and explore new deposits. The adequacy of the stone is increased by using the raw material as precisely as possible and by accounting for
the special requirements of the stone in product development. Tulikivi Group manages the competition risks of its raw materials with continuous product development, a strong total concept and the Tulikivi brand, as well as with long-term stone reserve and excavation planning.
Changes in Legislation and Environmental Issues About half of the fireplaces manufactured by Tulikivi are exported, primarily to continental Europe, Russia and the United States. Exceptional changes in the product approval process in these countries, sudden changes in product approval, such as in the case of particulate emission limits or restrictions on use, might affect the sales potential of Tulikivi products and restrict their use. Other legislative risks are the tightening of the requirements of environmental permits for quarrying and the lengthening of permit processes. Environmental legislation and regulations may cause the company to incur costs that will affect sales margins and the earnings trend.
Tulikivi keeps abreast of the development and preparation of regulations and exercise an influence on them both directly and through regional fireplace associations. The burning technology of the products is constantly develop and product development takes a long-term approach to ensuring that Tulikivi products measure up to local regulations. We secure product approval for our products in all our business countries. Group’s products have long life cycles and carbon emissions of fireplace production are extremely low.
Business Portfolio and AcquisitionsThe management of Tulikivi’s business operations accounts for development opportunities, new products and customer groups and new technological solutions. New business opportunities and markets involve risks that may affect not only profitability, but also the Tulikivi brand. Strong fluctuations in exchange rates may hinder reaching market specific gross margin targets.
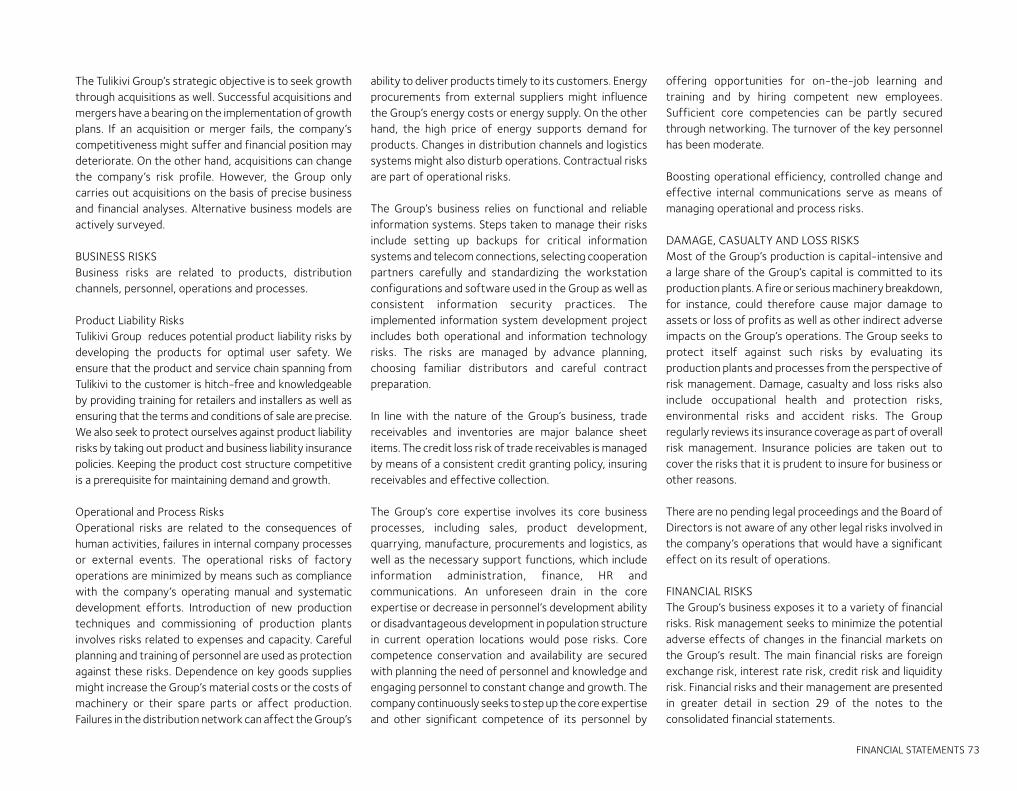
FINANCIAL STATEMENTS 73
The Tulikivi Group’s strategic objective is to seek growth through acquisitions as well. Successful acquisitions and mergers have a bearing on the implementation of growth plans. If an acquisition or merger fails, the company’s competitiveness might suffer and financial position may deteriorate. On the other hand, acquisitions can change the company’s risk profile. However, the Group only carries out acquisitions on the basis of precise business and financial analyses. Alternative business models are actively surveyed.
BUSINESS RISKS Business risks are related to products, distribution channels, personnel, operations and processes.
Product Liability Risks Tulikivi Group reduces potential product liability risks by developing the products for optimal user safety. We ensure that the product and service chain spanning from Tulikivi to the customer is hitch-free and knowledgeable by providing training for retailers and installers as well as ensuring that the terms and conditions of sale are precise. We also seek to protect ourselves against product liability risks by taking out product and business liability insurance policies. Keeping the product cost structure competitive is a prerequisite for maintaining demand and growth.
Operational and Process Risks Operational risks are related to the consequences of human activities, failures in internal company processes or external events. The operational risks of factory operations are minimized by means such as compliance with the company’s operating manual and systematic development efforts. Introduction of new production techniques and commissioning of production plants involves risks related to expenses and capacity. Careful planning and training of personnel are used as protection against these risks. Dependence on key goods supplies might increase the Group’s material costs or the costs of machinery or their spare parts or affect production. Failures in the distribution network can affect the Group’s
ability to deliver products timely to its customers. Energy procurements from external suppliers might influence the Group’s energy costs or energy supply. On the other hand, the high price of energy supports demand for products. Changes in distribution channels and logistics systems might also disturb operations. Contractual risks are part of operational risks.
The Group’s business relies on functional and reliable information systems. Steps taken to manage their risks include setting up backups for critical information systems and telecom connections, selecting cooperation partners carefully and standardizing the workstation configurations and software used in the Group as well as consistent information security practices. The implemented information system development project includes both operational and information technology risks. The risks are managed by advance planning, choosing familiar distributors and careful contract preparation.
In line with the nature of the Group’s business, trade receivables and inventories are major balance sheet items. The credit loss risk of trade receivables is managed by means of a consistent credit granting policy, insuring receivables and effective collection. The Group’s core expertise involves its core business processes, including sales, product development, quar rying, manufacture, procurements and logistics, as well as the necessary support functions, which include infor mation administration, finance, HR and communications. An unforeseen drain in the core expertise or decrease in personnel’s development ability or disadvantageous development in population structure in current operation locations would pose risks. Core competence conservation and availability are secured with planning the need of personnel and knowledge and engaging personnel to constant change and growth. The company continuously seeks to step up the core expertise and other significant competence of its personnel by
offering opportunities for on-the-job learning and training and by hiring competent new employees. Sufficient core competencies can be partly secured through networking. The turnover of the key personnel has been moderate.
Boosting operational efficiency, controlled change and effective internal communications serve as means of managing operational and process risks.
DAMAGE, CASUALTY AND LOSS RISKSMost of the Group’s production is capital-intensive and a large share of the Group’s capital is committed to its production plants. A fire or serious machinery break down, for instance, could therefore cause major damage to assets or loss of profits as well as other indirect adverse impacts on the Group’s operations. The Group seeks to protect itself against such risks by evaluating its production plants and processes from the perspective of risk management. Damage, casualty and loss risks also include occupational health and protection risks, environmental risks and accident risks. The Group regularly reviews its insurance coverage as part of overall risk management. Insurance policies are taken out to cover the risks that it is prudent to insure for business or other reasons.
There are no pending legal proceedings and the Board of Directors is not aware of any other legal risks involved in the company’s operations that would have a significant effect on its result of operations.
FINANCIAL RISKS The Group’s business exposes it to a variety of financial risks. Risk management seeks to minimize the potential adverse effects of changes in the financial markets on the Group’s result. The main financial risks are foreign exchange risk, interest rate risk, credit risk and liquidity risk. Financial risks and their management are presented in greater detail in section 29 of the notes to the consolidated financial statements.
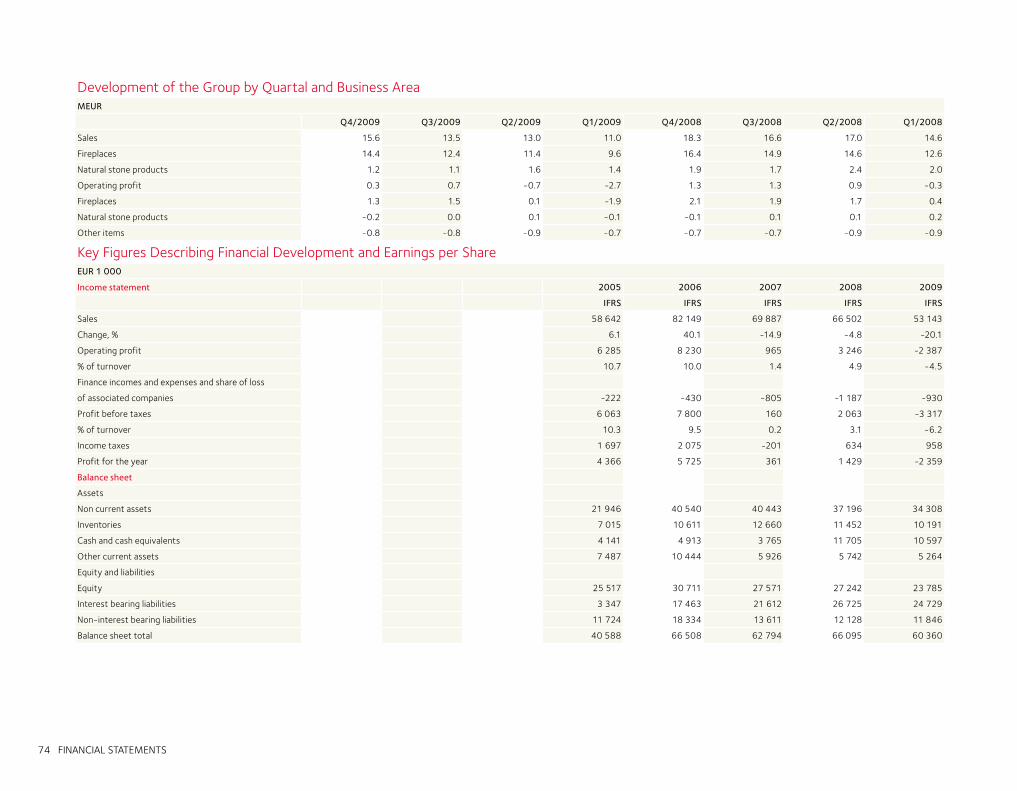
74 FINANCIAL STATEMENTS
*)
Development of the Group by Quartal and Business AreaMEUR
Q4/2009 Q3/2009 Q2/2009 Q1/2009 Q4/2008 Q3/2008 Q2/2008 Q1/2008
Sales 15.6 13.5 13.0 11.0 18.3 16.6 17.0 14.6
Fireplaces 14.4 12.4 11.4 9.6 16.4 14.9 14.6 12.6
Natural stone products 1.2 1.1 1.6 1.4 1.9 1.7 2.4 2.0
Operating profit 0.3 0.7 -0.7 -2.7 1.3 1.3 0.9 -0.3
Fireplaces 1.3 1.5 0.1 -1.9 2.1 1.9 1.7 0.4
Natural stone products -0.2 0.0 0.1 -0.1 -0.1 0.1 0.1 0.2
Other items -0.8 -0.8 -0.9 -0.7 -0.7 -0.7 -0.9 -0.9
Key Figures Describing Financial Development and Earnings per Share EUR 1 000
Income statement 2005 2006 2007 2008 2009
IFRS IFRS IFRS IFRS IFRS
Sales 58 642 82 149 69 887 66 502 53 143
Change, % 6.1 40.1 -14.9 -4.8 -20.1
Operating profit 6 285 8 230 965 3 246 -2 387
% of turnover 10.7 10.0 1.4 4.9 -4.5
Finance incomes and expenses and share of loss
of associated companies -222 -430 -805 -1 187 -930
Profit before taxes 6 063 7 800 160 2 063 -3 317
% of turnover 10.3 9.5 0.2 3.1 -6.2
Income taxes 1 697 2 075 -201 634 958
Profit for the year 4 366 5 725 361 1 429 -2 359
Balance sheet
Assets
Non current assets 21 946 40 540 40 443 37 196 34 308
Inventories 7 015 10 611 12 660 11 452 10 191
Cash and cash equivalents 4 141 4 913 3 765 11 705 10 597
Other current assets 7 487 10 444 5 926 5 742 5 264
Equity and liabilities
Equity 25 517 30 711 27 571 27 242 23 785
Interest bearing liabilities 3 347 17 463 21 612 26 725 24 729
Non-interest bearing liabilities 11 724 18 334 13 611 12 128 11 846
Balance sheet total 40 588 66 508 62 794 66 095 60 360
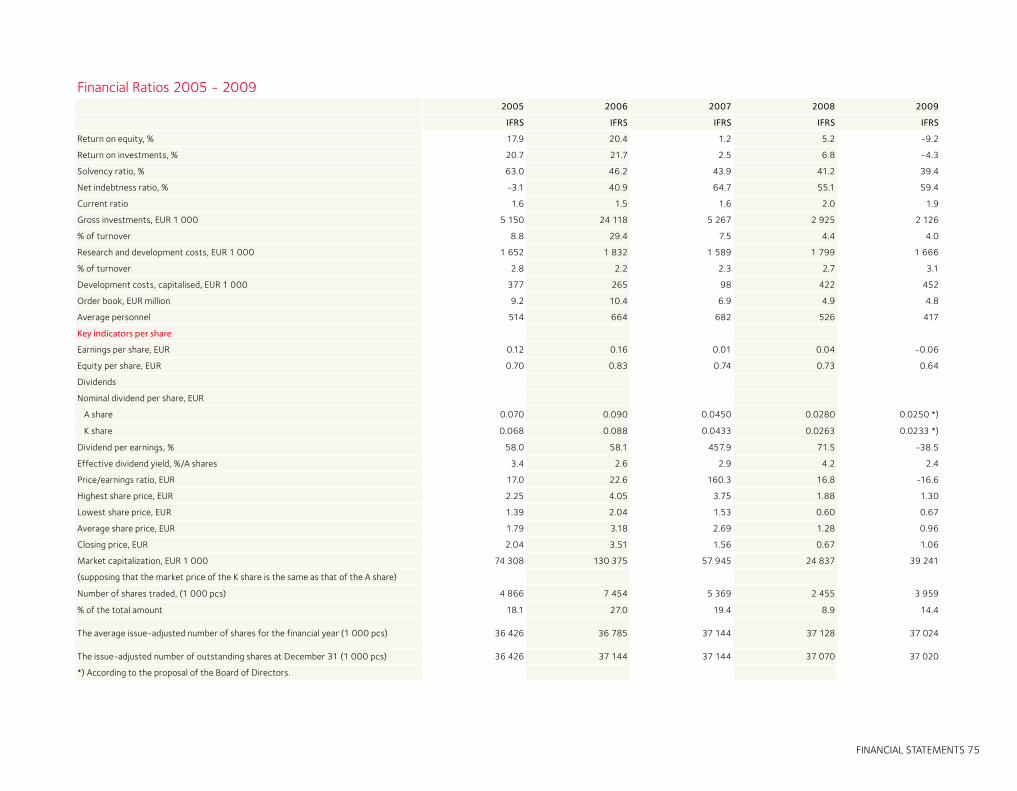
FINANCIAL STATEMENTS 75
Financial Ratios 2005 - 20092005 2006 2007 2008 2009
IFRS IFRS IFRS IFRS IFRS
Return on equity, % 17.9 20.4 1.2 5.2 -9.2
Return on investments, % 20.7 21.7 2.5 6.8 -4.3
Solvency ratio, % 63.0 46.2 43.9 41.2 39.4
Net indebtness ratio, % -3.1 40.9 64.7 55.1 59.4
Current ratio 1.6 1.5 1.6 2.0 1.9
Gross investments, EUR 1 000 5 150 24 118 5 267 2 925 2 126
% of turnover 8.8 29.4 7.5 4.4 4.0
Research and development costs, EUR 1 000 1 652 1 832 1 589 1 799 1 666
% of turnover 2.8 2.2 2.3 2.7 3.1
Development costs, capitalised, EUR 1 000 377 265 98 422 452
Order book, EUR million 9.2 10.4 6.9 4.9 4.8
Average personnel 514 664 682 526 417
Key indicators per share
Earnings per share, EUR 0.12 0.16 0.01 0.04 -0.06
Equity per share, EUR 0.70 0.83 0.74 0.73 0.64
Dividends
Nominal dividend per share, EUR
A share 0.070 0.090 0.0450 0.0280 0.0250 *)
K share 0.068 0.088 0.0433 0.0263 0.0233 *)
Dividend per earnings, % 58.0 58.1 457.9 71.5 -38.5
Effective dividend yield, %/A shares 3.4 2.6 2.9 4.2 2.4
Price/earnings ratio, EUR 17.0 22.6 160.3 16.8 -16.6
Highest share price, EUR 2.25 4.05 3.75 1.88 1.30
Lowest share price, EUR 1.39 2.04 1.53 0.60 0.67
Average share price, EUR 1.79 3.18 2.69 1.28 0.96
Closing price, EUR 2.04 3.51 1.56 0.67 1.06
Market capitalization, EUR 1 000 74 308 130 375 57 945 24 837 39 241
(supposing that the market price of the K share is the same as that of the A share)
Number of shares traded, (1 000 pcs) 4 866 7 454 5 369 2 455 3 959
% of the total amount 18.1 27.0 19.4 8.9 14.4
The average issue-adjusted number of shares for the financial year (1 000 pcs) 36 426 36 785 37 144 37 128 37 024
The issue-adjusted number of outstanding shares at December 31 (1 000 pcs) 36 426 37 144 37 144 37 070 37 020
*) According to the proposal of the Board of Directors.
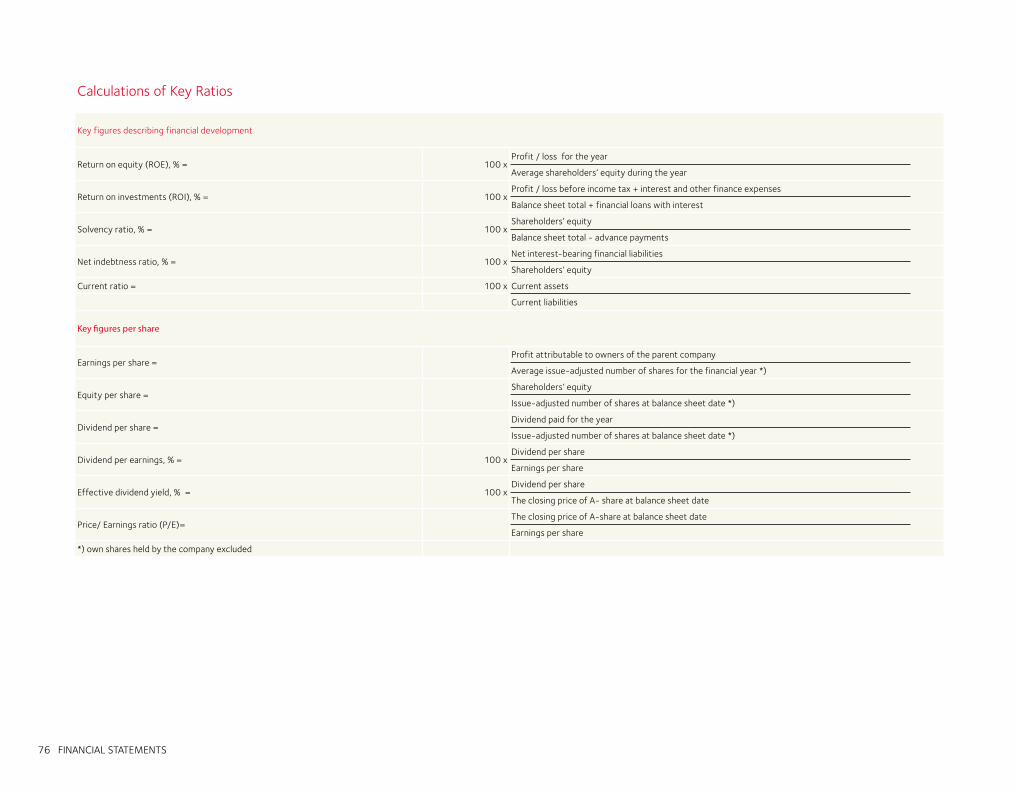
76 FINANCIAL STATEMENTS
Calculations of Key Ratios
Key figures describing financial development
Return on equity (ROE), % = 100 xProfit / loss for the year
Average shareholders’ equity during the year
Return on investments (ROI), % = 100 xProfit / loss before income tax + interest and other finance expenses
Balance sheet total + financial loans with interest
Solvency ratio, % = 100 xShareholders’ equity
Balance sheet total - advance payments
Net indebtness ratio, % = 100 xNet interest-bearing financial liabilities
Shareholders’ equity
Current ratio = 100 x Current assets
Current liabilities
Key figures per share
Earnings per share =Profit attributable to owners of the parent company
Average issue-adjusted number of shares for the financial year *)
Equity per share =Shareholders’ equity
Issue-adjusted number of shares at balance sheet date *)
Dividend per share =Dividend paid for the year
Issue-adjusted number of shares at balance sheet date *)
Dividend per earnings, % = 100 xDividend per share
Earnings per share
Effective dividend yield, % = 100 xDividend per share
The closing price of A- share at balance sheet date
Price/ Earnings ratio (P/E)=The closing price of A-share at balance sheet date
Earnings per share
*) own shares held by the company excluded
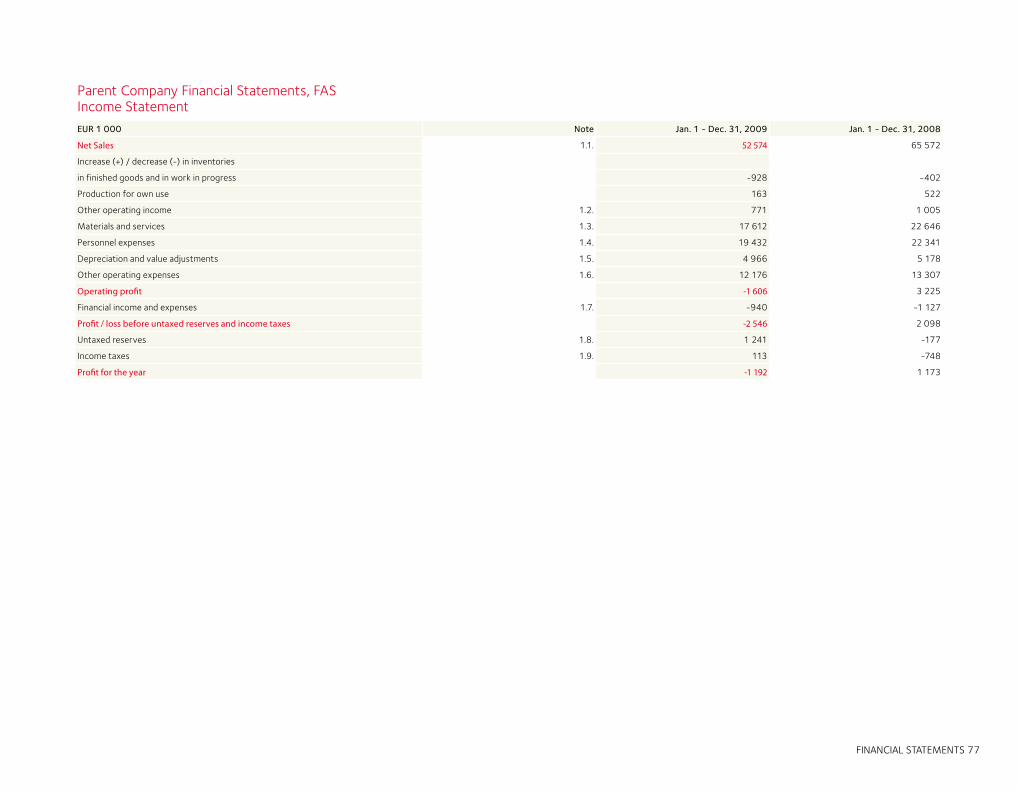
FINANCIAL STATEMENTS 77
Parent Company Financial Statements, FASIncome StatementEUR 1 000 Note Jan. 1 - Dec. 31, 2009 Jan. 1 - Dec. 31, 2008
Net Sales 1.1. 52 574 65 572
Increase (+) / decrease (-) in inventories
in finished goods and in work in progress -928 -402
Production for own use 163 522
Other operating income 1.2. 771 1 005
Materials and services 1.3. 17 612 22 646
Personnel expenses 1.4. 19 432 22 341
Depreciation and value adjustments 1.5. 4 966 5 178
Other operating expenses 1.6. 12 176 13 307
Operating profit -1 606 3 225
Financial income and expenses 1.7. -940 -1 127
Profit / loss before untaxed reserves and income taxes -2 546 2 098
Untaxed reserves 1.8. 1 241 -177
Income taxes 1.9. 113 -748
Profit for the year -1 192 1 173
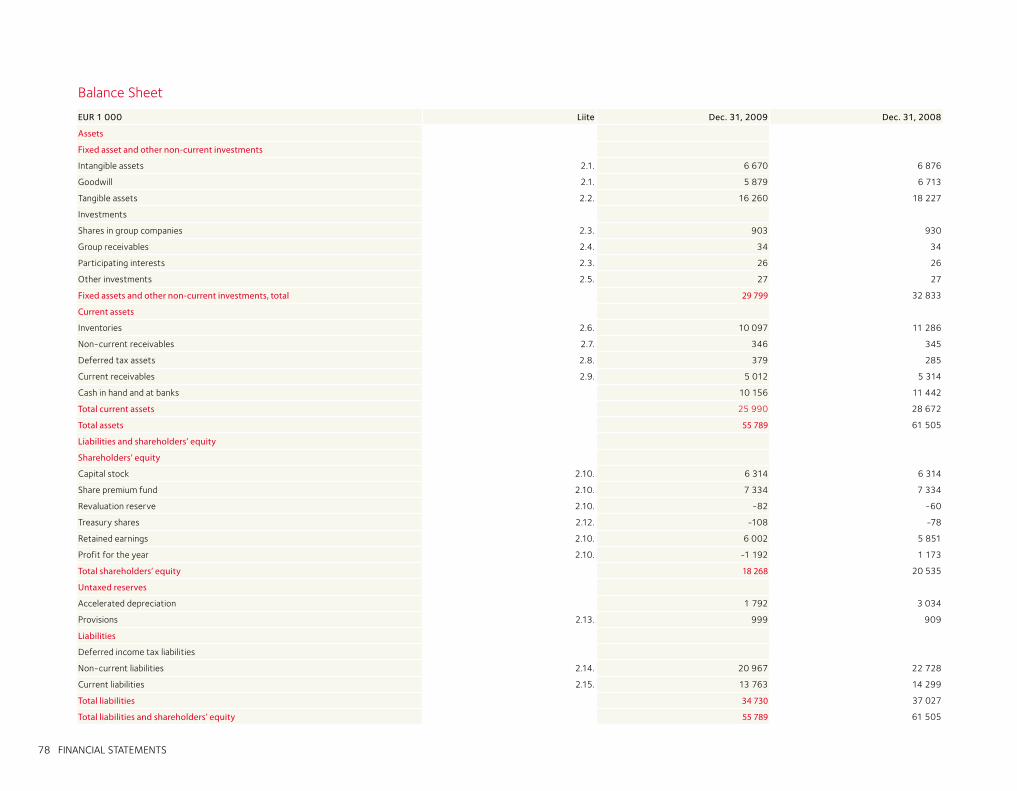
78 FINANCIAL STATEMENTS
Balance Sheet
EUR 1 000 Liite Dec. 31, 2009 Dec. 31, 2008
Assets
Fixed asset and other non-current investments
Intangible assets 2.1. 6 670 6 876
Goodwill 2.1. 5 879 6 713
Tangible assets 2.2. 16 260 18 227
Investments
Shares in group companies 2.3. 903 930
Group receivables 2.4. 34 34
Participating interests 2.3. 26 26
Other investments 2.5. 27 27
Fixed assets and other non-current investments, total 29 799 32 833
Current assets
Inventories 2.6. 10 097 11 286
Non-current receivables 2.7. 346 345
Deferred tax assets 2.8. 379 285
Current receivables 2.9. 5 012 5 314
Cash in hand and at banks 10 156 11 442
Total current assets 25 990 28 672
Total assets 55 789 61 505
Liabilities and shareholders’ equity
Shareholders’ equity
Capital stock 2.10. 6 314 6 314
Share premium fund 2.10. 7 334 7 334
Revaluation reserve 2.10. -82 -60
Treasury shares 2.12. -108 -78
Retained earnings 2.10. 6 002 5 851
Profit for the year 2.10. -1 192 1 173
Total shareholders’ equity 18 268 20 535
Untaxed reserves
Accelerated depreciation 1 792 3 034
Provisions 2.13. 999 909
Liabilities
Deferred income tax liabilities
Non-current liabilities 2.14. 20 967 22 728
Current liabilities 2.15. 13 763 14 299
Total liabilities 34 730 37 027
Total liabilities and shareholders’ equity 55 789 61 505
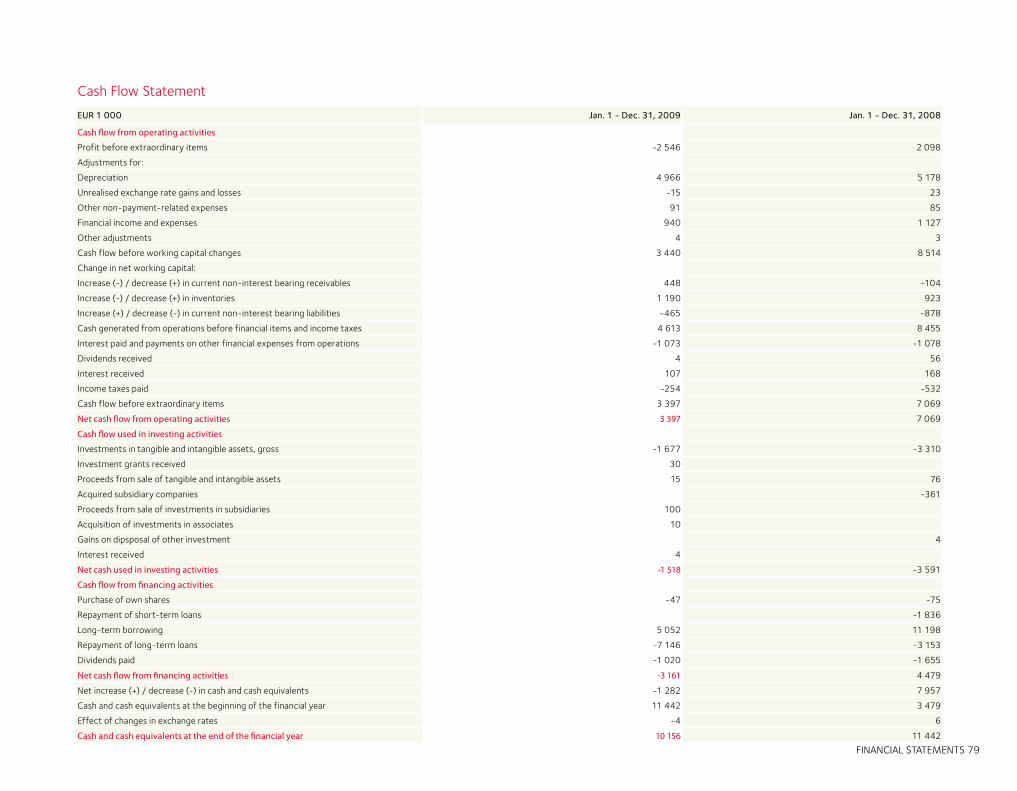
FINANCIAL STATEMENTS 79
Cash Flow Statement
EUR 1 000 Jan. 1 - Dec. 31, 2009 Jan. 1 - Dec. 31, 2008
Cash flow from operating activities
Profit before extraordinary items -2 546 2 098
Adjustments for:
Depreciation 4 966 5 178
Unrealised exchange rate gains and losses -15 23
Other non-payment-related expenses 91 85
Financial income and expenses 940 1 127
Other adjustments 4 3
Cash flow before working capital changes 3 440 8 514
Change in net working capital:
Increase (-) / decrease (+) in current non-interest bearing receivables 448 -104
Increase (-) / decrease (+) in inventories 1 190 923
Increase (+) / decrease (-) in current non-interest bearing liabilities -465 -878
Cash generated from operations before financial items and income taxes 4 613 8 455
Interest paid and payments on other financial expenses from operations -1 073 -1 078
Dividends received 4 56
Interest received 107 168
Income taxes paid -254 -532
Cash flow before extraordinary items 3 397 7 069
Net cash flow from operating activities 3 397 7 069
Cash flow used in investing activities
Investments in tangible and intangible assets, gross -1 677 -3 310
Investment grants received 30
Proceeds from sale of tangible and intangible assets 15 76
Acquired subsidiary companies -361
Proceeds from sale of investments in subsidiaries 100
Acquisition of investments in associates 10
Gains on dipsposal of other investment 4
Interest received 4
Net cash used in investing activities -1 518 -3 591
Cash flow from financing activities
Purchase of own shares -47 -75
Repayment of short-term loans -1 836
Long-term borrowing 5 052 11 198
Repayment of long-term loans -7 146 -3 153
Dividends paid -1 020 -1 655
Net cash flow from financing activities -3 161 4 479
Net increase (+) / decrease (-) in cash and cash equivalents -1 282 7 957
Cash and cash equivalents at the beginning of the financial year 11 442 3 479
Effect of changes in exchange rates -4 6
Cash and cash equivalents at the end of the financial year 10 156 11 442
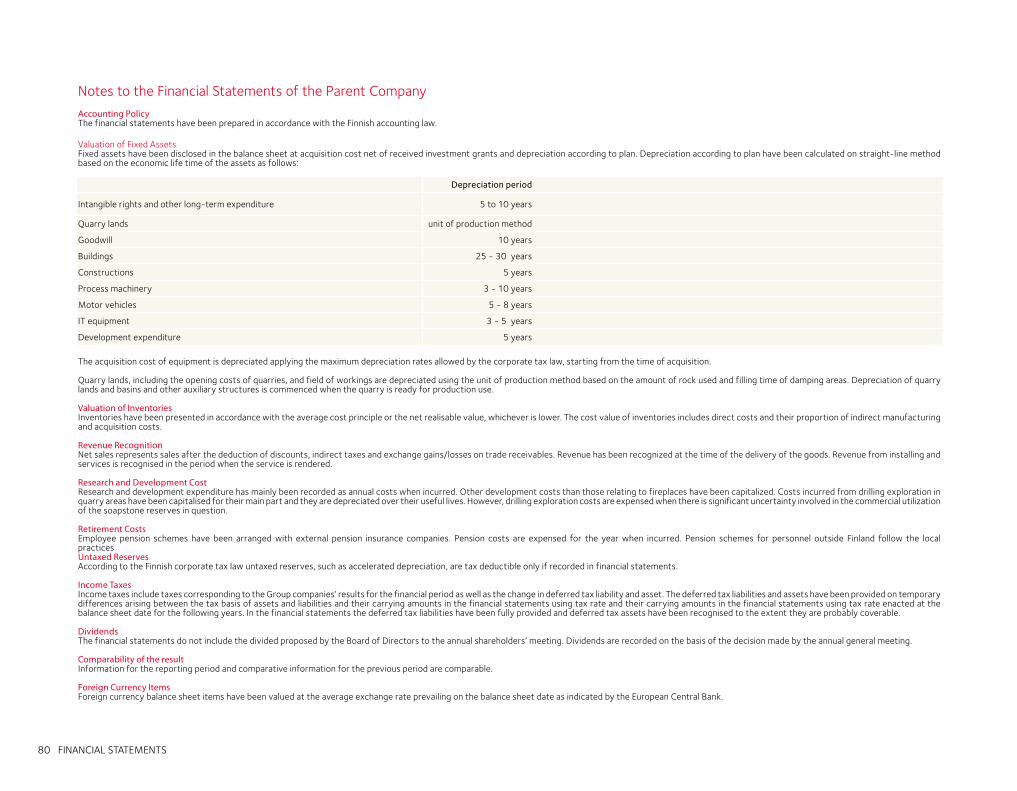
80 FINANCIAL STATEMENTS
Notes to the Financial Statements of the Parent Company
Accounting PolicyThe financial statements have been prepared in accordance with the Finnish accounting law.
Valuation of Fixed AssetsFixed assets have been disclosed in the balance sheet at acquisition cost net of received investment grants and depreciation according to plan. Depreciation according to plan have been calculated on straight-line method based on the economic life time of the assets as follows:
Depreciation period
Intangible rights and other long-term expenditure 5 to 10 years
Quarry lands unit of production method
Goodwill 10 years
Buildings 25 - 30 years
Constructions 5 years
Process machinery 3 - 10 years
Motor vehicles 5 - 8 years
IT equipment 3 - 5 years
Development expenditure 5 years
The acquisition cost of equipment is depreciated applying the maximum depreciation rates allowed by the corporate tax law, starting from the time of acquisition.
Quarry lands, including the opening costs of quarries, and field of workings are depreciated using the unit of production method based on the amount of rock used and filling time of damping areas. Depreciation of quarry lands and basins and other auxiliary structures is commenced when the quarry is ready for production use. Valuation of InventoriesInventories have been presented in accordance with the average cost principle or the net realisable value, whichever is lower. The cost value of inventories includes direct costs and their proportion of indirect manufacturing and acquisition costs. Revenue RecognitionNet sales represents sales after the deduction of discounts, indirect taxes and exchange gains/losses on trade receivables. Revenue has been recognized at the time of the delivery of the goods. Revenue from installing and services is recognised in the period when the service is rendered.
Research and Development CostResearch and development expenditure has mainly been recorded as annual costs when incurred. Other development costs than those relating to fireplaces have been capitalized. Costs incurred from drilling exploration in quarry areas have been capitalised for their main part and they are depreciated over their useful lives. However, drilling exploration costs are expensed when there is significant uncertainty involved in the commercial utilization of the soapstone reserves in question. Retirement CostsEmployee pension schemes have been arranged with external pension insurance companies. Pension costs are expensed for the year when incurred. Pension schemes for personnel outside Finland follow the local practices Untaxed ReservesAccording to the Finnish corporate tax law untaxed reserves, such as accelerated depreciation, are tax deductible only if recorded in financial statements.
Income TaxesIncome taxes include taxes corresponding to the Group companies’ results for the financial period as well as the change in deferred tax liability and asset. The deferred tax liabilities and assets have been provided on temporary differences arising between the tax basis of assets and liabilities and their carrying amounts in the financial statements using tax rate and their carrying amounts in the financial statements using tax rate enacted at the balance sheet date for the following years. In the financial statements the deferred tax liabilities have been fully provided and deferred tax assets have been recognised to the extent they are probably coverable. DividendsThe financial statements do not include the divided proposed by the Board of Directors to the annual shareholders’ meeting. Dividends are recorded on the basis of the decision made by the annual general meeting. Comparability of the resultInformation for the reporting period and comparative information for the previous period are comparable.
Foreign Currency ItemsForeign currency balance sheet items have been valued at the average exchange rate prevailing on the balance sheet date as indicated by the European Central Bank.
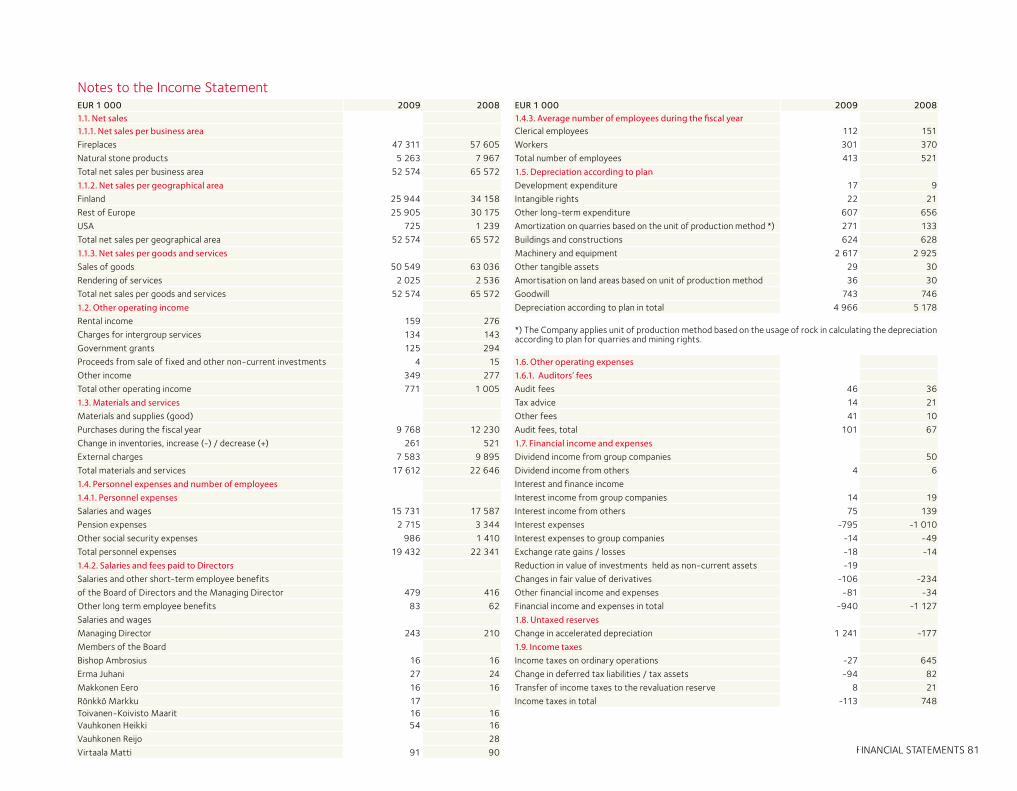
FINANCIAL STATEMENTS 81
Notes to the Income StatementEUR 1 000 2009 2008 EUR 1 000 2009 20081.1. Net sales 1.4.3. Average number of employees during the fiscal year1.1.1. Net sales per business area Clerical employees 112 151
Fireplaces 47 311 57 605 Workers 301 370
Natural stone products 5 263 7 967 Total number of employees 413 521
Total net sales per business area 52 574 65 572 1.5. Depreciation according to plan1.1.2. Net sales per geographical area Development expenditure 17 9
Finland 25 944 34 158 Intangible rights 22 21
Rest of Europe 25 905 30 175 Other long-term expenditure 607 656
USA 725 1 239 Amortization on quarries based on the unit of production method *) 271 133
Total net sales per geographical area 52 574 65 572 Buildings and constructions 624 628
1.1.3. Net sales per goods and services Machinery and equipment 2 617 2 925
Sales of goods 50 549 63 036 Other tangible assets 29 30
Rendering of services 2 025 2 536 Amortisation on land areas based on unit of production method 36 30
Total net sales per goods and services 52 574 65 572 Goodwill 743 746
1.2. Other operating income Depreciation according to plan in total 4 966 5 178
Rental income 159 276*) The Company applies unit of production method based on the usage of rock in calculating the depreciation according to plan for quarries and mining rights.
Charges for intergroup services 134 143
Government grants 125 294
Proceeds from sale of fixed and other non-current investments 4 15 1.6. Other operating expensesOther income 349 277 1.6.1. Auditors’ feesTotal other operating income 771 1 005 Audit fees 46 36
1.3. Materials and services Tax advice 14 21
Materials and supplies (good) Other fees 41 10
Purchases during the fiscal year 9 768 12 230 Audit fees, total 101 67
Change in inventories, increase (-) / decrease (+) 261 521 1.7. Financial income and expensesExternal charges 7 583 9 895 Dividend income from group companies 50
Total materials and services 17 612 22 646 Dividend income from others 4 6
1.4. Personnel expenses and number of employees Interest and finance income
1.4.1. Personnel expenses Interest income from group companies 14 19
Salaries and wages 15 731 17 587 Interest income from others 75 139
Pension expenses 2 715 3 344 Interest expenses -795 -1 010
Other social security expenses 986 1 410 Interest expenses to group companies -14 -49
Total personnel expenses 19 432 22 341 Exchange rate gains / losses -18 -14
1.4.2. Salaries and fees paid to Directors Reduction in value of investments held as non-current assets -19
Salaries and other short-term employee benefits Changes in fair value of derivatives -106 -234
of the Board of Directors and the Managing Director 479 416 Other financial income and expenses -81 -34
Other long term employee benefits 83 62 Financial income and expenses in total -940 -1 127
Salaries and wages 1.8. Untaxed reservesManaging Director 243 210 Change in accelerated depreciation 1 241 -177
Members of the Board 1.9. Income taxesBishop Ambrosius 16 16 Income taxes on ordinary operations -27 645
Erma Juhani 27 24 Change in deferred tax liabilities / tax assets -94 82
Makkonen Eero 16 16 Transfer of income taxes to the revaluation reserve 8 21
Rönkkö Markku 17 Income taxes in total -113 748Toivanen-Koivisto Maarit 16 16Vauhkonen Heikki 54 16
Vauhkonen Reijo 28
Virtaala Matti 91 90
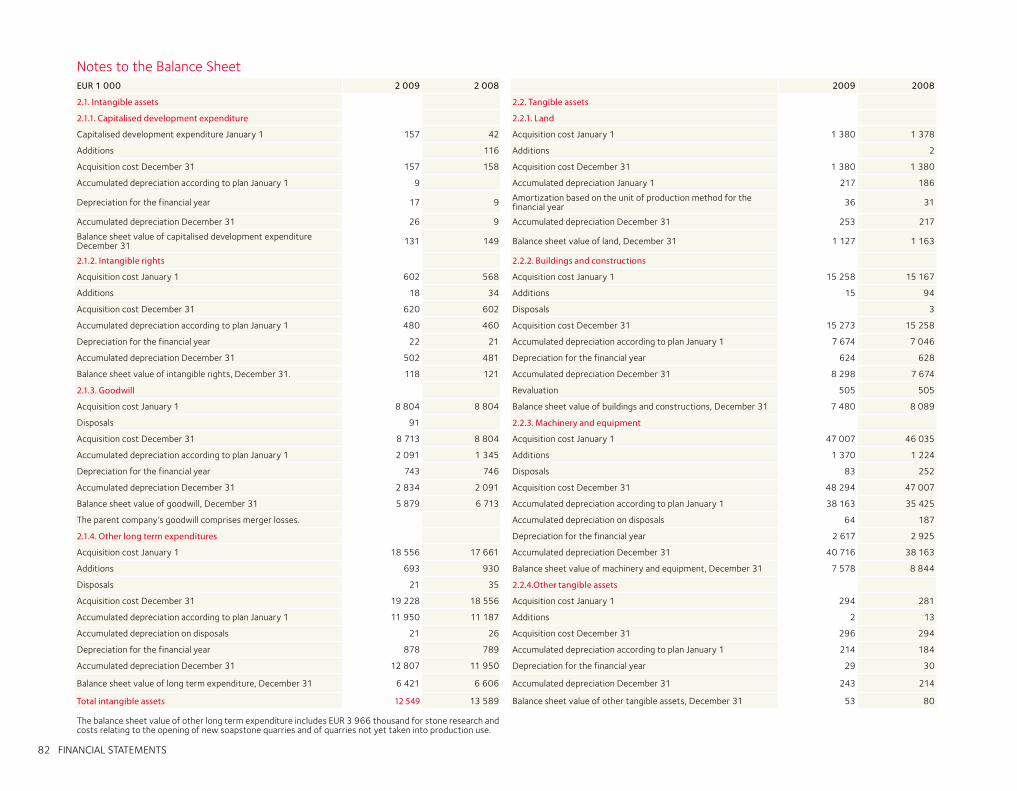
82 FINANCIAL STATEMENTS
Notes to the Balance SheetEUR 1 000 2 009 2 008 2009 2008
2.1. Intangible assets 2.2. Tangible assets
2.1.1. Capitalised development expenditure 2.2.1. Land
Capitalised development expenditure January 1 157 42 Acquisition cost January 1 1 380 1 378
Additions 116 Additions 2
Acquisition cost December 31 157 158 Acquisition cost December 31 1 380 1 380
Accumulated depreciation according to plan January 1 9 Accumulated depreciation January 1 217 186
Depreciation for the financial year 17 9 Amortization based on the unit of production method for the financial year 36 31
Accumulated depreciation December 31 26 9 Accumulated depreciation December 31 253 217
Balance sheet value of capitalised development expenditure December 31 131 149 Balance sheet value of land, December 31 1 127 1 163
2.1.2. Intangible rights 2.2.2. Buildings and constructions
Acquisition cost January 1 602 568 Acquisition cost January 1 15 258 15 167
Additions 18 34 Additions 15 94
Acquisition cost December 31 620 602 Disposals 3
Accumulated depreciation according to plan January 1 480 460 Acquisition cost December 31 15 273 15 258
Depreciation for the financial year 22 21 Accumulated depreciation according to plan January 1 7 674 7 046
Accumulated depreciation December 31 502 481 Depreciation for the financial year 624 628
Balance sheet value of intangible rights, December 31. 118 121 Accumulated depreciation December 31 8 298 7 674
2.1.3. Goodwill Revaluation 505 505
Acquisition cost January 1 8 804 8 804 Balance sheet value of buildings and constructions, December 31 7 480 8 089
Disposals 91 2.2.3. Machinery and equipment
Acquisition cost December 31 8 713 8 804 Acquisition cost January 1 47 007 46 035
Accumulated depreciation according to plan January 1 2 091 1 345 Additions 1 370 1 224
Depreciation for the financial year 743 746 Disposals 83 252
Accumulated depreciation December 31 2 834 2 091 Acquisition cost December 31 48 294 47 007
Balance sheet value of goodwill, December 31 5 879 6 713 Accumulated depreciation according to plan January 1 38 163 35 425
The parent company’s goodwill comprises merger losses. Accumulated depreciation on disposals 64 187
2.1.4. Other long term expenditures Depreciation for the financial year 2 617 2 925
Acquisition cost January 1 18 556 17 661 Accumulated depreciation December 31 40 716 38 163
Additions 693 930 Balance sheet value of machinery and equipment, December 31 7 578 8 844
Disposals 21 35 2.2.4.Other tangible assets
Acquisition cost December 31 19 228 18 556 Acquisition cost January 1 294 281
Accumulated depreciation according to plan January 1 11 950 11 187 Additions 2 13
Accumulated depreciation on disposals 21 26 Acquisition cost December 31 296 294
Depreciation for the financial year 878 789 Accumulated depreciation according to plan January 1 214 184
Accumulated depreciation December 31 12 807 11 950 Depreciation for the financial year 29 30
Balance sheet value of long term expenditure, December 31 6 421 6 606 Accumulated depreciation December 31 243 214
Total intangible assets 12 549 13 589 Balance sheet value of other tangible assets, December 31 53 80
The balance sheet value of other long term expenditure includes EUR 3 966 thousand for stone research and costs relating to the opening of new soapstone quarries and of quarries not yet taken into production use.
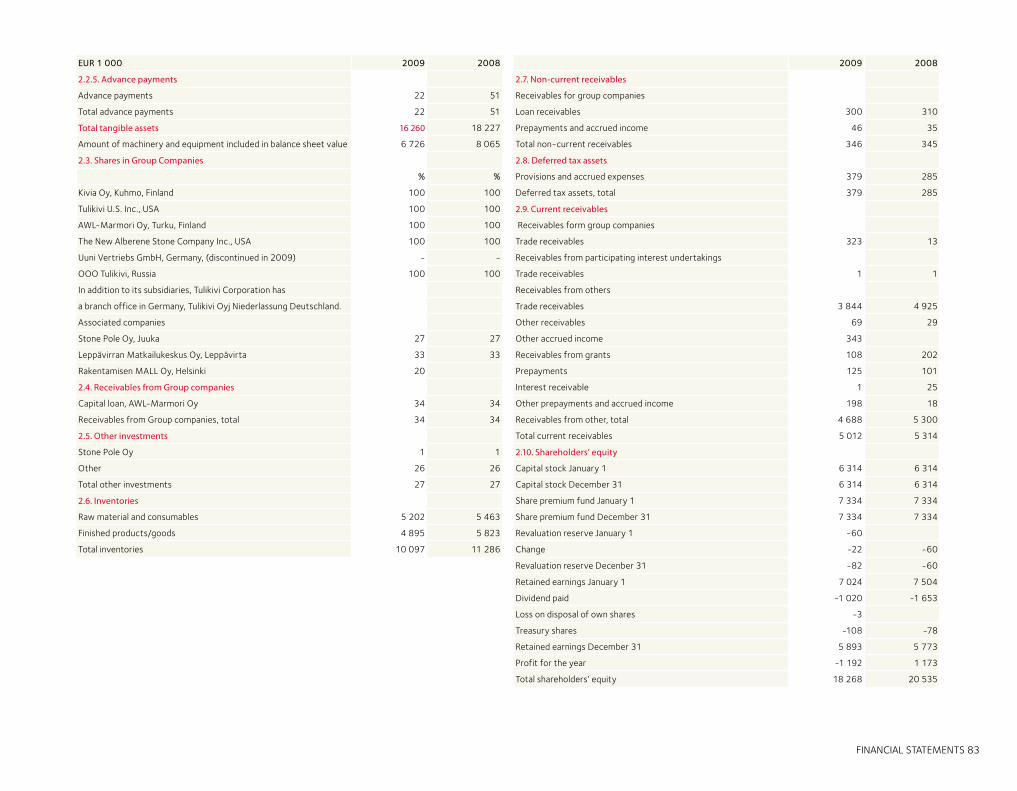
FINANCIAL STATEMENTS 83
EUR 1 000 2009 2008 2009 2008
2.2.5. Advance payments 2.7. Non-current receivables
Advance payments 22 51 Receivables for group companies
Total advance payments 22 51 Loan receivables 300 310
Total tangible assets 16 260 18 227 Prepayments and accrued income 46 35
Amount of machinery and equipment included in balance sheet value 6 726 8 065 Total non-current receivables 346 345
2.3. Shares in Group Companies 2.8. Deferred tax assets
% % Provisions and accrued expenses 379 285
Kivia Oy, Kuhmo, Finland 100 100 Deferred tax assets, total 379 285
Tulikivi U.S. Inc., USA 100 100 2.9. Current receivables
AWL-Marmori Oy, Turku, Finland 100 100 Receivables form group companies
The New Alberene Stone Company Inc., USA 100 100 Trade receivables 323 13
Uuni Vertriebs GmbH, Germany, (discontinued in 2009) - - Receivables from participating interest undertakings
OOO Tulikivi, Russia 100 100 Trade receivables 1 1
In addition to its subsidiaries, Tulikivi Corporation has Receivables from others
a branch office in Germany, Tulikivi Oyj Niederlassung Deutschland. Trade receivables 3 844 4 925
Associated companies Other receivables 69 29
Stone Pole Oy, Juuka 27 27 Other accrued income 343
Leppävirran Matkailukeskus Oy, Leppävirta 33 33 Receivables from grants 108 202
Rakentamisen MALL Oy, Helsinki 20 Prepayments 125 101
2.4. Receivables from Group companies Interest receivable 1 25
Capital loan, AWL-Marmori Oy 34 34 Other prepayments and accrued income 198 18
Receivables from Group companies, total 34 34 Receivables from other, total 4 688 5 300
2.5. Other investments Total current receivables 5 012 5 314
Stone Pole Oy 1 1 2.10. Shareholders’ equity
Other 26 26 Capital stock January 1 6 314 6 314
Total other investments 27 27 Capital stock December 31 6 314 6 314
2.6. Inventories Share premium fund January 1 7 334 7 334
Raw material and consumables 5 202 5 463 Share premium fund December 31 7 334 7 334
Finished products/goods 4 895 5 823 Revaluation reserve January 1 -60
Total inventories 10 097 11 286 Change -22 -60
Revaluation reserve Decenber 31 -82 -60
Retained earnings January 1 7 024 7 504
Dividend paid -1 020 -1 653
Loss on disposal of own shares -3
Treasury shares -108 -78
Retained earnings December 31 5 893 5 773
Profit for the year -1 192 1 173
Total shareholders’ equity 18 268 20 535
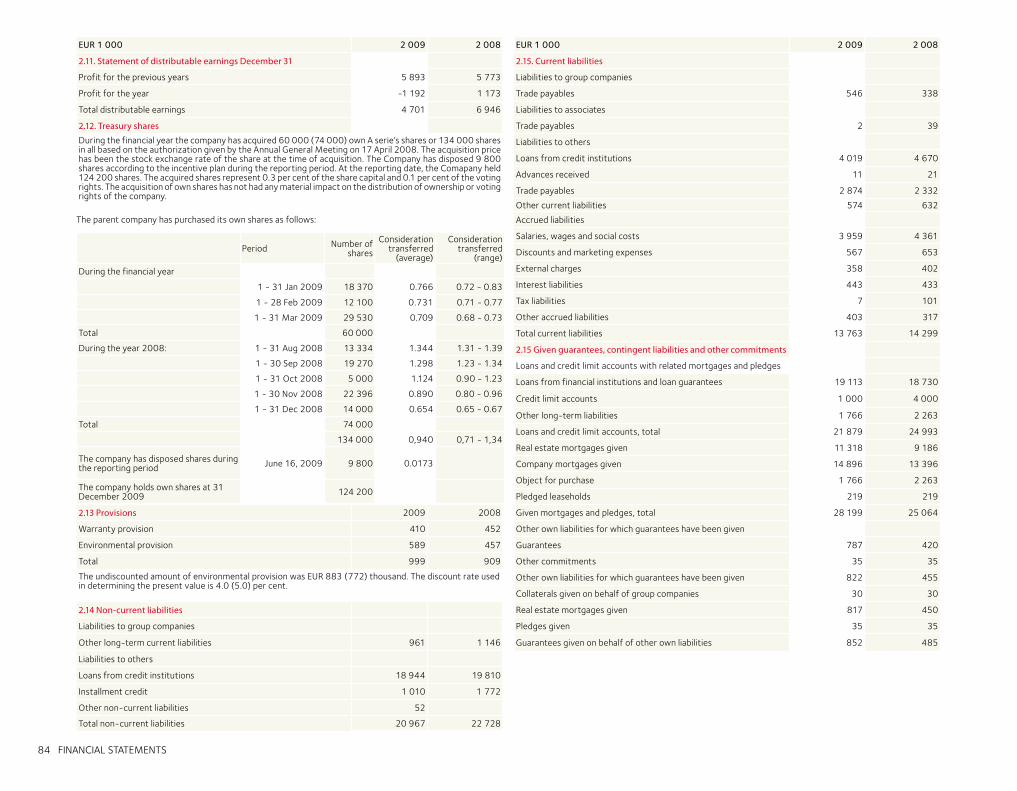
84 FINANCIAL STATEMENTS
EUR 1 000 2 009 2 008 EUR 1 000 2 009 2 008
2.11. Statement of distributable earnings December 31 2.15. Current liabilities
Profit for the previous years 5 893 5 773 Liabilities to group companies
Profit for the year -1 192 1 173 Trade payables 546 338
Total distributable earnings 4 701 6 946 Liabilities to associates
2.12. Treasury shares Trade payables 2 39
During the financial year the company has acquired 60 000 (74 000) own A serie’s shares or 134 000 shares in all based on the authorization given by the Annual General Meeting on 17 April 2008. The acquisition price has been the stock exchange rate of the share at the time of acquisition. The Company has disposed 9 800 shares according to the incentive plan during the reporting period. At the reporting date, the Comapany held 124 200 shares. The acquired shares represent 0.3 per cent of the share capital and 0.1 per cent of the voting rights. The acquisition of own shares has not had any material impact on the distribution of ownership or voting rights of the company.
Liabilities to others
Loans from credit institutions 4 019 4 670
Advances received 11 21
Trade payables 2 874 2 332
Other current liabilities 574 632
Accrued liabilities
Salaries, wages and social costs 3 959 4 361
Discounts and marketing expenses 567 653
External charges 358 402
Interest liabilities 443 433
Tax liabilities 7 101
Other accrued liabilities 403 317
Total current liabilities 13 763 14 299
2.15 Given guarantees, contingent liabilities and other commitments
Loans and credit limit accounts with related mortgages and pledges
Loans from financial institutions and loan guarantees 19 113 18 730
Credit limit accounts 1 000 4 000
Other long-term liabilities 1 766 2 263
Loans and credit limit accounts, total 21 879 24 993
Real estate mortgages given 11 318 9 186
Company mortgages given 14 896 13 396
Object for purchase 1 766 2 263
Pledged leaseholds 219 219
2.13 Provisions 2009 2008 Given mortgages and pledges, total 28 199 25 064
Warranty provision 410 452 Other own liabilities for which guarantees have been given
Environmental provision 589 457 Guarantees 787 420
Total 999 909 Other commitments 35 35
The undiscounted amount of environmental provision was EUR 883 (772) thousand. The discount rate used in determining the present value is 4.0 (5.0) per cent.
Other own liabilities for which guarantees have been given 822 455
Collaterals given on behalf of group companies 30 30
2.14 Non-current liabilities Real estate mortgages given 817 450
Liabilities to group companies Pledges given 35 35
Other long-term current liabilities 961 1 146 Guarantees given on behalf of other own liabilities 852 485
Liabilities to others
Loans from credit institutions 18 944 19 810
Installment credit 1 010 1 772
Other non-current liabilities 52
Total non-current liabilities 20 967 22 728
Period Number ofshares
Consideration transferred
(average)
Consideration transferred
(range)
During the financial year
1 - 31 Jan 2009 18 370 0.766 0.72 - 0.83
1 - 28 Feb 2009 12 100 0.731 0.71 - 0.77
1 - 31 Mar 2009 29 530 0.709 0.68 - 0.73
Total 60 000
During the year 2008: 1 - 31 Aug 2008 13 334 1.344 1.31 - 1.39
1 - 30 Sep 2008 19 270 1.298 1.23 - 1.34
1 - 31 Oct 2008 5 000 1.124 0.90 - 1.23
1 - 30 Nov 2008 22 396 0.890 0.80 - 0.96
1 - 31 Dec 2008 14 000 0.654 0.65 - 0.67
Total 74 000
134 000 0,940 0,71 - 1,34
The company has disposed shares during the reporting period June 16, 2009 9 800 0.0173
The company holds own shares at 31 December 2009 124 200
The parent company has purchased its own shares as follows:
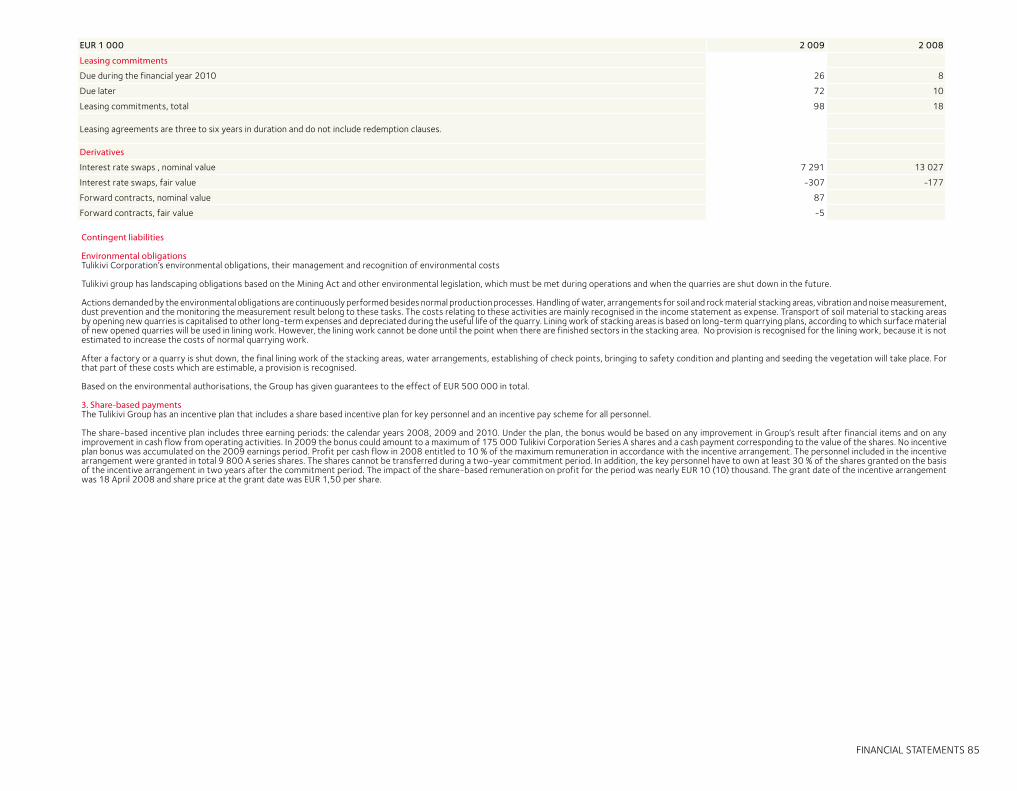
FINANCIAL STATEMENTS 85
Contingent liabilities
Environmental obligationsTulikivi Corporation’s environmental obligations, their management and recognition of environmental costs Tulikivi group has landscaping obligations based on the Mining Act and other environmental legislation, which must be met during operations and when the quarries are shut down in the future. Actions demanded by the environmental obligations are continuously performed besides normal production processes. Handling of water, arrangements for soil and rock material stacking areas, vibration and noise measurement, dust prevention and the monitoring the measurement result belong to these tasks. The costs relating to these activities are mainly recognised in the income statement as expense. Transport of soil material to stacking areas by opening new quarries is capitalised to other long-term expenses and depreciated during the useful life of the quarry. Lining work of stacking areas is based on long-term quarrying plans, according to which surface material of new opened quarries will be used in lining work. However, the lining work cannot be done until the point when there are finished sectors in the stacking area. No provision is recognised for the lining work, because it is not estimated to increase the costs of normal quarrying work. After a factory or a quarry is shut down, the final lining work of the stacking areas, water arrangements, establishing of check points, bringing to safety condition and planting and seeding the vegetation will take place. For that part of these costs which are estimable, a provision is recognised.
Based on the environmental authorisations, the Group has given guarantees to the effect of EUR 500 000 in total.
3. Share-based paymentsThe Tulikivi Group has an incentive plan that includes a share based incentive plan for key personnel and an incentive pay scheme for all personnel.
The share-based incentive plan includes three earning periods: the calendar years 2008, 2009 and 2010. Under the plan, the bonus would be based on any improvement in Group’s result after financial items and on any improvement in cash flow from operating activities. In 2009 the bonus could amount to a maximum of 175 000 Tulikivi Corporation Series A shares and a cash payment corresponding to the value of the shares. No incentive plan bonus was accumulated on the 2009 earnings period. Profit per cash flow in 2008 entitled to 10 % of the maximum remuneration in accordance with the incentive arrangement. The personnel included in the incentive arrangement were granted in total 9 800 A series shares. The shares cannot be transferred during a two-year commitment period. In addition, the key personnel have to own at least 30 % of the shares granted on the basis of the incentive arrangement in two years after the commitment period. The impact of the share-based remuneration on profit for the period was nearly EUR 10 (10) thousand. The grant date of the incentive arrangement was 18 April 2008 and share price at the grant date was EUR 1,50 per share.
EUR 1 000 2 009 2 008
Leasing commitments
Due during the financial year 2010 26 8
Due later 72 10
Leasing commitments, total 98 18
Leasing agreements are three to six years in duration and do not include redemption clauses.
Derivatives
Interest rate swaps , nominal value 7 291 13 027
Interest rate swaps, fair value -307 -177
Forward contracts, nominal value 87
Forward contracts, fair value -5
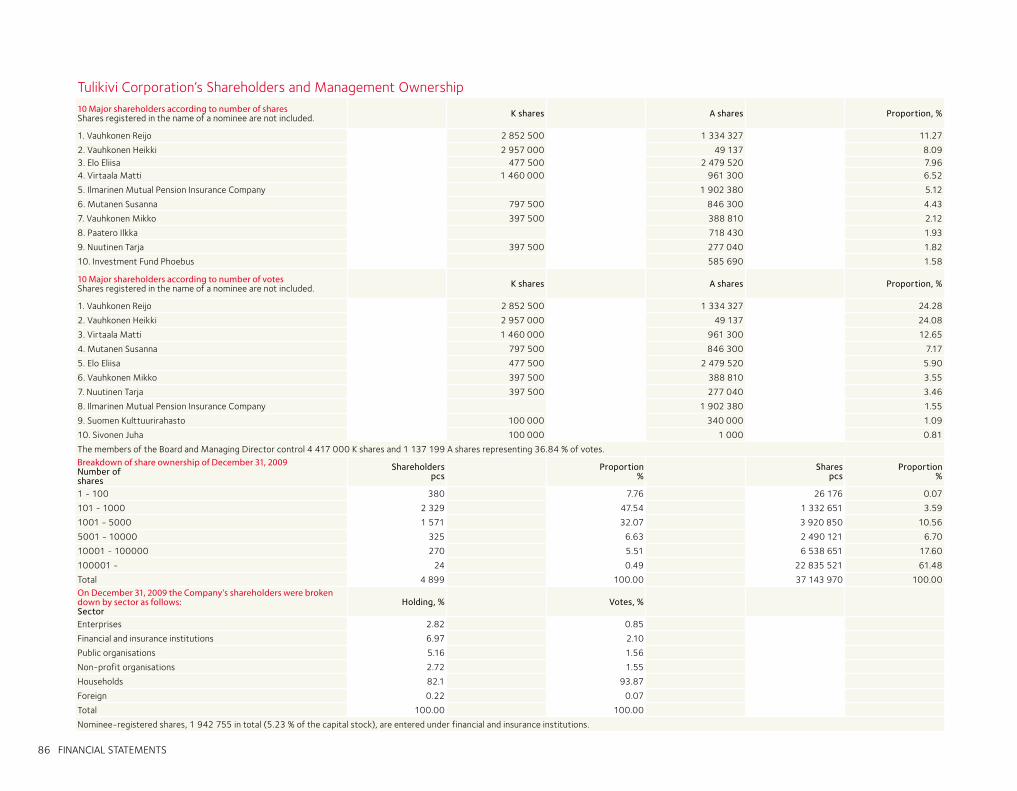
86 FINANCIAL STATEMENTS
Tulikivi Corporation’s Shareholders and Management Ownership10 Major shareholders according to number of shares Shares registered in the name of a nominee are not included. K shares A shares Proportion, %
1. Vauhkonen Reijo 2 852 500 1 334 327 11.27
2. Vauhkonen Heikki 2 957 000 49 137 8.093. Elo Eliisa 477 500 2 479 520 7.964. Virtaala Matti 1 460 000 961 300 6.52
5. Ilmarinen Mutual Pension Insurance Company 1 902 380 5.12
6. Mutanen Susanna 797 500 846 300 4.43
7. Vauhkonen Mikko 397 500 388 810 2.12
8. Paatero Ilkka 718 430 1.93
9. Nuutinen Tarja 397 500 277 040 1.82
10. Investment Fund Phoebus 585 690 1.58
10 Major shareholders according to number of votes Shares registered in the name of a nominee are not included. K shares A shares Proportion, %
1. Vauhkonen Reijo 2 852 500 1 334 327 24.28
2. Vauhkonen Heikki 2 957 000 49 137 24.08
3. Virtaala Matti 1 460 000 961 300 12.65
4. Mutanen Susanna 797 500 846 300 7.17
5. Elo Eliisa 477 500 2 479 520 5.90
6. Vauhkonen Mikko 397 500 388 810 3.55
7. Nuutinen Tarja 397 500 277 040 3.46
8. Ilmarinen Mutual Pension Insurance Company 1 902 380 1.55
9. Suomen Kulttuurirahasto 100 000 340 000 1.09
10. Sivonen Juha 100 000 1 000 0.81
The members of the Board and Managing Director control 4 417 000 K shares and 1 137 199 A shares representing 36.84 % of votes.Breakdown of share ownership of December 31, 2009Number of shares
Shareholderspcs
Proportion%
Sharespcs
Proportion%
1 - 100 380 7.76 26 176 0.07
101 - 1000 2 329 47.54 1 332 651 3.59
1001 - 5000 1 571 32.07 3 920 850 10.56
5001 - 10000 325 6.63 2 490 121 6.70
10001 - 100000 270 5.51 6 538 651 17.60
100001 - 24 0.49 22 835 521 61.48
Total 4 899 100.00 37 143 970 100.00On December 31, 2009 the Company’s shareholders were broken down by sector as follows:Sector
Holding, % Votes, %
Enterprises 2.82 0.85
Financial and insurance institutions 6.97 2.10
Public organisations 5.16 1.56
Non-profit organisations 2.72 1.55
Households 82.1 93.87
Foreign 0.22 0.07
Total 100.00 100.00
Nominee-registered shares, 1 942 755 in total (5.23 % of the capital stock), are entered under financial and insurance institutions.
FINANCIAL STATEMENTS 87
TO THE ANNUAL GENERAL MEETING OF TULIKIVI CORPORATION
We have audited the accounting records, the financial statements, the report of the Board of Directors, and the
administration of Tulikivi Corporation for the financial period 1 January - 31 December 2009. The financial sta-
tements comprise the consolidated statement of financial position, statement of comprehensive income, state-
ment of changes in equity, statement of cash flows and notes to the consolidated financial statements, as well
as the parent company’s balance sheet, income statement, cash flow statement and notes to the financial sta-
tements.
THE RESPONSIBILITY OF THE BOARD OF DIRECTORS AND THE MANAGING DIRECTOR
The Board of Directors and the Managing Director are responsible for the preparation of the financial statements
and the report of the Board of Directors and for the fair presentation of the consolidated financial statements in
accordance with International Financial Reporting Standards (IFRS) as adopted by the EU, as well as for the fair
presentation of the parent company’s financial statements and the report of the Board of Directors in accordance
with laws and regulations governing the preparation of the financial statements and the report of the Board of
Directors in Finland. The Board of Directors is responsible for the appropriate arrangement of the control of the
company’s accounts and finances, and the Managing Director shall see to it that the accounts of the company
are in compliance with the law and that its financial affairs have been arranged in a reliable manner.
AUDITOR’S RESPONSIBILITY
Our responsibility is to perform an audit in accordance with good auditing practice in Finland, and to express an
opinion on the parent company’s financial statements, on the consolidated financial statements and on the re-
port of the Board of Directors based on our audit. Good auditing practice requires that we comply with ethical
requirements and plan and perform the audit to obtain reasonable assurance whether the financial statements
or the report of the Board of Directors are free from material misstatement and whether the members of the
Board of Directors of the parent company and the Managing Director have complied with the Limited Liability
Companies Act.
An audit involves performing procedures to obtain audit evidence about the amounts and disclosures in the fi-
nancial statements and the report of the Board of Directors. The procedures selected depend on the auditor’s
judgment, including the assessment of the risks of material misstatement of the financial statements or of the
report of the Board of Directors, whether due to fraud or error. In making those risk assessments, the auditor
considers internal control relevant to the entity’s preparation and fair presentation of the financial statements
and the report of the Board of Directors in order to design audit procedures that are appropriate in the circum-
stances. An audit also includes evaluating the appropriateness of accounting policies used and the reasonableness
of accounting estimates made by management, as well as evaluating the overall presentation of the financial sta-
tements and the report of the Board of Directors.
The audit was performed in accordance with good auditing practice in Finland. We believe that the audit eviden-
ce we have obtained is sufficient and appropriate to provide a basis for our audit opinion.
OPINION ON THE CONSOLIDATED FINANCIAL STATEMENTS
In our opinion, the consolidated financial statements give a true and fair view of the financial position, financial
performance, and cash flows of the group in accordance with International Financial Reporting Standards (IFRS)
as adopted by the EU.
OPINION ON THE COMPANY’S FINANCIAL STATEMENTS AND THE REPORT OF THE BOARD OF DIRECTORS
In our opinion, the financial statements and the report of the Board of Directors give a true and fair view of both
the consolidated and the parent company’s financial performance and financial position in accordance with the
laws and regulations governing the preparation of the financial statements and the report of the Board of Direc-
tors in Finland. The information in the report of the Board of Directors is consistent with the information in the
financial statements.
OTHER OPINIONS
We support that the financial statements should be adopted. The proposal by the Board of Directors regarding
the use of the profit shown in the balance sheet is in compliance with the Limited Liability Companies Act. We
support that the Members of the Board of Directors and the Managing Director should be discharged from lia-
bility for the financial period audited by us.
Helsinki, 25 February 2010
KPMG OY AB
ARI ESKELINEN
Authorized Public Accountant
In Nunnanlahti February 11, 2010
Matti Virtaala Bishop Ambrosius Juhani Erma
Eero Makkonen Markku Rönkkö Maarit Toivanen-Koivisto
Heikki VauhkonenManaging Director
Auditor’s Report
Signatures to Report of the Board and Financial Statements
88 CONTACT INFORMATION
Contact information
HEAD OFFICE AND JUUKA FACTORIESFI-83900 JuukaTel. +358 207 636 000 Fax +358 207 636 [email protected]
SUOMUSSALMI FACTORYSaarikyläntie 26FI-89920 RuhtinansalmiTel. +358 207 636 750Fax +358 207 636 769
HEINÄVESI FACTORYRasiahontie 3FI-79700 HeinävesiTel. +358 207 636 501Fax +358 207 636 505
TAIVASSALO AND VINKKILÄ FACTORIESHelsingintie 108FI-23310 TaivassaloTel. +358 207 636 880Fax +358 207 636 888
HELSINKI OFFICEBulevardi 22FI-00120 HelsinkiTel. +358 207 636 000Fax +358 207 636 558
ESPOO OFFICELautamiehentie 1FI-02770 EspooTel. +358 207 636 820Fax +358 207 636 877
SUBSIDIARIESKIVIA OYKivikatu 2-4FI-88900 KuhmoTel. +358 207 636 700Fax +358 207 636 720
TULIKIVI U.S., INC.c/o Drayer and Company PC, 195 Riverbend Drive - Suite 3VA 22911 CharlottesvilleUSATel. +800-843 3473
OOO TULIKIVI Liteiniy pr. 22091028 St. PetersburgRussiaTel. +7 812 911 831 30 22Fax: +7 812 333 38 95
ASSOCIATE COMPANIESSTONE POLE OYKuhnustantie 10FI-83900 JuukaTel. +358 207 636 600Fax + 358 207 636 609
LEPPÄVIRRAN MATKAILUKESKUS OYRasiahontie 3FI-79700 HeinävesiTel. +358 207 636 501Fax +358 207 636 505
SALES EXHIBITIONS IN FINLANDNearest distributor on Internet site www.tulikivi.com
TULIKIVI CORPORATION – FACTORIES AND OFFICES
CONTACT INFORMATION 89
TULIKIVI ABROADBENELUXDUTRY & CO.Jagershoek 10B-8570 VichteBelgiumTel. +32 56 776 090Fax +32 56 774 294
ITALYEUROTRIAS S.R.L. – GMBHVia Max PlanckI-39100 BolzanoItalyTel. +39 0 471 201 616Fax +39 0 471 201 689AUSTRIANEUHAUSER-SPECKSTEIN-ÖFENBahnhofstrasse 54A-4810 GmundenAustriaTel. +43 7612 744 58Fax +43 7612 744 584
LATVIA, LITHUANIABaltic TKPihlaka 1 a11216 TallinnEstoniaTel. +372 6555 486 Fax +372 6555 487
FRANCETULIKIVI OYJ75, avenue ParmentierF-75011 ParisFranceTel. +33 1 40 21 25 65Fax +33 1 40 21 24 00
SWEDENFI-83900 JuukaFinlandTel. +358 207 636 000 Fax +358 207 636 120
GERMANYTULIKIVI OYJ NIEDERLASSUNG DEUTSCHLANDBergstraße 11D-63589 Linsengericht/Eidengesäß GermanyTel. +49 6102 74 140Fax +49 6102 741 414
SWITZERLANDARMAKA AGDuggingerstrasse 10CH-4153 Reinach BLSwitzerlandTel. +41 61 715 9911Fax +41 61 715 9919
USATULIKIVI U.S., INC.c/o Drayer and Company PC, 195 Riverbend Drive - Suite 3VA 22911 CharlottesvilleUSATel. +800-843 3473
RUSSIAOOO TULIKIVI Liteiniy pr. 22091028 St. PetersburgRussiaTel. +7 812 911 831 30 22Fax: +7 812 333 38 95
ESTONIABaltic TKPihlaka 1 a11216 TallinnEstoniaTel. +372 6555 486 Fax +372 6555 487
SLOVENIAHorizont DOM, d.o.o.Prešernova 10a1000 LjubljanaSloveniaTel. +386 1 251 66 00 Fax +386 1 251 88 35
Tulikivi Corporation, FI 83900 Juuka, Finland, tel. +358 207 636 000, fax +358 207 636 130, www.tulikivi.com Business ID 0350080-1, domicile Juuka ES
20
21
, 03
/10


