50
Annual Report 2011

A n n u a l R e p o r t 2 0 1 1

Mission stateMent
As the pioneer in leisure community development in the Philippines, Belle Corporation
remains steadfast with its commitment in shaping and influencing the real estate
industry by promoting a holistic approach in its developments. Exclusive homes, clean
natural surroundings, and round-the-clock security and utilities in its gated communities keep in
mind the conscious effort of preserving the environment and general ecosystem. Value-added
services and world-class amenities in its clubs and other leisure facilities transcend into a legacy
for generations to come.

Annual Repor t 2011 Belle Corporation 1
Belle Corporation is leading the way to further preserve and enhance the environment by
incorporating various activities that promote ecological balance for the sustainable development of
Tagaytay Highlands and its surrounding lands in Batangas, thus enhancing the quality of life for the
communities it serves.
Professional ethics and traditional values continue to be the Company’s foundation in all its
endeavors. Management directives are guided by prudent leadership, which makes this company
continue to conform to the highest level of real estate industry practices, and prosper for the benefit
of all its stakeholders.

Belle Corporation Annual Repor t 20112
Belle Grande is being constructed on more
than 6 hectares of land in a central area in
the Aseana Business Park in Parañaque City,
with three of its sides facing major thoroughfares -
Roxas Boulevard, Diosdado Macapagal Avenue and
Aseana Avenue. The integrated resort has a very
advantageous location at the entrance of Bagong
Nayong Pilipino. It is also conveniently close to the
SM Mall of Asia complex, Ninoy Aquino International
Airport and all major tourist destinations in Old
Manila. Belle Grande will extend the visitors’ Manila
During 2011, Belle Corporation took giant strides
towards achieving the next level in its evolution
as a leading player in the Philippine high-end
property and leisure industry. Your Company’s
integrated resort, Belle Grande Manila Bay, has
risen prominently in what used to be undeveloped
grassy sand flats. The structure for the main
podium of Belle Grande is now a visible signal to
all of Metro Manila of the forthcoming emergence
of Bagong Nayong Pilipino (literally translated
to “New Philippine Village”), which the Philippine
Department of Tourism and Philippine Amusement
& Gaming Corporation are aiming to make
into a major international leisure destination
within a 15-minute drive from the Ninoy Aquino
International Airport.
Message to shareholders

Belle Grande will extend the visitors’ Manila experience beyond sightseeing and gaming.
Annual Repor t 2011 Belle Corporation 3
experience beyond sightseeing and gaming - with
its own entertainment, leisure and hospitality
options; and with its links to the SM Mall of Asia
for quality shopping, the SMX Convention Center
for conferences and trade fairs, and the SM Arena
for sporting events and entertainment spectacles.
Belle Grande will be a premiere leisure
destination comprising the main podium and the
adjacent Mall, with a total gross floor area of over
25 hectares and each approximately 45 meters
high. The main podium will feature six luxury hotel
towers with more than 800 rooms and the Belle
Grande Casino, which will occupy its first two floors.
The Belle Grande Casino will have a total gaming
area of approximately 1.8 hectares surrounded
by food and beverage outlets, with luxury retail
stores at the margins. The Mall will feature a
world-class performing arts theater and high-end
shopping. The entire resort will contain more than
2 hectares of retail and dining options. We expect
Belle Grande to be a key attraction in the Bagong
Nayong Pilipino area, and as such it will help to
redefine the Manila experience for both tourists
and residents alike.
We broke ground in January 2010, and expect
to complete and launch the entire complex in 2013.
By the end of 2011, the structure of the gaming
facility has already taken shape. We broke ground
on the Mall in February 2012, with its completion
projected for 2014.
While we are excited about the expected
long-term contribution of the Belle Grande project
to your Company’s value, we continue to focus on
our “franchise” business in the Tagaytay Highlands
area. Belle still owns about 780 hectares of
landbank that provides us with the opportunity to
offer to the market ideal lots and residences in the
level of quality that Belle is known for.
Financial Review
2011 was a particularly challenging year,
with the Philippine real estate markets being
affected by global financial disruptions that stifled
growth, coupled with more intensive competition,
as Belle’s gross revenues decreased by 45%
between 2010 and 2011, from P=1.3 billion to
P=697 million. However, Belle has continued to
attain profitable operations, with operating income
at P=225 million and consolidated net income of
about P=200 million for 2011. Our consistent focus
on cost control has helped your Company maintain
sufficient operating flexibility to be able to continue
to post positive operating results even under difficult
market conditions. Moreover, we have maintained
our longstanding reputation for product quality, as
well as a loyal following in our traditional niche
Topping-off ceremony of Belle Grande Manila Bay attended by members of the
Board of Directors and Management Team

1 As of December 31, 2011, Belle had P=2.8 billion in cash and marketable securities, and P=901 million in receivables.
Belle Corporation Annual Repor t 20114
market for high-end property. We have planned a
number of product launches and sales initiatives
for 2012, which we believe will help boost revenues
and operating profits significantly during 2012.
Belle’s balance sheet has continued to
be solid. As of December 31, 2011, Belle had
about P=3.7 billion in liquid assets1, as well as
approximately P=3 billion in available credit lines.
Our current ratio stands at 3.17X and effectively
assures funding for all of our pending and planned
projects. The Company’s balance sheet further
strengthened with its total debt to equity ratio at
29% as of December 31, 2011, the lowest level
since 1996, prior to the Asian Financial Crisis.
Affiliates
Highlands Prime, Inc. (HPI), Belle’s 36%-owned
real estate affiliate, realized a net loss of P=35 million
in 2011, compared to net income of P=8 million in
2010. HPI plans to turn around its operations with
promising new project launches during 2012,
including a new leisure lot development within
Tagaytay Highlands, envisioned to have modern
log homes which highlight the use of rustic wood
elements in modern architecture. HPI is also slated
to come out with another themed residential lot
development in the vicinity of Tagaytay Midlands.
Pacific Online Systems Corporation (Pacific
Online), a 35%-owned gaming affiliate, realized
net income of P=392 million for 2011, compared
to P=430 million in 2010. Pacific Online supplies
lottery equipment to the Philippine Charity
Sweepstakes Office (PCSO) in the Visayas and
Mindanao, for which it collects a percentage
of PCSO’s revenues from these areas. Pacific
Online’s decrease in net income during 2011
Debt to Equity Ratio
2004 2005 2006 2007 2008 2009 2010 2011
180%
160%
140%
120%
100%
80%
60%
40%
20%
0%
54% 49% 54% 50% 49% 45% 44%
29%
Consolidated Net Income
2004 2005 2006 2007 2008 2009 2010 2011
900.0
800.0
700.0
600.0
500.0
400.0
300.0
200.0
100.0
0.0
118.9
832.9
152.3
331.7
205.8
385.8
465.5
200.5Am
ou
nts
(in
P m
illio
ns)
Members of the Board of Directors of Belle Corporation and Philippine Stock Exchange during the listing of the stock rights offering last October 10, 2011

Annual Repor t 2011 Belle Corporation 5
Benito Tan GuatChairman
Willy N. OcierVice Chairman
Elizabeth Anne C. UychacoVice Chairperson
From left to right:
Willy N. OcierVice Chairman
Benito Tan Guat Chairman
Elizabeth Anne C. UychacoVice Chairperson
was because gains arising from its marketable
securities portfolio fell from about P=173 million
during 2010 to P=69 million during 2011, due to
volatile market conditions during 2011. Excluding
gains in marketable securities, Pacific Online’s net
income would have shown an increase of about
P=66 million during 2011. Further earnings growth
is expected in future years, as it benefits from
continued penetration by the PCSO of its regions
with terminals leased from it, coupled with growth
in the PCSO’s gaming revenues. We expect Pacific
Online’s earnings momentum to continue during
2012.
Future Plans
With the continuing demand for green
minimalist style of architecture present in Japanese
structural design, Belle plans on expanding the
Japanese-inspired community of Yume in Lakeside
Fairways with the same surreal design elements
that has endeared it to its first patrons. Sycamore
Heights, also in Lakeside Fairways, will welcome
an expansion as well. Similar to the homes in
Yume, the ones in Sycamore Heights designed by
L.V. Locsin and Partners follow a green or energy
efficient design with an Asian Contemporary
theme that provides high ceilings, large picture
windows and more open spaces to make the living
spaces harmoniously blend and work with the
environment.
The vision for Lakeside Fairways to be a
community embraced by the love of golf will
soon be realized with the opening of the Midlands
Lucky 9 in the second quarter of 2012. Golf course
designer John Olenoski has made an exciting
work of art with the new nines, giving it a breath of
mystery in every challenge that is distinctly Lucky
9. He is currently working on the design of the
fourth nines at the Tagaytay Midlands golf course
which will be a reality in the next three to four
years. With this, Belle will be bringing the number
of 18-hole international championship golf
courses in Tagaytay Highlands to a total of three,
with its own clubhouse and recreational facilities.
We are proud of your Company’s performance
and progress, and are very excited about its
expanding opportunities for 2012 and beyond.
Your Company continues to maintain its leadership
position in the high-end leisure real estate industry,
and is on track to enter the lucrative integrated
resort industry within a year.
We can assure you, our shareholders,
that we will continue to work diligently towards
delivering profitable results and strive to enhance
shareholders’ value.
Thank you for your continued support.

6 Belle Corporation Annual Repor t 2011
Tagaytay Highlands continues
to be the country’s premier destination
for luxury living.
Tagaytay Highlands

Belle Grande Manila Bay is bound
to change the gaming and tourism
landscape in the metro.

Belle Corporation Annual Repor t 20118
Benito Tan GuatChairman
Willy N. OcierVice Chairman
Elizabeth Anne C. UychacoVice Chairperson
Rogelio R. CabuñagDirector and President
Board of directors

Annual Repor t 2011 Belle Corporation 9
Gregorio U. KilaykoIndependent Director
Jose T. SioDirector
Washington Z. SycipIndependent Director
Jacinto C. Ng, Jr.Director
Virginia A. Yap Director
Emilio S. de Quiros, Jr.Director
Cesar E. A. Virata Independent Director

Belle Corporation Annual Repor t 201110
ManageMent teaM
Willy N. OcierVice Chairman
Rogelio R. CabuñagPresident
Joselito R. ConsunjiExecutive Vice President and
Chief Operating Officer
Frederic C. Dy BuncioHead - Business UnitPortfolio Investment
Armin B. Raquel SantosHead - Business Unit Casino Operations
Shirley C. OngHead - Business Unit
Project Development and Sales & Marketing
Claire T. KramerHead - Business Unit
Clubs
Manuel A. GanaExecutive Vice President and
Chief Financial Officer

Annual Repor t 2011 Belle Corporation 11
Nancy O. HuiExecutive Assistant to the Chairman
Emmanuel J. MoralesAsst. Vice President for Project
Management and External Affairs
Donn Frank C. RabanesAsst. Vice President for
Corporate Planning PremiumLeisure & Amusement, Inc.
Marilyn G. RicoVice President for Internal Audit
Rudy P. AninipotVice President for Property Maintenance
Rogelio I. RobangVice President for Project Management
and External Affairs
Margaret Y. HernandoVice President for Treasury
Melvin U. CadampogVice President for Corporate Planning
Maricer S. MendiolaAsst. Vice President for Sales
Michelle T. HernandezVice President for Marketing
Rosemarie S. RamosAsst. Vice President for Accounting
Atty. A. Bayani K. TanCorporate Secretary
Atty. Arthur A. SyAsst. Corporate Secretary
Sharlie B. CoAsst. Vice President for
Corporate Services
Zenia K. SyHead of Sales
Edwin M. PangilinanAsst. Vice President for Sales

The following data should be read in conjunction with the consolidated financial statements and related notes thereto and management’s discussion and analysis of operating performance and financial condition included elsewhere in this annual report. Years Ended December 31 2011 2010 2009 20081 20071
(amounts in P=millions)
CONSOLIDATED INCOME STATEMENT DATA:
Real Estate Operations:
Gross revenues P=696.5 P=1,263.1 P=1,403.2 P=1,349.3 P=658.3
Cost of real estate and club shares sold (236.0) (509.0) (566.3) (587.0) (210.5)
Gross margin 460.5 754.1 836.9 762.3 447.7
General and administrative expenses (235.1) (221.4) (305.4) (279.7) (222.6)
Income from real estate operations 225.3 532.7 531.5 482.6 225.1
Equity in net earnings of associates 140.5 156.2 117.9 81.3 72.2
Financial and other income (expenses) - net2 (142.3) (146.9) (189.4) (329.7) 41.3
Tax benefits (provisions) (23.1) (76.6) (73.9) (28.4) (6.9)
Minority interest (0.1) (0.1) (0.1) (0.1) (0.1)
Consolidated net income after taxes 200.5 465.5 385.8 205.8 331.7
CONSOLIDATED BALANCE SHEET DATA:
Total assets P=22,643.5 P=10,528.1 P=9,973.5 P=9,912.6 P=9,418.2
Total debt 4,715.4 2,708.1 2,564.5 2,598.2 2,535.0
Total liabilities3 6,568.5 4,349.8 4,273.6 4,576.8 4,320.6
Stockholders’ equity4 16,075.0 6,178.3 5,699.9 5,335.8 5,097.6
1 Income statement data were restated in order to conform to new financial reporting and presentation requirements. Such restatements had no effect on net income figures. Total assets and stockholders’ equity as of December 31, 2008 were restated from P=9,915.0 million and P=5,338.3 million, respectively, in order to reflect the fair market value of Belle shares held by Primary Data, Inc. (a subsidiary of APC Group, Inc.).
2 Inclusive of net foreign exchange gain of P=270 thousand in 2011, P=51.5 million in 2010, P=28.9 million in 2009, P=135.4 million in 2008, P=166.1 million in 2007 and P=88.5 million in 2006, mainly due to US$ denominated loans. For foreign exchange translation purposes, exchange rates used were P=43.84:US$1 as of December 31, 2011 and December 31, 2010, P=46.20:US$1 as of December 31, 2009, P=47.52:US$1 as of December 31, 2008, and P=41.28:US$1 as of December 31, 2007.
3 Including total debt.4 Net of minority interest.
Belle Corporation Annual Repor t 201112
selected financial and oPerating data

REVENUES
Gross revenue for 2011 of P=696.5 million was lower by P=566.6 million (45%), compared to P=1,263.1 million during 2010. Gross profit as of December 2011 of P=460.5 million was also lower than gross profit as of December 2010 of P=754.1 million by P=293.6 million (39%), due to the lower sales of real estate and club shares. The Company’s revenues for the 2010 period were stimulated by the launches of Katsura and Fairfield, and the grand launch of Cotswold, during 2009. These three projects comprised a total of 487 saleable lots and 165,175 square meters (“sqm”) in net saleable area. In contrast, the Company’s project launches during 2010 (Nob Hill and Yume), which were to help stimulate its revenues for 2011, comprised a total of approximately 162 saleable lots and 70,741 sqm in saleable area. During 2011, the Company has been devoting significant resources to development activities connected with Belle Grande Manila Bay (“Belle Grande”), its integrated resort project located in Parañaque City, which is targeted for its grand opening in 2013. During the year ended December 31, 2011, the Company recorded net
rental income of P=62.1 million on land and buildings leased by the Company to AB Leisure Global, Inc. (“ABLGI”) for the site of Belle Grande, starting January 14, 2011. In the second quarter of 2011, Belle introduced Lakeside Fairways Phase 8 (Sycamore Heights), with more than 23 hectares of gross saleable area and 309 residential lots. In the third quarter of 2011, the Company introduced extensions of existing projects, namely three new pads for log cabins at The Woodlands and nine new lots in Lakeside Fairways Phase 6 (Cotswold). These project extensions will carry total potential sales of about P=225.0 million.
Cost of Real Estate and Club Shares SoldCost of real estate and clubs shares sold decreased by P=273.0 million (54%) to P=236.0 million in 2011 from P=509.0 million in 2010 due mainly to lower unit sales of real estate and club shares sold in 2011.
General and Administrative ExpensesThe increase by P=13.8 million (6%) from P=221.4 million in 2010 to P=235.2 million in 2011 was caused by the following: higher marketing expenses and registration fees. The increase was partially offset by lower taxes and licenses and professional fees.
Financial Income (Expense)Interest expense decreased by P=33.2 million (17%), to P=158.2 million, from P=191.4 million in 2010 due to lower interest rates. In 2011, the Company also capitalized borrowing costs amounting to P=107.3 million.
Interest income increased by P=24.9 million (701.4%), from P=3.6 million to P=28.5 million in 2011 due to placement of funds. The significant increase in 2011 fund level of the Company was brought by new long-term loan drawdown and proceeds from the stock rights offering.
Equity in Net Earnings of AssociatesThe Company’s equitized net earnings from associated companies decreased by P=15.7 million (10%) to P=140.5 million in 2011, from P=156.2 million in 2010. Equitized earnings were mainly from its 36%-owned associate, Highlands Prime, Inc. (HPI), and from its 35%-owned associate, Pacific Online Systems Corporation (Pacific Online). HPI is also engaged in real estate development within the Tagaytay Highlands and Midlands complexes, while Pacific Online leases on-line equipment to the Philippine Charity Sweepstakes Office for their lottery operations in the Visayas and Mindanao.
TABLE 1: Year Ended December 31 Horizontal Analysis Vertical Analysis 2011 2010 Increase (Decrease) 2011 2010 (In Thousands) (Percentages)
REVENUE Sale of real estate and club shares P=520,176 P=1,163,986 (P=643,810) -55.3% 74.7% 92.2% Lease income 62,070 - 62,070 100.0% 8.9% 0.0% Others 114,275 99,137 15,138 15.3% 16.4% 7.8% 696,521 1,263,123 (566,602) -44.9% 100.00% 100.0%COST OF REAL ESTATE AND CLUB SHARES (235,983) (508,979) (272,996) -53.6% -33.9% -40.3%GENERAL AND ADMINISTRATIVE ExPENSES (235,158) (221,431) 13,727 6.2% -33.8% -17.5%INTEREST ExPENSE (158,160) (191,353) (33,193) -17.3% -22.7% -15.1%EQUITY IN NET EARNINGS OF ASSOCIATES 140,484 156,184 (15,700) -10.1% 20.2% 12.4%NET FOREIGN ExCHANGE GAIN 270 51,522 (51,252) -99.5% 0.0% 4.1%INTEREST INCOME 28,498 3,556 24,942 701.4% 4.1% 0.3%OTHER CHARGES - Net (12,910) (10,600) 2,310 21.8% -1.9% -0.8%INCOME BEFORE INCOME TAx 223,562 542,022 (318,460) -58.8% 32.1% 42.9%PROVISION FOR INCOME TAx Current 15,972 49,006 (33,034) -67.4% 2.3% 3.9% Deferred 7,130 27,548 (20,418) -74.1% 1.0% 2.2% 23,102 76,554 (53,452) -69.8% 3.3% 6.1%NET INCOME 200,460 465,468 (265,008) -56.9% 28.8% 36.9%Net profit attrbutable to: Equity holders of the parent 200,517 465,535 (265,018) -56.9% 28.8% 36.9% Non-controlling interests (57) (67) (10) -14.9% 0.0% 0.0% P=200,460 P=465,468 (P=265,008) -56.9% 28.8% 36.9%
DECEMBER 31, 2011 vs DECEMBER 31, 2010 RESULTS OF OPERATIONS (Table 1)
Net Foreign Exchange GainWith the exchange rate of the Philippine Peso against the US Dollar to P=43.84:US$1.00 as of December 31, 2011 and 2010, the Company posted a minimal P=0.3 million foreign exchange translation gain from its foreign currency deposits. While in 2010, the foreign exchange translation gain amounted to P=51.5 million.
Provision for Income TaxCurrent provision for income tax was lower by P=33.0 million (67%) in 2011 due to lower sales in real estate and club shares.
Deferred income tax decreased by P=20.4 million (74%) in 2011 mainly due to recognition of deferred income tax assets on MCIT and NOLCO amounting to P=10.7 million and P=6.1 million, respectively.
Net IncomeAs a result of the foregoing, Belle Corporation realized consolidated net income of P=200.5 million for the year ended December 31, 2011. This is P=265.0 million (57%) lower than the consolidated net income of P=465.5 million for the year ended December 31, 2010. Moreover, the Company’s consistent profitability has allowed it to post positive consolidated retained earnings of P=338.2 million as of December 31, 2011.
13 Annual Repor t 2011 Belle Corporation
ManageMent discUssion and analYsis of oPerating PerforMance and financial condition

ASSETS
Total assets of the Company increased by P=12,115.4 million (115%), to P=22,643.5 million as of December 31, 2011, from P=10,528.1 million as of December 31, 2010, due to the increases in cash and cash equivalents, value of investments, subscription receivable from stock rights offering and acquisition of intangible assets.
Cash and cash equivalentsCash and cash equivalents increased by P=2,725.8 million to (6,640%) P=2,766.9 million in 2011 from P=41.1 million in 2010, due mostly to (i) subscription payments received from stockholders under the Company’s stock rights offering in September 2011 of P=977.0 million (ii) net proceeds from loans and long-term debt of P=2,751.0 million million (iii) cash generated from operations of P=417.7 million. The increases in cash and cash equivalents were offset by the expenditures for the construction of Belle Grande of P=1,940.9 million, an integrated resort complex to be located
TABLE 2: Horizontal Analysis Vertical Analysis December Increase (Decrease) 2011 2010 Amount % 2011 2010 (In Thousands) (Percentages)
ASSETSCash and Cash Equivalents P=2,766,880 P=41,052 P=2,725,828 6639.9% 12.2% 0.4%Short-term Investments 9,668 - 9,668 100.0% 0.0% 0.0%Receivables 930,124 1,116,402 (186,278) -16.75 4.1% 10.6%Subscription Receivables 2,082,920 - 2,082,920 100.0% 9.2% 0.0%Real Estate for Sale - at cost 3,036,153 3,012,896 23,257 0.8% 13.4% 28.6%Club Shares - at cost 2,786,148 2,816,442 (30,294) -1.1% 12.3% 26.8%Investments in and Advances to Associates 2,118,166 2,050,882 67,284 3.3% 9.4% 19.5%Available-for-sale Investments 22,336 13,751 8,585 62.4% 0.1% 0.1%Advances to Related Parties - net 457,764 449,958 7,806 1.7% 2.0% 4.3%Investment Properties under Construction 2,434,194 493,245 1,940,949 393.5% 10.8% 4.7%Property and Equipment 175,599 178,458 (2,859) -1.6% 0.8% 1.7%Intangible Asset 5,261,186 - 5,261,186 100.0% 23.2% 0.0%Other Assets 562,390 354,970 207,420 58.4% 2.5% 3.4% P=22,643,528 P=10,528,056 P=12,115,472 115.1% 100.0% 100.0%
LIABILITIES AND EQUITYLiabilitiesLoans payable P=2,155,857 P=1,743,069 P=412,788 23.7% 9.5% 16.6%Accounts payable and other liabilities 1,750,935 1,547,077 203,858 13.2% 7.7% 14.7%Income tax payable 8,258 - 8,258 100.0% 0.0% 0.0%Long-term debt 2,559,584 964,993 1,594,591 165.2% 11.3% 9.2%Pension liability 8,354 11,262 (2,908) -25.8% 0.0% 0.1%Deferred tax liabilities - net 85,468 78,338 7,130 9.1% 0.4% 0.7%Assignment of receivables with recourse - 5,027 (5,027) -100.0% 0.0% 0.0% Total Liabilities 6,568,456 4,349,766 2,218,690 51.1% 29.0% 41.3%
EquityAttributable to equity holders of the parent: Preferred stock - issued 1,000,000 1,000,000 - 0.0% 4.4% 9.5% Common stock - issued 9,170,770 6,350,900 2,819,870 44.45 40.5% 60.3% Common stock - subscribed 1,388,613 - 1,388,613 100.0% 6.1% 0.0% Additional paid-in capital 5,503,731 - 5,503,731 100.0% 24.3% 0.0% Equity share in cost of Parent Company shares held by associates (731,696) (731,696) - 0.0% -3.2% -6.9% Cost of Parent Company common shares held by subsidiaries (497,758) (497,758) - 0.0% -2.2% -4.7% Unrealized loss on available-for-sale investments 8,585 - 8,585 100.0% 0.0% 0.0% Retained earnings 338,243 137,726 200,517 145.6% 1.5% 1.3% Other reserves (52,369) (27,892) (24,477) 87.8% -0.2% -0.3%Total Equity Attributable to Equity Holders of the Parent 16,128,119 6,231,280 9,896,839 158.8% 71.2% 59.2%Non-controlling interests (53,047) (52,990) 57 0.1% -0.2% -0.5% Total Equity 16,075,072 6,178,290 9,896,782 160.2% 71.0% 58.7% P=22,643,528 P=10,528,056 P=12,115,472 115.1% 100.0% 100.0%
on approximately 6.2 hectares of land (of which 4.2 hectares are owned by the Company) along Roxas Boulevard in Parañaque City.
ReceivablesReceivables decreased by P=186.3 million (17%), to P=930.1 million in 2011 from P=1,116.4 million in 2010, the reduction was mainly due to collection of trade receivables.
Real Estate for Sale and Club SharesReal estate for sale increased by P=23.3 million (1%), to P=3,036.2 million in 2011 from P=3,012.9 million in 2010, due to the development of raw lands for various projects.
Club shares held by the Company, valued at historical cost, decreased by P=30.3 million (1%), to P=2,786.1 million in 2011 from P=2,816.4 million in 2010 due to sales made in 2011.
DECEMBER 31, 2011 vs DECEMBER 31, 2010 STATEMENT OF FINANCIAL POSITION (Table 2)
Belle Corporation Annual Repor t 201114
ManageMent discUssion and analYsis of oPerating PerforMance and financial condition

Investments in and Advances to AssociatesInvestments and advances increased by P=67.3 million (3%), to P=2,118.2 million in 2011 from P=2,050.9 million in 2010, due mainly to equity in net earnings of associates for the year.
Investment propertiesInvestment properties increased by P=1,941.0 million (394%), from P=493.2 million as of December 31, 2010 to P=2,434.2 million as of December 31, 2011, due mainly to the continuing construction of Belle Grande.
Intangible AssetIntangible asset increased by P=5,261.2 million (100%) of December 31, 2011, from nil as of December 31, 2010, due mainly to the acquisition of PLAI, a grantee by the Philippine Amusement and Gaming Corporation (PAGCOR) of a license to operate integrated resorts, including casinos.
On April 14, 2011, Belle has issued 2.7 billion new common shares valued at P=1.95 per share in exchange for 100% of the outstanding capital stock of PLAI.
LIABILITIES
Total liabilities increased by P=2,218.7 million (51%) to P=6,568.5 million as of December 31, 2011, from P=4,349.8 million as of December 31, 2010, due to borrowings for the construction of Belle Grande.
Loans Payable and Long-Term DebtTotal debt amounting to P=4,715.4 million in 2011 were comprised mostly of Peso loans from various local financial institutions, with interest at an approximate range of 7.0% to 7.5% per annum amounting to P=2,155.9 million, foreign-currency denominated Floating Rate Notes (“FRNs”), with a peso equivalent amounting to P=965.0 million and new peso long-term debt of P=1,594.6 million. The FRNs have a principal amount of US$22 million due on May 10, 2014 and carry interest at 2% per annum above the six-month LIBOR.
Total debt increased by P=2,007.3 million (74%), from P=2,708.1 million in 2010 to P=4,715.4 million in 2011, due to the availment of new peso long-term loans for the construction of Belle Grande.
Accounts payable and other liabilitiesAccounts payable and other liabilities increased by P=203.8 million (13%), to P=1,750.9 million in 2011 compared to P=1,547.1 million in 2010. Comprising accounts payable and other liabilities are principally trade payables of P=750.6 million, advances from related parties of P=214.6 million, accrued expenses of P=418.0 million, non-trade payables of P=332.5 million and customers’ deposits of P=35.2 million in 2011. The increase in the accounts payable and other liabilities is attributed to the construction of Belle Grande.
EQUITY
The Company’s equity as of December 31, 2011 of P=16,075.1 million was higher by P=9,896.8 million compared to the year-end 2010 level of P=6,178.3 million, due to: (i) the net income for 2011; (ii) the issuance of 2.7 billion new common shares for the acquisition of PLAI in April 2011 and (iii) the issuance and subscription of 1.5 billion new common shares in September 2011 as a result of the Company’s stock rights offering. The issuances and subscription of these new common shares also resulted in additional paid-in-capital of P=5,503.7 million as of December 31, 2011. Due to its consistent profitability, the Company had consolidated retained earnings of P=338.2 million as of December 31, 2011, compared to consolidated retained earnings of P=137.7 million as of December 31, 2010.
Below are the comparative key performance indicators of the Company and its subsidiaries:
Dec 31, 2011 (audited)
Dec 31, 2010 (audited)
Asset-to-equity ratio Total assets over stockholders’ equity 1.41 : 1.00 1.70 : 1.00
Current or Liquidity Ratio
Current assets over current liabilities 3.17 : 1.00 2.27 : 1.00
Debt-to-equity ratio Interest-bearing debt over stockholders’ equity 0.29 : 1.00 0.44 : 1.00
Net debt-to-equity ratio
Interest-bearing debt less cash and cash equivalents over stockholders’ equity
0.12 : 1.00 0.43 : 1.00
Interest rate coverage ratio EBIT over interest expense 2.41 : 1.00 3.83 : 1.00
Return on assets Net income over average total assets during the period 1.2% 4.5%
Return on equityNet income over average stockholders’ equity during the period
1.8% 7.8%
The Company does not foresee any cash flow or liquidity problems over the next twelve months. The P=2,155.9 million of debt obligations classified as loans payable have historically been mostly renewed or rolled-over, while the P=1,594.6 million long-term debt from the P=5.6 billion project finance facility from Banco de Oro Unibank for the Belle Grande project, will be amortized over a 5-year period starting December 2012. The Company’s FRN of P=965.0 million is due on May 10, 2014. Aside from the planned Belle Grande integrated resort project, Belle also has a number of revenue-generating real estate projects in the pipeline to enhance cash flow. Meanwhile, the Company continues to be in compliance with the terms of all of its debt obligations.
As of December 31, 2011, except for what has been noted in the preceding, there were no material events or uncertainties known to management that had a material impact on past performance, or that would have a material impact on the future operations, in respect of the following:
• Known trends,demands,commitments,eventsoruncertainties thatwouldhaveamaterialimpact on the Company;
• Material commitments for capital expenditures that are reasonably expected to have amaterial impact on the Company’s short-term or long-term liquidity;
• Knowntrends,eventsoruncertaintiesthathavehadorthatarereasonablyexpectedtohavea material favorable or unfavorable impact on net sales/revenues/income from continuing operations;
• Significant elements of income or loss that did not arise from the Company’s continuingoperations;
• SeasonalaspectsthathadamaterialimpactontheCompany’sresultsofoperations;and
• Material changes in the financial statements of the Company from the year ended December 31, 2010 to December 31, 2011.
REVENUES
Gross revenue for 2010 of P=1,263.1 million was lower by P=140.0 million (10%), compared to P=1,403.2 million during 2009. Gross profit as of December 2010 of P=754.1 million was also lower than gross profit as of December 2009 of P=836.9 million by P=82.8 million (10%), due to the lower revenues. However, the gross profit margin during 2010 of 59% was higher compared to 56% in 2009. This is due to the greater proportion in the 2010 revenue mix of Cotswold, which had a project gross margin of 62% and comprised 25% of 2010 gross revenues (compared to 10% of gross revenues in 2009) and Fairfield, which had a project gross margin of 65% and comprised 11% of 2010 gross revenues (compared to 3% in 2009). In contrast, a combined 27% of gross revenues in 2009 were comprised of Lakeside Fairways Phases 1- 5 (with an average project gross margin of 49% and a proportion to gross revenues of 12%) and Katsura (with a project gross margin of 50% and a proportion to gross revenues of 15%).
Cost of Real Estate and Club Shares SoldThe decrease of P=57.3 million (10%) in the cost of real estate and club shares sold from P=566.3 million in 2009 to P=509.0 follows the level of decrease in the sales of real estate and club shares.
General and Administrative ExpensesThe decrease of P=84.0 million (28%) in 2010 is mainly caused by the reduction in marketing and
advertising expense. It is partially offset by increased expenditures on professional fees and repairs and maintenance.
Equity in Net Earnings of AssociatesThe Company’s equitized net earnings from associated companies increased by P=38.3 million (32%) to P=156.2 million in 2010, from P=117.9 million in 2009. Equitized earnings were mainly from its 36%-owned associate, Highlands Prime, Inc. (HPI) and from its 35%-owned associate, Pacific Online Systems Corporation (Pacific Online). HPI is also engaged in real estate development within the Tagaytay Highlands and Midlands complexes, while Pacific Online leases on-line equipment to the Philippine Charity Sweepstakes Office for their lottery operations in the Visayas and Mindanao.
Financial Income (Expense)Interest expense decreased by P=15.7 million (8%), to P=191.4 million, from P=207.1 million in 2009 due to lower interest rates.
Foreign Exchange GainWith the appreciation of the Philippine Peso against the US Dollar to P=43.84:US$1.00 as of December 31, 2010, from P=46.20:US$1.00 as of December 31, 2009, the Company posted a P=51.5 million foreign exchange translation gain in 2010 from its US$22 million US Dollar-denominated debt, compared to a foreign exchange translation gain of P=28.9 million in 2009.
DECEMBER 31, 2010 VERSUS DECEMBER 31, 2009 RESULTS OF OPERATIONS (Table 3)
15 Annual Repor t 2011 Belle Corporation

TABLE 3: Year Ended December 31 Horizontal Analysis Vertical Analysis 2010 2009 Increase (Decrease) 2010 2009 (In Thousands) (Percentages)
REVENUE Sale of real estate and club shares P=1,163,986 P=1,259,814 (P=95,828) -7.6% 92.2% 89.8% Others 99,137 143,342 (44,205) -30.8% 7.8% 10.2% 1,263,123 1,403,156 (140,033) -10.0% 100.00% 100.0%COST OF REAL ESTATE AND CLUB SHARES (508,979) (566,300) (57,321) -10.1% -40.3% -40.4%GENERAL AND ADMINISTRATIVE ExPENSES (221,431) (305,421) (83,990) -27.5% -17.5% -21.8%INTEREST ExPENSE (191,353) (207,062) (15,709) -7.6% -15.1% -14.8%EQUITY IN NET EARNINGS OF ASSOCIATES 156,184 117,901 38,283 32.5% 12.4% 8.4%NET FOREIGN ExCHANGE GAIN 51,522 28,883 22,639 78.4% 4.1% 2.1%INTEREST INCOME 3,556 2,780 776 27.9% 0.3% 0.2%OTHER CHARGES - Net (10,600) (14,212) (3,612) -25.4% -0.8% -1.0%INCOME BEFORE INCOME TAx 542,022 459,725 82,297 17.9% 42.9% 32.8%PROVISION FOR INCOME TAx Current 49,006 80,579 (31,573) -39.2% 3.9% 5.7% Deferred 27,548 (6,685) 34,233 -512.1 2.2% -0.5% 76,554 73,894 2,660 3.6% 6.1% 5.3%NET INCOME 465,468 385,831 79,637 20.6% 36.9% 27.5%
Net profit attrbutable to: Equity holders of the parent 465,535 385,917 79,618 20.6% 36.9% 27.5% Non-controlling interests (67) (86) (19) -22.1% 0.0% 0.0% P=465,468 P=385,831 P=79,637 20.6% 36.9% 27.5%
Net IncomeBelle Corporation realized consolidated net income of P=465.5 million for the year ended December 31, 2010. This is P=79.7 million (21%) higher than the consolidated net income of P=385.8 million for the year ended December 31, 2009. Moreover, the Company’s consistent and substantial profitability has allowed it to post positive consolidated retained earnings of
P=137.7 million as of December 31, 2010. The Company’s consolidated retained earnings became positive for the first time since 1998, wiping out a consolidated deficit that peaked at P=5.8 billion as of December 31, 2001.
DECEMBER 31, 2010 VS DECEMBER 31, 2009 STATEMENT OF FINANCIAL POSITION (Table 4)
ASSETS
Total assets of the Company increased by P=554.6 million (6%), to P=10,528.1 million as of December 31, 2010, from P=9,973.5 million as of December 31, 2009, due mainly to the increases of the investments in advances and advances to associates and investment properties.
Cash and cash equivalentsCash and cash equivalents decreased by P=45.3 million (52%), to P=41.1 million from P=86.4 million in 2009. The decreases were mainly accounted for by the expenditure for the construction of investment properties (P=493.2 million) and payment of interest expense (P=189.0 million). The decreases in cash and cash equivalents were offset by the cash generated from operations of P=458.1 million.
ReceivablesReceivables decreased by P=108.6 million (9%), to P=1,116.4 million in 2010 from P=1,225.0 million in 2009, due to collection of trade receivables.
Real estate for sale and Club SharesReal estate for sale increased by P=77.0 million (3%), to P=3,012.9 million in 2010 from P=2,935.9 million in 2009, due to the development of raw lands for various projects.
Club shares held by the Company, valued at historical cost, increased by P=22.3 million (1%), to P=2,816.4 million in 2010 from P=2,794.1 million in 2009.
Investments in and advances to AssociatesInvestments in and advances to associates increased by P=119.0 million (6%), to P=2,050.9 million in 2010 from P=1,931.9 million in 2009, due mainly to equity in net earnings of associates for the year.
Investment properties and Property and EquipmentInvestment properties and property and equipment increased by P=500.3 million (292%), from P=171.4 million as of December 31, 2009 to P=671.7 million as of December 31, 2010, due mainly to the construction cost of the “Belle Grande Manila Bay”, an integrated resort complex located along Roxas Boulevard in Parañaque City.
LIABILITIES
Total liabilities increased by P=76.2 million (2%) to P=4,349.8 million as of December 31, 2010, from P=4,273.6 million as of December 31, 2009.
Loans Payable and Long-Term DebtTotal debt amounting to P=2,708.1 million were comprised mostly of Peso loans from various local financial institutions, with interest at an approximate range of 7.0% to 7.5% per annum, with the total of such Peso loans amounting to P=1,743.1 million, and which are predominantly secured. Foreign-currency denominated debt (Floating Rate Notes), with a Peso equivalent amounting to P=965.0 million as of December 31, 2010, comprise the balance of Belle’s total debt. The Floating Rate Notes have a principal amount of US$22 million due on May 10, 2014 and carry interest at 2% per annum above the six-month LIBOR. Total debt increased by P=145.3 million (6%), from P=2,562.8 million in 2009 to P=2,708.1 million in 2010. The increase was due mainly to the availment of new peso loans.
Accounts payable and other liabilitiesAccounts payable and other liabilities decreased by P=80.7 million (5%), to P=1,547.1 million in 2010 compared to P=1,627.8 million in 2009. Comprising accounts payable and other liabilities are principally trade payables of P=558.9 million, advances from related parties of P=212.7 million, accrued expenses of P=411.9 million, non-trade payables of P=316.6 million and customers’ deposits of P=47.0 million.
EQUITY
The Company’s equity as of December 31, 2010 of P=6,178.3 million was higher by P=478.4 million (8%) compared to the year-end 2009 level of P=5,699.9 million, due mainly to the net income recorded for 2010. Due to its consistent profitability since 2002, the Company attained consolidated retained earnings of P=137.7 million as of December 31, 2010, compared to a consolidated deficit of P=327.8 million as of December 31, 2009.
Belle Corporation Annual Repor t 201116

TABLE 4: Horizontal Analysis Vertical Analysis December Increase (Decrease) 2010 2009 Amount % 2010 2009 (In Thousands) (Percentages)
ASSETSCash and Cash Equivalents P=41,052 P=86,382 (P=45,330) -52.5% 0.4% 0.9%Receivables - net 1,116,402 1,225,046 (108,644) -8.9% 10.6% 12.3%Real Estate for Sale - at cost 3,012,896 2,935,901 76,995 2.6% 28.6% 29.4%Club Shares - at cost 2,816,442 2,794,066 22,376 0.8% 26.8% 28.0%Investments in and Advances to Associates 2,050,882 1,931,885 118,997 6.2% 19.5% 19.4%Available-for-sale Investments 13,751 13,014 737 5.7% 0.1% 0.1%Advances to Related Parties - net 449,958 460,342 (10,384) -2.3% 4.3% 4.6%Investment Properties 493,245 - 493,245 100.0% 4.7% 0.0%Property and Equipment - net 178,458 171,364 7,094 4.1% 1.7% 1.7%Other Assets - net 354,970 355,462 (492) -0.1% 3.4% 3.6% P=10,528,056 P=9,973,462 P=554,594 5.6% 100.0% 100.0%LIABILITIES AND EQUITYLiabilitiesLoans payable P=1,743,069 P=1,545,828 P=197,241 12.8% 16.6% 15.5%Accounts payable and other liabilities 1,547,077 1,627,774 (80,697) -5.0% 14.7% 16.3%Long-term debt 964,993 1,016,941 (51,948) -5.1% 9.2% 10.2%Assignment of receivables with recourse 5,027 16,417 (11,390) -69.4% 0.0% 0.2%Pension liability 11,262 14,093 (2,831) -20.1% 0.1% 0.1%Obligations under finance lease - 1,720 (1,720) -100.0% 0.0% 0.0%Deferred tax liabilities - net 78,338 50,970 27,548 54.2% 0.7% 0.5% Total Liabilities 4,349,766 4,273,563 76,203 1.8% 41.3% 42.8%EquityAttributable to equity holders of the parent: Preferred stock - issued 1,000,000 1,000,000 - 0.0% 9.5% 10.0% Common stock - issued 6,350,900 6,350,900 - 0.0% 60.3% 63.7% Equity share in cost of Parent Company shares held by associates (731,696) (731,696) - 0.0% -6.9% -7.3% Additional paid-in capital 5,503,731 - 5,503,731 100.05 24.35 0.0% Cost of Parent Company common shares held by subsidiaries (497,758) (497,758) - 0.0% -4.7% -5.0% Retained earnings (Deficit) 137,726 (327,809) 465,535 -142.0% 1.3% -3.3% Other reserves (27,892) (40,815) 12,923 -31.7% -0.3% -0.4%Total Equity Attributable to Equity Holders of the Parent 6,231,280 5,752,822 478,458 8.3% 59.2% 57.7%Non-controlling interests (52,990) (52923) (67) 0.1% -0.5% -0.5% Total Equity 6,178,290 5,699,899 478,391 8.4% 58.7% 57.2% P=10,528,056 P=9,973,462 P=554,594 5.6% 100.0% 100.0%
Below are the comparative key performance indicators of the Company and its subsidiaries:
Dec 31, 2010(audited)
Dec 31, 2009(audited)
Asset-to-equity ratio
Total assets over stockholders’ equity 1.70 : 1.00 1.75 : 1.00
Current or Liquidity Ratio
Current assets over current liabilities 2.27 : 1.00 2.36 : 1.00
Debt-to-equity ratio
Interest-bearing debt over stockholders’ equity 0.44 : 1.00 0.45 : 1.00
Net debt-to-equity ratio
Interest-bearing debt less cash and cash equivalents over stockholders’ equity
0.43 : 1.00 0.43 : 1.00
Interest rate coverage ratio
EBIT over interest expense 3.83 : 1.00 3.22 : 1.00
Return on assets Net income over average total assets during the period 4.5% 3.9%
Return on equityNet income over average stockholders’ equity during the period
7.8% 7.0%
The Company does not foresee any cash flow or liquidity problems over the next twelve months. The P=1,743.1 million of debt obligations classified as loans payable have historically been mostly renewed or rolled-over, with Belle paying only interest. Belle has also a number of revenue-generating real estate projects in the pipeline to enhance cash flow. The Company is in compliance with all of its debt obligations.
As of December 31, 2010, except for what has been noted in the preceding, there were no material events or uncertainties known to management that had a material impact on past performance, or that would have a material impact on the future operations, in respect of the following:
• Known trends,demands,commitments,eventsoruncertainties thatwouldhaveamaterialimpact on the Company;
• Material commitments for capital expenditures that are reasonably expected to have amaterial impact on the Company’s short-term or long-term liquidity;
• Knowntrends,eventsoruncertaintiesthathavehadorthatarereasonablyexpectedtohavea material favorable or unfavorable impact on net sales/revenues/income from continuing operations;
• Significant elements of income or loss that did not arise from the Company’s continuingoperations;
• SeasonalaspectsthathadamaterialimpactontheCompany’sresultsofoperations;and
• MaterialchangesinthefinancialstatementsoftheCompanyfromtheyearendedDecember31, 2009 to December 31, 2010.
17 Annual Repor t 2011 Belle Corporation

February 22, 2012
SECURITIES AND EXCHANGE COMMISSIONSEC Building, EDSA GreenhillsMandaluyong City, Metro Manila
The management of Belle Corporation and Subsidiaries is responsible for the preparation and fair presentation of the consolidated financial statements for the years ended December 31, 2011 and 2010, including the additional components attached therein, in accordance with Philippine Financial Reporting Standards. This responsibility includes designing and implementing internal controls relevant to the preparation and fair presentation of the consolidated financial statements that are free from material misstatement, whether due to fraud or error, selecting and applying appropriate accounting policies, and making accounting estimates that are reasonable in the circumstances.
The Board of Directors reviews and approves the consolidated financial statements and submits the same to the stockholders.
SyCip Gorres Velayo & Co., the independent auditors, appointed by the stockholders has examined the consolidated financial statements of the Company in accordance with Philippine Standards on Auditing, and in its report to the stockholders, has expressed its opinion on the fairness of presentation upon completion of such examination.
BENITO TAN GUATChairman of the Board
ROGELIO R. CABUÑAGPresident
MANUEL A. GANAExecutive Vice President and Chief Financial Officer
Belle Corporation Annual Repor t 201118
stateMent of ManageMent’s resPonsiBilitY for consolidated financial stateMents
The Stockholders and the Board of DirectorsBelle Corporation
We have audited the accompanying consolidated financial statements of Belle Corporation and Subsidiaries, which comprise the consolidated statements of financial position as at December 31, 2011 and 2010, and the consolidated statements of comprehensive income, statements of changes in equity and statements of cash flows for each of the three years in the period ended December 31, 2011, and a summary of significant accounting policies and other explanatory information.
Management’s Responsibility for the Consolidated Financial Statements
Management is responsible for the preparation and fair presentation of these consolidated financial statements in accordance with Philippine Financial Reporting Standards, and for such internal control as management determines is necessary to enable the preparation of consolidated financial statements that are free from material misstatement, whether due to fraud or error.
Auditors’ Responsibility
Our responsibility is to express an opinion on these consolidated financial statements based on our audits. We conducted our audits in accordance with Philippine Standards on Auditing. Those standards require that we comply with ethical requirements and plan and perform the audit to obtain reasonable assurance about whether the consolidated financial statements are free from material misstatement.
An audit involves performing procedures to obtain audit evidence about the amounts and disclosures in the consolidated financial statements. The procedures selected depend on the auditor’s judgment, including the assessment of the risks of material misstatement of the consolidated financial statements, whether due to fraud or error. In making those risk assessments, the auditor considers internal control relevant to the entity’s preparation and fair presentation of the consolidated financial statements in order to design audit procedures that are appropriate in the circumstances, but not for the purpose of expressing an opinion on the effectiveness of the entity’s internal control. An audit also includes evaluating the appropriateness of accounting policies used and the reasonableness of accounting estimates made by management, as well as evaluating the overall presentation of the consolidated financial statements.
We believe that the audit evidence we have obtained is sufficient and appropriate to provide a basis for our audit opinion.
Opinion
In our opinion, the consolidated financial statements present fairly, in all material respects, the financial position of Belle Corporation and Subsidiaries as at December 31, 2011 and 2010, and their financial performance and their cash flows for each of the three years in the period ended December 31, 2011 in accordance with Philippine Financial Reporting Standards.
SYCIP GORRES VELAYO & CO.
ROEL E. LUCASPartnerCPA Certificate No. 98200SEC Accreditation No. 1079-A (Group A), February 3, 2011, valid until February 2, 2014Tax Identification No. 191-180-015BIR Accreditation No. 08-001998-95-2011, February 4, 2011, valid until February 3, 2014PTR No. 3174806, January 2, 2012, Makati City
February 22, 2012
19 Annual Repor t 2011 Belle Corporation
indePendent aUditor’s rePort

Belle Corporation Annual Repor t 201120
consolidated stateMents of financial Position (amounts in thousands)
December 31 2011 2010ASSETS Cash and Cash Equivalents (Notes 8, 28, 32 and 33) P=2,766,880 P=41,052Short-term Investments (Notes 8, 28, 32 and 33) 9,668 –Receivables (Notes 9, 28, 32 and 33) 930,124 1,116,402Subscription Receivables (Notes 20 and 33) 2,082,920 –Real Estate for Sale - at cost (Notes 10, 17, 18 and 33) 3,036,153 3,012,896Club Shares - at cost (Notes 11, 17, 28 and 33) 2,786,148 2,816,442Investments in and Advances to Associates - net (Notes 12, 17, 19, 20, 28, 32 and 33) 2,118,166 2,050,882Available-for-sale Investments (Notes 13 and 32) 22,336 13,751Advances to Related Parties - net (Notes 28, 32 and 33) 457,764 449,958Investment Properties under Construction (Notes 14, 26 and 29) 2,434,194 493,245Property and Equipment (Notes 15 and 22) 175,599 178,458Intangible Asset (Notes 16, 29 and 34) 5,261,186 –Other Assets (Notes 19 and 26) 562,390 354,970 P=22,643,528 P=10,528,056
LIABILITIES AND EQUITY Liabilities Loans payable (Notes 10, 11, 12, 13, 17, 28, 32 and 33) P=2,155,857 P=1,743,069Accounts payable and other liabilities (Notes 10, 18, 28, 32 and 33) 1,750,935 1,547,077Income tax payable 8,258 –Long-term debt (Notes 19, 28 and 32) 2,559,584 964,993Pension liability (Note 27) 8,354 11,262Deferred tax liabilities - net (Note 25) 85,468 78,338 Assignment of receivables with recourse (Notes 9, 28, 32 and 33) – 5,027 Total Liabilities 6,568,456 4,349,766Equity Attributable to equity holders of the parent: Preferred stock - issued (Notes 20 and 28) 1,000,000 1,000,000 Common stock (Note 20): Issued 9,170,770 6,350,900 Subscribed 1,388,613 – Additional paid-in capital (Notes 16 and 20) 5,503,731 – Equity share in cost of Parent Company shares held by associates (Notes 12 and 20) (731,696) (731,696) Cost of Parent Company common shares held by subsidiaries (Note 20) (497,758) (497,758) Unrealized gain on available-for-sale investments (Note 13) 8,585 – Retained earnings (Note 20) 338,243 137,726 Other reserves (Note 12) (52,369) (27,892) Total Equity Attributable to Equity Holders of the Parent 16,128,119 6,231,280Non-controlling interests (53,047) (52,990) Total Equity 16,075,072 6,178,290 P=22,643,528 P=10,528,056 See accompanying Notes to Consolidated Financial Statements.

21 Annual Repor t 2011 Belle Corporation
consolidated stateMents of coMPrehensiVe incoMe (amounts in thousands, except Per share amounts)
Years Ended December 31 2011 2010 2009REVENUE Sale of real estate and club shares (Note 28) P=520,176 P=1,163,986 P=1,259,814Lease income (Note 29) 62,070 – –Others (Notes 9 and 21) 114,275 99,137 143,342 696,521 1,263,123 1,403,156COST OF REAL ESTATE AND CLUB SHARES SOLD (Note 22) (235,983) (508,979) (566,300)GENERAL AND ADMINISTRATIVE ExPENSES (Notes 15, 22, 26, 27 and 28) (235,158) (221,431) (305,421)INTEREST ExPENSE (Notes 9, 17, 19, 23 and 28) (158,160) (191,353) (207,062)EQUITY IN NET EARNINGS OF ASSOCIATES (Note 12) 140,484 156,184 117,901INTEREST INCOME (Notes 8, 9, 23 and 28) 28,498 3,556 2,780NET FOREIGN ExCHANGE GAIN 270 51,522 28,883OTHER CHARGES - Net (Notes 9, 12, 13, 15, 24 and 28) (12,910) (10,600) (14,212)INCOME BEFORE INCOME TAx 223,562 542,022 459,725PROVISION FOR (BENEFIT FROM) INCOME TAx (Note 25) Current 15,972 49,006 80,579Deferred 7,130 27,548 (6,685) 23,102 76,554 73,894
NET INCOME (Note 31) 200,460 465,468 385,831
OTHER COMPREHENSIVE INCOME (LOSS) Unrealized gain (loss) on available-for-sale investments of associates (Note 12) (24,477) 12,923 (21,721)Unrealized gain on available-for-sale investments (Note 13) 8,585 – – (15,892) 12,923 (21,721)TOTAL COMPREHENSIVE INCOME FOR THE YEAR P=184,568 P=478,391 P=364,110Net profit attributable to: Equity holders of the parent (Note 31) P=200,517 P=465,535 P=385,917 Non-controlling interests (57) (67) (86) P=200,460 P=465,468 P=385,831Total comprehensive income attributable to: Equity holders of the parent P=184,625 P=478,458 P=364,196 Non-controlling interests (57) (67) (86) P=184,568 P=478,391 P=364,110Basic/Diluted Earnings Per Share (Note 31) P=0.023 P=0.075 P=0.062 See accompanying Notes to Consolidated Financial Statements.

Belle Corporation Annual Repor t 201122
consolidated stateMents of changes in eQUitY (amounts in thousands)
for the Years ended december 31, 2011, 2010 and 2009
Attributable to Equity Holders of the Parent Attributable to Equity Holders of the Parent Other Reserves Equity Share Share in in Cost Cost of Unrealized of Parent Parent Unrealized Share in Gain (Loss) on Company Company Gain on Cumulative Available- Preferrred Additional Shares Held Common Available- Translation for-Sale Retained Stock Common Paid-in by Associates Share Held for-Sale Adjustments of Investments Earnings (Notes 20 Stock Capital (Notes 12 by Subsidiaries Investments an Associate of Associates (Deficit) Non-controlling and 28) (Note 20) (Note 20) and 20) (Note 20) (Note 13) (Note 12) (Note 12) (Note 20) Total Interests Total EquityBalance at December 31, 2010 P=1,000,000 P=6,350,900 P=– (P=731,696) (P=497,758) P=– (P26,393) (P=1,499) P=137,726 P=6,231,280 (P=52,990) P=6,178,290Issuance during the year – 2,819,870 2,776,140 – – – – – – 5,596,010 – 5,596,010Subscriptions during the year – 1,388,613 2,727,591 – – – – – – 4,116,204 – 4,116,204Net income – – – – – – – – 200,517 200,517 (57) 200,460Other comprehensive income (loss) – – – – – 8,585 – (24,477) – (15,892) – (15,892)Total comprehensive income for the year (loss) – – – – – 8,585 – (24,477) 200,517 184,625 (57) 184,568Balance at December 31, 2011 P=1,000,000 P=10,559,383 P=5,503,731 (P=731,696) (P=497,758) P=8,585 (P=26,393) (P=25,976) P=338,243 P=16,128,119 (P=53,047) P=16,075,072
Balance at December 31, 2009 P=1,000,000 P=6,350,900 P=– (P=731,696) (P=497,758) P=– (P=26,393) (P=14,422) (P=327,809) P=5,752,822 (P=52,923) P=5,699,899Net income – – – – – – – – 465,535 465,535 (67) 465,468Other comprehensive income – – – – – – – 12,923 – 12,923 – 12,923Total comprehensive income for the year – – – – – – – 12,923 465,535 478,458 (67) 478,391Balance at December 31, 2010 P=1,000,000 P=6,350,900 P=– (P=731,696) (P=497,758) P=– (P=26,393) (P=1,499) P=137,726 P=6,231,280 (P=52,990) P=6,178,290
Balance at December 31, 2008 P=1,000,000 P=6,350,900 P=– (P=731,696) (P=497,758) P=– (P=26,393) P=7,299 (P=713,726) P=5,388,626 (P=52,837) P=5,335,789Net income – – – – – – – – 385,917 385,917 (86) 385,831Other comprehensive loss – – – – – – – (21,721) – (21,721) – (21,721)Total comprehensive income (loss) for the year – – – – – – – (21,721) 385,917 364,196 (86) 364,110Balance at December 31 , 2009 P=1,000,000 P=6,350,900 P=– (P=731,696) (P=497,758) P=– (P=26,393) (P=14,422) (P=327,809) P=5,752,822 (P=52,923) P=5,699,899
See accompanying Notes to Consolidated Financial Statements.

23 Annual Repor t 2011 Belle Corporation
Attributable to Equity Holders of the Parent Attributable to Equity Holders of the Parent Other Reserves Equity Share Share in in Cost Cost of Unrealized of Parent Parent Unrealized Share in Gain (Loss) on Company Company Gain on Cumulative Available- Preferrred Additional Shares Held Common Available- Translation for-Sale Retained Stock Common Paid-in by Associates Share Held for-Sale Adjustments of Investments Earnings (Notes 20 Stock Capital (Notes 12 by Subsidiaries Investments an Associate of Associates (Deficit) Non-controlling and 28) (Note 20) (Note 20) and 20) (Note 20) (Note 13) (Note 12) (Note 12) (Note 20) Total Interests Total EquityBalance at December 31, 2010 P=1,000,000 P=6,350,900 P=– (P=731,696) (P=497,758) P=– (P26,393) (P=1,499) P=137,726 P=6,231,280 (P=52,990) P=6,178,290Issuance during the year – 2,819,870 2,776,140 – – – – – – 5,596,010 – 5,596,010Subscriptions during the year – 1,388,613 2,727,591 – – – – – – 4,116,204 – 4,116,204Net income – – – – – – – – 200,517 200,517 (57) 200,460Other comprehensive income (loss) – – – – – 8,585 – (24,477) – (15,892) – (15,892)Total comprehensive income for the year (loss) – – – – – 8,585 – (24,477) 200,517 184,625 (57) 184,568Balance at December 31, 2011 P=1,000,000 P=10,559,383 P=5,503,731 (P=731,696) (P=497,758) P=8,585 (P=26,393) (P=25,976) P=338,243 P=16,128,119 (P=53,047) P=16,075,072
Balance at December 31, 2009 P=1,000,000 P=6,350,900 P=– (P=731,696) (P=497,758) P=– (P=26,393) (P=14,422) (P=327,809) P=5,752,822 (P=52,923) P=5,699,899Net income – – – – – – – – 465,535 465,535 (67) 465,468Other comprehensive income – – – – – – – 12,923 – 12,923 – 12,923Total comprehensive income for the year – – – – – – – 12,923 465,535 478,458 (67) 478,391Balance at December 31, 2010 P=1,000,000 P=6,350,900 P=– (P=731,696) (P=497,758) P=– (P=26,393) (P=1,499) P=137,726 P=6,231,280 (P=52,990) P=6,178,290
Balance at December 31, 2008 P=1,000,000 P=6,350,900 P=– (P=731,696) (P=497,758) P=– (P=26,393) P=7,299 (P=713,726) P=5,388,626 (P=52,837) P=5,335,789Net income – – – – – – – – 385,917 385,917 (86) 385,831Other comprehensive loss – – – – – – – (21,721) – (21,721) – (21,721)Total comprehensive income (loss) for the year – – – – – – – (21,721) 385,917 364,196 (86) 364,110Balance at December 31 , 2009 P=1,000,000 P=6,350,900 P=– (P=731,696) (P=497,758) P=– (P=26,393) (P=14,422) (P=327,809) P=5,752,822 (P=52,923) P=5,699,899
See accompanying Notes to Consolidated Financial Statements.

Belle Corporation Annual Repor t 201124
consolidated stateMents of cash floWs (amounts in thousands)
Years Ended December 31 2011 2010 2009
CASH FLOWS FROM OPERATING ACTIVITIES Income before income tax P=223,562 P=542,022 P=459,725Adjustments for: Interest expense (Note 23) 158,160 191,353 207,062 Equity in net earnings of associates (Note 12) (140,484) (156,184) (117,901) Amortization of discount on trade receivables (Notes 9 and 21) (54,465) (44,409) (74,185) Interest income (Note 23) (28,498) (3,556) (2,780) Depreciation and amortization (Notes 15 and 22) 27,059 21,179 29,878 Gain on sale of: Investment (Note 12) (10,234) – – Property and equipment (Note 24) – (2,934) (356) Pension costs (Notes 22 and 27) 5,464 6,302 6,520 Dividend income (278) (371) (245) Unrealized foreign exchange loss (gain) - net 31 (51,620) (29,055) Provision for (reversal of) allowance: Probable loss on other assets (Note 24) – (11,030) 3,933 Impairment loss on advances to related parties (Note 24) – 5,969 91 Impairment loss on advances to associates (Notes 12, 24 and 28) – 2,200 – Impairment loss on available-for-sale investments (Notes 13 and 24) – 20 2,415Income before changes in working capital 180,317 498,941 485,102Decrease (increase) in: Receivables 246,136 170,190 (228,914) Club shares 30,294 (22,376) 191,381 Real estate for sale (23,257) (76,995) 163,475 Other assets (207,420) (67,831) 13,303Increase (decrease) in accounts payable and other liabilities 184,607 (31,478) (313,778)Contributions to the retirement fund (Note 27) (8,372) (9,133) (9,381)Net cash generated from operations 402,305 461,318 301,188Income tax paid (7,714) (6,776) (19,413)Interest received 23,105 3,556 2,780Net cash provided by operating activities 417,696 458,098 284,555
CASH FLOWS FROM INVESTING ACTIVITIES Acquisitions of: Short-term investments (9,668) – – Available-for-sale investments (Note 13) – (757) – Property and equipment (Note 15) (24,200) (28,393) (82,308)Expenditures on investment properties under construction (Note 14) (1,940,949) (493,245) –Decrease (increase) in investments in and advances to associates and related parties (19,123) (2,345) (7,118)Dividends received 44,692 37,906 36,490Proceeds from disposal of: Investments in an associate (Note 12) 25,125 – 11,900 Property and equipment – 3,054 741Net cash used in investing activities (1,924,123) (483,780) (40,295)
CASH FLOWS FROM FINANCING ACTIVITIES Proceeds from: Availment of loans (Notes 17 and 19) 2,379,855 607,547 – Stock rights offering (Note 20) 2,368,108 – –Payments of: Loans payable (371,868) (410,306) (1,184) Interest (140,783) (188,978) (215,944) Assignment of receivables with recourse (5,027) (11,390) (24,273) Obligations under capital lease – (1,720) (3,471)Increase (decrease) in advances from related parties 1,874 (14,473) 25,815Net cash provided by (used in) financing activities 4,232,159 (19,320) (219,057)
EFFECT OF ExCHANGE RATE CHANGES ON CASH AND CASH EQUIVALENTS 96 (328) –NET INCREASE (DECREASE) IN CASH AND CASH EQUIVALENTS 2,725,828 (45,330) 25,203CASH AND CASH EQUIVALENTS AT BEGINNING OF YEAR 41,052 86,382 61,179CASH AND CASH EQUIVALENTS AT END OF YEAR (Note 8) P=2,766,880 P=41,052 P=86,382
See accompanying Notes to Consolidated Financial Statements.

1. General Information
Corporate InformationBelle Corporation (“Belle” or “Parent Company”) is a stock corporation organized in the Philippines on August 20, 1973 and was listed at the Philippine Stock Exchange (“PSE”) on February 2, 1977. The businesses of Belle, direct and through subsidiaries and associates, include mainly real estate development, principally in the high-end leisure property market, and various investment holdings (see Note 12).
The registered office address of Belle is 28th Floor, East Tower, Philippine Stock Exchange Centre, Exchange Road, Ortigas Center, Pasig City.
Authorization of the Issuance of the Consolidated Financial StatementsThe accompanying consolidated financial statements were authorized for issue in accordance with a resolution of the Board of Directors (“BOD”) on February 22, 2012.
2. Basis of Preparation and Statement of Compliance
Basis of PreparationThe consolidated financial statements have been prepared on a historical cost basis, except for certain available-for-sale (“AFS”) investments that have been measured at fair value (see Note 13). The consolidated financial statements are presented in Philippine peso, the Parent Company’s functional and presentation currency, and all values are rounded to the nearest thousands, except when otherwise indicated.
Statement of ComplianceThe consolidated financial statements of the Company have been prepared in accordance with Philippine Financial Reporting Standards (“PFRS”).
Basis of ConsolidationThe consolidated financial statements comprise the financial statements of Belle and the following subsidiaries (collectively referred to as “the Company”) that it controls:
Subsidiaries Percentage of Ownership 2011 2010 2009Belle Bay Plaza Corporation* (Belle Bay Plaza) 100 100 100Colossal Construction Corporation* 100 100 100Metropolitan Leisure and Tourism Corporation* 100 100 100Parallax Resources, Inc. (Parallax) 100 100 100SLW Development Corporation* (SLW) 100 100 100PremiumLeisure and Amusement, Inc. (PLAI) 100 – –Highland Gardens Corporation* (HGC) 80 80 80* Non-operating
The subsidiaries are all incorporated in the Philippines.
The subsidiaries are consolidated from the date of acquisition, being the date on which the Parent Company obtains control, and continue to be consolidated until the date that such control ceases.
The financial statements of the subsidiaries are prepared for the same reporting year as the Parent Company using consistent accounting policies. All significant intercompany balances, transactions, income and expense and profits and losses from intercompany transactions are eliminated in full in the consolidation.
3. Changes in Accounting Policies and Disclosures
The accounting policies adopted in the preparation of the consolidated financial statements are consistent with those of the previous financial year, except for the adoption of the following new, revised and amended Philippine Accounting Standards (“PAS”), PFRS and Philippine Interpretations from International Financial Reporting Interpretations Committee (“IFRIC”) which were adopted as at January 1, 2011. The adoption of the following amendments and interpretations did not have material effect on the accounting policies, financial position or performance of the Company, except for additional disclosures.
• PAS 24, Related Party Disclosures (Amendment)
PAS 24 clarifies the definitions of a related party. The new definitions emphasize a symmetrical view of related party relationships and clarify the circumstances in which persons and key management personnel affect related party relationships of an entity. In addition, the amendment introduces an exemption from the general related party disclosure requirements for transactions with government and entities that are controlled, jointly controlled or significantly influenced by the same government as the reporting entity.
• PAS 32, Financial Instruments: Presentation (Amendment) - Classification of Rights Issues
The amendment alters the definition of a financial liability in PAS 32 to enable entities to classify rights issues and certain options or warrants as equity instruments. The amendment is applicable if the rights are given pro rata to all of the existing owners of the same class of an entity’s non-derivative equity instruments, to acquire a fixed number of the entity’s own equity instruments for a fixed amount in any currency.
• Philippine Interpretation IFRIC 14 (Amendment), Prepayments of a Minimum Funding Requirement
The amendment removes an unintended consequence when an entity is subject to minimum funding requirements and makes an early payment of contributions to cover such requirements. The amendment permits a prepayment of future service cost by the entity to be recognized as a pension asset. The Company is not subject to minimum funding requirements in the Philippines.
Improvements to PFRS (Issued 2010)
Improvements to PFRSs, an omnibus of amendments to standards, deal primarily with a view to removing inconsistencies and clarifying wording. There are separate transitional provisions for each standard. The adoption of the following amendments resulted in changes to accounting policies but did not have any impact on the financial position or performance of the Company.
• PFRS 3, Business Combinations: The measurement options available for non-controlling interest (“NCI”) were amended. Only components of NCI that constitute a present ownership interest that entitles their holder to a proportionate share of the entity’s net assets in the event of liquidation should be measured at either fair value or at the present ownership instruments’ proportionate share of the acquiree’s identifiable net assets. All other components are to be measured at their acquisition date fair value.
The amendments to PFRS 3 are effective for annual periods beginning on or after July 1, 2011. The Company, however, adopted these as of January 1, 2011 and changed its accounting policy accordingly as the amendment was issued to eliminate unintended consequences that may arise from the adoption of PFRS 3.
• PFRS 7, Financial Instruments - Disclosures — The amendment was intended to simplify the disclosures provided by reducing the volume of disclosures around collateral held and improving disclosures by requiring qualitative information to put the quantitative information in context. The Company reflects the revised disclosure requirements in Note 32.
• PAS1,Presentation of Financial Statements — The amendment clarifies that an entity may present an analysis of each component of other comprehensive income maybe either in the statement of changes in equity or in the notes to the financial statements. The Company provides this analysis in the consolidated statement of changes in equity.
Other amendments resulting from the 2010 improvements to PFRSs to the following standards did not have any impact on the accounting policies, financial position or performance of the Company:
• PFRS3,Business Combinations [contingent consideration arising from business combination prior to adoption of PFRS 3 (as revised in 2008)]
• PFRS3, Business Combinations (un-replaced and voluntarily replaced share-based payment awards)
• PAS27,Consolidated and Separate Financial Statements• PAS34,Interim Financial Statements
The following interpretation and amendments to interpretations did not have any impact on the accounting policies, financial position or performance of the Company:
• PhilippineInterpretationIFRIC13, Customer Loyalty Programmes (determining the fair value of award credits)
• PhilippineInterpretationIFRIC19,Extinguishing Financial Liabilities with Equity Instruments
4. Summary of Significant Accounting Policies
Cash and Cash EquivalentsCash includes cash on hand and in banks. Cash equivalents are short-term, highly liquid investments that are readily convertible to known amounts of cash with original maturity of three months or less from date of acquisition and are subject to an insignificant risk of change in value.
Financial Assets
Initial Recognition and Classification. Financial assets are recognized initially at fair value plus, in the case of investments not fair value through profit or loss (“FVPL”), directly attributable transaction costs.
Purchases or sales of financial assets that require delivery of assets within a time frame established by regulation or convention in the marketplace (regular way purchases) are recognized on the settlement date, i.e., the date that an asset is delivered to or by the Company.
Financial assets are classified as financial assets as at FVPL, loans and receivables, held-to-maturity (“HTM”) investments or AFS investments. The Company determines the classification of its financial assets at initial recognition and where allowed and appropriate, re-evaluates such classification every financial reporting date. The Company has no financial assets as at FVPL and HTM investments as at December 31, 2011 and 2010.
25 Annual Repor t 2011 Belle Corporation
notes to consolidated financial stateMents
Subsequent Measurement. The subsequent measurement of financial assets depends on their classification as follows:
• LoansandReceivables
Loans and receivables are nonderivative financial assets with fixed or determinable payments that are not quoted in an active market. Such financial assets are carried at amortized cost using the effective interest rate method less any allowance for impairment. Gains and losses are recognized in profit or loss in the consolidated statement of comprehensive income when the loans and receivables are derecognized or impaired, as well as through the amortization process.
This category includes the Company’s cash in banks and cash equivalents, short-term investments, receivables, advances to associates as shown under “Investments in and advances to associates” account in the consolidated statement of financial position and advances to related parties (see Note 32).
• AFSInvestments
AFS investments are those nonderivative financial assets that are designated as AFS investments or are not classified as FVPL, loans and receivables and HTM. The Company designates financial instruments as AFS if they are purchased and held indefinitely and may be sold in response to liquidity requirements or changes in market conditions. After initial measurement, AFS investments are measured at fair value with unrealized gains or losses recognized as other comprehensive income in the consolidated statement of comprehensive income until the investment is derecognized or determined to be impaired, at which time, the cumulative gain or loss is recognized in profit or loss in the consolidated statement of comprehensive income. AFS investments in equity instruments that do not have a quoted market price in an active market, or derivatives linked to such equity instruments are measured at cost because its fair value cannot be measured reliably.
For a financial asset reclassified out of the AFS investment category, any previous gain or loss on that asset that has been recognized in other comprehensive income is amortized to profit or loss in the consolidated statement of comprehensive income over the remaining life of the investment using the effective interest method. Any difference between the new amortized cost and the expected cash flows is also amortized over the remaining life of the asset using the effective interest method. If the asset is subsequently determined to be impaired, then the amount recorded in the consolidated statement of changes in equity is reclassified to the profit or loss in the consolidated statement of comprehensive income.
Where the Company holds more than one investment in the same security, these are deemed to be disposed of on a moving average basis. Interest earned on holding AFS investments are reported as interest income using the effective interest rate. Dividends earned on holding AFS investments are recognized in profit or loss in the consolidated statement of comprehensive income when the right to receive payment has been established. The losses arising from impairment of such financial assets are recognized in profit or loss in consolidated statement of comprehensive income.
This category includes the Company’s investments in quoted and unquoted equity securities shown under “Available-for-sale Investments” account in the consolidated statement of financial position (see Note 32).
Financial Liabilities
Initial Recognition and Classification. Financial liabilities are recognized initially at fair value and in the case of other financial liabilities, inclusive of any directly attributable transaction costs.
Financial liabilities are classified as financial liabilities as at FVPL or other financial liabilities which are measured at amortized cost. The Company determines the classification of its financial liabilities at initial recognition. The Company has no financial liabilities as at FVPL as at December 31, 2011 and 2010.
Subsequent Measurement. After initial recognition, interest-bearing other financial liabilities are subsequently measured at amortized cost using the effective interest rate method. Gains and losses are recognized in profit or loss in the consolidated statement of comprehensive income when the liabilities are derecognized as well as through the amortization process.
This category includes the Company’s loans payable, accounts payable and other liabilities (excluding statutory payables and other liabilities to the government), long-term debt and assignment of receivables with recourse (see Note 32).
Offsetting of Financial Assets and Financial LiabilitiesFinancial assets and financial liabilities are offset and the net amount is reported in the consolidated statement of financial position if, and only if, there is a currently enforceable right to offset the recognized amounts and there is intention to settle on a net basis, or to realize the asset and settle the liability simultaneously.
Determination of Fair Value and Fair Value Hierarchy of Financial Assets and Financial Liabilities The fair value for financial assets and financial liabilities traded in active markets at reporting date is based on their quoted market price or dealer price quotations (bid price for long positions and ask price for short positions), without any deduction for transaction costs. When current bid and asking prices are not available, the price of the most recent transaction provides evidence of the current fair value as long as there has not been a significant change in economic circumstances
since the time of the transaction.
For financial instruments where there is no active market, except for investment in unquoted equity securities, fair value is determined by using appropriate valuation techniques. Such techniques include using recent arm’s length market transactions; reference to the current market value of another instrument, which is substantially the same; discounted cash flow analysis; and options pricing models. In the absence of a reliable basis for determining fair value, investments in unquoted equity securities are carried at cost, net of impairment.
The Company uses the following hierarchy for determining and disclosing the fair value of financial instruments by valuation technique:
• Level1:quoted(unadjusted)pricesinactivemarketsforidenticalassetsorliabilities;
• Level2:othertechniquesforwhichallinputswhichhavesignificanteffectontherecordedfairvalue are observable, either directly or indirectly; and,
• Level3:techniqueswhichuseinputswhichhaveasignificanteffectontherecordedfairvaluethat are not based on observable market data.
Fair value measurement disclosures are presented in Note 32.
Amortized Cost of Financial Assets and Financial LiabilitiesAmortized cost is computed using the effective interest method less any allowance for impairment. The calculation takes into account any premium or discount on acquisition and includes transaction costs and fees that are an integral part of the effective interest rate.
“Day 1” DifferenceWhere the transaction price in a nonactive market is different from the fair value of other observable current market transactions in the same instrument or based on a valuation technique whose variables include only data from observable market, the Company recognizes the difference between the transaction price and fair value (a “Day 1” difference) in profit or loss in the consolidated statement of comprehensive income unless it qualifies for recognition as some other type of asset. In cases where use is made of data which is not observable, the difference between the transaction price and model value is only recognized in profit or loss in the consolidated statement of comprehensive income when the inputs become observable or when the instrument is derecognized. For each transaction, the Company determines the appropriate method of recognizing the “Day 1” difference amount.
Classification of Financial Instruments Between Debt and EquityA financial instrument is classified as debt if it provides for a contractual obligation to:
• delivercashoranotherfinancialassettoanotherentity;or• exchangefinancialassetsorfinancialliabilitieswithanotherentityunderconditionsthatare
potentially unfavorable to the Company; or• satisfy the obligation other than by the exchange of a fixed amount of cash or another
financial asset for a fixed number of own equity shares.
If the Company does not have an unconditional right to avoid delivering cash or another financial asset to settle its contractual obligation, the obligation meets the definition of a financial liability.
Impairment of Financial Assets The Company assesses at each reporting date whether there is any objective evidence that a financial asset or a group of financial assets is impaired. A financial asset or a group of financial assets is deemed to be impaired if, and only if, there is objective evidence of impairment as a result of one or more events that has occurred after the initial recognition of the asset (an incurred ‘loss event’) and that loss event has an impact on the estimated future cash flows of the financial asset or the group of financial assets that can be reliably estimated. Evidence of impairment may include indications that the debtors or a group of debtors is experiencing significant financial difficulty, default or delinquency in interest or principal payments, the probability that they will enter bankruptcy or other financial reorganization and where observable data indicate that there is a measurable decrease in the estimated future cash flows such as changes in arrears or economic conditions that correlate with defaults.
Financial Assets Carried at Amortized Cost. For financial assets carried at amortized cost, the Company first assesses whether objective evidence of impairment exists individually for financial assets that are individually significant, and individually or collectively for financial assets that are not individually significant. If there is objective evidence that an impairment loss has been incurred, the amount of the loss is measured as the difference between the asset’s carrying amount and the present value of estimated future cash flows discounted at the financial asset’s original effective interest rate. The carrying amount of the financial asset is reduced through use of an allowance account and the amount of the loss is recognized in profit or loss in the consolidated statement of comprehensive income. Interest income continues to be accrued on the reduced carrying amount based on the effective interest rate of the asset.
If it is determined that no objective evidence of impairment exists for an individually assessed financial asset, whether significant or not, the asset is included in a group of financial assets with similar credit risk characteristics and that group of financial assets is collectively assessed for impairment. Assets that are individually assessed for impairment and for which an impairment loss is or continues to be recognized are not included in a collective assessment of impairment.
The Company provides an allowance for loans and receivables which they deemed to be uncollectible despite the Company’s continuous effort to collect such balances from the respective clients. The Company considered those past due receivables as still collectible if they become
Belle Corporation Annual Repor t 201126

past due only because of a delay on the fulfillment of certain conditions as agreed in the contract and not due to incapability of the clients to fulfill their obligation. However, for those receivables associated with pre-terminated contracts, the Company directly writes them off from the account since there is no realistic prospect of future recovery.
If, in a subsequent period, the amount of the impairment loss decreases and the decrease can be related objectively to an event occurring after the impairment was recognized, the previously recognized impairment loss is reversed. Any subsequent reversal of an impairment loss is recognized in profit or loss in the consolidated statement of comprehensive income, to the extent that the carrying value of the asset does not exceed its amortized cost at the reversal date.
AFS Investments. For AFS equity investments, the Company assesses at each reporting date whether there is objective evidence that an investment or a group of investments is impaired. The evidence of impairment for equity securities classified as AFS investments would include a significant or prolonged decline in fair value of investments below its cost. Where there is evidence of impairment, the cumulative loss - measured as the difference between the acquisition cost and the current fair value, less any impairment loss on that financial asset previously recognized in the other comprehensive income - is removed from other comprehensive income and recognized in profit or loss in the consolidated statement of comprehensive income. Impairment losses on equity investments are not reversed through the profit or loss in the consolidated statement of comprehensive income. Increases in fair value after impairment are recognized directly in other comprehensive income in the consolidated statement of comprehensive income.
Financial Asset Carried at Cost. If there is objective evidence that an impairment loss on an unquoted equity instrument that is not carried at fair value because its fair value cannot be reliably measured, the amount of the loss is measured as the difference between the asset’s carrying amount and the present value of estimated future cash flows discounted at the current market rate of return for a similar financial asset. The carrying value of the asset is reduced through use of an allowance account.
Derecognition of Financial Assets and Financial Liabilities
Financial Assets. A financial asset (or, where applicable, a part of a financial asset or part of a group of similar financial assets) is derecognized when:
• theCompany’srighttoreceivecashflowsfromtheassethasexpired;or
• the Company retains the right to receive cash flows from the asset, but has assumed anobligation to pay them in full without material delay to a third party under a “pass-through” arrangement; or
• theCompanyhastransferreditsrighttoreceivecashflowsfromtheassetandeither(a)hastransferred substantially all the risks and rewards of the assets, or (b) has neither transferred nor retained substantially all the risks and rewards of the asset, but has transferred control of the asset.
Where the Company has transferred its right to receive cash flows from an asset or has entered into a “pass-through” arrangement, and has neither transferred nor retained substantially all the risks and rewards of the asset nor transferred control of the asset, the asset is recognized to the extent of the Company’s continuing involvement in the asset. In that case, the Company also recognizes an associated liability. The transferred asset and the associated liability are measured on a basis that reflects the rights and obligations that the Company has retained. Continuing involvement that takes the form of a guarantee over the transferred asset is measured at the lower of original carrying amount of the asset and the maximum amount of consideration that the Company could be required to repay.
Financial Liabilities. A financial liability is derecognized when the obligation under the liability is discharged or cancelled or has expired.
Where an existing financial liability is replaced by another from the same lender on substantially different terms, or the terms of an existing liability are substantially modified, such an exchange or modification is treated as a derecognition of the original liability and the recognition of a new liability, and the difference in the respective carrying amounts is recognized in profit or loss in the consolidated statement of comprehensive income.
Real Estate for SaleProperty acquired or being constructed for sale in the ordinary course of business, rather than to be held for rental or capital appreciation, is held as inventory and is measured at the lower of cost and net realizable value (“NRV”).
Cost includes acquisition cost plus any other directly attributable costs of developing the asset to its saleable condition and cost of improving the properties up to the reporting date.
Non-refundable commissions paid to sales or marketing agents on the sale of real estate units are expensed when incurred.
NRV is the estimated selling price in the ordinary course of the business, based on market prices at the reporting date and discounted for the time value of money if material, less costs to complete and the estimated costs of sale. NRV in respect of land under development is assessed with reference to market prices at the reporting date for similar completed property, less estimated costs to complete construction and less an estimate of the time value of money to the date of completion.
Club SharesClub shares are stated at the lower of cost and NRV. The cost of club shares sold is determined on the basis mainly of the actual development cost incurred plus the estimated development cost to complete the project based on the estimates as determined by the in-house engineers, adjusted with the actual costs incurred as the development progresses, including borrowing costs during the development stage. NRV is the estimated selling price less estimated cost to complete and sell.
Investments in AssociatesInvestments in associates are accounted for under the equity method. An associate is an entity in which the Company has significant influence and which is neither a subsidiary nor a joint venture.
Under the equity method, the investments in associates are carried in the consolidated statement of financial position at cost plus post-acquisition changes in the Company’s share of net assets of the associates, less any impairment in value.
The profit or loss in the consolidated statement of comprehensive income reflects the Company’s share of the financial performance of the associates. When there has been a change recognized directly in the equity of the associates, the Company recognizes its share of any changes and discloses this, when applicable, as part of other comprehensive income and in the consolidated statement of changes in equity. Unrealized gains and losses resulting from transactions between the Company and the associates are eliminated to the extent of the interest in the associates.
The share of income or loss of associates is presented as part of profit or loss in the consolidated statement of comprehensive income. This is the income or loss attributable to equity holders of the associates and therefore is income or loss after tax and non-controlling interest in the subsidiaries of the associates.
The financial statements of the associates are prepared for the same reporting period as the Parent Company. Where necessary, adjustments are made to bring the accounting policies in line with those of the Parent Company.
If the Company’s share of losses of an associate equals or exceeds the carrying amount of an investment, the Company discontinues including its share of further losses. After the Company’s investment is reported at zero value, additional losses are provided for and a liability is recognized only to the extent that the Company has incurred legal or constructive obligations or made payments on behalf of the associate. If the associate subsequently reports profits, the Company resumes recognizing its share of those profits only after its share of the profits equals the share of net losses not recognized.
After application of the equity method, the Company determines whether it is necessary to recognize an additional impairment loss on the Company’s investment in its associates. The Company determines at each reporting date whether there is any objective that the investment in associates is impaired. If this is the case, the Company calculates the amount of impairment as the difference between the recoverable amount of the investment in associate and its carrying value and recognizes against profit or loss in the consolidated statement of comprehensive income.
Upon loss of significant influence over the associate, the Company measures and recognizes any retained investment at its fair value. Any difference between the carrying amount of the investment in associates upon loss of significant influence and the fair value of the retained investment and proceeds from disposal is recognized in profit or loss in the consolidated statement of comprehensive income.
Investment Properties under ConstructionInvestment properties include land and building under construction held to earn rentals or for capital appreciation or both. Property held under a lease is classified as investment property when the definition of an investment property is met. Investment property is measured initially at cost including transaction costs. Transaction costs include transfer taxes, professional fees for legal services and initial leasing commissions to bring the property to the condition necessary for it to be capable of operating. The carrying amount also includes the cost of replacing part of an existing investment property at the time that cost is incurred if the recognition criteria are met and excludes the costs of day to day servicing of an investment property. Subsequent to initial recognition, investment property is stated at amortized cost less impairment, if any. Investment properties under construction are not depreciated until such time that the relevant assets are completed and become available for operational purpose.
Investment property is derecognized when either they have been disposed of or when the investment property is permanently withdrawn from use and no future economic benefit is expected from its disposal. Any gains or losses, which are the difference between the net disposal proceeds and the carrying amount of the investment property, on the retirement or disposal, are recognized in profit or loss in the consolidated statement of comprehensive income in the year of retirement or disposal.
Transfers are made to investment property when, and only when, there is a change in use, evidenced by ending of owner-occupation or commencement of an operating lease to another party. Transfers are made from investment property when, and only when, there is a change in use, evidenced by commencement of owner-occupation or commencement of development with a view to sale.
Property Acquisitions and Business CombinationsWhere property is acquired, via corporate acquisitions or otherwise, management considers the substance of the assets and activities of the acquired entity in determining whether the acquisition represents the acquisition of a business. The basis of judgment is set out in Note 5.
27 Annual Repor t 2011 Belle Corporation

Where such acquisitions are not judged to be an acquisition of a business, they are not treated as business combinations. Rather, the cost to acquire the corporate entity is allocated to the identifiable assets and liabilities of the entity based on their relative fair values at the acquisition date. Accordingly, no goodwill or additional deferred tax arises. Otherwise, acquisitions are accounted for as business combinations.
Property and EquipmentProperty and equipment, except land, are stated at cost, excluding the cost of day-to-day servicing, less accumulated depreciation, amortization and impairment in value. Such cost includes the cost of replacing part of the property and equipment when that cost is incurred if the recognition criteria are met. When major repairs and maintenance is performed, its cost is recognized in the carrying amount of the property and equipment as a replacement if the recognition criteria are satisfied. All other repair and maintenance costs are charged against profit or loss in the consolidated statement of comprehensive income. Land is carried at cost less any impairment in value.
Depreciation and amortization are computed using the straight-line method over the following estimated useful lives of the assets:
Leasehold improvements 15 years or the term of the lease, whichever is shorter
Machinery and equipment 5 yearsCondominium units and improvements 17 yearsTransportation equipment 4 years or the term of the lease,
whichever is shorterOffice furniture, fixtures and equipment 5 years
The assets’ residual values, useful lives and depreciation and amortization method are reviewed, and adjusted if appropriate, at each financial year-end.
Fully depreciated property and equipment are retained in the accounts until they are no longer in use and no further depreciation is charged to current operations.
Construction-in-progress represents property and equipment under construction and is stated at cost. This includes cost of construction and other direct costs. Construction-in-progress is transferred to the related property and equipment when the construction or installation and related activities necessary to prepare the property and equipment for their intended use have been completed and the property and equipment are ready for service. Construction-in-progress is not depreciated until such time that assets are completed and available for use.
An item of property and equipment is derecognized upon disposal or when no future economic benefits are expected from its use or disposal. Any gain or loss arising on derecognition of the asset (calculated as the difference between the net disposal proceeds and the carrying amount of the asset) is included in profit or loss in the consolidated statement of comprehensive income in the year the asset is derecognized.
Intangible AssetIntangible assets acquired separately are measured on initial recognition at cost. The cost of intangible assets acquired in a business combination is the fair value as at the date of acquisition. Following initial recognition, intangible assets are carried at cost less any accumulated amortization and accumulated impairment losses. Internally generated intangible assets, excluding capitalized development costs, are not capitalized and expenditure is reflected in the consolidated statement of comprehensive income in the year the expenditure is incurred.
The useful lives of intangible assets are assesses as either finite or infinite. Intangible assets with finite lives are amortized over the useful economic life and assessed for impairment whenever there is an indication that the intangible asset may be impaired. The amortization period and the amortization method for an intangible asset with a finite useful life is reviewed at least at the end of each reporting period. Changes in the expected useful life or the expected pattern of consumption of future economic benefits embodied in the asset is accounted for by changing the amortization period or method, as appropriate, and are treated as changes in the accounting estimates. The amortization expense on intangible assets with finite lives is recognized in the consolidated statement of comprehensive income in the expense category consistent with the function of the intangible assets.
Intangible assets with indefinite useful lives are not amortized, but are tested for impairment annually, either individually or at the cash-generating unit level. The assessment of indefinite life is reviewed annually to determine whether the indefinite life continues to be supportable. If not, the change in the useful life from the indefinite to finite is made on a prospective basis.
Gains or losses arising from derecognition of an intangible asset are measured as the difference between the net disposal proceeds and the carrying amount of the asset and are recognized in the consolidated statement of comprehensive income when the asset is derecognized.
Other AssetsOther assets are stated at cost less accumulated impairment in value and are shown in the consolidated statement of financial position. The accounting policies specific to the related assets are as follows:
Creditable Withholding Tax (“CWT”). CWT is recognized by virtue of Republic Act 8424 relative to the withholding on income subject to expanded and final withholding tax on compensation, value-added tax and other percentage taxes. CWT is recognized when the other party withheld certain taxes payable to the tax authority, and is reduced to the extent of that CWT which will not be realized through the use of an allowance account.
Project Development Costs. Costs incurred by subsidiaries in the development of its leisure, entertainment and residential projects are capitalized. An allowance for impairment in value is provided on the portion of such costs which is not likely to be recoverable. These are written off against the allowance when the costs are determined to be unrecoverable.
Supplies Inventory. Supplies inventory is valued at the lower of cost and NRV. Cost is determined using the moving average method. NRV of supplies is the current replacement cost.
Impairment of Nonfinancial AssetsThe Company assesses at each reporting date whether there is an indication that investments in associates, investment properties under construction, property and equipment, intangible asset and other assets may be impaired. If any such indication exists and when annual impairment testing for an asset is required, the Company makes an estimate of the asset’s recoverable amount. An asset’s recoverable amount is the higher of an asset’s cash-generating unit’s fair value less costs to sell or its value in use and is determined for an individual asset, unless the asset does not generate cash inflows that are largely independent of those from other assets or groups of assets. Where the carrying amount of an asset exceeds its recoverable amount, the asset is considered impaired and is written down to its recoverable amount. In determining fair value less costs to sell, an appropriate valuation model is used. These calculations are corroborated by valuation multiples and other available fair value indicators. In assessing value in use, the estimated future cash flows are discounted to their present value using a pretax discount rate that reflects current market assessments of the time value of money and the risks specific to the asset.
Any impairment loss is recognized in profit or loss in the consolidated statement of comprehensive income in those expense categories consistent with the function of the impaired assets.
An assessment is made at each reporting date as to whether there is any indication that previously recognized impairment losses may no longer exist or may have decreased. If such indication exists, the Company makes an estimate of recoverable amount. A previously recognized impairment loss is reversed only if there has been a change in the estimates used to determine the asset’s recoverable amount since the last impairment loss was recognized. If that is the case, the carrying amount of the asset is increased to its recoverable amount. That increased amount cannot exceed the carrying amount that would have been determined had no impairment loss been recognized for the asset in prior years. Such reversal is recognized in the consolidated statement of comprehensive income as part of profit or loss for the year.
EquityCapital stock is measured at par value for all shares issued. Incremental costs directly attributable to the issuance of new shares are shown in equity as a deduction from proceeds, net of tax. Proceeds and/or fair value of consideration received in excess of par value are recognized as additional paid-in capital.
Retained earnings represent the accumulated earnings.
Equity Share in Cost of Parent Company Shares Held by AssociatesEquity share in cost of Parent Company common shares held by associates represent the amount that reduces the Company’s “Investments in and advances to associates” account and equity balance by the Company’s effective ownership in Parent Company common shares held by associates.
Cost of Parent Company Common Shares Held by Subsidiaries Cost of Parent Company common shares held by subsidiaries are equity instruments which are reacquired (treasury shares) and are recognized at cost and deducted from equity. No gain or loss is recognized in the profit or loss in the consolidated statement of comprehensive income on the purchase, sale, issue or cancellation of the Company’s own equity instruments. Any difference between the carrying amount and the consideration is recognized in other reserves.
NCINCI represent the portion of profit or loss and the net assets not held by the Parent Company and are presented separately in the consolidated statement of comprehensive income and within equity in the consolidated statement of financial position, separately from total equity attributable to owners of the Parent Company. Any losses applicable to a non-controlling shareholder of a consolidated subsidiary in excess of the non-controlling shareholder’s equity in the subsidiary are charged against the NCI even if this results in NCI having a deficit.
NCI represent the equity interest in HGC not held by the Parent Company.
Revenue RecognitionRevenue is recognized to the extent that it is probable that the economic benefits will flow to the Company and the revenue can be reliably measured. The Company assesses its revenue arrangements against specific criteria to determine if it is acting as principal or agent. Except for “Commission income,” the Company has concluded that it is acting as a principal in all of its revenue arrangements. The following specific recognition criteria must also be met before revenue is recognized:
Net Revenue from Sale of Real Estate and Club Shares. Revenue from sale of real estate, which include the sale of lots and condominium units and club shares, are accounted for under the full accrual method of accounting. Under this method, revenue and cost is recognized when: (a) the collectibility of the sales price is reasonably assured; (b) the earnings process is virtually complete; and (c) the seller does not have a substantial continuing involvement with the subject properties.
Real estate sales, where the Company has material obligations under the sales contract to provide improvements after the property are sold, are accounted for under the percentage of completion
Belle Corporation Annual Repor t 201128

method. Under this method, the gain on sale is realized as the related obligations are fulfilled and the units are completed, measured principally as a percentage of actual cost incurred to date over the total estimated project cost.
If none of the revenue recognition criteria are met, deposit method is applied until all the conditions for recording a sale are met. Pending recognition of sale, cash received from buyers is accounted as customers’ deposits included under “Accounts payable and other liabilities” account in the consolidated statement of financial position.
Commission Income. Revenue is recognized when the related services are rendered. Commission is computed as a certain percentage of the net contract price of the sold real estate project of a related party.
Dividends. Revenue is recognized when the Company’s right to receive the payment is established.
Lease Income. Lease income arising from operating leases on investment properties is accounted for on a straight-line basis over the terms of the lease.
Service Income. Revenue is recognized as services of providing utilities and maintenance are performed.
Income from Forfeitures. This represents income from forfeitures of the deposits and, to a certain extent, installments from customers in the event of a default and/or from cancellations of sales. Revenue is recognized upon approval of cancellation.
Interest Income. Interest income from trade receivables is recognized as the interest accrues using the effective interest rate, which is the rate that exactly discounts estimated future cash receipts through the expected life of the financial asset to the net carrying amount. Interest income from bank deposits is recognized as it accrues.
Penalty. Penalty pertains to income from surcharges for buyers’ default and late payments. Income is recognized when penalty is actually collected.
Other Income. Revenue is recognized when there is an incremental economic benefit, other than the usual business operations, that will flow to the Company and the amount of the revenue can be measured reliably.
Costs and Expense RecognitionCosts and expenses are decreases in economic benefits during the accounting period in the form of outflows or decrease of assets or incurrence of liabilities that result in decrease in equity, other than those relating to distributions to equity participants. Costs and expenses are recognized in profit or loss in the consolidated statement of comprehensive income in the year these are incurred.
Cost of real estate sold includes all direct materials and labor costs, and those indirect costs related to contract performance. When it is probable that the labor contract cost will exceed total contract revenue, the expected loss is recognized immediately. Changes in job performance, job conditions and estimated profitability, including those arising from contract penalty provisions and final contract settlements which may result in revisions to estimated costs and gross margins, are recognized in the year in which the revisions are determined.
LeasesThe determination of whether an arrangement is, or contain, a lease is based on the substance of the arrangement at inception date or whether the fulfillment of the arrangement is dependent on the use of a specific asset or assets or the arrangement conveys a right to use the asset. A reassessment is made after inception of the lease only if one of the following applies:
a. There is a change in contractual terms, other than a renewal or extension of the arrangement;b. A renewal option is exercised or extension granted, unless the term of the renewal or extension
was initially included in the lease term;c. There is a change in the determination of whether fulfillment is dependent on a specified
asset; ord. There is a substantial change to the asset.
Where a reassessment is made, lease accounting shall commence or cease from the date when the change in circumstances gave rise to the reassessment for scenarios a, c or d and at the date of renewal or extension period for scenario b.
Leases where the lessor retains substantially all the risks and benefits of ownership of the asset are classified as operating leases. Operating lease payments are charged against profit or loss in the consolidated statement of comprehensive income on a straight-line basis over the lease term.
Capitalization of Operating Lease. Where a building will be constructed on a land under operating lease, the operating lease costs that are incurred during the construction period may be capitalized as part of the construction cost of the building. Otherwise, this may be expensed outright.
When capitalized, such lease costs are viewed as costs directly attributable to bringing the building to the location and condition necessary for it to be capable of operating in a manner intended by management. Lease costs are necessary and unavoidable costs of constructing the building, because without this lease, no construction could occur.
Borrowing CostsBorrowing costs directly attributable to the development of the Company’s projects that necessarily take a substantial period of time to get ready for its intended sale are capitalized as part of the cost of the “Real estate for sale”, “Club shares”, “Investment properties under construction” and “Property and equipment” accounts in the consolidated statement of financial position. Capitalization of
borrowing costs ceases when substantially all the activities necessary to prepare the asset for its intended use or sale are complete. All other borrowing costs are expensed in the period they occur. Borrowing costs consist of interest and other costs that an entity incurs in connection with the borrowing of funds.
Pension CostsThe defined benefit plan requires contributions to be made to separately administered funds. The cost of providing benefits under the defined benefit plan is determined using the projected unit credit actuarial valuation method. This method reflects service rendered by employees to the date of valuation and incorporates assumptions concerning employees’ projected salaries.
Actuarial gains and losses are recognized as income or expense when the net cumulative unrecognized actuarial gains and losses at the end of the previous reporting year exceeded 10% of the higher of the defined benefit obligation and the fair value of plan assets (“FVPA”) at that date. These gains or losses are recognized over the expected average remaining working lives of the employees participating in the plan.
Plan assets are assets that are held by a long-term employee benefit fund or qualifying insurance policies. Plan assets are not available to the creditors of the Company nor can they be paid directly to the Company. Fair value is based on market price information and, in the case of quoted securities, it is the published bid price.
The past service cost, if any, is recognized as an expense on a straight-line basis over the average period until the benefits become vested. If the benefits are already vested immediately following the introduction of, or changes to, a pension plan, past service cost is recognized immediately.
The defined benefit liability is the aggregate of the present value of the defined benefit obligation and actuarial gains not recognized reduced by past service cost not yet recognized and FVPA out of which the obligations are to be settled directly. If such aggregate is negative, the asset is measured at the lower of such aggregate or the aggregate of cumulative unrecognized net actuarial losses and past service cost and the present value of any economic benefits available in the form of refunds from the plan or reductions in the future contributions to the plan.
Actuarial valuations are made with sufficient regularity that the amounts recognized in the consolidated financial statements do not differ materially from the amounts that would be determined at the reporting date.
Foreign Currency-denominated Transactions and TranslationsTransactions denominated in foreign currency are recorded in Philippine peso by applying to the foreign currency amount the exchange rate between the Philippine peso and the foreign currency at the date of transaction. Monetary assets and liabilities denominated in foreign currencies are restated using the closing exchange rate at the reporting date. All differences are recognized in profit or loss in the consolidated statement of comprehensive income. Nonmonetary items measured in terms of historical cost in a foreign currency are translated using the exchange rates as at the dates of initial transactions. Nonmonetary items measured at fair value in a foreign currency are translated using the exchange rates at the date when the fair value was determined.
Income Taxes
Current Tax. Current tax assets and liabilities for the current and prior periods are measured at the amount expected to be recovered from or paid to the tax authority. The tax rates and tax laws used to compute the amount are those that are enacted or substantively enacted at the reporting date.
Deferred Tax. Deferred tax is provided using the liability method on temporary differences at the reporting date between the tax bases of assets and liabilities and their carrying amounts for financial reporting purposes, and the carryforward benefit of minimum corporate income tax (MCIT), to the extent that it is probable that future taxable profit will be available against which the temporary differences and carryforward benefit of unused MCIT can be utilized.
Deferred tax liabilities are recognized for all taxable temporary differences, except:
• wherethedeferredtaxliabilityarisesfromtheinitialrecognitionofgoodwillorofanassetorliability in a transaction that is not a business combination and, at the time of the transaction, affects neither the accounting profit nor taxable profit or loss; and
• in respectof taxable temporarydifferencesassociatedwith investments insubsidiariesandassociates and interests in joint ventures, where the timing of the reversal of the temporary differences can be controlled and it is probable that the temporary differences will not reverse in the foreseeable future.
Deferred tax assets are recognized for all deductible temporary differences to the extent that it is probable that future taxable profit will be available against which the deductible temporary differences can be utilized except:
• wherethedeferredtaxassetrelatingtothedeductibletemporarydifferencearisesfromtheinitial recognition of an asset or liability in a transaction that is not a business combination and, at the time of the transaction, affects neither the accounting profit nor taxable profit or loss; and
• inrespectofdeductibletemporarydifferencesassociatedwithinvestmentsinsubsidiariesandassociates and interests in joint ventures, deferred tax assets are recognized only to the extent that it is probable that the temporary differences will reverse in the foreseeable future and taxable profit will be available against which the temporary differences can be utilized.
29 Annual Repor t 2011 Belle Corporation

The carrying amount of deferred tax assets is reviewed at each reporting date and reduced to the extent that it is no longer probable that sufficient taxable profit will be available to allow all or part of the deferred tax assets to be utilized. Unrecognized deferred tax assets are reassessed at each reporting date and are recognized to the extent that it has become probable that future taxable profit will allow the deferred tax assets to be recovered.
Deferred tax assets and liabilities are measured at the tax rates that are expected to apply to the year when the asset is realized or the liability is settled, based on tax rates and tax laws that have been enacted or substantively enacted at the reporting date.
Deferred tax assets and liabilities are offset, if a legally enforceable right exists to offset current tax assets against current tax liabilities and the deferred taxes relate to the same taxable entity and the same tax authority.
Value-Added Tax (“VAT”). Revenues, expenses and assets are recognized net of the amount of VAT except:
• wherethetaxincurredonapurchaseofassetsorservicesisnotrecoverablefromthetaxationauthority, in which case the tax is recognized as part of the cost of acquisition of the asset or as part of the expense item as applicable; and
• receivablesandpayablesthatarestatedwiththeamountoftaxincluded.
The net amount of tax recoverable from, or payable to, the taxation authority is included as part of “Input VAT” under “Other Assets” account or “Output VAT payable” under “Accounts payable and other liabilities” account, respectively, in the consolidated statement of financial position.
Earnings Per Share (“EPS”)Basic EPS is computed by dividing net profit or loss for the year attributable to common equity holders of the parent, after recognition of the dividend requirement of preferred shares, as applicable, by the weighted average number of issued and outstanding common shares during the year, after giving retroactive effect to any stock dividends declared during the year.
Diluted EPS is computed by dividing net profit or loss for the year attributable to common equity holders of the parent by the weighted average number of issued and outstanding common shares during the year plus the weighted average number of common shares that would be issued on conversion of all the dilutive potential common shares into common shares. The calculation of diluted EPS does not assume conversion, exercise, or other issue of potential common shares that would have an anti-dilutive effect on EPS.
Business SegmentsThe Company’s operating businesses are organized and managed separately according to the nature of the products and services provided, with each segment representing a strategic business unit that offers different products.
Segment Assets and Liabilities. Segment assets include all operating assets used by a segment and consist principally of operating cash, receivables, real estate for sale, club shares, investment properties under construction and property and equipment, net of accumulated depreciation and impairment. Segment liabilities include all operating liabilities and consist principally of accounts payable and other liabilities. Segment assets and liabilities do not include deferred income taxes, investments and advances, and borrowings.
Inter-segment Transactions. Segment revenue, segment expenses and segment performance include transfers among business segments. The transfers, if any, are accounted for at competitive market prices charged to unaffiliated customers for similar products. Such transfers are eliminated in consolidation.
ProvisionsProvisions are recognized when the Company has a present obligation (legal or constructive) as a result of a past event; it is probable that an outflow of resources embodying economic benefits will be required to settle the obligation; and, a reliable estimate can be made of the amount of the obligation. When the Company expects some or all of a provision to be reimbursed, for example under an insurance contract, the reimbursement is recognized as a separate asset but only when the reimbursement is virtually certain. The expense relating to any provision is presented as part of profit or loss in the consolidated statement of comprehensive income, net of any reimbursement.
If the effect of the time value of money is material, provisions are discounted using a current pretax rate that reflects, where appropriate, the risks specific to the liability. Where discounting is used, the increase in the provision due to the passage of time is recognized as a finance cost.
ContingenciesContingent liabilities are not recognized in the consolidated financial statements. They are disclosed in the notes to the consolidated financial statements unless the possibility of an outflow of resources embodying economic benefits is remote. Contingent assets are not recognized in the consolidated financial statements but are disclosed in the notes to consolidated financial statements when an inflow of economic benefits is probable.
Events after the Reporting DatePost year-end events that provide additional information about the Company’s financial position at the reporting date (adjusting events), if any, are reflected in the consolidated financial statements. Post year-end events that are not adjusting events are disclosed in the notes to consolidated financial statements when material.
5. Significant Accounting Judgments, Estimates and Assumptions
The preparation of the Company’s consolidated financial statements requires management to make judgments, estimates and assumptions that affect certain reported amounts and disclosures. However, uncertainty about these assumptions and estimates could result in outcomes that could require a material adjustment to the carrying amount of the asset or liability affected in the future.
JudgmentsIn the process of applying the Company’s accounting policies, management has made the following judgments, apart from those involving estimations, which has the most significant effect on the amounts recognized in the consolidated financial statements:
Determination of Functional Currency. Based on the economic substance of the underlying circumstances relevant to the Company, the Company has determined its functional currency to be Philippine Peso. It is the currency of the primary economic environment in which the Company operates and the currency that mainly influences the revenue and expenses.
Recognition of Revenue on and Cost of Sale of Real Estate and Club Shares. Selecting an appropriate revenue recognition method for a particular sale transaction requires certain judgments based on sufficiency of cumulative payments by the buyer and completion of development. The completion of development is determined based on actual costs incurred over the total estimated development costs reconciled with the engineer’s judgment and estimates on the physical portion of contract work done if the development cost is beyond preliminary stage.
Revenue and cost from sale of real estate and club shares recognized amounted to P=520.2 million and P=236.0 million, respectively, in 2011, P=1,164.0 million and P=509.0 million, respectively, in 2010 and P=1,259.8 million and P=566.3 million, respectively, in 2009 (see Note 22).
Determination of Fair Value of Financial Assets and Financial Liabilities. PFRS requires certain financial assets and financial liabilities to be carried and disclosed at fair value, which requires extensive use of accounting estimates and judgments. While significant components of fair value measurement were determined using verifiable objective evidence (i.e., foreign exchange rates, interest rates and volatility rates), the amount of changes in fair value would differ if the Company utilized a different valuation methodology. Any changes in the assumptions could affect the fair value of these financial assets and financial liabilities.
The fair value of financial assets amounted to P=4,302.3 million and P=1,814.9 million as at December 31, 2011 and 2010, respectively. The fair value of financial liabilities amounted to P=6,368.2 million and P=4,103.9 million as at December 31, 2011 and 2010, respectively (see Note 32).
Determination of Fair Value of Financial Assets Not Quoted in an Active Market. The Company classified financial assets by evaluating, among others, whether the asset is quoted or not in an active market. Included in the evaluation on whether a financial asset is quoted in an active market is the determination on whether quoted prices are readily and regularly available, and whether those prices represent actual and regularly accruing market transaction in an arm’s-length basis.
The fair values of the Company’s investments in unquoted shares cannot be reasonably determined as these shares are not quoted in an active market. There were no recent transactions involving these shares, therefore these investments are carried at cost less impairment, if any. The Company does not intend to dispose these investments in unquoted shares.
The carrying amount of investments in unquoted shares amounted to P=2.8 million as at December 31, 2011 and 2010 (see Note 13).
Classification of Property. The Company determines whether a property is classified as investment property, inventory or property and equipment:
• Investment property comprises land, building and leasehold improvements which arenot occupied substantially for use by, or in the operations of, the Company, nor for sale in the ordinary course of business, but are held primarily to earn rental income and capital appreciation.
• Inventorycomprisespropertythatisheldforsaleintheordinarycourseofbusiness.Principally,these are condominium units and residential lots that the Company develops and intends to sell before or on completion of construction.
• Propertyandequipmentincludeslandandleaseholdimprovementsandcondominiumunitsand improvements, among others. These properties are used by the Company as model houses and are neither for sale nor for rentals. Other properties and equipment are intended for operations or administrative purposes.
Evaluation of Lease Commitments. The evaluation of whether an arrangement obtains a lease is based on its substance. An arrangement is, or contains a lease when the fulfillment of the arrangement depends on specific asset or assets and the arrangement conveys a right to use the asset.
The Parent Company, as a lessee, has entered into a lease of its office space and land. The Parent Company has determined that it has not acquired the significant risks and rewards of ownership of the leased properties because of the following factors: a) the Company will not acquire ownership of the leased property upon termination of the lease; and b) the Company was not given an option to purchase the asset at a price that is sufficiently lower than the fair value at the date of the option. Thus, the Company recognized the lease as an operating lease.
Belle Corporation Annual Repor t 201130
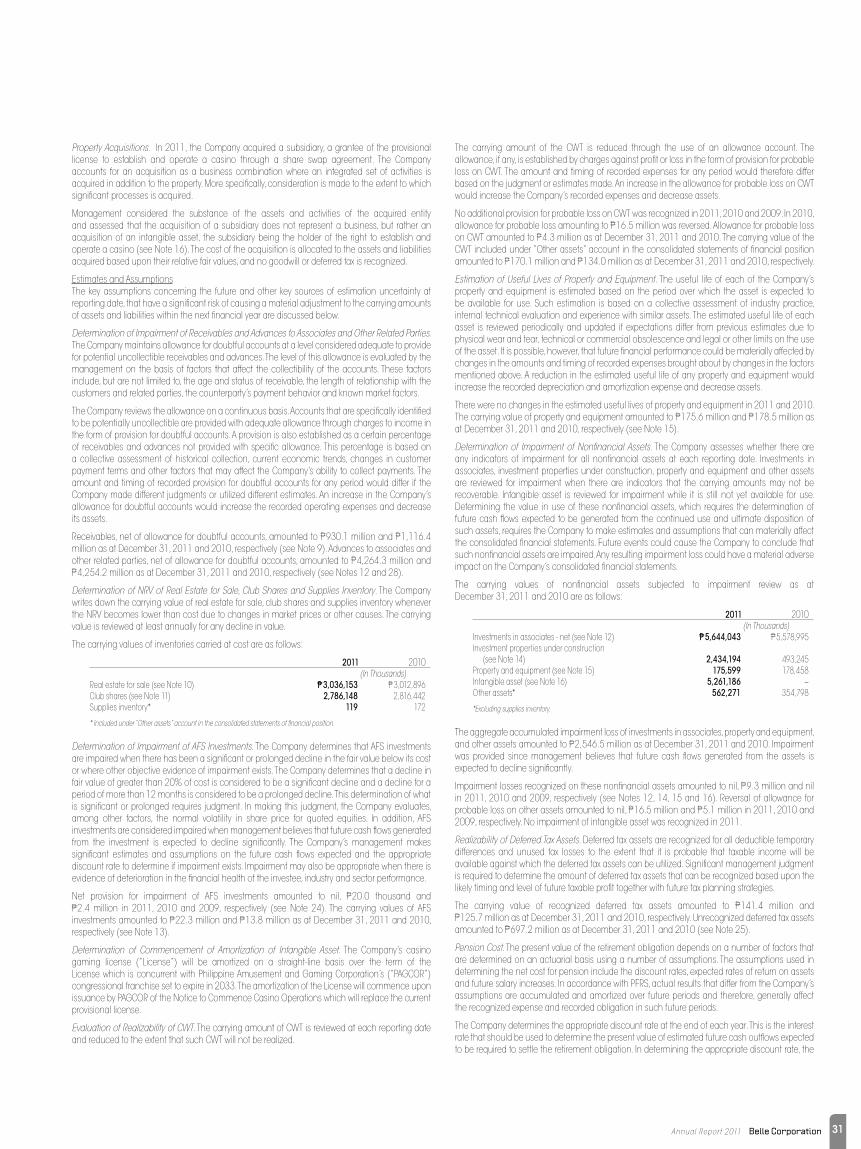
Property Acquisitions. In 2011, the Company acquired a subsidiary, a grantee of the provisional license to establish and operate a casino through a share swap agreement. The Company accounts for an acquisition as a business combination where an integrated set of activities is acquired in addition to the property. More specifically, consideration is made to the extent to which significant processes is acquired.
Management considered the substance of the assets and activities of the acquired entity and assessed that the acquisition of a subsidiary does not represent a business, but rather an acquisition of an intangible asset, the subsidiary being the holder of the right to establish and operate a casino (see Note 16). The cost of the acquisition is allocated to the assets and liabilities acquired based upon their relative fair values, and no goodwill or deferred tax is recognized.
Estimates and AssumptionsThe key assumptions concerning the future and other key sources of estimation uncertainty at reporting date, that have a significant risk of causing a material adjustment to the carrying amounts of assets and liabilities within the next financial year are discussed below.
Determination of Impairment of Receivables and Advances to Associates and Other Related Parties. The Company maintains allowance for doubtful accounts at a level considered adequate to provide for potential uncollectible receivables and advances. The level of this allowance is evaluated by the management on the basis of factors that affect the collectibility of the accounts. These factors include, but are not limited to, the age and status of receivable, the length of relationship with the customers and related parties, the counterparty’s payment behavior and known market factors.
The Company reviews the allowance on a continuous basis. Accounts that are specifically identified to be potentially uncollectible are provided with adequate allowance through charges to income in the form of provision for doubtful accounts. A provision is also established as a certain percentage of receivables and advances not provided with specific allowance. This percentage is based on a collective assessment of historical collection, current economic trends, changes in customer payment terms and other factors that may affect the Company’s ability to collect payments. The amount and timing of recorded provision for doubtful accounts for any period would differ if the Company made different judgments or utilized different estimates. An increase in the Company’s allowance for doubtful accounts would increase the recorded operating expenses and decrease its assets.
Receivables, net of allowance for doubtful accounts, amounted to P=930.1 million and P=1,116.4 million as at December 31, 2011 and 2010, respectively (see Note 9). Advances to associates and other related parties, net of allowance for doubtful accounts, amounted to P=4,264.3 million and P=4,254.2 million as at December 31, 2011 and 2010, respectively (see Notes 12 and 28).
Determination of NRV of Real Estate for Sale, Club Shares and Supplies Inventory. The Company writes down the carrying value of real estate for sale, club shares and supplies inventory whenever the NRV becomes lower than cost due to changes in market prices or other causes. The carrying value is reviewed at least annually for any decline in value.
The carrying values of inventories carried at cost are as follows:
2011 2010 (In Thousands)Real estate for sale (see Note 10) P=3,036,153 P=3,012,896Club shares (see Note 11) 2,786,148 2,816,442Supplies inventory* 119 172
* Included under “Other assets” account in the consolidated statements of financial position.
Determination of Impairment of AFS Investments. The Company determines that AFS investments are impaired when there has been a significant or prolonged decline in the fair value below its cost or where other objective evidence of impairment exists. The Company determines that a decline in fair value of greater than 20% of cost is considered to be a significant decline and a decline for a period of more than 12 months is considered to be a prolonged decline. This determination of what is significant or prolonged requires judgment. In making this judgment, the Company evaluates, among other factors, the normal volatility in share price for quoted equities. In addition, AFS investments are considered impaired when management believes that future cash flows generated from the investment is expected to decline significantly. The Company’s management makes significant estimates and assumptions on the future cash flows expected and the appropriate discount rate to determine if impairment exists. Impairment may also be appropriate when there is evidence of deterioration in the financial health of the investee, industry and sector performance.
Net provision for impairment of AFS investments amounted to nil, P=20.0 thousand and P=2.4 million in 2011, 2010 and 2009, respectively (see Note 24). The carrying values of AFS investments amounted to P=22.3 million and P=13.8 million as at December 31, 2011 and 2010, respectively (see Note 13).
Determination of Commencement of Amortization of Intangible Asset. The Company’s casino gaming license (“License”) will be amortized on a straight-line basis over the term of the License which is concurrent with Philippine Amusement and Gaming Corporation’s (“PAGCOR”) congressional franchise set to expire in 2033. The amortization of the License will commence upon issuance by PAGCOR of the Notice to Commence Casino Operations which will replace the current provisional license.
Evaluation of Realizability of CWT. The carrying amount of CWT is reviewed at each reporting date and reduced to the extent that such CWT will not be realized.
The carrying amount of the CWT is reduced through the use of an allowance account. The allowance, if any, is established by charges against profit or loss in the form of provision for probable loss on CWT. The amount and timing of recorded expenses for any period would therefore differ based on the judgment or estimates made. An increase in the allowance for probable loss on CWT would increase the Company’s recorded expenses and decrease assets.
No additional provision for probable loss on CWT was recognized in 2011, 2010 and 2009. In 2010, allowance for probable loss amounting to P=16.5 million was reversed. Allowance for probable loss on CWT amounted to P=4.3 million as at December 31, 2011 and 2010. The carrying value of the CWT included under “Other assets” account in the consolidated statements of financial position amounted to P=170.1 million and P=134.0 million as at December 31, 2011 and 2010, respectively.
Estimation of Useful Lives of Property and Equipment. The useful life of each of the Company’s property and equipment is estimated based on the period over which the asset is expected to be available for use. Such estimation is based on a collective assessment of industry practice, internal technical evaluation and experience with similar assets. The estimated useful life of each asset is reviewed periodically and updated if expectations differ from previous estimates due to physical wear and tear, technical or commercial obsolescence and legal or other limits on the use of the asset. It is possible, however, that future financial performance could be materially affected by changes in the amounts and timing of recorded expenses brought about by changes in the factors mentioned above. A reduction in the estimated useful life of any property and equipment would increase the recorded depreciation and amortization expense and decrease assets.
There were no changes in the estimated useful lives of property and equipment in 2011 and 2010. The carrying value of property and equipment amounted to P=175.6 million and P=178.5 million as at December 31, 2011 and 2010, respectively (see Note 15).
Determination of Impairment of Nonfinancial Assets. The Company assesses whether there are any indicators of impairment for all nonfinancial assets at each reporting date. Investments in associates, investment properties under construction, property and equipment and other assets are reviewed for impairment when there are indicators that the carrying amounts may not be recoverable. Intangible asset is reviewed for impairment while it is still not yet available for use. Determining the value in use of these nonfinancial assets, which requires the determination of future cash flows expected to be generated from the continued use and ultimate disposition of such assets, requires the Company to make estimates and assumptions that can materially affect the consolidated financial statements. Future events could cause the Company to conclude that such nonfinancial assets are impaired. Any resulting impairment loss could have a material adverse impact on the Company’s consolidated financial statements.
The carrying values of nonfinancial assets subjected to impairment review as at December 31, 2011 and 2010 are as follows:
2011 2010 (In Thousands)Investments in associates - net (see Note 12) P=5,644,043 P=5,578,995Investment properties under construction (see Note 14) 2,434,194 493,245Property and equipment (see Note 15) 175,599 178,458Intangible asset (see Note 16) 5,261,186 –Other assets* 562,271 354,798
*Excluding supplies inventory.
The aggregate accumulated impairment loss of investments in associates, property and equipment, and other assets amounted to P=2,546.5 million as at December 31, 2011 and 2010. Impairment was provided since management believes that future cash flows generated from the assets is expected to decline significantly.
Impairment losses recognized on these nonfinancial assets amounted to nil, P=9.3 million and nil in 2011, 2010 and 2009, respectively (see Notes 12, 14, 15 and 16). Reversal of allowance for probable loss on other assets amounted to nil, P=16.5 million and P=5.1 million in 2011, 2010 and 2009, respectively. No impairment of intangible asset was recognized in 2011.
Realizability of Deferred Tax Assets. Deferred tax assets are recognized for all deductible temporary differences and unused tax losses to the extent that it is probable that taxable income will be available against which the deferred tax assets can be utilized. Significant management judgment is required to determine the amount of deferred tax assets that can be recognized based upon the likely timing and level of future taxable profit together with future tax planning strategies.
The carrying value of recognized deferred tax assets amounted to P=141.4 million and P=125.7 million as at December 31, 2011 and 2010, respectively. Unrecognized deferred tax assets amounted to P=697.2 million as at December 31, 2011 and 2010 (see Note 25).
Pension Cost. The present value of the retirement obligation depends on a number of factors that are determined on an actuarial basis using a number of assumptions. The assumptions used in determining the net cost for pension include the discount rates, expected rates of return on assets and future salary increases. In accordance with PFRS, actual results that differ from the Company’s assumptions are accumulated and amortized over future periods and therefore, generally affect the recognized expense and recorded obligation in such future periods.
The Company determines the appropriate discount rate at the end of each year. This is the interest rate that should be used to determine the present value of estimated future cash outflows expected to be required to settle the retirement obligation. In determining the appropriate discount rate, the
31 Annual Repor t 2011 Belle Corporation

Company considers the interest rates on government bonds that are denominated in the currency in which the benefits will be paid, and that have terms to maturity approximating the terms of the related pension liability.
The assumption of the expected return on plan assets is determined on a uniform basis, taking into consideration the long-term historical returns, asset allocation and future estimates of long-term investment returns.
Other key assumptions for pension liability are based in part on current market conditions.
While it is believed that the Company’s assumptions are reasonable and appropriate, significant differences in actual experience or significant changes in assumptions may materially affect the Company’s retirement obligation.
Pension liability amounted to P=8.4 million and P=11.3 million as at December 31, 2011 and 2010, respectively (see Note 27).
Legal Contingencies. The Company is currently involved in legal and administrative proceedings. The Company’s estimate of the probable costs for the resolution of these claims has been developed in consultation with outside legal counsel handling defense in these matters and is based upon an analysis of potential results. The Company currently does not believe these proceedings will have a material adverse effect on its financial statements. It is possible, however, that future financial performance could be materially affected by changes in the estimates or in the effectiveness of strategies relating to these proceedings (see Note 30).
No provision for probable losses has been recognized in 2011, 2010 and 2009.
6. Future Changes in Accounting Policies
The Company will adopt the following standards and interpretations enumerated below when these become effective. Except as otherwise indicated, the Company does not expect the adoption of these new and amended PFRS and Philippine Interpretations to have significant impact on its consolidated financial statements.
Effective in 2012
• PAS12, Income Taxes - Recovery of Underlying Assets (effective for annual periods beginning on or after January 1, 2012)
The amendment clarified the determination of deferred tax on investment property measured at fair value. The amendment introduces a rebuttable presumption that deferred tax on investment property measured using the fair value model in PAS 40 should be determined on the basis that its carrying amount will be recovered through sale. Furthermore, it introduces the requirement that deferred tax on non-depreciable assets that are measured using the revaluation model in PAS 16 always be measured on a sale basis of the asset.
• PFRS7,Financial Instruments: Disclosures - Enhanced Derecognition Disclosure Requirements (effective for annual periods beginning on or after July 1, 2011)
The amendment requires additional disclosure about financial assets that have been transferred but not derecognized to enable the user of the Company’s financial statements to understand the relationship with those assets that have not been derecognized and their associated liabilities. In addition, the amendment requires disclosures about continuing involvement in derecognized assets to enable the user to evaluate the nature of, and risks associated with, the entity’s continuing involvement in those derecognized assets. The amendment affects disclosures only and has no impact on the Company’s financial position or performance.
Effective Subsequent to 2012
• PAS 1, Financial Statement Presentation - Presentation of Items of Other Comprehensive Income (effective for annual periods beginning on or after July 1, 2012)
The amendments to PAS 1 change the grouping of items presented in other comprehensive income. Items that could be reclassified (or “recycled”) to profit or loss at a future point in time (for example, upon derecognition or settlement) would be presented separately from items that will never be reclassified. The amendment affects presentation only and has therefore no impact on the Company’s financial position or performance.
• PAS19,Employee Benefits (Amendment) (effective for annual periods beginning on or after January 1, 2013)
Amendments to PAS 19 range from fundamental changes such as removing the corridor mechanism and the concept of expected returns on plan assets to simple clarifications and re-wording. The Company is currently assessing the impact of the amendment to PAS 19.
• PAS 27, Separate Financial Statements (as revised in 2011) (effective for annual periods beginning on or after January 1, 2013)
As a consequence of the new PFRS 10, Consolidated Financial Statements, and PFRS 12, Disclosure of Interests in Other Entities, what remains of PAS 27 is limited to accounting for subsidiaries, jointly controlled entities, and associates in separate financial statements.
• PAS28,Investments in Associates and Joint Ventures (as revised in 2011) (effective for annual periods beginning on or after January 1, 2013)
As a consequence of the new PFRS 11, Joint Arrangements, and PFRS 12, PAS 28 has been renamed PAS 28, Investments in Associates and Joint Ventures, and describes the application of the equity method to investments in joint ventures in addition to associates.
• PFRS7,Financial Instruments: Disclosures - Offsetting Financial Assets and Financial Liabilities (effective for annual periods beginning on or after January 1, 2013, with retrospective application)
These amendments require an entity to disclose information about rights of set-off and related arrangements (such as collateral agreements). The new disclosures are required for all recognized financial instruments that are set off in accordance with PAS 32. These disclosures also apply to recognized financial instruments that are subject to an enforceable master netting arrangement or ‘similar agreement’, irrespective of whether they are set-off in accordance with PAS 32. The amendments require entities to disclose, in a tabular format unless another format is more appropriate, the following minimum quantitative information. This is presented separately for financial assets and financial liabilities recognized at the end of the reporting period:
a) The gross amounts of those recognized financial assets and recognized financial liabilities
b) The amounts that are set off in accordance with the criteria in PAS 32 when determining the net amounts presented in the statement of financial position
c) The net amounts presented in the statement of financial positiond) The amounts subject to an enforceable master netting arrangement or similar agreement
that are not otherwise included in (b) above, including:
i. Amounts related to recognized financial instruments that do not meet some or all of the offsetting criteria in PAS 32
ii. Amounts related to financial collateral (including cash collateral)
e) The net amount after deducting the amounts in (d) from the amounts in (c) above
The amendment affects disclosures only and has no impact on the Company’s financial position or performance.
• PFRS10,Consolidated Financial Statements (effective for annual periods beginning on or after January 1, 2013)
PFRS 10 replaces the portion of PAS 27, Consolidated and Separate Financial Statements, that addresses the accounting for consolidated financial statements. It also includes the issues raised in SIC-12, Consolidation - Special Purpose Entities. PFRS 10 establishes a single control model that applies to all entities including special purpose entities. The changes introduced by PFRS 10 will require management to exercise significant judgment to determine which entities are controlled, and therefore, are required to be consolidated by a parent, compared with the requirements that were in PAS 27.
• PFRS 11, Joint Arrangements (effective for annual periods beginning on or after January 1, 2013)
PFRS 11 replaces PAS 31, Interests in Joint Ventures, and SIC-13, Jointly-controlled Entities - Non-monetary Contributions by Venturers. PFRS 11 removes the option to account for jointly controlled entities (JCEs) using proportionate consolidation. Instead, JCEs that meet the definition of a joint venture must be accounted for using the equity method. The application of this new standard will have no impact on the financial position of the Company.
• PFRS12,Disclosure of Involvement with Other Entities (effective for annual periods beginning on or after January 1, 2013)
PFRS 12 includes all of the disclosures that were previously in PAS 27 related to consolidated financial statements, as well as all of the disclosures that were previously included in PAS 31 and PAS 28. These disclosures relate to an entity’s interests in subsidiaries, joint arrangements, associates and structured entities. A number of new disclosures are also required.
• PFRS 13, Fair Value Measurement (effective for annual periods beginning on or after January 1, 2013)
PFRS 13 establishes a single source of guidance under PFRS for all fair value measurements. PFRS 13 does not change when an entity is required to use fair value, but rather provides guidance on how to measure fair value under PFRS when fair value is required or permitted. The Company is currently assessing the impact that this standard will have on the financial position and performance.
• PhilippineInterpretationIFRIC20,Stripping Costs in the Production Phase of a Surface Mine (effective for annual periods beginning on or after January 1, 2013)
This interpretation applies to waste removal costs that are incurred in surface mining activity during the production phase of the mine (“production stripping costs”) and provides guidance on the recognition of production stripping costs as an asset and measurement of the stripping activity asset.
Belle Corporation Annual Repor t 201132

• PAS32,Financial Instruments: Presentation - Offsetting Financial Assets and Financial Liabilities (effective for annual periods beginning on or after January 1, 2014, with retrospective application)
These amendments to PAS 32 clarify the meaning of “currently has a legally enforceable right to set-off” and also clarify the application of the PAS 32 offsetting criteria to settlement systems (such as central clearing house systems) which apply gross settlement mechanisms that are not simultaneous. While the amendment is expected not to have any impact on the net assets of the Company, any changes in offsetting is expected to impact leverage ratios and regulatory capital requirements. The Company is currently assessing the impact of the amendments to PAS 32.
• PFRS9,Financial Instruments: Classification and Measurement (effective for annual periods beginning on or after January 1, 2015)
PFRS 9 as issued reflects the first phase on the replacement of PAS 39 and applies to classification and measurement of financial assets and financial liabilities as defined in PAS 39. In subsequent phases, hedge accounting and impairment of financial assets will be addressed with the completion of this project expected on the first half of 2012. The adoption of the first phase of PFRS 9 will have an effect on the classification and measurement of the Company’s financial assets, but will potentially have no impact on classification and measurements of financial liabilities. The Company will quantify the effect in conjunction with the other phases, when issued, to present a comprehensive picture
• PhilippineInterpretationIFRIC15,Agreements for the Construction of Real Estate
This interpretation covers accounting for revenue and associated expenses by entities that undertake the construction of real estate directly or through subcontractors. The interpretation requires that revenue on construction of real estate be recognized only upon completion, except when such contract qualifies as construction contract to be accounted for under PAS 11, Construction Contracts, or involves rendering of services in which case revenue is recognized based on stage of completion. Contracts involving provision of services with the construction materials and where the risks and reward of ownership are transferred to the buyer on a continuous basis will also be accounted for based on stage of completion. The Securities and Exchange Commission (“SEC’) and the Financial Reporting Standards Council have deferred the effectivity of this interpretation until the final revenue standard is issued by International Accounting Standards Board and an evaluation of the requirements of the final revenue standard against the practices of the Philippine real estate industry is completed. The adoption of this interpretation will result in the change in the Company’s revenue and cost recognition from percentage of completion method to completed contract.
The Company continues to assess the impact of the above new, amended and improved accounting standards and interpretations effective subsequent to December 31, 2011 on its consolidated financial statements in the period of initial application. Additional disclosures required by these amendments will be included in the Company’s consolidated financial statements when these amendments are adopted.
7. Segment Information
The primary segment reporting format is presented based on business segments in which the Company’s risks and rates of return are affected predominantly by differences in the products and services provided. Thus, the operating businesses are organized and managed separately according to the nature of the products and services provided, with each segment representing a strategic business unit that offers different products and serves different markets.
The Company is in the businesses of real estate development and gaming and gaming-related activities, among others.
Financial information about the Company’s business segments are shown below:
2011 Gaming and Gaming Real Estate Related Eliminations/ Development Activities Others Adjustments Consolidated (In Thousands)Earnings InformationRevenue P=696,521 P=– P=– P=– P696,521Costs and expenses (461,787) (9,153) (201) – (471,141)Equity in net earnings of associates (10,391) 150,875 – – 140,484Interest expense (158,160) – – – (158,160)Interest income 28,419 79 – – 28,498Provision for income tax 23,102 – – – 23,102Net profit (loss) for the year 58,907 141,781 (228) – 200,460Net profit (loss) attributable to equity holders of the parent 58,907 141,781 (228) 57 200,517
(Forward)
2011 Gaming and Gaming Real Estate Related Eliminations/ Development Activities Others Adjustments Consolidated (In Thousands)Other Information Investments in and advances to associates P=9,001,613 P=146,923 P=760 (P=7,031,130) P=2,118,166Available-for-sale investments 17,954 1,106,869 33,446 (1,135,933) 22,336Advances to related parties 457,764 – – – 457,764Segment assets 6,532,579 68,770 53,061 13,390,852 20,045,262Segment liabilities 120,669 700 2,148,402 (716,835) 1,552,936Consolidated total assets 16,009,921 1,322,551 87,268 5,223,788 22,643,528Consolidated total liabilities 3,587,558 811,739 2,169,159 – 6,568,456Capital expenditures (1,965,149) – – – (1,965,149)Depreciation and amortization (26,954) (4) (101) – (27,059)
2010 Gaming and Gaming Real Estate Related Eliminations/ Development Activities Others Adjustments Consolidated (In Thousands)
Earnings Information Revenue P=1,263,123 P=– P=– P=– P=1,263,123Costs and expenses (729,246) (1,046) (118) – (730,410)Equity in net earnings of associates 5,811 150,373 – – 156,184Interest expense (191,353) – – – (191,353)Interest income 3,556 – – – 3,556Provision for income tax (76,554) – – – (76,554)Net profit (loss) for the year 316,306 149,293 (131) – 465,468Net profit (loss) attributable toequity holders of the parent 316,306 149,293 (131) 67 465,535Other Information Investments in and advances to associates 2,506,337 151,642 763 (607,860) 2,050,882Available-for-sale investments 13,751 – – – 13,751Advances to related parties 449,958 – – – 449,958Segment assets 8,430,617 66,985 53,308 (537,445) 8,013,465Segment liabilities 2,015,344 391 (825) (669,310) 1,345,600Consolidated total assets 11,400,663 218,626 54,072 (1,145,305) 10,528,056Consolidated total liabilities 7,582,433 805,775 19,931 (4,058,373) 4,349,766Capital expenditures (521,638) – – – (521,638) Depreciation and amortization (21,179) – – – (21,179)
2009 Gaming and Gaming Real Estate Related Eliminations/ Development Activities Others Adjustments Consolidated (In Thousands)
Earnings Information Revenue P=1,486,010 P=– P=33 (P=82,887) P=1,403,156Costs and expenses (911,249) (975) (273) 40,676 (871,821)Equity in net earnings of associates 11,133 92,166 14,602 – 117,901Interest expense (207,062) – – – (207,062)Interest income 2,779 1 – – 2,780Provision for income tax (73,894) – – – (73,894)Net profit (loss) for the year 295,069 91,017 (255) – 385,831Net profit (loss) attributable toequity holders of the parent 295,069 91,017 (255) 86 385,917Other Information Investments in and advances to associates 2,755,768 425,529 29,250 (1,278,662) 1,931,885Available-for-sale investments 13,014 – – – 13,014Advances to related parties 460,343 – – – 460,343Segment assets 8,002,378 51,329 14,514 (500,000) 7,568,221Segment liabilities 1,415,015 423 (783) – 1,414,655Consolidated total assets 11,231,502 476,858 43,764 (1,778,662) 9,973,462Consolidated total liabilities 5,236,996 759,292 2,168,982 (3,891,707) 4,273,563Capital expenditures (82,308) – – – (82,308)Depreciation and amortization (29,777) – (101) – (29,878)
33 Annual Repor t 2011 Belle Corporation

The following illustrate the reconciliations of reportable segment revenues, net profit, assets and liabilities to the Company’s corresponding amounts:
2011 2010 2009 (In Thousands)Revenues Total revenue for reportable segments P=696,521 P=1,263,123 P=1,486,043Elimination for intercompany revenue – – (82,887)Consolidated revenue P=696,521 P=1,263,123 P=1,403,156
Net Profit for the Year Total profit for reportable segments P=200,460 P=465,468 P=428,042Elimination for intercompany profits – – (42,211)Consolidated net profit P=200,460 P=465,468 P=385,831
Assets Total assets for reportable segments P=20,045,262 P=8,013,465 P=7,568,221Investments in and advances to associates 2,118,166 2,050,882 1,931,885AFS investments 22,336 13,751 13,014Advances to related parties 457,764 449,958 460,343Consolidated assets P=22,643,528 P=10,528,056 P=9,973,463
Liabilities Total liabilities for reportable segments P=1,552,936 P=1,345,600 P=1,414,655Loans payable 2,155,857 1,743,069 1,545,828Long-term debt 2,559,584 964,993 1,016,941Assignment of receivables with recourse – 5,027 16,417Deferred tax liabilities 85,468 78,338 50,790Advances from related parties* 214,611 212,739 227,212Consolidated liabilities P=6,568,456 P=4,349,766 P=4,273,563* Presented under “Accounts payable and other liabilities” account in the consolidated statements of financial position.
Management monitors the operating results of its business units separately for the purpose of making decisions about resource allocation and performance assessment. Segment performance is evaluated based on operating profit or loss and is measured consistently with operating profit or loss in the consolidated financial statements. However, financing (including interest expense and interest income) and income taxes are managed as a whole and are not allocated to operating segments. Transfer prices between operating segments are on an arm’s length basis in a manner similar to transactions with third parties.
Capital expenditures consist of additions of property and equipment and expenditures on investment properties under construction.
8. Cash and Cash Equivalents
This account consists of:
2011 2010 (In Thousands)Cash on hand and in banks P=325,775 P=26,642Cash equivalents (see Note 28) 2,441,105 14,410 P=2,766,880 P=41,052
Cash in banks earn interest at the respective bank deposit rates. Cash equivalents are short-term investments which are made for varying periods within one day to three months depending on the immediate cash requirements of the Company and earn interest at the respective short-term investment rates.
Short-term investments with original maturities of more than three months to one year are shown separately in the consolidated statements of financial position (see Note 28).
Interest income earned from cash in banks, cash equivalents and short-term investments amounted to P=24.9 million, P=1.7 million and P=1.0 million in 2011, 2010 and 2009, respectively (see Note 23).
9. Receivables - net
This account consists of:
2011 2010 (In Thousands)Trade (see Note 28) P=873,176 P=1,053,133Dividend 42,501 42,501Others 49,219 55,540 964,896 1,151,174Less allowance for doubtful accounts 34,772 34,772 P=930,124 P=1,116,402
• Tradereceivablesarenoninterest-bearingandaregenerallycollectedininstallmentwithin3to5 years. Some trade receivables were restructured by the customers resulting to recognition of interest income amounting to P=3.6 million, P=1.9 million and P=1.8 million in 2011, 2010 and 2009, respectively (see Note 23).
• Dividendreceivableisdueanddemandable.
• Otherreceivablesmainlypertaintoadvancestothirdparty,whicharenoninterest-bearingandgenerally have 90 days term.
As at December 31, 2011 and 2010, trade receivables with nominal amount of P=921.0 million and P=1,115.4 million, respectively, were recorded initially at fair value. The fair value of the receivables was obtained by discounting future cash flows using applicable interest rates ranging from 2.9% to 6.1% and 2.9% to 9.1% as at December 31, 2011 and 2010. The unamortized discount amounted to P=47.9 million and P=62.2 million as at December 31, 2011 and 2010, respectively. Amortization of discount on trade receivables, shown under “Other revenue” account in the consolidated statements of comprehensive income, amounted to P=54.5 million, P=44.4 million and P=74.2 million in 2011, 2010 and 2009, respectively (see Note 21).
Movement of unamortized discount on trade receivables are as follows:
2011 2010 (In Thousands)Trade receivables at nominal amount P=921,034 P=1,115,353Less discount on trade receivables: Balance at beginning of year 62,220 60,244 Discount recognized during the year 40,103 46,385 Amortization during the year (see Note 21) (54,465) (44,409) Balance at end of year 47,858 62,220 P=873,176 P=1,053,133
As at December 31, 2010, the gross undiscounted trade receivables amounting to P=5.0 million, have been assigned as security for loans from China Banking Corporation (“China Bank”), an associate of SM Investments Corporation (“SMIC”), a stockholder (see Note 28). The assigned receivables were not derecognized as the Company retains substantially all risks and rewards of ownership of the assigned receivables. Accordingly, a liability was recognized for the same amount and shown as “Assignment of receivables with recourse” account in the consolidated statements of financial position. Interest expense recognized on assigned receivables with recourse amounted to P=48.5 million, P=47.8 million and P=29.2 million in 2011, 2010 and 2009, respectively (see Note 23).
As at December 31, 2011 and 2010, the gross undiscounted trade receivables amounting to P=582.0 million and P=742.2 million, respectively, have been assigned on a without recourse basis to Banco de Oro Unibank, Inc. (Banco de Oro), an associate of SMIC, a stockholder. Under the terms of the assignment, the Company will deliver all Contracts to Sell and customers’ copies of the Certificates of Title covered by these receivables to be held in custody by the counterparty until the receivables are paid and/or repurchased by the Company. The Company also agreed that the counterparty may at its sole option, assign, sell, transfer or otherwise dispose of, or encumber or create a lien or liability on the receivables in favor of any third party (see Note 28).
Trade receivables also include receivables amounting to P=105.7 million as at December 31, 2011 and 2010 arising from the transfer of Tagaytay Midlands Golf Club, Inc. (“TMGCI”) shares to Sinophil Corporation (“Sinophil”) amounting to P=198.0 million as at December 31, 2011 and 2010 (see Note 28).
Terms and conditions relating to related party receivables are disclosed in Note 28.
In 2010, the movement in the allowance for doubtful accounts is as follows:
Trade Others Total (In Thousands)
Balance at beginning of year P=5,085 P=27,261 P=32,346Provision (see Note 24) – 2,426 2,426Balance at end of year P=5,085 P=29,687 P=34,772
Allowance for doubtful accounts is determined using specific identification.
No provision for doubtful accounts was recognized in 2011.
10. Real Estate for Sale - at Cost
This account consists of:
2011 2010 (In Thousands)Land held for future development P=2,370,514 P=2,287,344Land under development (see Note 14) 413,898 561,517Residential lots 248,293 160,810Condominium units 3,448 3,225 P=3,036,153 P=3,012,896
Land held for future development consists of properties in Tagaytay City, Batangas and Cavite. It also includes certain parcels of land with a carrying value amounting to P=892.2 million as at
Belle Corporation Annual Repor t 201134
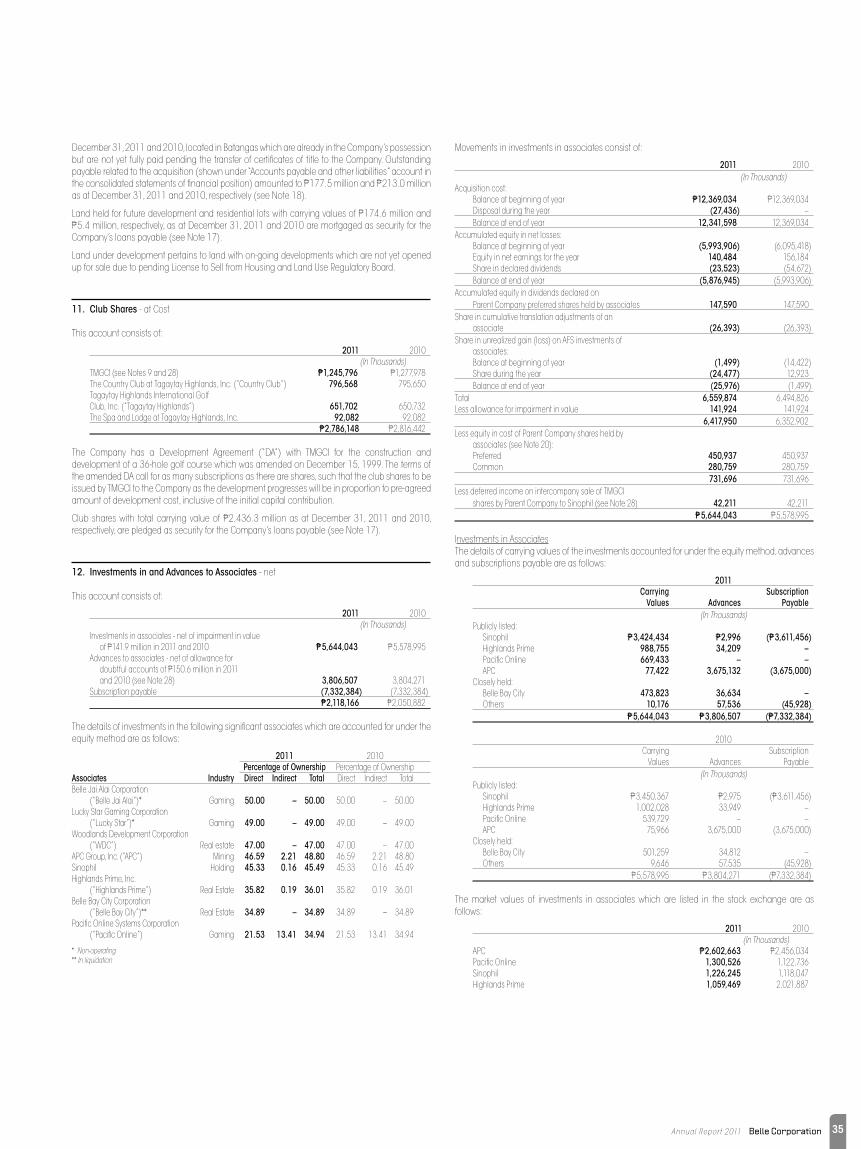
December 31, 2011 and 2010, located in Batangas which are already in the Company’s possession but are not yet fully paid pending the transfer of certificates of title to the Company. Outstanding payable related to the acquisition (shown under “Accounts payable and other liabilities” account in the consolidated statements of financial position) amounted to P=177.5 million and P=213.0 million as at December 31, 2011 and 2010, respectively (see Note 18).
Land held for future development and residential lots with carrying values of P=174.6 million and P=5.4 million, respectively, as at December 31, 2011 and 2010 are mortgaged as security for the Company’s loans payable (see Note 17).
Land under development pertains to land with on-going developments which are not yet opened up for sale due to pending License to Sell from Housing and Land Use Regulatory Board.
11. Club Shares - at Cost
This account consists of:
2011 2010 (In Thousands)TMGCI (see Notes 9 and 28) P=1,245,796 P=1,277,978The Country Club at Tagaytay Highlands, Inc. (“Country Club”) 796,568 795,650Tagaytay Highlands International GolfClub, Inc. (“Tagaytay Highlands”) 651,702 650,732The Spa and Lodge at Tagaytay Highlands, Inc. 92,082 92,082 P=2,786,148 P=2,816,442
The Company has a Development Agreement (“DA”) with TMGCI for the construction and development of a 36-hole golf course which was amended on December 15, 1999. The terms of the amended DA call for as many subscriptions as there are shares, such that the club shares to be issued by TMGCI to the Company as the development progresses will be in proportion to pre-agreed amount of development cost, inclusive of the initial capital contribution.
Club shares with total carrying value of P=2,436.3 million as at December 31, 2011 and 2010, respectively, are pledged as security for the Company’s loans payable (see Note 17).
12. Investments in and Advances to Associates - net
This account consists of:
2011 2010 (In Thousands)Investments in associates - net of impairment in value of P=141.9 million in 2011 and 2010 P=5,644,043 P=5,578,995Advances to associates - net of allowance for doubtful accounts of P=150.6 million in 2011 and 2010 (see Note 28) 3,806,507 3,804,271Subscription payable (7,332,384) (7,332,384) P=2,118,166 P=2,050,882
The details of investments in the following significant associates which are accounted for under the equity method are as follows:
2011 2010 Percentage of Ownership Percentage of OwnershipAssociates Industry Direct Indirect Total Direct Indirect TotalBelle Jai Alai Corporation (“Belle Jai Alai”)* Gaming 50.00 – 50.00 50.00 – 50.00Lucky Star Gaming Corporation (“Lucky Star”)* Gaming 49.00 – 49.00 49.00 – 49.00Woodlands Development Corporation (“WDC”) Real estate 47.00 – 47.00 47.00 – 47.00APC Group, Inc. (“APC”) Mining 46.59 2.21 48.80 46.59 2.21 48.80Sinophil Holding 45.33 0.16 45.49 45.33 0.16 45.49Highlands Prime, Inc. (“Highlands Prime”) Real Estate 35.82 0.19 36.01 35.82 0.19 36.01Belle Bay City Corporation (“Belle Bay City”)** Real Estate 34.89 – 34.89 34.89 – 34.89Pacific Online Systems Corporation (“Pacific Online”) Gaming 21.53 13.41 34.94 21.53 13.41 34.94
* Non-operating** In liquidation
Movements in investments in associates consist of:
2011 2010 (In Thousands)Acquisition cost: Balance at beginning of year P=12,369,034 P=12,369,034 Disposal during the year (27,436) – Balance at end of year 12,341,598 12,369,034Accumulated equity in net losses: Balance at beginning of year (5,993,906) (6,095,418) Equity in net earnings for the year 140,484 156,184 Share in declared dividends (23,523) (54,672) Balance at end of year (5,876,945) (5,993,906)Accumulated equity in dividends declared on Parent Company preferred shares held by associates 147,590 147,590Share in cumulative translation adjustments of an associate (26,393) (26,393)Share in unrealized gain (loss) on AFS investments of associates: Balance at beginning of year (1,499) (14,422) Share during the year (24,477) 12,923 Balance at end of year (25,976) (1,499)Total 6,559,874 6,494,826Less allowance for impairment in value 141,924 141,924 6,417,950 6,352,902Less equity in cost of Parent Company shares held by associates (see Note 20): Preferred 450,937 450,937 Common 280,759 280,759 731,696 731,696Less deferred income on intercompany sale of TMGCI shares by Parent Company to Sinophil (see Note 28) 42,211 42,211 P=5,644,043 P=5,578,995
Investments in AssociatesThe details of carrying values of the investments accounted for under the equity method, advances and subscriptions payable are as follows:
2011 Carrying Subscription Values Advances Payable
(In Thousands)Publicly listed: Sinophil P=3,424,434 P=2,996 (P=3,611,456) Highlands Prime 988,755 34,209 – Pacific Online 669,433 – – APC 77,422 3,675,132 (3,675,000)Closely held: Belle Bay City 473,823 36,634 – Others 10,176 57,536 (45,928) P=5,644,043 P=3,806,507 (P=7,332,384)
2010 Carrying Subscription Values Advances Payable
(In Thousands)Publicly listed: Sinophil P=3,450,367 P=2,975 (P=3,611,456) Highlands Prime 1,002,028 33,949 – Pacific Online 539,729 – – APC 75,966 3,675,000 (3,675,000)Closely held: Belle Bay City 501,259 34,812 – Others 9,646 57,535 (45,928) P=5,578,995 P=3,804,271 (P=7,332,384)
The market values of investments in associates which are listed in the stock exchange are as follows:
2011 2010 (In Thousands)APC P=2,602,663 P=2,456,034Pacific Online 1,300,526 1,122,736Sinophil 1,226,245 1,118,047Highlands Prime 1,059,469 2,021,887
35 Annual Repor t 2011 Belle Corporation

Condensed financial information of the following significant associates is shown below:
2011 2010 (In Thousands)APC: Current assets P=156,112 P=181,408 Noncurrent assets 442,516 423,711 Current liabilities 208,706 204,927 Noncurrent liabilities 103,807 107,361 Revenue 345,028 303,419 Expenses 321,271 277,841 Net income (loss) 21,656 (3,254)Sinophil: Current assets 88,675 94,475 Noncurrent assets 3,407,763 3,380,065 Current liabilities 53,119 52,557 Noncurrent liabilities 105,650 105,650 Revenue – – Expenses 6,676 7,403 Net loss 6,676 7,403Highlands Prime: Current assets 1,804,132 1,903,910 Noncurrent assets 2,856,551 3,114,996 Current liabilities 1,532,793 1,520,640 Noncurrent liabilities 404,037 738,806 Revenue from real estate sales 330,523 468,357 Cost of real estate sold 163,627 461,255 Net income (loss) (35,042) 8,220Pacific Online: Current assets 1,080,842 827,788 Noncurrent assets 592,717 445,236 Current liabilities 346,088 299,198 Noncurrent liabilities 74,312 138,512 Revenue 1,354,422 1,246,751 Expenses 894,117 892,714 Net income 392,062 430,343
Investment in Sinophil. In 1997, Belle together with Sinophil, entered into a Swap Agreement with Metroplex Berhad (“Metroplex”) whereby Sinophil issued 3,870,000,000 of its common shares in exchange for 46,381,600 shares of Legend International Resort H.K Limited. (“LIR HK”), a Hong Kong based company which is a subsidiary of Metroplex. In 1998, a dispute on the terms of the Swap Agreement about an unconditional guarantee issued by Metroplex on the combined net income of wholly owned subsidiaries of LIR-HK, caused Metroplex to advise Sinophil that it deemed the Swap Agreement terminated and will cause the cancellation of the shares covering the LIR-HK shares and the return of the Sinophil shares, which Sinophil, together with Belle, objected to.
On August 4, 1998, Belle, Sinophil and Metroplex entered into another agreement (“Agreement”) to confirm the validity of the aforementioned Swap Agreement. The terms of the Agreement again included among others, an unconditional guarantee by the Metroplex on the combined net income of LIR-HK’s wholly owned subsidiaries. The Agreement with Metroplex also provided that LIR-HK shall maintain a minimum equity of 20% in the Belle Bay Plaza Project. In 1998, LIR-HK advanced P=524.1 million to the Parent Company pending full payment of the subscription, which was intended as an equity contribution of LIR-HK in the Belle Bay Plaza Project. The shares will be issued to LIR-HK upon full payment of its subscription.
On August 23, 2001, a Memorandum of Agreement (“MOA”) was entered into by and among the Parent Company, Sinophil, Metroplex and LIR-HK rescinding the Swap Agreement and cancelling all obligations stated therein and reversing all the transactions as well as returning all the objects thereof in the following manner:
a. Metroplex shall surrender the certificates of Sinophil shares held by them in relation to the Swap Agreement. Belle shall then cause the reduction of the capital stock of Sinophil to the extent constituting Sinophil shares of stock surrendered by Metroplex and the cancellation and delisting of such shares from the PSE.
b. Sinophil shall surrender the LIR-HK shares back to Metroplex.
The MOA shall be deemed terminated should the regulatory agencies deny approval of Sinophil’s reduction of capital stock and the cancellation and delisting of such shares of stock, in which case the Swap Agreement shall continue to be in full force and effect, and Metroplex shall continue to hold its Sinophil shares, without prejudice to the parties continuing in good faith to explore other ways to unwind the Swap Agreement. The SEC has already approved Sinophil’s reduction of capital stock by 1,000,000,000 shares and 1,870,000,000 shares on June 24, 2008 and March 28, 2006, respectively. In 2009, Metroplex filed before the Court of appeals to review the Order of the SEC denying their petition to nullify the approval of the reduction of the capital stock of Sinophil.
As at February 22, 2012, the remaining 1,000,000,000 undelivered Sinophil shares of Metroplex are still being held by a creditor as collateral by Metroplex for loans obtained. Metroplex is negotiating for the release of such pledge to be able to carry out the terms of the MOA.
Investment in Highlands Prime. Investments in shares of stock of Highlands Prime with total carrying value of P=644.1 million and P=686.2 million as at December 31, 2011 and 2010, respectively, are pledged as security for the Company’s loans payable (see Note 17).
Investment in Pacific Online. The Company is also involved in gaming and gaming-related activities within the country, through Pacific Online. Pacific Online is engaged in lottery in Visayas and Mindanao. Investments in shares of stock of Pacific Online with total carrying value of P=283.5 million as at December 31, 2011 and 2010, are pledged as security for the Company’s loans payable (see Note 17).
Investment in Belle Bay City. Belle Bay City’s major development project is a 19-hectare mixed-use real estate development along Roxas Boulevard, on reclaimed land in Manila Bay. On June 27, 2003, the BOD of Belle Bay City approved the resolution to amend its articles of incorporation to shorten the corporate term from 50 years to end on January 31, 2004. The stockholders of Belle Bay City ratified the resolution on July 10, 2003. On January 27, 2005, the SEC approved the dissolution of Belle Bay City. In relation to the dissolution, the Parent Company partially received land with carrying value of P=252.1 million in 2005. In 2007, the Parent Company received additional land as part of its distributive share in Belle Bay City worth P=12.9 million. The land was conveyed to Sinophil as payment of advances. On December 6, 2011, the Company has sold 1,640 square meter land with carrying value of P=27.4 million to Light Rail Transit Authority (“LRTA”) for the construction of the guideway and concrete posts for the LRT 1 Cavite Extension Project which is being implemented by LRTA. Gain on sale amounting to P=10.2 million is presented under “Other revenue” account in the consolidated statements of comprehensive income (see Note 21). Belle Bay City has various parcels of land with total fair value of P=2,976.0 million and P=3,728.0 million as at December 31, 2011 and 2010 which are still for distribution to its stockholders. Belle Bay City’s land with total carrying value of P=338.7 million as at December 31, 2011 and 2010, are pledged as security for the Company’s long-term loans payable (see Note 19).
Investments in Belle Jai Alai and Lucky Star. Belle Jai Alai and Lucky Star are engaged in jai alai and other related games and nationwide online betting network related to jai alai games, respectively. In June 2001, the Supreme Court of the Philippines upheld its November 20, 2000 decision shutting down the jai-alai operations for lack of franchise which, it opined, can only be granted by the Philippine Congress. On the basis of such decision, Belle Jai Alai and Lucky Star were not able to operate their businesses. In 2001, Belle provided an allowance for impairment in value of its investments in Belle Jai Alai and Lucky Star amounting to P=266.9 million.
Allowance for Doubtful Accounts of Advances to AssociatesMovement in allowance for doubtful accounts determined using specific identification method is as follow:
2011 2010 (In Thousands)Balance at beginning of year P=150,582 P=148,382Provision during the year (see Note 24) – 2,200Balance at end of year P=150,582 P=150,582
13. AFS Investments
This account consists of:
2011 2010 (In Thousands)Shares of stock: Quoted P=15,197 P=6,263 Unquoted 2,758 2,758Club shares 4,381 4,730 P=22,336 P=13,751
The Company intends to hold these investments indefinitely in response to liquidity requirements or changes in market conditions.
Movement in AFS investments consists of:
2011 2010 (In Thousands)Acquisition cost: Balance at beginning of year P=34,306 P=33,549 Acquisition during the year – 757 Balance at end of year 34,306 34,306Unrealized gain on AFS investments: Balance at beginning of year – – Increase in fair value during the year 8,585 – Balance at end of year 8,585 –Less allowance for impairment in value: Balance at beginning of year 20,555 20,535 Provision during the year (see Note 24) – 20 Balance at end of year 20,555 20,555 P=22,336 P=13,751
AFS investments with total carrying value of P=15.2 million and P=6.3 million as at December 31, 2011 and 2010 are pledged as security for the Company’s loans payable (see Note 17).
Belle Corporation Annual Repor t 201136

14. Investment Properties under Construction
This account consists of:
2011 2010 (In Thousands)Casino building - construction in progress (“CIP”) P=1,676,695 P=414,235Hotel buildings - CIP 671,669 –Land 74,562 74,562Leasehold improvements (see Note 26) 11,268 4,448 P=2,434,194 P=493,245
The investment properties under construction pertain to the entertainment and resort facilities still under construction (see Note 29). Upon completion, the Company intends to lease out these properties to earn rentals.
In 2011, the Company changed its intention from selling condotels to leasing out the hotels as Belle Grande Suites. Consequently, costs incurred amounting to P=111.3 million as at December 31, 2010 previously classified as part of land under development under “Real estate for sale” account were reclassified to “Investment properties under construction” account in the consolidated statement of financial position (see Note 10).
As at December 31, 2011, borrowing costs amounting to P=107.3 million were capitalized as part of investment properties under construction (see Notes 17 and 19). The annual rate used to determine the amount of borrowing costs for capitalization was 7.02%.
The building casino and hotel buildings amounting to P=2,348.4 million in 2011 were mortgaged as security for the Company’s long-term loans payable as at December 31, 2011 (see Note 19).
15. Property and Equipment
This account consists of:
2011 Office Land and Machinery Condominium Furniture Leasehold and Units and Transportation Fixtures and Construction- Improvements Equipments Improvements Equipment Equipment In-progress Total (In Thousands)Cost Balance at beginning of year P=238,296 P=160,543 P=284,488 P=72,041 P=67,379 P=73,237 P=895,984Additions – 9,719 2,156 6,179 6,146 – 24,200Disposal (489) – – – – – (489)Balance at end of year 237,807 170,262 286,644 78,220 73,525 73,237 919,695Accumulated Depreciation, Amortization and Impairment Loss Balance at beginning of year 234,790 144,417 224,682 57,352 56,285 – 717,526 Depreciation andamortization for the year(see Note 22) 1,235 3,105 13,922 5,559 3,238 – 27,059 Disposal (489) – – – – – (489)Balance at end of year 235,536 147,522 238,604 62,911 59,523 – 744,096 Net Book Value P=2,271 P=22,740 P=48,040 P=15,309 P=14,002 P=73,237 P=175,599
2010 Office Land and Machinery Condominium Furniture Leasehold and Units and Transportation Fixtures and Construction- Improvements Equipments Improvements Equipment Equipment In-progress Total (In Thousands)Cost Balance at beginning of year P=238,296 P=183,241 P=282,851 P=64,401 P=62,493 P=72,321 P=903,603Additions – 9,777 1,637 10,958 5,105 916 28,393Disposal – (32,475) – (3,318) (219) – (36,012)Balance at end of year 238,296 160,543 284,488 72,041 67,379 73,237 895,984Accumulated Depreciation, Amortization and Impairment Loss Balance at beginning of year 233,637 175,369 213,400 55,814 54,019 – 732,239Depreciation and amortization for the year (see Note 22) 1,153 1,523 11,282 4,736 2,485 – 21,179Disposal – (32,475) – (3,198) (219) – (35,892)Balance at end of year 234,790 144,417 224,682 57,352 56,285 – 717,526Net Book Value P=3,506 P=16,126 P=59,806 P=14,689 P=11,094 P=73,237 P=178,458
In 2002, an impairment loss was recognized on certain property and equipment items, mainly land improvements, machinery and equipment and condominium units and improvements, as management had determined that such items of property and equipment may no longer be recovered. No additional provision for impairment in value of property and equipment was recognized in profit or loss in the consolidated statements of comprehensive income in 2011, 2010 and 2009. Allowance for impairment loss on property and equipment amounted to P=186.3 million as at December 31, 2011 and 2010.
The Company has disposed of certain property and equipment at a gain of P=2.9 million and P=0.4 million in 2010 and 2009, respectively (see Note 24).
16. Intangible Asset
Intangible asset pertains to the “License” of PLAI with a carrying value of P=5,261.2 million. PLAI is a grantee by the PAGCOR of a license to operate integrated resorts, including casinos. PLAI’s License runs concurrent with PAGCOR’s Congressional Franchise, set to expire in 2033.
On April 14, 2011, Belle has issued 2.7 billion new common shares valued at P=1.95 per share (“shares swap”) in exchange for shareholdings in PLAI constituting 100% of the outstanding capital stock of PLAI (see Note 29). The transfer and valuation of Belle for the shares swap was approved by SEC and BIR on October 16, 2010 and October 4, 2011, respectively. The related directly attributable costs amounting to P=20.5 million were charged against additional paid-in capital.
The License with total carrying value of P=5,261.2 million as at December 31, 2011 is pledged as security for the Company’s long-term loans payable (see Note 19).
17. Loans Payable
Loans payable represents peso-denominated loans obtained from local banks with interest ranging from 4.5% to 7.7% in 2011 and 7.0% to 8.9% in 2010 (see Note 28). Loans payable have historically been renewed or rolled-over. The carrying values of nonfinancial assets pledged as collateral for these loans are as follows:
2011 2010 (In Thousands)Club shares (see Note 11) P=2,436,291 P=2,436,291Shares of stock of Highlands Prime (see Note 12) 644,116 686,152Shares of stock of Pacific Online (see Note 12) 283,455 283,455Real estate for sale (see Note 10) 179,955 179,955AFS investments (see Note 13) 15,185 6,250 P=3,559,002 P=3,592,103
The interest expense on loans payable amounted to P=83.3 million, P=114.9 million and P=125.7 million in 2011, 2010 and 2009, respectively (see Note 23).
As at December 31, 2011, interest expense amounting to P=54.0 million was capitalized as part of investment properties under construction (see Note 14).
18. Accounts Payable and Other Liabilities
This account consists of:
2011 2010 (In Thousands)Trade P=750,635 P=558,905Customers’ deposits 35,182 46,988Accrued expenses Land transfer fees 291,738 315,418 Others 126,248 96,448Nontrade (see Note 10) 332,521 316,579Advances from related parties (see Note 28) 214,611 212,739 P=1,750,935 P=1,547,077
• Tradepayablesarenoninterest-bearingandarenormallyona90days’term.
• Customers’depositsincludecollectionsreceivedfrombuyerswhichhavenotmettherevenuerecognition criteria.
• Accruedexpensespertainmainlytoaccrualsofinterest,taxesandsellingexpenseswhicharenormally settled with an average term of 30 to 90 days.
• Nontradepayablesmainly includepayable relating to thepurchaseof land(seeNote10).These lands were acquired from various land owners in Tagaytay City, Batangas and Cavite. These are noninterest-bearing and are due and demandable. This also includes output VAT payable amounting to P=10.3 million and P=6.7 million as at December 31, 2011 and 2010, respectively.
37 Annual Repor t 2011 Belle Corporation

19. Long-term Debt
This account consists of:
2011 2010 (In Thousands)United States (“US”) Dollar floating rate notes (“FRNs”) P=964,993 P=964,933Loans payable 1,673,000 – 2,637,993 964,933Less debt issuance costs 78,409 – P=2,559,584 P=964,933
FRNsThe FRNs’ US Dollar denominated borrowings of 22.0 million is translated using the exchange rate of P=43.84 to US$1.0 at December 31, 2011 and 2010. This borrowing, amounting to US$22.0 million, is part of the principal amount of US$150.0 million that was originally due in May 2002 but was extended until May 2014. These FRNs are in bearer form and are issued in denominations of approximately US$250,000, with coupons attached at the time of issue.
The following are the significant terms and features of the US$22.0 million FRNs:
Interest Payment 2% p.a. over 6-month London Interbank Offered Rate (“LIBOR”) payable semi-annually in arrears in May and November of each year, starting May 2003 and up to maturity.
Redemption at the Option of the Parent Company
On certain conditions provided for in the terms of the FRNs.
Repurchase The Parent Company and any of its subsidiaries may purchase the FRNs provided that all unmatured coupons relating thereto are purchased therewith.
Reissuance All FRNs redeemed or purchased and any unmatured coupons attached to or surrendered with them shall be cancelled and may not be reissued or resold.
Restrictions and Covenants The Parent Company or any of its subsidiaries or any other person will not create or permit to be outstanding any security upon the whole or any part of its undertaking, assets or revenues, present or future, to secure any relevant indebtedness or any guarantee of or indemnity in respect of any relevant indebtedness according to the FRNs equal and ratable security or without having first obtained the approval of the Noteholders by extraordinary resolution.
The Parent Company also ensures that its payment obligations in respect of the FRNs rank at least pari passu with all its other unsecured obligations in respect of any indebtedness incurred by it under arrangements entered into after the date of issue of the FRNs.
Interest expense on FRNs amounted to P=26.1 million, P=27.7 million and P=43.7 million in 2011, 2010 and 2009, respectively (see Note 23).
Loans PayableOn December 1, 2010, the Parent Company (“Borrower”) obtained a loan facility in the amount of P=5,600.0 million from Banco de Oro (“Lender”) for the purpose of financing the construction of entertainment and resort facilities. The first drawdown amounting to P=570.0 million was made on April 13, 2011.
The following are the significant terms and features of the P=5,600.0 million loan facility:
Drawdowns The loan facility is available any time and from time to time during the period beginning on December 1, 2010 and ending on the earliest of: i) the date occurring 2 years thereafter, ii) the date the Commitment is fully drawn by the Borrower, or iii) the date the Commitment is cancelled or terminated in accordance with the provisions of the Omnibus Loan and Security Agreement (“OLSA”). Any amount of the commitment that remains undrawn after the availability period shall be automatically cancelled.
Repayment The Borrower shall repay the principal of the Loan in 21 consecutive quarterly installments on each Repayment Date commencing on the 24th month from the Initial Drawdown Date.
Interest Payment The Lender shall determine the interest rate that would apply for the relevant interest period, based on the applicable interest reference rate plus the applicable spread, and promptly give notice thereof to the Borrower and Banco de Oro – Trust and Investments Group, the Security Trustee. Interest on the unpaid principal amount of each Advance at the interest rate on each interest payment date for the interest period then ending should be paid by the Borrower.
The embedded early redemption and prepayment options are clearly and closely related to the host debt contract; thus, do not require to be bifurcated and accounted for separately in the host contract.
The Parent Company’s loans payable is secured by all of the Company’s lease and project receivables, an assignment of all rights, title and interest of the Company to its existing project agreements and performance guarantee and first ranking real estate mortgage on the present and future real assets with the Lender (see Notes 12, 14 and 16).
The carrying values of nonfinancial assets pledged as collateral for these loans in 2011 are as follows:
Amount (In Thousands)Intangible asset (see Note 16) P=5,261,186Investment properties under construction (see Note 14) 2,348,364Land held by an associate (see Note 12) 338,724 P=7,948,274
Interest expense on loans payable from OLSA amounting to P=49.0 million in 2011 were capitalized as part of investment properties under construction (see Note 14).
Debt Issuance Cost. As at December 31, 2011, loan transaction costs consisting of documentary stamp tax, professional fees and underwriting fees amounting to P=78.4 million were capitalized and presented as deduction from the related loan balance. Amortization of debt issuance cost in 2011 amounting to P=4.3 million was capitalized as part of “Investment properties under construction” account in the consolidated statement of financial position (see Note 14).
Covenants. OLSA contains, among others, provisions regarding the maintenance of certain financial ratios such as debt service coverage ratio, debt to equity ratio, current ratio and maintenance of debt service reserve account. The debt service reserve and accrual account wherein the level of funds shall at all times be at least equal to all payments to be made on the immediately succeeding payment date, is included as part of “Other assets” account in the consolidated statements of financial position. As of December 31, 2011, the Parent Company has complied with these covenants.
The repayments of loans based on existing terms are scheduled as follows:
Amount (In Thousands) 2013 P=100,380 2014 167,300 2015 234,220 2016 301,140 2017 onwards 869,960 P=1,673,000
20. Equity
Capital StockThe composition of the Company’s shares of capital stock is as follows:
2011 2010 Number Number of Shares Amount of Shares AmountPreferred stock: Authorized - P=1 par value 6,000,000,000 P=6,000,000,000 6,000,000,000 P=6,000,000,000 Issued (see Note 28) 1,000,000,000 1,000,000,000 1,000,000,000 1,000,000,000
Common: Authorized - P=1 par value 14,000,000,000 P=14,000,000,000 14,000,000,000 P=14,000,000,000 Issued 9,170,769,532 9,170,769,532 6,350,899,542 6,350,899,542 Subscribed 1,388,613,267 1,388,613,267 – –
Movements in issued common stock are as follows:
2011 2010 (In Thousands)Balance at beginning of year P=6,350,900 P=6,350,900Issuance during the year (see Note 29) 2,700,000 –Subscriptions during the year 119,870 – P=9,170,770 P=6,350,900
On September 29, 2011, the Parent Company’s stock rights offering was completed with a subscription of 1.508 billion common shares. Stockholders were entitled to 1 right for every 6 shares held as of September 2, 2011 at an exchange offering price of P=3.0 per share. The net proceeds of approximately P=4.5 billion from this offer will be used by the Parent Company to partially finance the construction of its entertainment and resort facilities (see Note 29).
As at December 31, 2011, 119,870 common shares of the total subscription have been fully paid and issued. As at December 31, 2011, subscription receivables expected to be collected within the
Belle Corporation Annual Repor t 201138

mandatory period of January 30, 2012 to February 3, 2012 amounted to P=2,082.9 million and is separately shown in the 2011 consolidated statement of financial position. The related directly attributable costs amounting to P=53.9 million were charged against additional paid-in capital.
The following are the salient features of the preferred shares:
Votingrights/convertibility Non-voting and non-convertible
Dividends 9.75% per annum, cumulative. Holders shall be entitled to receive out of the net profits or net assets of the Company available for dividends when and as declared by the BOD.
Others All shares of preferred stock of the same class shall rank equally and be identical in all respects regardless of series unless otherwise specified by the BOD, and if shares of any one series are issued at different terms, the subsequently issued shares need not be entitled to receive dividends previously paid on the outstanding shares of such series.
As at December 31, 2011 and 2010, the preferred shares are held by Sinophil. In 2009, Sinophil agreed to the renunciation of its rights to all past, present and future dividends. Sinophil also agreed to the revocation of the coupon rate originally provided for the preferred shares (see Notes 28 and 31).
The following summarizes the information on the Parent Company’s registration of securities under the Securities Regulation Code:
Authorized Number of Issue/ Date of SEC Approval Shares Shares Issued Offer Price August 20, 1973 6,000,000,000 6,000,000,000 P=0.01 March 19, 1976 2,000,000,000 464,900,000 0.01 December 7, 1990 – 920,000,000 0.01 1990 – 833,500,000 0.01 October 19,1990 (7,000,000,000) (8,136,216,000) 0.01 June 18, 1991 – 3,381,840 0.01 1991 – 47,435,860 1.00 1992 – 11,005,500 1.00 December 7, 1993 – 473,550,000 1.00 1993 – 95,573,400 1.00 January 24, 1994 – 100,000,000 1.00 August 3, 1994 – 2,057,948 7.00 August 3, 1994 – 960,375 10.00 June 6, 1995 – 138,257,863 1.00 February 14, 1995 1,000,000,000 – 1.00 March 8, 1995 – 312,068,408 1.00 March 17, 1995 2,000,000,000 – 1.00 March 28, 1995 – 627,068,412 1.00 July 5, 1995 – 78,060,262 1.00 September 1, 1995 – 100,000,000 1.00 March 1, 1995 – 94,857,072 1.00 September 13, 1995 – 103,423,030 1.00 1995 – 123,990,631 1.00 1996 – 386,225,990 1.00 February 21, 1997 10,000,000,000 – 1.00 1997 – 57,493,686 1.00 1998 – 36,325,586 1.00 March 19, 1999 – 16,600,000 1.00 April 26, 1999 – 450,000,000 1.00 April 27, 1999 – 300,000,000 1.00 1999 – 306,109,896 1.00 2000 – 2,266,666 1.00 2001 – 2,402,003,117 1.00 April 14, 2011 – 2,700,000,000 1.95 July 18, 2011 – 119,869,990 3.00 14,000,000,000 9,170,769,532
In a special meeting on November 18, 1989, the stockholders approved the increase in par value of capital stock from P=0.01 to P=1.00 and the decrease in the number of shares of authorized from 8.0 billion to 1.0 billion common shares. The resulting increase in par and reduction in the number of shares was approved by SEC on October 19, 1990.
On February 14, 1995, the SEC approved the increase in authorized capital stock from 1.0 billion shares with a par value of P=1.00 to 2.0 billion shares with the same par value. Subsequently, on March 17, 1995, the SEC approved another increase in authorized capital stocks from 2.0 billion shares to 4.0 billion shares with the same par value.
On February 21, 1997, the SEC approved the increase in the authorized capital stocks from 4.0 billion shares at a par value of P=1.00 per share to 20.0 billion shares divided into 6.0 billion preferred shares and 14 billion common shares, both at P=1.00 par value.
The Parent Company declared stock dividends in 1991 and 1995. The total number of share holders of the Parent Company is 2,035 and 2,349 as at December 31, 2011 and 2010, respectively.
Equity Share in Cost of Parent Company Common Shares Held by Associates There was no transaction that affected this account in 2011 and 2010.
Cost of Parent Company Shares Held by Subsidiaries Details of this account as at December 31, 2011 and 2010 are shown below:
Amount (In Thousands)Cost of Parent Company Common Held by Subsidiaries P=428,256Loss on Disposal of Parent Company Common Shares Held by Subsidiaries 69,502 P=497,758* There was no transaction in 2011 and 2010 that affected these accounts.
Parallax, SLW and other subsidiaries collectively holds 214,963,027 common shares of the Parent Company as at December 31, 2011 and 2010. These are presented as “Cost of Parent Company shares held by subsidiaries.”
Retained EarningsThe Company’s retained earnings of P=338.2 million and P=137.7 million as at December 31, 2011 and December 31, 2010, respectively, include accumulated equity in net losses of associates of P=5,876.9 million and P=5,993.9 million, respectively (see Note 12).
On May 25, 2005, the SEC approved the Parent Company’s application for a quasi-reorganization. Accordingly, the additional paid-in capital amounting to P=3,269.3 million as at December 31, 2004 was offset against the deficit. For purposes of dividend declaration, the retained earnings of the Company shall be restricted to the extent of the deficit wiped out by the additional paid-in capital.
21. Other Revenue
This account consists of:
2011 2010 2009 (In Thousands)Amortization of discount on trade receivables (see Note 9) P=54,465 P=44,409 P=74,185Income from forfeitures 15,707 10,567 11,150Service income from: Pumping stations 14,239 20,960 35,792 Power and maintenance 8,647 14,977 16,695Gain on sale of investment (LRTA) (see Note 12) 10,234 – –Penalty 5,056 4,088 109Commission income 887 524 1,638Others 5,040 3,612 3,773 P=114,275 P=99,137 P=143,342
22. Costs and Expenses
Cost of Real Estate and Club Shares Sold
2011 2010 2009 (In Thousands)Materials and labor P=119,125 P=231,243 P=220,000Cost of club shares sold 48,709 145,445 220,441Land 44,341 86,075 81,890Overhead and others 23,808 46,216 43,969 P=235,983 P=508,979 P=566,300
General and Administrative Expenses
2011 2010 2009 (In Thousands)Personnel costs (see Notes 27 and 28) P=75,077 P=63,473 P=61,400Marketing and advertising 51,169 34,082 132,985Depreciation and amortization (see Note 15) 27,059 21,179 29,878Taxes and licenses 20,888 33,342 20,969Professional fees 10,098 12,560 9,049Security and janitorial 9,264 9,889 8,873Rentals and utilities (see Note 26) 8,727 8,682 7,477Registration fees 7,267 1,779 705Repairs and maintenance 6,435 6,423 3,859Transportation and travel 4,474 3,401 3,625Representation and entertainment 3,992 4,723 2,888Communication 2,686 2,745 3,052Others 8,022 19,153 20,661 P=235,158 P=221,431 P=305,421
39 Annual Repor t 2011 Belle Corporation
Personnel Costs
2011 2010 2009 (In Thousands)Salaries and wages (see Note 28) P=52,140 P=44,025 P=43,395Pension costs (see Notes 27 and 28) 5,464 6,302 6,520Employee benefits and others (see Note 28) 17,473 13,146 11,485 P=75,077 P=63,473 P=61,400
23. Interest Income and Interest Expense
The sources of the Company’s interest income follows:
2011 2010 2009 (In Thousands)Cash in banks (see Note 8) P=1,166 P=542 P=326Cash equivalents (see Note 8): With related banks (see Note 28) 23,395 833 547 With other banks 281 293 157Short-term investments (see Note 8) 17 – –Receivables (see Note 9) 3,639 1,888 1,750 P=28,498 P=3,556 P=2,780
The sources of the Company’s interest expense follows:
2011 2010 2009 (In Thousands)Loans payable (see Notes 17 and 28) P=83,313 P=114,939 P=125,670Assignment of receivables with recourse (see Note 9) 48,547 47,765 29,155Long-term debt (see Note 19) 26,114 27,656 43,714Others 186 993 8,523 P=158,160 P=191,353 P=207,062
24. Other Charges - net
This account consists of:
2011 2010 2009 (In Thousands)Bank service charges P=12,880 P=13,434 P=6,287Provision for (reversal of) allowance: Probable loss on other assets - net – (11,030) 3,933 Impairment loss on advances to related parties (see Note 28) – 5,969 91 Doubtful accounts on receivables (see Note 9) – 2,426 (3,273) Doubtful accounts on advances to associates (see Note 12) – 2,200 – Impairment loss on AFS investments (see Note 13) – 20 2,415Gain on sale of property and equipment (see Note 15) – (2,934) (356)Others - net 30 515 5,115 P=12,910 P=10,600 P=14,212
25. Income Tax
The provision for current income tax consists of the following:
2011 2010 2009 (In Thousands)MCIT P=10,652 P=– P=–Capital gains tax and final tax on interest income 5,320 6,776 19,413Regular corporate income tax – 42,230 61,166 P=15,972 P=49,006 P=80,579
As at December 31, 2011, the carryforward benefit of MCIT amounting to P=10.7 million can be claimed as deduction against taxable income until year 2014.
The components of the Company’s net deferred tax liabilities are as follows:
2011 2010 (In Thousands)Deferred tax assets: Allowances for: Impairment in value of property and equipment P=55,891 P=55,891 Doubtful accounts 12,140 14,591 Probable losses 9,543 9,543 Impairment of supplies inventory 1,537 1,537
(Forward)
2011 2010 (In Thousands)Accrued selling expenses P=14,458 P=17,917 Discount on trade receivables 14,357 18,642 MCIT 10,652 – NOLCO 6,086 – Advance receipts 5,049 – Deferred lease income 4,357 – Unrealized profit on sale of club shares to associates 4,221 4,221 Pension liability 2,506 3,379 Accretion of refundable deposit 638 – 141,435 125,721Deferred tax liabilities: Unrealized foreign exchange gain (201,558) (201,891) Capitalized interest expense (16,204) – Unaccreted discount on refundable deposit (4,405) – Capitalized rent expense (3,336) – Unrealized gain on sale of real estate (797) (2,168) Deferred lease expense (603) – (226,903) (204,059) (P=85,468) (P=78,338)
The components of the Company’s temporary differences as at December 31, 2011 and 2010 for which deferred tax assets were not recognized follows:
2011 2010 (In Thousands)Allowances for: Impairment of project development costs P=2,136,820 P=2,136,820 Probable losses 177,175 177,175 Doubtful accounts 10,142 10,142 P=2,324,137 P=2,324,137
The deferred tax assets of the above temporary differences amounting to P=697.2 million as at December 31, 2011 and 2010, respectively, are not recognized in the books since management believes that it is not probable that taxable income will be available against which the deferred tax assets can be utilized.
The reconciliation between the provision for income tax computed at statutory tax rate and the provision for income tax shown in the consolidated statements of comprehensive income is as follows:
2011 2010 2009 (In Thousands)Income tax at statutory income tax rate of 30% P=67,069 P=162,607 P=137,918Nontaxable income (42,296) (51,784) (35,780)Income subjected to final tax (18,538) (41,245) (55,514)Nondeductible expenses and others 11,547 (164) 1,260Income subjected to capital gains tax 5,320 6,776 19,413Change in unrecognized deferred tax assets – 364 367Derecognition of deferred tax assets – – 6,230 P=23,102 P=76,554 P=73,894
Philippine Economic Zone Authority (“PEZA”)In 2010, the Company’s pre-qualification clearance from PEZA in relation with its efforts to secure a Tourism Economic Zone status for a portion of its flagship project, Tagaytay Highlands, has been approved. However, as at February 22, 2012, this approval has not yet been issued with a Presidential Proclamation.
26. Lease Commitments
Operating LeaseThe Company has operating lease agreement covering its office space which is renewable every year. Total rent expense charged to operations relating to this transaction amounted to P=1.2 million in years 2011, 2010 and 2009.
The Company entered into a lease agreement for parcel of land situated in Aseana Business Park, Parañaque City. The 20,218 square meter land area lease shall be for a period of 10 years commencing on April 23, 2010, inclusive of two years construction period. Rental payments are subject to escalation as stated in the agreement. The contract may be renewed or extended by written agreement of the parties and upon such terms and conditions that are mutually acceptable to them. The Company also paid P=4.4 million refundable deposit which formed part of “Other assets” account in the consolidated statements of financial position.
As at December 31, 2011 and 2010, the operating lease cost amounting to P=11.3 million and P=4.4 million was capitalized to leasehold improvements as the Company has started construction of the integrated resort (see Notes 14 and 29).
Belle Corporation Annual Repor t 201140

The future minimum rental payments by the Company under the lease agreement are as follows:
2011 2010Within one year P20,016 P=6,672After one year but not more than five years 156,215 107,346After more than five years 97,950 166,834 P=274,181 P=280,852
27. Pension Costs
The Company has a defined benefit pension plan covering all regular and permanent employees. The benefits are based on employees’ projected salaries and number of years of service.
The following tables summarize the components of pension costs recognized in the consolidated statements of comprehensive income and the pension liability recognized in the consolidated statements of financial position.
Pension Costs (recognized in “Costs and Expenses”)
2011 2010 2009 (In Thousands)Current service cost P=4,832 P=4,454 P=4,090Interest cost 3,265 3,942 3,626Expected return on plan assets (2,491) (1,860) (1,509)Net actuarial loss (gain) recognized (142) (234) 313 P=5,464 P=6,302 P=6,520
Pension Liability
2011 2010 (In Thousands)Present value of defined benefit obligation P=57,657 P=52,684FVPA (61,441) (49,826)Unfunded (funded) obligation (3,784) 2,858Unrecognized actuarial gain 12,138 8,404 P=8,354 P=11,262
Changes in the present value of the defined benefit obligation are as follows:
2011 2010 (In Thousands)Balance at beginning of year P=52,684 P=44,290Current service cost 4,832 4,454Interest cost 3,265 3,942Benefits paid (1,803) (1,315)Actuarial loss (gain) on obligation (1,321) 1,313 P=57,657 P=52,684
Changes in the FVPA are as follows:
2011 2010 (In Thousands)Balance at beginning of year P=49,826 P=37,198Expected return on plan assets 2,491 1,860Actual contributions 8,372 9,133Benefits paid (1,803) (1,315)Actuarial gain on FVPA 2,555 2,950 P=61,441 P=49,826
Actual return on plan assets P=5,046 P=4,810
Unrecognized actuarial gain is as follows:
2011 2010 (In Thousands)Net cumulative unrecognized actuarial gain (loss) at beginning of the year P=8,404 P=7,001Actuarial gain (loss) on obligation 1,321 (1,313)Recognized actuarial gain (142) (234)Actuarial gain on plan assets 2,555 2,950Net cumulative unrecognized actuarial gain at end of the year P=12,138 P=8,404
Movements in the pension liability are as follows: 2011 2010 (In Thousands)Balance at beginning of year P=11,262 P=14,093Pension costs 5,464 6,302Contributions to the retirement fund (8,372) (9,133) P=8,354 P=11,262
The overall expected rate of return on plan assets is determined based on the market prices prevailing on that date, applicable to the period over which the obligation is to be settled.
The unfunded obligation and experience adjustment for the current period and for the four preceding periods follows:
2011 2010 2009 2008 2007 (In Thousands)Defined benefit obligation P=57,657 P=52,684 P=44,290 P=54,775 P=46,831FVPA 61,441 49,826 37,198 28,900 22,517Unfunded (funded) obligation (3,784) 2,858 7,092 25,875 24,314Experience net adjustments on plan assets gain (loss) 2,555 2,950 4,214 (3,453) (411)
As Percentage of FVPA (%) 4.16 5.92 11.33 (11.95) (1.83)
The major categories of plan assets as a percentage of the fair value of total plan assets are as follows:
2011 2010Investments in fixed income securities 68% 72%Investments in unit investment trust funds 31% 27%Others 1% 1% 100% 100%
The principal assumptions used in determining pension benefit obligations for the Company’s plan are shown below:
2011 2010 2009Discount rates 6% 9% 9%Expected rates of return on plan assets 5% 5% 5%Future salary increases 7% 8% 8%
The tax exempt status of the plan was approved by the BIR on September 29, 1998.
28. Related Party Disclosures
Related parties are enterprises and individuals that has the ability to control directly, or indirectly through one or more intermediaries or are controlled by, or under common control with the Company, including holding companies, and subsidiaries, or exercise significant influence over the other party in making financial and operating decisions. Associates and individuals owning, directly or indirectly, an interest in the voting power of the Company that gives them significant influence over the enterprise, key management personnel, including directors and officers of the Company and close members of the family of these individuals and companies associated with these individuals also constitute related entities.
In considering each possible related entity relationship, attention is directed to the substance of the relationship, and not merely the legal form.
Settlement Agreement with Sinophil On October 7, 1997, Sinophil, a 45% owned entity of Belle, subscribed to 1,000,000,000 preferred shares from Belle at P=1.00 per share, with a coupon rate of 9.75% per annum (see Note 20). The accrued dividends on the preferred shares from 1997 to 1998 of P=92.3 million remained outstanding until August 2009. No additional dividends have been declared on the preferred shares after 1998 because of the absence of retained earnings in Belle.
On August 28, 2009, a Settlement Agreement (“SA”) was executed between Belle and Sinophil to settle the unpaid accrued dividends and to eventually cancel the preferred shares, subject to the transfer by Belle to Sinophil: (1) 220 shares in TMGCI, and (2) a 235,583 square meters of developed Rancho Montana land located in Tanauan, Batangas, completion of which is expected within five years from the date of the SA. The developed Rancho Montana land together with the 220 TMGCI shares shall be transferred to Sinophil at an aggregate value of at least P=1,092.3 million.
Immediately after the execution of the SA, Belle transferred the 220 TMGCI shares and executed a Deed of Assignment over the said TMGCI shares to Sinophil. Sinophil, on the other hand, executed a Release, Waiver and Quitclaim: (1) accepting the payment of dividends in the form of 220 shares in TMGCI; (2) renouncing its rights to all past, present and future dividends; (3) agreeing to the revocation of the coupon rate originally provided for the preferred shares; and (4) agreeing to the cancellation of all its preferred shares in Belle upon receipt of the developed Rancho Montana land.
Gain from the transfer, which were part of its normal gross profit, amounted to P=93.3 million. The Company’s proportionate share in the unrealized profit from the sale of TMGCI shares to Sinophil amounting to P=42.2 million has been deferred and will be recognized upon sale of TMGCI shares to unrelated party (see Note 12). As at December 31, 2011 and 2010, the Company’s related outstanding receivable (after offsetting the outstanding payable of P=92.3 million) amounting to P=105.7 million is presented as part of “Receivables” account in the consolidated statements of financial position (see Note 9).
41 Annual Repor t 2011 Belle Corporation

Other Transactions with Associates and Related CompaniesThe Company has the following significant related party transactions with associates and other related parties:
a. Extension/availment of advances with its associates and other related companies. These consist of the following:
2011 2010 (In Thousands)Advances to associates (see Note 12): APC P=3,675,132 P=3,675,000 Highlands Prime 34,209 33,949 Belle Bay City 36,634 34,812 WDC 28,007 28,007 Belle Jai Alai 29,398 18,200 Others 3,127 14,303 3,806,507 3,804,271Advances to other related parties (with common set of directors): Tagaytay Highlands 359,129 353,477 Country Club 88,069 89,404 Others 10,566 7,077 457,764 449,958 P=4,264,271 P=4,254,229
Advances from related parties (see Note 18): TMGCI P=70,966 P=72,594 Belle Jai Alai 60,753 60,753 Sinophil Leisure and Resorts Corp. (subsidiary of Sinophil) 29,072 29,110 Sinophil 23,028 28,130 Tagaytay Highlands 10,819 10,819 Pacific Online 10,016 10,093 Others 9,957 1,240 P=214,611 P=212,739
These advances are noninterest-bearing and outstanding balances at year-end are due and demandable. There have been no guarantees provided or received for any related party receivables or payables.
Allowance provided on advances to associates amounted to P=150.6 million as at December 31, 2011 and 2010 (see Note 12).
Allowance for doubtful accounts of advances to related parties amounted to P=7.1 million as at December 31, 2011 and 2010, respectively. Provision for doubtful accounts on advances to related parties amounted to nil, P=6.0 million and P=0.1 million in 2011, 2010 and 2009 (see Note 24).
b. Transactions with Banco de Oro are as follows:
• Cash equivalents amounting to P=2,321.3 million and P=14.4 million as at December 31, 2011 and 2010, respectively (see Note 8). Interest income recognized in the consolidated statements of comprehensive income amounted to P=22.9 million, P=0.8 million and P=0.5 million in 2011, 2010 and 2009, respectively (see Notes 8 and 23).
• CertaintradereceivablesoftheCompanysoldundera“ReceivablesPurchaseAgreement”in consideration for an amount equivalent to its face value amounting to P=582.0 million and P=742.2 million as at December 31, 2011 and 2010, respectively (see Note 9).
• Short-term loans amounting to P=1,758.0 million and P=1,015.0 million as at December 31, 2011 and 2010, respectively (see Note 17). The loans bear interest rates ranging from 4.5% to 7.5% in 2011 and 7.0% to 8.9% in 2010. Interest expense recognized in profit or loss in the consolidated statements of comprehensive income amounted to P=100.1 million (gross of capitalized interest), P=62.5 million and P=72.1 million in 2011, 2010 and 2009, respectively (see Notes 17 and 23).
• LoanfacilityamountingtoP=5,600.0 million. Drawdowns amounting to P=1,673.0 million were made in 2011 (see Note 19). Interest expense on loans payable from OLSA amounting to P=49.0 million in 2011 were capitalized as part of investment properties under construction (see Note 14).
c. Trade receivables amounting to nil and P=5.0 million as at December 31, 2011 and 2010, respectively, were assigned with recourse to China Bank, an associate of SMIC (see Note 9).
Transactions with Directors and Key Management PersonnelThe Company has the following significant related party transactions with directors and key management personnel:
a. Trade receivables from directors and officers arising from the sale of land and condominium units consummated at competitive prices amounted to P=14.3 million and P=17.2 million as at December 31, 2011 and 2010 (see Note 9). These receivables are unsecured, interest-free, settlement occurs in cash and collectible on demand.
b. Compensation and benefits to key management personnel of the Company are as follows:
2011 2010 2009 (In Thousands)Short-term employee benefits P=29,547 P=24,503 P=22,767Post-employment benefits 3,249 4,616 15,111 P=32,796 P=29,119 P=37,878
29. Significant Contracts
Investment Commitment with PAGCORPLAI and its casino operator shall have an “Investment Commitment” per PAGCOR guidelines of US$1.0 billion, of which US$650.0 million shall be invested upon the opening of the casino and the other US$350.0 million shall be invested within a period of three (3) years from the commencement of casino operations. The Investment Commitment should comprise of the value of land used for the projects and the construction costs of various facilities and infrastructure within the site of the project.
The other salient provisions of the License are: (i) creation of an escrow account of at least US$100.0 million to be used exclusively for the project, with a maintaining balance of US$50.0 million; (ii) issuance of performance bond of P=100.0 million to guarantee the completion of the project; and (iii) issuance of surety bond of P=100.0 million to guarantee the payment to PAGCOR of all fees payable under the license granted.
Lease Agreements with AB Leisure and Global, Inc. (ABLGI)Belle is the beneficial owner of four lots located at the Aseana Business Center, Macapagal Avenue, Parañaque City (referred to as “Belle Bay City Land”). The Belle Bay City Land has been allocated to Belle as part of its share in the remaining assets of Belle Bay City at the time of its dissolution pursuant to a Distribution Plan approved by the Board of Liquidators and Stockholders of Belle Bay City. On January 14, 2011, the Company, as a lessor, entered into an operating lease agreement for the Belle Bay City Land. The leased premises shall commence upon the execution of the lease agreement and shall expire 10 years after the commencement date of the lease period (earlier between the soft opening date and turnover date) for the integrated resort complex. During the construction period, from the date of execution of the lease agreement to the casino building lease commencement date, the lessee shall pay a nominal monthly rental of P=30.25 per square meter which is equivalent to 25% of the base rate of P=121 per square meter and P=121 per square meter after the casino building lease commencement date to December 31, 2012.
Rent income recognized by the Company from these lease agreements amounted to P=62.1 million for the year ended December 31, 2011.
30. Contingencies
In the normal course of business, there are certain tax cases and legal cases related to labor disputes and land ownership issues filed against the Company. Management and its legal counsel believe that the Company has substantial legal and factual bases for its position and are of the opinion that losses arising from the aforementioned cases, if any, will not have a material impact on the Company’s consolidated financial statements.
31. Basic/Diluted EPS
2011 2010 2009 (In Thousands, Except Number of Shares and EPS)Earnings attributable to Equity holders of the Parent (a) P=200,517 P=465,535 P=385,917Weighted average number of issued common shares - basic, at beginning of year 6,178,426,290 6,178,426,290 6,178,426,290Issued during the year (see Notes 16 and 20) 2,354,691,508 – –Weighted average number of issued common shares - basic, at end of year (b) 8,533,117,798 6,178,426,488 6,178,426,488Basic/diluted EPS (a/b) P=0.023 P=0.075 P=0.062
There are no common stock equivalents that would have a dilutive effect on the basic EPS.
32. Financial Assets and Financial Liabilities
Financial Risk Management Objectives and Policies The Company’s principal financial assets and financial liabilities are composed of cash and cash equivalents, short-term investments, AFS investments, loans payables, long-term debt, and assignment of receivables with recourse. The main purpose of these financial assets and financial
Belle Corporation Annual Repor t 201142

liabilities is to raise finances for the Company’s operations. The Company has various other financial assets and financial liabilities such as receivables, advances to associates and other related parties and accounts payable and other liabilities, which arise directly from its real estate operations.
The main risks arising from the Company’s financial assets and financial liabilities are interest rate risk, foreign currency risk, credit risk and liquidity risk. The Company’s BOD and management review and agree on the policies for managing each of these risks and they are summarized below.
Interest Rate Risk. Interest rate risk arises from the possibility that changes in interest rates will affect future cash flows or the fair values of financial assets and financial liabilities. The Company’s exposure to interest rate risk relates primarily to the Company’s long-term debt which is subject to cash flow interest rate risk. Re-pricing of FRNs is done every six months while re-pricing of long-term debt is normally done every three months.
The Company’s policy is to manage its interest cost by limiting its borrowings. The Company’s loans payable and long-term debt are subject to interest rate risk.
The following table demonstrates the sensitivity to a reasonably possible change in interest rates, with all other variables held constant, of the Company’s consolidated income before income tax in 2011 and 2010. There is no other impact on the Company’s equity other than those already affecting the profit or loss in the consolidated statements of comprehensive income.
2011 2010 Increase Decrease Increase Decrease in Basis Points in Basis Points in Basis Points in Basis Points (In Thousands, Except Change in Basis Points)Change in basis points* +52 -52 +61 -61Effect on income before income tax (P=4,959) P=4,959 (P=6,067) P=6,067* Average movement in LIBOR interest rates for the past five years.
Foreign Currency Risk. Foreign currency risk is the risk that the fair value or future cash flows of financial asset or financial liability will fluctuate due to changes in foreign exchange rates. As at December 31, 2011 and 2010, the Company’s foreign currency-denominated FRNs amounted to P=965.0 million (US$22.0 million).
In translating the foreign currency-denominated long-term debt into peso amounts, the exchange rate used was P=43.84 to US$1.0, the Philippine peso to U.S. dollar exchange rates as at December 31, 2011 and 2010.
It is the Company’s policy to ensure that capabilities exist for active but conservative management of its foreign currency risk. The Company seeks to mitigate its transactional currency exposure by maintaining its costs at consistently low levels, regardless of any upward or downward movement in the foreign currency exchange rate.
The following table demonstrates the sensitivity to a reasonably possible change in the U.S. dollar exchange rates, with all other variables held constant, of the Company’s consolidated income before tax as at December 31, 2011 and 2010. There is no other impact on the Company’s equity other than those already affecting the profit or loss in the consolidated statements of comprehensive income.
2011 2010 Increase Decrease Increase Decrease in US$ Rate in US$ Rate in US$ Rate in US$ Rate (In Thousands, Except Change in US$ Rate)Change in US$ rate* P=0.64 (P=0.64) P1.30 (P1.30)Effect on income before income tax (14,087) 14,087 (28,560) 28,560* Average movement of U.S. dollar against Philippine peso for the past five years.
The increase in US$ rate means stronger U.S. dollar against peso while the decrease in US$ means stronger peso against the U.S. dollar.
Credit Risk. Credit risk is the risk that the Company will incur a loss because its customers or counterparties fail to discharge their contractual obligations. It is the Company’s policy that all customers who wish to trade on credit terms are subject to credit verification procedures. In addition, receivable balances are monitored on an ongoing basis with the result that the Company’s exposure to bad debts is not significant. The Company does not offer credit terms without the specific approval of the management. There is no significant concentration of credit risk.
In the Company’s real estate business, title to the property is transferred only upon full payment of the purchase price. There are also provisions in the sales contract which allow forfeiture of installments/deposits made by the customer in favor of the Company and retain ownership of the property. The Company has the right to sell, assign or transfer to third party and any interest under sales contract, including its related receivables from the customers. The Company’s primary target customers are high-income individuals and top corporations, in the Philippines and overseas. These measures minimize the credit risk exposure or any margin loss from possible default in the payments of installments.
Trade receivables from sale of real estate units are secured with pre-completed property units. The legal title and ownership of these units will only be transferred to the customers upon full payment of the contract price. Receivables from sale of club shares are secured by the shares held by the Company. For other receivables, since the Company trades only with recognized third parties, there is no requirement for collateral.
With respect to credit risk arising from the financial assets of the Company, which comprise of cash and cash equivalents, short-term investments, receivables, advances to associates and other related parties and AFS investments, the Company’s exposure to credit risk arises from default of the counterparty, with a maximum exposure equal to the carrying amount of these instruments.
The table below shows the Company’s aging analysis of financial assets.
2011 Neither Past Past Due but not Impaired Due nor Less than 31 to 60 61 to Over Impaired 30 Days Days 90 Days 90 Days Impaired Total (In Thousands)Cash and cash equivalents* P2,766,730 P– P– P– P– P– P2,766,730Short-term investments 9,668 – – – – – 9,668Receivables: Trade** 710,365 4,910 3,821 3,248 16,297 5,085 743,726 Dividend 42,501 – – – – – 42,501 Others 19,532 – – – – 29,687 49,219Advances to associates*** - net of subscription payable 85,579 – – – – 150,582 236,161Advances to related parties 457,764 – – – – 7,077 464,841AFS investments 22,336 – – – – 20,555 42,891 P4,114,475 P4,910 P3,821 P3,248 P16,297 P212,986 P4,355,737 * Excluding cash on hand. ** Excluding non-financial trade receivables amounting to P=129.5 million. *** Presented under “Investments in and advances to associates” account in the consolidated statements of financial position.
2010 Neither Past Past Due but not Impaired Due nor Less than 31 to 60 61 to Over Impaired 30 Days Days 90 Days 90 Days Impaired Total (In Thousands)Cash and cash equivalents* P40,855 P– P– P– P– P– P40,855Receivables: Trade** 887,436 3,168 1,698 1,387 24,909 5,085 923,683 Dividend 42,501 – – – – – 42,501 Others 25,853 – – – – 29,687 55,540Advances to associates*** - net of subscription payable 83,343 – – – – 150,582 233,925Advances to related parties 449,958 – – – – 7,077 457,035AFS investments 13,751 – – – – 20,555 34,306 P1,543,697 P3,168 P1,698 P1,387 P24,909 P212,986 P1,787,845 * Excluding cash on hand. ** Excluding non-financial trade receivables amounting to P=129.5 million. *** Presented under “Investments in and advances to associates” account in the consolidated statements of financial position.
Financial assets are considered past due when collections are not received on due date.
Past due accounts which pertain to trade receivables from sale of real estate units and club shares are recoverable since the legal title and ownership of the real estate units and club shares will only be transferred to the customers upon full payment of the contract price.
The table below shows the credit quality of the Company’s financial assets that are neither past due nor impaired based on historical experience with the corresponding third parties.
2011 High Grade Medium Grade Unrated Total (In Thousands)Cash and cash equivalents* P=2,766,730 P=– P=– P=2,766,730Short-term investments 9,668 – – 9,668Receivables: Trade** 710,365 – – 710,365 Dividend 42,501 – – 42,501 Others 19,532 – – 19,532Advances to associates*** - net of subscription payable 85,579 – – 85,579Advances to related parties 457,764 – – 457,764AFS investments 19,578 – 2,758 22,336 P=4,111,717 P=– P=2,758 P=4,114,475
* Excluding cash on hand. ** Excluding non-financial trade receivables amounting to P=129.5 million. *** Presented under “Investments in and advances to associates” account in the consolidated statements of financial position.
2010 High Grade Medium Grade Unrated Total (In Thousands)Cash and cash equivalents* P=40,855 P=– P=– P=40,855Receivables: Trade 887,436 – – 887,436 Dividend 42,501 – – 42,501 Others 25,853 – – 25,853
Forward
43 Annual Repor t 2011 Belle Corporation

2010 High Grade Medium Grade Unrated Total (In Thousands)Advances to associates*** - net of subscription payable P=83,343 P=– P=– P=83,343Advances to related parties 449,958 – – 449,958AFS investments 10,993 – 2,758 13,751 P=1,540,939 P=– P=2,758 P=1,543,697 * Excluding cash on hand. ** Excluding non-financial trade receivables amounting to P=129.5 million. *** Presented under “Investments in and advances to associates” account in the consolidated statements of financial position.
High grade financial assets pertain to receivables from clients or customers who have no history of delayed payment while medium grade includes receivables from clients or customers who have history of delayed payment but is currently updated.
Cash in banks, cash equivalents and short-term investments are deposited with the top ten banks in the Philippines; hence, considered high grade.
Unquoted AFS investments are unrated while quoted AFS investments are assessed as high grade based on financial status of the counterparty and its current stock price performance in the market.
Liquidity Risk. Liquidity risk is the risk that the Company will encounter difficulty in meeting obligations associated with financial liabilities that are settled by delivering cash or another financial asset. The Company seeks to manage its liquidity profile to be able to finance its capital expenditures and service its maturing debts. The Company’s objective is to maintain a balance between continuity of funding and flexibility through valuation of projected and actual cash flow information. The Company considers obtaining borrowings as the need arises.
The following table summarizes the maturity profile of the Company’s financial assets and financial liabilities as at December 31, 2011 and 2010 based on contractual undiscounted cash flows. The table also analyzes the maturity profile of the Company’s financial assets in order to provide a complete view of the Company’s contractual commitments and liquidity.
2011 6 Months On Demand < 6 Months to 1 Year 1–3 Years > 3 Years Total (In Thousands)Financial Assets Cash and cash equivalents P=2,766,880 P=– P=– P=– P=– P2,766,880Short-term investments 9,668 – – – – 9,668Receivables* 58,162 279,643 258,152 894,750 87,128 1,577,835AFS investments 22,336 – – – – 22,336 P=2,857,046 P=279,643 P=258,152 P=894,750 P=87,128 P=4,376,719
Financial Liabilities Loans payable** P=– P=2,174,478 P=2,313 P=3,750 P=– P=2,180,541Accounts payable and other liabilities*** 1,702,681 – – – – 1,702,681Long-term debt** – 28,191 13,029 1,271,336 1,405,320 2,717,876 P=1,702,681 P=2,202,669 P=15,342 P=1,275,086 P=1,405,320 P=6,601,098 * Excluding non-financial trade receivables. ** Including future interest payments. *** Excluding statutory payables and other liabilities to the government.
2010 6 Months On Demand < 6 Months to 1 Year 1–3 Years > 3 Years Total (In Thousands )Financial Assets Cash and cash equivalents P=41,052 P=– P=– P=– P=– P=41,052Receivables* 63,480 530,540 507,022 840,231 55,667 1,996,940AFS investments 13,751 – – – – 13,751 P=118,283 P=530,540 P=507,022 P=840,231 P=55,667 P=2,051,743
Financial Liabilities Loans payable** P=– P=1,743,899 P=2,339 P=4,654 P=– P=1,750,892Accounts payable and other liabilities*** 1,490,468 – – – – 1,490,468Long-term debt** – 8,511 12,047 47,860 976,844 1,045,262Assignment of receivables with recourse** – 1,654 768 3,074 – 5,496 P=1,490,468 P=1,754,064 P=15,154 P=55,588 P=976,844 P=4,292,118 * Excluding non-financial trade receivables. ** Including future interest payments. *** Excluding statutory payables and other liabilities to the government.
The Company expects to settle its maturing obligations on long-term debt from its gaming revenues from casino operations which is expected to open in 2013, rental income on land and casino building (see Note 29) and expected profits from real estate development operations.
Capital ManagementThe primary objective of the Company’s capital management is to safeguard its ability to continue as a going concern, so that it can continue to provide returns for shareholders and benefits for other stakeholders and to maintain an optimal capital structure to reduce the cost of capital.
The Company manages its capital structure and makes adjustments to it, in light of changes in economic conditions. To maintain or adjust the capital structure, the Company may adjust the dividend payment to shareholders, return capital to shareholders or issue new shares. There were no changes made in the objectives, policies or processes during the years ended December 31, 2011 and 2010.
The Company considers the following as its capital:
2011 2010 (In Thousands)Preferred stock P=1,000,000 P=1,000,000Common stock 9,170,770 6,350,900Subscribed stock 1,388,613 –Additional paid-in capital 5,503,731 –Equity share in cost of Parent Company shares held by associates (731,696) (731,696)Cost of Parent Company common shares held by subsidiaries (497,758) (497,758)Retained earnings 338,243 137,726 P=16,171,903 P=6,259,172
The Company monitors capital on the basis of the debt-to-equity ratio. This ratio is calculated as total interest-bearing debt over equity.
The Company’s strategy, which was unchanged from prior period, was to maintain the debt-to-equity ratio at manageable levels. For purposes of monitoring debt-to-equity ratio, the Company excludes trade and other payables arising from operations. Only interest-bearing debt was included in the total debt.
The debt-to-equity ratio is as follows:
2011 2010 (In Thousands, except for debt-to-equity ratio)Interest-bearing debt (a) P=4,715,441 P=2,713,089Equity (b) 16,075,072 6,178,290Debt-to-equity ratio (a/b) 0:29:1 0.44:1
Fair Value of Financial Assets and Financial LiabilitiesSet out below is a comparison by category and by class of carrying values and fair values of all the Company’s financial assets and liabilities:
2011 2010 Carrying Carrying Value Fair Value Value Fair Value (In Thousands)Cash on hand P=150 P=150 P=197 P=197Loans and receivables: Cash in banks and cash equivalents 2,766,730 2,766,730 40,855 40,855 Short-term investments 9,668 9,668 – – Receivables: Trade* 738,641 898,064 918,598 1,158,447 Dividend 42,501 42,501 42,501 42,501 Others 19,532 19,532 25,853 25,853 800,674 960,097 986,952 1,226,801 Advances to associates** - net of subscription payable 85,579 85,579 83,343 83,343 Advances to related parties 457,764 457,764 449,958 449,958 4,120,415 4,279,838 1,561,108 1,800,957AFS financial assets: Quoted shares 15,197 15,197 6,263 6,263 Unquoted shares 2,758 2,758 2,758 2,758 Club shares 4,381 4,381 4,730 4,730 22,336 22,336 13,751 13,751 P=4,142,901 P=4,302,324 P=1,575,056 P=1,814,905
Other financial liabilities : Loans payable P=2,155,857 P=2,155,857 P=1,743,069 P=1,743,069 Accounts payable and other liabilities: Trade 750,635 750,635 558,905 558,905 Nontrade*** 319,449 319,449 306,958 306,958 Accrued expenses 417,986 417,986 411,866 411,866 Advances from related parties 214,611 214,611 212,739 212,739 1,702,681 1,702,681 1,490,468 1,490,468 Long-term debt 2,559,584 2,509,664 964,993 865,682 Assignment of receivables with recourse – – 5,027 4,634 P=6,418,122 P=6,368,202 P=4,203,557 P=4,103,853* Excluding non financial trade receivables amounting to P=129.5 million.** Presented under “Investments in and advances to associates” account in the consolidated statements of financial position.*** Excluding statutory payables and other liabilities to the government.
Belle Corporation Annual Repor t 201144

Fair value is defined as the amount at which the financial assets and financial liabilities could be exchanged in a current transaction between knowledgeable willing parties in an arm’s length transaction, other than in a forced liquidation or sale. Fair values are obtained from quoted market prices, discounted cash flow models and other valuation models, as appropriate.
The following methods and assumptions are used to estimate the fair value of each class of financial assets and financial liabilities:
Cash and Cash Equivalents, Short-term Investments, Advances to Associates and Other Related Parties, Dividend and Other Receivables, Loans Payable, Accounts Payable and Other Liabilities. The carrying amounts of these financial assets approximate their fair values due to the relatively short-term maturities of these financial assets.
Trade Receivables. The fair value of these instruments is determined by discounting the estimated cash flows using prevailing interest rates as at reporting dates. The discount rates used ranged from 3.9% to 8.5% in 2011 and 4.5% to 7.1% in 2010.
AFS Investments. The fair values of AFS investments in quoted equity shares are based on quoted prices in the PSE or those shares whose prices are readily available from brokers or other regulatory agency as at reporting date. There are no quoted market prices for the unlisted shares and there are no other reliable sources of their fair values, therefore, these are carried at cost, net of any impairment loss.
Long-term Debt. The fair value of long-term debt is determined by discounting the obligations’ expected future cash flows using the discount rate of 2.2% in 2011 and 3.2% in 2010.
Assignment of Receivables with Recourse. The fair value of these instruments is determined by discounting the expected future cash flows using the discount rates ranging from 3.2% to 6.6% in 2010.
Determination of Fair Value and Fair Value HierarchyThe Company has AFS investments in quoted equity securities amounting to P=19.6 million and P=11.0 million in 2011 and 2010, respectively, recorded at Level 1 fair value. These are the only financial assets and financial liabilities carried at fair value.
There were no transfers between fair value measurements in 2011 and 2010.
33. Classification of Statement of Financial Position Accounts
The current portions of assets and liabilities that are expected to be recovered or settled within no more than 12 months after the reporting date are as follows:
2011 2010 (In Thousands)Current assets: Cash and cash equivalents P=2,766,880 P=41,052 Short-term investments 9,668 – Receivables 602,163 791,842 Subscription receivable 2,082,920 – Real estate for sale 3,036,153 3,012,896 Club shares 2,786,148 2,816,442 Advances to associates* - net of subscription payable 85,579 83,343 Advances to related parties 457,764 449,958 Other assets 553,408 275,514 P=12,380,683 P=7,471,047
Current liabilities: Loans payable P=2,152,162 P=1,738,651 Accounts payable and other liabilities 1,750,935 1,547,077 Income tax payable 8,258 Assignment of receivables with recourse – 875 P=3,911,355 P=3,286,603* Presented under “Investments in and advances to associates” account in the consolidated statements of financial position.
34. Supplemental Disclosure of Cash Flow Information
In 2011, the principal noncash transactions pertain to the Parent Company’s share swap agreement for the acquisition of PLAI amounting to P=5.3 billion (see Notes 16 and 29) and the transfer of real estate for sale to investment property under construction amounting to P=111.3 million (see Notes 10 and 14).
45 Annual Repor t 2011 Belle Corporation


Belle CorporationCorporate Headquarters28/F East Tower Philippine Stock Exchange Centre,Exchange Road, Ortigas CenterPasig City, PhilippinesTel Nos.: (632) 635 3016 to 20Fax Nos.: (632) 635 3025 (632) 635 3030
Tagaytay Highlands International Golf Club, Inc.Tagaytay City, PhilippinesTel Nos.: (6346) 483 0888 (6346) 483 0840Fax No.: (6346) 483 0830
The Country Club at Tagaytay Highlands, Inc.Tagaytay City, PhilippinesTel No.: (6346) 483 0818Fax No.: (6346) 483 0972
Tagaytay Midlands Golf Club, Inc.Barangay Tranca, TalisayBatangas City, PhilippinesTel Nos.: (6346) 483 3808 (6346) 483 4270Fax No.: (6346) 483 0810
The Spa & Lodge at Tagaytay Highlands, Inc.Tagaytay City, PhilippinesTel No.: (6346) 483 0838Fax No.: (6346) 483 0914
INDEPENDENT PUBLIC AUDITORSSycip Gorres Velayo & Co.6760 Ayala Avenue, Makati City, PhilippinesTel No.: (632) 891 0307Fax Nos.: (632) 819 0872 (632) 818 1377
LEGAL COUNSELTan Venturanza Valdez Law Offices2704 East Tower, Philippine Stock Exchange CentreExchange Road, Ortigas CenterPasig City, PhilippinesTel Nos.: (632) 632 0905 to 10Fax No.: (632) 635 4703
Tan Acut Lopez & Pison Law Offices2303 A East Tower, Philippine Stock Exchange CentreExchange Road, Ortigas CenterPasig City, PhilippinesTel Nos.: (632) 635 3671 to 78Fax No.: (632) 632 1876
Cayetano Sebastian Ata Dado & Cruz Law Offices12/F NDC Building, 116 Tordesillas Street, Salcedo VillageMakati City, PhilippinesTel No.: (632) 841 0716Fax No.: (632) 841 0544
Herrera Teehankee & Cabrera Law Offices5/F SGV II Building, 6758 Ayala AvenueMakati City, PhilippinesTel Nos.: (632) 813 7111 to 14Fax Nos.: (632) 813 7881 (632) 840 5555
STOCK TRANSFER AGENTProfessional Stock Transfer, Inc. (up to March 31, 2012)1003 10/F City & Land Mega PlazaADB Avenue cor. Garnet RoadOrtigas Center, Pasig City, PhilippinesTel No.: (632) 687 4053Fax No.: (632) 687 2733
Banco de Oro - Trust and Investments Group (engaged April 1, 2012)15th Floor South Tower, BDO Corporate Center7899 Makati Avenue, Makati City, PhilippinesTel. No.(632) 8407000Fax No. (632) 8407025
Annual Repor t 2011 Belle Corporation 47
corPorate inforMation

28/F East TowerPhilippine Stock Exchange Centre Ortigas Center, Pasig CityMetro Manila, Philippines


