122
ANNUAL REPORT 2011 HIGHNOON LABORATORIES LIMITED

ANNUAL
REPORT
2011
HIGHNOON LABORATORIES LIMITED

Theme of Annual Report 2011 - Teamwork
Coming together is a beginning. Keeping together is progress. Working together is success.(Henry Ford)
Of course, synergy happens out of joint and aligned efforts and hence teamwork is the only way to the excellence.
Knowledge, skill, intelligence, competence and other resources,even all put together, will not work if team work is not there.Teamwork brings strategic alignment of all.
Company InformationVision, Mission & Objectives
02 08 20020304
050607
Company InformationCommittees Notice of AnnualGeneral MeetingOur VisionOur MissionCorporate Objectives
08 09
131718
Statement of Ethics & Core ValuesDirectors’ Reportto the ShareholdersChairman’s ReviewSix Years at a GlancePerformance Overview
20 21 24
Statement of value addition and its distributionVertical & HorizontalAnalysisPattern of Shareholding
Statement of EthicsPerformance Overview
Statement of ComplianceReview Report
26 31 7726
28
Statement of Compliance with the best practices ofthe Code of Corporate GovernanceReview Report to the Members on Statementof Compliance withbest practices of theCode of CorporateGovernance
31 323435
3638
39
Highnoon Laboratories LimitedFinancial Statements
ConsolidatedFinancial Statements
Auditors’ Report tothe MembersBalance SheetProfit & Loss AccountStatement ofComprehensive IncomeCash Flow StatementStatement of Changesin EquityNotes to theFinancial Statements
77
78
80
81
82
84
85
Auditors’ Report to theMembersConsolidated BalanceSheetConsolidated Profit &Loss AccountConsolidated Statement ofComprehensive IncomeConsolidated Cash FlowStatementConsolidated Statementof Changes in EquityNotes to the ConsolidatedFinancial StatementsForm of Proxy
Statement of value additionPattern of Shareholding
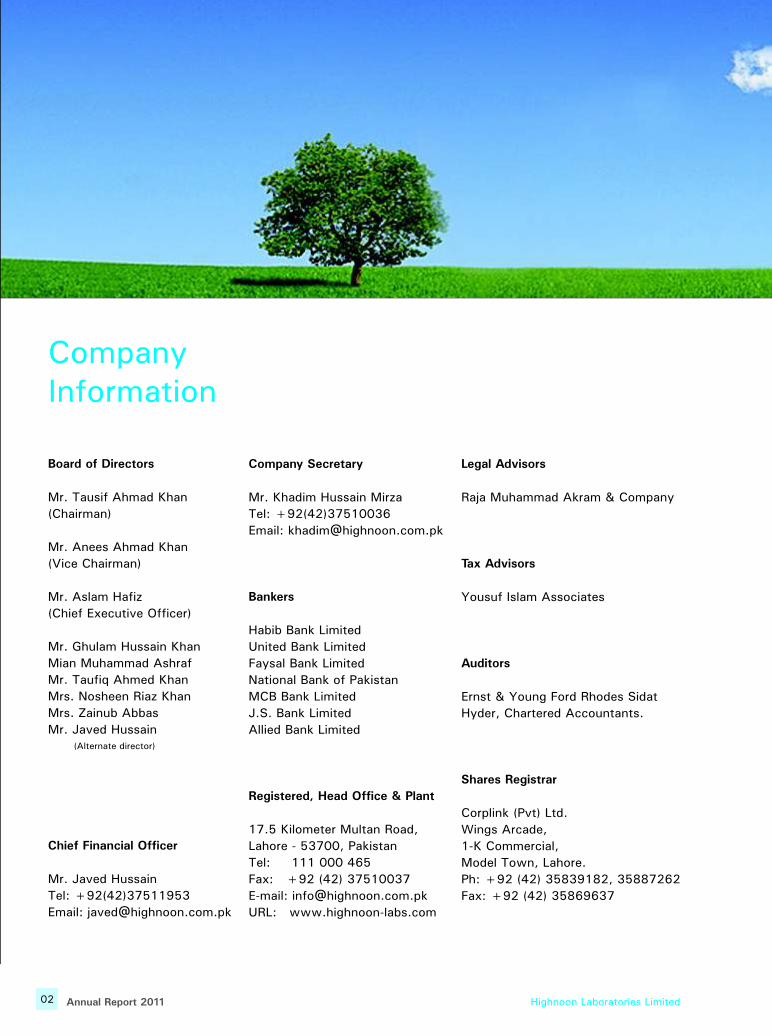
CompanyInformation
Board of Directors
Mr. Tausif Ahmad Khan
(Chairman)
Mr. Anees Ahmad Khan
(Vice Chairman)
Mr. Aslam Hafiz
(Chief Executive Officer)
Mr. Ghulam Hussain Khan
Mian Muhammad Ashraf
Mr. Taufiq Ahmed Khan
Mrs. Nosheen Riaz Khan
Mrs. Zainub Abbas
Mr. Javed Hussain
Chief Financial Officer
Mr. Javed Hussain
Tel: +92(42)37511953
Email: [email protected]
Mr. Khadim Hussain Mirza
Tel: +92(42)37510036
Email: [email protected]
Bankers
Habib Bank Limited
United Bank Limited
Faysal Bank Limited
National Bank of Pakistan
MCB Bank Limited
J.S. Bank Limited
Allied Bank Limited
Registered, Head Office & Plant
17.5 Kilometer Multan Road,
Lahore - 53700, Pakistan
Tel: 111 000 465
Fax: +92 (42) 37510037
E-mail: [email protected]
URL: www.highnoon-labs.com
Company Secretary Legal Advisors
Raja Muhammad Akram & Company
Tax Advisors
Yousuf Islam Associates
Auditors
Ernst & Young Ford Rhodes Sidat
Hyder, Chartered Accountants.
Shares Registrar
Corplink (Pvt) Ltd.
Wings Arcade,
1-K Commercial,
Model Town, Lahore.
Ph: +92 (42) 35839182, 35887262
Fax: +92 (42) 35869637
(Alternate director)
02 Annual Report 2011 Highnoon Laboratories Limited
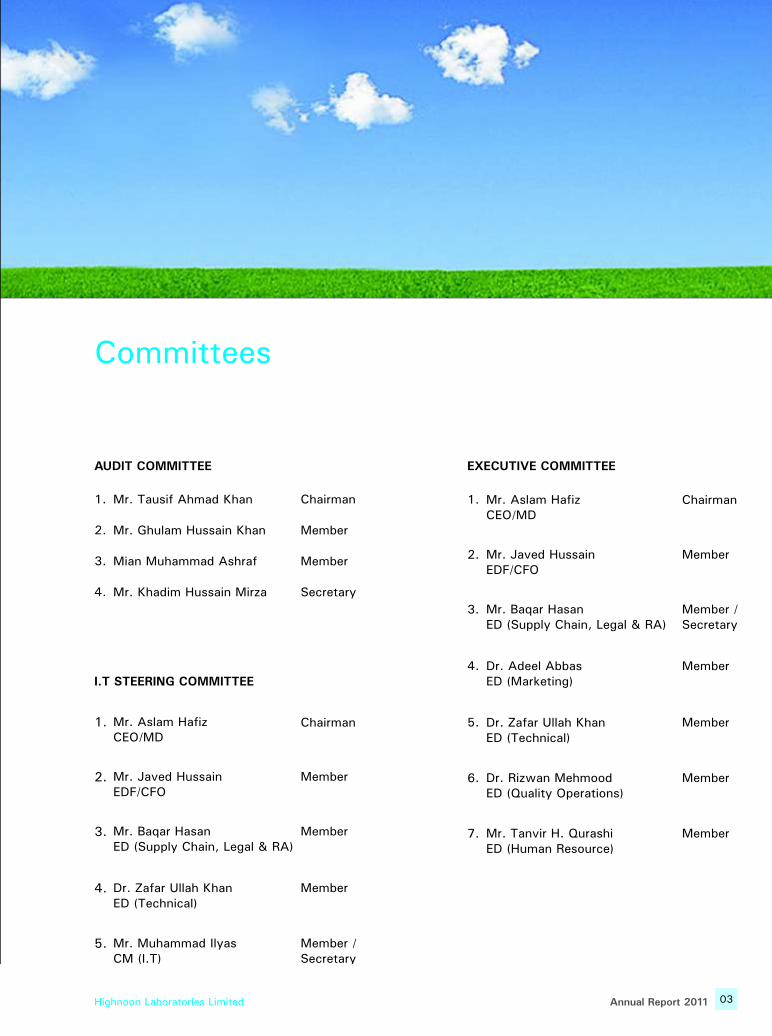
Committees
AUDIT COMMITTEE
Mr. Tausif Ahmad Khan
Mr. Ghulam Hussain Khan
Mian Muhammad Ashraf
Mr. Khadim Hussain Mirza
1.
2.
3.
4.
Chairman
Member
Member
Secretary
EXECUTIVE COMMITTEE
1.
2.
3.
4.
5.
6.
Mr. Baqar HasanED (Supply Chain, Legal & RA)
Mr. CEO/MD
Aslam Hafiz
Mr. Javed HussainEDF/CFO
Dr. Rizwan MehmoodED (Quality Operations)
Dr. Zafar Ullah KhanED (Technical)
Dr. Adeel AbbasED (Marketing)
Chairman
Member /Secretary
Member
Member
Member
Member
I.T STEERING COMMITTEE
2.
3.
1.
4.
5.
Mr. CEO/MD
Aslam Hafiz
Mr. Baqar HasanED (Supply Chain, Legal & RA)
Mr. Muhammad IlyasCM (I.T)
Dr. Zafar Ullah KhanED (Technical)
Mr. Javed HussainEDF/CFO
Chairman
Member
Member /Secretary
Member
Member
7. Mr. Tanvir H. QurashiED (Human Resource)
Member
Highnoon Laboratories Limited 03Annual Report 2011
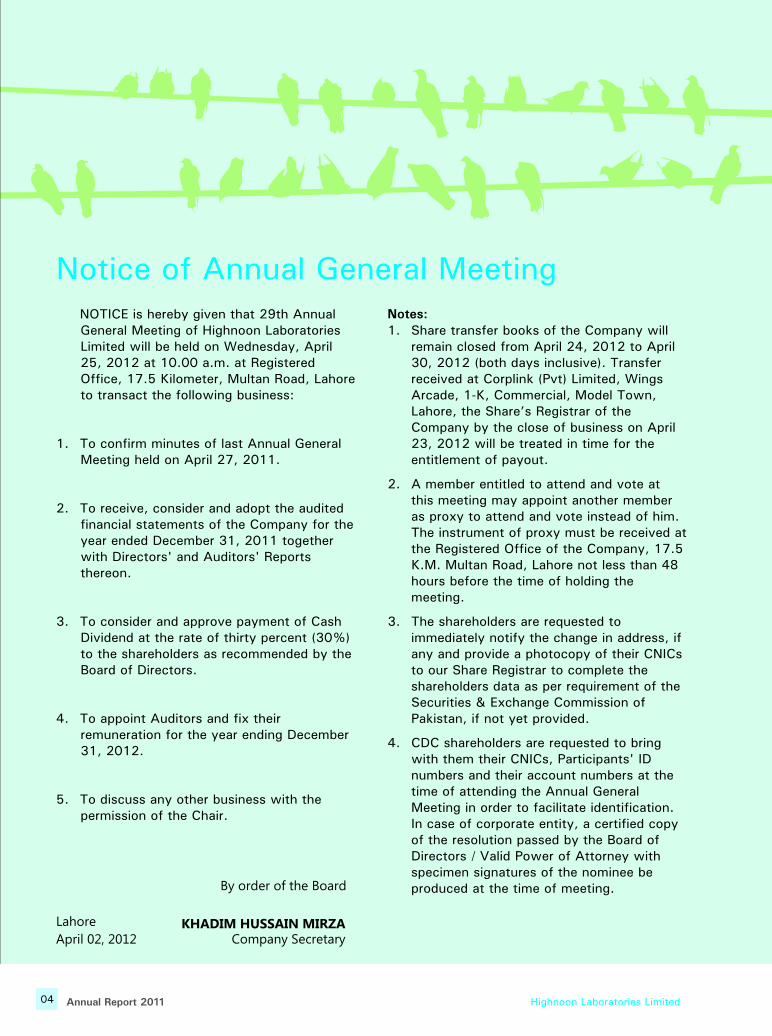
Notice of Annual General MeetingNOTICE is hereby given that 29th Annual General Meeting of Highnoon Laboratories Limited will be held on Wednesday, April 25, 2012 at 10.00 a.m. at Registered Office, 17.5 Kilometer, Multan Road, Lahore to transact the following business:
1. To confirm minutes of last Annual General Meeting held on April 27, 2011.
2. To receive, consider and adopt the audited financial statements of the Company for the year ended December 31, 2011 together with Directors' and Auditors' Reports thereon.
3. To consider and approve payment of Cash Dividend at the rate of thirty percent (30%) to the shareholders as recommended by the Board of Directors.
4. To appoint Auditors and fix their remuneration for the year ending December 31, 2012.
5. To discuss any other business with the permission of the Chair.
Notes:1. Share transfer books of the Company will
remain closed from April 24, 2012 to April 30, 2012 (both days inclusive). Transfer received at Corplink (Pvt) Limited, Wings Arcade, 1-K, Commercial, Model Town, Lahore, the Share’s Registrar of the Company by the close of business on April 23, 2012 will be treated in time for the entitlement of payout.
2. A member entitled to attend and vote at this meeting may appoint another member as proxy to attend and vote instead of him. The instrument of proxy must be received at the Registered Office of the Company, 17.5 K.M. Multan Road, Lahore not less than 48 hours before the time of holding the meeting.
3. The shareholders are requested to immediately notify the change in address, if any and provide a photocopy of their CNICs to our Share Registrar to complete the shareholders data as per requirement of the Securities & Exchange Commission of Pakistan, if not yet provided.
4. CDC shareholders are requested to bring with them their CNICs, Participants' ID numbers and their account numbers at the time of attending the Annual General Meeting in order to facilitate identification. In case of corporate entity, a certified copy of the resolution passed by the Board of Directors / Valid Power of Attorney with specimen signatures of the nominee be produced at the time of meeting.
KHADIM HUSSAIN MIRZACompany Secretary
By order of the Board
Lahore
April 02, 2012
04 Annual Report 2011 Highnoon Laboratories Limited

Our Vision
“Highnoon for a Healthier Nation”
We at Highnoon Laboratories Limited understand theduties of being responsible corporate citizen and standtrue to our conviction and promise to work for thebetterment and prosperity of our people.
Highnoon Laboratories Limited 05Annual Report 2011

Our Mission
We strive to maintain excellence in our business practices with the objective to benefit the medical community, consumers, stakeholders and employees; and to improve quality of life by providing quality products.
06 Annual Report 2011 Highnoon Laboratories Limited

Corporate Objectives
Excel in meeting customer needs.
Maintain leadership in national
pharmaceutical industry.
Gain confidence of Doctors,
Pharmacists and Consumers who use our products.
Seek employee involvement, continuous improvement
and enhanced performance goals.
Enhance export business.
Highnoon Laboratories Limited 07Annual Report 2011

Shared Responsibility
The achievement and continuation of an ethical work environment is a shared responsibility among employees, seniors, officials and directors of the company, which will be treated as confidential.
Intellectual Honesty
Personal interaction among employees should be characterized by truthfulness, openness to new ideas, and consideration for the rights of others. Each member of the team should respect the right of others to freedom of thought, opinion, speech, and association.
Personal Conduct
At Highnoon each employee is responsible for avoiding real or apparent conflicts of interest, ensuring that authority is exercised within a framework of accountability and ensuring that information is managed in accordance with relevant statutes. Employees must ensure that the organization’s interests are foremost in all business decision and shall remove themselves from decision making roles which involve the employee in any personal capacity or which involve friends or family members.
Research
Research carried out by our organization shall be characterized by the highest standards of integrity and ethical behavior. Every effort shall be made to ensure that all research dataor results of projects or programs sponsored by or under the administrative supervision of organization are represented properly and accurately.
Statement of Ethics& Core Values
08 Annual Report 2011 Highnoon Laboratories Limited

Directors' Reportto the shareholders
The Board of Directors feels pleasure to present the annual audited financial statements of Highnoon Laboratories Limited along with consolidated financial statements with its wholly owned subsidiary for the year ended 31 December 2011.
Financial Highlights of the Company2011
(Rupees in '000')
(Rupees in '000')
Profit before tax
Taxation
Profit after tax
Un-appropriated profit brought forward
Transfer from surplus on revaluation of fixed assets
Profit available for appropriation
144,053
(51,672)
92,381
244,856
5,322
342,559
Appropriations:
Dividend for financial year
31 December, 2010 @ Rs.2.5 per share
(2009: @ Rs.2.5 per share)
Bonus Shares @ 10% (2009: NIL)
284,713
(41,319)
(16,527)
Consolidated Financial Highlights
Profit before tax
Taxation
Profit after tax
Un-appropriated profit brought forward
Transfer from surplus on revaluation of fixed assets
2011
Profit available for appropriation
143,899
(51,672)
246,152
5,322
343,701
92,227
Appropriations:
Dividend for financial year
31 December, 2010 @ Rs.2.5 per share
(2009: @ Rs.2.5 per share)
Bonus Shares @ 10% (2009: NIL)
285,855
(41,319)
(16,527)
Highnoon Laboratories Limited 09Annual Report 2011
EARNINGS PER SHAREBased on net profit for the year ended 31 December 2011, the earnings per share (EPS) is Rs.5.08 (2010: Rs.3.87) showing an increase of 31.26 percent. On the basis of consolidated results EPS stands at Rs.5.07 compared to Rs.4.00 last year.
DIVIDEND ANNOUNCEMENTThe Board of Directors of the Company has recommended cash dividend thirty percent i.e. Rs. 3.00 per share (2010: Rs.2.5 per share and bonus shares @ 10%) for the financial year ended December 31, 2011 for consideration and approval by the shareholders in the Annual General Meeting.
PATTERN OF SHAREHOLDINGThe pattern of shareholding along with categories of shareholders as at December 31, 2011 as required under Section 236 of the Companies Ordinance and listing regulations is set out on Page 24 of the Annual Report 2011.
BOARD OF DIRECTORS AND THEIR ATTENDANCE AT MEETINGSThe present Board of Directors was elected in 2009 for a term of three years. The terms of appointment of Chief Executive Officer, Executive Directors, Chief Financial Officer and Company Secretary are the same; however, the Board of Directors has approved annual increase in their salaries in accordance with the policy of the Company.
During the year five (05) meetings of Board of Directors were held, the number of meetings attended by each Director is given there against:
Leave of absence was granted to the directors who could not attend the meeting.
Pursuant to the provisions of the Companies Ordinance, Mr. Taufiq Ahmed Khan nominated Mr. Javed Hussain as alternate director during his absence from Pakistan. Mr. Javed Hussain was appointed as alternate director by the Board in a meeting held on October 21, 2011.
All the directors are aware of their duties and powers under the Company's Memorandum and Articles of Association and the listing regulations of the stock exchanges and have filed declaration to the effect.
1.
2.
3.
4.
5.
6.
7.
8.
9.
05
05
05
05
02
00
02
03
02
MR. ANEES AHMAD KHAN
MR. ASLAM HAFIZ
MR. GHULAM HUSSAIN KHAN
MIAN MUHAMMAD ASHRAF
MR. TAUFIQ AHMED KHAN
MRS. NOSHEEN RIAZ KHAN
MRS. ZAINUB ABBAS
MR. JAVED HUSSAIN
MR. TAUSIF AHMAD KHAN
S.No. N A M E O F M E M B E R S ATTENDANCE
(Alternate director to Mr. Taufiq Ahmed Khan)
10 Annual Report 2011 Highnoon Laboratories Limited

TRADING OF SHARES BY DIRETORS, CEO, CFO AND COMPANY SECRETARY ETC.
Directors, Chief Executive Officer, Chief Financial Officer, Company Secretary, their spouses and minor children have not sold or purchased shares of the Company during the period except as mentioned hereunder:
- Mr. Tausif Ahmad Khan, Chairman / Director purchased =347,828=ordinary shares from the open market.
- Mr. Umar Hafiz son of Mr. Aslam Hafiz (CEO/MD) purchased =11,000= ordinary shares from the open market.
AUDIT COMMITTEE
The Audit Committee is in existence since 2002. It comprises of three members including Chairman of the Committee out of which two are non executive directors. The terms of reference of the Committee is in line with the Code of Corporate Governance and has been approved by the Board of Directors.
STATEMENT OF ETHICS AND BUSINESS PRACTICES
The Board has prepared and circulated the Statement of Ethics and Business Practices signed by every director and employee of the Company as a token of acknowledgement of his/her understanding of the standards of conduct in relation to every body associated or dealing with the Company.
EXTERNAL AUDITORS
The external auditors of the Company Ernst & Young Ford Rhodes Sidat Hyder, Chartered Accountants shall retire on the conclusion of Annual General Meeting. Being eligible for re-appointment under the listing regulations, they have offered their services as auditors of the Company for FY 2012. The Audit Committee has recommended the appointment of Ernst & Young Ford Rhodes Sidat Hyder, Chartered Accountants as auditors of the Company for the year ended 31 December 2012 and the Board agrees to the recommendations of the Audit Committee.
The auditors have also given their consent to work as auditors of the Company for the next year and have conveyed that they have been given satisfactory rating under the Quality Control Review of Institute of Chartered Accountants of Pakistan and the firm is fully compliant with the code of ethics issued by International Federation of Accountants (IFAC). Further they are also not rendering any related services to the Company. The auditors have also confirmed that neither the firm nor any of their partners, their spouses or minor children at any time during the year held or traded in the shares of the Company.
SUBSIDIARY COMPANY
The wholly owned subsidiary company, Dynalog Services Private Limited, had been in-operative since 2009 and has now ceased to operate on going concern basis. The financial statements have accordingly been stated at their estimated realizable values and the resultant gain or loss, as the case may be, has been adjusted in the financial statements for the year ended 31 December 2011.
CORPORATE GOVERNANCE
The Directors confirm compliance with the Corporate and Financial Reporting framework of the Code of Corporate Governance as contained in the listing regulations for the followings:
1. The financial statements together with the notes thereon have been drawn up in conformity with the Companies Ordinance, 1984. These statements, prepared by the management, present fairly the Company's state of affairs, the results of its operations, cash flows and changes in equity.
2. Proper books of accounts have been maintained.
Highnoon Laboratories Limited 11Annual Report 2011
3. Accounting estimates are based on prudent judgments and there are no outstanding statutory payments on account of Government taxes, duties, levies and charges except for those which have been disclosed in note 11 and note 15 to the financial statements.
4. Appropriate accounting policies have been consistently applied in preparation of financial statements and accounting estimates are based on reasonable and prudent judgment.
5. There have been no material changes since 31 December 2011 and the Company has not entered into any commitment, which would affect the financial position at the date.
6. An Audit Committee of the Board has been in existence since the enforcement of the Code of Corporate Governance, which comprises of three members including the Chairman out of which two are non-executive directors. The Committee has its own terms of reference, which were determined by the Board of Directors in accordance with the guidelines provided in the Code of Corporate Governance.
7. International Accounting Standards, as applicable in Pakistan, have been followed in preparation of financial statements.
8. The System of internal controls is sound in design and has been effectively implemented and monitored.
9. There are no significant doubts upon the Company's ability to continue as a going concern.
10. None of the directors have been convicted as a defaulter in payment of any loans of Banks / DFIs nor they or their spouses are engaged in the business of stock brokerage. The Board has separately appended “Statement of Compliance with Best Practices of Corporate Governance” and auditors have given clean review report thereon.
11. There has been no material departure from the Best Practices of Corporate Governance, as detailed in the listing regulations.
12. The value of investment of the Provident fund based on un-audited figure as on 31 December 2011 was Rs.128.135 Million as compared to audited figures as at 31 December 2010 of Rs.120.501 million.
13. Key financial data for the last six years as an investors' guide is set out on Page 17 of the Annual Report.
WEB PRESENCE
Company's profile and all periodic financial statements including annual reports are available on the Company's web site “www.highnoon-labs.com” for information of the investors.
CHAIRMAN'S REVIEW
The Directors endorse the contents of the Chairman's Review, which forms part of the Directors' Report. The Board authorizes the Chief Executive Officer to sign the Directors' Report on behalf of the Board.
For and on behalf of the Board
Aslam HafizChief Executive Officer
Lahore: 22 March, 2012
12 Annual Report 2011 Highnoon Laboratories Limited
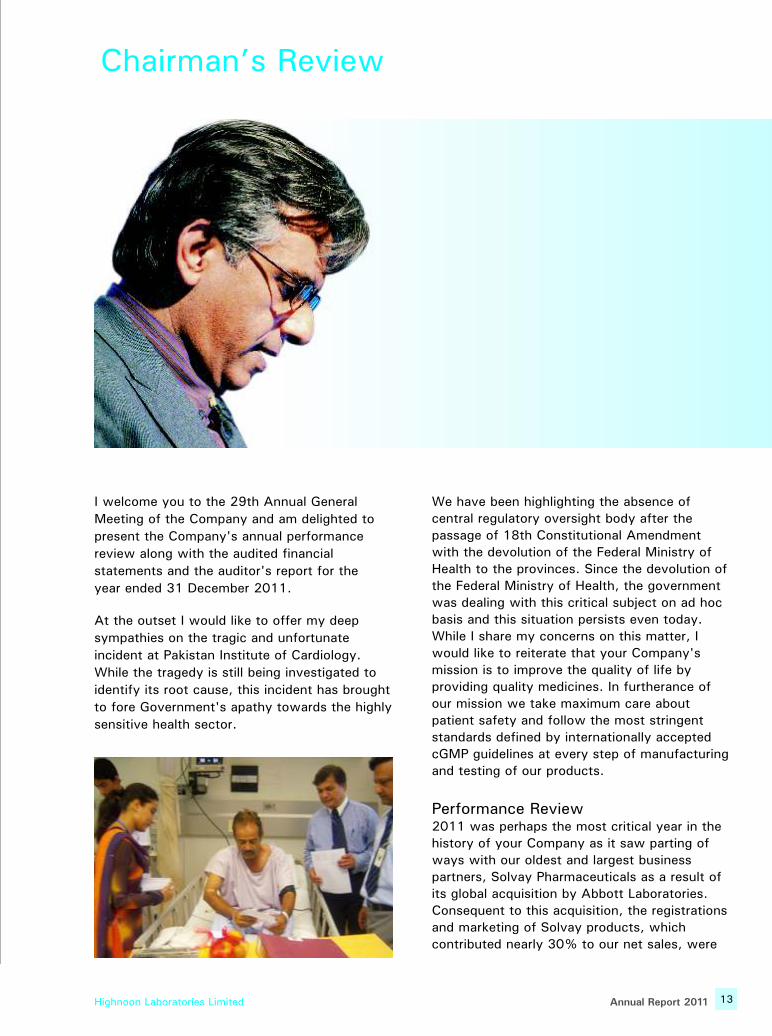
I welcome you to the 29th Annual General
Meeting of the Company and am delighted to
present the Company's annual performance
review along with the audited financial
statements and the auditor's report for the
year ended 31 December 2011.
At the outset I would like to offer my deep
sympathies on the tragic and unfortunate
incident at Pakistan Institute of Cardiology.
While the tragedy is still being investigated to
identify its root cause, this incident has brought
to fore Government's apathy towards the highly
sensitive health sector.
We have been highlighting the absence of
central regulatory oversight body after the
passage of 18th Constitutional Amendment
with the devolution of the Federal Ministry of
Health to the provinces. Since the devolution of
the Federal Ministry of Health, the government
was dealing with this critical subject on ad hoc
basis and this situation persists even today.
While I share my concerns on this matter, I
would like to reiterate that your Company's
mission is to improve the quality of life by
providing quality medicines. In furtherance of
our mission we take maximum care about
patient safety and follow the most stringent
standards defined by internationally accepted
cGMP guidelines at every step of manufacturing
and testing of our products.
Performance Review2011 was perhaps the most critical year in the
history of your Company as it saw parting of
ways with our oldest and largest business
partners, Solvay Pharmaceuticals as a result of
its global acquisition by Abbott Laboratories.
Consequent to this acquisition, the registrations
and marketing of Solvay products, which
contributed nearly 30% to our net sales, were
Chairman’s Review
Highnoon Laboratories Limited 13Annual Report 2011

14 Annual Report 2011 Highnoon Laboratories Limited
transferred from Highnoon to Abbott. The
management of your Company, however,successfully negotiated a long-term agreement
with Abbott Laboratories under which these
products will continue to be manufactured by
Highnoon while these shall be marketed by
Abbott. The operating results of 2011,
therefore, carry the impact of this phenomenal
change in the structure of your Company.
Net revenues recorded by your Company during
2011 amounted to Rs.2.945 Billion (2010:
Rs.2.637 Billion), showing a growth of 11.7%.
It is pertinent to re-iterate here that 2011
revenues carry only six months of sales from
Solvay products as against full year sales
impact from these products during 2010.
Ever increasing inflationary pressure and
weakening rupee resulted in more than 17%
increase in cost of sales during the year. As a
consequence, there was only a marginal
increase of 1.2% in gross profit, which
amounted to Rs.0.914 Billion (2010: Rs.0.904
Billion). As a percentage to sales, gross profit
for the year stood at 31% as against 34% in
2010.
Significant reduction in financial cost and realization of revenues as a consequence of the agreement with Abbott Laboratories enabled your Company to post a pre-tax profit of Rs.144 Million (2010: Rs.106 million), registering an increase of 36% over 2010. Profit after tax also posted a handsome increase of 31% and came up to Rs.92.381 Million (2010: Rs.70.344 Million), enabling your Company to record an EPS of Rs.5.08 as against Rs.3.87 during 2010.
Looking Ahead
While transfer of Solvay business to Abbott Laboratories severely impacted our revenues and costs during 2011, your Company has taken concrete measures during the course of the year to overcome these deficits through re-aligning its operation. These measures include:
o Re-structuring of the sales organization to make it leaner and more productive.
o Improving the sales mix of existing products to improve the overall gross margin of the Company.
o More aggressive introduction of new products.
o Addition of new manufacturing sections to broaden the product offerings.
3,000
2,500
2,000
1,500
1,000
500
-
180
160
140
120
100
80
60
40
20
-
20112006 2007 2008 2009 2010
Turnover Gross Profit Operating Profit Profit before Tax
Turnover and Profitability
Tu
rno
ver
& G
P (
Ru
pe
es
in m
illio
n)
Op
era
ting
Pro
fit &
Pro
fit b
efo
re T
ax
(Ru
pe
es
in m
illio
n)
Sales Trend
20112006 2007 2008 2009 2010
Local Export
Ru
pe
es
in m
illio
ns
3,000
2,700
2,400
2,100
1,800
1,500
1,200
900
Highnoon Laboratories Limited 15Annual Report 2011
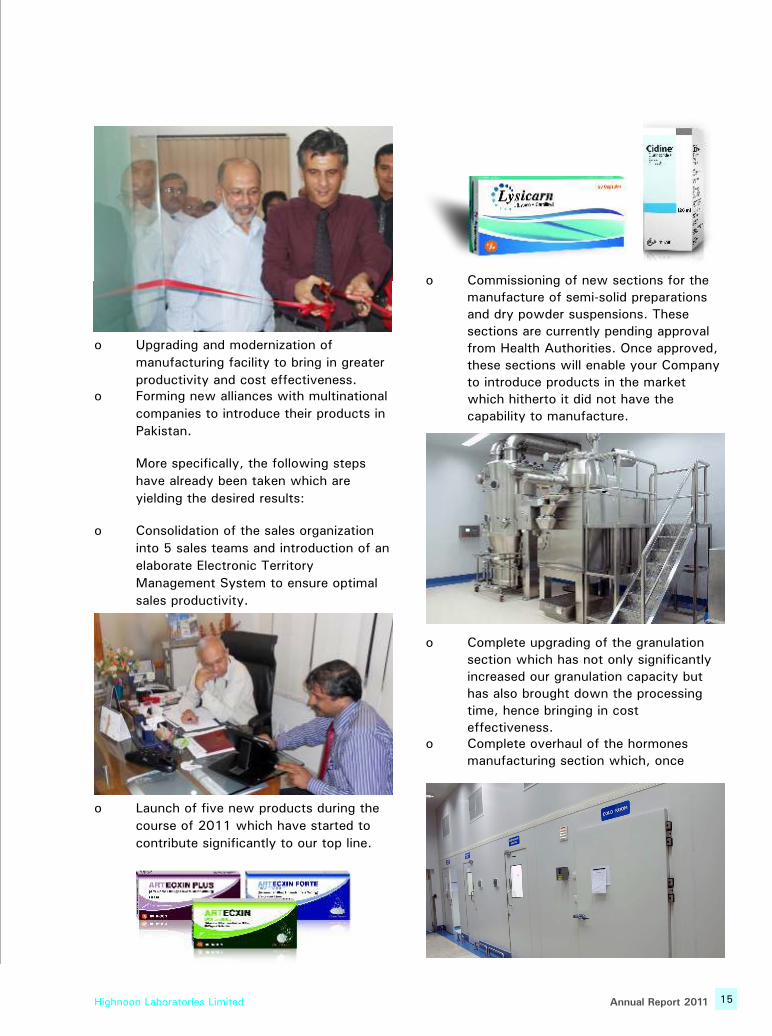
o Upgrading and modernization of
manufacturing facility to bring in greater
productivity and cost effectiveness.o Forming new alliances with multinational
companies to introduce their products in
Pakistan.
More specifically, the following steps
have already been taken which are
yielding the desired results: o Consolidation of the sales organization
into 5 sales teams and introduction of an
elaborate Electronic Territory
Management System to ensure optimal
sales productivity.
o Launch of five new products during the
course of 2011 which have started to
contribute significantly to our top line.
o Commissioning of new sections for the
manufacture of semi-solid preparations
and dry powder suspensions. These
sections are currently pending approval
from Health Authorities. Once approved,
these sections will enable your Company
to introduce products in the market
which hitherto it did not have the
capability to manufacture.
o Complete upgrading of the granulation
section which has not only significantly
increased our granulation capacity but
has also brought down the processing
time, hence bringing in cost
effectiveness.o Complete overhaul of the hormones
manufacturing section which, once

16 Annual Report 2011 Highnoon Laboratories Limited
completed, will enable your Company to become one of the foremost manufacturers of hormone products in the country.
o Entering into a marketing alliance with Switzerland based Acino Pharmaceuticals which specializes in manufacture and marketing of high-tech dosage forms such as trans-dermal patches and delayed release formulations. Some of the products from Acino are already under registration and are expected to be introduced during the course of 2012.
o Your Company is also in the advanced stages of negotiating another marketing alliance with German company which specializes in pharmaceutical products of natural origin. We expect that this agreement will, Insha Allah, get concluded during the first half of 2012.
Ladies and gentlemen, as I said earlier, 2011 was perhaps the most critical and difficult year in the history of our Company. The fact that we have posted as impressive earnings speaks volumes of the strength of the organization and the perseverance and dedication of the team which forms the Highnoon family. These results along with the steps which I have elaborated above give me the confidence that we have an exceptionally prosperous future in front of us. Please join me in praying to the almighty that our endeavors do indeed bear the fruits which take our Company to new heights of success.
May God bless all of us.
For & on behalf of the Board
Tausif Ahmad KhanChairman
Lahore: 22 March 2012

Six years at a Glance200620072008200920102011
181,805
398,713
701,972
127,039
284,416
83,898
265,857
2,944,907
914,171
297,360
72,751
144,053
92,381
388,077
(47,473)
(391,339)
(50,735)
12,597
Summary of Balance Sheet
Share Capital
Reserves
Operating Fixed Assets
Non Current Assets
Net Working Capital
Long Term Liabilities
Deferred Liabilities
Summary of Profit and Loss Account
Sales - Net
Gross Profit
Earnings Before Interest, Tax, Depreciation
and Amortization (EBITDA)
Operating Profit
Profit Before Tax
Net Profit After Tax
Summary of Cash Flow Statement
Net Cash Flow from Operating Activities
Net Cash Flow from Investing Activities
Net Cash Flow from Financing Activities
Changes in Cash and Cash Equivalents
Cash and Cash Equivalents at Year End
Financial Performance/Profitability Analysis
Gross Profit Margin
EBITDA to Sales Margin
Operating Profit Margin
Profit Before Tax Margin
Profit After Tax Margin
Return on Equity
Return on Capital Employed
Operating Performance/Liquidity Analysis
Inventory Turnover
Debtors Turnover
Creditors Turnover
Cash Operating Cycle
Assets Turnover Ratio
Fixed Assets Turnover
Return on Assets
Current Ratio
Quick Ratio
165,277
358,856
696,937
144,145
259,483
127,850
260,106
2,636,538
903,555
258,772
108,748
105,580
70,344
270,151
(115,634)
(122,111)
32,406
63,331
165,277
323,918
675,982
104,145
201,138
70,554
227,126
2,334,752
846,157
258,042
115,827
101,847
65,762
(13,919)
(71,394)
113,337
28,024
30,925
165,277
332,801
653,900
107,088
194,315
96,472
160,146
1,933,344
686,938
209,909
96,178
77,972
63,123
59,457
(120,787)
56,650
(4,679)
7,177
150,252
299,940
564,711
119,383
192,212
86,182
131,672
1,851,718
755,409
226,069
125,676
122,265
100,924
119,631
(38,419)
(84,921)
(3,707)
11,856
130,654
245,127
500,804
76,421
137,181
40,881
149,295
1,525,692
616,506
196,658
99,014
100,487
75,725
92,232
(11,217)
(78,954)
2,061
15,565
%
%
%
%
%
%
%
Days
Days
Days
Days
Times
Times
%
Times
Times
31.04
10.10
2.47
4.89
3.14
15.91
13.90
104
6
29
76
1.89
3.56
9.25
1.64
0.47
34.27
9.81
4.12
4.00
2.67
13.42
10.79
141
6
28
119
1.51
3.19
6.06
1.41
0.40
40.41
12.89
6.49
6.59
4.96
20.15
18.17
129
23
45
108
1.32
2.75
8.69
1.31
0.50
36.24
11.05
4.96
4.36
2.82
13.44
11.75
141
14
32
123
1.34
3.18
5.83
1.26
0.35
35.53
10.86
4.97
4.03
3.26
12.67
10.62
127
31
40
118
1.31
2.58
5.28
1.37
0.51
40.80
12.21
6.79
6.60
5.45
22.42
18.82
130
31
48
113
1.38
2.79
9.13
1.42
0.51
Highnoon Laboratories Limited 17Annual Report 2011

200620072008200920102011
Rs.
%
%
%
Rs./share
Times
%
Times
in’000’
Rs.
Rs.
Rs.
Rs.
Rs.
Rs.
Rs.in’000’
3.00
-
59.04
10.58
5.08
5.58
11:89
49.03
3.05
18,181
31.93
42.00
28.35
33.50
24.50
27.94
515,418
2.50
10.00
82.23
12.09
4.26
6.80
19:81
40.93
2.18
16,528
31.71
43.12
28.94
33.99
22.10
27.30
478,313
2.50
-
62.83
8.20
3.98
7.66
11:89
39.14
2.28
16,528
29.60
41.36
30.50
40.45
27.71
30.54
504,095
2.50
-
65.46
6.38
3.82
10.26
16:84
47.36
2.16
16,528
30.14
42.27
39.20
94.25
27.40
79.64
647,886
1.50
10.00
37.22
2.99
6.72
12.43
16:84
49.18
3.86
15,025
29.96
43.82
83.50
94.55
49.50
75.54
1,254,604
1.50
15.00
51.76
6.74
5.80
7.67
10:90
45.32
3.62
13,065
28.76
40.12
44.50
52.20
37.90
45.05
581,410
Distribution Analysis
Pay out - Proposed
Cash Dividend per share
Bonus
Payout Ratio (after tax)
Dividend Yield
Earnings Per Share (after tax)
Price Earning Ratio
Capital Structure/Market Value Analysis
Long Term Debt : Equity Ratio
Shareholders' Net Worth
as % of Total Assets
Financial Charges Coverage
Number of Shares
Break-up Value of Share
Excluding Surplus on Revaluation
Including Surplus on Revaluation
Market Value of Share
Year End
Highest
Lowest
Average
Market Capitalization
Profit after Tax
Profit before Tax
Operating Profit
EBITDA
40 70 100 130 160 190 220 250 280 300
Rupees in million
2006 2007 2008 2009 2010 2011Profitability
18 Annual Report 2011 Highnoon Laboratories Limited
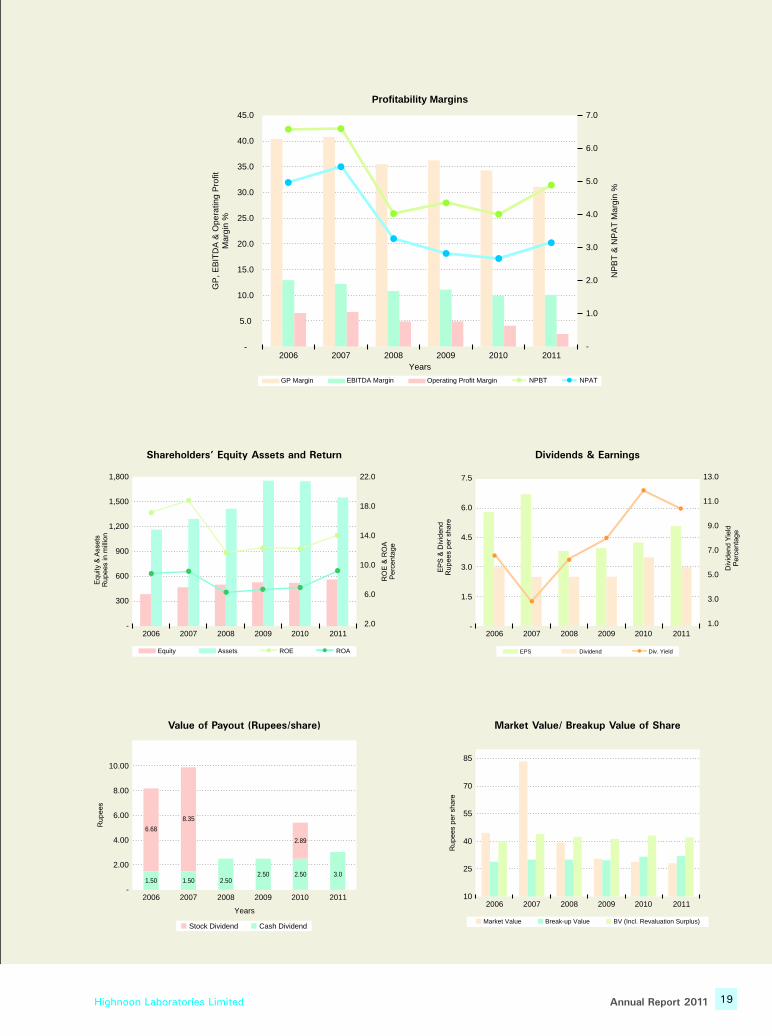
Performance Overview
20112006 2007 2008 2009 2010
1,800
1,500
1,200
900
600
300
-
22.0
18.0
14.0
10.0
6.0
2.0
Eq
uity
& A
sse
tsR
up
ee
s in
mill
ion
RO
E &
RO
AP
erc
en
tag
e
Shareholders’ Equity Assets and Return
Equity Assets ROE ROA
Dividends & Earnings
Div
ide
nd
Yie
ldP
erc
en
tag
e
EP
S &
Div
ide
nd
Ru
pe
es
pe
r sh
are
20112006 2007 2008 2009 2010
7.5
6.0
4.5
3.0
1.5
-
13.0
11.0
9.0
7.0
5.0
3.0
1.0
EPS Dividend Div. Yield
Years
Ru
pe
es
Value of Payout (Rupees/share)
Stock Dividend Cash Dividend
20112006 2007 2008 2009 2010
8.35
6.68
1.50 1.50 2.502.50 2.50 3.0
2.89
10.00
8.00
6.00
4.00
2.00
-
Ru
pe
es
pe
r sh
are
Market Value Break-up Value BV (Incl. Revaluation Surplus)
20112006 2007 2008 2009 2010
Market Value/ Breakup Value of Share
85
70
55
40
25
10
GP Margin EBITDA Margin Operating Profit Margin NPBT NPAT
45.0
40.0
35.0
30.0
25.0
20.0
15.0
10.0
5.0
-
7.0
6.0
5.0
4.0
3.0
2.0
1.0
-20112006 2007 2008 2009 2010
Years
Profitability Margins
GP
, EB
ITD
A &
Ope
ratin
g P
rofit
Mar
gin
%
NP
BT
& N
PA
T M
argi
n %
Highnoon Laboratories Limited 19Annual Report 2011

Shareholders asdividends, 41,319,
5.3%
Lenders as financialcharges, 70,371,
9.0%Retained within
business, 133,999,17.2%
Government astaxes, 59,107,
7.6%
Employees’ asremuneration,
475,443,60.9%
Statement of value additionand its distribution
2011
Rs. in ‘000’
2010
Rs. in ‘000’
Value Added
Net Sales
Material & Services
Other Income
2,947,666
2,260,179
92,752
780,239
2,636,932
1,942,503
7,708
702,137
DistributionEmployees
Salaries Wages & Benefits
Workers Profit Participation Fund
467,611
7,832
475,443
430,641
5,745
436,386
Government
Income Tax
Sales Tax
Central Research Fund
Workers Welfare Fund
51,672
2,759
1,456
3,220
59,107
35,236
394
1,427
2,155
39,212
Provider of Finances
To Shareholder as Dividend
To Banks as financial charges
41,319
70,371
111,690
41,319
79,341
120,660
Retained in Business
Depreciation and amortization
Retained Profit
82,937
51,062
133,999
780,239
76,854
29,025
105,879
702,137
20 Annual Report 2011 Highnoon Laboratories Limited
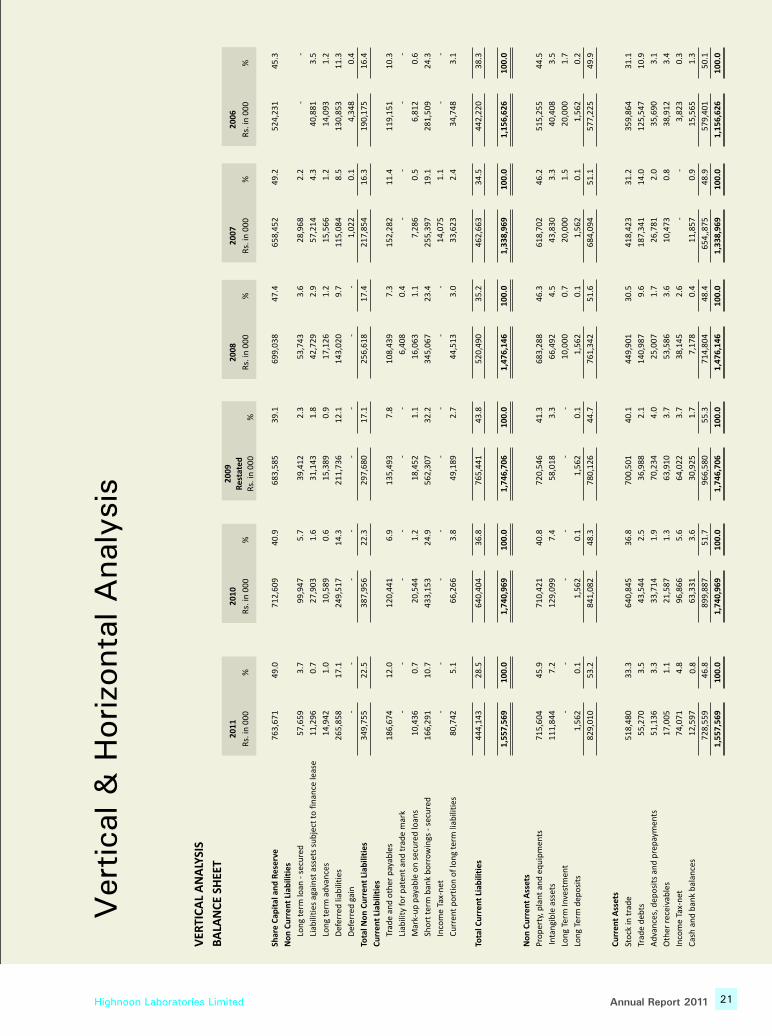
Vert
ical &
Horizo
nta
l A
naly
sis
VER
TIC
AL
AN
ALY
SIS
BA
LAN
CE
SHEE
T
Shar
e C
apit
al a
nd
Re
serv
e
No
n C
urr
en
t Li
abili
tie
s
L
on
g te
rm lo
an -
sec
ure
d
L
iab
iliti
es a
gain
st a
sset
s su
bje
ct t
o f
inan
ce le
ase
L
on
g te
rm a
dva
nce
s
D
efer
red
liab
iliti
es
D
efer
red
gai
n
Tota
l No
n C
urr
en
t Li
abili
tie
s
Cu
rre
nt
Liab
iliti
es
T
rad
e an
d o
ther
pay
able
s
L
iab
ility
fo
r p
aten
t an
d t
rad
e m
ark
M
ark-
up
pay
able
on
sec
ure
d lo
ans
S
ho
rt t
erm
ban
k b
orr
ow
ings
- s
ecu
red
I
nco
me
Tax-
net
C
urr
ent
po
rtio
n o
f lo
ng
term
liab
iliti
es
Tota
l Cu
rre
nt
Liab
iliti
es
No
n C
urr
en
t A
sset
s
Pro
per
ty, p
lan
t an
d e
qu
ipm
ents
Inta
ngi
ble
ass
ets
Lon
g Te
rm In
vest
men
t
Lon
g Te
rm d
epo
sits
Cu
rre
nt
Ass
ets
Sto
ck in
tra
de
Trad
e d
ebts
Ad
van
ces,
dep
osi
ts a
nd
pre
pay
men
ts
Oth
er r
ecei
vab
les
Inco
me
Tax-
net
Cas
h a
nd
ban
k b
alan
ces
20
11
Rs.
in 0
00
%
76
3,6
71
57
,65
9
11
,29
6
14
,94
2
26
5,8
58 -
34
9,7
55
18
6,6
74 -
10
,43
6
16
6,2
91 -
80
,74
2
44
4,1
43
1,5
57
,56
9
49
.0
3.7
0.7
1.0
17
.1 -
22
.5
12
.0 -
0.7
10
.7 -
5.1
28
.5
10
0.0
71
5,6
04
11
1,8
44 -
1,5
62
82
9,0
10
51
8,4
80
55
,27
0
51
,13
6
17
,00
5
74
,07
1
12
,59
7
72
8,5
59
1,5
57
,56
9
45
.9
7.2 -
0.1
53
.2
33
.3
3.5
3.3
1.1
4.8
0.8
46
.8
10
0.0
20
10
Rs.
in 0
00
%
71
2,6
09
99
,94
7
27
,90
3
10
,58
9
24
9,5
17 -
38
7,9
56
12
0,4
41 -
20
,54
4
43
3,1
53 -
66
,26
6
64
0,4
04
1,7
40
,96
9
40
.9
5.7
1.6
0.6
14
.3 -
22
.3
6.9 -
1.2
24
.9 -
3.8
36
.8
10
0.0
71
0,4
21
12
9,0
99 -
1,5
62
84
1,0
82
64
0,8
45
43
,54
4
33
,71
4
21
,58
7
96
,86
6
63
,33
1
89
9,8
87
1,7
40
,96
9
40
.8
7.4 -
0.1
48
.3
36
.8
2.5
1.9
1.3
5.6
3.6
51
.7
10
0.0
68
3,5
85
39
,41
2
31
,14
3
15
,38
9
21
1,7
36 -
29
7,6
80
13
5,4
93 -
18
,45
2
56
2,3
07 -
49
,18
9
76
5,4
41
1,7
46
,70
6
39
.1
2.3
1.8
0.9
12
.1 -
17
.1
7.8 -
1.1
32
.2 -
2.7
43
.8
10
0.0
20
09
Re
stat
ed
Rs.
in 0
00
%
72
0,5
46
58
,01
8 -
1,5
62
78
0,1
26
70
0,5
01
36
,98
8
70
,23
4
63
,91
0
64
,02
2
30
,92
5
96
6,5
80
1,7
46
,70
6
41
.3
3.3 -
0.1
44
.7
40
.1
2.1
4.0
3.7
3.7
1.7
55
.3
10
0.0
20
08
Rs.
in 0
00
%
69
9,0
38
53
,74
3
42
,72
9
17
,12
6
14
3,0
20 -
25
6,6
18
10
8,4
39
6,4
08
16
,06
3
34
5,0
67 -
44
,51
3
52
0,4
90
1,4
76
,14
6
47
.4
3.6
2.9
1.2
9.7 -
17
.4
7.3
0.4
1.1
23
.4 -
3.0
35
.2
10
0.0
68
3,2
88
66
,49
2
10
,00
0
1,5
62
76
1,3
42
44
9,9
01
14
0,9
87
25
,00
7
53
,58
6
38
,14
5
7,1
78
71
4,8
04
1,4
76
,14
6
46
.3
4.5
0.7
0.1
51
.6
30
.5
9.6
1.7
3.6
2.6
0.4
48
.4
10
0.0
20
07
Rs.
in 0
00
%
65
8,4
52
28
,96
8
57
,21
4
15
,56
6
11
5,0
84
1,0
22
21
7,8
54
15
2,2
82 -
7,2
86
25
5,3
97
14
,07
5
33
,62
3
46
2,6
63
1,3
38
,96
9
49
.2
2.2
4.3
1.2
8.5
0.1
16
.3
11
.4 -
0.5
19
.1
1.1
2.4
34
.5
10
0.0
61
8,7
02
43
,83
0
20
,00
0
1,5
62
68
4,0
94
41
8,4
23
18
7,3
41
26
,78
1
10
,47
3 -
11
,85
7
65
4,,8
75
1,3
38
,96
9
46
.2
3.3
1.5
0.1
51
.1
31
.2
14
.0
2.0
0.8 -
0.9
48
.9
10
0.0
20
06
Rs.
in 0
00
%
52
4,2
31 -
40
,88
1
14
,09
3
13
0,8
53
4,3
48
19
0,1
75
11
9,1
51 -
6,8
12
28
1,5
09 -
34
,74
8
44
2,2
20
1,1
56
,62
6
45
.3 -
3.5
1.2
11
.3
0.4
16
.4
10
.3 -
0.6
24
.3 -
3.1
38
.3
10
0.0
51
5,2
55
40
,40
8
20
,00
0
1,5
62
57
7,2
25
35
9,8
64
12
5,5
47
35
,69
0
38
,91
2
3,8
23
15
,56
5
57
9,4
01
1,1
56
,62
6
44
.5
3.5
1.7
0.2
49
.9
31
.1
10
.9
3.1
3.4
0.3
1.3
50
.1
10
0.0
Highnoon Laboratories Limited 21Annual Report 2011
Sale
s -
net
Co
st o
f Sa
les
Gro
ss P
rofi
t
Oth
er O
per
atin
g In
com
e
Dis
trib
uti
on
, Sel
ling
and
Pro
mo
tio
nal
Exp
ense
s
Ad
min
istr
ativ
e an
d G
ener
al E
xpen
ses
Res
earc
h a
nd
Dev
elo
pm
ent
Exp
ense
s
Oth
er O
per
atin
g Ex
pen
ses
Fin
ance
Co
st
Pro
fit
Bef
ore
Tax
atio
n
Pro
fit
Aft
er T
axat
ion
Taxa
tio
n
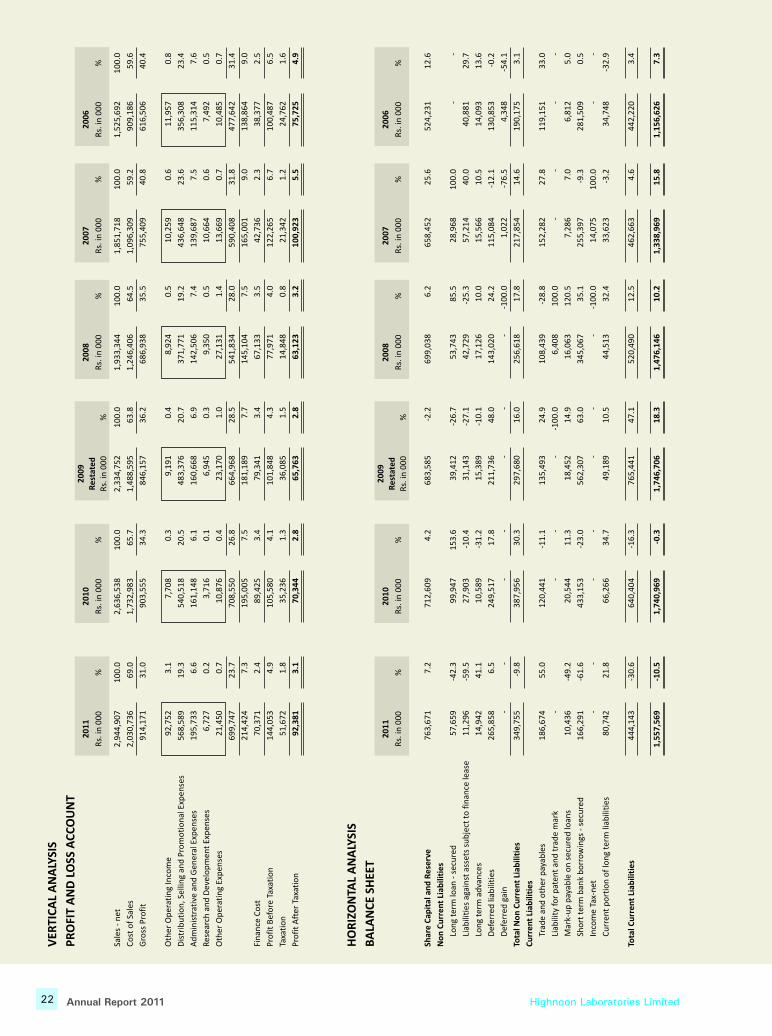
VER
TIC
AL
AN
ALY
SIS
PR
OFI
T A
ND
LO
SS A
CC
OU
NT
10
0.0
69
.0
31
.0
3.1
19
.3
6.6
0.2
0.7
23
.7
7.3
2.4
4.9
1.8
3.1
20
11
Rs.
in 0
00
%
2,9
44
,90
7
2,0
30
,73
6
91
4,1
71
92
,75
2
56
8,5
89
19
5,7
33
6,7
27
21
,45
0
69
9,7
47
21
4,4
24
70
,37
1
14
4,0
53
51
,67
2
92
,38
1
10
0.0
65
.7
34
.3
0.3
20
.5
6.1
0.1
0.4
26
.8
7.5
3.4
4.1
1.3
2.8
20
10
Rs.
in 0
00
%
2,6
36
,53
8
1,7
32
,98
3
90
3,5
55
7,7
08
54
0,5
18
16
1,1
48
3,7
16
10
,87
6
70
8,5
50
19
5,0
05
89
,42
5
10
5,5
80
35
,23
6
70
,34
4
10
0.0
59
.2
40
.8
0.6
23
.6
7.5
0.6
0.7
31
.8
9.0
2.3
6.7
1.2
5.5
20
07
Rs.
in 0
00
%
1,8
51
,71
8
1,0
96
,30
9
75
5,4
09
10
,25
9
43
6,6
48
13
9,6
87
10
,66
4
13
,66
9
59
0,4
08
16
5,0
01
42
,73
6
12
2,2
65
21
,34
2
10
0,9
23
10
0.0
64
.5
35
.5
0.5
19
.2
7.4
0.5
1.4
28
.0
7.5
3.5
4.0
0.8
3.2
20
08
Rs.
in 0
00
%
1,9
33
,34
4
1,2
46
,40
6
68
6,9
38
8,9
24
37
1,7
71
14
2,5
06
9,3
50
27
,13
1
54
1,8
34
14
5,1
04
67
,13
3
77
,97
1
14
,84
8
63
,12
3
10
0.0
63
.8
36
.2
0.4
20
.7
6.9
0.3
1.0
28
.5
7.7
3.4
4.3
1.5
2.8
20
09
Re
stat
ed
Rs.
in 0
00
%
2,3
34
,75
2
1,4
88
,59
5
84
6,1
57
9,1
91
48
3,3
76
16
0,6
68
6,9
45
23
,17
0
66
4,9
68
18
1,1
89
79
,34
1
10
1,8
48
36
,08
5
65
,76
3
10
0.0
59
.6
40
.4
0.8
23
.4
7.6
0.5
0.7
31
.4
9.0
2.5
6.5
1.6
4.9
20
06
Rs.
in 0
00
%
1,5
25
,69
2
90
9,1
86
61
6,5
06
11
,95
7
35
6,3
08
11
5,3
14
7,4
92
10
,48
5
47
7,6
42
13
8,8
64
38
,37
7
10
0,4
87
24
,76
2
75
,72
5
HO
RIZ
ON
TAL
AN
ALY
SIS
BA
LAN
CE
SHEE
T
Shar
e C
apit
al a
nd
Re
serv
e
No
n C
urr
en
t Li
abili
tie
s
L
on
g te
rm lo
an -
sec
ure
d
L
iab
iliti
es a
gain
st a
sset
s su
bje
ct t
o f
inan
ce le
ase
L
on
g te
rm a
dva
nce
s
D
efer
red
liab
iliti
es
D
efer
red
gai
n
Tota
l No
n C
urr
en
t Li
abili
tie
s
Cu
rre
nt
Liab
iliti
es
T
rad
e an
d o
ther
pay
able
s
L
iab
ility
fo
r p
aten
t an
d t
rad
e m
ark
M
ark-
up
pay
able
on
sec
ure
d lo
ans
S
ho
rt t
erm
ban
k b
orr
ow
ings
- s
ecu
red
I
nco
me
Tax-
net
C
urr
ent
po
rtio
n o
f lo
ng
term
liab
iliti
es
Tota
l Cu
rre
nt
Liab
iliti
es
20
11
Rs.
in 0
00
%
76
3,6
71
57
,65
9
11
,29
6
14
,94
2
26
5,8
58 -
34
9,7
55
18
6,6
74 -
10
,43
6
16
6,2
91 -
80
,74
2
44
4,1
43
1,5
57
,56
9
7.2
-42
.3
-59
.5
41
.1
6.5 -
-9.8
55
.0
-49
.2
-61
.6 -
21
.8
-30
.6
-10
.5
20
10
Rs.
in 0
00
%
71
2,6
09
99
,94
7
27
,90
3
10
,58
9
24
9,5
17 -
38
7,9
56
12
0,4
41 -
20
,54
4
43
3,1
53 -
66
,26
6
64
0,4
04
1,7
40
,96
9
4.2
15
3.6
-10
.4
-31
.2
17
.8 -
30
.3
-11
.1 -
11
.3
-23
.0 -
34
.7
-16
.3
-0.3
68
3,5
85
39
,41
2
31
,14
3
15
,38
9
21
1,7
36 -
29
7,6
80
13
5,4
93 -
18
,45
2
56
2,3
07 -
49
,18
9
76
5,4
41
1,7
46
,70
6
-2.2
-26
.7
-27
.1
-10
.1
48
.0 -
16
.0
24
.9
-10
0.0
14
.9
63
.0 -
10
.5
47
.1
18
.3
20
09
Re
stat
ed
Rs.
in 0
00
%
20
08
Rs.
in 0
00
%
69
9,0
38
53
,74
3
42
,72
9
17
,12
6
14
3,0
20 -
25
6,6
18
10
8,4
39
6,4
08
16
,06
3
34
5,0
67 -
44
,51
3
52
0,4
90
1,4
76
,14
6
6.2
85
.5
-25
.3
10
.0
24
.2
-10
0.0
17
.8
-28
.8
10
0.0
12
0.5
35
.1
-10
0.0
32
.4
12
.5
10
.2
20
07
Rs.
in 0
00
%
65
8,4
52
28
,96
8
57
,21
4
15
,56
6
11
5,0
84
1,0
22
21
7,8
54
15
2,2
82 -
7,2
86
25
5,3
97
14
,07
5
33
,62
3
46
2,6
63
1,3
38
,96
9
25
.6
10
0.0
40
.0
10
.5
-12
.1
-76
.5
14
.6
27
.8 -
7.0
-9.3
10
0.0
-3.2
4.6
15
.8
20
06
Rs.
in 0
00
%
52
4,2
31 -
40
,88
1
14
,09
3
13
0,8
53
4,3
48
19
0,1
75
11
9,1
51 -
6,8
12
28
1,5
09 -
34
,74
8
44
2,2
20
1,1
56
,62
6
12
.6 -
29
.7
13
.6
-0.2
-54
.1
3.1
33
.0 -
5.0
0.5 -
-32
.9
3.4
7.3
22 Annual Report 2011 Highnoon Laboratories Limited

No
n C
urr
en
t A
sset
s
Pro
per
ty, p
lan
t an
d e
qu
ipm
ents
Inta
ngi
ble
ass
ets
Lon
g Te
rm In
vest
men
t
Lon
g Te
rm d
epo
sits
Cu
rre
nt
Ass
ets
20
11
Rs.
in 0
00
%
71
5,6
04
11
1,8
44 -
1,5
62
82
9,0
10
0.7
-13
.4 - -
-1.4
20
10
Rs.
in 0
00
%
71
0,4
21
12
9,0
99 -
1,5
62
84
1,0
82
-1.4
12
2.5 - -
7.8
20
09
Re
stat
ed
Rs.
in 0
00
%
72
0,5
46
58
,01
8 -
1,5
62
78
0,1
26
5.5
-12
.7
-10
0.0 -
2.5
20
08
Rs.
in 0
00
%
68
3,2
88
66
,49
2
10
,00
0
1,5
62
76
1,3
42
10
.4
51
.7
-50
.0 -
11
.3
20
07
Rs.
in 0
00
%
61
8,7
02
43
,83
0
20
,00
0
1,5
62
68
4,0
94
20
.1
8.5 - -
18
.5
20
06
Rs.
in 0
00
%
51
5,2
55
40
,40
8
20
,00
0
1,5
62
57
7,2
25
0.8
-3.8 -
33
5.1
0.7
Sto
ck in
tra
de
Trad
e d
ebts
Ad
van
ces,
dep
osi
ts a
nd
pre
pay
men
ts
Oth
er r
ecei
vab
les
Inco
me
Tax-
net
Cas
h a
nd
ban
k b
alan
ces
51
8,4
80
55
,27
0
51
,13
6
17
,00
5
74
,07
1
12
,59
7
72
8,5
59
-19
.1
26
.9
51
.7
-21
.2
-23
.5
-80
.1
-19
.0
64
0,8
45
43
,54
4
33
,71
4
21
,58
7
96
,86
6
63
,33
1
89
9,8
87
-8.5
17
.7
-52
.0
-66
.2
51
.3
10
4.8
-6.9
70
0,5
01
36
,98
8
70
,23
4
63
,91
1
64
,02
1
30
,92
5
96
6,5
80
55
.7
-73
.8
18
0.9
19
.3
67
.8
33
0.8
35
.2
44
9,9
01
14
0,9
87
25
,00
7
53
,58
6
38
,14
5
7,1
78
71
4,8
04
7.5
-24
.7
-6.6
41
1.7
10
0.0
-39
.5
9.2
41
8,4
23
18
7,3
41
26
,78
1
10
,47
3 -
11
,85
7
65
4,,8
75
16
.3
49
.2
-25
.0
-73
.1
-10
0.0
-23
.8
13
.0
35
9,8
64
12
5,5
47
35
,69
0
38
,91
2
3,8
23
15
,56
5
57
9,4
01
27
.8
82
.2
47
.1
-54
.3
-87
.5
15
.3
14
.9
1,5
57
,56
9-1
0.5
1,7
40
,96
9-0
.31
,74
6,7
06
18
.31
,47
6,1
46
10
.21
,33
8,9
69
15
.81
,15
6,6
26
7.3
Sale
s -
net
Co
st o
f Sa
les
Gro
ss P
rofi
t
Oth
er O
per
atin
g In
com
e
4.4
13
.7
-9.1
-13
.0
20
08
Rs.
in 0
00
%
1,9
33
,34
4
1,2
46
,40
6
68
6,9
38
8,9
24
21
.4
20
.6
22
.5
-14
.2
20
07
Rs.
in 0
00
%
1,8
51
,71
8
1,0
96
,30
9
75
5,4
09
10
,25
9
22
.2
14
.0
36
.7
-19
.1
20
06
Rs.
in 0
00
%
1,5
25
,69
2
90
9,1
86
61
6,5
06
11
,95
7
HO
RIZ
ON
TAL
AN
ALY
SIS
PR
OFI
T A
ND
LO
SS A
CC
OU
NT
11
.7
17
.2
1.2
11
03
.4
20
10
Rs.
in 0
00
%
2,9
44
,90
7
2,0
30
,73
6
91
4,1
71
92
,75
2
12
.9
16
.4
6.8
-16
.1
20
10
Rs.
in 0
00
%
2,6
36
,53
8
1,7
32
,98
3
90
3,5
55
7,7
08
20
.8
19
.4
23
.2
3.0
20
09
Re
stat
ed
Rs.
in 0
00
%
2,3
34
,75
2
1,4
88
,59
5
84
6,1
57
9,1
91
Dis
trib
uti
on
, Sel
ling
and
Pro
mo
tio
nal
Exp
ense
s
Ad
min
istr
ativ
e an
d G
ener
al E
xpen
ses
Res
earc
h a
nd
Dev
elo
pm
ent
Exp
ense
s
Oth
er O
per
atin
g Ex
pen
ses
Fin
ance
Co
st
Pro
fit
Bef
ore
Tax
atio
n
Taxa
tio
n
Pro
fit
Tax
atio
nA
fter
-14
.9
2.0
-12
.3
98
.5
-12
.1
57
.1
-36
.2
-30
.4
-37
.5
37
1,7
71
14
2,5
06
9,3
50
27
,13
1
14
5,1
04
67
,13
3
77
,97
1
14
,84
8
63
,12
3
22
.5
21
.1
42
.3
30
.4
18
.8
11
.4
21
.7
-13
.8
33
.3
43
6,6
48
13
9,6
87
10
,66
4
13
,66
9
16
5,0
01
42
,73
6
12
2,2
65
21
,34
2
10
0,9
23
49
.7
6.9
16
.5
74
.8
29
.2
15
.2
35
.4
4.7
49
.8
35
6,3
08
11
5,3
14
7,4
92
10
,48
5
13
8,8
64
38
,37
7
10
0,4
87
24
,76
2
75
,72
5
5.2
21
.5
81
.0
97
.2
10
.0
-21
.3
36
.4
46
.6
31
.3
56
8,5
89
19
5,7
33
6,7
27
21
,45
0
21
4,4
24
70
,37
1
14
4,0
53
51
,67
2
92
,38
1
11
.8
0.3
-46
.5
-53
.1
7.6
12
.7
3.7
-2.4
7.0
54
0,5
18
16
1,1
48
3,7
16
10
,87
6
19
5,0
05
89
,42
5
10
5,5
80
35
,23
6
70
,34
4
30
.0
12
.7
-25
.7
-14
.6
24
.9
18
.2
30
.6
14
3.0
4.2
48
3,3
76
16
0,6
68
6,9
45
23
,17
0
-8.2
23
.63
3.3
-1.2
6.6
22
.7
18
1,1
89
79
,34
1
10
1,8
48
36
,08
5
65
,76
3
HO
RIZ
ON
TAL
AN
ALY
SIS
BA
LAN
CE
SHEE
T
69
9,7
47
70
8,5
50
59
0,4
08
54
1,8
34
66
4,9
68
47
7,6
42
Highnoon Laboratories Limited 23Annual Report 2011

Pattern of Shareholdingas at December 31, 2011
51,324
196,547
451,870
744,526
450,855
479,097
244,439
138,009
198,749
159,390
73,340
128,405
94,773
111,195
63,477
74,470
344,496
92,049
112,752
257,279
286,988
151,153
322,969
167,092
181,842
197,599
203,805
509,485
397,056
461,276
484,286
614,343
736,552
1,038,897
1,127,104
1,321,257
1,515,376
1,930,832
2,065,563
18,180,517
1
2
3
4
5
6
7
8
9
10
11
12
13
14
15
16
17
18
19
20
21
22
23
24
25
26
27
28
29
30
31
32
33
34
35
36
37
38
39
1175
840
569
359
65
40
14
6
7
5
2
3
2
2
1
1
4
1
1
2
2
1
2
1
1
1
1
2
1
1
1
1
1
1
1
1
1
1
1
3,121
1
101
501
1,001
5,001
10,001
15,001
20,001
25,001
30,001
35,001
40,001
45,001
50,001
60,001
70,001
80,001
90,001
100,001
115,001
130,001
145,001
155,001
165,001
180,001
195,001
200,001
230,001
300,001
400,001
465,001
600,001
700,001
800,001
1,050,001
1,150,001
1,400,001
1,700,001
2,000,001
-
-
-
-
-
-
-
-
-
-
-
-
-
-
-
-
-
-
-
-
-
-
-
-
-
-
-
-
-
-
-
-
-
-
-
-
-
-
-
100
500
1,000
5,000
10,000
15,000
20,000
25,000
30,000
35,000
40,000
45,000
50,000
60,000
70,000
80,000
90,000
100,000
115,000
130,000
145,000
155,000
165,000
180,000
195,000
200,000
230,000
300,000
400,000
465,000
600,000
700,000
800,000
1,050,000
1,150,000
1,400,000
1,700,000
2,000,000
2,200,200
Sr.No. No. of Shareholders Total Share heldShareholdings
From: To:
24 Annual Report 2011 Highnoon Laboratories Limited


This Statement is being presented to comply with the Code of Corporate Governance contained in the listing regulations of Karachi, Lahore and Islamabad Stock Exchanges for the purpose of establishing a framework of good governance, whereby a listed company is managed in compliance with the best practices of Corporate Governance.
The Company has applied the principles contained in the Code in the following manner:
1. The Company encourages representation of independent non-executive directors and directors representing minority interest on its Board of Directors. The present Board consists of three executive directors and five non-executive directors of which one is an independent director.
2. The directors have confirmed that none of them is serving as a director in more than ten listed companies, including Highnoon Laboratories Limited.
3. All the resident directors of the Company are registered as tax payers and none of them has defaulted in payment of any loan to a banking company, a DFI or an NBFI or, being a member of a stock exchange, has been declared as a defaulter by that stock exchange.
4. The Company has prepared a Statement of Ethics and Business Practices, which has been signed by all the directors and employees of the Company.
5. The Board has developed a vision/mission statement, overall corporate strategy and significant policies of the Company. A complete record of particulars of significant policies along with the dates on which they were approved or amended has been maintained.
6. All the powers of the Board have been duly exercised and decisions on material transactions, including appointment and determination of remuneration and terms and conditions of employment of the CEO and other executive directors have been taken by the Board.
7. The meetings of the Board were presided over by the Chairman, and in his absence, by a director elected by the Board and the Board met at least once in every quarter. Written notices of the Board meetings, along with agenda and working papers were circulated at least seven days before the meetings. The minutes of the meetings were appropriately recorded and circulated.
8. The Board arranged an orientation course for its directors to remind them of their duties and responsibilities.
9. The Company Secretary was appointed prior to the implementation of the Code of Corporate Governance. The Chief Financial Officer fulfils the requirements as mandated by the Code of Corporate Governance. The appointment of Head of Internal Audit, his remuneration and other terms and conditions have been approved by the Board of Directors as determined by the CEO.
Statement of Compliance
with best practices of the code of
Corporate Governance
26 Annual Report 2011 Highnoon Laboratories Limited

10. The directors' report for the year has been prepared in compliance with the requirements of the Code and fully describes the salient matters required to be disclosed.
11. The financial statements of the Company
were duly endorsed by CEO and CFO before
approval of the Board.
12. The directors, CEO and executives do not
hold any interest in the shares of the
Company other than that disclosed in the
pattern of shareholding.
13. The Company has complied with all the
corporate and financial reporting
requirements of the Code.
14. The Board has formed an Audit Committee.
It comprises of three members, two of them
are non-executive directors.
15. The meetings of the Audit Committee were
held at least once in every quarter prior to
the approval of interim and final results ofthe Company as required by the Code. The
terms of reference of the Committee have
been fully complied with.
16. The Board has set-up an effective internal audit function and the internal auditors of the Company are fully conversant with the policies and procedures of the Company and working on a full time basis.
17. The statutory auditors of the Company have confirmed that they have been given a satisfactory rating under the quality control review program of the Institute of Chartered Accountants of Pakistan, that they or any of the partners of the firm, their spouses and minor children do not hold shares of the Company and that the firm and all its partners are in compliance with International Federation of Accountants (IFAC) guidelines on code of ethics as adopted by the Institute of Chartered Accountants of Pakistan.
18. The statutory auditors or the persons associated with them have not been appointed to provide other services except in accordance with the listing regulations and the auditors have confirmed that they have observed IFAC guidelines in this regard.
19. We confirm that all other material principles contained in the Code have been complied with.
Lahore: 22 March 2012
For and on behalf of the Board
Aslam Hafiz Chief Executive Officer
Highnoon Laboratories Limited 27Annual Report 2011

We have reviewed the Statement of Compliance with the best practices contained in the Code of Corporate Governance prepared by the Board of Directors of Highnoon Laboratories Limited to comply with the Listing Regulation No. 35 of the Karachi Stock Exchange and Chapter XIII of the Lahore Stock Exchange and Chapter XI of the Listing Regulations of Islamabad Stock Exchange (Guarantee) Limited, where the Company is listed.
The responsibility for compliance with the Code of Corporate Governance is that of the Board of Directors of the Company. Our responsibility is to review, to the extent where such compliance can be objectively verified, whether the Statement of Compliance reflects the status of the Company's compliance with the provisions of the Code of Corporate Governance and report if it does not. A review is limited primarily to inquiries of the Company personnel and review of various documents prepared by the Company to comply with the Code.
As part of our audit of financial statements we are required to obtain an understanding of the accounting and internal control systems sufficient to plan the audit and develop an effective audit approach. We are not required to consider whether the Board's statement on internal controls covers all the risks and controls, or to form an opinion on the effectiveness of such internal controls, the company's corporate governance procedures and risks.Further, sub-regulation (xiii) of Listing Regulation No. 35 notified by the Karachi Stock EXChange (Guarantee) Limited vide circular KSE/N-269
dated 19 January 2009 requires the Company to place before the Board of Directors for their consideration and approval related party transactions distinguishing between transactions carried out on terms equivalent to those that prevail in arm's length transactions and transactions which are not executed at arm's length price recording proper justifications for using such alternate pricing mechanism. Further, all such transactions also required to be separately placed before the audit committee. We are only required and have ensured compliance of requirement to the extent of approval of related party transactions by the board of directors and placement of such transactions before audit committee. We have not carried out any procedures to determine whether the related party transactions were undertaken at arm's length price or not.
Based on our review, nothing has come to our attention which causes us to believe that the Statement of Compliance does not appropriately reflect the Company's compliance, in all material respects, with the best practices contained in the Code of Corporate Governance as applicable to the Company for the year ended 31 December 2011.
Lahore: 22 March 2012
Chartered AccountantsEngagement Partner:Naseem Akbar
Review Report to the Members on
Statement of Compliance with Best
Practices of the Code of Corporate
Governance
28 Annual Report 2011 Highnoon Laboratories Limited

Financial StatementsHIGHNOON LABORATORIES LIMITED2011
Highnoon Laboratories Limited 31Annual Report 2011
Lahore: 22 March 2012
AUDITORS’ REPORT TO THE MEMBERS
We have audited the annexed balance sheet of Highnoon Laboratories Limited as at 31 December 2011 and the related profit and loss account, statement of comprehensive income, cash flow statement and statement of changes in equity together with the notes forming part thereof, for the year then ended and we state that we have obtained all the information and explanations which, to the best of our knowledge and belief, were necessary for the purposes of our audit.
It is the responsibility of the Company's management to establish and maintain a system of internal control, and prepare and present the above said statements in conformity with the approved accounting standards and requirements of the Companies Ordinance, 1984. Our responsibility is to express an opinion on these statements based on our audit.
We conducted our audit in accordance with the auditing standards as applicable in Pakistan. These standards require that we plan and perform the audit to obtain reasonable assurance about whether the above said statements are free of any material misstatement. An audit includes examining, on a test basis, evidence supporting the amounts and disclosures in the above said statements. An audit also includes assessing the accounting policies and significant estimates made by management, as well as, evaluating the overall presentation of the above said statements. We believe that our audit provides a reasonable basis for our opinion and, after due verification, we report that:
a) in our opinion, proper books of account have been kept by the Company as required by the Companies Ordinance, 1984;
b) in our opinion:
(i) The balance sheet and profit and loss account together with the notes thereon have been draw up in conformity with the Companies Ordinance, 1984, and are in agreement with the books of account and are further in accordance with accounting policies consistently applied except for changes as stated in Noted 2.3 with which we concur;
(ii) The expenditure incurred during the year was for the purpose of the Company's business; and
(iii) The business conducted, investments made and the expenditure incurred during the year were in accordance with the objects of the Company.
c) in our opinion and to the best of our information and according to the explanations given to us, the balance sheet, profit and loss account, statement of comprehensive income, cash flow statement and statement of changes in equity together with the notes forming part thereof conform with approved accounting standards as applicable in Pakistan, and , give the information required by the Companies Ordinance, 1984, in the manner so required and respectively give a true and fair view of the state of the Company's affairs as at 31 December 2011 and of the profit, comprehensive income, its cash flows and changes in equity for the year then ended; and
d) In our opinion, Zakat deductible at source under the Zakat and Ushr Ordinance, 1980 (XVIII of 1980), was deducted by the Company and deposited in the Central Zakat Fund established under Section 7 of that Ordinance.
Chartered AccountantsEngagement Partner: Naseem akbar

32 Annual Report 2011 Highnoon Laboratories Limited
BALANCE SHEET
ASLAM HAFIZ CHIEF EXECUTIVE OFFICER
EQUITY AND LIABILITIES
SHARE CAPITAL AND RESERVES
Share capital
Reserves
Surplus on revaluation of fixed assets
NON CURRENT LIABILITIES
5
6
Note
2011
Rupees
2010
Rupees
Authorized Share Capital
Ordinary shares of Rs. 10 each
20,000,000 (2010: 20,000,000) 200,000,000
CURRENT LIABILITIES
Liabilities against assets
Long term loans - secured
subject to finance lease
Long term advances
Deferred liabilities
Trade and other payables
CONTINGENCIES AND COMMITMENTS
7
8
9
10
11
181,805,170
398,712,812
183,153,055
57,659,470
11,296,272
14,942,278
265,856,776
349,754,796
186,673,545
1,557,568,986
15
200,000,000
165,277,431
358,856,438
580,517,982 524,133,869
188,475,264
99,946,763
27,903,144
10,588,988
249,517,280
387,956,175
120,440,822
Markup payable on secured loans
Short term bank borrowings - secured
Current portion of long term liabilities
12
13
14
10,436,070
166,291,136
80,742,402
444,143,153
20,544,406
433,152,102
66,266,257
640,403,587
1,740,968,895
The annexed notes from 1 to 41 form an integral part of these financial statements.
- -

ANEES AHMAD KHANDIRECTOR
AS AT 31 DECEMBER 2011
Note
2011
Rupees
16
17
18
NON CURRENT ASSETS
ASSETS
Property, plant and equipment
Intangible assets
Long term investment
Long term deposits
CURRENT ASSETS
Stock in trade
Trade debts
Advances, deposits and prepayments
Other receivables
Income tax - net
Cash and bank balances
19
20
21
22
23
1,562,054
715,604,221
111,843,817
829,010,092
-
518,480,424
55,269,355
51,136,092
17,005,240
74,070,798
12,596,985
728,558,894
2010
Rupees
1,562,054
710,421,269
129,099,156
841,082,479
-
640,844,633
43,544,080
33,714,141
21,586,681
96,865,390
63,331,491
899,886,416
1,557,568,986 1,740,968,895
Highnoon Laboratories Limited 33Annual Report 2011

ANEES AHMAD KHANDIRECTOR
ASLAM HAFIZ CHIEF EXECUTIVE OFFICER
PROFIT AND LOSS ACCOUNTFOR THE YEAR ENDED 31 DECEMBER 2011
Cost of sales
GROSS PROFIT
Administrative and general expenses
Distribution, selling and promotional expenses
Other operating expenses
Research and development expenses
26
27
28
29
30
The annexed notes from 1 to 41 form an integral part of these financial statements.
Sales - net 2
25
4
Finance Cost 31
Taxation
PROFIT BEFORE TAXATION
32
PROFIT AFTER TAXATION
2011
Rupees
2010
RupeesNote
Earnings per share - basic and diluted 33
92,381,262
2,944,907,488
2,030,736,442
914,171,046
568,588,690
92,752,280
195,732,726
6,727,034
21,450,726
699,746,896
214,424,150
70,370,861
144,053,289
51,672,027
5.08
Other operating income
70,343,964
2,636,538,261
1,732,983,015
903,555,246
161,147,992
7,707,501
3,716,059
10,875,591
708,550,084
195,005,162
89,424,804
105,580,358
35,236,394
3.87
540,517,943
34 Annual Report 2011 Highnoon Laboratories Limited
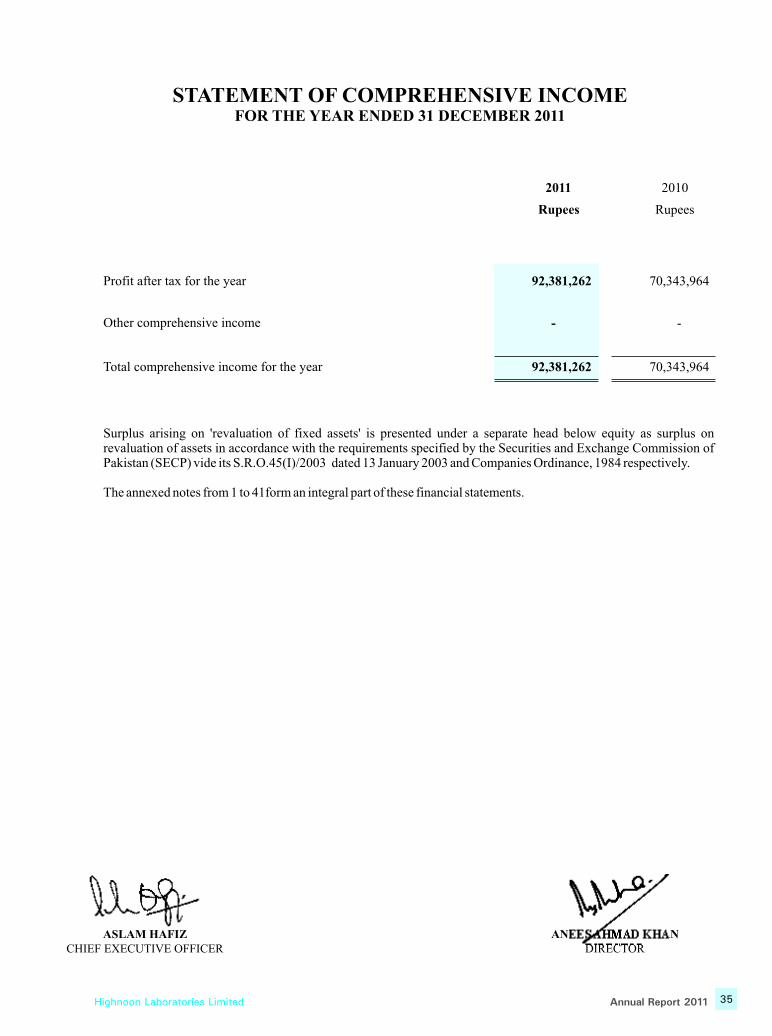
ANEES AHMAD KHANDIRECTOR
ASLAM HAFIZ CHIEF EXECUTIVE OFFICER
STATEMENT OF COMPREHENSIVE INCOMEFOR THE YEAR ENDED 31 DECEMBER 2011
Other comprehensive income
Total comprehensive income for the year
Surplus arising on 'revaluation of fixed assets' is presented under a separate head below equity as surplus on revaluation of assets in accordance with the requirements specified by the Securities and Exchange Commission of Pakistan (SECP) vide its S.R.O.45(I)/2003 dated 13 January 2003 and Companies Ordinance, 1984 respectively.
The annexed notes from 1 to 41form an integral part of these financial statements.
Profit after tax for the year 92,381,262
-
92,381,262
2011
Rupees
2010
Rupees
70,343,964
-
70,343,964
Highnoon Laboratories Limited 35Annual Report 2011

2011
Rupees
CASH FLOWS FROM OPERATING ACTIVITIES
Adjustments for non-cash and other items:
Profit before taxation
DepreciationAmortization of intangible assetsGain on sale of property, plant and equipmentExchange loss Provision for defined benefit obligation
2010
Rupees
Provision for doubtful debtsFinance cost
Profit before working capital changes
144,053,289
65,378,232
17,557,999
(5,530,791)
8,942,250
40,681,629
-
70,370,861
197,400,180
341,453,469
105,580,358
63,766,964
13,086,294
(6,780,670)
1,548,075
35,792,612
2,186,927
89,424,804
199,025,006
304,605,364
WORKING CAPITAL CHANGES
(Increase) / decrease in current assets:
Increase / (decrease) in current liabilities:
Stock in trade
Trade debts
Advances, deposits and prepayments
Other receivables
Trade and other payables
Taxes paid
Gratuity paid
Finance cost paid
Long term advances - net
Net Cash Flow from Operating activities
Cash generated from operations
122,364,209
(11,725,275)
(17,421,951)
4,581,441
56,750,712
(42,988,179)
(10,231,390)
(74,452,116)
19,746,270
388,077,190
496,002,605
154,549,136
59,656,796
(8,742,714)
36,519,934
42,322,834
(17,141,619)
112,615,231
417,220,595
(55,571,383)
(10,521,073)
(79,607,315)
(1,369,339)
270,151,485
CASH FLOW STATEMENTFOR THE YEAR ENDED 31 DECEMBER 2011
36 Annual Report 2011 Highnoon Laboratories Limited
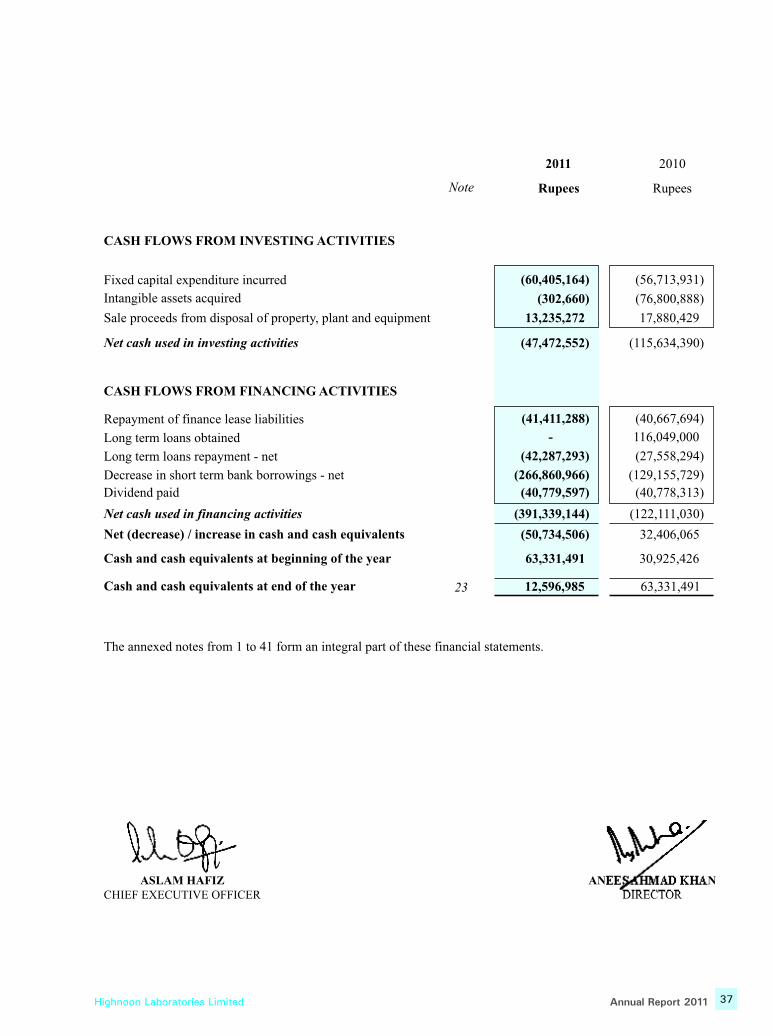
ANEES AHMAD KHANDIRECTOR
ASLAM HAFIZ CHIEF EXECUTIVE OFFICER
CASH FLOWS FROM INVESTING ACTIVITIES
Net cash used in investing activities
CASH FLOWS FROM FINANCING ACTIVITIES
Fixed capital expenditure incurred
Sale proceeds from disposal of property, plant and equipment
Intangible assets acquired
Long term loans repayment - net
Decrease in short term bank borrowings - net
Dividend paid
Long term loans obtained
Repayment of finance lease liabilities
2011
RupeesNote
2010
Rupees
The annexed notes from 1 to 41 form an integral part of these financial statements.
Net cash used in financing activities
23
Net / in cash and cash equivalents(decrease) increase
Cash and cash equivalents at beginning of the year
Cash and cash equivalents at end of the year
(60,405,164)
(302,660)
13,235,272
(47,472,552)
(42,287,293)
(266,860,966)
(40,779,597)
-
(41,411,288)
(391,339,144)
(50,734,506)
63,331,491
12,596,985
(56,713,931)
(76,800,888)
17,880,429
(115,634,390)
(27,558,294)
(129,155,729)
(40,778,313)
(122,111,030)
32,406,065
30,925,426
63,331,491
116,049,000
(40,667,694)
Highnoon Laboratories Limited 37Annual Report 2011

ANEES AHMAD KHANDIRECTOR
ASLAM HAFIZ CHIEF EXECUTIVE OFFICER
STATEMENT OF CHANGES IN EQUITYFOR THE YEAR ENDED 31 DECEMBER 2011
Share Capital
Revenue Reserves
Total
General ReserveUnappropriated
ProfitSub Total
----------------------------------------------------Rupees----------------------------------------------------
Balance as at 01 January 2010
Final dividend @ Rs. 2.5 per share
for the year ended 31 December 2009
-
165,277,431 114,000,000
-
209,918,266
(41,319,358)
323,918,266
(41,319,358)
489,195,697
(41,319,358)
Incremental depreciation relating to
surplus on revaluation of fixed assets - net
Total comprehensive income for the year
Balance as at 31 December 2010
Final dividend @ Rs. 2.5 per share
for the year ended 31 December 2010
Issuance of bonus shares @ of 10%
Incremental depreciation relating to
surplus on revaluation of fixed assets - net
Total comprehensive income for the year
Balance as at 31 December 2011
-
-
-
-
165,277,431
181,805,170
-
-
114,000,000
-
-
114,000,000
5,913,566
70,343,964
244,856,438
5,322,209
92,381,262
284,712,812
5,913,566
70,343,964
358,856,438
5,322,209
92,381,262
398,712,812
5,913,566
70,343,964
524,133,869
- - (41,319,358) (41,319,358) (41,319,358)
16,527,739 - (16,527,739) (16,527,739) -
5,322,209
92,381,262
580,517,982
The annexed notes from 1 to 41orm an integral part of these financial statements.
38 Annual Report 2011 Highnoon Laboratories Limited

Highnoon Laboratories Limited 39Annual Report 2011
NOTES TO THE FINANCIAL STATEMENTSFOR THE YEAR ENDED 31 DECEMBER 2011
1. THE COMPANY, OPERATIONS AND REGISTERED OFFICE
Highnoon Laboratories Limited ("the Company") was incorporated as a private limited company in Pakistan
in year 1984 and converted into an unquoted public limited company in 1985. Its shares are quoted on all
stock exchanges in Pakistan since November 1994. The Company is principally engaged in the manufacture,
import, sale and marketing of pharmaceutical and allied consumer products. The registered office of the
Company is situated at 17.5 Km, Multan Road, Lahore.
2. BASIS OF PREPARATION
2.1 Statement of Compliance
These financial statements have been prepared in accordance with approved accounting standards as
applicable in Pakistan. Approved accounting standards comprise of such International Financial
Reporting Standards (IFRS) issued by the International Accounting Standards Board (IASB) as are
notified under the Companies Ordinance, 1984, provisions of and directives issued under the
Companies Ordinance, 1984. In case requirements differ, the provisions or directives of the Companies
Ordinance, 1984 shall prevail.
2.2 Basis of presentation
These unconsolidated financial statements represent separate financial statements of the Company. The
consolidated financial statements of the company and its subsidiary Company are being issued
separately.
2.3 New and amended standards and interpretations become effective
The Company has adopted the following new and amended IFRS and IFRIC interpretations which
became effective during the year:
IAS 24 – Related Party Disclosures (Revised)
IAS 32 – Financial Instruments: Presentation – Classification of Rights Issues (Amendment)
IFRIC 14 – Prepayments of a Minimum Funding Requirement (Amendment)
IFRIC 19 - Extinguishing Financial Liabilities with Equity Instruments
In May 2010, International Accounting Standards Board (IASB) issued amendments to various
standards primarily with a view to removing inconsistencies and clarifying wording. These
improvements are listed below:
IFRS 3 Business Combinations- Transition requirements for contingent consideration from a business combination that
occurred before the effective date of the revised IFRS- Measurement of non-controlling interests (NCI)- Un-replaced and voluntarily replaced share-based payment awards
IFRS 7 Financial Instruments: Disclosures- Clarification of disclosures
IAS 1 Presentation of Financial Statements- Clarification of statement of changes in equity

40 Annual Report 2011 Highnoon Laboratories Limited
IAS 27 Consolidated and Separate Financial Statements- Transition requirements for amendments made as a result of IAS 27 Consolidated and Separate
Financial Statements.
IAS 34 Interim Financial Reporting- Significant events and transactions
IFRIC 13 Customer Loyalty Programmes- Fair value of award credits
The adoption of the above standards, amendments, interpretations and improvements did not have any
material effect on the financial statements.
2.4 Standards, interpretations and amendments to published approved accounting standards that are
not yet effective
The following revised standards, amendments and interpretations with respect to the approved
accounting standards as applicable in Pakistan would be effective from the dates mentioned below
against the respective standard or interpretation:
Effective Date (Annual Periods
Standard or Interpretation beginning on or after)
IFRS 7 - Financial Instruments : disclosures – (amendments)
- Amendments enhancing disclosures about transfers of financial Assets 01 July 2011
- Amendments enhancing disclosures about offsetting of financialassets and financial liabilities 01 January 2013
IAS 1 - Presentation of Financial Statements – Presentation of items ofcomprehensive income of Underlying Assets 01 January 2012
IAS 12 - Income Taxes (Amendment) - Recovery of Underlying Assets 01 January 2012
IAS 19 - Employee Benefits –(Amendment) 01 January 2013
The Company expects that the adoption of the above revisions, amendments and interpretations of the
standards will not materially affect the Company's financial statements in the period of initial
application.
In addition to the above, the following new standards have been issued by IASB which are yet to be
notified by the SECP for the purpose of applicability in Pakistan.
IASB effective date (Annual periods
Standards beginning on or after)
IFRS 9 - Financial Instruments 01 January 2015IFRS 10 - Consolidated Financial Statements 01 January 2013IFRS 11 - Joint Arrangements 01 January 2013IFRS 12 - Disclosure of Interests in Other Entities 01 January 2013IFRS 13 - Fair Value Measurement 01 January 2013
Highnoon Laboratories Limited 41Annual Report 2011
3. BASIS OF MEASUREMENT
3.1 Accounting convention
These financial statements have been prepared under the historical cost convention, except for
revaluation of certain assets as referred to in note 16 and recognition of certain employees retirement
benefits at present value. In these financial statements, except for the cash flow statement, all the
transactions have been accounted for on accrual basis.
3.2 Use of estimates and judgments
The preparation of financial statements in conformity with approved accounting standards requires
management to make judgments, estimates and assumptions that affect the application of accounting
policies and reported amounts of assets and liabilities, income and expenses. The estimates and
associated assumptions and judgments are based on historical experience and various other factors that
are believed to be reasonable under the circumstances, the result of which form the basis of making the
judgments about carrying values of assets and liabilities that are not readily apparent from other sources.
Actual results may differ from these estimates.
The estimates and underlying assumptions are reviewed on an ongoing basis. Revision to accounting
estimates are recognised in the period in which the estimate is revised if revision affects only that
period, or in the period of revision and future periods if the revision affects both current and future
periods.
The areas where various assumptions and estimates are significant to Company's financial statements or
where judgments were exercised in application of accounting policies are as follows:
Notes
- defined benefit obligation 4.2- revaluation of property, plant and equipment 4.5- residual values and useful lives of property, plant and equipment 4.5- impairment 4.12- taxation 4.16- provisions 4.19
4. SIGNIFICANT ACCOUNTING POLICIES
4.1 The accounting policies adopted in the preparation of these financial statements are consistent with
those of the previous financial year except as mentioned in note 2.3.
4.2 Staff retirement benefits
Defined benefit plan
The Company operates an unfunded gratuity scheme for all of its permanent employees, under which
benefits are paid on cessation of employment subject to a minimum qualifying period of service.
Qualified actuaries have carried out the valuation as at 31 December 2011. The projected unit credit
method with the following significant assumptions was used for the valuation of this scheme:
2011 2010
- Discount rate 12.5% per annum 13% per annum- Expected rate of increase in salary 11.5% per 12% - Expected average remaining working life time 14 years 14 years
The Company's policy with regard to actuarial gains/losses is to follow minimum recommended
approach under IAS 19 "Employees Benefits" by which actuarial gains/losses exceeding 10 % of
present value of benefit obligation are amortized over a period of five years.
annum per annum

42 Annual Report 2011 Highnoon Laboratories Limited
Defined contribution plan
The Company also operates a recognized provident fund scheme for all of its permanent employees in
accordance with the trust deed and rules made there under. Equal monthly contributions are made to the
fund by the Company and employees at the rate of 8.33% of basic salary and cost of living allowance.
Compensated leave absences
Provision for compensated absences is made to the extent of value of accumulated accrued leaves /
leave fare assistance of the employees at the balance sheet date as per entitlement on the basis of last
drawn salary. A maximum of 10 unavailed leaves are allowed to be carried forward for a maximum of
one year.
4.3 Foreign currency translation
All monetary assets and liabilities in foreign currency are translated at the rates of exchange prevailing
on the balance sheet date. Non-monetary assets and liabilities that are measured in terms of historical
cost in foreign currency are translated into rupees at exchange rates prevailing at the date of transaction.
Non-monetary assets and liabilities denominated in foreign currency that are stated at fair value are
translated into rupees at exchange rates prevailing at the date when fair values are determined.
Transactions in foreign currencies are converted into Pak rupees at exchange rates prevailing on the date
of transaction. All exchange gains/losses are taken to profit and loss account currently.
4.4 Trade and other payables
Trade and other payables are initially carried at fair value and subsequently at amortized cost using
effective interest rate method.
4.5 Property, plant and equipment
Owned operating assets
These are stated at cost or revalued amount less accumulated depreciation except for freehold land,
which is stated at revalued amount. Revaluation is carried out every five years unless earlier revaluation
is necessitated.
Depreciation is charged on reducing balance method at the rates mentioned in note 16.1 to write off the
cost / revalued amount of an asset over its estimated useful life. The assets' residual values and useful
lives are reviewed at each financial year end and adjusted, if its impact on depreciation is significant.
Full month's depreciation is charged on additions, while no depreciation is charged in the month of
disposal of assets. Surplus on revaluation of fixed assets relating to incremental depreciation (net of
deferred taxation) is transferred directly to unappropriated profit.
Gains and losses on disposal of fixed assets are included in income currently, except that the related
surplus on revaluation of fixed assets (net of deferred taxation) is transferred directly to unappropriated
profit.
Normal repairs and maintenance is charged to revenue as and when incurred, while major renewals and
replacements are capitalized if it is probable that the respective future economic benefits will flow to the
Company and the cost of the item can be measured reliably, and assets so replaced, if any, are retired.
Leasehold assets
Leases, where all the risks and rewards incidental to ownership of the leased assets have been
transferred to the Company, are classified as finance leases. Assets subject to finance lease are stated at
the lower of present value of minimum lease payments under the lease agreements and the fair value of
Highnoon Laboratories Limited 43Annual Report 2011
the leased assets at the commencement of lease, less accumulated depreciation and any identified
impairment loss.
The related rental obligations, net of finance costs, are included in liabilities against assets subject to
finance lease as referred to in note 8. The liabilities are classified as current and long term depending
upon the timing of the payment.
Each lease payment is allocated between the liability and finance costs so as to produce a constant
periodic rate of interest on the balance outstanding. The interest element of the rental is charged to
income over the lease term.
Assets acquired under finance lease are depreciated over the useful lives of assets on reducing balance
method at the rates given in note 16.1. The assets' residual values and useful lives are reviewed at each
financial year end and adjusted, if its impact on depreciation is significant. Depreciation of leased assets
is charged to profit and loss account. Depreciation on additions in leased assets is charged from the
month in which an asset is acquired while no depreciation is charged for the month in which the asset is
disposed off/transferred to freehold assets.
Capital work in progress
Capital work in progress is stated at cost less any identified impairment loss and includes the
expenditures on material, labour and appropriate overheads directly relating to the project. These costs
are transferred to fixed assets as and when assets are available for intended use.
4.6 Intangible assets and amortization
Intangible assets includes Intellectual Property, Rights, Trademarks and Software, which are non-
monetary assets without physical substance. These are recognized at cost, which comprises its purchase
price, non-refundable purchase taxes and any directly attributable expenditures.
After initial recognition an intangible asset is carried at its cost less accumulated amortization and any
identified impairment loss. Amortization is charged to the income on monthly basis by following the
straight line method over a period of ten years. Amortization on additions is charged from the month
when the asset is put to use, while for disposals, no amortization is charged in the month of disposal.
At each financial year end, the Company reviews the recoverable amounts of intangible assets to assess
impairment loss. If such indication exists, impairment losses are recognized as an expense.
Subsequent expenditures on intangible assets are recognized as an expense when it is incurred unless
the expenditure will enable the asset to generate future economic benefits in excess of its originally
assessed standard of performance.
4.7 Borrowing costs
Finance cost on long term liabilities / lease liabilities which are specifically obtained for the acquisition
of qualifying assets i.e. assets that take a substantial period of time to get ready for their intended use,
are capitalized up to the date of commissioning of respective asset. All other interest, mark-up and
expenses are charged to income in the period in which they are incurred.
4.8 Investments
Subsidiary Company
Investment in subsidiary company is measured at cost as per the requirements of IAS-27 "Consolidated
and Separate Financial Statements". However, at subsequent reporting dates, the Company reviews the
carrying amounts of the investment and its recoverability to determine whether there is an indication

44 Annual Report 2011 Highnoon Laboratories Limited
that such investments have suffered an impairment loss. If such indication exists the carrying amount of
the investment is adjusted to the extent of impairment loss. Impairment losses are recognized as an
expense currently.
Investments available for sale - Quoted securities
Investment intended to be held for an unidentified period of time which may be sold in response to need
for liquidity or changes to interest rates, exchange rates or equity prices are classified as available for
sale.
Investments classified as "available for sale" are initially measured at cost, being the fair value of
consideration given. At subsequent reporting dates, these investments are measured at fair value. The
investments for which quoted price is not available, are measured at cost as it is not possible to apply
any other valuation methodology.
Unrealized gains and losses arising from changes in fair value are recognized in other comprehensive
income and presented within equity as reserve. Cumulative gains and losses arising from changes in fair
value are included in the net profit and loss for the period in which an investment is derecognized or
determined to be impaired.
All "regular way" purchases and sales of shares are recognized on the trade date, i.e. the date that the
Company commits to purchase/sell the asset.
4.9 Stock in trade
These are valued at the lower of cost and net realizable value. Cost is determined using the following
basis :-
Raw materials - on moving averageWork-in-process - at estimated manufacturing cost including appropriate
overheadsFinished goods- Imported - on moving average- Local - on annual average manufacturing cost including appropriate
overheads
Merchandise in transit / pledged - at invoice value plus other charges incurred thereon
Net realizable value signifies the estimated selling price in the ordinary course of business less
estimated costs necessary to make the sale.
4.10 Trade debts
These are initially carried at original invoice amount, which is the fair value of consideration to be
received in future and subsequently measured at amortized cost less impairment loss, if any. A provision
for impairment of trade debts is established when there is an objective evidence that the Company will
not be able to collect all amounts due according to the original terms of receivable.
4.11 Cash and cash equivalents
These are carried in balance sheet at cost. For the purpose of cash flow statement, cash and cash
equivalents comprise of cash in hand and balance with banks in current accounts.
4.12 Impairment
The carrying amount of the assets except for inventories are reviewed at each balance sheet date to
identify the circumstances indicating the occurrence of impairment loss or reversal of previously
recognized impairment losses. If any such indication exists, the recoverable amount of such asset is
estimated.
Highnoon Laboratories Limited 45Annual Report 2011
An impairment loss is recognized if the carrying amount of an asset or its cash-generating unit exceeds
its recoverable amount. A cash-generating unit is the smallest identifiable asset group that generates
cash flows that largely are independent from other assets and groups.
Where an impairment loss subsequently reverses, the carrying amount of such asset is increased to the
extent that it does not exceed the carrying amount that would have been determined, net of depreciation
and amortization, if no impairment loss has been charged. A reversal of the impairment loss is
recognized in income.
4.13 Revenue recognition
Revenue from local sales is recognized when risk and reward incidental to ownership are transferred i.e.
on dispatch of goods to the customers. Export goods are considered dispatched when bill of lading is
prepared for shipment to customers.
Service income is recognized when related services are rendered.
Return on bank deposits is accounted for on time proportion basis and other income is recognized on
accrual basis.
4.14 Transactions with related parties and transfer pricing
The Company under the direction of Securities and Exchange Commission of Pakistan's Notification
SRO 66(I)/ 2003 dated 22 January 2003 adopted the following policies of transfer pricing for the
determination of arm's length prices with subsidiary company/associated companies/related parties
except for the assets sold to employees at written down value under the employee's car scheme as
approved by the Board of Directors.
- Subsidiary Company Resale price method- Associated companies / related parties Cost plus method
Parties are said to be related, if they are able to influence the operating and financial decisions of the
Company and vice versa.
4.15 Research and development cost
These costs are charged to revenue as and when incurred, except for any development costs which are
recognized as intangible assets when it is probable that the development project will be a success and
certain criteria, including commercial and technological feasibility have been met.
4.16 Taxation
Income tax on profit and loss for the year comprises current and deferred tax.
Current
The charge for current taxation is based on taxable income for the year determined in accordance with
Income Tax Ordinance, 2001 and prevailing tax rates after taking into account applicable tax credits and
rebates, if any. The charge for current tax also includes adjustments, where considered necessary, to
provision for tax made in previous years arising from assessments framed during the year for such
years.
Deferred
Deferred tax is recognized using the balance sheet liability method on all temporary differences between
the amounts attributed to assets and liabilities for financial reporting purposes and amounts used for
taxation purposes.
46 Annual Report 2011 Highnoon Laboratories Limited
Deferred tax liabilities are recognized for all taxable temporary differences and deferred tax assets are
recognized to the extent that it is probable that future taxable profits will be available against which the
deductible temporary differences, unused tax losses and tax credits can be utilized.
Carrying amount of deferred tax asset is reviewed at each balance sheet date and reduced to the extent
that it is no longer probable that the related tax benefit will be realized. Deferred tax is calculated at the
rates that are expected to apply to the period when differences reverse based on tax rates and tax laws
that have been enacted or substantively enacted by the balance sheet date.
Deferred tax is charged or credited in income except for deferred tax asset/liability arising on
deficit/surplus on revaluation of fixed assets which is adjusted against the related surplus as per the
requirements of revised IAS 12 "Income Taxes".
4.17 Dividend
Dividend to shareholders is recognized as a liability in the period in which it is approved.
4.18 Financial instruments
These comprise financial assets and financial liabilities. Significant financial assets include trade debts,
advances and deposits, other receivables and cash and bank balances. Significant financial liabilities
include borrowings, trade and other payables, liabilities in respect of leased assets and mark up payable
on bank borrowings.
Financial assets and financial liabilities are recognized when the Company becomes a party to the
contractual provisions of the instrument and assets and liabilities are stated at fair value. The Company
derecognizes the financial asset and liabilities when it ceases to be a party to such contractual provisions
of the instruments. Any gain or loss on derecognizing of the financial assets and financial liabilities is
taken to profit and loss account currently. The particular measurement methods adopted are disclosed in
the individual policy statement associated with each item.
Offsetting of financial assets and financial liabilities
Financial assets and liabilities are offset and the net amount is reported in the balance sheet if the
Company has legally enforceable right to offset the recognized amounts and the Company intends to
settle either on a net basis or realize the asset and settle the liability simultaneously.
4.19 Provisions
A provision is recognized when the Company has a present legal or constructive obligation as a result of
past event and it is probable that an outflow of resources embodying economic benefits will be required
to settle the obligation of which reliable estimate can be made.
Highnoon Laboratories Limited 47Annual Report 2011
Surplus on revaluation of fixed assets as at 01 January
Note
2011
Rupees
2010
Rupees
Incremental depreciation relating to surplus on revaluationof fixed assets - transferred to unappropriated profit
Net of deferred tax
Related deferred tax liability
Incremental depreciation relating to surplus on revaluationof fixed assets - transferred to unappropriated profit
Surplus on revaluation of fixed assets as at 31 December
Less: Related deferred tax liability on:
Balance at the beginning of the year
10.1
6. SURPLUS ON REVALUATION OF FIXED ASSETS
217,133,314
(5,322,209)
(2,865,805)
(8,188,014)
208,945,300
28,658,050
(2,865,805)
25,792,245
183,153,055
226,231,108
(5,913,566)
(3,184,228)
(9,097,794)
217,133,314
31,842,278
(3,184,228)
28,658,050
188,475,264
5.1 This represents the issuance of shares against the purchase of plant and machinery and other assets.
5.1
2011
RupeesNote
59,050,000
950,000
121,805,170
181,805,170
5. SHARE CAPITAL
Issued, subscribed and paid-up
5,905,000 Ordinary shares (2010: 5,905,000)of Rs.10 each fully paid in cash
95,000 (2010: 95,000) Ordinary sharesof Rs.10 each issued for considerationother than cash
12,180,517 (2010: 10,527,743) Ordianry shares of Rs.10 each issued as bonus shares
2010
Rupees
59,050,000
950,000
105,277,431
165,277,431
1,652,774
Outstanding at the beginningBonus shares issued during the year
Outstanding at the end
5.2 Reconciliation of issued, subscribed and paid-up capital
2011 2010
16,527,743
18,180,517
16,527,743
16,527,743
-
( Numbers of Shares)
6.1 This represent surplus arising on revaluation of freehold land and building on freehold land, plant and
machinery both owned and leased carried out in 1995, 1999, 2004 and 2007 respectively. This has been
adjusted by incremental depreciation arising due to revaluation net of deferred tax. The latest revaluation
of land was carried out on 19 January 2007 by M/S Surval which resulted in a surplus of Rs. 67,922,000.
48 Annual Report 2011 Highnoon Laboratories Limited
Note
2011
Rupees
2010
Rupees
Habib Bank LimitedFaysal Bank Limited
LONG TERM LOANS - SECURED7.
7.17.2
51,301,76348,645,000
80,617,05661,617,000
Less: Current portion shown under current liabilities 14 42,287,293
57,659,470
42,287,293
99,946,763
7.1 This loan has been obtained for the purpose of expansion and carries mark-up at the rate of three months
KIBOR plus 2.25% per annum. The effective mark-up charged during the year was 15.69% (2010:
14.73%) of the average outstanding loan facility. The amount outstanding as at 31 December 2011 is
repayable in 7 equal quarterly installments. This loan along with working capital facilities provided by
the bank are secured by way of first pari passu charge for Rs. 362 million on fixed assets and first joint
pari passu hypothecation charge of Rs. 230 million on stocks including but not limited to raw materials,
medicines, goods in process and finished goods of the Company.
7.2 The loan of Rs. 64.860 million has been obtained in 2009 for financing the acquisition of Blokium trade
mark and carries mark-up at the rate of three months KIBOR plus 2.75% per annum. The effective
mark-up charged during the year was 15.96% (2010: 15.73%) of the average outstanding loan amount.
The amount outstanding as at 31 December 2011 is repayable in 15 equal quarterly installments. This
loan along with working capital facilities provided by the bank are secured by way of first pari passu
charge of Rs. 69.25 million on the present and future current assets of the company and first pari passu
charge of Rs. 83.65 million on present and future fixed assets of the Company.
Not later than one yearLater than one year but not later than five years
1,551,3404,688,386
6,239,726
15,933,78727,903,144
43,836,931
17,485,12732,591,530
50,076,657
2010Financecost for
future periods
Principaloutstanding
Minimumlease
payments
Rupees
8. LIABILITIES AGAINST ASSETS SUBJECT TO FINANCE LEASE
Present value of minimum lease paymentsLess: Current portion shown under current liabilities
26,313,22415,016,952
11,296,272
2,761,9341,125,400
3,887,334
15,016,95211,296,272
26,313,224
17,778,88612,421,672
30,200,558
2011Financecost for
future periods
Principaloutstanding
Minimumlease
payments
Not later than one yearLater than one year but not later than five years
Rupees
14
43,836,93115,933,787
27,903,144
Note
2011
Rupees
2010
Rupees

Highnoon Laboratories Limited 49Annual Report 2011
Discounting factor
Period of lease
Security deposits
Salient features of the leases are as follows:
14.50% - 18.61%
36 months
5% - 10%
2011
14.50% - 16.50%
36 months
5% - 10%
2010
The Company has entered into finance lease arrangements with various financial institutions for lease of plant
and machinery, and vehicles as shown in note 16.1. Liabilities under these arrangements are payable in
monthly instalments. These mark-up rates are used as discounting factor to determine the present value of
minimum lease payments.
All lease agreements carry renewal option at the end of lease period and the Company intends to exercise its
option to purchase the leased assets upon completion of the respective lease terms. Residual value of the
leased assets has already been paid at the inception of the lease in the form of security deposit. There are no
financial restrictions imposed by lessors. Taxes, repairs, replacements and insurance costs are borne by the
lessee.
10.
Taxation
Gratuity
DEFERRED LIABILITIES
96,861,973
168,994,803
265,856,776
10.1
10.2
Taxable/(deductible) temporary differencesarising in respect of :
10.1
Surplus on revaluation of fixed assets
Accelerated tax depreciation
Finance lease
Provision for doubtful debts
Provision for gratuity
25,792,245
83,577,293
11,753,678
(4,758,622)
(19,502,622)
6
110,972,716
138,544,564
249,517,280
28,658,050
76,918,941
10,154,346
(4,758,621)
-
LONG TERM ADVANCES9.
These represent advances taken from employees against future sale of vehicles as per the Company's policy.
Balance at 31 December
Less: Current portion
38,380,435
23,438,157
14,942,278
14
2011
Rupees
2010
RupeesNote
2011
Rupees
2010
RupeesNote
18,634,165
8,045,177
10,588,988
96,861,972 110,972,716
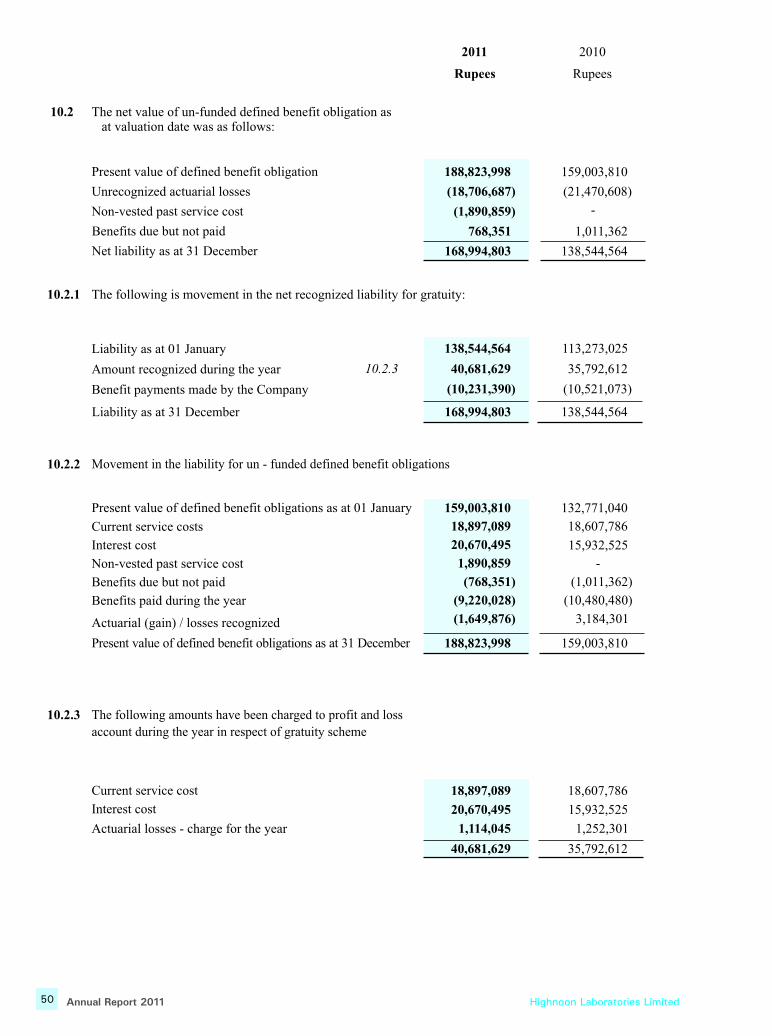
50 Annual Report 2011 Highnoon Laboratories Limited
The following amounts have been charged to profit and loss
account during the year in respect of gratuity scheme
10.2.3
Current service cost
Interest cost
Actuarial losses - charge for the year
Movement in the liability for un - funded defined benefit obligations10.2.2
Present value of defined benefit obligations as at 01 January
Current service costs
Interest cost
Non-vested past service cost
Benefits due but not paid
Benefits paid during the year
Actuarial (gain) / losses recognized
Present value of defined benefit obligations as at 31 December
18,897,089
20,670,495
1,114,045
40,681,629
20,670,495
1,890,859
(768,351)
(9,220,028)
(1,649,876)
188,823,998
18,607,786
15,932,525
1,252,301
35,792,612
18,897,089 18,607,786
159,003,810 132,771,040
15,932,525
-
(1,011,362)
(10,480,480)
3,184,301
159,003,810
10.2.1 The following is movement in the net recognized liability for gratuity:
Liability as at 01 January
Amount recognized during the year
Benefit payments made by the Company
Liability as at 31 December
The net value of un-funded defined benefit obligation as at valuation date was as follows:
10.2
Present value of defined benefit obligation
Unrecognized actuarial losses
Non-vested past service cost
Benefits due but not paid
Net liability as at 31 December
10.2.3
138,544,564
40,681,629
(10,231,390)
168,994,803
113,273,025
35,792,612
(10,521,073)
138,544,564
188,823,998
(18,706,687)
(1,890,859)
768,351
168,994,803
159,003,810
(21,470,608)
-
1,011,362
138,544,564
2011
Rupees
2010
Rupees
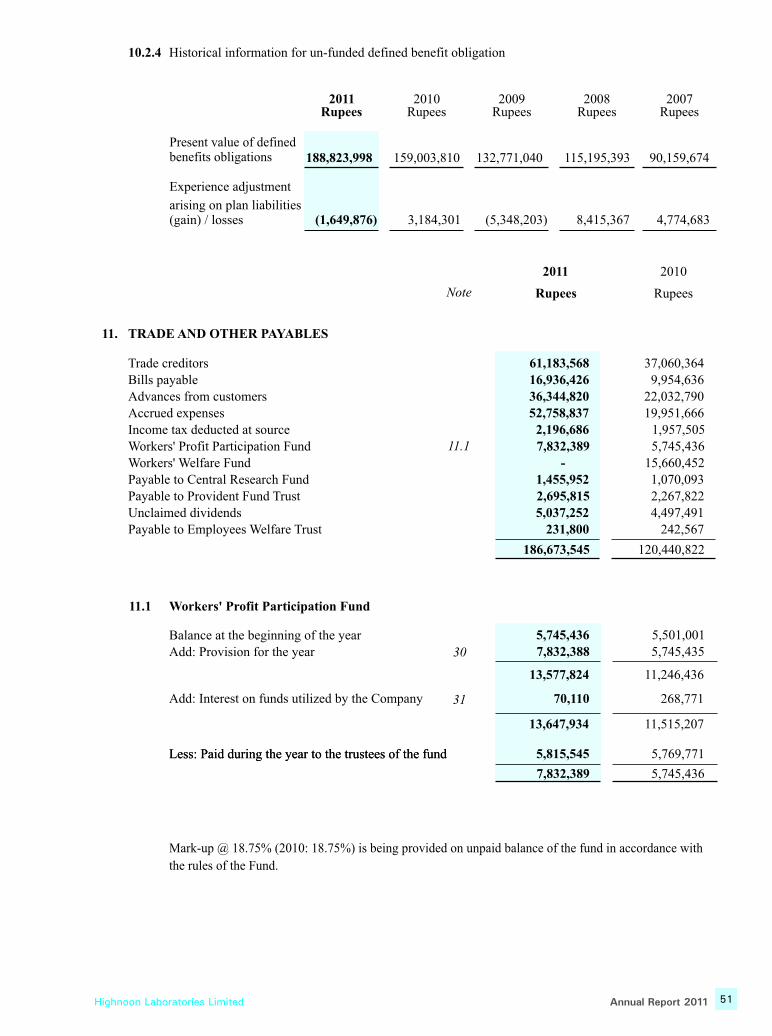
Highnoon Laboratories Limited 51Annual Report 2011
11.1 Workers' Profit Participation Fund
Balance at the beginning of the yearAdd: Provision for the year
5,745,4367,832,38830
5,501,0015,745,435
Add: Interest on funds utilized by the Company
13,577,824
70,110
13,647,934
5,815,545
31
11,246,436
268,771
11,515,207
5,769,771
Mark-up @ 18.75% (2010: 18.75%) is being provided on unpaid balance of the fund in accordance with
the rules of the Fund.
7,832,389 5,745,436
Less: Paid during the year to the trustees of the fundLess: Paid during the year to the trustees of the fund
2011
Rupees
2010
RupeesNote
11.1
Trade creditorsBills payableAdvances from customersAccrued expensesIncome tax deducted at sourceWorkers' Profit Participation FundWorkers' Welfare FundPayable to Central Research FundPayable to Provident Fund TrustUnclaimed dividends Payable to Employees Welfare Trust
11. TRADE AND OTHER PAYABLES
61,183,56816,936,42636,344,82052,758,837
2,196,6867,832,389
-1,455,9522,695,8155,037,252
231,800
186,673,545
37,060,3649,954,636
22,032,79019,951,666
1,957,5055,745,436
15,660,4521,070,0932,267,8224,497,491
242,567
120,440,822
Present value of defined benefits obligations
10.2.4
Experience adjustment
arising on plan liabilities(gain) / losses
Historical information for un-funded defined benefit obligation
2007Rupees
2008Rupees
2011Rupees
2010Rupees
90,159,674
4,774,683
115,195,393
8,415,367
188,823,998
(1,649,876)
159,003,810
3,184,301
132,771,040
(5,348,203)
2009Rupees
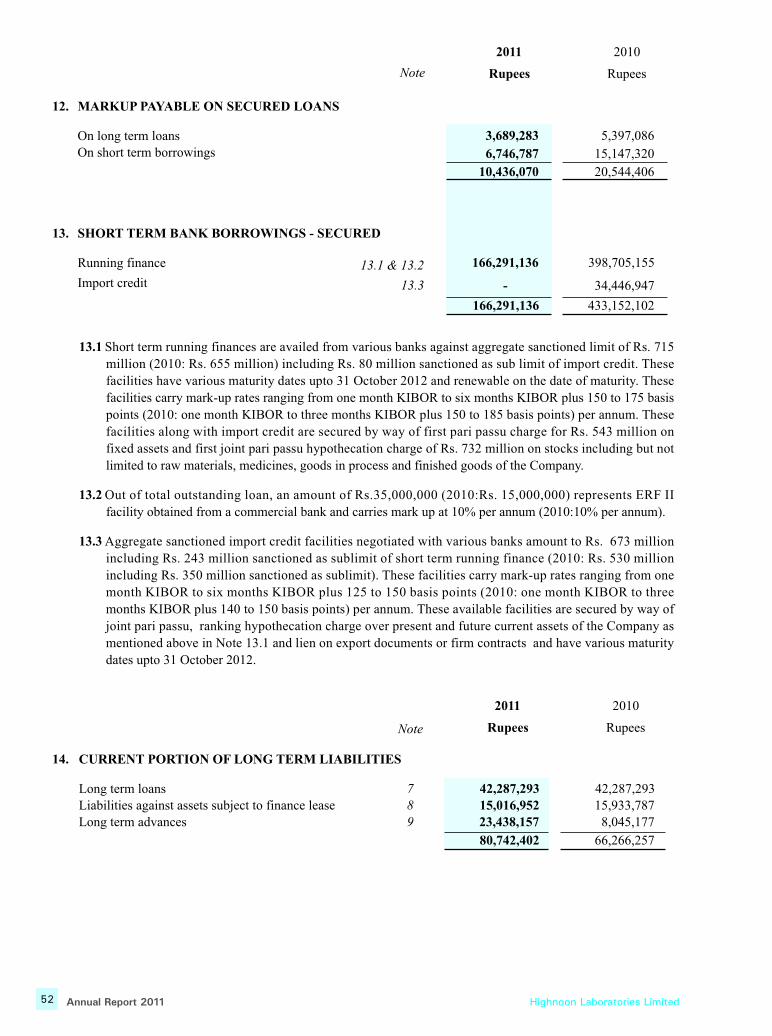
52 Annual Report 2011 Highnoon Laboratories Limited
12. MARKUP PAYABLE ON SECURED LOANS
13. SHORT TERM BANK BORROWINGS - SECURED
On long term loansOn short term borrowings
Running finance
Import credit
3,689,283
6,746,787
10,436,070
166,291,136
-
166,291,136
13.1 & 13.2
13.3
5,397,086
15,147,320
20,544,406
398,705,155
34,446,947
433,152,102
13.1 Short term running finances are availed from various banks against aggregate sanctioned limit of Rs. 715
million (2010: Rs. 655 million) including Rs. 80 million sanctioned as sub limit of import credit. These
facilities have various maturity dates upto 31 October 2012 and renewable on the date of maturity. These
facilities carry mark-up rates ranging from one month KIBOR to six months KIBOR plus 150 to 175 basis
points (2010: one month KIBOR to three months KIBOR plus 150 to 185 basis points) per annum. These
facilities along with import credit are secured by way of first pari passu charge for Rs. 543 million on
fixed assets and first joint pari passu hypothecation charge of Rs. 732 million on stocks including but not
limited to raw materials, medicines, goods in process and finished goods of the Company.
13.2 Out of total outstanding loan, an amount of Rs.35,000,000 (2010:Rs. 15,000,000) represents ERF II
facility obtained from a commercial bank and carries mark up at 10% per annum (2010:10% per annum).
13.3 Aggregate sanctioned import credit facilities negotiated with various banks amount to Rs. 673 million
including Rs. 243 million sanctioned as sublimit of short term running finance (2010: Rs. 530 million
including Rs. 350 million sanctioned as sublimit). These facilities carry mark-up rates ranging from one
month KIBOR to six months KIBOR plus 125 to 150 basis points (2010: one month KIBOR to three
months KIBOR plus 140 to 150 basis points) per annum. These available facilities are secured by way of
joint pari passu, ranking hypothecation charge over present and future current assets of the Company as
mentioned above in Note 13.1 and lien on export documents or firm contracts and have various maturity
dates upto 31 October 2012.
2011
Rupees
2010
RupeesNote
2010
Rupees
2011
RupeesNote
14. CURRENT PORTION OF LONG TERM LIABILITIES
Long term loansLiabilities against assets subject to finance leaseLong term advances
42,287,29315,016,95223,438,157
80,742,402
789
42,287,29315,933,7878,045,177
66,266,257
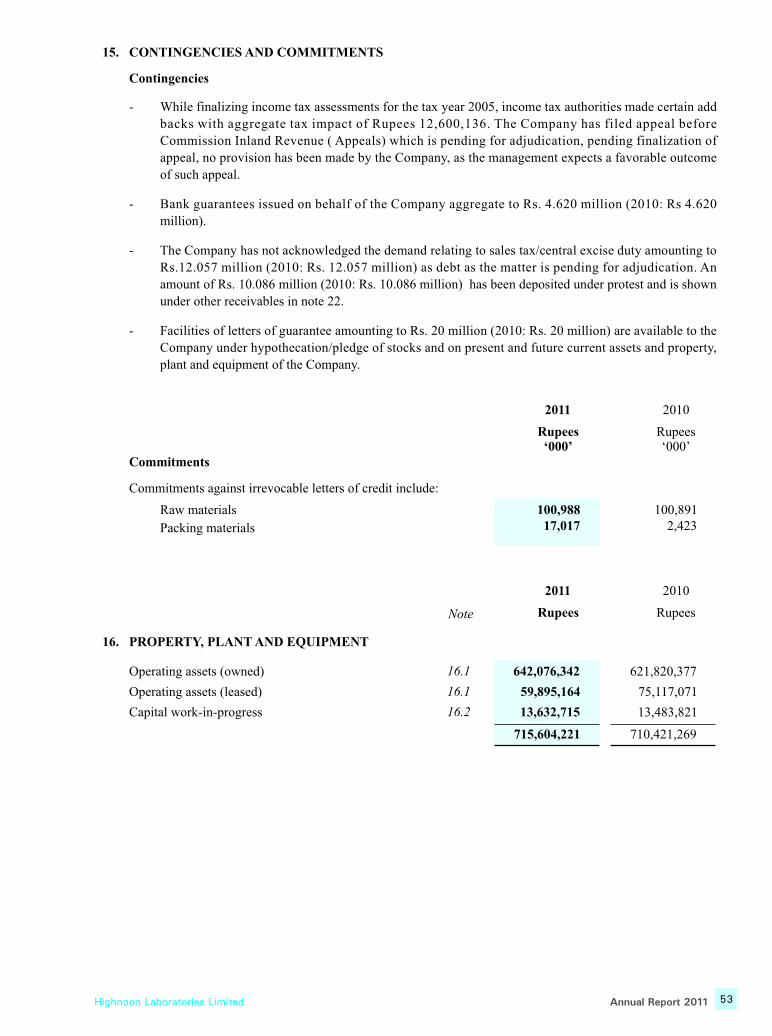
Highnoon Laboratories Limited 53Annual Report 2011
16. PROPERTY, PLANT AND EQUIPMENT
Operating assets (owned)
Operating assets (leased)
Capital work-in-progress
16.1
16.1
16.2
642,076,342
59,895,164
13,632,715
715,604,221
Commitments
Commitments against irrevocable letters of credit include:
Raw materials
Packing materials
- While finalizing income tax assessments for the tax year 2005, income tax authorities made certain add
backs with aggregate tax impact of Rupees 12,600,136. The Company has filed appeal before
Commission Inland Revenue ( Appeals) which is pending for adjudication, pending finalization of
appeal, no provision has been made by the Company, as the management expects a favorable outcome
of such appeal.
- Bank guarantees issued on behalf of the Company aggregate to Rs. 4.620 million (2010: Rs 4.620
million).
- The Company has not acknowledged the demand relating to sales tax/central excise duty amounting to
Rs.12.057 million (2010: Rs. 12.057 million) as debt as the matter is pending for adjudication. An
amount of Rs. 10.086 million (2010: Rs. 10.086 million) has been deposited under protest and is shown
under other receivables in note 22.
- Facilities of letters of guarantee amounting to Rs. 20 million (2010: Rs. 20 million) are available to the
Company under hypothecation/pledge of stocks and on present and future current assets and property,
plant and equipment of the Company.
15. CONTINGENCIES AND COMMITMENTS
Contingencies
17,017100,988
621,820,377
75,117,071
13,483,821
710,421,269
2,423100,891
20102011
Rupees‘000’
2010
Rupees
2011
RupeesNote
Rupees‘000’
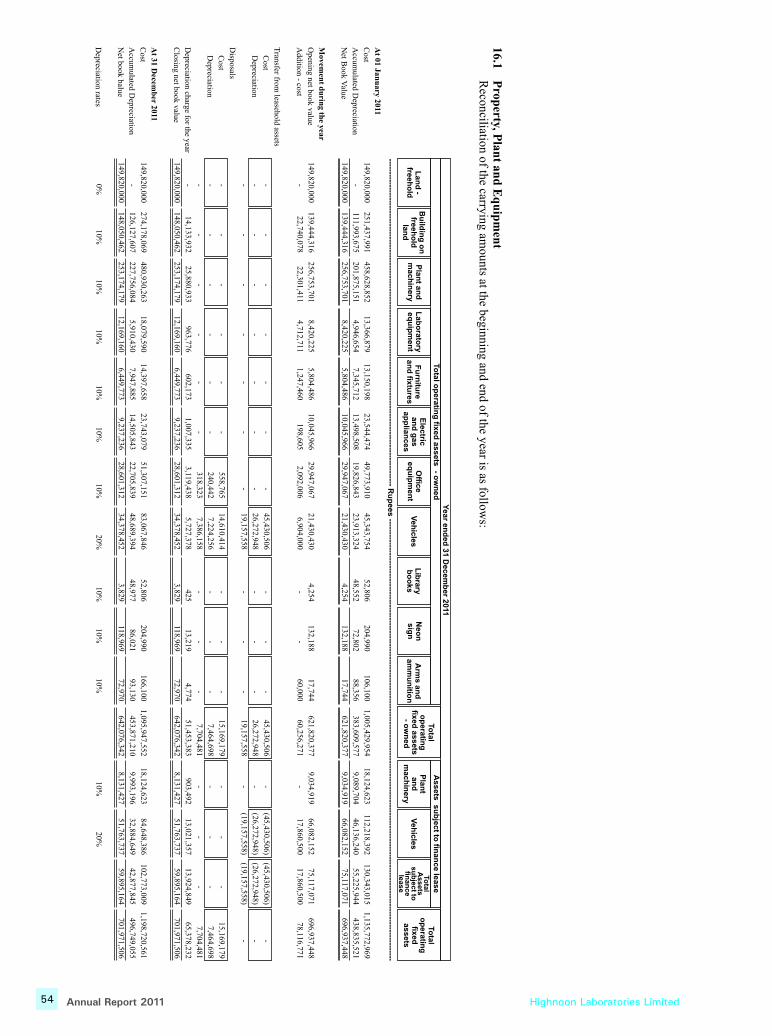
16.1
Pro
perty, P
lan
t an
d E
qu
ipm
ent
Recon
ciliation of th
e carrying am
oun
ts at the b
eginnin
g and end
of the year is as follows:
At 01 Jan
uary 2011
Cost
Accum
ulated Depreciation
Net B
ook Value
Movem
ent d
urin
g the year
Opening net book value
Addition - cost
Transfer from
leasehold assets
Cost
Depreciation
Dispo
sals
Cost
Depreciation
Depreciation charge for the year
Closing net book
value
At 31 D
ecemb
er 2011
Cost
Accum
ulated Depreciation
Net book balue
Depreciation rates
La
nd
- fre
eh
old
Bu
ildin
g o
nfre
eh
old
la
nd
Pla
nt a
nd
ma
ch
ine
ryL
ab
ora
tory
eq
uip
me
nt
Fu
rnitu
rea
nd
fixtu
res
Ele
ctric
a
nd
ga
sa
pp
lian
ce
s
Offic
e
eq
uip
me
nt
Ve
hic
les
Lib
rary
b
oo
ks
Ne
on
s
ign
Arm
s a
nd
am
mu
nitio
n
To
tal
op
era
ting
fixe
d a
ss
ets
- ow
ne
d
Pla
nt
an
dm
ac
hin
ery
Ve
hic
les
To
tal
As
se
ts
su
bje
ct to
fin
an
ce
le
as
e
To
tal
op
era
ting
fixe
d
as
se
ts
As
se
ts s
ub
jec
t to fin
an
ce
lea
se
To
tal o
pe
ratin
g fix
ed
as
se
ts - o
wn
ed
Ye
ar e
nd
ed
31
De
ce
mb
er 2
011
------------------------------------------------------------------------------------------------------------------------------ Ru
pe
es
--------------------------------------------------------------------------------------------------------------------------------------------------------------------------
149,820,000
-
149,820,000
149,820,000
--------
149,820,000
149,820,000
-
149,820,000
0%
251,437,991
111,993,675
139,444,316
139,444,316
22,740,078
------
14,133,932
148,050,462
274,178,069
126,127,607
148,050,462
10%
458,628,852
201,875,151
256,753,701
256,753,701
22,301,411
------
25,880,933
253,174,179
480,930,263
227,756,084
253,174,179
10%
13,366,879
4,946,654
8,420,225
8,420,225
4,712,711
------
963,776
12,169,160
18,079,590
5,910,430
12,169,160
10%
13,150,198
7,345,712
5,804,486
5,804,486
1,247,460
------
602,173
6,449,773
14,397,658
7,947,885
6,449,773
10%
23,544,474
13,498,508
10,045,966
10,045,966
198,605
------
1,007,335
9,237,236
23,743,079
14,505,843
9,237,236
10%
49,773,910
19,826,843
29,947,067
29,947,067
2,092,006
---
558,765
240,442
318,323
3,119,438
28,601,312
51,307,151
22,705,839
28,601,312
10%
45,343,754
23,913,324
21,430,430
21,430,430
6,904,000
45,430,506
26,272,948
19,157,558
14,610,414
7,224,256
7,386,158
5,727,378
34,378,452
83,067,846
48,689,394
34,378,452
20%
52,806
48,552
4,254
4,254
-------425
3,829
52,806
48,977
3,829
10%
204,990
72,802
132,188
132,188
-------
13,219
118,969
204,990
86,021
118,969
10%
106,100
88,356
17,744
17,744
60,000
------
4,774
72,970
166,100
93,130
72,970
10%
1,005,429,954
383,609,577
621,820,377
621,820,377
60,256,271
45,430,506
26,272,948
19,157,558
15,169,179
7,464,698
7,704,481
51,453,383
642,076,342
1,095,947,552
453,871,210
642,076,342
18,124,623
9,089,704
9,034,919
9,034,919
-------
903,492
8,131,427
18,124,623
9,993,196
8,131,427
10%
112,218,392
46,136,240
66,082,152
66,082,152
17,860,500
(45,430,506)
(26,272,948)
(19,157,558)
---
13,021,357
51,763,737
84,648,386
32,884,649
51,763,737
20%
130,343,015
55,225,944
75,117,071
75,117,071
17,860,500
(45,430,506)
(26,272,948)
(19,157,558)
---
13,924,849
59,895,164
102,773,009
42,877,845
59,895,164
1,135,772,969
438,835,521
696,937,448
696,937,448
78,116,771
---
15,169,179
7,464,698
7,704,481
65,378,232
701,971,506
1,198,720,561
496,749,055
701,971,506
54 Annual Report 2011 Highnoon Laboratories Limited

Highnoon Laboratories Limited 55Annual Report 2011
La
nd
-
fre
eh
old
Bu
ild
ing
on
fre
eh
old
la
nd
Pla
nt
an
dm
ac
hin
ery
La
bo
rato
rye
qu
ipm
en
tF
urn
itu
rea
nd
fix
ture
s
Ele
ctr
ic
an
d g
as
ap
plia
nc
es
Off
ice
e
qu
ipm
en
tV
eh
icle
sL
ibra
ry
bo
ok
sN
eo
n
sig
nA
rms
an
da
mm
un
itio
n
To
tal
op
era
tin
gfi
xe
d a
ss
ets
- o
wn
ed
Pla
nt
an
dm
ac
hin
ery
Ve
hic
les
To
tal
As
se
ts
su
bje
ct
to
fin
an
ce
le
as
e
To
tal
op
era
tin
gfi
xe
d
as
se
ts
As
se
ts s
ub
jec
t to
fin
an
ce
le
as
eTo
tal o
pe
rati
ng
fix
ed
as
se
ts -
ow
ne
dY
ea
r e
nd
ed
31
De
ce
mb
er
20
10
----
----
----
----
----
----
----
----
----
----
----
----
----
----
----
----
----
----
----
----
----
----
----
----
----
----
----
----
----
----
----
-- R
up
ee
s -
----
----
----
----
----
----
----
----
----
----
----
----
----
----
----
----
----
----
----
----
----
----
----
----
----
----
----
----
----
----
----
----
----
----
----
----
----
----
----
----
----
----
-
Tra
nsfe
r fr
om l
ease
hold
ass
ets
C
ost
D
epre
ciat
ion
- - -
- - -
9,83
7,00
0
3,25
2,96
7
6,58
4,03
3
- - -
- - -
- - -
- - -
21,8
00,2
60
10,1
72,0
21
11,6
28,2
39
- - -
- - -
- - -
31,
637,
260
13,
424,
988
18,
212,
272
(9,8
37,0
00)
(3,2
52,9
67)
(6,5
84,0
33)
(21,
800,
260)
(10,
172,
021)
(11,
628,
239)
(31,
637,
260)
(13,
424,
988)
(18,
212,
272)
- - -
Dis
posa
ls
C
ost
D
epre
ciat
ion
- - -
- - -
- - -
- - -
101,
585
5,88
3
403,
175
344,
056
553,
975
185,
568
22,1
91,0
96
11,6
14,5
65
- - -
- - -
- - -
23,
249,
831
12,1
50,0
72
- - -
- - -
- - -
23,2
49,8
31
12,1
50,0
72
95,7
0259
,119
368,
407
10,5
76,5
3111
,099
,759
11,0
99,7
59
At
01 J
anu
ary
2010
Cos
t
Acc
umul
ated
Dep
reci
atio
n
Net
Boo
k V
alue
Mov
emen
t d
uri
ng
the
year
Ope
nin
g ne
t bo
ok v
alue
Add
itio
n -
cost
Dep
reci
atio
n ch
arge
for
the
year
Clo
sing
net
boo
k va
lue
At
31 D
ecem
ber
201
0
Cos
t
Acc
umul
ated
Dep
reci
atio
n
Net
boo
k ba
lue
Dep
reci
atio
n ra
tes
149,
820,
000
-
149,
820,
000
149,
820,
000
- -
149,
820,
000
149,
820,
000
-
149,
820,
000
0%
224,
099,
955
99,
227,
024
124,
872,
931
124,
872,
931
27,
338,
036
12,
766,
651
139,
444,
316
251,
437,
991
111,
993,
675
139,
444,
316
10%
402,
725,
034
174,
731,
620
227,
993,
414
227,
993,
414
46,0
66,8
18
23,8
90,5
64
256
,753
,701
458,
628,
852
201,
875,
151
256,
753,
701
10%
12,1
66,8
79
4,02
2,18
5
8,14
4,69
4
8,14
4,69
4
1,20
0,00
0
924,
469
8,42
0,22
5
13,3
66,8
79
4,94
6,65
4
8,42
0,22
5
10%
13,1
26,2
83
6,71
1,09
9
6,41
5,18
4
6,41
5,18
4
125,
500
640,
496
5,80
4,48
6
13,1
50,1
98
7,34
5,71
2
5,80
4,48
6
10%
23,7
75,4
01
12,7
31,1
67
11,0
44,2
34
11,0
44,2
34
172,
248
1,11
1,39
7
10,0
45,9
66
23,5
44,4
74
13,4
98,5
08
10,0
45,9
66
10%
48,6
43,6
25
16,7
45,8
68
31,8
97,7
57
31,8
97,7
57
1,68
4,26
0
3,26
6,54
3
29,9
47,0
67
49,7
73,9
10
19,8
26,8
43
29,9
47,0
67
10%
41,8
92,7
90
19,9
68,1
73
21,9
24,6
17
21,9
24,6
17
3,84
1,800
5,38
7,695
21,4
30,4
30
45,3
43,7
54
23,9
13,3
24
21,4
30,4
30
20%
52,8
06
48,0
79
4,72
7
4,72
7
- 473
4,25
4
52,8
06
48,5
52
4,25
4
10%
204,
990
58,1
14
146,
876
146,
876
-
14,6
88
132,
188
204,
990
72,8
02
132,
188
10%
106,
100
86,3
86
19,7
14
19,7
14 -
1,97
0
17,7
44
106,
100
88,3
56
17,7
44
10%
916,
613,
863
334,
329,
715
582,
284,
148
582,
284,
148
80,
428,
662
48,
004,
946
621,
820,
377
1,00
5,42
9,95
4
383,
609,
577
621,
820,
377
27,9
61,6
23
11,1
69,9
70
16,7
91,6
53
16,7
91,6
53
-
1,17
2,7
01
9,03
4,91
9
18,1
24,6
23
9,08
9,7
04
9,03
4,9
19
10%
118,
624,
652
41,7
18,9
44
76,9
05,7
08
76,9
05,7
08
15,3
94,0
00
14,5
89,3
17
66,0
82,1
52
112,
218,
392
46,1
36,2
40
66,0
82,1
52
20%
146,
586,2
75
52,8
88,9
14
93,6
97,3
61
93,6
97,3
61
15,3
94,0
00
15,7
62,0
18
75,1
17,0
71
130,
343,
015
55,2
25,9
44
75,1
17,0
71
1,06
3,200
,138
387,
218
,629
675,
981
,509
675,
981
,509
95,8
22,6
62
63,7
66,9
64
696,
937
,448
1,13
5,772
,969
438,
835
,521
696,
937
,448

56 Annual Report 2011 Highnoon Laboratories Limited
Depreciation charge has been allocated as under:
Cost of sales
Administrative and general expenses
Distribution, selling and promotional expenses
16.1.1
16.1.2 Land, building on freehold land and plant and machinery were first revalued on 30 June 1995,
resulting in a surplus of Rs. 68,809,377. Subsequently land, building on freehold land and plant and
machinery were revalued on 30 June 1999 resulting in a surplus of Rs. 48,731,393. Land, building
on freehold land and plant and machinery were again revalued on 31 May 2004 and 31 December
2004 respectively by M/s Hamid Mukhtar & Co., which resulted in a surplus of Rs. 168,473,204
over the net book value of assets. The latest revaluation of land was carried out on 19 January 2007
by M/S Surval which resulted in a surplus of Rs. 67,922,000.
2011
Rupees
2010
Rupees
25
27
28
Note
Had the assets not been revalued the carrying valueswould have been:
16.1.3
Land - Freehold
Building on freehold land
Plant and machinery (Owned)
Plant and machinery (Leased)
43,569,519
9,749,342
12,059,371
65,378,232
14,566,828
119,899,858
210,347,030
5,417,053
350,230,769
2011
Rupees
2010
Rupees
40,552,316
10,388,046
12,826,602
63,766,964
14,566,828
108,165,868
209,167,979
6,018,948
337,919,623

Highnoon Laboratories Limited 57Annual Report 2011
16.1.4 Disposal of property, plant and equipment
Particulars Sold to CostAccumulated Depreciation
Written Down Value
Sale Proceeds
Gain / (Loss) Mode of Sale
RupeesVehiclesWaseem Akhtar
Muhammad Iqbal
Mushtaq Muhammad
Ahmed Bilal Khan
Syed Salman Akhtar
Imran Ali
Humayun Rashid
Zafar Iqbal
Irfan Ahmed Dyer
Javed Iqbal
Wajhat Hussain
Rana Rizwan Ahmed
Muhammad Shahid Hussain
Nasir Ali
Waqas Akhtar
Irfan Junaid
Muhammad Asif
Waqar Khan
Mohsin Hasan
Sajid Ahmad
Hafiz Ateeq Ur Rehman
Muhammad Jamil
Shakir Ali
Farhan Saeed
Muhammad Ashraf
Shahzad Shaukat
Farhan Saeed
Reliance Insurance Co. Ltd
Asim Hasan
Javaid Akhtar
Asham Abid
M. Shafique Awan
Anwaw Ul Haq
Azfar Shams
Adnan Ahmed
Reliance Insurance Co. Ltd
Qasim Janju
Muhammad Tahir
Tanvir Khan
M. Salman
Patras Bashir
Imran Saeed
Sheraz Ali Akhund
Daood Ahmed
Shahzad Khaliq
Dr. Asad Ali
Reliance Inusrance Co. Ltd
Dr. Azfar Abbas Haidrie
Arif Hussain Khan Sherwani
Zeeshan Akbar
Shakil Ahmad Khan Lodhi
Muhammad Ilyas
Ghulam Haider
Javed Hussain
Syed Riffat Irfan Ahmed
Dr. Adeel Abbas
Irfan Tayyab Dar
Arif Khurshid
682,000
211,663
211,372
229,854
204,698
453,845
578,867
189,151
204,698
221,357
54,890
52,890
52,890
50,890
62,900
62,900
62,900
62,900
50,490
50,490
50,890
50,490
50,490
50,490
62,900
62,900
50,490
62,900
62,900
62,900
62,900
62,900
204,698
229,854
62,900
62,900
188,178
62,900
62,900
50,490
54,890
62,900
395,000
434,509
500,000
403,000
611,000
568,000
365,000
568,000
365,000
365,000
395,000
1,370,500
365,000
969,000
884,000
565,000
14,610,414
302,869
21,166
14,091
15,324
23,881
366,598
307,185
33,207
38,949
75,261
25,908
25,509
25,509
24,590
19,080
18,451
24,545
24,545
25,070
25,501
25,558
25,932
27,583
26,363
19,080
16,773
27,612
25,328
15,096
23,175
19,080
19,289
41,963
40,352
23,315
20,967
66,908
16,599
23,175
26,793
25,908
25,859
229,276
192,961
113,333
233,461
194,434
383,429
246,643
386,505
250,588
250,588
246,691
853,584
254,533
610,685
373,244
384,354
7,224,256
379,131
190,497
197,281
214,530
180,817
87,247
271,682
155,944
165,749
146,096
28,982
27,381
27,381
26,300
43,820
44,449
38,355
38,355
25,420
24,989
25,332
24,558
22,907
24,127
43,820
46,127
22,878
37,572
47,804
39,725
43,820
43,611
162,735
189,502
39,585
41,933
121,270
46,301
39,725
23,697
28,982
37,041
165,724
241,548
386,667
169,539
416,566
184,571
118,357
181,495
114,412
114,412
148,309
516,916
110,467
358,315
510,756
180,646
7,386,158
530,566
313,317
312,947
420,464
445,531
915,000
950,000
370,000
292,976
400,000
54,890
52,890
52,890
50,890
62,900
62,900
62,900
62,900
50,490
50,490
50,890
45,540
41,796
40,572
62,900
62,900
40,644
55,000
62,900
62,900
62,900
26,176
289,709
406,157
62,900
60,000
269,340
62,900
62,900
50,490
54,890
62,900
292,300
367,428
446,444
320,820
525,000
409,380
254,531
500,000
248,700
248,700
285,277
516,916
248,700
358,315
276,976
378,540
13,190,272
151,435
122,820
115,666
205,934
264,714
827,753
678,318
214,056
127,227
253,904
25,908
25,509
25,509
24,590
19,080
18,451
24,545
24,545
25,070
25,501
25,558
20,982
18,889
16,445
19,080
16,773
17,766
17,428
15,096
23,175
19,080
(17,435)
126,974
216,655
23,315
18,067
148,070
16,599
23,175
26,793
25,908
25,859
126,576
125,880
59,777
151,281
108,434
224,809
136,174
318,505
134,288
134,288
136,968
-
138,233
-
(233,780)
197,894
5,804,114
Company Policy
Company Policy
Company Policy
Company Policy
Company Policy
Negotiation
Negotiation
Negotiation
Company Policy
Company Policy
Company Policy
Company Policy
Company Policy
Company Policy
Company Policy
Company Policy
Company Policy
Company Policy
Company Policy
Company Policy
Company Policy
Company Policy
Company Policy
Company Policy
Company Policy
Company Policy
Company Policy
Insurance Claim
Company Policy
Company Policy
Company Policy
Company Policy
Company Policy
Company Policy
Company Policy
Insurance Claim
Company Policy
Company Policy
Company Policy
Company Policy
Company Policy
Company Policy
Company Policy
Company Policy
Company Policy
Company Policy
Insurance Claim
Company Policy
Company Policy
Negotiation
Company Policy
Company Policy
Company Policy
Company Policy
Company Policy
Company Policy
Company Policy
Company Policy
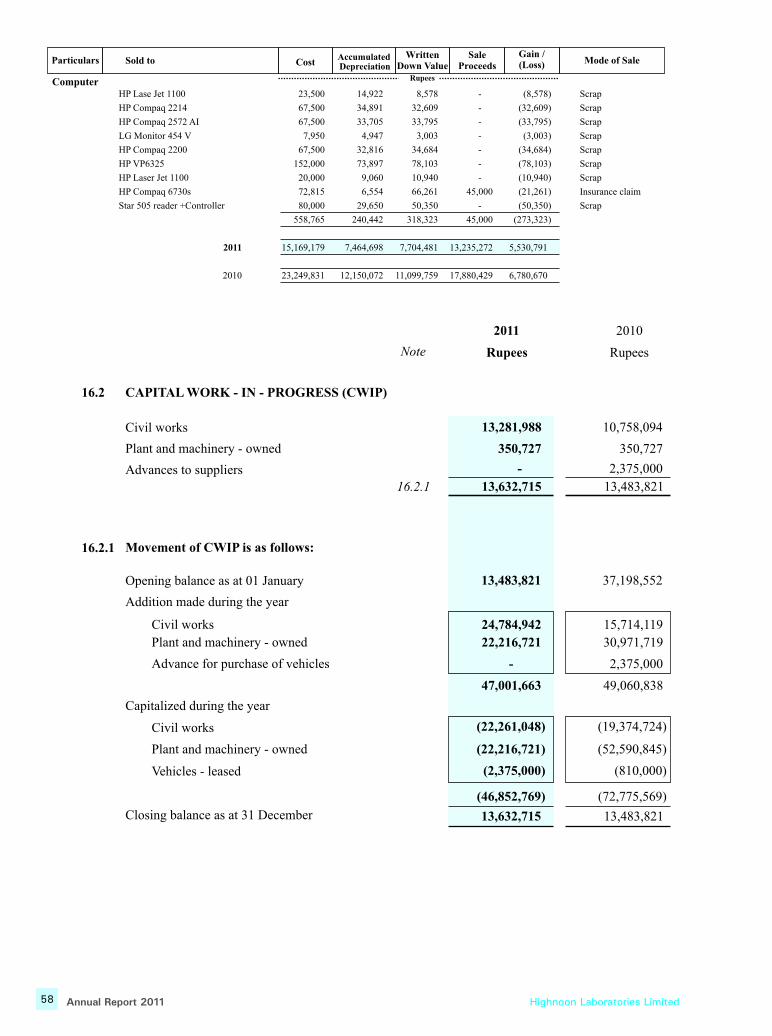
58 Annual Report 2011 Highnoon Laboratories Limited
Particulars Sold to CostAccumulated Depreciation
Written Down Value
Sale Proceeds
Gain / (Loss) Mode of Sale
RupeesComputerHP Lase Jet 1100
HP Compaq 2214
HP Compaq 2572 AI
LG Monitor 454 V
HP Compaq 2200
HP VP6325
HP Laser Jet 1100
HP Compaq 6730s
Star 505 reader +Controller
Scrap
Scrap
Scrap
Scrap
Scrap
Scrap
Scrap
Insurance claim
Scrap
23,500
67,500
67,500
7,950
67,500
152,000
20,000
72,815
80,000
558,765
15,169,179
23,249,831
14,922
34,891
33,705
4,947
32,816
73,897
9,060
6,554
29,650
240,442
7,464,698
12,150,072
8,578
32,609
33,795
3,003
34,684
78,103
10,940
66,261
50,350
318,323
7,704,481
11,099,759
-
-
-
-
-
-
-
45,000
-
45,000
13,235,272
17,880,429
(8,578)
(32,609)
(33,795)
(3,003)
(34,684)
(78,103)
(10,940)
(21,261)
(50,350)
(273,323)
5,530,791
6,780,670
2011
2010
16.2 CAPITAL WORK - IN - PROGRESS (CWIP)
Plant and machinery - owned
Civil works
Advances to suppliers
16.2.1 Movement of CWIP is as follows:
Civil works
Plant and machinery - owned
Advance for purchase of vehicles
Opening balance as at 01 January
Addition made during the year
16.2.1
Note
2011
Rupees
2010
Rupees
13,281,988
350,727
13,632,715
13,483,821
24,784,942
22,216,721
-
-
10,758,094
350,727
13,483,821
37,198,552
15,714,119
30,971,719
2,375,000
2,375,000
Capitalized during the year
Vehicles - leased
Civil works
Plant and machinery - owned
47,001,663
(2,375,000)
(22,261,048)
(22,216,721)
49,060,838
(810,000)
Closing balance as at 31 December
(46,852,769)
13,632,715
(72,775,569)
13,483,821
(19,374,724)
(52,590,845)
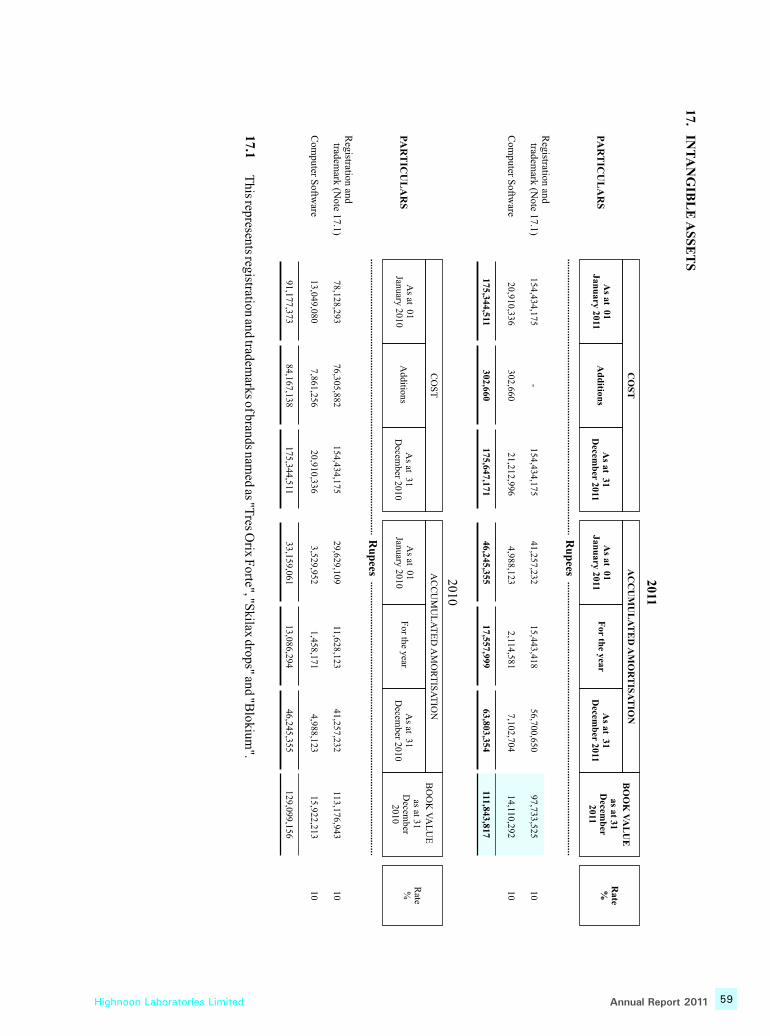
Highnoon Laboratories Limited 59Annual Report 2011
113,176,943
15,922,213
129,0
99,15
6
41,2
57,232
4,9
88,123
46,245
,355
11,628,1
23
1,458,17
1
13,08
6,2
94
29,629
,109
3,5
29,952
33,159
,061
154,434
,175
20,91
0,3
36
175,3
44,511
76,305
,882
7,861,256
84,167,138
17.1T
his represents registration and trademarks of brands nam
ed as "Tres O
rix Forte", "S
kilax drops" and "Blokium
".
17.IN
TA
NG
IBL
E A
SS
ET
S
Registration
and
tradem
ark (Note 17
.1)
Com
puter S
oftware
1010
97,733,525
14,110
,292
111,843,8
17
Registration
and
tradem
ark (Note 17
.1)
Com
puter S
oftware
1010
PA
RT
ICU
LA
RS
PA
RT
ICU
LA
RS
For th
e year
AC
CU
MU
LA
TE
D A
MO
RT
ISA
TIO
NB
OO
K V
AL
UE
as at 31
Decem
ber
2011
CO
ST
As a
t 31D
ecemb
er 2011
Ad
dition
s
Rate %
Ru
pees
As at 0
1Jan
uary 20
11A
s at 31
Decem
ber 2011
As at 01
Janu
ary 2011
154,434,175
20,9
10,336
175,344,511
302,660
302,6
60
-15
4,4
34,175
21,212,9
96
175,647,17
1
56,700,650
7,102,7
04
63,803,3
54
15,4
43,41
8
2,11
4,581
17,557,999
41,25
7,2
32
4,988,1
23
46,245,3
55
For the year
AC
CU
MU
LA
TE
D A
MO
RT
ISA
TIO
NB
OO
K V
AL
UE
as at 31
Decem
ber 2010
CO
ST
As at 31
Decem
ber 2010
Additions
Rate %
Ru
pees
As at 0
1January 201
0A
s at 31
Decem
ber 2010A
s at 01Jan
uary 2
010
78,128,293
13,049,0
80
91,1
77,373
2011
2010

60 Annual Report 2011 Highnoon Laboratories Limited
2011
Rupees
2010
Rupees
Amortization charge has been allocated as under:
Cost of sales
Distribution, selling and promotional expenses
17.2
15,443,418
2,114,581
17,557,999
25
27
Note
18.1 The Company had terminated its "Distribution Agreement" of finished goods with Dynalog Services
(Private) Limited in year 2008 and the management of the subsidiary had then decided to discontinue
its operations. Furthermore, as the subsidiary financial statements are drawn up on the basis that
going concern assumption is no longer valid, therefore, an impairment loss of Rs. 20 million was
directly recognized in the financial statements for years 2008 and 2009, thereby reducing the carrying
amount of investment to Nil ( 2010 Nil).
18. LONG TERM INVESTMENT
Related party - at cost
Dynalog Services (Private) Limited
2,000,000 (2010: 2,000,000) ordinary shares
of Rs. 10 each
Equity held: 100% (2010: 100%)
20,000,000
(20,000,000)Less: Impairment in investment
-
18.1
11,628,123
1,458,171
13,086,294
20,000,000
(20,000,000)
-
2011
Rupees
2010
Rupees19. STOCK IN TRADE
Raw materials
In hand
In transit
218,192,744
39,165,327
268,517,105
61,441,556
Packing material257,358,071
In hand 68,481,126
In transit
With third party
-
54,046
329,958,661
67,795,955
571,642
2,204,874
Work in process
Finished goods in hand
68,535,172
39,820,419
152,766,762
70,572,471
59,384,189
180,929,312
518,480,424 640,844,633
Subsidiary Company -Unlisted
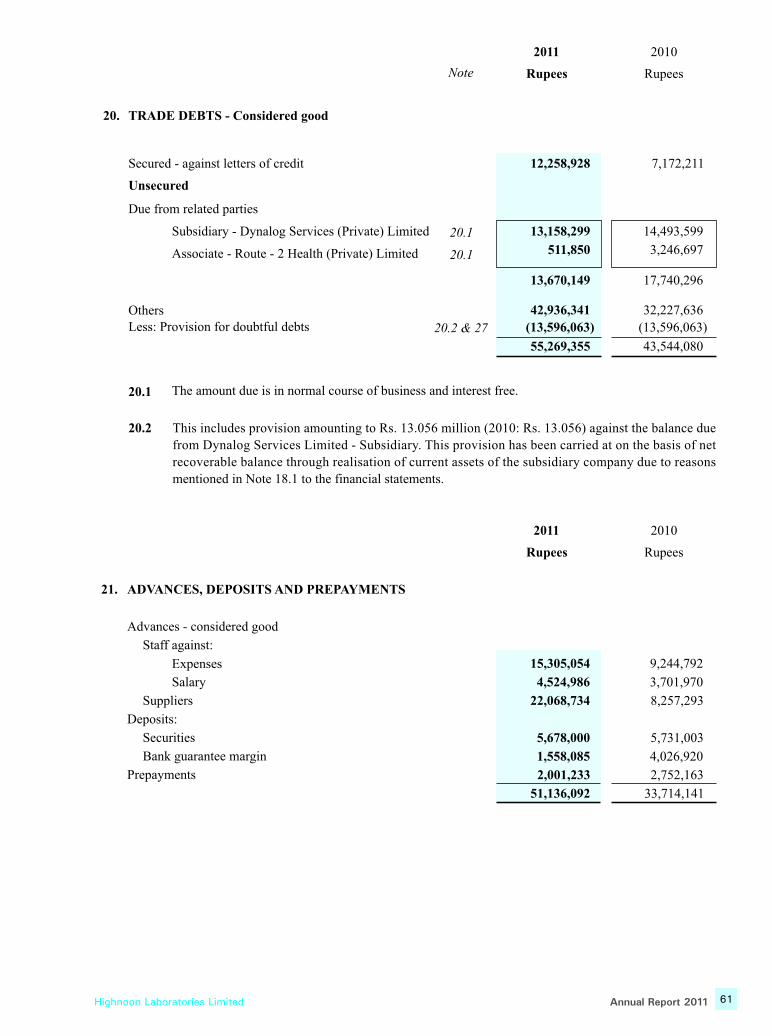
Highnoon Laboratories Limited 61Annual Report 2011
20. TRADE DEBTS - Considered good
Unsecured
Secured - against letters of credit
Due from related parties
Subsidiary - Dynalog Services (Private) Limited
Associate - Route - 2 Health ( ) LimitedPrivate 20.1
20.1
12,258,928
13,158,299
511,850
2011
Rupees
2010
RupeesNote
7,172,211
14,493,599
3,246,697
21. ADVANCES, DEPOSITS AND PREPAYMENTS
Advances - considered good
Staff against:
Suppliers
Expenses
Salary
15,305,054
4,524,986
22,068,734
Deposits:
Securities
Bank guarantee margin
Prepayments
5,678,000
1,558,085
2,001,233
51,136,092
9,244,792
3,701,970
8,257,293
5,731,003
4,026,920
2,752,163
33,714,141
20.1 The amount due is in normal course of business and interest free.
OthersLess: Provision for doubtful debts 20.2 & 27
13,670,149
42,936,341
55,269,355
(13,596,063)
2011
Rupees
2010
Rupees
17,740,296
32,227,636
43,544,080
(13,596,063)
20.2 This includes provision amounting to Rs. 13.056 million (2010: Rs. 13.056) against the balance due
from Dynalog Services Limited - Subsidiary. This provision has been carried at on the basis of net
recoverable balance through realisation of current assets of the subsidiary company due to reasons
mentioned in Note 18.1 to the financial statements.
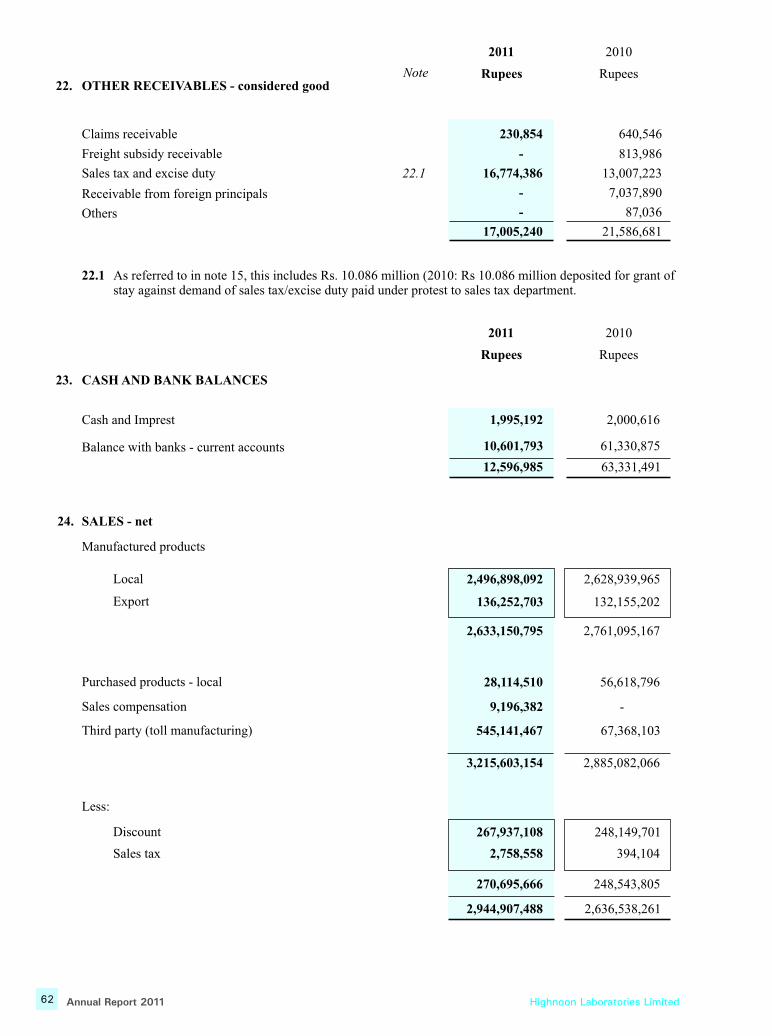
62 Annual Report 2011 Highnoon Laboratories Limited
2011
Rupees
2010
Rupees
23. CASH AND BANK BALANCES
Cash and Imprest
Balance with banks - current accounts
1,995,192
10,601,793
12,596,985
24. SALES - net
Manufactured products
Local
Export
2,496,898,092
136,252,703
Purchased products - local
Sales compensation
Third party (toll manufacturing)
Discount
Less:
Sales tax
2,633,150,795
28,114,510
9,196,382
545,141,467
3,215,603,154
267,937,108
2,758,558
270,695,666
2,944,907,488
22. OTHER RECEIVABLES - considered good
Claims receivable
Freight subsidy receivable
Sales tax and excise duty
Receivable from foreign principals
Others
22.1
230,854
-
16,774,386
-
-
17,005,240
22.1
As referred to in note 15, this includes Rs. 10.086 million (2010: Rs 10.086 million deposited for grant ofstay against demand of sales tax/excise duty paid under protest to sales tax department.
2,000,616
61,330,875
63,331,491
2,628,939,965
132,155,202
2,761,095,167
56,618,796
-
67,368,103
2,885,082,066
248,149,701
394,104
248,543,805
2,636,538,261
640,546
813,986
13,007,223
7,037,890
87,036
21,586,681
2011
Rupees
2010
RupeesNote

Highnoon Laboratories Limited 63Annual Report 2011
Note
2011
Rupees
2010
Rupees
25. COST OF SALES
Raw and packing material consumed
25.1
16.1.1
17.2
Raw and packing material consumed
Salaries, wages and benefits
Vehicle running and maintenance
Fuel and power
Stores consumed
Repair and maintenance
Insurance
Rent, rates and taxes
Fee and subscription
Printing and stationery
Traveling and conveyance
Consultancy and professional charges
Office supplies
Depreciation
Amortization of intangible assets
Others direct cost
Inventory effect of work in process
Opening
Closing
1,664,236,175
147,996,669
14,502,334
42,386,309
6,844,797
23,696,364
3,088,925
2,870,912
319,273
3,687,056
798,402
1,854,039
7,319,916
43,569,519
15,443,418
4,677,623
1,983,291,731
59,384,189
(39,820,419)
1,402,432,824
124,393,802
13,264,129
34,257,448
7,581,726
18,273,150
2,812,661
1,830,443
476,408
2,589,238
2,440,827
4,999,986
6,621,520
40,552,316
11,628,123
3,559,186
1,677,713,787
49,560,198
(59,384,189)
Inventory effect of finished goods(excluding purchased products)
Opening
Closing
Cost of goods manufactured
19,563,770
2,002,855,501
160,115,818
(150,723,607)
(9,823,991)
1,667,889,796
186,894,949
(160,115,818)
Cost of goods sold - Purchased products
Cost of goods sold
Cost of goods sold - Manufactured products
25.1 It includes the following staff retirement benefits:
Defined benefit plan - Gratuity
Defined contribution plan - Provident Fund
Provision for compensated leave absences
9,392,211
2,012,247,712
18,488,730
2,030,736,442
16,864,790
4,128,435
800,519
21,793,744
26,779,131
1,694,668,927
38,314,088
1,732,983,015
11,552,368
3,762,902
2,574,090
17,889,300
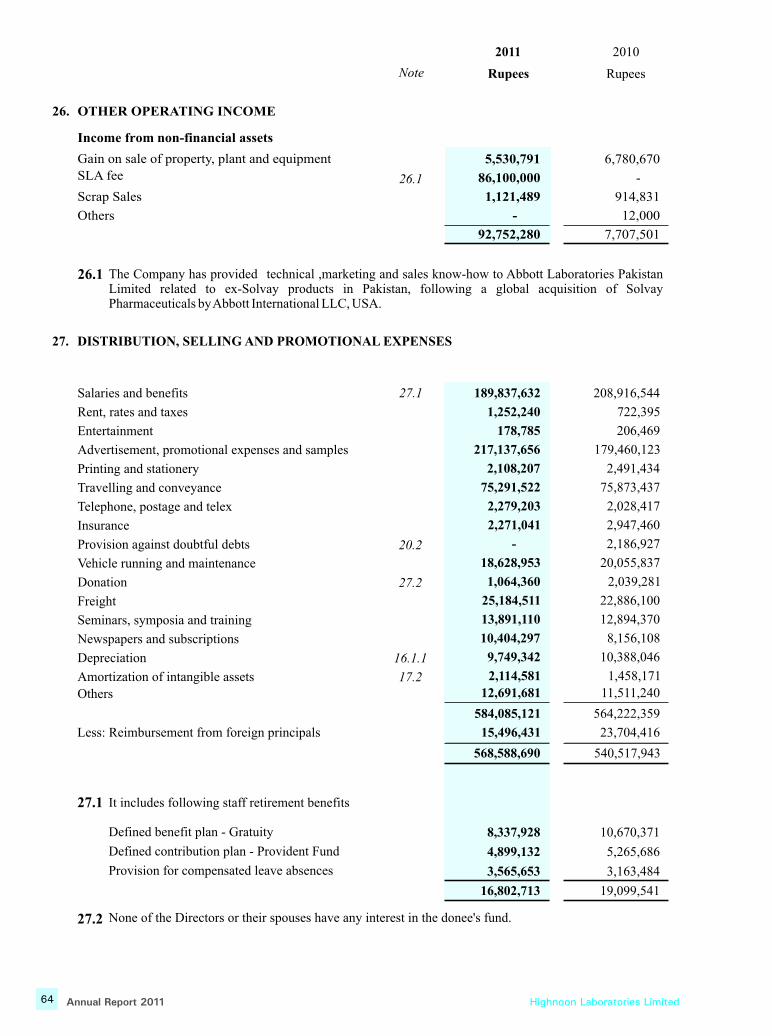
64 Annual Report 2011 Highnoon Laboratories Limited
2011
Rupees
2010
RupeesNote
26. OTHER OPERATING INCOME
Income from non-financial assets
Gain on sale of property, plant and equipment
SLA fee
Scrap Sales
Others
5,530,791
86,100,000
1,121,489
-
92,752,280
6,780,670
-
914,831
12,000
7,707,501
Less: Reimbursement from foreign principals
20.2
27.2
16.1.1
17.2
Rent, rates and taxes
Entertainment
Advertisement, promotional expenses and samples
Printing and stationery
Travelling and conveyance
Telephone, postage and telex
Insurance
Provision against doubtful debts
Vehicle running and maintenance
Donation
Freight
Seminars, symposia and training
Newspapers and subscriptions
Depreciation
Others
Amortization of intangible assets
27. DISTRIBUTION, SELLING AND PROMOTIONAL EXPENSES
27.1Salaries and benefits
-
722,395
206,469
179,460,123
2,491,434
75,873,437
2,028,417
2,947,460
2,186,927
20,055,837
2,039,281
22,886,100
12,894,370
8,156,108
10,388,046
11,511,240
1,458,171
564,222,359
23,704,416
540,517,943
208,916,544
12,691,681
584,085,121
15,496,431
568,588,690
178,785
217,137,656
2,108,207
75,291,522
2,279,203
2,271,041
18,628,953
1,064,360
25,184,511
13,891,110
10,404,297
9,749,342
2,114,581
1,252,240
189,837,632
27.1 It includes following staff retirement benefits
Defined benefit plan - Gratuity
Defined contribution plan - Provident Fund
Provision for compensated leave absences
27.2 None of the Directors or their spouses have any interest in the donee's fund.
8,337,928
4,899,132
3,565,653
16,802,713
10,670,371
5,265,686
3,163,484
19,099,541
26.1 The Company has provided technical ,marketing and sales know-how to Abbott Laboratories Pakistan Limited related to ex-Solvay products in Pakistan, following a global acquisition of Solvay Pharmaceuticals by Abbott International LLC, USA.
26.1
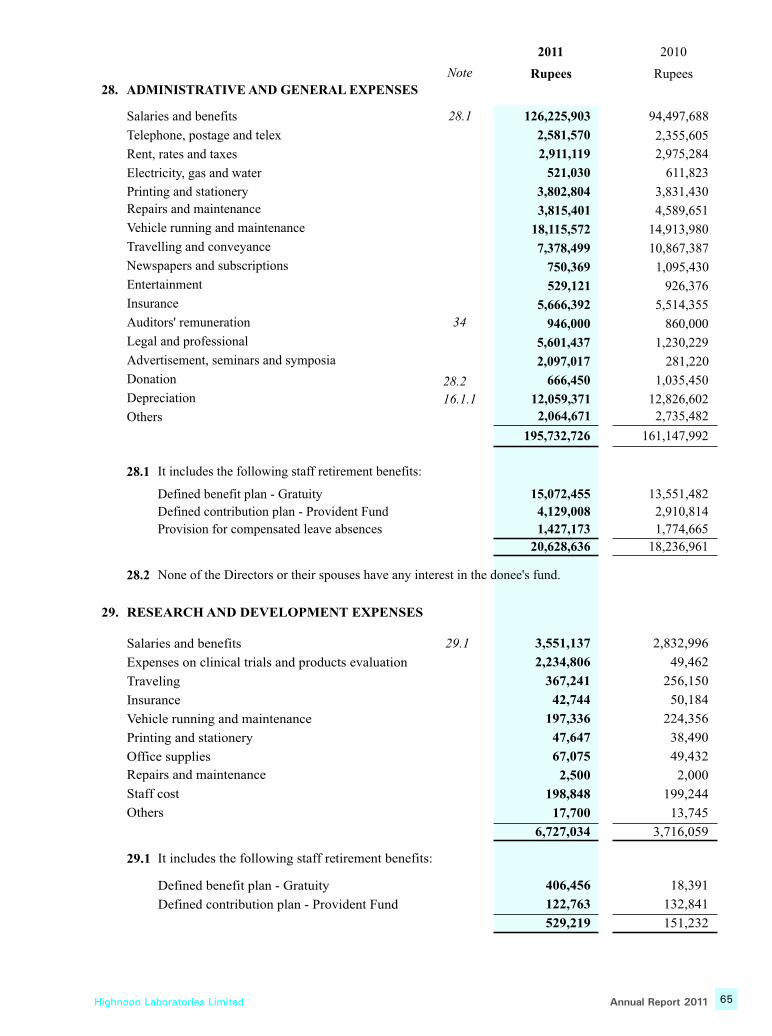
Highnoon Laboratories Limited 65Annual Report 2011
28. ADMINISTRATIVE AND GENERAL EXPENSES
28.2 None of the Directors or their spouses have any interest in the donee's fund.
28.1
34
16.1.1
Note
2011
Rupees
2010
Rupees
Salaries and benefits
Telephone, postage and telex
Rent, rates and taxes
Electricity, gas and water
Repairs and maintenance
Printing and stationery
Vehicle running and maintenance
Travelling and conveyance
Newspapers and subscriptions
Entertainment
Insurance
Auditors' remuneration
Legal and professional
Advertisement, seminars and symposia
Donation
Depreciation
Others
28.1 It includes the following staff retirement benefits:
Defined benefit plan - Gratuity
Defined contribution plan - Provident Fund
Provision for compensated leave absences
126,225,903
2,581,570
2,911,119
521,030
3,802,804
3,815,401
18,115,572
7,378,499
750,369
529,121
5,666,392
946,000
5,601,437
2,097,017
666,450
12,059,371
2,064,671
195,732,726
15,072,455
4,129,008
1,427,173
20,628,636
94,497,688
2,355,605
2,975,284
611,823
3,831,430
4,589,651
14,913,980
10,867,387
1,095,430
926,376
5,514,355
860,000
1,230,229
281,220
1,035,450
12,826,602
2,735,482
161,147,992
13,551,482
2,910,814
1,774,665
18,236,961
29.1
29.1 It includes the following staff retirement benefits:
Defined benefit plan - Gratuity
Defined contribution plan - Provident Fund
29. RESEARCH AND DEVELOPMENT EXPENSES
Salaries and benefits
Expenses on clinical trials and products evaluation
Traveling
Insurance
Vehicle running and maintenance
Printing and stationery
Office supplies
Staff cost
Others
406,456
122,763
529,219
3,551,137
2,234,806
367,241
42,744
197,336
47,647
67,075
2,500
198,848
17,700
6,727,034
18,391
132,841
151,232
2,832,996
49,462
256,150
50,184
224,356
38,490
49,432
2,000
199,244
13,745
3,716,059
28.2
Repairs and maintenance
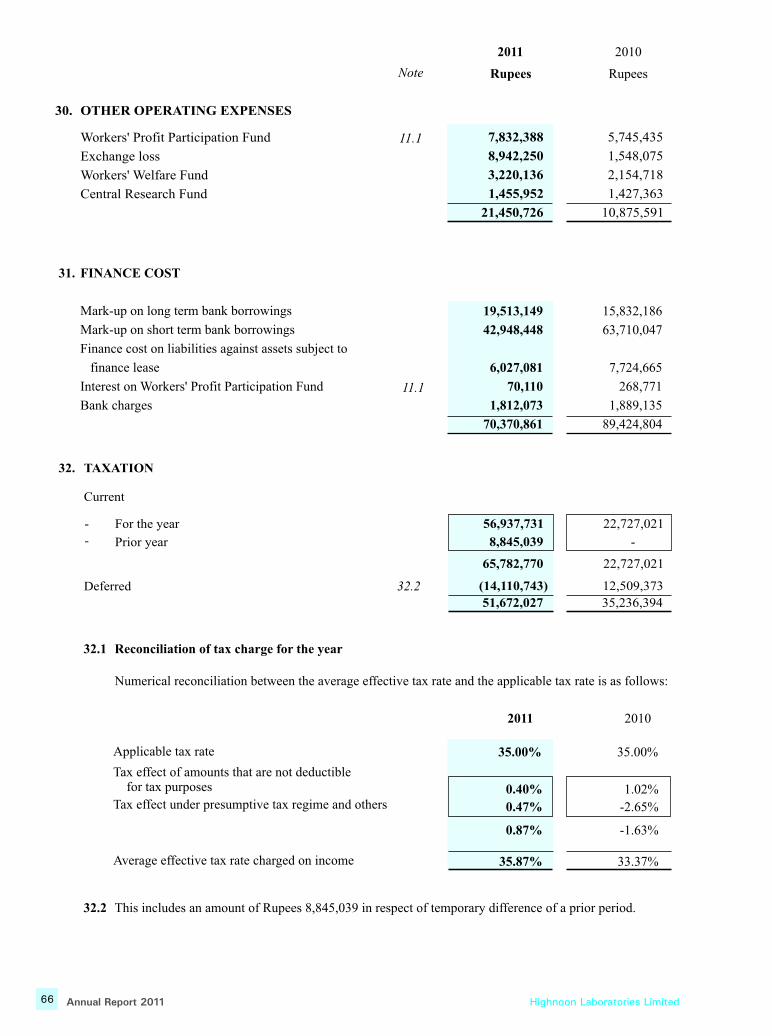
66 Annual Report 2011 Highnoon Laboratories Limited
2011
Rupees
2010
RupeesNote
30. OTHER OPERATING EXPENSES
11.1Workers' Profit Participation Fund
Exchange loss
Workers' Welfare Fund
Central Research Fund
7,832,388
8,942,250
3,220,136
1,455,952
21,450,726
5,745,435
1,548,075
2,154,718
1,427,363
10,875,591
31. FINANCE COST
11.1
Mark-up on long term bank borrowings
Mark-up on short term bank borrowings
Finance cost on liabilities against assets subject to
finance lease
Interest on Workers' Profit Participation Fund
Bank charges
19,513,149
42,948,448
6,027,081
70,110
1,812,073
70,370,861
15,832,186
63,710,047
7,724,665
268,771
1,889,135
89,424,804
32. TAXATION
Current
For the year
Prior year
-
-
56,937,731
8,845,039
22,727,021
-
Tax effect of amounts that are not deductible for tax purposes
Tax effect under presumptive tax regime and others
Applicable tax rate
2011 2010
32.1 Reconciliation of tax charge for the year
Numerical reconciliation between the average effective tax rate and the applicable tax rate is as follows:
Average effective tax rate charged on income
35.00%
0.40%
0.47%
0.87%
35.87%
35.00%
1.02%
-2.65%
-1.63%
33.37%
Deferred
65,782,770
51,672,027
(14,110,743)
22,727,021
35,236,394
12,509,37332.2
32.2 This includes an amount of Rupees 8,845,039 in respect of temporary difference of a prior period.
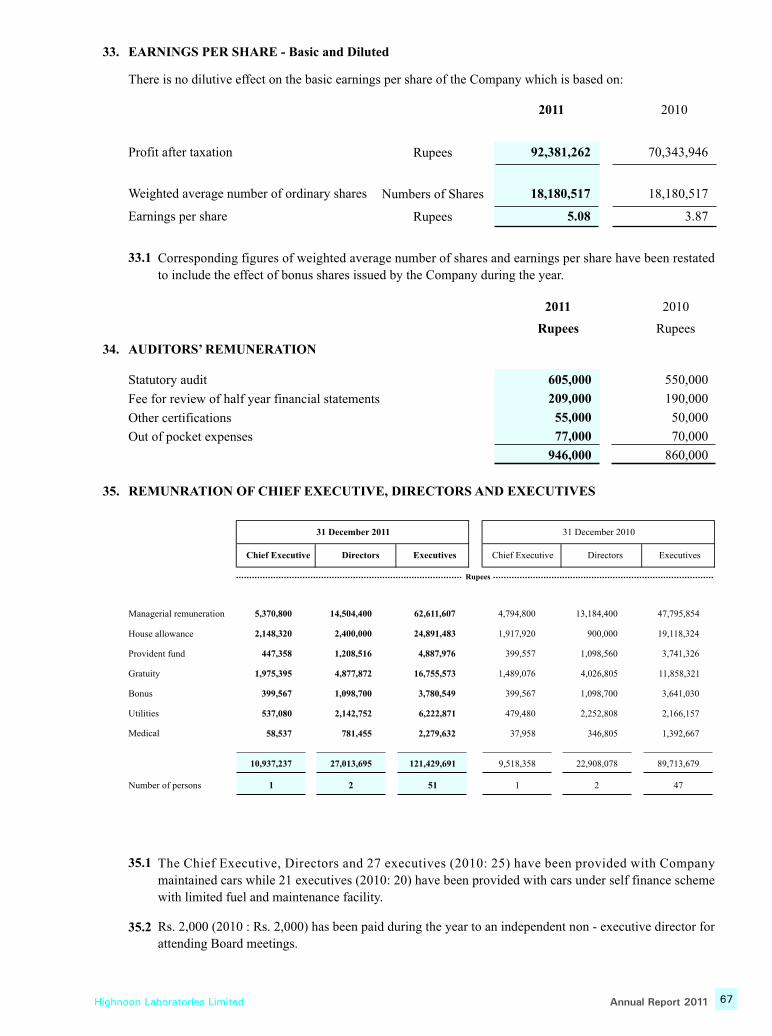
Highnoon Laboratories Limited 67Annual Report 2011
Profit after taxation
33. EARNINGS PER SHARE - Basic and Diluted
There is no dilutive effect on the basic earnings per share of the Company which is based on:
Rupees 92,381,262
Weighted average number of ordinary shares
Earnings per share
Numbers of Shares
Rupees
18,180,517
5.08
2011 2010
70,343,946
18,180,517
3.87
34. AUDITORS’ REMUNERATION
Statutory audit
Fee for review of half year financial statements
Other certifications
Out of pocket expenses
2011
Rupees
2010
Rupees
605,000
209,000
55,000
77,000
946,000
550,000
190,000
50,000
70,000
860,000
The Chief Executive, Directors and 27 executives (2010: 25) have been provided with Company
maintained cars while 21 executives (2010: 20) have been provided with cars under self finance scheme
with limited fuel and maintenance facility.
Rs. 2,000 (2010 : Rs. 2,000) has been paid during the year to an independent non - executive director for
attending Board meetings.
35.1
35.2
35. REMUNRATION OF CHIEF EXECUTIVE, DIRECTORS AND EXECUTIVES
Rupees
Managerial remuneration
House allowance
Provident fund
Gratuity
Bonus
Utilities
Medical
Number of persons
14,504,400
2,400,000
1,208,516
4,877,872
1,098,700
2,142,752
781,455
27,013,695
62,611,607
24,891,483
4,887,976
16,755,573
3,780,549
6,222,871
2,279,632
121,429,691
31 December 2011
Chief Executive Directors Executives
1 2 51
10,937,237
5,370,800
2,148,320
447,358
1,975,395
399,567
537,080
58,537
13,184,400
900,000
1,098,560
4,026,805
1,098,700
2,252,808
346,805
22,908,078
47,795,854
19,118,324
3,741,326
11,858,321
3,641,030
2,166,157
1,392,667
89,713,679
Chief Executive Directors Executives
1 2 47
9,518,358
4,794,800
1,917,920
399,557
1,489,076
399,567
479,480
37,958
31 December 2010
Corresponding figures of weighted average number of shares and earnings per share have been restated
to include the effect of bonus shares issued by the Company during the year.
33.1
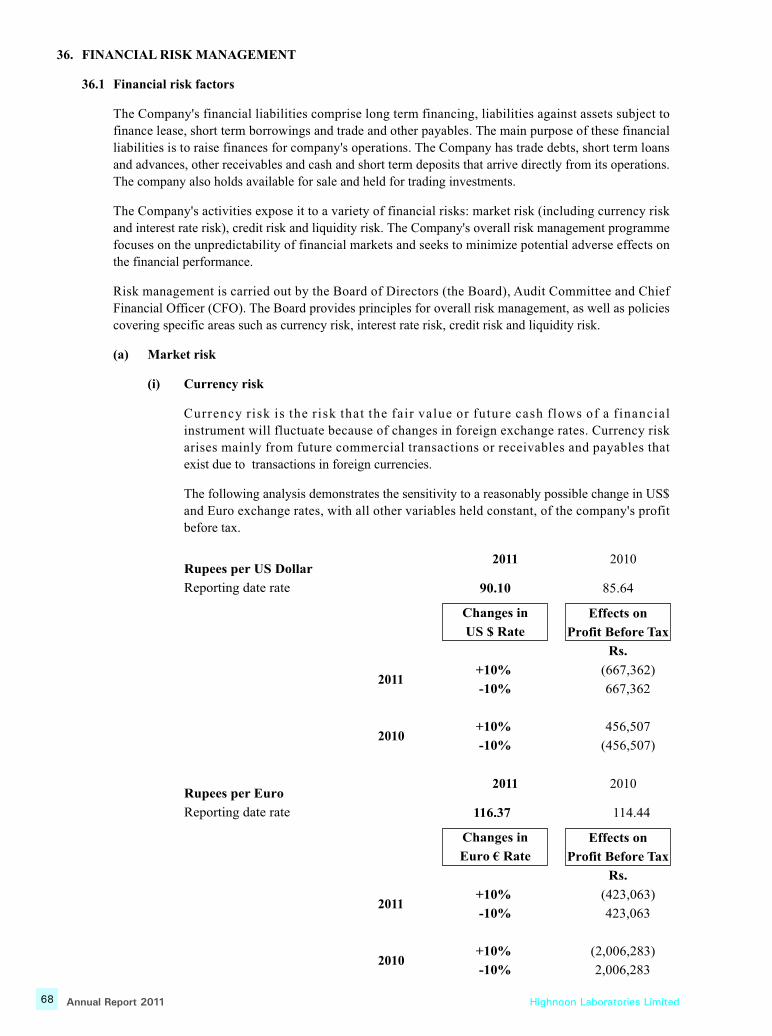
68 Annual Report 2011 Highnoon Laboratories Limited
36. FINANCIAL RISK MANAGEMENT
36.1 Financial risk factors
The Company's financial liabilities comprise long term financing, liabilities against assets subject to
finance lease, short term borrowings and trade and other payables. The main purpose of these financial
liabilities is to raise finances for company's operations. The Company has trade debts, short term loans
and advances, other receivables and cash and short term deposits that arrive directly from its operations.
The company also holds available for sale and held for trading investments.
The Company's activities expose it to a variety of financial risks: market risk (including currency risk
and interest rate risk), credit risk and liquidity risk. The Company's overall risk management programme
focuses on the unpredictability of financial markets and seeks to minimize potential adverse effects on
the financial performance.
Risk management is carried out by the Board of Directors (the Board), Audit Committee and Chief
Financial Officer (CFO). The Board provides principles for overall risk management, as well as policies
covering specific areas such as currency risk, interest rate risk, credit risk and liquidity risk.
(a) Market risk
(i) Currency risk
Currency risk is the risk that the fair value or future cash flows of a f inancial
instrument will fluctuate because of changes in foreign exchange rates. Currency risk
arises mainly from future commercial transactions or receivables and payables that
exist due to transactions in foreign currencies.
The following analysis demonstrates the sensitivity to a reasonably possible change in US$
and Euro exchange rates, with all other variables held constant, of the company's profit
before tax.
2011 2010
Changes in
US $ Rate
Effects on
Profit Before Tax
Rs.
Rupees per US Dollar
Reporting date rate 90.10 85.64
+10%
-10%
+10%
-10%
2011
2010
2011 2010
Changes in
Euro € Rate
Effects on
Profit Before Tax
Rs.
Rupees per Euro
Reporting date rate 116.37
+10%
-10%
+10%
-10%
(667,362)
667,362
456,507
(456,507)
114.44
(423,063)
(
423,063
2,006,283)
2,006,283
2011
2010

Highnoon Laboratories Limited 69Annual Report 2011
Long term financing+1.5
-1.5
+1.5
-1.5
(1,499,201)
1,499,201
(2,133,511)
2,133,511
2011
2010
Liabilities against assets
subject to finance lease +1.5
-1.5
+1.5
-1.5
(394,698)
394,698
(657,554)
657,554
2011
2010
Short term bank borrowings+1.5
-1.5
+1.5
-1.5
(1,969,367)
1,969,367
(5,755,577)
5,755,577
2011
2010
Changes in
Interest Rate
Effects on
Profit Before Tax
Rs.
(ii) Interest rate riskThis represents the risk that the fair value or future cash flows of a financial instrument will fluctuate because of changes in market interest rates.
The Company has no significant long-term interest-bearing assets. The Company's interest rate risk arises from long term financing, short term borrowings and liabilities against assets subject to finance lease. Borrowings obtained at variable rates expose the Company to cash flow interest rate risk. Borrowings obtained at fixed rate expose the Company to fair value interest rate risk.
At the balance sheet date the interest rate profile of the Company’s interest bearing financial instruments was:
Fair value sensitivity analysis for fixed rate instruments
The Company does not account for any fixed rate financial assets and liabilities at fair value through profit or loss. Therefore, a change in interest rate at the balance sheet date would not affect profit or loss of the Company.
Cash flow sensitivity analysis for variable rate instruments
The following analysis demonstrates the sensitivity to a reasonably possible change in interest rates, with all other variables held constant, of the Company's profit before tax. This analysis is prepared assuming the amounts of floating rate instruments outstanding at balance sheet dates were outstanding for the whole year.
Fixed rate instruments Financial liabilities
Short term financing
Floating rate instruments Financial liabilities
Long term financing Liabilities against assets subject to finance lease
Short term bank borrowings
2011
Rupees
2010
Rupees
35,000,000
99,946,763
26,313,224
131,291,136
15,000,000
142,234,056
43,836,931
383,705,155

70 Annual Report 2011 Highnoon Laboratories Limited
(b) Credit risk
Credit risk represents the risk that one party to a financial instrument will cause a financial loss
for the other party by failing to discharge an obligation. The carrying amount of financial assets
represents the maximum credit exposure. The maximum exposure to credit risk at the reporting
date was as follows:
Due to the Company's long standing business relationships with these counterparties and after
giving due consideration to their strong financial standing, management does not expect non-
performance by these counter parties on their obligations to the Company. Accordingly the credit
risk is minimal.
The credit quality of financial assets that are neither past due nor impaired can be assessed by
reference to external credit ratings (If available) or to historical information about
counterparty default rate. The table below shows the bank balances held with some major
counterparties at the balance sheet date:
Trade DebtsCredit risk related to trade debts is managed by established procedures and controls relating to
customers credit risk management. Outstanding receivables are regularly monitored and
shipments to foreign customers are covered by letters of credit.
The maximum credit risk exposure at reporting date is carrying value of financial assets stated
above.
At 31 December 2011, the Company has 7 (2010:8) customers who owed the company more than
Rupees 1.00 million each and accounted for approximately 36% (2010:68%) of all receivables
owing.
There are 2 (2010:2) customers with balance greater than Rupees 5.0 million (2010:5.0 million)
accounted for over 39% (2010:20%%) of total amount receivables.
The Company's exposure to credit risk related to trade debts is disclosed below:
Trade debts
Short term loans
Trade deposits
Other receivables
Bank balances
2011
Rupees
2010
Rupees
43,010,427
4,524,986
7,236,085
230,854
10,601,793
65,604,145
36,371,869
3,701,970
9,757,923
7,765,472
61,330,875
118,928,109
Not past due
Past due 1–30 days
Past due 31–60 days
Past due 61–90 days
Over 90 days
2011
Rupees
2010
Rupees
6,986,450
19,215,304
6,941,862
4,372,628
5,494,183
43,010,427
5,466,996
4,816,430
2,483,699
2,848,358
20,756,386
36,371,869
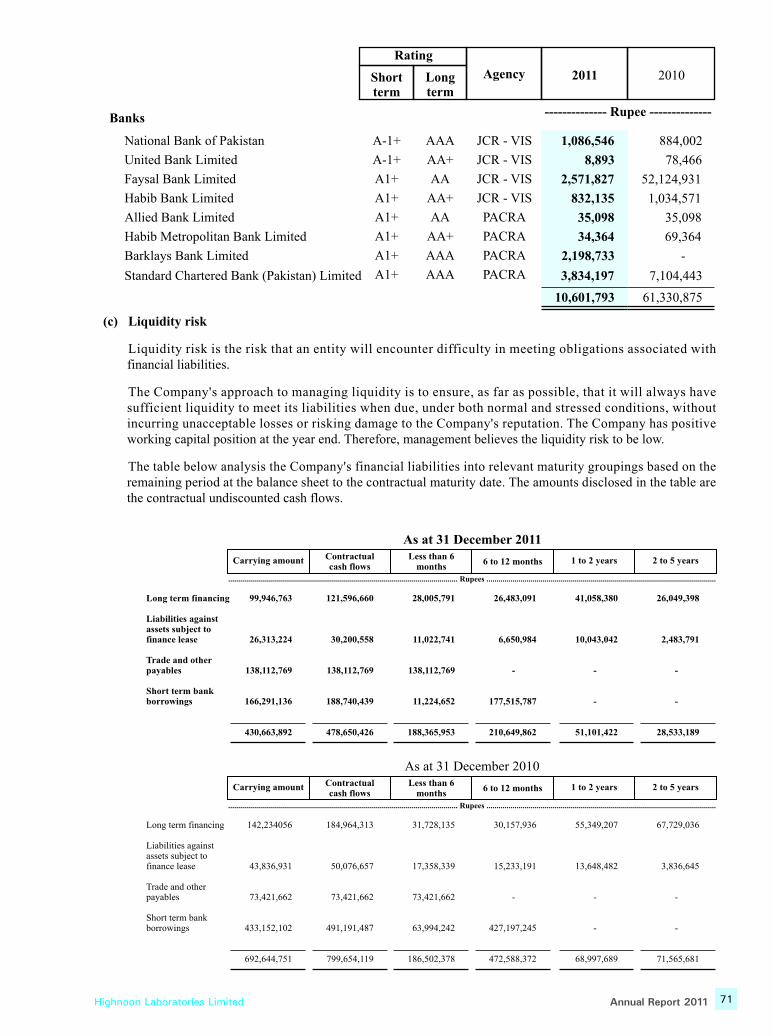
Highnoon Laboratories Limited 71Annual Report 2011
(c) Liquidity risk
Liquidity risk is the risk that an entity will encounter difficulty in meeting obligations associated with financial liabilities.
The Company's approach to managing liquidity is to ensure, as far as possible, that it will always have sufficient liquidity to meet its liabilities when due, under both normal and stressed conditions, without incurring unacceptable losses or risking damage to the Company's reputation. The Company has positive working capital position at the year end. Therefore, management believes the liquidity risk to be low.
The table below analysis the Company's financial liabilities into relevant maturity groupings based on the remaining period at the balance sheet to the contractual maturity date. The amounts disclosed in the table are the contractual undiscounted cash flows.
20102011Agency
Rating
Longterm
Shortterm
-------------- Rupee --------------
United Bank Limited
National Bank of Pakistan
Banks
Faysal Bank Limited
Habib Bank Limited
Allied Bank Limited
Habib Metropolitan Bank Limited
Barklays Bank Limited
Standard Chartered Bank (Pakistan) Limited
1,086,546
8,893
2,571,827
832,135
35,098
34,364
2,198,733
3,834,197
10,601,793
884,002
78,466
52,124,931
1,034,571
35,098
69,364
-
7,104,443
61,330,875
JCR - VIS
JCR - VIS
JCR - VIS
JCR - VIS
PACRA
PACRA
PACRA
PACRA
AAA
AA+
AA
AA+
AA
AA+
AAA
AAA
A-1+
A-1+
A1+
A1+
A1+
A1+
A1+
A1+
As at 31 December 2011
Long term financing
Liabilities againstassets subject tofinance lease
Trade and otherpayables
Short term bankborrowings
................................................................................................................... Rupees ...................................................................................................................
Carrying amount Contractualcash flows
Less than 6months
6 to 12 months 1 to 2 years 2 to 5 years
99,946,763
26,313,224
138,112,769
166,291,136
430,663,892
121,596,660
30,200,558
138,112,769
188,740,439
478,650,426
28,005,791
11,022,741
138,112,769
11,224,652
188,365,953
26,483,091
6,650,984
-
177,515,787
210,649,862
41,058,380
10,043,042
-
-
51,101,422
26,049,398
2,483,791
-
-
28,533,189
As at 31 December 2010
Long term financing
Liabilities againstassets subject tofinance lease
Trade and otherpayables
Short term bankborrowings
................................................................................................................... Rupees ...................................................................................................................
Carrying amount Contractualcash flows
Less than 6months
6 to 12 months 1 to 2 years 2 to 5 years
142,234056
43,836,931
73,421,662
433,152,102
692,644,751
184,964,313
50,076,657
73,421,662
491,191,487
799,654,119
31,728,135
17,358,339
73,421,662
63,994,242
186,502,378
30,157,936
15,233,191
-
427,197,245
472,588,372
55,349,207
13,648,482
-
-
68,997,689
67,729,036
3,836,645
-
-
71,565,681

72 Annual Report 2011 Highnoon Laboratories Limited
The contractual cash flows relating to the above financial liabilities have been determined on the
basis of markup rates effective as at 31 December 2011. The rates of mark up have been disclosed
in respective notes to the financial statements.
36.2 Fair values of financial assets and liabilities
Fair value of available-for-sale financial assets is derived from quoted market prices in active markets,if
available.
The carrying values of all financial assets and liabilities reflected in financial statements approximate
their fair values. Fair value is determined on the basis of objective evidence at each reporting date.
Accordingly, detailed disclosure with reference to fair value has been given in the financial statements.
36.3 Fair values of financial assets and liabilities
2011
TotalLoans and
advances
Cash andcash
equivalents
-------------------------------- Rupee --------------------------------
Trade debts
Long term deposits
Assets as per balance sheet
Short term loans
Trade deposits
Other receivables
Cash and bank balances -
68,823,334
-
-
-
-
-
10,601,793
10,601,793
1,562,0541,562,054
55,269,35555,269,355
4,524,9864,524,986
7,236,0857,236,085
230,854230,854
10,601,793
79,425,127
2011
Liabilities against assets subject to finance lease
Long term financing
Liabilities as per balance sheet
Interest accrued on secured loans
Short term borrowings
Trade and other payables
99,946,763
26,313,224
10,436,070
166,291,136
138,112,769
441,099,962
Financial Liabilitiesat amortized cost
(Rupees)
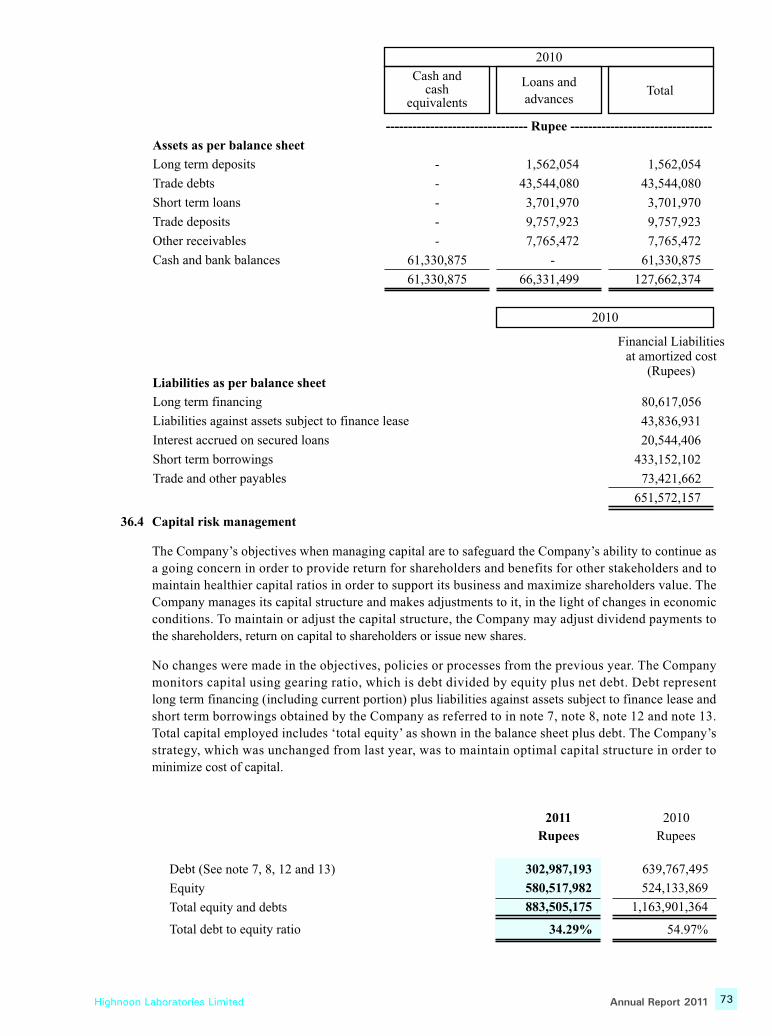
Highnoon Laboratories Limited 73Annual Report 2011
36.4 Capital risk management
The Company’s objectives when managing capital are to safeguard the Company’s ability to continue as
a going concern in order to provide return for shareholders and benefits for other stakeholders and to
maintain healthier capital ratios in order to support its business and maximize shareholders value. The
Company manages its capital structure and makes adjustments to it, in the light of changes in economic
conditions. To maintain or adjust the capital structure, the Company may adjust dividend payments to
the shareholders, return on capital to shareholders or issue new shares.
No changes were made in the objectives, policies or processes from the previous year. The Company
monitors capital using gearing ratio, which is debt divided by equity plus net debt. Debt represent
long term financing (including current portion) plus liabilities against assets subject to finance lease and
short term borrowings obtained by the Company as referred to in note 7, note 8, note 12 and note 13.
Total capital employed includes ‘total equity’ as shown in the balance sheet plus debt. The Company’s
strategy, which was unchanged from last year, was to maintain optimal capital structure in order to
minimize cost of capital.
2010
TotalLoans and
advances
Cash andcash
equivalents
-------------------------------- Rupee --------------------------------
Trade debts
Long term deposits
Assets as per balance sheet
Short term loans
Trade deposits
Other receivables
Cash and bank balances -
66,331,499
-
-
-
-
-
61,330,875
61,330,875
1,562,0541,562,054
43,544,08043,544,080
3,701,9703,701,970
9,757,9239,757,923
7,765,4727,765,472
61,330,875
127,662,374
2010
Liabilities against assets subject to finance lease
Long term financing
Liabilities as per balance sheet
Interest accrued on secured loans
Short term borrowings
Trade and other payables
80,617,056
43,836,931
20,544,406
433,152,102
73,421,662
651,572,157
Financial Liabilitiesat amortized cost
(Rupees)
Debt (See note 7, 8, 12 and 13)
Equity
Total equity and debts
Total debt to equity ratio
302,987,193
580,517,982
883,505,175
34.29%
2011
Rupees
2010
Rupees
639,767,495
524,133,869
1,163,901,364
54.97%
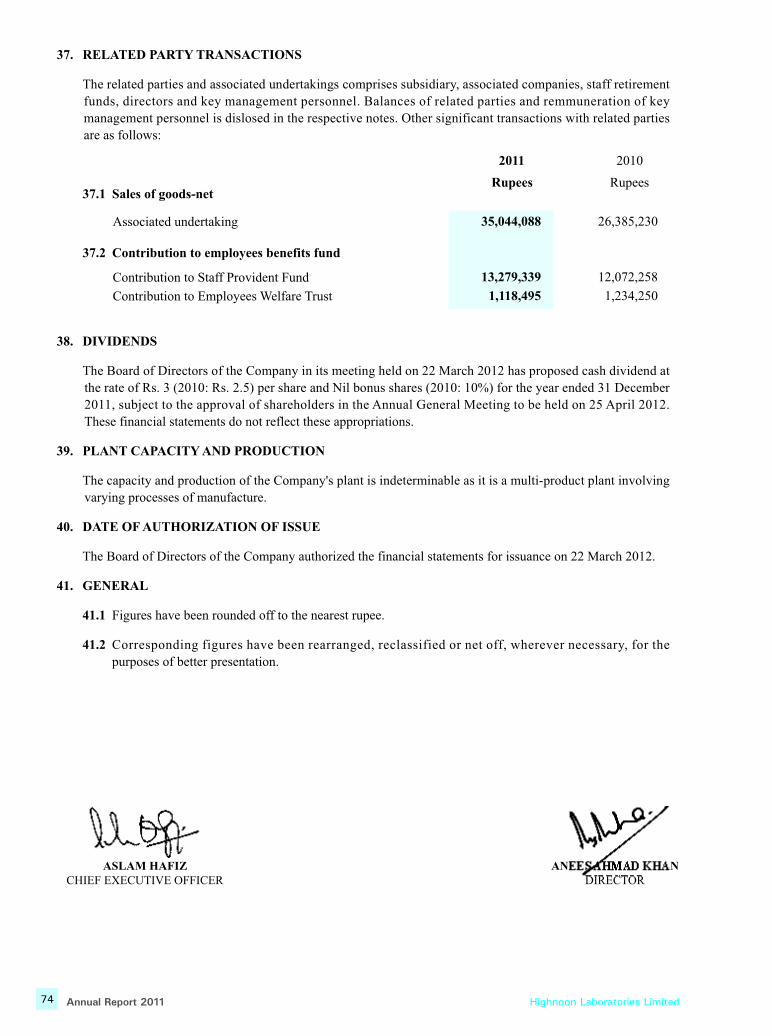
74 Annual Report 2011 Highnoon Laboratories Limited
ANEES AHMAD KHANDIRECTOR
ASLAM HAFIZ CHIEF EXECUTIVE OFFICER
37. RELATED PARTY TRANSACTIONS
The related parties and associated undertakings comprises subsidiary, associated companies, staff retirement
funds, directors and key management personnel. Balances of related parties and remmuneration of key
management personnel is dislosed in the respective notes. Other significant transactions with related parties
are as follows:
37.1 Sales of goods-net
37.2 Contribution to employees benefits fund
38. DIVIDENDS
The Board of Directors of the Company in its meeting held on 22 March 2012 has proposed cash dividend at
the rate of Rs. 3 (2010: Rs. 2.5) per share and Nil bonus shares (2010: 10%) for the year ended 31 December
2011, subject to the approval of shareholders in the Annual General Meeting to be held on 25 April 2012.
These financial statements do not reflect these appropriations.
39. PLANT CAPACITY AND PRODUCTION
The capacity and production of the Company's plant is indeterminable as it is a multi-product plant involving
varying processes of manufacture.
40. DATE OF AUTHORIZATION OF ISSUE
The Board of Directors of the Company authorized the financial statements for issuance on 22 March 2012.
41. GENERAL
41.1 Figures have been rounded off to the nearest rupee.
41.2 Corresponding figures have been rearranged, reclassified or net off, wherever necessary, for the
purposes of better presentation.
2011
Rupees
2010
Rupees
Associated undertaking 35,044,088
Contribution to Staff Provident Fund
Contribution to Employees Welfare Trust
13,279,339
1,118,495
26,385,230
12,072,258
1,234,250


Group Financial StatementsHIGHNOON LABORATORIES LIMITEDand its wholly owned subsidiary companyDynalog Services (Private) Limited2011

Highnoon Laboratories Limited and its Subsidiary Company 77Annual Report 2011
AUDITORS’ REPORT TO THE MEMBERS
We have audited the annexed consolidated financial statements comprising the consolidated balance sheet of Highnoon Laboratories Limited and its subsidiary as at 31 December 2011 and the related consolidated profit and loss account, consolidated statement of comprehensive income, consolidated cash flow statement and consolidated statement of changes in equity together with the notes forming part thereof, for the year then ended. We have also expressed a separate opinion on the financial statements of the Highnoon Laboratories Limited and its subsidiary company. These financial statements are the responsibility of the holing company's management. Our responsibility is to express an opinion on these financial statements based on our examination.
Our audit was conducted in accordance with International Standards on Auditing and accordingly included such tests of accounting records and such other auditing procedures as we considered necessary in the circumstances.
In our opinion, the consolidated financial statements present fairly the financial position of the Highnoon Laboratories Limited and its subsidiary as at 31 December 2011 and the results of their operations for the year then ended.
Without qualifying our opinion, we draw attention to note 1.2 to the financial statements which states that the management of the subsidiary company had discontinued its operations and accordingly, the subsidiary company financial statements have been prepared on non-going concern basis and related assets and liabilities approximate to their realizable values.
Lahore: 22 March 2012
Chartered AccountantsEngagement Partner: Naseem akbar

78 Annual Report 2011 Highnoon Laboratories Limited and its Subsidiary Company
CONSOLIDATED BALANCE SHEET
ASLAM HAFIZ CHIEF EXECUTIVE OFFICER
EQUITY AND LIABILITIES
SHARE CAPITAL AND RESERVES
Share capital
Reserves
Surplus on revaluation of fixed assets
NON CURRENT LIABILITIES
5
6
Note
2011
Rupees
2010
Rupees
Authorized Share Capital
Ordinary shares of Rs. 10 each
20,000,000 (2010: 20,000,000) 200,000,000
CURRENT LIABILITIES
Liabilities against assets
Long term loans - secured
subject to finance lease
Long term advances
Deferred liabilities
Trade and other payables
CONTINGENCIES AND COMMITMENTS
7
8
9
10
11
181,805,170
399,854,712
183,153,055
57,659,470
11,296,272
14,942,278
265,856,775
349,754,795
186,874,267
1,558,911,607
15
200,000,000
165,277,431
360,152,632
581,659,882 525,430,063
188,475,264
99,946,763
27,903,144
10,588,988
249,517,280
387,956,175
120,599,544
Markup payable on secured loans
Short term bank borrowings - secured
Current portion of long term liabilities
12
13
14
10,436,070
166,291,136
80,742,402
444,343,875
20,544,406
433,152,102
66,266,257
640,562,309
1,742,423,811
The annexed notes from 1 to 40 form an integral part of these financial statements.
- -

ANEES AHMAD KHANDIRECTOR
AS AT 31 DECEMBER 2011
Note
2011
Rupees
16
17
NON CURRENT ASSETS
ASSETS
Property, plant and equipment
Intangible assets
715,051,154
111,843,817
2010
Rupees
709,868,202
129,099,156
Long term deposits
CURRENT ASSETS
Stock in trade
Trade debts
Advances, deposits and prepayments
Other receivables
Income tax - net
Cash and bank balances
18
19
20
21
22
1,562,054
828,457,025
518,480,424
55,167,872
51,136,092
17,204,500
75,251,804
13,213,890
730,454,582
1,562,054
840,529,412
640,844,633
42,107,297
33,714,141
21,696,618
98,046,396
65,485,314
901,894,399
1,558,911,607 1,742,423,811
Highnoon Laboratories Limited and its Subsidiary Company 79Annual Report 2011

ANEES AHMAD KHANDIRECTOR
ASLAM HAFIZ CHIEF EXECUTIVE OFFICER
CONSOLIDATED PROFIT AND LOSS ACCOUNTFOR THE YEAR ENDED 31 DECEMBER 2011
Cost of sales
GROSS PROFIT
Administrative and general expenses
Distribution, selling and promotional expenses
Other operating expenses
Research and development expenses
25
26
27
28
29
The annexed notes from 1 to 40 form an integral part of these financial statements.
Sales - net 23
24
Finance Cost 30
Taxation
PROFIT BEFORE TAXATION
31
PROFIT AFTER TAXATION
2011
Rupees
2010
RupeesNote
Earnings per share - basic and diluted 32
92,226,968
2,944,907,488
2,030,736,442
914,171,046
568,588,690
92,752,280
195,886,720
6,727,034
21,450,726
699,900,890
214,270,156
70,371,161
143,898,995
51,672,027
5.07
Other operating income
72,658,049
2,636,538,261
1,732,983,015
903,555,246
161,147,492
8,347,560
3,716,059
10,875,591
706,229,367
197,325,879
89,425,036
107,900,843
35,242,794
4.00
538,366,785
80 Annual Report 2011 Highnoon Laboratories Limited and its Subsidiary Company
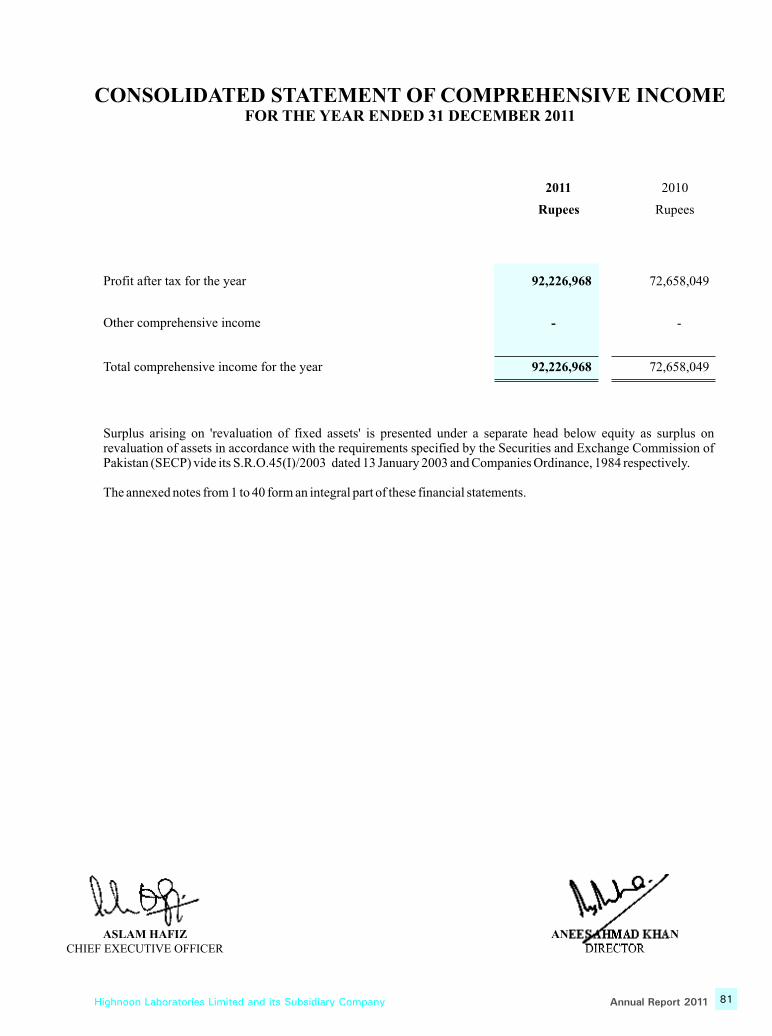
ANEES AHMAD KHANDIRECTOR
ASLAM HAFIZ CHIEF EXECUTIVE OFFICER
CONSOLIDATED STATEMENT OF COMPREHENSIVE INCOMEFOR THE YEAR ENDED 31 DECEMBER 2011
Other comprehensive income
Total comprehensive income for the year
Profit after tax for the year 92,226,968
-
92,226,968
2011
Rupees
2010
Rupees
72,658,049
-
72,658,049
Surplus arising on 'revaluation of fixed assets' is presented under a separate head below equity as surplus on revaluation of assets in accordance with the requirements specified by the Securities and Exchange Commission of Pakistan (SECP) vide its S.R.O.45(I)/2003 dated 13 January 2003 and Companies Ordinance, 1984 respectively.
The annexed notes from 1 to 40 form an integral part of these financial statements.
Highnoon Laboratories Limited and its Subsidiary Company 81Annual Report 2011
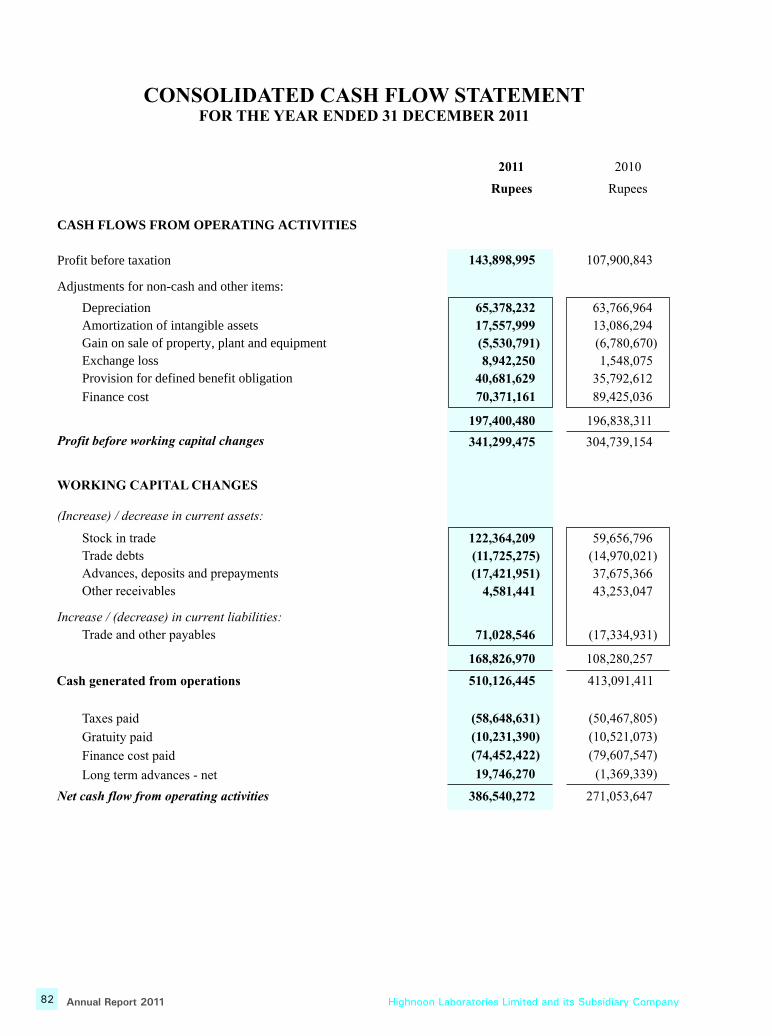
2011
Rupees
CASH FLOWS FROM OPERATING ACTIVITIES
Adjustments for non-cash and other items:
Profit before taxation
DepreciationAmortization of intangible assetsGain on sale of property, plant and equipmentExchange loss Provision for defined benefit obligation
2010
Rupees
WORKING CAPITAL CHANGES
(Increase) / decrease in current assets:
Increase / (decrease) in current liabilities:
Stock in trade
Trade debts
Advances, deposits and prepayments
Other receivables
Trade and other payables
Taxes paid
Gratuity paid
Finance cost paid
Long term advances - net
Net cash flow from operating activities
Cash generated from operations
Finance cost
Profit before working capital changes
143,898,995
65,378,232
17,557,999
(5,530,791)
8,942,250
40,681,629
122,364,209
(11,725,275)
(17,421,951)
4,581,441
71,028,546
(58,648,631)
(10,231,390)
(74,452,422)
19,746,270
386,540,272
510,126,445
168,826,970
70,371,161
197,400,480
341,299,475
107,900,843
63,766,964
13,086,294
(6,780,670)
1,548,075
35,792,612
89,425,036
196,838,311
304,739,154
59,656,796
(14,970,021)
37,675,366
43,253,047
(17,334,931)
108,280,257
413,091,411
(50,467,805)
(10,521,073)
(79,607,547)
(1,369,339)
271,053,647
CONSOLIDATED CASH FLOW STATEMENTFOR THE YEAR ENDED 31 DECEMBER 2011
82 Annual Report 2011 Highnoon Laboratories Limited and its Subsidiary Company

ANEES AHMAD KHANDIRECTOR
ASLAM HAFIZ CHIEF EXECUTIVE OFFICER
CASH FLOWS FROM INVESTING ACTIVITIES
Net cash used in investing activities
CASH FLOWS FROM FINANCING ACTIVITIES
Long term loans repayment - net
Decrease in short term bank borrowings - net
Dividend paid
Long term loans obtained
Repayment of finance lease liabilities
2011
RupeesNote
2010
Rupees
The annexed notes from 1 to 40 form an integral part of these financial statements.
Net cash used in financing activities
22
Net (decrease) / increase in cash and cash equivalents
Cash and cash equivalents at beginning of the year
Cash and cash equivalents at end of the year
(47,472,552)
(42,287,293)
(266,860,966)
(40,779,597)
-
(41,411,288)
(391,339,144)
(52,271,424)
65,485,314
13,213,890
Fixed capital expenditure incurred
Intangible assets acquired
(60,405,164)
(302,660)
(56,713,931)
(76,800,888)
(115,634,390)
(27,558,294)
(129,155,729)
(40,778,313)
(122,111,030)
33,308,227
32,177,087
65,485,314
116,049,000
(40,667,694)
Sale proceeds from disposal of property, plant and equipment 13,235,272 17,880,429
Highnoon Laboratories Limited and its Subsidiary Company 83Annual Report 2011

ANEES AHMAD KHANDIRECTOR
ASLAM HAFIZ CHIEF EXECUTIVE OFFICER
CONSOLIDATED STATEMENT OF CHANGES IN EQUITYFOR THE YEAR ENDED 31 DECEMBER 2011
Share Capital
Revenue Reserves
Total
General ReserveUnappropriated
ProfitSub Total
----------------------------------------------------Rupees----------------------------------------------------
Balance as at 01 January 2010
165,277,431 114,000,000
208,900,375
322,900,375
488,177,806
Final dividend @ Rs. 2.5 per share
for the year ended 31 December 2009 - - (41,319,358) (41,319,358) (41,319,358)
Incremental depreciation relating to
surplus on revaluation of fixed assets - net - - 5,913,566 5,913,566 5,913,566
Total comprehensive income for the year - - 72,658,049 72,658,049 72,658,049
Balance as at 31 December 2010 165,277,431 114,000,000 246,152,632 360,152,632 525,430,063
Final dividend @ Rs. 2.5 per share
for the year ended 31 December 2010 - - (41,319,358) (41,319,358) (41,319,358)
Issuance of bonus shares @ of 10% 16,527,739 - (16,527,739) (16,527,739) -
Incremental depreciation relating to
surplus on revaluation of fixed assets - net
-
-
5,322,209
5,322,209
5,322,209
Total comprehensive income for the year - - 92,226,968 92,226,968 92,226,968
Balance as at 31 December 2011 181,805,170 114,000,000 285,854,712 399,854,712 581,659,882
The annexed notes from 1 to 40 from an integral part of these financial statements.
84 Annual Report 2011 Highnoon Laboratories Limited and its Subsidiary Company
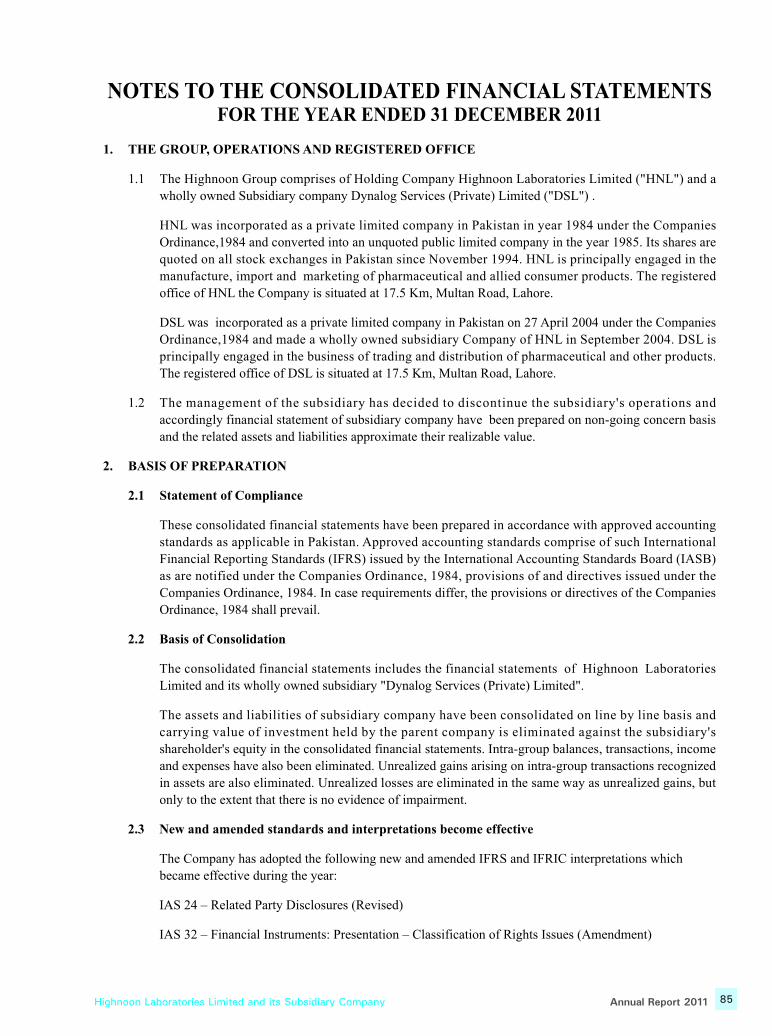
Highnoon Laboratories Limited and its Subsidiary Company 85Annual Report 2011
NOTES TO THE FINANCIAL STATEMENTSFOR THE YEAR ENDED 31 DECEMBER 2011
CONSOLIDATED
1. THE GROUP, OPERATIONS AND REGISTERED OFFICE
1.1 The Highnoon Group comprises of Holding Company Highnoon Laboratories Limited ("HNL") and a
wholly owned Subsidiary company Dynalog Services (Private) Limited ("DSL") .
HNL was incorporated as a private limited company in Pakistan in year 1984 under the Companies
Ordinance,1984 and converted into an unquoted public limited company in the year 1985. Its shares are
quoted on all stock exchanges in Pakistan since November 1994. HNL is principally engaged in the
manufacture, import and marketing of pharmaceutical and allied consumer products. The registered
office of HNL the Company is situated at 17.5 Km, Multan Road, Lahore.
DSL was incorporated as a private limited company in Pakistan on 27 April 2004 under the Companies
Ordinance,1984 and made a wholly owned subsidiary Company of HNL in September 2004. DSL is
principally engaged in the business of trading and distribution of pharmaceutical and other products.
The registered office of DSL is situated at 17.5 Km, Multan Road, Lahore.
1.2 The management of the subsidiary has decided to discontinue the subsidiary's operations and
accordingly financial statement of subsidiary company have been prepared on non-going concern basis
and the related assets and liabilities approximate their realizable value.
2. BASIS OF PREPARATION
2.1 Statement of Compliance
These consolidated financial statements have been prepared in accordance with approved accounting
standards as applicable in Pakistan. Approved accounting standards comprise of such International
Financial Reporting Standards (IFRS) issued by the International Accounting Standards Board (IASB)
as are notified under the Companies Ordinance, 1984, provisions of and directives issued under the
Companies Ordinance, 1984. In case requirements differ, the provisions or directives of the Companies
Ordinance, 1984 shall prevail.
2.2 Basis of Consolidation
The consolidated financial statements includes the financial statements of Highnoon Laboratories
Limited and its wholly owned subsidiary "Dynalog Services (Private) Limited".
The assets and liabilities of subsidiary company have been consolidated on line by line basis and
carrying value of investment held by the parent company is eliminated against the subsidiary's
shareholder's equity in the consolidated financial statements. Intra-group balances, transactions, income
and expenses have also been eliminated. Unrealized gains arising on intra-group transactions recognized
in assets are also eliminated. Unrealized losses are eliminated in the same way as unrealized gains, but
only to the extent that there is no evidence of impairment.
2.3 New and amended standards and interpretations become effective
The Company has adopted the following new and amended IFRS and IFRIC interpretations which
became effective during the year:
IAS 24 – Related Party Disclosures (Revised)
IAS 32 – Financial Instruments: Presentation – Classification of Rights Issues (Amendment)

86 Annual Report 2011 Highnoon Laboratories Limited and its Subsidiary Company
IFRIC 14 – Prepayments of a Minimum Funding Requirement (Amendment)
IFRIC 19 - Extinguishing Financial Liabilities with Equity Instruments
In May 2010, International Accounting Standards Board (IASB) issued amendments to various
standards primarily with a view to removing inconsistencies and clarifying wording. These
improvements are listed below:
IFRS 3 Business Combinations- Transition requirements for contingent consideration from A business combination that occurred
before the effective date of the revised IFRS- Measurement of non-controlling interests (NCI)- Un-replaced and voluntarily replaced share-based payment awards
IFRS 7 Financial Instruments: Disclosures- Clarification of disclosures
IAS 1 Presentation of Financial Statements- Clarification of statement of changes in equityIAS 27 Consolidated and Separate Financial Statements- Transition requirements for amendments made as a result of IAS 27 Consolidated and Separate
Financial Statements.
IAS 34 Interim Financial Reporting- Significant events and transactions
IFRIC 1 Customer Loyalty Programmes- Fair value of award credits
The adoption of the above standards, amendments, interpretations and improvements did not have any
material effect on the financial statements
2.4 Standards, interpretations and amendments to published approved accounting Standards that are
not yet effective
The following revised standards, amendments and interpretations with respect to the approved
accounting standards as applicable in Pakistan would be effective from the dates mentioned below
against the respective standard or interpretation:
Effective Date (Annual Periods
Standard or Interpretation beginning on or after
IFRS 7 Financial Instruments : disclosures – (amendments)
- Amendments enhancing disclosures about transfers of financial Assets 01 July 2011
- Amendments enhancing disclosures about offsetting of financialassets and financial liabilities 01 January 2013
IAS 1 Presentation of Financial Statements – Presentation of items ofcomprehensive income of Underlying Assets 01 January 2012
IAS 12 Income Taxes (Amendment) - Recovery of Underlying Assets 01 January 2012
IAS 19 Employee Benefits –(Amendment) 01 January 2013

Highnoon Laboratories Limited and its Subsidiary Company 87Annual Report 2011
The Company expects that the adoption of the above revisions, amendments and interpretations of the
standards will not materially affect the Company's financial statements in the period of initial
application.
In addition to the above, the following new standards have been issued by IASB which are yet to be
notified by the SECP for the purpose of applicability in Pakistan.
IASB effective date (Annual periods
Standards beginning on or after)
IFRS 9 - Financial Instruments 01 January 2015IFRS 10 - Consolidated Financial Statements 01 January 2013IFRS 11 - Joint Arrangements 01 January 2013IFRS 12 - Disclosure of Interests in Other Entities 01 January 2013IFRS 13 - Fair Value Measurement 01 January 2013
3. BASIS OF MEASUREMENT
3.1 Accounting convention
These consolidated financial statements have been prepared under the historical cost convention, except
for revaluation of certain assets as referred to in note 16 and recognition of certain employees retirement
benefits at present value. In these financial statements, except for the cash flow statement, all the
transactions have been accounted for on accrual basis.
3.2 Use of estimates and judgments
The preparation of consolidated financial statements in conformity with approved accounting standards
requires management to make judgments, estimates and assumptions that affect the application of
accounting policies and reported amounts of assets and liabilities, income and expenses. The estimates
and associated assumptions and judgments are based on historical experience and various other factors
that are believed to be reasonable under the circumstances, the result of which form the basis of making
the judgments about carrying values of assets and liabilities that are not readily apparent from other
sources. Actual results may differ from these estimates.
The estimates and underlying assumptions are reviewed on an ongoing basis. Revision to accounting
estimates are recognised in the period in which the estimate is revised if revision affects only that
period, or in the period of revision and future periods if the revision affects both current and future
periods.
The areas where various assumptions and estimates are significant to Group financial statements or
where judgments were exercised in application of accounting policies are as follows:
Notes
- defined benefit obligation 4.1- revaluation of property, plant and equipment 4.4- residual values and useful lives of property, plant and equipment 4.4- impairment 4.11- taxation 4.15- provisions and contingencies 4.18
4. SIGNIFICANT ACCOUNTING POLICIES
4.1 The accounting policies adopted in the preparation of these financial statements are consistent with
those of the previous financial year except as mentioned in note 2.3.
88 Annual Report 2011 Highnoon Laboratories Limited and its Subsidiary Company
4.2 Staff retirement benefits
Defined benefit plan
HNL operates an unfunded gratuity scheme for all of its permanent employees, under which benefits are
paid on cessation of employment subject to a minimum qualifying period of service.
Qualified actuaries have carried out the valuation as at 31 December 2011. The projected unit credit
method with the following significant assumptions was used for the valuation of this scheme:
2011 2010
- Discount rate 12.5% per annum 13% per annum- Expected rate of increase in salary 11.5% per 12% - Expected average remaining working life time 14 years 14 years
HNL's policy with regard to actuarial gains/losses is to follow minimum recommended approach under
IAS 19 "Employees Benefits" by which actuarial gains/losses exceeding 10 % of present value of
benefit obligation are amortized over a period of five years.
Defined contribution plan
The Group also operates a recognized provident fund scheme for all of its permanent employees in
accordance with the trust deed and rules made there under. Equal monthly contributions are made to the
fund by the Group and employees at the rate of 8.33% of basic salary and cost of living allowance.
Compensated leave absences
Provision for compensated absences is made to the extent of value of accumulated accrued leaves /
leave fare assistance of the employees at the balance sheet date as per entitlement on the basis of last
drawn salary. A maximum of 10 unavailed leaves are allowed to be carried forward for a maximum of
one year.
4.3 Foreign currency translation
All monetary assets and liabilities in foreign currency are translated at the rates of exchange prevailing
on the balance sheet date. Non-monetary assets and liabilities that are measured in terms of historical
cost in foreign currency are translated into rupees at exchange rates prevailing at the date of transaction.
Non-monetary assets and liabilities denominated in foreign currency that are stated at fair value are
translated into rupees at exchange rates prevailing at the date when fair values are determined.
Transactions in foreign currencies are converted into Pak rupees at exchange rates prevailing on the date
of transaction. All exchange gains/losses are taken to profit and loss account currently.
4.4 Trade and other payables
Trade and other payables are initially carried at fair value and subsequently at amortized cost using
effective interest rate method.
4.5 Property, plant and equipment
Owned operating assets
These are stated at cost or revalued amount less accumulated depreciation except for freehold land,
which is stated at revalued amount. Revaluation is carried out every five years unless earlier revaluation
is necessitated.
Depreciation is charged on reducing balance method at the rates mentioned in note 16.1 to write off the
annum per annum

Highnoon Laboratories Limited and its Subsidiary Company 89Annual Report 2011
cost / revalued amount of an asset over its estimated useful life. The assets' residual values and useful
lives are reviewed at each financial year end and adjusted, if its impact on depreciation is significant.
Full month's depreciation is charged on additions, while no depreciation is charged in the month of
disposal or deletion of assets. Surplus on revaluation of fixed assets relating to incremental depreciation
(net of deferred taxation) is transferred directly to unappropriated profit.
Gains and losses on disposal of fixed assets are included in income currently, except that the related
surplus on revaluation of fixed assets (net of deferred taxation) is transferred directly to unappropriated
profit.
Normal repairs and maintenance is charged to revenue as and when incurred, while major renewals and
replacements are capitalized if it is probable that the respective future economic benefits will flow to the
Group and the cost of the item can be measured reliably, and assets so replaced, if any, are retired.
Leasehold assets
Leases, where all the risks and rewards incidental to ownership of the leased assets have been
transferred to the Group, are classified as finance leases. Assets subject to finance lease are stated at the
lower of present value of minimum lease payments under the lease agreements and the fair value of the
leased assets at the commencement of lease, less accumulated depreciation and any identified
impairment loss.
The related rental obligations, net of finance costs, are included in liabilities against assets subject to
finance lease as referred to in note 8. The liabilities are classified as current and long term depending
upon the timing of the payment.
Each lease payment is allocated between the liability and finance costs so as to produce a constant
periodic rate of interest on the balance outstanding. The interest element of the rental is charged to
income over the lease term.
Assets acquired under finance lease are depreciated over the useful lives of assets on reducing balance
method at the rates given in note 16.1. The assets' residual values and useful lives are reviewed at each
financial year end and adjusted, if its impact on depreciation is significant. Depreciation of leased assets
is charged to profit and loss account. Depreciation on additions in leased assets is charged from the
month in which an asset is acquired while no depreciation is charged for the month in which the asset is
disposed off / transferred to freehold assets.
Capital work in progress
Capital work in progress is stated at cost less any identified impairment loss less any identified losses
and includes the expenditures on material, labour and appropriate overheads directly relating to the
project. These costs are transferred to fixed assets as and when assets are available for intended use.
4.6 Intangible assets and amortization
Intangible assets includes Intellectual Property, Rights, Trademarks and Software, which are non-
monetary assets without physical substance. These are recognized at cost, which comprises its purchase
price, non-refundable purchase taxes and any directly attributable expenditures.
After initial recognition an intangible asset is carried at its cost less accumulated amortization and any
identified impairment loss. Amortization is charged to the income on monthly basis by following the
straight line method over a maximum period of ten years. Amortization on additions is charged from the
month when the asset is put to use, while for disposals, no amortization is charged in the month of
disposal.
At each financial year end, the Group reviews the recoverable amounts of intangible assets to assess
90 Annual Report 2011 Highnoon Laboratories Limited and its Subsidiary Company
impairment loss. If such indication exists, impairment losses are recognized as an expense.
Subsequent expenditures on intangible assets are recognized as an expense when it is incurred unless
the expenditure will enable the asset to generate future economic benefits in excess of its originally
assessed standard of performance.
4.7 Deferred gain
Deferred gain arising on sale and lease back of assets is amortized on straight line basis over the lease
term.
4.8 Borrowing costs
Finance cost on long term liabilities / lease liabilities which are specifically obtained for the acquisition
of qualifying assets i.e. assets that take a substantial period of time to get ready for their intended use,
are capitalized up to the date of commissioning of respective asset. All other interest, mark-up and
expenses are charged to income in the period in which they are incurred.
4.9 Stock in trade
These are valued at the lower of cost and net realizable value. Cost is determined using the following
basis :-
Raw materials - on moving averageWork-in-process - at estimated manufacturing cost including appropriate
overheadsFinished goods- Imported - on moving average- Local - on annual average manufacturing cost including appropriate
overheads
Merchandise in transit / pledged - at invoice value plus other charges incurred thereon
Net realizable value signifies the estimated selling price in the ordinary course of business less
estimated costs necessary to make the sale.
4.10 Trade debts
These are initially carried at original invoice amount, which is the fair value of consideration to be
received in future and subsequently measure at amortized cost less impairment loss, if any. A provision
for impairment of trade debts is established when there is an objective evidence that the Group will not
be able to collect all amounts due according to the original terms of receivable.
4.11 Cash and cash equivalents
These are carried in balance sheet at cost. For the purpose of cash flow statement, cash and cash
equivalents comprise of cash in hand and balance with banks in current accounts.
4.12 Impairment
The carrying amount of the assets except for inventories are reviewed at each balance sheet date to
identify the circumstances indicating the occurrence of impairment loss or reversal of previously
recognized impairment losses. If any such indication exists, the recoverable amount of such asset is
estimated.
An impairment loss is recognized if the carrying amount of an asset or its cash-generating unit exceeds
Highnoon Laboratories Limited and its Subsidiary Company 91Annual Report 2011
its recoverable amount. A cash-generating unit is the smallest identifiable asset group that generates
cash flows that largely are independent from other assets and groups.
Where an impairment loss subsequently reverses, the carrying amount of such asset is increased to the
extent that it does not exceed the carrying amount that would have been determined, net of depreciation
and amortization, if no impairment loss has been charged. A reversal of the impairment loss is
recognized in income.
4.13 Revenue recognition
Revenue from local sales is recognized when risk and reward incidental to ownership are transferred i.e.
on dispatch of goods to the customers. Export goods are considered dispatched when bill of lading is
prepared for shipment to customers.
Service income is recognized when related services are rendered.
Return on bank deposits is accounted for on time proportion basis and other income is recognized on
accrual basis.
4.14 Transactions with related parties and transfer pricing
The Group under the direction of Securities and Exchange Commission of Pakistan's Notification SRO
66(I)/ 2003 dated 22 January 2003 adopted the following policies of transfer pricing for the
determination of arm's length prices with subsidiary company/associated companies/related parties
except for the assets sold to employees at written down value under the employee's car scheme as
approved by the Board of Directors.
- Associated companies / related parties Cost plus method
Parties are said to be related, if they are able to influence the operating and financial decisions of the
Company and vice versa.
4.15 Research and development cost
These costs are charged to revenue as and when incurred, except for any development costs which are
recognized as intangible assets when it is probable that the development project will be a success and
certain criteria, including commercial and technological feasibility have been met.
4.16 Taxation
Income tax on profit and loss for the year comprises current and deferred tax.
Current
The charge for current taxation is based on taxable income for the year determined in accordance with
Income Tax Ordinance, 2001 and prevailing tax rates after taking into account applicable tax credits and
rebates, if any. The charge for current tax also includes adjustments, where considered necessary, to
provision for tax made in previous years arising from assessments framed during the year for such
years.
Deferred
Deferred tax is recognized using the balance sheet liability method on all temporary differences between
the amounts attributed to assets and liabilities for financial reporting purposes and amounts used for
taxation purposes.
Deferred tax liabilities are recognized for all taxable temporary differences and deferred tax assets are

92 Annual Report 2011 Highnoon Laboratories Limited and its Subsidiary Company
recognized to the extent that it is probable that future taxable profits will be available against which the
deductible temporary differences, unused tax losses and tax credits can be utilized.
Carrying amount of deferred tax asset is reviewed at each balance sheet date and reduced to the extent
that it is no longer probable that the related tax benefit will be realized. Deferred tax is calculated at the
rates that are expected to apply to the period when differences reverse based on tax rates and tax laws
that have been enacted or substantively enacted by the balance sheet date.
Deferred tax is charged or credited in the income except for deferred tax asset/liability arising on
deficit/surplus on revaluation of fixed assets which is adjusted against the related surplus as per the
requirements of revised IAS 12 "Income Taxes".
4.17 Dividend
Dividend to shareholders is recognized as a liability in the period in which it is approved.
4.18 Financial instruments
These comprise financial assets and financial liabilities. Significant financial assets include trade debts,
advances and deposits, other receivables and cash and bank balances. Significant financial liabilities
include borrowings, trade and other payables, liabilities in respect of leased assets and mark up payable
on bank borrowings.
Financial assets and financial liabilities are recognized when the Group becomes a party to the
contractual provisions of the instrument and assets and liabilities are stated at fair value. The Company
derecognizes the financial asset and liabilities when it ceases to be a party to such contractual provisions
of the instruments. Any gain or loss on derecognizing of the financial assets and financial liabilities is
taken to profit and loss account currently. The particular measurement methods adopted are disclosed in
the individual policy statement associated with each item.
Offsetting of financial assets and financial liabilities
Financial assets and liabilities are offset and the net amount is reported in the balance sheet if the
Company has legally enforceable right to offset the recognized amounts and the Group intends to settle
either on a net basis or realize the asset and settle the liability simultaneously.
4.19 Provisions
A provision is recognized when the Group has a present legal or constructive obligation as a result of
past event and it is probable that an outflow of resources embodying economic benefits will be required
to settle the obligation of which reliable estimate can be made.

Highnoon Laboratories Limited and its Subsidiary Company 93Annual Report 2011
5.1 This represents the issuance of shares against the purchase of plant, machinery and other assets.
5.1
2011
RupeesNote
59,050,000
950,000
121,805,170
181,805,170
5. SHARE CAPITAL
Issued, subscribed and paid-up
5,905,000 Ordinary shares (2010: 5,905,000)of Rs.10 each fully paid in cash
95,000 (2010: 95,000) Ordinary sharesof Rs.10 each issued for considerationother than cash
12,180,517 (2010: 10,527,743) Ordianry shares of Rs.10 each issued as bonus shares
2010
Rupees
59,050,000
950,000
105,277,431
165,277,431
Surplus on revaluation of fixed assets as at 01 January
Note
2011
Rupees
2010
Rupees
Incremental depreciation relating to surplus on revaluationof fixed assets - transferred to unappropriated profit
Net of deferred tax
Related deferred tax liability
Incremental depreciation relating to surplus on revaluationof fixed assets - transferred to unappropriated profit
Surplus on revaluation of fixed assets as at 31 December
Less: Related deferred tax liability on:
Balance at the beginning of the year
10.1
6. SURPLUS ON REVALUATION OF FIXED ASSETS
217,133,314
(5,322,209)
(2,865,805)
(8,188,014)
208,945,300
28,658,050
(2,865,805)
25,792,245
183,153,055
226,231,108
(5,913,566)
(3,184,228)
(9,097,794)
217,133,314
31,842,278
(3,184,228)
28,658,050
188,475,264
6.1 This represent surplus arising on revaluation of freehold land and building on freehold land, plant and
machinery both owned and leased assets of HNL carried out in 1995, 1999, 2004 and 2007 respectively.
This has been adjusted by incremental depreciation arising due to revaluation net of deferred tax. The
latest revaluation of land was carried out on 19 January 2007 by M/S Surval which resulted in a surplus
of Rs. 67,922,000.
1,652,774
Outstanding at the beginningBonus shares issued during the year
Outstanding at the end
5.2 Reconciliation of issued, subscribed and paid-up capital
2011 2010
16,527,743
18,180,517
16,527,743
16,527,743
-
( Numbers of Shares)

94 Annual Report 2011 Highnoon Laboratories Limited and its Subsidiary Company
Note
2011
Rupees
2010
Rupees
Habib Bank LimitedFaysal Bank Limited
LONG TERM LOAN - SECURED7.
7.17.2
51,301,76348,645,000
80,617,05661,617,000
Less: Current portion shown under current liabilities 14 42,287,293
57,659,470
42,287,293
99,946,763
7.1 This loan has been obtained for the purpose of expansion and carries mark-up at the rate of three months
KIBOR plus 2.25% per annum. The effective mark-up charged during the year was 15.69% (2010:
14.73%) of the average outstanding loan facility. The amount outstanding as at 31 December 2011 is
repayable in 7 equal quarterly installments. This loan along with working capital facilities provided by
the bank are secured by way of first pari passu charge for Rs. 362 million on fixed assets and first joint
pari passu hypothecation charge of Rs. 230 million on stocks including but not limited to raw materials,
medicines, goods in process and finished goods of HNL.
7.2 The loan of Rs. 64.860 million has been obtained in 2009 for financing the acquisition of Blokium trade
mark and carries mark-up at the rate of three months KIBOR plus 2.75% per annum. The effective
mark-up charged during the year was 15.96% (2010: 15.73%) of the average outstanding loan amount.
The amount outstanding as at 31 December 2011 is repayable in 15 equal quarterly installments. This
loan along with working capital facilities provided by the bank are secured by way of first pari passu
charge of Rs. 69.25 million on the present and future current assets of HNL and first pari passu charge
of Rs. 83.65 million on present and future fixed assets of HNL.
Not later than one yearLater than one year but not later than five years
1,551,3404,688,386
6,239,726
15,933,78727,903,144
43,836,931
17,485,12732,591,530
50,076,657
2010Financecost for
future periods
Principaloutstanding
Minimumlease
payments
Rupees
8. LIABILITIES AGAINST ASSETS SUBJECT TO FINANCE LEASE
Present value of minimum lease paymentsLess: Current portion shown under current liabilities
26,313,22415,016,952
11,296,272
2,761,9341,125,400
3,887,334
15,016,95211,296,272
26,313,224
17,778,88612,421,672
30,200,558
2011Financecost for
future periods
Principaloutstanding
Minimumlease
payments
Not later than one yearLater than one year but not later than five years
Rupees
14
43,836,93115,933,787
27,903,144
2011
Rupees
2010
Rupees
Highnoon Laboratories Limited and its Subsidiary Company 95Annual Report 2011
Discounting factor
Period of lease
Security deposits
Salient features of the leases are as follows:
14.50% - 18.61%
36 months
5% - 10%
2011
14.50% - 16.50%
36 months
5% - 10%
2010
HNL has entered into finance lease arrangements with various financial institutions for lease of plant and
machinery and vehicles as shown in note 16.1. Liabilities under these arrangements are payable in monthly
installments. Above mark-up rates are used as discounting factor to determine the present value of minimum
lease payments.
All lease agreements carry renewal option at the end of lease period and intends to exercise its option to
purchase the leased assets upon completion of the respective lease terms. Residual value of the leased assets
has already been paid at the inception of the lease in the form of security deposit. There are no financial
restrictions imposed by lessors. Taxes, repairs, replacements and insurance costs are borne by the lessee.
HNL
10.
Taxation
Gratuity
DEFERRED LIABILITIES
96,861,972
168,994,803
265,856,775
10.1
10.2
Taxable/(deductible) temporary differencesarising in respect of :
10.1
Surplus on revaluation of fixed assets
Accelerated tax depreciation
Finance lease
Provision for doubtful debts
Provision for gratuity
25,792,245
83,577,293
11,753,678
(4,758,622)
(19,502,622)
6
110,972,716
138,544,564
249,517,280
28,658,050
76,918,941
10,154,346
(4,758,621)
-
LONG TERM ADVANCES9.
These represent advances taken from employees against future sale of vehicles as per policy.HNL
Balance at 31 December
Less: Current portion
38,380,435
23,438,157
14,942,278
14
2011
Rupees
2010
RupeesNote
2011
Rupees
2010
RupeesNote
18,634,165
8,045,177
10,588,988
96,861,972 110,972,716

96 Annual Report 2011 Highnoon Laboratories Limited and its Subsidiary Company
The following amounts have been charged to profit and loss
account during the year in respect of gratuity scheme:
10.2.3
Current service cost
Interest cost
Actuarial losses - charge for the year
Movement in the liability for un - funded defined benefit obligations10.2.2
Present value of defined benefit obligations as at 01 January
Current service costs
Interest cost
Non-vested past service cost
Benefits due but not paid
Benefits paid during the year
Actuarial (gain) / losses recognized
Liability for defined benefit obligations at 31 December
18,897,089
20,670,495
1,114,045
40,681,629
20,670,495
1,890,859
(768,351)
(9,220,028)
(1,649,876)
188,823,998
18,607,786
15,932,525
1,252,301
35,792,612
18,897,089 18,607,786
159,003,810 132,771,040
15,932,525
-
(1,011,362)
(10,480,480)
3,184,301
159,003,810
10.2.1 The following is the reconciliation of movement in the net recognized liability for gratuity:
Liability as at 01 January
Amount recognized during the year
Benefit payments made by HNL
Liability as at 31 December
The net value of defined benefit obligation as at valuation date wasas follows:
10.2
Present value of defined benefit obligation
Unrecognized actuarial losses
Non-vested past service cost
Benefits due but not paid
Net liability as at 31 December
10.2.3
138,544,564
40,681,629
(10,231,390)
168,994,803
113,273,025
35,792,612
(10,521,073)
138,544,564
188,823,998
(18,706,687)
(1,890,859)
768,351
168,994,803
159,003,810
(21,470,608)
-
1,011,362
138,544,564
2011
Rupees
2010
Rupees
10.2.2
Note

Highnoon Laboratories Limited and its Subsidiary Company 97Annual Report 2011
11.1 Workers' Profit Participation Fund
Balance at the beginning of the yearAdd: provision for the year
5,745,4367,832,38829
5,501,0015,745,435
Add: interest on funds utilized by the HNL
13,577,824
70,110
13,647,934
30
11,246,436
268,771
11,515,207
Mark-up @ 18.75% (2010: 18.75%) is being provided on unpaid balance of the fund in accordance
with the rules of the Fund.
5,815,545
7,832,389
5,769,771
5,745,436
Less: Paid during the year to the trustees of the fund
2011
Rupees
2010
RupeesNote
11.1
Trade creditorsBills payableAdvances from customersAccrued expensesIncome tax deducted at sourceWorkers Profit Participation FundWorkers' Welfare FundPayable to Central Research FundPayable to Provident Fund TrustUnclaimed dividends Payable to Employees Welfare Trust
11. TRADE AND OTHER PAYABLES
61,183,56816,936,42636,453,54252,850,8372,196,6867,832,389
-1,455,9522,695,8155,037,252
231,800
186,874,267
37,060,3649,954,636
22,141,51220,001,666
1,957,5055,745,436
15,660,4521,070,0932,267,8224,497,491
242,567
120,599,544
Present value of defined benefits obligations
10.2.4
Experience adjustment
arising on plan liabilities(gain) / losses
Historical information for un-funded defined benefit obligation
2007Rupees
2008Rupees
2011Rupees
2010Rupees
90,159,674
4,774,683
115,195,393
8,415,367
188,823,998
(1,649,876)
159,003,810
3,184,301
132,771,040
(5,348,203)
2009Rupees

98 Annual Report 2011 Highnoon Laboratories Limited and its Subsidiary Company
12. MARKUP PAYABLE ON SECURED LOANS
13. SHORT TERM BANK BORROWINGS - SECURED
On long term loansOn short term borrowings
Running finance
Import credit
3,689,283
6,746,787
10,436,070
166,291,136
-
166,291,136
13.1 & 13.2
13.3
5,397,086
15,147,320
20,544,406
398,705,155
34,446,947
433,152,102
13.1 Short term running finances are availed from various banks against aggregate sanctioned limit of Rs. 715
million (2010: Rs. 655 million) including Rs. 80 million sanctioned as sub limit of import credit. These
facilities have various maturity dates upto 31 October 2012 and renewable on the date of maturity. These
facilities carry mark-up rates ranging from one month KIBOR to six months KIBOR plus 150 to 175 basis
points (2010: one month KIBOR to three months KIBOR plus 150 to 185 basis points) per annum. These
facilities along with import credit are secured by way of first pari passu charge for Rs. 543 million on
fixed assets and first joint pari passu hypothecation charge of Rs. 732 million on stocks including but not
limited to raw materials, medicines, goods in process and finished goods of HNL.
13.2 Out of total outstanding loan, an amount of Rs.35,000,000 (2010:Rs. 15,000,000) represents ERF II
facility obtained from a commercial bank and carries mark up at 10% per annum (2010:10% per annum).
13.3 Aggregate sanctioned import credit facilities negotiated with various banks amount to Rs. 673 million
including Rs. 243 million sanctioned as sublimit of short term running finance (2010: Rs. 530 million
including Rs. 350 million sanctioned as sublimit). These facilities carry mark-up rates ranging from one
month KIBOR to six months KIBOR plus 125 to 150 basis points (2010: one month KIBOR to three
months KIBOR plus 140 to 150 basis points) per annum. These available facilities are secured by way of
joint pari passu, ranking hypothecation charge over present and future current assets of HNL as
mentioned above in Note 13.1 and lien on export documents or firm contracts and have various maturity
dates upto 31 October 2012.
2011
Rupees
2010
RupeesNote
2010
Rupees
2011
RupeesNote
14. CURRENT PORTION OF LONG TERM LIABILITIES
Long term loansLiabilities against assets subject to finance leaseLong term advances
42,287,29315,016,95223,438,157
80,742,402
789
42,287,29315,933,7878,045,177
66,266,257

Highnoon Laboratories Limited and its Subsidiary Company 99Annual Report 2011
16. PROPERTY, PLANT AND EQUIPMENT
Operating assets (owned)
Operating assets (leased)
Capital work-in-progress
16.1
16.1
16.2
641,523,276
59,895,163
13,632,715
715,051,154
Commitments
Commitments against irrevocable letters of credit include:
Raw materials
Packing materials
- While finalizing of HNL income tax assessments for the tax year 2005, income tax authorities made
certain add backs with aggregate tax impact of Rupees 12,600,136. HNL has filed appeal before
Commission Inland Revenue ( Appeals) which is pending for adjudication, pending finalization of
appeal, no provision has been made by HNL, as the management expects a favorable outcome of such
appeal.
- Bank guarantees issued on behalf of HNL aggregate to Rs. 4.620 million (2010: Rs 4.620 million).
- HNL has not acknowledged the demand relating to sales tax / central excise duty amounting to
Rs.12.057 million (2010: Rs. 12.057 million) as debt as the matter is pending for adjudication. An
amount of Rs. 10.086 million (2010: Rs. 10.086 million) has been deposited under protest and is shown
under other receivables in note 21
- Facilities of letters of guarantee amounting to Rs. 20 million (2010: Rs. 20 million) are available to
HNL under hypothecation / pledge of stocks and on present and future current assets and property, plant
and equipment of HNL.
15. CONTINGENCIES AND COMMITMENTS
Contingencies
17,017100,988
621,267,311
75,117,070
13,483,821
709,868,202
2,423100,981
20102011
Rupees‘000’
2010
Rupees
2011
RupeesNote
Rupees‘000’

100 Annual Report 2011 Highnoon Laboratories Limited and its Subsidiary Company
16.1
Pro
perty, P
lan
t an
d E
qu
ipm
ent
Recon
ciliation of th
e carrying am
oun
ts at the b
eginnin
g and end
of the year is as follows:
At 01 Jan
uary 2011
Cost
Accum
ulated Depreciation
Net B
ook Value
Movem
ent d
urin
g the year
Opening net book value
Addition - cost
Transfer from
leasehold assets
Cost
Depreciation
Dispo
sals
Cost
Depreciation
Depreciation charge for the year
Closing net book
value
At 31 D
ecemb
er 2011
Cost
Accum
ulated Depreciation
Net book balue
Depreciation rates
149,820,000
-
149,820,000
149,820,000
--------
149,820,000
149,820,000
-
149,820,000
0%
251,437,991
111,993,675
139,444,316
139,444,316
22,740,078
------
14,133,932
148,050,462
274,178,069
126,127,607
148,050,462
10%
458,628,852
201,875,151
256,753,701
256,753,701
22,301,411
------
25,880,933
253,174,179
480,930,263
227,756,084
253,174,179
10%
13,366,879
4,946,654
8,420,225
8,420,225
4,712,711
------
963,776
12,169,160
18,079,590
5,910,430
12,169,160
10%
13,150,198
7,345,712
5,804,486
5,804,486
1,247,460
------
602,173
6,449,773
14,397,658
7,947,885
6,449,773
10%
23,544,474
13,498,508
10,045,966
10,045,966
198,605
------
1,007,335
9,237,236
23,743,079
14,505,843
9,237,236
10%
49,773,910
19,826,843
29,947,067
29,947,067
2,092,006
---
558,765
240,442
318,323
3,119,438
28,601,312
51,307,151
22,705,839
28,601,312
10%
45,343,754
24,466,390
20,877,364
20,877,364
6,904,000
45,430,506
26,272,948
19,157,558
14,610,414
7,224,256
7,386,158
5,727,378
33,825,386
83,067,846
49,242,460
33,825,386
20%
52,806
48,552
4,254
4,254
-------425
3,829
52,806
48,977
3,829
10%
204,990
72,802
132,188
132,188
-------
13,219
118,969
204,990
86,021
118,969
10%
106,100
88,356
17,744
17,744
60,000
------
4,774
72,970
166,100
93,130
72,970
10%
1,005,429,954
384,162,643
621,267,311
60,256,271
45,430,506
26,272,948
19,157,558
15,169,179
7,464,698
7,704,481
51,453,383
641,523,276
1,095,947,552
454,424,276
621,267,311
641,523,276
18,124,623
9,089,705
9,034,918
9,034,918
-------
903,492
8,131,426
18,124,623
9,993,197
8,131,426
10%
112,218,392
46,136,240
66,082,152
66,082,152
17,860,500
(45,430,506)
(26,272,948)
(19,157,558)
---
13,021,357
51,763,737
84,648,386
32,884,649
51,763,737
20%
130,343,015
55,225,945
75,117,070
75,117,070
17,860,500
(45,430,506)
(26,272,948)
(19,157,558)
---
13,924,849
59,895,163
102,773,009
42,877,846
59,895,163
1,135,772,969
439,388,588
696,384,381
78,116,771
---
15,169,179
7,464,698
7,704,481
65,378,232
701,418,439
1,198,720,561
497,302,122
701,418,439
696,384,381
La
nd
- fre
eh
old
Bu
ildin
g o
nfre
eh
old
la
nd
Pla
nt a
nd
ma
ch
ine
ryL
ab
ora
tory
eq
uip
me
nt
Fu
rnitu
rea
nd
fixtu
res
Ele
ctric
a
nd
ga
sa
pp
lian
ce
s
Offic
e
eq
uip
me
nt
Ve
hic
les
Lib
rary
b
oo
ks
Ne
on
s
ign
Arm
s a
nd
am
mu
nitio
n
To
tal
op
era
ting
fixe
d a
ss
ets
- ow
ne
d
Pla
nt
an
dm
ac
hin
ery
Ve
hic
les
To
tal
As
se
ts
su
bje
ct to
fin
an
ce
le
as
e
To
tal
op
era
ting
fixe
d
as
se
ts
As
se
ts s
ub
jec
t to fin
an
ce
lea
se
To
tal o
pe
ratin
g fix
ed
as
se
ts - o
wn
ed
Ye
ar e
nd
ed
31
De
ce
mb
er 2
011
------------------------------------------------------------------------------------------------------------------------------ Ru
pe
es
--------------------------------------------------------------------------------------------------------------------------------------------------------------------------

Highnoon Laboratories Limited and its Subsidiary Company 101Annual Report 2011
At
01 J
anu
ary
2010
Cos
t
Acc
umul
ated
Dep
reci
atio
n
Net
Boo
k V
alue
Mov
emen
t d
uri
ng
the
year
Ope
nin
g ne
t bo
ok v
alue
Add
itio
n -
cost
Dep
reci
atio
n ch
arge
for
the
year
Clo
sing
net
boo
k va
lue
At
31 D
ecem
ber
201
0
Cos
t
Acc
umul
ated
Dep
reci
atio
n
Net
boo
k ba
lue
Dep
reci
atio
n ra
tes
149,
820,
000
-
149,
820,
000
149,
820,
000
- -
149,
820,
000
149,
820,
000
-
149,
820,
000
0%
224,
099,
955
99,
227,
024
124,
872,
931
124,
872,
931
27,
338,
036
12,
766,
651
139,
444,
316
251,
437,
991
111,
993,
675
139,
444,
316
10%
402,
725,
034
174,
731,
620
227,
993,
414
227,
993,
414
46,0
66,8
18
23,8
90,5
64
256,
753,
701
458,
628,
852
201,
875,
151
256,
753,
701
10%
12,1
66,8
79
4,02
2,18
5
8,14
4,69
4
8,14
4,69
4
1,20
0,00
0
924,
469
8,42
0,22
5
13,3
66,8
79
4,94
6,65
4
8,42
0,22
5
10%
13,1
26,2
83
6,71
1,09
9
6,41
5,18
4
6,41
5,18
4
125,
500
640,
496
5,80
4,48
6
13,1
50,1
98
7,34
5,71
2
5,80
4,48
6
10%
23,7
75,4
01
12,7
31,1
67
11,0
44,2
34
11,0
44,2
34
172,
248
1,11
1,39
7
10,0
45,9
66
23,5
44,4
74
13,4
98,5
08
10,0
45,9
66
10%
48,6
43,6
25
16,7
45,8
68
31,8
97,7
57
31,8
97,7
57
1,68
4,26
0
3,26
6,54
3
29,9
47,0
67
49,7
73,9
10
19,8
26,8
43
29,9
47,0
67
10%
41,8
92,7
90
20,5
21,2
39
21,3
71,5
51
21,3
71,5
51
3,84
1,800
5,38
7,695
20,8
77,3
64
45,3
43,7
54
24,4
66,3
90
20,8
77,3
64
20%
52,8
06
48,0
79
4,72
7
4,72
7
- 473
4,25
4
52,8
06
48,5
52
4,25
4
10%
204,
990
58,1
14
146,
876
146,
876
-
14,6
88
132,
188
204,
990
72,8
02
132,
188
10%
106,
100
86,3
86
19,7
14
19,7
14 -
1,97
0
17,7
44
106,
100
88,3
56
17,7
44
10%
916,
613,
863
334,
882,
781
581,
731,
082
581,
731,
082
80,
428,
662
48,
004,
946
621,
267,
311
1,00
5,42
9,95
4
384,
162,
643
621,
267,
311
27,9
61,6
23
11,1
69,9
71
16,7
91,6
52
16,7
91,6
52
-
1,17
2,7
01
9,03
4,9
18
18,1
24,6
23
9,08
9,7
05
9,03
4,9
18
10%
118,
624,
652
41,7
18,9
44
76,9
05,7
08
76,9
05,7
08
15,3
94,0
00
14,5
89,3
17
66,0
82,1
52
112,
218,
392
46,1
36,2
40
66,0
82,1
52
20%
146,
586,
275
52,8
88,9
15
93,6
97,3
60
93,6
97,3
60
15,3
94,0
00
15,7
62,0
18
75,1
17,0
70
130,
343,
015
55,2
25,9
45
75,1
17,0
70
1,06
3,200
,138
387,
771
,696
675,
428
,442
675,
428
,442
95,8
22,6
62
63,7
66,9
64
696,
384
,381
1,13
5,772
,969
439,
388
,588
696,
384
,381
La
nd
-
fre
eh
old
Bu
ild
ing
on
fre
eh
old
la
nd
Pla
nt
an
dm
ac
hin
ery
La
bo
rato
rye
qu
ipm
en
tF
urn
itu
rea
nd
fix
ture
s
Ele
ctr
ic
an
d g
as
ap
plia
nc
es
Off
ice
e
qu
ipm
en
tV
eh
icle
sL
ibra
ry
bo
ok
sN
eo
n
sig
nA
rms
an
da
mm
un
itio
n
To
tal
op
era
tin
gfi
xe
d a
ss
ets
- o
wn
ed
Pla
nt
an
dm
ac
hin
ery
Ve
hic
les
To
tal
As
se
ts
su
bje
ct
to
fin
an
ce
le
as
e
To
tal
op
era
tin
gfi
xe
d
as
se
ts
As
se
ts s
ub
jec
t to
fin
an
ce
le
as
eTo
tal o
pe
rati
ng
fix
ed
as
se
ts -
ow
ne
dY
ea
r e
nd
ed
31
De
ce
mb
er
20
11
----
----
----
----
----
----
----
----
----
----
----
----
----
----
----
----
----
----
----
----
----
----
----
----
----
----
----
----
----
----
----
-- R
up
ee
s -
----
----
----
----
----
----
----
----
----
----
----
----
----
----
----
----
----
----
----
----
----
----
----
----
----
----
----
----
----
----
----
----
----
----
----
----
----
----
----
----
----
----
-
Tra
nsfe
r fr
om l
ease
hold
ass
ets
C
ost
D
epre
ciat
ion
- - -
- - -
9,83
7,00
0
3,25
2,96
7
6,58
4,03
3
- - -
- - -
- - -
- - -
21,8
00,2
60
10,1
72,0
21
11,6
28,2
39
- - -
- - -
- - -
31,
637,
260
13,
424,
988
18,
212,
272
(9,8
37,0
00)
(3,2
52,9
67)
(6,5
84,0
33)
(21,
800,
260)
(10,
172,
021)
(11,
628,
239)
(31,
637,
260)
(13,
424,
988)
(18,
212,
272)
- - -
Dis
posa
ls
C
ost
D
epre
ciat
ion
- - -
- - -
- - -
- - -
101,
585
5,88
3
95,7
02
403,
175
344,
056
59,1
19
553,
975
185,
568
368,
407
22,1
91,0
96
11,6
14,5
65
10,5
76,5
31
- - -
- - -
- - -
23,
249,
831
12,1
50,0
72
11,0
99,7
59
- - -
- - -
- - -
23,2
49,8
31
12,1
50,0
72
11,0
99,7
59

102 Annual Report 2011 Highnoon Laboratories Limited and its Subsidiary Company
Depreciation charge has been allocated as under:
Cost of sales
Administrative and general expenses
Distribution, selling and promotional expenses
16.1.1
16.1.2 HNL Land, building on freehold land and plant and machinery were first revalued on 30 June 1995,
resulting in a surplus of Rs. 68,809,377. Subsequently land, building on freehold land and plant and
machinery were revalued on 30 June 1999 resulting in a surplus of Rs. 48,731,393. Land, building
on freehold land and plant and machinery were again revalued on 31 May 2004 and 31 December
2004 respectively by M/s Hamid Mukhtar & Co., which resulted in a surplus of Rs. 168,473,204
over the net book value of assets. The latest revaluation of land was carried out on 19 January 2007
by M/S Surval which resulted in a surplus of Rs. 67,922,000.
2011
Rupees
2010
Rupees
24
26
27
Note
Had the assets not been revalued the carrying valueswould have been:
16.1.3
Land - Freehold
Building on freehold land
Plant and machinery (Owned)
Plant and machinery (Leased)
43,569,519
9,749,342
12,059,371
65,378,232
14,566,828
119,899,858
210,347,030
5,417,053
350,230,769
2011
Rupees
2010
Rupees
40,552,316
10,388,046
12,826,602
63,766,964
14,566,828
108,165,868
209,167,979
6,018,948
337,919,623
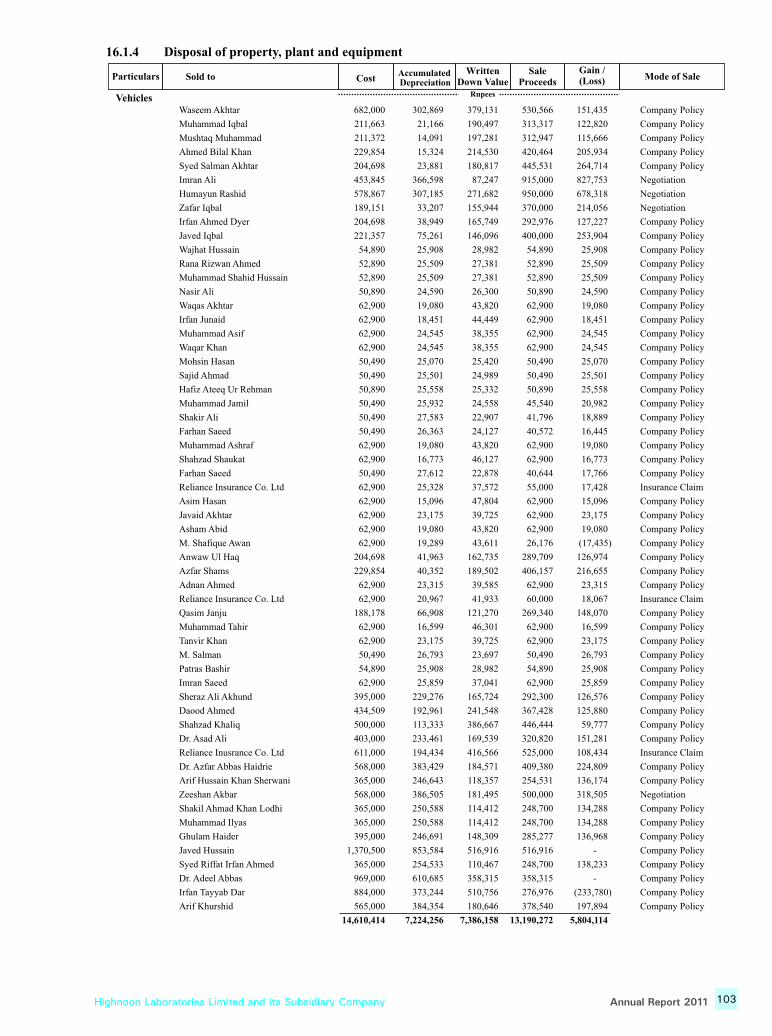
Highnoon Laboratories Limited and its Subsidiary Company 103Annual Report 2011
16.1.4 Disposal of property, plant and equipment
Particulars Sold to CostAccumulated Depreciation
Written Down Value
Sale Proceeds
Gain / (Loss) Mode of Sale
RupeesVehiclesWaseem Akhtar
Muhammad Iqbal
Mushtaq Muhammad
Ahmed Bilal Khan
Syed Salman Akhtar
Imran Ali
Humayun Rashid
Zafar Iqbal
Irfan Ahmed Dyer
Javed Iqbal
Wajhat Hussain
Rana Rizwan Ahmed
Muhammad Shahid Hussain
Nasir Ali
Waqas Akhtar
Irfan Junaid
Muhammad Asif
Waqar Khan
Mohsin Hasan
Sajid Ahmad
Hafiz Ateeq Ur Rehman
Muhammad Jamil
Shakir Ali
Farhan Saeed
Muhammad Ashraf
Shahzad Shaukat
Farhan Saeed
Reliance Insurance Co. Ltd
Asim Hasan
Javaid Akhtar
Asham Abid
M. Shafique Awan
Anwaw Ul Haq
Azfar Shams
Adnan Ahmed
Reliance Insurance Co. Ltd
Qasim Janju
Muhammad Tahir
Tanvir Khan
M. Salman
Patras Bashir
Imran Saeed
Sheraz Ali Akhund
Daood Ahmed
Shahzad Khaliq
Dr. Asad Ali
Reliance Inusrance Co. Ltd
Dr. Azfar Abbas Haidrie
Arif Hussain Khan Sherwani
Zeeshan Akbar
Shakil Ahmad Khan Lodhi
Muhammad Ilyas
Ghulam Haider
Javed Hussain
Syed Riffat Irfan Ahmed
Dr. Adeel Abbas
Irfan Tayyab Dar
Arif Khurshid
682,000
211,663
211,372
229,854
204,698
453,845
578,867
189,151
204,698
221,357
54,890
52,890
52,890
50,890
62,900
62,900
62,900
62,900
50,490
50,490
50,890
50,490
50,490
50,490
62,900
62,900
50,490
62,900
62,900
62,900
62,900
62,900
204,698
229,854
62,900
62,900
188,178
62,900
62,900
50,490
54,890
62,900
395,000
434,509
500,000
403,000
611,000
568,000
365,000
568,000
365,000
365,000
395,000
1,370,500
365,000
969,000
884,000
565,000
14,610,414
302,869
21,166
14,091
15,324
23,881
366,598
307,185
33,207
38,949
75,261
25,908
25,509
25,509
24,590
19,080
18,451
24,545
24,545
25,070
25,501
25,558
25,932
27,583
26,363
19,080
16,773
27,612
25,328
15,096
23,175
19,080
19,289
41,963
40,352
23,315
20,967
66,908
16,599
23,175
26,793
25,908
25,859
229,276
192,961
113,333
233,461
194,434
383,429
246,643
386,505
250,588
250,588
246,691
853,584
254,533
610,685
373,244
384,354
7,224,256
379,131
190,497
197,281
214,530
180,817
87,247
271,682
155,944
165,749
146,096
28,982
27,381
27,381
26,300
43,820
44,449
38,355
38,355
25,420
24,989
25,332
24,558
22,907
24,127
43,820
46,127
22,878
37,572
47,804
39,725
43,820
43,611
162,735
189,502
39,585
41,933
121,270
46,301
39,725
23,697
28,982
37,041
165,724
241,548
386,667
169,539
416,566
184,571
118,357
181,495
114,412
114,412
148,309
516,916
110,467
358,315
510,756
180,646
7,386,158
530,566
313,317
312,947
420,464
445,531
915,000
950,000
370,000
292,976
400,000
54,890
52,890
52,890
50,890
62,900
62,900
62,900
62,900
50,490
50,490
50,890
45,540
41,796
40,572
62,900
62,900
40,644
55,000
62,900
62,900
62,900
26,176
289,709
406,157
62,900
60,000
269,340
62,900
62,900
50,490
54,890
62,900
292,300
367,428
446,444
320,820
525,000
409,380
254,531
500,000
248,700
248,700
285,277
516,916
248,700
358,315
276,976
378,540
13,190,272
151,435
122,820
115,666
205,934
264,714
827,753
678,318
214,056
127,227
253,904
25,908
25,509
25,509
24,590
19,080
18,451
24,545
24,545
25,070
25,501
25,558
20,982
18,889
16,445
19,080
16,773
17,766
17,428
15,096
23,175
19,080
(17,435)
126,974
216,655
23,315
18,067
148,070
16,599
23,175
26,793
25,908
25,859
126,576
125,880
59,777
151,281
108,434
224,809
136,174
318,505
134,288
134,288
136,968
-
138,233
-
(233,780)
197,894
5,804,114
Company Policy
Company Policy
Company Policy
Company Policy
Company Policy
Negotiation
Negotiation
Negotiation
Company Policy
Company Policy
Company Policy
Company Policy
Company Policy
Company Policy
Company Policy
Company Policy
Company Policy
Company Policy
Company Policy
Company Policy
Company Policy
Company Policy
Company Policy
Company Policy
Company Policy
Company Policy
Company Policy
Insurance Claim
Company Policy
Company Policy
Company Policy
Company Policy
Company Policy
Company Policy
Company Policy
Insurance Claim
Company Policy
Company Policy
Company Policy
Company Policy
Company Policy
Company Policy
Company Policy
Company Policy
Company Policy
Company Policy
Insurance Claim
Company Policy
Company Policy
Negotiation
Company Policy
Company Policy
Company Policy
Company Policy
Company Policy
Company Policy
Company Policy
Company Policy

104 Annual Report 2011 Highnoon Laboratories Limited and its Subsidiary Company
16.2 CAPITAL WORK - IN - PROGRESS (CWIP)
Civil works
Plant and machinery - owned
Advances to suppliers
16.2.1 Movement of CWIP is as follows:
Civil works
Plant and machinery - owned
Advance for purchase of vehicles
Opening balance as at 01 January
Addition made during the year
16.2.1
Note
2011
Rupees
2010
Rupees
13,281,988
350,727
13,632,715
13,483,821
24,784,942
22,216,721
-
-
10,758,094
350,727
13,483,821
37,198,552
15,714,119
30,971,719
2,375,000
2,375,000
Capitalized during the year
Vehicles - leased
Civil works
Plant and machinery - owned
47,001,663
(2,375,000)
(22,261,048)
(22,216,721)
49,060,838
(810,000)
Closing balance as at 31 December
(46,852,769)
13,632,715
(72,775,569)
13,483,821
(19,374,724)
(52,590,845)
Particulars Sold to CostAccumulated Depreciation
Written Down Value
Sale Proceeds
Gain / (Loss) Mode of Sale
RupeesComputerHP Lase Jet 1100
HP Compaq 2214
HP Compaq 2572 AI
LG Monitor 454 V
HP Compaq 2200
HP VP6325
HP Laser Jet 1100
HP Compaq 6730s
Star 505 reader +Controller
Scrap
Scrap
Scrap
Scrap
Scrap
Scrap
Scrap
Insurance claim
Scrap
23,500
67,500
67,500
7,950
67,500
152,000
20,000
72,815
80,000
558,765
15,169,179
23,249,831
14,922
34,891
33,705
4,947
32,816
73,897
9,060
6,554
29,650
240,442
7,464,698
12,150,072
8,578
32,609
33,795
3,003
34,684
78,103
10,940
66,261
50,350
318,323
7,704,481
11,099,759
-
-
-
-
-
-
-
45,000
-
45,000
13,235,272
17,880,429
(8,578)
(32,609)
(33,795)
(3,003)
(34,684)
(78,103)
(10,940)
(21,261)
(50,350)
(273,323)
5,530,791
6,780,670
2011
2010
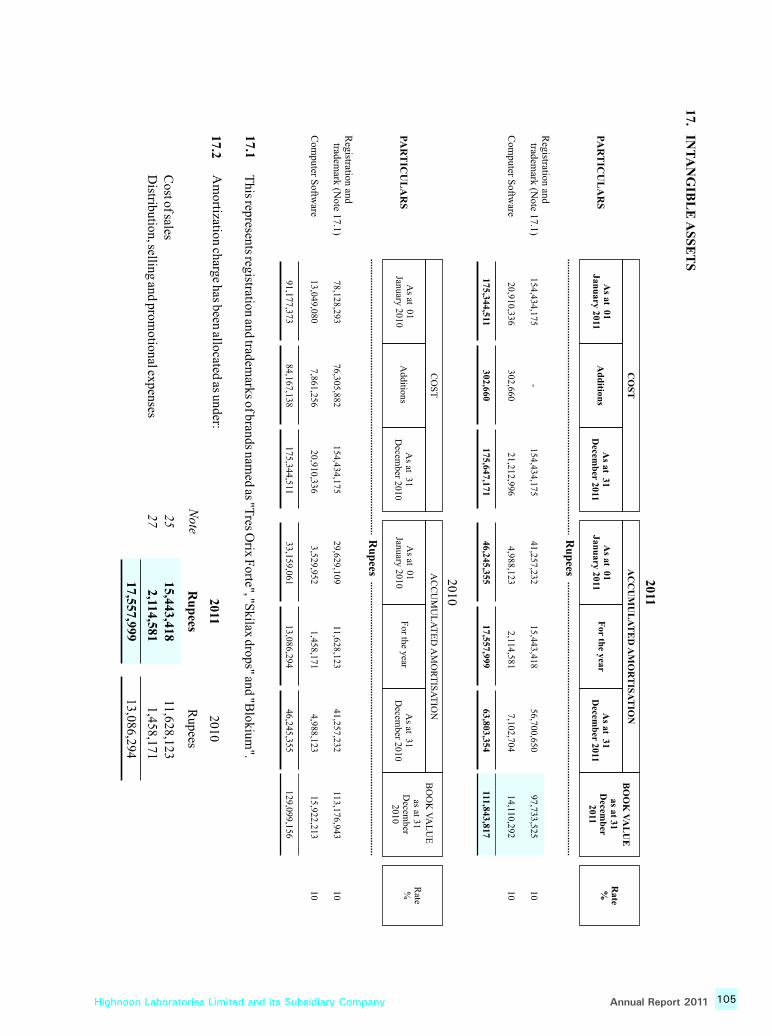
Highnoon Laboratories Limited and its Subsidiary Company 105Annual Report 2011
15,443,418
2,114,581
17,557,999
11,628,123
1,458,171
13,086,294
25
27
This represents registration and tradem
arks of brands named as "T
res Orix F
orte", "Skilax drops" and "B
lokium".
Am
ortization charge has been allocated as under:
Cost of sales
Distribution, selling and prom
otional expenses
113,176,943
15,922,213
129,0
99,15
6
41,2
57,232
4,9
88,123
46,245
,355
11,628,1
23
1,458,17
1
13,08
6,2
94
29,629
,109
3,5
29,952
33,159
,061
154,434
,175
20,91
0,3
36
175,3
44,511
76,305
,882
7,861,256
84,167,138
17.1
17.IN
TA
NG
IBL
E A
SS
ET
S
Registration
and
tradem
ark (Note 17
.1)
Com
puter S
oftware
1010
97,733,525
14,110
,292
111,843,8
17
Registration
and
tradem
ark (Note 17
.1)
Com
puter S
oftware
1010
PA
RT
ICU
LA
RS
PA
RT
ICU
LA
RS
For th
e year
AC
CU
MU
LA
TE
D A
MO
RT
ISA
TIO
NB
OO
K V
AL
UE
as at 31
Decem
ber
2011
CO
ST
As a
t 31D
ecemb
er 2011
Ad
dition
s
Rate %
Ru
pees
As at 0
1Jan
uary 20
11A
s at 31
Decem
ber 2011
As at 01
Janu
ary 2011
154,434,175
20,9
10,336
175,344,511
302,660
302,6
60
-154
,434,1
75
21,212,9
96
175,647,17
1
56,700,650
7,102,7
04
63,803,3
54
15,4
43,41
8
2,11
4,581
17,557,999
41,25
7,2
32
4,988,1
23
46,245,3
55
For the year
BO
OK
VA
LU
E
as at 31
Decem
ber 2010
CO
ST
As at 31
Decem
ber 2010
Additions
Rate %
Ru
pees
As at 0
1January 201
0A
s at 31
Decem
ber 2010A
s at 01Jan
uary 2
010
78,128,293
13,049,0
80
91,1
77,373
17.2
Note
2011
Ru
pees
2010
Rupees
2011
2010
AC
CU
MU
LA
TE
D A
MO
RT
ISA
TIO
N

106 Annual Report 2011 Highnoon Laboratories Limited and its Subsidiary Company
2011
Rupees
2010
Rupees18. STOCK IN TRADE
Raw materials
In hand
In transit
218,192,744
39,165,327
268,517,105
61,441,556
Packing material257,358,071
In hand 68,481,126
In transit
With third party
-
54,046
329,958,661
67,795,955
571,642
2,204,874
Work in process
68,535,172
39,820,419
Finished goods in hand 152,766,762
70,572,471
59,384,189
180,929,312
518,480,424 640,844,633
20. ADVANCES, DEPOSITS AND PREPAYMENTS
Advances - considered good
Staff against:
Suppliers
Expenses
Salary
Deposits:
Securities
Bank guarantee margin
Prepayments
15,305,054
4,524,986
22,068,734
5,678,000
1,558,085
2,001,233
51,136,092
9,244,792
3,701,970
8,257,293
5,731,003
4,026,920
2,752,163
33,714,141
2011
Rupees
2010
Rupees
19. TRADE DEBTS - Considered good
Unsecured
Secured - against letters of credit
Due from related parties
Route - 2 Health (Private) Limited 19.1
Note
19.1 The amount due is in the normal course of business and interest free.
OthersLess: Provision for doubtful debts
12,258,928
511,850
42,936,341
55,167,872
(539,247)
7,172,211
3,246,697
32,227,636
42,107,297
(539,247)
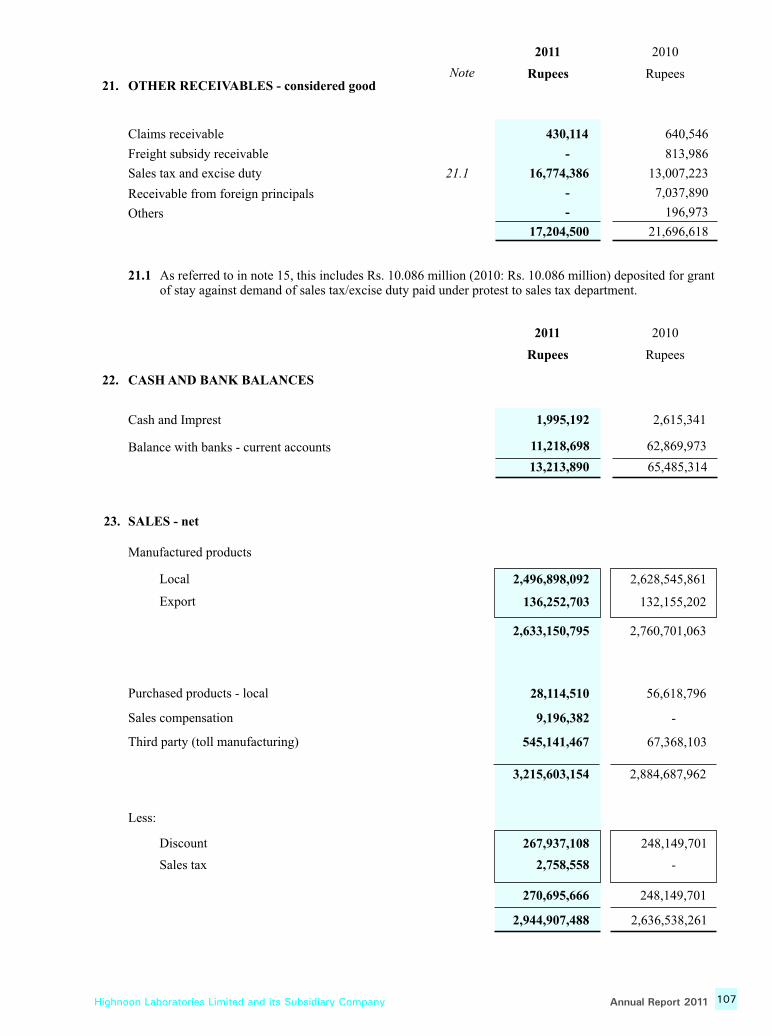
Highnoon Laboratories Limited and its Subsidiary Company 107Annual Report 2011
2011
Rupees
2010
Rupees
22. CASH AND BANK BALANCES
Cash and Imprest
Balance with banks - current accounts
1,995,192
11,218,698
13,213,890
23. SALES - net
Manufactured products
Local
Export
2,496,898,092
136,252,703
Purchased products - local
Sales compensation
Third party (toll manufacturing)
Discount
Less:
Sales tax
2,633,150,795
28,114,510
9,196,382
545,141,467
3,215,603,154
267,937,108
2,758,558
270,695,666
2,944,907,488
21. OTHER RECEIVABLES - considered good
Claims receivable
Freight subsidy receivable
Sales tax and excise duty
Receivable from foreign principals
Others
21.1
430,114
-
16,774,386
-
-
17,204,500
21.1
As referred to in note 15, this includes Rs. 10.086 million (2010: Rs. 10.086 million) deposited for grantof stay against demand of sales tax/excise duty paid under protest to sales tax department.
2,615,341
62,869,973
65,485,314
2,628,545,861
132,155,202
2,760,701,063
56,618,796
-
67,368,103
2,884,687,962
248,149,701
-
248,149,701
2,636,538,261
640,546
813,986
13,007,223
7,037,890
196,973
21,696,618
2011
Rupees
2010
RupeesNote

108 Annual Report 2011 Highnoon Laboratories Limited and its Subsidiary Company
Note
2011
Rupees
2010
Rupees
24. COST OF SALES
Raw and packing material consumed
24.1
16.1.1
17.2
Raw and packing material consumed
Salaries, wages and benefits
Vehicle running and maintenance
Fuel and power
Stores consumed
Repair and maintenance
Insurance
Rent, rates and taxes
Fee and subscription
Printing and stationery
Traveling and conveyance
Consultancy and professional charges
Office supplies
Depreciation
Amortization of intangible assets
Others direct cost
Inventory effect of work in process
Opening
Closing
1,664,236,175
147,996,669
14,502,334
42,386,309
6,844,797
23,696,364
3,088,925
2,870,912
319,273
3,687,056
798,402
1,854,039
7,319,916
43,569,519
15,443,418
4,677,623
1,983,291,731
59,384,189
(39,820,419)
1,402,432,824
124,393,802
13,264,129
34,257,448
7,581,726
18,273,150
2,812,661
1,830,443
476,408
2,589,238
2,440,827
4,999,986
6,621,520
40,552,316
11,628,123
3,559,186
1,677,713,787
49,560,198
(59,384,189)
Inventory effect of finished goods(excluding purchased products)
Opening
Closing
Cost of goods manufactured
19,563,770
2,002,855,501
160,115,818
(150,723,607)
(9,823,991)
1,667,889,796
186,894,949
(160,115,818)
Cost of goods sold - Purchased products
Cost of goods sold
Cost of goods sold - Manufactured products
24.1 It includes the following staff retirement benefits:
Defined benefit plan - Gratuity
Defined contribution plan - Provident Fund
Provision for compensated leave absences
9,392,211
2,012,247,712
18,488,730
21,793,744
16,864,790
4,128,435
800,519
26,779,131
1,694,668,927
38,314,088
17,889,360
11,552,368
3,762,902
2,574,090
2,030,736,442 1,732,983,015

Highnoon Laboratories Limited and its Subsidiary Company 109Annual Report 2011
25. OTHER OPERATING INCOME
Income from non-financial assets
Gain on sale of property, plant and equipment
SLA fee
Scrap Sales
Others
5,530,791
86,100,000
1,121,489
-
92,752,280
6,780,670
-
1,554,890
12,000
8,347,560
Rent, rates and taxes
Entertainment
Advertisement, promotional expenses and samples
Printing and stationery
Travelling and conveyance
Telephone, postage and telex
Insurance
26. DISTRIBUTION, SELLING AND PROMOTIONAL EXPENSES
26.1Salaries and benefits
722,395
206,469
179,460,123
2,491,434
75,873,437
2,028,417
2,947,460
208,916,544
178,785
217,137,656
2,108,207
75,291,522
2,279,203
2,271,041
Less: Reimbursement from foreign principals
26.2
16.1.1
17.2
Vehicle running and maintenance
Donation
Freight
Seminars, symposia and training
Newspapers and subscriptions
Depreciation
Others
Amortization of intangible assets
20,055,837
2,039,281
22,886,100
12,894,370
8,156,108
10,388,046
11,547,009
1,458,171
562,071,201
23,704,416
538,366,785
12,691,681
584,085,121
15,496,431
568,588,690
18,628,953
1,064,360
25,184,511
13,891,110
10,404,297
9,749,342
2,114,581
1,252,240
189,837,632
26.1 It includes the following staff retirement benefits:
Defined benefit plan - Gratuity
Defined contribution plan - Provident Fund
Provision for compensated leave absences
26.2 None of the Directors or their spouses have interest in the donee's fund.
8,337,928
4,899,132
3,565,653
16,802,713
12,159,447
5,265,686
3,163,484
20,588,617
25.1 HNL has provided technical ,marketing and sales know-how to Abbott Laboratories Pakistan Limited related to ex-Solvay products in Pakistan, following a global acquisition of Solvay Pharmaceuticals by Abbott International LLC, USA.
2011
Rupees
2010
RupeesNote
2011
Rupees
2010
RupeesNote
25.1
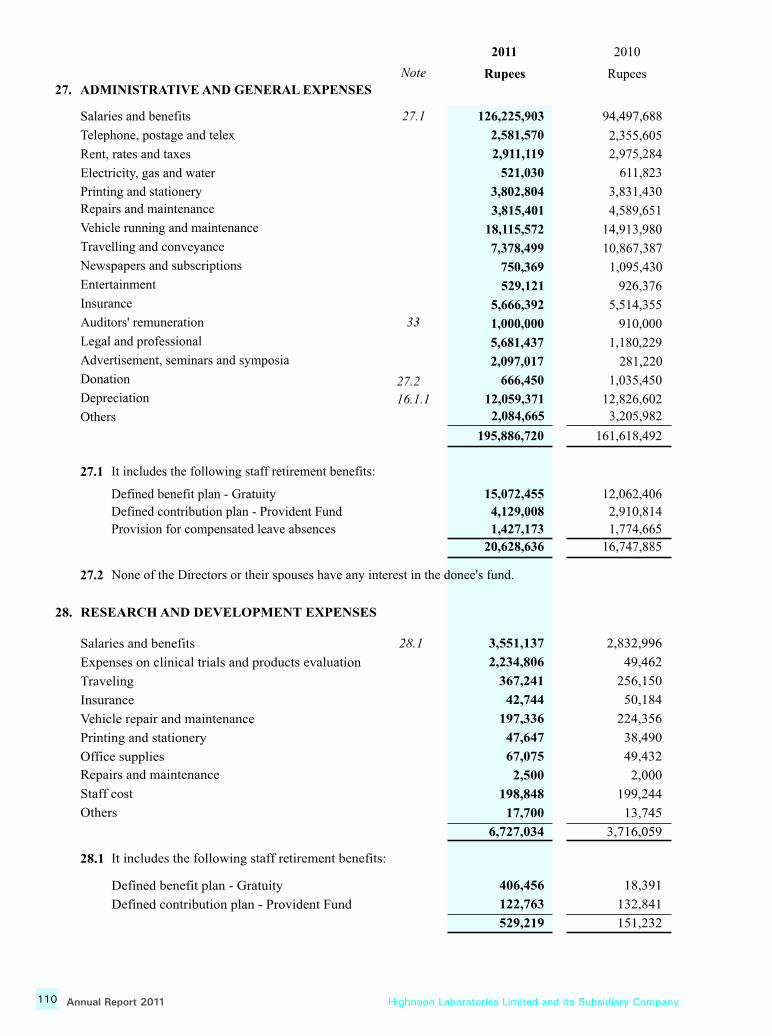
110 Annual Report 2011 Highnoon Laboratories Limited and its Subsidiary Company
27. ADMINISTRATIVE AND GENERAL EXPENSES
27.2 None of the Directors or their spouses have any interest in the donee's fund.
27.1
33
16.1.1
Note
2011
Rupees
2010
Rupees
Salaries and benefits
Telephone, postage and telex
Rent, rates and taxes
Electricity, gas and water
Repairs and maintenance
Printing and stationery
Vehicle running and maintenance
Travelling and conveyance
Newspapers and subscriptions
Entertainment
Insurance
Auditors' remuneration
Legal and professional
Advertisement, seminars and symposia
Donation
Depreciation
Others
27.1 It includes the following staff retirement benefits:
Defined benefit plan - Gratuity
Defined contribution plan - Provident Fund
Provision for compensated leave absences
126,225,903
2,581,570
2,911,119
521,030
3,802,804
3,815,401
18,115,572
7,378,499
750,369
529,121
5,666,392
1,000,000
5,681,437
2,097,017
666,450
12,059,371
2,084,665
195,886,720
15,072,455
4,129,008
1,427,173
20,628,636
94,497,688
2,355,605
2,975,284
611,823
3,831,430
4,589,651
14,913,980
10,867,387
1,095,430
926,376
5,514,355
910,000
1,180,229
281,220
1,035,450
12,826,602
3,205,982
161,618,492
12,062,406
2,910,814
1,774,665
16,747,885
28.1
28.1 It includes the following staff retirement benefits:
Defined benefit plan - Gratuity
Defined contribution plan - Provident Fund
28. RESEARCH AND DEVELOPMENT EXPENSES
Salaries and benefits
Expenses on clinical trials and products evaluation
Traveling
Insurance
Vehicle repair and maintenance
Printing and stationery
Office supplies
Staff cost
Others
406,456
122,763
529,219
3,551,137
2,234,806
367,241
42,744
197,336
47,647
67,075
2,500
198,848
17,700
6,727,034
18,391
132,841
151,232
2,832,996
49,462
256,150
50,184
224,356
38,490
49,432
2,000
199,244
13,745
3,716,059
27.2
Repairs and maintenance
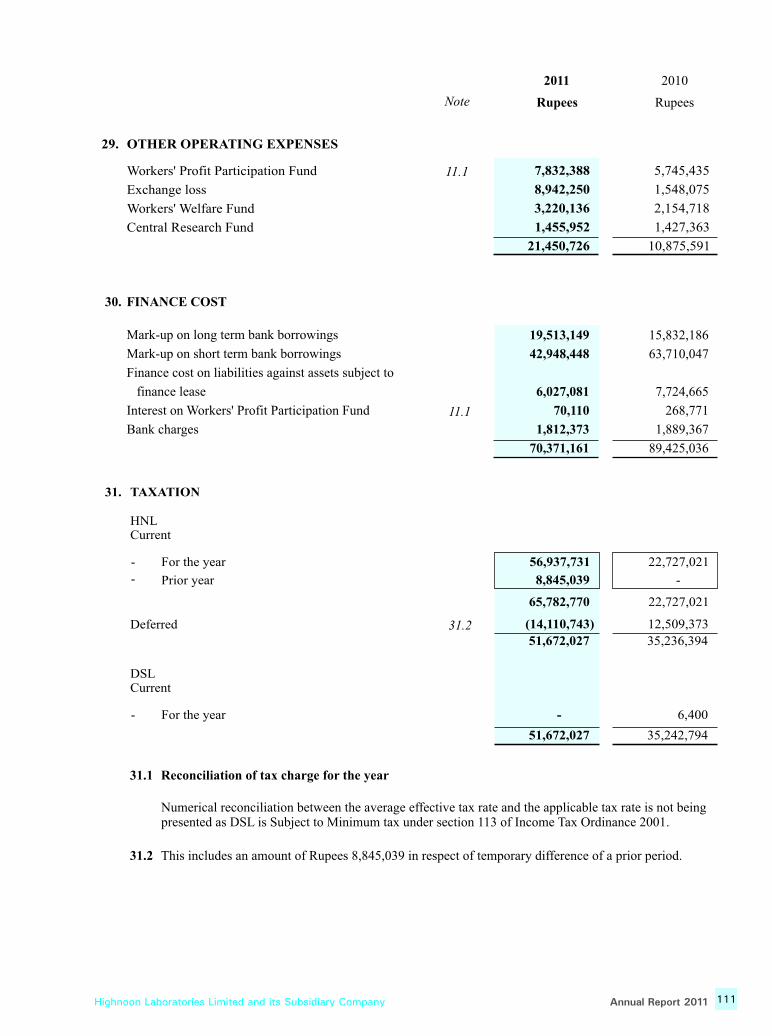
Highnoon Laboratories Limited and its Subsidiary Company 111Annual Report 2011
2011
Rupees
2010
RupeesNote
29. OTHER OPERATING EXPENSES
11.1Workers' Profit Participation Fund
Exchange loss
Workers' Welfare Fund
Central Research Fund
7,832,388
8,942,250
3,220,136
1,455,952
21,450,726
5,745,435
1,548,075
2,154,718
1,427,363
10,875,591
30. FINANCE COST
11.1
Mark-up on long term bank borrowings
Mark-up on short term bank borrowings
Finance cost on liabilities against assets subject to
finance lease
Interest on Workers' Profit Participation Fund
Bank charges
19,513,149
42,948,448
6,027,081
70,110
1,812,373
70,371,161
15,832,186
63,710,047
7,724,665
268,771
1,889,367
89,425,036
31.1 Reconciliation of tax charge for the year
Numerical reconciliation between the average effective tax rate and the applicable tax rate is not beingpresented as DSL is Subject to Minimum tax under section 113 of Income Tax Ordinance 2001.
31. TAXATION
HNLCurrent
For the year
Prior year
-
-
56,937,731
8,845,039
22,727,021
-
Deferred
65,782,770
51,672,027
(14,110,743)
22,727,021
35,236,394
12,509,373
DSLCurrent
For the year- - 6,400
51,672,027 35,242,794
31.2 This includes an amount of Rupees 8,845,039 in respect of temporary difference of a prior period.
31.2
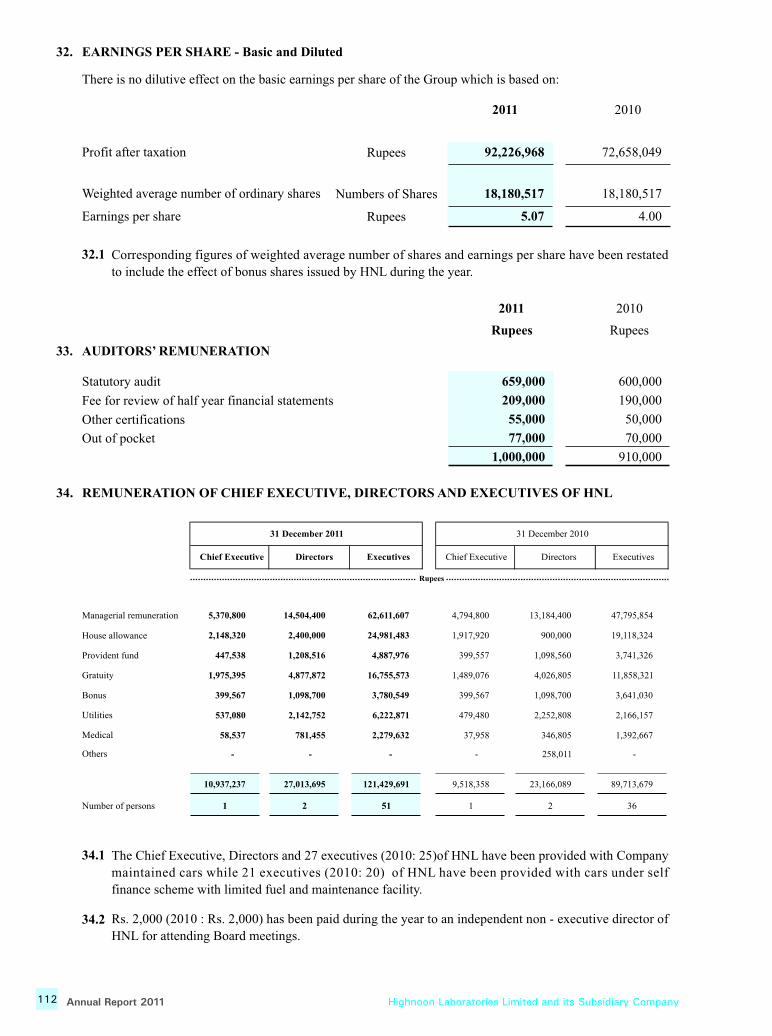
Profit after taxation
32. EARNINGS PER SHARE - Basic and Diluted
There is no dilutive effect on the basic earnings per share of the Group which is based on:
Rupees 92,226,968
Weighted average number of ordinary shares
Earnings per share
Numbers of Shares
Rupees
18,180,517
5.07
2011 2010
72,658,049
18,180,517
4.00
33. AUDITORS’ REMUNERATION
Statutory audit
Fee for review of half year financial statements
Other certifications
Out of pocket
2011
Rupees
2010
Rupees
659,000
209,000
55,000
77,000
1,000,000
600,000
190,000
50,000
70,000
910,000
The Chief Executive, Directors and 27 executives (2010: 25)of HNL have been provided with Company
maintained cars while 21 executives (2010: 20) of HNL have been provided with cars under self
finance scheme with limited fuel and maintenance facility.
Rs. 2,000 (2010 : Rs. 2,000) has been paid during the year to an independent non - executive director of
HNL for attending Board meetings.
34.1
34.2
34. REMUNERATION OF CHIEF EXECUTIVE, DIRECTORS AND EXECUTIVES OF HNL
Rupees
Managerial remuneration
House allowance
Provident fund
Gratuity
Bonus
Utilities
Medical
Others
Number of persons
14,504,400
2,400,000
1,208,516
4,877,872
1,098,700
2,142,752
781,455
-
27,013,695
62,611,607
24,981,483
4,887,976
16,755,573
3,780,549
6,222,871
2,279,632
-
121,429,691
31 December 2011
Chief Executive Directors Executives
1 2 51
10,937,237
5,370,800
2,148,320
447,538
1,975,395
399,567
537,080
58,537
-
13,184,400
900,000
1,098,560
4,026,805
1,098,700
2,252,808
346,805
258,011
23,166,089
47,795,854
19,118,324
3,741,326
11,858,321
3,641,030
2,166,157
1,392,667
-
89,713,679
Chief Executive Directors Executives
1 2 36
9,518,358
4,794,800
1,917,920
399,557
1,489,076
399,567
479,480
37,958
-
31 December 2010
Corresponding figures of weighted average number of shares and earnings per share have been restated
to include the effect of bonus shares issued by HNL during the year.
32.1
112 Annual Report 2011 Highnoon Laboratories Limited and its Subsidiary Company
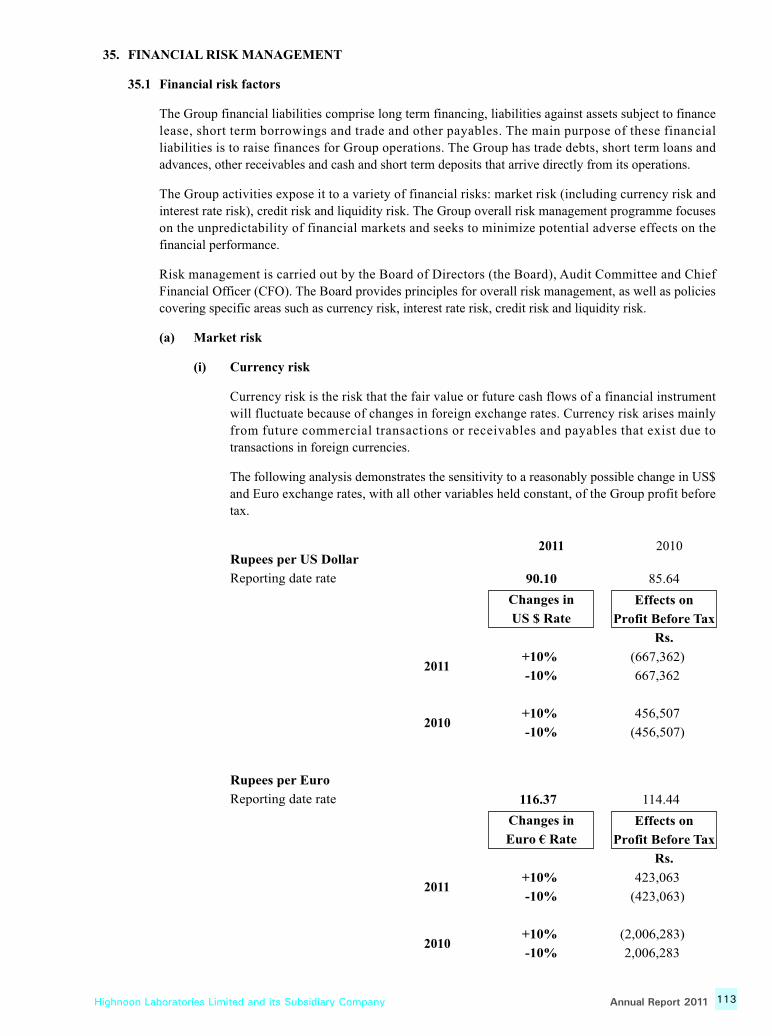
Highnoon Laboratories Limited and its Subsidiary Company 113Annual Report 2011
35. FINANCIAL RISK MANAGEMENT
35.1 Financial risk factors
The Group financial liabilities comprise long term financing, liabilities against assets subject to finance
lease, short term borrowings and trade and other payables. The main purpose of these financial
liabilities is to raise finances for Group operations. The Group has trade debts, short term loans and
advances, other receivables and cash and short term deposits that arrive directly from its operations.
The Group activities expose it to a variety of financial risks: market risk (including currency risk and
interest rate risk), credit risk and liquidity risk. The Group overall risk management programme focuses
on the unpredictability of financial markets and seeks to minimize potential adverse effects on the
financial performance.
Risk management is carried out by the Board of Directors (the Board), Audit Committee and Chief
Financial Officer (CFO). The Board provides principles for overall risk management, as well as policies
covering specific areas such as currency risk, interest rate risk, credit risk and liquidity risk.
(a) Market risk
(i) Currency risk
Currency risk is the risk that the fair value or future cash flows of a financial instrument
will fluctuate because of changes in foreign exchange rates. Currency risk arises mainly
from future commercial transactions or receivables and payables that exist due to
transactions in foreign currencies.
The following analysis demonstrates the sensitivity to a reasonably possible change in US$
and Euro exchange rates, with all other variables held constant, of the Group profit before
tax.
2011 2010
Changes in
US $ Rate
Effects on
Profit Before Tax
Rs.
Rupees per US Dollar
Reporting date rate 90.10 85.64
+10%
-10%
+10%
-10%
(667,362)
667,362
456,507
(456,507)
2011
2010
Changes in
Euro € Rate
Effects on
Profit Before Tax
Rs.
Rupees per Euro
Reporting date rate 116.37 114.44
+10%
-10%
+10%
-10%
423,063
(423,063)
2,006,283)
2,006,283
(
2011
2010
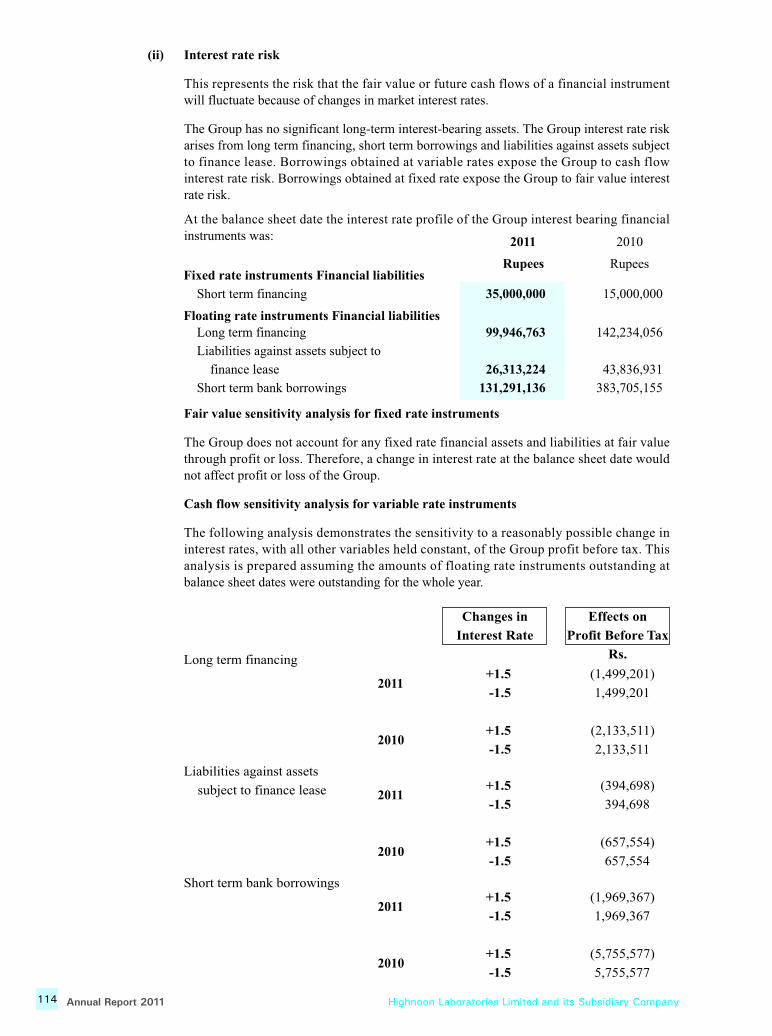
114 Annual Report 2011 Highnoon Laboratories Limited and its Subsidiary Company
Long term financing+1.5
-1.5
+1.5
-1.5
(1,499,201)
1,499,201
(2,133,511)
2,133,511
2011
2010
Liabilities against assets
subject to finance lease +1.5
-1.5
+1.5
-1.5
(394,698)
394,698
(657,554)
657,554
2011
2010
Short term bank borrowings+1.5
-1.5
+1.5
-1.5
(1,969,367)
1,969,367
(5,755,577)
5,755,577
2011
2010
Changes in
Interest Rate
Effects on
Profit Before Tax
Rs.
(ii) Interest rate risk
This represents the risk that the fair value or future cash flows of a financial instrument will fluctuate because of changes in market interest rates.
The Group has no significant long-term interest-bearing assets. The Group interest rate risk arises from long term financing, short term borrowings and liabilities against assets subject to finance lease. Borrowings obtained at variable rates expose the Group to cash flow interest rate risk. Borrowings obtained at fixed rate expose the Group to fair value interest rate risk.
At the balance sheet date the interest rate profile of the Group interest bearing financial instruments was:
Fair value sensitivity analysis for fixed rate instruments
The Group does not account for any fixed rate financial assets and liabilities at fair value through profit or loss. Therefore, a change in interest rate at the balance sheet date would not affect profit or loss of the Group.
Cash flow sensitivity analysis for variable rate instruments
The following analysis demonstrates the sensitivity to a reasonably possible change in interest rates, with all other variables held constant, of the Group profit before tax. This analysis is prepared assuming the amounts of floating rate instruments outstanding at balance sheet dates were outstanding for the whole year.
2011
Rupees
2010
Rupees
Short term financing
Floating rate instruments Financial liabilities Long term financing
Liabilities against assets subject to
finance lease
Short term bank borrowings
Fixed rate instruments Financial liabilities
35,000,000
99,946,763
26,313,224
131,291,136
15,000,000
142,234,056
43,836,931
383,705,155
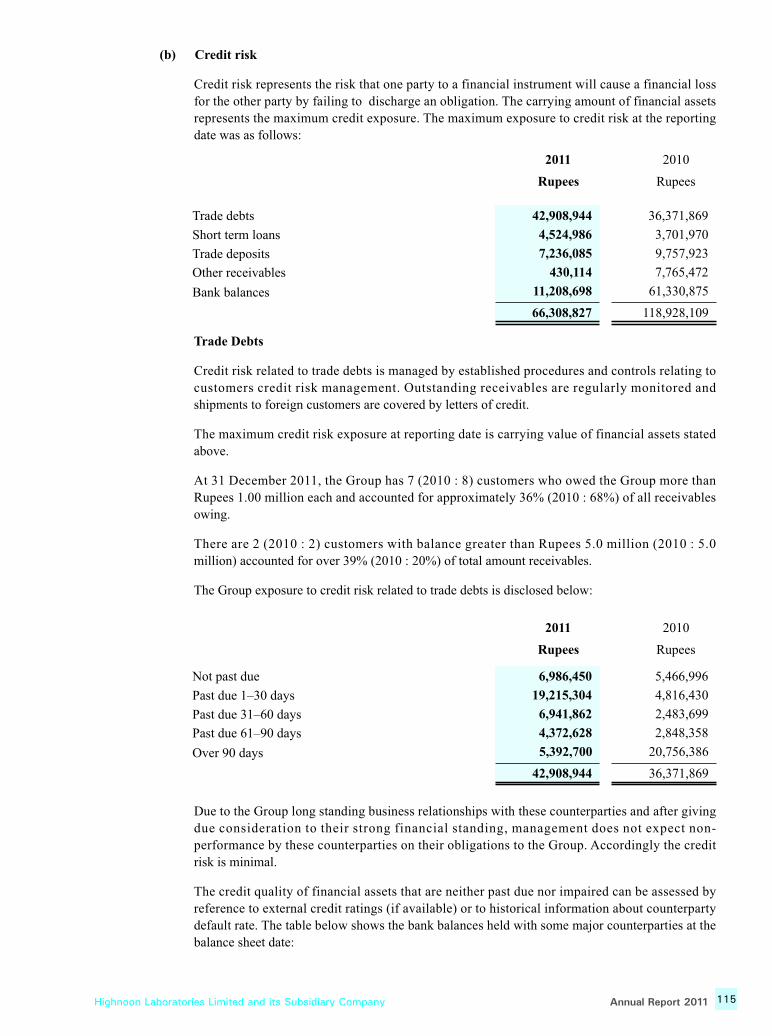
Highnoon Laboratories Limited and its Subsidiary Company 115Annual Report 2011
(b) Credit risk
Credit risk represents the risk that one party to a financial instrument will cause a financial loss
for the other party by failing to discharge an obligation. The carrying amount of financial assets
represents the maximum credit exposure. The maximum exposure to credit risk at the reporting
date was as follows:
Due to the Group long standing business relationships with these counterparties and after giving
due consideration to their strong financial standing, management does not expect non-
performance by these counterparties on their obligations to the Group. Accordingly the credit
risk is minimal.
The credit quality of financial assets that are neither past due nor impaired can be assessed by
reference to external credit ratings (if available) or to historical information about counterparty
default rate. The table below shows the bank balances held with some major counterparties at the
balance sheet date:
Trade Debts
Credit risk related to trade debts is managed by established procedures and controls relating to
customers credit risk management. Outstanding receivables are regularly monitored and
shipments to foreign customers are covered by letters of credit.
The maximum credit risk exposure at reporting date is carrying value of financial assets stated
above.
At 31 December 2011, the Group has 7 (2010 : 8) customers who owed the Group more than
Rupees 1.00 million each and accounted for approximately 36% (2010 : 68%) of all receivables
owing.
There are 2 (2010 : 2) customers with balance greater than Rupees 5.0 million (2010 : 5.0
million) accounted for over 39% (2010 : 20%) of total amount receivables.
The Group exposure to credit risk related to trade debts is disclosed below:
Trade debts
Short term loans
Trade deposits
Other receivables
Bank balances
2011
Rupees
2010
Rupees
42,908,944
4,524,986
7,236,085
430,114
11,208,698
66,308,827
36,371,869
3,701,970
9,757,923
7,765,472
61,330,875
118,928,109
Not past due
Past due 1–30 days
Past due 31–60 days
Past due 61–90 days
Over 90 days
2011
Rupees
2010
Rupees
6,986,450
19,215,304
6,941,862
4,372,628
5,392,700
42,908,944
5,466,996
4,816,430
2,483,699
2,848,358
20,756,386
36,371,869

(c) Liquidity risk
Liquidity risk is the risk that an entity will encounter difficulty in meeting obligations associated with financial liabilities.
The Group's approach to managing liquidity is to ensure, as far as possible, that it will always have sufficient liquidity to meet its liabilities when due, under both normal and stressed conditions, without incurring unacceptable losses or risking damage to the Group's reputation. The Group has positive working capital position at the year end. Therefore, management believes the liquidity risk to be low.
The table below analysis the Group's financial liabilities into relevant maturity groupings based on the remaining period at the balance sheet to the contractual maturity date. The amounts disclosed in the table are the contractual undiscounted cash flows.
20102011Agency
Rating
Longterm
Shortterm
-------------- Rupee --------------
United Bank Limited
National Bank of Pakistan
Banks
Faysal Bank Limited
Habib Bank Limited
Allied Bank Limited
Habib Metropolitan Bank Limited
Barklays Bank Limited
Standard Chartered Bank (Pakistan) Limited
1,086,546
8,893
2,571,827
832,238
651,900
34,364
2,198,733
3,834,197
11,218,698
884,002
78,466
52,124,931
1,034,674
1,574,093
69,364
-
7,104,443
62,869,973
JCR - VIS
JCR - VIS
JCR - VIS
JCR - VIS
PACRA
PACRA
PACRA
PACRA
AAA
AA+
AA
AA+
AA
AA+
AAA
AAA
A-1+
A-1+
A1+
A1+
A1+
A1+
A1+
A1+
As at 31 December 2011
Long term financing
Liabilities againstassets subject tofinance lease
Trade and otherpayables
Short term bankborrowings
................................................................................................................... Rupees ...................................................................................................................
Carrying amount Contractualcash flows
Less than 6months
6 to 12 months 1 to 2 years 2 to 5 years
99,946,763
26,313,224
135,922,083
166,291,136
428,473,206
121,596,660
30,200,558
188,740,439
476,459,740
135,922,083
28,005,791
11,022,741
11,224,652
186,175,267
135,922,083
26,483,091
6,650,984
-
177,515,787
210,649,862
41,058,380
10,043,042
-
-
51,101,422
26,049,398
2,483,791
-
-
28,533,189
As at 31 December 2010
Long term financing
Liabilities againstassets subject tofinance lease
Trade and otherpayables
Short term bankborrowings
................................................................................................................... Rupees ...................................................................................................................
Carrying amount Contractualcash flows
Less than 6months
6 to 12 months 1 to 2 years 2 to 5 years
142,234056
43,836,931
73,421,662
433,152,102
692,803,473
184,964,313
50,076,657
73,421,662
491,191,487
799,654,119
31,728,135
17,358,339
73,421,662
63,994,242
186,502,378
30,157,936
15,233,191
-
427,197,245
472,588,372
55,349,207
13,648,482
-
-
68,997,689
67,729,036
3,836,645
-
-
71,565,681
116 Annual Report 2011 Highnoon Laboratories Limited and its Subsidiary Company

2011
TotalLoans and
advances
Cash andcash
equivalents
-------------------------------- Rupee --------------------------------
Trade debts
Long term deposits
Assets as per balance sheet
Short term loans
Trade deposits
Other receivables
Cash and bank balances -
69,022,594
-
-
-
-
-
11,218,698
11,218,698
1,562,0541,562,054
55,269,35555,269,355
4,524,9864,524,986
7,236,0857,236,085
430,114430,114
11,218,698
80,241,292
2011
Liabilities against assets subject to finance lease
Long term financing
Liabilities as per balance sheet
Interest accrued on secured loans
Short term bank borrowings
Trade and other payables
99,946,763
26,313,224
10,436,070
166,291,136
138,313,491
441,300,684
Financial Liabilitiesat amortized cost
(Rupees)
The contractual cash flows relating to the above financial liabilities have been determined on the
basis of markup rates effective as at 31 December 2011. The rates of mark up have been disclosed
in respective notes to the financial statements..
35.2 Fair values of financial assets and liabilities
Fair value of available-for-sale financial assets is derived from quoted market prices in active markets,if
available.
The carrying values of all financial assets and liabilities reflected in financial statements approximate
their fair values. Fair value is determined on the basis of objective evidence at each reporting date.
Accordingly, detailed disclosure with reference to fair value has been given in the financial statements.
35.3 Financial instruments by categories
Highnoon Laboratories Limited and its Subsidiary Company 117Annual Report 2011
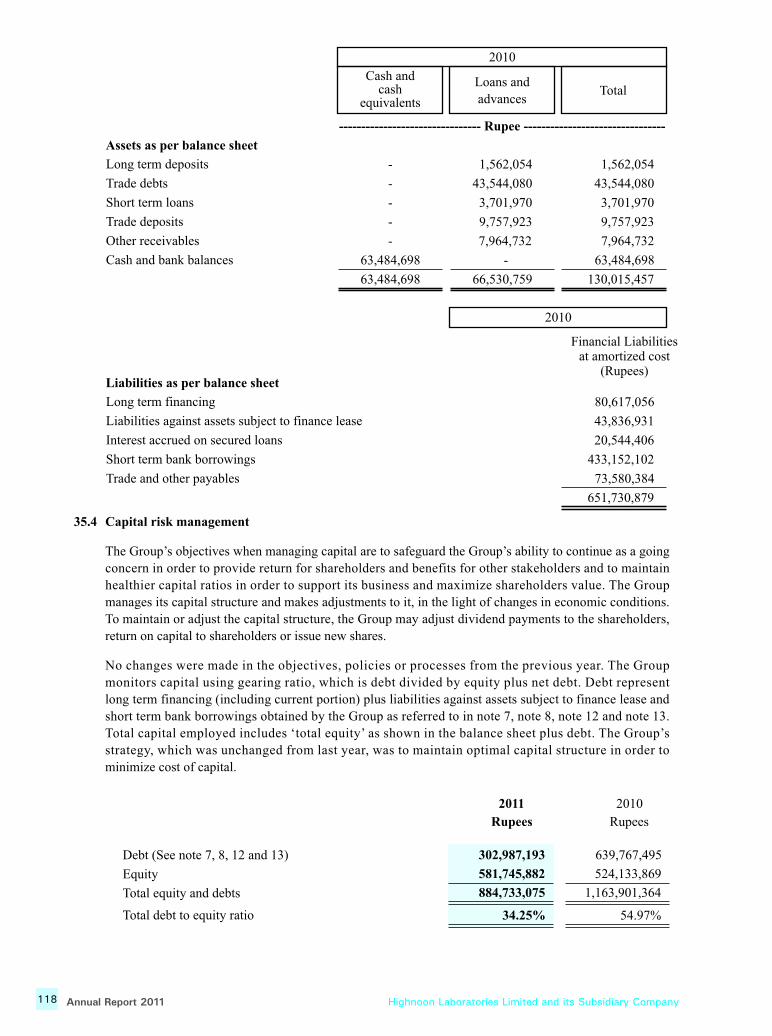
35.4 Capital risk management
The Group’s objectives when managing capital are to safeguard the Group’s ability to continue as a going
concern in order to provide return for shareholders and benefits for other stakeholders and to maintain
healthier capital ratios in order to support its business and maximize shareholders value. The Group
manages its capital structure and makes adjustments to it, in the light of changes in economic conditions.
To maintain or adjust the capital structure, the Group may adjust dividend payments to the shareholders,
return on capital to shareholders or issue new shares.
No changes were made in the objectives, policies or processes from the previous year. The Group
monitors capital using gearing ratio, which is debt divided by equity plus net debt. Debt represent
long term financing (including current portion) plus liabilities against assets subject to finance lease and
short term bank borrowings obtained by the Group as referred to in note 7, note 8, note 12 and note 13.
Total capital employed includes ‘total equity’ as shown in the balance sheet plus debt. The Group’s
strategy, which was unchanged from last year, was to maintain optimal capital structure in order to
minimize cost of capital.
2010
TotalLoans and
advances
Cash andcash
equivalents
-------------------------------- Rupee --------------------------------
Trade debts
Long term deposits
Assets as per balance sheet
Short term loans
Trade deposits
Other receivables
Cash and bank balances -
66,530,759
-
-
-
-
-
63,484,698
63,484,698
1,562,0541,562,054
43,544,08043,544,080
3,701,9703,701,970
9,757,9239,757,923
7,964,7327,964,732
63,484,698
130,015,457
2010
Liabilities against assets subject to finance lease
Long term financing
Liabilities as per balance sheet
Interest accrued on secured loans
Short term bank borrowings
Trade and other payables
80,617,056
43,836,931
20,544,406
433,152,102
73,580,384
651,730,879
Financial Liabilitiesat amortized cost
(Rupees)
Debt (See note 7, 8, 12 and 13)
Equity
Total equity and debts
Total debt to equity ratio
302,987,193
581,745,882
884,733,075
34.25%
2011
Rupees
2010
Rupees
639,767,495
524,133,869
1,163,901,364
54.97%
118 Annual Report 2011 Highnoon Laboratories Limited and its Subsidiary Company

Highnoon Laboratories Limited and its Subsidiary Company 119Annual Report 2011
ANEES AHMAD KHANDIRECTOR
ASLAM HAFIZ CHIEF EXECUTIVE OFFICER
36. RELATED PARTY TRANSACTIONS
The related parties and associated undertakings comprises associated companies, staff retirement funds,
directors and key management personnel. Balances of related parties and remuneration of key management
personnel is dislosed in the respective notes. Other significant transactions with related parties are as follows:
36.1 Sales of goods-net
36.2 Contribution to employees benefits fund
37. DIVIDENDS
The Board of Directors of HNL in its meeting held on 22 March 2012 has proposed cash dividend at the rate
of Rs. 3 (2010: Rs. 2.5) per share and Nil bonus shares (2010: 10%) for the year ended 31 December 2011,
subject to the approval of shareholders in the Annual General Meeting to be held on 25 April 2012. These
financial statements do not reflect these appropriations.
38. PLANT CAPACITY AND PRODUCTION
The capacity and production of HNL's plant is indeterminable as it is a multi-product plant involving varying
processes of manufacture.
39. DATE OF AUTHORIZATION OF ISSUE
The Board of Directors of HNL authorized the consolidated financial statements for issuance on 22 March
2012
40. GENERAL
40.1 Figures have been rounded off to the nearest rupee.
40.2 Corresponding figures have been rearranged, reclassified or net off, wherever necessary, for the
purposes of better presentation.
2011
Rupees
2010
Rupees
Associated undertaking 35,044,088
Contribution to Staff Provident Fund
Contribution to Employees Welfare Trust
13,279,339
1,118,495
26,385,230
12,072,258
1,234,250

HIGHNOON for a Healthier Nation

HIGHNOON LABORATORIES LIMITED17.5 Kilometer Multan Road,Lahore - 53700, Pakistan
Phone: +92 (42) 111 000 465Fax: +92 (42) 3751 0037Email: [email protected]
www.highnoon-labs.com
Co
nce
pt
by:
w
ww
.Re
dL
ion
Exp
ress
ion
s.co
mD
esig
n &
Prin
ted
by: T
rack
& T
ie 0
42-3
7513
000-
3

![arXiv:1608.08710v3 [cs.CV] 10 Mar 2017 · Asim Kadav NEC Labs America asim@nec-labs.com Igor Durdanovic NEC Labs America igord@nec-labs.com Hanan Samety University of Maryland hjs@cs.umd.edu](https://static.documents.pub/doc/80x56/5ec9c6967af0ce2b0906a548/arxiv160808710v3-cscv-10-mar-2017-asim-kadav-nec-labs-america-asimnec-labscom.jpg)


