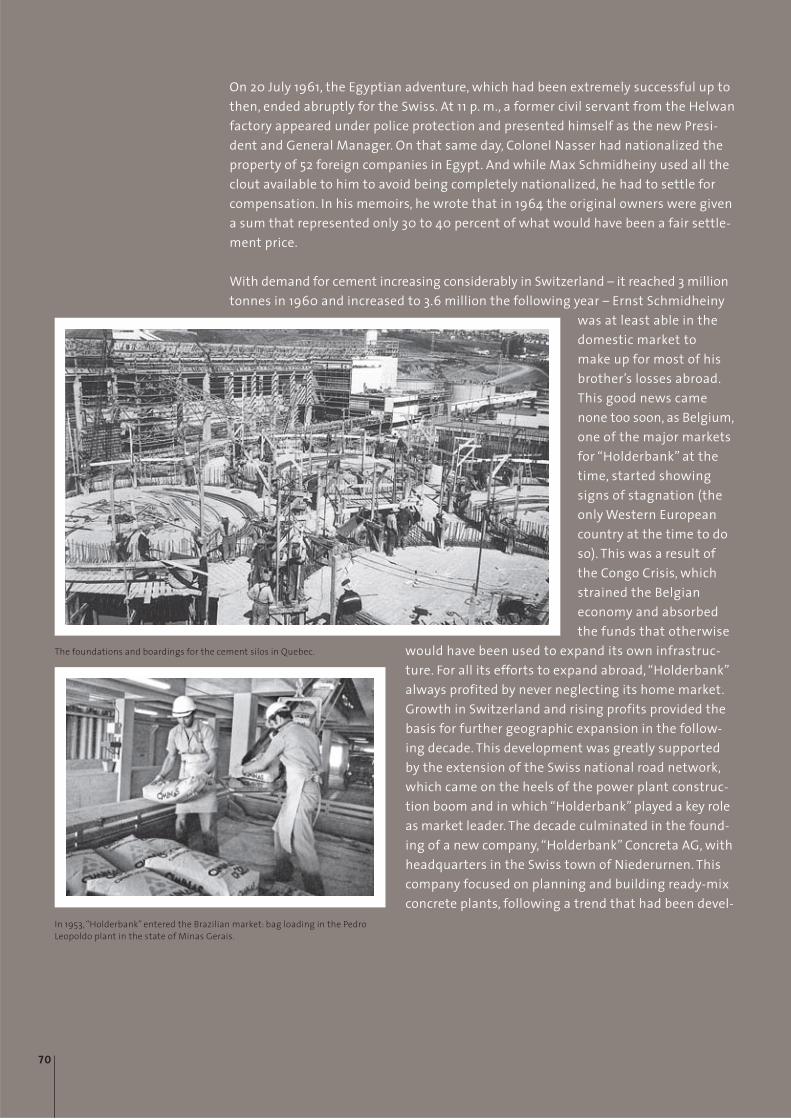
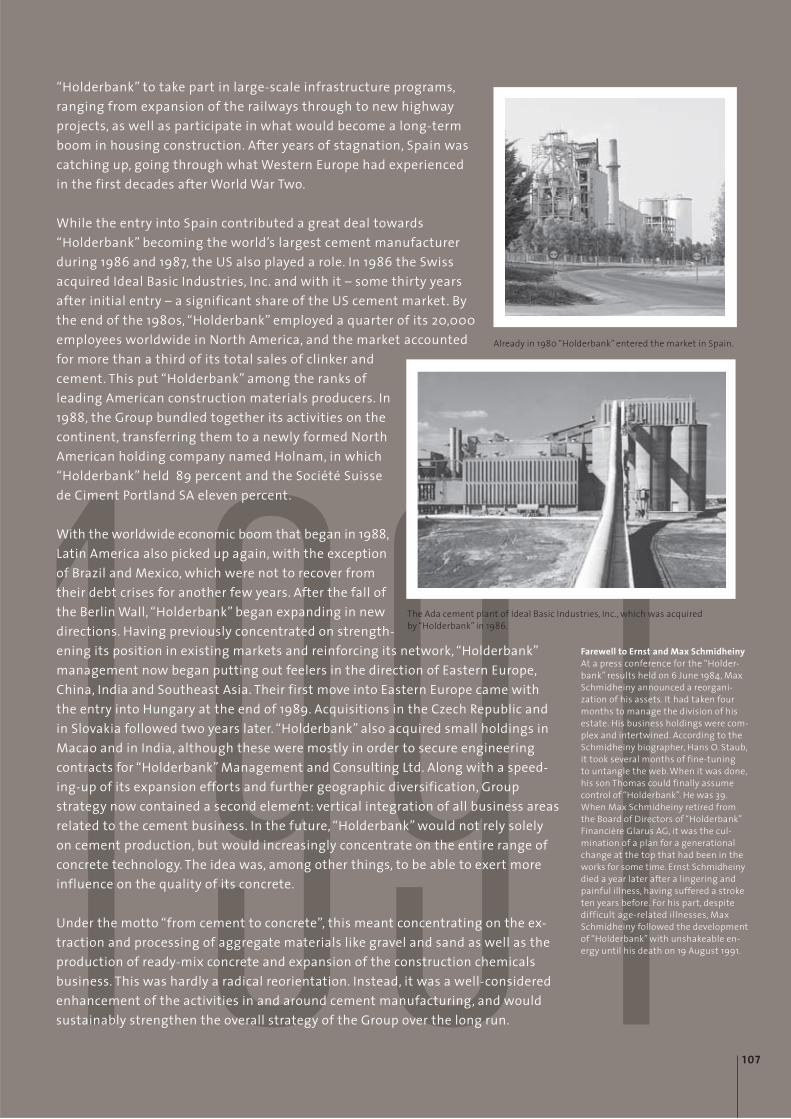
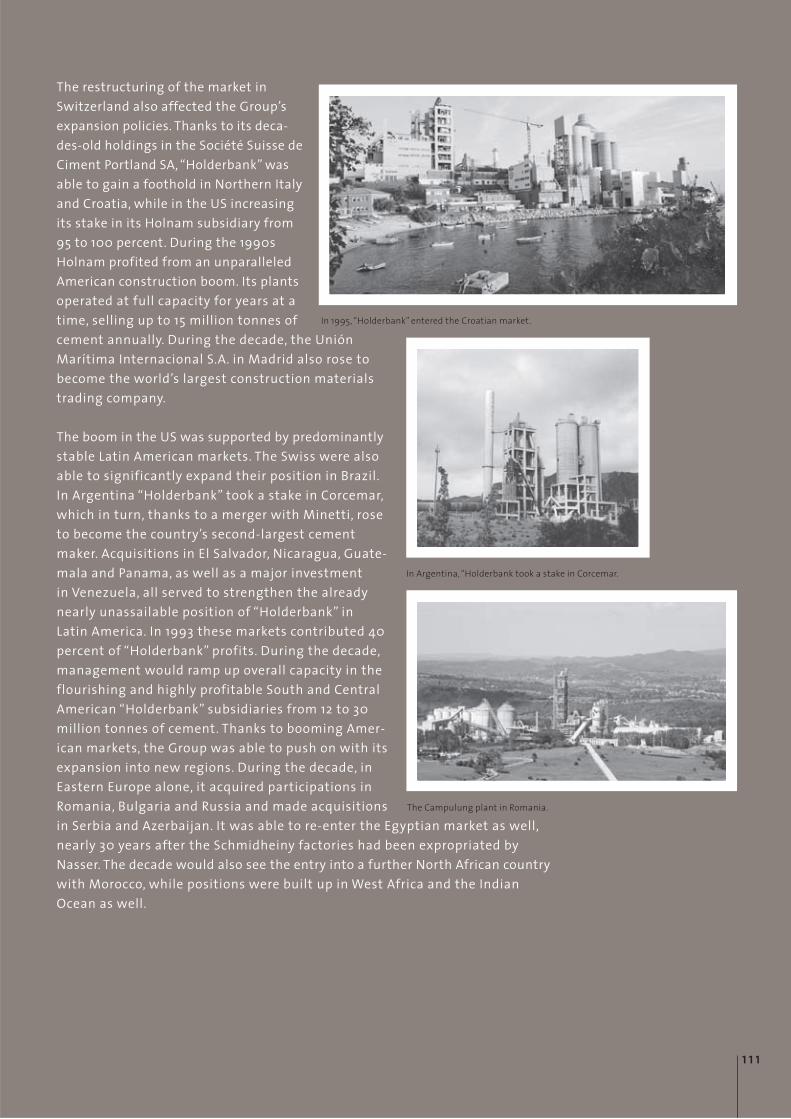
1 0 0The new Ste. Genevieve plant of Holcim US in Missouri.
Holcim’s original cement plant inHolderbank in the Swiss cantonof Aargau.
Annual Report 2011 Holcim Ltd
100 years ofStrength. Performance. Passion.
2012 – a remarkable year for Holcim as the company
celebrates its centenary. One hundred years during which
the company, originally established under the name of
“Holderbank” in Aargau in the Swiss Mittelland, gradually
developed from a local producer to one of the world’s
leading suppliers of building materials, playing an important
role across all continents. Holcim operates in around
70 countries and employs more than 80,000 people.
The present Annual Report traces the history of Holcimin ten decades. It tells of people and of pioneers in theconstruction industry who during this period trans-formed Holcim from a family firm to a global buildingmaterials group with some 2,200 production sitesaround the globe. This is the story of a company whosedevelopment also reflects the major events of the pasthundred years. The challenges of the early decadeswere followed by visionary decisions which drove thecompany’s expansion onto all continents as more andmore markets opened up. So that, going forward, Holcim will be a key player not only in the constructionmaterials markets of Western Europe and North andLatin America but also in the emerging countries ofAsia and Eastern Europe. Economically successful, ecologically sustainable and socially responsible. Trulyin the tradition of the company’s founders.
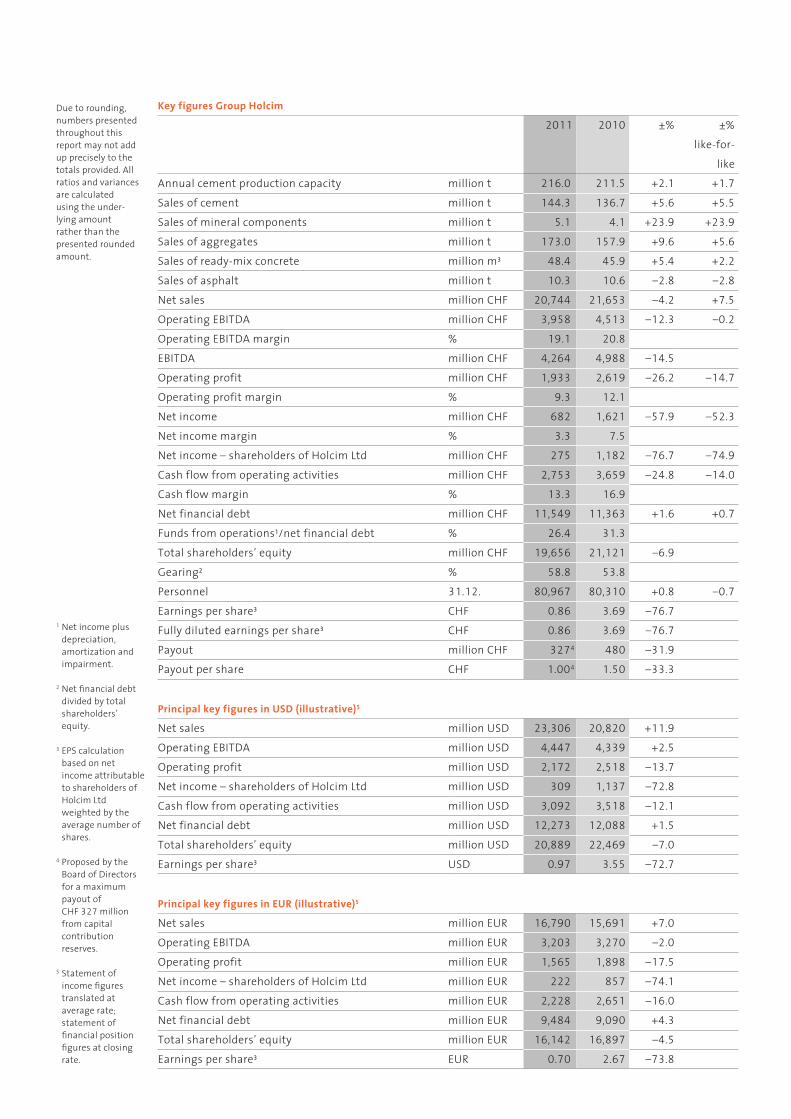
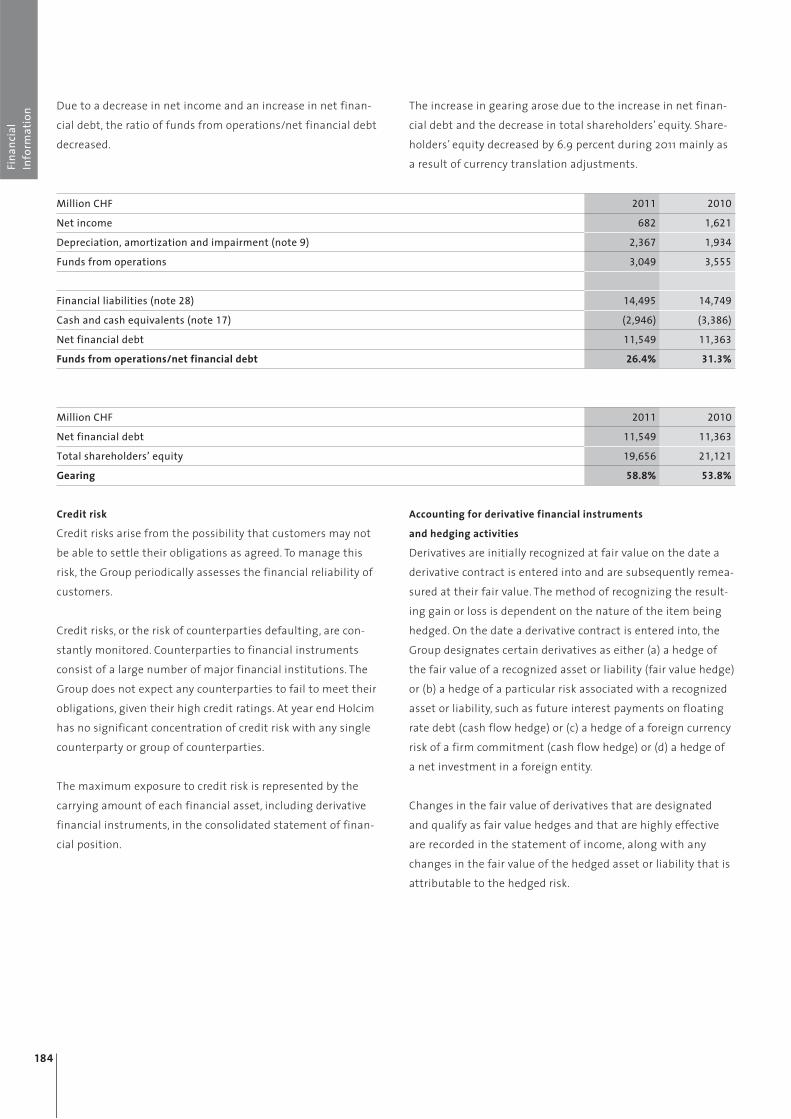
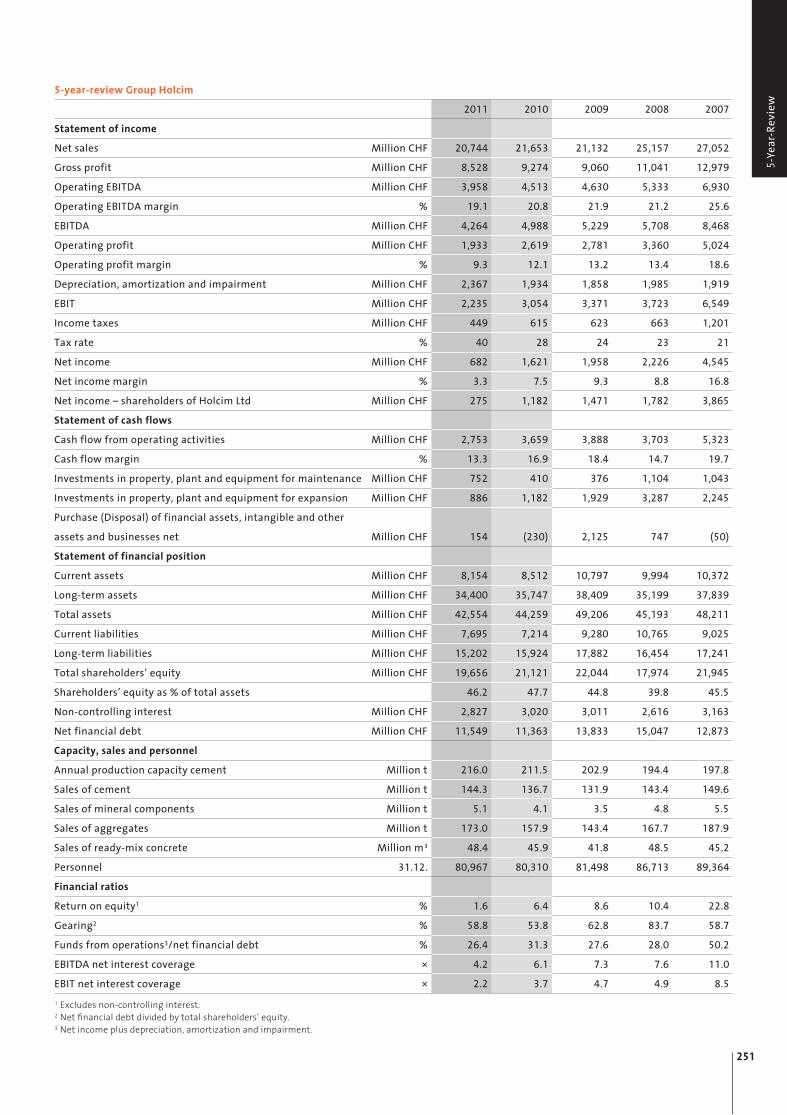
1 Net income plus depreciation, amortization and impairment.
2 Net financial debt divided by total shareholders’ equity.
3 EPS calculation based on net income attributable to shareholders of Holcim Ltd weighted by the average number of shares.
4 Proposed by the Board of Directors for a maximum payout of CHF 327 million from capital contribution reserves.
5 Statement of income figures translated at average rate; statement of financial position figures at closing rate.
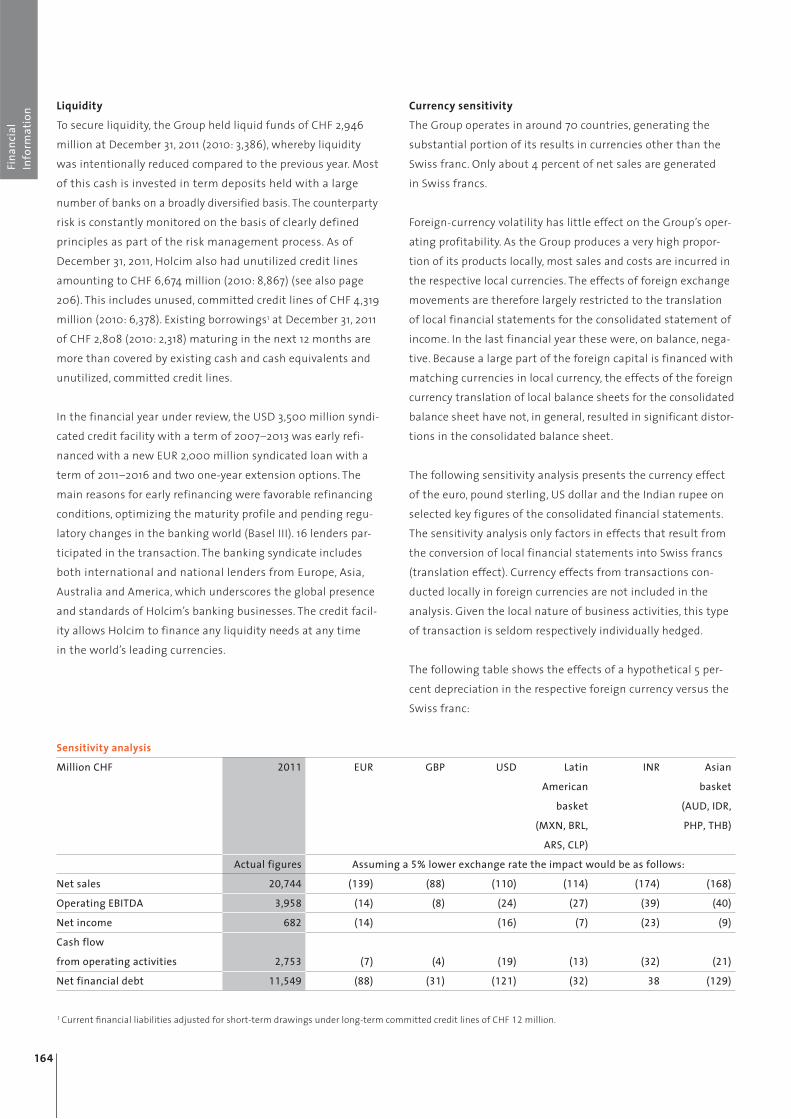
Key figures Group Holcim2011 2010 ±% ±%
like-for-like
Annual cement production capacity million t 216.0 211.5 +2.1 +1.7Sales of cement million t 144.3 136.7 +5.6 +5.5Sales of mineral components million t 5.1 4.1 +23.9 +23.9Sales of aggregates million t 173.0 157.9 +9.6 +5.6Sales of ready-mix concrete million m3 48.4 45.9 +5.4 +2.2Sales of asphalt million t 10.3 10.6 –2.8 –2.8Net sales million CHF 20,744 21,653 –4.2 +7.5Operating EBITDA million CHF 3,958 4,513 –12.3 –0.2Operating EBITDA margin % 19.1 20.8EBITDA million CHF 4,264 4,988 –14.5Operating profit million CHF 1,933 2,619 –26.2 –14.7Operating profit margin % 9.3 12.1Net income million CHF 682 1,621 –57.9 –52.3Net income margin % 3.3 7.5Net income – shareholders of Holcim Ltd million CHF 275 1,182 –76.7 –74.9Cash flow from operating activities million CHF 2,753 3,659 –24.8 –14.0Cash flow margin % 13.3 16.9Net financial debt million CHF 11,549 11,363 +1.6 +0.7Funds from operations1/net financial debt % 26.4 31.3Total shareholders’ equity million CHF 19,656 21,121 –6.9Gearing2 % 58.8 53.8Personnel 31.12. 80,967 80,310 +0.8 –0.7Earnings per share3 CHF 0.86 3.69 –76.7Fully diluted earnings per share3 CHF 0.86 3.69 –76.7Payout million CHF 3274 480 –31.9Payout per share CHF 1.004 1.50 –33.3
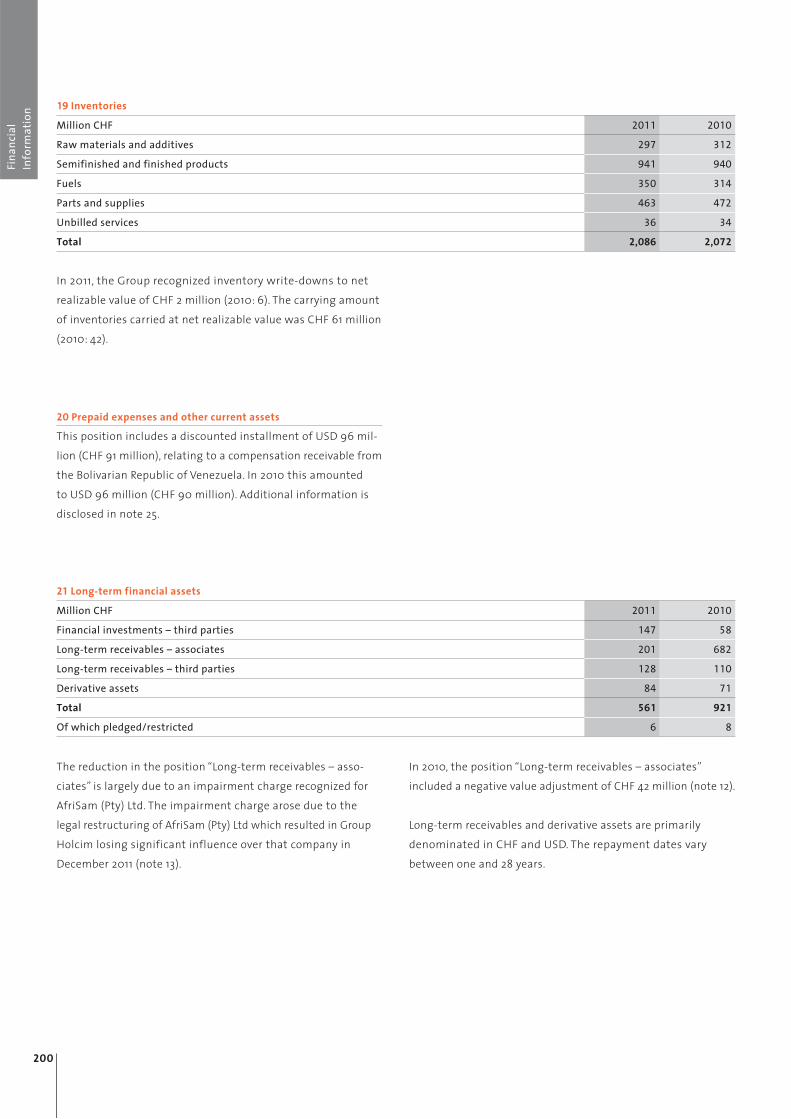
Principal key figures in USD (illustrative)5
Net sales million USD 23,306 20,820 +11.9Operating EBITDA million USD 4,447 4,339 +2.5Operating profit million USD 2,172 2,518 –13.7Net income – shareholders of Holcim Ltd million USD 309 1,137 –72.8Cash flow from operating activities million USD 3,092 3,518 –12.1Net financial debt million USD 12,273 12,088 +1.5Total shareholders’ equity million USD 20,889 22,469 –7.0Earnings per share3 USD 0.97 3.55 –72.7
Principal key figures in EUR (illustrative)5
Net sales million EUR 16,790 15,691 +7.0Operating EBITDA million EUR 3,203 3,270 –2.0Operating profit million EUR 1,565 1,898 –17.5Net income – shareholders of Holcim Ltd million EUR 222 857 –74.1Cash flow from operating activities million EUR 2,228 2,651 –16.0Net financial debt million EUR 9,484 9,090 +4.3Total shareholders’ equity million EUR 16,142 16,897 –4.5Earnings per share3 EUR 0.70 2.67 –73.8
Due to rounding, numbers presented throughout this report may not add up precisely to the totals provided. All ratios and variances are calculated using the under- lying amount rather than the presented rounded amount.
Annual Review 2011 6 Shareholders’ Letter 10
Value-Driven Corporate Management 30 Key Success Factors 30 Organization and Management 39 Innovation 46 Capital Market Information 49
Sustainable Development 53 Environmental Commitment and Social Responsibility 53 Human Resources 58
Business Review 82 Group Region Europe 82 Group Region North America 88 Group Region Latin America 92 Group Region Africa Middle East 96 Group Region Asia Pacific 100
Corporate Governance 121 Remuneration Report 142
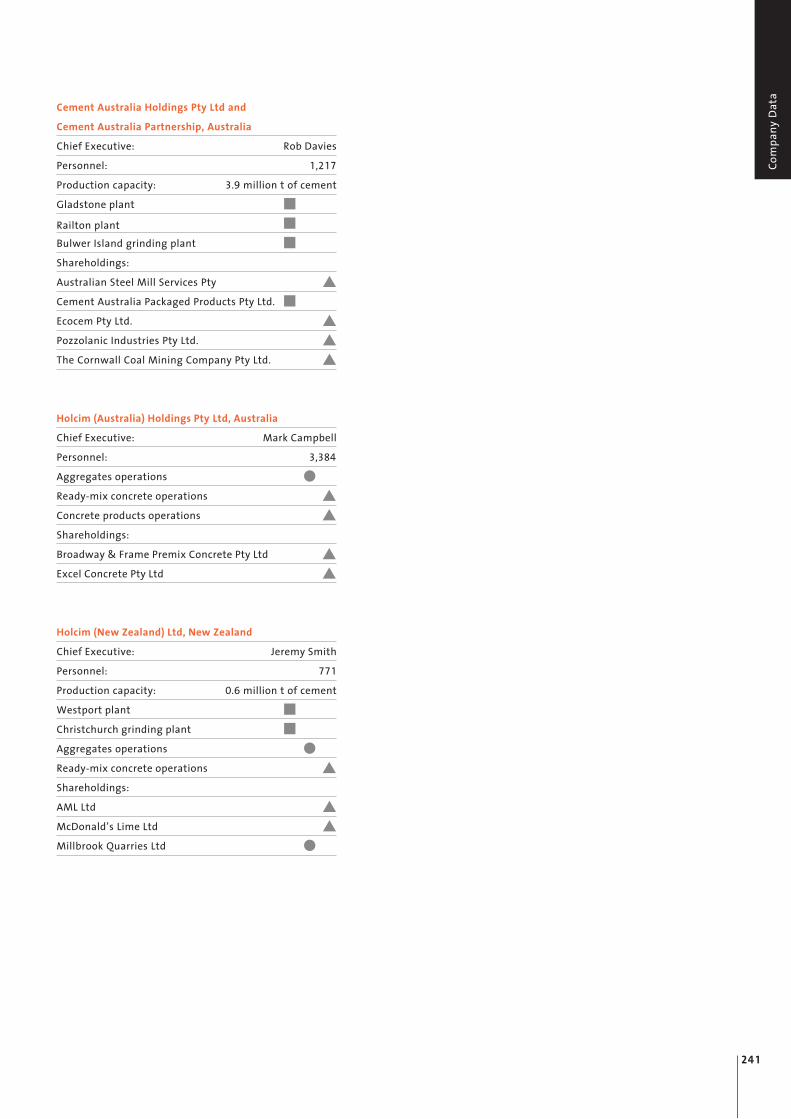
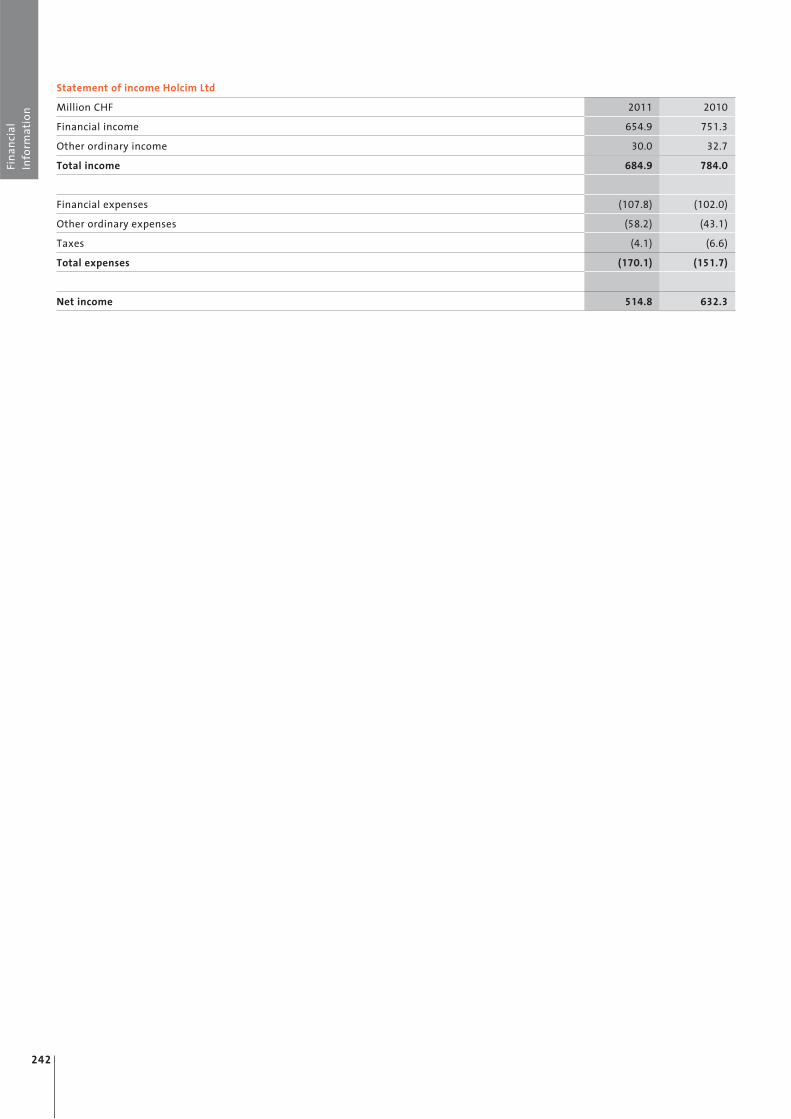
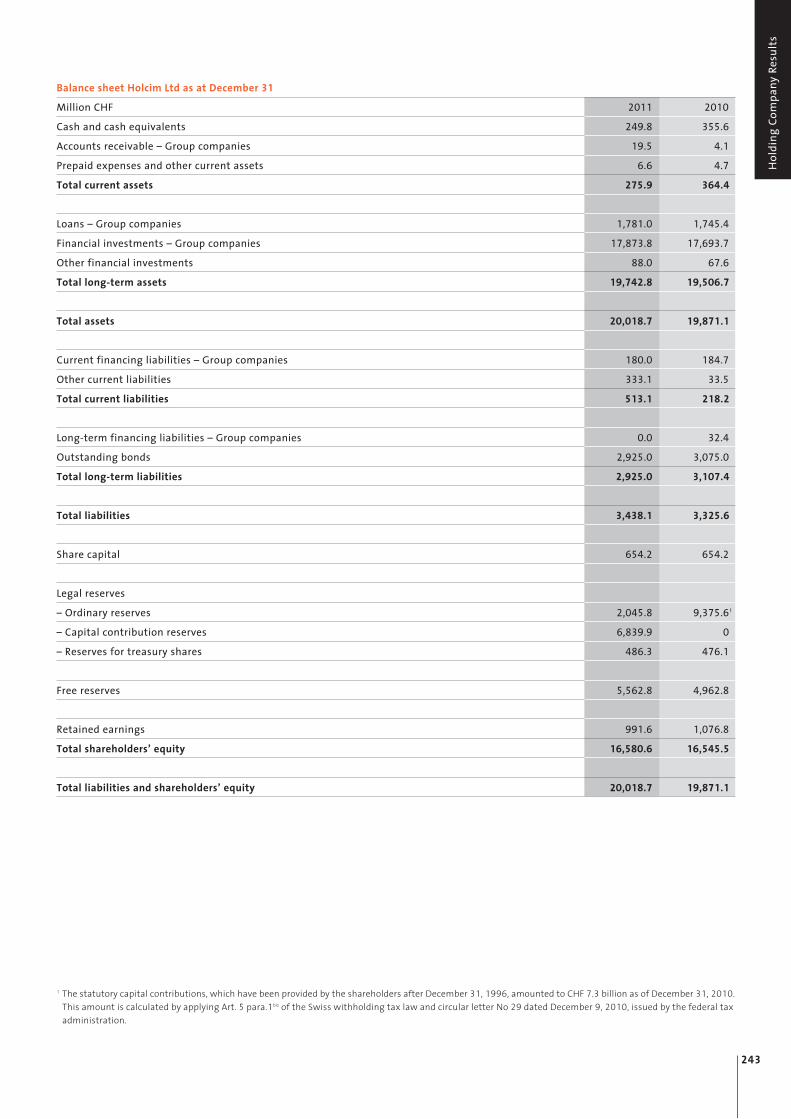
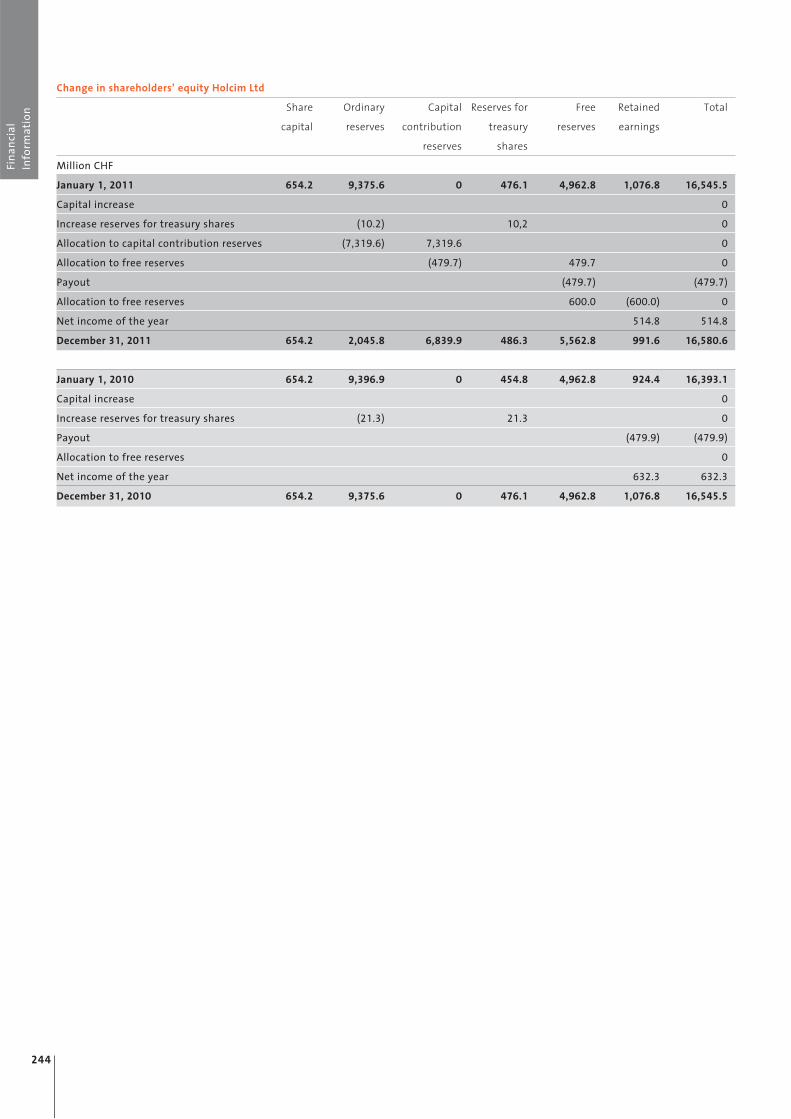
Financial Information 153 MD & A 154 Consolidated Financial Statements 165 Key Management Compensation 223 Company Data 234 Holding Company Results 242 5-Year-Review 251
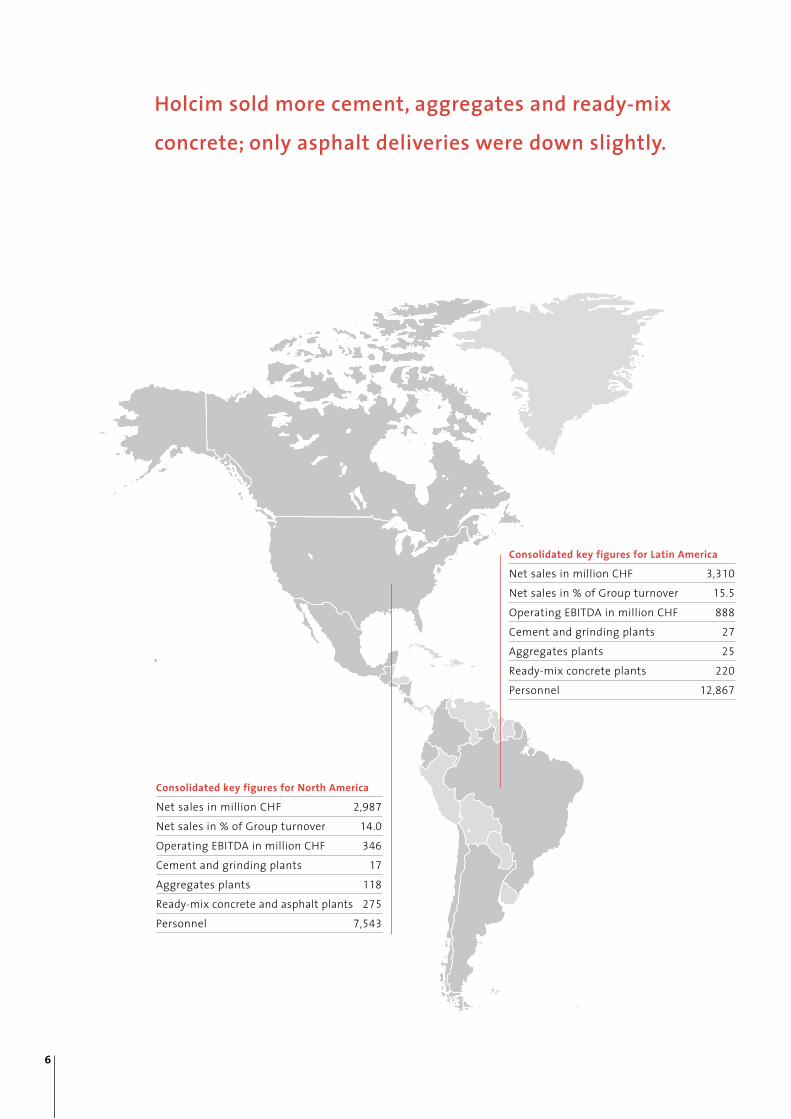
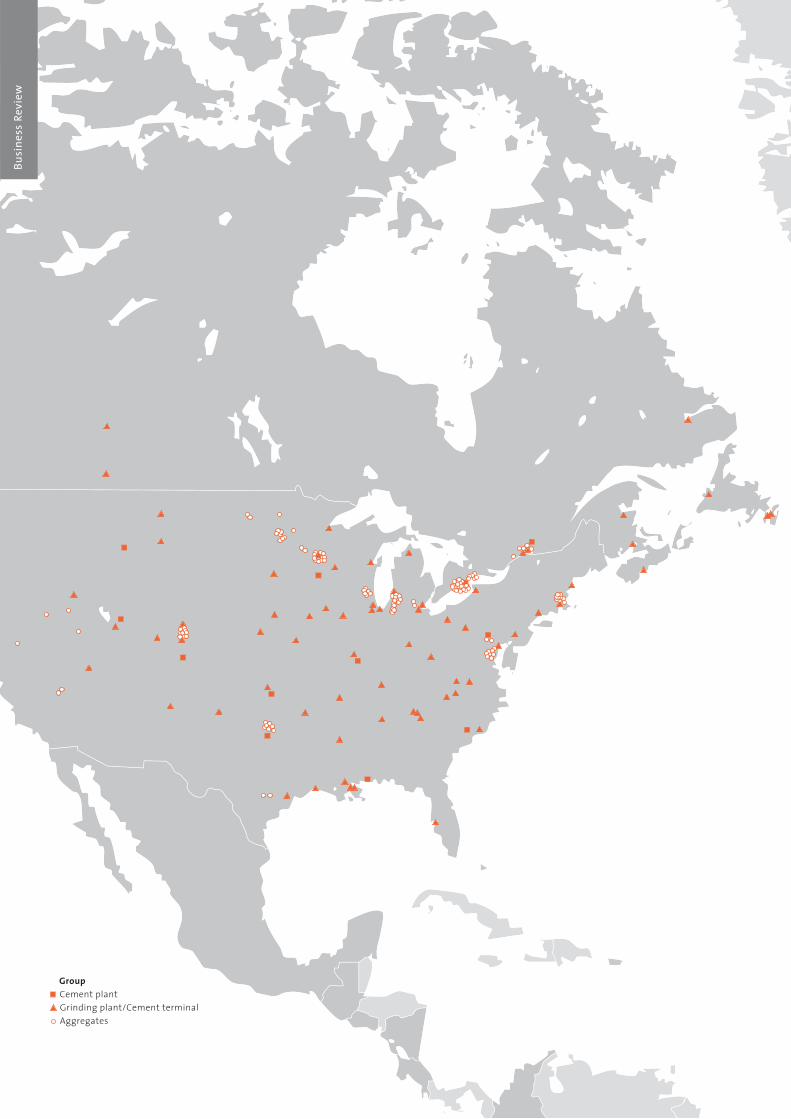
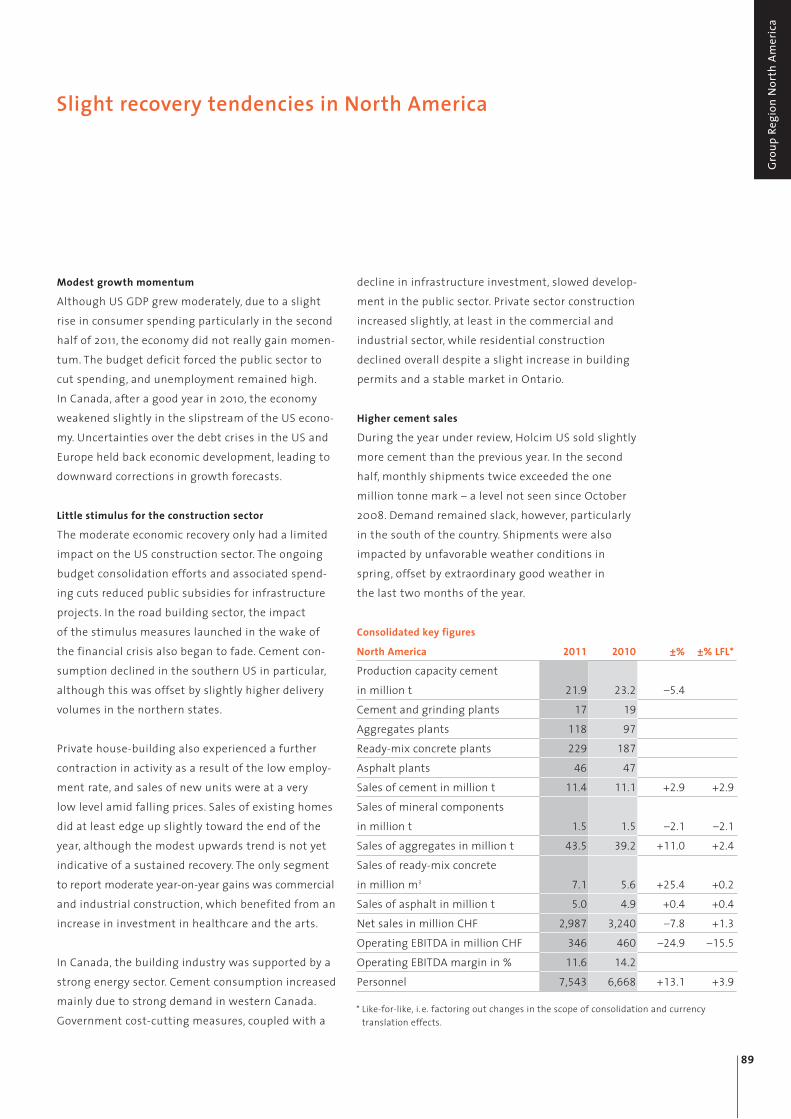
Consolidated key figures for North AmericaNet sales in million CHF 2,987Net sales in % of Group turnover 14.0Operating EBITDA in million CHF 346Cement and grinding plants 17Aggregates plants 118Ready-mix concrete and asphalt plants 275Personnel 7,543
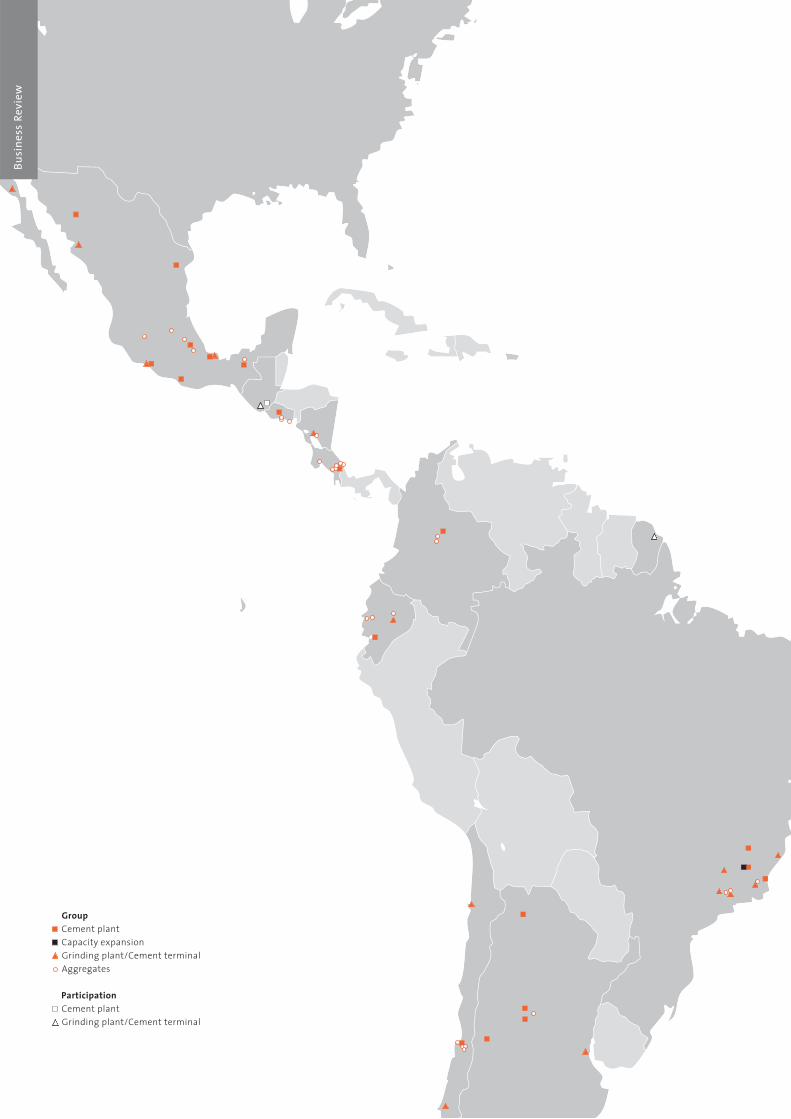
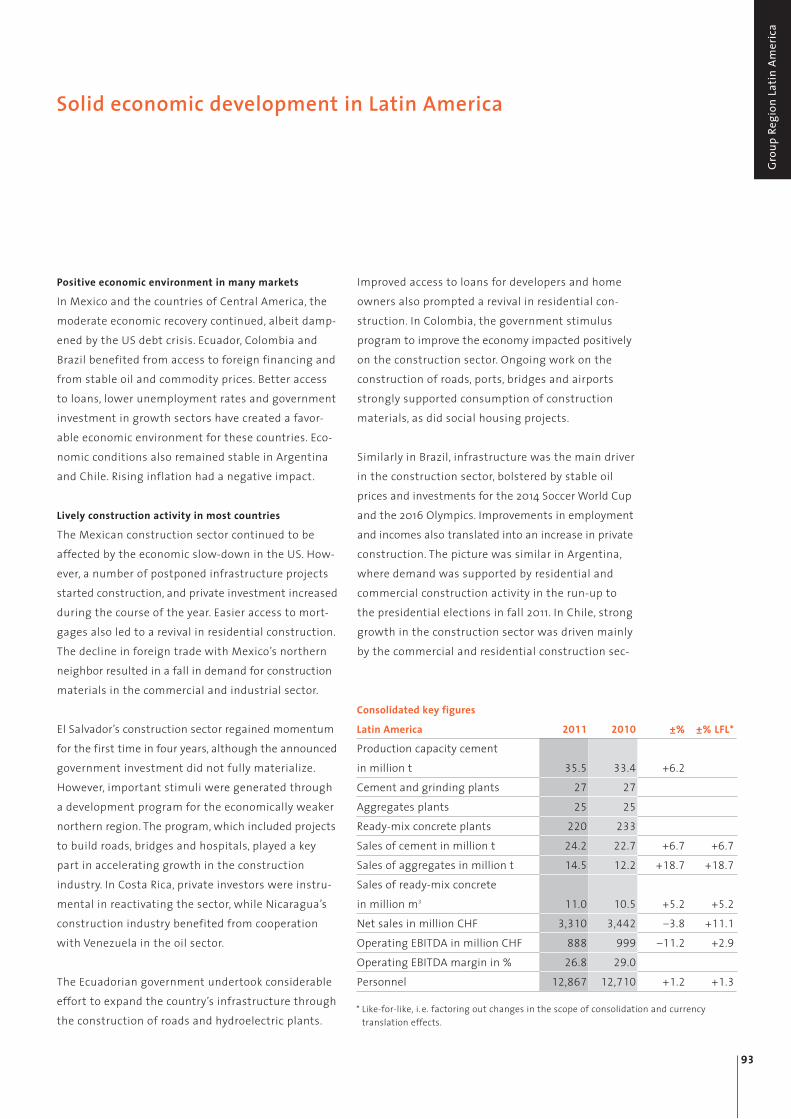
Consolidated key figures for Latin AmericaNet sales in million CHF 3,310Net sales in % of Group turnover 15.5Operating EBITDA in million CHF 888Cement and grinding plants 27Aggregates plants 25Ready-mix concrete plants 220Personnel 12,867
Holcim sold more cement, aggregates and ready-mix concrete; only asphalt deliveries were down slightly.
6
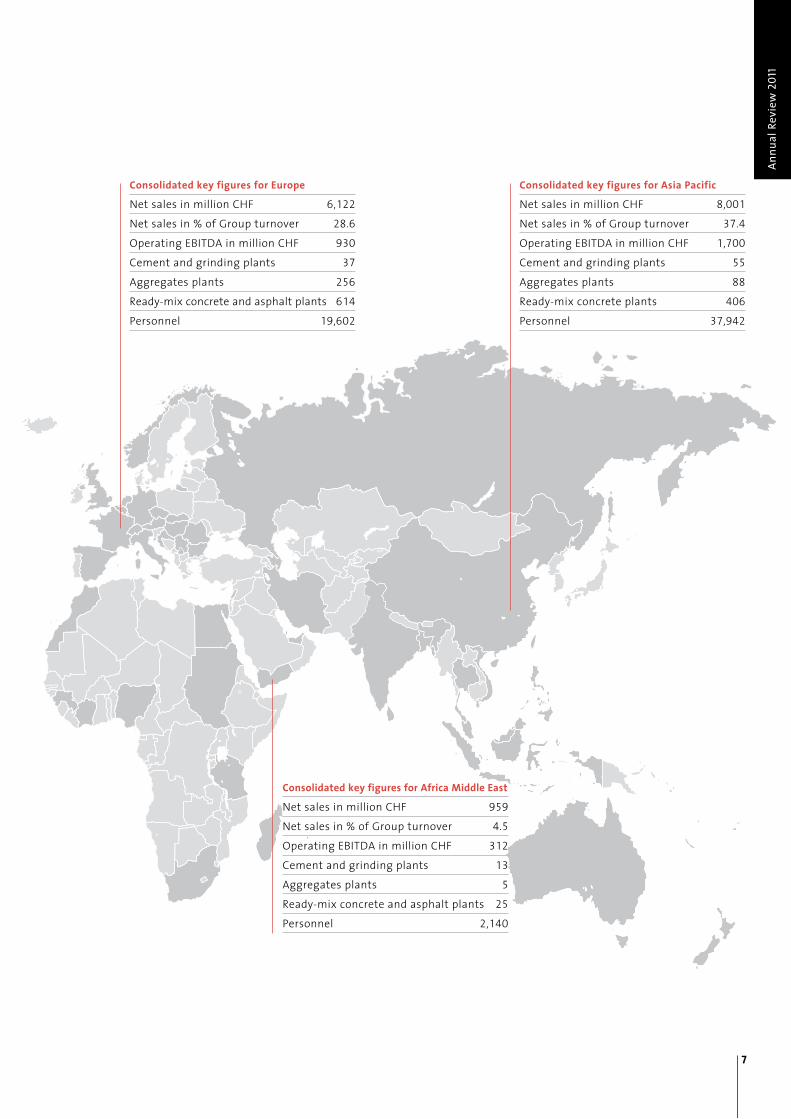
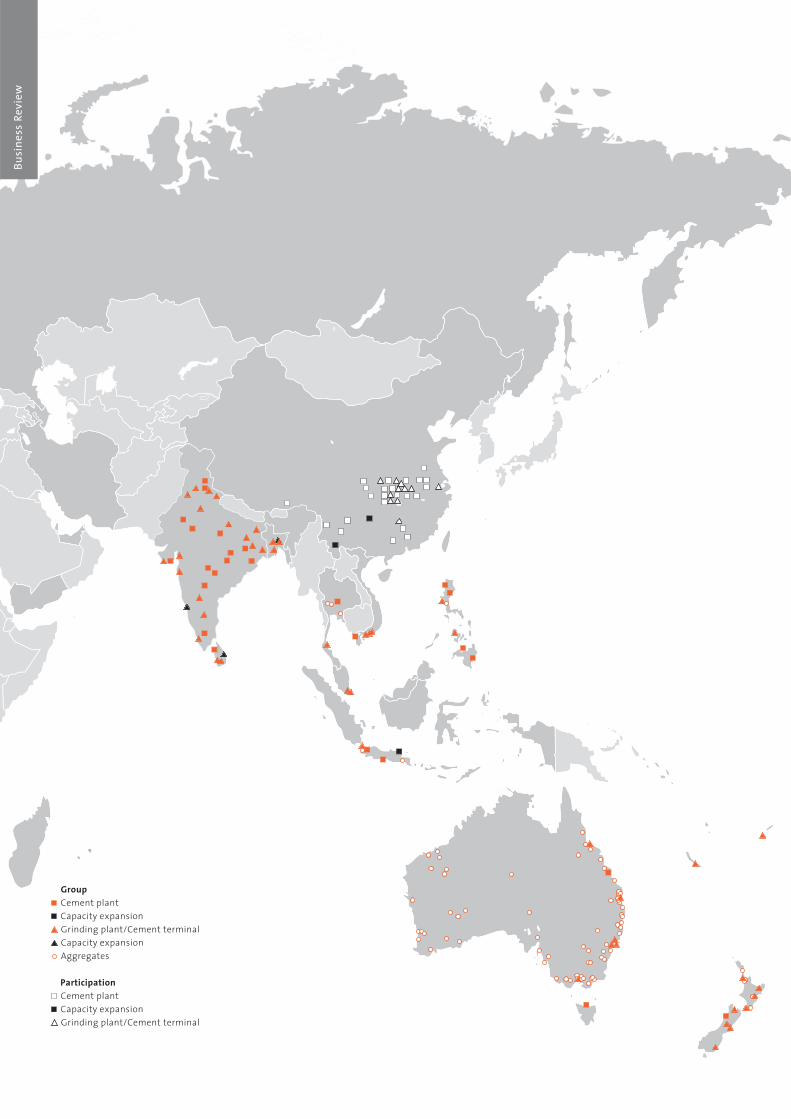
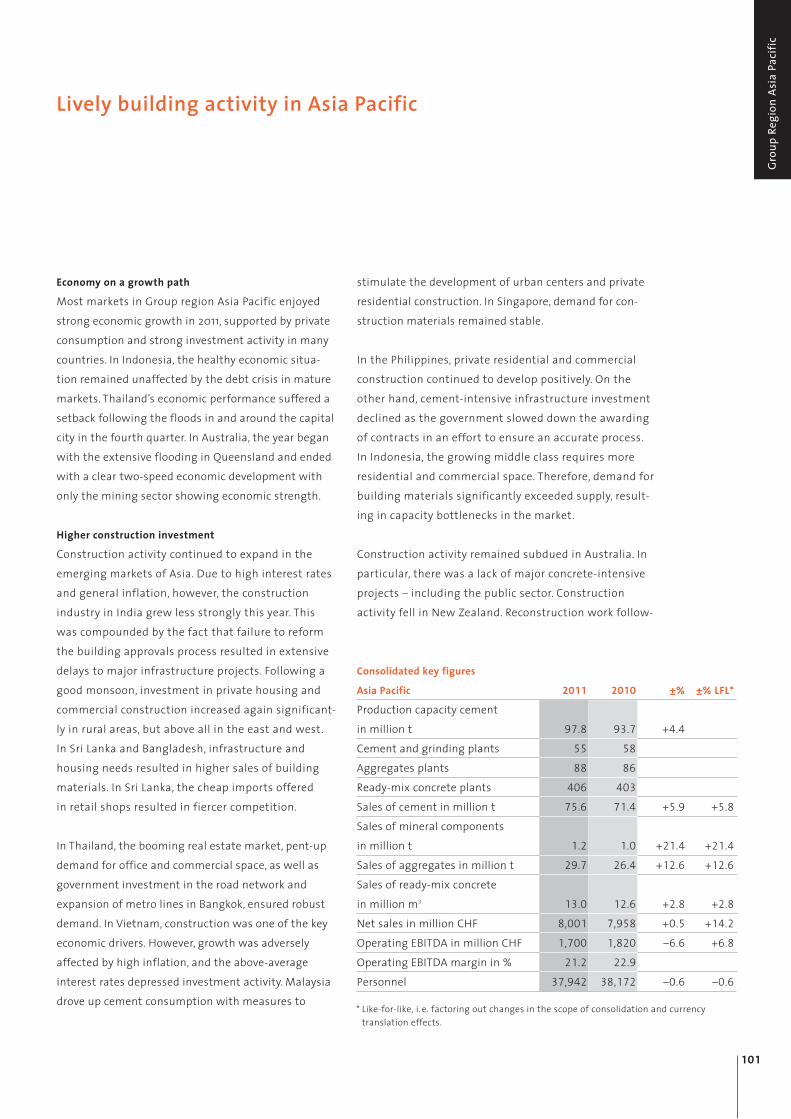
Consolidated key figures for Asia PacificNet sales in million CHF 8,001Net sales in % of Group turnover 37.4Operating EBITDA in million CHF 1,700Cement and grinding plants 55Aggregates plants 88Ready-mix concrete plants 406Personnel 37,942
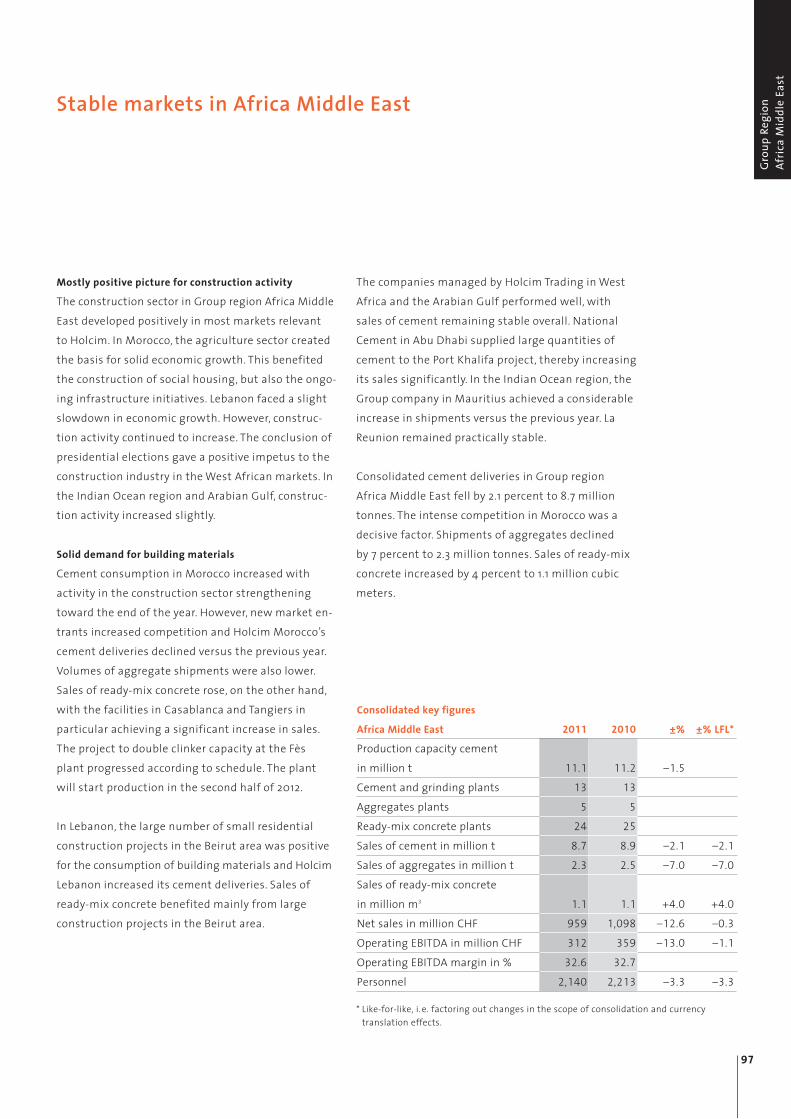
Consolidated key figures for Africa Middle EastNet sales in million CHF 959Net sales in % of Group turnover 4.5Operating EBITDA in million CHF 312Cement and grinding plants 13Aggregates plants 5Ready-mix concrete and asphalt plants 25Personnel 2,140
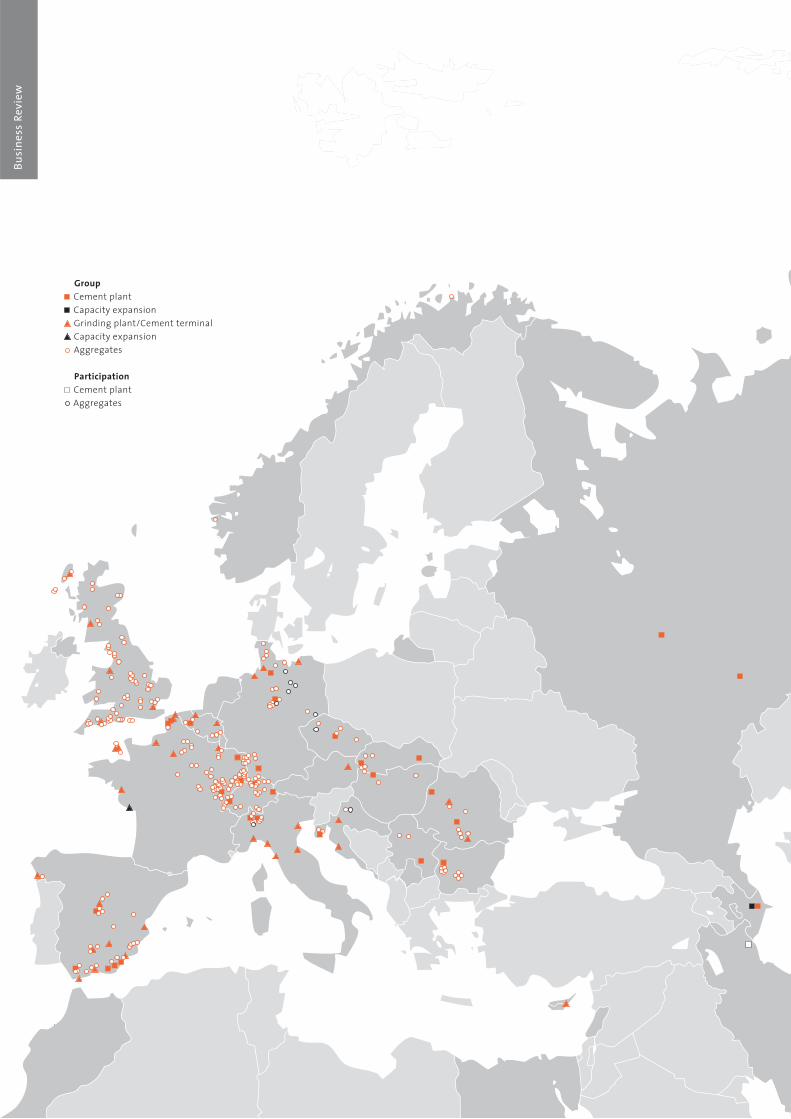
Consolidated key figures for EuropeNet sales in million CHF 6,122Net sales in % of Group turnover 28.6Operating EBITDA in million CHF 930Cement and grinding plants 37Aggregates plants 256Ready-mix concrete and asphalt plants 614Personnel 19,602
Annu
al R
evie
w 20
11
7
Profile
Cement is manufactured through a large-scale, com-plex and capital-intensive process. At the core of theproduction process is a rotary kiln, in which limestoneand clay are heated to approximately 1,450 degreesCelsius. The semifinished product, called clinker, is created by sintering. In the cement mill, gypsum isadded to the clinker and the mixture is ground to afine powder – traditional Portland cement. Otherhigh-grade materials such as granulated blast furnaceslag, fly ash, pozzolan and limestone are added in order to modify the properties of the cement. Holcimoffers customers a very wide range of cements andalso develops customized solutions for special applications.
Developments
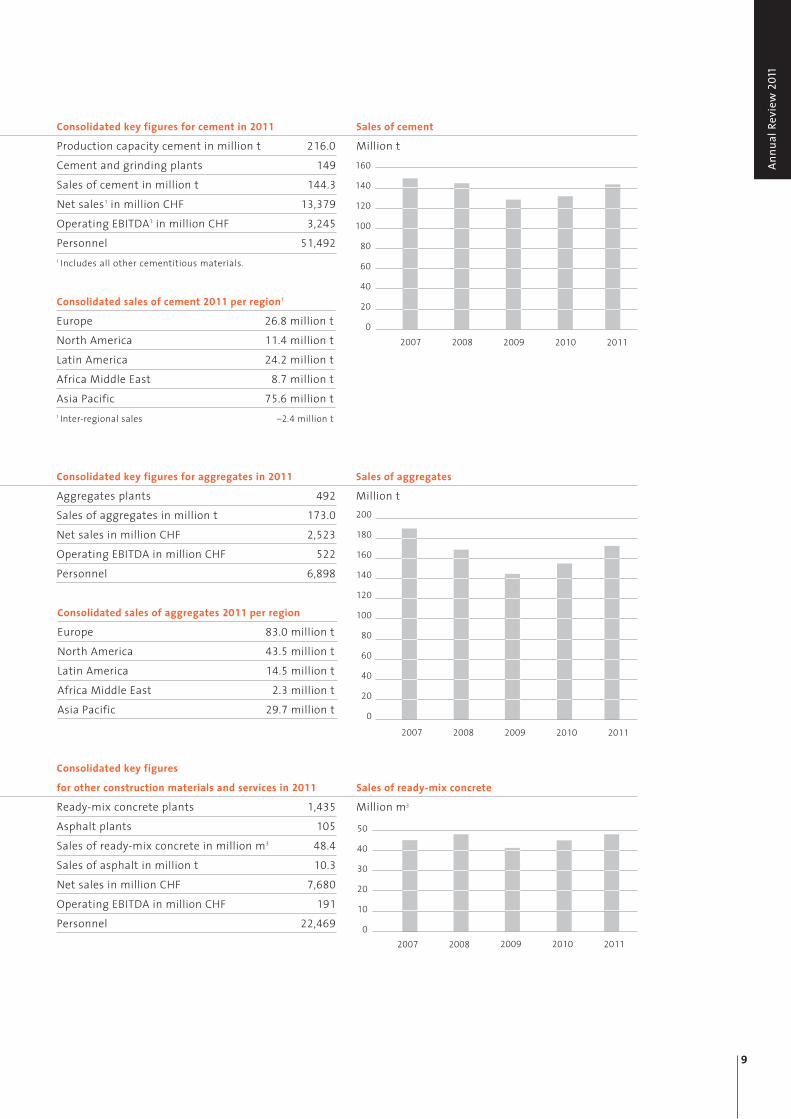
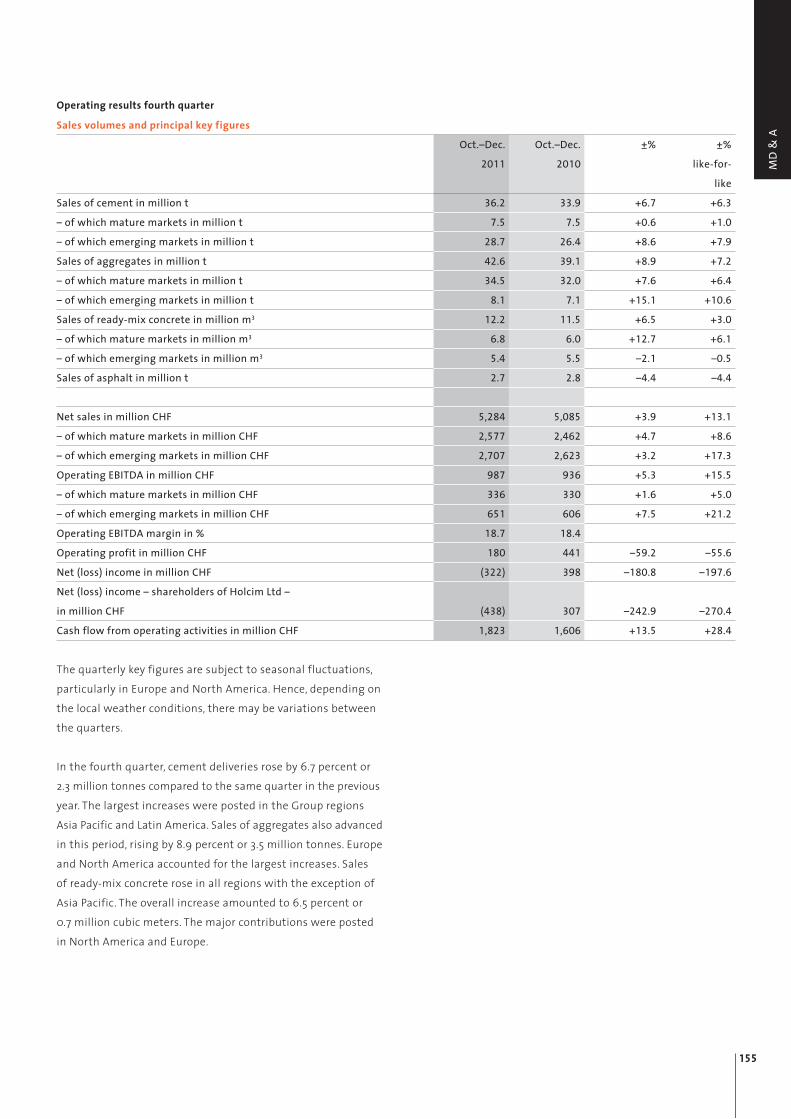
In 2011, cement sales increased by 5.6 percent to 144.3million tonnes. In addition, 5.1 million tonnes of othermineral components were sold, representing a rise of 23.9 percent. With the exception of Group regionAfrica Middle East, deliveries were up, above all inGroup regions Latin America and Asia Pacific. This positive trend reflects dynamic demand in the emerg-ing markets as well as capacity expansions in impor-tant markets, including, for example, India, Mexico and Russia.
Profile
Aggregates include crushed stone, gravel and sand.The production process centers around quarrying,preparing and sorting the raw material as well asquality testing. Aggregates are mainly used in themanufacturing of ready-mix concrete, concrete products and asphalt as well as for road building and railway track beds. The recycling of aggregatesfrom concrete material is gaining importance at Holcim.
Developments
The aggregates segment saw a particularly sharp rise in sales, with an increase of 9.6 percent to 173 milliontonnes. While volume growth was robust in LatinAmerica, Asia Pacific and North America, Groupcompanies in Europe also recorded gains. Numerous Group companies achieved higher sales volumes, withthe largest growth posted by Holcim France, Aggre-gate Industries US and Holcim Australia. Aggregate Industries UK almost matched its prior-year volumes.By contrast, the aggregates business declined in Italy,Spain, Slovakia, Morocco and New Zealand.
Profile
Globally, concrete is the second most consumed com-modity by volume after water. One cubic meter consistsof approximately 300 kilograms of cement, 150 liters ofwater and 2 tonnes of aggregates. Concrete is a very environmentally friendly, energy-efficient building material. Asphalt is a bituminous construction materialused primarily for road paving. It consists mainly of aggregates of differing grain size. Holcim’s service offer-ing also includes construction services and internationaltrading.
Developments
Sales of ready-mix concrete rose by 5.4 percent to 48.4 million cubic meters. The strongest growth was seen in North and Latin America. Sales volumesincreased significantly in France, the USA, Chile, andIndonesia. Holcim suffered a setback in Spain. Deliveriesof ready-mix concrete were lower in Italy, Hungary,Argentina and Vietnam. The volume of asphalt soldwas down by 2.8 percent to 10.3 million tonnes.
Cement
Aggregates
Other construction materials and services
8
Consolidated key figures for cement in 2011Production capacity cement in million t 216.0 Cement and grinding plants 149Sales of cement in million t 144.3Net sales1 in million CHF 13,379Operating EBITDA1 in million CHF 3,245Personnel 51,4921 Includes all other cementitious materials.
Consolidated sales of cement 2011 per region1 en Europe 26.8 million tNorth America 11.4 million tLatin America 24.2 million tAfrica Middle East 8.7 million tAsia Pacific 75.6 million t1 Inter-regional sales –2.4 million t
Consolidated key figures for aggregates in 2011Aggregates plants 492Sales of aggregates in million t 173.0Net sales in million CHF 2,523Operating EBITDA in million CHF 522Personnel 6,898
Consolidated key figures for other construction materials and services in 2011Ready-mix concrete plants 1,435Asphalt plants 105Sales of ready-mix concrete in million m3 48.4Sales of asphalt in million t 10.3Net sales in million CHF 7,680Operating EBITDA in million CHF 191Personnel 22,469
Consolidated sales of aggregates 2011 per regionEurope 83.0 million tNorth America 43.5 million tLatin America 14.5 million tAfrica Middle East 2.3 million tAsia Pacific 29.7 million t
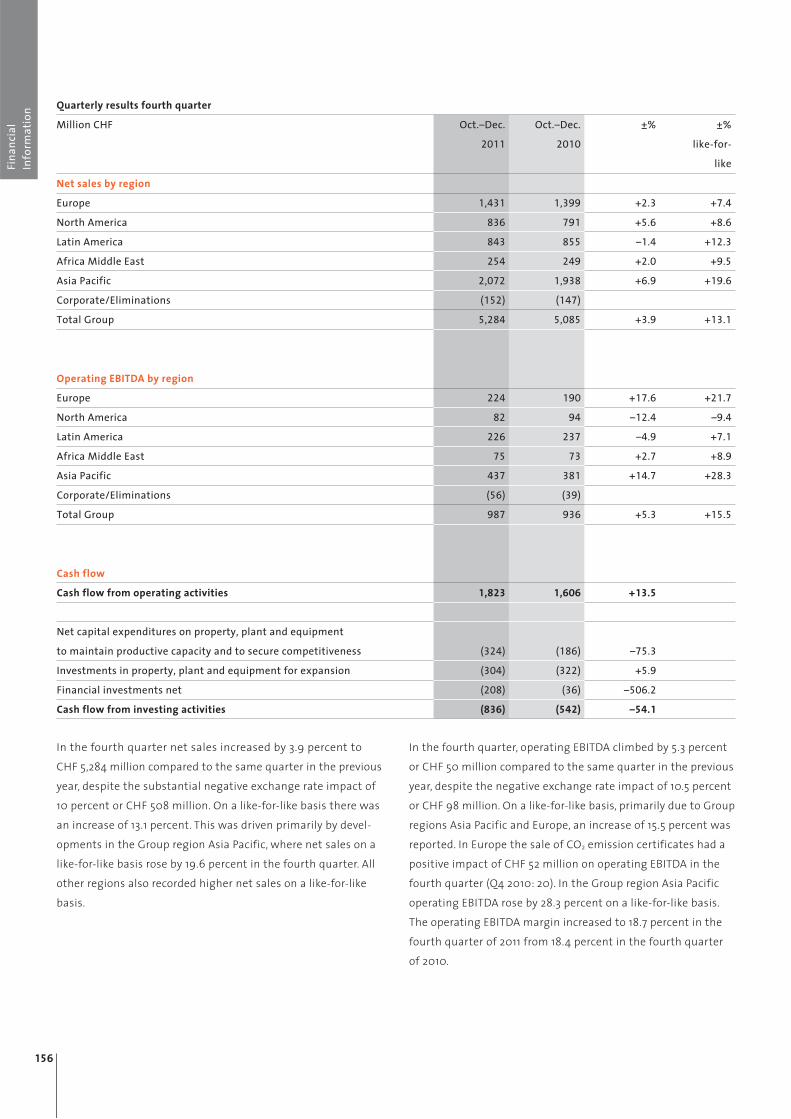
Sales of cement
Million t
2008 2010 201120092007
160
140
120
100
80
60
40
20
0
Sales of aggregates
Million t
2008 2010 201120092007
200
180
160
140
120
100
80
60
40
20
0
Sales of ready-mix concrete
Million m3
2008 2010 201120092007
50
40
30
20
10
0
Annu
al R
evie
w 20
11
9
Dear Shareholder,100 years
This is a very special year for our company: it turns 100. We are pleased to be able to celebrate our centennial.On February 15, 1912, the Aargauische Portlandcementfabrik was founded with the purpose of building a ce-ment factory in the small farming village of Holderbank in the Swiss canton of Aargau. In 1913, the plant wascommissioned and in its first year produced 90,000 tonnes of cement. That may not seem much by today’sstandards, but at the time the factory and its modern technology made a difference. Another notable differ-ence was the entrepreneurial energy brought to the enterprise by Ernst Schmidheiny – a businessman whojoined the company soon after it was founded. Looking back over a century, it is clear that already in the earlyyears the company’s hallmarks, such as “technological leadership”, “growing international presence”, and “integration of employees at all levels” were part and parcel of its corporate thinking and actions.
World War One put a temporary brake on the company’s development. But soon it moved into Belgium,France, Lebanon, Egypt, and elsewhere. The figures in this Annual Report illustrate once again how systemati-cally the company has pursued international expansion. The 90,000 tonnes in small Holderbank have growninto a cement capacity of 216 million tonnes in 149 plants, plus 492 aggregates plants and 1,435 ready-mixconcrete plants. This growth reflects how the world has changed. Cities have grown and industries have ex-panded, as has the infrastructure they need: schools and hospitals, airports and railways, roads, bridges, anddams. This has created markets for building materials. But these opportunities had to be grasped – by busi-nessmen and investors who had the courage to commit themselves and their own funds. They could neverhave done it on their own, and they knew it. For the past 100 years the corporate strategy has been put intoeffect by employees at all levels. Hence, it is no coincidence that they, the employees – in the plants on allcontinents – are the center of attention in this centennial year. Highly renowned photographers depict thepeople as they are. The ensuing book is intended to express the respect and gratitude that those at the headof the company have for these people – and for those who went before them.
In the financial year under review, the world has been a source of progress for us, but also of setbacks; a lot has remained the same, but some things are changing as well.
Sales grow in all segments
Holcim increased sales of cement, aggregates, and ready-mix concrete in four of its five Group regions. Onlythe Group region Africa Middle East delivered slightly lower volumes. Aggregates experienced the strongestgrowth, especially in Latin America and Asia. Sales of cement were also impressive in Latin America, followedby Asia – no surprise there. In North America sales of ready-mix concrete were supported by acquisitions. Thestrongest organic growth was achieved by the Group companies in Latin America.
100 years – from a small factory to a global enterprise
10
A world of multiple speeds
A pattern that has been developing for some time which continued in 2011: The global economy is changingand developing at different speeds. Unsurprisingly, the impact of this process is particularly noticeable in thebuilding materials industry. In mature markets, where the construction industry in some instances had tofundamentally re-orient itself, demand expanded only slowly, and at times even contracted. Spain, a marketthat had long been one of Holcim’s key contributors, is a case in point. However, the emerging markets in Asia and Latin America continued to grow robustly. We note with concern how energy and transport costsrose and signs of inflation began to appear here and there. Natural catastrophes also impacted constructionactivity. Holcim itself was directly affected by the severe flooding in eastern Australia and Thailand, as well asthe earthquake in New Zealand.
Company management responds to the situation
Individual markets may pose serious economic challenges, to which management must take appropriate ac-tion. Already at the start of the financial crisis in 2008 Holcim introduced measures to reduce fixed costs. In2011 further steps were taken to improve efficiency. Although cost controls, cost cutting, and the ever moreefficient and careful deployment of all resources – raw materials and energy, labor and capital – have been acore corporate focus for the past 100 years, this is of particular importance in current times. As in the past, itmay involve the temporary or permanent closure of production plants for reasons of economics or technol-ogy. In 2011 this happened in our mature markets, and not only in the cement sector, but in all segments, particularly in Spain, Italy, a number of Eastern European countries, and the USA.
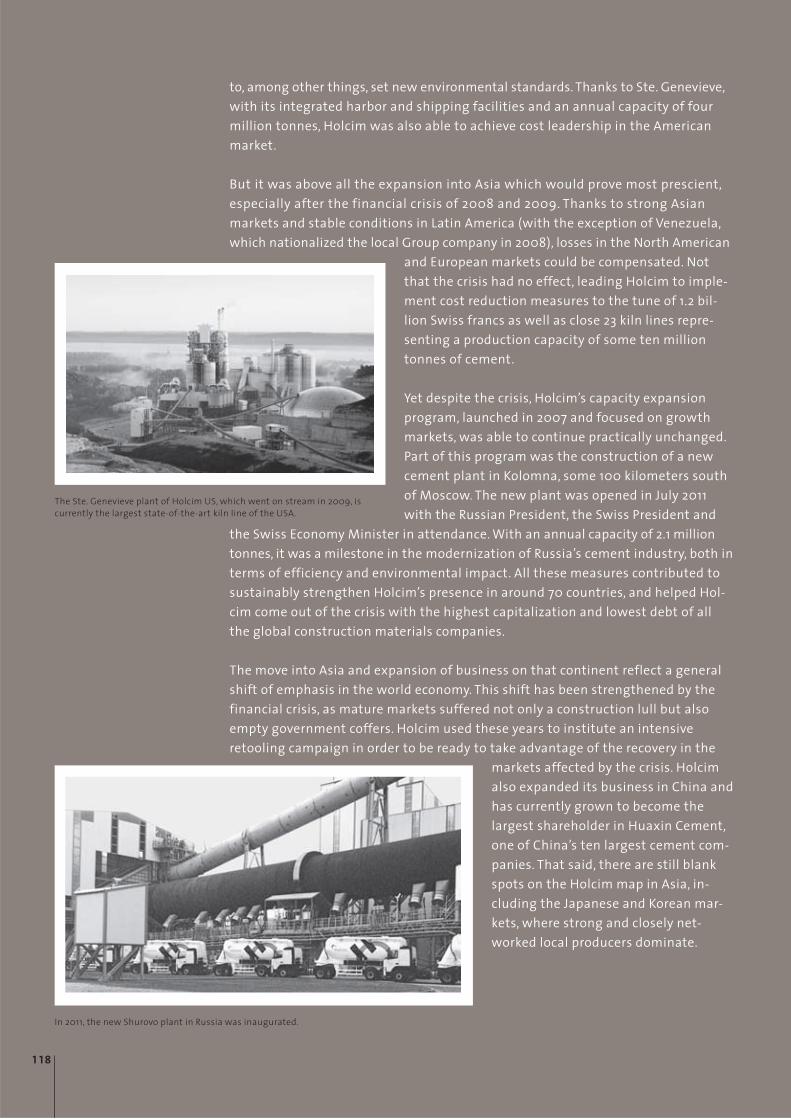
Capacity expanded in important market regions
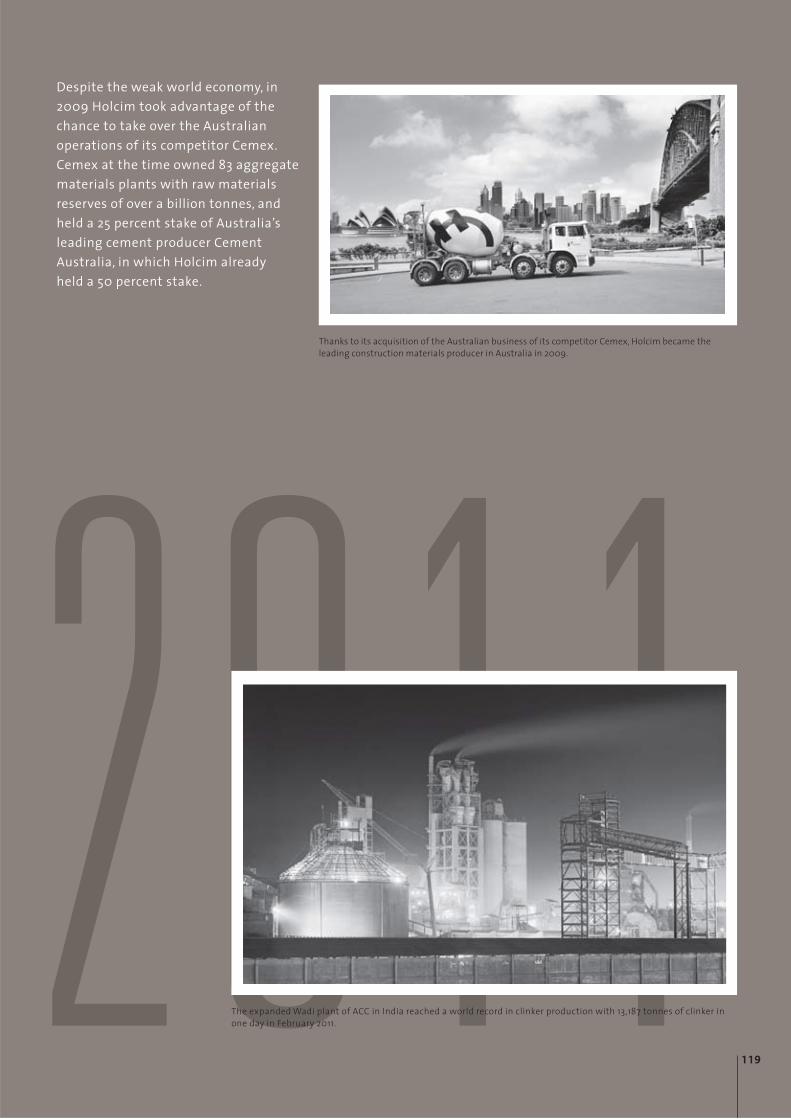
However, as mentioned above, certain major regions are growing. Holcim expanded its capacity in some ofthese markets in 2011. In Russia the new Shurovo plant was commissioned. Probably the most modern plantin the country, it supplies the booming Moscow market with building materials. Shortly before the end of the year the first clinker was produced at Garadagh Cement in Azerbaijan; this new kiln line will strengthenthe Group company’s position in this attractive market. As is well known, in Asia the shortfalls in housing and infrastructure are still enormous. Holcim is making great efforts to adjust existing capacity to thegrowth in demand. In India, ACC commissioned the world’s largest clinker kiln at its Wadi plant; the Chandaplant was also expanded considerably; Ambuja Cements commissioned additional clinker capacity in Rauriand Bhatapara as well as two new grinding facilities; and in 2013 the Tuban plant in Indonesia, a market withhuge potential, will come on stream. In Latin America, cement capacity was significantly increased in Ecuador,and in 2014 Holcim will go on stream with a new kiln line in the Barroso plant in Brazil.
Innovations not only improve products and processes, but also reduce environmental impact
The first plant in Holderbank was regarded as one of the most modern of its age. If Holcim had not continu-ously improved its products and processes, the small cement company would never have grown into a globalenterprise. Today innovation is perhaps even more important. Customers – quite rightly – expect to be offeredsolutions that create added value. Process innovation is driven by various factors: competition, the necessity to
Shar
ehol
ders
’ Let
ter
11
conserve resources, optimization of investment, and opportunities offered by technological developments. Often these are small innovations rather than revolutionary steps, but combined they are significant.
In 2011, Holcim Group Support strengthened and refocused the innovation function with the objective of pro-viding even greater support for Group companies in respect of innovation and speeding up the replication ofbest practices throughout the organization. For examples of innovation-focused activities in the Group pleasesee pages 46 to 48 of this report. The demands of environmental compatibility and resource conservation havemade innovation indispensable. As we are all aware, energy costs have risen appreciably in the past five years.Holcim responded by creating an internal energy fund which supports innovation in the fields of heat recovery,use of alternative fuels and raw materials, wind power and hydroelectricity. It is funded by the sale of CO2emission certificates; although proceeds were lower in 2011 owing to the economic slowdown, there were stillenough funds to support interesting projects. An internal competition attracted numerous promising entriesfor energy projects, all of which were carefully evaluated. All in all, the projects approved to date will enableHolcim to save around 200,000 tonnes of CO2 per year. This is equal to about one sixth of the annual CO2emissions of the city of Zurich.
The figures show: Management is focused on growth and profitability
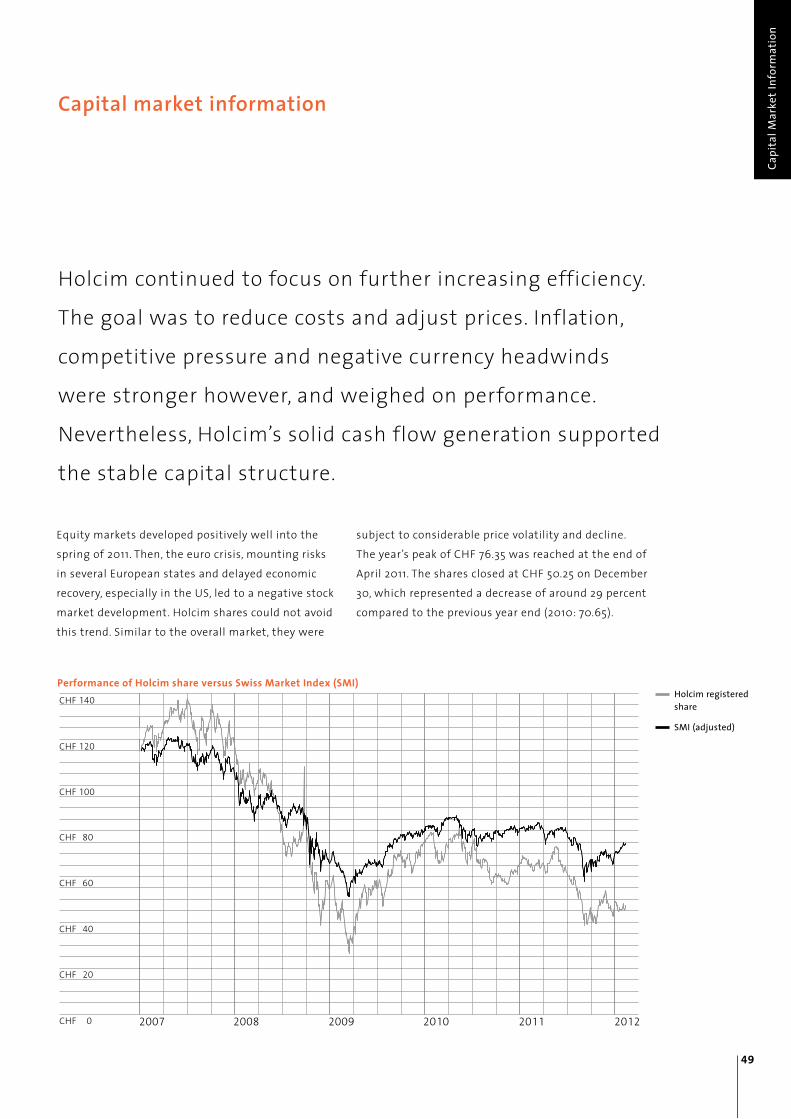
Holcim’s task is to supply its customers on building sites around the world with precisely the products theyneed. Despite weakness in some markets, Holcim succeeded in doing this in 2011. Adjusting for changes in exchange rates and the scope of consolidation, consolidated net sales increased by 7.5 percent. Translatedinto Swiss francs, however, consolidated net sales fell by 4.2 percent to CHF 20.7 billion.
The earnings figures show how productive the company’s operations are, but also the extent to which external circumstances can bolster and at times hamper them. As is well known, the latter is currently thecase. Despite cost increases, which could not be factored into prices everywhere, operating EBITDA was practi-cally stable, down just 0.2 percent on a like-for-like basis, but 12.3 percent lower when measured in Swissfrancs.
The substantial earnings of Holcim Russia and Holcim Australia and improvements in Indonesia, Singapore,Colombia, and Switzerland positively impacted results. In many markets higher costs for raw materials and energy could not immediately be passed on in full. This is one of the factors that impaired financial performance in the Philippines, India, North America, and the UK. Only in the fourth quarter of the year did this situation show signs of easing.
12
Impairments adversely affect consolidated net income, but are cash-neutral
In the 100 years of its existence, Holcim has often had to cope with fundamental changes in its operating environment. Precautions should of course be taken to protect against potential risks, but if they do occur,the consequences must be soberly recognized and resolutely addressed.
In 2007, Holcim responded to the South African policy of promoting Black Economic Empowerment (BEE) by selling a majority interest in AfriSam (formerly Holcim South Africa) to a BEE-compliant consortium; theHolcim Group retained a 15 percent stake in the company. Following a sharp decline in demand for buildingmaterials since 2010, AfriSam was forced to undertake a far-reaching financial restructuring. For Holcim this meant write-offs of CHF 415 million on issued notes, accrued interest, and foreign currency movements. It now holds a 2 percent stake in AfriSam. Because of the weakness in demand, impairments totaling CHF 360million on property, plant and equipment, and goodwill impairment also had to be made in Spain, EasternEurope and the USA.
The impairments, totaling CHF 775 million, are cash-neutral. However, they have to be taken into account inthe annual financial statements. As a result, consolidated net income fell by 57.9 percent to CHF 682 millionand the proportion attributable to shareholders of Holcim Ltd decreased to CHF 275 million. Cash flow fromoperating activities totaled CHF 2.8 billion; cash flow was particularly strong in the fourth quarter of 2011.
Payout proposal for the annual general meeting
Through their contributions and their loyalty, the shareholders have made it possible for the company tothrive for 100 years. Holcim has a solid balance sheet and liquidity position. That, too, is a traditional charac-teristic of the Group which management feels it has a duty to uphold. Although new plants were commis-sioned or are under construction, the Group’s net debt increased by just 1.6 percent to CHF 11.5 billion.
As the aforementioned impairments are cash-neutral, the Board of Directors proposes to the annual generalmeeting to be held in Zurich on April 17, 2012 a payout in the sum of CHF 1.00 per registered share (2011: 1.50).It will be paid from the capital contribution reserves and is consequently subject to the corresponding Swissstatutory provisions.
Shar
ehol
ders
’ Let
ter
13
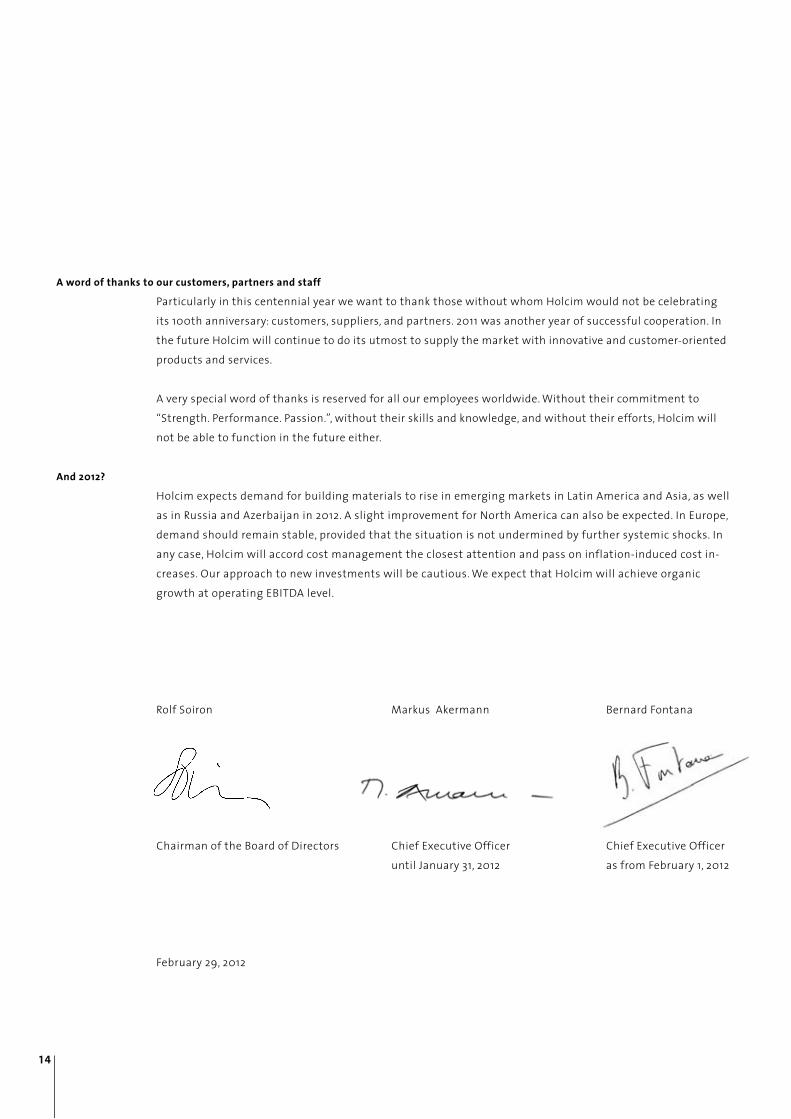
A word of thanks to our customers, partners and staff
Particularly in this centennial year we want to thank those without whom Holcim would not be celebrating its 100th anniversary: customers, suppliers, and partners. 2011 was another year of successful cooperation. Inthe future Holcim will continue to do its utmost to supply the market with innovative and customer-orientedproducts and services.
A very special word of thanks is reserved for all our employees worldwide. Without their commitment to“Strength. Performance. Passion.”, without their skills and knowledge, and without their efforts, Holcim will not be able to function in the future either.
And 2012?
Holcim expects demand for building materials to rise in emerging markets in Latin America and Asia, as wellas in Russia and Azerbaijan in 2012. A slight improvement for North America can also be expected. In Europe,demand should remain stable, provided that the situation is not undermined by further systemic shocks. Inany case, Holcim will accord cost management the closest attention and pass on inflation-induced cost in-creases. Our approach to new investments will be cautious. We expect that Holcim will achieve organicgrowth at operating EBITDA level.
Rolf Soiron Markus Akermann Bernard Fontana
Chairman of the Board of Directors Chief Executive Officer Chief Executive Officer until January 31, 2012 as from February 1, 2012
February 29, 2012
14
15
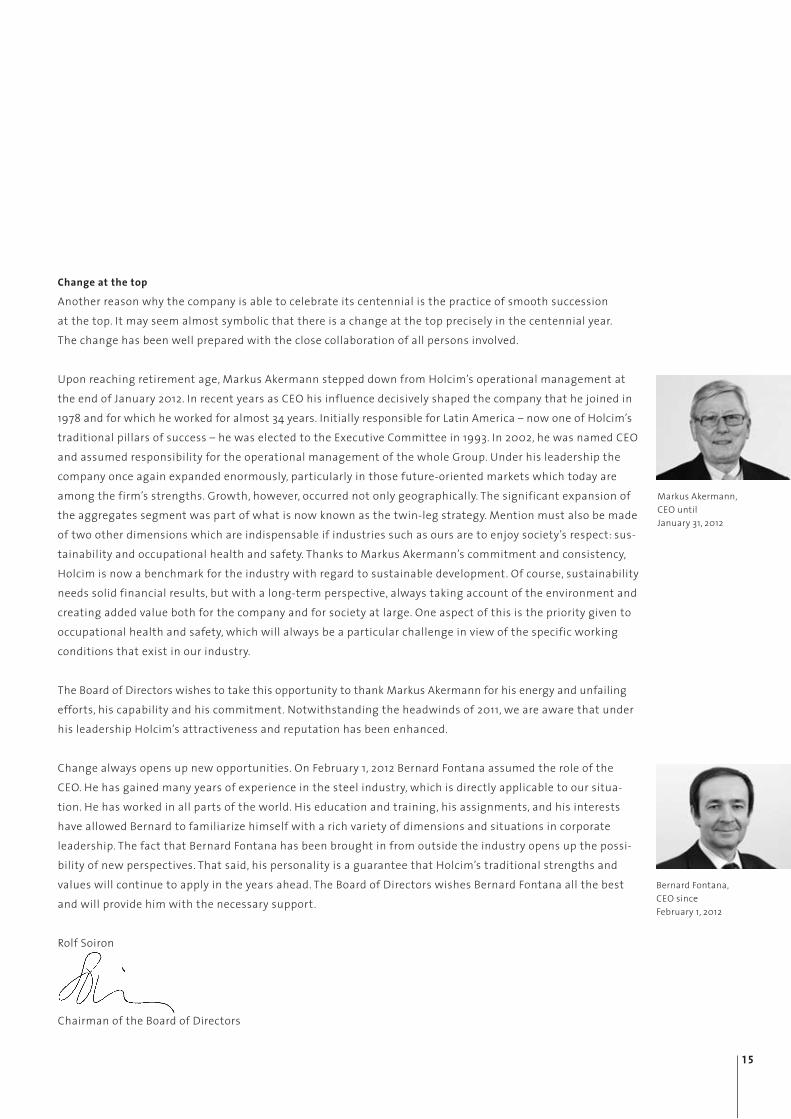
Change at the top
Another reason why the company is able to celebrate its centennial is the practice of smooth succession at the top. It may seem almost symbolic that there is a change at the top precisely in the centennial year. The change has been well prepared with the close collaboration of all persons involved.
Upon reaching retirement age, Markus Akermann stepped down from Holcim’s operational management atthe end of January 2012. In recent years as CEO his influence decisively shaped the company that he joined in1978 and for which he worked for almost 34 years. Initially responsible for Latin America – now one of Holcim’straditional pillars of success – he was elected to the Executive Committee in 1993. In 2002, he was named CEOand assumed responsibility for the operational management of the whole Group. Under his leadership thecompany once again expanded enormously, particularly in those future-oriented markets which today areamong the firm’s strengths. Growth, however, occurred not only geographically. The significant expansion ofthe aggregates segment was part of what is now known as the twin-leg strategy. Mention must also be madeof two other dimensions which are indispensable if industries such as ours are to enjoy society’s respect: sus-tainability and occupational health and safety. Thanks to Markus Akermann’s commitment and consistency,Holcim is now a benchmark for the industry with regard to sustainable development. Of course, sustainabilityneeds solid financial results, but with a long-term perspective, always taking account of the environment andcreating added value both for the company and for society at large. One aspect of this is the priority given tooccupational health and safety, which will always be a particular challenge in view of the specific workingconditions that exist in our industry.
The Board of Directors wishes to take this opportunity to thank Markus Akermann for his energy and unfailingefforts, his capability and his commitment. Notwithstanding the headwinds of 2011, we are aware that underhis leadership Holcim’s attractiveness and reputation has been enhanced.
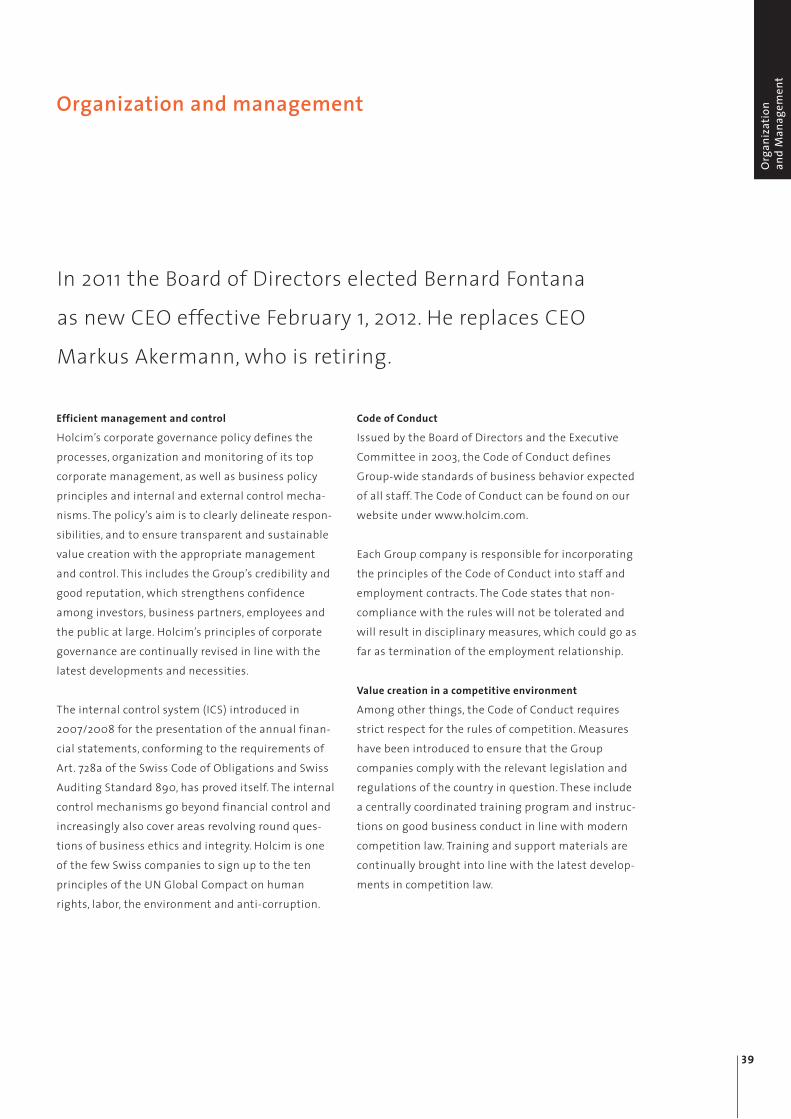
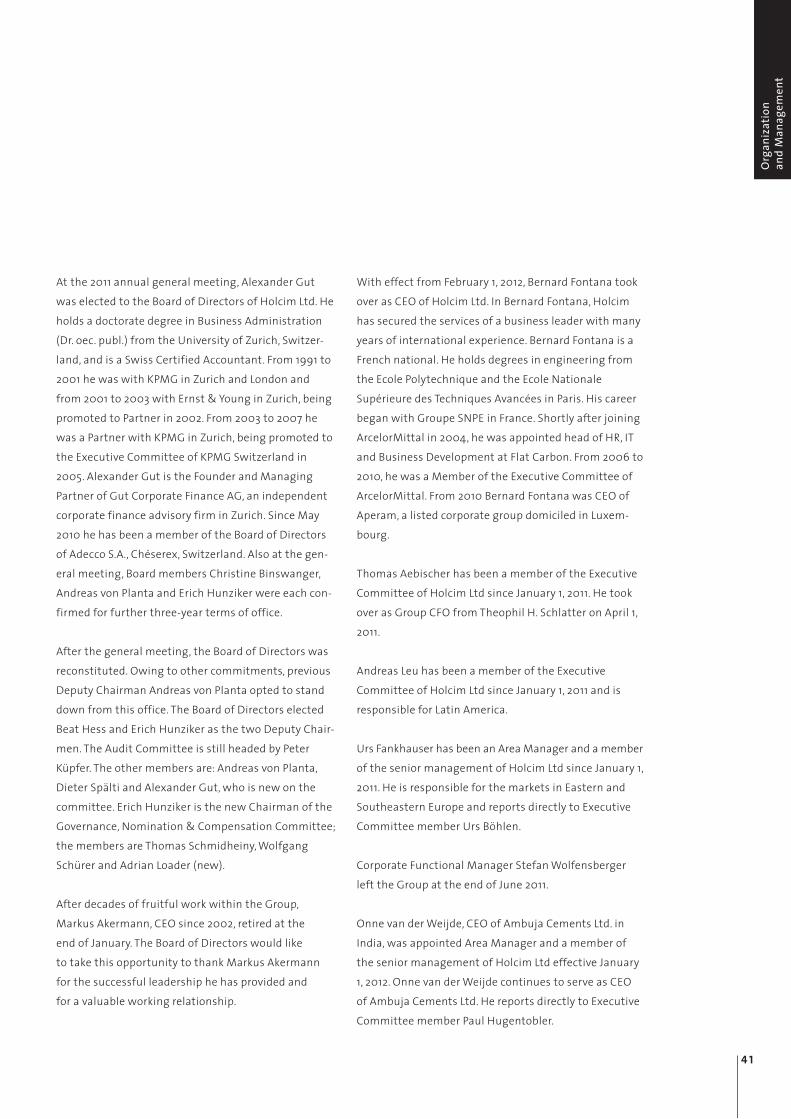
Change always opens up new opportunities. On February 1, 2012 Bernard Fontana assumed the role of theCEO. He has gained many years of experience in the steel industry, which is directly applicable to our situa-tion. He has worked in all parts of the world. His education and training, his assignments, and his interestshave allowed Bernard to familiarize himself with a rich variety of dimensions and situations in corporateleadership. The fact that Bernard Fontana has been brought in from outside the industry opens up the possi-bility of new perspectives. That said, his personality is a guarantee that Holcim’s traditional strengths andvalues will continue to apply in the years ahead. The Board of Directors wishes Bernard Fontana all the bestand will provide him with the necessary support.
Rolf Soiron
Chairman of the Board of Directors
Markus Akermann,CEO until January 31, 2012
Bernard Fontana,CEO sinceFebruary 1, 2012
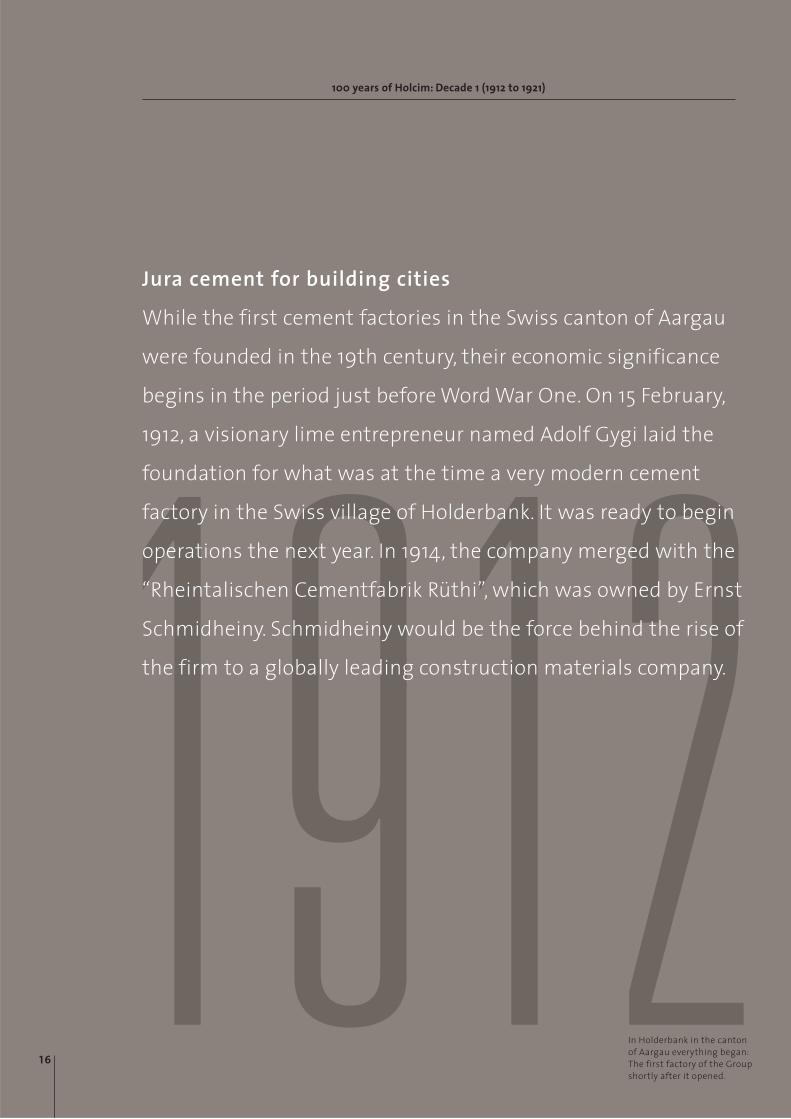
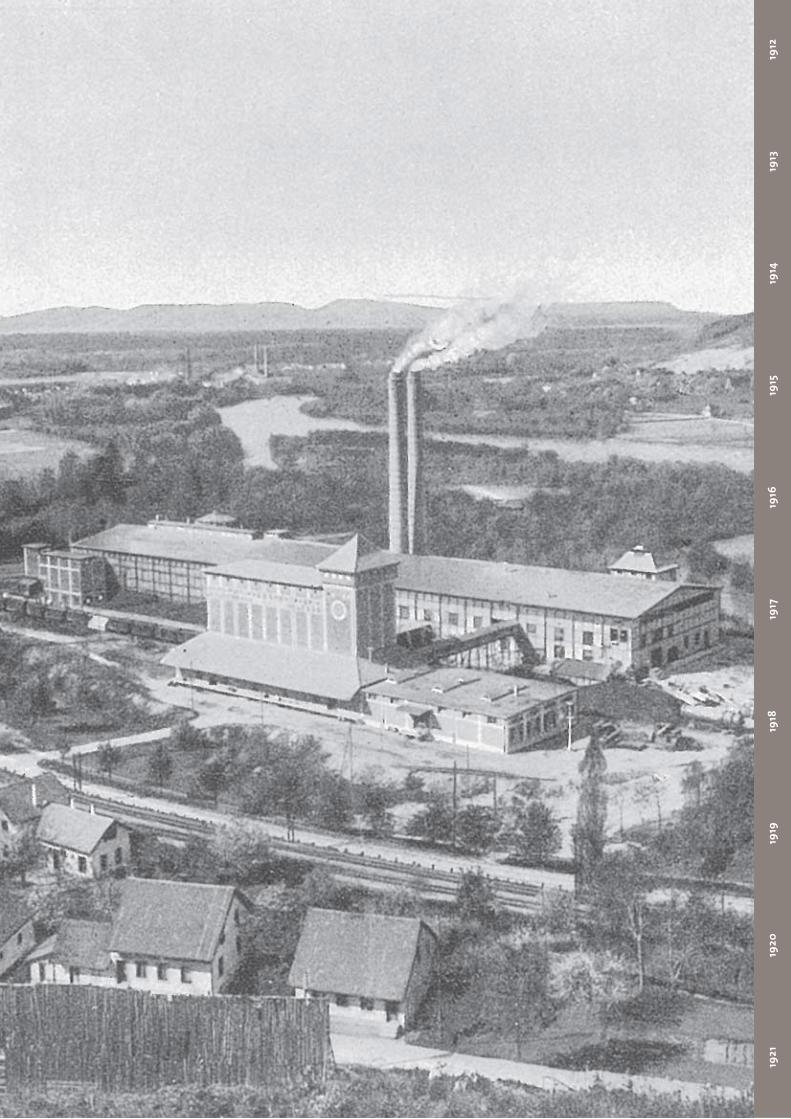
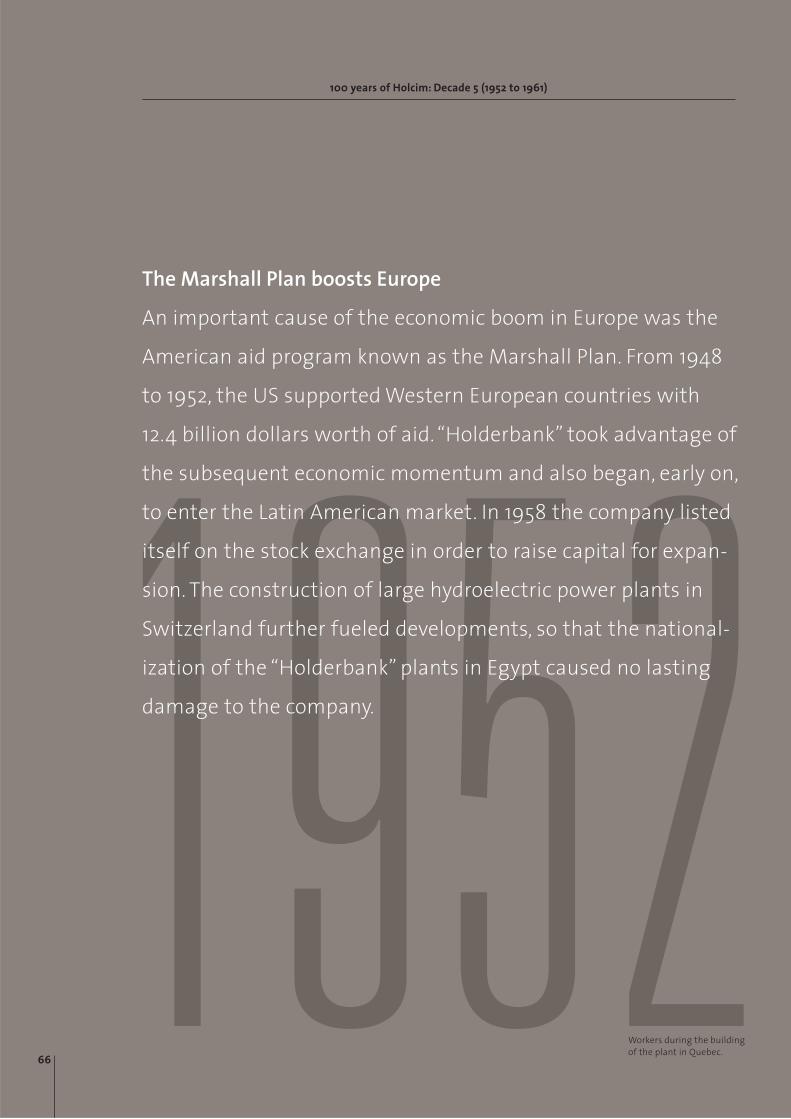
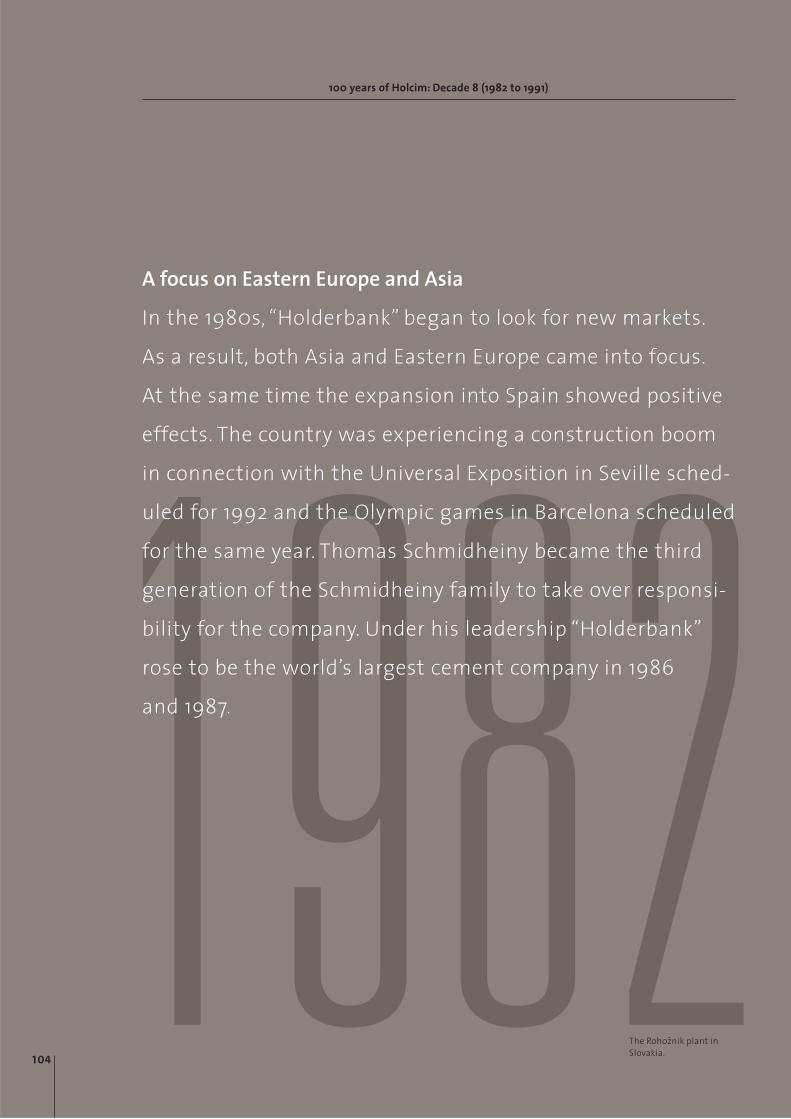
1912While the first cement factories in the Swiss canton of Aargau
were founded in the 19th century, their economic significance
begins in the period just before Word War One. On 15 February,
1912, a visionary lime entrepreneur named Adolf Gygi laid the
foundation for what was at the time a very modern cement
factory in the Swiss village of Holderbank. It was ready to begin
operations the next year. In 1914, the company merged with the
“Rheintalischen Cementfabrik Rüthi”, which was owned by Ernst
Schmidheiny. Schmidheiny would be the force behind the rise of
the firm to a globally leading construction materials company.
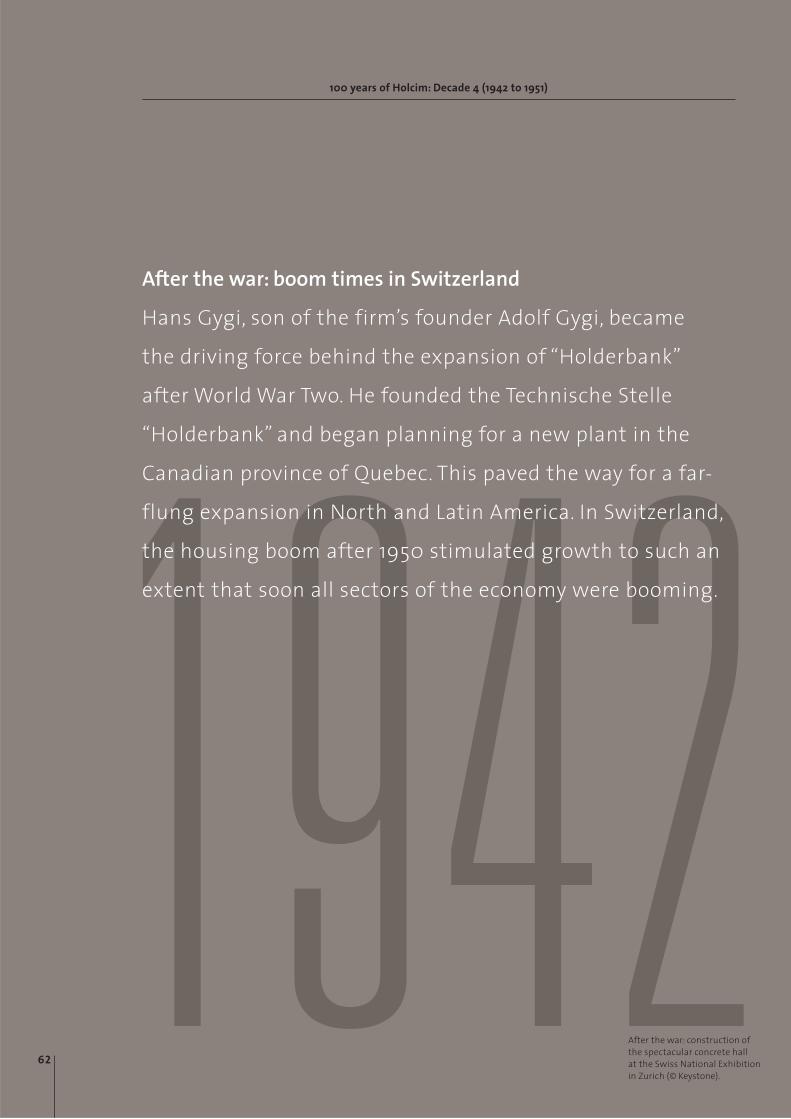
Jura cement for building cities
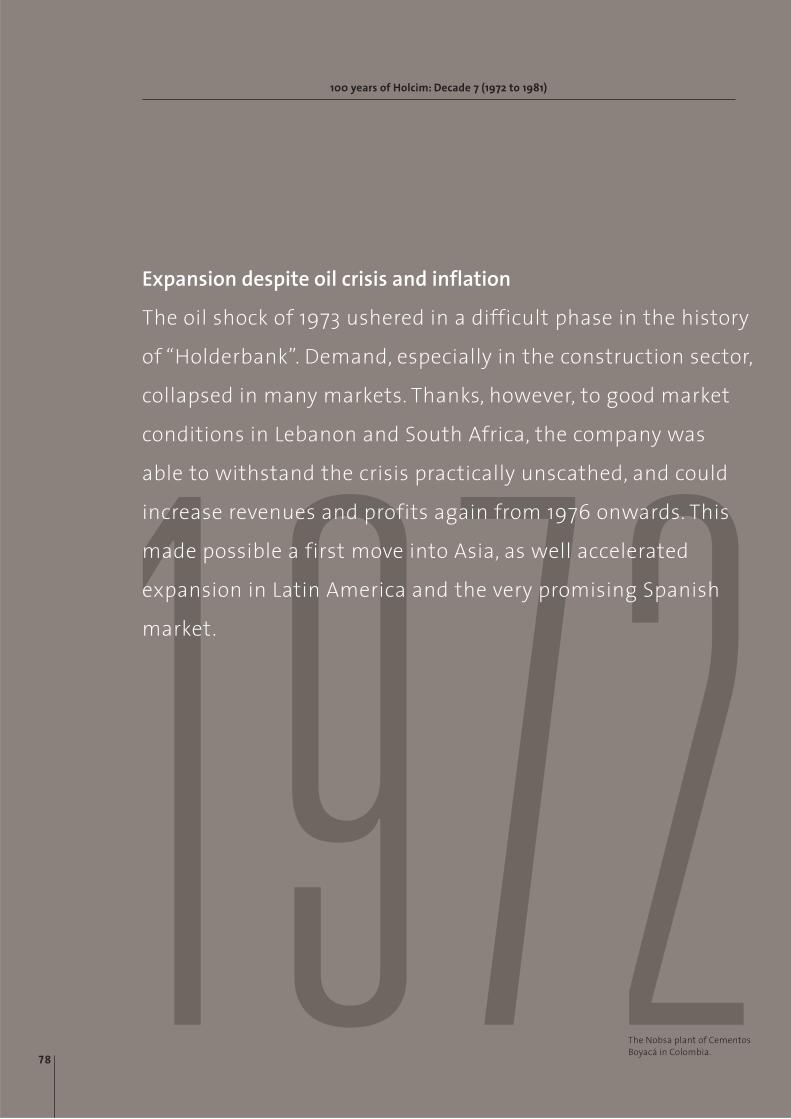
100 years of Holcim: Decade 1 (1912 to 1921)
In Holderbank in the canton of Aargau everything began: The first factory of the Groupshortly after it opened.
16
1912
1913
1914
1915
1916
1917
1918
1919
1920
1921
Twice HolderbankIn the spring of 1913, the districtcouncillors of the Swiss village of Holderbank were summoned to ap-pear before the civil court in Baselas witnesses. The case involved a dispute between cement producersand the operators of a cement factorycalled “Holderbank”which had beenfounded the previous year in theSwiss canton of Aargau. Questionedby the judge, the local politicians hadlittle information to offer. They hadnot heard anything about a newcement factory, nor were they awareof any large land purchases. The judgewas understandably furious at whathe saw as a group of incompetent local representatives – until one ofthe witnesses, in response to a ques-tion, was able to solve the conundrum:they represented the Holderbank inthe canton of Solothurn, not theHolderbank in the canton of Aargau.
In the middle of the 1800s the Swiss canton of Aargau was still a predominantly agricultural region, especially compared to many of the country’s other cantons. Initial attempts at industrialization in the area had not come to much. This all changedwith the construction of the railway in 1858. It not only led to greatly increased demand for lime and cement – it also solved a transportation problem which hadbeen holding back the local earth and stone industries. These included Aargau’s first Roman cement factory, founded back in 1832 by Karl Herosé and ultimately un-successful. Midcentury also saw a short period of cement production in Brugg (also inAargau), but it had to be abandoned after a few years.
The railroad changed all this. By spurring the growth of cities it helped increase demand for cement. With it demand increased for the one raw material essential tocement production and available in great abundance in Aargau: limestone. This wasthanks to the great deposits found in the Jura mountains. For a long time, however,only the lime factories in the area had any success with this promising material– and they were an exception in Switzerland, which otherwise lacks raw materials.
Most of the lime was exported out ofAargau. The canton lagged behind interms of industrial and technical devel-opment for quite a while, and there waslittle know-how in the field of cementproduction.
This all changed with the turn of thecentury. New cement factories began tospring up on both sides of the Jura. By1902 there were already 13 producers inSwitzerland. Yet despite their growingnumbers these producers found them-selves, on the eve of World War One, un-able to meet demand. At the same time,the domestic industry was suffering un-der continued price pressure from neigh-boring countries. In order to protectthemselves, the cement owners started
looking for ways to work together. But it was only in 1910, when an entrepreneur fromthe Rhine valley named Ernst Schmidheiny founded the Eingetragene Genossen-schaft Portland, or E. G. Portland for short, that a first successful attempt at collabo-ration was made.
In 1911, cement usage in Switzerland rose to half a million tonnes. The country’s ce-ment plants, several of which were hopelessly out of date, could no longer meet de-mand. This fact was not lost on Adolf Gygi, then the director of the Portland CementFactory Laufen. His father Philipp owned a lime factory in Holderbank and knew thelocal conditions well. The elder Gygi had already begun buying parcels of land in atown called Holderbank with an eye to building a cement factory there and one dayturning it over to his son.
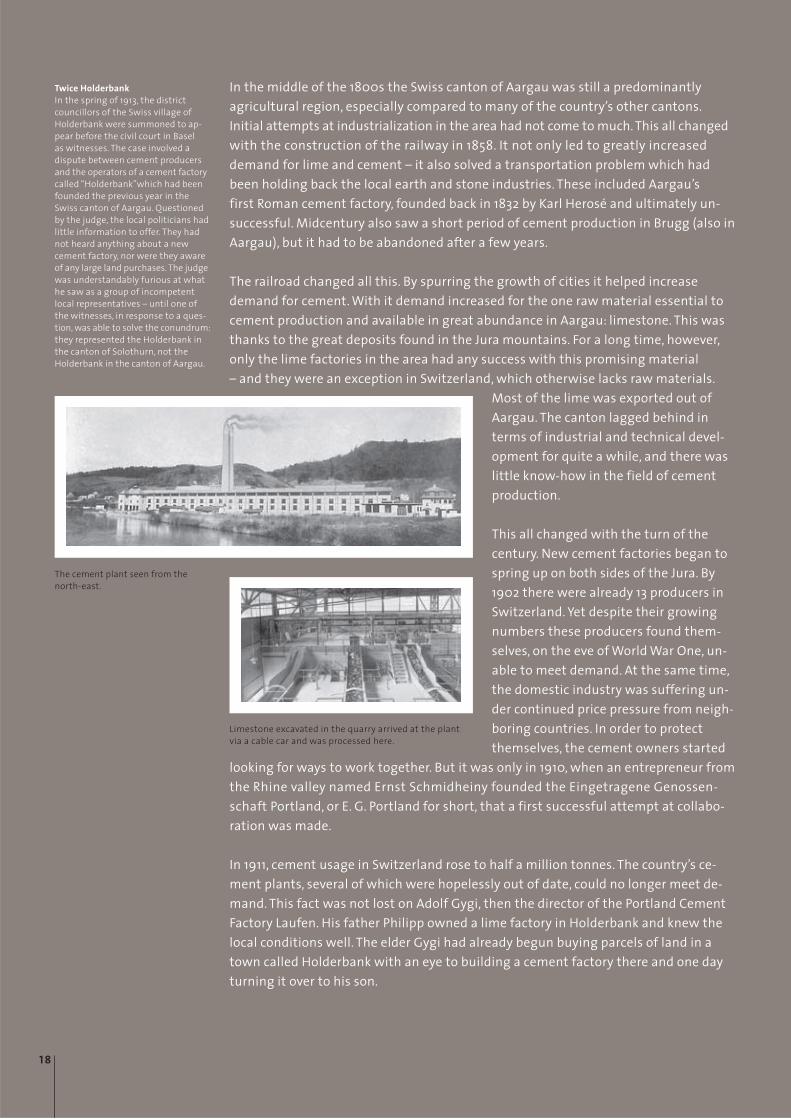
The cement plant seen from thenorth-east.
Limestone excavated in the quarry arrived at the plantvia a cable car and was processed here.
18
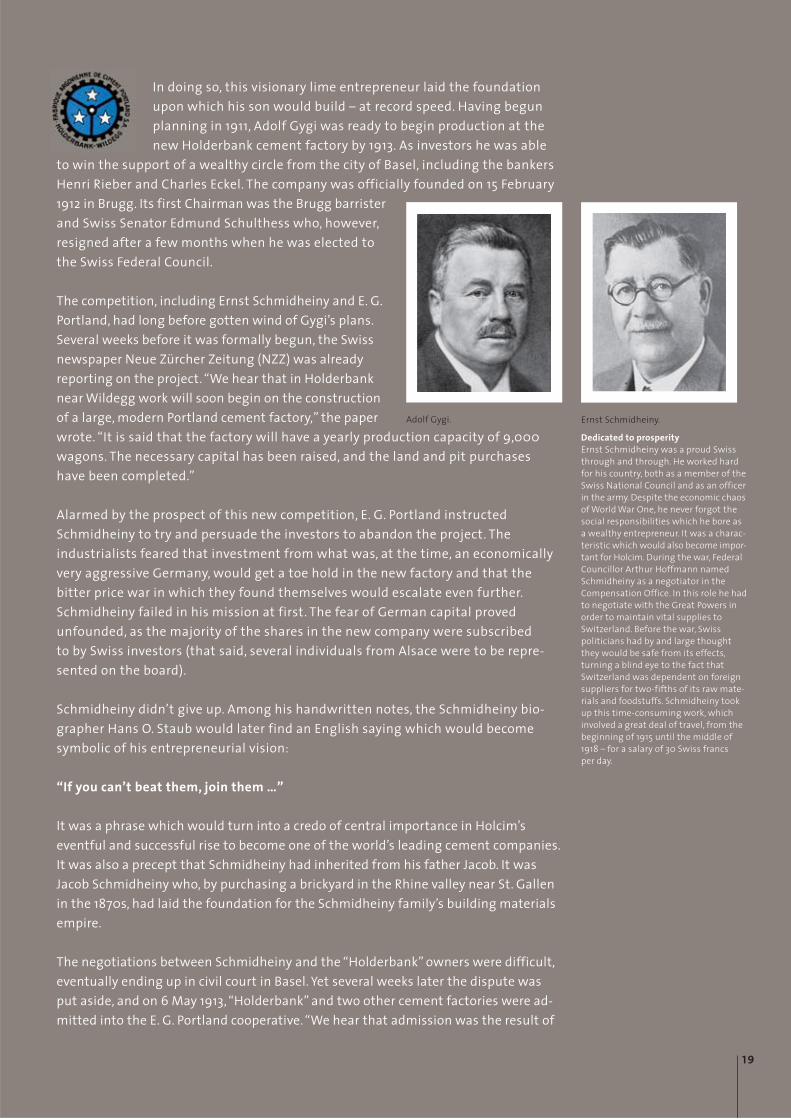
In doing so, this visionary lime entrepreneur laid the foundationupon which his son would build – at record speed. Having begunplanning in 1911, Adolf Gygi was ready to begin production at thenew Holderbank cement factory by 1913. As investors he was able
to win the support of a wealthy circle from the city of Basel, including the bankersHenri Rieber and Charles Eckel. The company was officially founded on 15 February1912 in Brugg. Its first Chairman was the Brugg barristerand Swiss Senator Edmund Schulthess who, however,resigned after a few months when he was elected tothe Swiss Federal Council.
The competition, including Ernst Schmidheiny and E. G.Portland, had long before gotten wind of Gygi’s plans.Several weeks before it was formally begun, the Swissnewspaper Neue Zürcher Zeitung (NZZ) was already reporting on the project. “We hear that in Holderbanknear Wildegg work will soon begin on the constructionof a large, modern Portland cement factory,” the paperwrote. “It is said that the factory will have a yearly production capacity of 9,000wagons. The necessary capital has been raised, and the land and pit purchaseshave been completed.”
Alarmed by the prospect of this new competition, E. G. Portland instructed Schmidheiny to try and persuade the investors to abandon the project. The industrialists feared that investment from what was, at the time, an economicallyvery aggressive Germany, would get a toe hold in the new factory and that the bitter price war in which they found themselves would escalate even further.Schmidheiny failed in his mission at first. The fear of German capital proved unfounded, as the majority of the shares in the new company were subscribed to by Swiss investors (that said, several individuals from Alsace were to be repre-sented on the board).
Schmidheiny didn’t give up. Among his handwritten notes, the Schmidheiny bio-grapher Hans O. Staub would later find an English saying which would becomesymbolic of his entrepreneurial vision:
“If you can’t beat them, join them …”
It was a phrase which would turn into a credo of central importance in Holcim’seventful and successful rise to become one of the world’s leading cement companies.It was also a precept that Schmidheiny had inherited from his father Jacob. It was Jacob Schmidheiny who, by purchasing a brickyard in the Rhine valley near St. Gallenin the 1870s, had laid the foundation for the Schmidheiny family’s building materialsempire.
The negotiations between Schmidheiny and the “Holderbank” owners were difficult,eventually ending up in civil court in Basel. Yet several weeks later the dispute wasput aside, and on 6 May 1913, “Holderbank” and two other cement factories were ad-mitted into the E. G. Portland cooperative. “We hear that admission was the result of
Dedicated to prosperityErnst Schmidheiny was a proud Swissthrough and through. He worked hardfor his country, both as a member of theSwiss National Council and as an officerin the army. Despite the economic chaosof World War One, he never forgot thesocial responsibilities which he bore asa wealthy entrepreneur. It was a charac-teristic which would also become impor-tant for Holcim. During the war, FederalCouncillor Arthur Hoffmann namedSchmidheiny as a negotiator in theCompensation Office. In this role he hadto negotiate with the Great Powers inorder to maintain vital supplies toSwitzerland. Before the war, Swisspoliticians had by and large thoughtthey would be safe from its effects,turning a blind eye to the fact thatSwitzerland was dependent on foreignsuppliers for two-fifths of its raw mate-rials and foodstuffs. Schmidheiny tookup this time-consuming work, which involved a great deal of travel, from thebeginning of 1915 until the middle of1918 – for a salary of 30 Swiss francs per day.
Adolf Gygi. Ernst Schmidheiny.
19
long, drawn-out negotiations,” wrote the NZZ a day later. Noteworthy here is thefact that it was Ernst Schmidheiny who had led the negotiations, mainly with an eyeto gaining a foothold for himself in the “Holderbank” company.
Schmidheiny clearly saw both the potential and the technical superiority of the newoperation. In an early phase of the negotiations he even offered to close some unprof-itable businesses of his own, if this would help convince the owners that the unionmade sense. This persistence would be rewarded. In 1914 “Holderbank” merged withthe Rheintalischen Cementfabrik Rüthi, which Schmidheiny owned. It was a clevermove for two reasons. Not only did Schmidheiny secure for himself a stake in a new,modern cement factory. He also got rid of one of his problem children by closing theRüthi works. This factory in St. Gallen had been more expensive than planned, de-vouring almost twice the originally budgeted investment; the operation also neverreally took off, as the quality of the raw materials was poor.
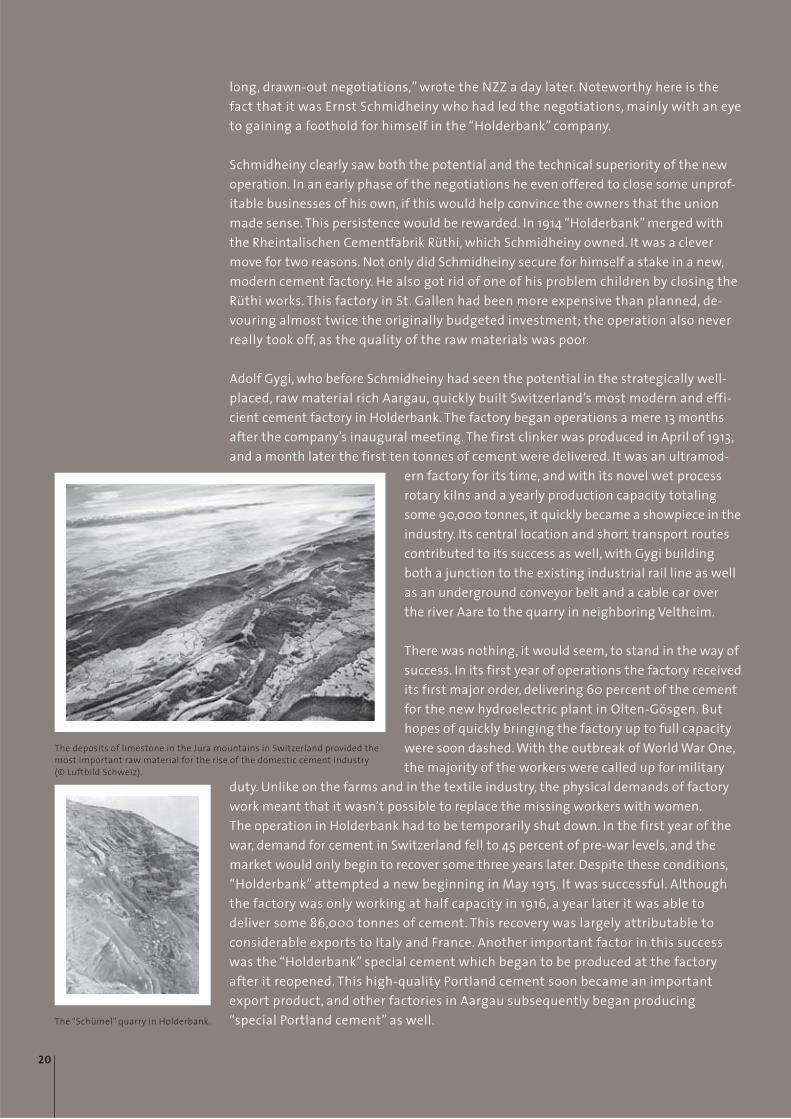
Adolf Gygi, who before Schmidheiny had seen the potential in the strategically well-placed, raw material rich Aargau, quickly built Switzerland’s most modern and effi-cient cement factory in Holderbank. The factory began operations a mere 13 monthsafter the company’s inaugural meeting. The first clinker was produced in April of 1913,and a month later the first ten tonnes of cement were delivered. It was an ultramod-
ern factory for its time, and with its novel wet process rotary kilns and a yearly production capacity totalingsome 90,000 tonnes, it quickly became a showpiece in theindustry. Its central location and short transport routescontributed to its success as well, with Gygi buildingboth a junction to the existing industrial rail line as wellas an underground conveyor belt and a cable car over the river Aare to the quarry in neighboring Veltheim.
There was nothing, it would seem, to stand in the way ofsuccess. In its first year of operations the factory receivedits first major order, delivering 60 percent of the cementfor the new hydroelectric plant in Olten-Gösgen. Buthopes of quickly bringing the factory up to full capacitywere soon dashed. With the outbreak of World War One,the majority of the workers were called up for military
duty. Unlike on the farms and in the textile industry, the physical demands of factorywork meant that it wasn’t possible to replace the missing workers with women. The operation in Holderbank had to be temporarily shut down. In the first year of thewar, demand for cement in Switzerland fell to 45 percent of pre-war levels, and themarket would only begin to recover some three years later. Despite these conditions,“Holderbank” attempted a new beginning in May 1915. It was successful. Althoughthe factory was only working at half capacity in 1916, a year later it was able to deliver some 86,000 tonnes of cement. This recovery was largely attributable toconsiderable exports to Italy and France. Another important factor in this successwas the “Holderbank” special cement which began to be produced at the factory after it reopened. This high-quality Portland cement soon became an important export product, and other factories in Aargau subsequently began producing “special Portland cement” as well.
1921Ernst Schmidheiny hadbet on the right horse.not only did he receive aconsiderable amount ofequity in “Holderbank”through the merger, hewas also elected to theBoard of Directors. Therehe was able to rapidlybuild up his influence, until the Board namedhim a Managing Director.In 1921, he became Chair-man. It was a position he likely would have assumed more quickly had it not beenfor the chaos of the war years, which demanded a great deal from Schmidheiny onmany fronts – not just as an entrepreneur, but also in his capacity as an economicnegotiator for the Swiss Confederation.
With the post-war rebound, Schmidheiny could again concentrate on his businessinterests. As he worked his way up to the Chairmanship of “Holderbank”, the busi-ness credo he had worked under for decades finally paid off for him in Aargau as well. Instead of battling his original adversaries, he successfully sought affiliationwith them, which led gradually to his assuming full control of this highly produc-tive factory:
“If you can’t beat them, join them …”
After finally taking over, Schmidheiny promptly established syndicates with theVigier cement works in Luterbach and the Portland Cement Factory Laufen, both ofwhich were sealed with stock swaps. In doing so, Schmidheiny helped “Holderbank”achieve an outstanding position, and gained two further board memberships for himself too. These business relationships were built primarily on the basis of his already extensive experience in the cement market. Shortly thereafterSchmidheiny helped his new partners to close two cement factories and concen-trate their production on the more important operation in Reuchenette in the canton of Bern. A scant 15 years after going into the cement business in his nativeRhine valley with the factory in Rüthi, this visionary entrepreneur from St. Gallenhad become one of the central figures in the Swiss cement industry.
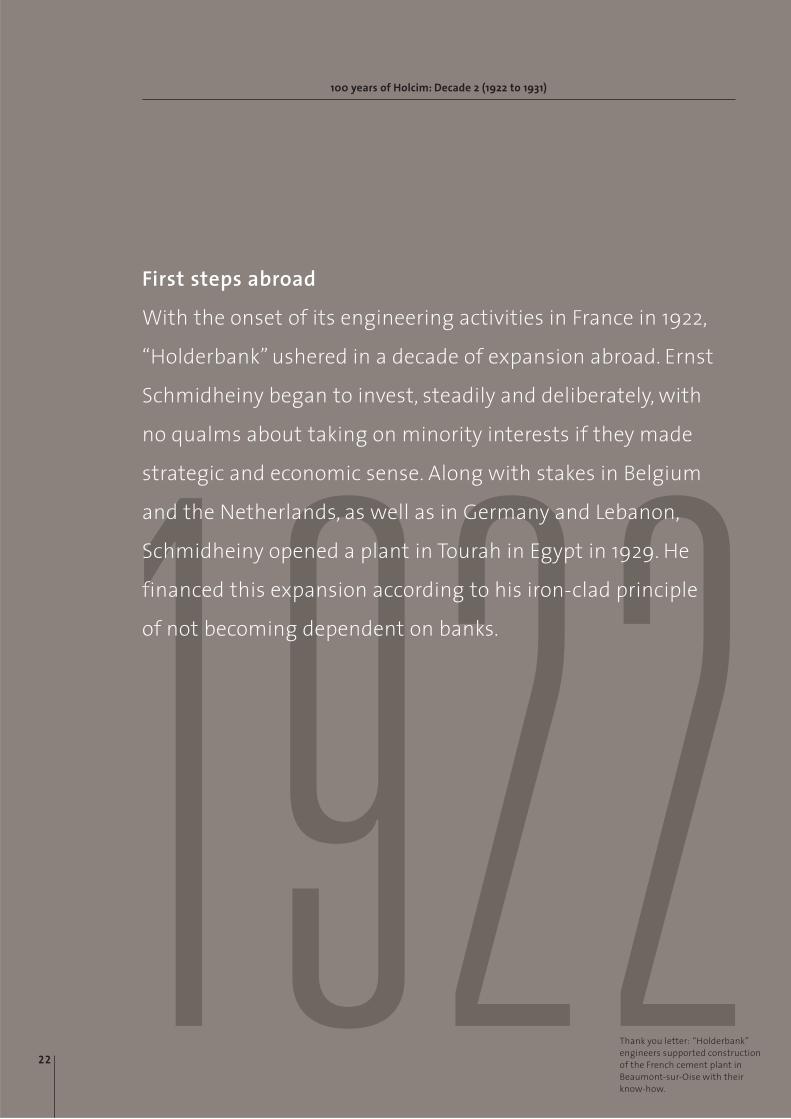
Transport of the raw material with a cable car directly into the pro-duction halls.
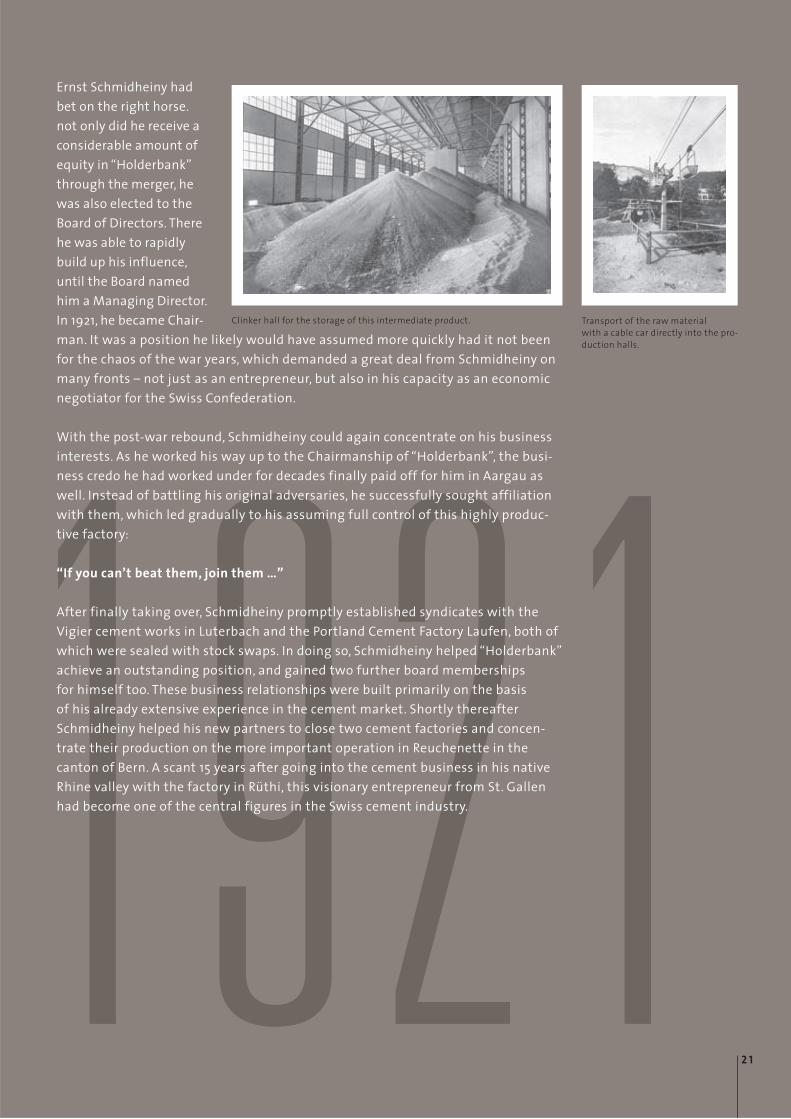
Clinker hall for the storage of this intermediate product.
1922With the onset of its engineering activities in France in 1922,
“Holderbank” ushered in a decade of expansion abroad. Ernst
Schmidheiny began to invest, steadily and deliberately, with
no qualms about taking on minority interests if they made
strategic and economic sense. Along with stakes in Belgium
and the Netherlands, as well as in Germany and Lebanon,
Schmidheiny opened a plant in Tourah in Egypt in 1929. He
financed this expansion according to his iron-clad principle
of not becoming dependent on banks.
First steps abroad
100 years of Holcim: Decade 2 (1922 to 1931)
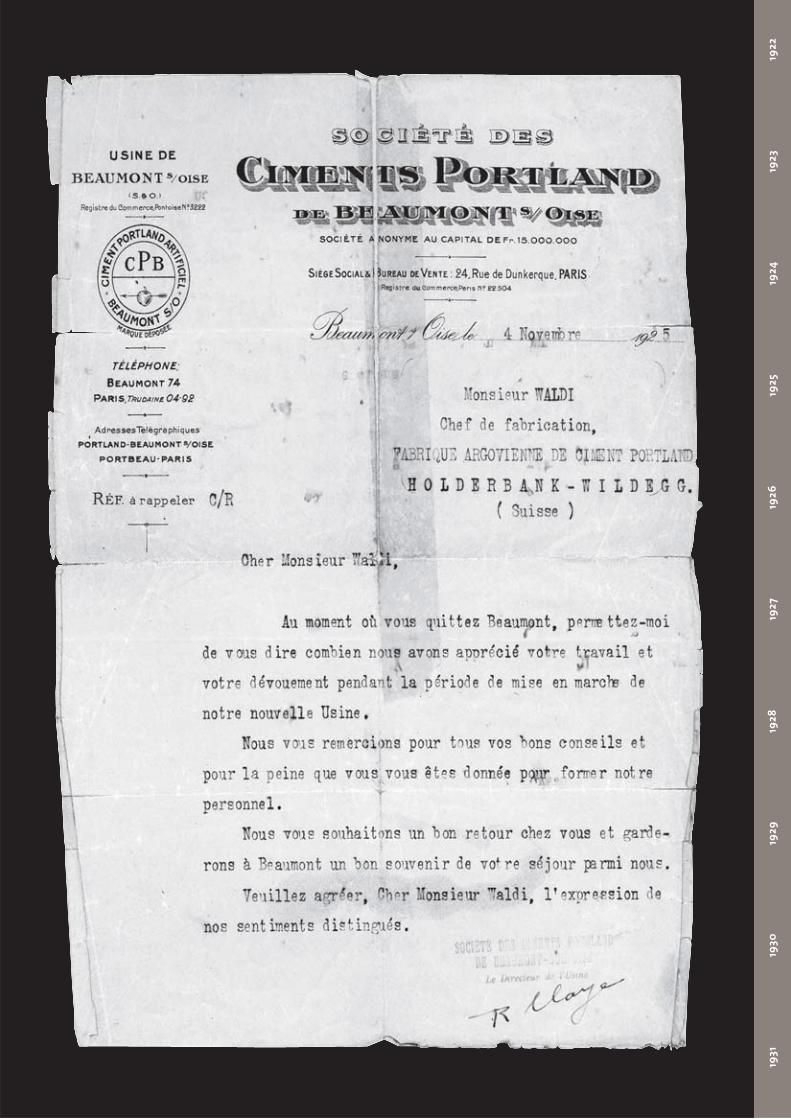
Thank you letter: “Holderbank”engineers supported constructionof the French cement plant in Beaumont-sur-Oise with theirknow-how.
22
1922
1923
1924
1925
1926
1927
1928
1929
1930
1931
At the beginning of the Golden 20s Ernst Schmidheiny, along with “Holderbank”founder Adolf Gygi, laid the foundation upon which Holcim would build fordecades to come. It’s possible to trace many of the company’s most importantcharacteristics back to this decade.
In 1922, “Holderbank” engineers began their first activities abroad, using their technical know-how to support the construction of a cement plant in Beaumont-sur-Oise, south of Paris. The work was carried out on behalf of the Société Suisse de Ciment Portland SA of Neuchâtel, in which “Holderbank” at the time had a large stake.
Ernst Schmidheiny had hardly taken over as Chairman of the Board of “Holderbank”when he began pushing to expand abroad. He embarked on a steady series of well-considered transactions, and had no hesitation about taking on minority interestsas long as they made strategic and economic sense. During a trip through Cyprusin the early 1920s, he made a detour to Egypt, having heard about an old cementfactory in Maasara that was for sale. Cement production in Egypt was not really efficient at the time. The situation was so bad that most Egyptian cement had tobe imported. Schmidheiny jumped in. In 1926, he founded the Société Égyptienne
de Ciment Portland Tourah-le Caire with the goal of building an ultramodern cement factory south of Cairo. In 1927, the company was completely in Swiss hands, and two years later the new plant inTourah was opened. Alongside his business interests,Schmidheiny quickly developed a personal affinity toEgypt, and considered emigrating. His wife Vera, whofor health reasons was very fond of the warm climate,liked the idea as well.
It is a measure of their farsightedness that both ErnstSchmidheiny and Adolf Gygi dealt early with the issueof the company’s succession planning. Schmidheiny’ssons Ernst Jr. and Max, as well as Gygi’s son Hans,
were all integrated in various functions at “Holderbank” and quickly learned totake on business-related responsibilities. All three of them would play importantroles in the subsequent development and expansion of the Group. In 1923, Gygi and Schmidheiny sent their sons to the Netherlands and Belgium to scout possiblecement work acquisitions. It would prove to be a fruitful trip. Just two years later,“Holderbank” would take an equity position in Ciments d’Obourg in Belgium and a year later, in 1926, in the Dutch cement plant ENCI. Unfortunately the elder Gygi,who died in an automobile accident in 1924, would not be able to experience thisfirst phase of expansion abroad.
For the younger generation, Adolf Gygi’s death meant an unexpected and some-what premature assumption of leadership roles. In 1924, Ernst Schmidheiny Jr., the elder of Schmidheiny’s two sons, became the head of the cement factory inHolderbank-Wildegg. His father still held the reins of the company firmly in hishands, and continued pushing on with its rapid expansion both at home and abroad.It would only be in the following decade that “Holderbank” would feel the effects
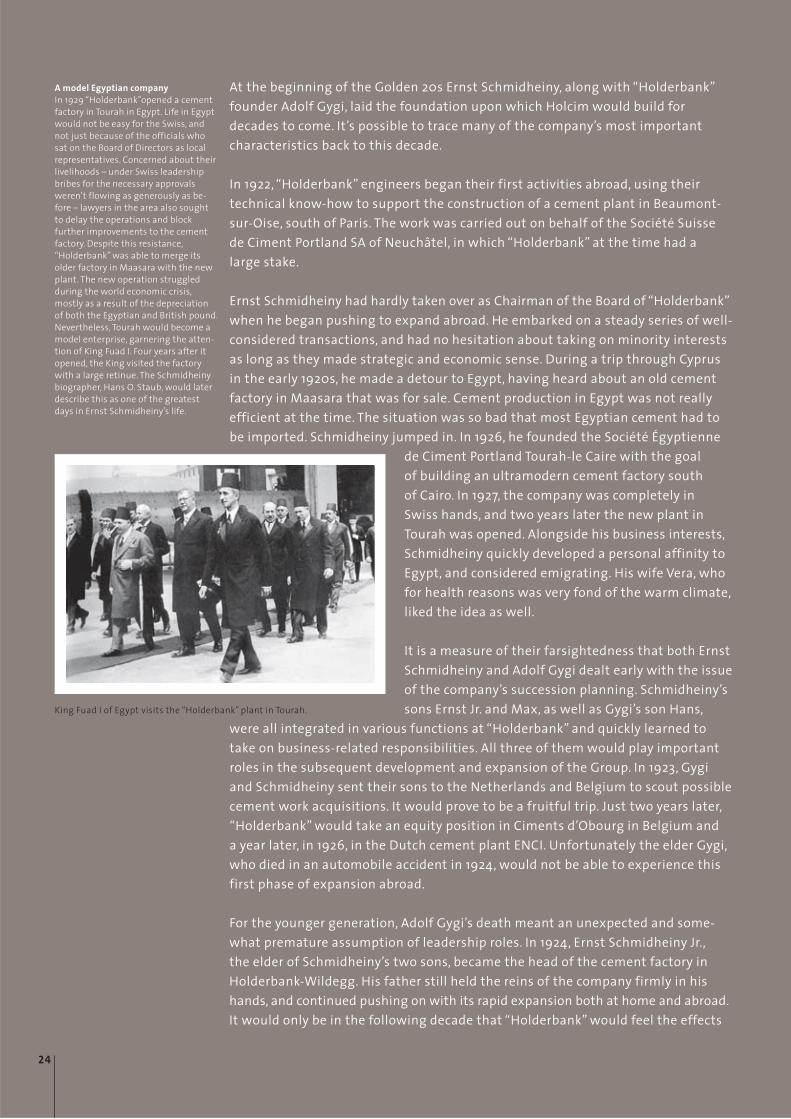
A model Egyptian companyIn 1929 “Holderbank”opened a cementfactory in Tourah in Egypt. Life in Egyptwould not be easy for the Swiss, andnot just because of the officials whosat on the Board of Directors as localrepresentatives. Concerned about theirlivelihoods – under Swiss leadershipbribes for the necessary approvalsweren’t flowing as generously as be-fore – lawyers in the area also soughtto delay the operations and block further improvements to the cementfactory. Despite this resistance,“Holderbank” was able to merge itsolder factory in Maasara with the newplant. The new operation struggledduring the world economic crisis,mostly as a result of the depreciationof both the Egyptian and British pound.Nevertheless, Tourah would become amodel enterprise, garnering the atten-tion of King Fuad I. Four years after itopened, the King visited the factorywith a large retinue. The Schmidheinybiographer, Hans O. Staub, would laterdescribe this as one of the greatestdays in Ernst Schmidheiny’s life.
King Fuad I of Egypt visits the “Holderbank” plant in Tourah.
24
on its business of the world economic crisis of 1929.While sales at many other cement factories collapsed,it had the good luck of being called on to deliver cement for two hydroelectric plants scheduled tostart construction in 1930. One was at Wettingen onthe river Limmat, and the other in the German town of Albbruck on the upper Rhine. It was only after thesetwo jobs were finished that sales at “Holderbank” fell off markedly.
Schmidheiny continued to build up his holdings, forexample in 1927 in a cement factory in Lägerdorf inGermany, and in 1929 in a production facility in Chekkain Lebanon. When it came to financing this expansion,he stuck to his iron-clad principle of avoiding becoming dependent on banks. This was another of Ernst Schmidheiny’s characteristicsthat would play an important role in the history of Holcim later on.(He had already financed the gradual expansion of the flagship factory in Holderbank-Wildegg from two to four wet kilns exclusivelyby raising equity capital.)
This strong desire for financial independence was a result of theproblems he was confronted with after “Black Friday” in October 1929,which signaled the onset of the Great Depression. Both the devalua-tion of the currency and some shady dealings of a Belgian business partner almostruined him. The story was as follows: Schmidheiny had signed guarantees for hisBelgian partner which subsequently led to enormous losses in connection with theImmobiliengesellschaft Glarus AG. As his biographer has traced in minute detail,with the interest on his liabilities amounting to over 100,000 Swiss francs morethan his yearly income, Schmidheiny was close to bankruptcy. Not knowing whatelse to do, he turned to the Schweizerische Volksbank. After initially hesitating, thebank took over Schmidheiny’s stake in the Glarus real estate company, thus freeinghim from the guarantee.
Expansion led to a reorganization of the cement business in 1930. The AargauischePortlandcementfabrik Holderbank-Wildegg was converted into a holding com-pany called “Holderbank” Financière Glarus AG (HOFI). The idea was to separatethe manufacturing business from the new domestic and foreign activities.Schmidheiny wanted a structure which would secure him long-term independ-ence from the banks. The goal was to keep the holding company debt-free and to secure financing via the subsidiaries. At the same time the Schweizerische Cement-Industrie-Gesellschaft (SCI) in Ennenda in the canton of Glarus was con-verted into a holding company. SCI owned the manufacturing company Cement-und Kalkfabrik Unterterzen on the Walensee in the canton of St. Gallen as well as minority interests in cement plants in Greece and Austria. Through an equityswap, Schmidheiny bound HOFI and SCI together. As history would subsequentlyshow, this too would prove to be a prescient move in Holcim’s rise to become oneof the world’s leading cement concerns.
Knowledge as capitalErnst Schmidheiny early on recog-nized the important role knowledgetransfer between the individualplants would play in the growth andexpansion of “Holderbank”. In 1930,the first edition of the “Holderbank”Bulletin appeared, a publication designed to encourage the sharing of know-how and strengthen ties between the different parts of the organization. At the same time,Schmidheiny began organizing yearlymeetings of his technicians andchemists. These set the basis for theStelle für technische Zusammen-arbeit (Center for Technical Coopera-tion) which Schmidheiny’s son Ernst Jr. would set up years later.
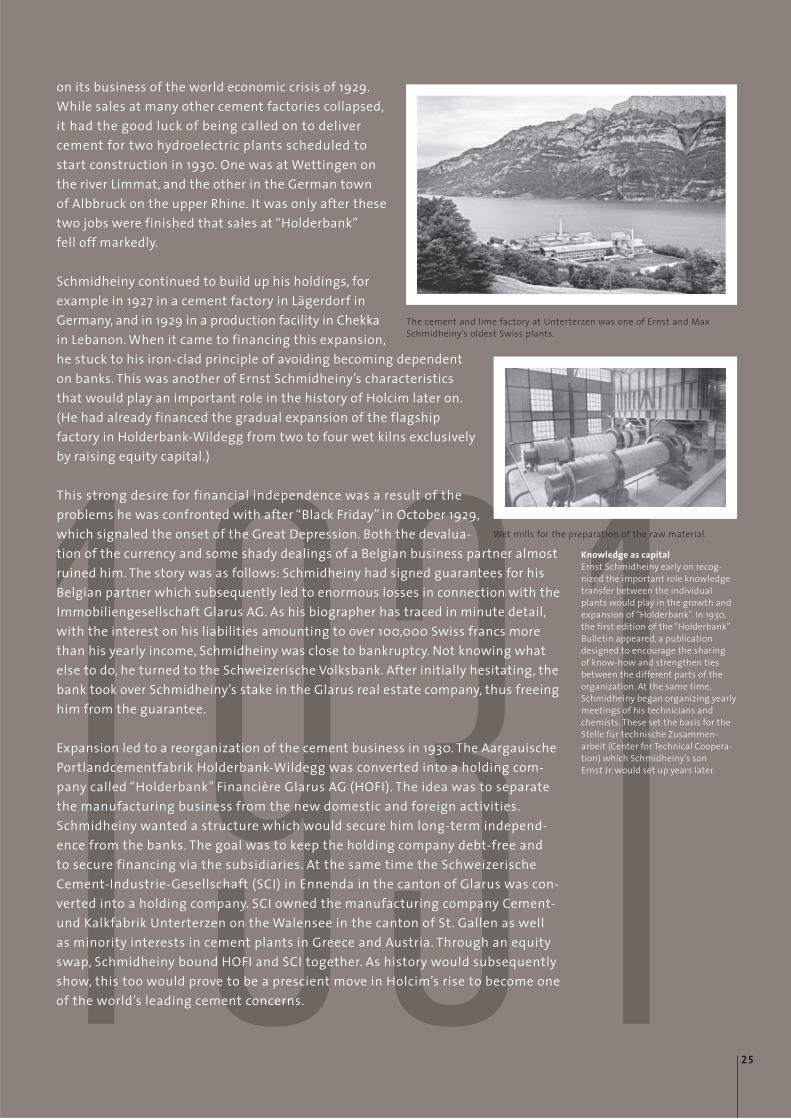
The cement and lime factory at Unterterzen was one of Ernst and MaxSchmidheiny’s oldest Swiss plants.
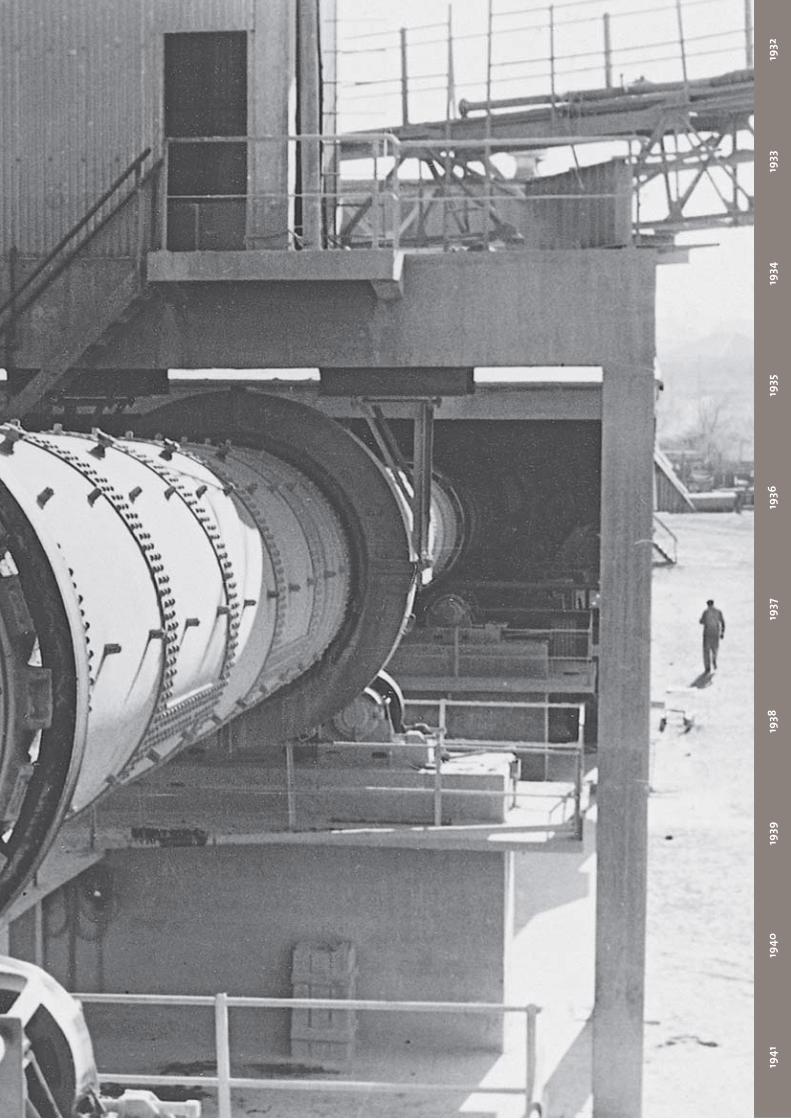
Wet mills for the preparation of the raw material.
25
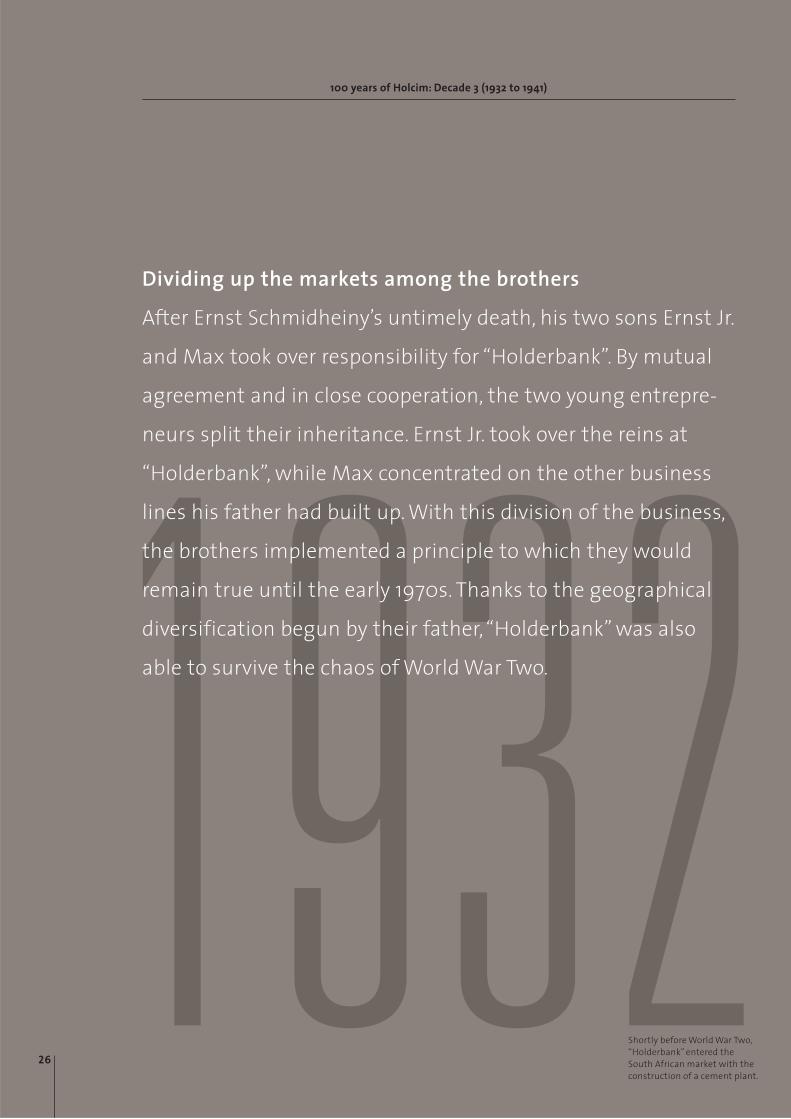
1932After Ernst Schmidheiny’s untimely death, his two sons Ernst Jr.
and Max took over responsibility for “Holderbank”. By mutual
agreement and in close cooperation, the two young entrepre-
neurs split their inheritance. Ernst Jr. took over the reins at
“Holderbank”, while Max concentrated on the other business
lines his father had built up. With this division of the business,
the brothers implemented a principle to which they would
remain true until the early 1970s. Thanks to the geographical
diversification begun by their father, “Holderbank” was also
able to survive the chaos of World War Two.
Dividing up the markets among the brothers
100 years of Holcim: Decade 3 (1932 to 1941)
Shortly before World War Two,“Holderbank” entered the South African market with theconstruction of a cement plant.
26
1932
1933
1934
1935
1936
1937
1938
1939
1940
1941
Ernst Schmidheiny’s unexpected death, the effects of the world economic crisisand the onset of World War Two made Holcim’s third decade the most economi-cally precarious in its 100-year history. Faced with currency turbulence, difficultieswith foreign business partners and crashes in the Swiss and foreign markets inwhich “Holderbank” was active, Schmidheiny’s two sons had a difficult decision tomake. Considering that it would likely be overloaded with debt, should they accepttheir father’s inheritance? Neither Ernst nor Max Schmidheiny, 33 and 27 years oldrespectively, hesitated for long. Despite the desperate times, both would end upmaking far-sighted decisions which would affect the expansion of Holcim fordecades to come. They were supported throughout this difficult period by HansGygi, whose sister Anna Maria had married Ernst Schmidheiny Jr. ten years before.The ensuing connection between these two industrialist families, both so impor-tant to Holcim’s early years, further strengthened their position as the leadingshareholders of the rising cement group.
As their father Ernst and their uncle Jacob had done before them, the two youngentrepreneurs decided to split their inheritance. Ernst took control of “Holderbank”Financière Glarus AG, while Max concentrated on the other business lines built upby his father. In the cement business, he looked to expand in markets that were ofless interest to his brother. The two employed the same principle in Switzerland.Max regularly took over cement companies for which Ernst saw no use within“Holderbank”.
This led to stakes in and liaisons with other cement companies in Switzerland andelsewhere which would only be integrated into the “Holderbank” network decadeslater, but which would make an important contribution to the Group’s rise to the
top at the beginning of the 1970s. Ernst and MaxSchmidheiny developed a co-leadership approach totheir cement activities in which each, alongside their“Holderbank” shares, built up their own cementgroups, apportioning markets and responsibilitiesamong themselves.
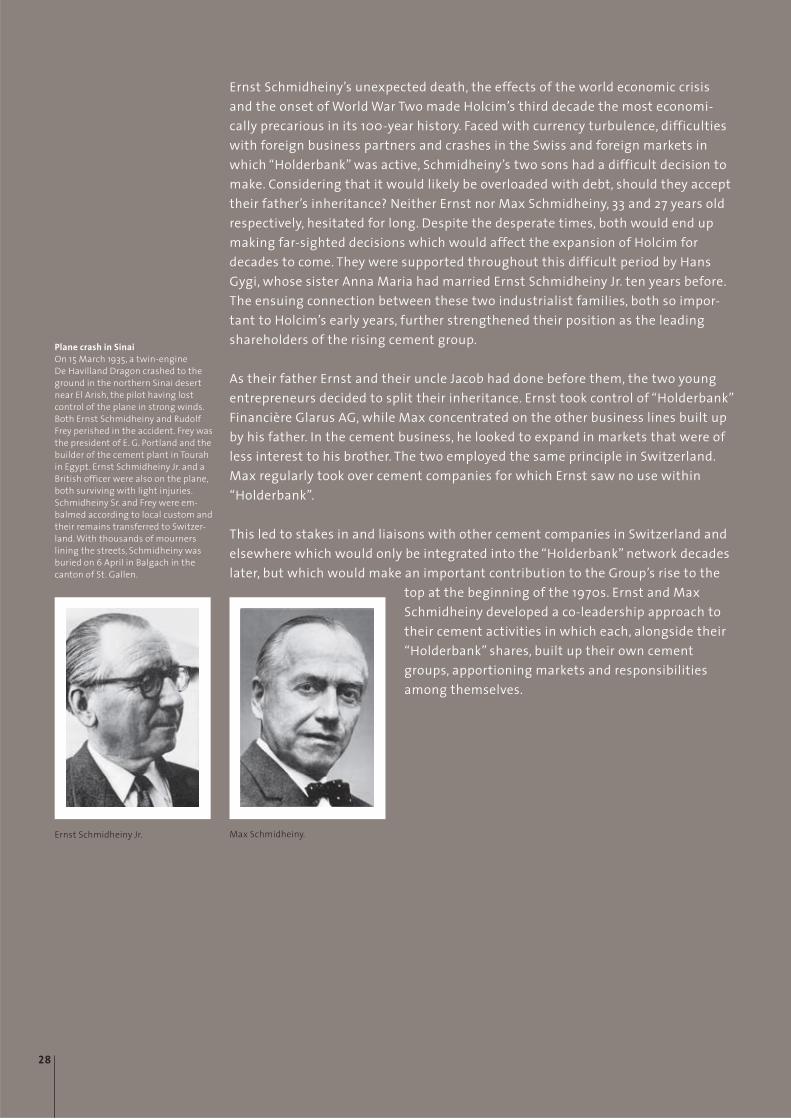
Plane crash in SinaiOn 15 March 1935, a twin-engine De Havilland Dragon crashed to theground in the northern Sinai desertnear El Arish, the pilot having lost control of the plane in strong winds.Both Ernst Schmidheiny and RudolfFrey perished in the accident. Frey wasthe president of E. G. Portland and thebuilder of the cement plant in Tourahin Egypt. Ernst Schmidheiny Jr. and aBritish officer were also on the plane,both surviving with light injuries.Schmidheiny Sr. and Frey were em-balmed according to local custom andtheir remains transferred to Switzer-land. With thousands of mourners lining the streets, Schmidheiny wasburied on 6 April in Balgach in thecanton of St. Gallen.
Max Schmidheiny.Ernst Schmidheiny Jr.
28
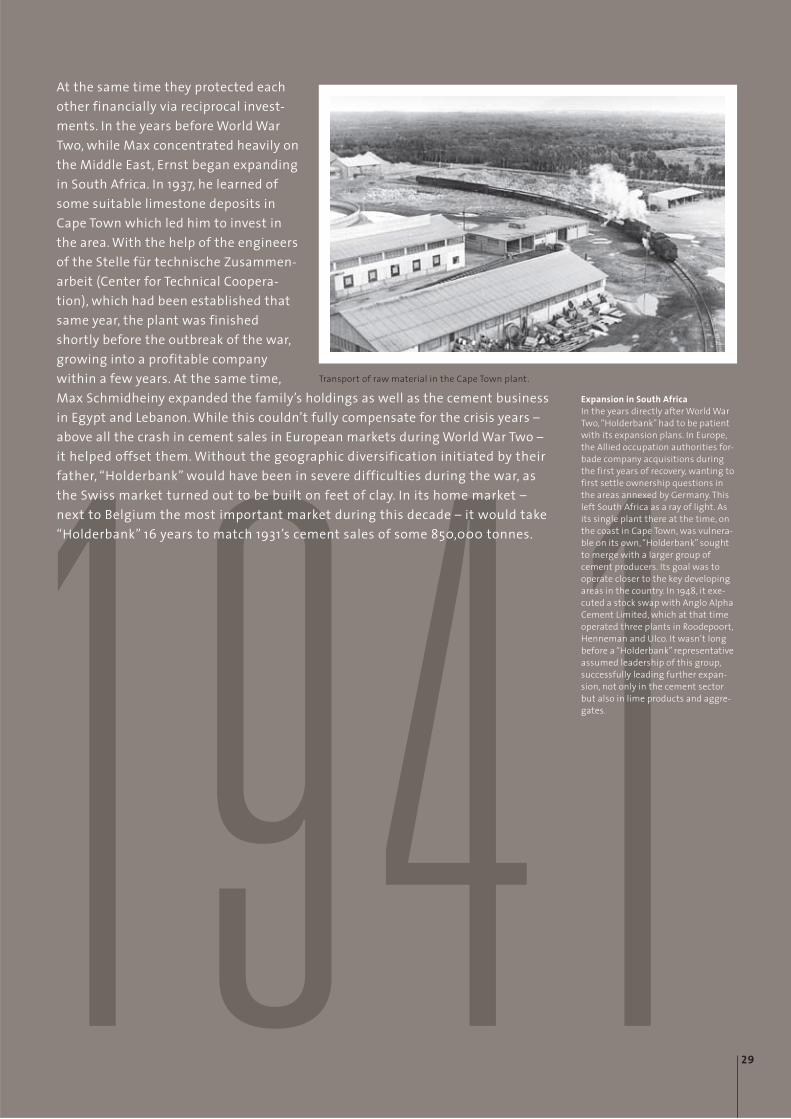
1941At the same time they protected eachother financially via reciprocal invest-ments. In the years before World WarTwo, while Max concentrated heavily onthe Middle East, Ernst began expandingin South Africa. In 1937, he learned ofsome suitable limestone deposits inCape Town which led him to invest inthe area. With the help of the engineersof the Stelle für technische Zusammen-arbeit (Center for Technical Coopera-tion), which had been established thatsame year, the plant was finishedshortly before the outbreak of the war,growing into a profitable companywithin a few years. At the same time,Max Schmidheiny expanded the family’s holdings as well as the cement businessin Egypt and Lebanon. While this couldn’t fully compensate for the crisis years –above all the crash in cement sales in European markets during World War Two – it helped offset them. Without the geographic diversification initiated by theirfather, “Holderbank” would have been in severe difficulties during the war, as the Swiss market turned out to be built on feet of clay. In its home market – next to Belgium the most important market during this decade – it would take“Holderbank” 16 years to match 1931’s cement sales of some 850,000 tonnes.
Transport of raw material in the Cape Town plant.
Expansion in South AfricaIn the years directly after World WarTwo, “Holderbank” had to be patientwith its expansion plans. In Europe,the Allied occupation authorities for-bade company acquisitions duringthe first years of recovery, wanting tofirst settle ownership questions inthe areas annexed by Germany. Thisleft South Africa as a ray of light. Asits single plant there at the time, onthe coast in Cape Town, was vulnera-ble on its own, “Holderbank” soughtto merge with a larger group of cement producers. Its goal was to operate closer to the key developingareas in the country. In 1948, it exe-cuted a stock swap with Anglo AlphaCement Limited, which at that timeoperated three plants in Roodepoort,Henneman and Ulco. It wasn’t longbefore a “Holderbank” representativeassumed leadership of this group,successfully leading further expan-sion, not only in the cement sectorbut also in lime products and aggre-gates.
29
Continuity thanks to tried-and-tested strategy
The Group’s strategy is based on three pillars: con-centrating on the core business, geographical diver-sification and balancing local business responsibilityand global leadership. These principles have provedthemselves in good and bad economic times alike.
The resolve to respond rapidly and decisively to majorchanges in the business environment is a crucial factor. For example, during the recent, far-reaching financial crisis and ensuing recession, Holcim suc-ceeded in achieving significant cost savings in manymature markets. Despite inflationary pressure andthe commissioning of new capacity, a pivotal objectivefor 2011 was to maintain control over those costswhich can be influenced.
Global presence
Holcim operates worldwide in around 70 countries on all continents, employs a workforce over 80,000and has production facilities at around 2,200 loca-tions. This broad-based presence, with cement plants, aggregates operations, ready-mix concrete and con-crete elements plants, asphalt facilities and prepara-tion platforms for alternative fuels and raw materi-als, plays a decisive part in stabilizing earnings by atleast evening out some cyclical fluctuations in indi-vidual markets. This is confirmed in part by the intactrevenue streams from the growth markets in Asiaand Latin America in 2011.
Key success factors
Holcim has a unique global presence. Economically and
ecologically efficient plants and innovative products are
key to creating value for customers and shareholders
and other stakeholders.
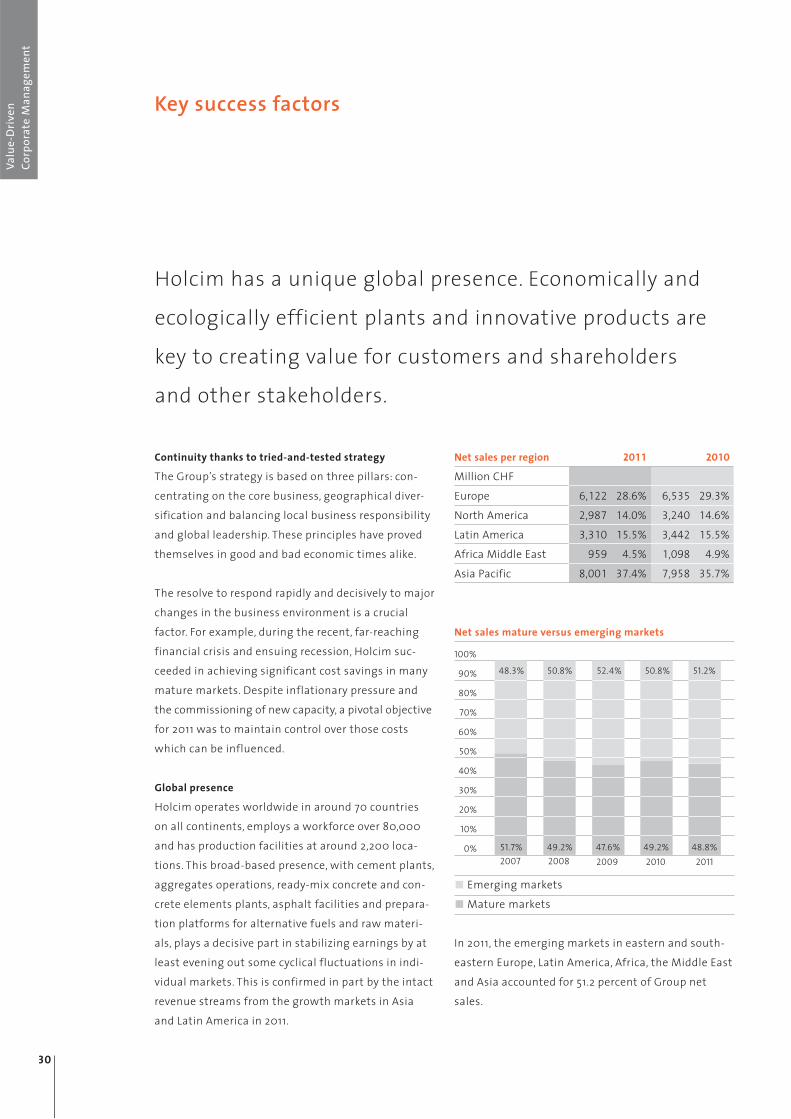
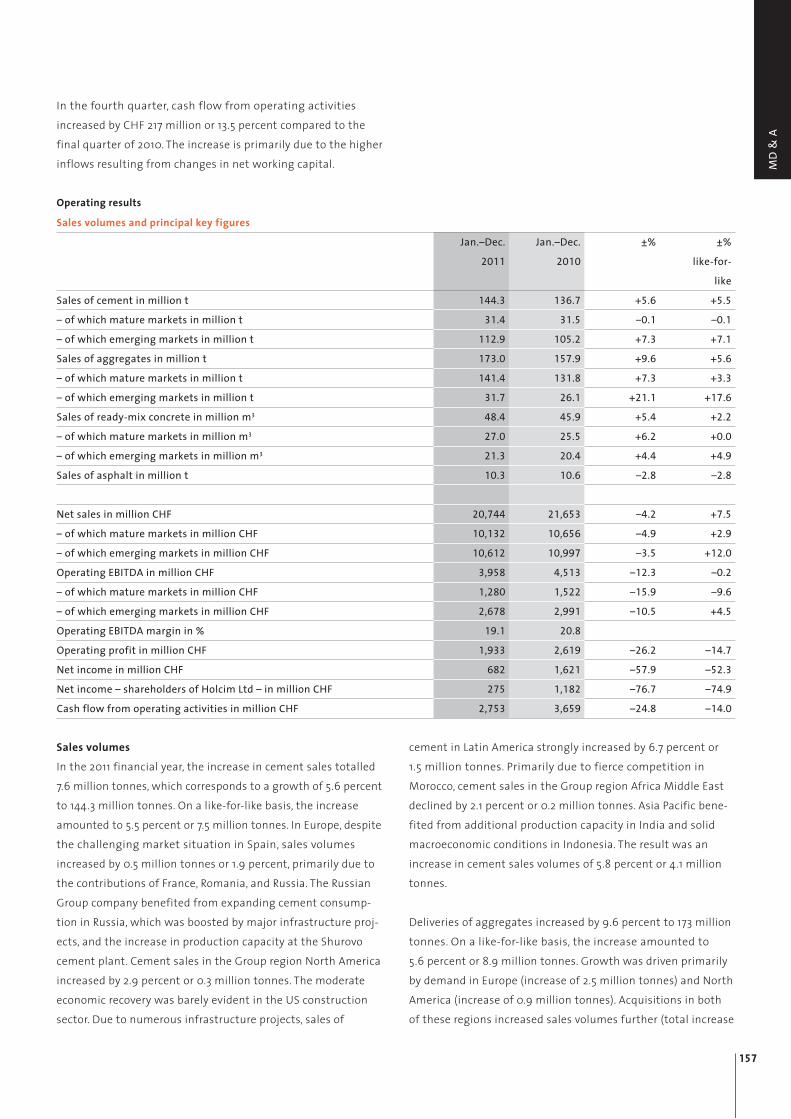
In 2011, the emerging markets in eastern and south-eastern Europe, Latin America, Africa, the Middle Eastand Asia accounted for 51.2 percent of Group netsales.
Net sales per region 2011 2010
Million CHF Europe 6,122 28.6% 6,535 29.3% North America 2,987 14.0% 3,240 14.6% Latin America 3,310 15.5% 3,442 15.5% Africa Middle East 959 4.5% 1,098 4.9% Asia Pacific 8,001 37.4% 7,958 35.7%
2007 2008 2009 2010
Net sales mature versus emerging markets
100%
90%
80%
70%
60%
50%
40%
30%
20%
10%
0%
Emerging marketsMature markets
48.3%
51.7%
50.8%
49.2%
52.4%
47.6%
50.8%
49.2%
51.2%
48.8%2011
Valu
e-Dr
iven
Corp
orat
e M
anag
emen
t
30
Key S
ucce
ss Fa
ctor
s
31
Cement and aggregates as core businesses
Holcim’s success over decades is founded on a tar-geted and comprehensible product strategy. At itsheart are the production and distribution of cementand the aggregates crushed stone, gravel and sand.Investment activities and value creation thus focuson processing natural resources, while at the sametime giving increasingly important priority to recy-cling building materials. This is highly capital-inten-sive and ties up assets long term.
In addition to cement, Holcim also supplies ready-mixconcrete, concrete elements and concrete products as well as asphalt in nearly all mature markets and inmajor urban centers on all continents. This includeshigh levels of service in areas such as product-specificadvice, innovative sales concepts and system solu-tions specifically for large projects. Competent teamscan offer customers solutions tailored to all kinds ofconstruction projects.
Madrid-based Holcim Trading has a leading positionin international trading in cement, clinker, hydraulicbinders and fuels. It helps Group companies with buy-ing and selling activities outside their market areas.
Extracting raw materials, operating cement plantsand distributing building materials is a local or, atmost, a regional business. Group companies and individual operating facilities are firmly anchored intheir local environment and assume entrepreneurialresponsibility accordingly.
Many mature markets saw a moderate increase indemand in 2011. Consumption of building materialswas dynamic in most emerging markets – particularlyin Asia and Latin America. A steady rise in demand isbeing fueled by a combination of population growth,rapidly expanding cities and conurbations, and higherhousing aspirations. Many countries also have majorquantitative and qualitative deficits in their infra-structure sectors. These factors will continue to beimportant growth drivers for Holcim in the future.
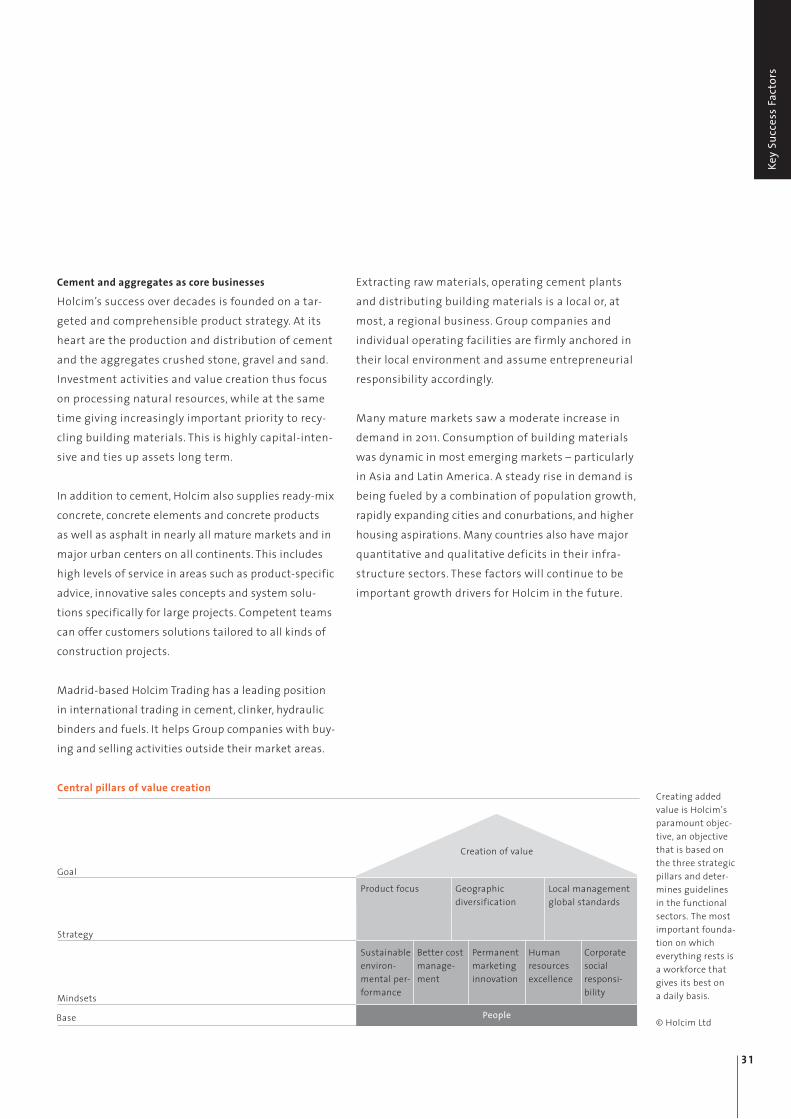
Central pillars of value creationCreating addedvalue is Holcim’sparamount objec-tive, an objectivethat is based on the three strategicpillars and deter-mines guide lines in the functionalsectors. The mostimportant founda-tion on which everything rests is a workforce thatgives its best on a daily basis.
Strong local management focused on five core areas
The five central challenges adopted at the 2010Group-wide Management Meeting were confirmed in2011, and the implementation strategies were fleshedout further and adapted:
Focus on customer benefit: All Holcim’s activities arecentered on creating value for the customer. Wherethe customer so requires, innovative customer-spe-cific solutions are offered, particularly in the high-growth sectors of infrastructure and house building.
Operating excellence: Appropriate operating targetsare defined for each area of business. Implementa-tion falls within the remit of the individual Groupcompanies. They receive targeted support from thecorporate staff units of Holcim Group Support Ltdand from regional service centers.
Solid anchorage of the Holcim culture: There has beenan exceptionally high increase in headcount in recentyears due to acquisitions, and it is essential to ensurethat Holcim’s corporate cultural values are nonethe-less practiced throughout the Group. The guidingprinciple in all Group companies is the motto “Strength.Performance. Passion.”
Permanent staff development: Holcim aspires to be an employer of choice which can attract and retaintalents. Without good employees and qualified managers there can be no outstanding operating performance, and high standards of health and safetyin the workplace will not be possible to achieve. Tothis end, staff on all levels undergo continuous inter-nal and external training and development.
Ongoing sustainable development: Holcim’s long plan-ning horizons and dependence on natural resourcesmake sustainable management a strategic necessity
for the company. The Group has been active in thisarea for many years. Staff at all levels are systematicallyguided and motivated on the question of sustainability.This has also earned Holcim external recognition, suchas inclusion in the Dow Jones Sustainability Index.
Corporate staff units step up efforts for the Group
companies
In 2010, the corporate staff units were combined underthe overall management of the CEO of Holcim GroupSupport Ltd and increasingly aligned to the needs ofthe Group companies. After central processing by thecorporate staff units, the Group’s global pool of knowl-edge is rapidly and efficiently made accessible to theindividual companies. Intensive cooperation betweenthe individual service and support functions createdimportant synergies and efficiency gains in 2011.
The complete overview of all Group services listed by topic published on the internal portal in the firstquarter of 2011 provides Group companies with aquick and simple means of identifying and calling upcross-functional services. Commercial activities wereorganizationally adjusted, and a new innovation function was rolled out.
Slight increase in headcount
As demand continued to decline in a number of maturemarkets, several Group companies shut down facilitiestemporarily or permanently and laid off staff. Unavoid-able redundancies were implemented in such a way asto minimize their social impact. However, many growthregions experienced the opposite trend and recruitednew staff. The increase in headcount was due to thecommissioning of new production units.
Whereas at the end of the last financial year theGroup had 80,310 employees, by the end of 2011 theheadcount was 80,967.
32
Key S
ucce
ss Fa
ctor
s
33
Strategic expansion program in growth markets
Global demand for building materials will increasein future too. The corresponding strategic programfor the expansion of production capacity was contin-ued, largely in the cement segment. As has been thecase for years, expansion was concentrated mainly in the so-called growth markets, which currently account for around 75 percent of production capacity.In 2011, Holcim consequently increased its cementcapacity Group-wide by 4.5 million tonnes to 216million tonnes.
In India, the Group companies ACC and Ambuja Cements commissioned cement capacity totalingaround 3.9 million tonnes p.a. Notable instances in-clude the replacement of an older kiln line at theChanda plant and the modernization and expansionof ACC’s Bargarh plant and Ambuja Cement’s Bhata-para and Dadri plants. In the booming Indonesian cement market, work also began on the constructionof a new plant in Tuban on the main island of Java.Slated to come on stream in the first half of 2013,this important plant will have an annual capacity of1.6 million tonnes of cement.
In Latin America, the focus was on the commissioningof the Hermosillo plant in Mexico. Holcim Apasco’snew plant, which was opened in the presence of the Mexican president, has an annual capacity of
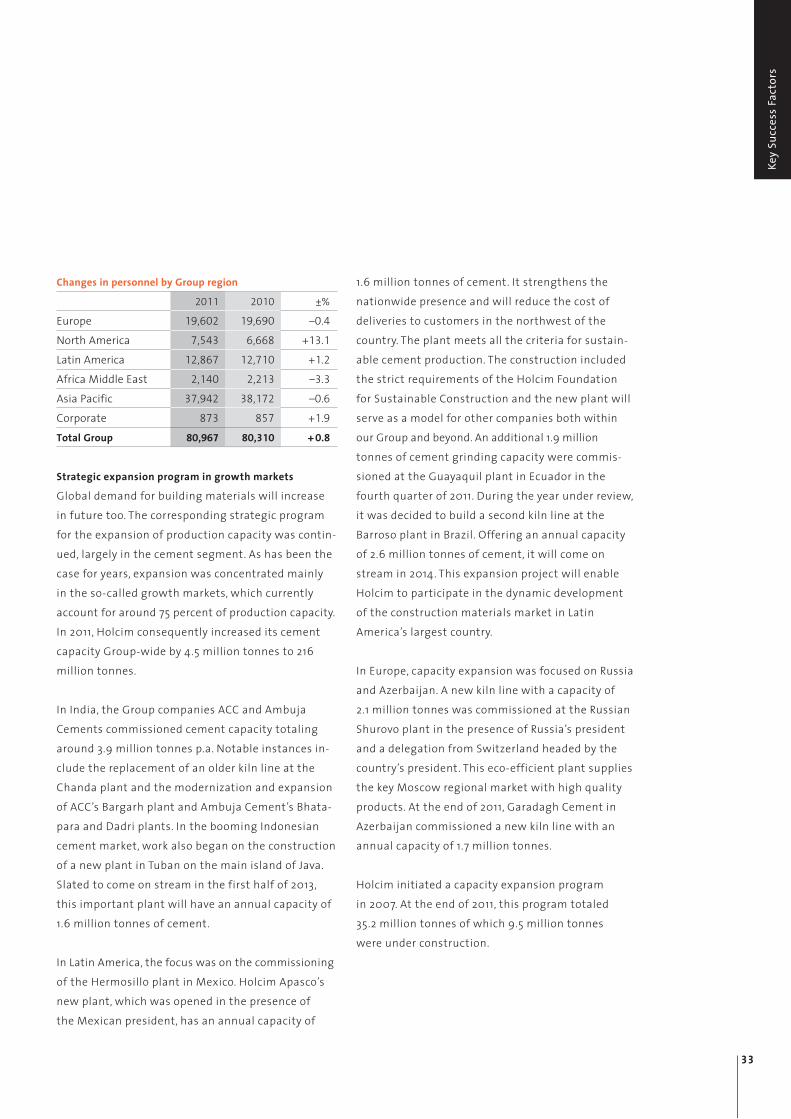
Changes in personnel by Group region
2011 2010 ±%
Europe 19,602 19,690 –0.4North America 7,543 6,668 +13.1Latin America 12,867 12,710 +1.2Africa Middle East 2,140 2,213 –3.3Asia Pacific 37,942 38,172 –0.6Corporate 873 857 +1.9Total Group 80,967 80,310 + 0.8
1.6 million tonnes of cement. It strengthens the nationwide presence and will reduce the cost of deliveries to customers in the northwest of thecountry. The plant meets all the criteria for sustain-able cement production. The construction includedthe strict requirements of the Holcim Foundation for Sustainable Construction and the new plant willserve as a model for other companies both withinour Group and beyond. An additional 1.9 milliontonnes of cement grinding capacity were commis-sioned at the Guayaquil plant in Ecuador in thefourth quarter of 2011. During the year under review,it was decided to build a second kiln line at the Barroso plant in Brazil. Offering an annual capacityof 2.6 million tonnes of cement, it will come onstream in 2014. This expansion project will enableHolcim to participate in the dynamic development of the construction materials market in Latin America’s largest country.
In Europe, capacity expansion was focused on Russiaand Azerbaijan. A new kiln line with a capacity of 2.1 million tonnes was commissioned at the RussianShurovo plant in the presence of Russia’s presidentand a delegation from Switzerland headed by thecountry’s president. This eco-efficient plant suppliesthe key Moscow regional market with high qualityproducts. At the end of 2011, Garadagh Cement inAzerbaijan commissioned a new kiln line with an annual capacity of 1.7 million tonnes.
Holcim initiated a capacity expansion program in 2007. At the end of 2011, this program totaled 35.2 million tonnes of which 9.5 million tonnes were under construction.
Valu
e-Dr
iven
Corp
orat
e M
anag
emen
t
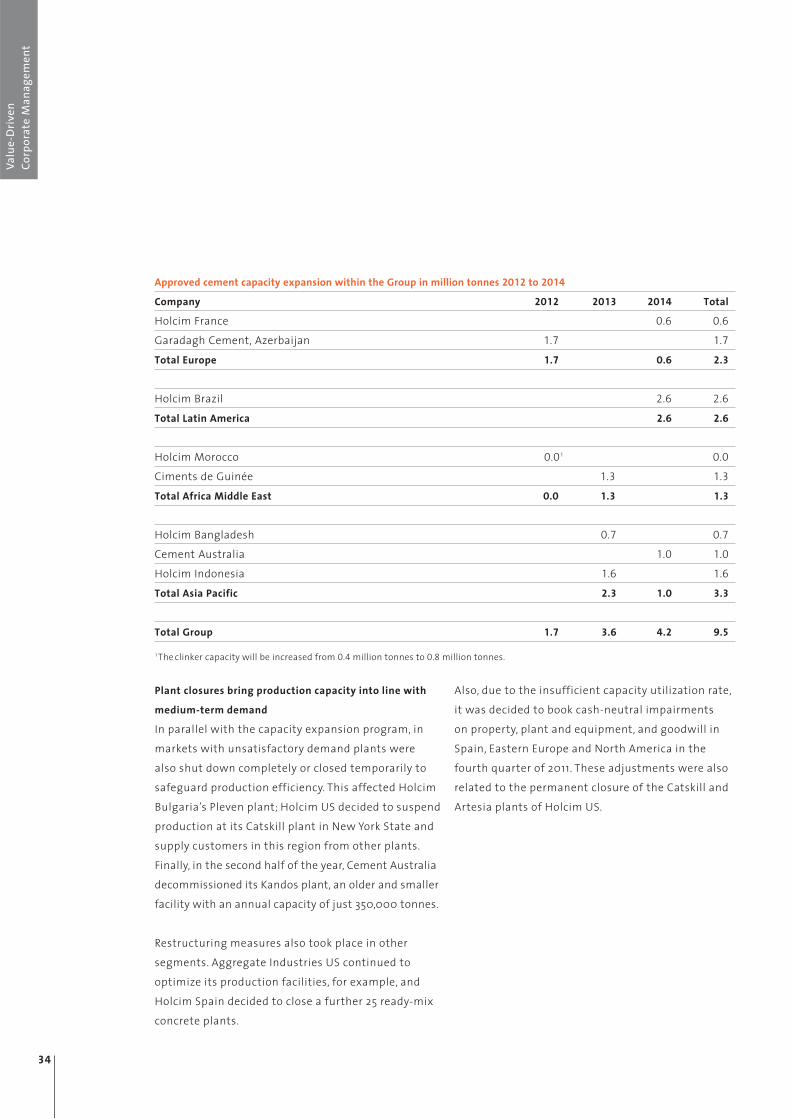
Approved cement capacity expansion within the Group in million tonnes 2012 to 2014
Company 2012 2013 2014 Total
Holcim France 0.6 0.6Garadagh Cement, Azerbaijan 1.7 1.7Total Europe 1.7 0.6 2.3
Holcim Brazil 2.6 2.6Total Latin America 2.6 2.6
Holcim Morocco 0.01 0.0Ciments de Guinée 1.3 1.3Total Africa Middle East 0.0 1.3 1.3
Holcim Bangladesh 0.7 0.7Cement Australia 1.0 1.0Holcim Indonesia 1.6 1.6Total Asia Pacific 2.3 1.0 3.3
Total Group 1.7 3.6 4.2 9.5
Plant closures bring production capacity into line with
medium-term demand
In parallel with the capacity expansion program, inmarkets with unsatisfactory demand plants were also shut down completely or closed temporarily tosafeguard production efficiency. This affected HolcimBulgaria’s Pleven plant; Holcim US decided to suspendproduction at its Catskill plant in New York State andsupply customers in this region from other plants. Finally, in the second half of the year, Cement Australiadecommissioned its Kandos plant, an older and smallerfacility with an annual capacity of just 350,000 tonnes.
Restructuring measures also took place in other segments. Aggregate Industries US continued to optimize its production facilities, for example, andHolcim Spain decided to close a further 25 ready-mixconcrete plants.
Also, due to the insufficient capacity utilization rate,it was decided to book cash-neutral impairments on property, plant and equipment, and goodwill inSpain, Eastern Europe and North America in thefourth quarter of 2011. These adjustments were alsorelated to the permanent closure of the Catskill andArtesia plants of Holcim US.
1 The clinker capacity will be increased from 0.4 million tonnes to 0.8 million tonnes.
34
Key S
ucce
ss Fa
ctor
s
35
Investments in aggregates and concrete
As an economy becomes more mature, vertical inte-gration becomes more important. Major infrastructureprojects and residential and commercial constructionactivity in such markets cause a rise in demand forhigh-grade aggregates and ready-mix concrete. Because of the high degree of regulation, securingguaranteed reserves of raw materials is of growingstrategic importance.
With the full takeover of Lattimore Materials in March2011, Aggregate Industries US strengthened its marketpresence in aggregates and ready-mix concrete in the important Texan market. In November, the Groupcompany took over the assets of Ennstone, Inc. in thestate of Virginia. Ennstone owns strategically well positioned ready-mix concrete plants, sand and gravelworks and limestone quarries.
Concrete as an indispensable, environmentally friendly
building material
The energy and CO2-efficient building material con-crete is used on a huge scale in construction projectsworldwide. Modern and efficient infrastructureswould be inconceivable without concrete. With our expertise we help customers increase productivityand gain competitive advantages through differenti-ated product offerings. Innovative, needs-oriented solutions help ensure that the high quality standardsare met. In line with Holcim’s commitment to pre-mium quality, sustainable building materials, we arestepping up the use of composite cements in the production of concrete. In addition to clinker and gypsum, they also incorporate additives such as granulated slag, fly ash or naturally occuring pozzolan.Combining innovative products and special serviceshelps to give Holcim a more distinctive profile. Heretoo, environmental considerations are an increasinglydecisive factor.
One good example of this comes from Group companyHolcim Germany, which successfully bid for the con-tract for the construction of the Nord Stream pipelinesput out to tender by the EUPEC construction group.These pipelines across the Baltic Sea link Vyborg in Russia and Lubmin in Germany. Once the two pipelinesare in operation next year, the system will secure thesupply of the European Union with Russian naturalgas. From the outset, EUPEC was concerned with thesafety and, above all, environmental friendliness of the construction work. Holcim Germany provided aconvincing solution that met these criteria.
Each pipeline is sheathed in a layer of concrete to give it the necessary weight to keep it in place in theseabed. The decisive factor behind Holcim Germanywinning the cement delivery contract was a combina-tion of a suitable product and the guarantee of a cost-effective logistics concept with a low environmentalimpact. 600 tonnes of cement had to be delivered dailyby rail and shipped from the Lägerdorf plant to theconstruction sites in Germany and Finland. Roadhaulage was only used as an alternative in the event ofextraordinary circumstances. Although this also re-quired considerable investment in rail loading capacityat the plant, the effort proved worthwhile for HolcimGermany as it not only secured the contract for thisproject, but was also able to position itself as a reliableand innovative partner in the market.
Fund to promote energy efficiency
The production of cement is energy-intensive. Thermaland electrical energy accounts for around 40 percentof production costs, while the chemical conversion ofstone in the rotary kiln releases large quantities of CO2,as does the use of fossil fuels. Ensuring that plants arehighly energy-efficient is therefore a key considerationfor Holcim – particularly in light of rising energy costs.
Valu
e-Dr
iven
Corp
orat
e M
anag
emen
t
Because low demand means that the European cementindustry currently emits less CO2 than producers areentitled to, non-required CO2 emission certificatescan be sold. The lower emissions not only reflect thecurrent economic situation, but also the industry’s efforts to increase plant efficiency and reduce theclinker factor.
The CHF 100 million in payments received by Holcimeach year were channeled in 2011 into an internal energy fund created in 2010. The fund should help ensure the realization of innovative projects in the fieldof heat recovery, the recycling of alternative fuels andraw materials, as well as wind power and hydroelec-tricity. The objective is to further reduce consumptionof fossil fuels and increase energy efficiency. Severalprojects are being implemented (see also pages 55).Together they will yield savings of around 200,000tonnes of CO2.
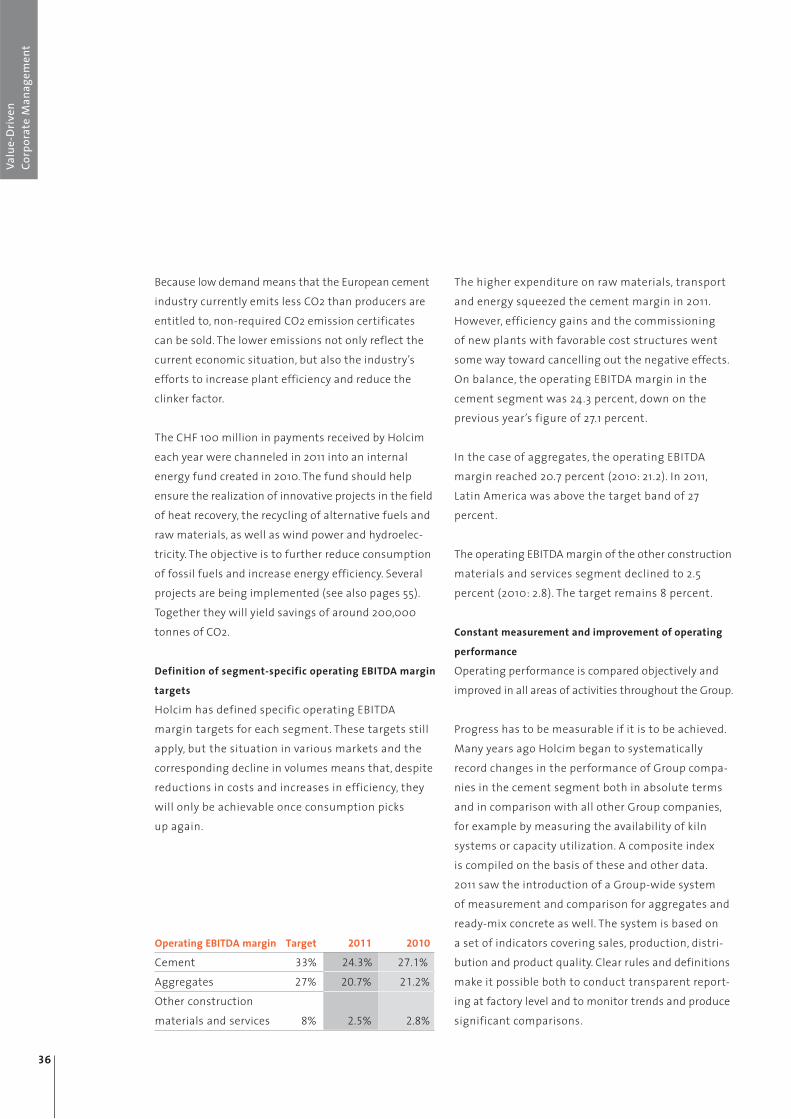
Definition of segment-specific operating EBITDA margin
targets
Holcim has defined specific operating EBITDA margin targets for each segment. These targets stillapply, but the situation in various markets and thecorresponding decline in volumes means that, despitereductions in costs and increases in efficiency, theywill only be achievable once consumption picks up again.
The higher expenditure on raw materials, transportand energy squeezed the cement margin in 2011.However, efficiency gains and the commissioning of new plants with favorable cost structures wentsome way toward cancelling out the negative effects.On balance, the operating EBITDA margin in the cement segment was 24.3 percent, down on the previous year’s figure of 27.1 percent.
In the case of aggregates, the operating EBITDA margin reached 20.7 percent (2010: 21.2). In 2011,Latin America was above the target band of 27 percent.
The operating EBITDA margin of the other constructionmaterials and services segment declined to 2.5 percent (2010: 2.8). The target remains 8 percent.
Constant measurement and improvement of operating
performance
Operating performance is compared objectively andimproved in all areas of activities throughout the Group.
Progress has to be measurable if it is to be achieved.Many years ago Holcim began to systematicallyrecord changes in the performance of Group compa-nies in the cement segment both in absolute termsand in comparison with all other Group companies,for example by measuring the availability of kiln systems or capacity utilization. A composite index is compiled on the basis of these and other data. 2011 saw the introduction of a Group-wide system of measurement and comparison for aggregates andready-mix concrete as well. The system is based on a set of indicators covering sales, production, distri-bution and product quality. Clear rules and definitionsmake it possible both to conduct transparent report-ing at factory level and to monitor trends and producesignificant comparisons.
36
Operating EBITDA margin Target 2011 2010
Cement 33% 24.3% 27.1% Aggregates 27% 20.7% 21.2% Other construction materials and services 8% 2.5% 2.8%
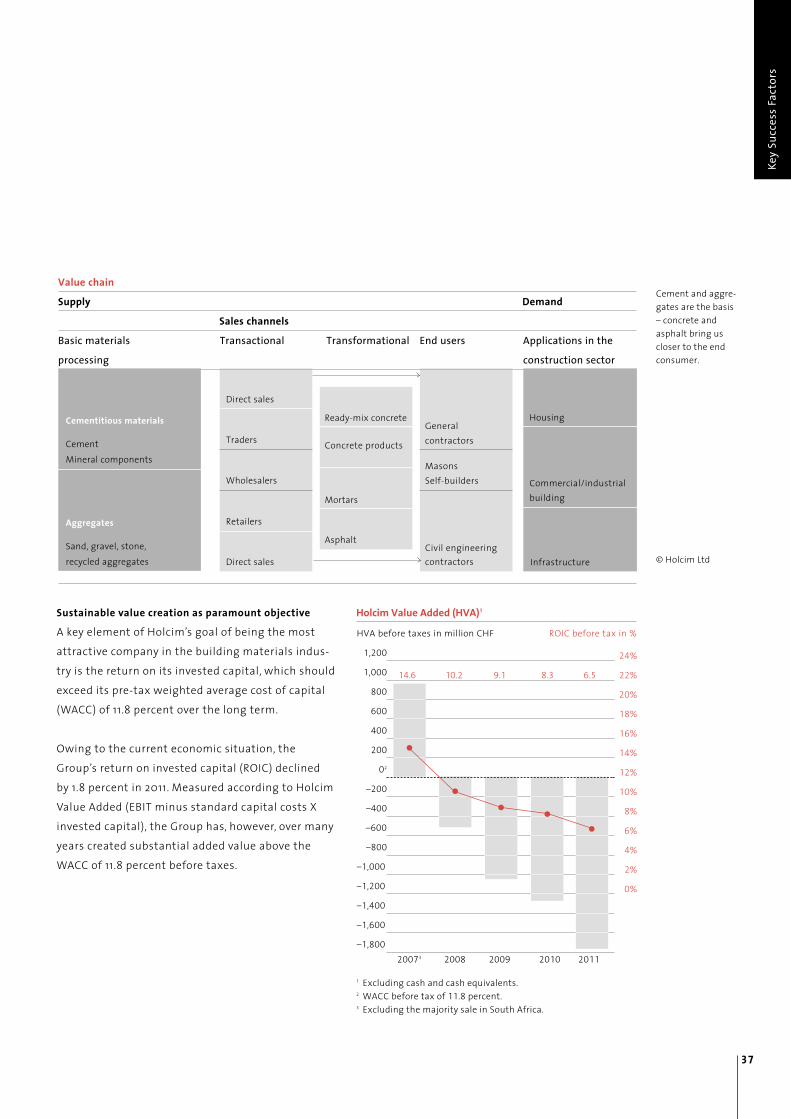
attractive company in the building materials indus-
try is the return on its invested capital, which should
exceed its pre-tax weighted average cost of capital
(WACC) of 11.8 percent over the long term.
Owing to the current economic situation, the
Group’s return on invested capital (ROIC) declined
by 1.8 percent in 2011. Measured according to Holcim
Value Added (EBIT minus standard capital costs X
invested capital), the Group has, however, over many
years created substantial added value above the
WACC of 11.8 percent before taxes.
Cement and aggre-gates are the basis– concrete andasphalt bring uscloser to the endconsumer.
Cementitious materials
CementMineral components
Traders
Wholesalers
Retailers
Direct sales
General contractors
MasonsSelf-builders
Civil engineeringcontractors
Aggregates
Sand, gravel, stone, recycled aggregates
Housing
Commercial/industrialbuilding
Infrastructure
Ready-mix concrete
Direct sales
Concrete products
Mortars
Asphalt
Value chain
Supply Demand
Sales channels
Basic materials Transactional Transformational End users Applications in the
processing construction sector
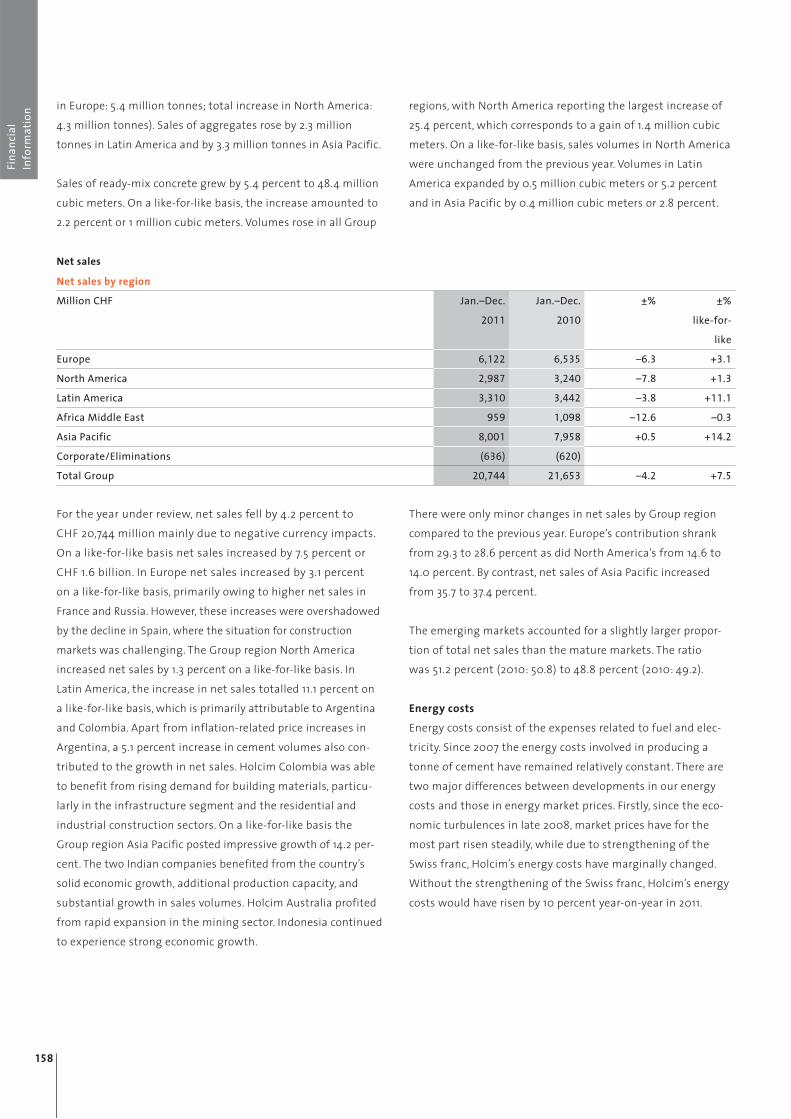
Holcim Value Added (HVA)1
HVA before taxes in million CHF ROIC before tax in %
1,200
1,000
800
600
400
200
02
–200
–400
–600
–800
–1,000
–1,200
–1,400
–1,600
–1,800
1 Excluding cash and cash equivalents.2 WACC before tax of 11.8 percent.3 Excluding the majority sale in South Africa.
24%
22%
20%
18%
16%
14%
12%
10%
8%
6%
4%
2%
0%
20073 2008 2009 2010 2011
14.6 10.2 9.1 8.3 6.5
Valu
e-Dr
iven
Corp
orat
e M
anag
emen
t
38
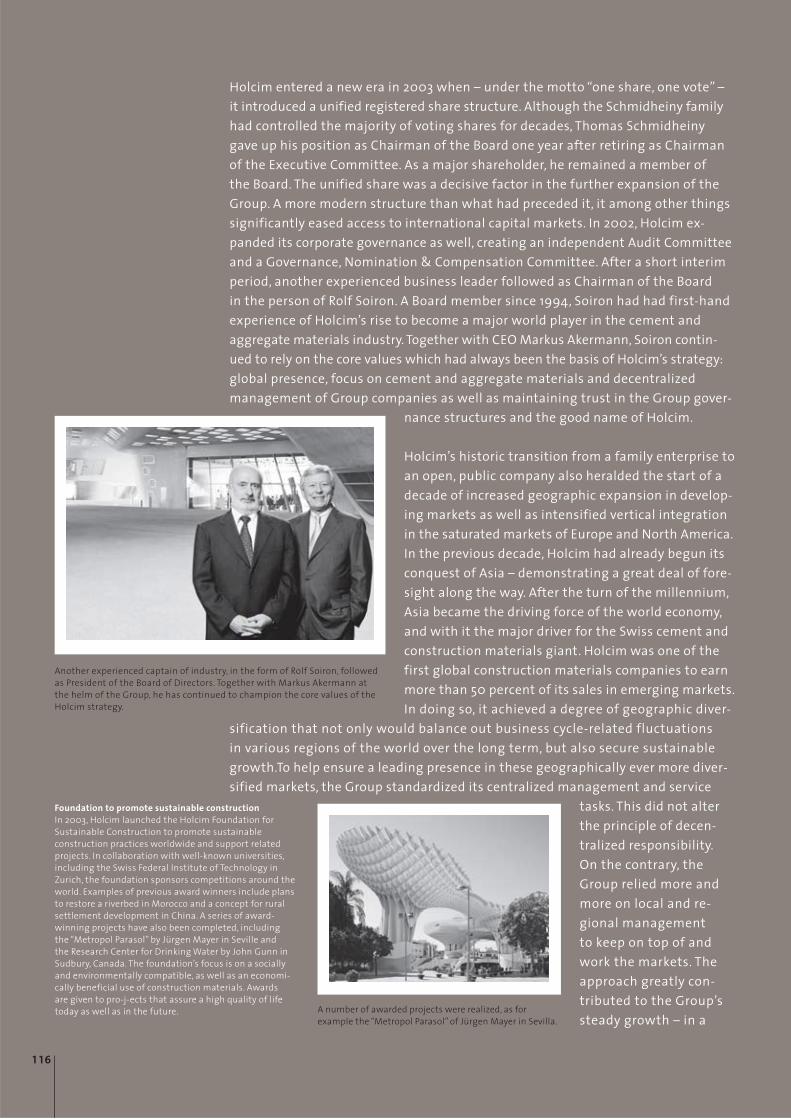
Holcim Foundation promotes sustainability projects
In 2003, Holcim established the Holcim Foundation forSustainable Construction. This independent foundationchampions the cause of sustainability in the construc-tion sector. Against the backdrop of rapidly rising population numbers, mass migration, increased pres-sure on resources, and urbanization, new approaches to construction are needed if future generations are tobe able to live in a sustainable environment. This is why the foundation aims to promote knowledge andacceptance of sustainable building among constructionspecialists and developers.
The Holcim awards recognize exemplary sustainableconstruction projects all over the world. The competi-tion, held in a three-year cycle, is endowed with prizestotaling USD 2 million awarded by a distinguished inde-pendent jury. The regional awards for the third compe-tition cycle were presented in 2011 at ceremonies heldin Milan, Washington D.C., Buenos Aires, Casablancaand Singapore. Prizes were awarded to a total of 53 sustainable projects from 29 countries.
At www.holcimfoundation.org information on thecompetitions and the award-winning projects can befound, along with details of the other activities, publi-cations and partnerships of the Holcim Foundation.
Attractive dividend policy
The Group’s success should bear fruit for the share-holders of Holcim Ltd. In 2003, the Board of Directorsdetermined as a guiding principle that one-third ofGroup net income attributable to shareholders of Holcim Ltd should be distributed. For the 2011 financialyear, the Board is proposing to the annual generalmeeting to distribute a cash payment of CHF 1.00 perregistered share from the capital contribution re-serves, despite the impairment costs.
Environmental commitment and social responsibility
enhance our reputation
Holcim is strengthened by its substantial efforts topromote sustainable development. In addition to the creation of economic value, Holcim also regardsenvironmental performance and social responsibilityas integral components of its overriding strategy.
This is, for instance, reflected in the partnership withthe International Union for Conservation of Nature(IUCN). Holcim also maintains an ongoing dialogwith various other stakeholder groups. Holcim is alsolisted in the Dow Jones Sustainability Index 2011/2012and as such is regarded as one of the most sustain-able companies in the construction materials sector.
Orga
niza
tion
and
Man
agem
ent
Efficient management and control
Holcim’s corporate governance policy defines theprocesses, organization and monitoring of its top corporate management, as well as business policyprinciples and internal and external control mecha-nisms. The policy’s aim is to clearly delineate respon-sibilities, and to ensure transparent and sustainablevalue creation with the appropriate managementand control. This includes the Group’s credibility andgood reputation, which strengthens confidenceamong investors, business partners, employees andthe public at large. Holcim’s principles of corporategovernance are continually revised in line with thelatest developments and necessities.
The internal control system (ICS) introduced in2007/2008 for the presentation of the annual finan-cial statements, conforming to the requirements ofArt. 728a of the Swiss Code of Obligations and SwissAuditing Standard 890, has proved itself. The internalcontrol mechanisms go beyond financial control andincreasingly also cover areas revolving round ques-tions of business ethics and integrity. Holcim is oneof the few Swiss companies to sign up to the tenprinciples of the UN Global Compact on humanrights, labor, the environment and anti-corruption.
In 2011 the Board of Directors elected Bernard Fontana
as new CEO effective February 1, 2012. He replaces CEO
Markus Akermann, who is retiring.
Code of Conduct
Issued by the Board of Directors and the ExecutiveCommittee in 2003, the Code of Conduct definesGroup-wide standards of business behavior expectedof all staff. The Code of Conduct can be found on ourwebsite under www.holcim.com.
Each Group company is responsible for incorporatingthe principles of the Code of Conduct into staff andemployment contracts. The Code states that non-compliance with the rules will not be tolerated andwill result in disciplinary measures, which could go asfar as termination of the employment relationship.
Value creation in a competitive environment
Among other things, the Code of Conduct requiresstrict respect for the rules of competition. Measureshave been introduced to ensure that the Group companies comply with the relevant legislation and regulations of the country in question. These includea centrally coordinated training program and instruc-tions on good business conduct in line with moderncompetition law. Training and support materials arecontinually brought into line with the latest develop-ments in competition law.
Organization and management
39
Board of Directors
Rolf Soiron
Chairman Beat Hess
Deputy ChairmanErich Hunziker
Deputy Chairman, Chairman of the Governance, Nomination &Compensation CommitteeMarkus Akermann
Christine Binswanger
Alexander Gut
Peter Küpfer
Chairman of the Audit CommitteeAdrian Loader
Andreas von Planta
Thomas Schmidheiny
Wolfgang Schürer
Dieter Spälti
Secretary of the Board of Directors
Peter Doerr
Executive Committee
Markus Akermann
Chief Executive Officer until January 31, 2012Bernard Fontana
Chief Executive Officer from February 1, 2012Thomas Aebischer
Chief Financial OfficerUrs Böhlen
Eastern and Southeastern Europe,CIS/Caspian regionPatrick Dolberg
Belgium, France, Netherlands, Germany, Switzerland, ItalyPaul Hugentobler
South Asia & ASEAN excl. PhilippinesBenoît-H. Koch
North America, UK, Norway, Mediterranean incl. Iberian Peninsula, International TradeRoland Köhler
CEO Holcim Group Support LtdAndreas Leu
Latin AmericaIan Thackwray
East Asia incl. China, Philippines,Oceania and South & East Africa
Valu
e-Dr
iven
Corp
orat
e M
anag
emen
t
Status as at February 29, 2012
Area Management
Javier de Benito
Urs Fankhauser
Aidan Lynam
Bernard Terver
Onne van der Weijde
from January 1, 2012
Corporate Functional Manager
Jacques Bourgon
Auditors
Ernst & Young AG
Management Structure
See organizational chart on pages 44 and 45.
Changes
See also Corporate Governance onpage 121 ff.
The Executive Committee from left to right:Benoît-H. Koch, Urs Böhlen, Ian Thackwray, Patrick Dolberg, Roland Köhler, Bernard Fontana, Andreas Leu, Paul Hugentobler, Thomas Aebischer.
Orga
niza
tion
and
Man
agem
ent
At the 2011 annual general meeting, Alexander Gutwas elected to the Board of Directors of Holcim Ltd. Heholds a doctorate degree in Business Administration(Dr. oec. publ.) from the University of Zurich, Switzer-land, and is a Swiss Certified Accountant. From 1991 to2001 he was with KPMG in Zurich and London andfrom 2001 to 2003 with Ernst & Young in Zurich, beingpromoted to Partner in 2002. From 2003 to 2007 hewas a Partner with KPMG in Zurich, being promoted tothe Executive Committee of KPMG Switzerland in2005. Alexander Gut is the Founder and ManagingPartner of Gut Corporate Finance AG, an independentcorporate finance advisory firm in Zurich. Since May2010 he has been a member of the Board of Directorsof Adecco S.A., Chéserex, Switzerland. Also at the gen-eral meeting, Board members Christine Binswanger,Andreas von Planta and Erich Hunziker were each con-firmed for further three-year terms of office.
After the general meeting, the Board of Directors wasreconstituted. Owing to other commitments, previousDeputy Chairman Andreas von Planta opted to standdown from this office. The Board of Directors electedBeat Hess and Erich Hunziker as the two Deputy Chair-men. The Audit Committee is still headed by PeterKüpfer. The other members are: Andreas von Planta, Dieter Spälti and Alexander Gut, who is new on thecommittee. Erich Hunziker is the new Chairman of theGovernance, Nomination & Compensation Committee;the members are Thomas Schmidheiny, WolfgangSchürer and Adrian Loader (new).
After decades of fruitful work within the Group,Markus Akermann, CEO since 2002, retired at the end of January. The Board of Directors would like to take this opportunity to thank Markus Akermann for the successful leadership he has provided and for a valuable working relationship.
With effect from February 1, 2012, Bernard Fontana tookover as CEO of Holcim Ltd. In Bernard Fontana, Holcimhas secured the services of a business leader with manyyears of international experience. Bernard Fontana is aFrench national. He holds degrees in engineering fromthe Ecole Polytechnique and the Ecole NationaleSupérieure des Techniques Avancées in Paris. His careerbegan with Groupe SNPE in France. Shortly after joiningArcelorMittal in 2004, he was appointed head of HR, ITand Business Development at Flat Carbon. From 2006 to2010, he was a Member of the Executive Committee ofArcelorMittal. From 2010 Bernard Fontana was CEO ofAperam, a listed corporate group domiciled in Luxem-bourg.
Thomas Aebischer has been a member of the ExecutiveCommittee of Holcim Ltd since January 1, 2011. He tookover as Group CFO from Theophil H. Schlatter on April 1,2011.
Andreas Leu has been a member of the Executive Committee of Holcim Ltd since January 1, 2011 and is responsible for Latin America.
Urs Fankhauser has been an Area Manager and a memberof the senior management of Holcim Ltd since January 1,2011. He is responsible for the markets in Eastern andSoutheastern Europe and reports directly to ExecutiveCommittee member Urs Böhlen.
Corporate Functional Manager Stefan Wolfensbergerleft the Group at the end of June 2011.
Onne van der Weijde, CEO of Ambuja Cements Ltd. in India, was appointed Area Manager and a member ofthe senior management of Holcim Ltd effective January1, 2012. Onne van der Weijde continues to serve as CEO of Ambuja Cements Ltd. He reports directly to ExecutiveCommittee member Paul Hugentobler.
41
Valu
e-Dr
iven
Corp
orat
e M
anag
emen
t
Line and functional management responsibility
Holcim’s hierarchical structures are flat and its divisions of responsibility clearly defined – both atGroup level and in the individual Group companies.This ensures that decisions are based on expert knowl -edge and cost awareness, and that new processes or standards can be implemented without delay.
The key to the Group’s performance and success liesin the competence of the local management teams.The operating units in around 70 countries fall underthe line responsibility of individual Executive Com-mittee members, assisted by Area Managers and Corporate Functional Managers. Striking the rightbalance between local power and autonomy on theone hand, and the appropriate degree of support andintervention from Group headquarters on the other,is a permanent challenge. If our Group companies are to strengthen their cost and market leadership in their markets, they need entrepreneurial room formaneuver as well as support from the Group in theform of specific know-how and predefined parameters.The Group’s managers, the regions, the countries and local sites are assisted by service centers at theregional level and by central corporate staff units atthe global level. Since May 2010, the central serviceand support functions of Holcim Group Support Ltdhave reported directly to an Executive Committeemember.
A coherent program of basic and continuing manage-ment training, as well as systematic succession plan-ning to develop candidates with executive potentialat both national company and corporate level, arefactors which will strengthen the Group on a lastingbasis.
Holcim has well-structured management systems in place. Group companies are given clear guidelines in key areas of the business, from technology and environmentally friendly production, to human resources and finance.
Business Risk Management identifies risks and
opportunities
Business Risk Management supports the ExecutiveCommittee and the management teams of the Group companies. Business Risk Management aimssystematically to recognize major risks – as well asopportunities – facing the company. Potential risksare identified and evaluated at an early stage. Coun-termeasures are then proposed and implemented atthe appropriate level. Risk management looks at awide range of different internal and external risktypes in the strategic, operating and financial sectors.
In addition to the Group companies, the ExecutiveCommittee and the Board of Directors are also in-volved in the assessment process. The Group’s riskprofile is assessed both top-down and bottom-up.This not only entails identifying threats along the entire value chain, but also opportunities. The Boardof Directors receives regular reports on importantrisk analysis findings and provides updates on themeasures taken (see also page 127).
42
Orga
niza
tion
and
Man
agem
ent
43
Internal Audit as an important monitoring instrument
Internal Audit is an independent body. It reports directly to the Chairman of the Board of Directorsand submits regular reports to the Audit Committee.Internal Audit does not confine itself to financialmatters, but also monitors compliance with externaland internal guidelines.
Particular attention is paid to the effectiveness and efficiency of internal management and controlsystems, including:
Examining the reliability and completeness of financial and operational information;Examining the systems for controlling compliancewith internal and external directives such as plans,processes, laws and ordinances;Examining whether operating assets are secure.
Focus on joint objectives
To achieve the corporate goals and added value it isaiming for, Holcim systematically measures perform-ance. The compensation systems are designed to motivate management to perform to consistentlyhigh standards. A standardized, variable compensa-tion system has been in place for our most senior executives. Salaries are calculated not only on the basis of financial objectives, but also in light of indi-vidual goals (see also compensation report on pages142 to 152). A significant proportion of the variablecompensation is paid in the form of Holcim shares,which are locked in for a period of three to five years.This system strengthens the shared focus on a sus-tainable increase in the Group’s performance andvalue.
44
Valu
e-Dr
iven
Corp
orat
e M
anag
emen
t
Organizational chart
1 Internal Audit reports to the Chairman of the Board of Directors.2 Including Iberian Peninsula.3 Excluding Philippines. 4 Including Philippines.
Occupational Health & Safety
Human Resources
Strategy & Risk Management
Legal & Compliance
Communications
Investor Relations
North America
UK
Norway
Mediterranean2
International Trade
Belgium
France
Netherlands
Germany
Switzerland
Italy
Latin America
Javier de BenitoBernard Terver
Urs Fankhauser
Benoît-H. Koch Patrick Dolberg Urs Böhlen Andreas Leu
Bernard FontanaCEO
Audit Committee
Internal Audit1
Board of Directors Holcim Ltd
Line Responsibility
Executive Committee
Eastern and SoutheasternEurope
CIS/Caspian Region
Area Managers/Corporate FunctionalManager
FunctionalResponsibility
Status as at February 29, 2012
45
Orga
niza
tion
and
Man
agem
ent
Group Structure & Tax
Controlling
Financing & Treasury
South Asia
ASEAN 3
East Asia4
Oceania
South and East Africa
Finance & Controlling Holcim Group Support Ltd (HGRS)
Aidan LynamOnne van der Weijde
Paul Hugentobler Ian Thackwray Thomas AebischerCFO
Roland KöhlerCEO HGRS
Governance, Nomination & Compensation Committee
Jacques Bourgon
Commercial & Marketing
ACM Services
Sustainable Development
Cement Manufacturing Services
Procurement
Information & Knowledge Management
Innovation
Accounting & Administration
Human Resources HGRS
Valu
e-Dr
iven
Corp
orat
e M
anag
emen
t
Holcim’s innovations address customer needs andstakeholder requirements in an increasingly fastchanging business context. Our aspiration is industryleadership in customer solutions, sustainability andcost efficiency.
A new Innovation function has been established atcorporate level to act as a platform to coordinatethe Group’s activities. Additionally in 2012, the HolcimFoundation for Sustainable Construction for thefirst time is awarding three innovation prizes, whichfocus upon contributions to innovative buildingmaterial and construction technologies in the con-text of sustainable construction.
Meeting customer needs exceptionally well across the
entire construction value chain
Customer driven innovation demands a thoroughunderstanding of the needs of direct customers aswell as end-users. Competence in providing newcustomer solutions which incorporate innovativeproducts and services is the main way Holcim differ-entiates itself in the markets.
Driving sustainability throughout the building lifecycle
As our industry is resource and energy intensive,environmental considerations are paramount whendesigning new solutions and improving our opera-tions. Our ambition is to reduce energy needs andCO2 emissions.
Innovation is a strategic priority for Holcim. It is one of
the key ingredients to deliver new solutions to customers
and to create value.
Maximizing efficiency along the whole supply chain
Research and development in manufacturing and process technology is essential both for cost management and the sustainability of production.New technological developments allow the furtherreduction of environmental footprint and increaseduse of alternative and renewable energy sources. Adedicated Energy Fund, financed with the proceedsof the sale of excess CO2 emission certificates, hasbeen set up to support projects of Group companieswhich conserve natural resources and make stepchanges in energy reduction.
In the following paragraphs, we highlight several ofour newest innovations in these areas:
Holcim Belgium, Limroc 1 cement
Limroc 1 cement was custom blended to produce a specially formulated concrete. It was designed to meet specific customer requirements in the construction of a new railway tunnel under a sea-freight canal and tidal river north of Antwerp, Belgium. The product had to be able to be pumpedover long distances, used underwater, and offerlow resistance to drilling after six months. HolcimBelgium also set up a reliable logistics solution toaddress the project owner’s needs.
Innovation: New solutions, new value
46
Inno
vatio
n
Holcim Germany, Nord Stream offshore gas pipeline
Holcim Germany’s contribution to the successfulcompletion of the Nord Stream gas pipeline, throughthe Baltic Sea between Russia and Germany, demon-strated that it is more than a producer of high-perfor-mance products by delivering a tailor-made cementlogistics solution for the customer. The Group compa-ny supplied a total of over 400,000 tonnes of sulfate-resistant, low-alkali Portland cement with high dura-bility and early strength development over the courseof the construction.
Holcim Switzerland, Zurich cross-city rail link project
Two bridges, a train station, a tunnel, and an under-ground train station expansion underneath the exist-ing Zurich main station are the constituent parts of amajor project being carried out for the Swiss FederalRailways in and around Zurich. The Group company isnot only delivering cement and aggregates, but alsoacts as the project contact for cement technologywithin an environmentally friendly logistics concept.More than 90 percent of all material transport ishandled by rail, minimizing the impact on the sur-rounding urban environment.
Cemento Polpaico, Chile, mine expansion project
An extreme construction environment demanded acreative approach to delivery and safety. Despite theremote location in the Andes at an altitude of 3,500meters above sea-level, and harsh winter conditionswith temperatures down to –25°C, Cemento Polpaico’sengineering skills and commitment to safety meantit was able to guarantee the continuous, safe deliveryof 240,000 cubic meters of ready-mix concrete fromthree ready-mix plants. Safety was the top priority forthe customer, and here Cemento Polpaico’s tailoredmanagement system delivered as promised, with zero‘lost time injuries’ meeting the goal of “zero harm”.
Holcim France, Créateurs de Sols Béton
The Créateurs de Sols Béton network markets decora-tive concrete directly to end-users, whether they be private individuals, local authorities or architects. Surfacing products for driveways, flooring, pavements,cycle paths, communal spaces, kerbs and tramways arepresented and promoted as integrated solutions viathe internet and cross-media. The network connectsconsumers with local, Holcim certified concreting companies, adding new value for the company and the customers.
Aggregate Industries UK, Sustainable Drainage System
Flourishing development of urban, suburban andbrownfield sites has led to an increased incidence offlooding in the UK, often causing significant damage.Aggregate Industries’ Sustainable Drainage Systems(SUDS) range improves soil water absorption andreduces flood risk. The unparalleled SUDS range nowprovides a tailored solution to the differing drainagedemands encountered on today’s construction proj-ects. As well as excellent source control, SUDS can bedesigned to include pollution control, attenuation,rainwater harvesting, and infiltration near buildings.
Holcim Apasco, Mexico, Durable Flooring Solution
The Durable Flooring Solution for industrial and commercial use means that the Group company is not just delivering concrete, but rather providing acomplete, integrated solution with structural design,placing and finishing, and a warranty. This turn-keycustomer solution is offered together with a globalflooring company as a partner. A direct relationshipwith a major North American retailer has now beenestablished, allowing Apasco to become involved inthe specification stage of construction projects andbe better positioned in the competitive environment.
47
Valu
e-Dr
iven
Corp
orat
e M
anag
emen
t
Holcim Switzerland, Robusto 4R-S
To meet the increasing durability demands on infrastructure and civil engineering construction,Robusto was recently developed and launched inSwitzerland. Holcim Robusto 4R-S, consisting of Portland cement clinker, granulated blast furnaceslag and burnt shale, is characterized not only by its high resistance to alkali aggregate reaction,sulfate attack and chloride migration, but also bylimited shrinkage and an equal carbonation resist-ance in comparison to the CEM I type cements nor-mally used. During manufacturing, replacing part of the clinker with burnt shale and granulated blastfurnace slag reduces CO2 emissions substantially.
Collaboration in environmental technology
Collaboration within the Group, as well as with suppliers and leading experts outside the Group, has been further strengthened. One example is the successful collaboration of Holcim Slovakia, theRegional Manufacturing Support Organization forEastern Europe, Holcim Group Support and Austria-based ATEC. Their expertise and commitment led to the development of an innovative solution forconverting bypass dust into a marketable product.After being validated in a test laboratory, productionwill now move to an industrial scale.
Lower specific investment costs through higher capacity
machinery
In line with the industry trend towards high capacityproduction facilities, the Group systematically devel-ops components for large mechanical systems whichallow reduced total cost of ownership. Improved reli-ability and shorter component delivery times lowercement production costs. This is illustrated by a newdrive for vertical roller cement mills that has beendeveloped in collaboration with Holcim France, Holcim Group Support, grinding equipment supplierGebrüder Pfeiffer and drive system supplier Siemens-Flender. Synchronized high quality standard motorsavoid the need for large motors and gear boxes.Experiences with the first installation have been positive so far.
Open innovation for the best energy-efficiency
Collaborative ventures are continually sought. Forexample, the Group has teamed up with ABB in aconsortium seeking to develop new technology tovalorize low temperature waste heat for power generation. This project includes a test installationat the Untervaz plant in Switzerland, and showshow committed Holcim is to developing sustainableand cost efficient production processes.
48
2007 2008 2009 2010 2011 2012
Capi
tal M
arke
t Inf
orm
atio
n
49
Equity markets developed positively well into thespring of 2011. Then, the euro crisis, mounting risksin several European states and delayed economicrecovery, especially in the US, led to a negative stockmarket development. Holcim shares could not avoidthis trend. Similar to the overall market, they were
Holcim continued to focus on further increasing efficiency.
The goal was to reduce costs and adjust prices. Inflation,
competitive pressure and negative currency headwinds
were stronger however, and weighed on performance.
subject to considerable price volatility and decline. The year’s peak of CHF 76.35 was reached at the end ofApril 2011. The shares closed at CHF 50.25 on December30, which represented a decrease of around 29 percentcompared to the previous year end (2010: 70.65).
Performance of Holcim share versus Swiss Market Index (SMI)
CHF 100
CHF 80
CHF 60
CHF 40
CHF 20
CHF 0
CHF 140
CHF 120
SMI (adjusted)
Holcim registeredshare
Valu
e-Dr
iven
Corp
orat
e M
anag
emen
t
Geographical distribution
Switzerland 48%Other countries 22%Shares pending registration of transfer 30%
The free float as defined by the SIX Swiss Exchangestands at 75 percent.
Dividend policy
Dividends are distributed annually. In 2003, the Boardof Directors determined that one-third of Group netincome attributable to shareholders of Holcim Ltdshould be distributed. For the 2011 financial year, despite impairments, the Board is proposing a payout fromthe capital contribution reserves of CHF 1.00 per regis-tered share. The payout is scheduled for April 24, 2012.
Listings
Holcim is listed on the SIX Swiss Exchange. Itsshares are traded on the Main Standard of SIX SwissExchange. Each share carries one voting right. Atyear-end 2011, the company’s market capitalizationstood at approximately CHF 16.4 billion.
Additional data ISIN CH0012214059Security code number 1221405Telekurs code HOLNBloomberg code HOLN VXThomson Reuters code HOLN.VX
Major shareholders
Information on major shareholders can be found onpage 246 of this report.
Distribution of Holcim shares and breakdown of
shareholders
The majority of shares held in other countries areowned by shareholders in the UK and the US.
50
Trading volume (in ’000)
12,000
10,000
8,000
6,000
4,000
2,000
02007 2008 2009 2010 2011 2012
Capi
tal M
arke
t Inf
orm
atio
n
51
Weighting of the Holcim registered share
in selected share indices
Index Weighting in %SMI, Swiss Market Index 1.71SPI, Swiss Performance Index 1.43SLI, Swiss Leader Index 3.62BEBULDM, BE500 Building Materials Index 23.00 SXOP, Dow Jones STOXX 600 Construction 8.79DJSI World, Dow Jones Sustainability Index 0.16FTSE4Good Europe Index 0.48
Information on Holcim registered shares
Further information on Holcim registered shares can be found on our homepage at www.holcim.com/investors.
Sources: Bloomberg, Dow Jones Sustainability Indexes, FTSE Index Company, end-December 2011.
Key data Holcim registered share1
Par value CHF 2 2011 2010 2009 2008 2007Number of shares issued 327,086,376 327,086,376 327,086,376 263,586,090 263,586,090Number of dividend-bearing shares 327,086,376 327,086,376 327,086,376 263,586,090 263,586,090Number of shares conditional capital2 1,422,350 1,422,350 1,422,350 1,422,350 1,422,350Number of treasury shares 7,270,081 7,131,083 6,905,384 5,132,061 668,849Stock market prices in CHFHigh 76 85 81 111 126Low 43 60 28 40 102Average 60 71 58 79 115Market capitalization (CHF bn) 16.4 23.1 26.3 14.5 29.2Trading volumes (million shares) 357.6 378.8 397.0 495.9 297.2Earnings per dividend-bearing share in CHF3 0.86 3.69 4.93 6.27 13.66Cash earnings per share in CHF4 8.61 11.44 13.04 13.02 18.81Consolidated shareholders’ equityper share in CHF5 52.62 56.57 59.44 59.42 71.44Payout/dividend per share in CHF 1.006 1.50 1.50 2.25 3.30Dividend yield (%) 1.67 2.11 2.56 2.86 2.86
11 Adjusted for stock dividend 2008 and/or capital increases.12 Shares reserved for convertible bonds.13 EPS calculation based on net income attributable to shareholders of Holcim Ltd weighted by the average number of shares outstanding (see note 16).14 Cash EPS calculated based on cash flow weighted by the average number of shares outstanding.15 Based on shareholders’ equity – attributable to shareholders of Holcim Ltd – and the number of dividend-bearing shares (less treasury shares) as per December 31.16 Proposed by the Board of Directors for a payout from capital contribution reserves.
Valu
e-Dr
iven
Corp
orat
e M
anag
emen
t
Disclosure of shareholdings
Under Art. 20 of the Swiss Federal Act on StockExchanges and Securities Trading (Stock ExchangeAct), whosoever, directly, indirectly or in concert with third parties, acquires or disposes of shares, for his own account, in a company incorporated inSwitzerland whose equity securities are listed, inwhole or in part, in Switzerland and thereby attains,falls below or exceeds the threshold of 3, 5, 10, 15, 20,25, 331⁄3, 50 oder 662⁄3 percent of the voting rights,whether or not such rights may be exercised, shallnotify the company and the stock exchanges onwhich the equity securities in question are listed.Important shareholders are disclosed on page 246.
Financial reporting calendar
General meeting of shareholders April 17, 2012Ex date April 19, 2012Payout April 24, 2012Results for the first quarter 2012 May 9, 2012Half-year results 2012 August 15, 2012Press and analyst conference for the third quarter 2012 November 7, 2012
Current rating (February 2012)
Standard & Poor’s Fitch Moody’sLong-term rating BBB, outlook stable BBB, outlook stable Baa2, outlook negativeShort-term rating A-2 F2 P-2
52
Registration in the share register and restrictions on
voting rights
On request, purchasers of registered shares areentered in the share register as voting shareholdersprovided that they expressly declare that theyacquired the shares in their own name and for theirown account. The Board of Directors will enter individuals whose requests for registration do notinclude an express declaration that they hold theshares for their own account (nominees) in the shareregister as shareholders with voting rights, providedthat such nominees have concluded an agreementwith the company concerning their status and aresubject to recognized banking or financial marketsupervision.
Envi
ronm
enta
l Com
mitm
ent
and
Socia
l Res
pons
ibili
ty
53
Thanks to considerable efforts, the number of fatalitiesin the areas where Holcim has direct control steadilyimproved. Unfortunately, however, still 26 individualslost their lives while working for Holcim in 2011. Themajority of them were third party contractors notunder direct Holcim supervision. The Board of Direc-tors and the Executive Committee deeply regret thefatalities and will pursue the objective of an accidentfree working environment even more vigorously.
The continuous embedding of the Fatality PreventionElements and the Contractor Safety ManagementDirective throughout the business remain a priorityand the effectiveness of the implementation of thesedirectives across all regions and businesses is con-stantly being assessed. We will further strengthenthe competence of our people in OH&S throughintensive training and an improved safety organiza-tion. Holcim will also continue to work on this topicswith other companies through the Cement Sustain-ability Initiative.
Environmental commitment and social responsibility
Holcim is guided by the aim to create value for all relevant stakeholders of the Group. The principle ofsustainable development applies, seeking a balancebetween value creation, environmental performanceand social responsibility.
Health and safety is a core value
Occupational Health and Safety (OH&S) is of utmostimportance to Holcim. We expect our leaders to leadby example, to improve our safety performance, andto bring about the necessary behavior changes at alllevels. Safety reviews are regularly being conductedand the findings are quickly implemented. Hence thecommitment at all management levels is reinforcedand more visible. The goal of “zero harm to people” is the long-term point of reference.
Intensive training and various line managementinterventions aim at the necessary behavior changesat all levels. This allowed the Group to reduce thenumber of injuries for directly employed personnel,and was supported by the continued strengtheningof the OH&S management system.
Furthermore the number of severe accidents involvingdirectly employed personnel continues to decline inline with the lost time injury frequency rate.
Lost time injury frequency rate1
1 The lost time injury frequency rate (LTIFR) is calculated as: number of lost time injuries × 1,000,000 : total number of hours worked and paid. Data includes all operations.
6
5
4
3
2
1
0
2007 2009 20102008 2011
Threshold<2
2.62.1 2.0
1.6
4.1
Sust
aina
ble
Deve
lopm
ent
Sustainable building materials and sustainable
construction
Population growth, urbanization and the infrastructuregrowth of developing economies continue to drivedemand for building materials despite difficult eco-nomic conditions. The challenge for the constructionindustry is to meet this demand while reducing theassociated environmental impacts.
The main focus is on developing composite cementsin which clinker content is reduced by adding mineralcomponents such as blast furnace slag, fly ash andpozzolans. By 2011 approximately three quarters ofHolcim’s product portfolio comprised these compos-ite cements, compared with only 30 percent in 1990.Initiatives along the value chain complement this. Asan example, our Group company Aggregate IndustriesUK produces concrete products containing up to 80 per-cent recycled materials, thus reducing the reliance onnatural resources and the impact on the environment.
More sustainable products are only effective if cus-tomers accept them. In 2010, Holcim Switzerlandlaunched the “Optimo” product range; it uses fired oilshale to create a high quality product with a relativelysmall environmental footprint. By the end of 2011,Optimo represented around 31 percent of the sales of Holcim Switzerland, resulting in a meaningfulreduction in ecological impact.
Holcim has developed a standardized methodology to calculate and report the embedded CO2 emissionper tonne of cement from “cradle-to-gate”. It assists customers to make informed choices on the CO2 effi-ciency of their products. The methodology, which willbe ISO and PAS 20501 compatible, will be made avail-able to Group companies, and will allow them to labeltheir products accordingly. A similar methodology forconcrete products is currently under development.
Holcim Foundation promotes sustainable construction
The Holcim Foundation for Sustainable Constructionhas been working to promote sustainability in theconstruction sector since 2003.
Further information can be found in the section headed “Key success factors” on page 38 and atwww.holcimfoundation.org.
Reducing emissions
Holcim has committed to reducing CO2 emissions per tonne of cement by 25 percent by 2015 comparedto the reference year of 1990. We will continue tofocus on three main levers to achieve this reduction,namely reducing clinker content through the use ofmineral components, substitution of fossil fuels withalternative fuels and energy efficiency improvements.
Holcim has further targeted to reduce specific emis-sions of dust and nitrogen oxides (NOx) by 20 percentby 2012 and 2013 respectively compared to 2004 levels.Despite a continuing difficult economic environment,Holcim is committed to achieving these reductiontargets. Progress will be reported in our sustainabilityreport and on our website in May 2012.
Managing carbon trading and credits
During the year in review Holcim focused on improvingthe security of European Union carbon allowances inour registry, made necessary by the inherent lack ofsecurity of the EU system.
Holcim realized revenues from the sale of CO2allowances of CHF 63 million (2010: 95). Revenuesgenerated from carbon trading activities are used toincrease energy efficiency of the Group (see below).
54
11 A specification assessing the life cycle greenhouse gas emissions of goods and services
Envi
ronm
enta
l Com
mitm
ent
and
Socia
l Res
pons
ibili
ty
55
During 2011, Holcim received Certified EmissionReduction (CER) credits for wind power projects inIndia and alternative fuel projects in Indonesia, and it is expected that Holcim will continue receivingthese credits in 2012.
Innovation in the energy field
Holcim sets aside some CHF 100 million every year to further improve energy efficiency in the Group. In 2010, a fund was set up for this purpose. The fundis an element in the Group’s comprehensive energystrategy and is financed by the proceeds from thesale of excess CO2 emission certificates. Projects forelectricity generation by means of waste heat recovery, wind power and alternative fuels as replacement of fossil heat carriers have already been approved.With these projects alone, Holcim will save around200,000 tonnes of CO2 annually which is approxi-mately about one sixth of the emissions of the city of Zurich.
The creation of the fund has sparked a whole series ofnew approaches for sustainable energy projects. 2010saw funds earmarked for five waste heat recoveryplants in Vietnam, India, Romania, Lebanon andSwitzerland. These installations are under construc-tion and will be commissioned between the end of2011 and 2013. Another six projects were approved lastyear. They include four waste heat recovery units inCanada, Mexico, India and Slovakia, as well as twoinstallations for the utilization of alternative fuelsand raw materials in Germany and France. These facilities will be commissioned in 2013 and 2014.
Alternative fuels and raw materials
The recovery of energy and materials from waste conserves natural resources and reduces global CO2emissions, while also lowering production costs. Holcim currently produces approximately 12 percentof its thermal energy from waste derived fuels.
The co-processing of municipal solid waste offers economic, environmental and social benefits. It sub-stantially reduces greenhouse gas emissions whencompared to landfilling, contributes to solving thegrowing waste problem, provides so-called greenemployment, and makes production costs more com-petitive. Holcim will further strengthen its activitiesin this area. The Group already operates a number ofwaste treatment facilities in many parts of the world,notably in Eastern Europe. But also Huaxin Cement inChina is active in this field.
To ensure the responsible handling of waste materialsin the Group, Holcim launched the AFR Certificationprogram (ACert). It provides an auditable managementframework designed to minimize risks at AFR process-ing facilities. The ACert system has been rolled out inall Group companies that use alternative fuels andraw materials, and by the end of 2011, some 80 per-cent of Holcim facilities had been internally audited.
Sust
aina
ble
Deve
lopm
ent
In both India and China, specific national CSI groupswere initiated to ensure that the activities of thecement industry in these countries become more sustainable and verifiable. In June 2011 more than 50 participants gathered in Yichang, China, to discussthe development of co-processing in the Chinesecement industry. Chinese CSI members visited theHuaxin Cement Zigui pre-processing plant, which collects, dries, and shreds floating material from theThree Gorges Dam and injects it into the kiln as analternative fuel.
Collaborating with our suppliers
In 2011, Holcim began work on developing and im-plementing a Sustainable Procurement Initiative. The existing practices in the supply chain will bestrengthened and sustainable and responsible business practices will be promoted among suppliers.The initiative will include a Supplier Code of Conductand a methodology for identifying and assessing critical suppliers.
Strategic community engagement
Holcim’s approach to social engagement is strategic,not just philanthropic. Holcim considers the protectionand consolidation of its social acceptance as a conditionfor creating value. In the focus of the engagement are innovative solutions for low cost and sustainablehousing, the promotion of micro-enterprises andvocational training.
In 2011, Holcim Group companies invested CHF 38million in community engagement activities, fromwhich some 9.4 million people benefited directly andindirectly.
Biodiversity and water
In early 2011, Holcim extended its partnership withthe International Union for Conservation of Nature(IUCN). The focus of the cooperation is the implemen-tation of the Biodiversity Management System devel-oped during the initial phase, as well as the develop-ment of indicators for measuring success. As requiredby the Cement Sustainability Initiative, Holcimreports the percentage of sites situated in areas ofhigh biodiversity value which have biodiversity actionplans in place. Progress will be reported in our sus-tainability report and on our website in May 2012.Rehabilitation manuals, which are applicable to allquarries and pits, have been revised to better inte-grate biodiversity.
In 2011 work continued, in conjunction with the IUCNon developing a water management scheme, whichwill include a water directive, a water measurementprotocol and a water risk mapping tool. The toolswere piloted in selected Group companies in all business segments in 2011 and will be implementedfrom 2012 onwards.
Promoting good sustainability practice in the sector
Holcim is currently co-chairing the Cement Sustain-ability Initiative (CSI) of the World Business Councilfor Sustainable Development (WBCSD). The CSI, aglobal association of cement producers, was created10 years ago with the aim to coordinate actions onissues of sustainability. Activities include research,business planning, action and progress reporting, the creation of guidelines, publications, and databanks,and the development of a roadmap outlining tech-nologies that could reduce greenhouse gas emissionsfrom cement production. In the past 4 years, Holcimwas active in the Executive Board of the WBCSD.
56
Envi
ronm
enta
l Com
mitm
ent
and
Socia
l Res
pons
ibili
ty
57
During the centennial year, 2012, employees will further strengthen contributions to communitiesthrough a global volunteering initiative.
Community spending 2011
Community development projects 22%Education projects 14%Infrastructure community projects 20%Donations and charity 21%CSR overhead 20%Others 3%
Total in million CHF 38
Close cooperation with local stakeholders is vital andbuilds mutual respect and trust. Holcim engages withstakeholders in a number of forums locally includingcommunity advisory panels, formal dialog sessions,open days and local partnerships. All Group companiesshould have a formal Community Engagement Plan inplace by 2012. By the end of 2011, 24 percent of Groupcompanies report that such plans have already beendeveloped and implemented.
Listed in leading sustainability indices
For the ninth consecutive year Holcim was confirmedas a member of the Dow Jones Sustainability Indexes.In the 2011 assessment, Holcim received top scores forits international production standards, biodiversity,environmental reporting, human capital development,social reporting and stakeholder engagement. Holcimalso continues to be a member of the FTSE4Good sus-tainability index.
Sust
aina
ble
Deve
lopm
ent
A close collaborative approach exists between topmanagement, senior HR professionals in the individ-ual Group companies, and the Talent Managementteam at Holcim Group Support Ltd to identify anddevelop candidates early for leadership positions.This includes the application of a structured process,part of which is the systematic charting of key positions and employees, and the maintenance of atalent pool of high potential and high performancemanagers.
A systematic approach to talent management
Four HR process streams contribute to the develop-ment of a strong talent base:
The performance management process stream hasbeen established for many years within the Groupunder the keyword “Dialogue”. The most importantcomponent of the Dialogue process is regular, openand constructive feedback to employees. It supportsemployees’ individual development, strengthenstheir engagement and should also contribute totheir identification with the Group. Group companymanagement teams calibrate the goals of the indi-vidual employees and teams so that collectively,they can deliver the best possible performance. Holcim places a strong expectation on its leaders to act as role models and demonstrate the behaviorthey expect from their own staff.
The succession management process streamensures talent identification and development on a global scale. Dynamic talent development which is responsive to current needs is made possible by
Development of leaders is a structured process which
draws on cutting edge IT technology and social media.
Human resources
quarterly reviews. In 2011, a new web-based IT solu-tion, “iTalent”, was introduced throughout Holcim.Following the integration phase, this solution willbe the global data source for succession manage-ment analysis and reporting.
Assessment development is the third talent man-agement process stream. Holcim cultivates a cultureof constant professional advancement, continuouslearning and personal development for potentialmanagers, as well as encouraging innovation. Thisprocess stream is primarily about enhancing man-agement potential aligned with Holcim’s leadershipcompetency model, encouraging employees to takemore responsibility for their own development.
The fourth stream deals with international trans-fers. It includes all the processes and practices thatenable Holcim to develop key talent through expo-sure to assignments in other countries and Groupcompanies.
58
Hum
an R
esou
rces
59
International transfers enhance performance
A prerequisite for further growth and maintainingproductivity is the willingness of employees to bedeployed around the world. International transfersnot only support individual development, they alsopromote knowledge sharing and the rapid spread of best practices.
Moving jobs internationally is often not easy. Relocation to a different country normally presentsbigger challenges and opportunities than changingjobs at home. In a Group the size of Holcim, it isimportant to have clear, simple and transparentdirectives for international transfers and to consis-tently apply them. In 2011, the International Transfer& Remuneration team supported Group companiesin transferring around 125 employees globally. Theteam’s work naturally includes ensuring proper benefits coverage and tax compliance. Line managersaim to make sure that employees and their familiessettle in quickly at their new location.
The geographical distribution of transfers at the endof 2011 can be seen in the tables and charts below:
Europe154
Africa Middle East3
Asia Pacific 17
Latin America64
North America10
Transfer of employees from the following Group regions
Transfer of employees to the following Group regions
Number
Europe118
Africa Middle East21
Asia Pacific 36
Latin America63
North America10
Number
Sust
aina
ble
Deve
lopm
ent
60
The use of social media in Human Resources
In global competition – including for talent – theuse of social media is becoming an increasinglyimportant success factor. Today, most global organi-zations and many local companies are present onthe web. From an HR perspective, presence on theweb is also a given for Holcim, providing access tocareer information and the opportunity to apply foropen positions on line, both of which options aregaining in significance. With this in mind, Holcim’scareer website has been improved, largely as a resultof feedback obtained through participation inbenchmarking initiatives.
Holcim is also using social media such as Facebookand Flickr to be able to communicate effectivelywith potential future employees. Above all, youngpeople are using these media to make decisions andto voice their opinions about companies.
The HR presence in social media provides a multitudeof information to give future employees an insightinto working in the Group. Holcim’s Facebook pres-ence contains video features of recent recruits andprovides introductions to career paths. There arealso links to the career website – a dynamic forumfor current and future employees to exchange infor-mation.
Composition of senior managers
Male Female Total Percentage of womenTop management level 329 32 361 9%Senior management level 1,437 146 1,583 9%Middle management level 6,825 994 7,819 13%Total 8,591 1,172 9,763 12%
Origin of senior managers
From Europe: 24 nationalities 32% of all senior managementFrom North America: 2 nationalities 2% of all senior managementFrom Latin America: 12 nationalities 8% of all senior managementFrom Africa Middle East: 7 nationalities 12% of all senior managementFrom Asia Pacific: 17 nationalities 46% of all senior management
Personnel expenses in 2011 by function and region
Million CHF Production Marketing Administration Total and distribution and salesEurope 897 153 234 1,283North America 591 53 101 744Latin America 364 64 91 519Africa Middle East 52 8 24 84Asia Pacific 697 95 209 1,001Service and trading companies 40 23 164 227Total Group 2,641 395 823 3,859
Group employees by region 2011 2010 2009 2008 2007
Europe 19,602 19,690 20,800 23,557 22,905North America 7,543 6,668 8,016 9,825 11,190Latin America 12,867 12,710 12,626 13,548 13,409Africa Middle East 2,140 2,213 2,256 2,477 2,795Asia Pacific 37,942 38,172 36,858 36,196 38,133Service and trading companies 873 857 942 1,110 932Total Group 80,967 80,310 81,498 86,713 89,364
Group employees by segments 2011 2010 2009 2008 2007
Despite the difficult economic conditions at the start of the 1940s, this periodwould see several important decisions which would have a major influence on therecovery of “Holderbank” in the years following the war. For his part Hans Gygi, sonof the founder Adolf, would be responsible for several key projects and expansionmoves which likewise would leave their mark on the cement company. In 1942, heproposed creating a research and testing facility in Holderbank. It took two yearsto get the project approved and another two years to get it up and running. The research facility, which in 1947 was renamed the Technische Stelle “Holderbank”(Technical Center “Holderbank”, or TSH), helped the Swiss to achieve a unique posi-tion in the areas of consulting, research, project development and services. The TSHoffered its services also to third parties, and from its earliest beginnings, was ableto pay for itself out of the sale of licences and consulting fees. A quarter centurylater in 1970, the TSH was renamed “Holderbank” Management and Consulting Ltd.
During this time, Hans Gygi was also the driving force behind efforts to expandacross the Atlantic. Although the post-war Swiss economic boom had invigoratedthe expansion plans of “Holderbank”, the 1950 decision to venture into North Americawas anything but easy. Tasked with project planning for a new factory in Quebec in Canada, the TSH had quickly come to a sobering conclusion: costs for the projectwould be astronomical, involving sums of money which the Swiss, after years of
war and its consequences, simply couldnot fathom. They were several orders ofmagnitude greater than the amountsthat the management of “Holderbank”had dealt with in the late 1930s whenthey expanded into South Africa.
Max Schmidheiny showed little interestin the American market and left it to his brother Ernst. The latter set to work using the approach which had provenso successful during previous expansionphases. He decided to put together agroup of companies under the leader-ship of “Holderbank” Financière GlarusAG and so, together with a handful ofpartners from the cement and financeindustries, founded the St. LawrenceCement Company with headquarters inMontreal. The goal was not necessarilyto look for a majority stake at the out-set but to gain a foothold and concen-trate on the long-term effort of gettingestablished in the new market. At thesame time the decision was made totake on the strong Canadian competi-tion by means of a product which wasnot just cheaper but also better.
Research and testing institute in Holderbank.
The agricultural productioncrisis in HolderbankIn the early 1940s, “Holderbank” saw a repeat of the conditions the cement factory had already experi-enced during World War One. Coalwas in short supply, many workerswere stuck at the border, demand collapsed. As with other Swiss com-panies, cement producers wereforced to shut down their kilns,sometimes for weeks on end, andsend their workers into the fields tohelp relieve the food supply crisisbrought on by the war. Things did not look much better for the otherEuropean affiliates. The driving forceduring this period remained the factories in the Arab world. MaxSchmidheiny used the profits fromTourah in Egypt and Chekka inLebanon to finance expansion ofErnst Schmidheiny’s cement-pro-ducing activities in South Africa. Thiswas an important step towards thefuture dualism approach used by theSchmidheiny brothers in their foreigncement business undertakings.
Workplace around 1945 in the cement plant in Holderbank.
64
The Swiss did not pull their punches. Their guiding principle: the greater the capacity,the higher the efficiency. The equipment and kilns of the new plant in Villeneuveon the banks of the St. Lawrence river had more than double the usual capacity.The move paid off more quickly than expected, and theywere soon able to open a second plant of the same sizein Mississauga on the banks of Lake Ontario nearToronto. The entry into Canada proved to be a catalyst,considerably speeding up the plans of “Holderbank” toexpand into North and Latin America. This, in turn, laidthe basis for the company’s rise to a global player overthe following two decades.
In 1950, after years of crisis, the Swiss economy expe-rienced a major turnaround. Housing constructionspurred growth, and within a year all sectors werebooming. The future looked bright as well, with a slewof major infrastructure projects, such as large dams and power plants in WesternSwitzerland, on the horizon. “Holderbank” was able to secure a large share of thefinancing it needed for new investment domestically. This domestic financingcompensated for the persistent difficulties the company experienced with someof its foreign investments in the post-war years. It was not until well into the1950s, in fact, that “Holderbank” began to see dividends coming out of many ofthe warravaged countries in Europe, such as Germany and Austria. Problems arosein Egypt as well, where “Holderbank” had to struggle against a growing tendencytowards the nationalization of industries.
The Mississauga cement plant in Canada belonging to St. Lawrence Cement: after World War Two “Holderbank” began its rise to becomeone of the leading cement producersin North America.
65
1952An important cause of the economic boom in Europe was the
American aid program known as the Marshall Plan. From 1948
to 1952, the US supported Western European countries with
12.4 billion dollars worth of aid. “Holderbank” took advantage of
the subsequent economic momentum and also began, early on,
to enter the Latin American market. In 1958 the company listed
itself on the stock exchange in order to raise capital for expan-
sion. The construction of large hydroelectric power plants in
Switzerland further fueled developments, so that the national-
ization of the “Holderbank” plants in Egypt caused no lasting
damage to the company.
The Marshall Plan boosts Europe
100 years of Holcim: Decade 5 (1952 to 1961)
Workers during the building of the plant in Quebec.
66
1952
1953
1954
1955
1956
1957
1958
1959
1960
1961
After two decades of economic and politicaldifficulties, “Holderbank”management was finallyable to reap the rewardsof its long-term vision.The large-scale, post-wareconomic recovery pro-gram initiated by the US,known as the MarshallPlan, helped Europe tosustainable economicgrowth. In all, the Ameri-cans provided 12.4 billionUS dollars in aid to thecountries of Western Europe from 1948 to 1952.
The 1950s were not only a profitable period for
“Holderbank”, they were also a decade of increased expansion. Following the entryinto the Canadian market with the construction of two large plants, an equally largecement production facility was opened in the US in Dundee, Michigan, in 1960. Thischain of three modern plants helped the company establish itself in the difficultand highly regulated North American market. This, however, was not enough for theSwiss – not by a long shot – and they began to target the Latin American market aswell. To help finance its plans, “Holderbank” increased its capital from 10 to 30 millionSwiss francs in the spring of 1958. Doing so involved a listing of registered andbearer shares of “Holderbank” Financière Glarus AG on the Zurich and Basel stockexchanges. Despite the large issue of stock, Ernst and Max Schmidheiny were ableto keep control of the company for themselves through the use of voting rightshares. This inflow of new capital paved the way for further expansion in North andLatin America. It was also a good example of how “Holderbank” early on recognizedand made use of the leverage effects of the financial markets – one of the first ofthe large, Swiss family-run businesses to do so.
Prosperity for everyoneThe economic upturn and rising com-pany profits during the boom yearsof European recovery would pay offfor employees and their families aswell. Having built the Wohlfahrtshaus(welfare house) the previous year using money from an endowmentcreated expressly for that purpose in Holderbank, in 1959 the companycreated no less than three new foundations. The first was a welfarefund which the Board of Directors endowed to the tune of 250,000Swiss francs. At almost the sametime, “Holderbank”, acting on one of the last wishes of its long-time Director Oscar Wagner, established a foundation to help the children ofemployees pursue higher educationopportunities and to provide vaca-tions for women. This foundationwas granted 200,000 Swiss francs.The third foundation that year,the Adolph Gygi Scholarship Fund,started life with a grant of 100,000Swiss francs. With these three foun-dations, “Holderbank” was continuingthe tradition of social responsibilitythat its management had begun in previous decades, for examplethrough gradual expansion of pen-sion funds and numerous other employee benefits.
68
The Dundee plant in Michigan was inaugurated in 1960.
Almost simultaneously with the entryinto the US market, Ernst Schmidheinyinvested in a small Brazilian plant nearSorocaba in the vicinity of São Paulo. Inthe 1960s, Brazil served the Group as thestaging ground for moves into otherLatin American markets. In 1959, a youngSwiss, Max D. Amstutz, took over man-agement of the Brazilian Companhia deCimento Ipanema. He was to play a keyrole in the company’s further expansion.
For the time being, however, “Holderbank”remained primarily concerned with European reconstruction and the enor-mous infrastructure projects whichwere being carried out in Switzerland. In the domestic market, 1953 saw theopening of a cement factory in Eclépensbelonging to the Société des Chaux et Ciments de la Suisse Romande. This wouldbecome the main supplier of cement for the large dams and power plants beingbuilt in the Valais Alps, some of the largest construction projects in Swiss history.The Grande Dixence alone, which remains Switzerland’s largest dam today, con-sumed some 1.3 million tonnes of cement by the time it was completed in 1961. In1958, Max Schmidheiny opened a further factory in Untervaz to meet the cementneeds of the power plants being planned in the cantons of Graubünden and Ticino.Besides the infrastructure projects, housing construction was a strong source ofgrowth at the time. In 1954, the number of new housing units rose to 31,000, triplewhat the figure had been at the end of the war. That year “Holderbank” also finallyreceived permission from the Allies to collect dividends from neighboring Germanyand Austria.
Although Belgium remained the major dividend-paying market for “Holderbank”during the 1950s, the domestic market became increasingly important in this regard as well. This was not least because of the increasing difficulties in Egypt. A key market for over three decades, with Nasser’s coup in 1954 and the national-ization of the Suez Canal on 26 July 1956, dividend payments from this part of theSchmidheiny cement empire began drying up. As recently as 1952, Max Schmidheinyhad started the Alexandria Company for Portland Cement along with the SudanPortland Cement Company Ltd., which had a factory in Atabara on the Nile some300 kilometers north of the Sudanese capital of Khartoum. These new, Swiss-builtplants were a large reason why Egypt had been able, in only a few years, not only to finally meet its own demand for cement, but to become the largest cement exporter in the Arab world. The Egyptian factories ran at full capacity during thoseyears, with the government’s large-scale industrial and social projects claiming the lion’s share of production.
On 20 July 1961, the Egyptian adventure, which had been extremely successful up tothen, ended abruptly for the Swiss. At 11 p. m., a former civil servant from the Helwanfactory appeared under police protection and presented himself as the new Presi-dent and General Manager. On that same day, Colonel Nasser had nationalized theproperty of 52 foreign companies in Egypt. And while Max Schmidheiny used all theclout available to him to avoid being completely nationalized, he had to settle forcompensation. In his memoirs, he wrote that in 1964 the original owners were givena sum that represented only 30 to 40 percent of what would have been a fair settle-ment price.
With demand for cement increasing considerably in Switzerland – it reached 3 milliontonnes in 1960 and increased to 3.6 million the following year – Ernst Schmidheiny
was at least able in thedomestic market to make up for most of hisbrother’s losses abroad.This good news camenone too soon, as Belgium,one of the major marketsfor “Holderbank” at thetime, started showingsigns of stagnation (theonly Western Europeancountry at the time to doso). This was a result ofthe Congo Crisis, whichstrained the Belgianeconomy and absorbedthe funds that otherwise
would have been used to expand its own infrastruc-ture. For all its efforts to expand abroad, “Holderbank”always profited by never neglecting its home market.Growth in Switzerland and rising profits provided thebasis for further geographic expansion in the follow-ing decade. This development was greatly supportedby the extension of the Swiss national road network,which came on the heels of the power plant construc-tion boom and in which “Holderbank” played a key roleas market leader. The decade culminated in the found-ing of a new company, “Holderbank” Concreta AG, withheadquarters in the Swiss town of Niederurnen. Thiscompany focused on planning and building ready-mixconcrete plants, following a trend that had been devel-
In 1953, “Holderbank” entered the Brazilian market: bag loading in the Pedro Leopoldo plant in the state of Minas Gerais.
The foundations and boardings for the cement silos in Quebec.
70
1961oping in several markets for a number of years. At the same time, “Holderbank”Concreta AG was intended to be a parent company for future acquisitions of gravel-mining land. With pressure from the newly emerging environmental protectiongroups and their push for increased environmental regulations, “Holderbank” beganto concentrate on doing more of its own gravel mining. The idea was to secure long-term access to raw materials, as it would become increasingly difficult to developnew sources of aggregate reserves.
In favor of liberalized labor markets“Holderbank” management hadevery reason to be pleased with thesituation in its native country. Eachyear saw new highs in cement pro-duction, primarily thanks to the construction of new power plantsbut also due to record per capita consumption of cement for housingconstruction – well above the Euro-pean average. The flip side of this on-going economic boom was a greatlyexacerbated situation in what was analready tight labor market. Like otherSwiss industries, the cement sectorfaced a serious labor shortage. In hisaddress to the group’s 1956 annualgeneral meeting, Ernst Schmidheinyspoke out forcefully about the situation. As reported in detail by the Neue Zürcher Zeitung (NZZ) on 27 April, the focus of his message was his concerns over a future laborshortage, accompanied by an appealto the unions to revise their “ratherrestrictive policy towards the ques-tion of foreign workers in favor of a more tolerant approach”. Demo-graphic developments at home, headded, made it impossible to relysolely on domestic labor. In light ofthese changes in the makeup of thepopulation it was also fair to ask ifthe authorities shouldn’t review theirimmigration policy. Schmidheiny’scall for easing restrictions on quali-fied foreign workers in Switzerlandwould be echoed 15 years later by his brother Max who also spoke outagainst Switzerland’s restrictive labor market policies. “It’s a clear case of economic exploitation whenhundreds of jobs remain vacant in ahighly modernized, fully efficient industrial company simply becauseof an artificially created shortage inthe labor market,” he said.
A highway interchange in Toronto: infrastructure projects after the war boosted the cement industry.
71
1962In the 1960s, the two Latin American markets of Brazil
and Mexico became major contributors to the company’s
portfolio. At the same time the North American market
became increasingly important. After years of discussion,
the Schmidheiny brothers took the step in the early
summer of 1970 of consolidating their cement activities.
They were able to convince shareholders with their vision
of a globally active construction materials company.
The combination of “Holderbank” and the Schweizerische
Cement-Industrie-Gesellschaft resulted in a company with
total revenues of 800 million Swiss francs. From that
moment on, “Holderbank” could hold its own with largest
players in the industry.
The rise of a global concern
100 years of Holcim: Decade 6 (1962 to 1971)
With Compañia Mexicana de Cemento Portland Apaxco, “Holderbank” laid the ground-work for its continued success in the Mexican market.
72
1962
1963
1964
1965
1966
1967
1968
1969
1970
1971
In its 50th anniversary year in 1962, “Holderbank” began a phase of expansion in Latin America whichwould propel the Group into a position as a leaderamong global cement manufacturers in the late1960s.
“Holderbank” and the Schweizerische Cement-Indus-trie-Gesellschaft (SCI), also controlled by Ernst andMax Schmidheiny, divided the countries up betweenthem. Having already entered Brazil a decade earlier,the Swiss participated in the construction of a newcement plant in Costa Rica in 1962 and 1963, in whichthey at first acquired a minority stake via SCI. Theyalso succeeded in entering the Mexican market via
SCI with a stake in Compañía Mexicanade Cemento Portland Apaxco, whichwas later renamed Cementos Apasco.“Holderbank” took over the holdings inboth these companies in 1970. In 1967,the Group acquired a minority stake in Cementos Lima SA, though the com-pany would experience political andmonetary difficulties in the followingyear. With a new “Industrial Act”, Perubegan in 1970 to nationalize numerousbranches of industry. Thanks to the bi-lateral agreement between Switzer-land and Peru on investment protection,
“Holderbank” was at least able to receive the nominal value of its investmentback as compensation.
At the start of 1969, “Holderbank” acquired a minority share of Cementos Boyacáin Colombia, which is now among the nation’s leading construction materialsmanufacturers. The entry into the Australian market followed quickly through
The Apaxco plant to the north of the Mexican capital city.
At the beginning of the sixties, investment was made in acement plant in Costa Rica. Picture: Cartago plant.
The Pedro Leopoldo plant in Brazil.
74
the founding of a new national company, and a few months later“Holderbank” acquired a stake in Australian & Kandos CementHoldings Ltd., as a further means of taking part in this dynamicand significant market.
As the Group expanded into new regions of the world, its NorthAmerican market increased in importance as well. In December1967, Dundee Cement Co., an affiliate of “Holderbank”, announcedthe opening of a new cement factory in Clarksville, Missouri. The cost of this plant, which had an initial capacity of 1.2 milliontonnes, was secured for the most part by a long-term loan.
One side effect of expansion was an increasingly intense discussionin the Swiss financial press around demands that “Holderbank”completely divulge its shareholdings on a consolidated balancesheet, giving shareholders a better overview of the portfolio andits attendant risks. At the annual general meeting in 1965, ErnstSchmidheiny rejected the idea on the grounds that a consolidatedbalance sheet was impossible due to bureaucratic hurdles, diver-gent financial reporting standards and exchange rate fluctuations,but this didn’t put a stop to talk of consolidation. Quite the contrary,intense discussion of the subject continued in the “Holderbank”executive suite, above all after the arrival of two new Directors in 1967 in the persons of Anton E. Schrafl, a nephew of the Schmidheiny brothers, and Max D.Amstutz. With time the Board would grow to realize that the financial marketswould not continue to be satisfied with the current practice of simply listing thedividend payments from the individual national companies. At the same timethe co-leadership approach of the Schmidheiny brothers was being called intoquestion, as the two-track investment tactic used by “Holderbank” and SCI hadreached its limits. Despite intensive and constructive co-operation between thetwo brothers, the prevailing structures hindered further expansion and a full exploitation of the company’s industrial resources. Due to the nature of thesestructures, the Schmidheinys were also not able to individually access the cashflow in many of their holdings, another disadvantage. In the early summer of1970, Ernst and Max Schmidheiny finally took the plunge and consolidated theircement manufacturing activities. This marked the end of an era in the Swiss cement industry: the age of industrialist families which had congregated aroundthe Schmidheinys and enjoyed friendly relations with them.
The shareholders of “Holderbank”, however, were attracted to the idea of a globally active construction materials company, approving the acquisition of assets of SCI with a combination of equity and cash.
Kiln line in the cement plant of Westport in New Zealand.
Economic upturn defies frost and iceDespite some minor setbacks, theeconomic growth of the post-waryears continued into the 1960s. Cement sales in most European countries set new records year afteryear, and the construction industryprofited from an uninterrupted in-frastructure boom fueled by powerplant and highway construction projects. There was a brief, and some-what frosty, break in this activity during the “winter of the century” in 1962/63. It was so cold that winterthat major lakes all over Central Europe – like the Lake of Zurich, Lake Constance and the Chiemsee in Bavaria – froze over, as did canals in the Netherlands and Belgium. Inmany countries, construction activitycame to a standstill for weeks.“Holderbank” suffered from the coldtoo, with sales collapsing in mostmarkets for the first time since 1958.Luckily, the record winter was fol-lowed all over Europe by a long, warmand very dry summer, which in turnwas followed by an extremely mildwinter. This helped the constructionindustry rather rapidly recover fromits slowdown. So while “Holderbank”had to accept a drop in cement salesin Switzerland in 1963, the next yeardemand in its domestic market increased by 19 percent, surpassingthe four million tonne level for thefirst time.
75
At the same time, the family exchanged its holdings for a larger share of the“Holderbank” capital. The Neue Zürcher Zeitung (NZZ) was impressed by thenumbers, which made clear just to what extent this move solidified the Group’sposition in almost all its markets. Before the acquisition, “Holderbank” heldstakes in domestic and foreign companies with an annual capacity of around 21million tonnes, of which it fully controlled barely a third. After the acquisition ofSCI’s cement activities, although annual capacity increased by “only” 25 percentto 25.5 million tonnes, “Holderbank” now controlled at least three-quarters. With total sales of 800 million Swiss francs, and increased geographic and riskdiversification, “Holderbank” could easily hold its own against the other majorplayers in the industry. It now participated in 31 cement companies. In a third ofthese it had a majority stake, in five others it possessed a large enough minoritystake to be able to exercise full control. The newly enhanced transparency surrounding the Group’s affairs also found clear expression in the 1970 annualreport, which was nearly twice as long and twice as thick as its predecessors.
The advantages of the merger were apparent, as Ernst Schmidheiny made thor-oughly clear in the annual report: strengthened positions in markets, increasedproduction efficiency, improved earnings, better expansion potential, increasedinfluence on subsidiaries’ business decisions and – last but not least – easier access to financial and capital markets. Although many shareholders remained
opposed to the plan, fearing dilution of their capital, Ernst and Max Schmidheiny prevailed, not least withthe help of votes from shares held by the large banks on whose boardsthey sat.
In Switzerland, the merger marked the beginning of a new era. The Koch family, for instance, which like“Holderbank” held a 50 percent shareof the Vigier cement factory, did notgo along with the share swap agree-ment, preferring to buy back the“Holderbank” stake. The time was also not yet ripe for a merger with the Société Suisse de Ciment PortlandSA in the canton of Neuchâtel, with its stake in plants at Merone and Barletta in Italy.
Office building of “Holderbank” Management and Consulting Ltd (HMC) in Holderbank.
The canteen “Aarehus” in Holderbank was used by the employees of HMC andthe cement plant in Holderbank.
Ahead of their time“Holderbank” was one of the firstcompanies in Switzerland to see thetrend from manual to electronic dataprocessing in the 1960s. At the end of 1964 it acquired a stake in thenewly formed Interdata AG, whichwas active at the time as a comput-ing center for industry, trade andsmall business. Three years later thecompany was well established in themarket and generating considerableprofits. The cement group profitednot just from the electronic process-ing of its data flow: Interdata alsosupported its research functions andfactories with technical calculationsand provided solutions for increasingefficiency.
76
77
The merger meant reorganization on several fronts. ErnstSchmidheiny remained Chairman of the Board, Max Schmidheinybecame Deputy Chairman and Anton E. Schrafl and Max D. Amstutz were named Managing Directors. These four wouldalso make up the company’s executive management. The presence of Schrafl and Amstutz helped fill a gap which hadarisen in the company’s succession planning. Ernst Schmidheinyhad no sons and only limited contact with his two daughtersfrom his first marriage, while at the start of the 1970s MaxSchmidheiny’s three sons were still either in school or at uni-versity. All of the specialized services and functions which hadbeen created during the days of the former Technical Center“Holderbank” were also reorganized. As part of the newlyformed “Holderbank” Management and Consulting Ltd., theTechnical Center, as well as the personnel, financial and control-ling functions, along with Group planning, were combined under Ernst Schmidheiny’s leadership. The goal of the reorgani-zation was to expand business representation domestically and abroad and continue to take over the management of othercement factories. “Holderbank” continued with its expansionplans starting the year after the merger, rounding off its portfolioin the Mediterranean and South Pacific regions with acquisitionsin Cyprus and New Zealand.
First Annual Report of “Holderbank” Financière Glarus AG after consolidation.
1972The oil shock of 1973 ushered in a difficult phase in the history
of “Holderbank”. Demand, especially in the construction sector,
collapsed in many markets. Thanks, however, to good market
conditions in Lebanon and South Africa, the company was
able to withstand the crisis practically unscathed, and could
increase revenues and profits again from 1976 onwards. This
made possible a first move into Asia, as well accelerated
expansion in Latin America and the very promising Spanish
market.
Expansion despite oil crisis and inflation
100 years of Holcim: Decade 7 (1972 to 1981)
The Nobsa plant of CementosBoyacá in Colombia.
78
1972
1973
1974
1975
1976
1977
1978
1979
1980
1981
Two years after taking over the construction activities of the Schweizerische Cement-Industrie-Gesellschaft (SCI) and becoming a global player, “Holderbank” Financière Glarus AG (HOFI) and its diversification strategy was put to a tough test.The oil price shock of 1973 and the subsequent recession shook the economies ofthe industrialized countries to the core. Energy prices exploded, triggering infla-tionary impulses not seen in Europe since World War Two. Demand collapsed inseveral markets as the construction industry was particularly hard hit by the deeprecession. In several of its key markets “Holderbank” suffered double digit drops in sales for cement and aggregate materials. This was above all the case in Switzer-land and West Germany, although Belgium, the Netherlands, France and the USwere also among the biggest decliners. However, while many globally active com-panies suffered from the effects of the oil crisis well into the 1980s, “Holderbank”managed to survive the period without any lasting injury, and was able to increase
sales and profits again as early as 1976.It owed its robustness during this diffi-cult period mostly to strong business inLebanon and South Africa. Earnings inboth these markets more than compen-sated for the losses in the industrializedcountries of Western Europe and NorthAmerica. After 1975 there were also pos-itive developments in the holdings andGroup companies in Latin America. In1976, “Holderbank” grew by eleven per-cent in Brazil, by 6.6 percent in CostaRica and by 5.3 percent in Colombia. Incomparison, Belgium showed a declinethat same year of 4.5 percent, while in
Switzerland demand was down by 5.8 percent and inNew Zealand by 7.5 percent.
The cash flow generated in South Africa and Lebanonhelped the Group continue its expansion strategy despite the turbulence in its established core markets.In 1974, “Holderbank” made its first move in Asia witha participation in the Philippines. In 1975, it enteredEcuador, in 1977 Chile, 1979 Venezuela and 1980 Spain.
At the same time “Holderbank” expanded its stakesand plants in the US, Australia and Europe to such an
extent that, even in these difficult markets, the losses caused by the recessioncould be quickly recouped. In Germany, “Holderbank” grew primarily through its acquisition of Nordcement and Alsen-Breitenburg, in France through the purchaseof the Origny and Champagnole groups.
This period also saw a change in leadership at “Holderbank” with the completion of a long-planned and well-considered changeover to the next generation of theSchmidheiny family.
The end of a chapter in Swiss industrial historyIn its home market of Switzerland,responsible for 13 to 14 percent of theGroup’s sales at the end of the 1970s,the seventh decade marked the beginning of a new era. A new plantwas opened in Rekingen in the can-ton of Aargau, spelling the end ofthe previous center of operations inHolderbank. In 1977 administrationand company management movedto the new location. In 1979 a pack-ing plant and bag distribution centerwere completed at Rekingen as well.With this change, an important partof Swiss industrial history came toan end. In 1980, 68 years after beingbuilt, the factory in Holderbankclosed its doors for good.
The control room of the cement plant in Eclépens in Switzerland.
In 1974, the Group entered the Asian market with a first stakein Pacific Cement in the Philippines.
80
1981Business administration for highschool studentsIn May 1972, the Board of “Holderbank”created the Ernst Schmidheiny Foundation with a grant of one millionSwiss francs. The move was timed tocoincide with Ernst Schmidheiny’s70th birthday. The stated purpose ofthe foundation was to promote –among the Swiss public and especiallyits youth – an interest in and under-standing of the economic interdepen-dencies in a liberal social marketeconomy. The foundation began hold-ing “business weeks” at secondaryschools, organized by chambers ofcommerce and industrial associations.Instruction was provided by Swissbusiness executives. Through thesediscussions and by providing personalcontact with business leaders, thefoundation aimed to bring studentsinto closer contact with the businessworld. The creation of the foundationalso marked the completion of ErnstSchmidheiny’s withdrawal from“Holderbank”, for whose developmenthe had been responsible for morethan 40 years. In 1975, he passed the Chairmanship on to his brotherMax, and a year later he was namedHonorary Chairman of the company.Today, the foundation which bears his name is more active than ever, successfully carrying out its businessweeks in schools in all Swiss cantonsand in (primarily Swiss) schoolsabroad.
In 1977, the new cement plant in Rekingen, in the Swiss canton of Aargau, replaced the plant in Holderbank.
Although Max Schmid-heiny remained active asChairman of the Boarduntil the 1980s, he gradu-ally handed over the reins.From 1976 to 1977 theGroup was run by ErwinMächler, an experienced,long-serving “Holderbank”manager, greatly easingthe generational transi-tion from Max to ThomasSchmidheiny.
Thomas Schmidheiny hadstudied business admin-istration as well as con-trol and process technology at the Swiss Federal Institute of Technology in Zurich,before being sent to Peru by his father. There he first worked as a shift manager, in keeping with the family tradition of learning the business from the ground up.In 1970, he took over as technical head of the Apaxco plant in Mexico. After his return, he worked his way up step-by-step. In 1975, he was named a Managing Director of the Board of Directors of the HOFI cement plants in the German-speak-ing part of Switzerland. Parallel to that, he ran the company secretary function forthe Executive Committee and Board of Directors. In 1976, the Board appointed himto the Executive Committee of HOFI, with responsibility for Switzerland and theMiddle East. In 1978, he became Chairman of the Executive Committee and a Managing Director of the Board of HOFI. In 1980, he was named Deputy Chairmanof the Board.
Thomas Schmidheiny was elected Chairman of the Executive Committee in 1978.
In 2011, the economy performed quite well in thewestern European countries where Holcim is present.There were some exceptions, however, such as Italyand Spain. During the course of the year, the financialand debt crises increasingly slowed down the eco-nomic recovery in the eurozone and created uncer-tainty among investors. In Eastern Europe, the needto reduce deficits prompted governments to cutspending – sometimes drastically – which adverselyimpacted domestic demand. In Russia, the economicrecovery continued, accompanied by relatively highinflation rates. In Azerbaijan, growth was drivenmainly by the oil and gas industries.
In a number of countries, the construction sectorbenefited from economic stimulus programs intro-duced in 2009/2010 which focused strongly on theinfrastructure sector. Employment levels in the German construction industry were fairly good,despite regional variations. France experienced anincrease in demand for construction materials, andin Switzerland brisk residential construction activityand major infrastructure projects resulted in highcapacity utilization. In the UK, despite stringent government spending cuts, there were still salesopportunities for the construction industry in someareas such as transport and energy. In Italy andSpain, public sector construction activity continuedto bear the brunt of the government austerity meas-ures and suffer from the lack of private projects. The construction materials industry faced generallyfiercer competition, which put pressure on prices incertain regions.
Many Eastern European governments postponed orsuspended projects in an effort to reduce their infra-structure spending. This mainly applied to the CzechRepublic, Hungary, Croatia and Slovakia. In some
Positive volume development in Europe despite slowdown
in growth
cases, construction activity in these countries wasalso hampered by tight lending, high interest ratesand payment defaults. Romania, Bulgaria and Serbiainvested in infrastructure projects – mostly roadbuilding – but there was little recovery in residentialconstruction in these countries. In Russia, cementconsumption increased sharply, driven by residentialconstruction and infrastructure projects, whichresulted in significantly higher cement prices.
Rising sales of cement and aggregates
In 2011, consolidated cement shipments in Groupregion Europe increased by 2.2 percent to 26.8 mil-lion tonnes. Deliveries of aggregates also increasedby 7 percent to 83 million tonnes. Shipments ofready-mix concrete rose by 0.5 percent to 16.1 millioncubic meters. Asphalt volumes declined by 5.8 percentto 5.4 million tonnes.
Consolidated key figures Europe 2011 2010 ±% ±% LFL*
Production capacity cement in million t 49.8 50.0 –0.4 Cement and grinding plants 37 40 Aggregates plants 256 259 Ready-mix concrete plants 556 578 Asphalt plants 58 58 Sales of cement in million t 26.8 26.2 +2.2 +1.9Sales of mineral components in million t 2.4 1.6 +49.4 +49.4Sales of aggregates in million t 83.0 77.6 +7.0 +3.3Sales of ready-mix concrete in million m3 16.1 16.0 +0.5 +0.3Sales of asphalt in million t 5.4 5.7 –5.8 –5.8Net sales in million CHF 6,122 6,535 –6.3 +3.1Operating EBITDA in million CHF 930 1,045 –11.0 –3.8Operating EBITDA margin in % 15.2 16.0 Personnel 19,602 19,690 –0.4 –3.7
* Like-for-like, i. e. factoring out changes in the scope of consolidation and currency translation effects.
Grou
p Re
gion
Euro
pe
83
Busin
ess R
evie
w
Despite the contracting domestic demand, AggregateIndustries UK sold slightly less aggregates, but moreready-mix concrete. However, exports of aggregatesto continental Europe increased. The Group company’ssales of building materials were supported by majorconstruction sites in London, and by the constructionof a new terminal at Heathrow Airport. The sales volume of asphalt dropped as a result of the declinein road building.
In a competitive market, Holcim France achieved significant increases in volumes across all segments,with the acquisitions made in Alsace at the begin-ning of the year impacting positively on sales ofaggregates and ready-mix concrete. While the con-struction sector was faced with a difficult price situ-ation, particularly for ready-mix concrete, the situa-tion improved slightly for cement. Holcim Belgium –which also operates in the Netherlands – likewiseincreased its sales in all segments due to the revivalof commercial and infrastructure construction projects. However, margins further declined as aresult of fierce competition.
Holcim Germany, which is active in northern Germany,increased its sales in all product segments, withregional variations however. An increase in invest-ment in residential and commercial building projectscompensated for hesitant public sector constructionactivity. For Holcim, the projects requiring large volumes of construction materials included the NordStream Consortium’s natural gas pipeline throughthe Baltic Sea, the JadeWeserPort in Wilhelmshavenand the reconstruction of the old Kaiserschleuse lockin Bremerhaven. The south German Group companyposted substantial increases in deliveries of ready-mix concrete in particular. Sales of aggregates werealso robust and only cement saw a slight decline in sales.
Holcim Switzerland’s delivery volumes exceeded the previous year’s high levels in all segments, withdemand coming mainly from the infrastructure andresidential construction sectors. Pressure fromimports from Germany and Italy further increaseddue to the strong Swiss franc. In Italy, the govern-ment’s stability program led to spending cuts in theinfrastructure sector, and there was also a decline in private building projects. However, deliveries inpreparation for the World Expo in Milan generatedpositive stimuli in the north-west of the country,where Holcim is most active. In Spain, the crisis inthe construction sector was exacerbated by govern-ment’s budget consolidation measures, leading to a further decline in sales volumes.
Competition was fierce in eastern and southeasternEurope. The Hungarian Group company in particularexperienced a decline in shipments of building mate-rials. Cement sales were adversely affected by a com-bination of poor market conditions and the marketentry of a new competitor. In fall 2011, Holcim Hungarydecided to close the Hejöcsaba plant in the east ofthe country and supplement the domestic marketwith imports from sister companies. In Slovakia, Holcim sold less aggregates and ready-mix concrete,but more cement. However, Holcim increased itssales of aggregates in the Czech Republic. Largerconstruction projects in urban centers enabled HolcimRomania and Holcim Bulgaria to increase their salesof cement, aggregates and ready-mix concrete.Romania also saw an increase in sales of specialbinders for road building projects. In the ready-mixconcrete segment, Holcim Serbia benefited fromlarge-scale deliveries for an oil refinery project and in particular sold more special concrete. In Croatia,Holcim lifted sales in all segments thanks to majorinfrastructure projects and industrial building work.
84
Grou
p Re
gion
Euro
pe
Holcim Russia posted double-digit increases in ship-ments of cement due to strong demand for municipalhousing projects and an increase in productioncapacity at the newly constructed Shurovo plant. In addition, projects for the modernization of theRussian transport system opened up new prospectsin the infrastructure sector. In Azerbaijan, GaradaghCement increased its deliveries of cement slightlydespite a rise in imports. The focus was on majorinfrastructure projects in the road building sector,the expansion of the Baku subway system and buildings in the aviation and shipping sectors.
Drive to cut costs continues
During the year under review, all European Groupcompanies continued their efforts to reduce costs.Aggregate Industries UK had to temporarily ceaseproduction at several sites due to economic conditions.Also in Italy, plants were mothballed or closed due toa lack of demand. The ready-mix concrete plants inTurin were incorporated into a joint venture. HolcimSpain mainly focused its efforts on measures to optimize logistics, including the closure of ready-mixconcrete production sites. Holcim France Benelux’sservice center in La Hulpe near Brussels was closed.However, the Group companies in France and Belgiumwill maintain a strong operational collaboration. Holcim Belgium sold a concrete products division toa local company, but kept a minority participation. In response to the crisis in the construction sector,Holcim Hungary initiated an extensive restructuringprocess, and in other markets of Eastern Europe, theproduction of aggregates and ready-mix concretewas also adjusted in line with lower demand.
Holcim Trading maintains leading position in global
building materials trade
In 2011, Madrid-based Holcim Trading posted a tradingvolume of 21 million tonnes, which represents a year-on-year increase of 0.7 percent. While above all therewas a decline in deliveries of cement and petroleumcoke, trade in coal increased thanks to brisk demand.Customers in Africa, Southeast Asia and on the Indiansubcontinent were the main buyers of cement andclinker, together absorbing around 65 percent of volumes traded worldwide. The key import marketsin Latin America included Brazil and Chile. Demandfrom the mature markets remained relatively weak.
Lower operating result
The weak euro and higher costs, particularly forenergy and transport, lower receipts from the sale of CO2 emission certificates, and the difficulty inmatching sales prices with inflation, impacted onthe sales profitability of the region as a whole. Due to the positive volume development, operatingEBITDA for Group region Europe only fell by 11 per-cent to CHF 930 million. The Group companies inSwitzerland, the Czech Republic, Croatia, Spain andRussia improved their operating EBITDA. The Groupcompany in southern Germany and Garadagh Cementjust maintained their results. In local currency, Holcim France just maintained the previous year’sresults despite fierce competition. Holcim Italy facedparticularly sharp declines in performance, as didHolcim Hungary due to restructuring costs. Aggre-gate Industries UK also saw a deterioration in itsfinancial results. At –3.8 percent, internal operatingEBITDA development practically matched the previ-ous year’s level.
85
86
Busin
ess R
evie
w
In the fourth quarter of 2011, impairments of property,plant and equipment and goodwill in Spain and Eastern Europe were charged impacting net incomein total by CHF 328 million.
Focused capacity expansion in growth markets
Holcim Russia commissioned its new Shurovo plantin the vicinity of Moscow in 2011. The plant lays thefoundations for the company’s strategic positioningin this important growth market. With an annualcapacity of 2.1 million tonnes of cement, the state-of-the-art plant sets new standards in the Russianindustry both on the environmental front and interms of safety in the workplace. In Azerbaijan, thenew kiln line at the Garadagh plant produced clinkerfor the first time shortly before the end of the year.The new facilities, with an annual capacity of 1.7 milliontonnes of cement, will go fully on stream in the first quarter of 2012. In 2011, Holcim France beganconstruction of a grinding station in the port of LaRochelle. The project is part of Holcim France’s devel-opment plan and is geared to meet predicted regionaldemand. Shortly before the end of the year, the local Group company in Slovakia acquired the sharecapital of a competitor in the east of the country.This company – which owns a cement plant and isalso active in the aggregates and ready-mix concretebusiness – will be fully integrated into the SlovakGroup company in 2012.
Heat recovery systems cut production costs
A number of locations were upgraded for increaseduse of alternative fuels and raw materials. New co-processing platforms are currently under construc-tion mainly in Eastern Europe. This equipment willgenerate substantial cost savings in the combustionprocess. Holcim Slovakia is investing in the use ofwaste kiln heat at its Rohozník plant. An innovativeheat recovery system will enable annual net gains ofup to 3.8 megawatts of electric power from the pro-duction process. A system for waste heat recovery isalso being installed at the Alesd plant in Romania.Once operations commence in 2012, this system toowill meet around 15 percent of energy requirementspreviously supplied by the main electricity grid. AtHolcim Switzerland’s Untervaz plant, work has begunon the construction of a new clinker cooler, whichwill improve the energy performance of the newwaste heat recovery system. At the same time, it willalso increase production efficiency.
New generation of building materials for the
Swiss market
The “Optimo” composite cement launched by HolcimSwitzerland marks the rollout of a new generation of environmentally friendly construction materials.Holcim Optimo is a standardized composite cementconsisting mainly of clinker, high-grade limestoneand burnt oil shale. Oil shale is a raw material exca-vated near the Dotternhausen plant of Holcim SouthGermany. It is used as fuel in a thermal power plantfor electricity generation, and then used as mineralcomponent in cement production not only in Germanybut also in Switzerland. Holcim thus has access to aself-produced mineral component, which allows asubstantial reduction in CO2 emissions. The marketresponse to this new product has been very positive.
ˇ
87
Grou
p Re
gion
Euro
pe
Recycling of aggregates protects natural resources
In 2011, Aggregate Industries UK once againincreased its sales of recycled aggregates, a high proportion of which was sourced from housing demolitions. Some of the recycled materials wereused at construction sites for the 2012 LondonOlympics.
Market conditions remain difficult
The debt crisis and the ensuing drive to rein in public sector budget deficits will dampen constructionspending in practically all European markets. Switzerland is only indirectly affected by the debtcrisis and construction activity should follow a positive trend in Russia and Azerbaijan. Holcim hasnew capacity in both countries.
Although US GDP grew moderately, due to a slightrise in consumer spending particularly in the secondhalf of 2011, the economy did not really gain momen-tum. The budget deficit forced the public sector tocut spending, and unemployment remained high. In Canada, after a good year in 2010, the economyweakened slightly in the slipstream of the US econo-my. Uncertainties over the debt crises in the US andEurope held back economic development, leading todownward corrections in growth forecasts.
Little stimulus for the construction sector
The moderate economic recovery only had a limitedimpact on the US construction sector. The ongoingbudget consolidation efforts and associated spend-ing cuts reduced public subsidies for infrastructureprojects. In the road building sector, the impact of the stimulus measures launched in the wake of the financial crisis also began to fade. Cement con-sumption declined in the southern US in particular,although this was offset by slightly higher deliveryvolumes in the northern states.
Private house-building also experienced a furthercontraction in activity as a result of the low employ-ment rate, and sales of new units were at a very low level amid falling prices. Sales of existing homesdid at least edge up slightly toward the end of theyear, although the modest upwards trend is not yetindicative of a sustained recovery. The only segmentto report moderate year-on-year gains was commercialand industrial construction, which benefited from anincrease in investment in healthcare and the arts.
In Canada, the building industry was supported by astrong energy sector. Cement consumption increasedmainly due to strong demand in western Canada.Government cost-cutting measures, coupled with a
Slight recovery tendencies in North America
decline in infrastructure investment, slowed develop-ment in the public sector. Private sector constructionincreased slightly, at least in the commercial andindustrial sector, while residential constructiondeclined overall despite a slight increase in buildingpermits and a stable market in Ontario.
Higher cement sales
During the year under review, Holcim US sold slightlymore cement than the previous year. In the secondhalf, monthly shipments twice exceeded the one million tonne mark – a level not seen since October2008. Demand remained slack, however, particularlyin the south of the country. Shipments were alsoimpacted by unfavorable weather conditions inspring, offset by extraordinary good weather in the last two months of the year.
Consolidated key figures
North America 2011 2010 ±% ±% LFL*
Production capacity cement in million t 21.9 23.2 –5.4Cement and grinding plants 17 19 Aggregates plants 118 97 Ready-mix concrete plants 229 187 Asphalt plants 46 47 Sales of cement in million t 11.4 11.1 +2.9 +2.9Sales of mineral components in million t 1.5 1.5 –2.1 –2.1Sales of aggregates in million t 43.5 39.2 +11.0 +2.4Sales of ready-mix concrete in million m3 7.1 5.6 +25.4 +0.2Sales of asphalt in million t 5.0 4.9 +0.4 +0.4Net sales in million CHF 2,987 3,240 –7.8 +1.3Operating EBITDA in million CHF 346 460 –24.9 –15.5Operating EBITDA margin in % 11.6 14.2 Personnel 7,543 6,668 +13.1 +3.9
* Like-for-like, i. e. factoring out changes in the scope of consolidation and currency translation effects.
Grou
p Re
gion
Nor
th A
mer
ica
89
Busin
ess R
evie
w
Holcim Canada experienced a decline in exports tothe northeastern US, where customers were serveddirectly by Holcim US, resulting in a fall-off in cementshipments. Significant volumes were used in twolarge mining projects of Xstrata and Vale Inco in theAtlantic provinces. Despite higher distribution costs,the Mississauga plant also supplied customers in the west of the country and in the north of Ontario.Public sector budget cuts led to cement-intensiveinfrastructure projects being delayed or postponed.This mainly affected the predominantly industrialregion around the Great Lakes.
Overall, cement deliveries in Group region NorthAmerica grew by 2.9 percent to 11.4 million tonnes.
Aggregate Industries US posted a significantincrease in volumes of aggregates and ready-mixconcrete. This is partly attributable to the full acqui-sition of Lattimore Materials in Texas. Like-for-like,deliveries declined, with the exception of the Mid-Atlantic region, amid strong competitive pressure.Asphalt sales increased despite the lower post-winterseason road repairs, particularly in the northeast of the country.
In the second half of the year, deliveries for a majorproject enabled Holcim Canada to significantlyincrease its sales of aggregates. In the ready-mixconcrete business, delivery volumes roughly reachedthe previous year’s level. Demand was mainly sup-ported by high-density construction in Montreal and Toronto, involving road building, residential construction and hospital projects.
In Group region North America, shipments of aggre-gates increased by 11 percent to 43.5 million tonnes,while deliveries of ready-mix concrete rose by 25.4percent to 7.1 million cubic meters. Asphalt salesincreased by 0.4 percent.
Efficiency improvements through systematic cost
management
Holcim US succeeded in its efforts to further reduceoperating costs. The focus was on efficient mainte-nance of its facilities. Savings were also achieved inelectricity consumption. High fuel costs supportedan increase in the use of alternative energy sources.
Aggregate Industries strengthens market presence
with new acquisitions
In spring 2011, Aggregate Industries US obtained full control of building materials supplier LattimoreMaterials, thus strengthening the Group’s marketpresence in Texas. This company has been fully consolidated since March 2011. The acquisition ofEnnstone, Inc. was completed in October. This Virginia-based company owns ready-mix concreteplants, sand and gravel pits, and quarries. Thetakeover improves Aggregate Industries market presence particularly in the Mid-Atlantic region.
Significantly lower operating result
Operating EBITDA for Group region North Americafell by 24.9 percent to CHF 346 million. Apart fromcurrency effects, the reasons for this decline werepredominantly weak demand and higher productionand distribution costs which could not be offset bythe slight price increases. All three Group companiesdid not reach their previous year results. Internaloperating EBITDA development reached –15.5 percent
90
Grou
p Re
gion
Nor
th A
mer
ica
Holcim US results were adversely affected by the difficult market environment and rising distributioncosts. Expenses were also incurred for the initialmothballing of the Catskill plant. The new Ste.Genevieve plant had a beneficial impact on costs.The performance of Aggregate Industries US wasimpacted by higher production expenses. HolcimCanada’s operating result was impacted by the slow-down in the construction sector and heavy price pres-sure. The change in the company’s product mix alsohad a negative impact on the result, which declinedsignificantly compared with the previous year’s solidperformance.
As demand for construction materials will only slowlyrecover in the US, and production capacity utilizationrates will remain unsatisfactory, property, plant andequipment impairments were charged in the fourthquarter 2011 impacting net income in total by CHF 32million. This figure relates to the permanent closureof the Catskill and Artesia plants of Holcim US.
Still focusing on sustainable development
Against the background of continuously high pricesfor petcoke and coal, Holcim US focusses in increasingthe use of alternative fuels. In 2011, these effortsproved particularly successful at the Portland plant,where the use of waste materials more than doubled,leading to significant savings. The Group companyalso continued to increase the proportion of alterna-tive fuels in the clinker-manufacturing process at itsother plants.
Holcim Canada initiated various measures in thesame direction. At the Joliette plant, the use of alter-natives fuels – including asphalt shingle – reached a new record. The percentage of alternative fuels also increased at the Mississauga plant. Economicconditions led to a decline in the use of industrialsolvents, but substitute materials were able to besourced in, including from outside the province ofOntario.
Demand for building materials remains moderate
In the US, the outlook for private sector constructionremains subdued due to economic uncertainties and continued high vacancy rates. The huge deficitsat both federal and state level will also hamper infrastructure construction. In Canada, the overalleconomic trend will remain sluggish. Like the US, the country is expected to experience only modestgrowth in construction spending nationwide.
In Mexico and the countries of Central America, themoderate economic recovery continued, albeit damp-ened by the US debt crisis. Ecuador, Colombia andBrazil benefited from access to foreign financing andfrom stable oil and commodity prices. Better accessto loans, lower unemployment rates and governmentinvestment in growth sectors have created a favor-able economic environment for these countries. Eco-nomic conditions also remained stable in Argentinaand Chile. Rising inflation had a negative impact.
Lively construction activity in most countries
The Mexican construction sector continued to beaffected by the economic slow-down in the US. How-ever, a number of postponed infrastructure projectsstarted construction, and private investment increasedduring the course of the year. Easier access to mort-gages also led to a revival in residential construction.The decline in foreign trade with Mexico’s northernneighbor resulted in a fall in demand for constructionmaterials in the commercial and industrial sector.
El Salvador’s construction sector regained momentumfor the first time in four years, although the announcedgovernment investment did not fully materialize.However, important stimuli were generated througha development program for the economically weakernorthern region. The program, which included projectsto build roads, bridges and hospitals, played a keypart in accelerating growth in the constructionindustry. In Costa Rica, private investors were instru-mental in reactivating the sector, while Nicaragua’sconstruction industry benefited from cooperationwith Venezuela in the oil sector.
The Ecuadorian government undertook considerableeffort to expand the country’s infrastructure throughthe construction of roads and hydroelectric plants.
Improved access to loans for developers and homeowners also prompted a revival in residential con-struction. In Colombia, the government stimulus program to improve the economy impacted positivelyon the construction sector. Ongoing work on theconstruction of roads, ports, bridges and airportsstrongly supported consumption of constructionmaterials, as did social housing projects.
Similarly in Brazil, infrastructure was the main driverin the construction sector, bolstered by stable oilprices and investments for the 2014 Soccer World Cupand the 2016 Olympics. Improvements in employmentand incomes also translated into an increase in privateconstruction. The picture was similar in Argentina,where demand was supported by residential andcommercial construction activity in the run-up tothe presidential elections in fall 2011. In Chile, stronggrowth in the construction sector was driven mainlyby the commercial and residential construction sec-
Consolidated key figures
Latin America 2011 2010 ±% ±% LFL*
Production capacity cement in million t 35.5 33.4 +6.2 Cement and grinding plants 27 27 Aggregates plants 25 25 Ready-mix concrete plants 220 233 Sales of cement in million t 24.2 22.7 +6.7 +6.7Sales of aggregates in million t 14.5 12.2 +18.7 +18.7Sales of ready-mix concrete in million m3 11.0 10.5 +5.2 +5.2Net sales in million CHF 3,310 3,442 –3.8 +11.1Operating EBITDA in million CHF 888 999 –11.2 +2.9Operating EBITDA margin in % 26.8 29.0 Personnel 12,867 12,710 +1.2 +1.3
* Like-for-like, i. e. factoring out changes in the scope of consolidation and currency translation effects.
Solid economic development in Latin America
93
tors. After two years without any new, major infra-structure projects, the construction sector is expectingsome stimuli related to the presidential elections atthe end of 2013.
Consistently positive volume development
In Mexico, Holcim Apasco’s cement sales increasedcompared to the previous year. A major project led to a sharp rise in deliveries of aggregates. Sales ofready-mix concrete also increased.
Holcim El Salvador sold more cement and aggregates,and a key road building project prompted a similarlymarked increase in sales of ready-mix concrete. InOctober, delivery volumes declined slightly in theaftermath of flooding. Holcim Nicaragua substantiallylifted volumes of ready-mix concrete in particular,due to shipments to a large wind power project in La Fe. Holcim Costa Rica realized an increase in thesame business segment on the strength of a shop-ping center construction project. Deliveries ofcement and aggregates also rose compared to theprevious year, with Holcim Costa Rica stepping upexports of cement to Nicaragua.
A robust construction sector allowed Holcim Colombiato achieve a sharp increase in volumes in all segments,particularly for aggregates. The re-commissioning of a quarry mothballed in 2010 was an importantfactor. Demand for cement increased in the residen-tial construction sector, while sales of ready-mix concrete grew due to construction work at BogotáAirport and other infrastructure projects, as well as a boom in commercial and industrial construction.Holcim Ecuador reported higher sales in all seg-ments. Significant quantities of cement were sup-plied for the country’s largest hydroelectric powerproject.
In Brazil, Holcim once again succeeded in surpassingits good prior-year sales. In the southeast of thecountry, the company sold cement mainly for infra-structure and industrial projects. The commissioningof the new kiln line at the Barroso plant in 2014 willsignificantly increase the Group company’s productioncapacity. In the second half of the year, project delayshad a negative impact on shipments of aggregatesin some markets; in the ready-mix concrete business,Holcim Brazil focused on optimizing margins at theexpense of volumes.
Holcim Argentina – Minetti's new name since theend of August 2011 – supplied cement for majorroadbuilding projects in Córdoba and Rosario. Shipments of ready-mix concrete declined as majorconstruction projects reached completion. In Chile,Cemento Polpaico increased deliveries in all segmentsdespite mounting pressure from imports and delaysto a major project.
On a consolidated basis, the cement sales of Groupregion Latin America came to 24.2 million tonnes,representing an increase of 6.7 percent. Deliveries of aggregates rose by 18.7 percent to 14.5 milliontonnes, and ready-mix concrete sales were up by 5.2 percent to 11 million cubic meters.
Weaker operating result
Operating EBITDA for Group region Latin Americadecreased by 11.2 percent to CHF 888 million. Betterresults were achieved by the companies in El Salvador,Colombia and Chile. In a few markets, prices could beadjusted in line with higher costs. Holcim Ecuadorwas unable to match last year’s result as expensiveclinker had to be imported to bridge supply bottle-necks due to strong demand. Furthermore, exchangerates worsened. The Group companies in Mexico,Brazil, Costa Rica and Nicaragua fared slightly under
Busin
ess R
evie
w
94
Grou
p Re
gion
Latin
Am
erica
In Argentina, Holcim concluded an agreement withsteel producer Aceros Zapla for the disposal of slagand the recovery and resale of molten iron remnants.This project will reduce consumption of thermalenergy. Cemento Polpaico in Chile achieved improve-ments in the use of alternative fuels in the kiln system.
Solid outlook
With a small number of exceptions, Latin America’seconomy will remain solid in 2012 and demand forbuilding materials can be expected to continue togrow. While stimuli are expected to come from residential construction, infrastructure expansionwill also be a very important factor. In the industrialconstruction sector, much will depend on how theglobal economic situation unfolds; however, sectorssuch as the oil, gas and mining industries will con-tinue to drive demand.
the previous year also due to the strong Swiss franc; they incurred higher costs as well, particularlyfor energy and transportation. The Venezuelan government transferred its annual installment ofapproximately USD 100 million in connection withthe nationalization of the local Group company ontime. Group region Latin America achieved internaloperating EBITDA growth of 2.9 percent.
New equipment strengthens environmental efficiency
Capacity for processing and storing alternative fuelsand raw materials was increased at several Groupcompanies. Various plants in Mexico, El Salvador,Costa Rica and Argentina were equipped with state-of-the-art technology and control instruments witha view to ensuring even higher safety standards.2012 will see the commissioning of a modern, envi-ronmentally-friendly aggregates plant in Nicaragua.Ultimately, attention also focused on reducing theuse of clinker and hence CO2 emissions.
In Costa Rica, Geocycle increased its storage capacityfor alternative fuels and for cleaning liquid fuel tanks.This enabled Holcim to improve its market position-ing for alternative fuels, particularly compared to theoil industry.
Holcim Colombia implemented its waste materialsupply contract with national oil producer Ecopetrol,resulting in a reduction in CO2 emissions. In Ecuador,a new facility for the use of biomass came on stream,allowing the company to make greater use of alter-native fuels. The facility was also equipped to be fedwith sewage sludge.
The construction sector in Group region Africa MiddleEast developed positively in most markets relevant to Holcim. In Morocco, the agriculture sector createdthe basis for solid economic growth. This benefitedthe construction of social housing, but also the ongo-ing infrastructure initiatives. Lebanon faced a slightslowdown in economic growth. However, construc-tion activity continued to increase. The conclusion ofpresidential elections gave a positive impetus to theconstruction industry in the West African markets. Inthe Indian Ocean region and Arabian Gulf, construc-tion activity increased slightly.
Solid demand for building materials
Cement consumption in Morocco increased with activity in the construction sector strengthening toward the end of the year. However, new market en-trants increased competition and Holcim Morocco’scement deliveries declined versus the previous year.Volumes of aggregate shipments were also lower.Sales of ready-mix concrete rose, on the other hand,with the facilities in Casablanca and Tangiers in particular achieving a significant increase in sales.The project to double clinker capacity at the Fès plant progressed according to schedule. The plantwill start production in the second half of 2012.
In Lebanon, the large number of small residentialconstruction projects in the Beirut area was positivefor the consumption of building materials and HolcimLebanon increased its cement deliveries. Sales ofready-mix concrete benefited mainly from large construction projects in the Beirut area.
The companies managed by Holcim Trading in WestAfrica and the Arabian Gulf performed well, withsales of cement remaining stable overall. NationalCement in Abu Dhabi supplied large quantities of cement to the Port Khalifa project, thereby increasingits sales significantly. In the Indian Ocean region, theGroup company in Mauritius achieved a considerableincrease in shipments versus the previous year. La Reunion remained practically stable.
Consolidated cement deliveries in Group regionAfrica Middle East fell by 2.1 percent to 8.7 milliontonnes. The intense competition in Morocco was a decisive factor. Shipments of aggregates declined by 7 percent to 2.3 million tonnes. Sales of ready-mixconcrete increased by 4 percent to 1.1 million cubicmeters.
Consolidated key figures
Africa Middle East 2011 2010 ±% ±% LFL*
Production capacity cement in million t 11.1 11.2 –1.5 Cement and grinding plants 13 13 Aggregates plants 5 5 Ready-mix concrete plants 24 25 Sales of cement in million t 8.7 8.9 –2.1 –2.1Sales of aggregates in million t 2.3 2.5 –7.0 –7.0Sales of ready-mix concrete in million m3 1.1 1.1 +4.0 +4.0Net sales in million CHF 959 1,098 –12.6 –0.3Operating EBITDA in million CHF 312 359 –13.0 –1.1Operating EBITDA margin in % 32.6 32.7 Personnel 2,140 2,213 –3.3 –3.3
* Like-for-like, i. e. factoring out changes in the scope of consolidation and currency translation effects.
Stable markets in Africa Middle East
97
98
Busin
ess R
evie
w
Growing use of alternative fuels and blended cements
Holcim Morocco increased the use of alternative fuelsin the clinker combustion process. This success is attributable to Holcim Morocco subsidiary Ecovalwhich was very active in promoting alternative fuels.Holcim Lebanon concentrated on further improve-ments in terms of dust emissions and energy savingprograms at the Chekka plant. Also with an ecologicalview, Holcim Madagascar and Al Jabor Cement Indus-tries in Qatar concentrated its efforts on marketinglow-CO2 blended cements with a reduced clinker fac-tor. This is supporting the efforts of the governmentof Qatar to promote sustainable construction.
Decline in operating result
Group region Africa Middle East’s operating EBITDAdeclined by 13 percent to CHF 312 million. In Morocco,the company’s result was adversely affected by lowervolumes, higher fuel costs and strong pressure onprices. In order to cope with market growth, theLebanese plant in Chekka occasionally had to purchaseexpensive additional clinker. Selling prices were, how-ever, increased. The Group companies in the IndianOcean region only just failed to match the previousyear’s result, solely as a result of the strong Swissfranc. Internal operating EBITDA development fell by –1.1 percent.
In 2007, Holcim initiated a transaction to createAfriSam (previously Holcim South Africa), the leadingcement and construction materials company in thecountry, as part of the South African to support theBlack Economic Empowerment (BEE) initiative. Holcimsold its majority stake to a BEE-compliant consortium,and has since held a minority stake of 15 percent inAfriSam. The Group continued to support the com-pany technically, and in 2009 subscribed to a notesissue in the amount of ZAR 2.6 billion, or CHF 292 million. As demand for construction materials hasheavily decreased since 2010, AfriSam found itselfforced to initiate additional financial restructuringmeasures in 2011. Due to this restructuring decision,Holcim writes off investments, made up of the notesissue, accrued interest and foreign currency move-ments, by CHF 415 million in the fourth quarter of 2011.Today, Holcim has a stake of 2 percent in AfriSam.
Business trend still solid
Construction activity in most markets of Group region Africa Middle East is likely to remain solid. Assuming a reasonably stable political situation, Holcim expects sales to be on a similar level to 2011.In Morocco in particular, residential construction activity is likely to remain dynamic.
Most markets in Group region Asia Pacific enjoyedstrong economic growth in 2011, supported by privateconsumption and strong investment activity in manycountries. In Indonesia, the healthy economic situa-tion remained unaffected by the debt crisis in maturemarkets. Thailand’s economic performance suffered asetback following the floods in and around the capitalcity in the fourth quarter. In Australia, the year beganwith the extensive flooding in Queensland and endedwith a clear two-speed economic development withonly the mining sector showing economic strength.
Higher construction investment
Construction activity continued to expand in theemerging markets of Asia. Due to high interest ratesand general inflation, however, the constructionindustry in India grew less strongly this year. Thiswas compounded by the fact that failure to reformthe building approvals process resulted in extensivedelays to major infrastructure projects. Following agood monsoon, investment in private housing andcommercial construction increased again significant-ly in rural areas, but above all in the east and west. In Sri Lanka and Bangladesh, infrastructure andhousing needs resulted in higher sales of buildingmaterials. In Sri Lanka, the cheap imports offered in retail shops resulted in fiercer competition.
In Thailand, the booming real estate market, pent-updemand for office and commercial space, as well asgovernment investment in the road network andexpansion of metro lines in Bangkok, ensured robustdemand. In Vietnam, construction was one of the keyeconomic drivers. However, growth was adverselyaffected by high inflation, and the above-averageinterest rates depressed investment activity. Malaysiadrove up cement consumption with measures to
stimulate the development of urban centers and privateresidential construction. In Singapore, demand for con-struction materials remained stable.
In the Philippines, private residential and commercialconstruction continued to develop positively. On theother hand, cement-intensive infrastructure investmentdeclined as the government slowed down the awardingof contracts in an effort to ensure an accurate process.In Indonesia, the growing middle class requires moreresidential and commercial space. Therefore, demand forbuilding materials significantly exceeded supply, result-ing in capacity bottlenecks in the market.
Construction activity remained subdued in Australia. Inparticular, there was a lack of major concrete-intensiveprojects – including the public sector. Constructionactivity fell in New Zealand. Reconstruction work follow-
Consolidated key figures
Asia Pacific 2011 2010 ±% ±% LFL*
Production capacity cement in million t 97.8 93.7 +4.4Cement and grinding plants 55 58 Aggregates plants 88 86 Ready-mix concrete plants 406 403 Sales of cement in million t 75.6 71.4 +5.9 +5.8Sales of mineral components in million t 1.2 1.0 +21.4 +21.4Sales of aggregates in million t 29.7 26.4 +12.6 +12.6Sales of ready-mix concrete in million m3 13.0 12.6 +2.8 +2.8Net sales in million CHF 8,001 7,958 +0.5 +14.2Operating EBITDA in million CHF 1,700 1,820 –6.6 +6.8Operating EBITDA margin in % 21.2 22.9 Personnel 37,942 38,172 –0.6 –0.6
* Like-for-like, i. e. factoring out changes in the scope of consolidation and currency translation effects.
Lively building activity in Asia Pacific
101
Busin
ess R
evie
w
ing February’s earthquake disaster is not expected tohave an effect on the construction sector until later in2012.
Higher delivery volumes in most markets
In India, ACC in particular sold considerably morecement due to capacity expansion at its Chanda andWadi plants. In the ready-mix concrete business, ACC’ssales were more or less on a par with the previousyear. Ambuja Cements produced more clinker at itsRauri and Bhatapara plants, which were commissionedin 2010, and also brought two new grinding stationson stream in Bhatapara and Maratha. The companyalso sold more cement. In September, Ambuja Cementsacquired a 60 percent majority shareholding in fly-ashtrader Dirk India, thus expanding its product portfolio.Shortly before the year-end, Holcim acquired theremaining shareholdings of the founding families of Ambuja Cements and raised its participation to 50.3 percent.
Holcim Lanka positioned itself successfully in theemerging retail market with the sale of the “Supri”cement brand. Various major infrastructure projects,such as Mattala International Airport, hydropowerprojects and highways, increased the Group company’scement shipments. Holcim Bangladesh achieved anincrease in cement deliveries, largely due to infrastruc-ture projects in road building.
Despite the floods, Siam City Cement in Thailand soldslightly more cement in the domestic market, butexported less cement and clinker. Sales of aggregatesand ready-mix concrete rose above-average due to thegrowing construction sector and a good distributionstrategy. Holcim Vietnam’s quality products enabled itto win major orders in the commercial and industrialsector. However, the inflationary environment led to afall in deliveries of cement and ready-mix concrete. In
Malaysia, the Iskandar development project in Johorprovided a significant catalyst for growth. The localGroup company increased its shipments of cementand ready-mix concrete, securing some attractive projects despite stiff competition. On slightly higherready-mix concrete volumes, Holcim Singapore con-centrated on projects with above-average margins.
In the Philippines, Holcim strengthened its customerbase. The company sold more ready-mix concrete forskyscraper projects such as Stratford in Manila – thecountry’s tallest apartment building. Cement deliveriesfell due to weak infrastructure construction. HolcimIndonesia achieved robust sales increases in all seg-ments due to a booming construction sector. Due tohigh domestic demand and better prices, exports werereduced. The important new construction project of acement plant in Tuban on the main island of Java isprogressing according to plan, and will contribute toincreasing clinker and cement capacity in this rapidlyexpanding market in 2013.
Cement Australia sold slightly less cement due todeclining residential construction and the floods onthe east coast. Holcim Australia also suffered from thepoor weather conditions. However, the Group compa-ny sold more aggregates as reconstruction work gotunderway. Ready-mix concrete sales only just matchedthe previous year’s level. Holcim New Zealand fellshort of the previous year’s figures across all segments.The effect of the earthquake and weak demand hitdeliveries of building materials throughout the sector.
Cement sales in Group region Asia Pacific grew by 5.9 percent to 75.6 million tonnes. Deliveries of aggre-gates rose by 12.6 percent at 29.7 million tonnes, andready-mix concrete sales increased by 2.8 percent to 13 million cubic meters.
102
Grou
p Re
gion
Asia
Pacif
ic
two aggregates plants in Wuxue and Yangxin willstart operations in 2012. Located close to the Yangtzeriver, they give the company access to the major markets in Shanghai and Nanjing.
Growing use of alternative fuels
Many Group companies successfully increased theiruse of alternative fuels and raw materials in the yearunder review, including Holcim Indonesia and HolcimPhilippines. This not only safeguards natural resourcesbut also makes a contribution to preventing growingwaste landfills.
In India, the two Group companies continued to workon active environmental protection under the Geocycleumbrella brand. The authorities gave their approvalfor the use of alternative fuel and raw materials in theclinker manufacturing process in 2010. In 2011, largequantities of industrial waste were re-used by ACC. In addition, the company is now successfully usinghousehold waste in the combustion process. Extensivetesting demonstrated that such waste does not haveany negative effect on the environment or productquality. In Gujarat, Ambuja Cements commissionedwind mills with a total capacity of 7.5 megawatts,enabling the company to procure CO2-free electricity.
Holcim Vietnam tested the combustion of contami-nated oil under the supervision of an internationalteam of experts.
Further growth in Asia Pacific
Group region Asia Pacific will continue to grow in 2012.In the emerging markets in particular, infrastructureand residential construction will have a positive influ-ence on the demand for building materials. Above allin India, Holcim will benefit from additional productioncapacity. In the Pacific region, activity in the construc-tion sector is likely to recover slightly.
Like-for-like increase in operating EBITDA
Operating EBITDA for Group region Asia Pacificdeclined by 6.6 percent to CHF 1.7 billion due to infla-tion-related cost pressures, not all of which could bepassed on to prices as yet and primarily due to thenegative currency development. On a like-for-like basis,however, Holcim achieved growth. In India and thePhilippines in particular, the higher cost of raw mate-rials, energy and transportation was only partly passedon to prices. Good demand for building materials inAsia supported the results of several Group companies,primarily of Holcim in Indonesia. Holcim Singapore alsoimproved results. In the Pacific region, the weak eco-nomic environment and consequences of natural dis-asters had a negative impact on the income statementof Group companies operating in these markets. HolcimAustralia nevertheless performed remarkably betterthan in the previous year. Internal operating EBITDAgrowth in this Group region reached 6.8 percent.
Positioning of Huaxin Cement in the growing Chinese
market
Huaxin Cement in China – in which Holcim hasapproximately a 42 percent stake, making it the largestsingle shareholder – benefited from governmentinvestment in infrastructure and residential construc-tion. Considerably more building materials were soldin all segments and the process of vertical integrationcontinued. Financial performance improved in partbecause selling prices increased in the fourth quarteras a result of the customary seasonal bottlenecksaffecting the electricity grid. Environmental awarenessand sound technology constitute the company’sstrengths in the ongoing consolidation process withinthe cement industry.
In the year under review, Huaxin Cement acquiredthree plants in the province of Hubei with a capacityof 5 million tonnes of cement. Huaxin Cement’s first
103
1982In the 1980s, “Holderbank” began to look for new markets.
As a result, both Asia and Eastern Europe came into focus.
At the same time the expansion into Spain showed positive
effects. The country was experiencing a construction boom
in connection with the Universal Exposition in Seville sched-
uled for 1992 and the Olympic games in Barcelona scheduled
for the same year. Thomas Schmidheiny became the third
generation of the Schmidheiny family to take over responsi-
bility for the company. Under his leadership “Holderbank”
rose to be the world’s largest cement company in 1986
and 1987.
A focus on Eastern Europe and Asia
100 years of Holcim: Decade 8 (1982 to 1991)
104The Rohoznik plant in Slovakia.
ˇ
1982
1983
1984
1985
1986
1987
1988
1989
1990
1991
The economic boom in Latin America ended abruptly at the start of the 1980s. The “Holderbank” strategy of broad geographic diversification of risk, which hadserved it well up to then, was now tarnished for the first time. The second oil crisis,brought on by the revolution in Iran and the subsequent war between Iraq and theAyatollahs, caused a world economic slump which also affected emerging markets. Latin America was severely impacted, with most countries on the continent ex-periencing some sort of economic crisis. It would take nearly ten years before LatinAmerica would once again play a key role for the Group. Countries like Brazil andMexico, two of its biggest markets in terms of sales and earnings, found themselvesin a massive debt trap as a result of excessive government spending. This led to anever-increasing inflationary spiral across Latin America. Demand for cement andaggregate materials collapsed, and plant utilization in core markets fell to a record-low 50 percent. While this led to overcapacity in many “Holderbank” Group plantsduring the recession, which saw a worldwide collapse in construction investment,it also meant the Group was well-positioned to take advantage of the recovery
when it came in the second half of the 1980s. In 1986,“Holderbank” also built up its internal trading net-work. This addition to its worldwide network allowedthe company to export excess capacity in individualcountries to other areas where it was needed.
Despite these measures, all of which were intended to “future proof” the Group, “Holderbank” beganscouting around for new markets. Although China and other Asian countries had long been a focus ofmanagement interest, this large blank spot on the“Holderbank” map would not be filled in until the 1990s.
Conditions for foreign investors in Asia remained difficult, above all in China, de-spite the economic opening initiated by Deng Xiaoping in 1979. This was particularlytrue in the cement industry, which the Chinese considered strategically important.Although Swiss cement and concrete experts had long been in contact with Chinesedelegations, they were loath to divulge their know-how with nothing in return. There was no significant change in this attitude at “Holderbank” when the familypatron divided his inheritance between his sons in 1984. Thomas Schmidheiny, whotook over “Holderbank” from his father and would become Chairman of the Board,kept an eye on China and the rest of Asia, but concentrated his attention at first onopening up those areas of the US and Europe the company had not yet reached. Theentry into Spain in 1980 would have a positive effect on business for “Holderbank”during the decade. The Iberian Peninsula, which had long been barely accessible toforeign investors, began to experience a construction boom some ten years after theend of the Franco dictatorship. This was spurred on to a great extent by preparationsfor the Universal Exposition of Seville in 1992 (Expo ’92) and the Olympic Summergames in Barcelona (planned for that same year). Starting with an initial minoritystake in a cement plant in southern Spain, “Holderbank” grew via a merger with another cement manufacturer and other acquisitions to become one of the leadingcement producers in the country. Its strong position in the south was enhanced byparticipations in the aggregate materials and ready-mix concrete area. This allowed
From oil to coalAlthough “Holderbank”, comparedwith other industrial companies, survived both oil crises of the 1970swithout any serious damage, theGroup made a decision to reduce itsdependence on oil. Through the end of 1982 it invested hundreds ofmillions of Swiss francs in convertingthe firing of its kilns from oil to coal.This led to considerable savings infuel costs in subsequent years, butwas also one of the main reasonswhy the 1980s would be a period ofgenerally high levels of investmentfor the Group. The plants were de-signed so that they could be switchedback to oil should prices fall again.These investments would pay off inthe long run, helping “Holderbank”at least partially mitigate the effects of the recession (which lasted until 1985).
The round blending storage yard for coal at the Rekingen plant.
Logo from 1987 till 2001.106
Farewell to Ernst and Max SchmidheinyAt a press conference for the “Holder-bank” results held on 6 June 1984, MaxSchmidheiny announced a reorgani-zation of his assets. It had taken fourmonths to manage the division of hisestate. His business holdings were com-plex and intertwined. According to theSchmidheiny biographer, Hans O. Staub,it took several months of fine-tuning to untangle the web. When it was done,his son Thomas could finally assumecontrol of “Holderbank”. He was 39.When Max Schmidheiny retired fromthe Board of Directors of “Holderbank”Financière Glarus AG, it was the cul-mination of a plan for a generationalchange at the top that had been in theworks for some time. Ernst Schmidheinydied a year later after a lingering andpainful illness, having suffered a stroketen years before. For his part, despitedifficult age-related illnesses, MaxSchmidheiny followed the developmentof “Holderbank” with unshakeable en-ergy until his death on 19 August 1991.
“Holderbank” to take part in large-scale infrastructure programs,ranging from expansion of the railways through to new highwayprojects, as well as participate in what would become a long-termboom in housing construction. After years of stagnation, Spain wascatching up, going through what Western Europe had experiencedin the first decades after World War Two.
While the entry into Spain contributed a great deal towards“Holderbank” becoming the world’s largest cement manufacturerduring 1986 and 1987, the US also played a role. In 1986 the Swiss acquired Ideal Basic Industries, Inc. and with it – some thirty yearsafter initial entry – a significant share of the US cement market. Bythe end of the 1980s, “Holderbank” employed a quarter of its 20,000employees worldwide in North America, and the market accountedfor more than a third of its total sales of clinker andcement. This put “Holderbank” among the ranks ofleading American construction materials producers. In1988, the Group bundled together its activities on thecontinent, transferring them to a newly formed NorthAmerican holding company named Holnam, in which“Holderbank” held 89 percent and the Société Suissede Ciment Portland SA eleven percent.
With the worldwide economic boom that began in 1988,Latin America also picked up again, with the exceptionof Brazil and Mexico, which were not to recover fromtheir debt crises for another few years. After the fall ofthe Berlin Wall, “Holderbank” began expanding in newdirections. Having previously concentrated on strength-ening its position in existing markets and reinforcing its network, “Holderbank”management now began putting out feelers in the direction of Eastern Europe,China, India and Southeast Asia. Their first move into Eastern Europe came withthe entry into Hungary at the end of 1989. Acquisitions in the Czech Republic andin Slovakia followed two years later. “Holderbank” also acquired small holdings inMacao and in India, although these were mostly in order to secure engineeringcontracts for “Holderbank” Management and Consulting Ltd. Along with a speed-ing-up of its expansion efforts and further geographic diversification, Group strategy now contained a second element: vertical integration of all business areasrelated to the cement business. In the future, “Holderbank” would not rely solely on cement production, but would increasingly concentrate on the entire range ofconcrete technology. The idea was, among other things, to be able to exert more influence on the quality of its concrete.
Under the motto “from cement to concrete”, this meant concentrating on the ex-traction and processing of aggregate materials like gravel and sand as well as theproduction of ready-mix concrete and expansion of the construction chemicalsbusiness. This was hardly a radical reorientation. Instead, it was a well-consideredenhancement of the activities in and around cement manufacturing, and wouldsustainably strengthen the overall strategy of the Group over the long run.
Already in 1980 “Holderbank” entered the market in Spain.
107
The Ada cement plant of Ideal Basic Industries, Inc., which was acquired by “Holderbank” in 1986.
1992During the 1990s, “Holderbank” entered new markets and
consolidated its position in existing ones. Thanks to the
booming American building sector, the company was able to
speed up expansion in Eastern Europe. In this decade alone,
stakes in companies in Romania, Bulgaria and Russia were
added. The company also succeeded in returning to Egypt,
some 30 years after Nasser had nationalized the Schmidheinys’
Egyptian plants. In the spring of 2001 the annual general
meeting decided to do business worldwide under the name
of Holcim.
Leading construction materials company in emerging markets
100 years of Holcim: Decade 9 (1992 to 2001)
From “Holderbank” to HolcimIt’s hardly surprising that, outside of Switzerland, a Swiss company named “Holderbank” would more often than not be confused with a financial institution. With this in mind, the annual general meeting voted in the spring of 2001 to change the company’s name worldwide to Holcim. “Hol” was meant as a reference to the company’s 90-year success story, while “cim” suggested the company’s main product: cement.
108
2001
2000
1999
1998
1997
1996
1995
1994
1993
1992
It took just under 80 years for three generations of Swiss entrepreneurs, start-ing with a single cement factory in Holderbank in the Swiss canton of Aargau,to build a group of companies with worldwide annual sales of over six billionSwiss francs’ worth of cement, aggregate materials and ready-mix concrete. It would take less than ten years to add another six billion and double annualsales on all five continents. Like few other Swiss companies, “Holderbank” wasable to take advantage of the climate in the 1990s to break into new marketsand expand its share of existing markets. A major focus was the post-communistacquisitions of outdated state-run operations in Eastern Europe and the sub-sequent revamping of their production equipment – a process which continuesto this day. Markets in Western Europe as well as in North and Latin Americawere also “rounded out”, accompanied by extensive restructuring programs, resulting in a substantial increase in earnings at almost all levels.
In its home market, the ninth decade of “Holderbank” started with a bang withan announcement in the summer of 1992. The Neue Zürcher Zeitung (NZZ) wentso far as to describe it as one of the “most important reorganizations of recentdecades”. Via acquisitions and a regrouping of its holdings, Thomas Schmidheinyinitiated one of the most far-reaching restructurings the Swiss constructionmaterials market had ever seen. Over half of the Swiss cement market was nowunited under the aegis of the newly formed “Holderbank” Cement und Beton AG (HCB). After more than eighty years, E. G. Portland was dissolved, markingthe end of the Swiss cement cartel. This came amid a general trend towardsconsolidation in the cement industry. The increasing pressure of market liberal-ization within the European Union and through the World Trade Organization
(WTO) – which, under the Uruguay Round, was takingsteps to open markets worldwide – was also a keymotivation behind restructuring “Holderbank” inSwitzerland. Just two years after the repositioning,the shareholders of the Société Suisse de CimentPortland SA ceded half their shares to ThomasSchmidheiny, including nine percent of the votes in “Holderbank”. This secured the entrepreneur from St. Gallen 57 percent of the votes in the Group.
Faster learning organizationFounded on the principle of decen-tralized leadership, “Holderbank” began implementing a personnelstrategy centered on the principle of a “faster learning organization”. Itdid so in the conviction that classichierarchical thinking was out ofdate. Instead, “Holderbank” empha-sized consensus and motivation, inorder to better utilize the abilities ofits staff in the service of the Groupas a whole. Such an approach allowsfor more freedom of action, but alsorequires a more deliberate delega-tion of many tasks. Employees andmanagers are encouraged to experi-ment to a certain degree, and to take calculated risks. This in turn demands increased flexibility frommanagers, as they have to respondquickly to problems that arise – aleadership principle which has in themeantime become part of many suc-cessful companies. “Holderbank” wasin many ways predestined for such aleadership philosophy, as one of thekey preconditions for it, a commongoal to be pursued by all levels of theorganization, is a given consideringthe nature of the Swiss cementgroup: in its case, a strict focus oncore competencies. It’s also a principlewhich Holcim employees worldwidefollow to this day and which is one ofthe key factors in the Group’s success.
Holcim supports training and education following the principle of a “Faster learning organization”.
110
The restructuring of the market inSwitzerland also affected the Group’sexpansion policies. Thanks to its deca-des-old holdings in the Société Suisse deCiment Portland SA, “Holderbank” wasable to gain a foothold in Northern Italyand Croatia, while in the US increasingits stake in its Holnam subsidiary from95 to 100 percent. During the 1990sHolnam profited from an unparalleledAmerican construction boom. Its plantsoperated at full capacity for years at atime, selling up to 15 million tonnes ofcement annually. During the decade, the UniónMarítima Internacional S.A. in Madrid also rose tobecome the world’s largest construction materialstrading company.
The boom in the US was supported by predominantlystable Latin American markets. The Swiss were alsoable to significantly expand their position in Brazil.In Argentina “Holderbank” took a stake in Corcemar,which in turn, thanks to a merger with Minetti, roseto become the country’s second-largest cementmaker. Acquisitions in El Salvador, Nicaragua, Guate-mala and Panama, as well as a major investment in Venezuela, all served to strengthen the alreadynearly unassailable position of “Holderbank” inLatin America. In 1993 these markets contributed 40percent of “Holderbank” profits. During the decade,management would ramp up overall capacity in theflourishing and highly profitable South and CentralAmerican “Holderbank” subsidiaries from 12 to 30million tonnes of cement. Thanks to booming Amer-ican markets, the Group was able to push on with itsexpansion into new regions. During the decade, inEastern Europe alone, it acquired participations inRomania, Bulgaria and Russia and made acquisitionsin Serbia and Azerbaijan. It was able to re-enter the Egyptian market as well,nearly 30 years after the Schmidheiny factories had been expropriated byNasser. The decade would also see the entry into a further North African countrywith Morocco, while positions were built up in West Africa and the IndianOcean as well.
In 1995, “Holderbank” entered the Croatian market.
In Argentina, “Holderbank took a stake in Corcemar.
The Campulung plant in Romania.
111
The Asian market crisis of 1997/98 accelerated the company’smove into the region, as “Holderbank” management was quickerthan the competition to see the resultant opportunities to make acquisitions, first in East Asia and then in other parts of the continent. During the 1990s, the company would rise to becomethe largest cement producer in the ASEAN region. For “Holderbank”,this period of upheaval would present opportunities which wouldpay off handsomely later. Having already entered Vietnam (1993)as well as Sri Lanka (1996), the Asian crisis facilitated the purchaseof stakes in Thailand and Malaysia (both 1998). At the turn of themillennium, another large and promising market, Indonesia, was
added. At the same time, the Group bought a grinding plant in Bangladesh. Inthe Philippines, where it had been active as early as 1974, “Holderbank” preparedto become the country’s largest cement producer when it signed a memoran-dum of understanding for the acquisition of a stake in Union Cement Corpora-tion (UCC) in 1998. It would not be until 2002, however, that UCC and the existingGroup company Alsons Cement could be combined under the aegis of HolcimPhilippines.
Gaining a firm foothold in China, however, not to speak of building up signifi-cant market share, remained tough. In 1995 “Holderbank” had its first success:through its New Zealand affiliate, it acquired a stake in Golden Cat Cement in
Shanghai. But the collaboration proved difficult, and operationalmanagement eventually had to be ceded to the local joint venturepartner. The Swiss were more successful with their participationin Huaxin Cement, acquired in 1999. This opened the door for“Holderbank”, in the following decade, to become the biggestshareholder in this major Chinese cement group, whose produc-tion facilities lie mainly along the Yangtze River. Despite the difficulties it was an important step, especially considering thatChina’s annual consumption of cement – nearly one billiontonnes – comprised some 50 percent of the world market duringthe decade.
In the industrialized countries, which were stagnating at thetime, “Holderbank” began investing to expand, renovate and im-
prove existing plants. This allowed it,especially in Switzerland, France, Bel-gium and Italy, to phase out less effi-cient equipment and so significantlyimprove its cost structure.
Cement plant Huaxin of Huaxin Cement in China.
The Fez plant of Holcim Morocco.
Cilacap plant in Indonesia.
112
2001“Holderbank” also received a full-time Chief FinancialOfficer for the first time in its history. His task wasto unify the controlling, reporting and financingfunctions in one organization. This was done withthe clear goal of further strengthening the traditionof decentralized leadership which the Group had always upheld.
SustainabilitySustainable business practice becamea central part of the “Holderbank”strategy in the 1990s. In 1992 theGroup signed the InternationalChamber of Commerce’s “BusinessCharter for Sustainable Develop-ment”; seven years later it joined the “World Business Council for Sus-tainable Development”. Internally,the cement giant implemented anew environmental concept. Its focus was – and still is – not just onconserving resources, but also oneconomic considerations in the formof sustainable economic growth aswell as an emphasis on environmen-tally friendly products. Various basicprinciples, which the Group had consistently followed in preceding
decades, were now adopted and codified in the environmental con-cept. Along with a focus on newtechnologies, these principles in-cluded an emphasis on the recyclingof industrial and civil waste such asold tires, solvents or sewage sludgeas substitutes for oil and coal, as wellas educating employees at all levelsof the organization about environ-mentally sound production methods.A strict product differentiation con-cept was also introduced in order toreduce CO2 emissions. Its primary focus was to reduce the share ofclinker in cement through CO2 neu-tral alternative raw materials such as granulated slag or pozzolan. Thegoal was – and remains – to increasethe trust of customers and the
general public in the Group and tostrengthen its image as an environ-mentally conscious enterprise.
Holcim’s tradition of engagement in the communities where it doesbusiness is also an important part of the sustainability concept. As amajor employer, Holcim supports ed-ucation and sustainable communitydevelopment. It does so by, on theone hand, regularly financing theconstruction and improvement of local infrastructure, and on the othersupporting the local population intheir own building projects, above allin emerging markets. It does this bymaking it easier to acquire buildingmaterials and providing financingsolutions for private construction.
Biodiversity is essential. Holcim advocates the use of alternative fuels in the cement industry.
For many years, Holcim has perfor-med pioneering work in sustainabledevelopment.
113
2002The new millennium began with a historic change from a
family-run business to an open, public company. The introduc-
tion of a unified registered share and modern corporate gover-
nance structures made it easier to access international capital
markets and so supported the growth of the company. Asia
became the engine both of the world economy and Holcim.
It was one of the first globally active construction materials
companies to achieve the goal of having more than 50 percent
of its revenues generated in emerging markets.
A strong position in 70 countries
100 years of Holcim: Decade 10 (2002 to 2011)
Passion for SafetyA central concern of the Group – which would be addressed during the decade with the launch of the “Passion for Safety” campaign – is work-place health and safety. The goal of this on-going campaign is to avoid accidents in general and completely eliminate fatalities. Among the numerous measures adopted by the Group was the introduction of global work safety and health management directives. The campaign hasbeen showing results, even if the Group is still far from being able to guarantee absolute safety at its plants. This will remain a top priority forHolcim in its eleventh decade.
114
2002
2003
2004
2005
2006
2007
2008
2009
2010
2011
Holcim entered a new era in 2003 when – under the motto “one share, one vote” –it introduced a unified registered share structure. Although the Schmidheiny familyhad controlled the majority of voting shares for decades, Thomas Schmidheinygave up his position as Chairman of the Board one year after retiring as Chairmanof the Executive Committee. As a major shareholder, he remained a member of the Board. The unified share was a decisive factor in the further expansion of theGroup. A more modern structure than what had preceded it, it among other thingssignificantly eased access to international capital markets. In 2002, Holcim ex-panded its corporate governance as well, creating an independent Audit Committeeand a Governance, Nomination & Compensation Committee. After a short interimperiod, another experienced business leader followed as Chairman of the Board in the person of Rolf Soiron. A Board member since 1994, Soiron had had first-handexperience of Holcim’s rise to become a major world player in the cement and aggregate materials industry. Together with CEO Markus Akermann, Soiron contin-ued to rely on the core values which had always been the basis of Holcim’s strategy:global presence, focus on cement and aggregate materials and decentralized management of Group companies as well as maintaining trust in the Group gover-
nance structures and the good name of Holcim.
Holcim’s historic transition from a family enterprise toan open, public company also heralded the start of adecade of increased geographic expansion in develop-ing markets as well as intensified vertical integrationin the saturated markets of Europe and North America.In the previous decade, Holcim had already begun itsconquest of Asia – demonstrating a great deal of fore-sight along the way. After the turn of the millennium,Asia became the driving force of the world economy,and with it the major driver for the Swiss cement andconstruction materials giant. Holcim was one of thefirst global construction materials companies to earnmore than 50 percent of its sales in emerging markets.In doing so, it achieved a degree of geographic diver-
sification that not only would balance out business cycle-related fluctuations in various regions of the world over the long term, but also secure sustainablegrowth.To help ensure a leading presence in these geographically ever more diver-sified markets, the Group standardized its centralized management and service
tasks. This did not alterthe principle of decen-tralized responsibility. On the contrary, theGroup relied more andmore on local and re-gional management to keep on top of andwork the markets. Theapproach greatly con-tributed to the Group’ssteady growth – in a
Foundation to promote sustainable constructionIn 2003, Holcim launched the Holcim Foundation for Sustainable Construction to promote sustainable construction practices worldwide and support relatedprojects. In collaboration with well-known universities, including the Swiss Federal Institute of Technology inZurich, the foundation sponsors competitions around theworld. Examples of previous award winners include plansto restore a riverbed in Morocco and a concept for ruralsettlement development in China. A series of award-winning projects have also been completed, including the “Metropol Parasol” by Jürgen Mayer in Seville and the Research Center for Drinking Water by John Gunn in Sudbury, Canada. The foundation’s focus is on a sociallyand environmentally compatible, as well as an economi-cally beneficial use of construction materials. Awards are given to pro-j-ects that assure a high quality of life today as well as in the future.
Another experienced captain of industry, in the form of Rolf Soiron, followedas President of the Board of Directors. Together with Markus Akermann at the helm of the Group, he has continued to champion the core values of theHolcim strategy.
116
A number of awarded projects were realized, as for example the “Metropol Parasol” of Jürgen Mayer in Sevilla.
scant two decades, Holcimwas able to triple world-wide sales. For his part,CEO Markus Akermannconcentrated on his mainconcern: driving expan-sion while at the sametime never losing sight ofthe overall managementof the growing company,and in so doing maintain-ing confidence in the Holcim brand among allstakeholders.
A key element of this strategy was the vertical integration of the construction materials business with the other important links of the value chain. These in-cluded asphalt and concrete products along with aggregate materials such as sandand gravel. In 2005, Holcim made the largest acquisition in its history, clearly demon-strating that the Swiss were intent on becoming an even more strongly integratedsupplier of construction materials in the future. Paying four billion Swiss francs forthe British company Aggregate Industries, Holcim secured itself a strong marketshare in aggregate materials in Great Britain and, more importantly, in the US. Thefocal point of the acquisition was ensuring access to resources, as starting up newmining operations, especially in mature markets, was becoming more difficult dueto stricter environmental regulations. Another key factor in the acquisition decisionwas the strong logistics capabilities of Aggregate Industries, which fit in well withthe intensified intercontinental trade between Holcim Group companies.
Staying ahead of the competition in emerging markets had been a key strategicprinciple throughout Holcim’s history. At the heart of the strategy was the acqui-sition of minority stakes in local companies, which were then gradually built up. This approach, which in previous decades had helped the Group enter many a new market, would be responsible for an impressive phase of expansion during its tenth decade. As it had previously done in Latin America, the Middle East and in Europe, management began to patiently but persistently establish contacts withlocal cement companies in the high-growth Indian subcontinent. Negotiationswith families holding large shares of two Indian cement groups lasted two years.After entering the market via a minority stake in the ACC cement company in 2005,and in Ambuja Cements a year later, Holcim gradually built up its stake until it heldmore than 50 percent while integrating the two Indian companies into the Group.This made Holcim, in one stroke, the number two in the Indian cement market.Once again these were investments which would pay off handsomely, as growth in this huge market played a large part in the Swiss group’s rise to become theleading cement supplier in Asia.
When it shut down a number of obsolete plants in the US and opened the largestcement factory in North America at Ste. Genevieve in Missouri, Holcim also demon-strated its continued determination to close old plants and to use new technology
Sustainable use of resourcesIn the new millennium, the issue of resource use would become in-creasingly important in the cementindustry. Holcim played a key role in the “Cement Sustainability Initia-tive” as part of the “World BusinessCouncil for Sustainable Develop-ment”. The goal was to encouragelong-term improvement in the in-dustry and to promote sustainabil-ity. Although there is no disputingthat such measures enhance theGroup’s image and so help business,Holcim has always, alongside eco-nomic considerations, paid a greatdeal of attention to the environ-mental and social aspects of its activities. From an economic pointof view, the Group has primarilystriven to significantly reduce its energy consumption through suchmeans as waste heat recovery or use of alternative fuels. From an en-vironmental point of view, Holcimhas for decades promoted the recul-tivation of stone and sand quarriesand has reduced its own emissions.The Group’s social engagement –above all in the areas around its production facilities – is also veryimportant. Its focus here is on innovative solutions for affordablehousing, supporting micro businessesand vocational training. In all theseareas, the Group has been able toset standards for sustainable per-formance to which today’s globalplayers in the cement industry orient themselves, and which play a useful role when it comes to exchanging best practice. Its invest-ment in this area has paid off forHolcim: in the past decade theGroup was named as industry leaderin the Dow Jones Sustainability Index for four years in a row.
The Bardon Hill quarry in Great Britain: the quarry belongs to Aggregate Industries, which Holcim acquired in 2005.
117
to, among other things, set new environmental standards. Thanks to Ste. Genevieve,with its integrated harbor and shipping facilities and an annual capacity of fourmillion tonnes, Holcim was also able to achieve cost leadership in the Americanmarket.
But it was above all the expansion into Asia which would prove most prescient, especially after the financial crisis of 2008 and 2009. Thanks to strong Asian markets and stable conditions in Latin America (with the exception of Venezuela,which nationalized the local Group company in 2008), losses in the North American
and European markets could be compensated. Notthat the crisis had no effect, leading Holcim to imple-ment cost reduction measures to the tune of 1.2 bil-lion Swiss francs as well as close 23 kiln lines repre-senting a production capacity of some ten milliontonnes of cement.
Yet despite the crisis, Holcim’s capacity expansion program, launched in 2007 and focused on growthmarkets, was able to continue practically unchanged.Part of this program was the construction of a new cement plant in Kolomna, some 100 kilometers southof Moscow. The new plant was opened in July 2011with the Russian President, the Swiss President and
the Swiss Economy Minister in attendance. With an annual capacity of 2.1 milliontonnes, it was a milestone in the modernization of Russia’s cement industry, both interms of efficiency and environmental impact. All these measures contributed tosustainably strengthen Holcim’s presence in around 70 countries, and helped Hol-cim come out of the crisis with the highest capitalization and lowest debt of allthe global construction materials companies.
The move into Asia and expansion of business on that continent reflect a generalshift of emphasis in the world economy. This shift has been strengthened by the financial crisis, as mature markets suffered not only a construction lull but alsoempty government coffers. Holcim used these years to institute an intensive retooling campaign in order to be ready to take advantage of the recovery in the
markets affected by the crisis. Holcimalso expanded its business in China andhas currently grown to become thelargest shareholder in Huaxin Cement,one of China’s ten largest cement com-panies. That said, there are still blankspots on the Holcim map in Asia, in-cluding the Japanese and Korean mar-kets, where strong and closely net-worked local producers dominate.
The Ste. Genevieve plant of Holcim US, which went on stream in 2009, is currently the largest state-of-the-art kiln line of the USA.
118
In 2011, the new Shurovo plant in Russia was inaugurated.
2011Despite the weak world economy, in2009 Holcim took advantage of thechance to take over the Australian operations of its competitor Cemex.Cemex at the time owned 83 aggregatematerials plants with raw materials reserves of over a billion tonnes, andheld a 25 percent stake of Australia’sleading cement producer Cement Australia, in which Holcim already held a 50 percent stake.
119
The expanded Wadi plant of ACC in India reached a world record in clinker production with 13,187 tonnes of clinker inone day in February 2011.
Thanks to its acquisition of the Australian business of its competitor Cemex, Holcim became the leading construction materials producer in Australia in 2009.
121
Exchange (SIX) and the disclosure rules of the Swiss Codeof Obligations. In the interest of clarity, reference is made to other parts of the Annual Report or, for example,to our website (www.holcim.com). Pages 125 and 126 of this report reflect on the duties of the Audit Committeeand the Governance, Nomination & Compensation Committee as well as on the Organizational Rules.
Group structure and shareholdersThe holding company Holcim Ltd operates under the lawsof Switzerland for an indefinite period. Its registered of-fice is in Rapperswil-Jona (Canton of St. Gallen, Switzer-land). It has direct and indirect interests in all companieslisted on pages 229 to 231 of this Annual Report.
The Group is organized by geographical regions. Themanagement structure as at December 31, 2011, andchanges which occurred in 2011, are described in thischapter. The current organizational chart is shown onpages 44 and 45.
Holcim has no mutual cross-holdings in any other com-pany. In Holcim, there are neither shareholders’ agree-ments nor other agreements regarding voting or holdingof Holcim shares.
Acting responsibly
The ultimate goal of effective corporate governance islong-term economic success and strengthening theGroup’s reputation. This includes continuous improve-ment to decision-making processes and managementsystems through legal, organizational and ethical direc-tives and terms of reference, as well as measures to enhance transparency. Compliance with internal andexternal directives, early recognition of business risks,social responsibility for stakeholder groups and opencommunication on all relevant issues are among theprinciples of Holcim. Since 2004, the Code of Conduct,binding for the entire Group, has been part of the mis-sion statement.
Holcim aims to achieve a balanced relationship be-tween management and control by keeping the func-tions of Chairman of the Board of Directors and CEOseparate. With the exception of Markus Akermann, for-mer CEO of Holcim Ltd, all directors are independent according to the definition of the Swiss Code of BestPractice for Corporate Governance in the year under re-view. Since the introduction of a uniform type of regis-tered share in 2003, the principle of “one share, onevote” also applies.
The information published in this chapter conforms to the Corporate Governance Directive of the SIX Swiss
Holcim applies high standards to corporate governance.
The goal is to assure the long-term value and success of
the company in the interests of various stakeholder groups:
More detailed information on the business review,Group structure and shareholders can be found on thefollowing pages of the Annual Report:
Topic
Business reviewin the individual Group regions P. 82–103Segment information P. 190–194Principal companies P. 229–231Information about Holcim Ltdand listed Group companies P. 51, 230Important shareholders P. 246
Capital structure
In 2003, one uniform type of registered share was introduced in order to comply with international capital market requirements in terms of an open,transparent and modern capital structure and to enhance attractiveness, particularly for institutionalinvestors.
The share capital of Holcim Ltd is divided into the following categories:
Share capitalThe share capital is divided into 327,086,376 registeredshares of CHF 2 nominal value each. As at December 31,2011, the nominal, fully paid-in share capital of HolcimLtd amounted to CHF 654,172,752.
Conditional share capitalThe share capital may be raised by a nominal amountof CHF 2,844,700 through the issuance of a maximumof 1,422,350 fully paid-in registered shares, each with apar value of CHF 2 (as at December 31, 2011). The condi-tional capital may be used for exercising convertibleand/or option rights relating to bonds or similar debtinstruments of the company or one of its Group com-panies. The subscription rights of the shareholdersshall be excluded. The current owners of conversionrights and/or warrants shall be entitled to subscribefor the new shares. The acquisition of shares throughthe exercise of conversion rights and/or warrants andeach subsequent transfer of the shares shall be subjectto the transfer and voting right restrictions set out inthe Articles of Incorporation. As at December 31, 2011,no bonds or similar debt instruments of the companyor one of its Group companies were outstanding that
would give rise to conversion rights related to the conditional capital; therefore, in the year under review, no conversion rights have been exercised. Further information on conversion rights and/or warrants and applicable conditions may be found in the Articles of Incorporation of Holcim Ltd atwww.holcim.com/corporate_governance.
Authorized share capital/Certificates of participationAs at December 31, 2011, neither authorized share capi -tal nor certificates of participation were outstanding.
Additional information can be found as follows:
Topic
Articles of Incorporation Holcim Ltd www.holcim.com/corporate_governanceCode of Conduct
www.holcim.com/corporate_governanceChanges in equity Holcim Ltd P. 244
Information for the year 2009 is included in the Annual Report 2010, P. 210
www.holcim.com/equityDetailed information on conditional capital
www.holcim.com/corporate_governanceArticles of Incorporation, Art. 3bis
Key data per share P. 49–52, 220, 246–247Rights pertaining to the shares
www.holcim.com/corporate_governanceArticles of Incorporation, Art. 6, 9, 10
Regulations on transferability of shares and nominee registration P. 129–130
www.holcim.com/corporate_governanceArticles of Incorporation, Art. 4, 5
Warrants/Options P. 218–219
123
Board of Directors
The Board of Directors consists of 12 members, 11 ofwhom are independent according to the definition ofthe Swiss Code of Best Practice for Corporate Gover-nance. Former CEO Markus Akermann is the sole non-independent member in the Board of Directors. Ac-cording to Art. 15 of the Articles of Incorporation, allDirectors are shareholders of the company.
Please see pages 132 to 135 for the biographical infor-mation of the Board members.
As Robert F. Spoerry has been elected Chairman of the Board of Directors of Sonova he resigned from the Board of Directors at the annual general meetingof shareholders 2011. He had been a member of thisbody since 2008. The Board of Directors has expressedsincere gratitude for his service.
In 2011, the shareholders elected Alexander Gut to theBoard of Directors. He is Founder and Managing Part-ner of Gut Corporate Finance AG, Zurich. He holds aPhD in Business Administration (Dr. oec. publ.) fromthe University of Zurich and is a Swiss Certified Ac-countant. From 1991 to 2001 he was with KPMG inZurich and London, from 2001 to 2003 with Ernst &Young in Zurich, being promoted to Partner in 2002.From 2003 to 2007 he was a Partner with KPMG inZurich, being promoted to the Executive Committee ofKPMG Switzerland in 2005. Since 2010, he has been amember of the Board of Directors of Adecco S.A.,Switzerland.
New members of the Board of Directors are intro-duced in detail to the company’s areas of business.
The Board of Directors meets as often as business requires, but at least four times each year. In 2011, six regular meetings, five regular private meetingswithout the presence of the Executive Committee, andtwo strategy meetings were held. The Board of Direc-tors held four regular meetings with all memberspresent, one meeting with one member excused andone meeting with two members excused. As a rule,the members of the Executive Committee attendedthe regular meetings of the Board as guests, insofar
Markus Akermann MemberChristine Binswanger MemberAlexander Gut MemberPeter Küpfer Member2
Adrian Loader MemberAndreas von Planta MemberThomas Schmidheiny MemberWolfgang Schürer MemberDieter Spälti Member
as they themselves were not affected by the items onthe agenda. The average duration of each meetingwas 3.8 hours. Three of the ordinary private meetingswere held with all board members present, while inone ordinary private meeting one member was ex-cused and in another meeting two members were ex-cused. As a rule the members of the Executive Com-mittee do not attend the private meetings as guests.The average duration of each meeting was 1.9 hours.
Election and terms of office of the Board of Directors
The members of the Board of Directors are eachelected individually and for a three-year term of office.Elections are staggered such that every year approxi-mately one-third of the Board of Directors stands forelection. Members of the Board of Directors may beproposed for re-election by the Board of Directorsupon motion by the Governance, Nomination & Com-pensation Committee. The Governance, Nomination &Compensation Committee bases its motion on a re-view of the overall performance of each candidate. After four three-year terms, the review includes thequestion as to why a further tenure as a member ofthe Board of Directors is deemed to be in the best interest of the company.
Members of the Board of Directors shall retire regard-less of a current term of office at the first generalmeeting of shareholders following their seventiethbirthday.
Other major Swiss and foreign mandates of the Board of Directors outside the Holcim Group as at December 31, 2011Board of Directors Mandate PositionRolf Soiron Lonza Group AG, Basel* Chairman of the BoardBeat Hess Nestlé S.A., Vevey* Member of the BoardErich Hunziker BB Biotech AG, Schaffhausen* Member of the Board IMD, Lausanne Member of the BoardChristine Binswanger Herzog & de Meuron, Basel Senior Partner Alexander Gut Gut Corporate Finance AG, Zurich Managing Partner Adecco S.A., Chéserex* Member of the BoardPeter Küpfer GE Money Bank AG, Zurich Chairman of the Board Julius Bär Gruppe AG, Zurich* Member of the Board Metro AG, Düsseldorf* Member of the Supervisory BoardAdrian Loader Compton Petroleum Corporation, Calgary* Chairman of the Board Oracle Coalfields PLC, London* Chairman of the Board Lane, Clark & Peacock, London Member of the Advisory Board GardaWorld, Montreal* Member of the International Advisory BoardAndreas von Planta SIX Swiss Exchange AG, Zurich Chairman of the Regulatory Board Schweizerische National-Versicherungs-Gesellschaft, Basel* Chairman of the Board Générale-Beaulieu Holding S.A., Geneva Chairman of the Board HSBC Private Bank (Switzerland) S.A., Geneva Vice Chairman of the Board HSBC Private Banking Holding (Switzerland) S.A., Geneva Member of the Board Novartis AG, Basel* Member of the Board Raymond Weil S.A., Geneva Member of the BoardThomas Schmidheiny Schweizerische Cement-Industrie-Aktiengesellschaft, Rapperswil-Jona Chairman of the Board Spectrum Value Management Ltd., Rapperswil-Jona Chairman of the BoardWolfgang Schürer Swiss Reinsurance Company, Zurich* Member of the Swiss Re Advisory Panel T-Systems Council for European Affairs and Economy, Bonn Member Dieter Spälti Rieter Holding AG, Winterthur* Member of the Board Schweizerische Cement-Industrie-Aktiengesellschaft, Rapperswil-Jona Member of the Board Spectrum Value Management Ltd., Rapperswil-Jona Member of the Board * Listed company.
125
Since 2002, the following expert committees havebeen operational:
Audit CommitteeThe Audit Committee assists and advises the Board of Directors in conducting its supervisory duties withrespect to the internal control systems. It examinesthe reporting for the attention of the Board of Direc-tors and evaluates the Group’s external and internalaudit procedures, reviews the risk management sys-tems of the Group and assesses financing issues.
Composition of the Audit Committee
Peter Küpfer ChairmanAlexander Gut1 MemberAndreas von Planta MemberDieter Spälti Member
1 Since May 5, 2011.
All members are independent according to the defini-tion of the Swiss Code of Best Practice for CorporateGovernance, in order to ensure the necessary degreeof objectivity required for an Audit Committee.
In 2011, four regular meetings of the Audit Committeewere held. All of the meetings were attended by allmembers of the committee. Three meetings were alsoattended by the auditors, and at three meetings, theHead of Group Internal Audit was present for certainagenda topics. Furthermore, the Chairman of theBoard of Directors (except for one meeting), the CEOand the CFO attended the meetings of the Audit Com-mittee as guests. The average duration of each meet-ing was 4.5 hours.
In 2011, the committee has particularly taken note of the status of the ICS (internal control system), dealt with internal directives and evaluated financingissues. The Audit Committee’s Charter is available at www.holcim.com/corporate_governance.
Governance, Nomination & Compensation CommitteeThe Governance, Nomination & Compensation Com-mittee supports the Board of Directors in planningand preparing succession at the senior managementlevel. It monitors developments with regard to com-pensation for the Board of Directors and senior man-agement, and briefs the Board of Directors accordingly.The committee decides on the compensation paid tothe Executive Committee, and on the CEO’s targetsand performance assessment, and informs the Boardof Directors as a whole of the decisions taken.
Composition
of the Governance, Nomination & Compensation Committee
Erich Hunziker1 ChairmanAdrian Loader2 MemberThomas Schmidheiny MemberWolfgang Schürer3 Member
1 Since May 5, 2011; Rolf Soiron until May 5, 2011.2 Since May 5, 2011.3 Until April 17, 2012.
The Governance, Nomination & Compensation Com-mittee held three regular meetings in 2011. All exceptfor one of the meetings were attended by all membersof the committee. The meetings were also attended by the CEO as a guest, insofar as he was not himselfaffected by the items on the agenda. The average duration of each meeting was 3.7 hours.
The Charter of the Governance, Nomination & Compen-sation Committee may be found at www.holcim.com/corporate_governance. More details on the activitiesof the Governance, Nomination & CompensationCommittee, in particular with regard to the processof determination of compensation, can be found inthe remuneration report, starting on page 142.
Areas of responsibilityThe division of responsibilities between the Board of Directors and the Executive Committee is set outin detail in the company’s Organizational Rules. TheOrganizational Rules may be found on our website atwww.holcim.com/corporate_governance.
Corp
orat
e Go
vern
ance
126
Organizational RulesThe Organizational Rules entered into force on May 24,2002, and according to the Organizational Rules shallbe reviewed at least every two years and amended asrequired. They were last amended in 2011.
The Organizational Rules were issued by the Board ofDirectors of Holcim Ltd in accordance with the terms ofArt. 716b of the Swiss Code of Obligations and Art. 19 ofthe company’s Articles of Incorporation. They stipulatethe organizational structure of the Board of Directorsand the Executive Committee and govern the tasks andpowers conferred on the company’s executive bodies.They regulate the convocation, execution and numberof meetings to be held by the Board of Directors andthe Executive Committee as well as the tasks and com-petences of the company’s bodies. The OrganizationalRules set out the tasks and responsibilities of the Chair-man of the Board of Directors and the CEO. In the eventthat the Chairman of the Board of Directors is not inde-pendent, the Organizational Rules provide for the elec-tion of an Independent Lead Director, such electionmust be confirmed on a yearly basis.
The Board of Directors also has the power to establishexpert committees and, if required, ad-hoc committeesfor special tasks. The Board of Directors can delegatespecial tasks or tasks related to specific functions toDeputy Chairmen on a temporary or permanent basis.
As part of its non-transferable statutory responsibili-ties, the Board of Directors defines the corporatestrategy, approves the consolidated Group budget,the quarterly consolidated financial statements (withthe exception of the report of the first quarter of the year, which is to be adopted and released by theAudit Committee) and the Annual Report for submis-sion to the annual general shareholders meeting, and reviews the professional qualifications of the external auditors.
The Executive Committee is responsible for operationalmanagement, preparing a large part of the business ofthe Board of Directors – including proposals of corpo-rate strategies – and executing the latter’s resolutions.The Executive Committee issues directives and recom-mendations with Group-wide significance in its ownauthority; furthermore, the Executive Committee is
responsible for electing and dismissing Area Managers,Corporate Functional Managers, Function Heads andCEOs of Group companies, as well as for the nomina-tion of the members of the Board of Directors and supervisory bodies of the Group companies.
Within the framework of budget approval, the Board ofDirectors defines limits for investments and financ ing.Within these limits, the Executive Committee decideson financing transactions and on one-off invest mentsand divestments for amounts up to CHF 200 million.Amounts beyond this are subject to approval by theBoard of Directors. The Board of Directors is regularly informed about important transactions within the authority of the Executive Committee.
The members of the Executive Committee may, inconcert with the CEO, delegate their tasks in relationto their geographical areas of responsibility to AreaManagers, or in relation to their functional areas ofresponsibility, to Corporate Functional Managers. The CEO assesses the performance of the members of the Executive Committee and, after advice and assessment by the Governance, Nomination & Com-pensation Committee, determines their respectiveobjectives.
The CEO, together with the Executive Committee, oversees Business Risk Management following appraisal by the Audit Committee. The Board of Directors is in-formed annually about the risk situation.
In case of a direct conflict of interest, the Organiza-tional Rules require each member of the corporatebody concerned to stand aside voluntarily prior to anydiscussion of the matter in question. Members of thecorporate bodies are required to treat all informationand documentation which they may obtain or view inthe context of their activities on these bodies as con-fidential, and not to make such information availableto third parties.
All individuals vested with the powers to representthe company have only joint signatory power at two.
127
Information and control instruments of the Board of DirectorsThe Board of Directors determines in which manner itis to be informed about the course of business. Anymember of the Board of Directors may demand infor-mation on all issues relating to the Group and thecompany. All Directors may request information fromthe CEO through the Chairman of the Board of Direc-tors. At meetings of the Board, any attending memberof the Executive Committee has a duty to provide in-formation. All members of the Board of Directorshave a right to inspect books and files to the extentnecessary for the performance of their tasks.
1. Financial reportingThe Board of Directors is informed on a monthly basisabout the current course of business, adopts the quar-terly reports (with the exception of the report of the firstquarter of the year, which is to be adopted and re-leased by the Audit Committee) and releases them forpublication. The Board of Directors discusses the AnnualReport, takes note of the auditors’ reports and submitsthe Annual Report to the general meeting for approval.
With regard to Group strategy development, a strat-egy plan, a five-year financial plan and an annualbudget are submitted to the Board of Directors.
2. Business Risk ManagementHolcim benefits from several years of experience withBusiness Risk Management (BRM) implemented in1999. The BRM process has been anchored in the entire Group covering all consolidated Group compa-nies and their relevant business segments.
BRM analyzes the Group’s overall risk exposure andsupports the strategic decision-making process.Therefore, the BRM process is closely linked with theGroup’s strategic management process. The full riskspectrum, from market, operations, finance and legal,to external risk factors of the business environment,is reviewed, including compliance and reputationalrisks. The risk assessment is not limited to a hazardanalysis, but also identifies measures and possibleopportunities.
The Group’s risk position is assessed from both top-down and bottom-up. In addition to the Group com-panies, senior management also conducts an annualrisk analysis. The Board of Directors analyzes theGroup’s risks and opportunities at least once a yearand discusses them with the Executive Committee aspart of the annual strategy review.
The BRM process consists of several steps. First, risksas well as opportunities are assessed and prioritizedaccording to significance and likelihood. Top risks areanalyzed more deeply regarding their causes. In athird step, the analysis of the current risk situation is completed with a detailed assessment of the con-sequences. Then, decisions are taken on how to dealwith specific risks, on the consolidated risk profile andon mitigating actions. During the year, risks and oppor-tunities are systematically monitored and reported.Information gathered in the process is stored in aprotected, centralized database which allows instantaccess for all Group companies around the world totheir information for data evaluation and reporting.Responsibilities concerning risks are clearly defined.The corporate function Strategy & Risk Managementis responsible for the BRM process and timely reportingby the Executive Committee to the Board of Directors.
3. Internal AuditInternal Audit assures the existence and pertinence ofprocess controls and integrity of information. For moredetails, see page 43. Internal Audit reports to the Chair-man of the Board of Directors and periodically informsthe Audit Committee. The members of the Board of Directors have access to Internal Audit at all times.Each year, the Audit Committee defines the audit focalareas to be addressed by Internal Audit, and the Headof Internal Audit periodically updates the Audit Com-mittee on the activities of Internal Audit.
Corp
orat
e Go
vern
ance
128
Senior managementSenior management of Holcim Ltd comprises the CEO,members of the Executive Committee, Area Managersand Corporate Functional Managers. The tasks of senior management are divided into different areas ofresponsibility in terms of country, division and function, each of these areas being ultimately super-vised and managed by a member of the ExecutiveCommittee. Members of the Executive Committee may be assisted by Area Managers and Corporate Functional Managers in their area of responsibility.
The following changes within senior managementoccurred during the year under review:
Thomas Aebischer, former CFO of Holcim US, hasbeen appointed as member of the Executive Commit-tee as of January 1, 2011. Effective April 1, 2011, he tookover CFO responsibility for the Group.
Andreas Leu, former Area Manager and member ofsenior management of Holcim Ltd, has been ap-pointed as member of the Executive Committee as ofJanuary 1, 2011, with responsibility for Latin America.
Urs Fankhauser, former Regional Technical DirectorEastern Europe, has been appointed Area Managerand as such member of senior management of Holcim Ltd as of January 1, 2011. He is responsible forthe markets in Eastern and Southeastern Europe, andreports directly to Executive Committee member UrsBöhlen.
Stefan Wolfensberger, Corporate Functional Man-ager Holcim Ltd and Head Commercial Services Holcim Group Support Ltd, retired from his positionon June 30, 2011 to pursue a new challenge.
Executive CommitteeDuring the year under review, the Executive Commit-tee of Holcim Ltd comprised nine members. None ofthe members of the Executive Committee has impor-tant functions outside the Holcim Group or any othersignificant commitments of interest.
Composition of the Executive Committee
Markus Akermann1 CEOBernard Fontana2 CEOThomas Aebischer3 CFOUrs Böhlen MemberPatrick Dolberg MemberPaul Hugentobler MemberBenoît-H. Koch MemberRoland Köhler Member, CEO HGRSAndreas Leu4 MemberTheophil H. Schlatter5 CFOIan Thackwray Member1 Until January 1, 2012.2 Since February 1, 2012.3 Since January 1, 2011, member of the Executive Committee; effective April 1, 2011, CFO.
4 Since January 1, 2011.5 Until March 31, 2011.
Please consult pages 136 and 138 for biographical information on the members of the Executive Com-mittee. Regional and functional responsibilities are shown on the organizational chart on pages 44and 45.
Area Management
The individual members of the Executive Committeeare assisted by Area Managers.
Composition of the Area Management
Javier de Benito Mediterranean, Indian Ocean, West AfricaUrs Fankhauser1 Eastern and Southeastern EuropeAidan Lynam Bangladesh, Malaysia, Singapore, Sri Lanka, VietnamBernard Terver Holcim US, Aggregate Industries US Onne van der Weijde2
1 Since January 1, 2011.2 Since January 1, 2012.
Please see pages 139 to 140 for biographical informa-tion on Area Managers.
129
Corporate Functional ManagersCorporate Functional Managers are responsible forspecific functions and dimensions and report to theCEO HGRS.
Composition of the Corporate Functional Management
Jacques Bourgon Cement Manufacturing Services
Please see page 141 for biographical information onthe Corporate Functional Manager.
Management agreementsHolcim has no management agreements in place withcompanies or private individuals outside the Group.
Compensation, shareholdings and loansDetails of Board and management compensation arecontained in the remuneration report (page 142) andin the consolidated financial statements (page 223,note 40).
Shareholders’ participationVoting rights and representation restrictionsAll holders of registered shares who are registered asshareholders with voting rights in the share registerat the date communicated in the invitation to thegeneral meeting approximately one week prior to thegeneral meeting (the exact date will be communicatedin the invitation to the general meeting) are entitled toparticipate in, and vote at, general meetings. Sharesheld by trusts and shares for which no declaration hasbeen made in the context of the regulations of theBoard of Directors governing the entry of shareholdersin the share register of Holcim Ltd are entered in theshare register as having no voting rights. Shareholdersnot participating in person in the general meeting may be represented by another shareholder, by thecustodian bank, by the company as representative of the governing body or by the independent votingproxy. Voting rights are not subject to any restrictions.Each share carries one vote.
Statutory quorumsThe general meeting of shareholders normally consti-tutes a quorum, regardless of the number of shares rep-resented or shareholders present; resolutions are passedby an absolute majority of the votes allocated to the
shares represented, unless Art. 704 para. 1 of the SwissCode of Obligations or the Swiss Merger Act provideotherwise. In such cases, resolutions may only bepassed with the respective qualified majority of thevotes represented.
According to Art. 10 para. 2 of the Articles of Incorpo-ration and in addition to Art. 704 para. 1 of the SwissCode of Obligations, the approval of at least two-thirdsof the votes represented and the absolute majority ofthe par value of shares represented shall be requiredfor resolutions of the general meeting of shareholderswith respect to the removal of the restrictions set forth in Art. 5 of the Articles of Incorporation (entries in the share register), the removal of the mandatorybid rule (Art. 22 para. 3 of the Stock Exchange Act), the removal or amendment of this para. 2 of Art. 10 of the Articles of Incorporation.
The chair of the meeting may also have votes andelections conducted electronically. Electronic votesand elections are deemed equivalent to secret votesand elections.
Convocation of the general meeting and agenda rulesThe ordinary general meeting of shareholders takesplace each year, at the latest six months following theconclusion of the financial year. It is convened by theBoard of Directors, whereby invitations are publishedat least twenty days prior to the meeting and in whichdetails are given of the agenda and items submitted.Shareholders representing shares with a par value of at least one million Swiss francs may request theaddition of a particular item for discussion. A corre-sponding application must be submitted in writing to the Board of Directors at least forty days prior tothe annual general meeting. Such application shouldindicate the items to be submitted. The invitations aswell as the minutes of the general meetings shall bepublished on www.holcim.com/AGM2012.
Entries in the share registerThe company maintains a share register for regis-tered shares in which the names and addresses ofowners and beneficiaries are entered. Only those in -cluded in the share register are deemed shareholdersor beneficial owners of the registered shares of thecompany. Upon request, purchasers of registered
Corp
orat
e Go
vern
ance
130
shares shall be included in the share register asshareholders with voting rights if they expresslydeclare that they have acquired the shares in theirown name and for their own account. Exceptions to this rule apply for nominees who have signed anominee agreement with the company regarding this position and are subject to a recognized bankingor financial markets supervisory authority.
The share register is closed approximately one weekprior to the date of the general meeting (the exactdate will be communicated in the invitation to thegeneral meeting). Shareholders’ participation andrights of protection are furthermore governed by theSwiss Code of Obligations.
This information comprises excerpts from the Articles of Incorporation of Holcim Ltd. The full ver-sion of the Articles of Incorporation can be retrievedat www.holcim.com/corporate_governance.
Changes of control and defense measuresThe Articles of Incorporation contain no waiver of theduty to make a public offer under the terms of Art. 32and 52 of the Swiss Stock Exchange Act (“opting out”).The result is that a shareholder who directly, indirectlyor in concert with third parties acquires shares in thecompany and, together with the shares he already pos-sesses, thereby exceeds the 331⁄3 percent threshold ofvoting rights in the company must make an offer for alllisted shares of the company.
There are no clauses relating to changes of control.
AuditorsAs part of their auditing activity, the auditors informthe Audit Committee and the Executive Committeeregularly about their findings and about proposalsfor improvement. Considering the reporting andassessments by the Group companies, the Audit Committee evaluates the performance of the auditorsand their remuneration in line with market condi-tions. The Audit Committee approves the audit focusarea, provides recommendations to the auditors andmakes suggestions for improvement. In 2011, theauditors participated in three regular meetings of theAudit Committee to discuss individual agenda items.
Ernst & Young Ltd, Zurich, were appointed in 2002 as auditors to Holcim Ltd. Since 2011, Willy Hofstetteris responsible for managing the audit mandate, sup-ported by Michael Brenner. The rotation of the leadauditor will be carried out in accordance with thestatutory provisions in Art. 730a of the Swiss Code ofObligations. The auditors are elected for a one-yearterm by the annual general meeting.
The following fees were charged for professionalservices rendered to the Group by Ernst & Young in2011 and 2010:
1 This amount includes the fees for the individual audits of Group companies carried out by Ernst & Young as well as their fees for auditingthe Group financial statements.
2 Audit-related services comprise, among other things, amounts for due diligences, comfort letters, accounting advice, information systemsreviews and reviews on internal controls.
3 Other services include, among other things, amounts for accounting, actuarial and legal advisory services.
Holcim Ltd reports to shareholders, the capital market,employees and the public at large in a transparentand timely manner concerning its corporate perfor -mance, including achievement of its sustainability targets. An open dialog is nurtured with the most important stakeholders, based on mutual respect andtrust. This promotes knowledge of the company andunderstanding of objectives, strategy and business activities of the company.
As a listed company, Holcim Ltd is committed to dis-close facts that may materially affect the share price(ad-hoc disclosure, Art. 53 and 54 of the SIX listingrules). Members of the Board of Directors and seniormanagement are subject to SIX rules on the disclosureof management transactions. These can be accessedon the SIX website (www.six-exchange-regulation.com/regulation/directives/being_public_en.html).
The most important information tools are the annualand quarterly reports, the website (www.holcim.com),media releases, press conferences, meetings for finan-cial analysts and investors as well as the annual gen-eral meeting.
Our commitment to sustainability is described onpages 53 to 57 of this Annual Report. Current informa-tion relating to sustainable development is availableat www.holcim.com/sustainable. In 2012, Holcim Ltdwill publish its sixth sustainability report.
The financial reporting calendar is shown on pages 52and 252 of this Annual Report.
Should you have any specific queries regarding Holcim, please contact:
Investor Relations, Bernhard A. FuchsPhone +41 58 858 87 87, Fax +41 58 858 80 [email protected]
Corp
orat
e Go
vern
ance
132
Rolf Soiron, Swiss national, born in 1945, Chairman of the Board of Directors since 2003, elected until 2013,Chairman of the Governance, Nomination & Compensation Committee from 2005 until 2011. He studied historyat the University of Basel, where he obtained a PhD in Philosophy in 1972. He began his professional career in1970 with Sandoz in Basel, where he held various positions, ultimately as COO of Sandoz Pharma AG with theresponsibility for the global pharmaceuticals business. From 1993 until the end of June 2003, Rolf Soiron man-aged the Jungbunzlauer Group in Basel (leading international manufacturer of citric acid and related products),ultimately as Managing Director. From 1996 until March 2005, he was – on a part-time basis – Chairman of theUniversity of Basel. He served from early 2003 until spring 2010 as Chairman of the Board of Directors of NobelBiocare. In April 2005, he was appointed Chairman of the Board of Directors of Lonza Group Ltd, Basel. In 2009,he was elected to the Board of the Swiss Industry Association “economiesuisse” and to the chair of the free-market think tank “Avenir Suisse”. He is also a member of the International Committee of the Red Cross (ICRC)in Geneva. He is a member of the Foundation Board of the Graduate Institute of International and Develop-ment Studies in Geneva. He was elected to the Board of Directors of Holcim Ltd in 1994.
Beat Hess, Swiss national, born in 1949, Deputy Chairman of the Board of Directors, elected until 2013. He holds adoctorate in law and is admitted to the bar in Switzerland. From 1977 to 2003, he was initially Legal Counsel andsubsequently General Counsel for the ABB Group. From 2003 until end of 2010, Beat Hess was Legal Director andmember of the Executive Committee of Royal Dutch Shell Group, The Hague, Netherlands. He is also member ofthe Board of Directors of Nestlé S.A., Vevey, Switzerland, and has been nominated as member of the Board of Di-rectors of Sonova Holding AG, Stäfa. He was elected to the Board of Directors of Holcim Ltd in 2010.
Erich Hunziker, Swiss national, born in 1953, Deputy Chairman of the Board of Directors, elected until 2014, Chair-man of the Governance, Nomination & Compensation Committee. He studied industrial engineering at the ETHZurich, obtaining a PhD in 1983. In the same year, he joined Corange AG (holding company for the BoehringerMannheim Group), where he was appointed CFO in 1997 and among other things managed a project handlingthe financial aspects of the sale of the Corange Group to F. Hoffmann-La Roche AG. From 1998 until 2001, he wasCEO at the Diethelm Group and Diethelm Keller Holding AG. From 2001 until end of March 2011, he served as CFOof F. Hoffmann-La Roche AG and as a member of the Executive Committee. In 2005, he was appointed as DeputyHead of Roche’s Corporate Executive Committee, in addition to his function as Chief Financial Officer. From 2004until 2011, he was a member of the Board of Genentech Inc., USA. From 2006 until 2011, he was a member of theBoard of Directors of Chugai Pharmaceutical Co. Ltd., Japan. He is a member of the Board of Directors of BBBiotech, Schaffhausen, and IMD, Lausanne. He was elected to the Board of Directors of Holcim Ltd in 1998.
Board of Directors1
1 For further information on major Swiss and foreign mandates of the Board of Directors outside the Holcim Group, see page 124.
133
Markus Akermann, Swiss national, born in 1947, CEO until January 31, 2012, member of the Board of Directors,elected until 2013. He obtained a degree in business economics from the University of St. Gallen in 1973 and stud-ied economic and social sciences at the University of Sheffield, UK. He began his professional career in 1975 withthe former Swiss Bank Corporation. In 1978, he moved to Holcim, where he was active in a number of roles, in-cluding Area Manager for Latin America and Holcim Trading. In 1993, he was appointed to the Executive Commit-tee, with responsibility for Latin America and international trading activities. From January 1, 2002 until his re-tirement at the end of January 2012, he was CEO of Holcim Ltd. At the annual general meeting in 2002, he waselected to the Board of Directors of Holcim Ltd.
Christine Binswanger, Swiss national, born in 1964, member of the Board of Directors, elected until 2014. Sheholds a degree in architecture from the ETH Zurich and in 1994, she became a partner at Herzog & de MeuronArchitects, Basel. In 2001, she acted as a visiting professor at EPFL Lausanne. In 2004, she was awarded theMeret Oppenheim Prize for architecture by the Federal Office of Culture. She was elected to the Board of Direc-tors of Holcim Ltd in 2008.
Alexander Gut, British and Swiss national, born in 1963, member of the Board of Directors, elected until 2014,member of the Audit Committee. Alexander Gut holds a doctorate degree in Business Administration (Dr. oec.publ.) from the University of Zurich, Switzerland, and is a Swiss Certified Accountant. From 1991 to 2001 he waswith KPMG in Zurich and London and from 2001 to 2003 with Ernst & Young in Zurich, being promoted to Part-ner in 2002. From 2003 to 2007 he was a Partner with KPMG in Zurich, being promoted to the Executive Com-mittee of KPMG Switzerland in 2005. Alexander Gut is the Founder and Managing Partner of Gut CorporateFinance AG, an independent corporate finance advisory firm in Zurich. Since May 2010, he has been a memberof the Board of Directors of Adecco S.A., Chéserex, Switzerland. He was elected to the Board of Directors of Holcim Ltd in 2011.
Peter Küpfer, Swiss national, born in 1944, member of the Board of Directors, elected until 2013, Chairman of theAudit Committee. As a Swiss Certified Accountant, he began his career with Revisuisse Pricewaterhouse AG inBasel and Zurich, where he became a member of management. From 1985 until 1989, he was CFO at FinancièreCredit Suisse First Boston and CS First Boston, New York; from 1989 until 1996, he was at CS Holding, Zurich, asa member of the Executive Board. He has been an independent business consultant since 1997. He was electedto the Board of Directors of Holcim Ltd in 2002.
Corp
orat
e Go
vern
ance
134
Adrian Loader, British national, born in 1948, member of the Board of Directors, elected until 2012, member ofthe Governance, Nomination & Compensation Committee. He holds an Honours Degree in History from Cam-bridge University and is a Fellow of the Chartered Institute of Personnel and Development. He began his pro-fessional career at Bowater in 1969, and joined Shell the following year. Until 1998, he held various manage-ment positions in Latin America, Asia, Europe and at the corporate level. In 1998, he was appointed President ofShell Europe Oil Products and became Director for Strategic Planning, Sustainable Development and ExternalAffairs in 2004. In 2005, he became Director of the Strategy and Business Development Directorate of RoyalDutch Shell, and became President and CEO of Shell Canada in 2007, retiring from Shell at the end of the year.In January 2008, he joined the Board of Toronto-based Candax Energy Inc. and was appointed Chairman. He re-tired from this position end of June 2010. He is Chairman of the Board of Directors of Oracle Coalfields, London,and of Compton Petroleum, Calgary, as well as a member of the Advisory Board of Lane, Clark & Peacock in Lon-don and member of the International Advisory Board of GardaWorld, Montreal, Canada. He was elected to theBoard of Directors of Holcim Ltd in 2006.
Andreas von Planta, Swiss national, born in 1955, Deputy Chairman of the Board of Directors from 2005 until 2011,elected until 2014, member of the Audit Committee. He studied law at the University of Basel (doctorate, 1981)and Columbia, New York (LL.M., 1983). He began his professional career in 1983 with Lenz & Staehelin, an interna-tional law firm based in Geneva. In 1988, he became partner and was Managing Partner from 2002 until the endof 2005. He has a wealth of experience in corporate law, business financing and mergers and acquisitions. Heacts as Chairman of the Board of Schweizerische National-Versicherungs-Gesellschaft, Basel, as member of theBoard of Novartis AG, Basel, and as Chairman of the Regulatory Board of SIX Swiss Exchange AG, Zurich. In addi-tion, he is Chairman of Générale-Beaulieu Holding SA, Geneva, Vice Chairman of HSBC Private Bank (Switzerland)SA, Geneva, and member of the Board of Directors of Raymond Weil SA, Geneva, and HSBC Private Banking Hold-ing (Switzerland) SA, Geneva, and in other companies which are affiliates of foreign groups. He was elected tothe Board of Directors of Holcim Ltd in 2003.
Thomas Schmidheiny, Swiss national, born in 1945, member of the Board of Directors, elected until 2012, memberof the Governance, Nomination & Compensation Committee. He studied mechanical engineering at the ETHZurich and complemented his studies with an MBA from the IMD Lausanne (1972). In 1999, he was awarded anhonorary doctorate for his services in the field of sustainable development from Tufts University, Massachu-setts, USA. He began his career in 1970 as Technical Director with Cementos Apasco and was appointed to theExecutive Committee of Holcim in 1976, where he held the office of Chairman from 1978 until 2001. He waselected to the Board of Directors of Holcim Ltd in 1978 and was Chairman of the Board from 1984 until 2003.
135
Wolfgang Schürer, Swiss national, born in 1946, member of the Board of Directors, elected until 2012, member ofthe Governance, Nomination & Compensation Committee. He studied economic and social sciences at the Uni-versity of St. Gallen, where he was awarded an honorary doctorate in 1999. He is Chairman of the Board of Direc-tors and CEO of MS Management Service AG, St. Gallen (international consultancy firm focusing on strategy andrisk evaluation for multinational firms in Asia, North America, Africa, Europe and the Middle East as well as man-dates in the international regulatory environment). He is Chairman of the Foundation Lindau NobelprizewinnersMeetings at Lake Constance as well as a regular visiting Professor for Public Affairs at the University of St. Gallen.Since 2006, he has served as a member of Swiss Re’s Advisory Panel and since 2009 as a member of the T-SystemCouncil for European Affairs and Economy. He was elected to the Board of Directors of Holcim Ltd in 1997 and willresign from this body at the annual general meeting 2012.
Dieter Spälti, Swiss national, born in 1961, member of the Board of Directors, member of the Audit Committee,elected until 2012. He studied law at the University of Zurich, obtaining a doctorate in 1989. He began his profes-sional career as a credit officer with Bank of New York in New York, before taking up an appointment as CFO ofTyrolit (Swarovski Group), based in Innsbruck and Zurich, in 1991. From 1993 until 2001, he was with McKinsey &Company, ultimately as a partner, and was involved in numerous projects with industrial, financial and technol-ogy firms in Europe, the US and Southeast Asia. In October 2002, he joined Rapperswil-Jona-based SpectrumValue Management Ltd. as a partner, the firm which administers the industrial and private investments of thefamily of Thomas Schmidheiny. Since 2006, he has been CEO of Spectrum Value Management Ltd. He was electedto the Board of Directors of Holcim Ltd in 2003.
Corp
orat
e Go
vern
ance
136
Markus Akermann, please refer to the section Board of Directors on page 133 for his biographical information.
Bernard Fontana, French national, born in 1961. Bernard Fontana holds a degree in engineering from the EcolePolytechnique and the Ecole Nationale Supérieure des Techniques Avancées in Paris. His career began withGroupe SNPE in France. In 1998, he was appointed head of US operations, and from 2001 to 2004 was a memberof the Executive Committee. Shortly after joining ArcelorMittal in 2004, he was given responsibility for HR, ITand business development at Flat Carbon. From 2006 to 2007 he was a member of the Executive Committee ofArcelorMittal with responsibility for the Automotive Worldwide Business Unit. In his capacity as Group Ma-nagement Committee member, he was subsequently responsible for HR and the global alliance with NipponSteel. From 2010 until 2011 Bernard Fontana was CEO of Aperam, a Luxembourg-domiciled listed corporategroup that was spun off from ArcelorMittal in the fall of 2010. Since February 1, 2012, he is CEO of Holcim Ltd.
Thomas Aebischer, Swiss national, born in 1961. Thomas Aebischer is a Swiss Certified Accountant and alumnusof the Advanced Management Program of the Harvard Business School. He started his career with the tax authorities of the Canton of Berne. From 1988 to 1996, Thomas Aebischer worked with PricewaterhouseCoopers in Hong Kong and Zurich. In 1996, he joined Holcim Group Support Ltd, and from 1998 to 2002 acted as Head of Corporate Controlling. From 2002 to 2003, he was CFO of Holcim Apasco in Mexico and since then CFO ofHolcim US. He joined the Executive Committee at the beginning of 2011, and effective April 1, 2011, he has takenover as CFO.
Urs Böhlen, Swiss national, born in 1950. Urs Böhlen studied business administration at the University of Berne,graduating in 1977, and complemented his education at the Stanford Business School in 1991. From 1977 to 1979,he served as Project Manager in the accounts division at Union Bank of Switzerland. From 1980 until 1985, he was Head of Controlling at Autophon AG. He joined Holcim in 1985; after holding various positions, he wasentrusted with overall management of the former Cementfabrik “Holderbank” at Rekingen in 1989. From 1992until 1998, he served as CEO of Holcim Switzerland, and subsequently as Area Manager of Holcim Ltd, responsiblefor Eastern Europe and the CIS/Caspian region. As member of the Executive Committee, he took over responsi-bility for Eastern/Southeastern Europe and the CIS/Caspian region, effective November 1, 2008.
Executive Committee
137
Patrick Dolberg, Belgian national, born in 1955. Patrick Dolberg has an MBA from the Solvay Business School, Belgium. He began his professional career with Exxon Chemical. From 1984 to 1986, he worked in sales and mar-keting with the Unilever Group and Exxon Chemical. Subsequently, he held executive positions with ExxonChemical International and Monsanto. Patrick Dolberg joined the Holcim Group in 1991. From 1992 to the end of1996, he was General Manager of Scoribel, a Belgian Group company of Holcim. In 1997, he assumed manage-ment responsibility for a Holcim Group company in Australia. Patrick Dolberg was appointed CEO of St. LawrenceCement (now Holcim Canada) at the end of 1998, and was made CEO of Holcim US in March 2003. As memberof the Executive Committee, he assumed responsibility for Belgium, France, the Netherlands, Germany, Switzer-land and Italy, effective November 1, 2008.
Paul Hugentobler, Swiss national, born in 1949. Paul Hugentobler has a degree in civil engineering from the ETHZurich and a degree in economic science from the University of St. Gallen. He joined what is now Holcim GroupSupport Ltd in 1980 as Project Manager and in 1994 was appointed Area Manager for Holcim Ltd. From 1999 until2000, he also served as CEO of Siam City Cement, headquartered in Bangkok, Thailand. He has been a member of the Executive Committee since January 1, 2002, with responsibility for South Asia and ASEAN excluding thePhilippines.
Benoît-H. Koch, French and Brazilian national, born in 1953. Benoît-H. Koch completed his education as an engi-neer at the ETH Zurich. He joined Holcim in 1977, occupying various positions at Group companies in Brazil,France, Belgium and Switzerland until 1992. He has been a member of the Executive Committee since then andis currently responsible for North America, the UK and Norway, the Mediterranean, including Iberian Peninsula,and International Trade.
Roland Köhler, Swiss national, born in 1953. Roland Köhler, a graduate in business administration from the Uni-versity of Zurich, joined building materials group Hunziker, Switzerland, in 1988 as Head of Finance and Admin-istration and transferred to Holcim Group Support Ltd as a management consultant in 1994. From 1995 to 1998,he was Head of Corporate Controlling and from 1999 to end 2001 Head of Business Risk Management. Since2002, he headed Corporate Strategy & Risk Management. Effective January 1, 2005, Roland Köhler was promotedto Corporate Functional Manager responsible for Corporate Strategy & Risk Management. The Board of Directorsappointed Roland Köhler as member of the Executive Committee, effective March 15, 2010. In his new role as CEOof Holcim Group Support Ltd (HGRS), he leads the central service and support functions of the Group.
Corp
orat
e Go
vern
ance
138
Andreas Leu, Swiss national, born in 1967, studied business administration at the University of St. Gallen andholds an MBA from the Johnson Graduate School at Cornell University. After working for the International Com-mittee of the Red Cross (ICRC), he joined Holcim Group Support Ltd in 1999 as a consultant. In 2002, he was ap-pointed General Manager of Holcim Centroamérica, before assuming the position of CEO of Holcim Ecuador in2003. During 2006 and 2007, he also held the position of CEO of Holcim Venezuela. On August 1, 2008, AndreasLeu was appointed Area Manager of Holcim Ltd, with responsibility for Colombia, Ecuador, Argentina, Chile andBrazil. As of January 1, 2011, Andreas Leu has been appointed as member of the Executive Committee. He is re-sponsible for Latin America.
Ian Thackwray, British national, born in 1958. Ian Thackwray holds an MA (Hons) in Chemistry from Oxford Univer-sity and is also a chartered accountant. After his studies, he joined Pricewaterhouse and handled major corporateaccounts in Europe. In 1985, he started a career with Dow Corning Corporation, serving in various managementroles in Europe, North America and particularly in Asia. From 2004 to 2006, he served as Dow Corning’s Asian/ Pacific President based out of Shanghai. Between 2006 and 2010, he was CEO of Holcim Philippines. Since the be-ginning of 2010, he has been a member of the Executive Committee. His area of responsibility spans the compa-nies in East Asia, including China, the Philippines, Oceania and South and East Africa.
139
Area Management
Javier de Benito, Spanish national, born in 1958, studied business administration and economics at the Universi-dad Autónoma de Madrid and undertook further studies at the Harvard Business School. After a number ofyears of professional experience in the finance department of an international steel trading company and as a specialist for finance projects with a Spanish export promotion company, he joined Holcim Trading in 1988.Along with responsibility for controlling at the subsidiary companies division and for business development, hetook on the position of Deputy General Manager in 1992, with responsibility for the trading division. On April 1,2003, he was appointed Area Manager for the Mediterranean, Indian Ocean and West Africa.
Urs Fankhauser, Swiss national, born in 1963, completed his education at the Swiss Federal Institute of TechnologyZurich (ETH Zurich) in 1989. He holds a Master of Science in Mechanical Engineering and worked at the Institutefor “Konstruktion und Bauweisen” of the ETH Zurich. Urs Fankhauser joined Holcim Group Support Ltd in 1991 asa process performance engineer. After holding several managerial roles, he was appointed General Manager ofHolcim Croatia in 2002 and took over his role as Regional Technical Director Eastern Europe in 2004. As of Janu-ary 1, 2011, he was appointed Area Manager and member of senior management of Holcim Ltd. In this function,he is responsible for the markets in Eastern and Southeastern Europe.
Aidan Lynam, citizen of the Republic of Ireland, born in 1960, holds an Honours Degree in Mechanical Engineeringfrom University College Dublin and an Executive MBA from IMD in Lausanne. He joined Holcim Group Support Ltdin 1986 working on assignments in Egypt and Switzerland. After spending some years with Krupp Polysius in Germany, he returned to the Group in 1996, assigned to the Morning Star project of Holcim Vietnam where hewas appointed as Terminal Manager in 1999. In 2002, he was appointed Vice President Manufacturing at HolcimLanka and returned to Holcim Vietnam as CEO in 2006. On January 1, 2010, he took up his position as Area Man-ager and member of the senior management of Holcim Ltd, assuming country responsibility for Bangladesh,Malaysia, Singapore, Sri Lanka and Vietnam.
Corp
orat
e Go
vern
ance
140
Bernard Terver, French national, born in 1952, concluded his studies at the Ecole Polytechnique in Paris in 1976.After beginning his career in the steel industry, in 1977 he moved to cement producer CEDEST, which was takenover by Holcim France in 1994. In 1999, Bernard Terver became CEO of Holcim Colombia and in 2003 he was appointed Area Manager for the Andes nations, Central America and the Caribbean. Since October 2008, he has been CEO of Holcim US and effective November 2010 CEO of Aggregate Industries US. Bernard Terver was appointed Area Manager and member of senior management of Holcim Ltd, with effect April 1, 2010. In this roleat Group level, he is responsible for Holcim US and Aggregate Industries US.
Onne van der Weijde, a Dutch national, born in 1964, holds a bachelor degree and a masters degree in businessadministration. He has been CEO of Ambuja Cements Limited since November 2009. Onne van der Weijde start-ed his career in the Dutch subsidiary Holderfin as international tax consultant in 1990. After four years hemoved to Switzerland to join the Corporate Finance team, followed by a transfer to Australia were he wasresponsible for business development and acquisitions in Asia. He was CFO at Holcim Indonesia from 2001 to2005 and was appointed General Manager of Holcim India Ltd in 2005 and he also assumed the CFO functionat ACC Ltd until 2008. From 2008 till 2009 he assumed responsibility for Sri Lanka and Bangladesh in additionto a board membership of Holcim’s operational companies in India. As of January 1, 2012, Onne van der Weijdehas been appointed Area Manager of Holcim Ltd.
141
Jacques Bourgon, French national, born in 1958. A graduate in mechanical engineering of the Ecole Catholiqued’Arts et Métiers, Lyon, and a postgraduate of Harvard Business School, he joined Holcim in 1990 and occupied sev-eral positions at Holcim Apasco in Mexico, mainly as Plant Manager at Tecomán and later responsible for cementoperations as member of Holcim Apasco Senior Management. He became Head of Corporate Engineering at Holcim Group Support Ltd in Switzerland in mid-2001 and was promoted to Corporate Functional Manager, Cement Manufacturing Services, effective January 1, 2005. Jacques Bourgon is a member of both the Industrial Advisory Board of the Department of Mechanical and Process Engineering and the International Advisory Board of the Swiss Federal Institute of Technology Zurich (ETH Zurich).
Corporate Functional Manager
Rem
uner
atio
n Re
port
142
Financial compensation for governing bodies
of Holcim Ltd
This part of the Annual Report covers the financialcompensation for the Board of Directors and seniormanagement, as well as compensation for formermembers of governing bodies of Holcim Ltd. No pay-ments were made to close persons.
Architecture of the pay-setting process
The Governance, Nomination & Compensation Com-mittee advises and supports the Board of Directors,among other things, in determining the compensa-tion policy and the compensation for the Board ofDirectors and senior management. It holds ordinarymeetings at least three times a year: at the beginningof the year, in the middle of the year and in autumn.
At the beginning of the year, the degree of achieve-ment of objectives for the previous year is assessedand objectives are set for the current year. The CEOmakes proposals for the assessment of the membersof the Executive Committee and assesses the per-formance of the other members of senior manage-ment and the Governance, Nomination & Compensa-tion Committee, decides on the assessment of themember of the Executive Committee and takes due
note of the assessment of the performance of theother members of senior management. Also in themeeting at the beginning of the year, the total finan-cial compensation of the Executive Committee isdetermined by the Governance, Nomination & Com-pensation Committee on a yearly basis, with theBoard of Directors taking due note. On a yearly basis,the CEO determines the financial compensation forthe other members of senior management, with theGovernance, Nomination & Compensation Commit-tee taking due note. In autumn, the financial com-pensation of the Board of Directors for the comingyear is reviewed by the Governance, Nomination &Compensation Committee. If necessary, it proposesadjustments to the Board of Directors.
The Chairman of the Governance, Nomination &Compensation Committee may invite members of the Executive Committee, other officers of the Groupor third parties to attend the meetings. After eachGovernance, Nomination & Compensation Committeemeeting, the Board is informed of topics discussed,decisions taken and recommendations made.
Also at Holcim, it is the employees who create value and
success of the company. Holcim therefore wants to be an
attractive employer in the highly competitive employment
market worldwide. Our compensation system has proven
conducive and robust, and forms a solid basis for compensa-
tion and motivation at the various hierarchical levels.
Remuneration report
143
Compensation policy
Board of Directors
The members of the Board of Directors receive a fixedfee, consisting of a set remuneration in cash andshares in Holcim Ltd. The shares are subject to a five-year sale and pledge restriction period. The Chairmanand Deputy Chairmen of the Board of Directors andChairmen and members of the Audit Committee orthe Governance, Nomination & Compensation Com-mittee receive additional compensation. The Chair-man of the Board of Directors is insured in the pen-sion fund.
Senior management
Senior management of Holcim Ltd includes the Executive Committee, the Area Managers and theCorporate Functional Managers. The annual totalcompensation of senior management comprises abase salary and a variable compensation. Members ofsenior management are insured in the pension fund.The base salary of members of senior management isfixed and is paid in cash.
Benchmarking of the total compensation is carriedout periodically on the basis of the annual compensa-tion reports of benchmark companies. The benchmarkcompanies include four international companies in thesame industry as Holcim with similar geographicalspread and complexity, as well as the ten companieswith the largest market capitalization in Switzerland,therefore with companies of similar size and com - plexity. The benchmarking is based on position andresponsibilities. In 2010, PricewaterhouseCoopers AGwas consulted as external advisor for a fundamentaland detailed review of the compensation system forthe CEO and Executive Committee. The result of thisreview confirmed that the current system servedrobustly during the economic upswing and subse-quent crisis, and also offers a value-oriented compen-sation philosophy for the future.
The variable compensation comprises a Group-relatedand an individual component. Assuming that all targets are achieved as per December 31 of the year,the variable compensation for senior management(excluding the CEO), depending on the function concerned, accounts for between 45 percent and 90 percent of the base salary, and 88 percent for
the CEO. For both components, a “target” amount isdetermined at the beginning of the year. This amountis only paid out if the objectives set are achieved by100 percent and is accordingly variable. Moreover,minimum and maximum objective achievement levels are set for which the respective minimum andmaximum payout factors apply, as detailed below.Payout factors in between are interpolated linearlydepending on objective achievement levels.
The Group-related component depends on the finan-cial results of the Group. If all objectives are achievedat target as per December 31 of the relevant year, itaccounts for senior management (without CEO) inthe average for 61 percent and for the CEO for 56 per-cent of the variable compensation. It is calculated onthe basis of the achieved operating EBITDA and thereturn on invested capital after tax (ROICAT). Bothobjectives are weighted equally, except for Area Man-agers, for whom 60 percent derive from the operatingEBITDA component and 40 percent from the ROICAT
component. For both components, a target objective(which, if achieved, results in 100 percent of the tar-geted variable compensation being paid) and maxi-mum and minimum target levels (which, if achieved,result in 200 percent and 0 percent of the targetedvariable compensation being paid, respectively) areset. The Group component of the variable compensa-tion was set for senior management (without CEO),depending on the function and based on 100 percenttarget objective achievement, between CHF 120,000and CHF 550,000, and for the CEO to CHF 1,100,000.
For the year 2011, the operating EBITDA targets wereset to 5 percent growth versus the previous year (AreaManagers at achievement of the budgeted regionaloperating EBITDA margin) and to 8 percent ROICAT,both on a like-for-like basis. The ROICAT target was set based on the defined weighted average cost ofcapital after tax (WACCAT) of 8 percent. The minimumand maximum payout factors were set at ±20 percentfor the operating EBITDA target (for Area Managers –2.5/+5 percentage points regional operating EBITDAmargin) and at ±3 percentage points for the ROICAT
target. In 2011, the operating EBITDA declined by –0.2 percent and the regional operating EBITDA margin was above budgets by +0.6 percentage pointon average, while ROICAT reached 4.3 percent, all on a
comparable “like-for-like” basis. This corresponds to anachievement level of 79 percent (operating EBITDA;regional operating EBITDA margin 111 percent) respec-tively 0 percent (ROICAT). Senior management (with-out CEO) achieved a payout factor of 44 percent andthe CEO of 40 percent. The Group component is paidin the form of registered shares of the company, sub-ject to a five-year sale and pledge restriction period,and a cash component of approximately 30 percent.Allotted shares are valued at the average market pricein the period from January 1, 2012, to February 15, 2012,and are either taken from treasury stock or are pur-chased from the market.
The individual component for senior management(without CEO), if all objectives are achieved as perDecember 31, amounts to around 38 percent of thevariable compensation, and for the CEO to 44 percent,and depends on the performance of the individual. A range of quantitative and qualitative individualobjectives is set for all members of senior manage-ment depending on their roles and responsibilities.These measurable objectives are weighted and theyrelate to functional performance, strategic objectives,operational objectives and specific project-relatedobjectives. For each objective, depending on targetachievement, an achievement level in percent isdetermined, resulting in a total achievement factorbetween 0 percent and 100 percent. The totalachievement factor is then multiplied by the targetedvariable compensation to determine the amount ofthe individual component. For the year 2011, the indi-vidual component of the variable compensation, at100 percent target achievement, was set for seniormanagement (without CEO), depending on the func-tion concerned, between CHF 90,000 and CHF350,000 and for the CEO to CHF 850,000. The averagetarget objective achievement and the payout factorfor senior management (without CEO) amounted to86 percent and for the CEO to 87 percent, respectively.The individual component is paid in the form ofoptions on registered shares of the company and acash component of around 30 percent. The exerciseprice of the options corresponds to the stock marketprice at the grant date. The options are restricted fora period of three years following the grant date andhave an overall maturity period of eight years. Theoptions are valued in accordance with the Black
Scholes model (input parameters are detailed onpage 219). The company reserves the underlyingshares on the grant date of the options as part oftreasury stock or purchases them from the market.
Pension scheme for senior management
The base salary of senior management is insured in a layered pension plan system, which includes thestate-controlled social security schemes, i.e. AHV/IV,the Holcim Pension Fund, the Holcim SupplementaryPension Fund and the Gemini Pension Fund. With theexception of the Swiss Federal AHV/IV and some localsocial security systems, all pension plans are definedcontribution plans offering benefits payable in theform of retirement, disability, children, survivingspouse and orphans’ pensions or equivalent lumpsums.
The Governance, Nomination & Compensation Com-mittee has reviewed and determined the pensionscheme for senior management as of June 30, 2005,and February 23, 2010. Accordingly, the pensionscheme for Executive Committee members and theCEO is targeted to achieve, at the retirement age of62, based on 10 years of service in senior manage-ment and 20 years of service with the Group, anamount of approximately 40 percent of the averageof the last three annual base salaries, or 50 percentfor other senior managers, taking into account allpension schemes related to current and past occu -pation, including state-controlled social securityschemes. Early or deferred retirement leads to adjust-ments based on actuarial calculations.
In the event of differences between the actual pensionfund benefits and the target pension, the Governance,Nomination & Compensation Committee decides in view of forthcoming retirements about possible contributions in favor of the individual insuranceaccounts. In 2011, contributions have been made inthe amount of CHF 3.6 million. These contributionswere made from the employer’s trust through theprovisions in the Holcim International Pension Trust,and have no impact on the statement of income ofthe Group in the year under review.
Rem
uner
atio
n Re
port
144
Employment contracts for senior management
The contracts of employment of senior managementare concluded for an indefinite period of time andmay be terminated with one year’s notice. Dependingon the length of tenure with the Group, contractsconcluded before 2004 include severance compensa-tion amounting to one annual salary or two annualsalaries in the event of notice being given by thecompany. More recent contracts of employment nolonger include severance compensation.
Upon appointment, members of the Executive Com-mittee may be granted a single allotment of optionson registered shares of the company by the Gover-nance, Nomination & Compensation Committee. It isa requirement that the members have been with theGroup for five years. The options are restricted fornine years and have a maturity period of twelve years.The company reserves the underlying shares as partof treasury stock or purchases them from the market.Single allotments made during recent years are shownon page 218 of this Annual Report.
Options allotted upon appointment to the ExecutiveCommittee are subject to forfeiture without compen-sation, as long as they are restricted, if the ExecutiveCommittee member leaves the Group, except in thecase of retirement, death or disability. Shares andoptions received as part of the annual remunerationmay not be sold or pledged until the end of therestriction period. If a member steps down from senior management, the restriction period for sharesand annually allocated options remains in force without any adjustment in terms of duration.
Compensation for Board of Directors
and senior management
The table shown on page 146 discloses the compensa-tion of the Board of Directors in 2011 in detail andthose of the 14 members of senior management inaggregate as well as the highest amount attributedto a member of the senior management individually.The amounts disclosed are based on the accrual prin-ciple and relate to 2011 performance.
In 2011, twelve non-executive members of the Boardof Directors received a total remuneration of CHF 3.1million (2010: 2.9) in the form of short-term employeebenefits of CHF 2.0 million (2010: 1.8), post-employ-ment benefits of CHF 0.1 million (2010: 0.1), share-based payments of CHF 0.9 million (2010: 0.9) andother compensation of CHF 0.2 million (2010: 0.1).
The total annual compensation for the 14 members of senior management (including CEO) amounted toCHF 31.6 million (2010: 36.7). This amount comprises a base salary and a variable cash compensation ofCHF 18.2 million (2010: 18.2), share-based compensa-tions of CHF 4.4 million (2010: 4.4), employer contri-butions to pension plans of CHF 5.1 million (2010: 5.3)and “Others” compensation of CHF 4.0 million (2010:8.8) which includes, according to the rules of SIXSwiss Exchange, the contributions from the HolcimInternational Pension Trust for the additional financ-ing of retirement benefits in the amount of CHF 3.6million. The CEO received a base salary plus variablecompensation in cash of CHF 2.6 million (2010: 2.5),share-based compensation of CHF 0.8 million (2010:0.8), and employer contributions to pension benefitsof CHF 0.4 million (2010: 0.4). As a result, total com-pensation, before the additional contributions for thefinancing of retirement benefits, amounted to CHF3.8 million (2010: 3.7). Including the additional contributions from the Holcim International PensionTrust in the amount of CHF 1.8 million, based on actu-arial considerations and disclosed under “Others”, the CEO’s total compensation, in accordance with therules of SIX Swiss Exchange, amounted to CHF 5.7 mil-lion (2010: 8.7). In accordance with Art. 663bbis of theSwiss Code of Obligations (transparency law), thebase salary and the variable cash compensation aredisclosed, including foreign withholding tax. Furtherincluded in the contribution to pension plans are theemployers contributions to social security (AHV/IV).
145
Rem
uner
atio
n Re
port
146
1 Compensation for the Board of Directors and senior management is disclosed gross of withholding tax and employee social security contributions. “Other compensation” includes employer contributions to pension plans (state old age and survivors insurance [AHV]/disability insurance [IV], pension funds) as well as a lump sum allowance, long-service benefits, etc. The parameters for the fair value calculation of shares and options allocated in the year under review are disclosed on page 217 under “Share compensation plan”.
2 The shares were valued at the average market price in the period from January 1, 2012, to February 15, 2012, and are subject to a five-year sale and pledge restriction period.
3 Value of the options according to the Black Scholes model at the time of allocation.4 In line with the rules of SIX Swiss Exchange, these amounts include primarily the contributions from the Holcim International Pension Trust in the amount of
CHF 3.6 million (2010: 8.3), which do not affect the statement of income of the Group.5 Including director’s fees from subsidiary companies.6 Member of senior management receiving the highest compensation.7 Includes the expense of the employer’s trust for the additional financing of the pension benefits, according to the rules of SIX Swiss Exchange.
Excluding this contribution, the total compensation for 2011 would have amounted to CHF 3.8 million (2010: 3.7).8 Including executive member of the Board of Directors, CEO.
Compensation Board of Directors/senior management1
Name Position Base salary
Cash Shares2
Rolf Soiron Chairman, Chairman of the Governance, Nomination Number 1,491
& Compensation Committee until May 5, 2011 CHF 595,680 80,000
Beat Hess Deputy Chairman since May 5, 2011 Number 1,491
CHF 190,833 80,000
Erich Hunziker Deputy Chairman since May 5, 2011, Chairman of the Number 1,491
Governance, Nomination & Compensation
Committee since May 5, 2011 CHF 216,667 80,000
Christine Binswanger Member of the Board of Directors Number 1,491
CHF 80,000 80,000
Alexander Gut Member of the Board of Directors since May 5, 2011, Number 870
Member of the Audit Committee since May 5, 2011 CHF 62,500 46,667
Peter Küpfer Member of the Board of Directors, Number 1,491
Chairman of the Audit Committee CHF 180,000 80,000
Adrian Loader Member of the Board of Directors, Member of the Number 1,491
Governance, Nomination & Compensation CHF
Committee since May 5, 2011 91,667 80,000
Andreas von Planta Deputy Chairman until May 5, 2011, Number 1,491
Member of the Audit Committee CHF 189,167 80,000
Thomas Schmidheiny Member of the Board of Directors, Member of the Number 1,491
Compensation for former members of governing bodies
In the year under review, compensation in theamount of CHF 4.2 million (2010: 2.9) was paid toone former member of the Board of Directors andfive former members of senior management.
Shareholdings and loans
Shares and options owned by the Board of Directors
At the end of 2011, non-executive members of theBoard of Directors held a total of 65,930,455 registeredshares in Holcim Ltd. This number comprises privatelyacquired shares and those allotted under participationand compensation schemes. As of the end of 2011,non-executive members of the Board of Directors do not hold any options from compensation and participation schemes.
Until the announcement of market-relevant informa-tion or projects, the Board of Directors, senior man-agement and any employees involved are prohibitedfrom effecting transactions with equity securities orother financial instruments of Holcim Ltd, exchange-listed Group companies or potential target compa-nies (trade restriction period).
149
Number of shares and options held by the Board of Directors1
Name Position Total number Total number
of shares 2010 of call options 2010
Rolf Soiron Chairman, Governance, Nomination &
Compensation Committee Chairman 35,713 –
Andreas von Planta Deputy Chairman 9,508 –
Christine Binswanger Member 2,760 –
Beat Hess Member 200 –
Erich Hunziker Member 9,750 –
Peter Küpfer Member, 37,0002
Audit Committee Chairman 9,749 31,0003
Adrian Loader Member 5,514 –
Thomas Schmidheiny Member 59,568,933 –
Wolfgang Schürer Member 42,454 –
Dieter Spälti Member 21,404 –
Robert F. Spoerry Member 8,179 –
Total Board of Directors
(non-executive members) 59,714,164 68,000
1 From allocation, shares are subject to a five-year sale and pledge restriction period.2 Exercise price: CHF 70; Ratio 1:1; Style: American; Maturity: 19.8.2014.3 Exercise price: CHF 80; Ratio 1:1; Style: American; Maturity: 12.11.2013.
Number of shares and options held by the Board of Directors1
Name Position Total number Total number
of shares 2011 of call options 2011
Rolf Soiron Chairman 36,879 –
Beat Hess Deputy Chairman 880 –
Erich Hunziker Deputy Chairman, Governance, Nomination &
Compensation Committee Chairman 10,916 –
Christine Binswanger Member 3,926 –
Alexander Gut Member 900 –
Peter Küpfer Member, 37,0002
Audit Committee Chairman 10,915 31,0003
Adrian Loader Member 6,680 –
Andreas von Planta Member 10,674 –
Thomas Schmidheiny Member 65,774,099 –
Wolfgang Schürer Member 43,620 –
Dieter Spälti Member 30,966 –
Total Board of Directors
(non-executive members) 65,930,455 68,000
1 From allocation, shares are subject to a five-year sale and pledge restriction period.2 Exercise price: CHF 70; Ratio 1:1; Style: American; Maturity: 19.8.2014.3 Exercise price: CHF 80; Ratio 1:1; Style: American; Maturity: 12.11.2013.
Rem
uner
atio
n Re
port
150
Shares and options owned by senior management
As of December 31, 2011, the executive member of the Board of Directors and the other members of senior management held a total of 296,824 registeredshares in Holcim Ltd. This figure includes both pri -vately acquired shares and those allocated under theGroup’s participation and compensation schemes.
Furthermore, at the end of 2011, senior managementheld a total of 924,382 share options; these arise as aresult of the participation and compensation schemesof various years. Options are issued solely on registeredshares of Holcim Ltd. One option entitles the holder tosubscribe to one registered share of Holcim Ltd.
1 From allocation, shares are subject to a five-year and options to a three-year and nine-year sale restriction period, respectively.
Number of shares and options held by the senior management1
Name Position Total number Total number
of shares 2010 of call options 2010
Markus Akermann Executive Member of the Board of Directors, CEO 89,429 261,916
Urs Böhlen Member of the Executive Committee 15,943 69,801
Patrick Dolberg Member of the Executive Committee 10,505 53,609
Paul Hugentobler Member of the Executive Committee 73,511 105,704
Thomas Knöpfel Member of the Executive Committee 34,284 99,896
Benoît-H. Koch Member of the Executive Committee 28,239 94,133
Roland Köhler Member of the Executive Committee, CEO HGRS 7,411 53,693
Theophil H. Schlatter Member of the Executive Committee, CFO 59,627 120,883
Ian Thackwray Member of the Executive Committee 1,589 33,550
Javier de Benito Area Manager 17,095 18,885
Andreas Leu Area Manager 9,455 9,124
Aidan Lynam Area Manager 1,226 0
Bernard Terver Area Manager 18,132 20,960
Jacques Bourgon Corporate Functional Manager 7,202 16,783
Stefan Wolfensberger Corporate Functional Manager 5,386 17,894
Total senior management 379,034 976,831
Number of shares and options held by the senior management1
Name Position Total number Total number
of shares 2011 of call options 2011
Markus Akermann Executive Member of the Board of Directors, CEO 93,996 290,096
Thomas Aebischer Member of the Executive Committee, CFO 3,417 33,550
Urs Böhlen Member of the Executive Committee 18,227 82,319
Patrick Dolberg Member of the Executive Committee 12,789 66,619
Paul Hugentobler Member of the Executive Committee 75,796 119,769
Benoît-H. Koch Member of the Executive Committee 19,383 104,763
Roland Köhler Member of the Executive Committee, CEO HGRS 9,323 65,581
Andreas Leu Member of the Executive Committee 10,434 46,773
Ian Thackwray Member of the Executive Committee 2,828 45,786
Javier de Benito Area Manager 19,123 21,855
Urs Fankhauser Area Manager 3,319 –
Aidan Lynam Area Manager 2,625 3,675
Bernard Terver Area Manager 19,262 23,600
Jacques Bourgon Corporate Functional Manager 6,302 19,996
Total senior management 296,824 924,382
151
Movements in the number of share options outstand-ing held by senior management are as follows:
Number1 Number1
2011 2010
January 1 976,831 890,685
Increase due to change in senior management 0 20,960
Decrease due to retirements 238,673 133,545
Granted and vested (individual component of variable compensation) 119,124 131,631
Granted and vested (single allotment) 67,100 67,100
Forfeited 0 0
Exercised 0 0
Lapsed 0 0
December 31 924,382 976,831
Of which exercisable at the end of the year 331,004 215,650
Option grant date Expiry date Exercise price1 Number1
2002 2014 CHF 67.15 201,300
2003 2012 CHF 33.85 45,910
2003 2015 CHF 67.152 33,550
2004 2013 CHF 63.35 34,341
2004 2016 CHF 67.152 33,550
2005 2014 CHF 74.54 71,423
2006 2014 CHF 100.69 58,573
2007 2015 CHF 125.34 49,674
2008 2016 CHF 104.34 71,083
2008 2020 CHF 67.152 67,100
2009 2017 CHF 38.26 385,124
2010 2018 CHF 71.15 131,631
2010 2022 CHF 75.40 33,550
2010 2022 CHF 81.45 33,550
2011 2019 CHF 67.15 149,763
2011 2023 CHF 71.50 67,100
Total 1,467,222
The share options outstanding held by senior management(including former members) at year-end 2011 have the follow-ing expiry dates and exercise prices:
1 Adjusted to reflect former share splits and/or capital increases.2 Valued according to the single allocation in 2002.
1 Adjusted to reflect former share splits and/or capital increases.
In 2011, two new Executive Committee members havebeen granted in total 67,100 options.
Rem
uner
atio
n Re
port
152
Loans granted to members of governing bodies
As at December 31, 2011, there were no loans out-standing to members of senior management. Therewere no loans to members of the Board of Directorsor to parties closely related to members of governingbodies.
Other transactions
As part of the employee share purchase plan, Holcimmanages employees’ shares. It sells and purchasesHolcim Ltd shares to and from employees and on theopen market. In this context, the company purchasedHolcim Ltd shares of CHF 2.1 million (2010: 0.3) at the stock market price from members of seniormanagement.
No compensation was paid to parties closely relatedto members of the governing bodies.
153
Financial Information 2011 Holcim Ltd
100 years ofStrength. Performance. Passion.
Finan
cial
Info
rmat
ion
154
This discussion and analysis of the Group’s financial condition and results of operations should be read in conjunction with the shareholders’ letter, the individual reports for the Group regions, the consolidated financial statements and the notes thereto. The quarterly reports contain additional information on the Group regions and business performance.
OverviewIn many emerging markets the construction industry reported steady growth throughout the year. Volumes were up in the product segments cement, aggregates, and ready-mix concrete, most notably in the emerging markets of Asia and Latin Amer-ica. Once again, broad geographical diversification proved to be a cornerstone of the Group’s success.
Although Holcim succeeded in raising selling prices, the increase was not enough to completely cover the inflation-related cost increases in energy, transportation, and raw materials. The fac-tor with the greatest negative impact on the results was the strength of the Swiss franc. On a like-for-like basis operating EBITDA was only slightly lower than in the previous year.
Despite the commissioning of net new cement capacity of 3.6 million tonnes in 2011, in addition to 1.7 million tonnes in the final quarter of 2010, and various non-recurring expenses, on a like-for-like basis, fixed costs, excluding CO2 transactions, increased by a moderate CHF 367 million compared to the pre-vious year. Owing to this result and the increase in distribution costs, the operating EBITDA margin fell from 20.8 percent in 2010 to 19.1 percent in the year under review.
The substantial appreciation of the Swiss franc against the most important foreign currencies for the Group put consider-able pressure on the 2011 consolidated statement of income. Year-on-year, the currency effect reduced net sales by 12.5 per-cent, operating EBITDA by 12.3 percent, and cash flow from operating activities by 10.5 percent. As in the previous year, there were only marginal changes in the scope of consolidation.
In the past 12 months, net financial debt rose slightly to CHF 11,549 million from CHF 11,363 million.
Management discussion and analysis 2011
2011 was characterized by a growing demand for building materials,
particularly in the emerging markets. The Group sold greater volumes of
cement, aggregates, and ready-mix concrete. Although the strength of
the Swiss franc and inflation-related cost increases put pressure on oper-
ating EBITDA, it was on a like-for-like basis only marginally lower than
in the previous year. Cash flow from operating activities was lower than
in the previous year due to the strong Swiss franc and tax credits received
in 2010.
MD
& A
155
Operating results fourth quarter
Sales volumes and principal key figures
Oct.–Dec.
2011
Oct.–Dec.
2010
±% ±%
like-for-
like
Sales of cement in million t 36.2 33.9 +6.7 +6.3
– of which mature markets in million t 7.5 7.5 +0.6 +1.0
– of which emerging markets in million t 28.7 26.4 +8.6 +7.9
Sales of aggregates in million t 42.6 39.1 +8.9 +7.2
– of which mature markets in million t 34.5 32.0 +7.6 +6.4
– of which emerging markets in million t 8.1 7.1 +15.1 +10.6
Sales of ready-mix concrete in million m3 12.2 11.5 +6.5 +3.0
– of which mature markets in million m3 6.8 6.0 +12.7 +6.1
– of which emerging markets in million m3 5.4 5.5 –2.1 –0.5
Sales of asphalt in million t 2.7 2.8 –4.4 –4.4
Net sales in million CHF 5,284 5,085 +3.9 +13.1
– of which mature markets in million CHF 2,577 2,462 +4.7 +8.6
– of which emerging markets in million CHF 2,707 2,623 +3.2 +17.3
Operating EBITDA in million CHF 987 936 +5.3 +15.5
– of which mature markets in million CHF 336 330 +1.6 +5.0
– of which emerging markets in million CHF 651 606 +7.5 +21.2
Operating EBITDA margin in % 18.7 18.4
Operating profit in million CHF 180 441 –59.2 –55.6
Net (loss) income in million CHF (322) 398 –180.8 –197.6
Net (loss) income – shareholders of Holcim Ltd –
in million CHF (438) 307 –242.9 –270.4
Cash flow from operating activities in million CHF 1,823 1,606 +13.5 +28.4
The quarterly key figures are subject to seasonal fluctuations, particularly in Europe and North America. Hence, depending on the local weather conditions, there may be variations between the quarters.
In the fourth quarter, cement deliveries rose by 6.7 percent or 2.3 million tonnes compared to the same quarter in the previous year. The largest increases were posted in the Group regions Asia Pacific and Latin America. Sales of aggregates also advanced in this period, rising by 8.9 percent or 3.5 million tonnes. Europe and North America accounted for the largest increases. Sales of ready-mix concrete rose in all regions with the exception of Asia Pacific. The overall increase amounted to 6.5 percent or 0.7 million cubic meters. The major contributions were posted in North America and Europe.
Finan
cial
Info
rmat
ion
156
Quarterly results fourth quarter
Million CHF Oct.–Dec.
2011
Oct.–Dec.
2010
±% ±%
like-for-
like
Net sales by region
Europe 1,431 1,399 +2.3 +7.4
North America 836 791 +5.6 +8.6
Latin America 843 855 –1.4 +12.3
Africa Middle East 254 249 +2.0 +9.5
Asia Pacific 2,072 1,938 +6.9 +19.6
Corporate/Eliminations (152) (147)
Total Group 5,284 5,085 +3.9 +13.1
Operating EBITDA by region
Europe 224 190 +17.6 +21.7
North America 82 94 –12.4 –9.4
Latin America 226 237 –4.9 +7.1
Africa Middle East 75 73 +2.7 +8.9
Asia Pacific 437 381 +14.7 +28.3
Corporate/Eliminations (56) (39)
Total Group 987 936 +5.3 +15.5
Cash flow
Cash flow from operating activities 1,823 1,606 +13.5
Net capital expenditures on property, plant and equipment
to maintain productive capacity and to secure competitiveness (324) (186) –75.3
Investments in property, plant and equipment for expansion (304) (322) +5.9
Financial investments net (208) (36) –506.2
Cash flow from investing activities (836) (542) –54.1
In the fourth quarter net sales increased by 3.9 percent to CHF 5,284 million compared to the same quarter in the previous year, despite the substantial negative exchange rate impact of 10 percent or CHF 508 million. On a like-for-like basis there was an increase of 13.1 percent. This was driven primarily by devel-opments in the Group region Asia Pacific, where net sales on a like-for-like basis rose by 19.6 percent in the fourth quarter. All other regions also recorded higher net sales on a like-for-like basis.
In the fourth quarter, operating EBITDA climbed by 5.3 percent or CHF 50 million compared to the same quarter in the previous year, despite the negative exchange rate impact of 10.5 percent or CHF 98 million. On a like-for-like basis, primarily due to Group regions Asia Pacific and Europe, an increase of 15.5 percent was reported. In Europe the sale of CO2 emission certificates had a positive impact of CHF 52 million on operating EBITDA in the fourth quarter (Q4 2010: 20). In the Group region Asia Pacific operating EBITDA rose by 28.3 percent on a like-for-like basis. The operating EBITDA margin increased to 18.7 percent in the fourth quarter of 2011 from 18.4 percent in the fourth quarter of 2010.
MD
& A
157
cement in Latin America strongly increased by 6.7 percent or 1.5 million tonnes. Primarily due to fierce competition in Morocco, cement sales in the Group region Africa Middle East declined by 2.1 percent or 0.2 million tonnes. Asia Pacific bene-fited from additional production capacity in India and solid macroeconomic conditions in Indonesia. The result was an increase in cement sales volumes of 5.8 percent or 4.1 million tonnes.
Deliveries of aggregates increased by 9.6 percent to 173 million tonnes. On a like-for-like basis, the increase amounted to 5.6 percent or 8.9 million tonnes. Growth was driven primarily by demand in Europe (increase of 2.5 million tonnes) and North America (increase of 0.9 million tonnes). Acquisitions in both of these regions increased sales volumes further (total increase
In the fourth quarter, cash flow from operating activities increased by CHF 217 million or 13.5 percent compared to the final quarter of 2010. The increase is primarily due to the higher inflows resulting from changes in net working capital.
Operating results
Sales volumes and principal key figures
Jan.–Dec.
2011
Jan.–Dec.
2010
±% ±%
like-for-
like
Sales of cement in million t 144.3 136.7 +5.6 +5.5
– of which mature markets in million t 31.4 31.5 –0.1 –0.1
– of which emerging markets in million t 112.9 105.2 +7.3 +7.1
Sales of aggregates in million t 173.0 157.9 +9.6 +5.6
– of which mature markets in million t 141.4 131.8 +7.3 +3.3
– of which emerging markets in million t 31.7 26.1 +21.1 +17.6
Sales of ready-mix concrete in million m3 48.4 45.9 +5.4 +2.2
– of which mature markets in million m3 27.0 25.5 +6.2 +0.0
– of which emerging markets in million m3 21.3 20.4 +4.4 +4.9
Sales of asphalt in million t 10.3 10.6 –2.8 –2.8
Net sales in million CHF 20,744 21,653 –4.2 +7.5
– of which mature markets in million CHF 10,132 10,656 –4.9 +2.9
– of which emerging markets in million CHF 10,612 10,997 –3.5 +12.0
Operating EBITDA in million CHF 3,958 4,513 –12.3 –0.2
– of which mature markets in million CHF 1,280 1,522 –15.9 –9.6
– of which emerging markets in million CHF 2,678 2,991 –10.5 +4.5
Operating EBITDA margin in % 19.1 20.8
Operating profit in million CHF 1,933 2,619 –26.2 –14.7
Net income in million CHF 682 1,621 –57.9 –52.3
Net income – shareholders of Holcim Ltd – in million CHF 275 1,182 –76.7 –74.9
Cash flow from operating activities in million CHF 2,753 3,659 –24.8 –14.0
Sales volumesIn the 2011 financial year, the increase in cement sales totalled 7.6 million tonnes, which corresponds to a growth of 5.6 percent to 144.3 million tonnes. On a like-for-like basis, the increase amounted to 5.5 percent or 7.5 million tonnes. In Europe, despite the challenging market situation in Spain, sales volumes increased by 0.5 million tonnes or 1.9 percent, primarily due to the contributions of France, Romania, and Russia. The Russian Group company benefited from expanding cement consump-tion in Russia, which was boosted by major infrastructure proj-ects, and the increase in production capacity at the Shurovo cement plant. Cement sales in the Group region North America increased by 2.9 percent or 0.3 million tonnes. The moderate economic recovery was barely evident in the US construction sector. Due to numerous infrastructure projects, sales of
Finan
cial
Info
rmat
ion
158
in Europe: 5.4 million tonnes; total increase in North America: 4.3 million tonnes). Sales of aggregates rose by 2.3 million tonnes in Latin America and by 3.3 million tonnes in Asia Pacific.
Sales of ready-mix concrete grew by 5.4 percent to 48.4 million cubic meters. On a like-for-like basis, the increase amounted to 2.2 percent or 1 million cubic meters. Volumes rose in all Group
regions, with North America reporting the largest increase of 25.4 percent, which corresponds to a gain of 1.4 million cubic meters. On a like-for-like basis, sales volumes in North America were unchanged from the previous year. Volumes in Latin America expanded by 0.5 million cubic meters or 5.2 percent and in Asia Pacific by 0.4 million cubic meters or 2.8 percent.
Net sales
Net sales by region
Million CHF Jan.–Dec.
2011
Jan.–Dec.
2010
±% ±%
like-for-
like
Europe 6,122 6,535 –6.3 +3.1
North America 2,987 3,240 –7.8 +1.3
Latin America 3,310 3,442 –3.8 +11.1
Africa Middle East 959 1,098 –12.6 –0.3
Asia Pacific 8,001 7,958 +0.5 +14.2
Corporate/Eliminations (636) (620)
Total Group 20,744 21,653 –4.2 +7.5
For the year under review, net sales fell by 4.2 percent to CHF 20,744 million mainly due to negative currency impacts. On a like-for-like basis net sales increased by 7.5 percent or CHF 1.6 billion. In Europe net sales increased by 3.1 percent on a like-for-like basis, primarily owing to higher net sales in France and Russia. However, these increases were overshadowed by the decline in Spain, where the situation for construction markets was challenging. The Group region North America increased net sales by 1.3 percent on a like-for-like basis. In Latin America, the increase in net sales totalled 11.1 percent on a like-for-like basis, which is primarily attributable to Argentina and Colombia. Apart from inflation-related price increases in Argentina, a 5.1 percent increase in cement volumes also con-tributed to the growth in net sales. Holcim Colombia was able to benefit from rising demand for building materials, particu-larly in the infrastructure segment and the residential and industrial construction sectors. On a like-for-like basis the Group region Asia Pacific posted impressive growth of 14.2 per-cent. The two Indian companies benefited from the country’s solid economic growth, additional production capacity, and substantial growth in sales volumes. Holcim Australia profited from rapid expansion in the mining sector. Indonesia continued to experience strong economic growth.
There were only minor changes in net sales by Group region compared to the previous year. Europe’s contribution shrank from 29.3 to 28.6 percent as did North America’s from 14.6 to 14.0 percent. By contrast, net sales of Asia Pacific increased from 35.7 to 37.4 percent.
The emerging markets accounted for a slightly larger propor-tion of total net sales than the mature markets. The ratio was 51.2 percent (2010: 50.8) to 48.8 percent (2010: 49.2).
Energy costsEnergy costs consist of the expenses related to fuel and elec-tricity. Since 2007 the energy costs involved in producing a tonne of cement have remained relatively constant. There are two major differences between developments in our energy costs and those in energy market prices. Firstly, since the eco-nomic turbulences in late 2008, market prices have for the most part risen steadily, while due to strengthening of the Swiss franc, Holcim’s energy costs have marginally changed. Without the strengthening of the Swiss franc, Holcim’s energy costs would have risen by 10 percent year-on-year in 2011.
MD
& A
159
Secondly, Holcim’s energy prices are subject to much less, and sometimes delayed, volatility than market prices, as was partic-ularly evident in 2008. This is attributable to the fact that around 60 percent of the fuel consumed is coal, of which only about half is bought on the international market. The other half is bought locally. The price trends shown in the adjacent chart reflect prices in the international markets, which are more volatile than prices in local markets. Moreover, in some countries the government directly influences the latter. In addi-tion, fuel stocks result in time lags. Thus, changes in market prices do not immediately impact the expense recorded in the statement of income.
(CHF)1
Barre
l
(USD)2
(CHF)1
free on board,
(CHF)1
(USD)3
Operating EBITDA
Operating EBITDA by region
Million CHF Jan.–Dec.
2011
Jan.–Dec.
2010
±% ±%
like-for-
like
Europe 930 1,045 –11.0 –3.8
North America 346 460 –24.9 –15.5
Latin America 888 999 –11.2 +2.9
Africa Middle East 312 359 –13.0 –1.1
Asia Pacific 1,700 1,820 –6.6 +6.8
Corporate/Eliminations (219) (170)
Total Group 3,958 4,513 –12.3 –0.2
In the year under review there was a primarily currency-related fall in operating EBITDA of 12.3 percent. The decrease on a like-for-like basis was 0.2 percent or CHF 11 million. The decrease in the Group region Europe was 3.8 percent or CHF 39 million on a like-for-like basis. Much of this decline is accounted for by the year-on-year drop in sales of CO2 emission certificates, which were additionally sold at lower prices, but also by the marked falls in prices and volumes, and tighter government austerity measures in Eastern Europe. Despite higher sales volumes, all segments in the Group region North America were affected by falling prices and higher energy and distribution costs in the USA. Thus in 2011, operating EBITDA fell by 15.5 percent or
CHF 71 million on a like-for-like basis compared to the previous year. On the other hand, in Latin America, operating EBITDA rose by 2.9 percent or CHF 29 million on a like-for-like basis. Colombia and Argentina in particular made positive contribu-tions. Economic growth in Brazil was lower than in the previous year. Coupled with more rapidly rising costs, this had a negative impact on operating EBITDA. Owing to higher fuel costs and lower sales of cement and aggregates, operating results for the Group region Africa Middle East slipped by 1.1 percent or CHF 4 million on a like-for-like basis. However, in Asia Pacific, Holcim was able to generate 6.8 percent or CHF 124 million more operating EBITDA on a like-for-like basis. In particular
Finan
cial
Info
rmat
ion
160
Holcim Indonesia, Holcim Australia and Ambuja Cements in India reported very good results. Indonesia is experiencing a building boom, which fueled higher volumes and prices. Opera-tions in the Philippines were impacted by the government’s short-term postponement of major capital projects. To ensure appropriate Corporate Governance procedures, the tendering and award process was slowed down; and at the same time, there was a marked increase in pricing pressures and energy costs.
The shift in the regional weighting of operating EBITDA was most marked between North America and Asia Pacific. In 2011 North America accounted for 8.3 percent of operating EBITDA (2010: 9.8) and Asia Pacific 40.7 percent (2010: 38.9).
In 2011 the emerging markets’ share of operating EBITDA at 67.7 percent (2010: 66.3) was higher than that of the mature markets, which contributed 32.3 percent (2010: 33.7) of the overall result.
Operating EBITDA marginFor the year as a whole, the Group operating EBITDA margin decreased by 1.8 percentage points to 19.1 percent. On a like-for-like basis it fell by 1.5 percentage points. This is attributed pri-marily to the fact that while on the one hand Holcim was able to sharply increase revenues, on the other it could not increase operating EBITDA to the same extent because of inflation-driven cost increases. The reduction of 0.8 percent points in Europe is largely attributable to the smaller number of CO2 certificates sold at a lower market price. In North America, US prices which stabilized at a low level, and rising distribution costs reflecting changes in transport routes, resulted in the operating EBITDA margin falling by 2.6 percentage points. Latin America reported a decline of 2.2 percentage points in the operating EBITDA mar-gin largely on account of rising fuel costs coupled with slowing sales increases in Brazil. The Group region Africa Middle East reported a steady margin year-on-year. In the Group region Asia Pacific the operating EBITDA margin fell by 1.6 percentage points primarily due to higher costs for fuel and transport services.
In the cement segment, the operating EBITDA margin fell from 26.9 percent in previous year to 24.3 percent (Holcim target: > 33 percent). All Group regions reported a margin reduction in this segment. In the aggregates segment the margin edged down by just 0.6 percent to 20.7 percent (Holcim target: > 27 percent). The situation was similar in the other construction materials and services segment, where the margin declined by a modest 0.3 percentage points to 2.5 percent (Holcim target: > 8 percent). In this segment only the Group region Africa Middle East reported a sizable increase of 4.2 percentage points.
Operating profitIn 2011, operating profit fell by 26.2 percent to CHF 1,933 million. On a like-for-like basis the development in operating profit was a negative 14.7 percent, or a decrease of CHF 385 million. The decrease resulted mainly from the impairments of property, plant and equipment, and goodwill announced in January 2012 (see Notes 23 and 24 on pages 202 – 204).
Group net incomeGroup net income declined by 57.9 percent to CHF 682 million. This was impacted by the lower operating profit, the write-down of the investment in AfriSam which increased financial expenses (see Note 13 on page 196), and the lower share of profit of associates in 2011.
In 2011, the effective tax rate stood at 39.7 percent (2010: 27.5). The increase is primarily attributable to the non-tax-effective impairments of investments, goodwill and property, plant and equipment recognized in the fourth quarter of 2011.
MD
& A
161
Financing activities, investments and liquidity
Cash flow
Million CHF Jan.–Dec.
2011
Jan.–Dec.
2010
±%
Cash flow from operating activities 2,753 3,659 –24.8
Net capital expenditures on property, plant and equipment
to maintain productive capacity and to secure competitiveness (752) (410) –83.5
Free cash flow 2,001 3,249 –38.4
Investments in property, plant and equipment for expansion (886) (1,182) +25.0
Financial (in)divestments net (154) 230 –166.5
Dividends paid (713) (719) +0.8
Financing surplus 248 1,578 –84.3
Cash flow from financing activities (excl. dividends) (653) (2,521) +74.1
Decrease in cash and cash equivalents (405) (943) +57.1
Cash flow from operating activitiesIn the year under review, cash flow from operating activities fell by CHF 906 million or 24.8 percent to CHF 2,753 million. Currency fluctuations had a negative impact of CHF 384 million on cash flow. On a like-for-like basis, there was a decrease of CHF 511 million or 14 percent. This is a consequence in particu-lar of the one-time tax credits received in 2010 by Holcim (US) and both Indian Group companies (see note 14 on page 197). Other factors that negatively impacted cash flow from operat-ing activities included lower inflows from changes in net work-ing capital than in the previous year, and greater pressure on the operating EBITDA margin. In the year under review the cash flow margin was 13.3 percent (2010: 16.9).
Investment activitiesIn the financial year under review, cash flow used in investing activities increased by CHF 429 million to CHF 1,791 million. In 2011, Holcim invested CHF 886 million in expansion and CHF 752 million in maintenance of production plants and other fixed assets. Compared to the previous year’s total of CHF 1,592, this represents an increase of 2.8 percent. Maintenance activi-ties and investments in rationalizing and improving processes in environmental and occupational health and safety measures amounted to gross CHF 890 million (2010: 639). Investments in property, plant and equipment for expansion mainly include projects in emerging markets such as India and Russia, as well as in Australia. Holcim continued to pursue the strategic expan-sion program in existing and new markets. All in all, in the year under review, 3.6 million net tonnes of cement capacity was commissioned, most of it in the growth market India, with smaller amounts in Latin America and Europe. Equipped with modern technology, these capacity investments are expected to further improve the Group’s overall cost efficiency and
environmental impact. Currently the more important invest-ment projects include the expansion of aggregates capacity in Australia, the systematic expansion of capacities in the emerging market of India, the expansion of cement plants in Azerbaijan and Morocco, and the construction of new cement plants in Brazil and Indonesia.
Key investment projectsAustralia – expansion of aggregates capacityIn 2011, Holcim began work south-west of Sydney on what will become the company’s largest project in the field of aggregates. Known as Lynwood Quarry, the site has adequate reserves to cover the long-term supply of one of Australia’s largest markets. Due to the possibility of transporting the raw material by rail, the quarry, together with the distribution center in West Sydney will offer one of the most cost-effective and sustainable solu-tions of this kind. The plant is due to be commissioned in 2014. With reserves estimated to guarantee production for several decades, the site is expected to enable Holcim to strengthen its integrated market position in Sydney and New South Wales. India – expansion of market positionIn India both ACC and Ambuja Cements continue to expand capacity. A combined additional capacity of 3.7 million tonnes was commissioned in 2011 in the eastern and south-western regions of India, which offer favorable prospects in terms of price. In the eastern region, another 3.5 million tonnes capacity is expected to be commissioned in 2015. These capacities are expected to help improve efficiency and competitiveness in the rapidly growing Indian market and strengthen Holcim’s pres-ence in the country.
Finan
cial
Info
rmat
ion
162
Russia – capacity expansion at Shurovo plantThe Shurovo plant, the cornerstone of Holcim’s strategic posi-tioning in Russia, was commissioned in 2011. With an annual production capacity of 2.1 million tonnes of cement, the plant is equipped to use alternative fuels and raw materials and sets new standards for the industry in Russia for environmental aspects, health and safety. This modern production site strengthens Holcim’s ability to participate in Russia’s economic growth.
Azerbaijan – modernizing the Garadagh Cement plantAs part of its regional expansion strategy, Holcim is creating a technologically advanced cement plant in Azerbaijan. To be fully commissioned in the first quarter of 2012, it will have a cement capacity of 1.7 million tonnes. The modernization proj-ect includes replacing the outmoded wet process with a more efficient dry process kiln line. Goals include higher production volumes, lower fuel and energy consumption, improved environ-mental compatibility by reducing emissions, and better occu-pational health and safety.
Morocco – rationalizationWork on doubling clinker capacity at the Fez site is proceeding according to plan. When commissioned in the third quarter of 2012, the plant’s clinker capacity will increase by 0.4 million tonnes. One expected result of the investment is savings in the field of logistics, which should reduce production costs and improve Holcim’s positioning in an important growth market.
Brazil – capacity expansionTo keep up with Brazil’s dynamic market development, a second kiln line will be installed at Barroso. The facility is due to be commissioned in 2014. This investment should enable Holcim Brazil to increase its capacity by 2.6 million tonnes to 7.1 million tonnes and better position itself to meet growing demand for building materials in the country.
Indonesia – capacity expansionTo meet rising domestic demand and optimize logistics, Holcim decided to build a new cement plant with an annual production capacity of 1.7 million tonnes in Tuban, East Java. Clinker pro-duction should come on stream in December 2013, while com-missioning of the cement production and shipping facilities is scheduled for the first quarter of 2013. By leveraging a strong brand presence and optimizing the costs of logistics and produc-tion, this investment is expected to position Holcim Indonesia to participate in the country’s robust economic growth.
Group ROICBT
The Group’s return on invested capital before tax (ROICBT) measures the profitability of the capital employed. It is regarded as a measure of operating profitability and is calculated by expressing EBIT (earnings before interest and taxes) as a per-centage of the average invested capital (excluding cash and marketable securities).
Group ROICBT
Million CHF
EBIT1 Invested capital ROICBT in %
Current
year
Previous
year
Average
2011 2,235 33,426 35,040 34,233 6.5
2010 3,054 35,040 38,438 36,739 8.31 Earnings before interest and taxes.
Owing to the decline in EBIT, the ROICBT fell in the year under review from 8.3 percent to 6.5 percent. Investment activity, which normally starts to generate EBIT after a construction phase of two to three years, is charged to invested capital immediately.
Financing activityInvestments were largely funded out of cash flow from oper-ating activities. Additional debt capital was used to refinance or repay existing borrowings. Transactions in 2011 included, among others, the following:
CHF 425 million Holcim Overseas Finance Ltd. bond with a fixed
interest rate of 3.375%, term 2011–2021.
EUR 2,000 million Syndicated credit facility with term 2011–2016
and two one-year extension options for
the purpose of early refinancing of the
existing syndicated credit facility with maturity
in May 2013.
MD
& A
163
Net financial debt
Although cash flow from operating activities was higher than
cash outflows for investment activities, net financial debt
increased from CHF 11,363 million to CHF 11,549 million, primarily
due to the dividend payment to the shareholders of Holcim Ltd
and the increase of participations in Group companies.
At the end of 2011, the ratio of net financial debt to shareholders’
equity (gearing) was 58.8 percent (2010: 53.8). Gearing increased
primarily as a consequence of negative currency translation
effects on shareholders’ equity.
Financing profile
Holcim has a solid financial profile. 67 percent of the financial
liabilities are financed through various capital markets (see
overview of all outstanding bonds and private placements on
pages 208 and 209) and 33 percent through banks and other
lenders. There are no major positions with individual lenders.
The company explicitly favors a very broad investor base and
continues to expand it.
At 4.0 years, the average maturity of financial liabilities remained
within the target zone. The Group’s maturity profile is widely
spread with a large proportion of mid to long-term financing.
To optimize the Group’s maturity profile and make efficient use
of the Group’s cash and cash equivalents, Holcim Ltd and Holcim
Overseas Finance Ltd. purchased own bonds for an amount
of CHF 305 million in 2011 which were due to mature within the
next 18 months.
One of the Group’s objectives is the maintenance of a favorable
credit rating, as evidenced by the Group’s focus on financial
targets required for a solid investment grade rating. Detailed
information on the credit ratings can be found on pages 52,
183 and 184 of this Annual Report. At December 31, 2011, the
ratio of funds from operations (FFO) to net financial debt was
26.4 percent (Holcim target: >25 percent) and that of net finan-
cial debt to EBITDA was 2.7 (Holcim target: <2.8). The EBITDA net
interest coverage excluding the value adjustments announced
in January 2012 was 6.4x1 (Holcim target: >5x) and the EBIT net
interest coverage, also excluding the value adjustments
announced in January 2012 was 3.9x2 (Holcim target: >3x).
Compared with the previous year, there was no change in the
average interest rate of 4.4 percent on Holcim’s financial liabili-
ties as at December 31, 2011. The proportion of fixed-rate debt
was reduced to 53 percent (2010: 58).
3
3
1 Including the value adjustments announced in January 2012, the EBITDA net interest coverage was 4.2x.2 Including the value adjustments announced in January 2012, the EBIT net interest coverage was 2.2x.
402.indd 163 27.03.2012 11:04:25
Finan
cial
Info
rmat
ion
164
LiquidityTo secure liquidity, the Group held liquid funds of CHF 2,946 million at December 31, 2011 (2010: 3,386), whereby liquidity was intentionally reduced compared to the previous year. Most of this cash is invested in term deposits held with a large number of banks on a broadly diversified basis. The counterparty risk is constantly monitored on the basis of clearly defined principles as part of the risk management process. As of December 31, 2011, Holcim also had unutilized credit lines amounting to CHF 6,674 million (2010: 8,867) (see also page 206). This includes unused, committed credit lines of CHF 4,319 million (2010: 6,378). Existing borrowings1 at December 31, 2011 of CHF 2,808 (2010: 2,318) maturing in the next 12 months are more than covered by existing cash and cash equivalents and unutilized, committed credit lines.
In the financial year under review, the USD 3,500 million syndi-cated credit facility with a term of 2007–2013 was early refi-nanced with a new EUR 2,000 million syndicated loan with a term of 2011–2016 and two one-year extension options. The main reasons for early refinancing were favorable refinancing conditions, optimizing the maturity profile and pending regu-latory changes in the banking world (Basel III). 16 lenders par-ticipated in the transaction. The banking syndicate includes both international and national lenders from Europe, Asia, Australia and America, which underscores the global presence and standards of Holcim’s banking businesses. The credit facil-ity allows Holcim to finance any liquidity needs at any time in the world’s leading currencies.
Currency sensitivityThe Group operates in around 70 countries, generating the substantial portion of its results in currencies other than the Swiss franc. Only about 4 percent of net sales are generated in Swiss francs.
Foreign-currency volatility has little effect on the Group’s oper-ating profitability. As the Group produces a very high propor-tion of its products locally, most sales and costs are incurred in the respective local currencies. The effects of foreign exchange movements are therefore largely restricted to the translation of local financial statements for the consolidated statement of income. In the last financial year these were, on balance, nega-tive. Because a large part of the foreign capital is financed with matching currencies in local currency, the effects of the foreign currency translation of local balance sheets for the consolidated balance sheet have not, in general, resulted in significant distor-tions in the consolidated balance sheet.
The following sensitivity analysis presents the currency effect of the euro, pound sterling, US dollar and the Indian rupee on selected key figures of the consolidated financial statements. The sen sitivity analysis only factors in effects that result from the conversion of local financial statements into Swiss francs (trans lation effect). Currency effects from transactions con-ducted locally in foreign currencies are not included in the analysis. Given the local nature of business activities, this type of transaction is seldom respectively individually hedged.
The following table shows the effects of a hypothetical 5 per-cent depreciation in the respective foreign currency versus the Swiss franc:
Sensitivity analysis
Million CHF 2011 EUR GBP USD Latin
American
basket
(MXN, BRL,
ARS, CLP)
INR Asian
basket
(AUD, IDR,
PHP, THB)
Actual figures Assuming a 5% lower exchange rate the impact would be as follows:
Net sales 20,744 (139) (88) (110) (114) (174) (168)
from operating activities 2,753 (7) (4) (19) (13) (32) (21)
Net financial debt 11,549 (88) (31) (121) (32) 38 (129)
1 Current financial liabilities adjusted for short-term drawings under long-term committed credit lines of CHF 12 million.
Cons
olid
ated
Fin
ancia
l Sta
tem
ents
165
Consolidated statement of income of Group Holcim
Million CHF Notes 2011 2010
Net sales 5, 6 20,744 21,653
Production cost of goods sold 7 (12,216) (12,379)
Gross profit 8,528 9,274
Distribution and selling expenses 8 (5,226) (5,278)
Administration expenses (1,369) (1,377)
Operating profit 1,933 2,619
Other income 11 69 7
Share of profit of associates 22 149 245
Financial income 12 191 262
Financial expenses 13 (1,210) (897)
Net income before taxes 1,131 2,236
Income taxes 14 (449) (615)
Net income 682 1,621
Attributable to:
Shareholders of Holcim Ltd 275 1,182
Non-controlling interest 408 439
Earnings per share in CHF
Earnings per share1 16 0.86 3.69
Fully diluted earnings per share1 16 0.86 3.69
Million CHF
Operating EBITDA 3, 10 3,958 4,513
EBITDA 3 4,264 4,9881 EPS calculation based on net income attributable to shareholders of Holcim Ltd weighted by the average number of shares.
Finan
cial
Info
rmat
ion
166
Consolidated statement of comprehensive earnings of Group Holcim
Million CHF Notes 2011 2010
Net income 682 1,621
Other comprehensive earnings
Currency translation effects
– Exchange differences on translation (1,247) (2,042)
– Realized through statement of income 108
– Tax effect 3 (7)
Available-for-sale financial assets
– Change in fair value (2) 421
– Realized through statement of income 25 (55) (171)
– Tax effect
Cash flow hedges
– Change in fair value (3) 9
– Realized through statement of income
– Tax effect (1)
Net investment hedges in subsidiaries
– Change in fair value 2 (3)
– Realized through statement of income
– Tax effect
Total other comprehensive earnings (1,195) (1,793)
Total comprehensive earnings (513) (172)
Attributable to:
Shareholders of Holcim Ltd (606) (395)
Non-controlling interest 93 223
Cons
olid
ated
Fin
ancia
l Sta
tem
ents
167
Consolidated statement of financial position of Group Holcim
Million CHF Notes 31.12.2011 31.12.2010
Cash and cash equivalents 17 2,946 3,386
Marketable securities 4 30
Accounts receivable 18 2,719 2,590
Inventories 19 2,086 2,072
Prepaid expenses and other current assets 20 382 416
Assets classified as held for sale 16 18
Total current assets 8,154 8,512
Long-term financial assets 21 561 921
Investments in associates 22 1,425 1,432
Property, plant and equipment 23 22,933 23,343
Intangible assets 24 8,453 9,061
Deferred tax assets 31 490 385
Other long-term assets 25 539 605
Total long-term assets 34,400 35,747
Total assets 42,554 44,259
Trade accounts payable 27 2,547 2,303
Current financial liabilities 28 2,820 2,468
Current income tax liabilities 418 555
Other current liabilities 1,667 1,632
Short-term provisions 32 242 256
Total current liabilities 7,695 7,214
Long-term financial liabilities 28 11,675 12,281
Defined benefit obligations 33 285 317
Deferred tax liabilities 31 2,061 2,203
Long-term provisions 32 1,181 1,123
Total long-term liabilities 15,202 15,924
Total liabilities 22,897 23,138
Share capital 36 654 654
Capital surplus 8,894 9,371
Treasury shares 36 (486) (476)
Reserves 7,768 8,552
Total equity attributable to shareholders of Holcim Ltd 16,830 18,101
Non-controlling interest 2,827 3,020
Total shareholders’ equity 19,656 21,121
Total liabilities and shareholders’ equity 42,554 44,259
Finan
cial
Info
rmat
ion
168
Consolidated statement of changes in equity of Group Holcim
Million CHF Share
capital
Capital
surplus
Treasury
shares
Retained
earnings
Equity as at January 1, 2011 654 9,371 (476) 15,688
Net income 275
Other comprehensive earnings
Total comprehensive earnings 275
Payout (480)
Change in treasury shares (21)
Share-based remuneration 3 11 1
Capital paid-in by non-controlling interest
Acquisition and disposal of participation in Group companies
Change in participation in existing Group companies (179)
Equity as at December 31, 2011 654 8,894 (486) 15,785
Equity as at January 1, 2010 654 9,368 (455) 15,019
Net income 1,182
Other comprehensive earnings
Total comprehensive earnings 1,182
Payout (480)
Change in treasury shares (32) 3
Share-based remuneration 3 11
Capital paid-in by non-controlling interest
Change in participation in existing Group companies (36)
Equity as at December 31, 2010 654 9,371 (476) 15,688
Cons
olid
ated
Fin
ancia
l Sta
tem
ents
169
Available-for-sale
reserve
Cash flow
hedging
reserve
Currency
translation
adjustments
Total
reserves
Total equity
attributable to
shareholders
of Holcim Ltd
Non-controlling
interest
Total
shareholders’
equity
249 7 (7,392) 8,552 18,101 3,020 21,121
275 275 408 682
(56) (3) (822) (881) (881) (315) (1,195)
(56) (3) (822) (606) (606) 93 (513)
(480) (226) (706)
(21) (21)
1 15 1 16
32 32
23 23
(179) (179) (116) (295)
193 4 (8,214) 7,768 16,830 2,827 19,656
(2) (2) (5,549) 9,466 19,033 3,011 22,044
1,182 1,182 439 1,621
251 9 (1,837) (1,577) (1,577) (216) (1,793)
251 9 (1,837) (395) (395) 223 (172)
(480) (480) (236) (716)
3 (29) (29)
14 4 18
29 29
(6) (42) (42) (11) (53)
249 7 (7,392) 8,552 18,101 3,020 21,121
Finan
cial
Info
rmat
ion
170
Consolidated statement of cash flows of Group Holcim
Million CHF Notes 2011 2010
Net income before taxes 1,131 2,236
Other income 11 (69) (7)
Share of profit of associates 22 (149) (245)
Financial expenses net 12, 13 1,020 635
Operating profit 1,933 2,619
Depreciation, amortization and impairment of operating assets 9 2,025 1,894
Other non-cash items 242 238
Change in net working capital (259) (43)
Cash generated from operations 3,941 4,708
Dividends received 137 183
Interest received 132 122
Interest paid (701) (829)
Income taxes paid (705) (471)
Other expenses (52) (54)
Cash flow from operating activities (A) 2,753 3,659
Purchase of property, plant and equipment (1,776) (1,821)
Disposal of property, plant and equipment 138 229
Acquisition of participation in Group companies (137) (60)
Disposal of participation in Group companies 5 0
Purchase of financial assets, intangible and other assets (242) (446)
Disposal of financial assets, intangible and other assets 221 736
Cash flow used in investing activities (B) 39 (1,791) (1,362)
Payout on ordinary shares (480) (480)
Dividends paid to non-controlling interest (234) (239)
Capital paid-in by non-controlling interest 32 29
Movements of treasury shares (21) (29)
Proceeds from current financial liabilities 6,232 6,097
Repayment of current financial liabilities (6,301) (7,713)
Proceeds from long-term financial liabilities 4,067 2,544
Repayment of long-term financial liabilities (4,298) (3,325)
Increase in participation in existing Group companies (390) (154)
Decrease in participation in existing Group companies 27 30
Cash flow used in financing activities (C) (1,366) (3,240)
Decrease in cash and cash equivalents (A+B+C) (405) (943)
Cash and cash equivalents as at January 1 (net) 17 3,069 4,261
Decrease in cash and cash equivalents (405) (943)
Currency translation effects (168) (249)
Cash and cash equivalents as at December 31 (net) 17 2,497 3,069
Cons
olid
ated
Fin
ancia
l Sta
tem
ents
171
Basis of preparation
The consolidated financial statements have been prepared in accordance with International Financial Reporting Standards (IFRS).
Due to rounding, numbers presented throughout this report may not add up precisely to the totals provided. All ratios and variances are calculated using the underlying amount rather than the presented rounded amount.
Adoption of revised and new International Financial Reporting
Standards and interpretations
In 2011, Group Holcim adopted the following amended standard and interpretation relevant to the Group, which became effective from January 1, 2011:
IAS 24 (revised) Related Party DisclosuresIFRIC 14 (amended) IAS 19 – Prepayment of a minimum
funding requirementImprovements to IFRSs Clarifications of existing IFRSs
(issued in May 2010)
The revisions to IAS 24 are disclosure-related only and had no impact on the Group’s financial statements. The amendment to IFRIC 14 clarifies that companies recognize the benefit of a prepayment as a pension asset. The effect of applying this amendment had no material effect on the Group’s financial statements. The improvements to IFRSs relate largely to clari-fication issues only. Therefore, the effect of applying these amendments had no material impact on the Group’s financial statements.
In 2013, Group Holcim will adopt the following new and amended standards and interpretations relevant to the Group:
IFRS 10 Consolidated Financial StatementsIFRS 11 Joint ArrangementsIFRS 12 Disclosure of Interests in Other EntitiesIFRS 13 Fair Value MeasurementIAS 1 (amended) Presentation of Items
of Other Comprehensive IncomeIAS 19 (revised) Employee BenefitsIAS 28 (revised) Investments in Associates and
Joint VenturesIFRIC 20 Stripping Costs in the Production
Phase of a Surface Mine
IFRS 10, which replaces IAS 27 Consolidated and Separate Finan-cial Statements, introduces a single consolidation model appli-cable to all investees. That model states that the investor consolidates an investee when it has control over the investee, i.e. when it is exposed, or has rights, to variable returns from its involvement with the investee and has the ability to affect those returns through its power over the investee. The Group is in the process of evaluating any impact this new standard may have on its consolidated financial statements.
IFRS 11, which replaces IAS 31 Interests in Joint Ventures, will require companies to classify joint arrangements as either a joint operation or as a joint venture, based on the rights and obligations arising from the joint arrangement. The standard also requires companies to apply the equity method of account-ing for interests in joint ventures. As a consequence thereof, Holcim will be unable to continue to apply the proportionate method of consolidation for such entities. Based on the joint ventures held in 2011, Holcim believe that had the Group applied IFRS 11 for the current year, the impact would not have been material.
IFRS 12 sets out the disclosure requirements for IFRS 10, IFRS 11 and IAS 28. This standard is disclosure related only. The Group is in the process of evaluating whether the current disclosures will need to be expanded.
IFRS 13 provides guidance on how to measure the fair value of financial and non-financial assets and liabilities when required or permitted by IFRS. The new standard does not change the IFRS as to when an entity is required to use fair value. The Group is in the process of evaluating any impact this new standard may have on its consolidated financial statements.
IAS 1 (amended) requires companies to group items presented in other comprehensive earnings on the basis of whether they are potentially reclassifiable to profit or loss subsequently. As such, the amendment will only impact the presentation of certain items in the Group’s statement of comprehensive earnings.
Accounting policies
Finan
cial
Info
rmat
ion
172
According to IAS 19 (revised), Group companies will not be able to defer actuarial gains and losses and subsequently amortize them to profit or loss by applying the corridor method but instead will be required to recognize such changes immediately in other comprehensive earnings. No reclassification of these amounts will be permitted in future periods. In addition, the expected return on plan assets has been removed and instead companies will be required to calculate a net interest expense on the net defined benefit liability and recognize the resulting cost in the income statement. Based on the 2011 results, Holcim believes that had the Group applied IAS 19 (revised) for the current year, the approximate financial impacts would have been as follows:
The net interest component of personnel expenses would have increased by approximately CHF 31 million as a result of the removal of the expected return on plan assets. Operating profit would have decreased by about CHF 15 million as the increase in net interest expense would have more than offset the elimina-tion of the amortization of the actuarial losses of CHF 17 million as a result of the removal of the 10 percent corridor.
The derecognition of unrecognized actuarial losses and past service costs at 1 January 2011 would have resulted in a decrease in retained earnings of CHF 399 million. Other comprehensive earnings (OCE) would have decreased by about CHF 210 million largely due to the immediate recognition of net actuarial losses relating to defined benefit obligations and the remeasurement of plan assets for the current year.
The defined benefit obligation in the statement of financial position of Group Holcim would have increased by about CHF 627 million as a result of the removal of the corridor method.
The approximate impacts mentioned above should not be considered predictive for future years considering the volatility of the underlying nature of the defined benefit pension plans and other post-employment benefit plans.
IAS 28 (revised) has been consequentially revised to include joint ventures in its scope as a result of IFRS 11 which requires such entities to be equity accounted in accordance with IAS 28 (revised).
IFRIC 20 states that costs incurred to remove waste materials (overburden) to gain access to raw material is recognized as an asset and is depreciated over the expected useful life of the area exposed as a result of the stripping activity based on the unit-of-production method. Since Holcim applies such account-ing policy, IFRIC 20 will not impact the Group’s financial state-ments.
In 2015, Group Holcim will adopt the following new standard relevant to the Group:
IFRS 9 Financial Instruments
IFRS 9 will ultimately replace IAS 39. Classification and mea-surement of financial assets and financial liabilities represents the first part of the new standard. This standard will require financial assets to be classified on initial recognition at either amortized cost or fair value. For financial liabilities, the new standard retains most of the current IAS 39 requirements. Therefore, the effect of applying the first part of this new standard will have no material impact on the Group’s financial statements.
Use of estimates
The preparation of financial statements in conformity with IFRS requires management to make estimates and assumptions that affect the reported amounts of revenues, expenses, assets, liabilities and related disclosures at the date of the financial statements. These estimates are based on management’s best knowledge of current events and actions that the Group may undertake in the future. However, actual results could differ from those estimates.
Critical estimates and assumptions
Estimates and judgments are continually evaluated and are based on historical experience and other factors, including expectations of future events that are believed to be reason-able under the circumstances.
Cons
olid
ated
Fin
ancia
l Sta
tem
ents
173
The Group makes estimates and assumptions concerning the future. The resulting accounting estimates will, by definition, seldom equal the related actual results. The estimates and assumptions that may have a significant risk of causing a material adjustment to the carrying amounts of assets and liabilities within the next financial year relate primarily to goodwill, and to a lesser extent, defined benefit obligations, deferred tax assets, long-term provisions, depreciation of prop-erty, plant and equipment and disclosure of contingent liabi-lities at the end of the reporting period. The cost of defined benefit pension plans and other post-employment benefits is determined using actuarial valuations. The actuarial valuation involves making assumptions about discount rates, expected rates of return on plan assets, future salary increases, mortality rates and future pension increases. Due to the long-term nature of these plans, such estimates are subject to significant uncertainty (note 33).
The Group tests annually whether goodwill has suffered any impairment in accordance with its accounting policy. The recov-erable amounts of cash generating units have been determined based on value-in-use calculations. These calculations require the use of estimates (note 24).
All estimates mentioned above are further detailed in the corresponding disclosures.
Scope of consolidation
The consolidated financial statements comprise those of Holcim Ltd and of its subsidiaries, including joint ventures. The list of principal companies is presented in the section “Principal companies of the Holcim Group”.
Principles of consolidation
Subsidiaries, which are those entities in which the Group has an interest of more than one half of the voting rights or other-wise has the power to exercise control over the operations, are consolidated. Business combinations are accounted for using the acquisition method. The cost of an acquisition is measured at the fair value of the consideration given at the date of exchange. For each business combination, the acquirer measures the non-controlling interest in the acquiree either at fair value or at the proportionate share of the acquiree’s identifiable net assets. Acquisition costs incurred are expensed in the statement of income. Iden tifiable assets acquired and liabilities assumed in a business combination are measured initially at fair value at the date of acquisition, irrespective of the extent of any non-controlling interest assumed.
When Group Holcim acquires a business, it assesses the finan-cial assets and liabilities assumed for appropriate classification and designation in accordance with the contractual terms, economic circumstances and pertinent conditions as of the acquisition date.
If the business combination is achieved in stages, the fair value of Group Holcim’s previously held equity interest in the acquiree is remeasured to fair value as at the acquisition date through profit or loss.
Any contingent consideration to be transferred by the Group is recognized at fair value at the acquisition date. Subsequent changes to the fair value of the contingent consideration are recognized in profit or loss.
Subsidiaries are consolidated from the date on which control is transferred to the Group and are no longer consolidated from the date that control ceases.
All intercompany transactions and balances between Group companies are eliminated in full.
It is common practice for the Group to write put options and acquire call options in connection with the remaining shares held by the non-controlling shareholders mainly as part of a business combination. If the Group has acquired a present ownership interest as part of a business combination, the pres-ent value of the redemption amount of the put option is recog-nized as a financial liability with any excess over the carrying amount of the non-controlling interest recognized directly as goodwill. In such a case, the non-controlling interest is deemed to have been acquired at the acquisition date and therefore any excess arising should follow the accounting treatment as in a business combination. All subsequent fair value changes of the financial liability are recognized in profit or loss and no earnings are attributed to the non-controlling interest. However, where the Group has not acquired a present ownership interest as part of a business combination, the non-controlling interest continues to receive an allocation of profit or loss and is reclas-sified as a financial liability at each reporting date as if the acquisition took place at that date. Any excess over the reclas-sified carrying amount of the non-controlling interest and all subsequent fair value changes of the financial liability are recognized directly in retained earnings.
Finan
cial
Info
rmat
ion
174
The Group’s interest in jointly controlled entities is consolidated using the proportionate method of consolidation. Under this method, the Group records its share of the joint ventures’ indi-vidual income and expenses, assets and liabilities and cash flows in the consolidated financial statements on a line-by-line basis. All transactions and balances between the Group and joint ventures are eliminated to the extent of the Group’s inter-est in the joint ventures.
Investments in associated companies are accounted for using the equity method of accounting. These are companies over which the Group generally holds between 20 and 50 percent of the voting rights and has significant influence but does not exercise control. Goodwill arising from the acquisition is included in the carrying amount of the investment in associated com panies. Equity accounting is discontinued when the carrying amount of the investment together with any long-term interest in an associated company reaches zero, unless the Group has in addition either incurred or guaranteed additional obli gations in respect of the associated company.
Foreign currency translation
The individual financial statements of each of the Group’s companies are measured using the currency of the primary economic environment in which the entity operates (“the functional currency”). Statements of income of foreign entities are translated into the Group’s reporting currency at average exchange rates for the year and statements of financial position are translated at exchange rates prevailing on December 31.
Goodwill arising from the acquisition of a foreign entity is expressed in the functional currency of the foreign operation and is translated at the closing rate.
Foreign currency transactions translated into the functional currency are accounted for at the exchange rates prevailing at the date of the transactions; gains and losses resulting from the settlement of such transactions and from the translation of monetary assets and liabilities denominated in foreign currencies are recognized in the statement of income, except when deferred outside the statement of income as qualifying cash flow hedges or net investment hedges.
Exchange differences arising on monetary items that form part of a company’s net investment in a foreign operation are reclassified to equity (currency translation adjustment) in the consolidated financial statements and are fully recycled to the statement of income when Group Holcim loses control of a subsidiary, loses joint control over a joint venture or loses significant influence in an associate. When a foreign operation is partially disposed of or sold, exchange differences that were recorded in equity are recognised in the statement of income as part of the net gain or loss on sale, except for a partial disposal of a subsidiary without loss of control.
Segment information
Segment information is presented in respect of the Group’s reportable segments.
For management purposes, the Group is organized by geo-graphical areas and has five reportable segments based on location of assets as follows:
Each of the above reportable segments derives its revenues from the sale of cement, aggregates and other construction materials and services.
The Group has three product lines:
Cement, which comprises clinker, cement and other cementitious materialsAggregatesOther construction materials and services, which comprises ready-mix concrete, concrete products, asphalt, construction and paving, trading and other products and services
Cons
olid
ated
Fin
ancia
l Sta
tem
ents
175
Group financing (including financing costs and financing income) and income taxes are managed on a Group basis and are not allocated to any reportable segments.
Transfer prices between segments are set on an arms-length basis in a manner similar to transactions with third parties. Segment revenue and segment result include transfers between segments. Those transfers are eliminated on consolidation.
Cash and cash equivalents
Cash and cash equivalents are financial assets. Cash equiva-lents are readily convertible into a known amount of cash with original maturities of three months or less. For the purpose of the statement of cash flows, cash and cash equivalents com-prise cash at banks and in hand, deposits held on call with banks and other short-term, highly liquid investments, net of bank overdrafts.
Marketable securities
Marketable securities consist primarily of debt and equity securities which are traded in liquid markets and are classified as available-for-sale. They are carried at fair value with all fair value changes recorded in other comprehensive earnings until the financial asset is either impaired or disposed of, at which time the cumulative gain or loss previously recognized in other comprehensive earnings is reclassified from equity to the statement of income.
Accounts receivable
Trade accounts receivable are carried at the original invoice amount less an estimate made for doubtful debts based on a review of all outstanding amounts of the financial asset at the year end.
Inventories
Inventories are stated at the lower of cost and net realizable value. Cost is determined by using the weighted average cost method. The cost of finished goods and work in progress com-prises raw materials and additives, direct labor, other direct costs and related production overheads. Cost of inventories includes transfers from equity of gains or losses on qualifying cash flow hedges relating to inventory purchases.
Long-term financial assets
Long-term financial assets consist of (a) investments in third parties, (b) long-term receivables from associates, (c) long-term receivables from third parties, and (d) long-term derivative assets. Investments in third parties are classified as available-for-sale and long-term receivables from associates and third parties are classified as loans and receivables. A loan or receiv-able may also be designated as available-for-sale. Long-term derivative assets are regarded as held for hedging unless they do not meet the strict hedging criteria under IAS 39 Financial Instruments: Recognition and Measurement, in which case they will be classified as held for trading.
All purchases and sales of investments are recognized on trade date, which is the date that the Group commits to purchase or sell the asset. Purchase cost includes transaction costs, except for derivative instruments. Loans and receivables are measured at amortized cost using the effective interest method. Available-for-sale investments are carried at fair value, while held-to-maturity investments are carried at amortized cost using the effective interest method. Gains and losses arising from chang-es in the fair value of available-for-sale investments are includ-ed in other comprehensive earnings until the financial asset is either impaired or disposed of, at which time the cumu lative gain or loss previously recognized in other comprehensive earnings is reclassified from equity to the statement of income.
Finan
cial
Info
rmat
ion
176
Property, plant and equipment
Property, plant and equipment is valued at acquisition or con-struction cost less depreciation and impairment loss. Cost includes transfers from equity of any gains or losses on qual-ifying cash flow hedges. Depreciation is charged so as to write off the cost of property, plant and equipment over their esti-mated useful lives, using the straight-line method, on the follow-ing bases:
Land No depreciation except on land with raw material reserves
Buildings and installations 20 to 40 yearsMachinery 10 to 30 yearsFurniture, vehicles and tools 3 to 10 years
Costs are only included in the asset’s carrying amount when it is probable that economic benefits associated with the item will flow to the Group in future periods and the cost of the item can be measured reliably. Costs include the initial estimate of the costs of dismantling and removing the item and restor-ing the site on which it is located. All other repairs and mainte-nance expenses are charged to the statement of income during the period in which they are incurred.
Mineral reserves, which are included in the class “land” of prop-erty, plant and equipment, are valued at cost and are depreciated based on the unit-of-production method over their estimated commercial lives.
Costs incurred to gain access to mineral reserves are capital-ized and depreciated over the life of the quarry, which is based on the estimated tonnes of raw material to be extracted from the reserves.
Interest cost on borrowings to finance construction projects, which necessarily takes a substantial period of time to get ready for their intended use, are capitalized during the period of time that is required to complete and prepare the asset for its intended use. All other borrowing costs are expensed in the period in which they are incurred.
Government grants received are deducted from property, plant and equipment and reduce the depreciation charge accordingly.
Leases of property, plant and equipment where the Group has substantially all the risks and rewards of ownership are classi-fied as finance leases. Property, plant and equipment acquired through a finance lease is capitalized at the date of the com-mencement of the lease term at the present value of the mini-mum future lease payments or, if lower, at an amount equal to the fair value of the leased asset as determined at the incep-tion of the lease. The corresponding lease obligations, exclud-ing finance charges, are included in either current or long-term financial liabilities.
For sale and lease-back transactions, the book value of the related property, plant or equipment remains unchanged. Proceeds from a sale are included as a financing liability and the financing costs are allocated over the term of the lease in such a manner that the costs are reported over the relevant periods.
Non-current assets (or disposal groups) classified as held for sale
Non-current assets (or disposal groups) are classified as held for sale and stated at the lower of carrying amount and fair value less costs to sell if their carrying amount is to be recovered principally through a sale transaction rather than through continuing use.
Goodwill
Goodwill represents the excess of the aggregate of the consid-eration transferred and the amount recognized for the non-controlling interest over the fair value of the net identifiable assets acquired and liabilities assumed. Goodwill on acquisi-tions of subsidiaries and interests in joint ventures is included in intangible assets. Such goodwill is tested annually for impair-ment or whenever there are impairment indi cators and is carried at cost less accumulated impairment losses. Goodwill on acquisitions of associates is included in investments in associates. If the consideration transferred is less than the fair value of the net assets of the subsidiary acquired, the difference is recognized directly in the statement of income.
On disposal of a subsidiary, associate or joint venture, the related goodwill is included in the determination of profit or loss on disposal.
Cons
olid
ated
Fin
ancia
l Sta
tem
ents
177
Goodwill on acquisitions of subsidiaries and interests in joint ventures is allocated to cash generating units for the purpose of impairment testing (note 24). Impairment losses relating to goodwill cannot be reversed in future periods.
Computer software
Costs associated with developing or maintaining computer software programs are recognized as an expense as incurred. Costs that are directly associated with identifiable and unique software products controlled by the Group and which will probably generate economic benefits exceeding costs beyond one year are recognized as intangible assets.
Expenditures which enhance or extend the performance of computer software programs beyond their original specifica-tions are capitalized and added to the original cost of the software. Computer software development costs recognized as assets are amortized using the straight-line method over their useful lives, but not exceeding a period of three years.
Other intangible assets
Expenditure on acquired patents, trademarks and licenses is capitalized and amortized using the straight-line method over their estimated useful lives, but not exceeding 20 years.
Impairment of non-financial assets
At each reporting date, the Group assesses whether there is any indication that a non-financial asset may be impaired. If any such indication exists, the recoverable amount of the non-financial asset is estimated in order to determine the extent of the impairment loss, if any. Where it is not possible to esti-mate the recoverable amount of an individual non-financial asset, the Group estimates the recoverable amount of the smallest cash generating unit to which the non-financial asset belongs. The recoverable amount is the higher of an asset’s or cash generating unit’s fair value less costs to sell and its value in use. If the recoverable amount of a non-financial asset or cash generating unit is estimated to be less than its carrying amount, the carrying amount of the non-financial asset or cash generating unit is reduced to its recoverable amount. Impair-ment losses are recognized immediately in the statement of income.
Where an impairment loss subsequently reverses, the carrying amount of the non-financial asset or cash generating unit is increased to the revised estimate of its recoverable amount. However, this increased amount cannot exceed the carrying amount that would have been determined had no impairment loss been recognized for that non-financial asset or cash gener-ating unit in prior periods. A reversal of an impairment loss is recognized immediately in the statement of income.
Impairment of financial assets
At each reporting date, the Group assesses whether there is any indication that a financial asset may be impaired. An impairment loss in respect of a financial asset measured at amortized cost is calculated as the difference between its carrying amount and the present value of the future estimated cash flows discounted at the original effective interest rate. The carrying amount of the asset is reduced through the use of an allowance account. The amount of the loss is recognized in profit or loss.
If, in a subsequent period, the amount of the impairment loss decreases and the decrease can be related objectively to an event occurring after the impairment was recognized, the pre-viously recognized impairment loss is reversed, to the extent that the carrying value of the asset does not exceed its amor-tized cost at the reversal date. Any reversal of an impairment loss is recognized in profit or loss.
An impairment loss in respect of an available-for-sale financial asset is recognized in the statement of income and is calculated by reference to its fair value. Individually significant financial assets are tested for impairment on an individual basis. Rever-sals of impairment losses on equity instruments classified as available-for-sale are recognized in other comprehensive earn-ings while reversals of impairment losses on debt instruments are recognized in profit or loss if the increase in fair value of the instrument can be objectively related to an event occurring after the impairment loss was recognized in the statement of income.
Finan
cial
Info
rmat
ion
178
In relation to accounts receivable, a provision for impairment is made when there is objective evidence (such as the probability of insolvency or significant financial difficulties of the debtor) that the Group will not be able to collect all of the amounts due under the original terms of the invoice. The carrying amount of the receivable is reduced through use of an allowance account. Impaired receivables are derecognized when they are assessed as uncollectible.
Long-term financial liabilities
Bank loans acquired and non-convertible bonds issued are rec-ognized initially at the proceeds received, net of transaction costs incurred. Subsequently, bank loans and non-convertible bonds are stated at amortized cost using the effective interest method, with any difference between proceeds (net of trans-action costs) and the redemption value being recognized in the statement of income over the term of the borrowings.
Upon issuance of convertible bonds, the fair value of the liability portion is determined using a market interest rate for an equiv-alent non-convertible bond; this amount is carried as a long-term liability on the amortized cost basis using the effective interest method until extinguishment on conversion or maturity of the bonds. The remainder of the proceeds is allocated to the conversion option, which is recognized and included in share-holders’ equity; the value of the conversion option is not remeasured in subsequent periods.
Long-term derivative liabilities are regarded as held for hedging unless they do not meet the strict hedging criteria under IAS 39 Financial Instruments: Recognition and Measurement, in which case they will be classified as held for trading.
Financial liabilities that are due within 12 months after the end of the reporting period are classified as current liabilities unless the Group has an unconditional right to defer settlement of the liability until more than 12 months after the reporting period.
Deferred taxes
Deferred tax is provided, using the balance sheet liability method, on temporary differences arising between the tax bases of assets and liabilities and their carrying amounts in the financial statements. Tax rates enacted or substantially enacted by the end of the reporting period are used to deter-mine the deferred tax expense.
Deferred tax assets are recognized to the extent that it is prob-able that future taxable profit will be available against which temporary differences or unused tax losses can be utilized. Deferred tax liabilities are recognized for taxable temporary differences arising from investments in subsidiaries, associates and joint ventures except where the Group is able to control the distribution of earnings from these respective entities and where dividend payments are not expected to occur in the foreseeable future.
Deferred tax is charged or credited in the statement of income, except when it relates to items credited or charged outside the statement of income, in which case the deferred tax is treated accordingly.
Site restoration and other environmental provisions
The Group provides for the costs of restoring a site where a legal or constructive obligation exists. The cost of raising a pro-vision before exploitation of the raw materials has commenced is included in property, plant and equipment and depreciated over the life of the site. The effect of any adjustments to the provision due to further environmental damage as a result of exploitation activities is recorded through operating costs over the life of the site to reflect the best estimate of the expendi-ture required to settle the obligation at the end of the reporting period. Changes in the measurement of a provision that result from changes in the estimated timing or amount of cash out-flows, or a change in the discount rate, are added to, or deducted from, the cost of the related asset to the extent that they relate to the asset’s installation, construction or acquisition. All provi-sions are discounted to their present value.
Cons
olid
ated
Fin
ancia
l Sta
tem
ents
179
Emission rights
The initial allocation of emission rights granted is recognized at nominal amount (nil value). Where a Group company has emissions in excess of the emission rights granted, it will rec-ognize a provision for the shortfall based on the market price at that date. The emission rights are held for compliance pur-poses only and therefore the Group does not intend to specu-late with these in the open market.
Other provisions
A provision is recognized when there exists a legal or construc-tive obligation arising from past events, it is probable that an outflow of resources embodying economic benefits will be required to settle the obligation and a reliable estimate can be made of this amount.
Employee benefits – Defined benefit plans
Some Group companies provide defined benefit pension plans for employees. Professionally qualified independent actuaries value the defined benefit obligations on a regular basis. The obligation and costs of pension benefits are determined using the projected unit credit method. The projected unit credit method considers each period of service as giving rise to an additional unit of benefit entitlement and measures each unit separately to build up the final obligation. Past service costs are recognized on a straight-line basis over the average period until the amended benefits become vested. Gains or losses on the curtailment or settlement of pension benefits are recog-nized when the curtailment or settlement occurs.
Actuarial gains or losses are amortized based on the expected average remaining working lives of the participating employees, but only to the extent that the net cumulative unrecognized amount exceeds 10 percent of the greater of the present value of the defined benefit obligation and the fair value of plan assets at the end of the previous year. The pension obligation is measured at the present value of estimated future cash flows using a discount rate that is similar to the interest rate on high quality corporate bonds where the currency and terms of the corporate bonds are consistent with the currency and estimated terms of the defined benefit obligation.
A net pension asset is recorded only to the extent that it does not exceed the present value of any economic benefits available in the form of refunds from the plan or reductions in future contributions to the plan and any unrecognized net actuarial losses and past service costs.
Employee benefits – Defined contribution plans
In addition to the defined benefit plans described above, some Group companies sponsor defined contribution plans based on local practices and regulations. The Group’s contributions to defined contribution plans are charged to the statement of income in the period to which the contributions relate.
Employee benefits – Other long-term employment benefits
Other long-term employment benefits include long-service leave or sabbatical leave, medical aid, jubilee or other long- service benefits, long-term disability benefits and, if they are not due to be settled within twelve months after the year end, profit sharing, variable and deferred compensation.
The measurement of these obligations differs from defined benefit plans in that all actuarial gains and losses are recog-nized immediately and no corridor approach is applied.
Employee benefits – Equity compensation plans
The Group operates various equity-settled share-based compen-sation plans. The fair value of the employee services received in exchange for the grant of the options or shares is recognized as an expense. The total amount to be expensed is determined by reference to the fair value of the equity instruments granted. The amounts are charged to the statement of income over the relevant vesting periods and adjusted to reflect actual and expected levels of vesting (note 33).
Non-controlling interest
Non-controlling interest is the equity in a subsidiary not attrib-utable, directly or indirectly, to a parent company and is pre-sented separately in the consolidated statement of income, in the consolidated statement of comprehensive earnings and within equity in the consolidated statement of financial posi-tion.
Finan
cial
Info
rmat
ion
180
Changes in the ownership interest of a subsidiary that do not result in loss of control are accounted for as an equity transac-tion. Consequently, if Holcim acquires or partially disposes of a non-controlling interest in a subsidiary, without losing control, any difference between the amount by which the non-control-ling interest is adjusted and the fair value of the consideration paid or received is recognized directly in retained earnings.
Revenue recognition
Revenue is recognized when it is probable that the economic benefits associated with the transaction will flow to the entity and the amount of the revenue can be measured reliably. Revenue is measured at the fair value of the consideration received net of sales taxes and discounts. Revenue from the sale of goods is recognized when delivery has taken place and the transfer of risks and rewards of ownership has been completed.
Interest is recognized on a time proportion basis that reflects the effective yield on the asset. Dividends are recognized when the shareholder’s right to receive payment is established.
Certain activities of the Group are construction contract driven. Consequently, contract revenue and contract costs are recog-nized in the statement of income on the percentage of comple-tion method, with the stage of completion being measured by reference to actual work performed to date.
Contingent liabilities
Contingent liabilities arise from conditions or situations where the outcome depends on future events. They are disclosed in the notes to the financial statements.
Financial instruments
Information about accounting for derivative financial instru-ments and hedging activities is included in the section “Risk management”.
Cons
olid
ated
Fin
ancia
l Sta
tem
ents
181
Business risk management
Business Risk Management supports the Executive Committee and the management teams of the Group companies in their strategic decisions. Business Risk Management aims to system-atically recognize major risks but also opportunities the com-pany encounters. Potential risks are identified and evaluated at an early stage and constantly monitored. Countermeasures are then proposed and implemented at the appropriate level. All types of risk, from market, operations, finance and legal up to the external business environment, are considered including compliance and reputational aspects.
In addition to the Group companies, the Executive Committee and the Board of Directors are also involved in the assessment. The Group’s risk profile is assessed from a variety of top-down and bottom-up angles. The Executive Committee reports regu-larly to the Board of Directors on important risk analysis findings and provides updates on the measures taken.
Financial risk management
The Group’s activities expose it to a variety of financial risks, including the effect of changes in debt structure and equity market prices, foreign currency exchange rates and interest rates. The Group’s overall risk management program focuses on the unpredictability of financial markets and seeks to minimize potential adverse effects on the financial performance of the Group. The Group uses derivative financial instruments such as foreign exchange contracts and interest rate swaps to hedge certain exposures. Therefore, the Group does not enter into derivative or other financial transactions which are unrelated to its operating business. As such, a risk-averse approach is pursued.
Financial risk management within the Group is governed by policies approved by key management personnel. It provides principles for overall risk management as well as policies cover-ing specific areas such as interest rate risk, foreign exchange risk, counterparty risk, use of derivative financial instruments and investing excess liquidity.
Market risk
Holcim is exposed to market risk, primarily relating to foreign exchange and interest rate risk. Management actively monitors these exposures. To manage the volatility relating to these exposures, Holcim enters into a variety of derivative financial instruments. The Group’s objective is to reduce, where appro-priate, fluctuations in earnings and cash flows associated with changes in foreign exchange and interest rate risk. To manage liquid funds, it might write call options on assets it has or it might write put options on positions it wants to acquire and has the liquidity to acquire. Holcim, therefore, expects that any loss in value of those instruments generally would be offset by increases in the value of the underlying transactions.
Liquidity risk
Group companies need a sufficient availability of cash to meet their obligations. Individual companies are responsible for their own cash surpluses and the raising of loans to cover cash deficits, subject to guidance by the Group and, in certain cases, to approval at Group level.
The Group monitors its liquidity risk by using a recurring liquid-ity planning tool and maintains sufficient reserves of cash, unused credit lines and readily realizable marketable securities to meet its liquidity requirements at all times. In addition, the strong international creditworthiness of the Group allows it to make efficient use of international financial markets for financing purposes.
Risk management
Finan
cial
Info
rmat
ion
182
The maturity profile is based on contractual undiscounted amounts including both interest and principal cash flows and based on the earliest date on which Holcim can be required to pay.
Contractual interest cash flows relating to a variable interest rate are calculated based on the rates prevailing as of December 31.
Interest rate risk
Interest rate risk arises from movements in market interest rates which could affect the Group’s financial result and market values of its financial instruments. The Group is primarily exposed to fluctuations in market interest rates on its financial liabilities at floating rates which may cause variations in the Group’s financial result. The exposure is addressed through the management of the fixed/floating ratio of financial liabilities. To manage this mix, the Group may enter into interest rate swap agreements, in which it exchanges periodic payments based on notional amounts and agreed-upon fixed and floating inter-est rates.
Interest rate sensitivity
The Group’s sensitivity analysis has been determined based on the interest rate exposure relating to the Group’s financial lia-bilities at variable rate on a post hedge basis as at December 31.
A 1 percentage point change is used when the interest rate risk is reported internally to key management personnel and repre-sents management’s assessment of a reasonably possible change in interest rates.
At December 31, a ±1 percentage point shift in interest rates, with all other assumptions held constant, would result in approximately CHF 50 million (2010: 46) of annual additional/ lower financial expenses before tax on a post hedge basis. The Group’s sensitivity to interest rates is higher than last year mainly due to the fact that the ratio of financial liabilities at variable rates to total financial liabilities has increased from 42 percent to 47 percent.
Contractual maturity analysis
Million CHF Contractual undiscounted cash flows Carrying
Total 5,591 2,272 3,698 2,396 1,186 4,823 19,966 1 All derivative financial instruments are held for hedging. The contractual cash flows include both cash in- and outflows. Additional information is disclosed
in note 30.
Cons
olid
ated
Fin
ancia
l Sta
tem
ents
183
Impacts on equity due to derivative instruments are considered as not material based on the shareholders’ equity of Group Holcim.
Currency risk
The Group operates internationally in around 70 countries and therefore is exposed to foreign currency risks.
The translation of foreign operations into the Group reporting currency leads to currency translation effects. The Group may hedge certain net investments in foreign entities with foreign currency borrowings or other instruments. Hedges of net investments in foreign entities are accounted for similarly to cash flow hedges. To the extent that the net investment hedge is effective, all foreign exchange gains or losses are recognized in equity and included in currency translation adjustments.
Due to the local nature of the construction materials business, transaction risk is limited. However, for many Group companies, income will be primarily in local currency whereas debt servic-ing and a significant amount of capital expenditures may be in foreign currencies. As a consequence thereof, subsidiaries may enter into derivative contracts which are designated as either cash flow hedges or fair value hedges, as appropriate, but which do not include the hedging of forecasted transactions as it is not considered economical.
Currency sensitivity
The Group’s sensitivity analysis has been determined based on the Group’s net transaction exposure that arises on monetary financial assets and liabilities at December 31 that are denomi-nated in a foreign currency other than the functional currency in which they are measured. The Group’s net foreign currency transaction risk mainly arises from CHF, USD and EUR against the respective currencies the Group operates in.
A 5 percent change is used when the net foreign currency trans-action risk is reported internally to key management personnel and represents management’s assessment of a reasonably pos-sible change in foreign exchange rates.
A ±5 percent change in the CHF, USD and EUR against the respective currencies the Group operates in would only have an immaterial impact on foreign exchange (loss) gains net on a post hedge basis in both the current and prior year.
Impacts on equity due to derivative instruments are considered as not material based on the shareholders’ equity of Group Holcim.
Equities and securities risk
In general, the Group does not hold or acquire any shares or options on shares or other equity products which are not directly related to the business of the Group.
Capital structure
The Group’s objectives when managing capital are to secure the Group’s ongoing financial needs to continue as a going concern as well as to cater for its growth targets in order to provide returns to shareholders and benefits for other stake-holders and to maintain a cost-efficient and risk-optimized capital structure.
The Group manages the capital structure and makes adjust-ments to it in the light of changes in economic conditions, its business activities, investment and expansion program and the risk characteristics of the underlying assets. In order to maintain or adjust the capital structure, the Group may adjust the amount of dividends paid to shareholders, return capital to shareholders, issue new shares, increase debt or sell assets to reduce debt.
The Group monitors capital, among others, on the basis of both the ratio of funds from operations as a percentage of net finan-cial debt and gearing.
Funds from operations is calculated as net income plus depre-ciation, amortization and impairment as shown in the consoli-dated statement of income. Net financial debt is calculated as financial liabilities less cash and cash equivalents as shown in the consolidated statement of financial position.
Gearing is calculated as net financial debt divided by total shareholders’ equity as shown in the consolidated statement of financial position.
During 2011, the Group’s target, which was unchanged from 2010, was to maintain a ratio of funds from operations as a percentage of net financial debt of at least 25 percent and a gearing below 100 percent in order to maintain a solid investment grade rating.
Finan
cial
Info
rmat
ion
184
Due to a decrease in net income and an increase in net finan-cial debt, the ratio of funds from operations/net financial debt decreased.
The increase in gearing arose due to the increase in net finan-cial debt and the decrease in total shareholders’ equity. Share-holders’ equity decreased by 6.9 percent during 2011 mainly as a result of currency trans lation adjustments.
Million CHF 2011 2010
Net income 682 1,621
Depreciation, amortization and impairment (note 9) 2,367 1,934
Funds from operations 3,049 3,555
Financial liabilities (note 28) 14,495 14,749
Cash and cash equivalents (note 17) (2,946) (3,386)
Net financial debt 11,549 11,363
Funds from operations/net financial debt 26.4% 31.3%
Million CHF 2011 2010
Net financial debt 11,549 11,363
Total shareholders’ equity 19,656 21,121
Gearing 58.8% 53.8%
Credit risk
Credit risks arise from the possibility that customers may not be able to settle their obligations as agreed. To manage this risk, the Group periodically assesses the financial reliability of customers.
Credit risks, or the risk of counterparties defaulting, are con-stantly monitored. Counterparties to financial instruments consist of a large number of major financial institutions. The Group does not expect any counterparties to fail to meet their obligations, given their high credit ratings. At year end Holcim has no significant concentration of credit risk with any single counterparty or group of counterparties.
The maximum exposure to credit risk is represented by the carrying amount of each financial asset, including derivative financial instruments, in the consolidated statement of finan-cial position.
Accounting for derivative financial instruments
and hedging activities
Derivatives are initially recognized at fair value on the date a derivative contract is entered into and are subsequently remea-sured at their fair value. The method of recognizing the result-ing gain or loss is dependent on the nature of the item being hedged. On the date a derivative contract is entered into, the Group designates certain derivatives as either (a) a hedge of the fair value of a recognized asset or liability (fair value hedge) or (b) a hedge of a particular risk associated with a recognized asset or liability, such as future interest payments on floating rate debt (cash flow hedge) or (c) a hedge of a foreign currency risk of a firm commitment (cash flow hedge) or (d) a hedge of a net investment in a foreign entity.
Changes in the fair value of derivatives that are designated and qualify as fair value hedges and that are highly effective are recorded in the statement of income, along with any changes in the fair value of the hedged asset or liability that is attributable to the hedged risk.
Cons
olid
ated
Fin
ancia
l Sta
tem
ents
185
Changes in the fair value of derivatives that are designated and qualify as cash flow hedges and that are highly effective are recognized outside the statement of income. Where the firm commitment results in the recognition of an asset, for example, property, plant and equipment, or a liability, the gains or losses previously deferred in equity are transferred from equity and included in the initial measurement of the non-financial asset or liability. Otherwise, amounts deferred in equity are trans-ferred to the statement of income and classified as revenue or expense in the same periods during which the cash flows, such as hedged firm commitments or interest payments, affect the statement of income.
Changes in the fair value of derivatives that are designated and qualify as net investment hedges and that are highly effective are recognized outside the statement of income and included in currency translation adjustments. The amounts deferred in equity are transferred to the statement of income on disposal of the foreign entity.
Certain derivative transactions, while providing effective eco-nomic hedges under the Group’s risk management policies, may not qualify for hedge accounting under the specific rules in IAS 39. Changes in the fair value of any derivative instru-ments that do not qualify for hedge accounting under IAS 39 are recognized immediately in the statement of income as part of the financial result.
When a hedging instrument is sold, or when a hedge no longer meets the criteria for hedge accounting under IAS 39, any cumu-lative gain or loss recognized in equity at that time remains in equity until the committed transaction occurs. However, if a committed transaction is no longer expected to occur, the cumulative gain or loss that was reported in equity is imme-diately transferred to the statement of income. In the case of a fair value hedge related to items carried at amortised cost, any valuation adjustment relating to a hedged item is amortized to profit or loss over the remaining life of the hedged item.
The Group documents at the inception of the transaction the relationship between hedging instruments and hedged items as well as its risk management objective and strategy for under-taking various hedge transactions. This process includes linking all derivatives designated as hedges to specific assets and liabilities or to specific firm commitments or to investments in foreign entities. The Group also documents its assessment, both at hedge inception and on an ongoing basis, of whether the derivatives that are used in hedging transactions are highly effective in offsetting changes in fair values or cash flows of hedged items including translation gains and losses in hedged foreign investments.
The fair values of various derivative instruments used for hedg-ing purposes are disclosed in note 30. Movements in the cash flow hedging reserve are shown in the statement of changes in consolidated equity of Group Holcim.
Finan
cial
Info
rmat
ion
186
Fair values
Million CHF Carrying amount (based on measurement basis) Comparison
fair valueAmortized
cost
Fair value
level 1
Fair value
level 2
Total
2011
Current financial assets
Cash and cash equivalents 2,946 2,946 2,946
Marketable securities 41 4 4
Trade accounts receivable 2,348 2,348 2,348
Other receivables 78 78 78
Other current assets 911 91 91
Derivative assets3 5 5 5
Long-term financial assets
Long-term receivables 330 330 345
Other long-term assets 1771 177 177
Financial investments third parties 452 61 961 147 147
Derivative liabilities3 152 152 1521 Available-for-sale.2 Financial investments measured at cost.3 Held for hedging.
Fair value estimation
The fair value of publicly traded financial instruments is gener-ally based on quoted market prices at the end of the reporting period.
For non-publicly traded financial instruments the fair value is determined by using a variety of methods, such as the dis-
counted cash flow method and option pricing models. The valu-ation methods seek to maximize the use of observable market data existing at the end of the reporting period.
The fair value of current financial assets and liabilities at amor-tized cost are assumed to approximate their carrying amounts due to the short-term nature of these financial instruments.
Cons
olid
ated
Fin
ancia
l Sta
tem
ents
187
The table shows the carrying amounts and fair values of finan-cial assets and liabilities. The fair value hierarchy level is shown for those financial assets and liabilities that are carried at fair value in the statement of financial position.
The levels of fair value hierarchy used are defined as follows:
Level 1 fair value measurements are those derived from quoted prices (unadjusted) in active markets for identical assets or lia-bilities. The types of assets carried at level 1 fair value are equity and debt securities listed in active markets.
Level 2 fair value measurements are those derived from valua-tion techniques using inputs for the asset or liability that are observable market data, either directly or indirectly. Such valua-tion techniques include the discounted cash flow method and option pricing models. For example, the fair value of interest rate and currency swaps is determined by discounting estimated future cash flows, and the fair value of forward foreign
exchange contracts is determined using the forward exchange market at the end of the reporting period.
Level 3 fair value measurements are those derived from valua-tion techniques using inputs for the asset or liability that are not based on observable market data. In 2011 and 2010 there were no financial assets and liabilities allocated to level 3.
There have been no transfers between the different hierarchy levels in 2011 and 2010.
Million CHF Carrying amount (based on measurement basis) Comparison
Derivative liabilities3 130 130 1301 Available-for-sale.2 Financial investments measured at cost.3 Held for hedging.
Finan
cial
Info
rmat
ion
188
Notes to the consolidated financial statements
1 Changes in the scope of consolidation
During 2011 there were several business combinations that were individually immaterial but considered material on an aggregated basis.
Newly included in 2011 Effective as at Participation acquired
Lattimore Materials Company, L.P. 4 March 2011 51 percent
Východoslovenské stavebné hmoty, a.s. 25 October 2011 51 percent
Others – –
The aggregated identifiable net assets and liabilities arising from the acquisitions are disclosed in Note 39. The amounts disclosed were determined provisionally. Further adjustments may be made to the fair values assigned to property, plant and equipment, other assets, long-term provisions and other long-term liabilities up to twelve months from the date of acquisition.
The amount of the non-controlling interest recognized amounted to CHF 23 million and was measured at the proportionate share of the acquirees’ identifiable net assets at the date of acquisition.
The total goodwill arising from the transactions was CHF 79 million. The goodwill is attributable to the favorable presence that the companies enjoy in their respective markets, including the good locations and strategic importance of mineral reserves. None of the goodwill recognized is expected to be deductible for income tax purposes.
Holcim recognized a gain of CHF 27 million as a result of measuring at fair value its previously held equity interests in the acquired companies held before the business combinations. The gains are included in other income in Holcim’s consolidated statement of income for the year ending 31 December 2011.
The acquired companies contributed net sales of CHF 203 mil-lion and a negative net income of CHF 8 million to the Group from the date of acquisition to December 31, 2011. If the acqui-sitions had occurred on January 1, 2011, Group net sales and net income would have been CHF 126 million and CHF 10 million higher respectively.
Holcim recognized acquisition-related costs of CHF 4 million which has been reflected as administration expenses in the consolidated statement of income.
During 2010 there were no business combinations that were either individually material or that were considered material on an aggregated basis.
An overview of the subsidiaries, joint ventures and associated companies is included in the section “Principal companies of the Holcim Group” on pages 229 to 231.
Cons
olid
ated
Fin
ancia
l Sta
tem
ents
189
2 Principal exchange rates
The following table summarizes the principal exchange rates that have been used for translation purposes.
Statement of income Statement of financial position
Average exchange rates
in CHF
Year-end exchange rates
in CHF
2011 2010 31.12.2011 31.12.2010
1 EUR 1.24 1.38 1.22 1.25
1 USD 0.89 1.04 0.94 0.94
1 GBP 1.42 1.61 1.45 1.45
1 CAD 0.90 1.01 0.92 0.94
100 MXN 7.16 8.24 6.71 7.56
100 BRL 53.23 59.16 50.46 56.33
100 INR 1.91 2.28 1.77 2.09
1,000 IDR 0.10 0.12 0.10 0.10
100 PHP 2.05 2.31 2.15 2.14
1 AUD 0.92 0.96 0.96 0.95
Finan
cial
Info
rmat
ion
190
3 Information by reportable segmentEurope North America Latin America
2011 2010 2011 2010 2011 2010Capacity and salesMillion tAnnual cement production capacity 49.8 50.0 21.9 23.2 35.5 33.4Sales of cement 26.8 26.2 11.4 11.1 24.2 22.7– of which mature markets 16.5 16.3 11.4 11.1– of which emerging markets 10.3 9.9 24.2 22.7Sales of mineral components 2.4 1.6 1.5 1.5Sales of aggregates 83.0 77.6 43.5 39.2 14.5 12.2– of which mature markets 72.0 69.4 43.5 39.2– of which emerging markets 11.0 8.2 14.5 12.2Sales of asphalt 5.4 5.7 5.0 4.9Million m3
Sales of ready-mix concrete 16.1 16.0 7.1 5.6 11.0 10.5– of which mature markets 14.2 14.1 7.1 5.6– of which emerging markets 1.9 1.9 11.0 10.5
Statement of income, statement of finan- cial position and statement of cash flowsMillion CHFNet sales to external customers 5,922 6,391 2,987 3,240 3,195 3,442Net sales to other segments 200 144 116 Total net sales 6,122 6,535 2,987 3,240 3,310 3,442– of which mature markets 5,026 5,402 2,987 3,240 – of which emerging markets 1,096 1,133 3,310 3,442Operating EBITDA 930 1,045 346 460 888 999– of which mature markets 640 717 346 460 – of which emerging markets 290 328 888 999Operating EBITDA margin in % 15.2 16.0 11.6 14.2 26.8 29.0Depreciation, amortization and impairment of operating assets (884) (652) (346) (360) (206) (209)Operating profit 47 393 0 100 682 790Operating profit margin in % 0.8 6.0 0.0 3.1 20.6 23.0Depreciation, amortization and impairment of non-operating assets (1) (2) 0 (5) (1) (2)Other (expenses) income (57) (28) (25) 456 (139) (168)Share of profit of associates 24 24 Other financial income 21 19 2 1 9 12EBITDA 920 1,062 322 922 759 845Investments in associates 223 172 11 2Net operating assets 8,512 8,738 6,736 6,809 3,817 4,000Total assets 14,807 14,379 8,114 7,882 4,989 5,315Total liabilities 7,092 6,793 5,610 5,375 2,783 3,387Cash flow from operating activities 621 968 153 260 376 493Cash flow margin in % 10.1 14.8 5.1 8.0 11.4 14.3Acquisition cost segment assets1 645 750 115 101 296 312Cash flow (used in) from investing activities2 (680) (625) (117) 601 (233) (316)Impairment loss3 (351) (51) (32) (3) (8)
PersonnelNumber of personnel 19,602 19,690 7,543 6,668 12,867 12,7101 Property, plant and equipment and intangible assets.2 Net investments in property, plant and equipment, Group companies, financial assets, intangible and other assets.3 Included in depreciation, amortization and impairment of operating and non-operating assets respectively.
Cons
olid
ated
Fin
ancia
l Sta
tem
ents
191
Africa Middle East Asia Pacific Corporate/Eliminations Total Group2011 2010 2011 2010 2011 2010 2011 2010
Reconciling measures of profit and loss to the consolidated statement of income of Group Holcim
Million CHF Notes 2011 2010
Operating profit 1,933 2,619
Depreciation, amortization and impairment of operating assets 9 2,025 1,894
Operating EBITDA 3,958 4,513
Dividends earned 11 3 5
Other ordinary income 11 70 42
Share of profit of associates 22 149 245
Other financial income 12 83 183
EBITDA 4,264 4,988
Depreciation, amortization and impairment of operating assets 9 (2,025) (1,894)
Depreciation, amortization and impairment of non-operating assets 11 (4) (40)
Interest earned on cash and marketable securities 12 108 79
Financial expenses 13 (1,210) (897)
Net income before taxes 1,131 2,236
4 Information by product line
Cement1
Million CHF 2011 2010
Statement of income, statement of financial position and statement of cash flows
Net sales to external customers 12,050 12,572
Net sales to other segments 1,329 1,376
Total net sales 13,379 13,948
Operating EBITDA 3,245 3,755
Operating EBITDA margin in % 24.3 26.9
Operating profit (loss) 1,969 2,551
Net operating assets 19,060 19,907
Acquisition cost segment assets2 1,309 1,495
Cash flow used in investing activities3 (1,440) (1,529)
Personnel
Number of personnel 51,492 51,1331 Cement, clinker and other cementitious materials.2 Property, plant and equipment and intangible assets.3 Net investments in property, plant and equipment, Group companies, financial assets, intangible and other assets.
Net sales to external customers are based primarily on the location of assets (origin of sales).
Non-current assets for this purpose consist of property, plant and equipment and intangible assets.
6 Change in net sales
Million CHF 2011 2010
Volume and price 1,632 (444)
Change in structure 171 1,147
Currency translation effects (2,712) (182)
Total (909) 521
7 Production cost of goods sold
Million CHF 2011 2010
Material expenses (3,385) (3,488)
Fuel expenses (1,447) (1,420)
Electricity expenses (957) (979)
Personnel expenses (1,777) (1,852)
Depreciation, amortization and impairment (1,719) (1,528)
Other production expenses (2,905) (3,079)
Change in inventory (25) (33)
Total (12,216) (12,379)
8 Distribution and selling expenses
Million CHF 2011 2010
Distribution expenses (4,563) (4,582)
Selling expenses (662) (696)
Total (5,226) (5,278)
Cons
olid
ated
Fin
ancia
l Sta
tem
ents
195
9 Summary of depreciation, amortization and impairment
Million CHF 2011 2010
Production facilities (1,719) (1,528)
Distribution and sales facilities (218) (246)
Administration facilities (88) (120)
Total depreciation, amortization and impairment of operating assets (A) (2,025) (1,894)
Impairment of long-term financial assets (338) 0
Impairment of investments in associates 0 (30)
Ordinary depreciation of non-operating assets (4) (4)
Unusual write-offs 0 (6)
Total depreciation, amortization and impairment of non-operating assets (B) (342) (40)
of which recognized in financial expenses (338) 0
Total depreciation, amortization and impairment (A + B) (2,367) (1,934)
Of which depreciation of property, plant and equipment (1,527) (1,711)
10 Change in operating EBITDA
Million CHF 2011 2010
Volume, price and cost (11) (284)
Change in structure 11 188
Currency translation effects (556) (21)
Total (556) (117)
11 Other income
Million CHF 2011 2010
Dividends earned 3 5
Other ordinary income 70 42
Depreciation, amortization and impairment of non-operating assets (4) (40)
Total 69 7
The position “Other ordinary income” mainly includes the gain from sale of property, plant and equipment and the gain from the remeasurement at fair value of previously held equity inter-est in acquired companies before business combinations.
Finan
cial
Info
rmat
ion
196
12 Financial income
Million CHF 2011 2010
Interest earned on cash and marketable securities 108 79
Other financial income 83 183
Total 191 262
In 2011 the position “Other financial income” includes the partial realization of the change in fair value of the compen-sation related to the nationalization of Holcim Venezuela in the amount of USD 61 million (CHF 54 million), respectively USD 164 million (CHF 171 million) in 2010. Additional informa-tion is disclosed in note 25.
In 2010 the position further included a negative value adjust-ment of CHF 42 million on “Long-term receivables – associates” (note 21).
The remaining amounts in both years relate primarily to income from loans and receivables.
The average rate of interest of financial liabilities at Decem-ber 31, 2011, was 4.4 percent (2010: 4.4).
The positions “Interest expenses” and “Other financial expenses” relate primarily to financial liabilities measured at amortized cost.
In 2011, the positions “Other financial expenses” and “Foreign exchange (loss) gain net” include an impairment charge and a reclassification of foreign exchange losses amounting to CHF 415 million recognized for AfriSam (Pty) Ltd as a result of the legal restructuring of that company in December 2011 (note 21).
The position “Financial expenses capitalized” comprises interest expenditures on large-scale projects during the reporting period.
Information about the Group’s exposure to the risk of changes in market interest rates and foreign currency exchange rates is disclosed within the section “Risk management” on pages 182 and 183.
13 Financial expenses
Million CHF 2011 2010
Interest expenses (655) (789)
Fair value changes on financial instruments (1) 0
Amortization on bonds and private placements (9) (10)
Unwinding of discount on provisions (54) (58)
Other financial expenses (437) (102)
Foreign exchange (loss) gain net (95) 5
Financial expenses capitalized 40 57
Total (1,210) (897)
Of which associates (415) 0
Cons
olid
ated
Fin
ancia
l Sta
tem
ents
197
14 Income taxes
Million CHF 2011 2010
Current taxes (600) (602)
Deferred taxes 151 (13)
Total (449) (615)
As a last restructuring step following the buyout of the non-controlling interest in Holcim (Canada) Inc., Holcim (US) Inc. transferred in the first quarter 2010 its entire stake in Holcim (Canada) Inc. to its parent company Holcim Ltd. As a conse-quence, Holcim (US) Inc. realized a capital gain in the amount of CHF 509 million, which was eliminated in the Group’s con-solidated accounts. The non-recurring tax charge of USD 171 million (CHF 178 million) on the capital gain appeared as of the first quarter 2010 in deferred taxes. However, this charge was cash-neutral as it was fully offset by tax losses carried forward.
“Income taxes paid” in 2011 are higher in comparison to the previous year. In the second quarter of 2010, Holcim (US) Inc. received a tax refund pursuant to a change in local tax law which enabled it to offset tax losses incurred in 2009 against taxable income of the previous five years. Further tax refunds were received by the two Indian companies in the third quarter 2010.
Current taxes include an income of CHF 48 million (2010: 94) relating to prior years.
The Group’s expected tax rate is a weighted average tax rate based on profits (losses) before taxes of the Group companies.
The increase of the Group’s effective tax rate is largely due to non-deductible impairments and write-offs on property, plant and equipment, goodwill and investments and to current period tax losses not capitalized related to certain countries.
Deferred tax by type
Million CHF 2011 2010
Property, plant and equipment (73) 49
Intangible and other long-term assets (9) (12)
Provisions 32 (39)
Tax losses carryforward 222 4
Other (20) (15)
Total 151 (13)
Reconciliation of tax rate
2011 2010
Group’s expected tax rate 39% 36%
Effect of non-deductible items 7% 3%
Effect of non-taxable items and income taxed at different tax rates (9%) (7%)
Effect on deferred tax balance due to changed tax rate (3%) (1%)
Net change of unrecognized tax loss carryforwards 9% 2%
Prior year taxes (4%) (4%)
Other items 1% 0%
Group’s effective tax rate 40% 28%
Finan
cial
Info
rmat
ion
198
16 Earnings per share
2011 2010
Earnings per share in CHF 0.86 3.69
Net income – shareholders of Holcim Ltd – as per statement of income (in million CHF) 275 1,182
Weighted average number of shares outstanding 319,802,593 319,980,805
Fully diluted earnings per share in CHF 0.86 3.69
Net income used to determine diluted earnings per share (in million CHF) 275 1,182
Weighted average number of shares outstanding 319,802,593 319,980,805
Adjustment for assumed exercise of share options 158,024 225,319
Weighted average number of shares for diluted earnings per share 319,960,617 320,206,124
15 Research and development
Research and development projects are carried out with a view to generate added value for customers through end user oriented products and services. Additionally, process innovation aims at environmental protection and production system improvements. Research and development costs of CHF 8 mil-lion (2010: 15) were charged directly to the consolidated state-ment of income. No significant costs were incurred for licenses obtained from third parties, nor was any major revenue gener-ated from licenses granted.
In conformity with the decision taken at the annual general meeting on May 5, 2011, a cash payment out of the capital contribution reserves related to 2010 of CHF 1.50 per registered share has been paid. This resulted in a total payout of CHF 480 million.
A cash payment out of the capital contribution reserves in respect of the financial year 2011 of CHF 1.00 per registered share, amounting to a maximum payment of CHF 327 million, is to be proposed at the annual general meeting of shareholders on April 17, 2012. These consolidated financial statements do not reflect this cash payment, since it will be effective in 2012 only.
17 Cash and cash equivalents
Million CHF 2011 2010
Cash at banks and in hand 748 790
Short-term deposits 2,199 2,596
Total 2,946 3,386
Bank overdrafts (450) (317)
Cash and cash equivalents for the purpose of the consolidated statement of cash flows 2,497 3,069
Cash and cash equivalents comprise cash at banks and in hand, deposits held on call with banks and other short-term highly liquid investments.
Bank overdrafts are included in current financial liabilities.
Cons
olid
ated
Fin
ancia
l Sta
tem
ents
199
18 Accounts receivable
Million CHF 2011 2010
Trade accounts receivable – associates 56 56
Trade accounts receivable – third parties 2,292 2,054
Other receivables – associates 8 35
Other receivables – third parties 359 436
Derivative assets 5 9
Total 2,719 2,590
Of which pledged/restricted 90 115
Overdue accounts receivable
Million CHF 2011 2010
Not overdue 2,224 2,146
Overdue 1 to 89 days 384 334
Overdue 90 to 180 days 85 99
Overdue more than 180 days 191 194
./. Allowances for doubtful accounts (165) (183)
Total 2,719 2,590
Due to the local nature of the business, specific terms and conditions for accounts receivable trade exist for local Group companies and as such Group guidelines are not required.
The overdue amounts relate to receivables where payment terms specified in the terms and conditions established with Holcim customers have been exceeded.
Allowance for doubtful accounts
Million CHF 2011 2010
January 1 (183) (217)
Change in structure 0 0
Allowance recognized (14) (32)
Amounts used 6 12
Unused amounts reversed 2 12
Currency translation effects 24 42
December 31 (165) (183)
Finan
cial
Info
rmat
ion
200
19 Inventories
Million CHF 2011 2010
Raw materials and additives 297 312
Semifinished and finished products 941 940
Fuels 350 314
Parts and supplies 463 472
Unbilled services 36 34
Total 2,086 2,072
In 2011, the Group recognized inventory write-downs to net realizable value of CHF 2 million (2010: 6). The carrying amount of inventories carried at net realizable value was CHF 61 million (2010: 42).
20 Prepaid expenses and other current assets
This position includes a discounted installment of USD 96 mil-lion (CHF 91 million), relating to a compensation receivable from the Bolivarian Republic of Venezuela. In 2010 this amounted to USD 96 million (CHF 90 million). Additional information is disclosed in note 25.
21 Long-term financial assets
Million CHF 2011 2010
Financial investments – third parties 147 58
Long-term receivables – associates 201 682
Long-term receivables – third parties 128 110
Derivative assets 84 71
Total 561 921
Of which pledged/restricted 6 8
The reduction in the position “Long-term receivables – asso-ciates” is largely due to an impairment charge recognized for AfriSam (Pty) Ltd. The impairment charge arose due to the legal restructuring of AfriSam (Pty) Ltd which resulted in Group Holcim losing significant influence over that company in December 2011 (note 13).
In 2010, the position “Long-term receivables – associates” included a negative value adjustment of CHF 42 million (note 12).
Long-term receivables and derivative assets are primarily denominated in CHF and USD. The repayment dates vary between one and 28 years.
Cons
olid
ated
Fin
ancia
l Sta
tem
ents
201
22 Investments in associates
Million CHF 2011 2010
January 1 1,432 1,529
Share of profit of associates 149 245
Dividends earned (137) (202)
Net additions 130 49
Reclassifications (128) 60
Impairments 0 (30)
Currency translation effects (21) (219)
December 31 1,425 1,432
Sales to and purchases from associates amounted to CHF 146 mil lion (2010: 168) and CHF 61 million (2010: 32) respectively.
The following amounts represent the Group’s share of assets, liabilities, net sales and net income of associates:
Aggregated financial information – associates
Million CHF 2011 2010
Assets 2,917 3,514
Liabilities (1,494) (2,146)
Net assets 1,423 1,368
Net sales 1,654 1,951
Net income 143 229
Net income and net assets also reflect the unrecognized share of losses of associates where equity accounting is discontinued as the carrying amount of the investment reached zero. The unrecognized share of losses of associates amounts to CHF 6 million (2010: 16). The accumulated unrecognized share of losses of associates amounts to CHF 2 million (2010: 64).
Finan
cial
Info
rmat
ion
202
23 Property, plant and equipment
Million CHF Land Buildings,
installations
Machines Furniture,
vehicles,
tools
Construction
in progress
Total
2011Net book value as at January 1 5,053 5,316 9,472 1,262 2,240 23,343Change in structure 145 77 129 61 4 415Additions 85 77 178 35 1,472 1,846Disposals (64) (13) (11) (20) 0 (108)Reclassifications 100 403 667 259 (1,420) 9Depreciation (111) (300) (841) (276) 0 (1,527)Impairment loss (charged to statement of income) (50) (33) (64) (2) (11) (160)Currency translation effects (61) (221) (473) (42) (87) (886)Net book value as at December 31 5,097 5,305 9,056 1,277 2,197 22,933
At cost of acquisition 6,251 9,484 19,229 3,551 2,273 40,787Accumulated depreciation/impairment (1,154) (4,178) (10,173) (2,274) (76) (17,855)Net book value as at December 31 5,097 5,305 9,056 1,277 2,197 22,933Net asset value of leased property, plant and equipment 1 54 16 65 0 136Of which pledged/restricted 60
2010Net book value as at January 1 5,585 5,633 9,765 1,512 2,998 25,493Change in structure 15 1 1 0 6 23Additions 71 75 170 24 1,551 1,891Disposals (103) (21) (21) (18) 0 (163)Reclassifications 91 522 1,398 159 (2,121) 49Depreciation (129) (333) (947) (302) 0 (1,711)Impairment loss (charged to statement of income) (4) (6) (10) (4) (18) (42)Currency translation effects (473) (555) (884) (109) (176) (2,197)Net book value as at December 31 5,053 5,316 9,472 1,262 2,240 23,343
At cost of acquisition 6,037 9,307 19,235 3,394 2,330 40,303Accumulated depreciation/impairment (984) (3,991) (9,763) (2,132) (90) (16,960)Net book value as at December 31 5,053 5,316 9,472 1,262 2,240 23,343Net asset value of leased property, plant and equipment 1 48 23 68 0 140Of which pledged/restricted 210
The net book value of CHF 22,933 million (2010: 23,343) repre-sents 56.2 percent (2010: 57.9) of the original cost of all assets. At December 31, 2011, the fire insurance value of property, plant and equipment amounted to CHF 35,956 million (2010: 33,912). Net gains on sale of property, plant and equipment amounted to CHF 30 million (2010: 66).
In 2011, the impairment loss relates mainly to Group region Europe (CHF 69 million in Spain and CHF 38 million in certain markets in Eastern Europe) and North America (CHF 32 million), which is a consequence of the decrease in demand for
constrution material in these regions. The impairment loss recognized in 2010 relates primarily to plants in Hungary, Spain and India. The impairment loss is included in production cost of goods sold in the statement of income.
Included in land, buildings and installations is investment property with a net book value of CHF 78 million (2010: 87). The fair value of this investment property amounted to CHF 81 million (2010: 87). Rental income related to investment property amounted to CHF 3 million (2010: 2).
Cons
olid
ated
Fin
ancia
l Sta
tem
ents
203
24 Intangible assets
Million CHF Goodwill Other
intangible
assets
Total
2011Net book value as at January 1 8,144 917 9,061Change in structure 77 45 122Additions 0 25 25Disposals 0 0 0Amortization 0 (94) (94)Impairment loss (charged to statement of income) (194) (49) (243)Currency translation effects (365) (53) (417)Net book value as at December 31 7,663 790 8,453
At cost of acquisition 7,887 1,558 9,445Accumulated amortization/impairment (229) (768) (996)Net book value as at December 31 7,663 790 8,453
2010Net book value as at January 1 8,926 1,057 9,983Change in structure 31 14 45Additions 2 31 33Disposals (27) (4) (31)Amortization 0 (119) (119)Impairment loss (charged to statement of income) (23) 0 (23)Currency translation effects (765) (62) (827)Net book value as at December 31 8,144 917 9,061
At cost of acquisition 8,179 1,541 9,720Accumulated amortization/impairment (35) (624) (659)Net book value as at December 31 8,144 917 9,061
The other intangible assets have finite useful lives, over which the assets are amortized. The corresponding amortization expense is recognized mainly in administration expenses.
In 2011, the impairment loss relates mainly to Group region Europe (CHF 174 million in Spain and CHF 65 million in certain markets in Eastern Europe) which is a consequence of the decrease in demand for construction materials in these regions. The recoverable amount for Spain was based on value-in-use by applying a pre-tax discount rate of 6.7 percent. The impair-ment loss is included in production cost of goods sold in the statement of income.
Impairment tests for goodwill
For the purpose of impairment testing, goodwill is allocated to a cash generating unit or to a group of cash generating units that are expected to benefit from the synergies of the respective business combination. The Group’s cash generating units are defined on the basis of geographical market, normally country-related. The carrying amount of goodwill allocated to the countries or regions stated below is significant in com parison with the total carrying amount of goodwill, while the carrying amount of goodwill allocated to the other cash generating units is individually not significant.
Finan
cial
Info
rmat
ion
204
Key assumptions used for value-in-use calculations in respect of goodwill 2011
Cash generating unit
(Million CHF)
Carrying
amount of
goodwill
Currency Pre-tax
discount
rate
Long-term
GDP
growth rate
India 1,417 INR 11.4% 8.1%
North America 1,762 USD/CAD 7.7% 2.7%
United Kingdom 833 GBP 9.5% 2.6%
Central Europe 513 CHF/EUR 6.6% 1.8%
Mexico 374 MXN 8.5% 3.2%
Others1 2,764 Various 6.3%–14.2% 1.3%–7.5%
Total 7,663
Key assumptions used for value-in-use calculations in respect of goodwill 2010
Cash generating unit
(Million CHF)
Carrying
amount of
goodwill
Currency Pre-tax
discount
rate
Long-term
GDP
growth rate
India 1,660 INR 11.4% 8.1%
North America 1,765 USD/CAD 7.7% 2.4%
United Kingdom 830 GBP 8.8% 2.5%
Central Europe 433 CHF/EUR 6.6% 2.0%
Mexico 413 MXN 7.9% 4.0%
Others1 3,043 Various 6.7%–14.7% 1.2%–7.5%
Total 8,1441 Individually not significant.
Sensitivity to changes in assumptions
With regard to the assessment of value-in-use of a cash gener-ating unit or a group of cash generating units, management believes that except for Spain (included in Others above) a reasonably possible change in the pre-tax discount rate of 1 percentage point would not cause the carrying amount of a cash generating unit or a group of cash generating units to materially exceed its recoverable amount. Using a pre-tax discount rate of 6.7 percent, the recoverable amount of Spain equals its carrying amount of CHF 52 million.
For the impairment test, the recoverable amount of a cash generating unit, which has been determined based on value- in-use, is compared to its carrying amount. An impairment loss is only recognized if the carrying amount of the cash generat-ing unit exceeds its recoverable amount. Future cash flows are discounted using the weighted average cost of capital (WACC).
The cash flow projections are based on a four-year financial planning period approved by management. Cash flows beyond the four-year budget period are extrapolated based either on steady or increasing sustainable cash flows. In any event, the
growth rate used to extrapolate cash flow projections beyond the four-year budget period does not exceed the long-term average growth rate for the relevant market in which the cash generating unit operates.
In respect of the goodwill allocated to “Others”, the same impair-ment model and parameters are used, as is the case with indi-vidually significant goodwill positions, except that different key assumptions are used depending on the risks associated with the respective cash generating units.
Cons
olid
ated
Fin
ancia
l Sta
tem
ents
205
25 Other long-term assets
This position includes an amount of USD 188 million (CHF 177 million), respectively USD 280 million (CHF 263 million) in 2010, relating to a compensation receivable from the Bolivarian Republic of Venezuela.
On September 4, 2010, Holcim Ltd signed a settlement with the Bolivarian Republic of Venezuela agreeing on the terms for Venezuela’s compensation payment for the June 2008 nation-alization of Holcim (Venezuela) C.A. and the suspension of the international arbitration procedure before the International Centre for Settlement of Investment Disputes (ICSID) in con-nection with that nationalization.
The agreed total compensation amount was USD 650 million (CHF 611 million), of which a first down-payment of USD 260 million (CHF 244 million) was received on September 10, 2010. A second payment of USD 97.5 (CHF 87 million) was received on September 12, 2011. The remaining compensation amount of USD 292.5 million (CHF 275 million) is to be paid in three equal yearly installments of USD 97.5 million (CHF 92 million) start-ing in September 2012. The resulting change in fair value in 2010 amounted to USD 410 million (CHF 426 million) of which USD 164 million (CHF 171 million) was realized through “other financial income”. In 2011 a further USD 61 million (CHF 54 mil-lion) was realized through “other financial income”.
26 Joint ventures
The following amounts represent the effect of proportionately consolidated assets, liabilities and sales and results of significant joint ventures disclosed on pages 229 and 230.
The amounts are included in the consolidated statement of financial position and consolidated statement of income.
Statement of financial position
Million CHF 2011 2010
Current assets 100 98
Long-term assets 354 366
Total assets 454 464
Short-term liabilities 63 57
Long-term liabilities 93 102
Total liabilities 155 159
Net assets 298 305
Statement of income
Million CHF 2011 2010
Net sales 336 343
Operating profit 57 53
Net income from joint ventures 47 35
Sales to and purchases from significant joint ventures amounted to CHF 5 million (2010: 5) and CHF 63 million (2010: 95) respec-tively.
Finan
cial
Info
rmat
ion
206
27 Trade accounts payable
Million CHF 2011 2010
Trade accounts payable – associates 12 14
Trade accounts payable – third parties 2,384 2,137
Advance payments from customers 151 152
Total 2,547 2,303
28 Financial liabilities
Million CHF 2011 2010
Current financial liabilities – associates 3 1
Current financial liabilities – third parties 1,433 1,384
Current portion of long-term financial liabilities 1,377 1,076
Derivative liabilities 6 7
Total current financial liabilities 2,820 2,468
Long-term financial liabilities – associates 9 9
Long-term financial liabilities – third parties 11,514 12,142
Derivative liabilities 152 130
Total long-term financial liabilities 11,675 12,281
Total 14,495 14,749
Of which secured 171 167
Details of total financial liabilities
Million CHF 2011 2010
Loans from financial institutions 4,528 4,188
Bonds and private placements 9,713 10,316
Total loans and bonds 14,240 14,504
Obligations under finance leases (note 29) 97 108
Derivative liabilities (note 30) 158 137
Total 14,495 14,749
“Loans from financial institutions” include amounts due to banks and other financial institutions. Repayment dates vary between one and 14 years. CHF 1,925 million (2010: 1,783) are due within one year.
Unutilized credit lines totaled CHF 6,674 million (2010: 8,867) at year-end 2011, of which CHF 4,319 million (2010: 6,378) are committed.
Cons
olid
ated
Fin
ancia
l Sta
tem
ents
207
Financial liabilities by currency
Currency 2011 2010
Million CHF In % Interest rate1 Million CHF In % Interest rate1
CHF 3,934 27.1 2.7 3,709 25.1 2.7
USD 3,927 27.1 3.4 4,097 27.8 3.4
EUR 3,009 20.8 5.1 3,105 21.0 4.8
GBP 724 5.0 7.5 731 5.0 7.4
AUD 994 6.9 7.2 816 5.5 7.7
MXN 442 3.0 6.2 446 3.0 6.4
CAD 299 2.1 5.9 303 2.1 5.9
Others 1,166 8.0 6.5 1,542 10.5 6.2
Total 14,495 100.0 4.4 14,749 100.0 4.41 Weighted average nominal interest rate on financial liabilities at December 31.
Interest rate structure of total financial liabilities
Million CHF 2011 2010
Financial liabilities at fixed rates 7,706 8,541
Financial liabilities at floating rates 6,790 6,208
Total 14,495 14,749
Financial liabilities that are hedged to a fixed or floating rate are disclosed on a post hedge basis.
Information on the maturity of financial instruments is dis-closed in the section “Risk management” on page 182.
Total expense for operating leases recognized in the consoli-dated statement of income in 2011 was CHF 165 million (2010: 170). There are no individually significant operating lease agreements.
The liabilities from finance leases due within one year are included in current financial liabilities and liabilities due there-after are included in long-term financial liabilities (note 28). There are no individually significant finance lease agreements.
Cons
olid
ated
Fin
ancia
l Sta
tem
ents
211
30 Derivative financial instruments
Derivative assets with maturities exceeding one year are included in long-term financial assets (note 21) and derivative assets with maturities less than one year are included in accounts receivable (note 18).
Derivative liabilities are included in financial liabilities (note 28).
Derivative assets and liabilities
Fair value
assets
Fair value
liabilities
Nominal
amount
Fair value
assets
Fair value
liabilities
Nominal
amount
Million CHF 2011 2011 2011 2010 2010 2010
Fair value hedges
Interest rate 81 0 628 78 0 863
Currency 0 0 0 0 0 0
Cross-currency 0 15 85 0 12 150
Total fair value hedges 81 15 713 78 12 1,013
Cash flow hedges
Interest rate 0 3 78 0 3 94
Currency 5 7 141 0 4 76
Cross-currency 0 133 527 0 117 823
Total cash flow hedges 5 143 746 0 124 993
Net investment hedges
Currency 0 0 0 0 0 0
Cross-currency 3 0 59 2 1 61
Total net investment hedges 3 0 59 2 1 61
Held for trading
Interest rate 0 0 0 0 0 0
Currency 0 0 0 0 0 0
Cross-currency 0 0 0 0 0 0
Total held for trading 0 0 0 0 0 0
Total 89 158 1,518 80 137 2,067
Finan
cial
Info
rmat
ion
212
31 Deferred taxes
Deferred tax by type of temporary difference 2011 2010
Million CHF
Deferred tax assets
Property, plant and equipment 19 32
Intangible and other long-term assets 26 40
Provisions 199 171
Tax losses carryforward 595 385
Other 291 309
Total 1,129 937
Deferred tax liabilities
Property, plant and equipment 2,348 2,367
Intangible and other long-term assets 254 281
Provisions 3 5
Other 96 102
Total 2,701 2,755
Deferred tax liabilities net 1,571 1,818
Reflected in the statement of financial position as follows:
Deferred tax assets (490) (385)
Deferred tax liabilities 2,061 2,203
Deferred tax liabilities net 1,571 1,818
Temporary differences for which no deferred tax is recognized
Million CHF 2011 2010
On unremitted earnings of subsidiary companies (taxable temporary difference) 1,946 3,303
On tax losses carryforward (deductible temporary difference) 1,488 879
Tax losses carryforward
Loss carry-
forwards
Tax
effect
Loss carry-
forwards
Tax
effect
2011 2011 2010 2010
Million CHF
Total tax losses carryforward 3,527 1,013 2,281 650
Of which reflected in deferred taxes (2,039) (595) (1,402) (385)
Total tax losses carryforward not recognized 1,488 418 879 265
Expiring as follows:
1 year 1 0 35 9
2 years 14 4 3 1
3 years 21 4 23 5
4 years 8 2 10 2
5 years 19 4 22 6
Thereafter 1,425 403 786 242
Cons
olid
ated
Fin
ancia
l Sta
tem
ents
213
32 Provisions
Site restoration
and other environ-
mental provisions
Specific
business
risks
Other
provisions
Total
2011
Total
2010
Million CHF
January 1 618 239 522 1,379 1,515
Change in structure 51 4 13 68 3
Provisions recognized 172 51 183 406 443
Provisions used during the year (51) (30) (185) (266) (205)
Provisions reversed during the year (29) (57) (42) (128) (259)
Of which long-term provisions 705 153 323 1,181 1,123
Site restoration and other environmental provisions represent the Group’s legal or constructive obligations of restoring a site. The timing of cash outflows of this provision is dependent on the completion of raw material extraction and the commence-ment of site restoration.
Specific business risks comprise litigation and restructuring costs which arise during the normal course of business. Provi-sions for litigations mainly relate to antitrust investigations, product liability as well as tax claims and are set up to cover legal and administrative proceedings. In 2011, it included several provisions for risks related to direct and indirect taxes of CHF 32 million (2010: 32) and a provision of CHF 20 million (2010: 21) related to the German antitrust investigation set up in 2002. Total provisions for litigations amounted to CHF 130 mil-lion (2010: 180) on December 31. The timing of cash outflows of provisions for litigations is uncertain since it will largely depend upon the outcome of administrative and legal proceed-ings. Provisions for restructuring costs relate to various restruc-turing programs and amounted to CHF 64 million (2010: 59) on December 31. These provisions are expected to result in future cash outflows mainly within the next one to three years.
Other provisions relate mainly to provisions that have been set up to cover other contractual liabilities. The composition of this item is extremely manifold and comprises, as of December 31, among other things: various severance payments to employees of CHF 101 million (2010: 111), provisions for vacation and over-time of CHF 93 million (2010: 91), provisions for health insurance and pension schemes, which do not qualify as benefit obliga-tions, of CHF 23 million (2010: 22), provisions related to sales and other taxes of CHF 58 million (2010: 71) and pro visions for contingent liabilities arising from business combinations of CHF 52 million (2010: 77). The expected timing of the future cash outflows is uncertain.
Finan
cial
Info
rmat
ion
214
33 Employee benefits
Personnel expenses 2011 2010
Million CHF
Production and distribution 2,641 2,759
Marketing and sales 395 415
Administration 823 861
Total 3,859 4,035
Personnel expenses and number of personnel
The Group’s total personnel expenses, including social charges, are recognized in the relevant expenditure line by function in the consolidated statement of income and amounted to CHF 3,859 million (2010: 4,035). As of December 31, 2011, the Group employed 80,967 people (2010: 80,310).
Defined benefit pension plans
Some Group companies provide pension plans for their em-ployees which, under IFRS, are considered as defined benefit pension plans. Provisions for pension obligations are estab-lished for benefits payable in the form of retirement, disability and surviving dependent’s pensions. The benefits offered vary according to the legal, fiscal and economic conditions of each country. Benefits are dependent on years of service and the respective employee’s compensation and contribution. A net pension asset is recorded only to the extent that it does not exceed the present value of any economic benefits available in the form of refunds from the plan or reductions in future contributions to the plan and any unrecognized actuarial losses and past service costs. The obligation resulting from the defined benefit pension plans is determined using the projected
unit credit method. Unrecognized gains and losses resulting from changes in actuarial assumptions are recognized as income (expense) over the expected average remaining work-ing lives of the participating employees, but only to the extent that the net cumulative unrecognized amount exceeds 10 per-cent of the greater of the present value of the defined benefit obligation and the fair value of plan assets at the end of the previous year.
Other post-employment benefit plans
The Group operates a number of other post-employment bene-fit plans. The method of accounting for these provisions is similar to the one used for defined benefit pension schemes. A number of these plans are not externally funded, but are covered by provisions in the statements of financial position of the respective Group companies.
The following table reconciles the funded, partially funded and unfunded status of defined benefit pension plans and other post-employment benefit plans to the amounts recognized in the statement of financial position.
Reconciliation of retirement benefit plans to the statement of financial position
Million CHF 2011 2010
Net liability arising from defined benefit pension plans 175 222
Net liability arising from other post-employment benefit plans 69 69
Net liability 244 291
Reflected in the statement of financial position as follows:
Other long-term assets (41) (26)
Defined benefit obligations 285 317
Net liability 244 291
Cons
olid
ated
Fin
ancia
l Sta
tem
ents
215
Retirement benefit plans
Defined benefit
pension plans
Other post-employment
benefit plans
Million CHF 2011 2010 2011 2010
Present value of funded obligations 3,026 2,786 0 0
Fair value of plan assets (2,469) (2,405) 0 0
Plan deficit of funded obligations 557 381 0 0
Present value of unfunded obligations 225 225 89 83
Net liability from funded and unfunded plans 175 222 69 69
Amounts recognized in the statement of income are as follows:
Current service costs 72 78 1 1
Interest expense on obligations 125 149 4 4
Expected return on plan assets (129) (137) 0 0
Amortization of actuarial losses 17 62 0 0
Past service costs 6 1 0 0
Losses on curtailments and settlements 2 0 0 0
Limit of asset ceiling (1) (50) 0 0
Others (4) (4) 0 0
Total (included in personnel expenses) 88 99 5 5
Actual return on plan assets 39 51 0 0
Present value of funded and unfunded obligations
Opening balance as per January 1 3,011 3,028 83 89
Current service costs 72 78 1 1
Employees’ contributions 20 22 0 0
Interest expense 125 149 4 4
Actuarial losses (gains) 143 147 6 (1)
Currency translation effects 0 (211) 0 (5)
Benefits paid (150) (183) (5) (5)
Past service costs 8 9 0 0
Change in structure 34 (9) 0 0
Curtailments 0 (10) 0 0
Settlements (12) (9) 0 0
Closing balance as per December 31 3,251 3,011 89 83
Finan
cial
Info
rmat
ion
216
Retirement benefit plans
Defined benefit
pension plans
Other post-employment
benefit plans
Million CHF 2011 2010 2011 2010
Fair value of plan assets
Opening balance as per January 1 2,405 2,541 0 0
Expected return on plan assets 129 137 0 0
Actuarial (losses) gains (89) (86) 0 0
Currency translation effects (10) (148) 0 0
Contribution by the employer 110 109 5 4
Contribution by the employees 20 22 0 0
Benefits paid (130) (166) (5) (4)
Change in structure 45 0 0 0
Settlements (10) (4) 0 0
Closing balance as per December 31 2,469 2,405 0 0
Plan assets consist of:
Equity instruments of Holcim Ltd or subsidiaries 1 1 0 0
Equity instruments of third parties 877 846 0 0
Debt instruments of Holcim Ltd or subsidiaries 24 23 0 0
Debt instruments of third parties 591 592 0 0
Land and buildings occupied or used by third parties 364 330 0 0
Other 613 613 0 0
Total fair value of plan assets 2,469 2,405 0 0
Principal actuarial assumptions used at the end of the reporting period
Discount rate 3.8% 4.4% 4.2% 4.9%
Expected return on plan assets 4.8% 5.4%
Future salary increases 2.7% 2.9%
Medical cost trend rate 7.2% 7.2%
The overall expected rate of return on plan assets is deter-mined based on the market prices prevailing on that date, applicable to the period over which the obligation is to be settled.
Cons
olid
ated
Fin
ancia
l Sta
tem
ents
217
34 Share compensation plans
Employee share purchase plan
Holcim has an employee share ownership plan for all employees of Swiss subsidiaries and some executives from Group compa-nies. This plan entitles employees to acquire a limited amount of discounted Holcim shares generally at 70 percent of the market value based on the prior-month average share price. The shares cannot be sold for a period of two years from the date of purchase. The total expense arising from this plan amounted to CHF 1.7 million in 2011 (2010: 1.7).
Share plan for management of Group companies
Part of the variable, performance-related compensation for management of Group companies is paid in Holcim shares, which are granted based on the market price of the share in the following year. The shares cannot be sold by the employee for the next three years. The total expense arising from this share plan amounted to CHF 6.5 million in 2011 (2010: 6.4).
Senior management share plans
Part of the variable, performance-related compensation of senior management is paid in Holcim shares, which are granted based on the market price of the share in the following year. The shares cannot be sold nor pledged by the employee for the next five years. The total expense arising from these share plans amounted to CHF 1.9 million in 2011 (2010: 2).
No dilution of Holcim shares occurs as all shares granted under these plans are purchased from the market.
Share option plans
Two types of share options are granted to senior management of the Holcim Group, the ones, which are granted as part of the annual variable compensation and those, which are allotted to the Executive Committee upon appointment. In both cases, each option represents the right to acquire one registered share of Holcim Ltd at the market price of the shares at the date of grant (see explanations on page 144).
Experience adjustments
Defined benefit pension plans Other post-employment benefit plans
On plan liabilities (19) (33) 0 24 (17) 0 (3) (6) (3) 3
On plan assets (89) (86) 73 (341) 13 0 0 0 0 0
A 1 percentage point change in the assumed medical cost trend rate would have no material effect on the current service and interest cost components as well as on the accumulated post-employment benefit obligations for medical cost.
Expected contributions by the employer to be paid to the post-employment benefit plans during the annual period beginning after the end of the reporting period are CHF 105 million (2010: 119).
Finan
cial
Info
rmat
ion
218
The contractual term of the first type of option plan is eight years, with immediate vesting but exercise restrictions for a period of three years following the grant date.
The contractual term of the second type of option plan is twelve years and the options have a vesting period (service-related only) of nine years from the date of grant, with sale and pledge restrictions.
The Group has no legal or constructive obligation to repur-chase or settle the options in cash.
Movements in the number of share options outstanding and their related weighted average exercise prices are as follows:
Weighted average Number1 Number1
exercise price1 2011 2010
January 1 CHF 64.37 1,250,359 1,054,493
Granted and vested (individual component of variable compensation) CHF 67.15 149,763 131,631
Granted and vested (single allotment) CHF 71.50 67,100 67,100
Forfeited 0 0
Exercised 0 2,865
Lapsed 0 0
December 31 CHF 64.98 1,467,222 1,250,359
Of which exercisable at the end of the year 331,004 259,9211 Adjusted to reflect former share splits and/or capital increases.
Share options outstanding at the end of the year have the fol-lowing expiry dates and give the right to acquire one registered share of Holcim Ltd at the exercise prices as listed below:
Option grant date Expiry date Exercise price1 Number1 Number1
2011 2010
2002 2014 CHF 67.15 201,300 201,300
2003 20122 CHF 33.85 45,910 45,910
2003 20152 CHF 67.153 33,550 33,550
2004 20132 CHF 63.35 34,341 34,341
2004 20162 CHF 67.153 33,550 33,550
2005 20142 CHF 74.54 71,423 71,423
2006 2014 CHF 100.69 58,573 58,573
2007 2015 CHF 125.34 49,674 49,674
2008 2016 CHF 104.34 71,083 71,083
2008 2020 CHF 67.153 67,100 67,100
2009 2017 CHF 38.26 385,124 385,124
2010 2018 CHF 71.15 131,631 131,631
2010 2022 CHF 75.40 33,550 33,550
2010 2022 CHF 81.45 33,550 33,550
2011 2019 CHF 67.15 149,763
2011 2023 CHF 71.50 67,100
Total 1,467,222 1,250,3591 Adjusted to reflect former share splits and/or capital increases.2 Due to trade restrictions in 2008, the expiry date of the annual options granted for the years 2003 to 2005 has been extended by one year.3 Valued according to the single allocation in 2002.
Cons
olid
ated
Fin
ancia
l Sta
tem
ents
219
In 2011 no options were exercised. In 2010, options exercised resulted in 2,865 shares having been issued based on an aver-age share price of CHF 33.85.
The fair value of options granted for the year 2011 using the Black Scholes valuation model is CHF 13.45 (2010: 16.59). The significant inputs into the model are the share price and an exercise price of CHF 58.50 (2010: 67.15) at the date of grant, an expected volatility of 32.9 percent (2010: 31.6), an expected option life of 6 years (2010: 6), a dividend yield of 2.6 percent (2010: 2.2) and an annual risk-free interest rate of 0.3 percent
(2010: 1.3). Expected volatility was determined by calculating the historical volatility of the Group’s share price over the respective vesting period.
All shares granted under these plans are either purchased from the market or derived from treasury shares. The total per-sonnel expense arising from the grant of options based on the individual component of variable compensation amounted to CHF 2.4 million in 2011 (2010: 2.4).
35 Construction contracts
Million CHF 2011 2010
Contract revenue recognized during the year 1,118 1,341
Contract costs incurred and recognized profits (less recognized losses) to date 2,365 2,963
Progress billings to date (2,366) (2,982)
Due to contract customers at the end of the reporting period (1) (19)
Of which:
Due from customers for contract work 33 23
Due to customers for contract work (34) (42)
Finan
cial
Info
rmat
ion
220
37 Contingencies, guarantees and commitments
Contingencies
In the ordinary course of business, the Group is involved in law-suits, claims, investigations and proceedings, including product liability, commercial, environmental, health and safety matters, etc. There are no single matters pending that the Group expects to be material in relation to the Group’s business, financial position or results of operations.
At December 31, 2011, the Group’s contingencies amounted to CHF 406 million (2010: 363). It is possible, but not probable, that the respective legal cases will result in future liabilities.
The Group operates in countries where political, economic, social and legal developments could have an impact on the Group’s operations. The effects of such risks which arise in the normal course of business are not foreseeable and are therefore not included in the accompanying consolidated financial statements.
Guarantees
At December 31, 2011, guarantees issued to third parties and associates in the ordinary course of business amounted to CHF 721 million (2010: 508).
Commitments
In the ordinary course of business, the Group enters into purchase commitments for goods and services, buys and sells investments, associated companies and Group companies or portions thereof. It is common practice that the Group makes offers or receives call or put options in connection with such acquisitions and divestitures.
At December 31, 2011, the Group’s commitments amounted to CHF 1,210 million (2010: 1,236), of which CHF 558 million (2010: 342) relate to the purchase of property, plant and equip-ment.
36 Details of shares
Number of registered shares
December 31 2011 2010
Total outstanding shares 319,816,295 319,955,293
Treasury shares
Shares reserved for convertible bonds 5,785,824 5,785,824
Shares reserved for call options 1,467,222 1,250,359
Unreserved treasury shares 17,035 94,900
Total treasury shares 7,270,081 7,131,083
Total issued shares 327,086,376 327,086,376
Shares out of conditional share capital
Reserved for convertible bonds 1,422,350 1,422,350
Unreserved 0 0
Total shares out of conditional share capital 1,422,350 1,422,350
Total shares 328,508,726 328,508,726
The par value per share is CHF 2. The share capital amounts to nominal CHF 654 million (2010: 654) and the treasury shares amount to CHF 486 million (2010: 476).
Cons
olid
ated
Fin
ancia
l Sta
tem
ents
221
38 Monetary net current assets by currency
Million CHF Cash and
marketable
securities
Accounts
receivable
Trade
accounts
payable
Current
financial
liabilities
Other
current
liabilities
Total
2011
Total
2010
EUR 324 555 486 811 401 (819) (615)
GBP 89 248 361 20 117 (161) 55
CHF 303 114 87 376 206 (252) (25)
USD 561 377 387 287 295 (31) (255)
CAD 20 183 153 1 100 (51) (40)
MXN 29 117 113 182 33 (182) (25)
INR 1,029 136 217 45 603 300 39
THB 40 27 37 76 20 (66) (10)
IDR 109 60 55 27 58 29 40
PHP 70 36 31 27 24 24 28
AUD 55 391 200 671 221 (646) (100)
Others 322 475 420 297 250 (170) (300)
Total 2,951 2,719 2,547 2,820 2,328 (2,025) (1,208)
39 Cash flow used in investing activities
Million CHF 2011 2010
Purchase of property, plant and equipment net
Replacements (890) (639)
Proceeds from sale of property, plant and equipment 138 229
Capital expenditures on property, plant and equipment to maintain
productive capacity and to secure competitiveness (752) (410)
Expansion investments (886) (1,182)
Total purchase of property, plant and equipment net (A) (1,638) (1,592)
Acquisition of participation in Group companies (net of cash and cash equivalents acquired)1 (137) (60)
Disposal of participation in Group companies (net of cash and cash equivalents disposed of) 5 0
Purchase of financial assets, intangible and other assets
Increase in financial investments including associates (137) (252)
Increase in other financial assets, intangible and other assets (105) (194)
Total purchase of financial assets, intangible and other assets (242) (446)
Disposal of financial assets, intangible and other assets
Decrease in financial investments including associates 32 61
Decrease in other financial assets, intangible and other assets 189 675
Total disposal of financial assets, intangible and other assets 221 736
Total (purchase) disposal of financial assets, intangible and other assets and businesses net (B) (154) 230
Total cash flow used in investing activities (A + B) (1,791) (1,362)1 Including goodwill of new Group companies.
Finan
cial
Info
rmat
ion
222
Cash flow from acquisitions and disposals of Group companies
Acquisitions Disposals
Million CHF 2011 2010 2011 2010
Current assets (131) (28) 20 0
Property, plant and equipment (424) (23) 9 0
Other assets (55) (13) 6 0
Current liabilities 123 11 (24) 0
Long-term provisions 69 7 (1) 0
Other long-term liabilities 107 4 0 0
Net assets (311) (42) 10 0
Non-controlling interest 29 1 (6) 0
Net assets (acquired) disposed (282) (41) 4 0
Goodwill (acquired) disposed (79) (28) 2 0
Fair value of previously held (retained) equity interest 127 0 (6) 0
Net gain on disposals 0 0 3 0
Total (purchase) disposal consideration (234) (69) 3 0
Acquired cash and cash equivalents 38 1 (2) 0
Contingent consideration 0 0 0 0
Payables and loan notes 59 8 4 0
Net cash flow (137) (60) 5 0
Cons
olid
ated
Fin
ancia
l Sta
tem
ents
223
40 Transactions and relations with members
of the Board of Directors and senior management
Key management compensation
Board of Directors
In 2011, twelve non-executive members of the Board of Directors received a total remuneration of CHF 3.1 million (2010: 2.9) in the form of short-term employee benefits of CHF 2.0 million (2010: 1.8), post-employment benefits of CHF 0.1 million (2010: 0.1), share-based payments of CHF 0.9 million (2010: 0.9) and other compensation of CHF 0.2 million (2010: 0.1).
Senior management
The total annual compensation for the 14 members of senior management (including CEO) amounted to CHF 31.6 million (2010: 36.7). This amount comprises of base salary and variable cash compensation of CHF 18.2 million (2010: 18.2), share-based compensations of CHF 4.4 million (2010: 4.4), employer contri-butions to pension plans of CHF 5.1 million (2010: 5.3) and “Others” compensation of CHF 4.0 million (2010: 8.8) which includes, according to the rules of SIX Swiss Exchange, the contributions from the Holcim International Pension Trust for the additional financing of retirement benefits in the amount of CHF 3.6 million (2010: 8.3). The CEO received a base salary plus variable compensation in cash of CHF 2.6 million (2010: 2.5), share based compensation of CHF 0.8 million (2010: 0.8), and employer contributions to pension benefits of CHF 0.4 million (2010: 0.4). As a result, total compensation, before the addi-tional contributions for the financing of retirement benefits, amounted to CHF 3.8 million (2010: 3.7). The CEO’s total com-pensation, in accordance with the rules of SIX Swiss Exchange, amounted to CHF 5.7 million (2010: 8.7). In 2011 the CEO’s total compensation included additional contributions from the Holcim International Pension Trust in the amount of CHF 1.8 mil-lion (2010: 5), based on actuarial considerations and disclosed under “Others”. In accordance with Art. 663bbis of the Swiss Code of Obligations (transparency law), the base salary and the variable cash compensation are disclosed, including foreign withholding tax. Further included in the contribution to pen-sion plans are the employer’s contri butions to social security (AHV/IV).
The following table provides details on the total compensation awarded to the individual members of the Board of Directors, the highest compensation paid to a senior management mem-ber and the total amount of senior management compensation.
Compensation for former members of governing bodies
In the year under review, compensation in the amount of CHF 4.2 million (2010: 2.9) was paid to one former member of the Board of Directors (2010: one) and five (2010: three) former members of senior management. In 2010, this amount included, according to the rules of SIX Swiss Exchange, the expense of the employer’s trust for the additional financing of the pension benefit of one former member of the senior management in the amount of CHF 0.5 million.
Loans
As at December 31, 2011, and December 31, 2010, there were no loans outstanding, to members of the Board of Directors and members of senior management.
Finan
cial
Info
rmat
ion
224
Compensation Board of Directors/senior management1
Name Position Base Salary
Cash Shares2
Rolf Soiron Chairman Number 1,491
CHF 595,680 80,000
Beat Hess Deputy Chairman since May 5, 2011 Number 1,491
CHF 190,833 80,000
Erich Hunziker Deputy Chairman since May 5, 2011, Chairman of the Number 1,491
Dieter Spälti Member of the Board of Directors, Number 1,491
Member of the Audit Committee CHF 110,000 80,000
Robert F. Spoerry Member of the Board of Directors until May 5, 2011 Number 621
CHF 33,333 33,333
Total Board of Directors Number 16,401
(non-executive members) CHF 1,980,647 880,000
Markus Akermann6 Executive member of the Board of Directors, Number
CEO CHF 2,223,500
Variable compensation
in percentage of base salary
Total senior management8 Number
CHF 15,377,609
Variable compensation
in percentage of base salary1 Compensation for the Board of Directors and senior management is disclosed gross of withholding tax and employee social security contributions.
“Other compensation” includes employer contributions to pension plans (state old age and survivors insurance [AHV]/disability insurance [IV], pension funds) as well as a lump sum allowance, long-service benefits, government child payments, etc. The parameters for the fair value calculation of shares and options allocated in the year under review are disclosed in note 34 “Share compensation plans”.
2 The shares were valued at the average market price in the period from January 1, 2012 to February 15, 2012, and are subject to a five-year sale and pledge restriction period.
3 Value of the options according to the Black Scholes model at the time of allocation.4 In line with the rules of SIX Swiss Exchange, these amounts include primarily the expenses of the contributions from the Holcim International Pension Trust
in the amount of CHF 3.6 million (2010: 8.3), which do not affect the statement of income of the Group in the reporting period.5 Including director’s fees from subsidiary companies.6 Member of senior management receiving the highest compensation.7 Includes the expense of the employer’s trust for the additional financing of the pension benefits, according to the rules of SIX Swiss Exchange. Excluding this contribution,
the total compensation for 2011 would have amounted to CHF 3.8 million (2010: 3.7).8 Including executive member of the Board of Directors, CEO.
Cons
olid
ated
Fin
ancia
l Sta
tem
ents
225
Variable Compensation Other compensation Total Total
The tables show the number of shares and options held by members of the Board of Directors and senior management as of December 31, 2011, and December 31, 2010, respectively.
The total number of shares and call options comprise privately acquired shares and call options, and shares allocated under profit-sharing and compensation schemes. Non-executive
members of the Board of Directors did not receive any options from compensation and profit-sharing schemes.
Board of Directors1
Name Position Total number
of shares 2011
Total number
of call options 2011
Rolf Soiron Chairman 36,879
Beat Hess Deputy Chairman 880
Erich Hunziker Deputy Chairman, Governance, Nomination & 10,916
Compensation Committee Chairman
Christine Binswanger Member 3,926
Alexander Gut Member 900
Peter Küpfer Member, 10,915 37,0002
Audit Committee Chairman 31,0003
Adrian Loader Member 6,680
Andreas von Planta Member 10,674
Thomas Schmidheiny Member 65,774,099
Wolfgang Schürer Member 43,620
Dieter Spälti Member 30,966
Total Board of Directors (non-executive members) 65,930,455 68,000
Board of Directors
Name Position Total number
of shares 2010
Total number
of call options 2010
Rolf Soiron Chairman, Governance, Nomination &
Compensation Committee Chairman
35,713
Andreas von Planta Deputy Chairman 9,508
Christine Binswanger Member 2,760
Beat Hess Member 200
Erich Hunziker Member 9,750
Peter Küpfer Member, 9,749 37,0002
Audit Committee Chairman 31,0003
Adrian Loader Member 5,514
Thomas Schmidheiny Member 59,568,933
Wolfgang Schürer Member 42,454
Dieter Spälti Member 21,404
Robert F. Spoerry Member 8,179
Total Board of Directors (non-executive members) 59,714,164 68,0001 From allocation, shares are subject to a five-year sale and pledge restriction period.2 Exercise price: CHF 70; Ratio 1:1; Style: American; Maturity: 19.8.2014.3 Exercise price: CHF 80; Ratio 1:1; Style: American; Maturity: 12.11.2013.
Cons
olid
ated
Fin
ancia
l Sta
tem
ents
227
Senior management1
Name Position Total number
of shares 2011
Total number
of call options 2011
Markus Akermann Executive Member of the Board of Directors, CEO 93,996 290,096
Thomas Aebischer Member of the Executive Committee, CFO 3,417 33,550
Urs Böhlen Member of the Executive Committee 18,227 82,319
Patrick Dolberg Member of the Executive Committee 12,789 66,619
Paul Hugentobler Member of the Executive Committee 75,796 119,769
Benoît-H. Koch Member of the Executive Committee 19,383 104,763
Roland Köhler Member of the Executive Committee, CEO HGRS 9,323 65,581
Andreas Leu Member of the Executive Committee 10,434 46,773
Ian Thackwray Member of the Executive Committee 2,828 45,786
Javier de Benito Area Manager 19,123 21,855
Urs Fankhauser Area Manager 3,319
Aidan Lynam Area Manager 2,625 3,675
Bernard Terver Area Manager 19,262 23,600
Jacques Bourgon Corporate Functional Manager 6,302 19,996
Total senior management 296,824 924,382
Senior management
Name Position Total number
of shares 2010
Total number
of call options 2010
Markus Akermann Executive Member of the Board of Directors, CEO 89,429 261,916
Urs Böhlen Member of the Executive Committee 15,943 69,801
Patrick Dolberg Member of the Executive Committee 10,505 53,609
Paul Hugentobler Member of the Executive Committee 73,511 105,704
Thomas Knöpfel Member of the Executive Committee 34,284 99,896
Benoît-H. Koch Member of the Executive Committee 28,239 94,133
Roland Köhler Member of the Executive Committee, CEO HGRS 7,411 53,693
Theophil H. Schlatter Member of the Executive Committee, CFO 59,627 120,883
Ian Thackwray Member of the Executive Committee 1,589 33,550
Javier de Benito Area Manager 17,095 18,885
Andreas Leu Area Manager 9,455 9,124
Aidan Lynam Area Manager 1,226
Bernard Terver Area Manager 18,132 20,960
Jacques Bourgon Corporate Functional Manager 7,202 16,783
Stefan Wolfensberger Corporate Functional Manager 5,386 17,894
Total senior management 379,034 976,8311 From allocation, shares are subject to a five-year and options to a three-year and nine-year sale restriction period respectively.
The total number of shares and call options include both pri-vately acquired shares and call options, and those allocated under the Group’s profit-sharing and compensation schemes. Options are issued solely on registered shares of Holcim Ltd.
Finan
cial
Info
rmat
ion
228
Other transactions
As part of the employee share purchase plan, Holcim manages employees’ shares. It sells and purchases Holcim Ltd shares to and from employees and on the open market. As a result, the company purchased Holcim Ltd shares of CHF 2.1 million (2010: 0.3) at stock market price from members of senior management.
No compensation was paid or loans granted to parties closely related to members of the governing bodies.
41 Events after the reporting period
There were no significant events after the reporting period.
42 Authorization of the financial statements for issuance
The consolidated financial statements were authorized for issuance by the Board of Directors of Holcim Ltd on February 24, 2012, and are subject to shareholder approval at the annual general meeting of shareholders scheduled for April 17, 2012.
Cons
olid
ated
Fin
ancia
l Sta
tem
ents
229
Principal companies of the Holcim Group
Region Company Place Nominal share capital
in 000
Participation
(voting right)
Europe Holcim (France) S.A.S. France EUR 96,971 100.0%
Holcim (Belgique) S.A. Belgium EUR 750,767 100.0%
Holcim (España) S.A. Spain EUR 420,945 99.9%
Holcim Trading S.A. Spain EUR 19,600 100.0%
Aggregate Industries Ltd United Kingdom GBP 0 100.0%
Latin America Cementos Progreso S.A. Guatemala 20.0%
Africa Middle East Lafarge Cement Egypt S.A.E. Egypt 43.7%
United Cement Company of Nigeria Ltd Nigeria 35.9%
Asia Pacific Huaxin Cement Co. Ltd. China 41.6%
Cons
olidated
Finan
cial
Statem
ents
233
To the General Meeting of Holcim Ltd, Jona
Zurich, February 24, 2012
Report of the statutory auditor on the consolidated financial statements
As statutory auditor, we have audited the consolidated financial statements of Holcim Ltd, which comprise the consolidated statementof income, consolidated statement of comprehensive earnings, consolidated statement of financial position, statement of changesin consolidated equity, consolidated statement of cash flows and notes on pages 165 to 231 for the year ended December 31, 2011.
Board of Directors’ responsibility
The Board of Directors is responsible for the preparation of the consolidated financial statements in accordance with InternationalFinancial Reporting Standards (IFRS) and the requirements of Swiss law. This responsibility includes designing, implementing andmaintaining an internal control system relevant to the preparation and fair presentation of consolidated financial statements thatare free from material misstatement, whether due to fraud or error. The Board of Directors is further responsible for selecting andapplying appropriate accounting policies and making accounting estimates that are reasonable in the circumstances.
Auditor’s responsibility
Our responsibility is to express an opinion on these consolidated financial statements based on our audit.We conducted our auditin accordance with Swiss law, Swiss Auditing Standards and International Standards on Auditing. Those standards require that weplan and perform the audit to obtain reasonable assurance whether the consolidated financial statements are free from materialmisstatement. An audit involves performing procedures to obtain audit evidence about the amounts and disclosures in the consoli-dated financial statements. The procedures selected depend on the auditor’s judgment, including the assessment of the risks ofmaterial misstatement of the consolidated financial statements, whether due to fraud or error. In making those risk assessments, theauditor considers the internal control system relevant to the entity’s preparation and fair presentation of the consolidated financialstatements in order to design audit procedures that are appropriate in the circumstances, but not for the purpose of expressing anopinion on the effectiveness of the entity’s internal control system. An audit also includes evaluating the appropriateness of theaccounting policies used and the reasonableness of accounting estimates made as well as evaluating the overall presentation of theconsolidated financial statements.We believe that the audit evidence we have obtained is sufficient and appropriate to provide abasis for our audit opinion.
Opinion
In our opinion, the consolidated financial statements for the year ended December 31, 2011, give a true and fair view of the financialposition, the results of operations and the cash flows in accordance with the International Financial Reporting Standards (IFRS) andcomply with Swiss law.
Report on other legal requirements
We confirm that we meet the legal requirements on licensing according to the Auditor Oversight Act (AOA) and independence(Art. 728 Code of Obligations (CO) and Art. 11 AOA) and that there are no circumstances incompatible with our independence. Inaccordance with Art. 728a para. 1 item 3 CO and Swiss Auditing Standard 890, we confirm that an internal control system exists,which has been designed for the preparation of consolidated financial statements according to the instructions of the Board ofDirectors.We recommend that the consolidated financial statements submitted to you be approved.
Ernst & Young Ltd
Willy Hofstetter Michael BrennerLicensed Audit Expert Licensed Audit ExpertAuditor in charge
AML Ltd ▲McDonald’s Lime Ltd ▲Millbrook Quarries Ltd
Finan
cial
Inform
ation
242
Statement of income Holcim Ltd
Million CHF 2011 2010
Financial income 654.9 751.3
Other ordinary income 30.0 32.7
Total income 684.9 784.0
Financial expenses (107.8) (102.0)
Other ordinary expenses (58.2) (43.1)
Taxes (4.1) (6.6)
Total expenses (170.1) (151.7)
Net income 514.8 632.3
HoldingCo
mpa
nyRe
sults
243
Balance sheet Holcim Ltd as at December 31
Million CHF 2011 2010
Cash and cash equivalents 249.8 355.6
Accounts receivable – Group companies 19.5 4.1
Prepaid expenses and other current assets 6.6 4.7
Total current assets 275.9 364.4
Loans – Group companies 1,781.0 1,745.4
Financial investments – Group companies 17,873.8 17,693.7
Other financial investments 88.0 67.6
Total long-term assets 19,742.8 19,506.7
Total assets 20,018.7 19,871.1
Current financing liabilities – Group companies 180.0 184.7
Other current liabilities 333.1 33.5
Total current liabilities 513.1 218.2
Long-term financing liabilities – Group companies 0.0 32.4
Outstanding bonds 2,925.0 3,075.0
Total long-term liabilities 2,925.0 3,107.4
Total liabilities 3,438.1 3,325.6
Share capital 654.2 654.2
Legal reserves
– Ordinary reserves 2,045.8 9,375.61
– Capital contribution reserves 6,839.9 0
– Reserves for treasury shares 486.3 476.1
Free reserves 5,562.8 4,962.8
Retained earnings 991.6 1,076.8
Total shareholders’ equity 16,580.6 16,545.5
Total liabilities and shareholders’ equity 20,018.7 19,871.1
1 The statutory capital contributions, which have been provided by the shareholders after December 31, 1996, amounted to CHF 7.3 billion as of December 31, 2010.This amount is calculated by applying Art. 5 para.1bis of the Swiss withholding tax law and circular letter No 29 dated December 9, 2010, issued by the federal taxadministration.
Finan
cial
Inform
ation
244
Change in shareholders’ equity Holcim Ltd
Share Ordinary Capital Reserves for Free Retained Total
capital reserves contribution treasury reserves earnings
reserves shares
Million CHF
January 1, 2011 654.2 9,375.6 0 476.1 4,962.8 1,076.8 16,545.5
Capital increase 0
Increase reserves for treasury shares (10.2) 10,2 0
Allocation to capital contribution reserves (7,319.6) 7,319.6 0
Allocation to free reserves (479.7) 479.7 0
Payout (479.7) (479.7)
Allocation to free reserves 600.0 (600.0) 0
Net income of the year 514.8 514.8
December 31, 2011 654.2 2,045.8 6,839.9 486.3 5,562.8 991.6 16,580.6
January 1, 2010 654.2 9,396.9 0 454.8 4,962.8 924.4 16,393.1
Capital increase 0
Increase reserves for treasury shares (21.3) 21.3 0
Payout (479.9) (479.9)
Allocation to free reserves 0
Net income of the year 632.3 632.3
December 31, 2010 654.2 9,375.6 0 476.1 4,962.8 1,076.8 16,545.5
HoldingCo
mpa
nyRe
sults
245
Data as required under Art. 663b and c of the Swiss Code of Obligations
Contingent liabilities 31.12.2011 31.12.2010Million CHFHolcim Capital Corporation Ltd.Guarantees in respect of holders of7.05% USD 358 million private placement due in 2011 01 3646.59% USD 165 million private placement due in 2014 1861 1887.65% USD 50 million private placement due in 2031 821 696.88% USD 250 million bonds due in 2039 2591 257Holcim Capital (Thailand) Ltd.Guarantees in respect of holders of6.69% THB 2,450 million bonds due in 2012 722 763.52% THB 2,000 million bonds due in 2015 652 68Holcim Finance (Australia) Pty LtdGuarantees in respect of holders of8.50% AUD 500 million bonds due in 2012 4783 477Holcim Finance (Belgium) S.A.Commercial Paper Program, guarantee based on utilization, EUR 500 million maximum 615 25Holcim Finance (Canada) Inc.Guarantees in respect of holders of6.91% CAD 10 million private placement due in 2017 124 125.90% CAD 300 million bonds due in 2013 3044 309Holcim Finance (Luxembourg) S.A.Guarantees in respect of holders of4.38% EUR 600 million bonds due in 2014 8045 8249.00% EUR 650 million bonds due in 2014 8715 8936.35% EUR 200 million bonds due in 2017 2685 275Holcim GB Finance Ltd.Guarantees in respect of holders of8.75% GBP 300 million bonds due in 2017 4796 478Holcim Overseas Finance Ltd.Guarantees in respect of holders of2.75% CHF 300 million bonds due in 2011 0 3303.00% CHF 155 million bonds due in 2013 171 2753.38% CHF 425 million bonds due in 2021 468 0Holcim US Finance S.à r.l. & Cie S.C.S.Guarantees in respect of holders of5.96% USD 125 million private placement due in 2013 1181 1176.10% USD 125 million private placement due in 2016 1181 1176.21% USD 200 million private placement due in 2018 1881 1875.12% EUR 90 million private placement due in 2013 1215 1242.67% EUR 358 million private placement due in 2013 4805 4922.82% EUR 202 million private placement due in 2015 2715 2786.00% USD 750 million bonds due in 2019 7761 772
Guarantees for committed credit lines, utilization CHF 898 million (2010: 1,040) 3,982 5,658Other guarantees 614 825
Holcim Ltd is part of a value added tax group and therefore jointly liable to the Swiss Federal Tax Administration for the value added taxliabilities of the other members.
Treasury shares Number Price per share in CHF Million CHF
01.01.10 Treasury shares 6,905,384 65.86 454.8
01.01. to 31.12.10 Purchases 432,300 77.52 33.5
01.01. to 31.12.10 Sales (206,601) 73.26 (12.2)
31.12.10 Treasury shares 7,131,083 66.76 476.1
01.01.11 Treasury shares 7,131,083 66.76 476.1
01.01. to 31.12.11 Purchases 369,168 68.50 25.3
01.01. to 31.12.11 Sales (230,170) 75.86 (15.1)
31.12.11 Treasury shares 7,270,081 66.90 486.3
Conditional share capital Number Price per share in CHF Million CHF
01.01.10 Conditional shares par value 1,422,350 2.00 2.8
01.01. to 31.12.10 Movement 0 0 0
31.12.10 Conditional shares par value 1,422,350 2.00 2.8
01.01.11 Conditional shares par value 1,422,350 2.00 2.8
01.01. to 31.12.11 Movement 0 0 0
31.12.11 Conditional shares par value 1,422,350 2.00 2.8
1 Shareholding of more than 3 percent.2 Included in share interests of Board of Directors and senior management.
Share interests of Board of Directors and senior management
As of December 31, 2011, the members of the Board ofDirectors and senior management of Holcim held directlyand indirectly in the aggregate 66,227,279 registered shares(2010: 60,093,198) and no rights to acquire further registeredshares and 992,382 call options on registered shares(2010: 1,044,831).
Important shareholders1
As per December 31, 2011, Thomas Schmidheiny directly andindirectly held 65,774,099 shares (20.10 percent), all registered(2010: 59,568,933 shares or 18.21 percent). Eurocement HoldingAG, on September 16, 2011 declared holdings of 33,091,556shares (10.12 percent) of which 21,326,032 shares (6.52 percent)were registered as per December 31, 2011 (2010: 21,326,032
shares or 6.52 percent). On September 14, 2011, Capital GroupCompanies Inc. declared holdings of 15,996,300 shares (4.89percent) (August 15, 2008: 13,181,456 shares or 5 percent) .
The information disclosed complies with Swiss legal require-ments. Further information can be found in the notes tothe consolidated financial statements on pages 188 to 228.Specific information in accordance with Art. 663b para. 12 (riskassessment), Art. 663bbis and Art. 663c para. 3 (transparencylaw) of the Swiss Code of Obligations are disclosed in thesection “Risk management” on pages 181 to 187 and note 40on pages 223 to 228, respectively.
Issued bonds
The outstanding bonds and private placements as of Decem-ber 31, 2011, are listed on pages 208 and 209.
Principal investments
The principal direct and indirect investments of Holcim Ltdare listed under the heading “Principal companies of theHolcim Group” on pages 229 to 231.
HoldingCo
mpa
nyRe
sults
247
Share capital 2011 2010
Shares Number Million CHF Number Million CHF
Registered shares of CHF 2 par value 327,086,376 654.2 327,086,376 654.2
Total 327,086,376 654.2 327,086,376 654.2
Appropriation of retained earnings 2011 2010
Million CHF Million CHF
Retained earnings brought forward 476.8 444.5
Net income of the year 514.8 632.3
Retained earnings available for annual general meeting of shareholders 991.6 1,076.8
The Board of Directors proposes to the annual general
meeting of shareholders of April 17, 2012, in Zurich
the following appropriation:
Appropriation to free reserves (500.0) (600.0)
Balance to be carried forward 491.6 476.8
2011 2010
Cash payout CHF Cash payout CHF
Payout per share, gross 1.00 1.50
Less withholding tax 0 0
Payout per share, net 1.00 1.50
1 There is no payout on treasury shares held by Holcim. On January 1, 2012, treasury holdings amounted to 7,270,081 registered shares.
Payout from capital contribution reserves
The Board of Directors proposes to the annual general meet-ing of shareholders an appropriation from capital contributionreserves to free reserves and payout of CHF 1.00 per registeredshare up to an amount of CHF 327.0 million1.
HoldingCo
mpa
nyRe
sults
249
To the General Meeting of Holcim Ltd, Jona
Zurich, February 24, 2012
Report of the statutory auditor on the financial statements
As statutory auditor, we have audited the accompanying financial statements of Holcim Ltd, which comprise the statement ofincome, balance sheet, change in shareholders’ equity and notes presented on pages 242 to 247 for the year ended December 31, 2011.
Board of Directors’ responsibility
The Board of Directors is responsible for the preparation of the financial statements in accordance with the requirements of Swisslaw and the company’s articles of incorporation. This responsibility includes designing, implementing and maintaining an internalcontrol system relevant to the preparation of financial statements that are free from material misstatement, whether due to fraudor error. The Board of Directors is further responsible for selecting and applying appropriate accounting policies and makingaccounting estimates that are reasonable in the circumstances.
Auditor’s responsibility
Our responsibility is to express an opinion on these financial statements based on our audit.We conducted our audit in accordancewith Swiss law and Swiss Auditing Standards. Those standards require that we plan and perform the audit to obtain reasonableassurance whether the financial statements are free from material misstatement. An audit involves performing procedures toobtain audit evidence about the amounts and disclosures in the financial statements. The procedures selected depend on theauditor’s judgment, including the assessment of the risks of material misstatement of the financial statements, whether dueto fraud or error. In making those risk assessments, the auditor considers the internal control system relevant to the entity’spreparation of the financial statements in order to design audit procedures that are appropriate in the circumstances, but not forthe purpose of expressing an opinion on the effectiveness of the entity’s internal control system. An audit also includes evaluatingthe appropriateness of the accounting policies used and the reasonableness of accounting estimates made as well as evaluatingthe overall presentation of the financial statements.We believe that the audit evidence we have obtained is sufficient and appro-priate to provide a basis for our audit opinion.
Opinion
In our opinion, the financial statements for the year ended December 31, 2011, comply with Swiss law and the company’s articlesof incorporation.
Report on other legal requirements
We confirm that we meet the legal requirements on licensing according to the Auditor Oversight Act (AOA) and independence(Art. 728 Code of Obligations (CO) and Art. 11 AOA) and that there are no circumstances incompatible with our independence.In accordance with Art. 728a para. 1 item 3 CO and Swiss Auditing Standard 890, we confirm that an internal control system exists,which has been designed for the preparation of financial statements according to the instructions of the Board of Directors.We further confirm that the proposed appropriation of available retained earnings complies with Swiss law and the company’sarticles of incorporation.We recommend that the financial statements submitted to you be approved.
Ernst & Young Ltd
Willy Hofstetter Michael BrennerLicensed Audit Expert Licensed Audit ExpertAuditor in charge
251
5-Ye
ar-R
evie
w
5-year-review Group Holcim
2011 2010 2009 2008 2007
Statement of income
Net sales Million CHF 20,744 21,653 21,132 25,157 27,052
Gross profit Million CHF 8,528 9,274 9,060 11,041 12,979
Operating EBITDA Million CHF 3,958 4,513 4,630 5,333 6,930
EBITDA net interest coverage × 4.2 6.1 7.3 7.6 11.0
EBIT net interest coverage × 2.2 3.7 4.7 4.9 8.51 Excludes non-controlling interest.2 Net financial debt divided by total shareholders’ equity.3 Net income plus depreciation, amortization and impairment.
This document may contain certain forward-looking state-ments relating to the Group’s future business, developmentand economic performance. Such statements may be subjectto a number of risks, uncertainties and other importantfactors, such as but not limited to (1) competitive pressures;(2) legislative and regulatory developments; (3) global, macro-economic and political trends; (4) fluctuations in currencyexchange rates and general financial market conditions;(5) delay or inability in obtaining approvals from authorities;(6) technical developments; (7) litigation; (8) adverse publicityand news coverage, which could cause actual developmentand results to differ materially from the statements made inthis document. Holcim assumes no obligation to update oralter forward-looking statements whether as a result of newinformation, future events or otherwise.
General meeting of shareholders April 17, 2012Ex date April 19, 2012Payout April 24, 2012Results for the first quarter 2012 May 9, 2012Half-year results 2012 August 15, 2012Press and analyst conference for the third quarter 2012 November 7, 2012
Countless companies are founded every year, yet not
many survive for long. That makes it worthy of note when
a company celebrates its 100th anniversary, as Holcim is
doing in 2012. Founded in 1912, in the village of Holderbank
in the Swiss canton of Aargau, it has grown steadily, first
as “Holderbank” and then later as Holcim, to become one
of the world’s leading construction materials companies.
It now has a significant presence on every continent.
Holcim from 1912 to 2012
Holcim is a worldwide leading producer ofcement and aggregates. Further activitiesinclude the provision of ready-mix concreteand asphalt as well as other services. TheGroup is active in around 70 countries andemploys more than 80,000 people.