145
ANNUAL REPORT 2011 B-23 ANNUAL REPORT 2011

ANNUAL REPORT2011
B-23
AN
NU
AL REPO
RT 2011

Crown Copyright © 2011
�is work is licensed under the Creative Commons Attribution 3.0 New Zealand licence. In essence, you are free to copy, distribute and adapt the work, as long as you attribute the work to the Crown and abide by the other licence terms. To view a copy of this licence, visit
creativecommons.org
Please note that no departmental or governmental emblem, logo or Coat of Arms may be used in any way that infringes any provision of the Flags, Emblems, and Names Protection Act 1981.
legislation.govt.nz
Attribution to the Crown should be in written form and not by reproduction of any such emblem, logo or Coat of Arms.
ISSN 2230-6005 (Print)
ISSN 2230-6013 (Online)
ird.govt.nz
Presented to the House of Representatives pursuant to the Public Finance Act 1989 and the Tax Administration Act 1994.

3 ird.govt.nz
CONTENTS
To the Minister of Revenue 4
Commissioner’s introduction 5
Inland Revenue’s charter 8
PART 1 – Operational context 9Factors influencing our operations 10
Tax revenue 13
Advising on government policy 14
PART 2 – Strategic direction 19IR for the future 20
Measuring our performance 22
PART 3 – Operational performance 29How we provide better, smarter services 30
Working with other agencies and providers 33
Influencing voluntary compliance 34
Delivering social programmes 41
PART 4 – Organisational health and capability 47Developing our people capability 48
Our systems meet our needs 50
PART 5 – Governance and risk management 51Governance 52
Managing risks 53
PART 6 – Statement of service performance 55Statement of responsibility 56
Statement of service performance 57
PART 7 – Departmental financial statements 87
PART 8 – Financial schedules – Crown as administered by Inland Revenue
119
Audit report 139
Additional information 145

4 NEW ZEALAND INLAND REVENUE ANNUAL REPORT 2011 ird.govt.nz
Under the provisions of the Public Finance Act 1989 and the Tax Administration Act 1994, I present the following report on my administration of the Inland Revenue Acts for the year ended 30 June 2011, and on the operations of the Inland Revenue Department for that year, together with the audited financial statements.
Robert Russell Chief Executive and Commissioner of Inland Revenue
TO THE MINISTER OF REVENUE

5ird.govt.nz
COMMISSIONER’S INTRODUCTION
Inland Revenue’s mission is:
We contribute to the economic and social wellbeing of New Zealand by collecting and distributing money.
Our success is reflected in two outcomes:
" Revenue is available to fund government programmes through people meeting payment obligations of their own accord.
" People receive payments they are entitled to, enabling them to participate in society.
INLAND REVENUE’S BUSINESSWe deal with large numbers of customers, often on complex and sensitive matters. We have:
" 7,119,000 taxpayers (individuals, businesses, partnerships, trusts and other entities)
" 1,756,000 KiwiSaver members
" 621,000 student loan borrowers
" 200,000 customers receiving regular Working for Families Tax Credits payments from Inland Revenue
" 180,000 child support paying parents
" 181,000 child support custodians
" 23,000 paid parental leave recipients.
We also deal with high transaction volumes. In 2010–11 we:
" collected $46.8 billion in tax, over 80% of core Crown revenue
" answered 5.47 million service customer contacts (correspondence, counter and telephones)
" received 16.06 million self-help service contacts
" collected $1,566 million in overdue debt
" identified $1,450 million in discrepancies through audit activity
" distributed $2,911 million in KiwiSaver funds to scheme providers
" distributed $2,746 million in Working for Families Tax Credits
" distributed $412 million in child support payments
" received $691 million in student loan repayments.
RESPONDING TO GOVERNMENT PRIORITIESInland Revenue has made a substantial contribution to two of the Government’s priorities for 2011—building a stronger economy and building better results from public services.
Inland Revenue contributes to these priorities by:
" delivering an effective and efficient tax administration which supports the Government’s objectives, especially contributing to the Government’s efforts to consolidate New Zealand’s fiscal position and by providing value for money to the Government and our customers.
" providing better, smarter public services by changing the way we work to give customers greater certainty and faster, simpler interactions with us.
In April 2011 we launched Inland Revenue’s new strategic document, IR for the future. It sets out our mission and vision, highlights our priorities and the culture we will need to achieve our performance goals. IR for the future will help us to focus and prioritise our efforts as we seek to transform Inland Revenue.
RESPONDING TO THE CANTERBURY EARTHQUAKESThe Canterbury earthquakes disrupted our operations in Christchurch, had a significant impact on our people and affected our ability to deliver services to our customers. After the earthquakes we focused on supporting our people in Christchurch, ensuring they were safe and progressively able to return to work. Some work was transferred to other sites and we set up temporary offices outside the central city.
We took steps to help our customers affected by the earthquakes. We held back letters requesting payment and offered assistance for businesses and individuals that had suffered losses, through a helpline and recovery assistance centres. Policy measures were also put in place to recognise and assist affected customers and to encourage people to make donations to the relief effort.
Our response to the earthquakes will continue over the year ahead. See Parts one, three and six for detailed information.

6 NEW ZEALAND INLAND REVENUE ANNUAL REPORT 2011 ird.govt.nz
SERVICE PERFORMANCEThis year, our service performance was affected by the Canterbury earthquakes and we did not achieve some targets as a direct consequence. We also decided to reallocate resources to the areas where they were most needed, eg, we increased the number of hours spent on advisory services.
Areas directly affected by the earthquakes included:
" our outbound calling campaigns for collecting overdue debt
" timeliness of responding to electronic correspondence
" processing of registrations and child support administrative review applications.
We also expect service performance to be affected during 2011–12 because we are still re-establishing our full range of services in Christchurch. Despite these pressures, we maintained high levels of customer satisfaction with our services.
More information about our service performance is included in Parts three and six.
PROVIDING BETTER, SMARTER SERVICESThis year, we continued to strengthen our e-service platform to make our e-services faster, more consistent and stable. We introduced a new e-service for tax agents and we improved the existing ones for families and individuals. This gives our customers more opportunity to self-manage their interactions with us. There was a 56% increase in the number of customers registered for e-services compared to last year.
We also continued to improve our telephone services and we made greater use of “front-end banner messaging” to encourage customers to use our Interactive Voice Response system and e-services. This helped reduce demand, with Inland Revenue answering 8.6% fewer calls this year than in 2009–10.
MANAGING COMPLIANCEOur focus on prevention and early intervention in managing overdue debt has helped us significantly reduce the number of new debt cases and the amount of debt aged under one year. We recruited additional debt staff and invested in technology to develop our capability for outbound calling campaigns. One consequence of our focus on new debt is an increase in the level of debt over two years old, which we plan to address in the coming year.
This year, we published Inland Revenue’s compliance focus 2010–11. The document provides an overview of the key compliance issues we were concerned with and the activities we used to manage them. This was the third year we published our compliance
document and we have seen positive results from the activities we used to manage compliance during the year.
In Budget 2010, Inland Revenue received additional funding for compliance work in debt collection, the hidden economy and property transactions. In 2010–11, we exceeded our target returns on investment for these compliance programmes, despite some work being affected by the Canterbury earthquakes.
PERFORMANCE IMPROVEMENT FRAMEWORK REPORTThe Performance Improvement Framework report on Inland Revenue was released in May 2011. The report was complimentary of Inland Revenue’s performance. We rated strong or well placed in our delivery of core business functions, meeting government priorities and policy advice.
The report identified our business transformation programme, management of debt and returns, asset management and information management as needing improvement. One of the report’s key recommendations was that the Commissioner should provide greater leadership to the business transformation programme. I accepted this recommendation and now chair the Business Transformation Programme Board.
OUR PEOPLEWith the introduction of IR for the future, a key priority is:
We retain, develop, and attract high-calibre people with the skills required in the future–enabling a culture of service and excellence.
During the year we continued to focus on our leadership development, recognising that good leadership is critical to deliver our priorities and build a culture of service and excellence.
At the same time, we are carrying out a work programme to improve the way we target our customer needs, focus on compliance issues and work smarter. This programme will affect our people over the coming years. We also expect it will help us to provide better services by standardising processes, reducing duplication of effort and delivering prioritised services to meet local needs.
See Part four for details of our work to develop the capability of our people.

7ird.govt.nz
TRANSFORMING THE WAY WE WORKOur priorities and transformation goals, from IR for the future, set out the key features of Inland Revenue’s business in the future. We are advancing our transformation through several key projects and a range of service-focused initiatives across the organisation. During the year we continued to focus on developing options for transforming Inland Revenue’s business, which we will discuss with Ministers in 2011–12.
In 2010–11 we changed our approach for delivering the system changes needed to implement legislative changes in the Student Loan Scheme Act 2011. We will now implement these changes within our existing system (FIRST) in two phases taking effect from 1 April 2012 and 1 April 2013.
CONCLUSIONWe continued to deliver high-quality services to the Government and our customers during a time of considerable organisational change. We responded quickly and effectively to the challenges presented by the Canterbury earthquakes and we supported our staff in Christchurch while also providing relief to customers affected by the earthquakes. I am proud of what Inland Revenue achieved during 2010–11.
Robert Russell Chief Executive and Commissioner of Inland Revenue

8 NEW ZEALAND INLAND REVENUE ANNUAL REPORT 2011 ird.govt.nz
INLAND REVENUE’S CHARTER
For this charter to work effectively, we rely on each customer to provide all relevant information when dealing with Inland Revenue.
Robert Russell Commissioner of Inland Revenue
" We will be easy to deal with, prompt, courteous and professional.
" We will follow through on what we say we will do.
" We will be responsive to individual, cultural and special needs.
" The person you are dealing with will give you their name.
" We will value your feedback and use it to improve our services.
" We will apply the law consistently so everyone receives their entitlements and pays the right amount.
" We will take your particular circumstances into account as far as the law allows.
" We will make it easy for you to question the information, advice and service we give you. We will inform you about options available if you disagree with us, and we will work with you to reach an outcome quickly and simply.
" We will provide you with reliable and correct advice and information about your entitlements and obligations.
" We will assist you to get in touch with the right people for your needs.
" We will be well-trained and competent.
" We will keep looking for better ways to provide you with advice and information.
" We will treat all information about you as private and confidential, and keep it secure. We will only use or disclose it in accordance with the law.
Inland Revenue collects money to pay for public services. We help people to meet their obligations and receive their entitlements. We work within the Inland Revenue Acts and other relevant laws, and our actions are consistent with the spirit of the Treaty of Waitangi.
How we will work with you
How we will work with you
Consistency and equity
Your right to question us
Reliable advice and information
Confidentiality

9PART 1 OPERATIONAL CONTEXTird.govt.nz
Part one
OPERATIONAL CONTEXT

10 NEW ZEALAND INLAND REVENUE ANNUAL REPORT 2011 ird.govt.nz
FACTORS INFLUENCING OUR OPERATIONS
Inland Revenue operates in an environment that is determined by the Government’s priorities for the economy and the results it wants to achieve in the public sector.
This year, several factors influenced how we work, which will contribute to our long-term ability to deliver on the Government’s priorities and our outcomes. The Canterbury earthquakes had a significant impact on Inland Revenue, requiring fast operational and policy responses to recognise the situation people in Canterbury were facing. Another factor was our continued work on transformation initiatives.
THE GOVERNMENT’S PRIORITIESThe Government’s priorities for 2011 include two goals that are a focus for Inland Revenue:
" building a stronger economy
" building better results from public services.
Inland Revenue contributes to these priorities by:
" delivering an effective and efficient tax administration which supports the Government’s objectives, especially contributing to the Government’s efforts to consolidate New Zealand’s fiscal position, and by providing value for money to the Government and our customers.
" providing better, smarter public services by changing the way we work to give customers greater certainty and faster, simpler interactions with us.
Our principal contributions to the Government’s priorities are reflected in the outcome indicators in figure 1.
1 This includes Working for Families Tax Credits paid by Inland Revenue and the Ministry of Social Development.
FIGURE 1 – OUTCOME INDICATORS REPORT
Outcome indicator 2009–10 2010–11
Revenue is available to fund government programmes through people meeting payment obligations of their own accord.
" Total revenue collected $46.0 billion $46.8 billion
" Total student loan repayments
$644 million $691 million
People receive payments they are entitled to, enabling them to participate in society.
" Total Working for Families Tax Credits paid 1
$2,787 million $2,746 million
" Total KiwiSaver funds distributed to providers for investment
$2,648 million $2,911 million
" Total child support payments distributed
$392 million $412 million
" Total paid parental leave distributed
$154 million $154 million
CANTERBURY EARTHQUAKESThe earthquakes in September 2010 and February 2011 seriously disrupted Inland Revenue’s operations in Christchurch and caused personal and business losses to many customers. Subsequent aftershocks have lengthened the recovery process. Our people have been working in temporary locations and, in some places, sharing accommodation with other government agencies. We do not know when we will be able to return to our central city building and provide services at the pre-quake level.
The impact on our operationsAfter the earthquakes, our initial concern was for our people in Christchurch. We set up social media sites and ran drop-in centres to offer assistance and keep them connected with their colleagues and other Inland Revenue offices. Many of our people in Christchurch worked on recovery efforts after the earthquakes and provided assistance to the Ministry of Social Development, New Zealand Police, Civil Defence and the Red Cross.

11PART 1 OPERATIONAL CONTEXTird.govt.nz
Some work previously done in the Christchurch Office was transferred to other sites or contracted to outside providers. Temporary office sites were set up outside the central city to restore services. The aftershocks that occurred in early June set the resumption of our work back because our main temporary buildings were declared unsafe. Several of our performance measure results for 2010–11 reflect the disruption caused by the earthquakes on our service delivery. We expect that service performance will continue to be affected during 2011–12.
How we supported our customersAfter the earthquakes, we recognised that many of our customers had suffered business or personal losses and we put a stop on letters requesting payment. We offered assistance for businesses and individuals through a helpline and local recovery assistance centres. More than 300 of our people worked in the community and with other agencies immediately after the earthquake. We implemented policy measures (see page 14) to assist our customers and encourage people to make donations to the relief effort.
As the recovery effort continues in Christchurch, we are working with other government agencies and private providers, such as tax agents, to provide assistance. We are providing limited face-to-face services for Working for Families Tax Credits and child support customers at Work and Income offices outside the Christchurch city centre and at temporary sites in shopping malls. This situation has enabled us to explore a range of cooperative working options that may serve as a model for other locations in New Zealand.
We received an additional $4.4 million in funding to deal with the consequences of the Canterbury earthquakes. The funding was limited to writing off or repairing damage to departmental assets, maintaining output delivery and re-establishing operations in Christchurch following the February 2011 earthquake.
THE ECONOMY The recovery after the recession of 2008–09 has had a positive effect on tax revenue, but it was also evident that the downstream effects of the recession were still being felt over the last year.
The most noticeable impact continued to be on our debt portfolio which reflected the pressure that some businesses have been under. Since 2007, just before the recession, the number of customers in debt to Inland Revenue has risen by 39% and insolvency debt has more than tripled.2
Other collections such as student loan repayments have also grown more slowly than in the pre-2008 period. From July 2007 to June 2009, repayments grew by an average of 13%. In the following two years growth was 6%, despite continued increases in the borrower base and campaigns to improve compliance.
TRANSFORMING OUR BUSINESSOur business transformation is a long-term programme that will make compliance faster, easier and less costly for customers, provide innovative online services, help us respond faster to future changes and maintain the integrity of the tax system. Our transformation goals set out the key features of our business in the future:
" Efficient self-management options for customers that provide speed and certainty
" A broader approach to compliance based on smarter use of information and a wider range of interventions
" A range of different working relationships with other organisations, including strategic partnerships to deliver some services
" Less transactional work and less direct contact with customers
" Excellence in complex technical work
" More automation and streamlined information flows
" Greater use of commercial IT products in our systems and services
" A healthy culture which our people value and thrive in.
During the year, we continued to focus on developing options for transforming Inland Revenue’s business that we will discuss with Ministers in early 2011–12.
We are advancing our transformation work through several key projects and a range of service-focused initiatives across Inland Revenue.
2 A large proportion of insolvency debt in our debt portfolio resulted from actions initiated by parties other than Inland Revenue.

12 NEW ZEALAND INLAND REVENUE ANNUAL REPORT 2011 ird.govt.nz
FUTURE DIRECTION OF SERVICE DELIVERYWe continued developing a work programme to improve the way we target our customers’ needs, focus on compliance issues and work smarter. We expect this will help us to provide better services by standardising processes, reducing duplication of effort and delivering prioritised services to meet local needs.
Examples of these changes are:
" tailoring advice and education to meet the needs and compliance behaviour of customers in provincial locations
" grouping non face-to-face work in the four main metropolitan centres (Auckland, Hamilton, Wellington and Christchurch) to increase efficiency and effectiveness
" keeping local counters for customers and looking for more co-location opportunities with other agencies
" managing customer-facing work nationally to provide consistent customer services.
We analysed information about our customers and their compliance behaviour. We also looked at demographics, social statistics and geographic spread, and aligned that with our business knowledge and priorities so we can provide the right mix of services to suit different communities.
The new way of working has been implemented in Gisborne, Greymouth and Timaru and changes made in our operations delivery sites. We have consulted staff in Rotorua, New Plymouth, Napier, Nelson and Invercargill, about proposed changes to their offices. Changes will start to be implemented in early 2012 and completed by June 2013.
STUDENT LOAN REDESIGNOur Student Loan Redesign Project addresses the need for a consolidated view of loans that integrates the lending and repayment processes carried out by StudyLink and Inland Revenue. As well as enabling a greater degree of collaboration between these two agencies, the changes will give borrowers enhanced online services and encourage improved repayment compliance. The new system is supported by policy changes made to the Student Loan Scheme Act 2011.
We received funding in 2009 to implement the redesign project. Our original plan to use commercial software licences in combination with our core taxpayer system, known as FIRST, was modified during 2010–11 so that FIRST would be used. This was done because it became apparent that the changes to systems were more complex and time-consuming than expected because of the particular complications of the student loan system.
The upgrade will be done in two phases. The main policy changes will be implemented to take effect from April 2012, and a number of the more administrative components that will have minimal impact on borrowers, will be implemented by April 2013.

13PART 1 OPERATIONAL CONTEXTird.govt.nz
Revenue increased by $811 million (1.8%) in 2010–11 compared to last year, reflecting a recovery in economic activity. However, the tax package in Budget 2010 has brought about a change in the composition of the revenue stream.
Taxation from individuals fell by 4.2%, with lower personal marginal tax rates coming into effect on 1 October 2010. This fall was offset by increased revenue from GST, indicating resilience in consumer spending through the course of the year. GST revenue was also increased by the GST rate change to 15%, effective from 1 October 2010.
Company tax revenue was also higher than in the 2009–10 year. Much of the improvement in company tax collected was due to a recovery in economic activity, with improved growth in both international and local markets.
FIGURE 2 – REVENUE ASSESSED 2010–11 (ACCRUAL BASIS)
Revenue type Outturn % change$ million previous year
Direct taxes Individuals $23,136 –4.2%
Company tax $8,195 9.1%
Other $2,582 1.3%
Sub-total direct $33,913 –0.8%
Indirect taxes
GST $12,575 9.6%
Other indirect taxes $357 –
Sub-total indirect $12,932 9.3%
Total Inland Revenue tax $46,845 1.8%
Figure 3 shows the trend in tax revenue collection over the last five years and figure 4 shows the composition of revenue by tax type.
FIGURE 3 – COMPOSITION OF ACTUAL REVENUE ASSESSED
2006–07 2007–08 2008–09 2009–10 2010–11$ billion $ billion $ billion $ billion $ billion
Direct taxes
$38.5 $41.3 $38.7 $34.2 $33.9
Indirect taxes
$10.1 $9.9 $10.4 $11.8 $12.9
Total tax $48.6 $51.2 $49.1 $46.0 $46.8
FIGURE 4 – COMPOSITION OF REVENUE BY TAX TYPE
Revenue type 2008–09 2009–10 2010–11
Individuals 52% 52% 49%GST 20% 25% 27%
Company tax 20% 16% 17%
Other direct 7% 6% 6%
Other indirect 1% 1% 1%
See Part 8 for further information on revenue collected by Inland Revenue.
Historical data for tax collected by Inland Revenue is available at ird.govt.nz
Outturn data for tax from all sources is available at treasury.govt.nz
TAX REVENUE

14 NEW ZEALAND INLAND REVENUE ANNUAL REPORT 2011 ird.govt.nz
Savings Working Group We supported the Savings Working Group, established in October 2010, to make recommendations on:
" the role of government savings as part of New Zealand’s overall savings picture, including long-term savings/debt targets and the interaction of government and private savings.
" the impact of the tax system on the level and composition of national savings and investment decisions.
" the role of KiwiSaver in national savings.
The Savings Working Group report recommended that the Government consider a large number of possible changes. A major theme of the report was the need for government to reduce expenditure and improve its fiscal position, to reduce reliance on offshore capital.
The measures suggested by the Savings Working Group were considered by the Government in developing Budget 2011.
Budget 2011 In an environment of economic recovery and the effects of the Canterbury earthquakes, Budget 2011 focused on national savings and fiscal consolidation. In the tax system, savings were generated through changes to KiwiSaver and Working for Families.
The main changes in Working for Families were a gradual lowering of the abatement threshold and an increase in the abatement rate. The inflation adjustment for family tax credit amounts for children aged 16 and over was suspended until the amounts for children aged 13 to 15 in a family, catch up to the older child amounts.
Changes to KiwiSaver included:
" all employer contributions to KiwiSaver will be subject to employer superannuation contribution tax from 1 April 2012.
" the payment rate and maximum amount of the member tax credit (MTC) was halved from the next MTC year (ending 30 June 2012).
" the default and minimum employee contribution rate will rise from 2% to 3% for all members from 1 April 2013.
" compulsory employer contributions will rise from 2% to 3% from 1 April 2013.
The Budget also announced proposed changes to the student loan scheme and these changes will be included in the Student Loans Scheme Amendment Bill 2011, to be introduced later in 2011.
ADVISING ON GOVERNMENT POLICY
The Government’s tax policy programme is agreed by Ministers and is the major part of our Policy Advice Division’s work. We also advise on Budget packages and develop policy on base maintenance matters. We develop policy to maintain the integrity of the tax system while ensuring that our tax system is as simple as possible and is internationally competitive.
POLICY HIGHLIGHTSDeveloping Budget 2011 policy work was a significant task. It included support for the Government’s Savings Working Group. Considerable effort was also put into policy responses to the Canterbury earthquakes.
Policy responses to the Canterbury earthquakesInland Revenue was significantly involved in legislative and regulatory change and advice on the tax implications of the earthquakes, providing relief for the people of Canterbury. We received positive feedback about our response to these issues. We are still working in this area through continuing consultation and work with other agencies.
Various Orders in Council focused on:
" interest relief and its extension
" the relief of GST on the Ministry of Social Development’s employer subsidy
" exchange of taxpayer-specific information
" flexibility of due dates.
Legislative amendments included:
" relationship between depreciation costs and insurance claims
" timing of deemed disposal of assets relating to insurance payouts
" extending the deductible loss on the destruction of buildings
" roll-over relief for depreciation recovered because of insurance claims
" income and gift duty relief for donations of trading stock
" new Working for Families definition of income—new Commissioner’s discretion
" exempting certain employer welfare contributions
" further extension of the redundancy tax credit
" timing of loss-of-profits insurance claims.
This work is ongoing.
Earthquake charities, donations and fundraisingWe also advised whether particular organisations had charitable status and if donations made to these organisations would entitle the donor to a tax credit.

15PART 1 OPERATIONAL CONTEXTird.govt.nz
The student loan changes focused on improving the value of the student loan scheme and encouraging personal responsibility by:
" ensuring lending is good value by requiring every new loan application to include a contact person as one of the conditions to access the scheme from 1 January 2013.
" maximising repayments from New Zealand-based borrowers by excluding losses from the calculation of net income for student loan repayment purposes from 1 April 2012.
" improving repayments from overseas-based borrowers by shortening the repayment holiday for overseas-based borrowers from three years to one.
Full details of the policy changes introduced in Budget 2011 were published at taxpolicy.ird.govt.nz
International tax reformThe international tax rules have been progressively reformed to align New Zealand with our international trading partners. This helps New Zealand-based businesses to compete more effectively in foreign markets.
As part of the reform, an active income exemption for investments in foreign subsidiaries was enacted in 2009. The Taxation (International Investment and Remedial Matters) Bill, introduced in October 2010, proposes extending the active income exemption to non-controlling but significant investments—non-portfolio foreign investment funds.
New Zealand has also continued to expand its tax treaty network. We signed a treaty with Hong Kong in December 2010. We are renegotiating a number of other treaties.
Information sharing and taxpayer confidentialityThe Taxation (Tax Administration and Remedial Matters) Act 2011 changes Inland Revenue’s information disclosure rules.
The Act amends the secrecy rule contained in section 81 of the Tax Administration Act 1994 to give the Commissioner of Inland Revenue greater discretion to release taxpayer information to administer the tax system more efficiently.
The Act includes changes to facilitate tax information sharing between Inland Revenue and other government agencies. This will allow more efficient use of information collected by Inland Revenue and reduce the need for individuals to provide duplicated information to multiple government agencies.
The changes aim to balance individuals’ privacy rights and a more efficient and effective government service. They should result in:
" improvements in service provision to customers
" improved accuracy and timeliness of social assistance payments
" increased detection and prevention of fraud
" reduced incidence of benefit debt
" improved efficiency for departments due to reduced information duplication
" reduced duplication of information that individuals are required to provide to separate government agencies.
From next year, Inland Revenue will provide comment in our annual report, on how the new secrecy provisions work, noting any issues or complaints that have arisen.
ConsultationWe issued four significant public consultation documents this year.
In July 2010, we sought public feedback on proposed administrative and legislative changes to the tax disputes process. The proposed changes were largely administrative with some remedial legislative changes which have been included in the Taxation (Tax Administration and Remedial Matters) Act 2011.
A consultation paper was released in August 2010 as part of a review of the distinction between depreciation fitout and non-depreciable buildings.
We issued a paper in August proposing broadening the definition of family scheme income, which is used to determine entitlements to Working for Families Tax Credits and other programmes. This was part of a Budget 2010 announcement to improve the integrity of social assistance programmes.

16 NEW ZEALAND INLAND REVENUE ANNUAL REPORT 2011 ird.govt.nz
Feedback was sought in September 2010 on options for updating the child support scheme. Public feedback from over 2,000 submissions was largely supportive, with most favouring a comprehensive review of the scheme. This could include changes to the child support formula, including revised estimates on the cost of raising children, the number of nights used to determine a shared-care arrangement, and counting both parents’ income when setting support levels. Options to change the rules for how child support payments could be made and for late payment penalties were also presented.
LegislationIn the year to June 2011, the following tax bills were introduced to the House:
" Taxation (Annual Rates and Budget Measures) Act 2011 (introduced 19 May 2011) introduced measures announced in Budget 2011, including changes to KiwiSaver and Working for Families. The bill was enacted on 24 May 2011.
" The Taxation (Canterbury Earthquake Measures) Bill was introduced on 4 May and enacted on 24 May 2011. This contained a number of earthquake-related relief measures.
" On 23 November 2010, the Taxation (Tax Administration and Remedial Matters) Bill was introduced. The bill contained proposals to abolish gift duty and also introduced amendments to secrecy provisions in tax administration. This bill was enacted on 29 August 2011.
" The Taxation (International Investment and Remedial Matters) Bill builds on previous reforms of New Zealand’s international tax rules. It contains proposals to allow an active income exemption to joint ventures and other New Zealand shareholdings in foreign companies, that are not controlled by New Zealand firms. The bill was introduced to the House on 26 October 2010.
" The Student Loan Scheme Bill was introduced on 27 August 2010 introducing reforms that will in the future allow borrowers to manage their loans online. This bill was enacted on 29 August 2011.
" The Taxation (Income-sharing Tax Credit) Bill, was introduced on 16 August 2010. It sets out the criteria that would apply for couples caring for children to share their income for tax purposes.
" The Taxation (GST and Remedial Matters) Bill, introduced on 5 August 2010, aimed to remove the ability to avoid paying GST on property transactions. The bill also clarifies the change-in-use rules and the GST boundary between commercial and residential accommodation. This bill was enacted on 20 December 2010.
The tax policy yearJuly 2010A discussion document was released inviting feedback on proposed administrative changes supported by a number of legislative changes to improve the tax disputes process.
August 2010The Taxation (GST and Remedial Matters) Bill was introduced to the House on 5 August 2010. The bill addressed phoenix fraud schemes and was enacted on 20 December 2010.
A technical paper on GST rate-change transitional matters was published as a result of recommendations made by the GST Advisory Panel.
An issues paper was released in August seeking feedback on suggested changes to depreciation of non-residential building fitouts and to the grandparenting of depreciation loading for assets acquired before Budget 2010.
The double tax agreement between New Zealand and Singapore became active on 12 August 2010.
The Taxation (Income-sharing Tax Credit) Bill was introduced on 16 August 2010.
Fund withdrawal tax was repealed and arrangements to help businesses make the transition to the new GST rate of 15% was introduced by Supplementary Order Papers No 156 and No 157 to the Taxation (Annual Rates, Trans-Tasman Savings Portability, KiwiSaver, and Remedial Matters) Bill released on 24 August 2010.
The Student Loan Scheme Bill was tabled in Parliament on 27 August 2010.
On 30 August 2010 public feedback was sought on proposals to improve integrity in social assistance programmes.
September 2010Views were sought on options for child support reforms on 2 September 2010.
The Taxation (Annual Rates, Trans-Tasman Savings Portability, KiwiSaver, and Remedial Matters) Bill was introduced on 19 November 2009 and received Royal assent on 7 September 2010.
On 30 September 2010, the redundancy tax credit repealed in Budget 2010 was extended to 31 March 2011 in response to the September Canterbury earthquake.

17PART 1 OPERATIONAL CONTEXTird.govt.nz
OECD Global Forum peer reviewNew Zealand participated in the OECD Global Forum peer review of tax administrations on the key tax administration measures of transparency and information exchange. The Forum’s report commended the high standard of New Zealand’s laws and practices for international cooperation on information exchange.
The Forum examined New Zealand’s legal and regulatory framework. This evaluation was done to understand how our commercial and civil laws create an environment promoting transparency and exchange of information for tax purposes.
The report noted only minor adjustments as recommendations.
October 2010The Software Developers’ Working Group was established on 7 October 2010.
Reform of New Zealand’s international tax rules continued with the tabling on 26 October 2010 of the Taxation (International Investment and Remedial Matters) Bill.
November 2010A protocol amending the double tax agreement between New Zealand and the United States came into force on 12 November 2010.
An Order in Council on 16 November 2010 set the annual amount of the minimum family tax credit at $22,204.
The Taxation (Tax Administration and Remedial Matters) Bill was introduced on 23 November 2010.
December 2010On 15 December 2010 Supplementary Order Paper No 200 to the Student Loan Scheme Bill was released, clarifying Inland Revenue’s ability to recall a loan in cases of serious non-compliance.
April 2011On 5 April 2011, Supplementary Order Paper No 220 to the Taxation (Tax Administration and Remedial Matters) Bill was released. It contained new tax rules for non-resident investors in portfolio investment entities.
May 2011The Taxation (Canterbury Earthquake Measures) Bill was introduced on 4 May 2011 and enacted on 24 May 2011.
The Taxation (Annual Rates and Budget Measures) Bill was introduced on 19 May 2011 and received Royal assent on 24 May 2011.
June 2011A Supplementary Order Paper No 245 to the Taxation (International Investment and Remedial Matters) Bill was released on 13 June 2011.

19PART 2 STRATEGIC DIRECTION ird.govt.nz
Part two
STRATEGIC DIRECTION

20 NEW ZEALAND INLAND REVENUE ANNUAL REPORT 2011 ird.govt.nz
IR FOR THE FUTURE
Inland Revenue’s mission is:
We contribute to the economic and social wellbeing of New Zealand by collecting and distributing money.
Our success is reflected in two outcomes:
" Revenue is available to fund government programmes through people meeting payment obligations of their own accord.
" People receive payments they are entitled to, enabling them to participate in society.
In April 2011, we launched Inland Revenue’s new strategic document, IR for the future. It sets out our vision and highlights our priorities and the culture we will need to move us towards our future.
IR for the future recognises that we need to develop a culture to help us deliver our outcomes and vision. Our culture is shaped by our beliefs, values and behaviour. The following statements describe the attributes and behaviour we value most:
" Trust and integrity—we act with integrity, honesty and professionalism. This ensures that we continue to be one of New Zealand’s most trusted organisations.
" Valuing people—we treat each other and our customers with respect.
" Innovating to make a difference—we keep finding new ways to lift our performance and make compliance easier.
" Working together—we work together and with other organisations to deliver better services and value.
We are also guided by our legislation, our code of conduct, our charter and our responsibilities as a government department under the Treaty of Waitangi.
OUR PRIORITIESWe have identified six priorities in IR for the future that we will need to achieve our transformation goals. They show the areas we need to focus our efforts and resources on to make a difference and contribute to our outcomes.
The priorities focus on building our information and intelligence capability, improving our systems, aligning our resources and investing in the future skills required to enable a culture of service and excellence. The priorities are:
" We retain, develop and attract high-calibre people with the skills required in the future—enabling a culture of service and excellence.
" We proactively influence voluntary compliance and address the causes of compliance risk and threats through a range of interventions.
" We move customers to cost-effective channels while creating an environment to make it easy for customers to self-manage.
" We improve the efficiency and effectiveness of government through working with other agencies and private providers.
" We use our information to make timely decisions and build an intelligence-led organisation.
" Our systems meet current and future needs.
For details about how we are delivering our priorities see Parts three and four.
Measuring our progressInland Revenue’s Statement of Intent 2010–13 included a range of strategy measures through to 2014. With the introduction of IR for the future, in April this year, these measures are no longer current and will not be reported. We are developing other measures to help us assess progress towards our priorities. When these measures have been finalised and approved they will be included in future Statements of Intent.

21PART 2 STRATEGIC DIRECTIONird.govt.nz
What we are here for
What we want to be
What’s important to us in how we work
Trust and integrity Valuing peopleInnovating to make a difference Working together
These values support a culture based on good relationships, continuous improvement and collaboration, so that we can achieve our performance goals.
Our transformation goals
Our challenges
A world-class revenue organisation recognised for service and excellence
We work with customers and other organisations to make compliance easy and to give New Zealanders confidence that everyone pays and receives the right amount.To be recognised for service and excellence we aim to achieve the performance goals that define a world-class revenue organisation. These are:
Speed Certainty Compliance Value> > > >
We contribute to the economic and social wellbeing of New Zealand by collecting and distributing money
Our success is reflected in two outcomes:
Revenue is available to fund government programmes through people meeting payment obligations of their own accord.
People receive payments they are entitled to, enabling them to participate in society.
>
>
We need to: Reduce our cost of administration
Maintain government revenue in a challenging economic environment
Work more across government to improve services
Respond to the challenges of an increasingly digital world
Improve the quality of information we use to make business decisions
Improve the responsiveness and agility of systems that hold and process business information
>
>
>
>
>
>
The key features of our business in the future will be: Efficient self-management options for customers that provide speed and certainty
A broader approach to compliance based on smarter use of information and a wider range of interventions
A range of different working relationships with other organisations, including strategic partnerships to deliver some services
Less transactional work and less direct contact with customers
Excellence in complex technical work
More automation and streamlined information flows
Greater use of commercial IT products in our systems and services
A healthy culture which our people value and thrive in
>
>
>
>
>
>
>
>
FIGURE 5– IR FOR THE FUTURE

22 NEW ZEALAND INLAND REVENUE ANNUAL REPORT 2011 ird.govt.nz
Our performance measurement framework demonstrates how the outputs we produce make a difference and contribute to our outcomes. It outlines how we use our resources, directing our efforts to the key areas outlined in our priorities, which contribute to our outcomes.
In 2009–10, we developed an initial set of impacts of our interventions for the framework. This was on the understanding that the impacts and the performance measurement framework would evolve over time. During 2010–11, we carried out further work to:
" refine the impact statements, which resulted in fewer impact statements and greater clarification of the difference we are aiming to make. We also clarified the relationship between the impacts to show how they influence voluntary compliance (see “Our impacts” in the performance measurement framework below).
" refine the impact indicators, which resulted in an improved set of indicators, the addition of baseline measurement and a performance target for 2014. For details see figure 8.
" incorporate our mission, vision and priorities from IR for the future.
Our priorities show the key focus areas we intend to direct our resources to. This ensures that the outputs we produce make a difference to customer compliance (through our impacts) and make progress towards our outcomes.
The performance measurement framework also includes our focus on delivering value for money to government and our customers. We have a three-part approach to delivering value for money:
" effectiveness—operating in a way that makes progress towards our outcomes
" efficiency—producing more for less or more for the same
" economy—getting and using our resources as economically as possible and using as few as possible.
MEASURING OUR PERFORMANCE
Value for money
Our missionWe contribute to the economic and social wellbeing of New Zealand
by collecting and distributing money
Our visionA world-class revenue organisation recognised for
service and excellence
EffectivenessEffi
ciency
Economy
FIGURE 6 – PERFORMANCE MEASUREMENT FRAMEWORK
Our outcomes – the goals we are aiming to achieve
Revenue is available to fund government programmes through people meeting payment obligations of their own accord
People receive payments they are entitled to, enabling them to participate in society
Our impacts – the difference we want to make
More customers register and report accurate
information when required
More customers claim their correct entitlements
More customers pay and file information on time
The behaviour of non-compliant customers
improves
More customers are able to self-manage
We improve compliance by ensuring: Compliance includes when: We address non-compliance
so that:
Our outputs – the activities we do
Our priorities – the key areas we will direct our effort and resources to
Services to inform the public about entitlements and meeting obligations
Services to process obligations and entitlements
Management of debt and outstanding returns Taxpayer audit
Policy advice
We retain, develop and attract high-calibre
people with the skills required in the future – enabling a culture of service and excellence
We proactively influence voluntary compliance and address the causes of compliance risk and
threats through a range of interventions
We move customers to cost-effective channels
while creating an environment to make
it easy for customers to self-manage
We improve the efficiency and effectiveness
of government through working with other agencies and private
providers
We use our information to make timely decisions and build an intelligence-
led organisation
Our systems meet current and future needs
Our inputs – the way we use our resources
People Systems Assets

23PART 2 STRATEGIC DIRECTIONird.govt.nz
EFFECTIVENESS We measure our effectiveness through:
" the impacts in the performance measurement framework, which help us to measure the effectiveness of our interventions
" evaluating the long-term effectiveness of our work programmes.
Measuring our impactsWe measure our impacts using a set of impact indicators. Figure 7 shows an aggregated view of our impact performance over the last five years (where information is available).
Figure 8 shows baseline performance, current-year performance and performance targets for our impact indicators. In setting the targets, we have taken into account:
" Inland Revenue’s priorities and transformation goals
" our operating environment including government priorities, the economy and changing customer expectations.
This is the first year we have set performance targets for our impact indicators. The targets vary from maintaining current performance levels to seeking substantial performance improvements. We will review the indicators and targets regularly to ensure they reflect our priorities and the impact we want our interventions to make.
More customers are able to self-manage
More customers register and report accurate information when
required
More customers claim their correct entitlements
More customers pay and file information on time
The behaviour of non-compliant customers
improves
Excellent
Good
Satisfactory
Needs improvement
85%
75%
65%
55%
FIGURE 7 – IMPACT PERFORMANCE
2006–072007–082008–092009–102010–11

24 NEW ZEALAND INLAND REVENUE ANNUAL REPORT 2011 ird.govt.nz
FIGURE 8 – MEASURING OUR IMPACTS3
3 In 2010–11 we discontinued six of the impact indicators that were included in the Statement of Intent 2010–13 because they were either unnecessary or better suited as output measures.
4 We report on this indicator to provide additional contextual information. Results are taken from customer compliance cost surveys of SMEs. As the survey is irregular, no formal target has been set. The results are tracked to ensure tax compliance does not impose undue cost on customers.
5 Overall costs are the sum of external tax compliance costs and the conversion of internal compliance hours into dollars (incorporating labour cost inflation).
Impact indicator Baseline Current performance Target by June 2014
More customers are able to self-manage
" % of customers who are aware of their obligations and entitlements increases
Year end June 2010: 80% Year end June 2011: 80% Increase to 85% or more
" % of customers who find it easy to comply increases Year end June 2010: 71% Year end June 2011: 71% Increase to 75% or more
" Customer compliance costs are minimised4 2004Internal hours: 93External costs: $1,635Overall costs5: $5,628
2009Internal hours: 77External costs: $1,639Overall costs: $5,557
n/a
Factors that influenced the level that targets were set at: This impact is key to enabling improved customer compliance and cost-effectiveness in a fiscally constrained environment.
More customers register and report accurate information when required
" % of returns filed without errors increases Year end June:2007 – 88%2008 – 82%2009 – 83%2010 – 86%
July 2010 – March 2011: 86%
Increase to 90% or more
" % of applications submitted without errors increases
– March 2011 – June 2011: 84%6
To be set when more data is available
" Ratio of registrations to population size and growth follows an appropriate trend7
Year end June 2010: Employers–correlation of 99%, WfFTC customers–correlation of 66%
Year end June 2011: Employers–correlation of 99%, WfFTC customers–correlation of 67%
n/a
" GST assessed to customer spending follows an appropriate trend8
Year end March 2010: Correlation of 92%
Year end March 2011: Correlation of 94%
n/a
Factors that influenced the level that targets were set at: This impact is key to improving customer self-management, reducing unnecessary contacts and improving end-to-end processing.
More customers claim their correct entitlements
" % of accurate WfFTC payments increases9 Tax year: 2006 – 65%2007 – 65%2008 – 67%2009 – 68%
Tax year 2010: 68% Tax year 2013: Increase to 70% or more
" % of customers confident that Inland Revenue takes appropriate action to ensure people receive their entitlements increases
Year end June 2010: 71% Year end June 2011: 73% Increase to 80% or more
Factors that influenced the level that targets were set at: The expected impact of the upcoming changes to WfFTC eligibility rules have been taken into account when assessing our ability to improve accuracy.
6 Results are based on an initial sampling that began in March 2011. 7 We report on this indicator to provide additional contextual information.
Employers’ correlation is between the number of employers who register for PAYE and the percentage of the labour force that is employed (from the Statistics New Zealand Household Labour Force Survey). WfFTC correlation is between the number of customers who receive payments from Inland Revenue and the number of households with dependent children (from the Statistics New Zealand Household Labour Force Survey).

25PART 2 STRATEGIC DIRECTIONird.govt.nz
FIGURE 8 – (CONTINUED)
8 We report on this indicator to provide additional contextual information. This measure highlights a link between consumer spending and the amount of GST assessed, showing the completeness of information provided by GST customers. As this is a indicator that is beyond our influence, no formal target has been set.
9 Payments are considered accurate if customers’ total yearly payments are within $1,000 of their entitlement.
10 Measured using provisional results. Final results will be confirmed in October 2011.
11 The current economic environment, together with our successful focus on prevention and early intervention, has affected cash collection levels this year. Early intervention meant there were fewer new debt cases, resulting in an older debt book—older debt tends to have lower cash collection levels.
Impact indicator Baseline Current performance Target by June 2014
More customers pay and file information on time
" % of returns filed on time increases Tax year: 2006 – 82%2007 – 81%2008 – 80%2009 – 82%
Tax year 2010: 82% Tax year 2013: Increase to 85% or more
" % of payments made by customer on time increases
Tax year:2006 – 88%2007 – 87%2008 – 87%2009 – 86%
Tax year 2010: 87%10 Tax year 2013: Increase to 90% or more
Factors that influenced the level that targets were set at: This impact is a key compliance driver and consequently stretch targets are appropriate.
The behaviour of non-compliant customers improves
" The compliance behaviour of customers who received an audit intervention improves
Year end June:2007 – 87%2008 – 86%2009 – 82%2010 – 83%
Year end June 2011: 82% Maintain at 80% or more
" % of customers confident that Inland Revenue takes appropriate action against those who don’t comply increases
Year end June 2010: 75% Year end June 2011: 75% Increase to 80% or more
" % of collectable debt to total debt increases Year end June:2007 – 68%2008 – 72%2009 – 66%2010 – 68%
Year end June 2011: 69% Increase to 70% or more
" % of cash collected to collectable debt increases
Year end June:2007 – 74%2008 – 69%2009 – 83%2010 – 80%
Year end June 2011: 65%11 Increase to 70% or more by year end
" % of collectable debt to revenue assessed decreases
Year end June:2007 – 5.1%2008 – 6.2%2009 – 6.8%2010 – 7.6%
Year end June 2011: 8.1% Decrease to 7.0% or less
Factors that influenced the level that targets were set at: The current economic environment is a significant factor in debt performance. Maintaining or making small improvements will be challenging.

26 NEW ZEALAND INLAND REVENUE ANNUAL REPORT 2011 ird.govt.nz
The work we have done this year to contribute to our impacts is detailed in Part three. We have also included discussion of the impacts our outputs contribute to in Part six.
Evaluating our work programmes Inland Revenue evaluates the effectiveness of policies and programmes against intended outcomes. Our evaluations focus on the effectiveness of interventions to improve compliance and participation in social policy programmes. Major evaluation reports and findings in 2010–11 included:
" KiwiSaver—we released four major reports focusing on KiwiSaver outcomes. KiwiSaver evaluation: survey of individuals, SME tax compliance costs 2009, KiwiSaver compliance costs evaluation, KiwiSaver evaluation: follow-up survey of SME employers and the Annual Report to Ministers, July 2009 – June 2010.
" Tax compliance costs of small businesses—tax compliance costs for small and medium-sized businesses in New Zealand decreased from 2004 to 2009. The average hours spent on tax decreased by 17.5% and the average amount of money spent on tax compliance decreased by 1.3%. The average compliance cost was $5,557 in 2009. These results include the costs associated with the introduction of KiwiSaver.
" Outbound calling—outbound calling positively influenced compliance. Analyses suggest that outbound calling is most effective if targeted at SME employers with the least knowledge of business tax, ie, those not linked to a tax agent for PAYE and, to a lesser extent, newer businesses and those based in the Auckland area.
" Property compliance programme—programme monitoring told us there was a positive outcome with a significant reduction in new LAQC registrations and an increase in deregistrations.
" Compliance—we are evaluating the effectiveness of programmes to improve compliance in the hidden economy, tax debt management, student loans collection, proactive compliance management and disputes processes.
You can view evaluation reports at ird.govt.nz
EFFICIENCYWe focus on initiatives that improve the efficiency of the services we provide to our customers. They include:
" making it easier for people to interact with us, such as website improvements and ongoing development of our online services
" improving our phone services, eg, SPK2IR, which has helped improve our overall telephone service performance
" encouraging customers to file and pay online.
We continued to use our Lean Six Sigma (LSS) programme to improve the efficiency of our core processes. This year our LSS programme included Inland Revenue’s counter contact practices, a review of our debt management processes and streamlining the process for customers providing information. We have also been supporting other government agencies with their LSS programmes and looking at opportunities to address cross-agency processes.
Inland Revenue is implementing Operations Management12 to support our workforce planning and performance monitoring. This year we ran a pilot programme in student loans that delivered significant productivity improvements. We will be implementing the programme in other parts of our Service Delivery group in the coming year.
Figure 9 shows the impact our efficiency initiatives have had on our bulk payment processing. Since 2006–07, the total cost of processing a payment has dropped by 41% and the direct cost by 56%.
12 Operations Management is an industry best-practice programme that helps us allocate resources to best meet business and customer needs.
FIGURE 9 – COST PER PAYMENT PROCESSED$1.80
$1.60
$1.40
$1.20
$1.00
$0.80
$0.60
$0.40
$0.20
$0.002006–07 2007–08 2008–09 2009–10 2010–11
Cost per payment processed (including overheads)
Cost per payment processed (excluding overheads)
Trend per payment processed (including overheads)

27PART 2 STRATEGIC DIRECTIONird.govt.nz
We measure our organisational efficiency using a number of indicators—see figures 10 and 11.
FIGURE 10 – EFFICIENCY INDICATORS13
Indicator 2010–11
Cost per telephone contact $28.84
Cost per correspondence contact $40.45
Cost per counter contact $35.12
Average cost per customer-initiated contact $31.97
Cost per income tax return processed $5.14
Cost per GST return processed $1.84
Cost per employer monthly schedule processed $4.86
Average cost per return processed $3.77
Cost per child support administrative review processed
$630.22
Cost per payment processed $0.95
The cost of collecting $100 of revenue is an indicator of Inland Revenue’s relative efficiency if other conditions are kept constant. Analysis of the trend in collection cost over time should be treated with caution and understood in the light of background factors that influence the parameter. These factors include changes in tax rates, macro-economic conditions (eg, the recession) and changes in the scope of work we do.
13 2010–11 is the first year we have measured these indicators. In future, we will provide back-year results as a comparison.
FIGURE 11 – COST OF COLLECTING $100 REVENUE
$0.95
$0.90
$0.85
$0.80
$0.75
$0.70
$0.65
$0.60
$0.55
$0.502002 2003 2004 2005 2006 2007 2008 2009 2010 2011
BenchmarkingThis year, Inland Revenue took part in the second Better Administrative and Support Services (BASS) benchmarking review. The review measured administrative and support service performance for 2009–10 using quality and cost metrics.
Inland Revenue’s results for the quality metrics were consistently higher than the average for the BASS cohort. In finance and property, we achieved the higher quality scores at a cost below the median for the BASS cohort.
In 2009–10 Inland Revenue spent 25.1% ($146 million) of organisational running costs (full BASS cohort: 10.5%) on administration and support functions. For Inland Revenue, 82% of this expenditure (20.6% of operational running costs) was on information and communications technology (ICT). The main reasons for this high ICT expenditure are:
" Inland Revenue’s investment in ICT systems development
" ICT infrastructure management (eg, hardware, data storage and telephony) including maintaining our main legacy system, FIRST.
Our level of ICT expenditure is typical for an organisation the size and complexity of Inland Revenue. While we have similar ICT expenditure, as a proportion of total operational expenditure, compared to the Australian Taxation Office and the Canada Revenue Agency, we have a lower ratio of staff to taxpayers. We are also proactively managing our ICT infrastructure management costs, particularly through our procurement practices.
During the year, we took part in two external exercises that identified measures of our efficiency:
" Inland Revenue’s Performance Improvement Framework review rated our efficiency and review processes as strong. The review identified that Inland Revenue was well placed to deliver an effective and efficient tax administration.
" Inland Revenue took part in a benchmarking exercise coordinated by HM Revenue and Customs (the UK revenue authority). Inland Revenue is ranked in the top three (out of 10 participating countries) for 26 of the 42 (62%) indicators used in the benchmarking study that are comparable and allow robust interpretation. Inland Revenue was the highest ranking tax administration for seven of these indicators.
Cost
Year

28 NEW ZEALAND INLAND REVENUE ANNUAL REPORT 2011 ird.govt.nz
ECONOMYWe regularly review our inputs to improve internal processes and reduce costs. Ongoing initiatives have produced savings this year.
Net input costs rose by $39.3 million in 2010–11. The net increase included expenditure of $14.5 million on Budget 2010 funded compliance initiatives and $48.9 million of cost pressures. Inland Revenue delivered savings of $24.1 million to ensure that agreed baselines were met without the requirement for additional baseline funding.
The Crown investment in Budget 2010 compliance initiatives provided returns on investment for the Government accounts above target (see pages 36 and 39).
Improvements to our procurement processes have enabled us to make savings in contracts with key suppliers, including savings from all-of-government contracts for computers and office consumables. We are also planning to improve the value of existing contracts by reducing the number of suppliers, reviewing our specifications or improving Inland Revenue’s processes.
We made savings in printing, stationery and postage costs by improving the quality and take-up of our online services and internal business processes. We also made savings in software licensing and ICT services. These savings were offset by increasing maintenance and mainframe costs, driven in part by the cost of maintaining legacy systems and our increased focus on electronic channels.
We also looked for savings in accommodation costs by consolidating our offices and looking for opportunities to co-locate with other government agencies.
This year, staff numbers increased by 135 full-time equivalent employees (FTEs). However, staff numbers excluding Budget 2010 funded compliance initiatives decreased by 155 FTEs.
The primary driver for savings delivered during the year was the salaries and associated costs.
Personnel costs account for 63% of total operating costs. As a consequence, moderate increases in staff remuneration and increases in staff costs, such as superannuation, created significant cost pressures.

29PART 3 OPERATIONAL PERFORMANCE ird.govt.nz
Part three
OPERATIONAL PERFORMANCE

30 NEW ZEALAND INLAND REVENUE ANNUAL REPORT 2011 ird.govt.nz
HOW WE PROVIDE BETTER, SMARTER SERVICES
One of the IR for the future priorities is:
We move customers to cost-effective service channels, while creating an environment to make it easy for customers to self-manage.
OUR E-SERVICESWe are developing our e-services to make it easier for our customers to self-manage their obligations and entitlements, as well as provide them with greater certainty.
Over the year we continued to strengthen and stabilise our e-services platform to provide faster, consistent and integrated customer service. We also encouraged our customers to register for online services. By increasing the promotion of our self-service options, we have encouraged customers to interact with us through more cost-effective, automated service channels. Over 960,000 people were registered for online services by the end of June 2011.
Our main website ird.govt.nz is one of the most visited government sites and won the Best Government Site category at the 2011 Net Guide Web Awards.
This year we developed new online services for tax agents that give them access to client information through their tax management software. We also improved our services for families and individuals by introducing additional secure e-services for them. These services provide customers with access to account details and enable them to correspond with us through secure email.
FIGURE 12 – ONLINE SERVICES
2008–09 2009–10 2010–11
Total registrations for online services (cumulative)
360,003 619,932 964,904
Account look-up enquiries 9,279,339 13,748,954 12,397,00614
Agent client maintenance 913,492 714,268 507,824
KiwiSaver self-help services 398,591 376,648 2,456,20815
TELEPHONE SERVICESIn 2010–11 we answered 336,460 (8.6%) fewer calls than last year. The reduction in calls answered has been influenced by the introduction of front-end banner messaging on our telephone systems. Customers hear a brief message when they call to encourage more use of our voice and self-service channels.
We have continued to invest in our telephone services to give our customers a more seamless service. This year we enhanced our front-end SPK2IR system16 and developed a new agent user interface.
We minimised the impact of the Canterbury earthquakes on our telephone services by reallocating resources to other locations. We also ran outbound calling campaigns to help customers affected by the earthquakes.
FIGURE 13 – TELEPHONE PERFORMANCE
2009–10 2010–11
Calls answered 4,230,914 3,894,454
Average handling time (min:sec) 10:35 10:48
CORRESPONDENCEDemand for correspondence requiring answers by staff is decreasing slowly. We have also had a significant decrease in the number of paper correspondence items. Figure 14 shows the paper and electronic correspondence items by tax type.
FIGURE 14 – CORRESPONDENCE ITEMS
Tax type 2009–10 2010–11 2009–10 2010–11Paper Electronic
Income tax 501,614 352,399 437,910 409,675
GST 100,224 82,157 66,015 85,701
Working for Families Tax Credits
29,099 26,332 21,036 23,708
PAYE 58,876 49,698 10,483 14,603
Student loans 11,818 10,227 16,235 24,871
Child support 69,511 55,819 16,420 18,048
Other tax types 131,374 166,594 49,065 7,977
KiwiSaver 14,957 8,945 10,487 23,066
Total 917,473 752,171 627,651 607,649
14 Total account look-up enquiries have decreased because this year we moved our account look-up services to Inland Revenue’s portal workspace. This provides customers with related information from different accounts on the same screen, decreasing the number of visits to individual accounts.
15 This is not comparable with previous years due to a change in our measurement methodology. 16 SPK2IR is Inland Revenue’s natural language speech recognition system.

31PART 3 OPERATIONAL PERFORMANCE ird.govt.nz
SUPPORTING OUR CUSTOMERSThis year we provided over 212,000 hours of advice to customers to raise their awareness and understanding of their obligations and entitlements. We did this through:
" running in-house customer seminars
" working closely with other government agencies to provide services, including seminars, to customers
" working with our Christchurch customers to re-establish links and provide assistance, including running local recovery assistance centres
" attending onsite meetings with the Ministry of Social Development for businesses undergoing redundancies or closures.
MAKING TAX EASIERWe continued to work on our Making tax easier initiatives, which will provide better services to customers and reduce operational costs. We are exploring options including:
" a new reporting service for employers to modernise our online filing system
" better support for business software developers, to ensure they can produce software that meets their customers’ needs and Inland Revenue’s requirements.
ADJUDICATING AND RULING ON THE LAWThe Office of the Chief Tax Counsel (OCTC) helps maintain taxpayer confidence in the tax administration by giving guidance on the correct interpretation of the Inland Revenue Acts and other relevant laws. We produce adjudications, public rulings and statements, as well as the more complex and sensitive taxpayer rulings. More straightforward taxpayer rulings are produced in our Large Enterprises business unit. OCTC also oversees technical governance to facilitate and coordinate Inland Revenue’s effort on key tax issues.
Over the past few years we have consistently improved the timeliness of our adjudications and rulings through improved processes and better project management. For example, in 2010–11 we completed 90 adjudication cases (2009–10: 86), and 94% met our timeliness completion target within three months of receipt (target: 80%).
Public items are published at ird.govt.nz/technical-tax
IMPROVING THE DISPUTES RESOLUTION PROCESSWe introduced new administrative procedures to the tax disputes process to make it faster and easier for customers. Either Inland Revenue or the customer can initiate a dispute—usually if there is a disagreement over a tax assessment. We also consulted the public about the disputes process. This consultation followed discussions with the New Zealand Institute of Chartered Accountants and the New Zealand Law Society about the best way to handle disputes.
The improvements to the disputes process focus on shorter, clearer Notices of proposed adjustment17, and offer customers a facilitated conference if a dispute remains unresolved.
Since we introduced the changes, we have reviewed cases that went through the improved disputes process. We found that:
" we have improved the timeliness for progressing cases
" the number of old cases—disputes that have been under way for 18 months or more—is decreasing
" the number of disputes reaching the litigation phase has decreased significantly.
We have had positive feedback from tax agents about facilitated conferences, indicating that the facilitator provided focus and structure to the discussions between the disputing parties.
Statistics about disputes are published on our website at ird.govt.nz/aboutir/audits-legal-issues
17 A Notice of proposed adjustment is the first formal step in the disputes process. It states the adjustments proposed to be made to an assessment, the tax laws that apply, the facts giving rise to the adjustments, and how the law applies to the facts.

32 NEW ZEALAND INLAND REVENUE ANNUAL REPORT 2011 ird.govt.nz
Complaints and ministerial servicesThis year, we managed 7,390 complaints (2009–10: 7,496) and received 2,012 items of ministerial correspondence for reply (2009–10: 2,622). The decrease in ministerial correspondence was mainly because in 2009–10, the Minister of Revenue received 1,164 letters providing feedback for the Victoria University Tax Working Group. However, ministerial volumes were still higher than in previous years (2007–08: 1,233, 2008–09: 1,391) because many customers wrote to the Minister about the increase in GST which took effect on 1 October 2010.
We received 1,835 complaints (2009–10: 1,433) about our telephone services. We received 54% of these in July 2010, when we had very high peak season call volumes. During the second half of the year the number of telephone-related complaints was 70% less than in 2009–10.
This year, we received 337 parliamentary questions (2009–10: 245). A large number of questions in April and May 2011 were about tax debt write-offs and issues related to the student loan redesign.
FIGURE 16 – REASONS FOR COMPLAINTS AND MINISTERIAL CONTACTS
2009–10 2010–11
Telephone services 1,433 1,835
General services 3,162 3,717
Information/explanation required 2,439 2,294
Legislation 1,087 1,042
Procedures 1,410 714
Staff 369 438
CUSTOMER FEEDBACKMeasuring customer satisfaction helps us understand how effective customers think we are in delivering timely and appropriate services.
FIGURE 15 – CUSTOMER SATISFACTION18
2009–10 2010–11Satisfied Very
satisfiedSatisfied Very
satisfied
Customer group
Overall customer satisfaction (all customer groups)
87% 71% 86% 69%
Tax agents 91% 78% 90% 71%
Small and medium enterprises
87% 71% 88% 74%
Working for Families Tax Credits
90% 75% 88% 71%
Large enterprises 90% 71% 89% 71%
Student loans 85% 65% 85% 70%
Individuals 86% 70% 84% 66%
Not for profit 84% 68% 88% 71%
Child support 79% 62% 76% 52%
KiwiSaver 89% 66% 87% 71%
Channel
Telephone 90% 74% 87% 70%
Correspondence 74% 58% 78% 57%
Counter 90% 66% 86% 70%
E-services customer satisfactionWe piloted an e-satisfaction survey to find more about the drivers of customer satisfaction with the online service channel. 72% of customers who recently used our online services found them easy to use. Overall satisfaction with online services was high at 95% for business customers, and 89% for individual customers. The results of the pilot survey will inform future measures of satisfaction with our online services. We will continue to report results in 2011–12, then set targets in 2012–13.
18 Satisfaction is ranked on a 5-point scale, ranging from dissatisfied to very satisfied. In the table, satisfied is made up of 3, 4 and 5 ratings and very satisfied is made up of 4 and 5 ratings.

33PART 3 OPERATIONAL PERFORMANCE ird.govt.nz
One of the IR for the future priorities is:
We improve the efficiency and effectiveness of government through working with other agencies and private providers.
We worked with other government agencies to establish a whole-of-government approach designed around customer needs. We developed a staged low-risk pathway, where new solutions and service delivery models are piloted in three agencies (the Ministry of Social Development, Inland Revenue and the Department of Internal Affairs).
In addition to this service delivery model, we have also cooperated with the Department of Internal Affairs and StudyLink on the enterprise integration design of the igovt logon service for our online services. This project will run in conjunction with StudyLink’s igovt logon migration to take advantage of service improvement and cost reduction opportunities.
We continue to work with software developers to make sure they can develop products that meet their customers’ needs and Inland Revenue’s requirements. We established a Software Developers Working Group, which provides a forum to engage and consult with software developers and key business stakeholders.
One of the effects of the Canterbury earthquakes was the need to work collaboratively with other agencies in Christchurch as part of the recovery effort. Part of this collaboration included co-locating our people with the Ministry of Social Development and Ministry of Economic Development staff.
We also worked with the Ministry of Social Development in Christchurch to implement the earthquake support subsidy to employers and co-locate some face-to-face services. Our staff worked on recovery activities and assisted Civil Defence, New Zealand Police, the Earthquake Commission, Canterbury Earthquake Recovery Authority and the Red Cross. We also worked closely with private providers, particularly tax agents to re-establish links with our customers.
WORKING WITH OTHER AGENCIES AND PROVIDERS

34 NEW ZEALAND INLAND REVENUE ANNUAL REPORT 2011 ird.govt.nz
One of the IR for the future priorities is:
We proactively influence voluntary compliance and address the causes of compliance risk and threats through a range of interventions.
In this section of the report we discuss the role of intelligence gathering in informing our approach to compliance, investigations, legal action, and management of outstanding returns and overdue debt.
USING INTELLIGENCE TO MANAGE COMPLIANCEOne of the IR for the future priorities is:
We use our information to make timely decisions and build an intelligence-led organisation.
Our approach to improving compliance is increasingly being directed by our intelligence gathering and analysis teams. In recent years we have strengthened our capability in the area of strategic compliance risk management, in line with the recommendations coming from the Auditor-General’s review of our audit function19. The review emphasised the need to improve and better define our intelligence needs and the technology that supports our audit work. The results of these improvements are reflected across Inland Revenue.
By proactively seeking out intelligence on economic activity and using information already within our organisation, we have been able to take a more focused approach to compliance and make more cost-effective decisions than in the past. We now take a more systematic view of priorities when we approach risks to revenue and the misuse of social policy entitlements, and consider the best way of dealing with non-compliance. Our traditional audit methods still form an important part of our approach, but investigations have become highly targeted and prioritised to make sure that we are achieving the best results in proportion to the cost of the investigation.
INFLUENCING VOLUNTARY COMPLIANCE
An international benchmarking study coordinated by HM Revenue and Customs20 compared Inland Revenue’s audit performance with nine other tax administrations, and found that we had a very high audit yield (as a percentage of taxpayer receipts) compared to the other countries. The effectiveness of our audits is a reflection of the intelligence effort that precedes audit work and the use of other cost-effective methods to influence compliance.
We have focused on influencing attitudes and behaviour so that we sustain improvements in voluntary compliance in the long term. For example, we have:
" begun intelligence gathering and analysis that exposes the hidden economy
" continued to monitor the property sector to detect non-compliance
" started work looking into the misuse of the charitable status of organisations to avoid paying tax
" begun intelligence gathering in the hospitality, scrap metal, fishing and aquaculture, tourism and agriculture industries, and monitoring online trading and short-term property rentals ahead of major events, eg, the 2011 Rugby World Cup.
We are developing industry benchmarks for small businesses. They will provide guidance on the financial ratios that would normally be expected for various sized businesses in a particular industry.
An important part of our approach to influencing compliance behaviour was the publication of Inland Revenue’s Compliance Focus 2010–11. We published the document on our website and we made presentations about it to organisations with an interest in tax matters. This is the third year we have publicly presented compliance issues we are concerned about.
19 Office of the Auditor-General (2006), Inland Revenue Department: Performance of taxpayer audit—follow-up audit. 20 The United Kingdom’s revenue authority.

35PART 3 OPERATIONAL PERFORMANCE ird.govt.nz
INVESTIGATIONSIntelligence-based analysis is the cornerstone of our approach to managing compliance. We use a range of tools to identify areas of non-compliance and evaluate the most appropriate response, including investigations of the tax affairs of individuals and businesses. Some cases may lead to prosecutions or litigation if disputes arise.
DiscrepanciesWhen we detect a discrepancy between a taxpayer’s self-assessment and our determination of their tax liability, we issue a new assessment. In some cases penalties and interest are applied to the assessment. The value of discrepancies fluctuates from year to year, depending on major cases and the underlying scale of non-compliance identified.
In 2010–11 actual discrepancies exceeded our target for large enterprises due to a small number of high-value cases. There were also high-value evasion and fraud cases that were part of our hidden economy investigations in which voluntary disclosures were made by taxpayers.
FIGURE 17 – AUDIT DISCREPANCIES
Audit category Actual 2009–10 $ million
Target 2010–11 $ million
Actual 2010–11 $ million
Investigations $438 $401 $374
Aggressive tax issues $156 $144 $110
Tax evasion and fraud $174 $87 $209
Large enterprises $2,098 $301 $757
Total discrepancies $2,866 $933 $1,450
Adjustments
Less loss reduction adjustments
$272 – $189
Less imputation credit adjustments
$158 – $429
Additional tax assessed $2,436 – $832
Notes
1. Net discrepancies = gross discrepancies, less timing adjustments. These adjustments are for errors found in a filed return for one period, but claimable in another.
2. Not all net discrepancies result in an immediate tax liability or payment of additional tax. Adjustments to losses have an impact on current or future tax, and imputation credit adjustments similarly affect future tax liabilities.
Focus areas for compliance action
Aggressive tax planning
We continued our focus on inappropriate income diversion arrangements, (see Legal action on page 36). We are also looking to address the misuse of charities’ income exemptions and loss generation. We have also investigated structures where family income is reduced to artificially increase entitlements to social assistance.
High-wealth individuals
We continued to promote compliance among high-wealth individuals and investigated non-compliance when necessary. We assessed an additional $76 million in tax during the year for this group.
Working with large enterprises
We consolidated improvements to our tax risk process so that we can identify and resolve tax risks in a more timely manner, working more closely with large enterprises and developing more open communication. This increases our understanding of their business and the commercial environment they operate in.
We are also piloting cooperative compliance agreements with a small number of large enterprises. This approach commits Inland Revenue and the large enterprise to a number of obligations and may also reduce compliance costs for both parties.
We continue to work with industries which are controlled by separate arrangements, eg, life insurance providers. We make sure they understand the special tax rules for their industry and we monitor the way they are applied.
Complex financing
We have continued to focus on large enterprise groups using tax structured funding arrangements that give a disproportionate tax advantage. These largely relate to the use of mandatory and optional convertible notes. Court action has been initiated in some cases, (see Legal action on page 36).
We are actively identifying and monitoring large enterprise groups and high wealth individuals who enter into innovative and complex financing arrangements. We will review any arrangements considered outside the law.
36 NEW ZEALAND INLAND REVENUE ANNUAL REPORT 2011 ird.govt.nz
International tax
Our advanced pricing agreement programme continues to grow. We completed 13 advanced pricing agreements (APAs) this year, including two bilateral agreements with Australia. We are developing this programme because APAs are still the best mechanism to achieve certainty for multinationals in their international associated party dealings. This is especially applicable to more complex issues such as restructuring arrangements and intellectual property transfers.
Budget 2010 funded initiatives
In Budget 2010, Inland Revenue received $119 million over four years to improve compliance in property, the hidden economy and debt.
Property
Our property compliance programme has continued in its awareness and educative work during 2010–11. We released Tax and your property transactions: Getting it right for people involved in property ownership to explain some of the least understood tax obligations for people involved in buying or selling property. It specifically covers common mistakes people make.
Enforcement in the property area has identified $48.8 million in discrepancies (against our target of $45 million), and we received $0.7 million in voluntary disclosures.
The hidden economy
We continue to concentrate our efforts on taxpayers who do not account for or declare all their income. We used the additional funding to address the hidden economy by investing in better intelligence, increasing our investigation capacity and introducing targeted education into the community. We are also working with private sector groups, other government bodies and overseas authorities to promote better compliance.
Our compliance enforcement activity, including specific hidden economy work, resulted in 938 closed evasion and fraud investigations in 2010–11, with discrepancies of $208.6 million (target: $87 million). Prosecutions followed the more serious cases of non-compliance.
See page 39 for progress on the debt initiative.
LEGAL ACTIONInland Revenue recognises that most businesses and individuals are compliant with tax law. However, we continued to take action against those who deliberately attempt to evade their responsibilities, and ensure that everyone pays their fair share.
We continued to impose a range of penalties including prosecution for serious non-compliance. One taxpayer, who failed to pay over $190,000 in PAYE, was sentenced to seven months home detention. Another taxpayer was jailed for two-and-a-half years after being found guilty of deliberately failing to file a GST return and providing false GST returns to get a refund.
Inland Revenue has achieved a high success rate—over 80%—in decisions delivered by courts on litigation cases. Efforts continue to be focused on tax avoidance issues.
In June 2011 the Commissioner defended a Court of Appeal finding of tax avoidance in the Penny and Hooper case, which had been appealed in the Supreme Court. A decision in this case was delivered on 24 August 2011, upholding the arrangements as tax avoidance.
Work continued on optional convertible note tax avoidance cases, with the first substantive case scheduled to be heard in the High Court in September 2011. The Commissioner continues to focus on achieving a positive High Court judgment as a precedent for these cases.
We also continued to work on resolving outstanding Trinity disputes and attempts to relitigate these cases.

37PART 3 OPERATIONAL PERFORMANCE ird.govt.nz
OUTSTANDING RETURNSIn 2010–11 we:
" sent out 10.2 million returns to taxpayers, 1.1% fewer than in the previous year
" finalised 1.2 million outstanding returns, 18.3% fewer than in the previous year.
This year, we proactively updated our databases to prevent unnecessary returns being sent to customers, which reduced the number of returns being issued. As a result, fewer returns became overdue than we expected. Consequently, we also cleared fewer outstanding returns.
We carried out several early interventions to remind taxpayers to file returns, including:
" texting IR 3 customers with outstanding returns
" running outbound calling campaigns for high-risk returns, eg, GST and PAYE
" radio advertising.
Our performance this year was affected by resources being used to meet peak demand on phone and correspondence channels, and reduced capacity as a result of the Canterbury earthquakes.
MANAGING OVERDUE DEBTDuring 2010–11:
" total overdue debt increased by $371.5 million (7.2%) to $5,522.1 million (2009–10: $90.2 million increase or 1.8%)
" we collected $1,565.5 million cash and $915.3 million from tax pooling21 (2009–10: $2,085.3 million cash, $715.7 million tax pooling).
Our main debt management focus, using the PARE22 model, is on preventing people getting into debt and contacting them early to assist them if they go into debt. We also take recovery and enforcement action when required. Our early intervention approach includes campaigns targeting customers before their payment due dates, and customers with debt less than one year old. Our approach has shown success for:
" debt less than one year old, which decreased by $123 million (8.2%) over the last year, and $728.1 million (35%) since 2008–09
" the decrease in new debt cases during 2010–11 with 39,715 (7.7%) fewer cases being opened than in 2009–10.
A consequence of our early intervention focus is a significant increase in debt aged over two years, which has increased by $492.8 million (22%) in the past year and $911 million (49%) since 2008–09. As debt gets older it accumulates penalties and interest. Of the $2,756.7 million debt aged over two years, $1,624.0 million (59%) is penalties and interest. We are developing plans to address the problem of aging debt in the coming year. Figure 20 has details on the age of debt.
We have also used the extra funding received from Budget 2010 to expand our campaigns, targeting major payment dates for a range of revenue types. For example, we targeted customers with income tax payments due on 7 February, who were at risk of going into debt. We used letters and text messaging to remind them about their payments, supplemented with online advertising. As a result of this campaign, 83% of assessments due on 7 February 2011 were paid on time compared to 72% of payments due on 7 February 2010. And 50% of customers who did not pay or were late with payments due on 7 February 2010 paid on time this year. We also used outbound calling campaigns to quickly follow up those who failed to pay on time after both key income tax payment dates of 7 February and 7 April.
Debt portfolio informationWe are still seeing the downstream effects of the recession in debt levels and we expect this to continue for the next few years. Two indicators of this are the continuing high level of insolvency debt23, which has increased by 234% since 2007, and the increase in debt pending write-off, which has increased by 60% in the past year. Debt has also grown because of financial pressure on customers’ available funds. Some customers choose to pay other creditors (especially suppliers) as a priority over Inland Revenue to keep a business activity going.
In 2010–11 we opened 475,748 new debt cases (2009–10: 515,463) and closed 459,979 debt cases (2009–10: 510,980).24 These decreases are because, as a result of our debt prevention approach, we had a big decline in the number of short-term debt cases, ie, cases that closed within two months of being opened.
21 Tax pooling allows compliant customers to reduce their exposure to use-of-money interest on underpayments of provisional tax by purchasing funds from, or depositing money with, a tax pooling intermediary. This can create debt for up to 60 days before being paid.
22 This model emphasises different responses to customers in different phases of debt. The phases are prevent, assist, recover and enforce.
23 A large proportion of insolvency debt in our debt portfolio resulted from actions initiated by parties other than Inland Revenue.
24 Excludes cases opened and closed in less than five days.

38 NEW ZEALAND INLAND REVENUE ANNUAL REPORT 2011 ird.govt.nz
FIGURE 18 – COMPONENTS OF OVERDUE DEBT (AT 30 JUNE)
Debt type ($ million) 2007 2008 2009 2010 2011 1 Year change
1 Year change
(%)
Non-collectable debtDeferred debt $757 $755 $963 $729 $686 –$42 –6%
Insolvency debt $215 $283 $548 $742 $718 –$24 –3%
Pending write-off $193 $188 $194 $193 $308 $114 60%
Total non-collectable debt $1,165 $1,226 $1,705 $1,664 $1,712 $48 3%
Collectable debtDebt under instalment $798 $918 $1,105 $938 $1,147 $209 22%
Residual collectable debt $1,700 $2,268 $2,250 $2,549 $2,663 $114 5%
Total collectable debt $2,498 $3,186 $3,355 $3,487 $3,810 $323 9%
Total debt $3,663 $4,412 $5,060 $5,151 $5,522 $371 7%
Customers in debt (total cases) 280,920 340,400 353,391 363,814 389,947 26,133 7%
Annual debt change 4% 20% 15% 2% 7% – –
25 Debt value in this table includes student loans debt and is based on cases using a weighted average of debt elements in each case. They are not comparable with Part 8, where the age is calculated on the average of each debt case.
FIGURE 20 – AGE OF DEBT AT 30 JUNE25
2009 2010 2011 1 Year change
Debt ($ million)
Debt cases
Debt ($ million)
Debt cases
Debt ($ million)
Debt cases
Debt ($ million)
Debt cases
< 1 year $2,106 238,964 $1,501 215,315 $1,377 220,597 –$124 5,2821–2 years $1,108 50,655 $1,386 84,000 $1,388 89,063 $2 5,063
2–5 years $1,260 51,777 $1,542 50,839 $1,788 63,840 $246 13,001
> 5 years $586 11,995 $722 13,660 $969 16,447 $247 2,787
Total $5,060 353,391 $5,151 363,814 $5,522 389,947 $371 26,133
FIGURE 19 – TOTAL OVERDUE DEBT BY TAX TYPE (AT 30 JUNE)
Total overdue debt 2010 $ million
2011 $ million
1 Year change
1 Year change
(%)
Income tax $2,158 $2,208 $50 2%GST $1,809 $1,908 $99 5%
PAYE $532 $623 $91 17%
Student loans $325 $412 $87 27%
Working for Families Tax Credits
$238 $275 $37 16%
Other tax $89 $96 $7 8%
Total $5,151 $5,522 $371 7%

39PART 3 OPERATIONAL PERFORMANCE ird.govt.nz
Future collection systemWe have completed initial work in developing a case for our future collection system. It confirms the need for a new debt and returns management system and recommends possible solutions. This initiative will be considered and prioritised in the future in conjunction with Inland Revenue’s long-term transformation work programme.
Office of the Auditor-General’s report on managing tax debt (2009)
We have implemented one of the five recommendations (alignment of internal and external reporting) in the Office of the Auditor-General’s 2009 report Inland Revenue Department: Managing Tax Debt and have made progress with the others. However, we depend on system and process changes to fully implement the remaining recommendations. Three of these recommendations depend on the proposed future collection system for implementation, and we will implement the fourth when we introduce an improved reporting tool and refresh our debt collection strategy.
Budget 2010 funded initiativeWe used funding received in Budget 2010 to recruit specialist debt staff and invest in new technology for our outbound calling campaign work. During 2010–11:
" we collected $115.3 million cash against a target of $100 million
" the return on investment was 9.5:1, above the target of 7.8:1
" we recruited additional specialist staff to build our campaign capability. By 30 June 2011 these teams had approximately 150 FTEs involved in campaign work.
The outbound calling campaigns were affected by the Canterbury earthquakes because most of our outbound calling team is based there. As a result of the earthquakes, this work was picked up by other debt teams across the country. As an interim measure we also used an external outbound calling provider for eight weeks from 28 March 2011.
Despite the reduced ability to involve our Christchurch-based outbound calling staff at critical times, we improved the level of coverage over all our debt cases. During the year, we targeted just over 170,000 people and businesses through our early intervention strategy, which meant substantially more customers were directly contacted than in previous years.
International benchmarkingInland Revenue meets regularly with the International Debt Management Committee (IDMC)26 to share information about debt management best practice. The IDMC (led by the Australian Taxation Office) is developing key performance indicators to benchmark debt management performance. We have included some of the proposed benchmarks in our performance measures for 2011–12.
We took part in an international tax benchmarking study coordinated by HM Revenue and Customs (the United Kingdom’s revenue authority). The results show that Inland Revenue’s debt management performance compares favourably with other tax authorities. Inland Revenue was ranked in the top three (out of 10 countries) for six out of 10 debt management indicators.
Putting debt information in context
Crown tax receivables and overdue debt
Inland Revenue administers tax, student loan repayments and child support on behalf of the Crown. As at 30 June 2011 the nominal value of these assets was $23,444 million.
There is often a time lag between an assessment being raised or debt being recognised, and the point when cash payment is due. If payment is not received on time the debt is considered overdue. Of the $23,444 million assets Inland Revenue administers, $5,110 million tax, $412 million student loans and $1,743 million in child support penalties is overdue.
FIGURE 21 – RELATIONSHIP BETWEEN RECEIVABLES AND OVERDUE DEBT
Components of debt (June 2011)
Not due debt
$ million
Overdue debt
$ million
Total
$ million
Tax $5,860 $5,110 $10,970Student loans $10,319 $412 $10,731
Child support penalties
– $1,743 $1,74327
Total $16,179 $7,265 $23,444
26 The IDMC has revenue authority representatives from New Zealand, Australia, Canada, the United Kingdom and the United States.
27 This figure, taken from the Crown financial schedules, does not match the child support debt figures on page 41 because the Crown financial schedules include accruals and only show the portion of overdue debt due to the Crown, ie, penalties. Overdue child support assessment debt is administered on behalf of custodial parents and is not reported in this section.

40 NEW ZEALAND INLAND REVENUE ANNUAL REPORT 2011 ird.govt.nz
Impairment
As part of our financial reporting requirements we seek an independent valuation of our receivables (debt). This year the impairment charge for student loans and tax receivables was negative $94 million and $224 million respectively. The factors influencing the impairment for student loans include policy changes, refinements to the actuarial model used and changes in the borrowers’ demographic profile. The key driver of this year’s impairment is the Budget Economic and Fiscal Update 2011 decision to hold the student loan repayment threshold constant until 2015. Holding the threshold constant results in increased repayments in a growing economy. The growth seen in the tax receivables impairment is a result of growth in the overdue debt book. For more information see Part eight.
Note: See Additional information on page 143 for more detailed statistics on our debt levels and pages 41 to 45 for a discussion of debt from the delivery of social policy programmes (child support, student loans and Working for Families Tax Credits).

41PART 3 OPERATIONAL PERFORMANCE ird.govt.nz
CHILD SUPPORTWe administer child support assessments and payments for approximately 179,500 liable parents and 181,400 custodial parents, who support an estimated 272,700 children. Since the scheme began we have collected 89.3% of the total of $5.2 billion child support assessed. This year we:
" distributed $209.1 million (50.8%) of child support and domestic maintenance collected to payees and $202.9 million (49.2%) to the Crown28 to offset sole parent benefits paid to custodians by the Ministry of Social Development.
" collected $420.4 million29 in child support payments (2009–10: $401.0 million). 23.8% of the amount collected was for previous year assessment arrears and penalties.
In 2010–11, options for updating the child support scheme were issued for public consultation (see page 16).
Child support debt
Office of the Auditor-General’s report on managing child support debt (2010)
In July 2010, the Office of the Auditor-General released its report Inland Revenue Department: Managing Child Support Debt. The report recognised that Inland Revenue is doing a good job monitoring, prioritising and collecting child support debt. We are working to implement the report’s recommendations:
" Child support debt strategy—we have included the strategy for collecting child support debt in Inland Revenue’s overall debt strategy, and we have developed a plan for collecting child support debt.
" Information for new and existing customers—improved services for families and individuals have enabled child support customers to update income estimates and note changes in their circumstances through a secure authenticated channel.
We completed an audit of information available to child support customers on our website but flow-on effects from the Canterbury earthquakes have delayed planned work to refresh and update the website content. We are also reviewing and updating our printed publications.
" Assess the current penalty regime— we completed some system enhancements following our review of the child support debt management computer systems and processes. We have scheduled more changes for 2011–12.
Child support debt portfolio
At 30 June 2011, total New Zealand child support debt was $2,271 million, an increase of $327 million (16.8%) from last year.30 Of the increase in total child support debt, $29 million (8.8%) is assessment debt and $298 million (91.2%) is penalties.
$1,738 million (76.5%) of child support debt is more than five years old. Of this, 15.6% is assessment debt and 84.4% is penalty debt. The main reason for the high level of aged debt is that we are required to collect all outstanding child support debt, even where recovery may be unlikely (eg, bankruptcy). We can only write off a valid assessment if the liable parent has died or by a court order.
We can write off some of a liable person’s late payment penalties provided they comply with their payment programme for 26 weeks. This year, we wrote off $52.1 million for 23,798 liable parents compared to $38.5 million for 25,382 liable parents in 2009–10.
30 This figure does not include $105.8 million debt being collected on behalf of the Australian Child Support Program from Australian paying parents who live in New Zealand. Child support debt figures do not match those in Part eight, because the Crown financial schedules include accruals and only show the portion of overdue debt due to the Crown, ie, penalties. Overdue child support assessment debt is administered on behalf of custodial parents.
28 Payments to the Crown include penalties as well as assessments paid.29 This figure includes assessments and penalties collected for both this year
and any previous years.
DELIVERING SOCIAL PROGRAMMES

42 NEW ZEALAND INLAND REVENUE ANNUAL REPORT 2011 ird.govt.nz
See Additional information on page 146 for analysis of child support debt by age.
Information matching with New Zealand Customs Service
This year the New Zealand Customs Service notified us of border crossings by 8,614 liable parents in debt. This is a small increase32 in notifications compared to 2009–10 (8,582 – 2009–10 corrected figure). The value of debt repayment arrangements entered into as a result was $86.8 million, a 12% increase from $77.5 million in 2009–10.
At 1 July 2010 there were 2,645 customers with uncollectable debt because they were missing. We located 268 of these, reducing the number of missing customers to 2,377 (10.1% reduction).
Reciprocal collection agreement with Australia
We have had a reciprocal agreement for collecting child support with the Australian Child Support Program (ACSP)33 since July 2000. At 30 June 2011, ACSP managed 11,759 cases (11,450 in debt) for New Zealand and we managed 6,306 (4,978 in debt) cases for Australia.
31 Debt being collected under the reciprocal agreement by the Australian Child Support Program for New Zealand.
32 Due to recently discovered and corrected data integrity issues, last year’s result of 12,602 was overstated by 4,020 cases as a result of counting departure and arrival of the same customer as two distinct notifications. 33 Previously known as the Australian Child Support Agency (ACSA).
FIGURE 23 – RECIPROCAL AGREEMENT FOR COLLECTION OF CHILD SUPPORT (AT 30 JUNE)
Total debt cases Debt owed $ million
Debt collected $ million
2010 2011 2010 2011 2010 2011
New Zealand cases handled by Australian Child Support Program
10,487 11,450 $462.5 $502.1 $34.4 $43.3
Australian cases handled by Inland Revenue 4,401 4,978 $80.1 $105.8 $11.1 $11.3
FIGURE 22 – CHILD SUPPORT DEBT (AT 30 JUNE)
Child support debt type ($ million)
2006–07 2007–08 2008–09 2009–10 2010–11 1 Year change
1 Year change (%)
Penalty debt $703 $834 $1,016 $1,368 $1,666 $298 21.8%Assessment debt $465 $504 $540 $576 $605 $29 5.0%
Debt under arrangement $534 $612 $770 $964 $1,123 $159 16.5%
Uncollectable debt $241 $258 $249 $273 $311 $38 13.9%
Not yet under arrangement $393 $468 $537 $707 $837 $130 18.4%
Total child support debt $1,168 $1,338 $1,556 $1,944 $2,271 $327 16.8%
Customers in debt (cases) 130,863 132,026 134,535 139,136 141,464 2,328 1.7%
Debt under arrangement/total debt (%) 45.7% 45.7% 49.5% 49.6% 49.4% –0.2% –
Reciprocal debt31/total debt (%) 23.4% 24.0% 26.2% 23.8% 22.1% –1.7% –

43PART 3 OPERATIONAL PERFORMANCE ird.govt.nz
STUDENT LOANSThis year, the nominal value of loans with Inland Revenue for collection increased from $9.8 billion to $10.7 billion. At 30 June 2011 there were about 621,000 borrowers (2009–10: 587,500) and the median value of the loans was $11,880 (2008–09: $11,399).
FIGURE 24 – STUDENT LOAN REPAYMENTS
Repayments 2006–07 $ million
2007–08 $ million
2008–09 $ million
2009–10 $ million
2010–11 $ million
PAYE system $344.2 $394.4 $452.1 $473.9 $491.6
From borrower $142.3 $155.7 $167.0 $170.5 $199.0
Total $486.5 $550.1 $619.1 $644.4 $690.634
RepaymentsIn the year to June 2011, 71% of repayments were collected through the PAYE tax system. The remainder came from borrowers living overseas, self-employed borrowers in New Zealand, borrowers under the income threshold who made voluntary repayments, and from those who chose to make payments over their assessed repayment amount.
The growth of 3.7% in repayments collected through the PAYE system reflects the underlying increase in the borrower base and compliance activity to make sure that borrowers declare the correct tax code to their employer. However, the percentage growth in PAYE collected is lower than in previous years.
Repayments received directly from borrowers increased by 16.7%. The main factors that affected this payment stream were:
" expiry of repayment holidays for about 25,000 borrowers who now have a repayment obligation
" the campaign to improve compliance among overseas-based borrowers
" campaigns to raise repayment compliance among borrowers in New Zealand.
Voluntary repayment bonus
From April 2009 borrowers who made repayments of $500 or more above their repayment obligation, received a 10% bonus. Since the bonus was introduced:
" $216 million in voluntary repayments have attracted the bonus
" the value of the repayments is evenly divided between New Zealand-based and overseas-based borrowers, but those overseas accounted for only 35% of those making the repayments
" overseas-based borrowers’ repayments were about twice the value of New Zealand-based borrowers’ repayments.
FIGURE 25 – REPAYMENT BONUS FROM APRIL 2009 TO JUNE 2011
Bonus repayments New Zealand-
based
Overseas- based
Total
Number of bonuses granted 26,743 14,498 41,241
Voluntary repayment $108 million
$108 million
$216 million
Average bonus $404 $744 $523
34 This figure is net of refunds to borrowers who have repaid their loans and is not comparable to Part eight, which includes gross repayments.

44 NEW ZEALAND INLAND REVENUE ANNUAL REPORT 2011 ird.govt.nz
Overdue student loan repayments At 30 June 2011, the amount of overdue student loan repayments was $411.6 million. There were 100,067 borrowers with payments that were overdue (June 2010: 92,412), about 16% of the total borrower base.
FIGURE 26 – OVERDUE STUDENT LOAN REPAYMENTS
30 June 2010
$ million
30 June 2011
$ million
% change
Borrowers based:$142.2 $122.7 –13.7%– in New Zealand
– overseas $182.5 $288.9 58.3%
Total $324.7 $411.6 26.7%
The sharp increase in overdue repayments is due to a peak in defaults among overseas-based borrowers who reach the end of their repayment holiday and go into arrears. New Zealand-based borrower overdue repayments have fallen by $20 million due to improved compliance. We credit this result to campaigns aimed at making sure that borrowers use the right tax code and proactive actions to prevent self-employed borrowers from getting into arrears.
In October 2010, Inland Revenue started a year-long initiative, focusing on the recovery of overdue repayments from 1,000 student loan borrowers whose last known address is in Australia. The initiative uses:
" direct campaigns to contact the target group of borrowers about paying their student loans
" online advertisements on Facebook, Google and popular New Zealand websites aimed at people who may have New Zealand student loans in Australia, to increase their level of awareness and encourage repayment. The online advertisements were recently expanded to reach borrowers worldwide.
Changes to the student loan scheme were announced in Budget 2011 (see Part one). For a full report on the student loan scheme go to educationcounts.govt.nz
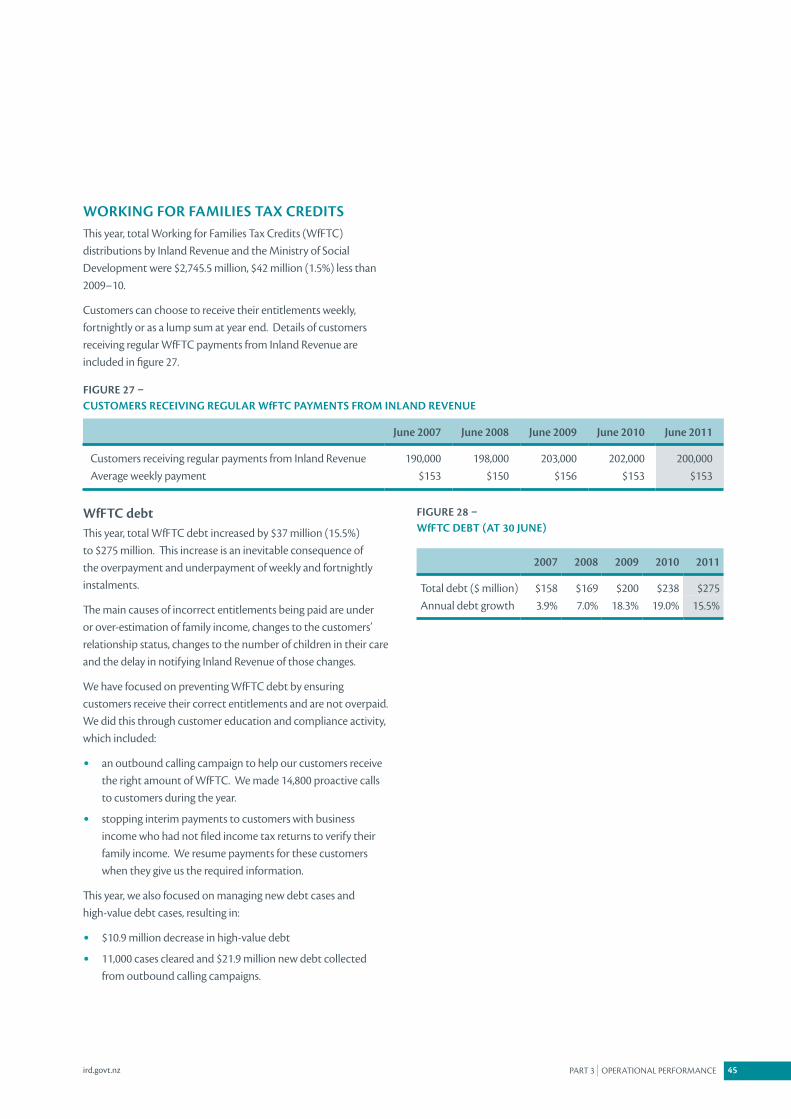
45PART 3 OPERATIONAL PERFORMANCE ird.govt.nz
WORKING FOR FAMILIES TAX CREDITSThis year, total Working for Families Tax Credits (WfFTC) distributions by Inland Revenue and the Ministry of Social Development were $2,745.5 million, $42 million (1.5%) less than 2009–10.
Customers can choose to receive their entitlements weekly, fortnightly or as a lump sum at year end. Details of customers receiving regular WfFTC payments from Inland Revenue are included in figure 27.
WfFTC debtThis year, total WfFTC debt increased by $37 million (15.5%) to $275 million. This increase is an inevitable consequence of the overpayment and underpayment of weekly and fortnightly instalments.
The main causes of incorrect entitlements being paid are under or over-estimation of family income, changes to the customers’ relationship status, changes to the number of children in their care and the delay in notifying Inland Revenue of those changes.
We have focused on preventing WfFTC debt by ensuring customers receive their correct entitlements and are not overpaid. We did this through customer education and compliance activity, which included:
" an outbound calling campaign to help our customers receive the right amount of WfFTC. We made 14,800 proactive calls to customers during the year.
" stopping interim payments to customers with business income who had not filed income tax returns to verify their family income. We resume payments for these customers when they give us the required information.
This year, we also focused on managing new debt cases and high-value debt cases, resulting in:
" $10.9 million decrease in high-value debt
" 11,000 cases cleared and $21.9 million new debt collected from outbound calling campaigns.
FIGURE 27 – CUSTOMERS RECEIVING REGULAR WfFTC PAYMENTS FROM INLAND REVENUE
June 2007 June 2008 June 2009 June 2010 June 2011
Customers receiving regular payments from Inland Revenue 190,000 198,000 203,000 202,000 200,000Average weekly payment $153 $150 $156 $153 $153
FIGURE 28 – WfFTC DEBT (AT 30 JUNE)
2007 2008 2009 2010 2011
Total debt ($ million) $158 $169 $200 $238 $275Annual debt growth 3.9% 7.0% 18.3% 19.0% 15.5%

46 NEW ZEALAND INLAND REVENUE ANNUAL REPORT 2011 ird.govt.nz
KIWISAVERThis year, KiwiSaver membership grew by 295,990 (20.3%), with total membership approaching 1.8 million at the end of June 2011. This represents about 46% of all New Zealanders under 65. Most of the new members enrolled through providers.
FIGURE 29 – KIWISAVER MEMBERSHIP (AT 30 JUNE)
Enrolment method 2009 2010 2011
Automatically enrolled 426,629 541,769 646,725
Opted in through employer 195,940 211,883 232,131
Opted in through provider 477,971 706,290 877,076
Total members 1,100,540 1,459,942 1,755,932
During 2010–11 Inland Revenue sent $2.9 billion to providers, 34% of which was a Crown contribution (2009–10: 36%). We expect the proportion of Crown contributions to continue to decrease over time because there will be fewer kick-start payments.
FIGURE 30 – KIWISAVER FUNDS TO PROVIDERS35
Source of funds 2008–09 $ million
2009–10 $ million
2010–11 $ million
Members
Employee deductions $917 $1,051 $1,156
Employer contributions $355 $626 $740
Voluntary contributions $6 $9 $15
Total member contributions
$1,278 $1,686 $1,911
Crown
Member tax credit $322 $573 $664
Kick-start $471 $376 $331
Fee subsidy $34 $9 –
Interest $12 $5 $5
Total Crown contributions
$839 $963 $1,000
Total funds to providers $2,117 $2,649 $2,911
Changes to the KiwiSaver scheme were announced in Budget 2011 (see page 14).
PAID PARENTAL LEAVEPaid parental leave (PPL) is a payment for parents who take leave from their jobs or business to care for a newborn or adopted child. Inland Revenue distributes PPL on behalf of the Department of Labour. The maximum amount of PPL is inflation-indexed each year. The maximum weekly rate increased from $441.62 to $458.82 from 1 July 2010 with 84% of applicants receiving the maximum payment.
This year, we:
" distributed $153.8 million to eligible applicants (2009–10: $153.9 million)
" processed 26,368 applications for PPL (2009–10: 27,493).
35 Figures are on a cash accounting basis and are gross (ie, exclude refunds from providers). They exclude member tax credits paid to complying funds and contributions made direct to scheme providers.

47PART 4 ORGANISATIONAL HEALTH AND CAPABILITYird.govt.nz
Part four
ORGANISATIONAL HEALTH AND CAPABILITY

48 NEW ZEALAND INLAND REVENUE ANNUAL REPORT 2011 ird.govt.nz
At 30 June 2011 we had 5,64636 full-time equivalent employees (FTEs) (2009–10: 5,511). This increase is due to recruiting staff for Budget 2010 initiatives. However, our FTE number is still below the cap of 6,310 for total positions (including vacancies) established by Cabinet (CAB (09)111) in 2009.
A CULTURE OF SERVICE AND EXCELLENCEOne of the IR for the future priorities is:
We retain, develop, and attract high-calibre people with the skills required in the future—enabling a culture of service and excellence.
To build a culture of service and excellence, we need our people to have the right skills and competencies required for the future.
Strong leadership is central to delivering our priorities. This year, we introduced leadership expectations to provide our leaders with clarity about what is expected of them. To help embed our leadership expectations and build our desired culture, we are implementing a number of initiatives to empower them. We:
" delivered Making it real leadership forums, focusing on what culture means for leadership behaviour and demonstrating our organisational values as set out in IR for the future
" included leader expectations in our job expectation templates
" aligned our 360° survey tools to the leader expectations and use them to assess leadership development needs
" developed an internal coaching model to help leaders demonstrate required behaviour, develop coaching skills and improve performance
" refreshed components of our leadership framework to reinforce the leadership expectations.
International research shows that engaged employees are more productive, customer-focused and more likely to stay longer with an organisation. An engaged workforce will help us meet our customers’ needs and improve compliance. This year’s engagement survey showed an overall engagement mean score of 3.77 out of 5, placing us at the 53rd percentile for the New Zealand State Sector Database.
PLANNING FOR OUR FUTURE WORKFORCEWe are focusing on developing strengths in key areas to ensure that we have the skills for a successful business transformation. They include designing services in collaboration with users, external stakeholder management and gaining product
DEVELOPING OUR PEOPLE CAPABILITY
knowledge of the new technology being introduced. We are developing key areas by:
" conducting an IT capability assessment
" focusing on project resources
" developing and implementing individual development planning tools
" strengthening our stakeholder management capability, including introducing a toolkit to support our stakeholder management skills.
This year we have focused on identifying and addressing our future capability requirements. An example of this is our work on the Future Direction of Service Delivery project (see page 12).
We also introduced succession planning at a business unit level to supplement our “critical roles” work at a senior level.
DEVELOPING SKILLS AND KNOWLEDGETo develop high-calibre people now and for the future, we need to provide access to effective and relevant development opportunities. We developed and shared training across priority areas, eg, debt collection, systems training, senior technical knowledge and networking. We also introduced new learning frameworks for customer-facing roles, which has helped us to identify and plan for skill gaps.
We analysed performance needs to ensure our training aligns with our capability priorities. A wider use of on-the-job training and use of online media has ensured our flexibility in responding to the Canterbury earthquakes, and supporting changes in how we deliver our services.
We also led and collaborated with other government agencies to improve our learning management system. The system allows us to share our training resources with other government agencies and helps align planning development with performance goals.
SUPPORTING EEO AND DIVERSITYWe produced a diversity scorecard, which will help Inland Revenue to take a more strategic approach to diversity. We integrated our pay and employment equity response plan into the diversity scorecard. Our ongoing monitoring process ensures we consider pay and employment equity issues when analysing business information.
We ran a Diversity Network forum for representatives from our 26 diversity networks, which allowed the diversity groups to share their knowledge between the networks, and identify and implement opportunities to enhance their effectiveness.
36 Excludes vacancies.

49PART 4 ORGANISATIONAL HEALTH AND CAPABILITYird.govt.nz
MEASURING OUR CAPABILITYThis year we introduced new capability indicators. They measure Inland Revenue’s capability, showing our performance over time and comparing us to other public sector organisations.
37 State Services Commission, (2010), Human Resource Capability (HRC) Survey of Public Sector Departments (as at June 2010).
FIGURE 31 – WORKFORCE INDICATORS
2006–07 2007–08 2008–09 2009–10 2010–11 Comparison
Staff FTEs 5,552 5,976 6,038 5,511 5,646 Establishment cap: 6,310
Staff turnover 11.9% 12.0% 8.0% 7.2% 9.4% 2010 public sector average: 9.2%37
Staff engagement (mean) out of 5
3.75 3.83 3.90 3.77 3.77 2011 Gallup engagement survey database for New Zealand State Sector, 50th percentile: 3.74

50 NEW ZEALAND INLAND REVENUE ANNUAL REPORT 2011 ird.govt.nz
One of the priorities for IR for the future is:
Our systems meet current and future needs.
It is critical that our technology systems are strong and stable. This year we focused on the following key areas to ensure that the systems meet current and future needs:
" Stabilising the environment to support the increase in activity.
" Repositioning our business systems to support the shift to the electronic channel.
" Establishing centralised business rules capability and infrastructure.
" Improving capability to support the technology transformation required to support the future direction of Inland Revenue.
Stabilising our IT environmentDuring the year our IT environment has been available 99.9% of the time, with the highest number of transactions processed in a single day at 8.6 million in May. We continued to stabilise and strengthen our core information technology infrastructure, as well as improving our performance by:
" moving our key subsystems to new platforms
" making internal process efficiencies
" improving the electronic end-user interface.
A significant focus has been to ensure the stability of our online services, which continue to grow in importance to Inland Revenue. We also implemented a new electronic channel for tax agents to review account details. We are replacing the method for exchanging data with other agencies and improving the interface for customers to access account details. See page 30 for more information on improvements to our online services.
During the year we successfully managed business continuity during the Canterbury earthquakes. We achieved this through cooperation with other agencies and our vendors, which helped us return to service within a short timeframe.
Improving our IT capabilityWe reviewed our long-term plan for data centre housing and storage. This will support the technology transformation required to ensure that our systems meet future needs. We have identified further efficiencies and improvements, including the uptake of shared government services.
We continue to review how our IT capability and systems are provided to ensure that business systems delivery is managed effectively. This includes considering how IT services will be provided to support our future direction, including business transformation.
We continued to work on the systems transformation stream of our business transformation programme. We have developed the business case for continued investment in our existing systems and introduced five system transformation options. We will integrate these with our transformation business blueprint, which will help us develop our business transformation options and roadmap.
We have established a Business Rules Centre to simplify the translation from legislation and policy to business and system rules. This will help them to become easily understood, centralised, documented, and provide transparency between the legislation and the business and system rules.
We worked with the Department of Internal Affairs (DIA) to implement the first stage of the one.govt network solution. This will provide a secure IT network for government agencies to collaborate and share information. We also worked closely with the DIA to evaluate the tender for the “Infrastructure as a service” for Inland Revenue’s future use.
We worked closely with the Ministry of Social Development to identify how to manage the shared student loan processes. We are also implementing a rules engine that will help automate the student loans application processes.
OUR SYSTEMS MEET OUR NEEDS

51PART 5 GOVERNANCE AND RISK MANAGEMENT ird.govt.nz
Part five
GOVERNANCE AND RISK MANAGEMENT
52 NEW ZEALAND INLAND REVENUE ANNUAL REPORT 2011 ird.govt.nz
The Commissioner chairs the Executive Board which examines longer-term strategy, ethics, integrity, strategic risks and progress towards our desired future and outcomes. In addition, the senior management team meets weekly.
The Executive Board is supported by the following governance groups:
" Portfolio Governance and Investment Committee—oversees the approval, initiation and implementation of significant programmes/projects.
" Business Transformation Programme Board—provides assurance that Inland Revenue business transformation initiatives will meet the strategic needs of the organisation. Following the recommendations of our Performance Improvement Framework review, the Commissioner now chairs this Board.
" Technical Governance Committee—facilitates and ensures the coordination and consistency of departmental work on key technical matters.
In addition to the Executive Board and the supporting governance groups above, the Risk and Assurance Committee provides independent advice to the Commissioner on carrying out his statutory responsibilities and accountabilities. This Committee has an independent chair and includes independent members to ensure objective advice.
Inland Revenue has a risk management framework based on international industry standards. Business areas apply the framework to operational and change activities to ensure that we identify and manage risks to successful business and change initiatives. We have established processes for managing risks relating to programmes and portfolios of work and have strengthened these during 2010–11.
GOVERNANCE

53PART 5 GOVERNANCE AND RISK MANAGEMENT ird.govt.nz
Our risk management framework is based on the ISO Risk Management Standard (ISO31000:2009) and sets out the principles for managing risk. The framework:
" requires business owners to adopt risk management practices
" has a strong assurance focus that supports governance bodies
" applies to strategic, operational, project, programme and portfolio risk.
STRATEGIC RISKSWe have identified these key strategic risks to Inland Revenue.
RevenueThere are constant threats to the revenue base from global and national developments and customer behaviour. The recession has had ongoing impacts that continue to influence our revenue collection and increase the level of customer debt.
We continue to undertake various measures to reduce the recession’s impact on the Crown’s accounts. We initiated a project to improve debt management and we have a programme to manage compliance risks.
Reputation and community confidenceIf we do not understand increasing customers’ requirements or meet our Minister’s and/or customers’ expectations, our reputation could be negatively affected. This could lead to a loss of confidence in us by government and/or customers and could undermine voluntary compliance and funding, which are critical for an effective tax administration.
We continue to improve our understanding of customers, as well as taking steps to deliver the right customer services. This includes analysing customer survey responses, developing new customer programmes, strengthening customer relationships and improving customer contact channels.
People capabilityIf we do not attract, develop or retain skilled, capable people to meet the current and future needs of our customers, as well as the department and the environment it operates in, we will reduce our ability to prepare and respond to policy and administrative challenges.
This risk is reflected as one of our key organisation priorities. We are continuing to build our people capability through identifying capability gaps and are working on developing strengths in key skill areas, (see Part four).
MANAGING RISKS
Information technologyThere are risks associated with some of the information technology systems we operate. These put pressure on our ability to make system changes quickly and effectively.
This risk is also reflected as a key organisational priority. As the Performance Improvement Framework report (PIF report 2011) confirmed, our transformation programme is modernising our infrastructure and systems and is important to our future. This is reflected as a key investment priority in our future capital intentions.
Information managementIf Inland Revenue has poor information management processes, we may not have the business information to support planning, monitoring, analysis and reporting, compliance-based management or correct and accessible customer information. This could lead to poor decision-making capability, impacting on our ability to deliver our outcomes.
We have established an information management programme to build on the agreed information management vision, framework and principles.38 This decision represents a significant commitment of resources (people, information systems and business processes changes) over the next few years.
FinancialsIf Inland Revenue does not plan or anticipate funding needs for the future we may be unable to deliver government priorities.
We have reviewed short-term baseline reduction requirements and balanced efficiency initiatives with longer-term transformational objectives. Our fiscal forecasting and decision making has allowed us to better meet current and future funding expectations.
38 This was discussed in the PIF report 2011.

PART 6 STATEMENT OF SERVICE PERFORMANCE
Part six
STATEMENT OF SERVICE PERFORMANCE
55ird.govt.nz

56 NEW ZEALAND INLAND REVENUE ANNUAL REPORT 2011 ird.govt.nz
STATEMENT OF RESPONSIBILITY
In terms of the Public Finance Act 1989 I am responsible, as Chief Executive of Inland Revenue, for the preparation of the department’s financial statements and statement of service performance, and for the judgements made in them.
I have the responsibility for establishing a system of internal control designed to provide reasonable assurance as to the integrity and reliability of financial reporting and the statement of service performance.
In my opinion, these financial statements fairly reflect the financial position and operations of the department for the year ended 30 June 2011.
Robert Russell Chief Executive and Commissioner of Inland Revenue
22 September 2011
Countersigned by:
Margaret Delany Acting Chief Financial Officer
22 September 2011

57PART 6 STATEMENT OF SERVICE PERFORMANCEird.govt.nz
STATEMENT OF SERVICE PERFORMANCEFOR THE YEAR ENDED 30 JUNE 2011
REPORTING PERFORMANCEOur forecast service performance is divided into two groups:
" Activity forecasts—these are forecasts of expected customer demand for our services that provide context for our performance measures results. Significant variation from the forecast figures can influence the achievement of the targets set for our performance measures.
" Performance measures—these are measures we use to set our performance targets. They measure our performance in terms of quantity, quality, timeliness and cost. We are reporting cost measures for the first time. As we did not set targets for all of these measures in 2010–11, a complete set of results is on page 27. Additional cost targets have been set for 2011–12 and these will be reported against in future annual reports.
The following section reports on our performance against our original forecasts. Where a performance measure is expressed in terms of a range of characteristics that the output should meet, the result is reported as “achieved” or “not achieved” (eg, see Output Expense 1). For these performance measures we have provided additional information to explain our performance.
We have bolded the 2010–11 columns for all performance measures that are not achieved with a negative variance greater than 5%.
We have provided comment for:
" key activity forecasts outside the expected range. Secondary activity forecasts have not been commented on separately because they form part of the key activity forecasts.
" performance measures with a negative variance of more than 5%. These measures were not achieved.
" performance measures with a positive variance greater than 10%.
Some performance measures are measured using a sample of the customer population. We have marked these performance measures with a hash mark (#) in the 2010–11 Actual column.
In the past, and in 2010–11, a 5% tolerance was applied to determine whether performance targets had been achieved. From 2011–12 we will no longer apply this tolerance and we have adjusted some 2011–12 performance targets to reflect this change.
Comparative performance dataWhere appropriate we have included comparative performance information against the activity forecasts and performance measures for the previous year (2009–10 Actual). We have not included comparative performance information for new performance measures, or where there has been a change in the performance measure or measurement methodology that made the results incomparable. These are indicated by “n/a”.
Performance context commentaryWe have included information to give context to the performance achieved. For each output expense we have included a summary of:
" the impacts we want to contribute to. Further information about our performance measurement framework is in Part two.
" factors influencing our performance during 2010–11.
These commentaries form part of the overall performance picture and should be read in conjunction with the activity forecasts and narrative in the other sections of this report.

58 NEW ZEALAND INLAND REVENUE ANNUAL REPORT 2011 ird.govt.nz
SUMMARY OF SERVICE PERFORMANCEFigure 32 summarises the performance measures achieved within the 5% tolerance. This year, we achieved 51 of 61 (84%) performance measures within the 5% tolerance. We achieved 37 of the 61 (61%) performance measures with a positive variance.
FIGURE 32 – PERFORMANCE MEASURES ACHIEVED WITHIN 5% TOLERANCE
2008–09 2009–10 Output expense 2010–11
3 of 4 4 of 4 Policy advice 6 of 619 of 24 20 of 21 Services to inform the public about entitlements and meeting obligations 12 of 14
20 of 20 18 of 18 Services to process obligations and entitlements 15 of 17
8 of 8 8 of 9 Management of debt and outstanding returns 9 of 15
9 of 9 9 of 9 Taxpayer audit 9 of 9
59 of 65 59 of 61 Total 51 of 61
Figure 33 shows the number of demand-driven activity forecasts below the forecast range, within the forecast range and above the forecast range.
FIGURE 33 – ACTIVITY FORECASTS WITHIN RANGE
Output expense 2010–11 Below range
2010–11 In range
2010–11 Above range
Policy advice There are no activity forecasts in this output classServices to inform the public about entitlements and meeting obligations 2 of 3 1 of 3 0 of 3
Services to process obligations and entitlements 1 of 5 3 of 5 1 of 5
Management of debt and outstanding returns There are no activity forecasts in this output class
Taxpayer audit 0 of 1 0 of 1 1 of 1
Total 3 of 9 4 of 9 2 of 9
In 2010–11, the Canterbury earthquakes had a negative impact on the achievement of six of our performance targets:
" timeliness of electronic correspondence responses
" timeliness of processing registrations and issuing child support administrative review decisions
" number of outstanding returns filed or brought to completion and percentage of returns finalised within three months of the due date and within six months of the due date.
These are discussed further in the following output sections. We anticipate that the situation in Canterbury will continue to influence our performance in 2011–12.

59PART 6 STATEMENT OF SERVICE PERFORMANCEird.govt.nz
OUTPUT EXPENSE 1 POLICY ADVICE
DescriptionThis output expense provides policy advice services jointly with the Treasury that contribute to achieving the government’s tax and social policy outcomes, and improving the economic and social wellbeing of New Zealanders.
Activities undertaken:
" advising on all aspects of tax policy and social policy measures that interact with the tax system
" drafting tax and social policy legislation
" negotiating and maintaining New Zealand’s network of double tax agreements with other countries
" forecasting tax revenues
" providing ministerial services.
Performance context commentary
The impacts we contribute to
Providing policy advice services protects and maintains the integrity of the tax system while ensuring that our tax system is as simple as possible and is internationally competitive. This contributes to all of our impacts, ie:
" more customers are able to self-manage
" more customers register and report accurate information when required
" more customers claim their correct entitlements
" more customers pay and file information on time
" the behaviour of non-compliant customers improves.
When customers comply with their obligations and receive their entitlements we make progress towards Inland Revenue’s outcomes:
" Revenue is available to fund government programmes through people meeting payment obligations of their own accord.
" People receive payments they are entitled to, enabling them to participate in society.
Factors influencing performance during 2010–11
Significant areas of work in 2010–11 were:
" providing policy advice for Budget 2011, including support for the Government’s Savings Working Group
" the urgent policy response to the Canterbury earthquakes.
This work took priority over other items in the Government’s tax policy work programme.
See Advising on Government Policy on page 14 and Complaints and ministerial services on page 32 for further information.
Financial performance for the year ended 30 June 2011 ($000)
Revenue Expenses Net surplus/(deficit)
14,833 14,627 206

60 NEW ZEALAND INLAND REVENUE ANNUAL REPORT 2011 ird.govt.nz
OUTPUT 1.1 POLICY ADVICE IN RELATION TO TAX AND SOCIAL POLICY
DescriptionThis output involves:
" advising on all aspects of tax policy and social policy measures that interact with the tax system
" developing tax and social policy in line with the Generic Tax Policy Process
" drafting tax legislation for introduction in the House and assisting its passage through the House
" negotiating and maintaining New Zealand’s network of double tax agreements with other countries
" forecasting future tax flows and other non-tax Crown revenue for the government
" reporting on revenue receipts against forecasts
" analysing revenue implications of changes in tax and social policy.
Performance measures2009–10
Actual Measure
2010–11Target Actual Variance
Quantity, quality and timelinessAchieved We will provide the Minister with: Achieved Achieved1 –
" tax and social policy advice as agreed in the tax policy work programme
" draft tax bills as agreed and support their introduction and passage through Parliament
" budget forecasts and updates
following the Generic Tax Policy Process within agreed timeframes.
n/a We will ensure that we comply with the regulatory impact analysis requirements for policy advice, including quality assurance assessments where required (advice is complete, convincing, consulted, clear and concise).
Achieved Achieved2 –
Achieved We will ensure that the Minister is satisfied with the quality of policy advice, tax legislation and revenue forecasts provided.
Achieved Achieved3 –
Explanation for “achieved” rating
We will provide the Minister with tax and social policy advice, draft tax bills, and budget forecasts and updates.
The achievement of this measure is based on the delivery of tax policy work, including draft tax bills and budget forecasts, in accordance with the agreed timeframes to deliver the Government’s tax policy work programme.
1 See Explanation for “achieved” rating on this page and Generic Tax Policy Process on page 61.2 See Tax policy quality assurance assessment criteria on page 61.3 This standard is measured by using a survey of the Minister near the end of the year.

61PART 6 STATEMENT OF SERVICE PERFORMANCEird.govt.nz
Generic Tax Policy Process
A process designed to produce better, more effective tax policy. There are five key development stages.
Stage Description
Strategic This involves the development of an economic strategy, a fiscal strategy and a revenue strategy.
Tactical This involves the development of a work programme and an annual resource plan.
Operational This involves detailed policy design, formal detailed consultation, and Ministerial and Cabinet approval of detailed policy recommendations.
Legislative This stage, which can occur concurrently with the operational stage, involves the translation of the detailed policy recommendations into legislation.
Implementation and review
This involves the implementation of legislation and any post-implementation review.
Tax policy quality assurance assessment criteria
Quality standard
Description
Complete All required information (including disclosure statement) is included in the Regulatory Impact Statement (RIS).
All substantive elements of each fully-developed option is included (or the RIS identifies the nature of the additional policy work required).
All substantive economic, social and environmental impacts have been identified (and quantified where feasible).
Convincing Status quo, problem definition and any cited evidence is presented in an accurate and balanced way.
The objectives relate logically to and fully cover the problem definition.
The options offer a proportionate, well-targeted response to the problem.
The level and type of analysis provided is commensurate with the size and complexity of the problem and the magnitude of the impacts and risk of the policy options.
The nature and robustness of the cited evidence is commensurate with the size and complexity of the problem and the magnitude of the impacts and risks of the policy options.
The conclusions relate logically and consistently to the analysis of the options.
Consulted The RIS shows evidence of efficient and effective consultation with all relevant stakeholders, key affected parties, government agencies and relevant experts.
The RIS shows how any issues raised in consultation have been addressed or dealt with.
Clear and concise Communicated in plain English, with minimal use of jargon and any technical terms explained.
The material is structured in a way that is helpful to the reader.
The material is concisely presented with minimal duplication, appropriate use of tables and diagrams and references to more detailed source material to help manage the length.

62 NEW ZEALAND INLAND REVENUE ANNUAL REPORT 2011 ird.govt.nz
OUTPUT 1.2 MINISTERIAL SERVICES
DescriptionThis output involves all activities associated with ministerial services, including responding to ministerial correspondence and parliamentary questions. It includes all tax, child support, student loan, KiwiSaver and family assistance ministerial correspondence and supply of information.
Performance measures2009–10
Actual Measure
2010–11Target Actual Variance
QualityAchieved We will ensure that all answers are correct, complete, clear and
appropriately referenced.Achieved Achieved4 –
Timelinessn/a Percentage of ministerial correspondence responded to within 10 days. 95% 95% –
n/a Percentage of parliamentary questions responded to within required timeframes.
100% 100%5 –
Explanation for “achieved” rating
We will ensure that all answers are correct, complete, clear and appropriately referenced.
This measure is achieved when:
" standard quality checks are completed and agreed processes are followed as part of preparing a response
" detailed quality reviews are completed for at least 10% of responses, and are assessed as satisfactory.
Ministerial services quality criteria
Quality standard Description
Correct A correct interpretation of the law.
Complete A fully resolved response which answers all aspects of the enquiry.
Clear Communicated in a way that the customer can understand.
Appropriately referenced
Referenced to the appropriate sections of the Acts or authorities when required.
4 See Explanation for “achieved” rating and Ministerial services quality criteria on this page.5 The statutory timeframe for oral parliamentary questions is response in the Minister’s office by 12:00pm on the day of receipt. The statutory timeframe for
written parliamentary questions is six working days from the day lodged with the Office of the Clerk.

63PART 6 STATEMENT OF SERVICE PERFORMANCEird.govt.nz
OUTPUT STATEMENT: POLICY ADVICE
FOR THE YEAR ENDED 30 JUNE 2011
2009–10 Actual
$000
2010–11 Actual
$000
2010–11 Main
estimates $000
2010–11 Final
voted $000
Revenue
15,320 Crown 14,655 15,117 14,655
160 Other 178 168 157
15,480 Total revenue 14,833 15,285 14,812
Expenses
14,653 Annual appropriations 14,627 15,285 14,812
14,653 Total expenses 14,627 15,285 14,812
827 Net surplus/(deficit) 206 – –

64 NEW ZEALAND INLAND REVENUE ANNUAL REPORT 2011 ird.govt.nz
OUTPUT EXPENSE 2 SERVICES TO INFORM THE PUBLIC ABOUT ENTITLEMENTS AND MEETING OBLIGATIONS
DescriptionThis output expense provides services that help taxpayers and other customers to meet their payment obligations of their own accord and to receive payments they are entitled to. This is achieved through a range of proactive and reactive services to make people aware of their entitlements and obligations, and the services available to help them comply. This output expense also contributes to confidence in the tax administration system through managing individual customer complaints quickly, fairly and in confidence.
Activities undertaken:
" providing information to taxpayers on the application of the tax laws
" responding to enquiries from taxpayers and social support programme customers
" providing assistance to the public, businesses and tax agents
" adjudication on behalf of the Commissioner on proposed taxpayer assessments
" providing binding rulings and other statements, on the interpretation and application of the law administered by Inland Revenue.
Performance context commentary
The impacts we contribute to
Providing customers with relevant information and advice, certainty in relation to the application of the law, and a choice in how they engage with us ensures that customers are aware of and understand their obligations and entitlements. This means more customers are able to self-manage and consequently:
" more customers register and report accurate information when required
" more customers claim their correct entitlements
" more customers pay and file information on time.
When customers comply with their obligations and receive their entitlements we make progress towards Inland Revenue’s outcomes:
" Revenue is available to fund government programmes through people meeting payment obligations of their own accord.
" People receive payments they are entitled to, enabling them to participate in society.
Factors influencing performance during 2010–11
The Canterbury earthquakes had a major effect on performance this year. We responded immediately after the earthquakes by reallocating work to other sites. With the closure of our main Christchurch building, service delivery resources were significantly reduced (46% fewer FTEs available for output related work in June 2011 than in November 2010). We did not meet our timeliness target for responding to electronic correspondence as a direct result of the earthquakes. However, due to our increased focus on engaging with customers affected by the earthquakes, we completed 21% more advisory hours than in 2009–10.
Overall, demand for service customer contacts (telephone calls, correspondence and counter enquiries) was 9% below the forecast range. We made improvements to our management of this year’s peak season, which helped improve voice channel performance in the fourth quarter compared to the same period in 2009–10. The average cost of service customer contacts was $31.97 per contact. For 2011–12, we have set a performance target for the average cost per contact and we will report on this in the 2011–12 Annual Report. The demand for self-help service enquiries was 8% below the forecast range.
Customer satisfaction with our services remains high and is consistent with last year’s results. This year we piloted an e-satisfaction survey to gain further insight into the drivers of customer satisfaction with the online service channel—72% of customers who recently contacted our online services found them easy to use. Overall satisfaction with online services was high at 95% for business customers, and 89% for individual customers. The results of the pilot survey will inform future measures of satisfaction with our online services. We will continue to report results in 2011–12, then set targets for 2012–13.

65PART 6 STATEMENT OF SERVICE PERFORMANCEird.govt.nz
Our timeliness performance for taxpayer rulings has improved significantly because of process improvements we introduced in 2010.
Full commentary on our information services and adjudications and rulings work is included in How we provide better, smarter services on pages 30 to 32. Information on the delivery of social policy programmes is on pages 41 to 46.
Financial performance for the year ended 30 June 2011 ($000)
Revenue Expenses Net surplus/(deficit)
246,919 245,396 1,523

66 NEW ZEALAND INLAND REVENUE ANNUAL REPORT 2011 ird.govt.nz
OUTPUT 2.1 INFORMATION SERVICES
DescriptionThis output involves responding to customer enquiries on tax and social support programmes (including child support and KiwiSaver) through electronic channels, correspondence, telephone, personal appointments, actively providing advice through a range of communication approaches delivered in the community and through the complaints management service.
Activity forecasts
2009–10 Actual
Activity forecast6
2010–11Forecast Actual
n/a We expect to answer an estimated 6.01 to 6.65 million service customer contacts, including child support contacts.
6.01–6.65 million
5.47 million
n/a " 0.88 to 0.92 million paper correspondence contacts, including child support paper correspondence contacts.
880,000–920,000
752,171
n/a " 0.65 to 0.72 million electronic correspondence contacts, including child support electronic correspondence contacts.
650,000–720,000
607,649
242,299 " 0.23 to 0.26 million counter enquiries, including child support counter enquiries. 230,000–260,000
219,326
4.23 million " 4.25 to 4.70 million telephone enquiries, including child support telephone enquiries.
4.25–4.70 million
3.89 million
n/a We expect to answer an estimated 17.53 to 19.37 million self-help service contacts, including child support self-help service enquiries.
17.53–19.37 million
16.06 million
n/a " 0.67 to 0.74 million interactive voice response (IVR) contacts, including child support IVR.
670,000–740,000
695,498
n/a " 2.24 to 2.48 million KiwiSaver scheme provider requests for confirmation. 2.24–2.48 million
2.56 million
n/a " 0.92 to 1.02 million agent client maintenance. 0.92–1.02 million
507,824
n/a " 13.70 to 15.14 million account look-up enquiries. 13.70–15.14 million
12.40 million
Explanation for forecasts outside range
We expect to answer an estimated 6.01 to 6.65 million service customer contacts.
Demand was below forecast for all service channels. This was influenced by our focus on moving customers to more cost-effective, self-help channels.
We expect to answer an estimated 17.53 to 19.37 million self-help service contacts.
Although we encouraged customers to move to self-help channels, demand did not meet our forecasts. In particular, the Canterbury earthquakes affected customers’ ability to contact us.
6 Several changes to these activity forecasts mean some 2009–10 results are not comparable. Customer contacts have been split into service contacts and self-help contacts, correspondence contacts have been split into paper and electronic correspondence contacts, KiwiSaver scheme provider requests are now counted as self-help contacts instead of correspondence contacts, and we changed our measurement methodology for account look-up enquiries.

67PART 6 STATEMENT OF SERVICE PERFORMANCEird.govt.nz
Child support activity forecasts Note: These activity forecasts are a subset of the previous information services activity forecasts and are reported separately for transparency.
2009–10 Actual
Activity forecast
2010–11Forecast Actual
704,725 We expect to answer an estimated 574,000 to 634,000 child support contacts. 574,000–634,000
523,559
n/a " 75,000 to 83,000 child support paper correspondence contacts. 75,000–83,000
55,819
n/a " 14,500 to 16,000 child support electronic correspondence contacts. 14,500–16,000
18,048
17,242 " 15,500 to 17,000 child support counter enquiries. 15,500–17,000
13,323
497,566 " 469,000 to 518,000 child support telephone enquiries. 469,000–518,000
436,369
103,986 We expect to receive 109,000 to 121,500 child support interactive voice response (IVR) enquiries.
109,000–121,500
not available
Explanation for forecasts outside range
We expect to answer an estimated 0.57 to 0.63 million child support contacts.
Child support correspondence and telephone volumes have been decreasing for the past four years because we have focused on providing complete customer service, reducing child support customers’ need for additional contact with us.
We expect to receive 109,000 to 121,500 child support interactive voice response (IVR) enquiries.
In May 2010 we switched child support self-help service enquiries from the old IVR system to SPK2IR. Although child support IVR enquiries are included in the result for overall IVR contacts, due to system compatibility issues, we are unable to provide separate child support results for this forecast. We are working with our technology provider to fix this for 2011–12.

68 NEW ZEALAND INLAND REVENUE ANNUAL REPORT 2011 ird.govt.nz
Performance measures2009–10
Actual Measure
2010–11Target Actual Variance
Quantity
175,881 Hours spent completing information, education and compliance focused advisory services.
175,000 212,065 21.2%
Quality
88.6% Percentage of customers who are given an answer that is correct, complete, clear, timely and appropriately referenced, that also shows an understanding of their environment.
88% 85.9%# (2.4%)
87.0% Percentage of customers who have contacted us and are satisfied with the quality of the service we provide.
85% 86.4%# 1.6%
75.8% Percentage of all initial telephone enquiries fully resolved at the time, requiring no follow-up action.
80% 74.7%# (6.6%)
n/a Percentage of customers who have contacted us and find they can easily access our services.
85% 82.6%# (2.8%)
n/a Percentage of customers who have contacted us and find the information straightforward and easy to understand.
85% 83.0%# (2.4%)
Timeliness
n/a Percentage of paper correspondence responded to within three weeks of receipt.
80% 77.4% (3.3%)
92.8% Percentage of all electronic enquiries responded to within one week of receipt.
80% 64.9% (18.8%)
77.9% Percentage of telephone calls responded to within one minute on priority queues.
70% 71.0% 1.4%
76.4% Percentage of telephone calls responded to within four minutes on general service queues.
70% 76.5% 9.3%
# measured using a sample of the customer population.
Explanation for significant positive variance
Hours spent completing information, education and compliance focused advisory services.
Advisory hours are 20.6% above the result for 2009–10. Increased advisory work has been an important factor in supporting the recovery from the Canterbury earthquakes.
Explanation for targets not achieved
Percentage of all initial telephone enquiries fully resolved at the time, requiring no follow-up action.
This year’s result is consistent with previous years. Inland Revenue’s strategy to shift less complex contacts to self-help channels is increasing the breadth and complexity of telephone enquiries, making them more difficult to resolve at first contact.
Percentage of all electronic enquiries responded to within one week of receipt.
Performance was affected by reduced capacity as a result of the Canterbury earthquakes.

69PART 6 STATEMENT OF SERVICE PERFORMANCEird.govt.nz
OUTPUT 2.2 ADJUDICATION AND RULINGS
DescriptionThis output involves:
Adjudication
" providing a technical review of existing taxation disputes referred to the Adjudication Unit
" issuing an adjudication report (or other formal communication of conclusions) to the parties concerned
" issuing, where required, an assessment consistent with the conclusions of the technical review.
Taxpayer rulings
" considering applications for and providing binding private and product rulings, and statutory determinations
" preparing statutory determinations and valuations, eg, taxpayer-specific accruals.
Public rulings
" preparing and issuing binding public rulings
" developing and publishing non-binding statements on the Commissioner’s view of the law administered by Inland Revenue, eg, interpretation statements and interpretation guidelines
" considering applications for and providing taxpayer-specific depreciation determinations
" preparing and publishing depreciation and other determinations, eg, livestock valuations
" considering and responding to technical correspondence.
Activity forecast
2009–10 Actual
Activity forecast
2010–11Forecast Actual
36 Number of public items we expect to publish or finalise consideration of (including technical correspondence), giving the Commissioner’s interpretation of the law.
25–45 28
Performance measures
2009–10 Actual
Measure
2010–11Target Actual Variance
Quantity
Achieved Rulings reports, adjudication reports, public items and technical correspondence or advice meets the applicable purpose, logic, alternatives, consultation and practicality standards.
100% 100%7 –
Timeliness
n/a Percentage of adjudication cases completed within three months of receipt.
80% 94.0% 17.5%
n/a Percentage of taxpayer ruling applications that have a draft ruling completed within three months of receipt.
90% 100% 11.1%
n/a Percentage of non-qualifying taxpayer ruling applications that have a draft ruling completed within the timeframe agreed with the applicant (which will not be more than six months from the receipt of the application).
90% 100% 11.1%
7 Each adjudication report is evaluated by a file closure issue review of the file, by a manager who was not involved in processing the adjudication case. See Quality criteria definitions on page 70.

70 NEW ZEALAND INLAND REVENUE ANNUAL REPORT 2011 ird.govt.nz
Explanation for significant positive variances
Percentage of adjudication cases completed within three months of receipt.
We completed 90 adjudication cases. This was our first year of targeting 80% of cases within three months of receipt, and measuring timelines from receipt rather than allocation. The initial target proved to be an underestimate. Targets for 2012–13 onwards will be set to better reflect our performance.
Percentage of taxpayer ruling applications that have a draft ruling completed within three months of receipt, and
Percentage of non-qualifying taxpayer ruling applications that have a draft ruling completed within the timeframe agreed with the applicant.
We completed 56 draft taxpayer rulings this year—39 qualifying rulings and 17 non-qualifying rulings. The improved rulings process implemented in February 2010 has contributed to the positive variances.
Quality criteria definitions
Quality standard
Description
Purpose The subject matter and conclusions are clearly stated and guidance is provided in a manner useful to those affected by them.
Logic The assumptions used are explicit, and the argument is logical and supported by appropriate legal authority.
Alternatives Alternative legal arguments and interpretations are adequately considered and their respective merits assessed.
Consultation There is evidence of appropriate consultation with the public, and contrary legal arguments and practical difficulties identified have been considered.
Practicality Compliance and administrative costs and problems for customers and Inland Revenue arising from implementation, including feasibility and timing, and consistency with the general body of the Commissioner’s interpretation and application of tax law, have been considered, and incorporated in the analysis insofar as they are relevant to the interpretation and are possible under the legislation.
Correct The law is correctly interpreted and the response is supported by the appropriate legal authority.
Complete The response fully resolves all aspects of the enquiry.
Clear The response will be communicated in a way that is clear to the enquirer.
OUTPUT STATEMENT: SERVICES TO INFORM THE PUBLIC ABOUT ENTITLEMENTS AND MEETING OBLIGATIONS
FOR THE YEAR ENDED 30 JUNE 2011
2009–10 Actual
$000
2010–11 Actual
$000
2010–11 Main
estimates $000
2010–11 Final
voted $000
Revenue
238,859 Crown 243,290 242,848 243,290
3,120 Other 3,629 2,682 2,480
241,979 Total revenue 246,919 245,530 245,770
Expenses
230,629 Annual appropriations 245,396 245,530 245,770
230,629 Total expenses 245,396 245,530 245,770
11,350 Net surplus/(deficit) 1,523 – –

71PART 6 STATEMENT OF SERVICE PERFORMANCEird.govt.nz
OUTPUT EXPENSE 3 SERVICES TO PROCESS OBLIGATIONS AND ENTITLEMENTS
DescriptionThis output expense provides services that contribute to the availability of revenue to fund government programmes, as well as ensuring that taxpayers and other customers receive payments they are entitled to, including tax refunds. This is achieved through services designed to achieve timely, efficient and effective assessment and processing of:
" tax payments, tax credit claims and refunds for taxpayers
" entitlements for social support programmes.
Activities undertaken:
" registering taxpayers
" making tax assessments
" banking tax payments and making refunds
" processing applications and payments for social support programmes
" supplying information to other government agencies
" accounting and reporting the collection of Crown revenue
" collecting ACC employee earners’ levy as a component of PAYE deductions.
Performance context commentary
The impacts we contribute to
Accurate, timely, complete and efficient processing of notices, statements and social policy entitlements increases customers’ confidence in the tax system. When customers have confidence in the tax system they are more likely to be able to self-manage their compliance obligations. This means:
" more customers register and report accurate information when required
" more customers claim their correct entitlements
" more customers pay and file information on time.
When customers comply with their obligations and receive their entitlements we make progress towards Inland Revenue’s outcomes:
" Revenue is available to fund government programmes through people meeting payment obligations of their own accord.
" People receive payments they are entitled to, enabling them to participate in society.
Factors influencing performance during 2010–11
We achieved all our performance targets in this output expense except two that were directly affected by the Canterbury earthquakes. These were:
" the timeliness standard for processing registrations. Year-to-date performance to 31 January 2011 was 89%, which dropped to 84.1% at 30 June 2011.
" the timeliness standard for processing child support administrative review decisions.
This year, we made improvements to the processing of paper-based income tax returns and tax credit claim forms, including centralising mail opening and payment processing in Upper Hutt from February 2011. As a result, our timeliness for processing income tax returns and tax credit claim forms, improved from last year.
During 2010–11, 81% of income tax refunds and 93% of GST refunds were issued within four weeks of a return being lodged. We will report on refund timeliness in 2011–12 and we are planning to set performance targets for refund timeliness for 2012–13.

72 NEW ZEALAND INLAND REVENUE ANNUAL REPORT 2011 ird.govt.nz
The average cost of processing income tax returns, GST returns and employer monthly schedules is $3.77 per return. In 2011–12, we set a performance target for processing these returns, and we will report against it in the 2011–12 Annual Report.
Further information on child support is on page 41.
Financial performance for the year ended 30 June 2011 ($000)
Revenue Expenses Net surplus/(deficit)
114,445 115,910 (1,465)

73PART 6 STATEMENT OF SERVICE PERFORMANCEird.govt.nz
OUTPUT 3.1 REGISTRATIONS, APPLICATIONS AND ASSESSMENTS
DescriptionThis output involves processing all registrations, applications and assessments for the tax and social policy programmes we administer.
Activity forecasts2009–10
Actual Activity forecast
2010–11Forecast Actual
n/a Number of new tax and KiwiSaver registrations we expect to process. 481,200–531,900
747,929
61,515 Number of new child support applications and registrations we expect to process. 56,200–62,300
58,192
n/a Number of new Working for Families Tax Credits (WfFTC) applications we expect to process.
28,300–31,400
25,324
Explanation for forecasts outside range
Number of new tax and KiwiSaver registrations we expect to process.
This is the first year of forecasting new tax and KiwiSaver registrations and we underestimated the volume. The 2011–12 forecast has been increased accordingly.
Number of new WfFTC applications we expect to process.
This is the first year of forecasting WfFTC applications. The forecast was based on historical trends, however, the number of WfFTC applications now appears to be decreasing over time.
Performance measures2009–10
Actual Measure
2010–11Target Actual Variance
Quality98.4% Correctly process all notices, statements, certificates of entitlement and
loan transfer letters.100% 99.7%# (0.3%)
Timelinessn/a Percentage of registrations processed within five working days of receipt. 90% 84.1% (6.6%)
85.6% Percentage of income tax assessments issued within four weeks of receipt.
80% 86.3% 7.9%
97.9% Percentage of FBT and GST assessments issued within three weeks of receipt.
95% 97.5% 2.6%
87.7% Percentage of paying parents issued with child support assessments within two weeks of receipt of a properly made application.
70% 83.6% 19.4%
96.7% Percentage of KiwiSaver contributions from employees on employer monthly schedules finalised by the end of the month following the due date.
95% 95.5% 0.5%
# measured using a sample of the customer population.

74 NEW ZEALAND INLAND REVENUE ANNUAL REPORT 2011 ird.govt.nz
Explanation for target not achieved
Percentage of registrations processed within five working days of receipt.
This measure was being achieved until February 2011. Performance declined as a result of the February Canterbury earthquake and the subsequent loss of capacity.
Explanation for significant positive variance
Percentage of paying parents issued with child support assessments within two weeks of receipt of a properly made application.
This result is below the 2009–10 result. It was achieved by focusing on issuing assessments early to inform customers of their liability, which helps to improve compliance.
OUTPUT 3.2 ADMINISTRATIVE REVIEWS
DescriptionThis output involves providing an administrative process for reviewing child support assessments that is both inexpensive and readily accessible to custodians and paying parents.
Performance measures2009–10
Actual Measure
2010–11Target Actual Variance
Timeliness92.7% Percentage of child support administrative review decisions issued
within seven weeks of receipt of a properly made application.85% 76.5%# (10%)
Costn/a The average cost of administering and issuing child support
administrative reviews per assessment issued.<$650 $630.22 3.0%
Explanation for target not achieved
Percentage of child support administrative review decisions issued within seven weeks of receipt of a properly made application.
Following the Canterbury earthquakes, performance was affected by the loss of specialist capability in Christchurch, where the child support administrative review team was located. Despite transferring this work to Manukau, we could not recover performance by year end.

75PART 6 STATEMENT OF SERVICE PERFORMANCEird.govt.nz
OUTPUT 3.3 PAYMENTS, RETURNS, COLLECTIONS AND DISBURSEMENTS
DescriptionThis output involves:
" issuing rebates and refunds
" distributing KiwiSaver contributions to scheme providers
" disbursing child support payments to custodians and the Crown
" receiving and banking payments (including child support payments from paying parents)
" accounting and reporting the collection of Crown revenue.
Activity forecasts2009–10
Actual
Activity forecast2010–11
Forecast Actual
8.27 million Number of returns we expect to process. 7.55–8.35 million
7.97 million
7.93 million Number of payments we expect to process. 7.48–8.27 million
8.10 million
Performance measures2009–10
Actual Measure
2010–11Target Actual Variance
Quality
100% Correctly process all payments to accounts. 100% 99.9% (0.1%)
74.1% Percentage of child support assessments collected (excluding cases we manage on behalf of overseas agencies and uncollectable debt cases) for the year ending 31 March 2011.
78% 75.6% (3.1%)
69.0% Percentage of assessed paying parents (excluding cases we manage on behalf of overseas agencies and uncollectable debt cases) who pay their whole liability by the due date.
70% 69.3% (1.0%)
n/a Percentage of New Zealand-based student loan borrowers who pay on time.
85% 97.1% 14.2%
n/a Percentage of employer monthly schedule and GST returns are filed electronically.
35% 34.6% (1.1%)
Timeliness
85.8% Percentage of tax credit claims processed and issued within three weeks of receipt.
90% 91.9% 2.1%
98.7% Percentage of paid parental leave payments issued to customers on the first regular pay day following the agreed date of entitlement.
100% 96.3% (3.7%)
n/a Percentage of Working for Families Tax Credit payments processed and issued to customers on the first regular pay period following the receipt of an application (excluding end-of-year payments).
100% 96.5% (3.5%)
98.8% Percentage of payments banked on the day of receipt. 100% 98.7% (1.3%)

76 NEW ZEALAND INLAND REVENUE ANNUAL REPORT 2011 ird.govt.nz
Explanation for significant positive variance
Percentage of New Zealand-based student loan borrowers who pay on time
�is measure and target was trialled internally in 2009–10 and our target was based on performance in that year. Improved compliance by New Zealand-based borrowers in 2010–11 has resulted in the performance achieved.
OUTPUT STATEMENT: SERVICES TO PROCESS OBLIGATIONS AND ENTITLEMENTS
FOR THE YEAR ENDED 30 JUNE 2011
2009–10 2010–11 2010–11 2010–11Actual Actual Main Final
estimates voted$000 $000 $000 $000
Revenue98,218 Crown 92,540 90,941 92,540
22,851 Other 21,905 23,723 23,648
121,069 Total revenue 114,445 114,664 116,188
Expenses115,740 Annual appropriations 115,910 114,664 116,188
115,740 Total expenses 115,910 114,664 116,188
5,329 Net surplus/(deficit) (1,465) – –
77PART 6 STATEMENT OF SERVICE PERFORMANCEird.govt.nz
OUTPUT EXPENSE 4 MANAGEMENT OF DEBT AND OUTSTANDING RETURNS
Description This output expense provides services that contribute to the availability of revenue to fund government programmes. This is achieved by:
" ensuring that taxpayers assess their liabilities when required and they and any other customers meet payment obligations (or understand the action they need to take to meet overdue obligations)
" taking appropriate enforcement action where people choose not to comply.
Activities undertaken:
" taking follow-up action where returns are outstanding
" taking follow-up action where payments are overdue.
Performance context commentary
The impacts we contribute to
Using a tailored approach to our interventions, that reflects customers’ individual circumstances and compliance behaviour should ensure that the behaviour of non-compliant customers improves. Consequently, more customers will pay and file information on time in the future.
If more customers comply with their obligations and receive their entitlements, we make progress towards Inland Revenue’s outcomes:
" Revenue is available to fund government programmes through people meeting payment obligations of their own accord.
" People receive payments they are entitled to, enabling them to participate in society.
Factors influencing performance during 2010–11
This year, our performance in clearing outstanding returns declined compared to 2009–10. This was influenced by:
" data-cleansing improvements that reduced the number of unnecessary returns issued to customers. We changed the measurement basis in 2011–12 from an absolute reduction in the number of outstanding returns, to a percentage reduction to reflect this.
" early intervention initiatives, such as text messaging customers with outstanding returns and outbound calling to target high-risk returns (GST and PAYE).
" the impact of the Canterbury earthquakes and the need to balance work on outstanding returns with other priorities.
Our debt management approach is primarily focused on preventing people falling into debt and contacting them early to assist them if they go into debt. Our approach includes campaigns targeting customers before their payment due dates, and customers with debt aged less than one year. This has been successful, as indicated by the 35% decrease since 2008–09 in debt aged under one year. This year, as a result of our 7 February campaign, 83% of assessments were paid on time, compared to 72% in 2009–10.
One consequence of our focus on early intervention is a significant increase in debt aged over two years, which has grown by 49% since 2009–10. As this debt gets older, it also continues to accumulate penalties and interest.
Inland Revenue received additional funding in Budget 2010 to manage overdue debt (2010 –11: $10.2 million) mainly through outbound calling campaigns. We achieved our performance targets for this programme of $100 million additional cash collection for this year. However, our outbound calling campaigns were affected by the Canterbury earthquakes because the majority of our outbound calling team is based there. As a result of the earthquakes, this work was picked up by other debt teams across the country.
Further information on managing outstanding returns and overdue debt is on pages 37 to 40 and in the Additional information section on page 143.
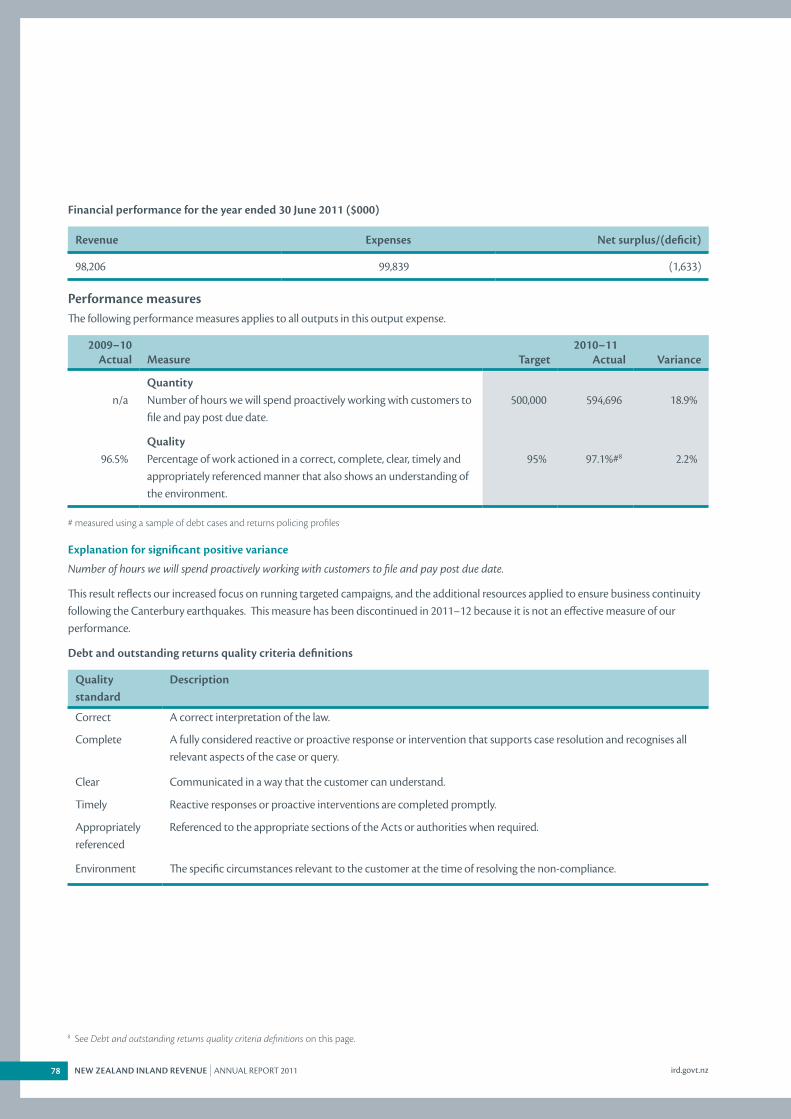
78 NEW ZEALAND INLAND REVENUE ANNUAL REPORT 2011 ird.govt.nz
Financial performance for the year ended 30 June 2011 ($000)
Revenue Expenses Net surplus/(deficit)
98,206 99,839 (1,633)
Performance measuresThe following performance measures applies to all outputs in this output expense.
2009–10 Actual
Measure
2010–11Target Actual Variance
Quantityn/a Number of hours we will spend proactively working with customers to
file and pay post due date.500,000 594,696 18.9%
Quality96.5% Percentage of work actioned in a correct, complete, clear, timely and
appropriately referenced manner that also shows an understanding of the environment.
95% 97.1%#8 2.2%
# measured using a sample of debt cases and returns policing profiles.
Explanation for significant positive variance
Number of hours we will spend proactively working with customers to file and pay post due date.
This result reflects our increased focus on running targeted campaigns, and the additional resources applied to ensure business continuity following the Canterbury earthquakes. This measure has been discontinued in 2011–12 because it is not an effective measure of our performance.
Debt and outstanding returns quality criteria definitions
Quality standard
Description
Correct A correct interpretation of the law.
Complete A fully considered reactive or proactive response or intervention that supports case resolution and recognises all relevant aspects of the case or query.
Clear Communicated in a way that the customer can understand.
Timely Reactive responses or proactive interventions are completed promptly.
Appropriately referenced
Referenced to the appropriate sections of the Acts or authorities when required.
Environment The specific circumstances relevant to the customer at the time of resolving the non-compliance.
8 See Debt and outstanding returns quality criteria definitions on this page.

79PART 6 STATEMENT OF SERVICE PERFORMANCEird.govt.nz
OUTPUT 4.1 OUTSTANDING RETURNS
DescriptionThis output involves all activities associated with collecting outstanding returns, including taking appropriate follow-up action against taxpayers who do not file a return.
Performance measures2009–10
Actual Measure
2010–11Target Actual Variance
Quantity1.44 million Number of outstanding returns filed or brought to completion by
year end.1.45 million 1.17 million (19.1%)
Qualityn/a Percentage of outstanding returns over two years old. <33% 36.3% (10.0%)
Timeliness
n/a Percentage of returns not filed by the due date, that were filed or finalised within three months.
60% 54.9% (8.5%)
n/a Percentage of returns not filed by the due date, that were filed or finalised within six months.
75% 66.0% (12.0%)
79.8% Percentage of returns not filed by the due date, that were filed or finalised within twelve months.
80% 79.3% (0.9%)
Explanation for targets not achieved
Number of outstanding returns filed or brought to completion by year end.
We carried out data-cleansing exercises to prevent unnecessary returns being issued to customers, which resulted in fewer returns becoming overdue than expected. Reprioritising resources following the Canterbury earthquakes also affected performance. The measurement basis has been changed for 2011–12.
Percentage of outstanding returns over two years old.
Our early intervention campaigns, which focus on new returns becoming overdue, have contributed to a gradual increase in the percentage of returns over two years old.
Percentage of returns not filed by the due date, that were filed or finalised within three months, and
Percentage of returns not filed by the due date, that were filed or finalised within six months.
A large number of income tax returns become overdue during the first quarter each year. This coincides with our peak season for the voice and correspondence channels, and we reallocate resources accordingly. This year, with reduced capacity in Christchurch after the earthquakes, we were unable to achieve these targets.

80 NEW ZEALAND INLAND REVENUE ANNUAL REPORT 2011 ird.govt.nz
OUTPUT 4.2 OVERDUE DEBT
DescriptionThis output covers all activities associated with collecting overdue debt (excluding child support debt). It involves taking appropriate follow-up action when customers do not meet their obligations, including providing them with assistance on how they can meet their tax obligations.
Performance measures2009–10
Actual Measure
2010–11Target Actual Variance
Quantity
510,980 Number of debt cases resolved (excluding child support) by year end. 505,000 459,979 (8.9%)
Quality
n/a Percentage of collectable debt value over two years old. <33% 41.3% (25.2%)
Timeliness
n/a Percentage of new debt cases resolved within three months of the due date for payment.
66% 66.3% 0.5%
83.4% Percentage of new debt cases resolved within 12 months of the due date for payment.
85% 85.3% 0.4%
Cost
$52.15 Cash collected for every debt output dollar spent. $50.00 $52.55 5.1%
Explanation for targets not achieved
Number of debt cases resolved (excluding child support) by year end.
The number of cases resolved was below last year’s level for most of the year. This reflects a similar reduction in cases opened, meaning fewer customers going into debt. In particular, the number of cases closed within two months of opening has reduced.
Percentage of collectable debt value over two years old.
The proportion of debt aged over two years old has increased substantially as a consequence of our successful focus on reducing new debt. Penalties and interest have also contributed to the increase in debt over two years old.

81PART 6 STATEMENT OF SERVICE PERFORMANCEird.govt.nz
OUTPUT 4.3 CHILD SUPPORT DEBT MANAGEMENT
Description�is output involves all activities associated with the recovery of overdue child support payments. It includes taking appropriate enforcement action against non-compliers within the child support law.
Performance measures2009–10
Actual Measure
2010–11Target Actual Variance
Quantityn/a Number of child support debt cases resolved by year end. 70,000 77,982 11.4%
Qualityn/a Percentage of child support assessments collected that were due over
the last five years (excluding penalties, debt we managed on behalf of overseas agencies and uncollectable debt cases).
84% 84.7% 0.8%
7.1% Limit the growth in child support debt between 30 June 2010 and 30 June 2011 (excluding penalties, debt we manage on behalf of overseas agencies and uncollectable debt cases).
<11.5% 5.4% 53.0%
Explanation for significant positive variances
Number of child support debt cases resolved by year end.
�is is the first year for this measure and the target underestimated our performance. In 2011–12, we have changed to a more effective measure of child support debt collection timeliness.
Limit the growth in child support debt between 30 June 2010 and 30 June 2011 (excluding penalties, debt we manage on behalf of overseas agencies and uncollectable debt cases).
Child support debt growth has been trending down for the last two years. Performance reflects our reorganised priorities and a focus on early intervention in debt cases.
OUTPUT STATEMENT: MANAGEMENT OF DEBT AND OUTSTANDING RETURNS
FOR THE YEAR ENDED 30 JUNE 2011
2009–10 2010–11 2010–11 2010–11Actual Actual Main Final
estimates voted$000 $000 $000 $000
Revenue87,210 Crown 95,786 94,895 95,786
1,551 Other 2,420 4,243 4,149
88,761 Total revenue 98,206 99,138 99,935
Expenses81,320 Annual appropriations 99,839 99,138 99,935
81,320 Total expenses 99,839 99,138 99,935
7,441 Net surplus/(deficit) (1,633) – –

82 NEW ZEALAND INLAND REVENUE ANNUAL REPORT 2011 ird.govt.nz
OUTPUT EXPENSE 5 TAXPAYER AUDIT
DescriptionThis output expense provides services to ensure that the revenue base for funding government programmes is protected. This is achieved by verifying, through audit activity, that taxpayers across all taxpayer groups are meeting their obligations, specifically targeting risk areas, and taking appropriate enforcement action when obligations are not being met.
Activities undertaken:
" Identifying risks to revenue and designing audit activities accordingly
" Verifying that tax obligations have been met by auditing a selection of taxpayers
" Managing tax litigation.
Performance context commentary
The impacts we contribute to
We use intelligence analysis to target our compliance activities to customers who are non-compliant or at risk of non-compliance. This creates an environment where customers believe we will detect non-compliance and are deterred from providing inaccurate information. It also protects the revenue base and provides certainty to customers on the application of the law.
We also use our compliance activities to educate customers who are unaware of their obligations and only use enforcement action to the extent necessary. This ensures that the behaviour of non-compliant customers improves. Consequently, more customers will pay and file information on time in the future.
When customers comply with their obligations and receive their entitlements we make progress towards Inland Revenue’s outcomes:
" Revenue is available to fund government programmes through people meeting payment obligations of their own accord.
" People receive payments they are entitled to, enabling them to participate in society.
Factors influencing performance during 2010–11
The strengthening of our intelligence gathering and analysis capability has enabled us to better target our investigations. We assessed $1,451 million in discrepancies, 55.4% over target, which raised our rate of return per audit hour to well over the target. The variance was due to a small number of high-value cases in the large enterprises sector, and high-value evasion and fraud cases that were part of our hidden economy investigations.
Inland Revenue received additional funding in Budget 2010 to address the hidden economy (2010–11: $6.7 million) and property compliance (2010–11: $6.6 million). We achieved our performance targets for the hidden economy (2010–11: $23 million of additional discrepancies) and property compliance (2010–11: $45 million of additional discrepancies).
We used overtime and moved work to other sites to help offset the impact of the Canterbury earthquakes on the number of hours spent conducting audits. As a result of these actions, our total number of audit hours this year was only 2.1% below target.
For further information see Investigations on page 35 and Legal action on page 36.
Financial performance for the year ended 30 June 2011 ($000)
Revenue Expenses Net surplus/(deficit)
166,622 164,606 2,016

83PART 6 STATEMENT OF SERVICE PERFORMANCEird.govt.nz
OUTPUT 5.1 TAXPAYER AUDIT
DescriptionThis output involves:
" Individual and small to medium enterprise audit —The audit of businesses with a turnover of up to $300 million (excluding large enterprises). It includes audits of duties, non-residents, investments and salary and wage earners.
" Large enterprise audit—Auditing and providing services to large businesses with a group turnover of more than $300 million, plus other specific groups.
Performance measures2009–10
Actual Measure
2010–11Target Actual Variance
Quantity1.075 million Number of hours we will spend on audit activities. 1.088 million 1.065 million (2.1%)
Quality94.6% Percentage of all cases completed that meet our quality standards for
timeliness, communication with taxpayers, technical accuracy, case selection, case management and reporting.
90% 95.8%#9 6.4%
Timeliness
3.7 months Months on average to complete general audits. 6 months 3.1 months 48.3%
9.4 months Months on average to complete risk-based audits. 12 months 9.5 months 20.8%
9.5 months Months on average to complete disputed cases. 15 months 11.0 months 26.7%
n/a Months on average to complete evasion and fraud cases. 18 months 17 months 5.6%
92.8% Percentage of all open cases (excluding aggressive tax planning cases) that are less than 24 months old.
90% 92.6% 2.9%
Cost
$2,816 Amount we will assess per hour for all audit activity. $875 $1,446 65.3%
# measured using a sample of audit cases.
Explanation for significant positive variances
Months on average to complete general audits, and
Months on average to complete risk-based audits, and
Months on average to complete disputed cases.
These targets have been consistently exceeded over the last three years. For general audits, the performance was boosted by high volumes of leverage cases10 completed this year. For risk-based audits and disputed cases, effective case management techniques help to complete cases within target times.
Amount we will assess per hour for all audit activity.
This result includes five large enterprise cases with discrepancies totalling $525 million. The rate of return with these cases excluded was $924 per hour, a positive variance of 5.6%.
9 See Quality standards on page 84.10 Leverage cases target specific risks and compliance issues using a “blanket coverage” approach for relevant customers. For example, we use bulk mail to contact
customers about their specific issues and invite voluntary compliance. We follow up with customers who do not respond using conventional audit processes.

84 NEW ZEALAND INLAND REVENUE ANNUAL REPORT 2011 ird.govt.nz
OUTPUT 5.2 LITIGATION MANAGEMENT
DescriptionThis output involves the management of litigation of disputed tax cases, including the requirement to state the case through to resolution by the courts.
Activity forecast2009–10
Actual Activity forecast
2010–11Forecast Actual
262 Number of litigation cases we expect to finally resolve. 75–100 190
Explanation for forecast outside range
Number of litigation cases we expect to finally resolve.
This result is high because we closed a number of previously settled structured finance and Trinity cases. These are group cases, where a large number of associated cases are closed at the same time.
Performance measures2009–10
Actual Measure
2010–11Target Actual Variance
Timeliness96.7% Percentage of all timetable requirements delivered as imposed by the
courts for any litigation undertaken.95% 98.0% 3.2%
Quality standards
The quality standards are measured by a review of closed cases by a quality review panel. It is an independent check of the quality of our customer interactions, our business requirements and our procedures where the impact is internal only. The review looks at:
" case planning and selection
" standard of correspondence
" legislative correctness
" timeliness
" commercial awareness
" adherence to best practice and procedures
" completeness of the investigation
" accuracy of codes used for reporting purposes
" case management and actions
" attaching documents
" adequacy of notes.

85PART 6 STATEMENT OF SERVICE PERFORMANCEird.govt.nz
OUTPUT STATEMENT: TAXPAYER AUDIT
FOR THE YEAR ENDED 30 JUNE 2011
2009–10 2010–11 2010–11 2010–11Actual Actual Main Final
estimates voted$000 $000 $000 $000
Revenue169,468 Crown 164,440 171,756 164,440
8,478 Other 2,182 1,890 1,772
177,946 Total revenue 166,622 173,646 166,212
Expenses158,768 Annual appropriations 164,606 173,646 166,212
158,768 Total expenses 164,606 173,646 166,212
19,178 Net surplus/(deficit) 2,016 – –

PART 7 DEPARTMENTAL FINANCIAL STATEMENTS
Part seven
DEPARTMENTAL FINANCIAL STATEMENTS
87ird.govt.nz

88 NEW ZEALAND INLAND REVENUE ANNUAL REPORT 2011 ird.govt.nz
STATEMENT OF COMPREHENSIVE INCOME
FOR THE YEAR ENDED 30 JUNE 2011
2009–10 Notes 2010–11 2010–11 2010–11Actual Actual Main Supp
estimates estimates$000 $000 $000 $000
Income 609,075 Revenue Crown 610,711 615,557 610,711
36,160 Other income 1 30,314 32,706 36,586
645,235 Total income 641,025 648,263 647,297
Expenditure
377,253 Personnel 2 403,665 400,401 407,905
146,720 Operating 3 159,191 170,336 155,107
16,501 Depreciation 4 16,500 16,697 16,618
43,970 Amortisation and impairment 5 43,096 42,742 45,361
16,666 Capital charge 6 17,926 18,087 17,926
601,110 Total output expenses 640,378 648,263 642,917
– Other expenses 7 3,226 – 4,380
601,110 Total expenditure 643,604 648,263 647,297
44,125 Net surplus/(deficit) (2,579) – –
– Other comprehensive income – – –
44,125 Total comprehensive income (2,579) – –
The accompanying accounting policies and notes form part of these financial statements.
Refer to Note 23 for explanation of major variances.

89PART 7 DEPARTMENTAL FINANCIAL STATEMENTSird.govt.nz
STATEMENT OF CHANGES IN TAXPAYERS’ FUNDS
FOR THE YEAR ENDED 30 JUNE 2011
2009–10 Note 2010–11 2010–11 2010–11Actual Actual Main Supp
estimates estimates$000 $000 $000 $000
222,402 Balance at start of year 241,292 241,292 241,292 44,125 Total comprehensive income (2,579) – –
(44,125) Repayment of surplus to the Crown 8 (647) – –
21,913 Capital contribution 24,391 24,391 24,391
(3,023) Capital repayment (720) (256) (720)
(25,235) 23,024 24,135 23,671
241,292 Balance at end of year 261,737 265,427 264,963
The accompanying accounting policies and notes form part of these financial statements.

90 NEW ZEALAND INLAND REVENUE ANNUAL REPORT 2011 ird.govt.nz
2009–10 Notes 2010–11 2010–11 2010–11Actual Actual Main Supp
estimates estimates$000 $000 $000 $000
Taxpayers' funds 241,292 Taxpayers' funds 261,737 265,427 264,963
241,292 Total taxpayers' funds 261,737 265,427 264,963
Represented by:
Current assets
14,633 Cash and cash equivalents 14,666 12,000 12,000
147,004 Debtor Crown 147,069 94,055 118,584
14,098 Debtors and prepayments 9 17,988 10,822 12,560
1,153 Inventories held for distribution 10 1,119 1,300 1,198
176,888 Total current assets 180,842 118,177 144,342
Non-current assets
383 Prepayments 9 305 – 300
57,723 Property, plant and equipment 4 58,562 69,994 60,105
158,425 Intangible assets 5 134,577 182,226 164,990
216,531 Total non-current assets 193,444 252,220 225,395
393,419 Total assets 374,286 370,397 369,737
Current liabilities
22,392 Creditors and other payables 11 27,412 25,500 21,234
44,125 Surplus payable to the Crown 647 – –
37,873 Employee entitlements and provision for restructuring 12 41,537 36,159 40,582
3,189 Provision for other liabilities 13 2,605 37 –
142 Other financial liabilities 14 181 181 181
107,721 Total current liabilities 72,382 61,877 61,997
Non-current liabilities
36,840 Employee entitlements and provision for restructuring 12 35,756 34,956 36,594
6,514 Provision for other liabilities 13 3,018 6,990 4,829
1,052 Other financial liabilities 14 1,393 1,147 1,354
44,406 Total non-current liabilities 40,167 43,093 42,777
152,127 Total liabilities 112,549 104,970 104,774
241,292 Net assets 261,737 265,427 264,963
�e accompanying accounting policies and notes form part of these financial statements.
Refer to Note 23 for explanation of major variances.
AS AT 30 JUNE 2011
STATEMENT OF FINANCIAL POSITION

91PART 7 DEPARTMENTAL FINANCIAL STATEMENTSird.govt.nz
FOR THE YEAR ENDED 30 JUNE 2011
STATEMENT OF CASH FLOWS
2009–10 Note 2010–11 2010–11 2010–11Actual Actual Main Supp
estimates estimates$000 $000 $000 $000
Cash flows − operating activities Cash provided from: Supply of outputs to
571,442 − Crown 610,648 645,914 639,133
7,457 − government departments 6,627 7,704 12,065
29,875 − third parties 23,284 24,999 25,237
608,774 640,559 678,617 676,435
Cash applied to: Cost of producing outputs
395,705 − employees 403,035 418,948 408,353
148,377 − suppliers 162,412 166,943 160,921
162 − net GST paid (877) 1,300 (5,000)
16,666 − capital charge 17,926 18,087 17,926
560,910 582,496 605,278 582,200
47,864 Net cash inflow from operating activities 16 58,063 73,339 94,235
Cash flows − investing activities
Cash provided from:
122 Sale of property, plant and equipment 2 – –
1 Disposal of intangible assets – – –
123 2 – –
Cash applied to:
20,696 Purchase of property, plant and equipment 18,329 21,697 19,000
37,893 Purchase of intangible assets 19,249 68,777 57,414
58,589 37,578 90,474 76,414
(58,466) Net cash (outflow) from investing activities (37,576) (90,474) (76,414)
Cash flows − financing activities
Cash provided from:
21,913 Capital contribution 24,391 24,391 24,391
21,913 24,391 24,391 24,391
Cash applied to:
6,111 Repayment of surplus 44,125 7,000 44,125
3,023 Capital repayment 720 256 720
9,134 44,845 7,256 44,845
12,779 Net cash inflow from financing activities (20,454) 17,135 (20,454)
2,177 Net increase/(decrease) in cash and cash equivalents 33 – (2,633)
12,456 Opening cash and cash equivalents 14,633 12,000 14,633
14,633 Closing cash and cash equivalents 14,666 12,000 12,000
�e accompanying accounting policies and notes form part of these financial statements.
�e GST net component of operating activities reflects the net GST paid to and received from Inland Revenue. �e GST components have been presented on a net basis, as the gross amounts do not provide meaningful information for financial statement purposes.

92 NEW ZEALAND INLAND REVENUE ANNUAL REPORT 2011 ird.govt.nz
2009–10 Note 2010–11Actual Actual
$000 $000
Capital commitments 8,026 Property, plant and equipment 3,331
1,686 Intangible assets 894
9,712 Total capital commitments 4,225
Operating commitments
Non-cancellable accommodation leases
34,880 Not later than one year 32,550
94,647 Later than one year and not later than five years 87,834
117,015 Later than five years 99,260
246,542 Total non-cancellable accommodation leases 219,644
Non-Cancellable contracts for the supply of goods and services
15,362 Not later than one year 21,981
2,364 Later than one year and not later than five years 3,367
– Later than five years –
17,726 Total non-cancellable contracts for the supply of goods and services 25,348
264,268 Total operating commitments 244,992
273,980 Total commitments 17 249,217
�e accompanying accounting policies and notes form part of these financial statements.
AS AT 30 JUNE 2011
STATEMENT OF COMMITMENTS

93PART 7 DEPARTMENTAL FINANCIAL STATEMENTSird.govt.nz
AS AT 30 JUNE 2011
STATEMENT OF CONTINGENT LIABILITIES AND CONTINGENT ASSETS
2009–10 Note 2010–11Actual Actual
$000 $000
Contingent liabilities613 Legal proceedings and disputes – taxpayer 378
– Legal proceedings and disputes – departmental 120
45 Personal grievances 20
658 Total contingent liabilities 18 518
Contingent assets
– Insurance claims 4,000
– Total contingent assets 18 4,000
�e accompanying accounting policies and notes form part of these financial statements.

94 NEW ZEALAND INLAND REVENUE ANNUAL REPORT 2011 ird.govt.nz
STATEMENT OF DEPARTMENTAL EXPENSES AND CAPITAL EXPENDITURE AGAINST APPROPRIATIONS
FOR THE YEAR ENDED 30 JUNE 2011
Departmental expenses and capital expenditure
2009–10 2010–11 2010–11 2010–11Expenditure Expenditure Main
estimatesFinal
voted2
$000 $000 $000 $000
Vote: Revenue Output expenses
14,653 Policy advice1 14,617 15,285 14,812
230,629 Services to inform the public about entitlements and meeting obligations1
245,238 245,530 245,770
115,740 Services to process obligations and entitlements1 115,868 114,664 116,188
81,320 Management of debt and outstanding returns1 99,776 99,138 99,935
158,768 Taxpayer audit1 164,495 173,646 166,212
601,110 Total output expenses1 639,994 648,263 642,917
– Recovery from February 2011 Christchurch earthquake 3,226 – 4,380
601,110 Total expenditure 643,220 648,263 647,297
Departmental capital expenditure
20,696 Property, plant and equipment 18,329 18,400 19,000
37,893 Intangible assets 19,249 77,388 51,926
58,589 Total departmental capital expenditure 37,578 95,788 70,926
1 �e Statement of Departmental Expenses and Capital Expenditure against Appropriations excludes remeasurements of $384,000.2 �is includes adjustments made in the Supplementary Estimates and transfers under the Public Finance Act 1989.
�e accompanying accounting policies and notes form part of these financial statements.
Refer to Note 23 for explanation of major variances.
STATEMENT OF UNAPPROPRIATED EXPENSES AND CAPITAL EXPENDITURE
FOR THE YEAR ENDED 30 JUNE 2011
In the 2010–11 financial year there were no instances of:
� expenses and capital expenditure incurred in excess of appropriation (2009–10, $nil).
� expenses and capital expenditure incurred without appropriation or other authority, or outside scope of appropriation (2009–10, $nil).
In the 2010–11 financial year there were no breaches of projected departmental net asset schedules (2009–10, $nil).
�e accompanying accounting policies and notes form part of these financial statements.

95PART 7 DEPARTMENTAL FINANCIAL STATEMENTSird.govt.nz
STATEMENT OF ACCOUNTING POLICIES
REPORTING ENTITYInland Revenue is a government department as defined by section 2 of the Public Finance Act 1989 and is domiciled in New Zealand. In addition, Inland Revenue has reported on Crown activities and trust monies which it administers. It is a wholly owned entity of the Crown whose primary objective is to provide services to the public rather than making a financial return. Accordingly, Inland Revenue has designated itself as a public benefit entity for the purpose of New Zealand equivalents to International Financial Reporting Standards (NZ IFRS).
Inland Revenue’s national office is 55 Featherston Street, Wellington.
REPORTING PERIODThe reporting period for these financial statements is for the year ended 30 June 2011. The financial statements were authorised for issue by the Chief Executive of Inland Revenue on 22 September 2011.
STATEMENT OF COMPLIANCEThe financial statements have been prepared in accordance with the requirements of the Public Finance Act 1989, which includes the requirement to comply with New Zealand generally accepted accounting practice (NZ GAAP), and Treasury Instructions. These financial statements have been prepared in accordance with NZ GAAP. They comply with NZ IFRS, and other applicable financial reporting standards, as appropriate for public benefit entities.
BASIS OF PREPARATIONThe accounting policies set out below have been applied consistently to all periods presented in these financial statements.
These financial statements have been prepared on a historical cost basis, unless otherwise stated.
The accrual basis of accounting has been used, unless otherwise stated.
These financial statements are presented in New Zealand dollars. All values in tables are rounded to the nearest thousand dollars ($000). The functional currency of Inland Revenue is New Zealand dollars.
JUDGEMENTS AND ESTIMATIONSThe preparation of financial statements in conformity with NZ IFRS requires judgements, estimates and assumptions that affect the application of policies and reported amounts of assets and liabilities, income and expenses. The estimates and associated assumptions are based on historical experience and various other factors, believed to be reasonable under the circumstances.
The estimates and underlying assumptions are reviewed on an ongoing basis. Revisions to accounting estimates are recognised in the period the estimate is revised in if the revision affects only that period, or in the period of the revision and future periods if the revision affects both current and future periods.
The estimates and assumptions that have a significant risk of causing a material adjustment to the carrying amount of assets and liabilities within the next financial year are related to retirement and long-service leave.
An analysis is provided in Note 12 of the exposure in relation to estimates and uncertainties surrounding retirement and long-service leave liabilities.
STANDARDS AND INTERPRETATIONS EARLY ADOPTEDInland Revenue has elected to early adopt the New Zealand equivalent to International Accounting Standard (NZ IAS) 24 Related Party Disclosures (Revised 2009). The effect of early adopting the revised NZ IAS 24 is:
" more information is required to be disclosed about transactions between Inland Revenue and entities controlled, jointly controlled, or significantly influenced by the Crown.
" commitments with related parties require disclosure.
" information is required to be disclosed about related party transactions with Ministers of the Crown with portfolio responsibility for Inland Revenue. An exemption is provided from reporting transactions with other Ministers of the Crown.

96 NEW ZEALAND INLAND REVENUE ANNUAL REPORT 2011 ird.govt.nz
STANDARDS AND INTERPRETATIONS ISSUED AND NOT YET ADOPTEDInland Revenue has elected not to early adopt the following standards issued but not yet effective as at 30 June 2011.
NZ IFRS 9 Financial Instruments will eventually replace NZ IAS 39 Financial Instruments: Recognition and Measurement. This new standard was approved by the Accounting Standards Review Board in November 2010. NZ IAS 39 is being replaced through the following three main phases: Phase 1 Classification and Measurement, Phase 2 Impairment Methodology and Phase 3 Hedge Accounting. Phase 1 has been completed and has been published in the new financial instrument standard NZ IFRS 9. The new standard addresses the issues of classification and measurement of financial assets and liabilities, and becomes effective for annual reporting periods commencing on or after 1 January 2013.
FRS-44 New Zealand Additional Disclosures and Amendments to NZ IFRS to harmonise with IFRS and Australian Accounting Standards (Harmonisation Amendments). These were issued in May 2011 with the purpose of harmonising Australia and New Zealand’s accounting standards with source IFRS and to eliminate many of the differences between the accounting standards in each jurisdiction. The amendments must first be adopted for the year ended 30 June 2012.
The effects of the above standards on Inland Revenue’s departmental financial statements have not yet been assessed.
As the External Reporting Board is to decide on a new accounting standards framework for public benefit entities, it is expected that all new NZ IFRS and amendments to existing NZ IFRS with a mandatory effective date for annual reporting periods commencing on or after 1 January 2012 will not be applicable to public benefit entities. This means that the financial reporting requirements for public benefit entities are expected to be effectively frozen in the short-term. Accordingly, no disclosure has been made about new or amended NZ IFRS that exclude public benefit entities from their scope.
ACCOUNTING POLICIESThe following particular accounting policies, which materially affect the measurement of financial results and financial position, have been applied.
Budget figuresThe budget figures are those included in the Information Supporting the Estimates of Appropriations (Main Estimates) for the year ending 30 June 2011 and the Information Supporting the Supplementary Estimates of Appropriations (Supplementary Estimates) for the year ending 30 June 2011. The budget figures
have been prepared in accordance with NZ GAAP, using accounting policies that are consistent with those adopted in preparing these financial statements.
GST (goods and services tax)All items in the financial statements, including appropriation statements, are stated exclusive of GST, except for “debtor Crown”, “net debtors” and “accounts payable”, which are stated on a GST-inclusive basis. Where GST is not recoverable as input tax, it is recognised as part of the related asset or expense.
The net amount of GST owing to or from Inland Revenue at balance date, being the difference between output GST and input GST, is included in “creditors and other payables” or “debtors and prepayments” in the Statement of Financial Position.
The net GST paid to or received from Inland Revenue, including the GST relating to investing and financing activities, is classified as an operating cash flow in the Statement of Cash Flows.
Commitments and contingencies are disclosed exclusive of GST.
Income taxGovernment departments are exempt from income tax as public authorities, so accordingly, no charge for income tax has been provided for.
RevenueInland Revenue derives revenue through the provision of outputs to the Crown, government departments, and for services to third parties. Revenue comprises the fair value of sale of services, net of GST, rebates and discounts. Revenue is recognised as follows:
Revenue Crown
Revenue earned from the supply of outputs to the Crown is recognised as revenue when earned.
Sale of services
Sale of services are recognised in the accounting period the services are provided in, by reference to completion of specific transactions, assessed on the basis of actual services provided as a proportion of the total services to be provided.
Sub-leases
Income from sub-leased property is recognised in the Statement of Comprehensive Income on a straight line basis over the term of the lease.
Insurance revenue
Insurance claim proceeds are recognised as revenue when the claim has been accepted by the insurer or when receipt of the insurance proceeds is considered virtually certain. The insurance

97PART 7 DEPARTMENTAL FINANCIAL STATEMENTSird.govt.nz
proceeds will be disclosed as a contingent asset if the receipt is only probable.
Cost allocationsInland Revenue uses an integrated cost allocation process to derive the cost of its outputs. This process involves the initial costing of business processes followed by the full costing of outputs.
Business processes represent Inland Revenue’s key functional activities. These business processes are used to capture direct costs.
Direct personnel costs are charged to business processes, based on actual hours and standard activity rates. Other related direct costs, including depreciation, are allocated to business processes, based on planned hours and relevant activity drivers.
Premises lease costs are charged to business processes based on headcount and relevant activities.
Other indirect costs and corporate overheads that cannot be attributed directly to a business process are apportioned to outputs, based on planned business process activity allocation to outputs.
There have been no material changes in cost accounting policies since the date of the last audited financial statements.
Capital chargeThe capital charge is recognised as an expense in the period to which the charge relates.
LeasesA lease is classified as a finance lease if it transfers substantially all the risks and rewards of ownership of an asset. A lease is classified as an operating lease if it does not transfer substantially all the risks and rewards incidental to the ownership of an asset. Inland Revenue has no finance leases.
Rentals payable under operating leases are recognised as an expense on a straight-line basis over the term of the relevant lease. Lease incentives received as incentive to enter into an operating lease are also recognised evenly over the term of the lease as a reduction in the rental expense.
Contractual arrangements considered to be operating leases have been recognised during the reporting period.
Financial instruments
Financial assets
Inland Revenue classifies its financial assets into two categories: financial assets at fair value through surplus or deficit, and debtors and receivables. The classification depends on the purpose for which the assets were acquired.
a) Financial assets at fair value through surplus or deficit Financial assets designated at fair value through surplus or deficit are recorded at fair value with any realised and unrealised gains or losses recognised in the Statement of Comprehensive Income. Gains or losses from foreign exchange and other fair value movements are separately reported in the Statement of Comprehensive Income. Transaction costs are expensed as they are incurred. Derivatives (eg, foreign currency forward exchange contracts) are classified under this category.
Derivative financial instruments are recognised both initially on the date a derivative contract is entered into and subsequently at fair value at each balance date. They are reported as either assets or liabilities, depending on whether the derivative is in a net gain or net loss position, respectively. The fair value gains or losses on derivatives are recognised in the Statement of Comprehensive Income.
b) Debtors and receivables Debtors and receivables are non-derivative financial assets with fixed or determinable payments that are not quoted in an active market. They are recognised initially at fair value plus transaction costs and subsequently measured at amortised cost using the effective interest rate method. Debtors and receivables issued with durations of less than 12 months are recognised at their nominal value, unless the effect of discounting is material.
Impairment of financial assets
Allowances for estimated irrecoverable amounts are recognised when there is objective evidence that Inland Revenue will not be able to collect all amounts due according to the original terms of the receivable. Significant financial difficulties of the debtor, probability that the debtor will enter into bankruptcy, and default in payments are considered indicators that the debtor is impaired.
The amount of the provision is the difference between the asset’s carrying amount and the estimated impaired value. The carrying amount of the asset is reduced through the use of an allowance account, and the amount of the impairment loss is recognised in the Statement of Comprehensive Income.
Financial liabilities
Inland Revenue classifies its financial liabilities into two categories: financial liabilities at fair value through surplus or deficit, and other financial liabilities. The classification depends on the purpose for which the liabilities were incurred.
a) Financial liabilities at fair value through surplus or deficit Financial liabilities designated at fair value through surplus or deficit are recorded at fair value with any realised and unrealised gains or losses recognised in the Statement of Comprehensive

98 NEW ZEALAND INLAND REVENUE ANNUAL REPORT 2011 ird.govt.nz
Income. Gains or losses from foreign exchange and other fair value movements are reported separately in the Statement of Comprehensive Income. Transaction costs are expensed as they are incurred. Derivatives (eg, foreign currency forward exchange contracts) are classified under this category.
b) Other financial liabilities Other financial liabilities are recognised initially at fair value less transaction costs and subsequently measured at amortised cost using the effective interest rate method. Financial liabilities entered into with durations of less than 12 months are recognised at their nominal value, unless the effect of discounting is material. “Creditors and other payables” are recognised at their nominal value as the effect of discounting is immaterial.
Cash and cash equivalentsCash and cash equivalents include all cash held in the bank accounts. All cash held in bank accounts is held in “on demand” accounts and no interest is payable to Inland Revenue.
Inventories held for distributionInventories held for distribution comprise forms, booklets and returns held for distribution to the public at no or nominal consideration in the ordinary course of operations.
Inventories held for distribution for public benefit purposes are carried at cost, calculated using the first-in, first-out (FIFO) cost method, adjusted where applicable for any loss of service potential. The cost of inventories includes all costs of purchase, costs of conversion and other costs incurred in bringing the inventories to their present location and condition. Where inventories are acquired at no cost, or for nominal consideration, the cost is deemed to be the current replacement cost at the date of acquisition.
The carrying amount is recognised as an expense in the period in which the goods are distributed. The amount of any write-down of inventories and all losses of inventories is recognised as an expense in the period the write-down or loss occurs. The amount of any reversal of any write-down of inventories is recognised as a reduction in the amount of inventories recognised as an expense in the period the reversal occurs in.
Hedge accounting, hedging activities and foreign currency transactionsInland Revenue’s activities expose it primarily to risks of changes in foreign exchange rates. Inland Revenue uses derivative financial instruments (primarily, foreign currency forward exchange contracts) to hedge its risks associated with foreign currency fluctuations relating to certain commitments. The use of financial derivatives is governed by Inland Revenue’s foreign exchange policy,
which provides written principles on the use of financial derivatives consistent with Inland Revenue’s risk management strategy.
Inland Revenue does not hold or issue derivative financial instruments for trading purposes. It also has not adopted hedge accounting.
Foreign currency transactions (including those for which forward exchange contracts are held) are translated into New Zealand dollars using the exchange rates prevailing at the dates of the transactions. Foreign exchange gains and losses resulting from the settlement of such transactions are recognised in the Statement of Comprehensive Income.
Property, plant and equipmentInland Revenue has operational assets that include IT equipment, furniture and office equipment, motor vehicles, and leasehold improvements. The capitalisation thresholds are:
" IT equipment – computers and laptops all
" IT equipment – other $2,000 and over (or $20,000 for bulk purchased IT equipment)
" Furniture and office equipment $2,000 and over (or $20,000 for bulk purchased furniture)
" Motor vehicles $2,000 and over
" Leasehold improvements $20,000 and over
Property, plant and equipment are shown at historical cost, less accumulated depreciation and impairment losses. Historical cost is the value of consideration given to acquire or create the asset and any directly attributable costs of bringing the asset to working condition for its intended use.
Additions
The cost of an item of property, plant and equipment is recognised as an asset if it is probable that future economic benefits or service potential associated with the item will flow to Inland Revenue and the cost of the item can be measured reliably. In most instances, an item of property, plant and equipment is recognised at its cost. Where an asset is acquired at no cost, or for a nominal cost, it is recognised at fair value as at the date of acquisition.
Subsequent costs
Subsequent costs are included in the asset’s carrying amount or recognised as a separate asset, as appropriate, only when it is probable that future economic benefits or service potential associated with the item will flow to Inland Revenue and the cost

99PART 7 DEPARTMENTAL FINANCIAL STATEMENTSird.govt.nz
of the item can be measured reliably. All repairs and maintenance are charged to the Statement of Comprehensive Income during the financial period in which they are incurred.
Depreciation
Depreciation is provided on a straight-line basis on all property, plant and equipment, other than assets under construction. The rate of depreciation will write off the cost of the asset to the estimated residual value over the useful life of the asset. The useful life of major classes of assets have been estimated as follows:
" IT equipment 3 to 6 years
" Furniture and office equipment 5 to 7 years
" Motor vehicles 5 to 7 years
" Leasehold improvements up to 10 years
All fixed assets other than motor vehicles are assumed to have no residual value. Motor vehicles are assumed to have a 20% residual value.
The cost of leasehold improvements is capitalised and depreciated over the unexpired period of the lease, or the estimated remaining useful life of the improvements, whichever is shorter, up to a maximum of 10 years.
Assets under construction are not depreciated. The total cost of a capital project is transferred to the appropriate asset class on its completion and then depreciated.
The assets’ residual values and useful lives are reviewed, and adjusted if appropriate, at each balance sheet date.
Impairment
Property, plant and equipment that has a finite useful life is reviewed for impairment whenever events or changes in circumstances indicate that the carrying amount may not be recoverable. If any indication of impairment exists, the recoverable amount is estimated to determine the extent of the impairment loss (if any).
If an assets’ recoverable amount is less than its carrying amount, the asset is impaired and it will be reported at its recoverable amount. The impairment loss is recognised in the Statement of Comprehensive Income.
The reversal of an impairment loss is also recognised in the Statement of Comprehensive Income.
Disposals
Gains and losses on disposals are determined by comparing proceeds with the carrying amount. These are included in the Statement of Comprehensive Income.
Intangible assetsInland Revenue has intangible assets in the form of software, licences, and business process design.
Additions
Intangible assets are initially recorded at cost. Inland Revenue only has intangible assets with finite useful lives. The three main categories are: software – developed, software and licences – purchased, and business process design.
a) Software – developed The cost of an internally generated intangible asset represents expenditure incurred in the development phase of the asset only. The cost of developed computer software comprises direct labour, material purchased and an appropriate portion of relevant overheads. These costs are directly associated with the development of identifiable and unique software controlled by Inland Revenue, and will generate future economic benefits.
Expenditure incurred on research of an internally generated intangible asset is expensed when it is incurred. Where the research phase cannot be distinguished from the development phase, the expenditure is expensed when it is incurred.
Costs associated with maintaining computer software programmes are recognised as an expense when incurred. Costs of configuring and customising purchased software for intended use are capitalised.
Staff training costs are recognised as an expense when incurred.
b) Software and licences – purchased Intangible assets acquired by Inland Revenue such as computer software and licences are stated at cost less accumulated amortisation and impairment losses. Acquired computer software and licences are capitalised on the basis of costs incurred to acquire and bring to use the specific software.
Costs associated with maintaining computer software programmes are recognised as an expense when incurred. Costs of configuring and customising purchased software for intended use are capitalised.
c) Business process design Expenditure on development activities, where research findings are applied to a plan or design for new or substantially improved business processes, is capitalised if the business process is technically and commercially feasible and Inland Revenue has sufficient resources to complete development. Other development expenditure is recognised in the Statement of Comprehensive Income as an expense as incurred.

100 NEW ZEALAND INLAND REVENUE ANNUAL REPORT 2011 ird.govt.nz
The capitalisation thresholds for intangible assets are:
" Software – developed $50,000 and over
" Software and licences – purchased $5,000 and over
" Business process design $50,000 and over
Subsequent cost
The cost of intangible assets with finite lives is subsequently recorded at cost less any amortisation and impairment losses.
Amortisation
The carrying value of an intangible asset with a finite life is amortised on a straight-line basis over its estimated useful life. Amortisation begins when the asset is available for use and ceases at the date that the asset is de-recognised. The amortisation charge for each period is recognised in the Statement of Comprehensive Income.
The useful lives of major classes of intangible assets have been estimated as follows:
" Software – developed 5 to 10 years
" Software and licences – purchased 5 to 10 years
" Business process design 5 to 10 years
Impairment
Intangible assets including assets under construction are reviewed for impairment at each balance date. If any indication of impairment exists, the recoverable amount is estimated to determine the extent of the impairment loss (if any).
If an intangible asset’s recoverable amount is less than its carrying amount, the asset is impaired and it will be reported at its recoverable amount. The impairment loss is recognised in the Statement of Comprehensive Income.
The reversal of an impairment loss is also recognised in the Statement of Comprehensive Income.
De-recognition
The gain or loss arising from the de-recognition of an intangible asset is recognised in the Statement of Comprehensive Income when the asset is de-recognised.
Employee benefits
Short-term benefits
Employee benefits that Inland Revenue expects to be settled within 12 months of balance date are measured at nominal values based on accrued entitlements at current rates of pay. These include salaries and wages accrued up to balance date, annual leave and time off in lieu earned up to but not yet taken at balance date, retiring and long-service leave, and sick leave entitlements expected to be settled within 12 months.
Inland Revenue recognises a liability for sick leave to the extent that absences in the coming year are expected to be greater than the sick leave entitlements earned in the coming year. The amount is calculated based on the unused sick leave entitlement that can be carried forward at balance date, to the extent that Inland Revenue anticipates it will be used by staff to cover those future absences.
Inland Revenue recognises a liability and an expense for bonuses where it is contractually obliged to pay them, or where a past practice has created a constructive obligation.
Long-term benefits
Employee benefits that are payable beyond 12 months such as long-service leave and retiring leave have been calculated on an actuarial basis, based on the present value of the estimated future cash outflows.
Long-service leave and retiring leave The actuarial calculations for long-service leave and retiring leave liabilities are based on:
" Employee contractual entitlements.
" Years of service accrued to balance date and years remaining to entitlement.
" Present value of the estimated future cash outflows using an applicable discount rate and salary increase rate.
Superannuation schemes
Obligations for contributions to the Inland Revenue Superannuation Scheme, State Sector Retirement Savings Scheme, KiwiSaver, and the Government Superannuation Fund are accounted for as defined contribution schemes and are recognised as an expense in the Statement of Comprehensive Income as they fall due.

101PART 7 DEPARTMENTAL FINANCIAL STATEMENTSird.govt.nz
Termination benefits
Termination benefits are payable when an employee’s employment contract is terminated before their normal retirement or when an employee accepts voluntary redundancy in exchange for these benefits. Inland Revenue recognises the expenditure in the Statement of Comprehensive Income when it is demonstrably committed to either terminate the employment of current employees, according to a detailed formal plan without the possibility of withdrawal, or as a result of an offer for voluntary redundancy.
Termination benefits settled within 12 months are reported at the amount expected to be paid, otherwise they are reported as the present value of the estimated future cash outflows.
ProvisionsInland Revenue recognises a provision for future expenditure of uncertain amounts or timing where there is a present obligation (either legal or constructive) as a result of a past event, and it is probable that expenditure will be required to settle the obligation, and a reliable estimate can be made of the amount of the obligation. Provisions are not recognised for future operating losses.
Provisions are recorded at the best estimate of the expenditure required to settle the obligation. Provisions to be settled beyond 12 months are recorded at their present value.
Taxpayers’ fundsThis is the Crown’s net investment in Inland Revenue. It is measured as the difference between total assets and total liabilities. Taxpayers’ funds are disaggregated and classified into a number of components:
" Capital contributions
" Repayment of capital to the Crown
" Provision for repayment of surplus to the Crown
Statement of Cash FlowsCash and cash equivalents mean cash balances in bank accounts.
Operating activities include cash received from all income sources of Inland Revenue, and cash payments made for the supply of goods and services.
Investing activities are those activities relating to the acquisition and disposal of non-current assets.
Financing activities comprise capital injections by, or repayment of capital to, the Crown.
CommitmentsExpenses and liabilities yet to be incurred on non-cancellable contracts that have been entered into on or before balance date are disclosed as commitments to the extent that they are unperformed obligations.
Cancellable commitments that have penalty or exit costs explicit in the agreement on exercising that option to cancel are included in the Statement of Commitments at the value of that penalty or exit cost.
Contingent liabilities and assetsContingent liabilities and assets are recorded in the Statement of Contingent Liabilities and Contingent Assets at the point at which the contingency is evident. Contingent liabilities are disclosed if the possibility that they will crystallise is not remote. Contingent assets are disclosed if it is probable that the benefits will be realised. Insurance claim proceeds will be disclosed as a contingent asset if the receipt of the insurance proceeds is probable.
ComparativesCertain comparative information has been reclassified, where required, to conform with the current year’s presentation.
CHANGES IN ACCOUNTING POLICIESThere have been no changes in accounting policies and cost allocation policies since the date of the last audited financial statements. All policies have been applied on a basis consistent with the previous year.

102 NEW ZEALAND INLAND REVENUE ANNUAL REPORT 2011 ird.govt.nz
NOTES TO THE FINANCIAL STATEMENTS
NOTE 1: OTHER INCOME2009–10 2010–11
Actual Actual$000 $000
20,500 Accident Compensation Corporation (ACC) – agency fees 20,500 6,348 State Services Commission – SSRSS and KiwiSaver recovery 6,725
7,318 Court cost recovery 1,412
629 Rulings 680
– Secondments to other agencies – salary recovery 434
189 Sub-leases 189
– Insurance proceeds 166
21 Net gains on derivative financial instruments 72
1,078 Supply of information to other agencies 13
77 Other 123
36,160 Total other income 30,314
NOTE 2: PERSONNEL2009–10 2010–11
Actual Actual$000 $000
345,563 Salaries and wages 352,363 17,051 Contractors and temporary staff 23,348
7,937 Employer contributions to defined contribution plans 9,138
2,742 Terminating benefits 6,465
1,672 ACC levies 1,867
(1,544) Annual leave 1,637
1,953 Retiring, long-service and sick leave 1,322
153 Bonuses 242
1,726 Other 7,283
377,253 Total personnel 403,665
Employer contributions to defined contribution plans include contributions to Inland Revenue Superannuation Scheme, KiwiSaver, State Sector Retirement Savings Scheme, and Government Superannuation Fund.

103PART 7 DEPARTMENTAL FINANCIAL STATEMENTSird.govt.nz
NOTE 3: OPERATING
2009–10 2010–11Actual Actual
$000 $000
37,313 Information technology costs 45,042 30,836 Operating lease rentals 35,397
17,092 Communication 16,023
12,491 Office supplies 12,204
8,503 Premises costs 8,518
6,546 Legal expenses 8,410
6,103 Travel and transport 7,634
6,444 Training and employee-related costs 6,913
5,266 Consultants 6,650
3,264 Bank fees 3,059
1,334 Advertising and publicity 1,917
1,541 Equipment maintenance 1,743
1,033 Audit fees for audit of the financial statements 1,033
70 Disbursements for audit of the financial statements 55
43 Net loss on disposal of property, plant and equipment 368
7 Bad debts written off 100
70 Net loss on disposal of intangible assets –
(46) Inc/(Dec) in provision for debt impairment (5)
3,028 Inc/(Dec) in provision for onerous leases (1,679)
5,782 Other operating expenses 5,809
146,720 Total operating 159,191
Net loss on disposal of property, plant and equipment relates to the disposal of superseded leasehold improvements and IT equipment.

104 NEW ZEALAND INLAND REVENUE ANNUAL REPORT 2011 ird.govt.nz
NOTE 4: PROPERTY, PLANT AND EQUIPMENT BY CATEGORY
IT equipment
Furniture and office
equipment
Motor vehicles
Leasehold improvements
Assets under construction
– leasehold
Total
$000 $000 $000 $000 $000 $000
CostBalance as at 1 July 2010 65,773 29,001 4,594 62,536 17,305 179,209
Additions by purchase 5,619 4,511 – 7,723 612 18,465
Reductions – other 1 – – – (305) – (305)
Transfers between category 402 – – 17,351 (17,351) 402
Disposals (15,001) (922) – (1,653) – (17,576)
Balance as at 30 June 2011 56,793 32,590 4,594 85,652 566 180,195
Depreciation and impairment lossesBalance as at 1 July 2010 52,536 18,607 1,923 48,420 – 121,486
Depreciation charge – expensed 7,926 3,221 480 4,873 – 16,500
Depreciation charge – capitalised 2 207 26 – – – 233
Impairment losses 3 43 62 – 513 – 618
Transfers between category – – – – – –
Disposals (14,933) (922) – (1,349) – (17,204)
Balance as at 30 June 2011 45,779 20,994 2,403 52,457 – 121,633
Carrying amount as at 30 June 2011 11,014 11,596 2,191 33,195 566 58,562
CostBalance as at 1 July 2009 71,066 27,864 4,663 63,088 3,505 170,186
Additions by purchase 3,815 3,496 283 144 13,804 21,542
Reductions – other 1 – – – (751) – (751)
Transfers between category 3 (55) – 56 (4) –
Disposals (9,111) (2,304) (352) (1) – (11,768)
Balance as at 30 June 2010 65,773 29,001 4,594 62,536 17,305 179,209
Depreciation and impairment lossesBalance as at 1 July 2009 52,802 18,301 1,681 43,711 – 116,495
Depreciation charge – expensed 8,785 2,567 472 4,677 – 16,501
Depreciation charge – capitalised 2 39 56 – – – 95
Impairment losses – – – – – –
Transfers between category (8) (24) – 32 – –
Disposals (9,082) (2,293) (230) – – (11,605)
Balance as at 30 June 2010 52,536 18,607 1,923 48,420 – 121,486
Carrying amount as at 30 June 2010 13,237 10,394 2,671 14,116 17,305 57,723
1 This relates to the addition/reduction of lease make-good costs on leased buildings. 2 Refers to the depreciation charge for existing assets that are used in the development of new intangible assets.3 Impairment relates to damages that arose from the Canterbury earthquakes. Refer note 7.

105PART 7 DEPARTMENTAL FINANCIAL STATEMENTSird.govt.nz
NOTE 5: INTANGIBLE ASSETS BY CATEGORY
Software – developed
Business process design
Software and licences – purchased
Assets under construction – intangibles
Total
$000 $000 $000 $000 $000
Cost
Balance as at 1 July 2010 400,361 8,262 110,225 13,760 532,608
Additions by purchase – – 4,596 – 4,596
Additions internally developed 5,074 – – 10,064 15,138
Transfers between category 8,590 – 56 (9,048) (402)
Disposals – – – – –
Balance as at 30 June 2011 414,025 8,262 114,877 14,776 551,940
Amortisation and impairment lossesBalance as at 1 July 2010 302,018 4,032 65,186 2,947 374,183
Amortisation charge – expensed 30,029 1,036 12,031 (1,820) 41,276
Amortisation charge – capitalised 1 84 – – – 84
Impairment losses – – – 1,820 1,820
Transfers between category – – – – –
Disposals – – – – –
Balance as at 30 June 2011 332,131 5,068 77,217 2,947 417,363
Carrying amount as at 30 June 2011 81,894 3,194 37,660 11,829 134,577
Cost
Balance as at 1 July 2009 330,447 8,262 140,846 17,124 496,679
Additions by purchase – – 22,507 – 22,507
Additions internally developed 7,469 – – 8,146 15,615
Transfers between category 62,958 – (51,448) (11,510) –
Disposals (513) – (1,680) – (2,193)
Balance as at 30 June 2010 400,361 8,262 110,225 13,760 532,608
Amortisation and impairment lossesBalance as at 1 July 2009 244,990 2,996 81,176 2,947 332,109
Amortisation charge – expensed 27,814 1,036 14,312 – 43,162
Amortisation charge – capitalised 1 229 – – – 229
Impairment losses 808 – – – 808
Transfers between category 2 28,693 – (28,693) – –
Disposals (516) – (1,609) – (2,125)
Balance as at 30 June 2010 302,018 4,032 65,186 2,947 374,183
Carrying amount as at 30 June 2010 98,343 4,230 45,039 10,813 158,425
There is no restriction over the title of Inland Revenue’s intangible assets, nor are any intangible assets pledged as security for liabilities.1 Refers to the amortisation charge for existing assets that are utilised in the development of new intangible assets. 2 Project-related assets in 2009–10 with a carrying amount of $20,553,000 were reclassified from software and licences – purchased, to software – developed
following an asset categorisation review.
Software – developed and business process design includes the following items and carrying amounts: FIRST technology environment $51,121,000, KiwiSaver $29,578,000, student loans $4,389,000 (2009–10, FIRST technology environment $56,802,000, KiwiSaver $40,877,000, student loans $4,895,000). The amortisation period for these intangible assets range from 5-10 years. Software and licences – purchased includes the following items and carrying amounts: FIRST technology environment $35,608,000, KiwiSaver $2,051,000 (2009–10, FIRST technology environment $34,529,000, KiwiSaver $1,759,000, Student loans $8,751,000). The amortisation period for these intangible assets range from 5-10 years.

106 NEW ZEALAND INLAND REVENUE ANNUAL REPORT 2011 ird.govt.nz
NOTE 6: CAPITAL CHARGEInland Revenue pays a capital charge to the Crown on taxpayer’s funds as at 30 June and 31 December each year. �e capital charge rate for the year ended 30 June 2011 was 7.5% per annum (2009–10, 7.5%).
NOTE 7: OTHER EXPENSES2009–10 Note 2010–11
Actual Actual$000 $000
– Canterbury earthquakes – personnel and operating 2,608 – Canterbury earthquakes – PPE impairment 4 618
– Total other expenses 3,226
NOTE 8: REPAYMENT OF SURPLUS TO THE CROWN2009–10 Note 2010–11
Actual Actual$000 $000
44,125 Total comprehensive income (2,579) – Inc/(Dec) Other expenses 7 3,226
44,125 Repayment of surplus to the Crown 647
NOTE 9: DEBTORS AND PREPAYMENTS2009–10 2010–11
Actual Actual$000 $000
2,595 Accounts receivable 3,165 (25) Less provision for impairment (5)
2,141 Other debtors 1,954
4,711 Net debtors 5,114
9,770 Prepayments 13,179
14,481 Total other debtors and prepayments 18,293
Given their short-term nature, the carrying value of accounts receivable and other debtors approximates their fair value.

107PART 7 DEPARTMENTAL FINANCIAL STATEMENTSird.govt.nz
Overdue receivables have been assessed for impairment and appropriate provisions applied, as detailed below:
Net debtors Gross debtors $000
Impairment $000
Net debtors $000
2010–11 Due within 30 days 4,830 – 4,830
Overdue by 31 to 60 days 63 – 63
Overdue by 61 to 90 days 62 (1) 61
Overdue by > 90 days 164 (4) 160
Total 5,119 (5) 5,114
2009–10Due within 30 days 4,408 – 4,408
Overdue by 31 to 60 days 157 – 157
Overdue by 61 to 90 days 10 – 10
Overdue by > 90 days 161 (25) 136
Total 4,736 (25) 4,711
The provision for impairment has been calculated based on expected losses for Inland Revenue’s pool of debtors. Expected losses have been determined based on a review of each debtor.
Movements in the provision for impairment are as follows:
2009–10 2010–11Actual Actual
$000 $000
(94) Opening balance (25) 46 Unused amounts reversed 5
23 Receivables written off during the year 15
(25) Closing balance (5)
NOTE 10: INVENTORIES HELD FOR EXTERNAL DISTRIBUTIONInland Revenue holds inventories in the form of returns and guides for external distribution. The carrying amount of inventories held for distribution that are measured at cost as at 30 June 2011 amounted to $1,119,000 (2009–10, $1,153,000).
The write-down of inventories held for distribution amounted to $60,000 (2009–10, $nil). There have been no reversals of write-downs.
No inventories are pledged as security for liabilities.

108 NEW ZEALAND INLAND REVENUE ANNUAL REPORT 2011 ird.govt.nz
NOTE 11: CREDITORS AND OTHER PAYABLES2009–10 2010–11
Actual Actual$000 $000
3,811 Accounts payable 9,019 13,149 Accrued expenses - other 12,086
5,432 GST payable 6,307
22,392 Total creditors and other payables 27,412
Creditors and other payables are normally settled on 30-day terms, therefore the carrying value of creditors and other payables approximates their fair value.
NOTE 12: EMPLOYEE ENTITLEMENTS AND PROVISION FOR RESTRUCTURING2009–10 2010–11
Actual Actual$000 $000
Current liabilities21,398 Annual leave 22,955
11,646 Accrued salaries and wages 13,806
1,589 Retiring leave 1,652
1,509 Sick leave 1,400
978 Long-service leave 1,073
694 Restructuring 615
59 Time off in lieu 36
37,873 Total current liabilities 41,537
Non-current liabilities
26,682 Retiring leave 27,956
7,186 Long-service leave 7,800
2,972 Sick leave –
36,840 Total non-current liabilities 35,756
74,713 Total employee entitlements and provision for restructuring 77,293
�e present value of retiring and long-service leave obligations depend on a number of factors that are determined on an actuarial basis by an independent actuary using a number of assumptions. Two key assumptions used in calculating these liabilities include the discount rate and the salary inflation factor. Any changes in these assumptions will impact on the carrying amount of the liabilities.
�e discount rates used by the independent actuary for the retiring and long-service leave valuations are based on Treasury published forward rates at 30 June 2011. �e long-term salary inflation assumption is based on Treasury published rates at 30 June 2011 and after obtaining advice from the independent actuary. �e long-term salary inflation assumption used was 4.00%.
In 2010–11 the methodology for calculating the sick leave liability was changed from an actuarial based long-term valuation to a short term model based on Treasury published guidance. Under the revised methodology a liability is recognised to the extent that absences in the coming year are expected to be greater than the sick leave entitlements earned in the coming year. �e amount is calculated based on the unused sick leave entitlement that can be carried forward at balance date, to the extent that it will be used by staff to cover those future absences. �e change in methodology has resulted in a $3.1m reduction of the sick leave liability.

109PART 7 DEPARTMENTAL FINANCIAL STATEMENTSird.govt.nz
�e following table provides a sensitivity analysis for the key assumptions:
Discount rate Salary inflation
–1% +1% –1% +1%
$000 $000 $000 $000
Retiring leave 1,850 (1,638) (1,700) 1,888 Long-service leave 403 (359) (375) 414
Movements in the provision for restructuring are as follows:
2009–10 2010–11Actual Actual
$000 $000
Restructuring17,549 Opening balance 694
694 Additional provisions made 6,236
(17,549) Amounts used (6,315)
– Unused amounts reversed –
694 Closing balance 615
�e 2009–10 and 2010–11 costs result from organisational restructuring. �e 2009–10 provision was fully utilised in the 2010–11 year. �e 2010–11 provision is expected to be fully utilised in the 2011–12 year.
NOTE 13: PROVISION FOR OTHER LIABILITIES2009–10 2010–11
Actual Actual$000 $000
Current liabilities2,483 Onerous contracts 1,416
706 Lease make-good 1,189
3,189 Total current liabilities 2,605
Non-current liabilities
2,326 Onerous contracts 391
4,188 Lease make-good 2,627
6,514 Total non-current liabilities 3,018
9,703 Total provision for other liabilities 5,623

110 NEW ZEALAND INLAND REVENUE ANNUAL REPORT 2011 ird.govt.nz
Onerous contracts
Lease make-good
Total
$000 $000 $000
2010–11 Opening balance 4,809 4,894 9,703
Additional provisions made 1,396 1,325 2,721
Amounts used (4,398) (1,258) (5,656)
Unused amounts reversed – (865) (865)
Discount unwind – (280) (280)
Closing balance 1,807 3,816 5,623
2009–10Opening balance 1,220 6,085 7,305
Additional provisions made 4,154 1,649 5,803
Amounts used (565) (12) (577)
Unused amounts reversed – (2,819) (2,819)
Discount unwind – (9) (9)
Closing balance 4,809 4,894 9,703
Onerous contracts
�e provision for onerous contracts arises from non-cancellable operating leases where the unavoidable costs of meeting the lease contract exceed the economic benefits to be received from it. Inland Revenue currently has three leases where it is no longer able to use the surplus space due to restructuring and floor plan revision.
Lease make-good
For a number of its leased premises, Inland Revenue is required at the expiry of the lease term to make-good any damage caused to the premises and remove any fixtures and fittings it has installed.
Where leases include make-good clauses, an asset and a provision for lease make-good costs is recognised at the commencement of the lease, for the costs of removing the improvement and restoring any damage from its installation. In some cases, Inland Revenue has the option to renew these leases, which impacts on the timing of expected cash flows to make-good the premises.
NOTE 14: OTHER FINANCIAL LIABILITIES2009–10 2010–11
Actual Actual$000 $000
Current liabilities 142 Leasing incentives 181
142 Total current liabilities 181
Non-current liabilities
1,052 Leasing incentives 1,393
1,052 Total non-current liabilities 1,393
1,194 Total other financial liabilities 1,574

111PART 7 DEPARTMENTAL FINANCIAL STATEMENTSird.govt.nz
NOTE 15: DERIVATIVE FINANCIAL INSTRUMENTSTo mitigate its currency risk Inland Revenue enters into foreign currency forward exchange contracts with New Zealand Debt Management Office (NZDMO).
�e notional principal amounts of outstanding forward exchange contracts as at 30 June 2011 were nil (2009–10, nil).
�e fair value of forward exchange contracts entered into during the financial year were determined by reference to published price quotations in an active market.
NOTE 16: RECONCILIATION OF NET SURPLUS TO NET CASH FLOW FROM OPERATING ACTIVITIES2009–10 2010–11
Actual Actual$000 $000
44,125 Net surplus/(deficit) (2,579) Add non-cash items
16,501 Depreciation and impairment 17,118
43,970 Amortisation and impairment 43,096
60,471 Total non-cash items 60,214
Add items classified as investing or financing activities
43 Net loss on sale of property, plant and equipment 368
70 Net loss on disposal of intangible assets –
113 Total items classified as investing or financing activities 368
Add/(less) working capital movements
(37,632) (Inc)/Dec in debtor Crown (62)
(1,246) (Inc)/Dec in debtors and prepayments (3,812)
289 (Inc)/Dec in inventories held for distribution 34
(2,039) Inc/(Dec) in creditors and other payables 5,020
(17) Inc/(Dec) in derivative financial instruments –
(18,452) Inc/(Dec) in provision for employee benefits 2,580
2,398 Inc/(Dec) in provision for other liabilities (4,080)
(146) Inc/(Dec) in other financial liabilities 380
(56,845) Net movements in working capital items 60
47,864 Net cash inflow from operating activities 58,063
NOTE 17: COMMITMENTS
Capital commitments
Capital commitments are the aggregate amount of capital expenditure contracted for the acquisition of property, plant and equipment and intangible assets that have not been paid for or recognised as a liability at the balance sheet date.
Operating commitments
Inland Revenue’s operating commitments consist of non-cancellable accommodation leases, and non-cancellable contracts for the supply of goods and services, where a penalty or exit cost is charged for cancelling the contract.
Commitments for non-cancellable accommodation leases relate to Inland Revenue’s long-term leases on its premises at many locations throughout New Zealand. �e annual lease payments are regularly reviewed and the amounts disclosed as future commitments are based on

112 NEW ZEALAND INLAND REVENUE ANNUAL REPORT 2011 ird.govt.nz
current rental rates. These commitments also include office space vacated by Inland Revenue as a result of organisational restructuring and sub-leased. Provision has been made in the financial statements for the expected net expenses for the duration of these leases.
The total minimum future sub-lease payments expected to be received under non-cancellable sub-leases at balance date is $189,000 (2009–10, $189,000).
Inland Revenue’s non-cancellable operating leases have varying terms, escalation clauses and renewal rights. There are no restrictions placed on Inland Revenue by any of its leasing arrangements.
Inland Revenue has also entered into non-cancellable contracts for computer maintenance and other contracts for the supply of goods and services.
NOTE 18: CONTINGENT LIABILITIES
Contingent liabilities
Legal proceedings and disputes – taxpayer
This contingent liability relates to potential net claims against Inland Revenue for court costs associated with tax disputes and other legal proceedings being taken through the courts against taxpayers. It only relates to court costs; the actual revenue under dispute is recognised as a Crown contingency (refer to Schedule of contingencies – Crown as administered by Inland Revenue).
The expected value of the contingent liability is calculated using an outcome probability model that weighs the total potential liability against outcome probabilities. An estimate of potential court cost recoveries is made and netted off against the contingent liability. Independent confirmation on the liability has been ascertained on all legal proceedings and tax disputes.
Legal proceedings and disputes – departmental
This contingent liability relates to a disputed claim made by a departmental supplier.
Personal grievances
Personal grievances represent amounts claimed by employees for alleged breaches of contract against Inland Revenue.
Contingent assets
Insurance claims – Canterbury earthquakes
Inland Revenue leases a building in Christchurch that sustained damage as a result of the 22 February 2011 and subsequent earthquakes. Damage was sustained to leasehold improvements, furniture, IT equipment, and office equipment.
Inland Revenue will be submitting insurance claims for material damage caused by the earthquakes and business interruption as a result of not being able to repair and access the building. These claims are estimated at $4 million. The final amount of the claim is still being determined and will be subject to ongoing discussions with our insurance company.
Insurance claim proceeds of $166,000 relating to the 4 September 2010 Canterbury earthquake are disclosed as other revenue in the Statement of Comprehensive Income.

113PART 7 DEPARTMENTAL FINANCIAL STATEMENTSird.govt.nz
NOTE 19: RELATED PARTY TRANSACTIONS AND KEY MANAGEMENT PERSONNEL
Inland Revenue is a wholly owned entity of the Crown. �e government significantly influences the roles of Inland Revenue as well as being its major source of revenue. In 2010–11 Inland Revenue has been provided with funding from the Crown of $611 million (2009–10, $609 million) for specific purposes as set out in the scope of relevant government appropriations.
Inland Revenue enters into numerous related party transactions with other government departments, Crown agencies and state-owned enterprises which are controlled, significantly influenced, or jointly controlled by the Crown. All related party transactions have been entered into on an arms’ length basis.
In 2010–11 the purchase of goods and services by Inland Revenue from entities controlled, significantly influenced, or jointly controlled by the Crown totalled $33 million (2009–10, $31 million). �ese purchases included postal services from New Zealand Post, and air travel from Air New Zealand.
In 2010–11 Inland Revenue paid the Crown capital charges on taxpayer’s funds totalling $18 million (2009–10, $17 million).
In 2010–11 the services provided by Inland Revenue to entities controlled, significantly influenced, or jointly controlled by the Crown totalled $22 million (2009–10, $22 million). �ese services included the collection of levies payable by earners on behalf of the Accident Compensation Corporation (ACC), and the supply of information to other agencies.
No provision has been required, nor any expense recognised, for impairment of receivables from related parties.
No related party transactions were entered into with key management personnel during the year.
Compensation to key management personnel
�e remuneration of key management personnel during the year was as follows:
2009–10 2010–11Actual Actual
$000 $000
2,391 Short-term employee benefits 2,78427 Post-employment benefits 35
5 Other long-term benefits 20
2,423 Total key management personnel compensation 2,839
Key management personnel include the Commissioner, five Deputy Commissioners, Chief Tax Counsel, Chief Financial Officer and those formally acting in those positions during the financial year. �e Commissioner’s remuneration is determined and paid by the State Services Commission.
�e number of key management personnel increased by one from March 2010.
NOTE 20: FINANCIAL INSTRUMENT RISKS
Market risk
Currency risk �e risk that the fair value or future cash flows of a financial instrument will fluctuate because of changes in foreign exchange rates is called currency risk.
Because Inland Revenue purchases fixed assets and services from overseas suppliers it is exposed to currency risk arising from various currency exposures, primarily for the United States and Australian dollars. Currency risk arises from future purchases of fixed assets and services which are denominated in a foreign currency.
Inland Revenue has policies in place to manage the risks associated with financial instruments and, being risk averse, seeks to minimise exposure from its treasury activities. Inland Revenue does not enter into transactions that are speculative in nature.

114 NEW ZEALAND INLAND REVENUE ANNUAL REPORT 2011 ird.govt.nz
Under its foreign exchange policy, Inland Revenue enters into foreign currency forward exchange contracts to manage foreign exchange exposures when single foreign exchange transactions exceed NZ $100,000, or the transaction exposure for an individual currency exceeds NZ $100,000. This policy has been approved by Treasury and is in line with the requirements of Treasury “Guidelines for the Management of Crown and Departmental Foreign Exchange Exposure”.
Sensitivity analysis A sensitivity analysis has not been undertaken as there is no significant foreign exchange rate risk.
Interest rate risk Interest rate risk is the risk that the fair value of a financial instrument will fluctuate or, the cash flows from a financial instrument will fluctuate, due to changes in market interest rates.
Inland Revenue has no interest-bearing financial instruments so it has no exposure to interest rate risk.
Credit risk
The risk that a third party will default on its obligations to Inland Revenue, causing a loss to be incurred is called credit risk. In the normal course of its business credit risk from trade debtors is concentrated with the Crown and other government agencies.
The carrying amount of financial assets recognised in the Statement of Financial Position best represents Inland Revenue’s maximum exposure to credit risk at balance date.
Inland Revenue does not require any collateral, security, or other credit enhancements to support financial instruments with financial institutions that it deals with or the New Zealand Debt Management Office, because these entities have high credit ratings. For its other financial instruments, Inland Revenue does not have significant concentrations of credit risk.
The carrying amount of financial assets that would otherwise be past due or impaired whose terms have been renegotiated, is not material.
Liquidity risk
Liquidity risk is the risk that Inland Revenue will encounter difficulty raising liquid funds to meet commitments as they fall due.
As all but an insignificant proportion of funds come from the New Zealand Government and cash is drawn down on a fortnightly basis, Inland Revenue does not have significant liquidity risk. In meeting its liquidity requirements, Inland Revenue closely monitors its forecast cash requirements with expected cash drawdowns from the New Zealand Debt Management Office. Inland Revenue maintains a target level of available cash to meet liquidity requirements.
The table below analyses Inland Revenue’s financial liabilities that will be settled, based on the remaining period at the balance sheet date to the contractual maturity date. The amounts disclosed are the contractual undiscounted cash flows.
LIQUIDITY RISKS
Notes Up to 1 year 1 to 5 years Over 5 years Total$000 $000 $000 $000
2010–11 Creditors and other payables 11 27,412 – – 27,412
Derivative financial instrument liabilities 15 – – – –
Other financial liabilities 14 181 670 723 1,574
Closing balance 27,593 670 723 28,986
2009–10Creditors and other payables 11 22,392 – – 22,392
Derivative financial instrument liabilities 15 – – – –
Other financial liabilities 14 142 518 534 1,194
Closing balance 22,534 518 534 23,586

115PART 7 DEPARTMENTAL FINANCIAL STATEMENTSird.govt.nz
NOTE 21: CATEGORIES OF FINANCIAL INSTRUMENTS�e carrying amounts of financial assets and financial liabilities in each of the NZ IAS 39 categories are as follows:
2009–10 Notes 2010–11Actual Actual
$000 $000
Debtors and receivables14,633 Cash and cash equivalents 14,666
147,004 Debtor Crown 147,069
4,711 Net debtors 9 5,114
166,348 Total debtors and receivables 166,849
Fair value through surplus or deficit
– Derivative financial instrument liabilities –
– Total fair value through surplus or deficit –
Financial liabilities measured at amortised cost
22,392 Creditors and other payables 11 27,412
1,194 Other financial liabilities 14 1,574
23,586 Total financial liabilities measured at amortised cost 28,986

116 NEW ZEALAND INLAND REVENUE ANNUAL REPORT 2011 ird.govt.nz
NOTE 22: CAPITAL MANAGEMENTInland Revenue’s capital is its equity (or taxpayers’ funds), which comprise of general funds. Equity is represented by net assets.
Inland Revenue manages its revenues, expenses, assets, liabilities and general financial dealings prudently. Inland Revenue’s equity is largely managed as a by-product of managing income, expenses, assets, liabilities, and compliance with the Government Budget processes and with Treasury Instructions and the Public Finance Act 1989.
The objective of managing Inland Revenue’s equity is to ensure that it effectively achieves its goals and objectives, while remaining a going concern.
NOTE 23: EXPLANATION OF MAJOR VARIANCES
Statement of Comprehensive Income
The following major variations occurred in the Statement of Comprehensive Income between the 2010–11 Actuals and 2009–10 Actuals:
" Other income was lower than last year’s actual by $5,846,000 (16%). This decrease was due to one-off court cost recoveries being accounted for during the 2009–10 year relating to structured finance litigation.
" Personnel expenses were higher than last year’s actual by $26,412,000 (7%). This increase was due to:
7 An increase of $11,220,000 in staff costs in 2010–11 primarily as a result of an increase in staff numbers to deliver new initiatives, an update to remuneration lines and contract settlements.
7 An increase of $6,297,000 in contractor and temporary staff related expenditure. Of this $4,083,000 was in relation to the reclassification of capital expenditure to operating on the student loan redesign project. The remainder of the increase was related to business transformation initiatives including the enterprise desktop project.
7 Organisational restructuring costs of $6,465,000 in 2010–11.
" Operating expenses were higher than last year’s actual by $12,471,000 (9%). This was mainly due to an increase in IT maintenance contracts.
" Other expenses were higher than last year’s actual by $3,226,000 (100%). This related to costs incurred as a result of the Canterbury earthquakes.
" Capital charge expense was higher than last year’s actual by $1,260,000 (8%). This increase was associated with capital injections from the Crown for various capital initiatives including $15,424,000 for the student loan redesign project and $8,168,000 for Budget 2010 initiatives.
The following major budget variations occurred between 2010–11 Actuals and the 2010–11 Estimates of Appropriations (Main Estimates) in the Statement of Comprehensive Income:
" Other income was lower than budget by $2,392,000 (7%). The variance was mainly due to binding rulings revenue and court cost recoveries being lower than budgeted.
" Operating expenses were lower than budget by $11,145,000 (7%). This decrease was mainly due to the following:
7 Underspending in the operating component of projects, including enterprise desktop and student loans redesign. These projects will continue into 2011–12.
7 A decrease in the provision for onerous rental contracts (vacant space) in the 2010–11 year, relating to the long-term accommodation solution in Wellington.
7 Underspending related to the child support reciprocal arrangement with Australia, with $2,996,000 funding returned as part of the 2011 March Baseline Update.
7 Savings in postage and printing costs resulting from lower demand volume than initially forecast.
Statement of Financial Position
The following major variations occurred in the Statement of Financial Position between 30 June 2011 Actuals and 30 June 2010 Actuals:
" Debtors and prepayments were higher than last year’s actual by $3,890,000 (28%). This was due to an increase in IT maintenance contracts.
" Intangible assets were lower than last year’s actual by $23,848,000 (15%). This was mainly due to the following:
7 $8,408,000 was in relation to reclassification and impairment of capital costs for the student loan programme.
7 The remaining variance was due to less projects being capitalised during 2010–11. A portion of this is timing related and there is $18,561,000 of capital funding proposed to be carried forward into the 2011–12 financial year.
" Creditors and other payables were higher than last year’s actual by $5,020,000 (22%). This was mainly due to the timing of trade payables.

117PART 7 DEPARTMENTAL FINANCIAL STATEMENTSird.govt.nz
" Current provision for employee benefits and restructuring were higher than last year’s actual by $3,664,000 (10%). This was mainly due to an additional day of salary and annual leave accruals compared to the same time last year.
" Provision for other liabilities were lower than last year’s actual by $4,080,000 (42%). This was due to a decrease in the provision for onerous rental contracts (vacant space) in the 2010–11 year, relating to the long-term accommodation solution in Wellington.
The following major budget variations occurred between 30 June 2011 Actuals and the 2010–11 Estimates of Appropriations (Main Estimates) in the Statement of Financial Position:
" Cash and cash equivalents were higher than budget by $2,666,000 (22%). This was mainly due to timing in relation to the payment of expenses and employee benefits.
" Debtor Crown was higher than budget by $53,014,000 (56%). The variance was due to funding in Debtor Crown that we have not drawn down due to capital underspending.
" Debtors and prepayments were higher than budget by $7,166,000 (66%). This was due to an increase in trade receivables from departments and third parties, and an increase in prepaid IT maintenance contracts.
" Property, plant and equipment was lower than budget by $11,432,000 (16%). This was mainly due to underspend and deferral of several capital projects. The underspending is proposed to be carried forward into the 2011–12 financial year.
" Intangible assets were lower than budget by $47,649,000 (26%). This was due to an underspend in capital projects, of which $18,561,000 is proposed to be carried forward to the 2011–12 year.
" Creditors and other payables were higher than budget by $1,912,000 (8%). This was mainly due to the net GST payable for the June 2011 month being higher than budgeted.
" Provision for employee benefits and restructuring were higher than budget by $6,178,000 (9%). This was mainly driven by changes in the actuarial valuations for long-service leave and retiring leave in 2010–11.
" Provision for other liabilities were lower than budget by $1,404,000 (20%). This was due to a decrease in the long-term provision for onerous rental contracts relating to the long-term accommodation solution in Wellington.
Statement of Commitments
The following major variations occurred in the Statement of Commitments between 30 June 2011 Actuals and 30 June 2010 Actuals:
" Total capital commitments were lower than last year’s actual by $5,487,000 (56%). This was mainly due to the commitments associated with the Wellington building fit-out in 2009–10. The project has been completed as at June 2011.
" Total accommodation commitments were lower than last year’s actual by $26,898,000 (11%). This was mainly due to less buildings being occupied as a result of the long-term accommodation solution in Wellington.
" Total supply commitments were higher than last year’s actual by $7,622,000 (43%). This was due to an increase in non-cancellable contracts (with exit or penalty costs) for the supply of goods and services.
Statement of Departmental Expenses and Capital Expenditure against Appropriations
The following major variations occurred in the Statement of Departmental Expenses and Capital Expenditure against Appropriations between 30 June 2011 Actuals and 2010–11 Appropriations:
Intangible assets were lower than the Appropriation by $32,677,000 (63%). This was due to the deferral of several capital projects, of which $18,561,000 is proposed to be carried forward to the 2011–12 year. Also having an impact was project underspending, impairment, and reclassification from capital to operating expenditure.
NOTE 24: EVENTS AFTER BALANCE DATEAfter the balance date, Inland Revenue completed a consultation process with staff in medium site offices on proposed changes to the way services will be delivered in these sites. The offices included in the proposed changes are Rotorua, New Plymouth, Napier, Nelson and Invercargill. Changes will start to be implemented in early 2012 and completed by June 2013.
No other events have occurred between the balance date and date of signing these financial statements that materially affect these financial statements.

PART 8 FINANCIAL SCHEDULES CROWN AS ADMINISTERED BY INLAND REVENUE
Part eight
FINANCIAL SCHEDULES CROWN AS ADMINISTERED BY INLAND REVENUE
119ird.govt.nz
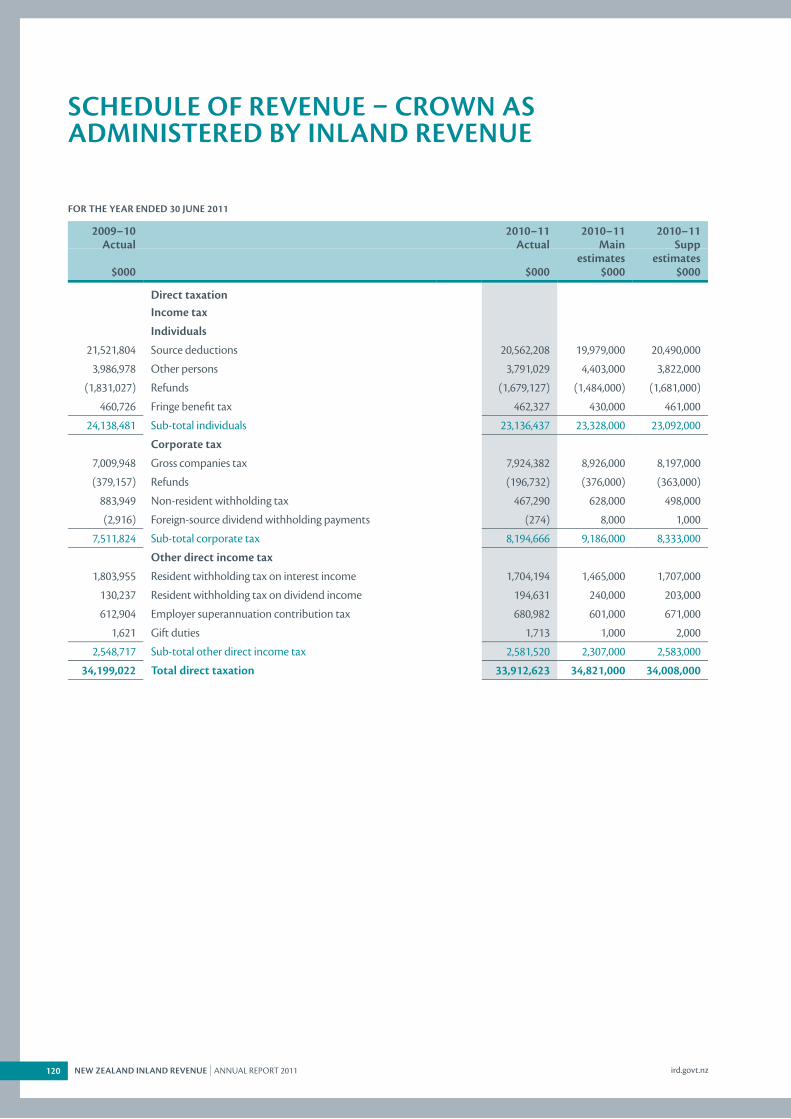
120 NEW ZEALAND INLAND REVENUE ANNUAL REPORT 2011 ird.govt.nz
SCHEDULE OF REVENUE CROWN AS ADMINISTERED BY INLAND REVENUE
FOR THE YEAR ENDED 30 JUNE 2011
2009–10 2010–11 2010–11 2010–11Actual Actual Main Supp
estimates estimates$000 $000 $000 $000
Direct taxation Income tax
Individuals
21,521,804 Source deductions 20,562,208 19,979,000 20,490,000
3,986,978 Other persons 3,791,029 4,403,000 3,822,000
(1,831,027) Refunds (1,679,127) (1,484,000) (1,681,000)
460,726 Fringe benefit tax 462,327 430,000 461,000
24,138,481 Sub-total individuals 23,136,437 23,328,000 23,092,000
Corporate tax
7,009,948 Gross companies tax 7,924,382 8,926,000 8,197,000
(379,157) Refunds (196,732) (376,000) (363,000)
883,949 Non-resident withholding tax 467,290 628,000 498,000
(2,916) Foreign-source dividend withholding payments (274) 8,000 1,000
7,511,824 Sub-total corporate tax 8,194,666 9,186,000 8,333,000
Other direct income tax
1,803,955 Resident withholding tax on interest income 1,704,194 1,465,000 1,707,000
130,237 Resident withholding tax on dividend income 194,631 240,000 203,000
612,904 Employer superannuation contribution tax 680,982 601,000 671,000
1,621 Gift duties 1,713 1,000 2,000
2,548,717 Sub-total other direct income tax 2,581,520 2,307,000 2,583,000
34,199,022 Total direct taxation 33,912,623 34,821,000 34,008,000

121PART 8 FINANCIAL SCHEDULES CROWN AS ADMINISTERED BY INLAND REVENUEird.govt.nz
2009–10 2010–11 2010–11 2010–11Actual Actual Main Supp
estimates estimates$000 $000 $000 $000
Indirect taxation Goods and services tax
19,358,560 Gross goods and services tax 22,350,836 22,850,000 22,137,000
(7,880,287) Refunds (9,775,501) (9,524,000) (10,047,000)
11,478,273 Sub-total goods and services tax 12,575,335 13,326,000 12,090,000
Other indirect taxation
4,622 Cheque duties 4,076 4,000 4,000
77,042 Approved issuer levy 82,098 77,000 79,000
265,311 Gaming duties 266,081 273,000 263,000
10,522 Other indirect taxation 4,934 15,000 5,000
357,497 Sub-total other indirect taxation 357,189 369,000 351,000
11,835,770 Total indirect taxation 12,932,524 13,695,000 12,441,000
46,034,792 Total taxation 46,845,147 48,516,000 46,449,000
Other revenue
184,038 Child support – assessments 192,938 235,700 200,000
376,634 Child support – penalties 317,009 387,300 329,000
394,777 Interest unwind – student loans 420,371 440,000 437,000
11,563 Other revenue 13,486 6,000 6,000
967,012 Total other revenue 943,804 1,069,000 972,000
47,001,804 Total operating revenue 47,788,951 49,585,000 47,421,000
�e accompanying accounting policies and notes form part of these financial schedules.
For a full understanding of the Crown’s financial position and the results of its operations, refer to the Financial Statements of the Government of New Zealand for the year ended 30 June 2011.
SCHEDULE OF REVENUE CROWN AS ADMINISTERED BY INLAND REVENUE CONTINUED

122 NEW ZEALAND INLAND REVENUE ANNUAL REPORT 2011 ird.govt.nz
SCHEDULE OF EXPENDITURE CROWN AS ADMINISTERED BY INLAND REVENUE
FOR THE YEAR ENDED 30 JUNE 2011
2009–10 2010–11 2010–11 2010–11Actual Actual Main Supp
estimates estimates$000 $000 $000 $000
Benefits and other unrequited expenses 4,056 Child tax credit 2,766 3,100 2,800
2,158,923 Family tax credit 2,129,523 2,229,000 2,204,400
595,088 In-work tax credit 584,787 597,080 592,000
(2,732) KiwiSaver: Employer tax credit 198 – 198
4,052 KiwiSaver: Fee subsidy (50) – –
4,677 KiwiSaver: Interest 4,625 6,000 5,000
359,802 KiwiSaver: Kick-start payment 312,797 293,000 302,000
655,618 KiwiSaver: Member tax credit 263,692 880,000 263,692
– KiwiSaver: Tax credit 460,777 – 468,110
8,877 Minimum family tax credit 9,483 10,000 9,600
153,945 Paid parental leave payments 154,194 162,800 154,600
20,497 Parental tax credit 18,966 19,840 19,200
1,302 Payroll subsidy 1,574 4,000 2,000
3,964,105 Total benefits and other unrequited expenses 3,943,332 4,204,820 4,023,600
Borrowing expenses
5 Adverse event interest 10 10 10
1,459 Environmental restoration account interest 1,527 2,000 2,000
5,778 Income equalisation interest 5,589 7,000 7,000
7,242 Total borrowing expenses 7,126 9,010 9,010
Other expenses
666,830 Bad debt write-offs 785,466 931,000 819,000
371,424 Impairment of debt relating to child support 280,802 401,000 330,000
(76,432) Impairment of debt 223,953 222,650 311,000
257,200 Impairment of debt relating to student loans (94,000) 100,000 154,000
1,219,022 Total other expenses 1,196,221 1,654,650 1,614,000
5,190,369 Total expenditure 5,146,679 5,868,480 5,646,610
�e accompanying accounting policies and notes form part of these financial schedules.
For a full understanding of the Crown’s financial position and the results of its operations, refer to the Financial Statements of the Government of New Zealand for the year ended 30 June 2011.

123PART 8 FINANCIAL SCHEDULES CROWN AS ADMINISTERED BY INLAND REVENUEird.govt.nz
SCHEDULE OF ASSETS CROWN AS ADMINISTERED BY INLAND REVENUE
AS AT 30 JUNE 2011
2009–10 Notes 2010–11 2010–11 2010–11Actual Actual Main Supp
estimates estimates$000 $000 $000 $000
Assets Current assets
965,562 Cash and cash equivalents 1,062,519 800,000 800,000
5,945,019 Receivables 1 6,484,079 5,874,726 5,716,483
23,541 Receivables – child support 2 55,406 59,541 10,541
16,012 Receivables – other 36,958 – 36,000
670,000 Student loans 3 706,000 796,000 727,000
7,620,134 Total current assets 8,344,962 7,530,267 7,290,024
Non-current assets
474,145 Receivables 1 343,100 345,718 418,693
5,434,251 Student loans 3 5,984,213 5,761,882 5,709,529
5,908,396 Total non-current assets 6,327,313 6,107,600 6,128,222
13,528,530 Total assets 14,672,275 13,637,867 13,418,246
�e accompanying accounting policies and notes form part of these financial schedules.
For a full understanding of the Crown’s financial position and the results of its operations, refer to the Financial Statements of the Government of New Zealand for the year ended 30 June 2011.

124 NEW ZEALAND INLAND REVENUE ANNUAL REPORT 2011 ird.govt.nz
SCHEDULE OF LIABILITIES CROWN AS ADMINISTERED BY INLAND REVENUE
AS AT 30 JUNE 2011
2009–10 Notes 2010–11 2010–11 2010–11Actual Actual Main Supp
estimates estimates$000 $000 $000 $000
Liabilities Payables and provisions
18,942 Child support 24,004 18,942 18,942
3,209,408 Refundables and payables 4 3,737,599 3,739,993 3,209,408
6,123 Unclaimed monies 5 6,750 5,716 6,123
3,234,473 Total payables and provisions 3,768,353 3,764,651 3,234,473
Reserve schemes
207,119 Reserve schemes 6 226,765 233,341 195,119
207,119 Total value of the reserve schemes 226,765 233,341 195,119
3,441,592 Total liabilities 3,995,118 3,997,992 3,429,592
�e accompanying accounting policies and notes form part of these financial schedules.
For a full understanding of the Crown’s financial position and the results of its operations, refer to the Financial Statements of the Government of New Zealand for the year ended 30 June 2011.
SCHEDULE OF MOVEMENTS BETWEEN DEPARTMENTS CROWN AS ADMINISTERED BY INLAND REVENUE
FOR THE YEAR ENDED 30 JUNE 2011
2009–10 2010–11 2010–11 2010–11Actual Actual Main Supp
estimates estimates$000 $000 $000 $000
10,268,137 Opening balance 10,086,938 9,582,219 10,086,93841,811,435 Net result from operating activities 42,642,272 43,716,520 41,774,390
792,988 Asset transfer between departments – Ministry of Social Development – student loans
762,203 737,326 732,278
(42,785,622) New Zealand Debt Management Office (42,814,256) (44,396,190) (42,604,952)
10,086,938 Closing balance 10,677,157 9,639,875 9,988,654
�e accompanying accounting policies and notes form part of these financial schedules.
For a full understanding of the Crown’s financial position and the results of its operations, refer to the Financial Statements of the Government of New Zealand for the year ended 30 June 2011.

125PART 8 FINANCIAL SCHEDULES CROWN AS ADMINISTERED BY INLAND REVENUEird.govt.nz
STATEMENT OF APPROPRIATIONS CROWN AS ADMINISTERED BY INLAND REVENUE
FOR THE YEAR ENDED 30 JUNE 2011
2009–10 2010–11 2010–11 2010–11Actual Actual Main Supp
estimates estimates$000 $000 $000 $000
Vote: Revenue Benefits and other unrequited expenses
207,227 Child support payments PLA 209,128 225,000 213,000
4,056 Child tax credit PLA 2,766 3,100 2,800
2,158,923 Family tax credit PLA 2,129,523 2,229,000 2,204,400
595,088 In-work tax credit PLA 584,787 597,080 592,000
– KiwiSaver: Employer tax credit 198 – 198
4,052 KiwiSaver: Fee subsidy – – –
4,677 KiwiSaver: Interest 4,625 6,000 5,000
359,802 KiwiSaver: Kick-start payment 312,797 293,000 302,000
655,618 KiwiSaver: Member tax credit 263,692 880,000 263,692
– KiwiSaver: Tax credit 460,777 – 468,110
8,877 Minimum family tax credit PLA 9,483 10,000 9,600
153,945 Paid parental leave payments PLA 154,194 162,800 154,600
20,497 Parental tax credit PLA 18,966 19,840 19,200
1,302 Payroll subsidy 1,574 4,000 2,000
4,174,064 Total benefits and other unrequited expenses 4,152,510 4,429,820 4,236,600
Borrowing expenses
5 Adverse event interest PLA 10 10 10
1,459 Environmental restoration account interest PLA 1,527 2,000 2,000
5,778 Income equalisation interest PLA 5,589 7,000 7,000
7,242 Total borrowing expenses 7,126 9,010 9,010
Other expenses
666,830 Bad debt write-offs 785,466 931,000 819,000
371,424 Impairment of debt relating to child support 280,802 401,000 330,000
(76,432) Impairment of debt 223,953 222,650 311,000
228,100 Impairment of debt relating to student loans* (43,000) 100,000 154,000
1,189,922 Total other expenses 1,247,221 1,654,650 1,614,000
5,371,228 Total appropriations 5,406,857 6,093,480 5,859,610
* Excludes remeasurement.
�e accompanying accounting policies and notes form part of these financial schedules.
For a full understanding of the Crown’s financial position and the results of its operations, refer to the Financial Statements of the Government of New Zealand for the year ended 30 June 2011.

126 NEW ZEALAND INLAND REVENUE ANNUAL REPORT 2011 ird.govt.nz
FOR THE YEAR ENDED 30 JUNE 2011
Actual Authority Expenses in excess of
appropriation$000 $000 $000
Benefits and other unrequited expenses
KiwiSaver: Kick-start payment 312,797 302,000 10,797
KiwiSaver: Employer tax credit: up to 18 November 2010 198 – 198
�e accompanying accounting policies and notes form part of these financial schedules.
For a full understanding of the Crown’s financial position and the results of its operations, refer to the Financial Statements of the Government of New Zealand for the year ended 30 June 2011.
�ere were two instances of unappropriated expenditure:
KiwiSaver: Kick-start payment totalled $312.797 million for the year. �e breach in the KiwiSaver kick-start payment appropriation is largely due to a spike in enrolments prior to the 2011 Budget. �is spike happens annually just prior to the Budget and is due to the anticipated changes that could be introduced as part of the Budget. Although this seasonal spike was already built into the forecasts, the degree of additional uptake surpassed expectations. Another ongoing theme is that uptake among the under-17 age group continues to be stronger than expected. �is affects the KiwiSaver kick-start payment, but not in the short-term any other KiwiSaver credits.
KiwiSaver: Employer tax credit appropriation enables the payment of the KiwiSaver employer tax credit. �e employer tax credit has been repealed with effect from 31 March 2009. Expenditure against this appropriation in 2008–09 was $205.809 million. Whilst the bulk of claims for the employer tax credit ceased in 2008–09 there is still a requirement for Inland Revenue to make final adjustments to member accounts, such as adjusting for overpayments. In 2009–10 this resulted in a ($2.732) million credit to this appropriation. In 2010–11 there was residual expenditure of $0.198 million that was unappropriated.
STATEMENT OF UNAPPROPRIATED EXPENDITURE CROWN AS ADMINISTERED BY INLAND REVENUE

127PART 8 FINANCIAL SCHEDULES CROWN AS ADMINISTERED BY INLAND REVENUEird.govt.nz
SCHEDULE OF CONTINGENT LIABILITIES AND CONTINGENT ASSETS CROWN AS ADMINISTERED BY INLAND REVENUE
AS AT 30 JUNE 2011
2009–10 Notes 2010–11Actual Actual
$000 $000
Quantifiable contingent liabilities 295,408 Legal proceedings and disputes – assessed 281,285
49,538 Unclaimed monies 5 54,617
344,946 Total quantifiable contingent liabilities 335,902
Quantifiable contingent assets
503,533 Legal proceedings and disputes – non-assessed 635,665
503,533 Total quantifiable contingent assets 635,665
�e accompanying accounting policies and notes form part of these financial schedules.
For a full understanding of the Crown’s financial position and the results of its operations, refer to the Financial Statements of the Government of New Zealand for the year ended 30 June 2011.
SCHEDULE OF TRUST MONEY CROWN AS ADMINISTERED BY INLAND REVENUE
FOR THE YEAR ENDED 30 JUNE 2011
2009–10 2010–11 2010–11 2010–11Actual Actual Contributions Distributions
$000 $000 $000 $000
Child support15,526 Child support trust account 11,927 203,628 (207,227)
267 Reciprocal child support agreement trust account 319 16,912 (16,860)
15,793 Total child support 12,246 220,540 (224,087)
KiwiSaver
27,962 KiwiSaver returned transactions trust account 137 – (27,825)
27,962 Total KiwiSaver 137 – (27,825)
43,755 Total trust money 12,383 220,540 (251,912)
�e Child Support trust accounts were established in accordance with sections 139 and 140 of the Child Support Act 1991. Inland Revenue administers these trust accounts for amounts collected from liable parents and the subsequent child support payments that are paid to the custodial parents.
�e KiwiSaver trust account was established in accordance with section 74(4) of the KiwiSaver Act 2006. Inland Revenue administers this account to hold money deposited with the Crown from KiwiSaver scheme providers, primarily for refunds and payments made in error.
�e accompanying accounting policies and notes form part of these financial schedules.
For a full understanding of the Crown’s financial position and the results of its operations, refer to the Financial Statements of the Government of New Zealand for the year ended 30 June 2011.

128 NEW ZEALAND INLAND REVENUE ANNUAL REPORT 2011 ird.govt.nz
STATEMENT OF ACCOUNTING POLICIES
REPORTING ENTITYThe financial schedules (Crown as administered by Inland Revenue) have been prepared and administered by Inland Revenue in accordance with the requirements of the Public Finance Act 1989.
The schedules represent extracts of Crown activity. The activities include elements of income, expenditure, assets and liabilities. These form part of the Financial Statements of the Government of New Zealand.
REPORTING PERIODThe reporting period for these financial schedules is for the year ended 30 June 2011. The financial schedules were authorised by the Chief Executive of Inland Revenue on 22 September 2011.
STATEMENT OF COMPLIANCEThe financial schedules have been prepared in accordance with the requirements of the Public Finance Act 1989, which includes the requirement to comply with New Zealand generally accepted accounting practice (NZ GAAP) and in accordance with Treasury Instructions. Compliance with NZ GAAP in this instance means the figures for the year ended 30 June 2011 comply with New Zealand equivalents to International Financial Reporting Standards (NZ IFRS), and where appropriate, standards issued by the International Public Sector Accounting Standards Board (IPSAS) as appropriate for public benefit entities and New Zealand equivalents to International Accounting Standards (NZ IAS).
BASIS OF PREPARATIONThe accounting policies set out below have been applied consistently to all periods presented in these financial schedules.
These financial schedules have been prepared on a historical cost basis, unless otherwise stated.
The accrual basis of accounting has been used unless otherwise stated. These financial schedules are presented in New Zealand dollars and all values are rounded to the nearest thousand dollars ($000). The functional currency of Inland Revenue is New Zealand dollars.
JUDGEMENTS AND ESTIMATIONSThe preparation of financial schedules in conformity with NZ IFRS requires judgements, estimates and assumptions that affect the application of policies and reported amounts of assets and liabilities, income and expenses. The estimates and associated assumptions are based on historical experience and various other factors that are believed to be reasonable under the circumstances.
The estimates and underlying assumptions are reviewed on an ongoing basis. Revisions to accounting estimates are recognised in the period the estimate is revised in if the revision affects only that period, or in the period of the revision and future periods if the revision affects both current and future periods.
Material judgements, estimates and assumptions impact on receivables, payables, child support receivables and student loan debt. See notes 1, 2, 3 and 4 for more information on these.
STANDARDS AND INTERPRETATIONS ISSUED AND NOT YET ADOPTEDThe Government has elected to early adopt all NZ IFRS and Interpretations that had been approved by the New Zealand Accounting Standards Review Board as at the 30th June 2011 but are not yet effective, with the exception of NZ IFRS 9: Financial Instruments. NZ IFRS 9 Financial Instruments will eventually replace NZ IAS 39 Financial Instruments: Recognition and Measurement. This new standard was approved by the Accounting Standards Review Board in November 2010. NZ IAS 39 is being replaced through the following three main phases: Phase 1 Classification and Measurement, Phase 2 Impairment Methodology and Phase 3 Hedge Accounting. Phase 1 has been completed and has been published in the new financial instrument standard NZ IFRS 9. The new standard addresses the issues of classification and measurement of financial assets and liabilities, and becomes effective for annual reporting periods commencing on or after 1 January 2013.
The standards and interpretations that have been early adopted by the Government predominantly relate to the presentation of financial information and did not have a material impact on these financial schedules.
ACCOUNTING POLICIESThe following particular accounting policies, which materially affect the measurement of financial results and financial position, have been applied.
Budget figuresThe budget figures are those included in the Information Supporting the Estimates of Appropriations (Main Estimates) for the year ending 30 June 2011 and the Information Supporting the Supplementary Estimates of Appropriations (Supplementary Estimates) for the year ending 30 June 2011.

129PART 8 FINANCIAL SCHEDULES – CROWN AS ADMINISTERED BY INLAND REVENUEird.govt.nz
Revenue
Operating revenue
The Crown provides many services and benefits that do not give rise to revenue. Further, payment of tax does not, in itself, entitle a taxpayer to an equivalent value of services or benefits, because there is no direct relationship between paying tax and receiving Crown services and transfers. Where possible, revenue is recognised at the time the debt to the Crown arises.
Taxation and duties are accounted for as income under NZ IFRS with an accounting treatment consistent with IPSAS 23 – Revenue from Non-Exchange transactions (Taxes and Transfers). The Crown recognises income as follows:
Revenue type Revenue recognition point
Source deductions When an individual earns income that is subject to PAYE
Resident withholding tax When an individual is paid interest or dividends subject to deduction at source
Fringe benefit tax When benefits are provided that give rise to fringe benefits
Provisional tax When taxable income is earned
Terminal tax When the terminal assessment is filed
Goods and services tax When the liability to the Crown is incurred
Cheque duties When the liability to the Crown is incurred
Other indirect taxes When the debt to the Crown arises
Child Support assessments When payment is received
Child Support penalties When the debt to the Crown arises
Interest unwind – student loans
Interest unwind on student loans is accrued using the effective interest rate method. The effective interest rate exactly discounts estimated future cash receipts through the expected life of the financial asset to that asset’s net carrying amount. The method applies this rate to the net carrying amount outstanding to determine interest income each period.
Expenses
General
Expenses are recognised in the period to which they relate.
Benefits and other unrequited expenses
Expense type Definition
Child tax credit Extra assistance for low to middle income families who do not depend on the state for financial support (expenses incurred pursuant to section 185 of the Tax Administration Act 1994).
Family tax credit Family support payments made to beneficiaries and non-beneficiaries during the year (expenses incurred pursuant to section 185 of the Tax Administration Act 1994).
In-work tax credit Extra assistance for low to middle income families where the person works a minimum of 20 hours per week and does not have a partner, or a person and their partner work a minimum of 30 hours per week (expenses incurred pursuant to section 185 of the Tax Administration Act 1994).
KiwiSaver: Employer tax credit
Tax credit to employers in respect of their contributions to KiwiSaver as set out in the Income Tax Act 2007. This ceased on 31 March 2009.
KiwiSaver: Fee subsidy Fee subsidy to members for provider fees as set out in the KiwiSaver Act 2006. This ceased on 31 March 2009.
KiwiSaver: Interest Interest on KiwiSaver contributions as set out in the KiwiSaver Act 2006.
KiwiSaver: Kick-start payment
One-off payment made on opening a KiwiSaver account for members who meet the required eligibility criteria as set out in the KiwiSaver Act 2006.
KiwiSaver: Member tax credit
Tax credit to KiwiSaver members as set out in the Income Tax Act 2007.
KiwiSaver: Tax credit Tax credit to KiwiSaver members and the payment of residual tax credits to employers as set out in the Income Tax Act 2007.

130 NEW ZEALAND INLAND REVENUE ANNUAL REPORT 2011 ird.govt.nz
Minimum family tax credit
Extra payment made to families where at least one parent is working for salary or wages (expenses incurred pursuant to section 185 of the Tax Administration Act 1994).
Paid parental leave payments
Paid parental leave payments made to parents eligible under the Parental Leave and Employment Protection Act 1987.
Parental tax credit Additional financial support made to working families for the eight-week period following the birth of a child (expenses incurred pursuant to section 185 of the Tax Administration Act 1994).
Payroll subsidy Subsidy to a payroll agent undertaking employers’ payroll-related tax compliance activities on their behalf (expenses incurred pursuant to section 185 of the Tax Administration Act 1994).
Borrowing expenses
Expense type Definition
Adverse event interest Interest on adverse event income equalisation reserve accounts held by taxpayers in the farming and agriculture business (expenses incurred pursuant to section 185 of the Tax Administration Act 1994).
Environmental restoration account interest
Interest on environmental restoration accounts (expenses incurred pursuant to section 185 of the Tax Administration Act 1994).
Income equalisation interest
Interest on income equalisation reserve scheme accounts held by taxpayers in the farming, fishing or forestry industries (expenses incurred pursuant to section 185 of the Tax Administration Act 1994).
Other expenses
Expense type Definition
Bad debt write-offs Bad debt write-offs for Crown debt administered by Inland Revenue. These write-offs relate to general tax, KiwiSaver and family support debt.
Impairment of debt relating to child support
Impairment arising from objective evidence of one or more loss events that occurred after the initial recognition of the debt, and the loss event (or events) has had a reliably measurable impact on the estimated future cash flows of the collective book of child support debt.
Impairment of debt Impairment arising from objective evidence of one or more loss events that occurred after the initial recognition of the debt, and the loss event (or events) has had a reliably measurable impact on the estimated future cash flows of the Crown debt book. This impairment relates to general tax, KiwiSaver and family support debt.
Impairment of debt relating to student loans
Impairment arising from objective evidence of one or more loss events that occurred after the initial recognition of the loan, and the loss event (or events) has had a reliably measurable impact on the estimated future cash flows of the collective book of student loan debt.
Cash and cash equivalentsCash and cash equivalents include cash on hand, cash in transit, and funds held in bank accounts.
ReceivablesReceivables from taxes, levies and fines (and any penalties and interest associated with these activities) as well as social benefit receivables that do not arise out of a contract.
Receivables are initially assessed at nominal amount or face value, that is, the receivable reflects the amount of tax owed, levy, fine charged, or social benefit debt payable. These receivables are subsequently adjusted for penalties and interest as they are charged, and tested for impairment annually. Interest and penalties charged on receivables are presented as revenue in the Schedule of Revenue.

131PART 8 FINANCIAL SCHEDULES – CROWN AS ADMINISTERED BY INLAND REVENUEird.govt.nz
Allowances for estimated irrecoverable amounts are recognised when there is objective evidence that the asset is impaired. Impairment movements are recognised in the Schedule of Expenditure. Impairment losses can be reversed where there is evidence that the impaired value of the asset has increased.
Financial models have been constructed for Inland Revenue to calculate the impairment of Crown debt as well as child support debt. These models apply a number of assumptions on future repayment behaviour as well as economic assumptions such as the discount rate and inflation.
Financial instruments
Financial assets
Student loansStudent loans are designated as loans and receivables under NZ IAS 39. Student loans are recognised initially at fair value, plus transaction costs, and subsequently measured at amortised cost using the effective interest rate method, and adjusted for impairment movements. Fair value on initial recognition of student loans is determined by projecting forward expected repayments and discounting them back at an appropriate discount rate. The difference between the amount lent and the fair value on initial recognition is expensed on initial recognition. The subsequent measurement at amortised cost is determined using the effective interest rate calculated at initial recognition. This rate is used to spread the Crown’s interest income across the life of the loan and determines the loan’s carrying value at each reporting date.
Allowances for estimated irrecoverable amounts are recognised when there is objective evidence that Inland Revenue will not be able to collect all amounts due according to the original terms of the receivables. Impairment losses are incurred if, and only if, there is objective evidence of impairment as a result of one or more events that occurred after the initial recognition of the loan and a loss event has an impact on the estimated future cash flows of the loan that can be reliably measured. The amount of the provision is the difference between the asset’s carrying amount and estimated impaired value. The impairment losses are recognised in the Schedule of Expenditure.
Impairment losses can be reversed where there is evidence that the impaired value of the financial asset has increased.
Financial liabilities
Financial liabilities are recognised initially at fair value, less transaction costs. Financial liabilities entered into with a duration of less than 12 months are recognised at their nominal value, unless the effect of discounting is material.
Contingent liabilitiesContingent liabilities are recorded in the Schedule of Contingent Liabilities at the point at which the contingency is evident. Contingent liabilities are disclosed if the possibility that they will crystallise is not remote.
Contingent liabilities arise if a case is still not resolved at the end of the disputes process, Inland Revenue will issue an amended assessment to the taxpayer and recognise revenue. The taxpayer is then able to file proceedings with the Taxation Review Authority or the High Court disputing the assessment. These are recorded in the Schedule of Contingent Liabilities as legal proceedings and disputes – assessed. The contingent liability is the maximum liability Inland Revenue has in respect of these cases.
Unclaimed monies are administered by Inland Revenue under the Unclaimed Money Act 1971.
Contingent assetsContingent assets are recorded in the Schedule of Contingent Assets at the point at which the contingency is evident. Contingent assets are disclosed if it is probable that the benefits will be realised.
Contingent assets arise as part of the tax dispute process, for example, when Inland Revenue has advised a taxpayer of a proposed adjustment to their tax assessment through a notice of proposed adjustment. At this point there has been no amended assessment issued and no revenue has been recognised so these adjustments are recorded in the Schedule of Contingent Assets as legal proceedings and disputes – non-assessed. The taxpayer has the right to dispute this adjustment and a disputes resolution process is entered into. Inland Revenue quantifies a contingent asset based on the likely outcome of the disputes process based on experience and similar prior cases, net of losses carried forward.
Contingent assets can also arise where the taxpayer has not filed an assessment but Inland Revenue believes they are liable for tax. In this situation Inland Revenue will issue an assessment. Where the taxpayer chooses to dispute the Inland Revenue initiated assessment, the assessment is not recognised as revenue and a contingent asset is recorded in the Schedule of Contingent Assets. The value of the asset is based on the assessment, net of losses carried forward.

132 NEW ZEALAND INLAND REVENUE ANNUAL REPORT 2011 ird.govt.nz
ComparativesWhen presentation or classification of items in the financial schedules are amended or accounting policies are changed voluntarily, comparative figures have been restated to ensure consistency with the current period, unless it is impracticable to do so.
Changes in accounting policiesThere have been no changes in accounting policies applicable to the preparation of financial schedules of Crown administered by Inland Revenue. All policies have been applied on a basis consistent with the previous year.

133PART 8 FINANCIAL SCHEDULES – CROWN AS ADMINISTERED BY INLAND REVENUEird.govt.nz
NOTE 1: RECEIVABLESReceivables include general tax receivables, working for families tax credit debt and KiwiSaver debt, and exclude overdue student loan repayments and child support debt.
The recoverable amount of receivables is calculated by forecasting the expected repayments based on analysis of historical debt data, deducting an estimate of service costs and then discounting using an appropriate rate. If the recoverable amount of the portfolio is less than the carrying amount, the carrying amount is reduced to the recoverable amount. Alternatively, if the recoverable amount is more, the carrying amount is increased.
2010–11 2009–10$000 $000
ReceivablesGross receivables 10,969,946 10,337,977
Impairment receivables (4,142,767) (3,918,813)
Carrying value receivables 6,827,179 6,419,164
Current and non-current apportionment Receivables – current 6,484,079 5,945,019
Receivables – non-current 343,100 474,145
Carrying value receivables 6,827,179 6,419,164
Ageing profile of tax receivables – gross
Not due 5,859,550 5,512,152Past due
Less than 6 months 982,436 947,780
6 –12 months 467,202 601,333
1–2 years 1,013,907 1,097,275
Greater than 2 years 2,646,851 2,179,437
Total past due 5,110,396 4,825,825
Total receivables – gross 10,969,946 10,337,977
% Past due 47% 47%
Receivables – impairment Opening balance 3,918,813 3,995,246
Impairment losses recognised 1,009,420 590,397
Amounts written off as uncollectable (785,466) (666,830)
Closing balance 4,142,767 3,918,813
The ageing profile of total past due in this note is based on debt element data that separates each component of a taxpayer’s debt with Inland Revenue. The debt-ageing profile presented in the front of this Annual Report is based on case information which uses a weighted average of debt element information. An individual taxpayer may have multiple debt elements (eg, by tax type, by return period) that are represented within a single debt case.
Receivables are classified as past due when any outstanding revenue is not paid by the taxpayer’s due date. Due dates will vary, depending on the type of revenue outstanding (eg, income tax, GST, KiwiSaver) and the taxpayer’s balance date. Past due debt includes debt collected under instalment, debt under dispute, default assessments and debts of taxpayers who are bankrupt, in receivership or in liquidation. Inland Revenue has debt management policies and procedures in place to actively manage the collection of past due debt.
NOTES TO THE FINANCIAL SCHEDULES

134 NEW ZEALAND INLAND REVENUE ANNUAL REPORT 2011 ird.govt.nz
The estimated recoverable amount of this portfolio and key assumptions underpinning the valuation are:
2010–11 2009–10$000 $000
Recoverable amount of receivables not due 5,825,389 5,462,433Recoverable amount of receivables past due 1,001,790 956,731
Use-of-money-interest rate 8.89% 8.91%
Discount rate 6.10% 8.50%
Impact on the recoverable amount of a 2% increase in discount rate (16,000) (15,000)
Impact on the recoverable amount of a 2% decrease in discount rate 17,000 16,000
The fair value of receivables is not materially different from the carrying value.
Credit risk
In determining the recoverability of receivables Inland Revenue uses information about the extent to which the taxpayer is contesting the assessment and experience of the outcomes of such disputes, from lateness of payment and other information obtained from credit collection actions taken. Due to the size of the tax base the concentration of credit risk is limited and not actively managed.
Under the Tax Administration Act 1994 Inland Revenue has broad powers to ensure that people meet their obligations. Part 10 of the Act sets out the powers of the Commissioner to recover unpaid tax.
The Crown does not hold any collateral or any other credit enhancements over receivables which are past due.
NOTE 2: RECEIVABLES – CHILD SUPPORTThe Crown collects monies from liable parents and remits this to custodial parents. The child support receivable represents penalties which have been incurred as a result of the under-payment of the debt.
Impairment is calculated by forecasting the expected repayments of this penalty debt based on analysis of historical debt data, deducting an estimate of service costs and then discounted.
The concentration of credit risk is limited and this is not a risk that is actively managed. The Crown does not hold any collateral or other credit enhancements over these receivables.
Child support debt, in the main, relates to penalties imposed on liable parents who default on their payments.
Child support penalties grow exponentially due to their compounding nature. The recovery of debt is challenging as 98% of child support debt is greater than two years old. There are limited provisions under child support legislation to remit penalties. The non-recoverability of penalties has been allowed for in the impairment figure.
2010–11 2009–10$000 $000
Receivables – child supportGross receivables 1,742,902 1,430,235
Impairment receivables (1,687,496) (1,406,694)
Total receivables – child support 55,406 23,541
Impairment of receivables – child support
Balance at beginning of the year 1,406,694 1,035,270
Impairment losses recognised 280,802 371,424
Balance at the end of the year 1,687,496 1,406,694

135PART 8 FINANCIAL SCHEDULES CROWN AS ADMINISTERED BY INLAND REVENUEird.govt.nz
NOTE 3: STUDENT LOANS
2010–11 2009–10 $000 $000
Nominal value student loans 10,730,926 9,829,358
Nominal value student loans 10,730,926 9,829,358Adjustment to nominal value (4,040,713) (3,725,107)
Carrying value student loans 6,690,213 6,104,251
Current and non-current apportionment
Student loans – current 706,000 670,000
Student loans – non-current 5,984,213 5,434,251
Carrying value student loans 6,690,213 6,104,251
Movement during the year
Opening balance 6,104,251 5,825,704
Impairment 94,000 (257,200)
Loans transferred from Ministry of Social Development 1,442,129 1,268,435
Fair value write-down on loans transferred from Ministry of Social Development (679,926) (475,447)
Repayments (690,609) (652,022)
Interest unwind 420,368 394,781
Carrying value student loans 6,690,213 6,104,251
Fair value student loans
Opening balance 5,589,600 4,883,300
Loans transferred from Ministry of Social Development 759,000 635,700
Repayments (690,609) (652,022)
Interest unwind 431,000 447,500
Administration costs 24,009 22,322
Change in expense assumption – 35,100
Change in fair value discount rate 221,000 470,700
Impairment 109,000 (253,000)
Fair value student loans 6,443,000 5,589,600

136 NEW ZEALAND INLAND REVENUE ANNUAL REPORT 2011 ird.govt.nz
Student loan valuation modelThe student loan valuation model has been adapted to reflect current student loan policy and macro-economic assumptions. As such, the book value is sensitive to changes in a number of underlying assumptions, including future income levels, repayment behaviour and macro-economic factors such as inflation and the discount rates used to determine the effective interest rate on new borrowers.
The data for the student loan valuation model has been integrated by Statistics New Zealand from files provided by Inland Revenue, Ministry of Social Development and Ministry of Education. The current data is up to 31 March 2010 and contains information on borrowings, repayments, income, educational factors and socio-economic factors amongst others, and has been analysed and incorporated into the valuation model. This integrated data has been supplemented by less detailed, but more recent data to value student loans at balance date. Given the lead time required to compile and analyse the detailed integrated data it is expected that there will always be a lag time between the integrated dataset and balance date. The significant assumptions behind the impaired value and fair value are shown below:
2010–11 2009–10
Carrying value Carrying value ($000) 6,690,213 6,104,251
Effective interest rate 7.11% 7.00%
Interest rate applied to loans for overseas borrowers 6.6%–6.7% 6.7%–6.8%
Consumer Price Index 2.5%–2.8% 2.4%–3.0%
Future salary inflation 3.5%–3.8% 3.0%–3.5%
Fair value is the amount for which the loan book value could be exchanged between knowledgeable, willing parties in an arm’s-length transaction as at 30 June 2011. It is determined by discounting the future cash flows at an appropriate discount rate.
Fair values will differ from carrying values due to changes in market interest rates, as the carrying value is not adjusted for such changes whereas the fair value was calculated on a discount rate that was current at 30 June 2011. At that date, the fair value was calculated on a discount rate of 7.10% whereas a weighted average discount rate of 7.11% was used for the carrying value. The difference between fair value and carrying value does not represent an impairment of the asset.
The comparative figures for the fair value reconciliation in Note 3 and the table below have been restated to include updated information. This is only a disclosure item and has no impact on the financial schedules.
2010–11 2009–10
Fair value Fair value ($000) 6,443,000 5,589,600
Discount rate 7.10% 7.67%
Impact on fair value of a 1% increase in discount rate ($000) (373,000) (320,000)
Impact on fair value of a 1% decrease in discount rate ($000) 426,000 365,400
The Student Loan Scheme Annual Report contains more information on the student loan scheme.
In 2010–11 there was a reversal of impairment of the student loan asset totalling $94.0 million, increasing the value of the student loan asset (in 2009–10 there was an impairment expense of $257.2 million). The current year impairment is mainly driven by the Budget 2011 policy decision to hold the repayment threshold constant. This policy decision increased the forecast future repayments of borrowers resulting in a reversal of impairment. Macroeconomics effects and data and modelling still had an impact this year. Data is still very sensitive to small changes in certain areas as can be seen from the table on page 137.

137PART 8 FINANCIAL SCHEDULES – CROWN AS ADMINISTERED BY INLAND REVENUEird.govt.nz
2010–11 2009–10$000 $000
Sources of impairment Change in demographic profile of participants (21,000) (57,800)
Experience variance (1,000) (23,000)
Interest unwind calculation (1,000) –
Legislative changes 95,000 64,800
Macroeconomic effects 52,000 (29,100)
Repayment threshold calculation (4,000) –
Remaining model and data (26,000) (212,100)
Total sources of impairment 94,000 (257,200)
The remeasurement adjustment portion of the impairment reversal totals ($51.0) million. The Schedule of Expenditure and the note above includes remeasurement adjustments in the impairment figure. However, the Statement of Appropriations excludes remeasurement adjustments.
The remeasurement relates to changes in the macro-economic assumptions used for the valuation of the receivable.
Credit risk
Credit risk is the risk that borrowers will default on their obligation to repay their loans or die before their loan is repaid, causing the scheme to incur a loss.
The student loan scheme does not require borrowers to provide any collateral or security to support advances made. As the total sum advanced is widely dispersed over a large number of borrowers, the student loan scheme does not have any material individual concentrations of credit risk.
The credit risk is reduced by collection of compulsory repayments through the tax system.
Interest rate risk
Interest rate risk is the risk that the value of financial instruments will fluctuate due to changes in interest rates. Changes could impact on the Government’s return on loans advanced. The interest rate and the interest write-off provisions attached to student loans are set by the Government.
NOTE 4: REFUNDABLES AND PAYABLESRefundables and payables are recognised at their nominal value as they are due within 12 months. The nominal value is considered to approximate their fair value.
Taxes refundable represent refunds due to taxpayers as a result of assessments being filed. Refunds are issued to taxpayers once account and refund reviews are complete.
2010–11 2009–10$000 $000
KiwiSaver payable 913,783 871,509 Paid parental leave payable 4,327 3,932 Research and development tax credits payable 95,817 110,280
Taxes refundable 2,723,672 2,223,687
Total refundables and payables 3,737,599 3,209,408

138 NEW ZEALAND INLAND REVENUE ANNUAL REPORT 2011 ird.govt.nz
NOTE 5: UNCLAIMED MONIESUnder the Unclaimed Money Act 1971, entities (eg, financial institutions, insurance companies) hand over money not claimed after six years to Inland Revenue. The funds are repaid to the entitled owner on proof of identification.
NOTE 6: RESERVE SCHEMES2010–11 2009–10
$000 $000
Adverse event income equalisation 108 75 Environmental restoration 51,650 50,892
Income equalisation 175,007 156,152
Total reserve schemes 226,765 207,119
The adverse event income equalisation scheme operates in addition to the income equalisation scheme. Interest at a rate of 6.5% is paid on deposits. Deposits can be withdrawn immediately, but are transferred to the main income equalisation account if not withdrawn within 12 months of the deposit.
The environmental restoration account allows businesses to set aside money to cover restoration costs for monitoring, avoiding, remedying or mitigating the detrimental environmental effects which may occur in later years. Interest at a rate of 3% is paid on the deposit while it is held in the scheme. Payment is made when the environmental restoration costs are incurred.
The income equalisation scheme allows taxpayers in the farming, fishing and forestry industries to make payments during the year by way of income equalisation deposits. Interest is paid at a rate of 3%, provided that no withdrawals are made within 12 months of the date of the deposit.
NOTE 7: ACCIDENT COMPENSATION COLLECTION 2010–11 2009–10 $000 $000
Earner premium – employees – provisional 1,701,367 1,456,017Total accident compensation collection 1,701,367 1,456,017
NOTE 8: EVENTS AFTER BALANCE DATENo events have occurred between the balance date and date of signing these financial schedules that materially affect the financial schedules.

AUDIT REPORT
139 AUDIT REPORT ird.govt.nz

140 NEW ZEALAND INLAND REVENUE ANNUAL REPORT 2011 ird.govt.nz
INDEPENDENT AUDITOR’S REPORTTo the readers of Inland Revenue’s financial statements, non-financial performance information and schedules of non-departmental activities for the year ended 30 June 2011.
The Auditor-General is the auditor of Inland Revenue (the Department). The Auditor-General has appointed me, Ajay Sharma, using the staff and resources of Audit New Zealand, to carry out the audit of the financial statements, the non-financial performance information and the schedules of non-departmental activities of the Department on her behalf.
We have audited:
" the financial statements of the Department on pages 88 to 117, that comprise the statement of financial position, statement of commitments, statement of contingent liabilities and contingent assets as at 30 June 2011, the statement of comprehensive income, statement of changes in equity, statement of departmental expenses and capital expenditure against appropriations, statement of unappropriated expenditure and capital expenditure and statement of cash flows for the year ended on that date and the notes to the financial statements that include accounting policies and other explanatory information;
" the non-financial performance information of the Department that comprises the statement of service performance on pages 57 to 85 and the report about outcomes on pages 10 and 22 to 25; and
" the schedules of non-departmental activities of the Department on pages 120 to 138 that comprise the schedule of assets, schedule of liabilities and schedule of contingent assets and liabilities as at 30 June 2011, the schedule of expenditure, statement of expenditure against appropriations, statement of unappropriated expenditure, schedule of revenue, schedule of trust monies and the schedule of movements between departments for the year ended on that date and the notes to the schedules that include accounting policies and other explanatory information.
OpinionIn our opinion:
" the financial statements of the Department on pages 88 to 117:
• comply with generally accepted accounting practice in New Zealand; and
• fairly reflect the Department’s:
− financial position as at 30 June 2011;
− financial performance and cash flows for the year ended on that date;
− expenses and capital expenditure incurred against each appropriation administered by the Department and each class of outputs included in each output expense appropriation for the year ended 30 June 2011; and
− unappropriated expenses and capital expenditure for the year ended 30 June 2011.
" the non-financial performance information of the Department on pages 10 and 22 to 25 and 57 to 85:
• complies with generally accepted accounting practice in New Zealand; and
• fairly reflects the Department’s service performance and outcomes for the year ended 30 June 2011, including for each class of outputs:
− its service performance compared with the forecasts in the statement of forecast service performance at the start of the financial year; and
− its actual revenue and output expenses compared with the forecasts in the statement of forecast service performance at the start of the financial year.
" the schedules of non-departmental activities of the Department on pages 120 to 138, fairly reflect:
• the assets, liabilities, contingent assets and liabilities as at 30 June 2011 managed by the Department on behalf of the Crown; and
• the revenues, expenditure, expenditure against appropriations, movements between Departments, unappropriated expenditure and trust monies for the year ended on that date managed by the Department on behalf of the Crown.
Our audit was completed on 22 September 2011. This is the date at which our opinion is expressed.

141 AUDIT REPORTird.govt.nz
The basis of our opinion is explained below. In addition, we outline the responsibilities of the Commissioner and our responsibilities, and we explain our independence.
Basis of opinionWe carried out our audit in accordance with the Auditor-General’s Auditing Standards, which incorporate the International Standards on Auditing (New Zealand). Those standards require that we comply with ethical requirements and plan and carry out our audit to obtain reasonable assurance about whether the financial statements, the non-financial performance information and the schedules of non-departmental activities are free from material misstatement.
Material misstatements are differences or omissions of amounts and disclosures that would affect a reader’s overall understanding of the financial statements, the non-financial performance information and the schedules of non-departmental activities. If we had found material misstatements that were not corrected, we would have referred to them in our opinion.
An audit involves carrying out procedures to obtain audit evidence about the amounts and disclosures in the financial statements, the non-financial performance information and the schedules of non-departmental activities. The procedures selected depend on our judgement, including our assessment of risks of material misstatement of the financial statements, the non-financial performance information and the schedules of non-departmental activities, whether due to fraud or error. In making those risk assessments, we consider internal control relevant to the Department’s preparation of the financial statements, the non-financial performance information and the schedules of non-departmental activities that fairly reflect the matters to which they relate. We consider internal control in order to design audit procedures that are appropriate in the circumstances but not for the purpose of expressing an opinion on the effectiveness of the Department’s internal control.
An audit also involves evaluating:
" the appropriateness of accounting policies used and whether they have been consistently applied;
" the reasonableness of the significant accounting estimates and judgements made by the Commissioner;
" the appropriateness of the reported non-financial performance information within the Department’s framework for reporting performance;
" the adequacy of all disclosures in the financial statements, the non-financial performance information and the schedules of non-departmental activities; and
" the overall presentation of the financial statements, the non-financial performance information and the schedules of non-departmental activities.
We did not examine every transaction, nor do we guarantee complete accuracy of the financial statements, the non-financial performance information and the schedules of non-departmental activities. We have obtained all the information and explanations we have required and we believe we have obtained sufficient and appropriate audit evidence to provide a basis for our audit opinion.

142 NEW ZEALAND INLAND REVENUE ANNUAL REPORT 2011 ird.govt.nz
Responsibilities of the CommissionerThe Commissioner is responsible for preparing:
" financial statements and non-financial performance information that:
• comply with generally accepted accounting practice in New Zealand;
• fairly reflect the Department’s financial position, financial performance, cash flows, expenses and capital expenditure incurred against each appropriation and its unappropriated expenses and capital expenditure; and
• fairly reflect its service performance and outcomes;
" schedules of non-departmental activities, in accordance with the Treasury Instructions 2010 that fairly reflect those activities managed by the Department on behalf of the Crown.
The Commissioner is also responsible for such internal control as is determined is necessary to enable the preparation of financial statements, non-financial performance information and schedules of non-departmental activities that are free from material misstatement, whether due to fraud or error.
The Commissioner’s responsibilities arise from the Public Finance Act 1989.
Responsibilities of the AuditorWe are responsible for expressing an independent opinion on the financial statements, the non-financial performance information and the schedules of non-departmental activities and reporting that opinion to you based on our audit. Our responsibility arises from section 15 of the Public Audit Act 2001 and the Public Finance Act 1989.
IndependenceWhen carrying out the audit, we followed the independence requirements of the Auditor-General, which incorporate the independence requirements of the New Zealand Institute of Chartered Accountants.
Other than the audit, we have no relationship with or interests in the Department.
Ajay Sharma Audit New Zealand On behalf of the Auditor-General Wellington, New Zealand

143 AUDIT REPORTird.govt.nzird.govt.nz
Matters relating to the electronic presentation of the audited financial statements, statement of service performance and schedules of non-departmental activitiesThis audit report relates to the financial statements, statement of service performance and schedules of non-departmental activities of the Inland Revenue for the year ended 30 June 2011 included on the Inland Revenue’s website. The Inland Revenue’s Chief Executive is responsible for the maintenance and integrity of the Inland Revenue’s website. We have not been engaged to report on the integrity of the Inland Revenue’s website. We accept no responsibility for any changes that may have occurred to the financial statements, statement of service performance and schedules of non-departmental activities since they were initially presented on the website.
The audit report refers only to the financial statements, statement of service performance and schedules of non-departmental activities named above. It does not provide an opinion on any other information which may have been hyperlinked to or from the financial statements, statement of service performance and schedules of non-departmental activities. If readers of this report are concerned with the inherent risks arising from electronic data communication they should refer to the published hard copy of the audited financial statements, statement of service performance and schedules of non-departmental activities as well as the related audit report dated 22 September 2011 to confirm the information included in the audited financial statements, statement of service performance and schedules of non-departmental activities presented on this website.
Legislation in New Zealand governing the preparation and dissemination of financial information may differ from legislation in other jurisdictions.

145 ADDITIONAL INFORMATION ird.govt.nz
ADDITIONAL INFORMATION

146 NEW ZEALAND INLAND REVENUE ANNUAL REPORT 2011 ird.govt.nz
FIGURE A – COMPONENTS OF OVERDUE DEBT BY TAX TYPES (AT JUNE 2011)
Debt type $million
Income tax
GST PAYE Student loans
Working for
Families
Other tax
Total debt
1 Year change
1 Year change
(%)
Total debt cases
Non-collectable debt
Deferred $542.1 $113.8 $21.2 $0.7 $1.7 $7.1 $686.6 –$43.2 –6% 1,524
Insolvency $161.4 $377.5 $160.6 $0.4 $0.3 $17.6 $717.7 –$24.0 –3% 2,889
Pending write-off $144.1 $80.7 $21.5 $46.3 $10.7 $4.5 $307.7 $114.9 60% 9,220
Total non-collectable debt $847.6 $571.9 $203.3 $47.4 $12.7 $29.1 $1,711.9 $47.6 3% 13,633
Collectable debt
Instalments $418.6 $367.1 $116.9 $107.6 $126.3 $10.2 $1,146.6 $208.9 22% 174,811
Residual collectable debt $941.6 $969.5 $302.5 $256.7 $136.1 $57.1 $2,663.5 $114.9 5% 201,503
Total collectable debt $1,360.2 $1,336.6 $419.3 $364.3 $262.4 $67.3 $3,810.2 $323.9 9% 376,314
Total debt $2,207.8 $1,908.5 $622.6 $411.7 $275.1 $96.4 $5,522.1 $371.5 7% 389,947
1 year change $49.7 $99.1 $90.3 $87.0 $36.7 $8.7 $371.5 – – 26,133
1 year change (%) 2% 5% 17% 27% 15% 10% 7% – – 7%
Collectable debt/total debt 62% 70% 67% 88% 95% 70% 69% – – 97%
Instalment debt/total debt 19% 19% 19% 26% 46% 11% 21% – – 45%
Customers with debt 167,113 104,804 31,905 100,225 70,241 25,378 n/a – – –
* A customer may have more than one overdue tax type within their Inland Revenue debt case, so they may be represented under more than one tax type.
** Due to rounding, some figures in this table differ from other parts of this report.

147 ADDITIONAL INFORMATIONird.govt.nz
FIGURE B – AGE AND VALUE OF OVERDUE DEBT (AT JUNE 2011)
Case value and case weighted age bands
Debt type ($million) Debt cases
0–6 months
6–12 months
1–2 years
> 2 years
Total 0–6 months
6–12 months
1–2 years
> 2 years
Total
Non-collectable debt
< $1K $0.3 $0.1 $0.2 $0.3 $0.8 787 221 709 639 2,356
$1K–$5K $1.1 $0.7 $1.5 $3.7 $7.1 474 256 640 1,367 2,737
$5K–$10K $0.9 $0.7 $4.4 $4.4 $10.4 130 97 681 608 1,516
$10K–$50K $3.4 $4.6 $35.4 $37.7 $81.2 159 192 1,975 1,542 3,868
$50K–$100K $2.7 $4.8 $19.5 $45.1 $72.1 38 69 265 625 997
$100K–$500K $8.1 $17.6 $102.6 $228.1 $356.4 35 77 458 1,050 1,620
$500K–$1million $9.4 $8.0 $53.3 $131.8 $202.5 13 11 78 190 292
>$1million $56.8 $73.6 $120.1 $730.9 $981.4 15 16 49 167 247
Total non-collectable debt $82.7 $110.1 $337.2 $1,181.9 $1,711.9 1,651 939 4,855 6,188 13,633
Collectable debt
< $1K $27.7 $3.6 $7.6 $5.2 $44.2 99,991 12,732 25,743 13,416 151,882
$1K–$5K $130.5 $29.8 $50.2 $63.0 $273.4 56,910 11,195 19,295 23,191 110,591
$5K–$10K $82.5 $40.1 $110.9 $86.4 $319.9 12,024 5,674 16,500 12,040 46,238
$10K–$50K $181.2 $143.3 $343.5 $438.8 $1,106.9 9,371 6,767 19,134 19,241 54,513
$50K–$100K $68.2 $66.5 $132.9 $270.3 $538.0 991 962 1,897 3,895 7,745
$100K–$500K $112.0 $123.2 $279.1 $368.0 $882.3 602 665 1,522 2,144 4,933
$500K–$1million $32.1 $22.2 $58.3 $67.8 $180.4 46 35 84 98 263
>$1million $87.3 $34.7 $67.9 $275.2 $465.1 27 15 33 74 149
Total collectable debt $721.5 $463.4 $1,050.5 $1,574.8 $3,810.2 179,962 38,045 84,208 74,099 376,314
Total debt $804.2 $573.5 $1,387.7 $2,756.7 $5,522.1 181,613 38,984 89,063 80,287 389,947
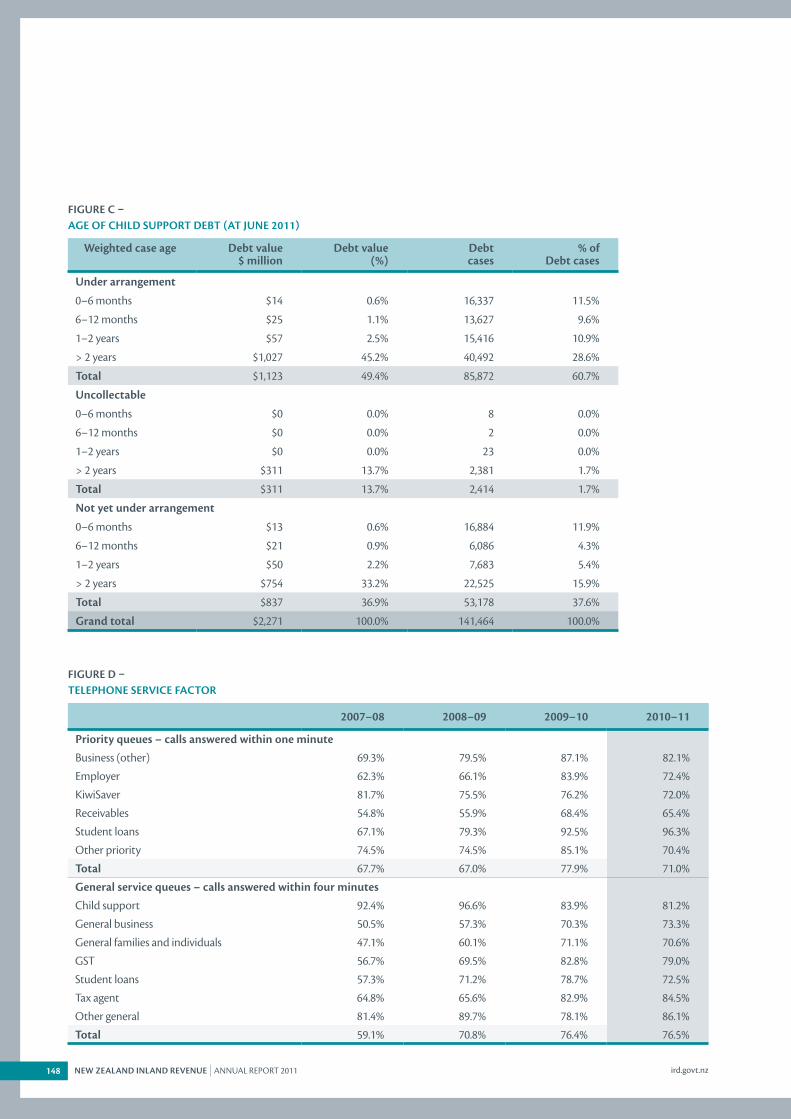
148 NEW ZEALAND INLAND REVENUE ANNUAL REPORT 2011 ird.govt.nz
FIGURE C – AGE OF CHILD SUPPORT DEBT (AT JUNE 2011)
Weighted case age Debt value $ million
Debt value (%)
Debt cases
% of Debt cases
Under arrangement
0–6 months $14 0.6% 16,337 11.5%
6–12 months $25 1.1% 13,627 9.6%
1–2 years $57 2.5% 15,416 10.9%
> 2 years $1,027 45.2% 40,492 28.6%
Total $1,123 49.4% 85,872 60.7%
Uncollectable
0–6 months $0 0.0% 8 0.0%
6–12 months $0 0.0% 2 0.0%
1–2 years $0 0.0% 23 0.0%
> 2 years $311 13.7% 2,381 1.7%
Total $311 13.7% 2,414 1.7%
Not yet under arrangement
0–6 months $13 0.6% 16,884 11.9%
6–12 months $21 0.9% 6,086 4.3%
1–2 years $50 2.2% 7,683 5.4%
> 2 years $754 33.2% 22,525 15.9%
Total $837 36.9% 53,178 37.6%
Grand total $2,271 100.0% 141,464 100.0%
FIGURE D – TELEPHONE SERVICE FACTOR
2007–08 2008–09 2009–10 2010–11
Priority queues – calls answered within one minuteBusiness (other) 69.3% 79.5% 87.1% 82.1%
Employer 62.3% 66.1% 83.9% 72.4%
KiwiSaver 81.7% 75.5% 76.2% 72.0%
Receivables 54.8% 55.9% 68.4% 65.4%
Student loans 67.1% 79.3% 92.5% 96.3%
Other priority 74.5% 74.5% 85.1% 70.4%
Total 67.7% 67.0% 77.9% 71.0%
General service queues – calls answered within four minutesChild support 92.4% 96.6% 83.9% 81.2%
General business 50.5% 57.3% 70.3% 73.3%
General families and individuals 47.1% 60.1% 71.1% 70.6%
GST 56.7% 69.5% 82.8% 79.0%
Student loans 57.3% 71.2% 78.7% 72.5%
Tax agent 64.8% 65.6% 82.9% 84.5%
Other general 81.4% 89.7% 78.1% 86.1%
Total 59.1% 70.8% 76.4% 76.5%

149 ADDITIONAL INFORMATIONird.govt.nz
FIGURE E – EMPLOYEE DISTRIBUTION BY BUSINESS UNIT
Business unit Number of staff
Service delivery 4,370 (77%)
Information design and systems 604 (11%)
Corporate services 479 (8%)
Policy advice 104 (2%)
Office of the Chief Tax Counsel 73 (1%)
Business transformation 15 (0%)
Note: The full-time equivalent (FTE) total is larger than sum of business units because two FTEs report to the Commissioner rather than to a specific business unit.
FIGURE F – EEO STATISTICS BY ETHNICITY
Business unit Number of staff
New Zealand European/Pākehā 2,477
European 380
Māori 433
Asian 493
Pacific peoples 199
Other 45
Not specified 1,952
Note: Includes full-time and part-time equivalent staff.
FIGURE G – HISTORICAL EXPENDITURE ON CONSULTANTS AND CONTRACTORS
2006–07 $ 000
2007–08 $ 000
2008–09 $ 000
2009–10 $ 000
2010–11 $ 000
Expenditure on consultants and contractors 50,378 70,688 59,232 30,829 35,173% of total operating expenditure 9.5% 11.6% 9.0% 5.1% 5.5%
% of total capital and operating expenditure 8.3% 9.8% 8.2% 4.7% 5.2%

150 NEW ZEALAND INLAND REVENUE ANNUAL REPORT 2011 ird.govt.nz
FIGURE H – EXPENDITURE ON CONSULTANTS AND CONTRACTORS
2009–10 2010–11Actual Actual
$ 000 $ 000
13,559 Information technology 14,8297,922 Specialist advice and project management 13,127
943 HR and change management services 744
1,941 Tax issues 780
4,419 Property 2,936
1,294 Research 1,660
155 Communications 257
596 Other 839
30,829 Total consultants and contractors 35,173
FIGURE I – PROPERTY INFORMATION (AT 30 JUNE)*
2007 2008 2009 2010 2011
Accommodation area (m2) 111,131 133,193 122,345 121,496 121,481**
Other area (m2) 6,864 7,720 5,764 5,147 5,519
Total area leases (m2) 117,995 140,913 128,109 126,643 127,000
Vacant accommodation (m2) 0 0 4,407 719 13,862***
Vacant as a % of total 0.0% 0.0% 3.4% 0.6% 10.9%
Average space occupied per person (m2) 19.1 21.5 18.8 21.1 18.5
Annual rental per person ($) 4,437 4,903 5,231 5,446 5,909
Utility costs per person ($) 874 916 906 939 857
Occupancy cost per person ($) 5,311 5,819 6,136 6,385 6,766
Notes
* Some data for prior periods has been revised.
** Includes Inland Revenue’s main building in Christchurch, which is presently unoccupied due to the earthquakes. It does not include other temporary accommodation that is presently being used in Christchurch.
*** Relates to changes in 2010–11, including leaving buildings in Wellington as part of the long-term accommodation solution. 95% of the vacant leases are due to expire within the next year.


