69
ANNUAL REPORT 2011
| Date post: | 21-Dec-2015 |
| Category: |
Documents |
| Upload: | kristi-duran |
| View: | 213 times |
| Download: | 0 times |

ANNUAL REPORT 2011
Our Business 1
Group Financial Highlights 3
Corporate Board 5
Group Chairman’s Report 6
Group Managing Director’s Report 8
Corporate Governance Report 10
Independent Auditor’s Report 17
Consolidated Statement ofComprehensive Income 18
Consolidated Statement ofCash Flows 19
Consolidated Statement of Financial Position 20
Consolidated Statement of Changes in Equity 21
Notes To The Consolidated Financial Statements 22
Analysis of Ordinary Shares 61
Shareholder’s Financial Calendar 62
Notice to Members 63
Form of Proxy 65
Corporate Information 67
Con
tent
s
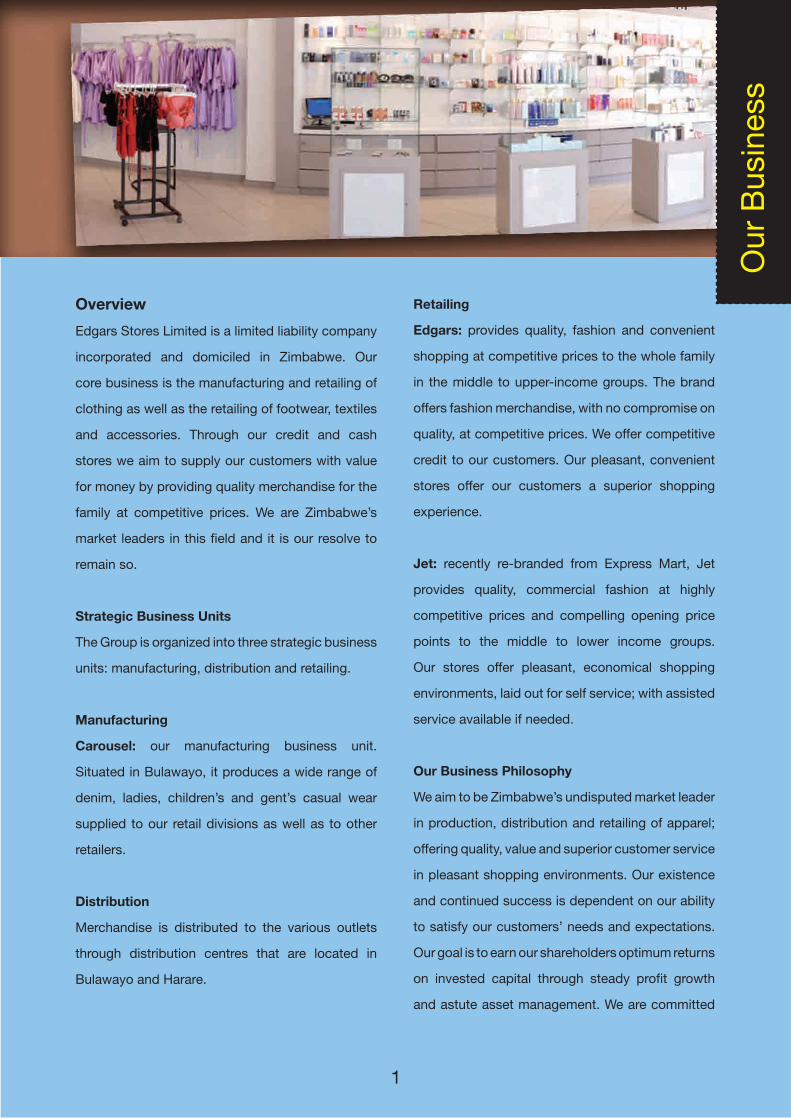
Retailing
Edgars: provides quality, fashion and convenient
shopping at competitive prices to the whole family
in the middle to upper-income groups. The brand
offers fashion merchandise, with no compromise on
quality, at competitive prices. We offer competitive
credit to our customers. Our pleasant, convenient
stores offer our customers a superior shopping
experience.
Jet: recently re-branded from Express Mart, Jet
provides quality, commercial fashion at highly
competitive prices and compelling opening price
points to the middle to lower income groups.
Our stores offer pleasant, economical shopping
environments, laid out for self service; with assisted
service available if needed.
Our Business Philosophy
We aim to be Zimbabwe’s undisputed market leader
in production, distribution and retailing of apparel;
offering quality, value and superior customer service
in pleasant shopping environments. Our existence
and continued success is dependent on our ability
to satisfy our customers’ needs and expectations.
Our goal is to earn our shareholders optimum returns
on invested capital through steady profit growth
and astute asset management. We are committed
Overview
Edgars Stores Limited is a limited liability company
incorporated and domiciled in Zimbabwe. Our
core business is the manufacturing and retailing of
clothing as well as the retailing of footwear, textiles
and accessories. Through our credit and cash
stores we aim to supply our customers with value
for money by providing quality merchandise for the
family at competitive prices. We are Zimbabwe’s
market leaders in this field and it is our resolve to
remain so.
Strategic Business Units
The Group is organized into three strategic business
units: manufacturing, distribution and retailing.
Manufacturing
Carousel: our manufacturing business unit.
Situated in Bulawayo, it produces a wide range of
denim, ladies, children’s and gent’s casual wear
supplied to our retail divisions as well as to other
retailers.
Distribution
Merchandise is distributed to the various outlets
through distribution centres that are located in
Bulawayo and Harare.
Our
Bus
ines
s
1

Customers
We will be the retailer of choice by ensuring superior
ranges, value for money, excellent service and
convenient, pleasant shopping environments.
Employees
We want to be regarded as the preferred equal
opportunity employer, offering competitive working
conditions that help us attract, develop and retain
creative, skilled people who are highly motivated.
Investors
We will deliver economic value through the sustained
real earnings growth, achieved through deliberate
market dominance of Zimbabwe’s clothing sector.
Suppliers
We aim to achieve synergies through win-win
partnerships based on honesty and integrity.
Community
We will be a socially responsible and caring corporate
citizen committed to the highest standards of
professionalism and ethical behaviour.
2
to honesty and integrity in all relationships. We are
demanding, but fair, and evaluate our suppliers on
the basis of quality, price and service.
We support local industry wherever we can do
so competitively in terms of price and quality. We
recognise our role in society and support worthwhile
projects, particularly of a charitable or conservation
nature.
Management Philosophy
The demands of our business are such that
success will only come from the dedication of
our employees. Participative management lies
at the heart of a strategy which relies on building
employee partnerships at every level, to foster
mutual trust and to encourage people to think
always about how they can do things better. We
incentivize outstanding performance.
Mission Statement
The Edgars Group’s mission is to create and
enhance stakeholder value, as follows:
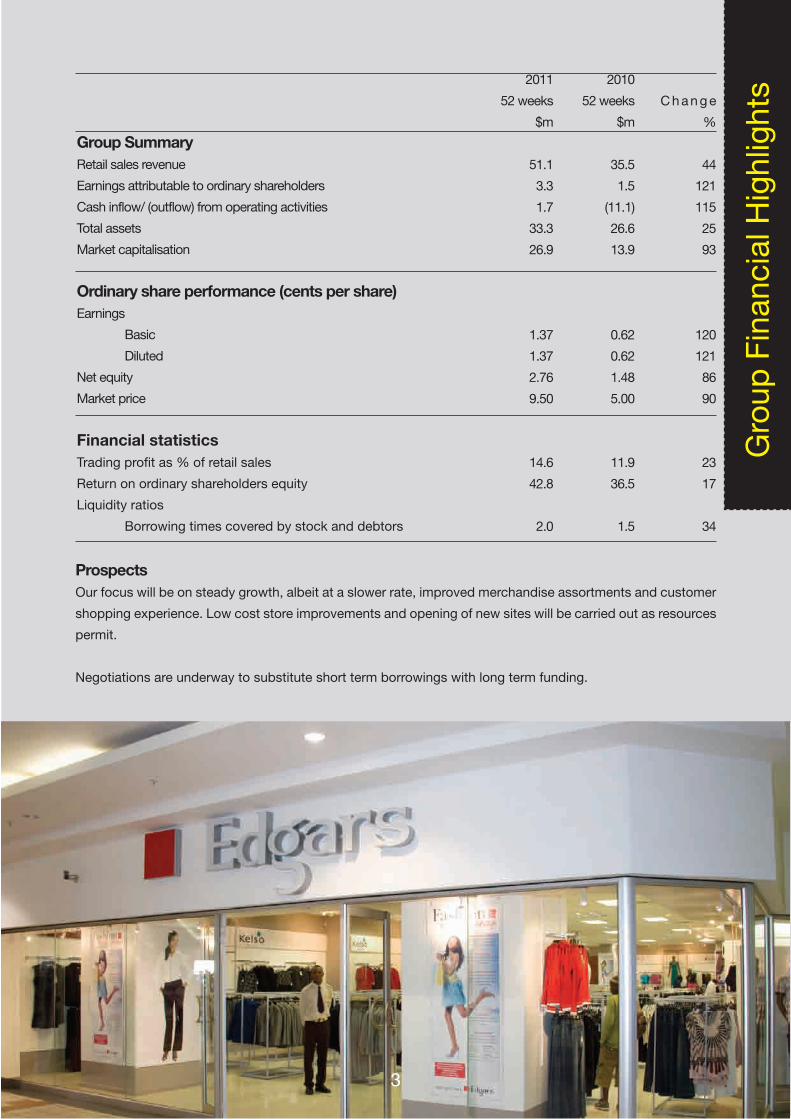
2011
52 weeks
$m
51.1
3.3
1.7
33.3
26.9
1.37
1.37
2.76
9.50
14.6
42.8
2.0
Group SummaryRetail sales revenue
Earnings attributable to ordinary shareholders
Cash inflow/ (outflow) from operating activities
Total assets
Market capitalisation
Ordinary share performance (cents per share)Earnings
Basic
Diluted
Net equity
Market price
Financial statisticsTrading profit as % of retail sales
Return on ordinary shareholders equity
Liquidity ratios
Borrowing times covered by stock and debtors
ProspectsOur focus will be on steady growth, albeit at a slower rate, improved merchandise assortments and customer
shopping experience. Low cost store improvements and opening of new sites will be carried out as resources
permit.
Negotiations are underway to substitute short term borrowings with long term funding.
2010
52 weeks
$m
35.5
1.5
(11.1)
26.6
13.9
0.62
0.62
1.48
5.00
11.9
36.5
1.5
C h a n g e
%
44
121
115
25
93
120
121
86
90
23
17
34
Gro
up F
inan
cial
Hig
hlig
hts
3

4
Cor
pora
te B
oard
Executive Directors
Linda Masterson (56) FCIS
Group Managing Director
Joined the company in 1988
Appointed to the Board in 1991
Appointed Group Managing Director
in April 2010
Vusumuzi Mpofu (44) ACMA, FCIS,
RP Acc (Z)
Group Finance Director & Company
Secretary
Joined the company in 2000
Appointed to the Board in 2008
Zebhediah Vella (54) BA Hons.
Accountancy and Economics
Group Manufacturing &
Operations Director
Joined the company in 1989
Appointed to the Board in 1999
Shepherd Ndlovu (60) BA Hons
Group Human Resources Director
Joined the company in 1990
Appointed to the Board in 1995
Non- Executive
Themba N. Sibanda (57)
B.Acc (Z), C.A. (Z)
Chairman
Appointed to the Board in 2003
Canaan F. Dube* (55)
LLB (Hons), LLB, MBA
Appointed to the Board in 2004.
Dr. Leonard. L.Tsumba* (68)
Phd, M.A, BSBA
Appointed to the Board in 2006.
Raymond Mlotshwa (61) BA
Joined the company in 1981.
Appointed to the Board in 1998.
Appointed Group Managing Director in
September 1999
Retired 31 March 2010
Appointed non-executive director in
April 2010
5
Member of Remuneration Committee
* Member of the Audit Committee

The steady growth in accounts, improved
merchandise assortments and improved cost
management together with the successful re-
branding of Express to Jet in November ensured
that targets were met.
PerformanceOn the back of credit, Edgars Chain units grew 23%
whilst margins were slightly up at 53.1%. Chain
trading profit grew 37.3% as a result of improved
profitability and the sale of higher value branded
items.
Express began the year with high stock holdings
and stiff competition from cheap imports. A total
of 9 Express stores were rebranded to Jet in
November. Unit sales in the chain increased 16.4%
compared to last year. Chain profitability grew
194% as the expenses to sales ratio improved
3.9% and margins slightly increased to 42%.
Our manufacturing unit incurred a loss. Focus
is on obtaining affordable funding to augment
improvements made in productivity to date. Exports
are being pursued despite difficulties encountered
in the market. We are striving for a breakeven
position in 2012 at the factory.
The overall group trading profit improved 77%
to $7,5million. Finance costs rose by 38%. This
should improve in the coming year as borrowing
costs fell from 18,2% at the beginning of the year
to 14,55% at year end. Profit after tax grew 121%.
Cash generated from operations was $1,7million, a
$12,8million turnaround.
Credit ManagementAccounts grew by 42.9%. The active book stood at
81%. Collection rates and other key indicators have
remained satisfactory. Bad and doubtful debts are
fully provided for while net handovers for the year
averaged 0.4% of lagged debtors.
AppreciationOn behalf of the board I wish to congratulate the
management and staff of Edgars for working as a
team to achieve a sterling set of results.
OutlookThe recent liquidity crisis in the banking sector
and economy is of concern. Our focus will be on
steady growth, albeit at a slower rate, improved
merchandise assortments and customer shopping
experience. Low cost store improvements and
opening of new sites will be carried out as resources
permit.
Negotiations are underway to substitute short term
borrowings with long term funding.
By order of the board.
TN Sibanda
Non-Executive Chairman
7 March 2012
Gro
up C
hairm
an’s
Rep
ort
6

Gro
up M
anag
ing
Dire
ctor
s R
epor
t
7

OverviewInternational market movements were determined
largely by the crisis in the Euro zone which affected
commodity prices and the movement in the rand. At the
beginning of the year, economists predicted that the
rand would fall as low as 12 by the end of the year.
However after it only fell to 8.4 and then strengthened,
forecasts were revised to a more conservative rate
of 8.
As a net importer, with no significant foreign direct
investment, the country’s liquidity problems
worsened to the extent that, by year end,
financial institutions were struggling to make
payments timeously. The situation worsened
when NSSA withdrew funds from the market.
In order to fulfill market expectation the Reserve
Bank Governor issued a statement which spelt
out measures intended to improve the situation.
However, in the absence of the right solutions to
the real underlying problems, the lack of liquidity
will continue to constrain economic growth.
From a retail perspective, the liquidity crunch could
not have happened at a worse time. Civil servants’
bonuses, traditionally paid in November, were
delayed until a few trading days before Christmas.
With the compounding effect of the 22nd being a
bank holiday, customers struggled to withdraw cash
and ran out of time to do their Christmas shopping. In
addition, many other employers failed to pay a bonus
and others were still catching up on salary arrears.
StrategyOur strategic objectives remained clear:
To obtain cheaper funding with longer tenures:
To increase productivity: We resolved to do this
by growing the top-line through credit growth,
whilst keeping a guard on spending.
To continuously improve standards: Our store
appearance needed improvement as did our
merchandise assortments through imports;
helping local suppliers to improve their styling
and finishing; and introducing more brands to
our customers.
In order to align our processes to our strategy, a large
management team met in November 2010 and signed
up to these objectives.
FinancingWe opened the year with borrowings of $15,7million
at 18%. Determined to reduce the cost of
borrowings, we pursued financiers and secured a
2-year loan early in the year. A Ministry of Finance
directive limiting interest rates on NSSA funds to
15% also assisted but, as liquidity worsened, rates
increased again as banks adopted a “take-it-or-
leave-it” attitude.
With cash generated in operations improving
$12,8million we were able to reduce borrowings
minimally to $15,65million at an average December
interest rate of 14.55%. We are working on a deal
that would see a further improvement in rates and
tenures.
StaffingThe Group retained all key personnel during the
year. As part of measures to improve standards we
reassigned Mr. V. Mpofu to the previously vacant
position of Group Operations Director and employed
three people to the positions of IT Executive, Group Credit Executive and Group Finance Director.
“At the beginning of the year, economists predicted that the rand would fall as low as 12 by the end of the year. However after it only fell to 8.4 and then strengthened, forecasts were revised to a more conservative rate of 8.”
Gro
up M
anag
ing
Dire
ctor
’s R
epor
t
8
The Group continued to enjoy harmonious industrial
relations. Staff morale was good throughout the
year as staff worked together to achieve strategic
objectives.
As well as focusing on performance-based systems
aligning staff activities to our strategy, training
continues to be a key focus.
OperationsOur biggest initiative this year was the launch of Jet.
Although our customers had grown accustomed to
the Express brand we believed that we could achieve
more by rebranding the chain to Jet. Zimbabweans
became accustomed to Jet stores in neighboring
countries during the years when local stores were
empty and, consequently, the brand had a strong
following among our customers. In November we
launched 9 Jet stores just in time for Christmas
trading. The move paid off and the excitement and
sales were a confirmation that the rebranding had
been the right decision. Year on year, unit sales in the
chain grew 16.4% and profitability increased 194%.
In the Edgars chain, a new Joina Centre store was
opened during the year with modern fixtures and
merchandised to top regional standards. New
brands launched included Ladies Charter Club,
Soviet, Levi, Polo, Amali, Free2bu, Faithwear, Jeep,
Puma, Hitec, Guess and Lee Cooper. Stores also
received the first input of cell phones in December.
On the back of credit, dollar sales grew by 47.6%
while unit sales were 23.4% up on last year.
During the year we successfully negotiated for
extended payment terms with a number of the
suppliers, and generally improved relationships
and built confidence. We worked with local
manufacturers to improve product quality but
note with concern that their struggles are largely
due to the use of outdated equipment and a
lack of cheap funding. This has made it difficult
for them to operate profitably. These challenges
exist in our own manufacturing division and our
focus is on obtaining cheap funding to augment
improvements made in productivity and to
purchase equipment aimed at improving quality.
CreditThe credit business in Zimbabwe is highly competitive. Our credit offering for most of the year was a six-month, five installment offering. For Christmas trading we moved this to a seven-month, six installments offering, which our competitors swiftly followed. Despite competition, the number of accounts grew 42.9% to 158 901. Active accounts were 81% at year end. Our debtors’ book has grown 127% over the last three years to $18,6million. Collections and other key debtors’ ratios remained satisfactory whilst net handovers for the year averaged 0.4% of lagged debtors.VIP account numbers reached 5,000 by the end of
the year.
Social responsibilityOur main focus was on supporting sport
and education in schools. We also gave
towards charities and ecological endeavors.
Donations in the form of sporting equipment, trophies,
stationery, discount vouchers and cash were made
to schools, teachers colleges and universities.
OutlookIn the absence of a lasting solution to the liquidity
crisis, growth will be constrained. Wage demands
and lack of disposable income are increasingly
being exacerbated by the micro-financing of
customers. Mindful of this, the group will continue
with low-cost store improvements and opening of
new sites as resources permit. Our focus will be
on steady growth, refined merchandise assortment
and improving the customer shopping experience.
AppreciationI wish to congratulate the management and staff
of Edgars for their outstanding performance and
thank them for their enthusiastic support.
I would like to thank my fellow board members for
their guidance and encouragement. I also extend my
gratitude to the shareholders, financiers, suppliers
and landlords that have supported our efforts.
Linda Masterson Group Managing Director
7 March 2012
9
The Board of Directors accepts accountability for
the transparent governance of Edgars Stores
Limited. Governance of the Group is managed
and monitored by a unitary Board of Directors,
assisted by committees of the Board. The Directors
believe that they have applied and complied with
the principles incorporated in the principles for
Corporate Governance in Zimbabwe – Manual of
Best Practice, Code of Corporate Practices and
Conduct as set out in the King Report. The Board’s
responsibilities are well defined and adhered to.
The Board’s primary responsibilities, based on a
predetermined assessment of materiality include
amongst others:
evaluating and reviewing the Group strategic
direction;
identifying, considering and reviewing key
risk areas and relevant responses as well
as key performance indicators;
monitoring investment decisions;
considering significant financial matters;
reviewing the performance of executive
management against business plans, budgets
and industry standards;
monitoring the stewardship of the Group;
ensuring that a comprehensive system of
policies and procedures is operational;
ensuring ethical behaviours and compliance
with relevant laws and regulations, audit
and accounting principles and the Group’s
internal governing documents and codes of
conduct;
and evaluate on a regular basis, economic,
political, social and legal issues, as well as any
other relevant external matters that may
influence or affect the development of the
business or the interest of the share owners
and, if appropriate taking external advice.
It should be noted that, when terminology such as
“ensure” or “review” are used to describe the duties
of the Board or its Committees, it does not mean
the Board or Committee Members actually get
involved in the detailed activities. Rather members
of the Board or Committee rely on reports from
management and the internal and external auditors
and then obtain their own desired levels of comfort
and assurance through query and discussion.
The BoardThe size of the Board is dictated by the Articles
of Association, which permit a maximum of
twelve directors. Currently the Board is chaired
by an independent non-executive director Mr. T.N.
Sibanda and consists of four executive and four
non-executive directors.
The names and credentials of the directors in office
at 31 December 2011 are detailed on page 5. Non-
executive directors introduce an independent view
to matters under consideration and add to the
breadth and depth of experience of the Board. All
the non-executive directors are considered to be
independent in character and judgment. Adequate
‘directors and officers’ insurance cover has been
purchased by the company to meet any material
claims against directors. No claims under the
relevant policy were lodged during the year under
review.
Board meetings are held at least quarterly and
whenever else circumstances necessitate. Directors
are invited to add items to the agendas for Board
meetings. Details of meetings held during the
2011 financial period and attendance at each are
contained on page 11.
Board CommitteesSpecific responsibilities have been delegated
to board committees with defined terms of
reference. The current board committees are:
Audit CommitteeThe Audit Committee continuously evaluates the
Group’s exposure and response to significant risk,
reviews the appropriateness and adequacy of the
systems of internal financial and operational control;
reviews and evaluates accounting policies and
financial information issued to the public, ensures
effective communication between directors,
management, internal and external auditors,
reviews the performance of the internal and
external auditors, recommends the appointment
of the external auditors and determines their fees.
Cor
pora
te G
over
nanc
e R
epor
t
1010
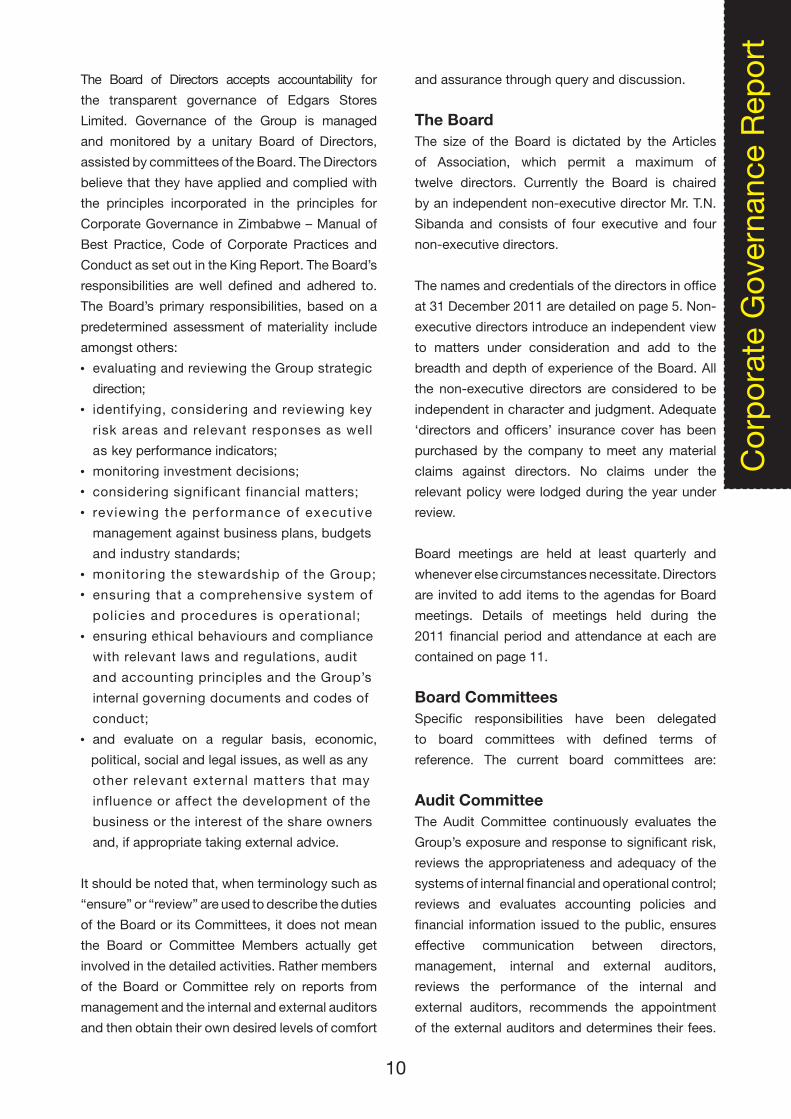
Board AttendanceT.N. Sibanda*
C.F. Dube*
L.L. Tsumba*
R. Mlotshwa*
L. Masterson
S. Ndlovu
Z. Vella
V. Mpofu
March 2011 Jun 2011 Sept 2011 Dec 2011
Key: *Non-Executive Director - no meeting √ - attended x - did not attend
11
The Audit Committee comprises two non-executive
directors whose details are provided on page 5.
Mr. C. Dube chairs the Committee and the other
member is Dr. L.L. Tsumba. The Group Managing
Director and Group Finance Director are required
to attend all meetings of the Committee as invitees.
The External Auditors and Head of Group Internal
Audit also attend the meetings.
AuditC.F. Dube*
L.L. Tsumba*
March 2011 Jun 2011 Sept 2011 Nov 2011
Remuneration March 2011 Jun 2011 Sept 2011 Nov 2011T.N. Sibanda*
C.F. Dube*
L.L. Tsumba*
Remuneration CommitteeThis Committee’s function is to approve a broad
remuneration strategy for the Group and to
ensure that directors and senior executives are
adequately remunerated for their contribution to
operating and financial performance, in terms of
base pay as well as short and long-term incentives.
Key: *Non-Executive Director - no meeting √ - attended x - did not attend
Attendance at board committee meetings was as follows:
12
Accountability and AuditThe Board of Directors is responsible for the Group’s
system of internal control. Responsibility for the
adequacy, extent and operations of these systems
is delegated to the executive directors. To fulfill this
responsibility, management maintains accounting
records and has developed, and continues to
maintain, appropriate systems of internal control.
The Directors report that the Group’s internal
controls and systems are designed to provide
reasonable, but not absolute, assurance as to the
integrity and reliability of the financial statements, to
safeguard, verify and maintain accountability of its
assets and to detect and minimize fraud, potential
liability, loss and material misstatement, while
complying with applicable laws and regulations.
The systems of internal control are based on
established organisational structures together with
written policies and procedures, including budgetary
and forecasting disciplines and the comparison of
actual results against these budgets and forecasts.
The Directors have satisfied themselves that
these systems and procedures are implemented,
maintained and monitored by appropriately
trained personnel with suitable segregation of
authority, duties and reporting lines and, where
appropriate, by the comprehensive use of advanced
computer hardware and software technologies.
Directors and employees are required to maintain
the highest ethical standards as outlined in the
Group’s Code of Ethics, to ensure that business
practices are conducted in a manner which in all
reasonable circumstances is above reproach.
The effectiveness of the systems of internal
control in operation is monitored continually
through reviews and reports from senior
executives and the internal and external auditors.
Internal AuditThe Edgars Group Internal Audit operates in terms of
the Audit Committee’s approved charter to provide
management with an independent, objective
consultancy and assurance service that reviews
matters relating to control, risk management,
corporate governance and operational efficiency.
The committee’s responsibility is to independently
assess and appraise the systems of internal
control and the policies and procedures of the
Group, in order to monitor how adequate and
effective they are in ensuring the achievement of
organisational objectives, the relevance, reliability
and integrity of management and financial
information, whether resources are being used
economically, effectively and efficiently, the
safeguarding of assets, compliance with relevant
policies, procedures, laws and regulations; and
prevention of waste, extravagance and fraud.
The Internal Audit Department reports directly
to the Audit Committee but is the responsibility
of the Group Financial Director on day-to-day
12

matters. Significant reports are copied to the Group
Managing Director as well as to the Chairman of
the Audit Committee and there is regular two-way
communication between the Group Managing
Director and the Head of Group Internal Audit.
All Edgars business operations and support
functions are subject to an internal audit. The Audit
Committee approves the annual audit plans, which
are based on an annual Group Risk Assessment.
Internal audits are conducted according to the
professional standards of the Institute of Internal
Auditors. The Group Internal Audit also facilitates
the management of risk in order to maintain a
high profile of the Group’s risk management
process without assuming responsibility for risk
management; this being the responsibility of
the Board. Group Internal Audit also conducts
independent investigations in cases of fraud. Edgars
is a member of Tip-Offs Anonymous, a hotline
managed by Deloitte, which allows tip-off callers’
confidentiality and anonymity on reporting matters.
External AuditThe External Auditors provide an independent
assessment of the Group’s systems of internal
financial control and express an independent
opinion on the Group Financial Statements.
An external audit offers reasonable but not
absolute assurance on financial results.
Collaboration exists between internal and
external auditors to ensure better audit coverage.
The Audit Committee reviews the external
auditor’s audit plan, without infringing on their
independence and rights, to ensure that areas
of significant concern are covered. In addition,
the Audit Committee reviews ongoing ratios
between fees for audit versus those for other
professional services rendered by external auditors.
13

14
Employee RelationshipsThe Group has its operating decisions made at
the appropriate levels. Participative management
lies at the heart of this strategy, which relies on the
building of employee partnerships at every level to
foster mutual trust and encourages people to always
think about how they can improve things. We strive
to liberate initiative and energy in our people, as
they are the ones who make the difference in our
performance.
Employment EquityThe Group has employment policies, which we
believe are appropriate to the business and the
market in which we trade. They are designed to
attract, motivate and retain quality staff at all levels.
Equal employment opportunities are offered without
discrimination.
Public ShareownersThe principles of balanced reporting, under-
standability, openness and substance over form
are the foundation for communication to the public
and shareowners. Positive and negative aspects
of both financial and non-financial information are
provided.
Edgars meets regularly with institutional
shareowners and investment analysts and makes
presentations to investors and analysts bi-annually,
after the release of results.
Ethical BehaviourThe Group’s Core Values are:
Superior customer service
Integrity
People
Performance and
Professionalism
The Code of Ethics clearly outlines the Group’s
Vision, Mission, Values and Code of Conduct.
All employees including senior management,
executives and directors, are expected to act in
line with the Code of Ethics at all times. Failure to
do so results in disciplinary action. Employees with
access to confidential information are prohibited
from disclosing it to outsiders and from trading in
Edgars shares during the closed periods around
year end and half-year reporting, until 48 hours
after the results are published, as well as during any
periods when the Group has issued a cautionary
trading statement to shareowners.
Financial ReportingThe Group Financial Statements for the year ended
31 December 2011 incorporate the results for the
fifty-two weeks ended 7 January 2012. In preparing
these Financial Statements, the same accounting
principles and methods of computation are applied
as in prior periods.
No event material to the understanding of this
report has occurred between the financial year-end
and the date of this report.
Directors’ ResponsibilitiesThe Directors are ultimately responsible for the
preparation of the Group Financial Statements and
related financial information that fairly present the
state of affairs and the results of the Group.
Auditors’ ResponsibilitiesThe external auditors are responsible for
independently auditing and reporting on these
Group Financial Statements in conformity
with International Standards on Auditing.
These financial statements have been approved
by the Board of Directors and are signed on their
behalf by:
T. N. Sibanda L Masterson
Non-Executive Chairman Group Managing
Director
On 07 March 2012
15

16

17

Con
solid
ated
Sta
tem
ent o
f C
ompr
ehen
sive
Inco
me
For
the
year
end
ed 3
1 D
ecem
ber 2
011
2010
$
35,873,449
35,278,291
(18,055,573)
17,222,718
8,767
(835,969)
(6,850,683)
(4,423,288)
5,121,545
923,465
(2,016,148)
4,028,862
(1,131,821)
2,897,041
-
-
-
2,897,041
1.20
1.17
2010
$
36,071,500
35,476,342
(18,240,200)
17,236,141
18,867
(835,969)
(6,850,683)
(5,363,874)
4,204,483
6,575
(2,054,442)
2,156,616
(648,179)
1,508,437
-
-
-
1,508,437
0.62
0.62
2011
$
52,606,931
50,720,382
(26,217,692)
24,502,689
(43,621)
(1,170,177)
(9,496,165)
(5,581,594)
8,211,132
7,868
(2,842,824)
5,376,177
(1,474,011)
3,902,165
165,120
(8,375)
156,745
4,058,910
1.60
1.59
Notes
6
6
7
8
9
11
12
2011
$
52,966,011
51,079,462
(26,536,106)
24,543,356
(42,088)
(1,170,177)
(9,496,165)
(6,374,394)
7,460,532
7,933
(2,842,824)
4,625,641
(1,289,269)
3,336,372
165,120
(8,375)
156,745
3,493,117
1.37
1.37
Revenue
Sale of merchandise
Cost of sales
Gross profit
Other (losses) / gains
Debt collection costs
Store expenses
Other operating expenses
Trading profit
Finance income on financial instruments
Finance cost paid
Profit before tax
Income tax expense
Profit for the year
Other comprehensive income
Revaluation of property, plant and equipment
Deferred tax liability arising on revaluation
Other comprehensive income for the year (net of tax)
Total comprehensive income for the year
Earnings per ordinary share
Basic (cents per share)
Diluted (cents per share)
Company Group
18

Con
solid
ated
Sta
tem
ent o
f C
ash
Flow
sFo
r th
e ye
ar e
nded
31
Dec
embe
r 201
1
2010
$
5,121,545
687,014
(15,802,047)
(9,993,488)
(2,016,148)
(287)
(12,009,923)
(307,418)
107,138
923,465
723,185
933
44,205,861
(33,166,442)
11,040,352
(246,386)
(1)
361,669
115,282
2010
$
4,204,483
851,100
(14,098,058)
(9,042,475)
(2,054,442)
(287)
(11,097,204)
(310,150)
118,288
6,575
(185,287)
933
44,206,310
(33,166,442)
11,040,801
(241,690)
(1)
369,531
127,840
2011
$
8,211,132
1,410,899
(5,090,225)
4,531,806
(2,842,824)
(3,258)
1,685,724
(1,669,758)
170,476
7,868
(1,491,414)
45,417
42,853,370
(42,897,624)
1,163
195,473
(1,083)
115,282
309,672
Notes
13.1
13.2
13.3
2011
$
7,460,532
1,584,574
(4,493,737)
4,551,369
(2,842,824)
(3,258)
1,705,287
(1,693,672)
170,478
7,933
(1,515,261)
45,417
42,851,986
(42,897,624)
(221)
189,805
(1,083)
127,840
316,562
Cash flows from operating activities
Trading profit
Adjusted for:
Non cash items
Movements in working capital
Cash generated/ (utilised) in operations
Finance cost paid
Taxation paid
Cash inflow/ (outflow) from operating activities
Cash flows from investing activities
Purchases of property, plant and equipment
Proceeds from disposal of property, plant and equipment
Finance income
Net cash (used in )/generated from investing activities
Cash flows from financing activities
Proceeds from issue of equity shares
Proceeds from borrowings and loans
Repayment of borrowings and loans
Net cash flows from financing activities
Net change in cash and cash equivalents
Net foreign exchange difference
Cash and cash equivalents at the beginning of the year
Cash and cash equivalents at the end of the year
Company Group
19

Con
solid
ated
Sta
tem
ent o
f Fi
nanc
ial P
ositi
onFo
r th
e ye
ar e
nded
31
Dec
embe
r 201
1
2011 $
3,415,737 -
3,415,737
6,035,140 19,364,492 9,030,152
309,672 34,739,456
10,227
38,165,420
79,825 1,482,697 6,442,437 8,004,959
2,366,771 1,501,930 3,868,701
11,954,097 75,306
111,955 14,150,402 26,291,760 30,160,460 38,165,420
2.83
1.92 (0.50)
2010 $
2,640,734 388,901
3,029,635
7,535,032 15,893,266
- 127,840
23,556,139
46,746
26,632,520
34,408 1,910,708 2,183,688 4,128,804
998,496 -
998,496
5,752,525 53,625 1,100
15,697,970 21,505,220 22,503,716 26,632,520
1.48
3.77 (0.08)
2010 $
1,918,198 -
1,918,198
5,231,101 15,806,975 5,543,930
115,282 26,697,288
46,746
28,662,232
34,408 1,201,480 2,540,272 3,776,160
998,496 -
998,496
8,136,265 53,625 1,100
15,696,586 23,887,576 24,886,072 28,662,232
1.35
4.13 (0.06)
1 Jan 2010 $
1,932,985 131,937
2,064,922
2,790,551 2,735,496
652,263 361,669
6,539,979
47,093
8,651,994
5,601 2,440,893
(1,624,896) 821,598
- - -
3,103,230 70,000
- 4,657,166 7,830,396 7,830,396 8,651,994
0.29
5.23 1.90
2011 $
3,988,512 573,644
4,562,156
8,850,253 19,514,557
- 316,562
28,681,371
10,227
33,253,753
79,825 2,188,565 5,523,420 7,791,810
2,366,770 1,501,930 3,868,700
7,255,580 75,306
111,955 14,150,402 21,593,243 25,461,943 33,253,753
2.76
1.97 (0.54)
ASSETSNon-current assetsProperty, plant and equipment Deferred tax asset Total non-current assets
Current assetsInventories Trade and other receivables Interest in subsidiary Cash and cash equivalents Total current assets
Assets classified as held for sale
Total assets
Equity and liabilitiesEquityIssued capital Reserves Retained earnings Total equity
Non-current liabilitiesDeferred tax liabilities Interest bearing loans and borrowings Total non-current liabilities
Current liabilitiesTrade and other payables Provisions Current tax liabilities Current portion of interest bearing loans and borrowings Total current liabilitiesTotal liabilities Total equity and liabilities
Net equity per share ( cents) Gearing: - Gross - Net
Company Group
1 Jan 2010 $
2,828,027 131,937
2,959,964
4,204,878 2,782,024
- 369,531
7,356,433
47,093
10,363,490
5,601 4,711,855
(2,154,610) 2,562,846
94,740 -
94,740
2,977,803 70,000
- 4,658,101 7,705,904 7,800,644
10,363,490
0.92
1.67 0.59
Notes
14 15
16 17
18
19 20
15 23
21 21 22 23
20

Con
solid
ated
Sta
tem
ent o
f C
hang
es in
Equ
ityFo
r th
e ye
ar e
nded
31
Dec
embe
r 201
1
Issued capital and premium
$
5,601 - - - -
933 -
27,874 34,408
- - - -
45,417 -
79,825
5,601 - - --
933 -
27,874 34,408
- - -
45,417 -
79,825
Equity-settled employee
benefits reserve
$
56,029 -- - - -
56,588 -
112,617 -- - - -
124,472 237,089
56,029 -- - --
56,588 -
112,617 -- - -
124,472 237,089
Revaluation reserve
$
932,824 -
(67,000) -- - --
865,824-
156,745 -
156,745 --
1,022,569
734,931 -
(67,000) - - -- -
667,931 156,745
- 156,745
--
824,676
GroupBalance 1 January 2010 Release in respect of inventories realised Release in respect of revalued property, plant and equipment disposed Total comprehensive income for the period Profit for the period Issue of ordinary shares under employee share option plan Recognition of share-based payments Shares restatedBalance at 31 December 2010 Release in respect of revalued property, plant and equipment disposed Total comprehensive income for the period Profit for the period Other comprehensive income Issue of ordinary shares under employee share option plan Recognition of share-based payments Balance at 31 December 2011
Company Balance 1 January 2010 Release in respect of inventories realisedRelease in respect of revalued property, plant and equipment disposed Total comprehensive income for the period Profit for the period Issue of ordinary shares under employee share option plan Recognition of share-based payments Shares restated Balance at 31 December 2010 Total comprehensive income for the period Profit for the period Other comprehensive income Issue of ordinary shares under employee share option plan Recognition of share-based payments Balance at 31 December 2011
Change in functional currency
reserve $
3,723,002 (2,762,861)
- --- -
(27,874)932,267
(3,360)- - - - -
928,907
1,649,933 (1,201,127)
- - - --
(27,874) 420,932
- - - - -
420,932
Retained earnings
$
(2,154,610) 2,762,861
67,000 1,508,437 1,508,437
- - -
2,183,688 3,360
3,336,372 3,336,372
- - -
5,523,420
(1,624,896) 1,201,127
67,000 2,897,0412,897,041
-- -
2,540,272 3,902,165 3,902,165
- - -
6,442,437
Total $
2,562,846 --
1,508,4371,508,437
93356,588
- 4,128,804
- 3,493,1173,336,372
156,745 45,417
124,472 7,791,810
821,598 --
2,897,041 2,897,041
93356,588
- 3,776,1604,058,910 3,902,165
156,745 45,417
124,472 8,004,959
21
1. Corporate InformationEdgars Stores Limited (the Group) is a limited company incorporated and domiciled in Zimbabwe. Its shares are publicly traded. The Group manufactures clothing, which it distributes and sells together with footwear, textiles, accessories and general dealer items through a network of stores in Zimbabwe.
The consolidated financial statements of the Group for the year ended 31 December 2011 were authorized for issue in accordance with a resolution of the directors on 7 March 2012.
2. Financial Reporting2.1. Basis of PreparationThe consolidated financial statements are prepared in accordance with the going concern and historical cost bases except where otherwise indicated. The accounting policies are applied consistently throughout the Group. The consolidated financial statements are presented in United States Dollar (USD) and all values are rounded to the nearest dollar except where otherwise stated. Statement of compliance The financial statements have been prepared in conformity with International Financial Reporting Standards (IFRS), promulgated by the International Accounting Standards Board (IASB) which includes standards and interpretations approved by the IASB as well as International Accounting Standards Board (IASB) and Standing Interpretations Committee (SIC) interpretations issued under previous constitutions (IFRS). Transition to IFRS The Group is resuming presentations of IFRS financial statements after early adoption of Revised IFRS1-first time Adoption of International Financial Reporting Standards issued on 20 December 2010. The group failed to present IFRS compliant financial statements for the financial year ended 31 December 2010 due to the effects of severe hyperinflation as defined in the Revised IFRS 1. The amendment provides guidance for entities emerging from severe hyperinflation to resume presenting IFRS financial statements. An entity can elect to measure assets and liabilities at fair value and to use the fair value as the deemed cost in its opening IFRS statement of financial position.
The Group elected to use the severe hyperinflation exemption. The effects of the application of this amendment is to render the opening statement of financial position, prepared on 1 January 2010 (date of transition to IFRS) IFRS compliant. The opening statement of financial position was reported in the prior year as not being compliant with International Accounting Standard (IAS) 21 The effects of Changes in Foreign Exchange Rates and IAS 29 Financial reporting in Hyperinflationary Economies. The Group’s previous functional currency, the Zimbabwe dollar (ZW$), was subjected to severe hyperinflation before the date of transition to IFRS because it had both of the following characteristics: a) A reliable general price index was not available to all entities with transactions and balances in the ZW$, and b) Exchangeability between the ZW$ and a relatively stable foreign currency did not exist. The Group changed its functional and presentation currency from the ZW$ to the United States dollar (US$) on 1 February 2009, however, the Group has adopted 1 January 2010 as the effective date of currency normalisation and the date of transition to reporting in terms of International Financial Reporting Standards. Deemed cost exemption The Group elected to measure certain items of property, plant and equipment, inventories, trade and other receivables and trade and other payables at fair value and to use the fair value as the deemed cost of these assets and liabilities in the opening IFRS statement of financial position. Comparative Financial information The financial statements comprise three statements of financial position, two statements of comprehensive income, changes in equity and cash flows as a result of the retrospective application of the amendments to IFRS. Reconciliation of previously prepared financial statements to IFRS compliant financial statements.In preparing its opening IFRS statement of financial position, the Group has not adjusted amounts previously determined in accordance with the “Guidance on Change in Functional Currency - 2009”, which was drafted jointly by the Public Accountants and Auditors Board (PAAB), Zimbabwe
Not
es T
o Th
e C
onso
lidat
ed F
inan
cial
Sta
tem
ents
For
the
year
end
ed 3
1 D
ecem
ber 2
011
22
Accounting Practices Board (ZAPB) and the Zimbabwe Stock Exchange (ZSE). This guidance was adopted as the local standard for reporting by most listed entities and other incorporated entities in Zimbabwe reporting subsequent to severe hyperinflation. As amounts have not changed from those presented in previously issued financial statements, reconciliations have not been presented, because the amendments to IFRS 1 effectively endorsed the approach adopted in the guidance paper issued by PAAB, ZAPB and the ZSE, which dealt with the conversion of local currency balances to stable foreign currency after a period of severe hyperinflation.
2.2. Basis of ConsolidationThe consolidated financial statements comprise the financial statements of the Group and it’s subsidiaries as at 31 December 2011. Subsidiaries are fully consolidated from the date of acquisition, being the date on which the Group obtains control, and continue to be consolidated until the date that such control ceases. The financial statements of the subsidiaries are prepared for the same reporting period as the parent company, using consistent accounting policies. All intra-group balances, income and expenses, unrealised gains and losses and dividends resulting from intra-group transactions are eliminated in full.
A change in the ownership interest of a subsidiary, without change of control, is accounted for as an equity transaction.
Losses are attributed to the non-controlling interest
even if that results in a deficit balance. If the Group
loses control over a subsidiary, it:
Derecognises the assets (including goodwill)
and liabilities of the subsidiary.
Derecognises the carrying amount of
any non-controlling interest.
Derecognises the cumulative translation
differences, recorded in equity.
Recognises the fair value of the consideration
received.
Recognises the fair value of any investment
retained.
Recognises any surplus or deficit in profit or loss.
Reclassifies the parent’s share of components
Not
es T
o Th
e C
onso
lidat
ed F
inan
cial
Sta
tem
ents
For
the
year
end
ed 3
1 D
ecem
ber 2
011
23
previously recognized in other comprehensive
income to profit or loss.
2.3. Summary of significant accounting policies2.3.1. Foreign currency translationThe Group’s consolidated financial statements are presented in United States Dollars, which is the Group’s functional currency. It is the currency of the primary economic environment in which the Group operates. Transactions in foreign currencies are initially recorded at the functional currency rate prevailing at the date of the transaction.
Monetary assets and liabilities denominated in foreign currencies are retranslated at the spot rate of exchange ruling at the reporting date. All differences are taken to profit or loss. Non-monetary items that are measured in terms of historical cost in a foreign currency are translated using the exchange rates as at dates of initial transactions. Non-monetary items measured at fair value in a foreign currency are translated using the exchange rates at the date when the fair value is determined.
2.3.2. Non-current assets held for saleNon-current assets and disposal groups are classified as held for sale if their carrying amount will be recovered principally through a sale transaction rather than through continuing use. This condition is regarded as met only when the sale is highly probable and the non-current asset (or disposal group) is available for immediate sale in its present condition. Management must be committed to the sale, which should be expected to qualify for recognition as a completed sale within one year from the date of classification. Non-current assets (and disposal groups) classified as held for sale are measured at the lower of their previous carrying amount and fair value less costs to sell and are no longer depreciated.
2.3.3. RevenueRevenue is recognized to the extent that it is probable that the economic benefits will flow to the Group and the revenue can be reliably measured. Revenue is measured at the fair value of the consideration received or receivable, including discounts, rebates and excluding value-added taxes and duty. The Group assesses its revenue arrangements against specific criteria in order to determine if it is acting as principal or agent. The Group has concluded
Not
es T
o Th
e C
onso
lidat
ed F
inan
cial
Sta
tem
ents
For
the
year
end
ed 3
1 D
ecem
ber 2
011
24

that it is acting as a principal in all of its revenue arrangements. Revenue from the sale of goods is recognised when the significant risks and rewards of ownership of the goods have passed to the buyer, usually on delivery of the goods.
Interest incomeFor all financial instruments measured at amortised cost, interest income or expense is recorded using the effective interest rate (EIR), which is the rate that exactly discounts the estimated future cash payments or receipts through the expected life of the financial instrument or a shorter period, where appropriate, to the net carrying amount of the financial asset or liability. Interest income is included in finance income in the statement of comprehensive income.
2.3.4. TaxesCurrent income tax assets and liabilities for the current period are measured at the amount expected to be recovered from or paid to the taxation authorities. The tax rates and laws used to compute the amount are those that are enacted or substantively enacted, by the reporting date in Zimbabwe. Current income tax relating to items is recognised in correlation to underlying transactions either in other comprehensive income, profit and loss or directly in equity.
Deferred taxDeferred tax is provided using the liability method on temporary differences at the reporting date between the tax bases of assets and liabilities and their carrying amounts for financial reporting purposes. Deferred tax liabilities are recognized for all taxable temporary differences, except:
Where the deferred tax liability arises from the initial recognition of goodwill or of an asset or liability in a transaction that is not a business combination and, at the time of the transaction, affects neither the accounting profit nor taxable profit or loss.
In respect of taxable temporary differences associated with investments in subsidiaries, associates and interests in joint ventures, where the timing of the reversal of the temporary differences can be controlled and it is probable that the temporary differences will not reverse in the foreseeable future.
Deferred tax assets are recognised for all deductible temporary differences, carry forward of unused tax credits and unused tax losses, to the extent that it is probable that taxable profit will be available against which the deductible temporary differences, and the carry forward of unused tax credits and unused tax losses can be utilized except:
Where the deferred tax asset relating to the deductible temporary difference arises from the initial recognition of an asset or liability in a transaction that is not a business combination and, at the time of the transaction, affects neither the accounting profit nor taxable profit or loss.
In respect of deductible temporary differences associated with investments in subsidiaries, associates and interests in joint ventures, deferred tax assets are recognised only to the extent that it is probable that the temporary differences will reverse in the foreseeable future and taxable profit will be available against which the temporary differences can be utilised.
The carrying amount of deferred tax assets is reviewed at each reporting date and reduced to the extent that it is no longer probable that sufficient taxable profit will be available to allow all or part of the deferred tax asset to be utilised. Unrecognised deferred tax assets are reassessed at each reporting date and are recognised to the extent that it has become probable that future taxable profits will allow the deferred tax asset to be recovered.
Deferred tax assets and liabilities are measured at the tax rates that are expected to apply in the year when the asset is realised or the liability is settled, based on tax rates (and tax laws) that have been enacted or substantively enacted at the reporting date.
Deferred tax relating to items is recognised in correlation to underlying transactions either in other comprehensive income, profit and loss or directly in equity.
Deferred tax assets and deferred tax liabilities are offset, if a legally enforceable right exists to set off current tax assets against current income tax liabilities and deferred taxes relate to the same taxable entity and the same taxation authority.
Not
es T
o Th
e C
onso
lidat
ed F
inan
cial
Sta
tem
ents
For
the
year
end
ed 3
1 D
ecem
ber 2
011
25
Value added taxRevenues, expenses and assets are recognised net of the amount of value added tax (VAT) except: Where the VAT incurred on a purchase of assets or services is not recoverable from the taxation authority, in which case the value added tax is recognized as part of the cost of acquisition of the asset or as part of the expense item as applicable. Receivables and payables that are stated with the amount of VAT included.
The net amount of VAT recoverable from, or payable to, the taxation authority is included as part of receivables or payables in the statement of financial position.
2.3.5. Pensions and other post employment benefitsThe Group pension scheme is a defined contribution scheme. The cost of retirement benefit is determined by the level of contribution made in terms of the rules. Employer contributions are charged in the profit and loss as they fall due. The Group also participates in the National Social Security Authority as required by legislation.
The cost of retirement benefit applicable to the National Social Security Authority Scheme is determined by the systematic recognition of legislated contributions. The Group has also agreed to provide certain additional post employment healthcare benefits to executives. Benefits are unfunded. Costs are actuarially calculated and are charged against trading profit when incurred.
2.3.6. Share-based payment transactionsEquity-settled transactionsThe cost of equity-settled transactions with employees for awards granted is measured by reference to the fair value at the date on which they are granted. The fair value is determined by using an appropriate pricing model, further details of which are given in note 10.5.
The cost of equity-settled transactions is recognised, together with a corresponding increase in equity, over the period in which the service conditions are fulfilled. The cumulative expense recognised for equity-settled transactions at each reporting date until the vesting date reflects the extent to which the vesting period has expired and the Group’s best estimate of the number of equity instruments that
will ultimately vest. The statement of comprehensive income expense or credit for a period represents the movement in cumulative expense recognised as at the beginning and end of that period. The dilutive effect of outstanding options is reflected as additional share dilution in the computation of diluted earnings per share (further details are given in note 12).
2.3.7. Financial instruments – initial recognition and subsequent measurement(a) Financial assets(i) Initial recognition and measurementFinancial assets within the scope of IAS 39 are classified as financial assets at fair value through profit or loss, loans and receivables, held-to-maturity investments, available-for-sale financial assets as appropriate. The Group determines the classification of its financial assets at initial recognition. All financial assets are recognised initially at fair value plus directly attributable transaction costs unless it is classified as at fair value through profit or loss.
Purchases or sales of financial assets that require delivery of assets within a time frame established by regulation or convention in the marketplace (regular way trades) are recognised on the trade date, i.e. the date that the Group commits to purchase or sell the asset. The Group’s financial assets include cash and short-term deposits, trade and other receivables, loans and other receivables.
At the reporting date there were no held-to-maturity investments, available-for-sale financial assets, derivatives or hedging instruments.
(ii) Subsequent measurementThe subsequent measurement of financial assets depends on their classification as follows:
Loans and receivablesLoans and receivables are non-derivative financial assets with fixed or determinable payments that are not quoted in an active market. After initial measurement, such financial assets are subsequently measured at amortised cost using the effective interest rate method (EIR), less impairment. The EIR amortisation is included in finance income in the statement of comprehensive income. The losses arising from impairment are recognised in the statement of comprehensive income in other operating expenses.
Not
es T
o Th
e C
onso
lidat
ed F
inan
cial
Sta
tem
ents
For
the
year
end
ed 3
1 D
ecem
ber 2
011
26
(iii) DerecognitionA financial asset (or, where applicable a part of a financial asset or part of a group of similar financial assets) is derecognised when:
The rights to receive cash flows from the asset have expired; or
The Group has transferred its rights to receive cash flows from the asset or has assumed an obligation to pay the received cash flows in full without material delay to a third party under a ‘pass-through’ arrangement; and either (a) the Group has transferred substantially all the risks and rewards of the asset, or (b) the Group has neither transferred nor retained substantially all the risks and rewards of the asset, but has transferred control of the asset.
When the Group has transferred its rights to receive cash flows from an asset or has entered into a pass-through arrangement, and has neither transferred nor retained substantially all the risks and rewards of the asset nor transferred control of the asset, the asset is recognised to the extent of the Group’s continuing involvement in the asset. In that case, the Group also recognises an associated liability. The transferred asset and the associated liability are measured on a basis that reflects the rights and obligations that the Group has retained. Continuing involvement that takes the form of a guarantee over the transferred asset, is measured at the lower of the original carrying amount of the asset and the maximum amount of consideration that the Group could be required to repay.
iv) Impairment of financial assetsThe Group assesses at each reporting date whether there is any objective evidence that a financial asset or a group of financial assets is impaired. A financial asset or a group of financial assets is deemed to be impaired if, and only if, there is objective evidence of impairment as a result of one or more events that has occurred after the initial recognition of the asset (an incurred ‘loss event’) and that loss event has an impact on the estimated future cash flows of the financial asset or the group of financial assets that can be reliably estimated. Evidence of impairment may include indications that the debtors or a group of debtors is experiencing significant financial difficulty, default or delinquency in interest or principal payments, the probability that they will enter bankruptcy or other financial reorganisation
Not
es T
o Th
e C
onso
lidat
ed F
inan
cial
Sta
tem
ents
For
the
year
end
ed 3
1 D
ecem
ber 2
011
27
and where observable data indicate that there is a measurable decrease in the estimated future cash flows, such as changes in arrears or economic conditions that correlate with defaults.
Financial assets carried at amortised costFor financial assets carried at amortised cost the Group first assesses individually whether objective evidence of impairment exists individually for financial assets that are individually significant, or collectively for financial assets that are not individually significant. The carrying amount of the asset is reduced through the use of an allowance account and the amount of the loss is recognised in profit or loss. The interest income is recorded as part of finance income in profit or loss. Loans together with the associated allowance are written off when there is no realistic prospect of future recovery and all collateral has been realized or has been transferred to the Group. If, in a subsequent year, the amount of the estimated impairment loss increases or decreases because of an event occurring after the impairment was recognised, the previously recognised impairment loss is increased or reduced by adjusting the allowance account. If a future write-off is later recovered, the recovery is credited to other operating expenses in the statement of comprehensive income.
(b) Financial liabilities(i) Initial recognition and measurementFinancial liabilities within the scope of IAS 39 are classified as financial liabilities at fair value through profit or loss, loans and borrowings, or as derivatives designated as hedging instruments in an effective hedge, as appropriate. The Group determines the classification of its financial liabilities at initial recognition. All financial liabilities are recognised initially at fair value and in the case of loans and borrowings, plus directly attributable transaction costs.
The Group’s financial liabilities include trade and other payables, bank overdraft and loans and borrowings.
(ii) Subsequent measurementThe measurement of financial liabilities depends on their classification as follows:
Not
es T
o Th
e C
onso
lidat
ed F
inan
cial
Sta
tem
ents
For
the
year
end
ed 3
1 D
ecem
ber 2
011
28
Loans and borrowingsAfter initial recognition, interest bearing loans and borrowings are subsequently measured at amortised cost using the effective interest rate method. Gains and losses are recognised in the statement of comprehensive income when the liabilities are derecognised as well as through the effective interest rate method (EIR) amortization process. Amortised cost is calculated by taking into account any discount or premium on acquisition and fee or costs that are an integral part of the EIR. The EIR amortization is included in finance cost in the statement of comprehensive income.
(iii) DerecognitionA financial liability is derecognised when the obligation under the liability is discharged or cancelled or expires. When an existing financial liability is replaced by another from the same lender on substantially different terms, or the terms of an existing liability are substantially modified, such an exchange or modification is treated as a derecognition of the original liability and the recognition of a new liability, and the difference in the respective carrying amounts is recognised in profit or loss.
(c) Offsetting of financial instrumentsFinancial assets and financial liabilities are offset and the net amount reported in the consolidated statement of financial position if, and only if, there is a currently enforceable legal right to offset the recognised amounts and there is an intention to settle on a net basis, or to realise the assets and settle the liabilities simultaneously.
(d) Fair value of financial instrumentsThe fair value of financial instruments that are traded in active markets at each reporting date is determined by reference to quoted market prices or dealer price quotations (bid price for long positions and ask price for short positions), without any deduction for transaction costs. For financial instruments not traded in an active market, the fair value is determined using appropriate valuation techniques. Such techniques may include using recent arm’s length market transactions; reference to the current fair value of another instrument that is substantially the same; discounted cash flow analysis or other valuation models. An analysis of fair values of financial instruments and further details as to how they are measured are provided in note 27.5.
2.3.8. Treasury sharesOwn equity instruments which are reacquired (treasury shares) are recognised at cost and deducted from equity. No gain or loss is recognised on the purchase, sale, issue or cancellation of the Group’s own equity instruments. Any difference between the carrying amount and the consideration is recognised in other capital reserves.
2.3.9. Property, plant and equipmentProperty, plant and equipment is stated at fair value less accumulated depreciation and / or accumulated impairment losses recognised after the date of the revaluation, if any. Such cost includes the cost of replacing part of the plant and equipment and borrowing costs for long-term construction projects if the recognition criteria are met. When significant parts of property, plant and equipment are required to be replaced in intervals, the Group recognises such parts as individual assets with specific useful lives and depreciation, respectively. Other repair and maintenance costs are expensed as incurred.
Land and buildings are measured at fair value less accumulated depreciation on buildings and impairment losses recognised after the date of the revaluation. Valuations are performed frequently to ensure that the fair value of a revalued asset does not differ materially from its carrying amount. Any revaluation surplus is recognised in other comprehensive income and credited to the revaluation reserve included in the equity section of the statement of financial position, except to the extent that it reverses a revaluation decrease of the same asset previously recognised in the profit or loss, in which case the increase is recognised in the profit or loss. A revaluation deficit is recognised in the profit or loss, except to the extent that it offsets an existing surplus on the same asset recognised in the asset revaluation reserve.
Accumulated depreciation as at the revaluation date is eliminated against the gross carrying amount of the asset and the net amount is restated to the revalued amount of the asset. Upon disposal, any revaluation reserve relating to the particular asset being sold is transferred to retained earnings.
Depreciation is calculated on a straight-line basis over the remaining estimated useful life of the asset.
Not
es T
o Th
e C
onso
lidat
ed F
inan
cial
Sta
tem
ents
For
the
year
end
ed 3
1 D
ecem
ber 2
011
29
The useful lives of each category are as follows:
Buildings: 40 yearsFurniture: 5-10 yearsFixtures and fittings: 5-10 yearsComputer equipment: 5-10 yearsComputer software: 5-10 yearsPlant and machinery: 5-10 yearsMotor vehicles: 5-7 yearsLeasehold Improvements: The lease period or shorter periods as may be determined
An item of property, plant and equipment and any significant part initially recognized is derecognised upon disposal or when no future economic benefits are expected from its use or disposal. Any gain or loss arising on derecognition of the asset (calculated as the difference between the net disposal proceeds and the carrying amount of the asset) is included in the profit or loss when the asset is derecognised. The assets’ residual values, useful lives and methods of depreciation are reviewed at each financial year-end, and adjusted prospectively, if appropriate. Where parts of an item of plant and equipment have different useful lives, they are accounted for as separate items of plant and equipment.
2.3.10. LeasesThe determination of whether an arrangement is, or contains, a lease is based on the substance of the arrangement at inception date: whether fulfillment of the arrangement is dependent on the use of a specific asset or assets or the arrangement conveys a right to use the asset.
Group as a lesseeOperating leases are leases that do not transfer to the Group substantially all the risks and benefits incidental to ownership of the leased item. Operating lease payments are recognised as an expense on a straight-line basis over the lease term. Contingent rentals are expensed as incurred.
Group as a lessorLeases where the Group does not transfer substantially all the risks and benefits of ownership of the asset are classified as operating leases. Initial direct costs incurred in negotiating an operating lease are added to the carrying amount of the leased asset and recognised over the lease term on
the same basis as rental income. Contingent rents are recognised as revenue in the period in which they are earned.
2.3.11. Borrowing costsBorrowing costs directly attributable to the acquisition, construction or production of an asset that necessarily takes a substantial period of time to get ready for its intended use or sale are capitalised as part of the cost of the respective assets. All other borrowing costs are expensed in the period they occur. Borrowing costs consist of interest and other costs that an entity incurs in connection with the borrowing of funds.
2.3.12. InventoriesInventories are valued at the lower of cost and net realisable value on a FIFO basis. Costs incurred in bringing each product to its present location and condition are accounted for as follows:Raw materials - average purchase cost Finished goods and work in progress - cost of direct materials and labour and a proportion of manufacturing overheads based on normal operating capacity but excluding borrowing costs.Merchandise - average costNet realisable value is the estimated selling price in the ordinary course of business, less estimated costs of completion and the estimated costs necessary to make the sale.
2.3.13. Cash and short-term depositsCash and short-term deposits in the statement of financial position comprise cash at banks and on hand and short-term deposits with an original maturity of three months or less. For the purpose of the consolidated statement of cash flows, cash and cash equivalents consist of cash and short-term deposits as defined above. Overdrafts are disclosed under borrowings.
2.3.14. ProvisionsProvisions are recognised when the Group has a present obligation (legal or constructive) as a result of a past event, it is probable that an outflow of resources embodying economic benefits will be required to settle the obligation and a reliable estimate can be made of the amount of the obligation. Where the Group expects some or all of a provision to be reimbursed, for example under an insurance contract, the reimbursement is recognised as a separate asset but only when
Not
es T
o Th
e C
onso
lidat
ed F
inan
cial
Sta
tem
ents
For
the
year
end
ed 3
1 D
ecem
ber 2
011
30
the reimbursement is virtually certain. The expense relating to any provision is presented in the profit or loss net of any reimbursement.
2.3.15. ImpairmentThe Group assesses at each reporting date whether there is an indication that a non-current asset may be impaired. If any indication exists the Group estimates the asset’s recoverable amount. An asset’s recoverable amount is the higher of an asset’s or cash-generating unit’s (CGU) fair value less costs to sell and its value in use and is determined for an individual asset, unless the asset does not generate cash inflows that are largely independent of those from other assets or group of assets. Where the carrying amount of an asset or CGU exceeds its recoverable amount, the asset is considered impaired and is written down to its recoverable amount. In assessing value in use, the estimated future cash flows are discounted to their present value using a pre-tax discount rate that reflects current market assessments of the time value of money and the risks specific to the asset. In determining fair value less costs to sell, recent market transactions are taken into account, if available. If no such transactions can be identified, an appropriate valuation model is used. These calculations are corroborated by valuation multiples, quoted share prices for publicly traded subsidiaries or other available fair value indicators.
The Group bases its impairment calculation on detailed budgets and forecast calculations which are prepared separately for each of the Group’s cash generating units to which the individual assets are allocated. These budgets and forecast calculations are generally covering a period of five years. For longer periods, a long-term growth rate is calculated and applied to projected future cash flows after the fifth year. Impairment losses of continuing operations, including impairment on inventories, are recognised in profit or loss in those expense categories consistent with the function of the impaired asset, except for a property previously revalued where the revaluation was taken to other comprehensive income. In this case, the impairment is also recognised in other comprehensive income up to the amount of any previous revaluation.
An assessment is made at each reporting date as to whether there is any indication that previously recognised impairment losses may no longer exist
or may have decreased. If such indication exists, the Group estimates the asset’s or cash generating unit’s recoverable amount. A previously recognised impairment loss is reversed only if there has been a change in assumption used to determine the asset’s recoverable amount since the last impairment loss was recognised. The reversal is limited so that the carrying amount of the asset does not exceed its recoverable amount, nor exceed the carrying amount that would have been determined, net of depreciation, had no impairment loss been recognised for the asset in prior years. Such reversal is recognised in profit or loss unless the asset is carried at a revalued amount in which case the reversal is treated as a revaluation increase.
3. Significant accounting judgments, estimates and assumptionsThe preparation of the Group’s financial statements requires management to make judgments, estimates and assumptions that affect the reported amounts of revenues, expenses, assets and liabilities, and the disclosures of contingent liabilities, at the end of the reporting period. However, uncertainty about these assumptions and estimates could result in outcomes that could require a material adjustment to the carrying amount of the assets or liabilities affected in future periods.
3.1. JudgmentsIn the process of applying the Group’s accounting policies, management has made the following judgments, which have the most significant effect on the amounts recognised in the consolidated financial statements:
3.1.1. Consolidation of special purpose entitiesThe Group has consolidated the group results of the Edgars Employee Share Trust Company and the Zimedgroup Employee Trust. The substance of the relationship between the company and these entities has been assessed and judgment made that they are controlled entities.
3.2. Estimates and assumptionsThe key assumptions concerning the future and other key sources of estimation uncertainty at the reporting date that have a significant risk of causing a material adjustment to the carrying amounts of assets and liabilities within the next financial year are discussed below.
Not
es T
o Th
e C
onso
lidat
ed F
inan
cial
Sta
tem
ents
For
the
year
end
ed 3
1 D
ecem
ber 2
011
31

The Group based its assumptions and estimates on parameters available when the consolidated financial statements were prepared. Existing circumstances and assumptions about future developments however, may change due to market changes or circumstances arising beyond the control of the Group.
3.2.1. Revaluation of property, plant and equipmentProperty, plant and equipment are stated at revaluation less accumulated depreciation. Valuations are performed frequently enough to ensure that the fair value of a revalued asset does not differ from its carrying amount. Professional valuers carried out revaluation of property in 2011.
Property, plant and equipment is depreciated over its useful life taking into account residual values where appropriate. The actual useful lives of the assets and residual values are assessed at each reporting date and may vary depending on a number of factors. In re-assessing asset lives, factors such as technological innovation, product life cycles and maintenance programs are taken into account. Residual value assessments consider issues such as future market conditions, the remaining useful life of the asset and projected disposal values. See note 14.
3.2.2. Post employment benefit obligationsPost employment benefits are provided for certain existing and former employees. Actuarial valuations are used to determine the value of the benefits. The actuarial valuations are based on assumptions, which include employee turnover, the discount rate, life expectancy, healthcare costs and rates of increase in compensation costs. See note 21.1.
3.2.3 Share based payment transactionsThe Group measures the cost of equity-settled transactions with employees by reference to the fair value of the equity instruments at the date at which they are granted. Estimating fair value for share-based payment transactions requires determining the most appropriate valuation model, which is dependent on the terms and conditions of the grant. This estimate also requires determining the most appropriate inputs to the valuation model including the expected life of the share option, volatility and dividend yield and making assumptions about them.
The assumptions and models used for estimating fair value for share-based payment transactions are disclosed in Note 10.5.
3.2.4. TaxesThe Group establishes provisions, based on reasonable estimates, for possible consequences of audits by the tax authorities. The amount of such provisions is based on various factors, such as experience of previous tax audits and interpretations of tax regulations by the responsible tax authority.
Deferred tax assets are recognized for all unused tax losses to the extent that it is probable that taxable profit will be available against which the losses can be utilized. Significant management judgment is required to determine the amount of deferred tax assets that can be recognized, based upon the likely timing and level of future taxable profits. Further details on taxes are disclosed in Note 11.
3.2.5 Specific provision for impairment of trade receivablesThe Group calculates this provision as being the trade receivables in arrears at the reporting date. The figure is arrived at after taking into consideration the performance of the debtors’ book and has proved adequate based on past experience. Further details are provided in note 17.
3.3 Standards issued but not yet effectiveStandards issued but not yet effective up to the date of issuance of the consolidated financial statements are listed below.
This listing is of standards and interpretations issued, which the Group reasonably expects to be applicable at a future date. The Group intends to adopt those standards when they become effective.
IAS 1 Financial statement presentation (Amendment)The amendment is effective for annual periods beginning on or after 1 January 2012 and requires that items of other comprehensive income be grouped in items that would be reclassified to profit or loss at a future point and items that will never be reclassified. This amendment does not change the nature of items that are currently recognised in OCI, nor does it impact the determination of
Not
es T
o Th
e C
onso
lidat
ed F
inan
cial
Sta
tem
ents
For
the
year
end
ed 3
1 D
ecem
ber 2
011
32
whether items of OCI are reclassified through profit or loss in future periods. In terms of classification the revaluation reserve would not be reclassified.
IAS 12 Income taxes (Amendment)The amendment is effective for annual periods beginning on or after 1 January 2012 and introduces a rebuttable presumption that deferred tax on investment properties measured at fair value will be recognised on a sale basis, unless an entity has a business model that would indicate the investment property will be consumed in the business. If consumed a use basis should be adopted. Furthermore, it introduces the requirement that deferred tax on non-depreciable assets that are measured using the revaluation model in IAS 16 always be measured on a sale basis of the asset. This amendment will have no impact on the Group after initial application as deferred tax as above has always been calculated at the capital gains tax rate.
IAS 19 Post employee benefits (Amendment)The amendments are effective for annual periods beginning on or after 1 January 2013. The IASB has issued numerous amendments to IAS 19. These range from fundamental changes such as removing the corridor mechanism and the concept of expected returns on plan assets to simple clarifications and re-wording. The more significant changes include the following:
For defined benefit plans, the ability to defer • recognition of actuarial gains and losses (i.e. the corridor approach) has been removed. As revised, actuarial gains and losses are recognised in OCI when they occur. Amounts recorded in profit or loss are limited to current and past service costs, gains or losses on settlements, and net interest income/(expense). All other changes in the net defined benefit asset/(liability) are recognised in OCI with no subsequent recycling to profit or loss.
Objectives for disclosures of defined benefit • plans are explicitly stated in the revised standard, along with new or revised disclosure requirements. These new disclosures include quantitative information of the sensitivity of the defined benefit obligation to a reasonably possible change in each significant actuarial
Not
es T
o Th
e C
onso
lidat
ed F
inan
cial
Sta
tem
ents
For
the
year
end
ed 3
1 D
ecem
ber 2
011
33

assumption. Termination benefits will be recognised at the earlier of when the offer of termination cannot be withdrawn, or when the related restructuring costs are recognised under IAS 37 Liabilities.
• The distinction between short-term and other • long-term employee benefits will be based on expected timing of settlement rather than the employee’s entitlement to the benefits.
• Actuarial gains and losses on the defined • benefit medical plan will in future be recognized within OCI and additional disclosures will be provided. The Group is currently assessing the full impact of the remaining amendments (termination benefits and definitions of short-term and long-term employee benefits).
•
IAS 27 Separate Financial Statements (as revised in 2011)As a consequence of the new IFRS 10 and IFRS 12, what remains of IAS 27 is limited to accounting for subsidiaries, jointly controlled entities, and associates in separate financial statements. The amendment becomes effective for annual periods beginning on or after 1 January 2013 and does not impact the accounting in the company’s separate financial statements.
IAS 28 Investments in Associates and Joint Ventures (as revised in 2011)As a consequence of the new IFRS 11 and IFRS 12, IAS 28 has been renamed IAS 28 Investments in Associates and Joint Ventures, and describes the application of the equity method to investments in joint ventures in addition to associates. The amendment becomes effective for annual periods beginning on or after 1 January 2013 and will have no impact on the group as the group does not have any investments in associates or joint ventures.
IAS 32 Financial Instruments: Presentation (Amendment) – Offsetting Financial Assets and Financial LiabilitiesThe IASB issued an amendment to clarify the meaning of “currently has a legally enforceable right to set off the recognised amounts” (IAS 32.42(a)).
This means that the right of set-off:must not be contingent on a future event; and•
Not
es T
o Th
e C
onso
lidat
ed F
inan
cial
Sta
tem
ents
For
the
year
end
ed 3
1 D
ecem
ber 2
011
34
must be legally enforceable in all of the following • circumstances: • * the normal course of business; • * the event of default; and • * the event of insolvency or bankruptcy of the entity and all of the counter-parties.
The amendment is effective for annual periods beginning on or after 1 January 2014 and the Group is still in the process of determining how it will impact the Statement of Financial Position and Income Statement upon adoption.
IFRS 7 Financial Instruments: Disclosures Transfer of financial assets (Amendment)The amendment is effective for annual periods beginning on or after 1 July 2011. The amendment requires additional quantitative and qualitative disclosures relating to transfers of financial assets, where:
Financial assets are derecognised in their • entirety, but where the entity has a continuing involvement in them (e.g., options or guarantees on the transferred assets)Financial assets are not derecognised in their • entirety - The amendments may be applied earlier than the effective date and this fact must be disclosed. Comparative disclosures are not required for any period beginning before the effective date.
• The amendment will not impact the Group as the Group does not regularly enter into transactions subject to the new disclosure requirements upon applying the IAS 39 derecognition model on financial assets.
IFRS 7 Financial Instruments: Disclosures (Amendment)– Disclosures – Offsetting Financial Assets and Financial LiabilitiesThe amendment amends the required disclosures to include information that will enable users of an entity’s financial statements to evaluate the effect or potential effect of netting arrangements, including rights of set-off associated with the entity’s recognised financial assets and recognised financial liabilities, on the entity’s financial position. The amendment is effective for annual periods beginning on or after 1 January 2013 and the Group is still in the process of determining how it will impact the note disclosures upon adoption.
IFRS 9 Financial Instruments: Classification and MeasurementIFRS 9 as issued reflects the first phase of the IASBs work on the replacement of IAS 39 and applies to classification and measurement of financial assets and liabilities as defined in IAS 32. The standard is effective for annual periods beginning on or after 1 January 2015. In subsequent phases, the Board will address impairment and hedge accounting. The completion of this project is expected in 2013. The adoption of the first phase of IFRS 9 will primarily have an effect on the classification and measurement of the Group’s financial assets but will potentially have no impact on classification and measurements of financial liabilities. The Group is currently assessing the impact of adopting IFRS 9, however, the impact of adoption depends on the assets held by the Group at the date of adoption, it is not practical to quantify the effect.
Financial assetsAll financial assets are measured at fair value at initial recognition. Debt instruments may, if the Fair Value Option (FVO) is not invoked, be subsequently measured at amortised cost if:
The asset is held within a business • model that has the objective to hold the assets to collect the contractual cash flows And • The contractual terms of the financial asset • give rise, on specified dates, to cash flows that are solely payments of principal and interest on the principal outstanding. All other debt instruments are subsequently measured at fair value.
All equity investment financial assets are measured at fair value either through other comprehensive income (OCI) or profit or loss. Equity instruments held for trading must be measured at fair value through profit or loss. However, entities have an irrevocable choice to recognise fair value changes in OCI by instrument for all other equity financial assets.
Financial liabilitiesFor FVO liabilities, the amount of change in the fair value of a liability that is attributable to changes in credit risk must be presented in OCI. The remainder
Not
es T
o Th
e C
onso
lidat
ed F
inan
cial
Sta
tem
ents
For
the
year
end
ed 3
1 D
ecem
ber 2
011
35

of the change in fair value is presented in profit or loss, unless presentation of the fair value change in respect of the liability’s credit risk in OCI would create or enlarge an accounting mismatch in profit or loss. All other IAS 39 classification and measurement requirements for financial liabilities have been carried forward into IFRS 9, including the embedded derivative separation rules and the criteria for using the FVO.
IFRS 10 Consolidated Financial Statements IFRS 10 replaces the portion of IAS 27 Consolidated and Separate Financial Statements that addresses the accounting for consolidated financial statements. It also includes the issues raised in SIC 12 Consolidation – Special Purpose Entities. IFRS 10 establishes a single control model with a new definition of control that applies to all entities. Control exists when an investor has:
Power over the investee (defined in IFRS 10 • as when the investor has existing rights that give it the current ability to direct the relevant activities)Exposure, or rights, to variable returns from its • involvement with the investee And• The ability to use its power over the investee to • affect the amount of the investor’s returns
• IFRS 10 also provides a number of clarifications on
applying this new definition of control, including the
following key points:
•
An investor is any party that potentially controls •
an investee; such party need not hold an equity
investment to be considered an investor.
An investor may have control over an investee •
even when it has less than a majority of the
voting rights of that investee (sometimes
referred to as de facto control).
Exposure to risks and rewards is an indicator •
of control, but does not in itself constitute
control.
When decision-making rights have been •
delegated or are being held for the benefit of
others, it is necessary to assess whether a
decision-maker is a principal or an agent to
determine whether it has control.
Consolidation is required until such time as •
control ceases, even if control is temporary.
The changes will require management to make
significant judgement to determine which entities
are controlled and therefore required to be
consolidated by the parent. Therefore, IFRS 10
may change which entities are within a Group. This
standard becomes effective for annual periods
beginning on or after 1 January 2013 and the Group
is still busy assessing the impact upon adoption of
this new standard.
IFRS 11 Joint ArrangementsIFRS 11 replaces IAS 31 and SIC-13. Joint control
under IFRS 11 is defined as the contractually
agreed sharing of control of an arrangement, which
exists only when the decisions about the relevant
activities require the unanimous consent of the
parties sharing control. The reference to ‘control’
in ‘joint control’ refers to the definition of ‘control’
in IFRS 10.
IFRS 11 also changes the accounting for joint
arrangements by moving from three categories
under IAS 31 to the following two categories:
Joint operation — An arrangement in which the
parties with joint control have rights to the assets
and obligations for the liabilities relating to that
arrangement. Joint operations are accounted for by
showing the party’s interest in the assets, liabilities,
revenues and expenses, and/or its relative share
of jointly controlled assets, liabilities, revenue and
expenses, if any.
Joint venture — An arrangement in which the parties
with joint control have rights to the net assets of
the arrangement. Joint ventures are accounted for
using the equity accounting method.
The option to account for joint ventures (as newly
defined) using proportionate consolidation has
been removed. Under this new classification,
Not
es T
o Th
e C
onso
lidat
ed F
inan
cial
Sta
tem
ents
For
the
year
end
ed 3
1 D
ecem
ber 2
011
36

the structure of the joint arrangement is not the
only factor considered when classifying the joint
arrangement as either a joint operation or a joint
venture, which is a change from IAS 31. Under
IFRS 11, parties are required to consider whether
a separate vehicle exists and, if so, the legal form
of the separate vehicle, the contractual terms and
conditions, and other facts and circumstances.
This standard becomes effective for annual periods
beginning on or after 1 January 2013 and will have
no impact on the Group as it is not party to any joint
arrangements.
IFRS 12 Disclosure of Interest in Other Entities IFRS 12 includes all the disclosures that were
previously required relating to an entity’s interests
in subsidiaries, joint arrangements, associates
and structured entities as well as a number of new
disclosures. An entity is now required to disclose
the judgements made to determine whether it
controls another entity. IFRS 12 will be effective for
the Group 1 July 2013 and the impact of adopting
this new standard is still being assessed.
IFRS 13 Fair Value MeasurementIFRS 13 establishes a single framework for all fair
value measurement (financial and non-financial
assets and liabilities) when fair value is required or
permitted by IFRS. IFRS 13 does not change when
an entity is required to use fair value but rather
describes how to measure fair value under IFRS
when it is permitted or required by IFRS as well as
providing clarification on certain areas. There are
also consequential amendments to other standards
to delete specific requirements for determining
fair value. The Group will need to consider the
new requirements to determine fair values going
forward. IFRS 13 will be effective for the Group 1
July 2013.
4. DefinitionsCapital employed:Capital and reserves and interest bearing debt.
Cash and cash equivalents:Comprise cash on hand and demand deposits
Not
es T
o Th
e C
onso
lidat
ed F
inan
cial
Sta
tem
ents
For
the
year
end
ed 3
1 D
ecem
ber 2
011
together with any highly liquid investments readily convertible to known amounts of cash.
Cash generated from trading:Trading profit adjusted for all non-cash items, which have been charged or credited therein.
Cost of sales:Cost of inventory sold, including distribution costs, markdowns, stock losses, promotional costs and early settlement discounts.
Current ratio:Current assets divided by current liabilities. Current liabilities include short-term borrowings and interest free liabilities.
Dividend cover:Earnings per ordinary share divided by dividends per ordinary share.
Dividend yield:Dividends per ordinary share divided by the closing share price on the Zimbabwe Stock Exchange.
Earnings per ordinary share:Basic:Earnings attributable to ordinary shareholders divided by the weighted average numberof ordinary shares in issue during the year.
Diluted:Earnings attributable to ordinary shareholders divided by the weighted average number of ordinary shares in issue during the year, increased by the weighted average number of additional ordinary shares that would have been outstanding assuming the conversion of dilutive options, and adjusted for the cost of share based payments, being the fair value of services rendered.
Earnings yield:Earnings per ordinary share divided by the closing price on The Zimbabwe Stock Exchange.
Gearing ratios:Gross:Interest bearing debt, reduced by cash and short term deposits, divided by shareholders’ funds.
Net:Interest bearing debt, reduced by trade receivables,
37

cash and short-term deposits, divided by shareholders’ funds.
Financing cost cover:Operating profit divided by net financing costs.
Net assets:Total assets less all interest free liabilities.
Net asset turn:Retail sales divided by the closing net assets.
Net equity per ordinary share:Equity divided by the number of ordinary shares in issue at the year end.
Price earnings ratio:The closing share price on the Zimbabwe Stock Exchange divided by earnings per ordinary share.
Retail sales:Includes merchandise, airtime sales and manufacturing sales to third parties net of VAT.
Return on ordinary shareholders’ equity:Earnings attributable to shareholders as a percentage of average ordinary shareholder’s equity.
Revenue:Comprises retail sales, airtime sales, manufacturing sales, debtors’ late payment charges and funeral insurance premium.
Weighted average number of ordinary shares in issue:The number of ordinary shares in issue at the beginning of the year, excluding treasury shares, increased by shares issued during the year, and
decreased by share repurchases on a time basis for the period during which they participated in the income of the Group. In the case of shares issued pursuant to a share capitalisation award in lieu of dividends, the participation is deemed to be from the date of issue.
5. Segment Information5.1 Reportable segmentsFor management purposes, the Group is organised into business units based on their products and services and has two reportable segments as follows:
Retail Consists of Edgars Chain, Expressmart Chain and Jet Chain. Offers fashion merchandise, cosmetics, kitchenware, hardware and a variety of other products to customers.
Manufacturing Consists of Carousel. Manufactures and sells a wide range of denim, ladies, children’s and gents casual wear that it supplies the retail divisions as well as other retailers.
Management monitors the operating results of its business units separately for the purpose of making decisions about resource allocation and performance assessment. Segment performance is evaluated based on operating profit or loss and is measured consistently with operating profit or loss in the consolidated financial statements. Transfer prices between operating segments are on an arm’s length basis in a manner similar to transactions with third parties.
5.2 Segments revenues and resultsThe following is an analysis of the Group’s revenue and results from continuing operations by reportable segment:
Not
es T
o Th
e C
onso
lidat
ed F
inan
cial
Sta
tem
ents
For
the
year
end
ed 3
1 D
ecem
ber 2
011
3838
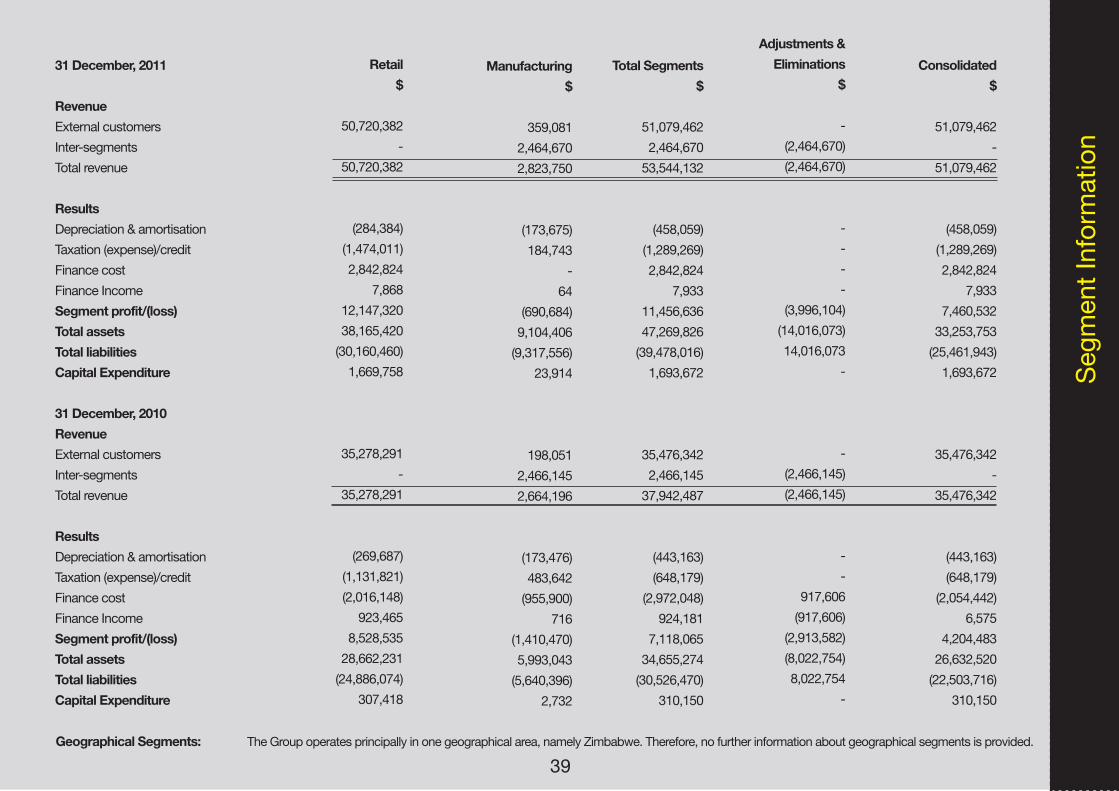
Seg
men
t Inf
orm
atio
n
31 December, 2011
RevenueExternal customers
Inter-segments
Total revenue
Results Depreciation & amortisation
Taxation (expense)/credit
Finance cost
Finance Income
Segment profit/(loss)Total assets Total liabilities Capital Expenditure
31 December, 2010RevenueExternal customers
Inter-segments
Total revenue
ResultsDepreciation & amortisation
Taxation (expense)/credit
Finance cost
Finance Income
Segment profit/(loss) Total assets Total liabilities Capital Expenditure
Retail$
50,720,382
-
50,720,382
(284,384)
(1,474,011)
2,842,824
7,868
12,147,320
38,165,420
(30,160,460)
1,669,758
35,278,291
-
35,278,291
(269,687)
(1,131,821)
(2,016,148)
923,465
8,528,535
28,662,231
(24,886,074)
307,418
Manufacturing$
359,081
2,464,670
2,823,750
(173,675)
184,743
-
64
(690,684)
9,104,406
(9,317,556)
23,914
198,051
2,466,145
2,664,196
(173,476)
483,642
(955,900)
716
(1,410,470)
5,993,043
(5,640,396)
2,732
Total Segments$
51,079,462
2,464,670
53,544,132
(458,059)
(1,289,269)
2,842,824
7,933
11,456,636
47,269,826
(39,478,016)
1,693,672
35,476,342
2,466,145
37,942,487
(443,163)
(648,179)
(2,972,048)
924,181
7,118,065
34,655,274
(30,526,470)
310,150
Adjustments &Eliminations
$
-
(2,464,670)
(2,464,670)
-
-
-
-
(3,996,104)
(14,016,073)
14,016,073
-
-
(2,466,145)
(2,466,145)
-
-
917,606
(917,606)
(2,913,582)
(8,022,754)
8,022,754
-
Consolidated$
51,079,462
-
51,079,462
(458,059)
(1,289,269)
2,842,824
7,933
7,460,532
33,253,753
(25,461,943)
1,693,672
35,476,342
-
35,476,342
(443,163)
(648,179)
(2,054,442)
6,575
4,204,483
26,632,520
(22,503,716)
310,150
39Geographical Segments: The Group operates principally in one geographical area, namely Zimbabwe. Therefore, no further information about geographical segments is provided.
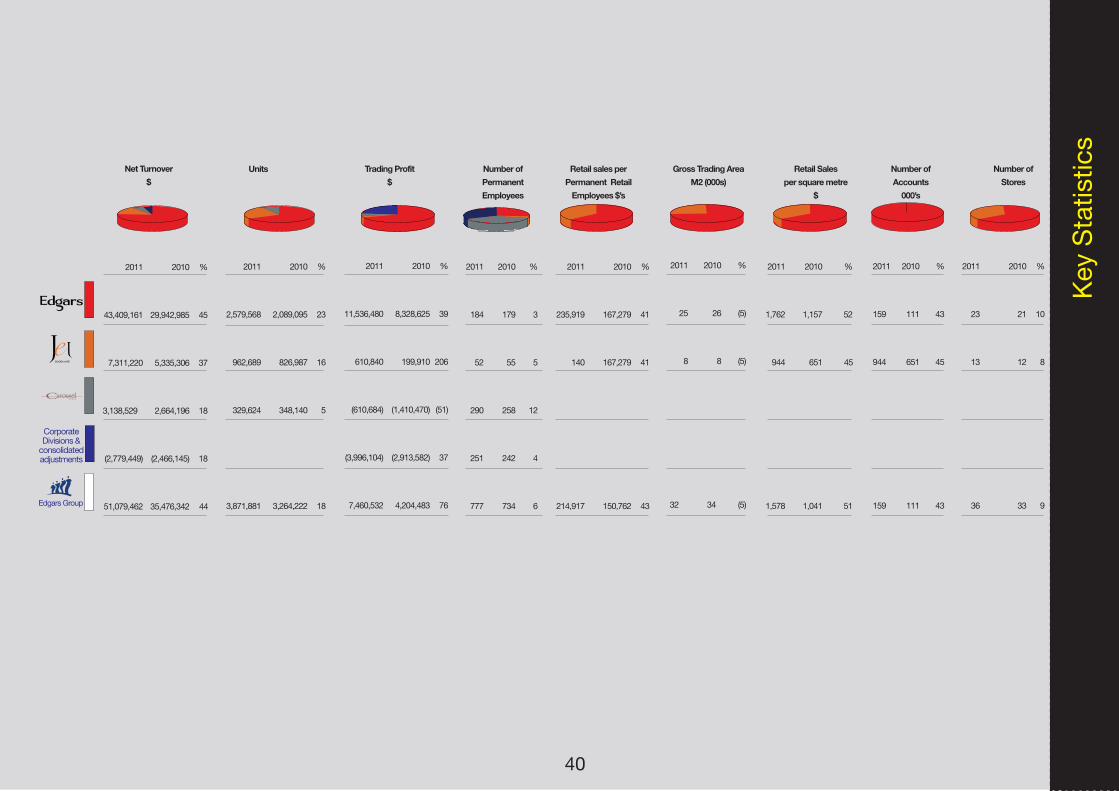
SEG
MEN
TAL
AN
ALY
SIS
Key
Sta
tistic
s
40
2011 2010 %
43,409,161 29,942,985 45
7,311,220 5,335,306 37
3,138,529 2,664,196 18
(2,779,449) (2,466,145) 18
51,079,462 35,476,342 44
2011 2010 %
2,579,568 2,089,095 23
962,689 826,987 16
329,624 348,140 5
3,871,881 3,264,222 18
2011 2010 %
11,536,480 8,328,625 39
610,840 199,910 206
(610,684) (1,410,470) (51)
(3,996,104) (2,913,582) 37
7,460,532 4,204,483 76
2011 2010 %
184 179 3
52 55 5
290 258 12
251 242 4
777 734 6
2011 2010 %
235,919 167,279 41
140 167,279 41
214,917 150,762 43
2011 2010 %
1,762 1,157 52
944 651 45
1,578 1,041 51
2011 2010 %
25 26 (5)
8 8 (5)
32 34 (5)
2011 2010 %
159 111 43
944 651 45
159 111 43
2011 2010 %
23 21 10
13 12 8
36 33 9
Net Turnover$
Units Trading Profit$
Number ofPermanent Employees
Retail sales perPermanent Retail
Employees $’s
Gross Trading AreaM2 (000s)
Retail Salesper square metre
$
Number ofAccounts
000’s
Number ofStores
Corporate Divisions &
consolidated adjustments
Edgars Group
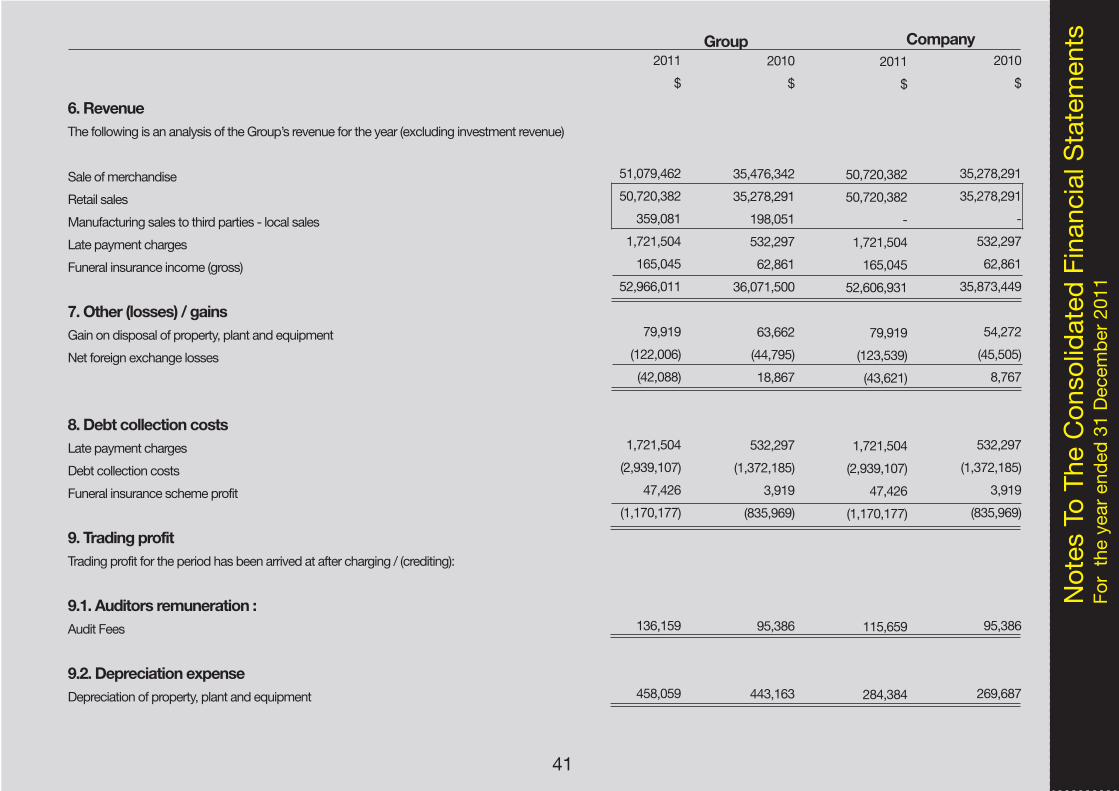
6. RevenueThe following is an analysis of the Group’s revenue for the year (excluding investment revenue)
Sale of merchandise
Retail sales
Manufacturing sales to third parties - local sales
Late payment charges
Funeral insurance income (gross)
7. Other (losses) / gainsGain on disposal of property, plant and equipment
Net foreign exchange losses
8. Debt collection costs Late payment charges
Debt collection costs
Funeral insurance scheme profit
9. Trading profitTrading profit for the period has been arrived at after charging / (crediting):
9.1. Auditors remuneration :Audit Fees
9.2. Depreciation expenseDepreciation of property, plant and equipment
2010
$
35,476,342
35,278,291
198,051
532,297
62,861
36,071,500
63,662
(44,795)
18,867
532,297
(1,372,185)
3,919
(835,969)
95,386
443,163
2011
$
50,720,382
50,720,382
-
1,721,504
165,045
52,606,931
79,919
(123,539)
(43,621)
1,721,504
(2,939,107)
47,426
(1,170,177)
115,659
284,384
2010
$
35,278,291
35,278,291
-
532,297
62,861
35,873,449
54,272
(45,505)
8,767
532,297
(1,372,185)
3,919
(835,969)
95,386
269,687
Group Company2011
$
51,079,462
50,720,382
359,081
1,721,504
165,045
52,966,011
79,919
(122,006)
(42,088)
1,721,504
(2,939,107)
47,426
(1,170,177)
136,159
458,059
Not
es T
o Th
e C
onso
lidat
ed F
inan
cial
Sta
tem
ents
For
the
year
end
ed 3
1 D
ecem
ber 2
011
41

9.3. Operating lease expensesLand and buildings: Minimum lease payments Contingent rentsSublease receipts
9.4. Fees payableManagerial, technical, administrative and secretarial fees paid outside the groupOutsourcing of IT
10. Directors and employees10.1 EmployeesThe Group employed 777 (2010: 734) permanent employees of which 487 (2010: 476) were employed in retailing and 290 (2010: 258) in the manufacturing division.
The aggregate remuneration and associated cost of permanent and casual employees including directors was: Salaries and wages Pension contributions Defined contribution plan - Medical aid contributions
Included in salaries and wages is $ nil (2010 - $544,927) relating to the voluntary retrenchment scheme. Permanent employees of the group belong to various medical aid schemes run by independent medical aid societies.
10.2 Directors’ emolumentsNon executive directors: - Fees Executive directors : - Remuneration - Retirement and medical aid benefits
2011 $
2,391,204 596,915
(213,784) 2,774,336
233,036 215,792448,828
6,428,124 473,343 365,308
7,266,776
63,551 343,250 83,883
490,684
Group Company2011
$
2,391,204 596,915(80,212)
2,907,908
284,996 215,792500,789
6,801,094 593,729 415,857
7,810,680
63,551 343,250 83,883
490,684
2010$
1,727,405 418,443
(107,914) 2,037,934
294,884 147,045 441,929
4,900,794 413,114 281,485
5,595,393
40,877 177,68617,638
236,201
2010$
1,727,442 418,443
(241,486) 1,904,400
262,182 147,045 409,227
4,454,907 309,478 223,199
4,987,584
40,877 177,686 17,638
236,201
Not
es T
o Th
e C
onso
lidat
ed F
inan
cial
Sta
tem
ents
For
the
year
end
ed 3
1 D
ecem
ber 2
011
42

Group Company
10.3. Pension fundsThe Group’s operating companies and all employees contribute to both of the following pension funds :
Edgars Pension FundThe Edgars Pension Fund is a defined contribution fund and provides pensions and other associated benefits to all permanent staff of the group, their spouses and dependants. Member contributions to the fund are set at 5% whilst the employer rate is set at 15% of monthly pensionable salaries, less the amount of the employer’s contributions to the National Social Security Authority. Employer contributions are charged against trading profit. The Fund is governed by legislation in the Pension and Provident Funds Act, Chapter 24:09
National Social Security Authority SchemeThe Group’s obligations under the scheme are limited to specific contributions legislated from time to time and as promulgated under the National Social Security Authority Act, Chapter 17:04. These are 3% of pensionable monthly emoluments for each employee up to a maximum salary of $200 per month.
Contributions to the above aforementioned funds charged against trading profit:
Edgars Pension Fund National Social Security Authority
10.4. Post-retirement medical aidPost-retirement medical aid net movement charged to trading profit (note 21.1)
10.5. Equity-settled share-based paymentsEmployee share option scheme (Group and Company)The Group has an ownership-based compensation scheme for executives and senior employees. The following shares have been set aside for this plan, as approved by shareholders at previous annual general meetings.
Resolution date:
29 May 2007 10 June 2010
Not
es T
o Th
e C
onso
lidat
ed F
inan
cial
Sta
tem
ents
For
the
year
end
ed 3
1 D
ecem
ber 2
011
43
2011 $
414,849 58,494
473,343
21,681
2010$
327,747 85,367
413,114
(16,375)
2010Shares set aside:
15,000,000 16,000,00031,000,000
2010$
250,62958,850
309,478
(16,375)
2011 $
509,664 84,065
593,729
21,681
2011Shares set aside:
15,000,000 16,000,00031,000,000
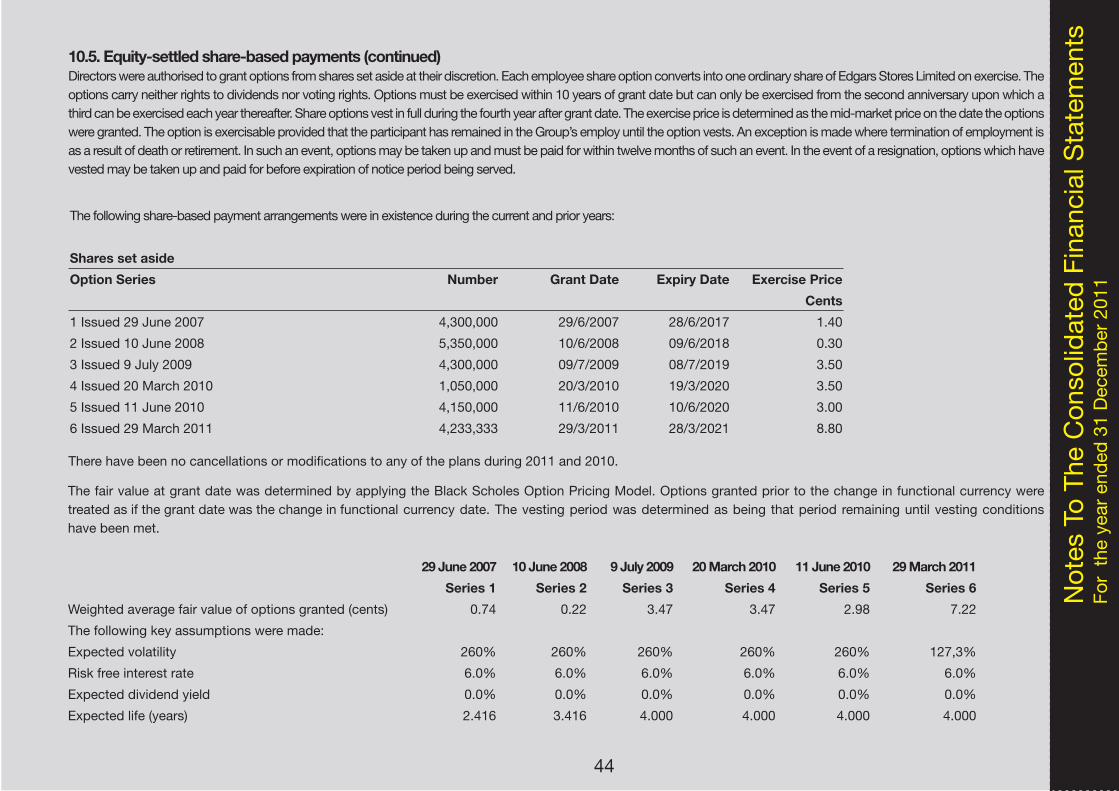
Not
es T
o Th
e C
onso
lidat
ed F
inan
cial
Sta
tem
ents
For
the
year
end
ed 3
1 D
ecem
ber 2
011
10.5. Equity-settled share-based payments (continued)Directors were authorised to grant options from shares set aside at their discretion. Each employee share option converts into one ordinary share of Edgars Stores Limited on exercise. The options carry neither rights to dividends nor voting rights. Options must be exercised within 10 years of grant date but can only be exercised from the second anniversary upon which a third can be exercised each year thereafter. Share options vest in full during the fourth year after grant date. The exercise price is determined as the mid-market price on the date the options were granted. The option is exercisable provided that the participant has remained in the Group’s employ until the option vests. An exception is made where termination of employment is as a result of death or retirement. In such an event, options may be taken up and must be paid for within twelve months of such an event. In the event of a resignation, options which have vested may be taken up and paid for before expiration of notice period being served.
The following share-based payment arrangements were in existence during the current and prior years:
Shares set aside
Option Series Number Grant Date Expiry Date Exercise Price
Cents
1 Issued 29 June 2007 4,300,000 29/6/2007 28/6/2017 1.40
2 Issued 10 June 2008 5,350,000 10/6/2008 09/6/2018 0.30
3 Issued 9 July 2009 4,300,000 09/7/2009 08/7/2019 3.50
4 Issued 20 March 2010 1,050,000 20/3/2010 19/3/2020 3.50
5 Issued 11 June 2010 4,150,000 11/6/2010 10/6/2020 3.00
6 Issued 29 March 2011 4,233,333 29/3/2011 28/3/2021 8.80
The fair value at grant date was determined by applying the Black Scholes Option Pricing Model. Options granted prior to the change in functional currency were treated as if the grant date was the change in functional currency date. The vesting period was determined as being that period remaining until vesting conditions have been met.
There have been no cancellations or modifications to any of the plans during 2011 and 2010.
29 June 2007 10 June 2008 9 July 2009 20 March 2010 11 June 2010 29 March 2011
Series 1 Series 2 Series 3 Series 4 Series 5 Series 6
Weighted average fair value of options granted (cents) 0.74 0.22 3.47 3.47 2.98 7.22
The following key assumptions were made:
Expected volatility 260% 260% 260% 260% 260% 127,3%
Risk free interest rate 6.0% 6.0% 6.0% 6.0% 6.0% 6.0%
Expected dividend yield 0.0% 0.0% 0.0% 0.0% 0.0% 0.0%
Expected life (years) 2.416 3.416 4.000 4.000 4.000 4.000
44
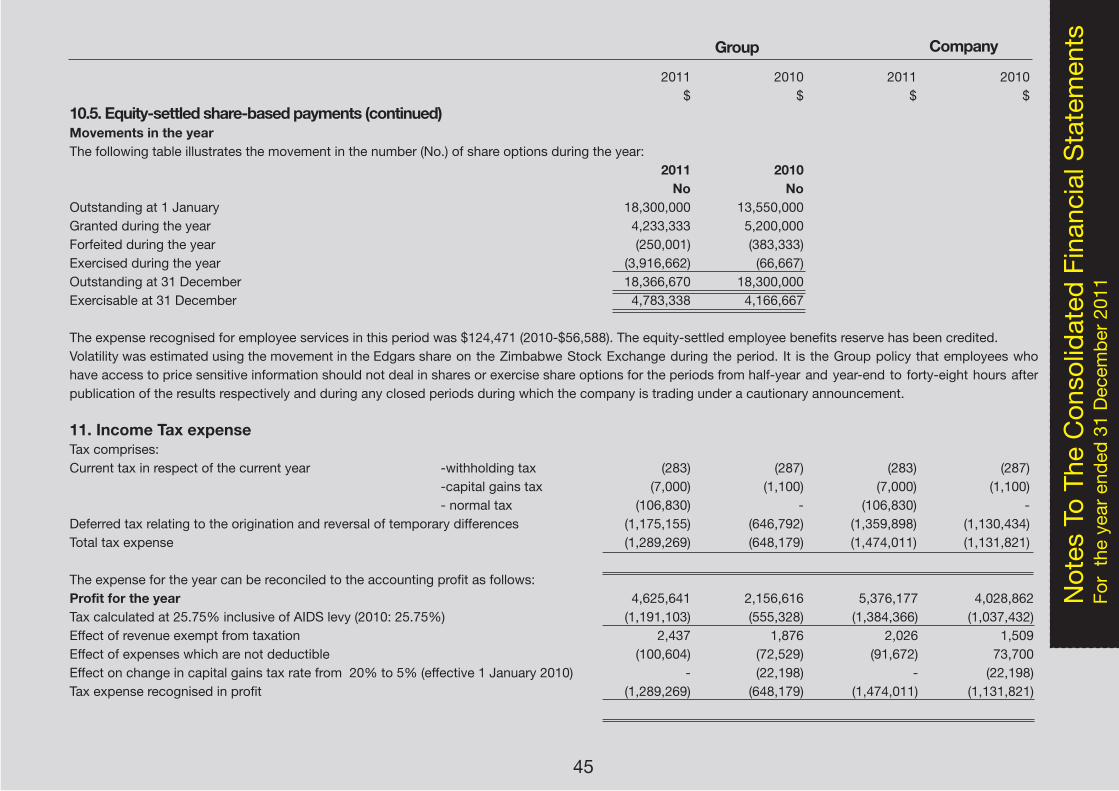
Not
es T
o Th
e C
onso
lidat
ed F
inan
cial
Sta
tem
ents
For
the
year
end
ed 3
1 D
ecem
ber 2
011
Group Company
2011 2010 2011 2010 $ $ $ $ 10.5. Equity-settled share-based payments (continued)Movements in the yearThe following table illustrates the movement in the number (No.) of share options during the year: 2011 2010 No No Outstanding at 1 January 18,300,000 13,550,000Granted during the year 4,233,333 5,200,000 Forfeited during the year (250,001) (383,333) Exercised during the year (3,916,662) (66,667) Outstanding at 31 December 18,366,670 18,300,000 Exercisable at 31 December 4,783,338 4,166,667
The expense recognised for employee services in this period was $124,471 (2010-$56,588). The equity-settled employee benefits reserve has been credited. Volatility was estimated using the movement in the Edgars share on the Zimbabwe Stock Exchange during the period. It is the Group policy that employees who have access to price sensitive information should not deal in shares or exercise share options for the periods from half-year and year-end to forty-eight hours after publication of the results respectively and during any closed periods during which the company is trading under a cautionary announcement.
11. Income Tax expenseTax comprises:Current tax in respect of the current year -withholding tax (283) (287) (283) (287) -capital gains tax (7,000) (1,100) (7,000) (1,100) - normal tax (106,830) - (106,830) -Deferred tax relating to the origination and reversal of temporary differences (1,175,155) (646,792) (1,359,898) (1,130,434)Total tax expense (1,289,269) (648,179) (1,474,011) (1,131,821)
The expense for the year can be reconciled to the accounting profit as follows:Profit for the year 4,625,641 2,156,616 5,376,177 4,028,862 Tax calculated at 25.75% inclusive of AIDS levy (2010: 25.75%) (1,191,103) (555,328) (1,384,366) (1,037,432)Effect of revenue exempt from taxation 2,437 1,876 2,026 1,509Effect of expenses which are not deductible (100,604) (72,529) (91,672) 73,700Effect on change in capital gains tax rate from 20% to 5% (effective 1 January 2010) - (22,198) - (22,198)Tax expense recognised in profit (1,289,269) (648,179) (1,474,011) (1,131,821)
45
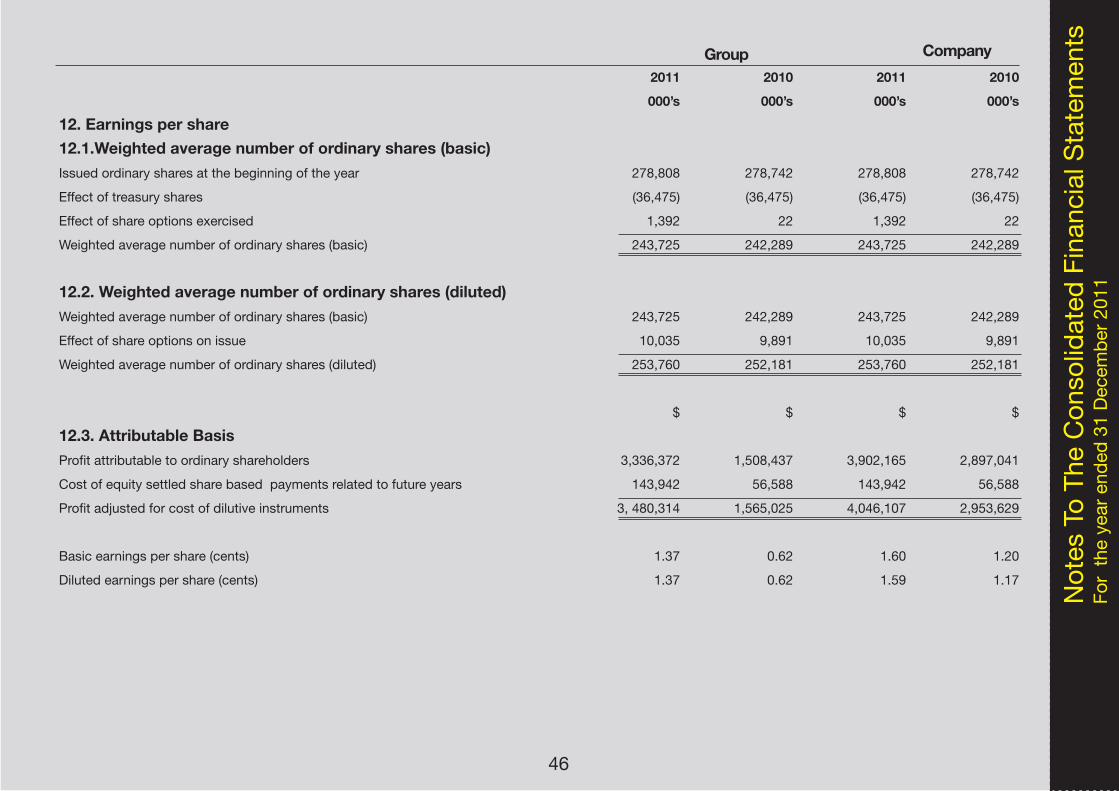
Group Company
2011 2010 2011 2010
000’s 000’s 000’s 000’s
12. Earnings per share12.1.Weighted average number of ordinary shares (basic) Issued ordinary shares at the beginning of the year 278,808 278,742 278,808 278,742
Effect of treasury shares (36,475) (36,475) (36,475) (36,475)
Effect of share options exercised 1,392 22 1,392 22
Weighted average number of ordinary shares (basic) 243,725 242,289 243,725 242,289
12.2. Weighted average number of ordinary shares (diluted)Weighted average number of ordinary shares (basic) 243,725 242,289 243,725 242,289
Effect of share options on issue 10,035 9,891 10,035 9,891
Weighted average number of ordinary shares (diluted) 253,760 252,181 253,760 252,181
$ $ $ $
12.3. Attributable BasisProfit attributable to ordinary shareholders 3,336,372 1,508,437 3,902,165 2,897,041
Cost of equity settled share based payments related to future years 143,942 56,588 143,942 56,588
Profit adjusted for cost of dilutive instruments 3, 480,314 1,565,025 4,046,107 2,953,629
Basic earnings per share (cents) 1.37 0.62 1.60 1.20
Diluted earnings per share (cents) 1.37 0.62 1.59 1.17
Not
es T
o Th
e C
onso
lidat
ed F
inan
cial
Sta
tem
ents
For
the
year
end
ed 3
1 D
ecem
ber 2
011
46
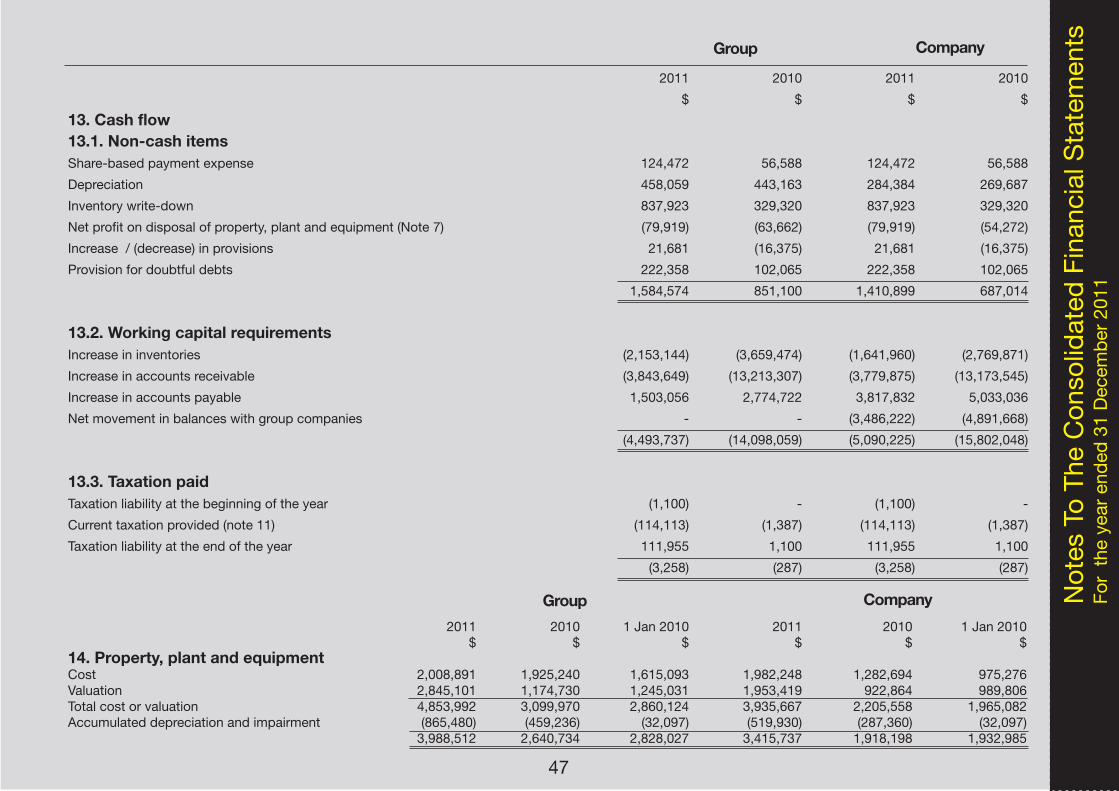
Group Company
Group Company
2011 2010 2011 2010
$ $ $ $
13. Cash flow13.1. Non-cash itemsShare-based payment expense 124,472 56,588 124,472 56,588
Depreciation 458,059 443,163 284,384 269,687
Inventory write-down 837,923 329,320 837,923 329,320
Net profit on disposal of property, plant and equipment (Note 7) (79,919) (63,662) (79,919) (54,272)
Increase / (decrease) in provisions 21,681 (16,375) 21,681 (16,375)
Provision for doubtful debts 222,358 102,065 222,358 102,065
1,584,574 851,100 1,410,899 687,014
13.2. Working capital requirements Increase in inventories (2,153,144) (3,659,474) (1,641,960) (2,769,871)
Increase in accounts receivable (3,843,649) (13,213,307) (3,779,875) (13,173,545)
Increase in accounts payable 1,503,056 2,774,722 3,817,832 5,033,036
Net movement in balances with group companies - - (3,486,222) (4,891,668)
(4,493,737) (14,098,059) (5,090,225) (15,802,048)
13.3. Taxation paidTaxation liability at the beginning of the year (1,100) - (1,100) -
Current taxation provided (note 11) (114,113) (1,387) (114,113) (1,387)
Taxation liability at the end of the year 111,955 1,100 111,955 1,100
(3,258) (287) (3,258) (287)
Not
es T
o Th
e C
onso
lidat
ed F
inan
cial
Sta
tem
ents
For
the
year
end
ed 3
1 D
ecem
ber 2
011
47
2011 2010 1 Jan 2010 2011 2010 1 Jan 2010 $ $ $ $ $ $ 14. Property, plant and equipmentCost 2,008,891 1,925,240 1,615,093 1,982,248 1,282,694 975,276Valuation 2,845,101 1,174,730 1,245,031 1,953,419 922,864 989,806Total cost or valuation 4,853,992 3,099,970 2,860,124 3,935,667 2,205,558 1,965,082Accumulated depreciation and impairment (865,480) (459,236) (32,097) (519,930) (287,360) (32,097) 3,988,512 2,640,734 2,828,027 3,415,737 1,918,198 1,932,985
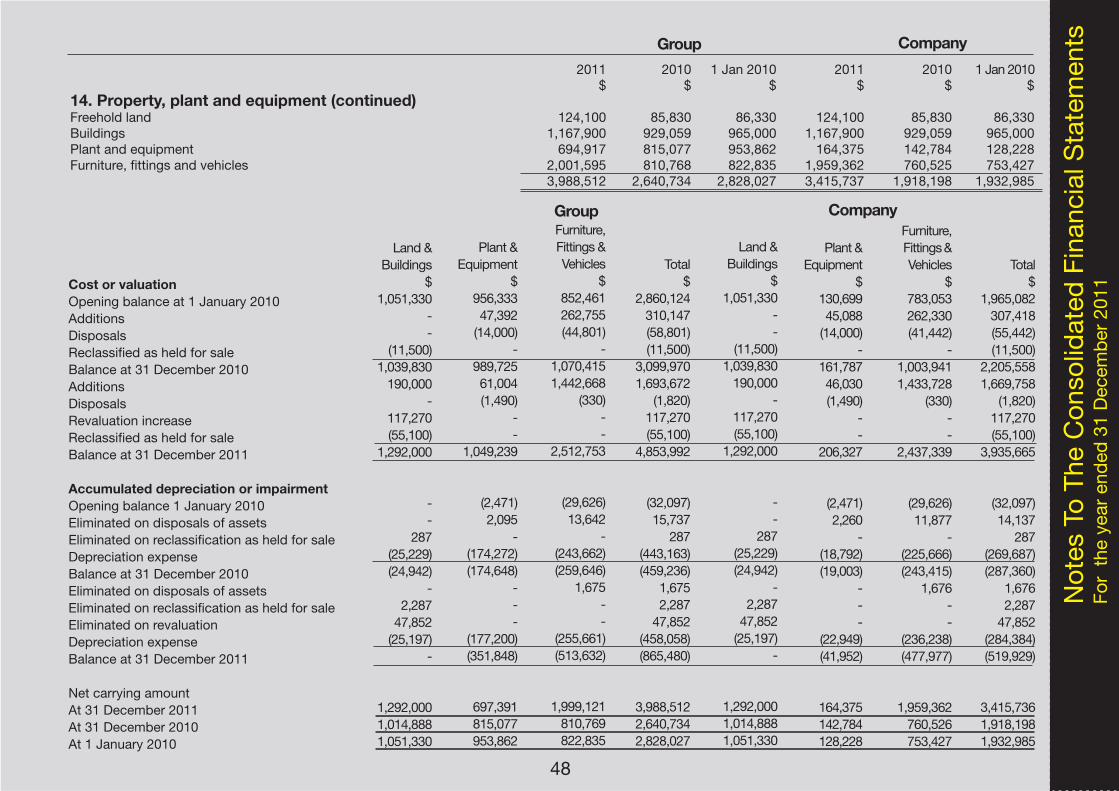
2011 2010 1 Jan 2010 2011 2010 1 Jan 2010 $ $ $ $ $ $ 14. Property, plant and equipment (continued)Freehold land 124,100 85,830 86,330 124,100 85,830 86,330Buildings 1,167,900 929,059 965,000 1,167,900 929,059 965,000Plant and equipment 694,917 815,077 953,862 164,375 142,784 128,228Furniture, fittings and vehicles 2,001,595 810,768 822,835 1,959,362 760,525 753,427 3,988,512 2,640,734 2,828,027 3,415,737 1,918,198 1,932,985
Not
es T
o Th
e C
onso
lidat
ed F
inan
cial
Sta
tem
ents
For
the
year
end
ed 3
1 D
ecem
ber 2
011
48
Group Company
Cost or valuationOpening balance at 1 January 2010 Additions Disposals Reclassified as held for sale Balance at 31 December 2010 AdditionsDisposals Revaluation increase Reclassified as held for sale Balance at 31 December 2011
Accumulated depreciation or impairmentOpening balance 1 January 2010 Eliminated on disposals of assets Eliminated on reclassification as held for saleDepreciation expense Balance at 31 December 2010 Eliminated on disposals of assets Eliminated on reclassification as held for sale Eliminated on revaluation Depreciation expense Balance at 31 December 2011
Net carrying amountAt 31 December 2011At 31 December 2010 At 1 January 2010
Land & Buildings
$1,051,330
--
(11,500)1,039,830
190,000-
117,270(55,100)
1,292,000
--
287(25,229)(24,942)
-2,287
47,852(25,197)
-
1,292,000 1,014,888 1,051,330
Total$
2,860,124 310,147(58,801) (11,500)
3,099,970 1,693,672
(1,820) 117,270(55,100)
4,853,992
(32,097) 15,737
287(443,163)(459,236)
1,675 2,287
47,852(458,058)(865,480)
3,988,512 2,640,734 2,828,027
Plant & Equipment
$956,333 47,392
(14,000) -
989,725 61,004(1,490)
- -
1,049,239
(2,471) 2,095
-(174,272)(174,648)
---
(177,200)(351,848)
697,391 815,077 953,862
Land & Buildings
$1,051,330
--
(11,500)1,039,830
190,000-
117,270(55,100)
1,292,000
--
287(25,229)(24,942)
-2,287
47,852(25,197)
-
1,292,0001,014,888 1,051,330
Furniture,Fittings & Vehicles
$852,461 262,755(44,801)
-1,070,415 1,442,668
(330) --
2,512,753
(29,626) 13,642
- (243,662)(259,646)
1,675--
(255,661)(513,632)
1,999,121 810,769 822,835
Plant & Equipment
$130,699 45,088
(14,000) -
161,787 46,030(1,490)
- -
206,327
(2,471) 2,260
-(18,792)(19,003)
---
(22,949)(41,952)
164,375 142,784 128,228
Furniture,Fittings & Vehicles
$783,053 262,330(41,442)
-1,003,941 1,433,728
(330) --
2,437,339
(29,626) 11,877
- (225,666)(243,415)
1,676--
(236,238)(477,977)
1,959,362 760,526 753,427
Total$
1,965,082 307,418(55,442) (11,500)
2,205,558 1,669,758
(1,820) 117,270(55,100)
3,935,665
(32,097) 14,137
287(269,687)(287,360)
1,676 2,287
47,852(284,384)(519,929)
3,415,736 1,918,198 1,932,985
Group Company
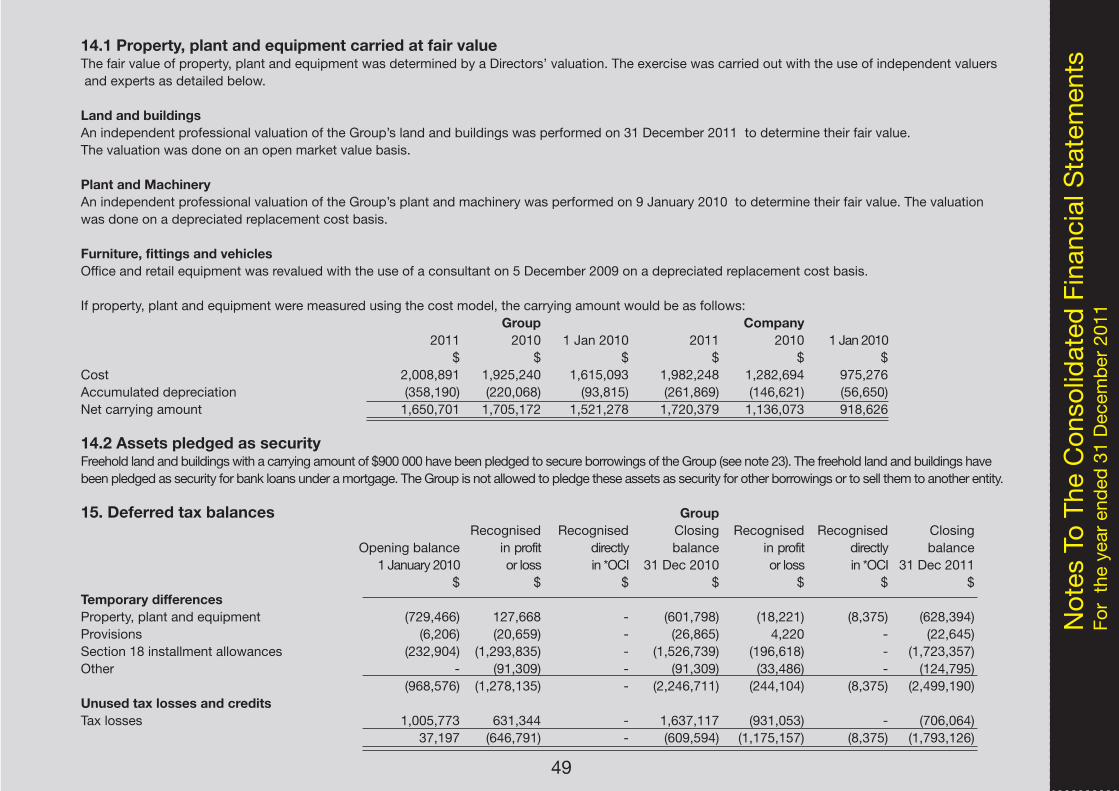
14.1 Property, plant and equipment carried at fair valueThe fair value of property, plant and equipment was determined by a Directors’ valuation. The exercise was carried out with the use of independent valuers and experts as detailed below.
Land and buildings An independent professional valuation of the Group’s land and buildings was performed on 31 December 2011 to determine their fair value. The valuation was done on an open market value basis.
Plant and MachineryAn independent professional valuation of the Group’s plant and machinery was performed on 9 January 2010 to determine their fair value. The valuationwas done on a depreciated replacement cost basis.
Furniture, fittings and vehicles Office and retail equipment was revalued with the use of a consultant on 5 December 2009 on a depreciated replacement cost basis.
If property, plant and equipment were measured using the cost model, the carrying amount would be as follows: Group Company 2011 2010 1 Jan 2010 2011 2010 1 Jan 2010 $ $ $ $ $ $Cost 2,008,891 1,925,240 1,615,093 1,982,248 1,282,694 975,276 Accumulated depreciation (358,190) (220,068) (93,815) (261,869) (146,621) (56,650)Net carrying amount 1,650,701 1,705,172 1,521,278 1,720,379 1,136,073 918,626
14.2 Assets pledged as securityFreehold land and buildings with a carrying amount of $900 000 have been pledged to secure borrowings of the Group (see note 23). The freehold land and buildings have been pledged as security for bank loans under a mortgage. The Group is not allowed to pledge these assets as security for other borrowings or to sell them to another entity. 15. Deferred tax balances Group Recognised Recognised Closing Recognised Recognised Closing Opening balance in profit directly balance in profit directly balance 1 January 2010 or loss in *OCI 31 Dec 2010 or loss in *OCI 31 Dec 2011 $ $ $ $ $ $ $Temporary differencesProperty, plant and equipment (729,466) 127,668 - (601,798) (18,221) (8,375) (628,394)Provisions (6,206) (20,659) - (26,865) 4,220 - (22,645)Section 18 installment allowances (232,904) (1,293,835) - (1,526,739) (196,618) - (1,723,357)Other - (91,309) - (91,309) (33,486) - (124,795) (968,576) (1,278,135) - (2,246,711) (244,104) (8,375) (2,499,190)Unused tax losses and creditsTax losses 1,005,773 631,344 - 1,637,117 (931,053) - (706,064) 37,197 (646,791) - (609,594) (1,175,157) (8,375) (1,793,126)
Not
es T
o Th
e C
onso
lidat
ed F
inan
cial
Sta
tem
ents
For
the
year
end
ed 3
1 D
ecem
ber 2
011
49
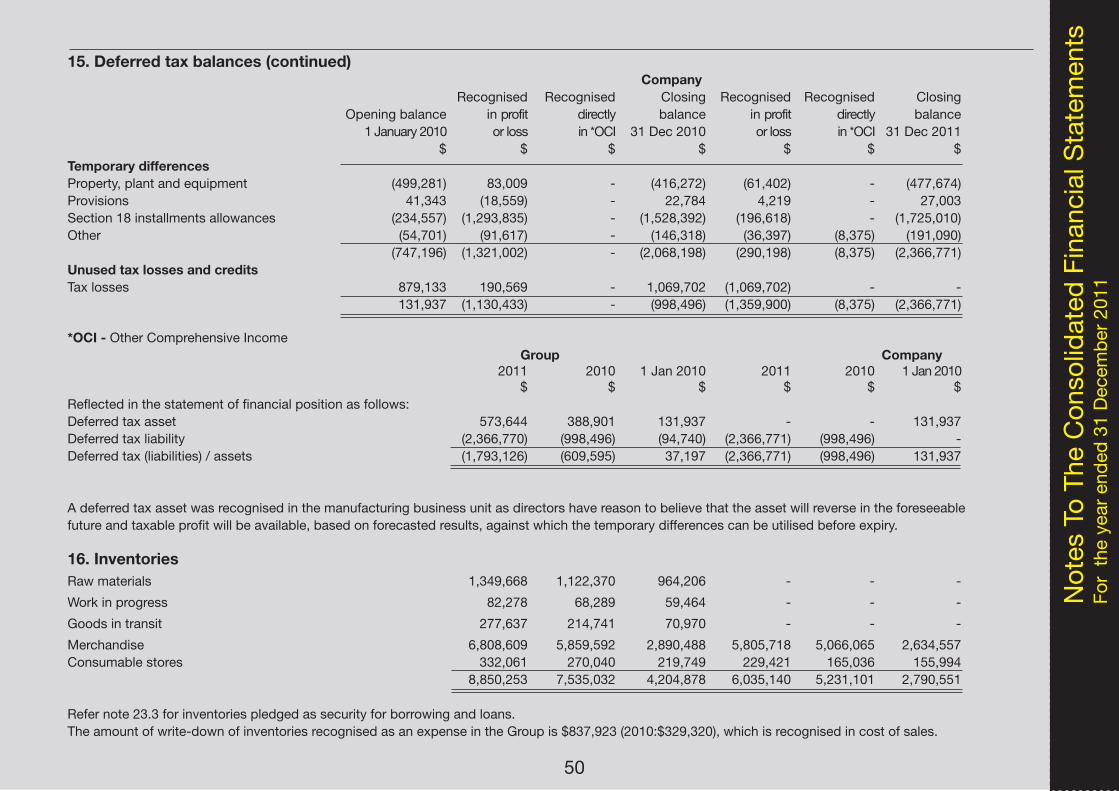
Not
es T
o Th
e C
onso
lidat
ed F
inan
cial
Sta
tem
ents
For
the
year
end
ed 3
1 D
ecem
ber 2
011
15. Deferred tax balances (continued) Company Recognised Recognised Closing Recognised Recognised Closing Opening balance in profit directly balance in profit directly balance 1 January 2010 or loss in *OCI 31 Dec 2010 or loss in *OCI 31 Dec 2011 $ $ $ $ $ $ $Temporary differencesProperty, plant and equipment (499,281) 83,009 - (416,272) (61,402) - (477,674)Provisions 41,343 (18,559) - 22,784 4,219 - 27,003Section 18 installments allowances (234,557) (1,293,835) - (1,528,392) (196,618) - (1,725,010)Other (54,701) (91,617) - (146,318) (36,397) (8,375) (191,090) (747,196) (1,321,002) - (2,068,198) (290,198) (8,375) (2,366,771)Unused tax losses and creditsTax losses 879,133 190,569 - 1,069,702 (1,069,702) - - 131,937 (1,130,433) - (998,496) (1,359,900) (8,375) (2,366,771)
*OCI - Other Comprehensive Income Group Company 2011 2010 1 Jan 2010 2011 2010 1 Jan 2010 $ $ $ $ $ $Reflected in the statement of financial position as follows: Deferred tax asset 573,644 388,901 131,937 - - 131,937Deferred tax liability (2,366,770) (998,496) (94,740) (2,366,771) (998,496) -Deferred tax (liabilities) / assets (1,793,126) (609,595) 37,197 (2,366,771) (998,496) 131,937
A deferred tax asset was recognised in the manufacturing business unit as directors have reason to believe that the asset will reverse in the foreseeablefuture and taxable profit will be available, based on forecasted results, against which the temporary differences can be utilised before expiry.
16. Inventories Raw materials 1,349,668 1,122,370 964,206 - - -
Work in progress 82,278 68,289 59,464 - - -
Goods in transit 277,637 214,741 70,970 - - -
Merchandise 6,808,609 5,859,592 2,890,488 5,805,718 5,066,065 2,634,557Consumable stores 332,061 270,040 219,749 229,421 165,036 155,994 8,850,253 7,535,032 4,204,878 6,035,140 5,231,101 2,790,551
Refer note 23.3 for inventories pledged as security for borrowing and loans.The amount of write-down of inventories recognised as an expense in the Group is $837,923 (2010:$329,320), which is recognised in cost of sales.
50
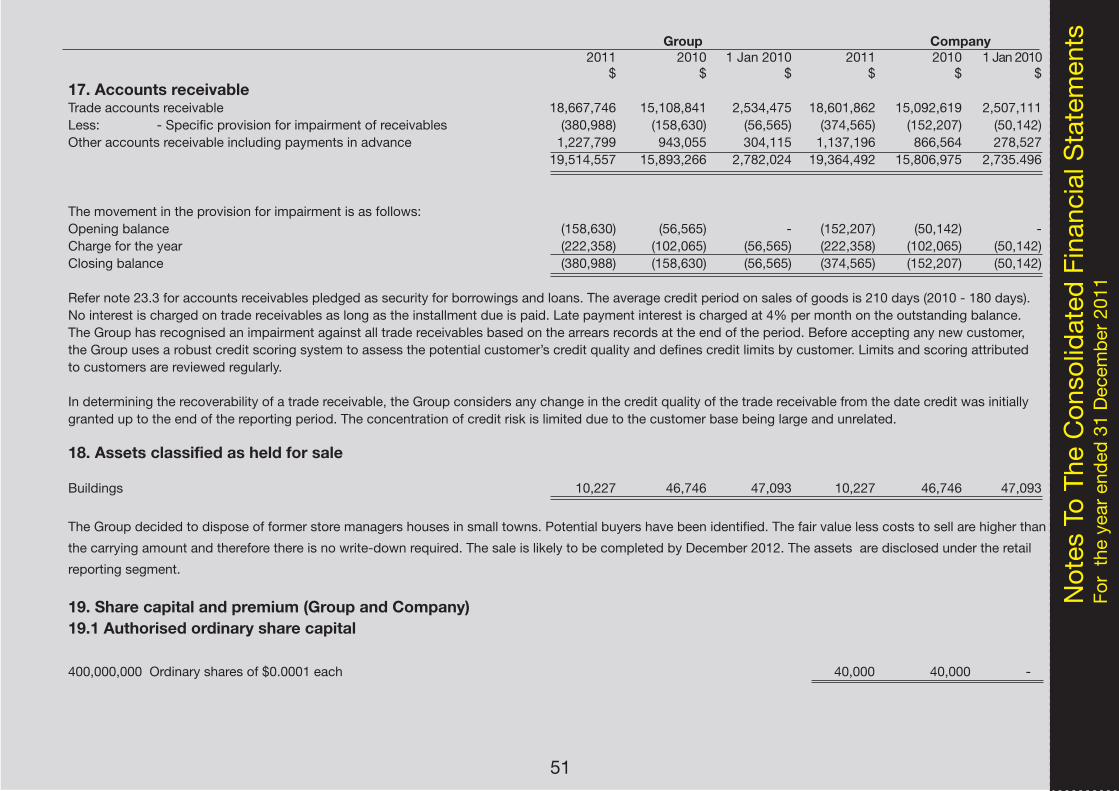
Group Company 2011 2010 1 Jan 2010 2011 2010 1 Jan 2010 $ $ $ $ $ $17. Accounts receivableTrade accounts receivable 18,667,746 15,108,841 2,534,475 18,601,862 15,092,619 2,507,111Less: - Specific provision for impairment of receivables (380,988) (158,630) (56,565) (374,565) (152,207) (50,142) Other accounts receivable including payments in advance 1,227,799 943,055 304,115 1,137,196 866,564 278,527 19,514,557 15,893,266 2,782,024 19,364,492 15,806,975 2,735.496
The movement in the provision for impairment is as follows: Opening balance (158,630) (56,565) - (152,207) (50,142) -Charge for the year (222,358) (102,065) (56,565) (222,358) (102,065) (50,142)Closing balance (380,988) (158,630) (56,565) (374,565) (152,207) (50,142)
Refer note 23.3 for accounts receivables pledged as security for borrowings and loans. The average credit period on sales of goods is 210 days (2010 - 180 days). No interest is charged on trade receivables as long as the installment due is paid. Late payment interest is charged at 4% per month on the outstanding balance.The Group has recognised an impairment against all trade receivables based on the arrears records at the end of the period. Before accepting any new customer,the Group uses a robust credit scoring system to assess the potential customer’s credit quality and defines credit limits by customer. Limits and scoring attributedto customers are reviewed regularly.
In determining the recoverability of a trade receivable, the Group considers any change in the credit quality of the trade receivable from the date credit was initiallygranted up to the end of the reporting period. The concentration of credit risk is limited due to the customer base being large and unrelated.
18. Assets classified as held for sale
Buildings 10,227 46,746 47,093 10,227 46,746 47,093
The Group decided to dispose of former store managers houses in small towns. Potential buyers have been identified. The fair value less costs to sell are higher than
the carrying amount and therefore there is no write-down required. The sale is likely to be completed by December 2012. The assets are disclosed under the retail
reporting segment.
19. Share capital and premium (Group and Company)19.1 Authorised ordinary share capital
400,000,000 Ordinary shares of $0.0001 each 40,000 40,000 -
Not
es T
o Th
e C
onso
lidat
ed F
inan
cial
Sta
tem
ents
For
the
year
end
ed 3
1 D
ecem
ber 2
011
51

19. Share capital and premium (continued)
19.2 Issued ordinary shares and premium Issued Number Share Share capital of shares capital premium total 000’s $ $ $Balance 1 January 2010 278,742 - 5,601 5,601Share redenomination - 27,874 - 27,874Issue of shares under employee share option plan 67 7 926 933Balance at 31 December 2010 278,808 27,881 6,527 34,408Issue of shares under employee share option plan 3,917 392 45,026 45,417Balance at 31 December 2011 282,725 28,273 51,553 79,825
Fully paid ordinary shares, carry one vote per share and carry a right to dividends.
Included in shares are shares held by special purpose entities - Zimedgroup Employee Trust (35,950,445 shares) and Edgars Employee Share Trust Company (524,150 shares).
In relation to the remaining 117,274,964 unissued shares, 100,000,000 are under the control of the Directors for an unlimited period, subject to the limitations contained in section 183 of the Companies Act (Chapter 24:03) and the balance of 17,274,964 are under the control of the company in a general meeting. Group Company 2011 2010 1 Jan 2010 2011 2010 1 Jan 2010 $ $ $ $ $ $20. Other reserves Equity-settled employee benefits reserve 237,089 112,617 56,029 237,089 112,617 56,029Change in functional currency 928,907 932,267 3,723,002 420,932 420,932 1,649,933Revaluation reserve 1,022,565 865,824 932,824 824,676 667,931 734,931 2,188,565 1,910,708 4,711,855 1,482,697 1,201,480 2,440,893Nature and purpose of reservesRevaluation reserveThe revaluation reserve is used to record increases in the fair value of property, plant equipment and decreases to the extent that such decreases relateto an increase on the same asset previously recognised in equity.Change in functional currency reserveThis arose as a result of change in functional currency from the Zimbabwe dollar to the United States dollar. It represents the residual equity in existence as at the date of of the change over and has been designated as Non-Distributable Reserve Equity-settled employee benefits reserve The equity-settled employee benefits reserve is used to record the value of equity settled share-based payment transactions provided to employees, including key management personnel, as part of their remuneration.
Not
es T
o Th
e C
onso
lidat
ed F
inan
cial
Sta
tem
ents
For
the
year
end
ed 3
1 D
ecem
ber 2
011
52
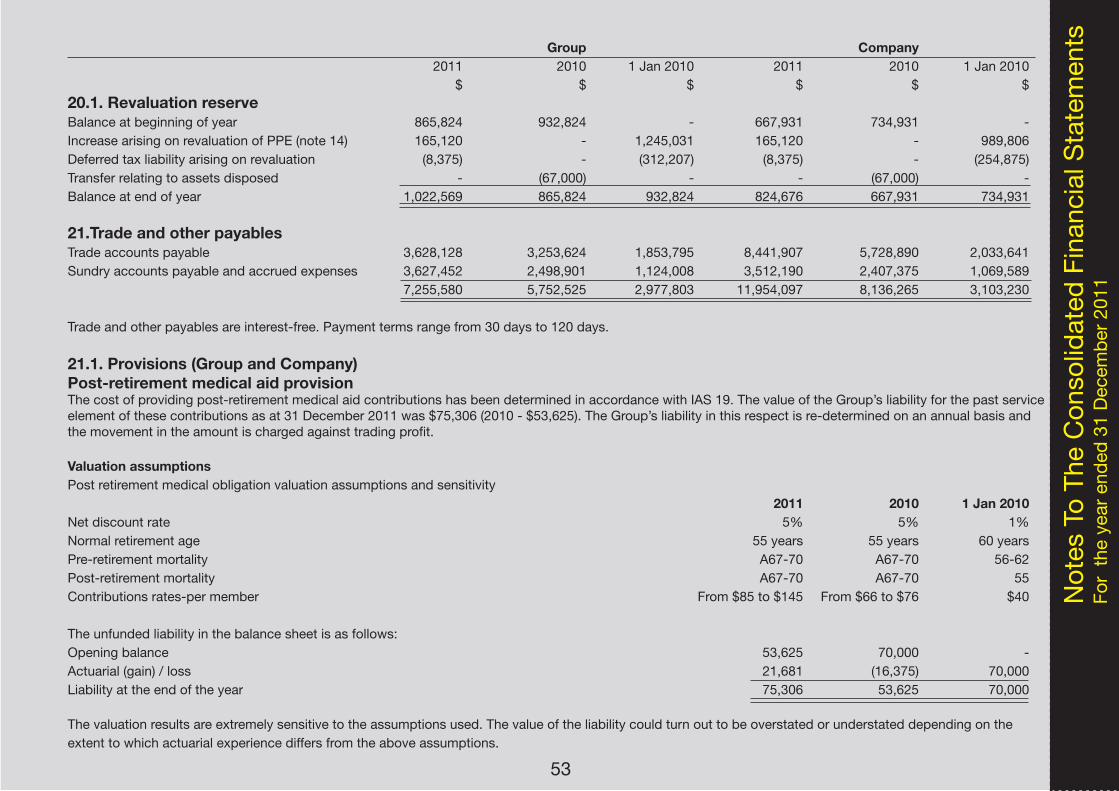
Group Company 2011 2010 1 Jan 2010 2011 2010 1 Jan 2010 $ $ $ $ $ $20.1. Revaluation reserveBalance at beginning of year 865,824 932,824 - 667,931 734,931 - Increase arising on revaluation of PPE (note 14) 165,120 - 1,245,031 165,120 - 989,806Deferred tax liability arising on revaluation (8,375) - (312,207) (8,375) - (254,875) Transfer relating to assets disposed - (67,000) - - (67,000) - Balance at end of year 1,022,569 865,824 932,824 824,676 667,931 734,931
21.Trade and other payablesTrade accounts payable 3,628,128 3,253,624 1,853,795 8,441,907 5,728,890 2,033,641Sundry accounts payable and accrued expenses 3,627,452 2,498,901 1,124,008 3,512,190 2,407,375 1,069,589 7,255,580 5,752,525 2,977,803 11,954,097 8,136,265 3,103,230
Trade and other payables are interest-free. Payment terms range from 30 days to 120 days.
21.1. Provisions (Group and Company)Post-retirement medical aid provision The cost of providing post-retirement medical aid contributions has been determined in accordance with IAS 19. The value of the Group’s liability for the past service element of these contributions as at 31 December 2011 was $75,306 (2010 - $53,625). The Group’s liability in this respect is re-determined on an annual basis and the movement in the amount is charged against trading profit.
Valuation assumptionsPost retirement medical obligation valuation assumptions and sensitivity 2011 2010 1 Jan 2010Net discount rate 5% 5% 1% Normal retirement age 55 years 55 years 60 yearsPre-retirement mortality A67-70 A67-70 56-62 Post-retirement mortality A67-70 A67-70 55 Contributions rates-per member From $85 to $145 From $66 to $76 $40
The unfunded liability in the balance sheet is as follows:Opening balance 53,625 70,000 - Actuarial (gain) / loss 21,681 (16,375) 70,000Liability at the end of the year 75,306 53,625 70,000
The valuation results are extremely sensitive to the assumptions used. The value of the liability could turn out to be overstated or understated depending on the extent to which actuarial experience differs from the above assumptions.
Not
es T
o Th
e C
onso
lidat
ed F
inan
cial
Sta
tem
ents
For
the
year
end
ed 3
1 D
ecem
ber 2
011
53

Not
es T
o Th
e C
onso
lidat
ed F
inan
cial
Sta
tem
ents
For
the
year
end
ed 3
1 D
ecem
ber 2
011
2011 2010 1 Jan 2010 2011 2010 1 Jan 2010 $ $ $ $ $ $
Central assumption Decrease 1% Increase 1% $ $ $ Members 75,306 83,022 68,733 Accrued liability - % change - 10% (9%)
22. Current tax liabilitiesNormal tax 106,830 - - 106,830 - -Capital gains tax 5,125 1,100 - 5,125 1,100 - 111,955 1,100 - 111,955 1,100 -
23. Interest bearing loans and borrowingsBank overdrafts 1,399,869 2,209,375 568,705 1,399,869 2,207,991 567,770Bills discounted 10,152,000 13,488,595 4,089,397 10,152,000 13,488,595 4,089,397Loans 4,100,462 - - 4,100,462 - - 15,652,332 15,697,970 4,658,101 15,652,332 15,696,586 4,657,166Less: Long term portion of loan disclosed under non-current liabilities (1,501,930) - - (1,501,930) - - Current portion 14,150,402 15,697,970 4,658,101 14,150,402 15,696,586 4,657,166
23.1. Unsecured - at amortised costBank overdrafts 926,073 1,416,626 69,469 926,073 1,416,626 68,534Bills discounted 1,152,000 5,107,000 2,731,876 1,152,000 5,107,000 2,731,876 2,078,073 6,523,626 2,801,345 2,078,073 6,523,626 2,800,410
23.2. Secured - at amortised costBank overdrafts 473,796 792,749 499,236 473,796 791,365 499,236Bills discounted 9,000,000 8,381,595 1,357,520 9,00,000 8,381,595 1,357,520Loans 4,100,462 - - 4,100,462 - - 13,574,259 9,174,344 1,856,756 13,574,259 9,172,960 1,856,756 15,652,332 15,697,970 4,658,101 15,652,332 15,696,586 4,657,166
Group Company
54
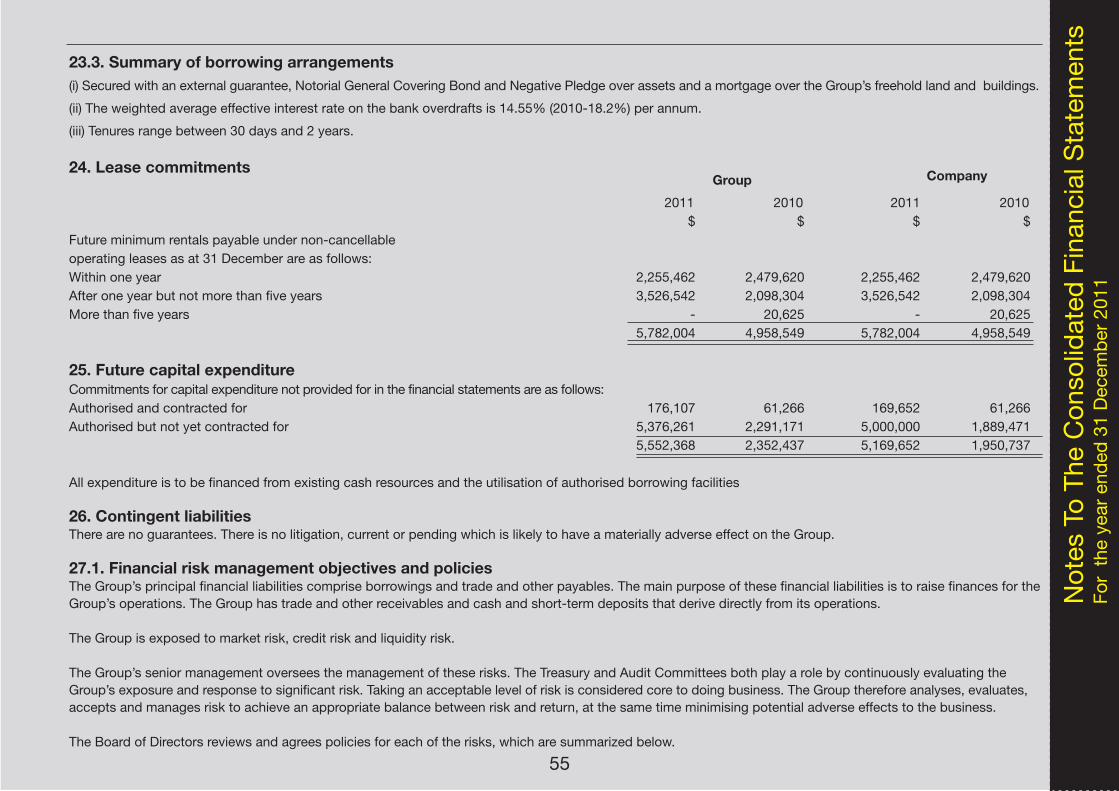
Not
es T
o Th
e C
onso
lidat
ed F
inan
cial
Sta
tem
ents
For
the
year
end
ed 3
1 D
ecem
ber 2
011
55
23.3. Summary of borrowing arrangements (i) Secured with an external guarantee, Notorial General Covering Bond and Negative Pledge over assets and a mortgage over the Group’s freehold land and buildings.
(ii) The weighted average effective interest rate on the bank overdrafts is 14.55% (2010-18.2%) per annum.
(iii) Tenures range between 30 days and 2 years.
24. Lease commitments
2011 2010 2011 2010 $ $ $ $Future minimum rentals payable under non-cancellable operating leases as at 31 December are as follows: Within one year 2,255,462 2,479,620 2,255,462 2,479,620 After one year but not more than five years 3,526,542 2,098,304 3,526,542 2,098,304 More than five years - 20,625 - 20,625 5,782,004 4,958,549 5,782,004 4,958,549
25. Future capital expenditureCommitments for capital expenditure not provided for in the financial statements are as follows:Authorised and contracted for 176,107 61,266 169,652 61,266Authorised but not yet contracted for 5,376,261 2,291,171 5,000,000 1,889,471 5,552,368 2,352,437 5,169,652 1,950,737
All expenditure is to be financed from existing cash resources and the utilisation of authorised borrowing facilities
26. Contingent liabilities There are no guarantees. There is no litigation, current or pending which is likely to have a materially adverse effect on the Group.
27.1. Financial risk management objectives and policies The Group’s principal financial liabilities comprise borrowings and trade and other payables. The main purpose of these financial liabilities is to raise finances for the Group’s operations. The Group has trade and other receivables and cash and short-term deposits that derive directly from its operations.
The Group is exposed to market risk, credit risk and liquidity risk.
The Group’s senior management oversees the management of these risks. The Treasury and Audit Committees both play a role by continuously evaluating the Group’s exposure and response to significant risk. Taking an acceptable level of risk is considered core to doing business. The Group therefore analyses, evaluates, accepts and manages risk to achieve an appropriate balance between risk and return, at the same time minimising potential adverse effects to the business.
The Board of Directors reviews and agrees policies for each of the risks, which are summarized below.
Group Company

27.2. Market risk Market risk is the risk that the fair value of future cash flows of a financial instrument will fluctuate because of changes in market prices. Market prices comprise three types of risk: interest rate risk, currency risk, commodity price risk and other price risk, such as equity risk. Financial instruments affected by market risk include borrowings and deposits. The objective of the treasury committee and financial services department is to manage and control market risk exposures within acceptable parameters, while optimizing the return.
Interest rate risk Interest rate risk is the risk that the fair value or future cash flows of a financial instrument will fluctuate because of changes in market interest rates. The amount at risk is a function of the magnitude and direction of interest rate changes and the size and maturity structure of the mismatch position. Significant factors in managing the risk include the frequency, volatility and direction of rate changes, the size of the interest-sensitive position and the basis for re-pricing at rollover dates. The Group’s exposure to the risk of changes in market interest rates relates primarily to its medium to long-term debt obligations. Currently the Group’s risks in this area are minimal as the bulk of borrowings are short-term and at a fixed rate of interest.
Foreign currency risk Foreign currency risk is the risk that the fair value of future cash flows of a financial instrument will fluctuate because of changes in foreign exchange rates. The Group’s exposure to the risk of changes in foreign exchange rates relates primarily to the Group’s operating activities (when revenue or expense are denominated in a different currency from the Group’s functional currency).
The carrying amount of foreign currency denominated monetary assets and liabilities at the reporting date were: South African Botswana Rand Pula Foreign denominated balancesAssetsCash and cash equivalents 227,488 8,662LiabilitiesTrade payables (2,332,434) -Total net position (2,104,946) 8,662Impact of US$ strengthening by 10% - gain/ (loss) in US$ Impact on profit 23,920 (105) Impact of US$ weakening by 10% - gain/ (loss) in US$ Impact on profit (29,235) 128 Price risk Price risk is the probability of loss occurring from adverse movement in the market price. The Group is not exposed to significant price risk. No listed investments are held and commodity price risk is minimal.
Not
es T
o Th
e C
onso
lidat
ed F
inan
cial
Sta
tem
ents
For
the
year
end
ed 3
1 D
ecem
ber 2
011
56
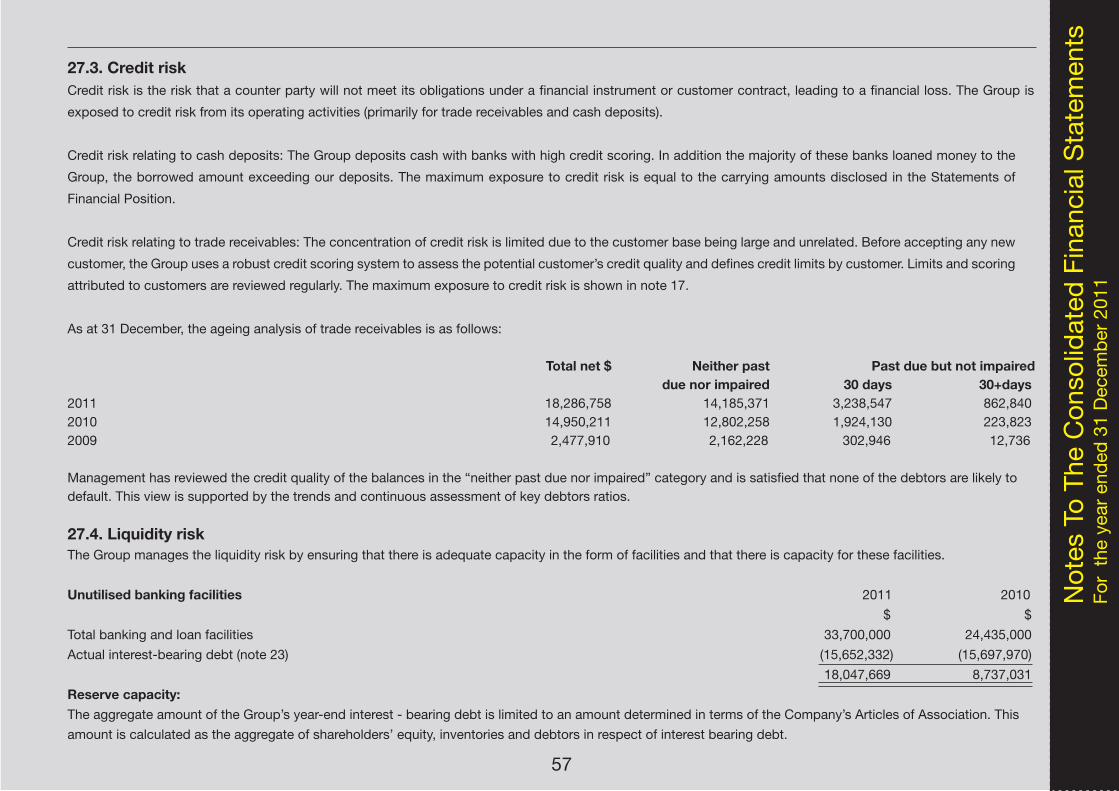
27.3. Credit riskCredit risk is the risk that a counter party will not meet its obligations under a financial instrument or customer contract, leading to a financial loss. The Group is
exposed to credit risk from its operating activities (primarily for trade receivables and cash deposits).
Credit risk relating to cash deposits: The Group deposits cash with banks with high credit scoring. In addition the majority of these banks loaned money to the
Group, the borrowed amount exceeding our deposits. The maximum exposure to credit risk is equal to the carrying amounts disclosed in the Statements of
Financial Position.
Credit risk relating to trade receivables: The concentration of credit risk is limited due to the customer base being large and unrelated. Before accepting any new
customer, the Group uses a robust credit scoring system to assess the potential customer’s credit quality and defines credit limits by customer. Limits and scoring
attributed to customers are reviewed regularly. The maximum exposure to credit risk is shown in note 17.
As at 31 December, the ageing analysis of trade receivables is as follows:
Total net $ Neither past Past due but not impaired due nor impaired 30 days 30+days 2011 18,286,758 14,185,371 3,238,547 862,840 2010 14,950,211 12,802,258 1,924,130 223,8232009 2,477,910 2,162,228 302,946 12,736
Management has reviewed the credit quality of the balances in the “neither past due nor impaired” category and is satisfied that none of the debtors are likely to default. This view is supported by the trends and continuous assessment of key debtors ratios.
27.4. Liquidity risk The Group manages the liquidity risk by ensuring that there is adequate capacity in the form of facilities and that there is capacity for these facilities.
Unutilised banking facilities 2011 2010 $ $Total banking and loan facilities 33,700,000 24,435,000Actual interest-bearing debt (note 23) (15,652,332) (15,697,970) 18,047,669 8,737,031 Reserve capacity: The aggregate amount of the Group’s year-end interest - bearing debt is limited to an amount determined in terms of the Company’s Articles of Association. This amount is calculated as the aggregate of shareholders’ equity, inventories and debtors in respect of interest bearing debt.
Not
es T
o Th
e C
onso
lidat
ed F
inan
cial
Sta
tem
ents
For
the
year
end
ed 3
1 D
ecem
ber 2
011
57

27.4. Liquidity risk (continued) 2011 2010 $ $Maximum permissible interest bearing debt 36,156,619 27,557,100Actual interest bearing debt (note 23) (15,652,332) (15,697,970) 20,504,288 11,859,131Cash and cash equivalents 316,562 127,840 Unutilised borrowing capacity 20,820,850 11,986,971
Sustainable liabilities The unutilised liability capacity is based on the estimated capacity of each asset investment to sustain liabilities. Liability capacity Property, plant and equipment 50% 1,994,256 1,320,367Inventories 75% 6,637,689 5,651,274Accounts receivable 66% 12,879,607 10,489,556Cash and cash equivalents 100% 316,562 127,840 21,828,115 17,589,037Interest free liabilities 7,255,580 5,752,525Permissible interest bearing debt at end of year 29,083,695 23,341,562Actual interest bearing debt (note 23) (15,652,332) (15,697,970)Unutilised liability capacity 13,431,363 7,643,592
The table below summarises the maturity profile of the Group’s financial liabilities based on contractual undiscounted payments:
2011 On demand less than 3mths 3-12 mths 1-2years TotalInterest bearing loans and borrowings 1,399,870 352,000 12,398,532 1,501,930 15,652,332Trade and other payables - 7,255,580 - - 7,255,580 1,399,870 7,607,580 12,398,532 1,501,930 22,907,9122010 Interest bearing loans and borrowings 2,209,374 4,214,000 9,274,596 - 15,697,970Trade and other payables - 5,752,524 - - 5,752,524 2,209,374 9,966,524 9,274,596 - 21,450,494
Not
es T
o Th
e C
onso
lidat
ed F
inan
cial
Sta
tem
ents
For
the
year
end
ed 3
1 D
ecem
ber 2
011
58

27.5. Fair value of financial instruments The estimated net fair values have been determined as at 31 December 2011, using available market information and appropriate valuation methodologies, and are not necessarily indicative of the amounts that the Group could realise in the normal course of business.
Liquid resources, trade accounts receivable, investments and loans: The carrying amounts reported in the statement of financial position approximate fair values.
Interest bearing debt: The carrying amount of interest bearing debt approximates its fair value.
27.6. Management of Capital The primary objective of the Group’s capital management is to ensure that it maintains a strong credit rating and healthy capital ratios in order to support its business and maximise shareholder value. The Group manages its capital structure and makes adjustments to it, in light of changes in economic conditions. To maintain or adjust the capital structure, the Group may adjust the dividend payment to shareholders or return capital to shareholders or issue new shares. The Group manages equity and borrowings as capital. The amount of capital as at 31 December 2011 was $23,444,142 (2010: $19,826,773).
The Group monitors capital on the basis of the gearing ratio and level of borrowings and this is calculated as net interest-bearing debt, reduced by cash and cash equivalents, divided by shareholder’s equity. During 2011, the Group’s strategy was to maintain a net gearing ratio of below 1. As at 31 December 2011 the net gearing was -0.54 (2010:-0.08).
28. Interests of directors in share capital The interests, direct and indirect of the directors in office at 31 December 2011 and at the date of this report, aggregated as to beneficial interest and non-beneficial interest are as follows:
Directors name Beneficial Non-beneficialR Mlotshwa 304,000 100CF Dube 1,500 100V Mpofu - 100L Masterson 757,799 100S Ndlovu - 100TN Sibanda - 100LL Tsumba - 100Z Vella 99,405 100Nominees - 300 1,162,704 1,100No changes in Directors’ shareholdings have occurred between the financial year end and 16 April 2012.During the course of the period, no Director of the company had any material interest in any contract of significance with the company or any of its subsidiarieswhich would have given rise to a related conflict of interest.
Not
es T
o Th
e C
onso
lidat
ed F
inan
cial
Sta
tem
ents
For
the
year
end
ed 3
1 D
ecem
ber 2
011
59

29. Related party disclosures (Group and Company) 2011 2010Compensation of key management personnel of the Group $ $Short terms employee benefits 965,193 452,164Post employment pension and medical benefits 185,343 58,015Share-based payment transactions 124,472 56,588Total compensation paid to key management personnel 1,275,008 566,767
The amounts disclosed in the table are the amounts recognised as an expense during the reporting period related related to key management personnel.
Related party relationships exist between the Group, fellow subsidiaries and the holding company. All purchasing and selling transactions are concluded at arm’s length. All intra-group balances, income and expenses, unrealised gains and losses resulting from intra-group transactions are eliminated in full.
30. Report of the directorsThis is contained in the Chairman’s Report and Corporate Governance Report.
31. Going concern assumptionThe directors have assessed the ability of the Group to continue operating as a going as going concern and believe that the preparation of these financial state-ments on a going concern basis is still appropriate.
32. Events after the reporting periodThere were no significant events after the reporting date and at the time of approval of the financial statements.
Not
es T
o Th
e C
onso
lidat
ed F
inan
cial
Sta
tem
ents
For
the
year
end
ed 3
1 D
ecem
ber 2
011
60
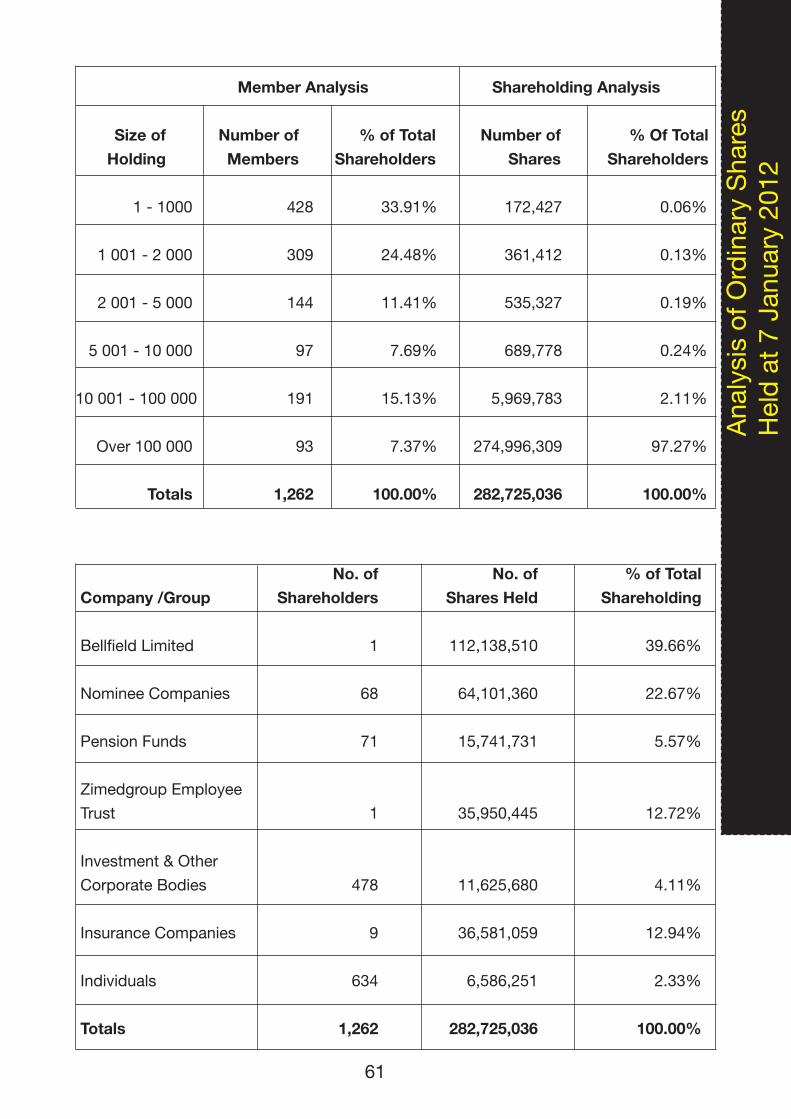
MemberAnalysis ShareholdingAnalysis
Sizeof Numberof %ofTotal Numberof %OfTotal Holding Members Shareholders Shares Shareholders
1-1000 428 33.91% 172,427 0.06%
1001-2000 309 24.48% 361,412 0.13%
2001-5000 144 11.41% 535,327 0.19%
5001-10000 97 7.69% 689,778 0.24%
10001-100000 191 15.13% 5,969,783 2.11%
Over100000 93 7.37% 274,996,309 97.27%
Totals 1,262 100.00% 282,725,036 100.00%
AnalysisofOrdinaryShares
Heldat7January2012
No.of No.of %ofTotalCompany/Group Shareholders SharesHeld Shareholding
BellfieldLimited 1 112,138,510 39.66%
NomineeCompanies 68 64,101,360 22.67%
PensionFunds 71 15,741,731 5.57%
ZimedgroupEmployeeTrust 1 35,950,445 12.72%
Investment&OtherCorporateBodies 478 11,625,680 4.11%
InsuranceCompanies 9 36,581,059 12.94%
Individuals 634 6,586,251 2.33%
Totals 1,262 282,725,036 100.00%
61
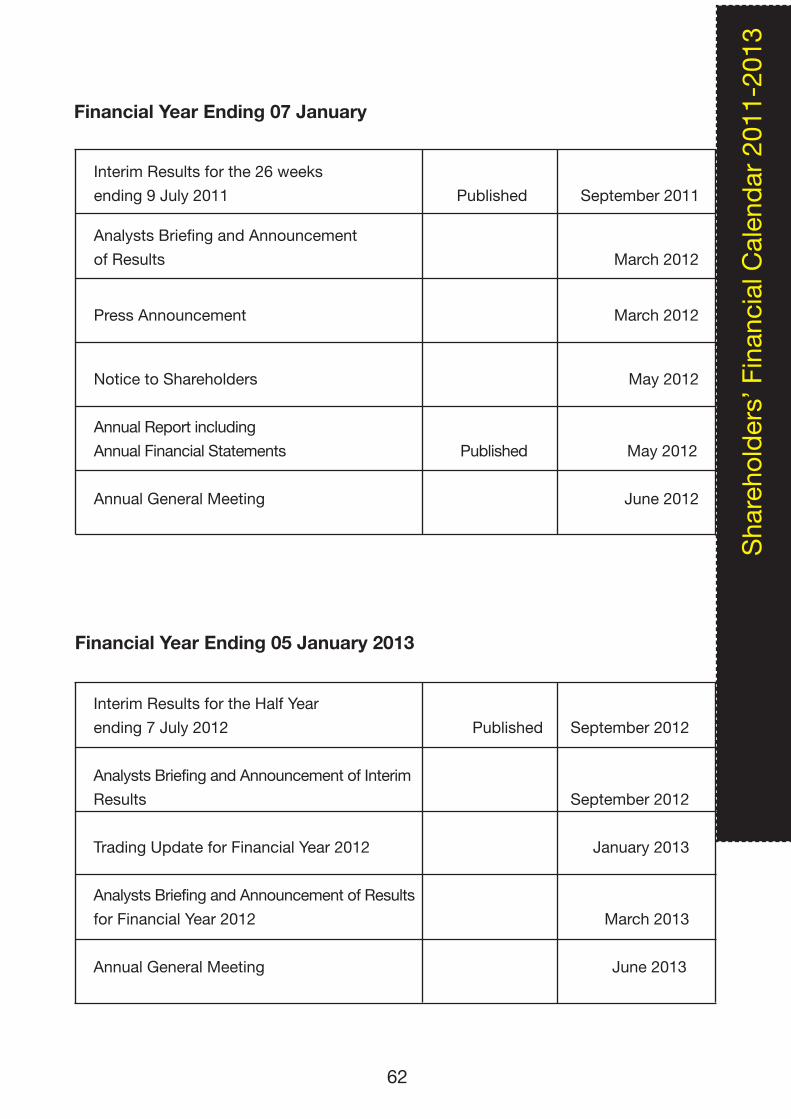
62
InterimResultsfortheHalfYear ending7July2012 Published September2012 AnalystsBriefingandAnnouncementofInterim Results September2012
TradingUpdateforFinancialYear2012 January2013
AnalystsBriefingandAnnouncementofResults forFinancialYear2012 March2013 AnnualGeneralMeeting June2013
FinancialYearEnding07January
FinancialYearEnding05January2013
InterimResultsforthe26weeks ending9July2011 Published September2011 AnalystsBriefingandAnnouncement ofResults March2012
PressAnnouncement March2012
NoticetoShareholders May2012
AnnualReportincluding AnnualFinancialStatements Published May2012 AnnualGeneralMeeting June2012
Shareholders’FinancialCalendar2011-2013

Noticeisherebygiventhatthe63rdAnnualGeneralMeetingofmemberswillbeheldattheRoyalHarareGolfClub,5thStreetExtension,HarareonWednesday,6June2012at08.30hours:-
OrdinaryBusiness
1. ToapproveminutesoftheAnnualGeneralMeetingheldon16June2011.
2. Toreceiveandadopttheannualfinancialstatementsandthereportsofthedirectorsandauditorsfor thefinancialyearending07January2012.
3. ToappointdirectorsinaccordancewiththeprovisionsoftheCompany’sArticlesofAssociation.
3.1Mr.TNSibandaandMr.ZVellaretirebyrotation.Beingeligibletheywillofferthemselvesforre-election. Mr.JBGalloway,havingbeenappointedsubsequenttothepreviousAnnualGeneralMeeting,andbeing eligible,willofferhimselfforelection.
4. Toapprovetheremunerationofthedirectors.
5. Toappointauditorsfortheensuingyearandtoapprovetheirremunerationforthepastyear.
6. Toconsiderand,ifdeemedfit,passwithorwithoutmodificationthefollowingSpecialResolution. SpecialResolution
That thecompanyherebyapproves,asageneralapprovalcontemplated insections78and79of the•CompaniesActChapter24:03,asamended(“theAct”),theacquisitionbythecompanyfromtimetotimeofissuedordinarysharesinthecompany,uponsuchtermsandconditionsandinsuchamountsasthedirectorsofthecompanymayfromtimetotimedeterminebut,subjecttotheArticlesofAssociationofthecompany,theprovisionsoftheActandtheListingRequirementsoftheZimbabweStockExchange(“ZSE”)aspresentlyconstitutedandwhichmaybeamendedfromtimetotime,and:
•a. anysuchacquisitionofordinarysharesshallbeimplementedontheopenmarketontheZSE;•
•b. thisgeneralauthorityshallonlybevaliduntilthecompany’snextAnnualGeneralMeeting,provided•thatitshallnotextendbeyondfifteen[15]monthsfromthedateofpassingofthisspecialresolution;
•c. a paid press announcement will be published as soon as the company has acquired ordinary•sharesconstituting,onacumulativebasis,3%(threepercent)ofthenumberofordinarysharesinissuepriortotheacquisitionpursuanttowhichthe3%(threepercent)thresholdisreached,whichannouncementshallcontainfulldetailsofsuchacquisitions;
•d. acquisitionsofordinarysharesintheaggregateinanyonefinancialyearmaynotexceed10%•(tenpercent)of thecompany’s issuedordinarysharecapital fromthedateof thegrantof thisgeneralauthority;
•e. indetermining thepriceatwhich thecompany’sordinarysharesareacquiredby thecompany in•termsofthisgeneralauthority,themaximumandminimumpriceatwhichsuchordinarysharesmaybeacquiredwillbe25%(twentyfivepercent)aboveorbelowtherespectiveweightedaverageofthemarketpriceatwhichsuchordinarysharesaretradedontheZSE,asdeterminedoverthefive[5]businessdaysimmediatelyprecedingthedateofrepurchaseofsuchordinarysharesbythecompany.
•
63
NoticeToMembers
ThereasonforthespecialresolutionistograntthecompanyageneralauthorityintermsoftheActfortheacquisitionbythecompanyofsharesissuedbyit,whichauthorityshallbevaliduntiltheearlierofthenextAnnualGeneralMeetingofthecompanyorthevariationorrevocationofsuchgeneralauthoritybyspecialresolutionbyanysubsequentgeneralmeetingofthecompany,providedthatthegeneralauthorityshallnotextendbeyondfifteen[15]monthsfromthedateofthisAnnualGeneralMeeting.Thepassingandregistrationof thisspecial resolutionwillhave theeffectofauthorising thecompany toacquireshares issuedby thecompany.
AlthoughtheZSEListingRequirementsallowacompanytorepurchaseupto20%ofitsissuedsharecapitalinanyonefinancialyear,thedirectorsareonlyseekingauthoritytorepurchaseupto10%ofissuedsharecapitalinthisfinancialyear,being28272503ordinarysharesof$0.0001each.
StatementbytheBoardofDirectorsoftheCompany
PursuanttoandintermsoftheListingRequirementsoftheZSE,thedirectorsofthecompanystatethat:
a.theintentionofthedirectorsofthecompanyistoutilisethisauthorityatafuturedateprovidedthat•thecashresourcesofthecompanyareinexcessofitsrequirements.Inthisregard,thedirectorswilltakeaccountof,interalia,anappropriatecapitalisationstructureforthecompany,thelong-termcashneedsofthecompany,andwillensurethatanysuchutilisationisintheinterestofshareholders;
•b.followingthemaximumnumberofsecuritiestoberepurchasedandthedateonwhichsuchrepurchase•willtakeplace,thedirectorsofthecompanywillensurethat:
•- thecompanyanditssubsidiarieswillbeabletopaytheirdebtsastheybecomedueintheordinary courseofbusinessforthenexttwelve[12]months;- theconsolidatedassetsofthecompanyanditssubsidiaries,willbeinexcessoftheconsolidated liabilitiesofthecompanyanditssubsidiaries;- theissuedsharecapitalandreservesofthecompanyanditssubsidiarieswillbeadequateforthe purposesofthebusinessofthecompanyanditssubsidiariesforthenexttwelve[12]months;and- theworkingcapitalavailabletothecompanyanditssubsidiarieswillbesufficientforthegroup’s requirementsforthenexttwelve[12]months.
Amemberentitledtoattendandvoteatthemeetingmayappointoneormoreproxiestoattendandvoteonhis/herbehalf.Suchproxyneednotbeamemberofthecompany.Theinstrumentappointingaproxyshallbedepositedattheregisteredofficeofthecompanyatleast48hoursbeforethemeeting.
ByorderoftheBoard
7March2012GroupSecretary
64

EDGARSSTORESLIMITED(“thecompany”)FORMOFPROXY
forusebymembersattheAnnualGeneralMeetingofthecompanytobeheldonWednesday,6June2012at08.30hours.
I/We___________________________________________________________________________________________beingtheholder/sofordinarysharesinthecompany,appoint(seeNote1)1 orfailinghim/her2 orfailinghim/her3thechairmanoftheAnnualGeneralMeeting:
asmy/ourproxytoactforme/usattheAnnualGeneralMeeting,whichwillbeheldattheRoyalHarareGolfClub,5thStreetExtension,HarareonWednesday,6June2012at08.30hoursforthepurposeofconsidering,andifdeemedfit,passingwithorwithoutmodification,theresolutionstobeproposedthereatandateachadjournmentthereof,tovotefororagainsttheresolutionswithorwithoutmodification,and/ortoabstainfromvotingthereoninrespectoftheordinarysharesintheissuedsharecapitalofthecompanyregisteredinmy/ourname/sinaccordancewiththefollowinginstruction(seeNote2).
Eachmember isentitledtoappointoneormoreproxies (whetheramember/softhecompanyornot) toattend,speakandtovoteatthemeetinginhis/herstead.
For Against Abstain Noofvotes NoofvotesNoofvotes Poll Poll PollOrdinaryResolutionNo1(ApprovalofminutesoftheAGMof16June2011)
OrdinaryResolutionNo2(Receiptandadoptionoftheannualfinancialstatementsfortheyearending07January2012)
OrdinaryResolutionNo3(ElectionofDirectorsasasingleresolution)
Alternatively:OrdinaryResolutionNo3(ElectionofDirectors)
OrdinaryResolutionNo4(Approvaloftheremunerationofdirectors)
OrdinaryResolutionNo5(Appointmentofauditors&approvaloftheirremuneration)
SpecialResolution(GeneralAuthorisation-ShareBuyBack)
(NOTE:ONAPOLL,AMEMBERISENTITLEDTOONEVOTEFOREACHSHAREHELD)
Signedat on2012Signature__________________ (ASSISTEDBYMEWHEREAPPLICABLE) Instructionsoverleaf
65
InstructionsforSigningandLodgingthisProxy
Eachmemberisentitledtoappointoneormoreproxies(whoneednotbeamember(s)ofthecompany)1.
toattend,speakandvote(eitheronapollorbyshowofhands)inplaceofthatmemberattheAnnual
GeneralMeeting.
Amembermayinsertthenameofaproxyorthenamesoftwoalternativeproxiesofthemember’schoice2.
inthespacesprovided,withorwithoutdeletingthewords“thechairmanoftheAnnualGeneralMeeting”.
Alldeletionsmustbeindividuallyinitialledbythemember,failingwhichtheywillnothavebeenvalidly
effected.ThepersonwhosenameappearsfirstontheformofproxyandwhoispresentattheAnnual
GeneralMeetingshallbeentitledtoactasproxytotheexclusionofthepersonswhosenamesfollow.
Votinginstructionsforeachoftheresolutionsmustbecompletedbyfillingthenumberofvotes(oneper3.
ordinaryshare)underthe“For”,“Against”or“Abstain”headingsontheProxyForm.Ifnoinstructionsare
filledinontheProxyForm,thechairmanoftheAnnualGeneralMeeting,ifthechairmanistheauthorised
proxy,oranyotherproxyshallbeauthorisedtovoteinfavourof,againstorabstainfromvotingashe/
shedeemsfit.
Amemberorhis/herproxyisentitledbutnotobligedtovoteinrespectoftheordinarysharesheldbythe4.
member.Thetotalnumberofvotesfororagainsttheordinaryandspecialresolutionsandinrespectof
whichanyabstentionisrecordedmaynotexceedthetotalnumberofsharesheldbythemember.
If this formhasbeensignedbyaperson ina representativecapacity, thedocumentauthorising that5.
persontosignmustbeattached,unlesspreviouslyrecordedbythecompany’stransfersecretariesor
waivedbythechairmanoftheAnnualGeneralMeeting.
ThechairmanoftheAnnualGeneralMeetingmayacceptorrejectanyformofproxythatiscompleted6.
and/orreceivedotherthaninaccordancewiththeseinstructionsandnotes.
Anyalterationsorcorrectionstothisformofproxyhavetobeinitialledbythesignatory(ies).7.
Thecompletionandlodgingofthisformofproxydoesnotprecludetherelevantmemberfromattending8.
theAnnualGeneralMeetingandspeakingandvotinginpersontotheexclusionofanyproxyappointed
bythemember.
FormsofproxyhavetobelodgedwithorpostedtotheGroupSecretary,EdgarsStoresLimited,Cnr9.
9thAvenue/HerbertChitepoStreet,Bulawayo,ortheTransferSecretaries,Corpserve(Private)Limited,
atCnrKwameNkrumahAvenue/1stStreet,POBox2208,Harareandtobereceivedbynotlaterthan
12.00hourson4June2012.
Thisproxyformistobecompletedonlybythosememberswhoeitherstillholdsharesinacertificated10.
form,orwhosesharesarerecordedintheirownnameinelectronicforminthesubregister.
66

EdgarsStoresLimitedIncorporatedintheRepublicofZimbabweCompanyregistrationnumber379/1948
RegisteredofficeEdgarsHeadOffice
CnrNinthAvenue/HerbertChitepoStreetTelephone:263-9-881626/35
Fax:263-9-68443E-mail:[email protected]
Website:http://www.edgars.co.zw
PostaladdressPOBox894,Bulawayo,Zimbabwe
CompanySecretaryVusumuziMpofu
TransferSecretariesCorpserve(Pvt)Ltd4thFloorZBCentre
CnrKwameNkrumahAvenue/1stStreetPOBox2208,Harare,ZimbabweTelephone:263-4-750711/2
AuditorsErnst&YoungDerryHouse
CnrFifeStreet/6thAvenuePOBox437,Bulawayo,Zimbabwe
Telephone:263-9-76111
LegalAdvisorsCoghlan&WelshLegalPractitioners
BarclaysBankBuilding8thAvenue,POBox22,Bulawayo,Zimbabwe
Telephone:263-9-888371/8
BankersBarclaysBankZimbabweLimitedCnrMainStreet/8thAvenue
POBox702,Bulawayo,ZimbabweTelephone:263-9-881121/7
FBCBankLimited2ndFloor,FBCBuilding,
108JasonMoyoStreet,Bulawayo,ZimbabweTelephone:263-9-885925
Co-ordination:GroupFinanceDesignandproduction:GroupMarketing
Theseresultscanbeviewedontheinternetat:http://www.edgars.co.zw
67
CorporateInformation


