196
ANNUAL REPORT 2012

ANNUAL REPORT 2012

2012 Financial Highlights
Assets Under Management (USD Billions)
By Channel
$220
$66
$144
Institutions51%
Retail34%
Private Client15%
By Client Location
$274
$156
US64%
Non-US 36%
Growth Equities2
By Investment Service
Fixed Income2
$256$57
$39
Value Equities2
Other1,2
$78
¹ Includes Index, Structured, Asset-Allocation Services and certain other alternative investments.2 Fixed Income includes $5 billion of AUM utilized in Blend Strategies; Value Equities includes $16 billion utilized in Blend Strategies; Growth Equities includes $16 billion utilized in
Blend Strategies; Other includes $2 billion of AUM utilized in Blend Strategies.
AllianceBernstein (The Operating Partnership)
AllianceBernstein Holding (The Publicly Traded Partnership)
(USD Thousands, Except per Unit Data)Years Ended December 31
2012 2011 2010
Equity in Earnings (Loss) of Operating Partnership $70,807 $(65,581) $162,217
Net Income (Loss) $51,085 $(93,268) $134,158
Diluted Net Income (Loss) per Unit $0.51 $(0.90) $1.32
Distributions per Unit $1.23 $1.14 $1.31
Years Ended December 31
2012 2011 2010
Assets Under Management (USD Millions) $430,017 $405,897 $478,019
Revenues (USD Thousands) $2,736,737 $2,749,891 $2,948,557
Net Income (Loss) (USD Thousands) $188,916 $(174,768) $442,419
Employees 3,318 3,764 4,256

1
In 2012, we made significant progress in executing on our long-term strategy to improve our
investment performance, diversify and globalize our business, innovate for clients with our
offerings, and strengthen our financial position. It was a year of milestones for our firm, and we
finished strong, with greater stability in many of our businesses and real momentum in others.
AllianceBernstein—Letter from the Chairman
The Environment in 2012Volatility and uncertainty persisted in the global markets in 2012. After a strong start to the year, weak US economic indicators, rising concerns over European sovereign debt and a US fiscal cliff, and signs of slowing emerging markets growth created volatility in the second quarter that hurt investment performance and caused investors to flee riskier assets.
The second half brought more favorable global market trends. In this environment, we were able to deliver strong investment performance in the majority of our fixed-income services and in many of our equity, alternative and multi-asset services as well. Our sales momentum accelerated, particularly in fast-growing non-US retail markets, and we engaged with clients and prospects in our Institutions and Private Client channels in a way we hadn’t in years.
With the US fiscal cliff averted, stable interest rates and strengthening equity fund flows, investors have been demonstrating greater confidence in the market and macroeconomic outlook so far in 2013. In the US, year-to-date equity fund flows have been their strongest in years. Equity market returns, which were positive in 2012 for the fourth consecutive year, have remained strong, even as the Federal Reserve shows no signs of raising interest rates. We continue to face uncertainties on issues such as US debt and eurozone stability, but I remain confident in our firm’s business mix and our ability to continue making progress in achieving our long-term goals.
Financials and Asset FlowsWe demonstrated meaningful improvement in a number of areas of our business in 2012. In every channel, we’ve focused on delivering products and services that best meet the evolving needs of our clients, and our clients have responded. Our annual gross sales of $82 billion were our highest since 2007, and we were net flow positive as a firm in the fourth quarter for the first time since 2007’s fourth quarter. Our Retail channel led the way, with record annual sales of $56 billion and net inflows of $16 billion, our highest since 2000. Our Institutions channel moved into positive net flow territory in the fourth quarter, with the highest gross sales since mid-2010 and the lowest redemptions since late 2005. Our firm’s total net outflows declined by 77% in 2012, to $14 billion, with outflows concentrated in equities within our Institutions channel.
We finished 2012 with assets under management of $430 billion, up 6% from the prior year, driven largely by strong investment performance and net new flows in fixed income.
We also strengthened our financial results in 2012. While adjusted net revenues declined by 7%, we managed to reduce adjusted operating expenses by 9% through the successful implementation of a comprehensive global real estate consolidation plan and other cost-cutting efforts. As a result, we expanded our adjusted operating margin by 1.8 percentage points in 2012, to 18.8%.

2
Progress on Our Strategy in 2012 This marks our fourth year of executing a long-term strategy designed to evolve our business to better serve clients and position AllianceBernstein for a future of growth. It is rewarding to see our efforts bearing results.
Improve investment performance: Throughout 2012, we consistently delivered for our clients in fixed income. As of year-end, 89% of our fixed-income assets were in services that outperformed benchmarks for the three-year period. Services such as Diversified Yield, Global Fixed Income, Global Plus, Global High Income, US Strategic Core Plus and Emerging Market Debt beat their benchmarks by 110 basis points or more for the three-year period.
In equities, the changes we’ve made in Growth and Value to address performance while maintaining our core discipline began to pay off with improved returns in strategies such as US Large Cap and Emerging Market Growth. Both outperformed for the one-year period. Our biggest performance shift came in Value during the fourth quarter, when correlations declined and fundamentals became more relevant. As a result, our largest value strategies outperformed by 110 basis points or more. Meanwhile, our newer stability services such as Global Market Neutral, Global Active Low Vol and Select US Equity continued to perform well for our clients, even as market conditions fluctuated throughout the year.
Diversify and globalize our business: After years of investing to build our overseas presence, AllianceBernstein is more diverse and global than ever. Today, we are a dominant player in the Asia (ex Japan) retail fixed-income markets, particularly Taiwan and Hong Kong, where we maintain leading market shares. In 2012, our Asia Retail gross sales were up by more than 100%. We also notched triple-digit gross sales increases in both the Retail and Institutions channels in the Europe, Middle East and Africa (EMEA) region in 2012.
In our leading sell-side research business, Sanford C. Bernstein, we continued our successful global expansion in 2012—a strategy that is already delivering outstanding sales growth and record revenues in Hong Kong. Eight new analysts launched coverage in Europe and Asia.
Innovate for clients with our offerings: Four years ago, we made a commitment to diversify our product array in order to provide our clients with offerings that can perform well across market cycles. Since then, we have launched 145 new offerings that together have attracted $60 billion in new assets.
About half of these are in our Retail channel, where gross sales of new offerings nearly doubled in 2012, to $8.5 billion, and represented 15% of total annual gross sales. Many of these new offerings have had remarkable success in gathering assets. Our Select US Equity and Absolute Alpha Luxembourg-based funds together have raised more than $1 billion in assets. Our new “Inflation Suite” of products, which includes Muni Bond Inflation, Bond Inflation and Real Asset, also passed the $1 billion mark. These offerings have performed well since inception and recently celebrated three-year anniversaries, an important asset-gathering milestone for products with strong investment returns.
In Institutions, we built upon our presence as thought leaders and innovators in the Defined Contribution (DC) space in both the US and the UK during 2012. In the US, we launched the industry’s first multi-insurer-backed Lifetime Income Solution for a major corporate DC plan. In the UK, we introduced the concept of Retirement Bridge, a post-retirement investment product so unique that the UK government has singled us out for our insights and expertise in this evolving marketplace. I know this is just the beginning of what we can achieve in an area of such significant growth opportunity for our firm.

3
We’ve innovated in Private Client as well. During 2012, we successfully transitioned clients to our new US Strategic Equities model, which takes a multi-style, all-cap approach to equity investing to deliver more reliable returns across market conditions. Knowing the diversification benefit an appropriate allocation to Alternatives provides, we also launched a Registered Investment Company, or RIC, that makes our multi-manager fund-of-hedge-funds offering available more broadly to our clients. Dynamic Asset Allocation, or DAA, a strategy we implemented in April 2010 to mitigate volatility while maintaining returns, has reduced volatility in Private Client portfolios by 11% since inception, with no impact on returns. Each of these enhancements is designed to meet our clients’ evolving needs over a long-term investment horizon.
Achieve greater operating leverage and better financial results: By staying vigilant on expenses, we finished 2012 on much firmer financial footing. I’m proud that we were able to reduce adjusted expenses by $175 million, even as we continued to invest for future growth. In the second half of the year, we began an ambitious real estate consolidation plan designed to reduce our global footprint and expense base. When we have completed the plan, by year-end 2013, we expect to have reduced our global footprint by more than 500,000 square feet and taken non-cash write-downs of $225–$250 million, for total annualized cost savings of $38–$43 million. So far, we have recorded $207 million in non-cash charges to write down office space and leases, and realized about $9 million in associated cost savings.
In the second half of 2012, we produced a 20% adjusted margin—better than in recent years, but still not where we need to be. We see opportunities for savings beyond real estate as well, and believe we can keep expanding our margin, particularly if we can grow both revenues and assets.
Our PeopleAt AllianceBernstein, our greatest long-term asset is our people, and we strive to make our firm a place where the best and brightest can thrive.
Even with the tough decisions we’ve had to make about aligning resources with trends in both revenues and assets, we’ve continued to add talent throughout the organization. We’ve brought in investment teams in real estate, mortgages, credit and equities; client-facing teams in Institutions and Retail; and new financial advisors in Private Client—a business that relies on a steady stream of new talent. We will continue to pursue talent in areas where we want to grow.
Looking ForwardFour years into a long and arduous recovery, AllianceBernstein is in a very different place today. We’re building a firm of the future, driven by a unified culture of relentless ingenuity that harnesses our shared values of collaboration, accountability, intellectual curiosity and integrity to deliver better outcomes for our clients and better returns for our unitholders. Our long-term strategy to return AllianceBernstein to growth is working and I’m confident we can keep making meaningful progress from here.
Thank you for your continued trust.
Peter S. Kraus Chairman and Chief Executive Officer

4
Board of Directors
Peter S. Kraus 1, 3, 4
Chairman of the Board and Chief Executive Officer
Christopher M. Condron 1, 3, 4
Former Director, President and Chief Executive Officer, AXA Financial, Inc.
Henri de Castries 1
Chairman and Chief Executive Officer, AXA Chairman of the Board, AXA Financial, Inc. Director, AXA Equitable Life Insurance Company
Denis Duverne 1, 3, 4
Deputy Chief Executive Officer, AXA Director, AXA Financial, Inc. Director, AXA Equitable Life Insurance Company
Steven G. Elliott 2, 4 Former Senior Vice Chairman, The Bank of New York Mellon
Deborah S. Hechinger 3
Independent Consultant on Non-Profit Governance
Weston M. Hicks 2
Director, President and Chief Executive Officer, Alleghany Corporation
Andrew J. McMahonPresident, AXA Equitable Life Insurance Company
Kevin MolloyBusiness Support and Development Representative, AXA
Mark PearsonDirector, President and Chief Executive Officer, AXA Financial, Inc. Chairman of the Board and Chief Executive Officer, AXA Equitable Life Insurance Company
Lorie A. Slutsky 1, 3, 4
President and Chief Executive Officer, The New York Community Trust Director, AXA Financial, Inc. Director, AXA Equitable Life Insurance Company
A.W. (Pete) Smith, Jr. 2, 4
President, Smith Compensation Consulting
Peter J. Tobin* 1, 2
Former Special Assistant to the President of St. John’s University
Executive Officers
Peter S. KrausChairman of the Board and Chief Executive Officer
James A. GingrichChief Operating Officer
John C. Weisenseel Chief Financial Officer
Robert P. van BruggeChairman and Chief Executive Officer of Sanford C. Bernstein & Co., LLC
Laurence E. Cranch General Counsel
Lori A. MassadHead—Human Capital and Chief Talent Officer
AllianceBernstein Directors and Executive Officers
*Lead Independent Director1Member of the Executive Committee2Member of the Audit Committee3Member of the Corporate Governance Committee4Member of the Compensation Committee

AllianceBernstein Holding L.P.
Form 10-K 2012


UNITED STATESSECURITIES AND EXCHANGE COMMISSION
WASHINGTON, D.C. 20549
FORM 10-KÈ ANNUAL REPORT PURSUANT TO SECTION 13 OR 15(d) OF THE SECURITIES
EXCHANGE ACT OF 1934For the Fiscal Year Ended December 31, 2012
OR
‘ TRANSITION REPORT PURSUANT TO SECTION 13 OR 15(d) OF THE SECURITIESEXCHANGE ACT OF 1934
For the transition period from toCommission file number 001-09818
ALLIANCEBERNSTEIN HOLDING L.P.(Exact name of registrant as specified in its charter)
Delaware 13-3434400(State or other jurisdiction ofincorporation or organization)
(I.R.S. EmployerIdentification No.)
1345 Avenue of the Americas, New York, N.Y. 10105(Address of principal executive offices) (Zip Code)
Registrant’s telephone number, including area code: (212) 969-1000Securities registered pursuant to Section 12(b) of the Act:
Title of Class Name of each exchange on which registered
units representing assignments of beneficial ownershipof limited partnership interests
New York Stock Exchange
Securities registered pursuant to Section 12(g) of the Act: NoneIndicate by check mark if the registrant is a well-known seasoned issuer, as defined in Rule 405 of the Securities
Act. Yes È No ‘
Indicate by check mark if the registrant is not required to file reports pursuant to Section 13 or Section 15(d) of theAct. Yes ‘ No È
Indicate by check mark whether the registrant (1) has filed all reports required to be filed by Section 13 or 15(d) of theSecurities Exchange Act of 1934 during the preceding 12 months (or for such shorter period that the registrant was required to filesuch reports), and (2) has been subject to such filing requirements for the past 90 days. Yes È No ‘
Indicate by check mark whether the registrant has submitted electronically and posted on its corporate Web site, if any, everyInteractive Data File required to be submitted and posted pursuant to Rule 405 of Regulation S-T (§232.405 of this chapter) duringthe preceding 12 months (or for such shorter period that the registrant was required to submit and post suchfiles). Yes È No ‘
Indicate by check mark if disclosure of delinquent filers pursuant to Item 405 of Regulation S-K (§229.405 of this chapter) isnot contained herein, and will not be contained, to the best of registrant’s knowledge, in definitive proxy or information statementsincorporated by reference in Part III of this Form 10-K or any amendment to this Form 10-K. ‘
Indicate by check mark whether the registrant is a large accelerated filer, an accelerated filer, a non-accelerated filer or a smaller reportingcompany. See definitions of “accelerated filer”, “large accelerated filer” and “smaller reporting company” in Rule 12b-2 of the Exchange Act.(Check one):
Large accelerated filer È Accelerated filer ‘ Non-accelerated filer ‘ Smaller reporting company ‘Indicate by check mark whether the registrant is a shell company (as defined in Rule 12b-2 of the Act). Yes ‘ No È
The aggregate market value of the units representing assignments of beneficial ownership of limited partnership interests heldby non-affiliates computed by reference to the price at which such units were last sold on the New York Stock Exchange as ofJune 30, 2012 was approximately $1.24 billion.
The number of units representing assignments of beneficial ownership of limited partnership interests outstanding as ofDecember 31, 2012 was 105,173,342. (This figure includes 100,000 units of general partnership interest having economic interestsequivalent to the economic interests of the units representing assignments of beneficial ownership of limited partnership interests.)
DOCUMENTS INCORPORATED BY REFERENCEThis Form 10-K does not incorporate any document by reference.


Table of Contents
Glossary of Certain Defined Terms . . . . . . . . . . . . . . . . . . . . . . . . . . . . . . . . . . . . . . . . . . . . . . . . . . . . . . . . . . . . . . . . . . . . . ii
Part I
Item 1. Business . . . . . . . . . . . . . . . . . . . . . . . . . . . . . . . . . . . . . . . . . . . . . . . . . . . . . . . . . . . . . . . . . . . . . . . . . . . . . . . . . . 1General . . . . . . . . . . . . . . . . . . . . . . . . . . . . . . . . . . . . . . . . . . . . . . . . . . . . . . . . . . . . . . . . . . . . . . . . . . . . . . . . . . . . . 1Institutional Services . . . . . . . . . . . . . . . . . . . . . . . . . . . . . . . . . . . . . . . . . . . . . . . . . . . . . . . . . . . . . . . . . . . . . . . . . . . 4Retail Services . . . . . . . . . . . . . . . . . . . . . . . . . . . . . . . . . . . . . . . . . . . . . . . . . . . . . . . . . . . . . . . . . . . . . . . . . . . . . . . . 4Private Client Services . . . . . . . . . . . . . . . . . . . . . . . . . . . . . . . . . . . . . . . . . . . . . . . . . . . . . . . . . . . . . . . . . . . . . . . . . 5Bernstein Research Services . . . . . . . . . . . . . . . . . . . . . . . . . . . . . . . . . . . . . . . . . . . . . . . . . . . . . . . . . . . . . . . . . . . . . 6Assets Under Management, Revenues and Fees . . . . . . . . . . . . . . . . . . . . . . . . . . . . . . . . . . . . . . . . . . . . . . . . . . . . . 6Custody and Brokerage . . . . . . . . . . . . . . . . . . . . . . . . . . . . . . . . . . . . . . . . . . . . . . . . . . . . . . . . . . . . . . . . . . . . . . . . 14Service Marks . . . . . . . . . . . . . . . . . . . . . . . . . . . . . . . . . . . . . . . . . . . . . . . . . . . . . . . . . . . . . . . . . . . . . . . . . . . . . . . . 15Regulation . . . . . . . . . . . . . . . . . . . . . . . . . . . . . . . . . . . . . . . . . . . . . . . . . . . . . . . . . . . . . . . . . . . . . . . . . . . . . . . . . . . 15Iran Threat Reduction and Syria Human Rights Act . . . . . . . . . . . . . . . . . . . . . . . . . . . . . . . . . . . . . . . . . . . . . . . . . 16Taxes . . . . . . . . . . . . . . . . . . . . . . . . . . . . . . . . . . . . . . . . . . . . . . . . . . . . . . . . . . . . . . . . . . . . . . . . . . . . . . . . . . . . . . . 17History and Structure . . . . . . . . . . . . . . . . . . . . . . . . . . . . . . . . . . . . . . . . . . . . . . . . . . . . . . . . . . . . . . . . . . . . . . . . . . 17Competition . . . . . . . . . . . . . . . . . . . . . . . . . . . . . . . . . . . . . . . . . . . . . . . . . . . . . . . . . . . . . . . . . . . . . . . . . . . . . . . . . 18Other Information . . . . . . . . . . . . . . . . . . . . . . . . . . . . . . . . . . . . . . . . . . . . . . . . . . . . . . . . . . . . . . . . . . . . . . . . . . . . 19
Item 1A. Risk Factors . . . . . . . . . . . . . . . . . . . . . . . . . . . . . . . . . . . . . . . . . . . . . . . . . . . . . . . . . . . . . . . . . . . . . . . . . . . . . . . 20Item 1B. Unresolved Staff Comments . . . . . . . . . . . . . . . . . . . . . . . . . . . . . . . . . . . . . . . . . . . . . . . . . . . . . . . . . . . . . . . . . . 30Item 2. Properties . . . . . . . . . . . . . . . . . . . . . . . . . . . . . . . . . . . . . . . . . . . . . . . . . . . . . . . . . . . . . . . . . . . . . . . . . . . . . . . . . 31Item 3. Legal Proceedings . . . . . . . . . . . . . . . . . . . . . . . . . . . . . . . . . . . . . . . . . . . . . . . . . . . . . . . . . . . . . . . . . . . . . . . . . . 32Item 4. Mine Safety Disclosures . . . . . . . . . . . . . . . . . . . . . . . . . . . . . . . . . . . . . . . . . . . . . . . . . . . . . . . . . . . . . . . . . . . . . 33
Part II
Item 5. Market for Registrant’s Common Equity, Related Stockholder Matters and Issuer Purchases of EquitySecurities . . . . . . . . . . . . . . . . . . . . . . . . . . . . . . . . . . . . . . . . . . . . . . . . . . . . . . . . . . . . . . . . . . . . . . . . . . . . . . . . . 34
Item 6. Selected Financial Data . . . . . . . . . . . . . . . . . . . . . . . . . . . . . . . . . . . . . . . . . . . . . . . . . . . . . . . . . . . . . . . . . . . . . . 36Holding . . . . . . . . . . . . . . . . . . . . . . . . . . . . . . . . . . . . . . . . . . . . . . . . . . . . . . . . . . . . . . . . . . . . . . . . . . . . . . . . . . . . . 36AllianceBernstein . . . . . . . . . . . . . . . . . . . . . . . . . . . . . . . . . . . . . . . . . . . . . . . . . . . . . . . . . . . . . . . . . . . . . . . . . . . . . . 37
Item 7. Management’s Discussion and Analysis of Financial Condition and Results of Operations . . . . . . . . . . . . . . . 38Executive Overview . . . . . . . . . . . . . . . . . . . . . . . . . . . . . . . . . . . . . . . . . . . . . . . . . . . . . . . . . . . . . . . . . . . . . . . . . . . 38Holding . . . . . . . . . . . . . . . . . . . . . . . . . . . . . . . . . . . . . . . . . . . . . . . . . . . . . . . . . . . . . . . . . . . . . . . . . . . . . . . . . . . . . 39AllianceBernstein . . . . . . . . . . . . . . . . . . . . . . . . . . . . . . . . . . . . . . . . . . . . . . . . . . . . . . . . . . . . . . . . . . . . . . . . . . . . . . 41
Item 7A. Quantitative and Qualitative Disclosures About Market Risk . . . . . . . . . . . . . . . . . . . . . . . . . . . . . . . . . . . . . . . 66Holding . . . . . . . . . . . . . . . . . . . . . . . . . . . . . . . . . . . . . . . . . . . . . . . . . . . . . . . . . . . . . . . . . . . . . . . . . . . . . . . . . . . . . 66AllianceBernstein . . . . . . . . . . . . . . . . . . . . . . . . . . . . . . . . . . . . . . . . . . . . . . . . . . . . . . . . . . . . . . . . . . . . . . . . . . . . . . 66
Item 8. Financial Statements and Supplementary Data . . . . . . . . . . . . . . . . . . . . . . . . . . . . . . . . . . . . . . . . . . . . . . . . . . . 68Holding . . . . . . . . . . . . . . . . . . . . . . . . . . . . . . . . . . . . . . . . . . . . . . . . . . . . . . . . . . . . . . . . . . . . . . . . . . . . . . . . . . . . . 68AllianceBernstein . . . . . . . . . . . . . . . . . . . . . . . . . . . . . . . . . . . . . . . . . . . . . . . . . . . . . . . . . . . . . . . . . . . . . . . . . . . . . . 82
Item 9. Changes in and Disagreements with Accountants on Accounting and Financial Disclosure . . . . . . . . . . . . . . .129Item 9A. Controls and Procedures . . . . . . . . . . . . . . . . . . . . . . . . . . . . . . . . . . . . . . . . . . . . . . . . . . . . . . . . . . . . . . . . . . . . .130Item 9B. Other Information . . . . . . . . . . . . . . . . . . . . . . . . . . . . . . . . . . . . . . . . . . . . . . . . . . . . . . . . . . . . . . . . . . . . . . . . . .132
Part III
Item 10. Directors, Executive Officers and Corporate Governance . . . . . . . . . . . . . . . . . . . . . . . . . . . . . . . . . . . . . . . . . .133Item 11. Executive Compensation . . . . . . . . . . . . . . . . . . . . . . . . . . . . . . . . . . . . . . . . . . . . . . . . . . . . . . . . . . . . . . . . . . . . .143Item 12. Security Ownership of Certain Beneficial Owners and Management and Related Stockholder Matters . . . . .165Item 13. Certain Relationships and Related Transactions, and Director Independence . . . . . . . . . . . . . . . . . . . . . . . . . .171Item 14. Principal Accounting Fees and Services . . . . . . . . . . . . . . . . . . . . . . . . . . . . . . . . . . . . . . . . . . . . . . . . . . . . . . . . .174
Part IV
Item 15. Exhibits, Financial Statement Schedules . . . . . . . . . . . . . . . . . . . . . . . . . . . . . . . . . . . . . . . . . . . . . . . . . . . . . . . .175Signatures . . . . . . . . . . . . . . . . . . . . . . . . . . . . . . . . . . . . . . . . . . . . . . . . . . . . . . . . . . . . . . . . . . . . . . . . . . . . . . . . . . . . . . . . . .178

Glossary of Certain Defined Terms
“AllianceBernstein” – AllianceBernstein L.P. (Delaware limited partnership formerly known as Alliance Capital Management L.P.,“Alliance Capital”), the operating partnership, and its subsidiaries and, where appropriate, its predecessors, Holding and ACMC,Inc. and their respective subsidiaries.
“AllianceBernstein Investments” – AllianceBernstein Investments, Inc. (Delaware corporation), an indirect wholly-owned sub-sidiary of AllianceBernstein that services retail clients and distributes company-sponsored mutual funds.
“AllianceBernstein Partnership Agreement” – the Amended and Restated Agreement of Limited Partnership ofAllianceBernstein, dated as of October 29, 1999 and as amended February 24, 2006.
“AllianceBernstein Units” – units of limited partnership interest in AllianceBernstein.
“AUM” – assets under management for clients.
“AXA” – AXA (société anonyme organized under the laws of France), the holding company for an international group of insuranceand related financial services companies engaged in the financial protection and wealth management businesses.
“AXA Equitable” – AXA Equitable Life Insurance Company (New York stock life insurance company), an indirect wholly-owned subsidiary of AXA Financial, and its subsidiaries other than AllianceBernstein and its subsidiaries.
“AXA Financial” – AXA Financial, Inc. (Delaware corporation), an indirect wholly-owned subsidiary of AXA.
“Bernstein GWM” – Bernstein Global Wealth Management, a unit of AllianceBernstein that services private clients.
“Bernstein Transaction” – on October 2, 2000, AllianceBernstein’s acquisition of the business and assets of SCB Inc., formerlyknown as Sanford C. Bernstein Inc., and assumption of the liabilities of that business.
“Exchange Act” – the Securities Exchange Act of 1934, as amended.
“ERISA” – the Employee Retirement Income Security Act of 1974, as amended.
“General Partner” – AllianceBernstein Corporation (Delaware corporation), the general partner of AllianceBernstein and Holdingand an indirect wholly-owned subsidiary of AXA Equitable, and, where appropriate, ACMC, LLC, its predecessor.
“Holding” – AllianceBernstein Holding L.P. (Delaware limited partnership).
“Holding Partnership Agreement” – the Amended and Restated Agreement of Limited Partnership of Holding, dated as ofOctober 29, 1999 and as amended February 24, 2006.
“Holding Units” – units representing assignments of beneficial ownership of limited partnership interests in Holding.
“Investment Advisers Act” – the Investment Advisers Act of 1940, as amended.
“Investment Company Act” – the Investment Company Act of 1940, as amended.
“NYSE” – the New York Stock Exchange, Inc.
“Partnerships” – AllianceBernstein and Holding together.
“SCB” – SCB LLC, SCBL and Sanford C. Bernstein (Hong Kong) Limited, together.
“SCB LLC” – Sanford C. Bernstein & Co., LLC (Delaware limited liability company), an indirect wholly-owned subsidiary ofAllianceBernstein that provides Bernstein Research Services in the United States.
“SCBL” – Sanford C. Bernstein Limited (U.K. company), an indirect wholly-owned subsidiary of AllianceBernstein that providesBernstein Research Services primarily in Europe.
“SEC” – the United States Securities and Exchange Commission.
“Securities Act” – the Securities Act of 1933, as amended.
ii

PART I
Item 1. Business
The words “we” and “our” in this Form 10-K refer collectively to Holding and AllianceBernstein and its subsidiaries, or to theirofficers and employees. Similarly, the words “company” and “firm” refer to both Holding and AllianceBernstein. Where the con-text requires distinguishing between Holding and AllianceBernstein, we identify which company is being discussed. Cross-references are in italics.
We use “global” in this Form 10-K to refer to all nations, including the United States; we use “international” or “non-U.S.” torefer to nations other than the United States.
We use “emerging markets” in this Form 10-K to refer to countries included in the Morgan Stanley Capital International(“MSCI”) emerging markets index, which are, as of December 31, 2012, Brazil, Chile, China, Columbia, Czech Republic, Egypt,Hungary, India, Indonesia, Malaysia, Mexico, Morocco, Peru, the Philippines, Poland, Russia, South Africa, South Korea, Taiwan,Thailand and Turkey.
We use the term “hedge funds” in this Form 10-K to refer to private investment funds we sponsor that utilize various alternativestrategies such as leverage, short selling of securities, and the use of forward contracts, currency options and other derivatives.
General
Mission
Our firm’s mission is to be the most trusted investment firm in the world by placing our clients’ interests first and foremost, utilizingour research capabilities to have more knowledge than any other investment firm, and using and sharing knowledge better than ourcompetitors to help our clients achieve financial peace of mind and investment success.
Clients
AllianceBernstein provides research, diversified investment management and related services globally to a broad range of clients,including:
• institutional clients, including unaffiliated corporate and public employee pension funds, endowment funds, domestic and for-eign institutions and governments, and various affiliates;
• retail clients, including U.S. and offshore mutual funds, variable annuities, insurance products and sub-advisory relationships;
• private clients, including high-net-worth individuals, trusts and estates, charitable foundations, partnerships, private and familycorporations, and other entities; and
• institutional investors seeking high-quality research, portfolio strategy advice and brokerage-related services.
We also provide distribution, shareholder servicing and administrative services to our sponsored mutual funds.
Research
Our high-quality, in-depth research is the foundation of our business. We believe that our global team of research professionalsgives us a competitive advantage in achieving investment success for our clients.
Our research disciplines include fundamental, quantitative and economic research and currency forecasting. In addition, we haveseveral specialized research initiatives, including research examining global strategic developments that can affect multiple industriesand geographies.
Annual Report 2012 1

Products and Services
We offer a broad range of investment products and services to our clients:
• To our institutional clients, we offer separately-managed accounts, sub-advisory relationships, structured products, collectiveinvestment trusts, mutual funds, hedge funds and other investment vehicles (“Institutional Services”);
• To our retail clients, we offer retail mutual funds sponsored by AllianceBernstein and our subsidiaries, sub-advisory services tomutual funds sponsored by third parties, separately-managed account programs sponsored by financial intermediaries worldwide(“Separately-Managed Account Programs”) and other investment vehicles (collectively, “Retail Services”);
• To our private clients, we offer diversified investment management services through separately-managed accounts, hedge funds,mutual funds and other investment vehicles (“Private Client Services”); and
• To institutional investors, we offer research, portfolio strategy advice and brokerage-related services (“Bernstein ResearchServices”).
These services are provided by teams of investment professionals with significant expertise in their respective disciplines (see“Employees” in this Item 1). Our buy-side research analysts support our portfolio managers and, together, they oversee a number ofdifferent types of investment services within various vehicles (discussed above) and strategies (discussed below). Our sell-side researchanalysts provide the foundation for our Bernstein Research Services.
Our services include:
• Value equities, generally targeting stocks that are out of favor and considered undervalued;
• Growth equities, generally targeting stocks with under-appreciated growth potential;
• Fixed income securities, including taxable and tax-exempt securities;
• Blend strategies, combining style-pure investment components with systematic rebalancing;
• Passive management, including index and enhanced index strategies;
• Alternative investments, including hedge funds, fund of funds, currency management strategies and private equity (e.g., directreal estate investing); and
• Asset allocation services, including dynamic asset allocation, customized target date funds, target risk funds and other strategiestailored to help clients meet their investment goals.
Sub-advisory client mandates span our investment strategies, including value, growth, fixed income and blend. We serve as sub-adviser for retail mutual funds, insurance products, retirement platforms and institutional investment products.
We provide our services using various investment disciplines, including market capitalization (e.g., large-, mid- and small-capequities), term (e.g., long-, intermediate- and short-duration debt securities), and geographic location (e.g., U.S., international,global and emerging markets), as well as local and regional disciplines in major markets around the world.
We market and distribute alternative investment products globally to high-net-worth clients and institutional investors. Alternativeproduct AUM totaled $11.6 billion as of December 31, 2012, $9.7 billion of which was institutional AUM, $1.5 billion of whichwas private client AUM and $0.4 billion of which was retail AUM.
In 2008, we created a unit called AllianceBernstein Defined Contribution Investments (“ABDC”) focused on expanding our firm’scapabilities in the defined contribution (“DC”) market. ABDC seeks to provide the most effective DC investment solutions in theindustry, as measured by product features, reliability, cost and flexibility, to meet specialized client needs by integrating research andinvestment design, product strategy, strategic partnerships (e.g., record-keeper partnerships and operations collaboration), and clientimplementation and service. In November 2010, we introduced Lifetime Income Strategies (formerly known as Secure RetirementStrategies, “LIS”), a multi-manager target-date solution. LIS provides guaranteed lifetime retirement income backed by multipleinsurers to participants of large DC plans. We had our first LIS client funding during the second quarter of 2012 and are in dis-cussions with additional plan sponsors to introduce LIS in their plans in 2013.
2 AllianceBernstein
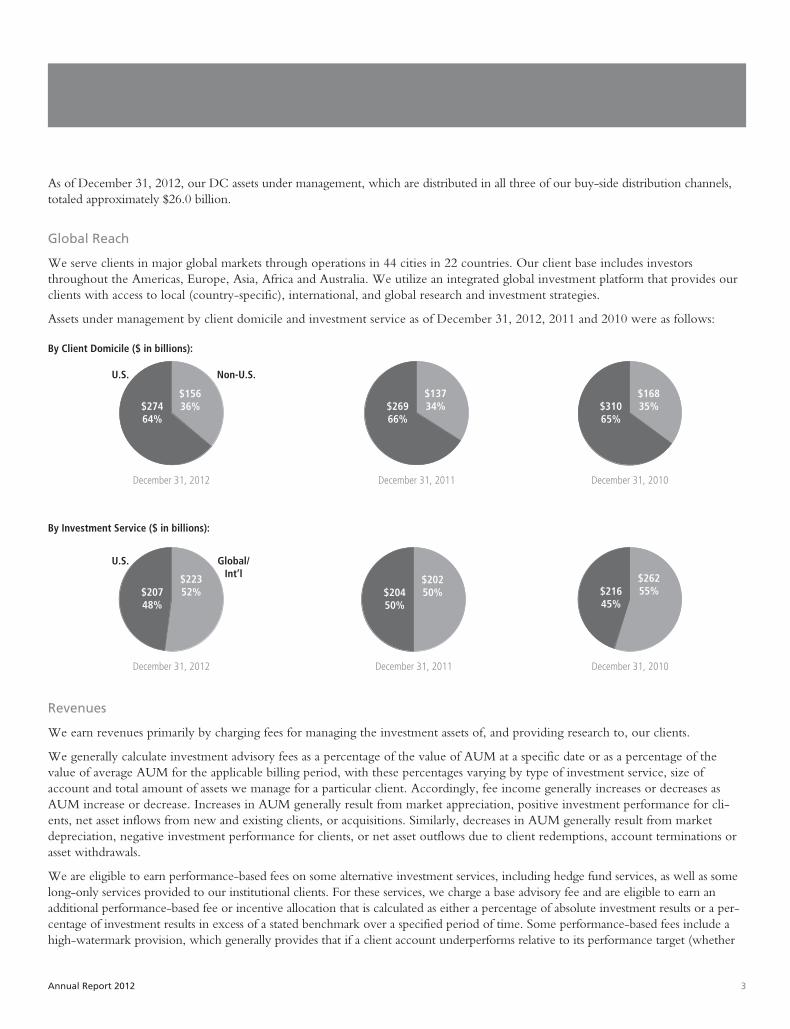
As of December 31, 2012, our DC assets under management, which are distributed in all three of our buy-side distribution channels,totaled approximately $26.0 billion.
Global Reach
We serve clients in major global markets through operations in 44 cities in 22 countries. Our client base includes investorsthroughout the Americas, Europe, Asia, Africa and Australia. We utilize an integrated global investment platform that provides ourclients with access to local (country-specific), international, and global research and investment strategies.
Assets under management by client domicile and investment service as of December 31, 2012, 2011 and 2010 were as follows:
By Client Domicile ($ in billions):
Non-U.S.U.S.
December 31, 2012
$27464%
$15636%
December 31, 2011
$26966%
$13734%
December 31, 2010
$31065%
$16835%
By Investment Service ($ in billions):
Global/Int’l
U.S.
December 31, 2012
$20748%
$22352%
December 31, 2011
$20450%
$20250%
December 31, 2010
$21645%
$26255%
Revenues
We earn revenues primarily by charging fees for managing the investment assets of, and providing research to, our clients.
We generally calculate investment advisory fees as a percentage of the value of AUM at a specific date or as a percentage of thevalue of average AUM for the applicable billing period, with these percentages varying by type of investment service, size ofaccount and total amount of assets we manage for a particular client. Accordingly, fee income generally increases or decreases asAUM increase or decrease. Increases in AUM generally result from market appreciation, positive investment performance for cli-ents, net asset inflows from new and existing clients, or acquisitions. Similarly, decreases in AUM generally result from marketdepreciation, negative investment performance for clients, or net asset outflows due to client redemptions, account terminations orasset withdrawals.
We are eligible to earn performance-based fees on some alternative investment services, including hedge fund services, as well as somelong-only services provided to our institutional clients. For these services, we charge a base advisory fee and are eligible to earn anadditional performance-based fee or incentive allocation that is calculated as either a percentage of absolute investment results or a per-centage of investment results in excess of a stated benchmark over a specified period of time. Some performance-based fees include ahigh-watermark provision, which generally provides that if a client account underperforms relative to its performance target (whether
Annual Report 2012 3

absolute or relative to a specified benchmark), it must gain back such underperformance before we can collect future performance-based fees. Therefore, if we fail to achieve our performance target for a particular period, we will not earn a performance-based fee forthat period and, for accounts with a high-watermark provision, our ability to earn future performance-based fees will be impaired. Ifthe percentage of our AUM subject to performance-based fees grows, seasonality and volatility of revenue and earnings are likely tobecome more significant. Our performance-based fees in 2012, 2011 and 2010 were $66.6 million (including $39.6 million pertainingto winding up the Public-Private Investment Program (“PPIP”) fund, see “Management’s Discussion and Analysis of Financial Conditionand Results of Operations” in Item 7), $16.5 million and $20.5 million, respectively. For additional information about performance-basedfees, see “Risk Factors” in Item 1A and “Management’s Discussion and Analysis of Financial Condition and Results of Operations” in Item 7.
We sometimes experience periods when the number of new accounts or the amount of AUM increases or decreases significantly.These changes result from wide-ranging factors, including conditions of financial markets, our investment performance for clients,the experience of the portfolio manager (both with our firm and in the industry generally), the client’s overall relationship with us,consultant recommendations, and changes in our clients’ investment preferences, risk tolerances and liquidity needs.
Our Bernstein Research Services generate revenues from clients to whom we provide research, portfolio strategy advice andbrokerage-related services, primarily in the form of transaction fees calculated as either “cents per share” (generally in the U.S.market) or a percentage of the value of the securities traded (generally outside of the U.S.) for these clients.
Our revenues may fluctuate for a number of reasons; see “Risk Factors” in Item 1A and “Management’s Discussion and Analysis of Finan-cial Condition and Results of Operations” in Item 7.
Employees
Our firm’s 3,318 full-time employees, who are located in 22 countries, include 261 research analysts, 136 portfolio managers, 34traders and 14 professionals with other investment-related responsibilities. We have employed these professionals for an averageperiod of approximately nine years, and their average investment experience is approximately 18 years. We consider our employeerelations to be good.
Institutional Services
We serve our institutional clients primarily through AllianceBernstein Institutional Investments (“Institutional Investments”), aunit of AllianceBernstein, and through other units in our international subsidiaries (institutional relationships of less than $25 millionare generally serviced by Bernstein GWM, our Private Client channel, discussed below). Institutional Services include actively man-aged equity accounts (including growth, value and blend accounts), fixed income accounts and balanced accounts (which combineequity and fixed income), as well as passive management of index and enhanced index accounts. These services are providedthrough separately-managed accounts, sub-advisory relationships, structured products, collective investment trusts, mutual funds,hedge funds and other investment vehicles. As of December 31, 2012, institutional AUM were $220 billion, or 51% of ourcompany-wide AUM, as compared to $224 billion, or 55%, as of December 31, 2011 and $273 billion, or 57%, as of December 31,2010. For more information concerning institutional AUM, revenues and fees, see “Assets Under Management, Revenues and Fees” inthis Item 1.
Our institutional client base includes unaffiliated corporate and public employee pension funds, endowment funds, domestic andforeign institutions and governments, and certain of our affiliates (AXA and its subsidiaries), as well as certain sub-advisory relation-ships with unaffiliated sponsors of various other investment products. We manage approximately 802 mandates for these clients,which are located in 37 countries.
Retail Services
We provide investment management and related services to a wide variety of individual retail investors, both in the U.S. and inter-nationally, through retail mutual funds sponsored by our company and our subsidiaries; mutual fund sub-advisory relationships;
4 AllianceBernstein

Separately-Managed Account Programs; and other investment vehicles (“Retail Products and Services”). As of December 31,2012, retail AUM were $144 billion, or 34% of our company-wide AUM, as compared to $113 billion, or 28%, as ofDecember 31, 2011 and $127 billion, or 27%, as of December 31, 2010. For more information concerning retail AUM, revenuesand fees, see “Assets Under Management, Revenues and Fees” in this Item 1.
Our Retail Products and Services are designed to provide disciplined, research-based investments that contribute to a well-diversified investment portfolio. We distribute these products and services through financial intermediaries, including broker-dealers, insurance sales representatives, banks, registered investment advisers and financial planners. These products and servicesinclude open-end and closed-end funds that are either (i) registered as investment companies under the Investment CompanyAct (“U.S. Funds”), or (ii) not registered under the Investment Company Act and generally not offered to United States per-sons (“Non-U.S. Funds” and, collectively with the U.S. Funds, “AllianceBernstein Funds”). They provide a broad range ofinvestment options, including local and global value equities, growth equities, blend strategies, fixed income securities and alter-native investment products. They also include Separately-Managed Account Programs, which are sponsored by financial inter-mediaries and generally charge an all-inclusive fee covering investment management, trade execution, asset allocation, andcustodial and administrative services. We also provide distribution, shareholder servicing, and administrative services for ourRetail Products and Services.
Our U.S. Funds, which include retail funds, our variable products series fund (a component of an insurance product) and the retailshare classes of the Sanford C. Bernstein Funds (principally Private Client Services products), currently offer 120 different portfoliosto U.S. investors. As of December 31, 2012, retail U.S. Funds AUM were approximately $45 billion, or 31% of total retail AUM,as compared to $41 billion, or 36%, as of December 31, 2011 and $46 billion, or 36%, as of December 31, 2010. Because of theway they are marketed and serviced, we report substantially all of the AUM in the Sanford C. Bernstein Funds (“SCB Funds”),which totaled $28 billion as of December 31, 2012, as private client AUM.
Our Non-U.S. Funds are distributed internationally by local financial intermediaries to non-U.S. investors in most major interna-tional markets by means of distribution agreements. As of December 31, 2012, these funds consisted of 92 different portfolios andAUM in these funds were $60 billion, $6 billion of which was invested in local-market funds that we distribute in Japan throughfinancial intermediaries.
AllianceBernstein Investments serves as the principal underwriter and distributor of the U.S. Funds. AllianceBernstein Investmentsemploys 118 sales representatives who devote their time to promoting the sale of U.S. Funds and certain other Retail Products andServices offered by financial intermediaries.
AllianceBernstein (Luxembourg) S.A. (“AllianceBernstein Luxembourg”), a Luxembourg management company and one of ourwholly-owned subsidiaries, generally serves as the distributor for the Non-U.S. Funds.
We have an international sales force of 69 sales representatives who devote some or all of their time to promoting the sale of Non-U.S. Funds and other Retail Products and Services offered by financial intermediaries.
Our Retail Products and Services include open-end mutual funds designed to fund benefits under variable annuity contracts andvariable life insurance policies offered by unaffiliated life insurance companies (“Sub-Advised Variable Products”), and we sub-advise variable product mutual funds sponsored by affiliates. As of December 31, 2012, we managed or sub-advised approximately$33 billion of Sub-Advised Variable Product AUM.
Private Client Services
Through Bernstein GWM, we provide Private Client Services to high-net-worth individuals, trusts and estates, charitable foundations,partnerships, private and family corporations, and other entities by means of separately-managed accounts, hedge funds, mutual fundsand other investment vehicles. As of December 31, 2012, private client AUM were $66 billion, or 15% of our company-wide AUM,as compared to $69 billion, or 17%, as of December 31, 2011 and $78 billion, or 16%, as of December 31, 2010. For more informationconcerning private client AUM, revenues and fees, see “Assets Under Management, Revenues and Fees” in this Item 1.
Annual Report 2012 5

Our Private Client Services are built on a sales effort that involves approximately 253 financial advisors based in 18 cities in the U.S.These advisors do not manage money, but work with private clients and their tax, legal and other advisors to assist them indetermining a suitable mix of U.S. and non-U.S. equity securities and fixed income investments. The diversified portfolio createdfor each client is intended to maximize after-tax investment returns, in light of the client’s individual investment goals, incomerequirements, risk tolerance, tax situation and other relevant factors. In creating these portfolios, we utilize our research reports,investment planning services, the dynamic asset allocation service and Bernstein GWM, which has in-depth knowledge of trust,estate and tax planning strategies.
Bernstein Research Services
Bernstein Research Services consist of fundamental research, quantitative services and brokerage-related services in equities andlisted options provided to institutional investors such as pension fund, hedge fund and mutual fund managers, and other institutionalinvestors. Brokerage-related services are provided by SCB LLC in the United States and SCBL primarily in Europe, with researchservices also provided by Sanford C. Bernstein (Hong Kong) Limited (an indirect wholly-owned subsidiary of AllianceBernstein,“SCB Hong Kong”), in Asia. For more information concerning the revenues we derive from Bernstein Research Services, see“Assets Under Management, Revenues and Fees” in this Item 1.
We provide fundamental company and industry research along with disciplined research into securities valuation and factors affect-ing stock-price movements. Our analysts are consistently among the highest ranked research analysts in industry surveys conductedby third-party organizations.
Assets Under Management, Revenues and Fees
The following tables summarize our AUM and revenues by distribution channel:
End of Period Assets Under ManagementDecember 31, % Change
2012 2011 2010 2012-11 2011-10
(in millions)
Institutions $ 219,819 $ 223,874 $ 272,928 (1.8)% (18.0)%
Retail 144,392 112,605 127,045 28.2 (11.4)
Private Client 65,806 69,418 78,046 (5.2) (11.1)
Total $430,017 $405,897 $478,019 5.9 (15.1)
Average Assets Under ManagementYears Ended December 31, % Change
2012 2011 2010 2012-11 2011-10
(in millions)
Institutions $ 218,923 $ 252,597 $ 277,109 (13.3)% (8.8)%
Retail 128,216 124,012 122,756 3.4 1.0
Private Client 68,839 75,323 74,686 (8.6) 0.9
Total $415,978 $451,932 $474,551 (8.0) (4.8)
6 AllianceBernstein

RevenuesYears Ended December 31, % Change
2012 2011 2010 2012-11 2011-10
(in thousands)
Institutional Services $ 485,651 $ 616,787 $ 764,847 (21.3)% (19.4)%Retail Services 1,192,895 1,092,561 1,068,869 9.2 2.2Private Client Services 585,791 652,097 651,218 (10.2) 0.1Bernstein Research Services 413,707 437,414 430,521 (5.4) 1.6Other(1) 61,915 (46,418) 36,650 n/m n/mTotal Revenues 2,739,959 2,752,441 2,952,105 (0.5) (6.8)Less: Interest Expense 3,222 2,550 3,548 26.4 (28.1)Net Revenues $2,736,737 $2,749,891 $2,948,557 (0.5) (6.7)
(1) Other revenues primarily consist of investment gains (losses) and dividend and interest income. For additional information, see “Management’s Discussion andAnalysis of Financial Condition and Results of Operations” in Item 7.
AXA and its subsidiaries, whose AUM consist primarily of fixed income investments, together constitute our largest client. Ouraffiliates represented approximately 25%, 23% and 22% of our company-wide AUM as of December 31, 2012, 2011 and 2010,respectively. We earned approximately 4%, 4% and 5% of our company-wide net revenues from our affiliates in 2012, 2011 and2010, respectively. Affiliated AUM is included in our Institutions and Retail buy-side distribution channels.
Institutional Services
The following tables summarize our Institutional Services AUM and revenues:
Institutional Services Assets Under Management(by Investment Service)
December 31, % Change2012 2011 2010 2012-11 2011-10
(in millions)Value Equity:
U.S. $ 2,476 $ 7,469 $ 13,955 (66.8)% (46.5)%Global and International 22,642 37,316 74,668 (39.3) (50.0)
25,118 44,785 88,623 (43.9) (49.5)Growth Equity:
U.S. 3,479 5,541 10,921 (37.2) (49.3)Global and International 3,426 7,417 22,507 (53.8) (67.0)
6,905 12,958 33,428 (46.7) (61.2)Fixed Income:
U.S. 92,112 86,329 78,101 6.7 10.5Global and International 54,015 44,983 44,766 20.1 0.5
146,127 131,312 122,867 11.3 6.9Other(1):
U.S. 11,820 11,278 9,980 4.8 13.0Global and International 29,849 23,541 18,030 26.8 30.6
41,669 34,819 28,010 19.7 24.3Total:
U.S. 109,887 110,617 112,957 (0.7) (2.1)Global and International 109,932 113,257 159,971 (2.9) (29.2)
Total $219,819 $223,874 $272,928 (1.8) (18.0)
Affiliated $ 77,569 $ 69,071 $ 74,672 12.3 (7.5)Non-affiliated 142,250 154,803 198,256 (8.1) (21.9)Total $219,819 $223,874 $272,928 (1.8) (18.0)
(1) Includes index, structured, asset allocation services and certain other alternative investments.
Annual Report 2012 7
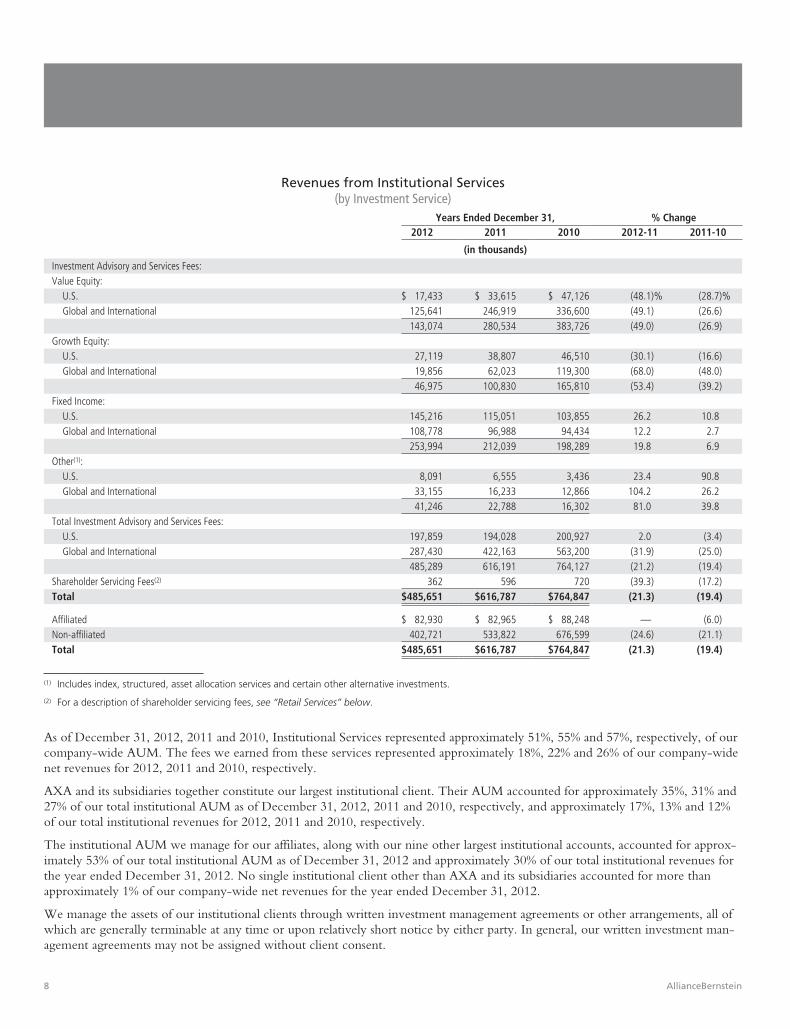
Revenues from Institutional Services(by Investment Service)
Years Ended December 31, % Change2012 2011 2010 2012-11 2011-10
(in thousands)
Investment Advisory and Services Fees:Value Equity:
U.S. $ 17,433 $ 33,615 $ 47,126 (48.1)% (28.7)%Global and International 125,641 246,919 336,600 (49.1) (26.6)
143,074 280,534 383,726 (49.0) (26.9)Growth Equity:
U.S. 27,119 38,807 46,510 (30.1) (16.6)Global and International 19,856 62,023 119,300 (68.0) (48.0)
46,975 100,830 165,810 (53.4) (39.2)Fixed Income:
U.S. 145,216 115,051 103,855 26.2 10.8Global and International 108,778 96,988 94,434 12.2 2.7
253,994 212,039 198,289 19.8 6.9Other(1):
U.S. 8,091 6,555 3,436 23.4 90.8Global and International 33,155 16,233 12,866 104.2 26.2
41,246 22,788 16,302 81.0 39.8Total Investment Advisory and Services Fees:
U.S. 197,859 194,028 200,927 2.0 (3.4)Global and International 287,430 422,163 563,200 (31.9) (25.0)
485,289 616,191 764,127 (21.2) (19.4)Shareholder Servicing Fees(2) 362 596 720 (39.3) (17.2)Total $485,651 $616,787 $764,847 (21.3) (19.4)
Affiliated $ 82,930 $ 82,965 $ 88,248 — (6.0)Non-affiliated 402,721 533,822 676,599 (24.6) (21.1)Total $485,651 $616,787 $764,847 (21.3) (19.4)
(1) Includes index, structured, asset allocation services and certain other alternative investments.
(2) For a description of shareholder servicing fees, see “Retail Services” below.
As of December 31, 2012, 2011 and 2010, Institutional Services represented approximately 51%, 55% and 57%, respectively, of ourcompany-wide AUM. The fees we earned from these services represented approximately 18%, 22% and 26% of our company-widenet revenues for 2012, 2011 and 2010, respectively.
AXA and its subsidiaries together constitute our largest institutional client. Their AUM accounted for approximately 35%, 31% and27% of our total institutional AUM as of December 31, 2012, 2011 and 2010, respectively, and approximately 17%, 13% and 12%of our total institutional revenues for 2012, 2011 and 2010, respectively.
The institutional AUM we manage for our affiliates, along with our nine other largest institutional accounts, accounted for approx-imately 53% of our total institutional AUM as of December 31, 2012 and approximately 30% of our total institutional revenues forthe year ended December 31, 2012. No single institutional client other than AXA and its subsidiaries accounted for more thanapproximately 1% of our company-wide net revenues for the year ended December 31, 2012.
We manage the assets of our institutional clients through written investment management agreements or other arrangements, all ofwhich are generally terminable at any time or upon relatively short notice by either party. In general, our written investment man-agement agreements may not be assigned without client consent.
8 AllianceBernstein

We are compensated principally on the basis of investment advisory fees calculated as a percentage of AUM. The percentage wecharge varies with the type of investment service, the size of the account and the total amount of assets we manage for a particularclient.
We are eligible to earn performance-based fees on approximately 8% of institutional AUM, which are primarily invested in long-only equity and fixed income services. Performance-based fees provide for a base advisory fee plus an additional fee based oninvestment performance. For additional information about performance-based fees, see “General–Revenues” in this Item 1 and “RiskFactors” in Item 1A.
Retail Services
The following tables summarize our Retail Services AUM and revenues:
Retail Services Assets Under Management(by Investment Service)
December 31, % Change2012 2011 2010 2012-11 2011-10
(in millions)
Value Equity:
U.S. $ 7,659 $ 7,769 $ 10,772 (1.4)% (27.9)%
Global and International 7,979 10,351 20,107 (22.9) (48.5)
15,638 18,120 30,879 (13.7) (41.3)
Growth Equity:
U.S. 10,319 8,568 9,789 20.4 (12.5)
Global and International 8,468 9,110 14,002 (7.0) (34.9)
18,787 17,678 23,791 6.3 (25.7)
Fixed Income:
U.S. 11,598 8,895 8,442 30.4 5.4
Global and International 66,009 42,843 40,754 54.1 5.1
77,607 51,738 49,196 50.0 5.2
Other(1):
U.S. 20,514 18,013 18,466 13.9 (2.5)
Global and International 11,846 7,056 4,713 67.9 49.7
32,360 25,069 23,179 29.1 8.2
Total:
U.S. 50,090 43,245 47,469 15.8 (8.9)
Global and International 94,302 69,360 79,576 36.0 (12.8)
Total $144,392 $112,605 $127,045 28.2 (11.4)
Affiliated $ 28,535 $ 22,561 $ 29,841 26.5 (24.4)
Non-affiliated 115,857 90,044 97,204 28.7 (7.4)
Total $144,392 $112,605 $127,045 28.2 (11.4)
(1) Includes index, structured, asset allocation services and certain other alternative investments.
Annual Report 2012 9

Revenues from Retail Services(by Investment Service)
Years Ended December 31, % Change2012 2011 2010 2012-11 2011-10
(in thousands)
Investment Advisory and Services Fees:
Value Equity:
U.S. $ 40,595 $ 43,148 $ 45,862 (5.9)% (5.9)%
Global and International 53,213 82,868 112,252 (35.8) (26.2)
93,808 126,016 158,114 (25.6) (20.3)
Growth Equity:
U.S. 52,242 50,572 45,752 3.3 10.5
Global and International 62,624 83,884 97,973 (25.3) (14.4)
114,866 134,456 143,725 (14.6) (6.4)
Fixed Income:
U.S. 46,821 34,143 31,723 37.1 7.6
Global and International 409,115 332,791 282,845 22.9 17.7
455,936 366,934 314,568 24.3 16.6
Other(1):
U.S. 21,470 15,447 11,672 39.0 32.3
Global and International 19,181 9,646 11,798 98.8 (18.2)
40,651 25,093 23,470 62.0 6.9
Total Investment Advisory and Services Fees:
U.S. 161,128 143,310 135,009 12.4 6.1
Global and International 544,133 509,189 504,868 6.9 0.9
705,261 652,499 639,877 8.1 2.0
Distribution Revenues(2) 399,259 348,456 336,204 14.6 3.6
Shareholder Servicing Fees(2) 88,375 91,606 92,788 (3.5) (1.3)
Total $1,192,895 $1,092,561 $1,068,869 9.2 2.2
Affiliated $ 31,089 $ 31,301 $ 46,756 (0.7) (33.1)
Non-affiliated 1,161,806 1,061,260 1,022,113 9.5 3.8
Total $1,192,895 $1,092,561 $1,068,869 9.2 2.2
(1) Includes index, structured, asset allocation services and certain other alternative investments.
(2) For a description of distribution revenues and shareholder servicing fees, see below.
Investment advisory fees and distribution fees for our Retail Products and Services are generally charged as a percentage of averagedaily AUM. In the past, as certain of the U.S. Funds grew, we revised our fee schedules to provide lower incremental fees abovecertain asset levels. Fees paid by the U.S. Funds, EQ Advisors Trust (“EQAT”) and AXA Premier VIP Trust are reflected in theapplicable investment management agreement, which generally must be approved annually by the boards of directors or trustees ofthose funds, including by a majority of the independent directors or trustees. Increases in these fees must be approved by fundshareholders; decreases need not be, including any decreases implemented by a fund’s directors or trustees. In general, each invest-ment management agreement with the U.S. Funds, EQAT and AXA Premier VIP Trust provides for termination by either party atany time upon 60 days’ notice.
Fees paid by Non-U.S. Funds are reflected in investment management agreements that continue until they are terminated. Increasesin these fees generally must be approved by the relevant regulatory authority, depending on the domicile and structure of the fund,and Non-U.S. Fund shareholders must be given advance notice of any fee increases.
10 AllianceBernstein

Revenues from Retail Services represented approximately 44%, 40% and 36% of our company-wide net revenues for the yearsended December 31, 2012, 2011 and 2010, respectively.
The mutual funds we sub-advise for AXA and its subsidiaries together constitute our largest retail client. They accounted for approx-imately 20%, 20% and 23% of our total retail AUM as of December 31, 2012, 2011 and 2010, respectively, and approximately 3%,3% and 4% of our total retail revenues for 2012, 2011 and 2010, respectively.
Our mutual fund distribution system (the “System”) includes a multi-class share structure that permits open-endAllianceBernstein Funds to offer investors various options for the purchase of mutual fund shares, including both front-end loadshares and back-end load shares. For front-end load shares, AllianceBernstein Investments generally pays sales commissions tofinancial intermediaries distributing the funds from the front-end sales charge it receives from investors at the time of the sale.For back-end load shares, AllianceBernstein Investments pays sales commissions to financial intermediaries at the time of sale andalso receives higher ongoing distribution services fees from the mutual funds. In addition, investors who redeem back-end loadshares before the expiration of the minimum holding period (which ranges from one year to four years) pay a contingentdeferred sales charge (“CDSC”) to AllianceBernstein Investments. We expect to recover sales commissions for back-end loadshares over periods not exceeding five and one-half years through receipt of a CDSC and/or the higher ongoing distributionservices fees we receive from holders of back-end load shares. Payments of sales commissions made to financial intermediaries inconnection with the sale of back-end load shares under the System, net of CDSC received of $21.7 million, $14.2 million and$20.0 million, totaled approximately $75.7 million, $21.5 million and $33.4 million during 2012, 2011 and 2010, respectively.We have not offered back-end load shares to new investors in U.S. Funds since January 31, 2009. However, our Non-U.S.Funds continue to offer back-end load shares.
The rules of the Financial Industry Regulatory Authority, Inc. (“FINRA”) effectively cap the aggregate sales charges that may be received fromeach open-end U.S. Fund by AllianceBernstein Investments at 6.25% of cumulative gross sales (plus interest at the prime rate plus 1% per annum).
Most open-end U.S. Funds have adopted a plan under Rule 12b-1 of the Investment Company Act that allows the fund to pay, outof assets of the fund, distribution and service fees for the distribution and sale of its shares (“Rule 12b-1 Fees”). The open-endAllianceBernstein Funds have entered into agreements with AllianceBernstein Investments under which they pay a distributionservices fee to AllianceBernstein Investments. AllianceBernstein Investments has entered into selling and distribution agreementspursuant to which it pays sales commissions to the financial intermediaries that distribute our open-end U.S. Funds. These agree-ments are terminable by either party upon notice (generally 30 days) and do not obligate the financial intermediary to sell anyspecific amount of fund shares.
In addition to Rule 12b-1 Fees, AllianceBernstein Investments, at its own expense, currently provides additional payments underdistribution services and educational support agreements to financial intermediaries that sell shares of our funds, a practice sometimesreferred to as “revenue sharing”. Although the amount of payments made in any given year may vary, the total amount paid to afinancial intermediary in connection with the sale of shares of U.S. Funds generally will not exceed the sum of (i) 0.25% of thecurrent year’s fund sales by that firm, and (ii) 0.10% of average daily net assets attributable to that firm over the course of the year.
Financial intermediaries that provide accounting or record-keeping services with respect to their customers’ investments in AllianceBernsteinFunds may receive specified payments from these funds or from affiliates of AllianceBernstein, including AllianceBernstein Investor Services,Inc. (one of our wholly-owned subsidiaries, “AllianceBernstein Investor Services”) and AllianceBernstein Investments.
During 2012, the 10 financial intermediaries responsible for the largest volume of sales of open-end AllianceBernstein Funds wereresponsible for 54% of such sales. Certain subsidiaries of AXA, including AXA Advisors, LLC (“AXA Advisors”), a wholly-ownedsubsidiary of AXA Financial that utilizes members of AXA Equitable’s insurance sales force as its registered representatives, wereresponsible for approximately 4%, 1% and 2% of total sales of shares of open-end AllianceBernstein Funds in 2012, 2011 and 2010,respectively. None of these entities are under any obligation to sell a specific amount of AllianceBernstein Fund shares and each alsosells shares of mutual funds sponsored by other affiliates and unaffiliated organizations.
During 2012, Hong Kong and Shanghai Banking Corporation, UBS AG and Citigroup (or their respective subsidiaries) wereresponsible for approximately 13%, 10% and 6%, respectively, of our open-end AllianceBernstein Fund sales. None of thesecompanies are under any obligation to sell a specific amount of AllianceBernstein Fund shares and each also sells shares of mutualfunds that it sponsors and that are sponsored by unaffiliated organizations.
Annual Report 2012 11

Based on industry sales data reported by the Investment Company Institute, our market share in the U.S. mutual fund industry wasapproximately 1% of total industry assets in the U.S. during 2012. The investment performance of the U.S. Funds is an importantfactor in the sale of their shares, but there are also other factors, including the level and quality of our shareholder services (see below)and the amounts and types of distribution assistance and administrative services payments we make to financial intermediaries, whichwe believe are competitive with others in the industry.
AllianceBernstein Investor Services, which operates in San Antonio, Texas, provides transfer agency and related services for eachopen-end U.S. Fund (except the SCB Funds) and provides shareholder servicing for each open-end U.S. Fund’s shareholderaccounts (approximately 2.7 million accounts in total), for which it receives a monthly fee under servicing agreements with eachopen-end U.S. Fund based on the number and type of shareholder accounts serviced. Each servicing agreement must be approvedannually by the relevant open-end U.S. Fund’s board of directors or trustees, including a majority of the independent directors ortrustees, and may be terminated by either party without penalty upon 60 days’ notice.
AllianceBernstein Funds utilize our personnel to perform most legal, clerical and accounting services. Payments to us by the U.S.Funds and certain Non-U.S. Funds for these services, which payments were approximately $5 million in 2012, $6 million in 2011and $6 million in 2010, must be specifically approved in advance by each fund’s board of directors or trustees.
A unit of AllianceBernstein Luxembourg (“ABIS Lux”) is the transfer agent for substantially all of the Non-U.S. Funds. ABIS Lux,based in Luxembourg and supported by operations in Singapore, Hong Kong and the United States, receives a monthly asset-basedfee for its transfer agency services and a transaction-based fee under various services agreements with the Non-U.S. Funds. Eachagreement may be terminated by either party upon 60 days’ notice.
Private Client Services
The following tables summarize Private Client Services AUM and revenues:
Private Client Services Assets Under Management(by Investment Service)
December 31, % Change2012 2011 2010 2012-11 2011-10
(in millions)
Value Equity:U.S. $ 8,839 $ 9,912 $ 13,082 (10.8)% (24.2)%Global and International 7,487 7,971 11,714 (6.1) (32.0)
16,326 17,883 24,796 (8.7) (27.9)Growth Equity:
U.S. 7,751 7,735 9,626 0.2 (19.6)Global and International 5,967 5,859 7,492 1.8 (21.8)
13,718 13,594 17,118 0.9 (20.6)Fixed Income:
U.S. 29,797 32,147 32,485 (7.3) (1.0)Global and International 2,055 2,360 1,658 (12.9) 42.3
31,852 34,507 34,143 (7.7) 1.1Other(1):
U.S. 818 319 236 156.4 35.2Global and International 3,092 3,115 1,753 (0.7) 77.7
3,910 3,434 1,989 13.9 72.6Total:
U.S. 47,205 50,113 55,429 (5.8) (9.6)Global and International 18,601 19,305 22,617 (3.6) (14.6)
Total $65,806 $69,418 $78,046 (5.2) (11.1)
(1) Includes index, structured, asset allocation services and certain other alternative investments.
12 AllianceBernstein

Revenues From Private Client Services(by Investment Service)
Years Ended December 31, % Change2012 2011 2010 2012-11 2011-10
(in thousands)
Investment Advisory and Services Fees:
Value Equity:
U.S. $ 112,695 $ 134,149 $ 143,591 (16.0)% (6.6)%
Global and International 83,671 104,260 116,254 (19.7) (10.3)
196,366 238,409 259,845 (17.6) (8.2)
Growth Equity:
U.S. 97,981 108,269 114,081 (9.5) (5.1)
Global and International 68,826 78,927 79,651 (12.8) (0.9)
166,807 187,196 193,732 (10.9) (3.4)
Fixed Income:
U.S. 168,966 182,928 177,310 (7.6) 3.2
Global and International 14,193 12,166 7,141 16.7 70.4
183,159 195,094 184,451 (6.1) 5.8
Other(1):
U.S. 5,246 2,160 292 142.9 639.7
Global and International 30,129 24,870 9,368 21.1 165.5
35,375 27,030 9,660 30.9 179.8
Total Investment Advisory and Services Fees:
U.S. 384,888 427,506 435,274 (10.0) (1.8)
Global and International 196,819 220,223 212,414 (10.6) 3.7
581,707 647,729 647,688 (10.2) —
Distribution Revenues(2) 2,447 3,165 2,393 (22.7) 32.3
Shareholder Servicing Fees(2) 1,637 1,203 1,137 36.1 5.8
Total $585,791 $652,097 $651,218 (10.2) 0.1
(1) Includes index, structured, asset allocation services and certain other alternative investments.
(2) For a description of distribution revenues and shareholder servicing fees, see “Retail Services” above.
Private client accounts generally are managed pursuant to a written investment advisory agreement among the client,AllianceBernstein and SCB LLC, which usually is terminable at any time or upon relatively short notice by any party. In general,these contracts may not be assigned without the consent of the client. We are compensated under these contracts by fees calculatedas a percentage of AUM at a specific date or as a percentage of the value of average AUM for the applicable billing period, withthese fees varying based on the types of investment services and the size of the account. The aggregate fees we charge for managinghedge funds may be higher than the fees we charge for managing other assets in private client accounts because hedge fund feesinclude performance-based fees, incentive allocations or carried interests in addition to base advisory fees. We are eligible to earnperformance-based fees on approximately 3% of private client AUM, substantially all of which is held in hedge funds.
Revenues from Private Client Services represented approximately 21%, 24% and 22% of our company-wide net revenues for theyears ended December 31, 2012, 2011 and 2010, respectively.
Annual Report 2012 13

Bernstein Research Services
The following table summarizes Bernstein Research Services revenues:
Revenues From Bernstein Research ServicesYears Ended December 31, % Change
2012 2011 2010 2012-11 2011-10
(in thousands)
Bernstein Research Services $413,707 $437,414 $430,521 (5.4)% 1.6%
We earn revenues for providing investment research to, and executing brokerage transactions for, institutional clients. These clientscompensate us principally by directing SCB to execute brokerage transactions on their behalf, for which we earn commissions.These services accounted for approximately 15%, 16% and 15% of our company-wide net revenues for the years endedDecember 31, 2012, 2011 and 2010, respectively.
Fee rates charged for brokerage transactions have declined significantly in recent years, but increases in transaction volume in boththe U.S. and Europe have often offset these decreases. For additional information, see “Risk Factors” in Item 1A and “Management’sDiscussion and Analysis of Financial Condition and Results of Operations” in Item 7.
Custody and Brokerage
Custody
SCB LLC acts as custodian for the majority of AllianceBernstein’s private client AUM and some of AllianceBernstein’s institutionalAUM. Other custodial arrangements are maintained by client-designated banks, trust companies, brokerage firms or custodians.
Brokerage
AllianceBernstein generally has the discretion to select the broker-dealers that execute securities transactions for client accounts.When selecting brokers, we are required to obtain “best execution”. Although there is no single statutory definition, SEC releasesand other legal guidelines make clear that the duty to obtain best execution requires us to seek “the most advantageous termsreasonably available under the circumstances for a customer’s account”. The lowest possible commission, while very important, isnot the only consideration. Generally, to achieve best execution, we consider factors such as order size and market depth, avail-ability of competing markets and liquidity, trading characteristics of the security, financial responsibility of the broker-dealer, thebroker’s ability to address current market conditions, and the ability and willingness of the broker to commit capital by taking posi-tions in order to execute transactions.
While we select brokers primarily on the basis of their execution capabilities, we may also take into consideration the quality andamount of research services a broker provides to us for the benefit of our clients. These research services, which are paid for withclient commissions and which we purchase to augment our own research capabilities, are governed by Section 28(e) of theExchange Act. We use broker-dealers that provide these services in consideration for commissions paid for the execution of clienttrades, subject at all times to our duty to seek best execution, and with respect to which we reasonably conclude, in good faith, thatthe value of the execution and other services we receive from the broker-dealer is reasonable in relation to the amount of commis-sions paid. The commissions charged by these full-service brokers are generally higher than those charged by electronic tradingnetworks and other “low-touch” trading venues.
We regularly execute transactions for our private clients through SCB, our affiliated broker-dealers, because these clients have gen-erally subscribed to an all-inclusive package of services that includes brokerage, custody and investment advice. We sometimes
14 AllianceBernstein

execute institutional client transactions through SCB LLC or SCBL. We do so only when our clients have consented to our use ofaffiliated broker-dealers or we are otherwise permitted to do so, and only when we can execute these transactions in accordancewith applicable law (i.e., our obligation to obtain “best execution”).
We may use third-party broker-dealers to execute client transactions that also sell shares of AllianceBernstein Funds or third partyfunds we sub-advise; however, we prohibit our investment professionals who place trades from considering these other relationshipsor the sale of fund shares as a factor when selecting broker-dealers.
Our Brokerage Allocation Committee has principal oversight responsibility for evaluating equity-related brokerage matters, includ-ing how to use research services we receive in a manner that is in the best interests of our clients and consistent with current regu-latory requirements.
Service Marks
We have registered a number of service marks with the U.S. Patent and Trademark Office and various foreign trademark offices,including the combination of an “AB” design logo with the mark “AllianceBernstein”.
In connection with the Bernstein Transaction, we acquired all of the rights and title in, and to, the Bernstein service marks, includ-ing the mark “Bernstein”.
Regulation
Virtually all aspects of our business are subject to various federal and state laws and regulations, rules of various securities regulatorsand exchanges, and laws in the foreign countries in which our subsidiaries conduct business. These laws and regulations are primar-ily intended to protect clients and fund shareholders and generally grant supervisory agencies broad administrative powers, includingthe power to limit or restrict the carrying on of business for failure to comply with such laws and regulations. Possible sanctions thatmay be imposed include the suspension of individual employees, limitations on engaging in business for specific periods, the revoca-tion of the registration as an investment adviser or broker-dealer, censures and fines.
AllianceBernstein, Holding, the General Partner, SCB LLC, AllianceBernstein Global Derivatives Corporation (an indirect wholly-owned subsidiary of AllianceBernstein, “Global Derivatives”) and Alliance Corporate Finance Group Incorporated (an indirectwholly-owned subsidiary of AllianceBernstein) are registered with the SEC as investment advisers under the Investment AdvisersAct. SCB LLC and Global Derivatives are also registered with the Commodity Futures Trading Commission (“CFTC”) ascommodity pool operators and commodity trading advisers. As of January 1, 2013, AllianceBernstein was also registered with theCFTC as a commodity pool operator and commodity trading adviser.
Each U.S. Fund is registered with the SEC under the Investment Company Act and the shares of most U.S. Funds are qualified forsale in all states in the United States and the District of Columbia, except for U.S. Funds offered only to residents of a particularstate. AllianceBernstein Investor Services is registered with the SEC as a transfer and servicing agent.
SCB LLC and AllianceBernstein Investments are registered with the SEC as broker-dealers, and both are members of FINRA.SCB LLC is also a member of the NYSE and other principal U.S. exchanges. SCBL is a broker regulated by the Financial ServicesAuthority of the United Kingdom (“FSA”) and is a member of the London Stock Exchange. SCB Hong Kong is regulated by theHong Kong Securities and Futures Commission (“SFC”) and is an exchange participant of The Stock Exchange of Hong KongLimited.
AllianceBernstein Trust Company, LLC (“ABTC”), a wholly-owned subsidiary of AllianceBernstein, is a non-depository trustcompany chartered under New Hampshire law as a limited liability company. ABTC is authorized to act as trustee, executor, trans-fer agent, assignee, receiver, custodian, investment adviser and in any other capacity authorized for a trust company under NewHampshire law. As a state-chartered trust company exercising fiduciary powers, ABTC must comply with New Hampshire lawsapplicable to trust company operations (such as New Hampshire Revised Statutes Annotated), certain federal laws (such as ERISA
Annual Report 2012 15

and sections of the Bank Secrecy Act), and New Hampshire banking laws. The primary fiduciary activities of ABTC consist of serv-ing as trustee to a series of collective investment funds, the investors of which currently are defined benefit and defined contributionretirement plans.
Holding Units are listed on the NYSE and trade publicly under the ticker symbol “AB”. As an NYSE-listed company, Holding issubject to applicable regulations promulgated by the NYSE.
Our relationships with AXA and its subsidiaries are subject to applicable provisions of the insurance laws and regulations of NewYork and other states. Under such laws and regulations, the terms of certain investment advisory and other agreements we enterinto with AXA or its subsidiaries are required to be fair and equitable, charges or fees for services performed must be reasonable,and, in some cases, are subject to regulatory approval.
Some of our subsidiaries are subject to the oversight of regulatory authorities in Europe, including the FSA in the U.K., in Asia,including the Financial Services Agency in Japan, the SFC in Hong Kong and the Monetary Authority of Singapore, and inCanada, including the Ontario Securities Commission and other Canadian provincial regulators. While the requirements of theseforeign regulators are often comparable to the requirements of the SEC and other U.S. regulators, they are sometimes morerestrictive and may cause us to incur substantial expenditures of time and money in our efforts to comply. As of December 31,2012, each of our subsidiaries subject to a minimum net capital requirement satisfied the applicable requirement.
Iran Threat Reduction and Syria Human Rights Act
AllianceBernstein, Holding and their global subsidiaries had no transactions or activities requiring disclosure under the Iran ThreatReduction and Syria Human Rights Act (“Iran Act”), nor were they involved in the AXA Group insurance policies describedimmediately below.
The non-U.S. based subsidiaries of AXA, our parent company, operate in compliance with applicable laws and regulations of thevarious jurisdictions where they operate, including applicable international (United Nations and European Union) laws andregulations. While AXA Group companies based and operating outside the United States generally are not subject to U.S. law, as aninternational group, AXA has in place policies and standards (including the AXA Group International Sanctions Policy) that applyto all AXA Group companies worldwide and often impose requirements that go well beyond local law. For additional informationregarding AXA, see “History and Structure” in this Item 1.
AXA has reported to us that 16 insurance policies underwritten by two of AXA’s European insurance subsidiaries, AXA FranceIARD and AXA Winterthur, that were in-force during 2012 potentially come within the scope of the disclosure requirements ofthe Iran Act. Of these insurance policies, 15 policies were written by AXA France IARD and relate to property and casualtyinsurance (homeowners, auto, accident, liability and/or fraud policies) covering property located in France where the insured is acompany or other entity that may have, direct or indirect, ties to the Government of Iran (the “French Policies”), including Ira-nian entities designated under Executive Orders 13224 and 13382. AXA France IARD is a French company, based in Paris, whichis licensed to operate in France. The other policy, described below, was written by AXA Winterthur and provides global coverage to aSwiss-based non-governmental organization based in Geneva that was initially established by the United Nations to facilitateinternational transport (the “Swiss Policy”). AXA Winterthur is a Swiss company, based in Winterthur, Switzerland, which islicensed to operate in Switzerland.
With respect to these policies, as of the date of this report: (1) AXA France IARD has taken actions necessary to terminate coverageunder all 15 of the French Policies; and (2) AXA Winterthur has restructured coverage under the Swiss Policy to specificallyexclude Iran. The aggregate premium for these 16 policies was less than $1 million (approximately $105,000 for the 15 FrenchPolicies and approximately $884,000 for the relevant premium amount under the Swiss Policy), representing less than 0.001% ofAXA’s consolidated revenues, which are in excess of $100 billion. The net profit attributable to these 16 insurance policies is diffi-cult to calculate with precision, but AXA estimates its net profit attributable to all 16 of these policies, in the aggregate, was less than$300,000, representing less than 0.006% of AXA’s aggregate net profit.
16 AllianceBernstein

The Swiss Policy relates to insurance provided to the International Road Transport Union (“IRU”), a nongovernmental orga-nization based in Geneva which, among other things, acts as the implementing partner of the Transports Internationaux RoutiersCustoms Transit System (“TIR System”) under mandate of the United Nations. The TIR System is an international harmonizedsystem of customs control that facilitates trade and transport by TIR Carnets, which are customs transit documents used to provethe existence of the international guarantee for duties and taxes for the goods transported under the TIR System, with the IRUguaranteeing payment to the contracting countries. The TIR Convention includes more than 70 contracting countries, includingthe United States, each member of the European Union and many other countries, including Iran.
During 2012, AXA Winterthur provided global cover to the IRU insuring it against financial losses that the IRU may incur if acarrier fails to pay the duty charges under the terms of a TIR Carnet. Under this policy, AXA Winterthur guaranteed duty pay-ments on behalf of the IRU to the TIR national transport associations in each of the more than 70 participating countries, whichincludes Iran’s TIR System national transport association (the Iran Chamber of Commerce Industry Mines and Agriculture).
As noted above, AXA Winterthur has restructured coverage under the Swiss Policy to specifically exclude Iran and notified the IRU accordingly.
TaxesHolding, having elected under Section 7704(g) of the Internal Revenue Code of 1986, as amended (“Code”), to be subject to a3.5% federal tax on partnership gross income from the active conduct of a trade or business, is a “grandfathered” publicly-tradedpartnership for federal income tax purposes. Holding is also subject to the 4.0% New York City unincorporated business tax(“UBT”), net of credits for UBT paid by AllianceBernstein. In order to preserve Holding’s status as a “grandfathered” publicly-traded partnership for federal income tax purposes, management ensures that Holding does not directly or indirectly (throughAllianceBernstein) enter into a substantial new line of business. A “new line of business” includes any business that is not closelyrelated to AllianceBernstein’s historical business of providing research and diversified investment management and related services toits clients. A new line of business is “substantial” when a partnership derives more than 15% of its gross income from, or uses morethan 15% of its total assets to support, the new line of business.
AllianceBernstein is a private partnership for federal income tax purposes and, accordingly, is not subject to federal and state corpo-rate income taxes. However, AllianceBernstein is subject to the 4.0% UBT. Domestic corporate subsidiaries of AllianceBernstein,which are subject to federal, state and local income taxes, generally are included in the filing of a consolidated federal income taxreturn with separate state and local income tax returns also being filed. Foreign corporate subsidiaries generally are subject to taxes athigher rates in the foreign jurisdictions where they are located so, as our business increasingly operates in countries other than theUnited States, our effective tax rate is expected to increase over time.
For additional information, see “Risk Factors” in Item 1A.
History and StructureWe have been in the investment research and management business for more than 40 years. Alliance Capital was founded in 1971when the investment management department of Donaldson, Lufkin & Jenrette, Inc. (since November 2000, a part of Credit SuisseGroup) merged with the investment advisory business of Moody’s Investor Services, Inc. Bernstein was founded in 1967.
In April 1988, Holding “went public” as a master limited partnership. Holding Units, which trade under the ticker symbol “AB”,have been listed on the NYSE since that time.
In October 1999, Holding reorganized by transferring its business and assets to AllianceBernstein, a newly-formed operating partner-ship, in exchange for all of the AllianceBernstein Units (“Reorganization”). Since the date of the Reorganization, AllianceBernsteinhas conducted the business formerly conducted by Holding and Holding’s activities have consisted of owning AllianceBernstein Unitsand engaging in related activities. As stated above, Holding Units trade publicly; AllianceBernstein Units do not trade publicly and aresubject to significant restrictions on transfer. The General Partner is the general partner of both AllianceBernstein and Holding.
In October 2000, our two legacy firms, Alliance Capital and Bernstein, combined, bringing together Alliance Capital’s expertise ingrowth equity and corporate fixed income investing, and its family of retail mutual funds, with Bernstein’s expertise in value equityand tax-exempt fixed income management, and its private client and Bernstein Research Services businesses. For additional detailsabout this business combination, see Note 2 to AllianceBernstein’s consolidated financial statements in Item 8.
Annual Report 2012 17

As of December 31, 2012, the condensed ownership structure of AllianceBernstein was as follows (for a more complete descriptionof our ownership structure, see “Principal Security Holders” in Item 12):
AllianceBernstein
PublicDirectors,Officers,
Employees1AXA
GeneralPartner
UnaffiliatedHolders
98.5%
56.3% 42.2%
1.4%
0.1%
1.0%
100%
Holding
37.5% 1.5%
60.0%
(1) Direct and indirect ownership including unallocated Holding Units held in a consolidated rabbi trust primarily used to fund our long-term incentive compensationplans and for other corporate purposes.
The ownership of Holding by AllianceBernstein directors, officers and employees increased to 42.2% as of December 31, 2012 from35.1% as of December 31, 2011, with a corresponding decrease in public ownership. This shift reflects our purchase of approx-imately 12.3 million Holding Units on the open market during 2012, helping to fund anticipated obligations under our incentivecompensation award program and for other corporate purposes. Any future restricted Holding Unit issuances as long-term incentivecompensation will further increase employee ownership and decrease public ownership.
The General Partner, an indirect wholly-owned subsidiary of AXA, owns 100,000 general partnership units in Holding and a 1%general partnership interest in AllianceBernstein. Including these general partnership interests, AXA, through certain of its sub-sidiaries (see “Principal Security Holders” in Item 12), had an approximate 65.5% economic interest in AllianceBernstein as ofDecember 31, 2012.
AXA and its subsidiaries own all of the issued and outstanding shares of the common stock of AXA Financial. AXA Financialindirectly owns all of the issued and outstanding shares of AXA Equitable. See “Principal Security Holders” in Item 12.
AXA, a société anonyme organized under the laws of France, is the holding company for an international group of insurance andrelated financial services companies engaged in the financial protection and wealth management businesses. AXA’s operations arediverse geographically, with major operations in Western Europe, North America and the Asia/Pacific regions and, to a lesserextent, in other regions including the Middle East and Africa. AXA has five operating business segments: life and savings, propertyand casualty, international insurance, asset management and other financial services.
CompetitionThe financial services industry is intensely competitive and new entrants are continually attracted to it. No single or small group ofcompetitors is dominant in the industry.
We compete in all aspects of our business with numerous investment management firms, mutual fund sponsors, brokerage and investmentbanking firms, insurance companies, banks, savings and loan associations, and other financial institutions that often provide investment
18 AllianceBernstein
products that have similar features and objectives as those we offer. Our competitors offer a wide range of financial services to the same cus-tomers that we seek to serve. Some of our competitors are larger, have a broader range of product choices and investment capabilities,conduct business in more markets, and have substantially greater resources than we do. These factors may place us at a competitive dis-advantage, and we can give no assurance that our strategies and efforts to maintain and enhance our current client relationships, and createnew ones, will be successful.
AXA and its subsidiaries provide financial services, some of which compete with those we offer. The AllianceBernstein PartnershipAgreement specifically allows AXA Financial and its subsidiaries (other than the General Partner) to compete with AllianceBernsteinand to exploit opportunities that may be available to us. AXA, AXA Financial, AXA Equitable and certain of their respective sub-sidiaries have substantially greater financial resources than we do and are not obligated to provide resources to us.
To grow our business, we must be able to compete effectively for AUM. Key competitive factors include:
• our investment performance for clients;
• our commitment to place the interests of our clients first;
• the quality of our research;
• our ability to attract, motivate and retain highly skilled, and often highly specialized, personnel;
• the array of investment products we offer;
• the fees we charge;
• Morningstar/Lipper rankings for the AllianceBernstein Funds;
• our operational effectiveness;
• our ability to further develop and market our brand; and
• our global presence.
Increased competition could reduce the demand for our products and services, which could have a material adverse effect on ourfinancial condition, results of operations and business prospects.
Competition is an important risk that our business faces and should be considered along with the other risk factors we discuss inItem 1A below.
Other Information
AllianceBernstein and Holding file or furnish annual reports on Form 10-K, quarterly reports on Form 10-Q, current reports onForm 8-K and other reports required to comply with federal securities laws. The public may read and copy any materials filed withthe SEC in the SEC’s conventional reading rooms, which are located within the SEC’s Headquarters Office at 100 F Street, NE,Washington, DC 20549. The public may obtain information on the operation of these rooms by calling the SEC at (202) 942-8088.The SEC also maintains an Internet site (http://www.sec.gov) that contains reports, proxy and information statements, and otherinformation regarding issuers that file electronically with the SEC.
AllianceBernstein and Holding maintain an Internet site (http://www.alliancebernstein.com). The portion of the site at “Investor &Media Relations” and “Reports & SEC Filings” contains links to both companies’ annual reports on Form 10-K, quarterly reportson Form 10-Q, current reports on Form 8-K, Section 16 beneficial ownership reports on Forms 3, 4 and 5, registration statementson Form S-8, proxy statements and amendments to such filings. These reports are available through the site free of charge as soon asreasonably practicable after such material is filed with, or furnished to, the SEC.
Annual Report 2012 19

Item 1A. Risk Factors
Please read this section along with the description of our business in Item 1, the competition section just above and AllianceBernstein’sfinancial information contained in Items 6, 7 and 8. The majority of the risk factors discussed below directly affect AllianceBernstein.These risk factors also affect Holding because Holding’s principal source of income and cash flow is attributable to its investment inAllianceBernstein. See also “Cautions Regarding Forward-Looking Statements” in Item 7.
Business-related Risks
Our ability to retain clients and increase our AUM depends, in part, on our absolute and relative investment performance.Some of our core equity services continued to underperform during 2012. Poor investment performance may lead to anadditional loss of clients and a decline in AUM and revenues, and could lead to further downgrades in our credit ratingsand a reduced ability to access credit on reasonable terms.
Our ability to achieve investment returns for clients that meet or exceed investment returns for comparable asset classes and compet-ing investment services is a key consideration when clients decide to keep their assets with us or invest additional assets, and when aprospective client is deciding whether to invest with us. Poor investment performance in some of our services, both in absoluteterms and/or relative to peers and stated benchmarks, has resulted, and may continue to result, in clients withdrawing assets and inprospective clients choosing to invest with competitors. The resulting lower AUM levels have led, and may continue to lead, tolower investment management fees, including minimal or no performance-based fees; lower investment management fees haveresulted, and may continue to result, in revenue declines.
Since the financial crisis of 2008, we have underperformed benchmarks in many of our services, particularly some of our core equi-ties services. Throughout 2012, and particularly during the second quarter, numerous sources of uncertainty negatively affected theglobal economy, which hindered investor confidence and hampered the ability of most asset managers, including our firm, to pro-duce returns that met client expectations. Our underperformance in certain of our core equities services during 2012 may placecontinued pressure on our flows during 2013 in our Institutions and Private Client channels.
In addition, our continued underperformance in certain of our core equities services may affect our credit ratings. Our access tocredit on reasonable terms is partially dependent on our firm’s credit ratings. Moody’s Investors Service, Inc. (“Moody’s”) affirmedAllianceBernstein’s long-term senior debt rating during 2012 while Standard & Poor’s Ratings Service (“S&P”) downgraded thecompany’s long-term rating from AA- to A+ in June 2012. Each rating agency maintains a “negative” outlook primarily due toconcerns over continued outflows and weak investment performance in large cap equities. S&P, in its June 2012 press release, citedfactors that could result in a future downgrade of our firm’s long-term rating, including continued net outflows as a result of lagginginvestment performance in equities, particularly if the outflows lead to a less favorable asset mix and a deterioration of the firm’sAUM and profitability. Moody’s, in its latest ratings analysis, also cited factors that could result in a downgrade to our firm’s long-term rating, including material net outflows for several quarters, a decline in average AUM to below $375 billion and a leverageratio (debt/EBITDA) greater than 1.5. A downgrade to our credit ratings is likely to increase our borrowing costs and limit ouraccess to the capital markets.
Volatility in and disruption of the global capital and credit markets and adverse changes in the global economy are likelyto significantly affect our AUM; any significant reduction in our AUM can have a material adverse effect on our results ofoperations and business prospects.
The mix, market value and level of our AUM are affected by the performance of financial markets (both domestic andinternational), global economic conditions, industry trends, interest rates, inflation rates, tax regulation changes and other factors thatare difficult to predict. Investment advisory and services fees, the largest component of our revenues, are generally calculated as apercentage of the value of AUM and vary with the type of account managed. Accordingly, fee income generally increases ordecreases as AUM increase or decrease and is affected by market appreciation or depreciation, inflow of new client assets (includingpurchases of mutual fund shares) and outflow of client assets (including redemption of mutual fund shares). In addition, changingmarket conditions and investment trends, particularly with respect to retirement savings, may reduce interest in certain of ourinvestment products and may result in a reduction in AUM.
20 AllianceBernstein

Throughout 2012, and particularly during the second quarter, the capital and credit markets continued to experience volatility anddisruption worldwide as concerns over European sovereign debt and the effect of the U.S. fiscal cliff (which, during the first quarterof 2013, has shifted to concerns regarding the debt ceiling debate), and signs of slowing growth in emerging markets, particularlyChina, created market volatility that negatively affected investment performance. These conditions, combined with net outflows inour Institutions and Private Client channels, resulted in significant decreases in our investment advisory and services fees. Futuredisruption of the capital and credit markets could result in further net outflows, which could severely impact our results of oper-ations and financial condition. If we are unable to obtain funds and/or financing, we may be forced to incur unanticipated costs orrevise our strategic plans, which could have a material adverse effect on our financial condition, results of operations and businessprospects.
The amount and mix of our AUM are subject to significant fluctuations, which may adversely affect our fee levels andresults of operations; our fee levels also could be negatively affected by regulatory initiatives, court decisions and com-petitive considerations, which may adversely affect our results of operations.
Fluctuations in the amount and mix of our AUM may be attributable in part to conditions outside of our control that have had, andin the future may have, a negative effect on our revenues and income. We derive substantially all of our revenues and income fromproviding investment research and management and related services, so a decrease in the level of our AUM, whether resulting frompoor investment performance, client outflows or other factors, adversely affects our revenues and income.
During the past several years, there has been a shift from active equity services towards fixed income services and passive services,which has resulted, and may continue to result, in a corresponding decline in our revenues and income because we generally earnhigher fees from assets invested in our active equity services than in our fixed income services or passive services. A shift from globaland international services to U.S. services is likely to have a similar effect. For example, the global economic turmoil experiencedduring the second quarter of 2012 caused some investors to further shift their investment preferences from active equities to fixedincome, passive and money market products (some of which we do not offer). This trend may continue or accelerate in the future.
Conversely, increases in interest rates, particularly if rapid, or high interest rates, as well as uncertainty pertaining to the future direc-tion of interest rates, would be likely to decrease the total return of many bond investments due to lower market valuations of exist-ing bonds. These factors, combined with a potential shift in investor sentiment away from fixed income investments, could have asignificant adverse effect on our revenues and results of operations because, in recent years, our AUM in fixed income investmentshave become a larger component of our overall AUM.
In addition, we may be required to reduce our fee levels, restructure the fees we charge or adjust the services we offer to our clientsbecause of, among other things, regulatory initiatives (whether industry-wide or specifically targeted), court decisions and com-petitive considerations. A reduction in fees would reduce our revenues. A reduction in revenues, without a commensurate reduc-tion in expenses, will adversely affect our results of operations.
Our results of operations and reputation could continue to suffer if we are unable to deliver consistent, competitive invest-ment performance.
Our business is based on the trust and confidence of our clients, and we are dedicated to earning and maintaining this trust and con-fidence. Damage to our reputation can substantially reduce our AUM and impair our ability to maintain or grow our business.
Our continued underperformance over the last few years in certain of our core equities services damaged our reputation amongmany clients, prospects and consultants. We are focused on delivering consistent, competitive investment performance in 2013 and,in so doing, continuing to rebuild our reputation. Failure in this endeavor, however, could have a material adverse effect on ourreputation, results of operations and business prospects.
Maintaining adequate liquidity for our general business needs depends on certain factors, including operating cash flowsand our access to credit on reasonable terms.
Our financial condition is dependent on our cash flow from operations, which is subject to the performance of the capital markets, ourability to maintain and grow AUM and other factors beyond our control. Our ability to issue public or private debt on reasonable terms
Annual Report 2012 21

may be limited by adverse market conditions, our profitability, our creditworthiness as perceived by lenders and changes in governmentregulations, including tax rates and interest rates. Furthermore, our access to credit on reasonable terms is partially dependent on our firm’scredit ratings. A downgrade to our credit ratings is likely to increase our borrowing costs and limit our access to the capital markets. If weare unable to obtain funds and/or financing, we may be forced to incur unanticipated costs or revise our strategic plans, which could havea material adverse effect on our financial condition, results of operations and business prospects.
An impairment of goodwill may occur.
As a result of increased economic uncertainty and current market dynamics, determining whether an impairment of the goodwillasset exists requires management to exercise significant judgment. In addition, to the extent that securities valuations are depressedfor prolonged periods of time and market conditions worsen, or if we experience significant net redemptions, our AUM, revenues,profitability and unit price may be adversely affected. Although the price of a Holding Unit is just one factor in the calculation offair value, if current Holding Unit price levels decline significantly, reaching the conclusion that fair value exceeds carrying valuewill, over time, become more difficult. In addition, control premiums, industry earnings multiples and discount rates are impactedby economic conditions. As a result, subsequent impairment tests may occur more frequently and be based on more negativeassumptions and future cash flow projections, and may result in an impairment of goodwill. An impairment may result in a materialcharge to our earnings. For additional information about our impairment testing, see Item 7.
Our business is dependent on investment advisory, selling and distribution agreements that are subject to termination ornon-renewal on short notice.
We derive most of our revenues pursuant to written investment management agreements (or other arrangements) with institutionalinvestors, mutual funds and private clients, and selling and distribution agreements between AllianceBernstein Investments andfinancial intermediaries that distribute AllianceBernstein Funds. Generally, the investment management agreements (and otherarrangements) are terminable at any time or upon relatively short notice by either party. The selling and distribution agreements areterminable by either party upon notice (generally 30 days) and do not obligate the financial intermediary to sell any specific amountof fund shares. In addition, investors in AllianceBernstein Funds can redeem their investments without notice. Any termination of,or failure to renew, a significant number of these agreements, or a significant increase in redemption rates, could have a materialadverse effect on our results of operations and business prospects.
Furthermore, the investment management agreements pursuant to which we manage the U.S. Funds must be renewed andapproved by the Funds’ boards of directors annually. A significant majority of the directors are independent. Consequently, therecan be no assurance that the board of directors of each fund will approve the fund’s investment management agreement each year,or will not condition its approval on revised terms that may be adverse to us.
Our ability to establish new client relationships and maintain existing ones is partly dependent on our relationships withvarious financial intermediaries and consultants that are not obligated to continue to work with us.
Our ability to market our Retail Products and Services, sub-advisory services and certain other investment services is partly depend-ent on our access to securities firms, brokers, banks and other intermediaries. These intermediaries generally offer their clientsinvestment products that compete with our products. In addition, certain institutional investors rely on consultants to advise themon choosing an investment adviser, and currently, some of our core equities services are not considered among the best choices byconsultants. For example, in previous years a number of investment consultants advised their clients to move their assets investedwith us to other investment advisers, which contributed to significant net outflows. This trend may continue. Also, our PrivateClient Services group relies on referrals from financial planners, registered investment advisers and other professionals. We cannot becertain that we will continue to have access to, or receive referrals from, these third parties. Loss of such access or referrals couldhave a material adverse effect on our results of operations and business prospects.
We may be unable to continue to attract, motivate and retain key personnel, and the cost to retain key personnel couldput pressure on our operating margin.
Our business depends on our ability to attract, motivate and retain highly skilled, and often highly specialized, technical, managerialand executive personnel; there is no assurance that we will be able to do so.
22 AllianceBernstein

The market for qualified research analysts, portfolio managers, financial advisors, traders and other professionals is extremely com-petitive and is characterized by frequent movement of these investment professionals among different firms. In 2012, some of oursenior professionals left the firm; additional departures may occur. Portfolio managers and financial advisors often maintain strong,personal relationships with their clients so their departure has caused, and may continue to cause, us to lose client accounts, whichcould have a material adverse effect on our results of operations and business prospects.
If our revenues continue to decline during 2013, it will place significant added pressure on our ability to pay our employees atcompetitive levels. As a result, we will continue to be vigilant about scaling our cost structure (including headcount) to our revenuebase. For additional information regarding our compensation practices, see “Compensation Discussion and Analysis” in Item 11.
Our operating margin may decline if we increase compensation to retain key personnel without a commensurate increase inrevenues.
Performance-based fee arrangements with our clients cause greater fluctuations in our revenues.
We sometimes charge our clients performance-based fees for certain services. For these services, we charge a base advisory fee andare eligible to earn an additional performance-based fee or incentive allocation that is calculated as either a percentage of absoluteinvestment results or a percentage of investment results in excess of a stated benchmark over a specified period of time. Someperformance-based fees include a high-watermark provision, which generally provides that if a client account underperforms rela-tive to its performance target (whether absolute or relative to a specified benchmark), it must gain back such underperformancebefore we can collect future performance-based fees. Therefore, if we fail to achieve the performance target for a particular period,we will not earn a performance-based fee for that period and, for accounts with a high-watermark provision, our ability to earnfuture performance-based fees will be impaired.
We are eligible to earn performance-based fees on approximately 8% of the assets we manage for institutional clients and approx-imately 3% of the assets we manage for private clients (in total, approximately 4% of our company-wide AUM). If the percentage ofour AUM subject to performance-based fees grows, seasonality and volatility of revenue and earnings are likely to become moresignificant. Our performance-based fees in 2012, 2011 and 2010 were $66.6 million (including $39.6 million pertaining to windingup the PPIP fund, see “Management’s Discussion and Analysis of Financial Condition and Results of Operations” in Item 7), $16.5 millionand $20.5 million, respectively.
We may engage in strategic transactions that could pose risks.
As part of our business strategy, we consider potential strategic transactions, including acquisitions, dispositions, consolidations, jointventures and similar transactions, some of which may be material. These transactions, if undertaken, may involve a number of risksand present financial, managerial and operational challenges, including:
• adverse effects on our earnings if acquired intangible assets or goodwill become impaired;
• existence of unknown liabilities or contingencies that arise after closing; and
• potential disputes with counterparties.
Acquisitions also pose the risk that any business we acquire may lose customers or employees or could underperform relative toexpectations. Additionally, the acquisition of investment personnel poses the risk that we may lose the AUM we expected to man-age, which could adversely affect our results of operations. Furthermore, strategic transactions may require us to increase our lever-age or, if we issue AllianceBernstein Units or Holding Units to fund an acquisition, would dilute the holdings of our existingUnitholders.
Because many of our subsidiary operations are located outside of the United States and have functional currencies otherthan the U.S. dollar, changes in exchange rates to the U.S. dollar affect our reported financial results from one period tothe next.
Although significant portions of our net revenues and expenses, as well as our AUM, are presently derived from the United States,we have subsidiaries outside of the United States with functional currencies other than the U.S. dollar. As a result, fluctuations in
Annual Report 2012 23
exchange rates to the U.S. dollar affect our reported financial results from one period to the next. We may not be successful in ourefforts to hedge our exposure to such fluctuations, which could have a negative effect on our reported financial results.
Despite our efforts to manage exposures from principal positions taken by our sell-side business, these positions are subjectto market risk.
Bernstein Research Services may use the firm’s capital to facilitate customer transactions, primarily relating to trading activities inlisted options. The resulting principal positions are exposed to market risk. We seek to manage this risk both by engaging in trans-actions designed to hedge the market risk and by maintaining a risk platform that includes the measurement and monitoring offinancial exposures and operational processes. Our ability to manage this risk may be limited, however, by adverse changes in theliquidity of the security or the hedging instrument and in the correlation of price movements between the security and the hedginginstrument. Similarly, the risk monitoring and risk mitigation techniques we employ and the related judgments we make cannotanticipate every possible economic and financial circumstance and outcome. Consequently, we may incur losses, which wouldrequire us to increase our regulatory capital and could adversely affect our results of operations.
Our seed capital investments are subject to market risk. While we enter into various futures, forward and swap contractsto economically hedge certain of these investments, we also may be exposed to market risk and credit-related losses in theevent of non-performance by counterparties to these derivative instruments.
We have a seed investment program for the purpose of sponsoring new products. As our new product launches have increased inrecent years, so too has our use of seed capital for investment purposes. These seed capital investments are subject to market risk.Our risk management team oversees a seed hedging program that attempts to minimize this risk, subject to practical and costconsiderations. Also, not all seed investments are deemed appropriate to hedge, and in those cases we are exposed to market risk. Asa result, volatility in the capital markets may cause significant changes in our period-to-period financial and operating results.
We use various derivative instruments, including futures, forward and swap contracts, in conjunction with our seed hedging pro-gram. While in most cases broad market risks are hedged, our hedges are imperfect and some market risk remains. In addition, ouruse of derivatives results in counterparty risk (i.e., the risk that we may be exposed to credit-related losses in the event of non-performance by counterparties to these derivative instruments), regulatory risk (e.g., short selling restrictions) and cash/syntheticbasis risk (i.e., the risk that the underlying positions do not move identically to the related derivative instruments).
The individuals, counterparties or issuers on which we rely in the course of performing services for us or our clients maybe unable or unwilling to honor their contractual obligations to us.
We rely on various third party counterparties and other vendors to fulfill their obligations to us, whether specified by contract,course of dealing or otherwise. Default rates, downgrades and disputes with counterparties as to the valuation of collateral increasesignificantly in times of market stress. Furthermore, disruptions in the financial markets and other economic challenges, like thosepresented by the global financial turmoil during the second quarter of 2012, may cause our counterparties and other vendors toexperience significant cash flow problems or even render them insolvent, which may expose us to significant costs.
We may not accurately value the securities we hold on behalf of our clients or our company investments.
In accordance with applicable regulatory requirements, contractual obligations or client direction, we employ procedures for thepricing and valuation of securities and other positions held in client accounts or for company investments. We have established aValuation Committee, composed of senior officers and employees, which oversees pricing controls and valuation processes. If mar-ket quotations for a security are not readily available, the Valuation Committee determines a fair value for the security.
Extraordinary volatility in financial markets, significant liquidity constraints or our failure to adequately consider one or more factorswhen fair valuing a security based on information with limited market observability could result in our failing to properly valuesecurities we hold for our clients or investments accounted for on our balance sheet. Improper valuation would likely result in ourbasing fee calculations on inaccurate AUM figures, our striking incorrect net asset values for company-sponsored mutual funds orhedge funds or, in the case of company investments, our inaccurately calculating and reporting our financial condition and operatingresults. Although the overall percentage of our AUM that we fair value based on information with limited market observability isnot significant, inaccurate fair value determinations can harm our clients, create regulatory issues and damage our reputation.
24 AllianceBernstein
We may not have sufficient information to confirm or review the accuracy of valuations provided to us by underlyingexternal managers for the funds in which certain of our alternative investment products invest.
Certain of our alternative investment services invest in funds managed by external managers (“External Managers”) rather than investingdirectly in securities and other instruments. As a result, our abilities will be limited with regard to (i) monitoring such investments,(ii) regularly obtaining complete, accurate and current information with respect to such investments and (iii) exercising control over suchinvestments. Accordingly, we may not have sufficient information to confirm or review the accuracy of valuations provided to us byExternal Managers. In addition, we will be required to rely on External Managers’ compliance with any applicable investment guidelinesand restrictions. Any failure of an External Manager to operate within such guidelines or to provide accurate information with respect tothe investment could subject our alternative investment products to losses and cause damage to our reputation.
The quantitative models we use in certain of our investment services may contain errors, resulting in imprecise risk assess-ments and unintended output.
We use quantitative models in a variety of our investment services, generally in combination with fundamental research. Our quanti-tative models are validated by senior quantitative professionals. In 2010, we formed our Model Risk Working Group, the purposeof which is to formalize and oversee a quantitative model governance framework, including minimum validation standards. How-ever, due to the complexity of such models, it is possible that errors in the models could exist and our controls could fail to detectsuch errors. Failure to detect errors could result in client losses and damage to our reputation.
Unpredictable events, including natural disaster, dangerous weather conditions, technology failure, terrorist attack andpolitical unrest, may adversely affect our ability to conduct business.
War, terrorist attack, political unrest in the Middle East, the Pacific Rim and elsewhere, power failure, climate change, natural dis-aster and rapid spread of infectious diseases could interrupt our operations by:
• causing disruptions in global economic conditions, thereby decreasing investor confidence and making investment productsgenerally less attractive;
• inflicting loss of life;
• triggering massive technology failures or delays; and
• requiring substantial capital expenditures and operating expenses to remediate damage and restore operations.
Despite the contingency plans and facilities we have in place, including system security measures, information back-up and disasterrecovery processes, our ability to conduct business may be adversely affected by a disruption in the infrastructure that supports ouroperations and the communities in which they are located. This may include a disruption involving electrical, communications,transportation or other services we may use or third parties with which we conduct business. If a disruption occurs in one locationand our employees in that location are unable to occupy our offices or communicate with or travel to other locations, our ability toconduct business with and on behalf of our clients may suffer, and we may not be able to successfully implement contingency plansthat depend on communication or travel. Furthermore, unauthorized access to our systems as a result of a security breach, the failureof our systems, or the loss of data could give rise to legal proceedings or regulatory penalties under laws protecting the privacy ofpersonal information, disrupt operations, and damage our reputation.
Our operations require experienced, professional staff. Loss of a substantial number of such persons or an inability to provide prop-erly equipped places for them to work may, by disrupting our operations, adversely affect our financial condition, results of oper-ations and business prospects. In addition, our property and business interruption insurance may not be adequate to compensate usfor all losses, failures, or breaches that may occur.
We are highly dependent on various software applications, technologies and other systems for our business to functionproperly and to safeguard confidential information; any significant limitation, failure or security breach of these systemscould constrain our operations.
We utilize software and related technologies throughout our business, including both proprietary systems and those provided byoutside vendors. We use our technology to, among other things, obtain securities pricing information, process client transactions,
Annual Report 2012 25

and provide reports and other customer services to the clients of the funds we manage. Although we take protective measures,including measures to effectively secure information through system security technology and established and tested business con-tinuity plans, we may experience system delays and interruptions as a result of natural disasters, power failures, acts of war and third-party failures. We cannot predict with certainty all of the adverse effects that could result from our failure, or the failure of a thirdparty, to efficiently address and resolve these delays and interruptions. These adverse effects could include the inability to performcritical business functions or failure to comply with financial reporting and other regulatory requirements, which could lead to lossof client confidence, harm to our reputation, exposure to disciplinary action and liability to our clients. Accordingly, potential sys-tem failures and the cost necessary to correct those failures could have a material adverse effect on our results of operations andbusiness prospects.
In addition, we could be subject to losses if we fail to properly safeguard sensitive and confidential information. As part of ournormal operations, we maintain and transmit confidential information about our clients as well as proprietary information relating toour business operations. Although we take protective measures, our systems still could be vulnerable to unauthorized access, com-puter viruses or other events that have a security impact, such as an authorized employee or vendor inadvertently or intentionallycausing us to release confidential or proprietary information. Such disclosure could, among other things, allow competitors access toour proprietary business information and require significant time and expense to investigate and remediate the breach. Moreover,loss of confidential client information could harm our reputation and subject us to liability under laws that protect confidential per-sonal data, resulting in increased costs or loss of revenues.
Also, although we take precautions to password protect and encrypt our laptops and other mobile electronic hardware, if suchhardware is stolen, misplaced or left unattended, it may become vulnerable to hacking or other unauthorized use, creating a possiblesecurity risk and resulting in potentially costly actions. Most of the software applications that we use in our business are licensedfrom, and supported, upgraded and maintained by, third-party vendors. A suspension or termination of certain of these licenses orthe related support, upgrades and maintenance could cause temporary system delays or interruption. In addition, technology rapidlyevolves and we cannot guarantee that our competitors may not implement more advanced technology platforms for their productsand services, which may place us at a competitive disadvantage and adversely affect our results of operations and business prospects.
Our own operational failures or those of third parties we rely on, including failures arising out of human error, could dis-rupt our business, damage our reputation and reduce our revenues.
Weaknesses or failures in our internal processes or systems could lead to disruption of our operations, liability to clients, exposure todisciplinary action or harm to our reputation. Our business is highly dependent on our ability to process, on a daily basis, largenumbers of transactions, many of which are highly complex, across numerous and diverse markets. These transactions generallymust comply with investment guidelines, as well as stringent legal and regulatory standards.
Our obligations to clients require us to exercise skill, care and prudence in performing our services. Despite our employees beinghighly trained and skilled, the large number of transactions we process makes it highly likely that errors will occasionally occur.Should we make a mistake in performing our services that causes financial harm to a client, we have a duty to act promptly to putthe client in the position the client would have been in had we not made the error. The occurrence of mistakes, particularly sig-nificant ones, can have a material adverse effect on our reputation, results of operations and business prospects.
We may not always successfully manage actual and potential conflicts of interest that arise in our business.
We increasingly must manage actual and potential conflicts of interest, including situations where our services to a particular clientconflict, or are perceived to conflict, with the interests of another client, as well as situations where certain of our employees haveaccess to material non-public information that may not be shared with all employees of our firm. Failure to adequately addresspotential conflicts of interest could adversely affect our reputation, results of operations and business prospects.
We have procedures and controls that are designed to identify and mitigate conflicts of interest, including those designed to preventthe improper sharing of information. However, appropriately managing conflicts of interest is complex and difficult. Our reputationcould be damaged and the willingness of clients to enter into transactions in which such a conflict might arise may be affected if wefail, or appear to fail, to deal appropriately with conflicts of interest. In addition, potential or perceived conflicts could give rise tolitigation or regulatory enforcement actions.
26 AllianceBernstein

Rates we charge for brokerage transactions have declined significantly over the last several years, and declines may con-tinue. In addition, turmoil in global capital markets and economies may reduce market volumes. Combined, these twofactors may adversely affect Bernstein Research Services revenue.
Electronic, or “low-touch”, trading approaches represent a significant percentage of buy-side trading activity and produce trans-action fees for execution-only services that are a small fraction of traditional full service fee rates. As a result, blended pricing for theindustry and SCB has declined over the last several years. In addition, fee rates charged by SCB and other brokers for traditionalbrokerage services have also historically experienced price pressure, and we expect these trends to continue. While increases intransaction volume and market share have in the past often offset decreases in rates, this may not continue. Recent economic andmarket turmoil has severely impacted much of SCB’s client base, which in the near-term may adversely affect transaction volumegenerally.
Our insurance policies may be insufficient to protect us against large losses.
We can make no assurance that a claim or claims will be covered by our insurance policies or, if covered, will not exceed the limitsof available insurance coverage, or that our insurers will remain solvent and meet their obligations.
Our business is subject to pervasive, complex and frequently evolving global regulation, the compliance with which couldinvolve substantial expenditures of time and money, and the violation of which may result in material adverse consequences.
Virtually all aspects of our business are subject to federal and state laws and regulations, rules of securities regulators and exchanges,and laws and regulations in the foreign jurisdictions in which our subsidiaries conduct business. If we violate these laws or regu-lations, we could be subject to civil liability, criminal liability or sanction, including revocation of our and our subsidiaries’ pro-fessional licenses or registrations, revocation of the licenses of our employees, censures, fines, or temporary suspension or permanentbar from conducting business. Any such liability or sanction could have a material adverse effect on our financial condition, resultsof operations, and business prospects. A regulatory proceeding, even if it does not result in a finding of wrongdoing or sanction,could require substantial expenditures of time and money.
These laws and regulations generally grant supervisory agencies and bodies broad administrative powers, including, in some cases,the power to limit or restrict doing business for failure to comply with such laws and regulations. Moreover, regulators in non-U.S.jurisdictions could change their policies or laws in a manner that might restrict or otherwise impede our ability to market, distribute,or register investment products in their respective markets. These local requirements could increase the expenses we incur in a spe-cific jurisdiction without any corresponding increase in revenues from operating in the jurisdiction.
In addition, there is uncertainty associated with the regulatory environments in which we operate, including uncertainty created bythe enactment of the Dodd-Frank Wall Street Reform and Consumer Protection Act of 2010 (the “Dodd-Frank Act”). TheDodd-Frank Act fundamentally changed the U.S. financial regulatory landscape and may impose additional restrictions and limi-tations on our business as the various rules and regulations required for implementation continue to be adopted.
Changes to the rules governing Rule 12b-1 Fees may affect the revenues we derive from our Retail Services.
In July 2010, the SEC proposed a new rule and rule amendments that would alter Rule 12b-1 Fees. The new rule and amendmentswould continue to allow funds to bear promotional costs within certain limits and would also preserve the ability of funds to pro-vide investors with alternatives for paying sales charges (e.g., at the time of purchase, at the time of redemption or through acontinuing fee charged to fund assets). Unlike the current Rule 12b-1 framework, however, the proposed rules would limit thecumulative sales charges each investor pays, regardless of how they are imposed.
If rules are adopted as proposed, changes in Rule 12b-1 Fees for a number of share classes offered by company-sponsored mutualfunds would be required, which would reduce the net fund distribution revenues we receive from company-sponsored mutualfunds. The impact of this rule change is dependent upon the final rules adopted by the SEC, any phase-in or grandfathering period,and any other changes made with respect to share class distribution arrangements.
Annual Report 2012 27
The financial services industry is intensely competitive.
We compete on the basis of a number of factors, including our array of investment services, our investment performance for ourclients, innovation, reputation and price. By having a global presence, we may face competitors with more experience and moreestablished relationships with clients, regulators and industry participants in the relevant market, which could adversely affect ourability to expand. Furthermore, our underperformance in certain of our core equities services during 2012 may place continuedpressure on our flows during 2013, which may make it more difficult for us to compete effectively. For additional informationregarding competitive factors, see “Competition” in Item 1.
We are involved in various legal proceedings and regulatory matters and may be involved in such proceedings in thefuture, any one or combination of which could have a material adverse effect on our financial condition, results of oper-ations and business prospects.
We are involved in various matters, including regulatory inquiries, administrative proceedings and litigation, some of which allegesignificant damages, and we may be involved in additional matters in the future. Litigation is subject to significant uncertainties,particularly when plaintiffs allege substantial or indeterminate damages, the litigation is in its early stages, or when the litigation ishighly complex or broad in scope.
Structure-related Risks
The partnership structure of Holding and AllianceBernstein limits Unitholders’ abilities to influence the management andoperation of AllianceBernstein’s business and is highly likely to prevent a change in control of Holding andAllianceBernstein.
The General Partner, as general partner of both Holding and AllianceBernstein, generally has the exclusive right and full authorityand responsibility to manage, conduct, control and operate their respective businesses, except as otherwise expressly stated in theirrespective Amended and Restated Agreements of Limited Partnership. Holding and AllianceBernstein Unitholders have more lim-ited voting rights on matters affecting AllianceBernstein than do holders of common stock in a corporation. Both Amended andRestated Agreements of Limited Partnership provide that Unitholders do not have any right to vote for directors of the GeneralPartner and that Unitholders can only vote on certain extraordinary matters (including removal of the General Partner under certainextraordinary circumstances). Additionally, the AllianceBernstein Partnership Agreement includes significant restrictions on transfersof AllianceBernstein Units and provisions that have the practical effect of preventing the removal of the General Partner, which arehighly likely to prevent a change in control of AllianceBernstein’s management.
AllianceBernstein Units are illiquid.
There is no public trading market for AllianceBernstein Units and AllianceBernstein does not anticipate that a public trading marketwill ever develop. The AllianceBernstein Partnership Agreement restricts our ability to participate in a public trading market oranything substantially equivalent to one by providing that any transfer which may cause AllianceBernstein to be classified as a“publicly traded partnership” as defined in Section 7704 of the Code shall be deemed void and shall not be recognized byAllianceBernstein. In addition, AllianceBernstein Units are subject to significant restrictions on transfer; all transfers ofAllianceBernstein Units are subject to the written consent of AXA Equitable and the General Partner pursuant to theAllianceBernstein Partnership Agreement. Generally, neither AXA Equitable nor the General Partner will permit any transfer that itbelieves would create a risk that AllianceBernstein would be treated as a corporation for tax purposes. AXA Equitable and theGeneral Partner have implemented a transfer program that requires a seller to locate a purchaser, and imposes annual volumerestrictions on transfers. You may request a copy of the transfer program from our Corporate Secretary([email protected]). Also, we have filed the transfer program as Exhibit 10.07 to this Form 10-K.
28 AllianceBernstein

Changes in the partnership structure of Holding and AllianceBernstein and/or changes in the tax law governing partner-ships would have significant tax ramifications.
Holding, having elected under Section 7704(g) of the Code to be subject to a 3.5% federal tax on partnership gross income fromthe active conduct of a trade or business, is a “grandfathered” publicly-traded partnership (“PTP”) for federal income tax purposes.Holding is also subject to the 4.0% UBT, net of credits for UBT paid by AllianceBernstein. In order to preserve Holding’s status asa “grandfathered” PTP for federal income tax purposes, management ensures that Holding does not directly or indirectly (throughAllianceBernstein) enter into a substantial new line of business. A “new line of business” includes any business that is not closelyrelated to AllianceBernstein’s historical business of providing research and diversified investment management and related services toits clients. A new line of business is “substantial” when a partnership derives more than 15% of its gross income from, or uses morethan 15% of its total assets in, the new line of business.
AllianceBernstein is a private partnership for federal income tax purposes and, accordingly, is not subject to federal and state corporateincome taxes. However, AllianceBernstein is subject to the 4.0% UBT. Domestic corporate subsidiaries of AllianceBernstein, which aresubject to federal, state and local income taxes, are generally included in the filing of a consolidated federal income tax return withseparate state and local income tax returns being filed. Foreign corporate subsidiaries are generally subject to taxes in the foreign juris-diction where they are located. As our business increasingly operates in countries other than the U.S., AllianceBernstein’s effective taxrate is expected to increase over time because our international subsidiaries are subject to corporate level taxes in the jurisdictions wherethey are located.
In order to preserve AllianceBernstein’s status as a private partnership for federal income tax purposes, AllianceBernstein Units mustnot be considered publicly traded. The AllianceBernstein Partnership Agreement provides that all transfers of AllianceBernsteinUnits must be approved by AXA Equitable and the General Partner; AXA Equitable and the General Partner approve only thosetransfers permitted pursuant to one or more of the safe harbors contained in relevant treasury regulations. If such units were consid-ered readily tradable, AllianceBernstein would be subject to federal and state corporate income tax on its net income. Furthermore,as noted above, should AllianceBernstein enter into a substantial new line of business, Holding, by virtue of its ownership ofAllianceBernstein, would lose its status as a grandfathered PTP and would become subject to corporate income tax as set forthabove.
In years prior to 2010, Congress proposed tax legislation that would cause certain PTPs to be taxed as corporations, thus subjectingtheir income to a higher level of income tax. Holding is a PTP that derives its income from investment management servicesthrough its ownership interest in AllianceBernstein. The legislation, in the form proposed, would not have affected Holding’s taxstatus. Also, this proposed legislation would not have affected AllianceBernstein because it is a private partnership.
In addition, recent decisions by members of Congress and their staffs regarding the need for fundamental tax reform and possible taxlaw changes to raise additional revenue have included suggestions that all large partnerships (which would include bothAllianceBernstein and Holding) be taxed as corporations. However, we cannot predict whether, or in what form, tax legislation willbe proposed in the future, and are unable to determine what effect any new legislation might have on us. If Holding andAllianceBernstein were to lose their federal tax status as partnerships, they would be subject to corporate income tax, which wouldreduce materially their net income and quarterly distributions to unitholders.
Annual Report 2012 29

Item 1B. Unresolved Staff Comments
Neither AllianceBernstein nor Holding has unresolved comments from the staff of the SEC to report.
30 AllianceBernstein

Item 2. Properties
Our principal executive offices at 1345 Avenue of the Americas, New York, New York are occupied pursuant to a lease expiring in2019 with options to extend to 2029 (for more information regarding this lease, see Exhibit 10.10 to this Form 10-K). At this loca-tion, we currently lease 1,033,984 square feet of space, within which we currently occupy approximately 629,472 square feet ofspace and have sub-let (or are seeking to sub-let) approximately 404,512 square feet of space. We also lease approximately 312,301square feet of space at 135 West 50th Street, New York, New York under a lease expiring in 2019 with options to extend to 2029.Within our leased space at 135 West 50th Street, we currently occupy approximately 4,132 square feet of space and have sub-let (orare seeking to sub-let) approximately 308,169 square feet of space.
In addition, we lease approximately 263,083 square feet of space at One North Lexington, White Plains, New York under a leaseexpiring in 2021 with options to extend to 2031. At this location, we currently occupy approximately 136,687 square feet of spaceand have sub-let (or are seeking to sub-let) approximately 126,396 square feet of space.
AllianceBernstein Investments and AllianceBernstein Investor Services lease 92,067 square feet of space in San Antonio, Texasunder a lease expiring in 2019 with options to extend to 2029. At this location, these subsidiaries currently occupy approximately59,004 square feet of space and have sub-let (or are seeking to sub-let) approximately 33,063 square feet of space.
We also lease space in 19 other cities in the United States.
Our subsidiaries lease space in 25 cities outside the United States, the most significant of which are in London, England under leasesexpiring between 2013 and 2022, and in Tokyo, Japan under a lease expiring in 2018. In London, we currently lease 110,865square feet of space, within which we currently occupy approximately 57,567 square feet of space and have sub-let (or are seekingto sub-let) approximately 53,298 square feet of space. In Tokyo, we currently lease and occupy approximately 34,615 square feet ofspace.
Annual Report 2012 31

Item 3. Legal Proceedings
With respect to all significant litigation matters, we consider the likelihood of a negative outcome. If we determine the likelihood ofa negative outcome is probable, and the amount of the loss can be reasonably estimated, we record an estimated loss for theexpected outcome of the litigation. If the likelihood of a negative outcome is reasonably possible and we are able to determine anestimate of the possible loss or range of loss in excess of amounts already accrued, if any, we disclose that fact together with theestimate of the possible loss or range of loss. However, it is often difficult to predict the outcome or estimate a possible loss or rangeof loss because litigation is subject to inherent uncertainties, particularly when plaintiffs allege substantial or indeterminate damages,the litigation is in its early stages, or when the litigation is highly complex or broad in scope. In such cases, we disclose that we areunable to predict the outcome or estimate a possible loss or range of loss.
During the first quarter of 2012, we received a legal letter of claim (the “Letter of Claim”) sent on behalf of a former Europeanpension fund client, alleging that AllianceBernstein Limited (a wholly-owned subsidiary of AllianceBernstein organized in the U.K.)was negligent and failed to meet certain applicable standards of care with respect to the initial investment in and management of a£500 million portfolio of U.S. mortgage-backed securities. The alleged damages range between $177 million and $234 million, pluscompound interest on an alleged $125 million of realized losses in the portfolio. We believe that any losses to this client resultedfrom adverse developments in the U.S. housing and mortgage market that precipitated the financial crisis in 2008 and not anynegligence or failure on our part. We believe that we have strong defenses to these claims, which are set forth in our October 12,2012 response to the Letter of Claim, and will defend this matter vigorously. Currently, we are unable to estimate a reasonablypossible range of loss because the matter remains in its early stages.
In addition to the Letter of Claim discussed immediately above, we are involved in various other matters, including regulatoryinquiries, administrative proceedings and litigation, some of which allege significant damages.
In management’s opinion, an adequate accrual has been made as of December 31, 2012 to provide for any probable losses regardingany litigation matters for which we can reasonably estimate an amount of loss. It is reasonably possible that we could incur addi-tional losses pertaining to these matters, but currently we cannot estimate any such additional losses.
Management, after consultation with legal counsel, currently believes that the outcome of any matter that is pending or threatened,or all of them combined, will not have a material adverse effect on our results of operations, financial condition or liquidity. How-ever, as any inquiry, proceeding or litigation has the element of uncertainty, management cannot determine whether further devel-opments relating to any matter that is pending or threatened, or all of them combined, will have a material adverse effect on ourresults of operations, financial condition or liquidity in any future reporting period.
32 AllianceBernstein

Item 4. Mine Safety Disclosures
Not applicable.
Annual Report 2012 33

PART II
Item 5. Market for Registrant’s Common Equity, Related Stockholder Matters and IssuerPurchases of Equity Securities
Market for Holding Units and AllianceBernstein Units; Cash Distributions
Holding Units are listed on the NYSE and trade publicly under the ticker symbol “AB”.
There is no established public trading market for AllianceBernstein Units, which are subject to significant restrictions on transfer. Ingeneral, transfers of AllianceBernstein Units will be allowed only with the written consent of both AXA Equitable and the GeneralPartner. Generally, neither AXA Equitable nor the General Partner will permit any transfer that it believes would create a risk thatAllianceBernstein would be treated as a corporation for tax purposes. AXA Equitable and the General Partner have implemented atransfer program, a copy of which you may request from our Corporate Secretary ([email protected]). Also, wehave filed the transfer program as Exhibit 10.07 to this Form 10-K.
Each of Holding and AllianceBernstein distributes on a quarterly basis all of its Available Cash Flow, as defined in the Holding Part-nership Agreement and the AllianceBernstein Partnership Agreement, to its unitholders and the General Partner. For additionalinformation concerning distribution of Available Cash Flow by Holding, see Note 2 to Holding’s financial statements in Item 8. Foradditional information concerning distribution of Available Cash Flow by AllianceBernstein, see Note 2 to AllianceBernstein’s con-solidated financial statements in Item 8.
Holding’s principal source of income and cash flow is attributable to its limited partnership interests in AllianceBernstein.
The tables set forth below provide the distributions of Available Cash Flow made by AllianceBernstein and Holding during 2012and 2011 and the high and low sale prices of Holding Units reflected on the NYSE composite transaction tape during 2012 and2011:
Quarters Ended 2012December 31 September 30 June 30 March 31 Total
Cash distributions per AllianceBernstein Unit(1) $ 0.38 $ 0.41 $ 0.26 $ 0.31 $1.36
Cash distributions per Holding Unit(1) $ 0.40 $ 0.36 $ 0.21 $ 0.26 $1.23
Holding Unit prices:
High $18.29 $15.99 $15.84 $16.75
Low $15.11 $11.44 $11.55 $13.01
Quarters Ended 2011December 31 September 30 June 30 March 31 Total
Cash distributions per AllianceBernstein Unit(1) $ 0.17 $ 0.32 $ 0.41 $ 0.48 $1.38
Cash distributions per Holding Unit(1) $ 0.12 $ 0.26 $ 0.34 $ 0.42 $1.14
Holding Unit prices:
High $15.05 $20.38 $22.75 $24.20
Low $12.40 $13.25 $18.43 $20.48
(1) Declared and paid during the following quarter.
On December 31, 2012, the closing price of a Holding Unit on the NYSE was $17.43 per Unit and there were 1,093 HoldingUnitholders of record for approximately 70,000 beneficial owners. On December 31, 2012, there were 456 AllianceBernsteinUnitholders of record, and we do not believe there are substantial additional beneficial owners.
Recent Sales of Unregistered Securities; Use of Proceeds from Registered Securities
We did not engage in any unregistered sales of our securities during the last three years.
34 AllianceBernstein

Purchases of Equity Securities by the Issuer and Affiliated PurchasersDuring each of the third and fourth quarters of 2012, we implemented a plan to repurchase Holding Units pursuant to Rule 10b5-1under the Exchange Act. A Rule 10b5-1 plan allows a company to repurchase its shares at times when it otherwise might be pre-vented from doing so because of self-imposed trading blackout periods and because it possesses material non-public information.Each broker we selected has the authority under the terms and limitations specified in the plan to repurchase Holding Units onAllianceBernstein’s behalf in accordance with the terms of each plan. Repurchases are subject to SEC regulations as well as certainprice, market volume and timing constraints specified in each plan.
The following table provides information relating to any Holding Units bought by us or one of our affiliates in the fourth quarter ofthe fiscal year covered by this report:
Issuer Purchases of Equity Securities
(a)Total Number
of Holding UnitsPurchased
(b)Average Price
PaidPer HoldingUnit, net of
Commissions
(c)Total Number of
Holding UnitsPurchased as
Part of PubliclyAnnounced Plans
or Programs
(d)MaximumNumber
(or ApproximateDollar Value) of
Holding Units thatMay Yet Be
Purchased Underthe Plans orPrograms(1)
Period10/1/12-10/31/12(1)(2)(3) 733,568 $ 16.03 729,109 —11/1/12-11/30/12(1)(3) 1,136,277 16.93 1,136,165 —12/1/12-12/31/12(1)(3) 4,269,426 17.36 1,290,011 —Total 6,139,271 $17.12 3,155,285 —
(1) During the fourth quarter of 2012, we purchased from employees 2,983,986 Holding Units to allow them to fulfill statutory withholding tax requirements at thetime of distribution of long-term incentive compensation awards.
(2) Between October 1, 2012 and October 24, 2012 (inclusive), we purchased 608,203 Holding Units on the open market pursuant to a Rule 10b5-1 plan, whichplan was adopted on August 3, 2012 and expired on October 24, 2012, to help fund anticipated obligations under our incentive compensation award programand for other corporate purposes.
(3) Between October 26, 2012 and December 31, 2012 (inclusive), we purchased 2,547,082 Holding Units on the open market pursuant to a Rule 10b5-1 plan,which plan was adopted on October 26, 2012 and expired on February 11, 2013, to help fund anticipated obligations under our incentive compensation awardprogram and for other corporate purposes.
The following table provides information relating to any AllianceBernstein Units bought by us or one of our affiliates in the fourthquarter of the fiscal year covered by this report:
Issuer Purchases of Equity Securities
(a)Total Number ofAllianceBernsteinUnits Purchased
(b)Average Price
Paid PerAllianceBernstein
Unit, net ofCommissions
(c)Total Number ofAllianceBernstein
Units Purchased asPart of Publicly
Announced Plansor Programs
(d)Maximum Number(or ApproximateDollar Value) of
AllianceBernsteinUnits that May Yet
Be PurchasedUnder the Plans or
Programs
Period10/1/12-10/31/12 — $ — — —11/1/12-11/30/12 — — — —12/1/12-12/31/12(1) 8,200 17.79 — —Total 8,200 $17.79 — —
(1) On December 10, 2012, we purchased 8,200 AllianceBernstein Units in private transactions.
Annual Report 2012 35

Item 6. Selected Financial Data
AllianceBernstein Holding L.P.
Selected Financial DataYears Ended December 31,
2012 2011 2010 2009 2008
(in thousands, except per unit amounts)
Income Statement Data:
Equity in net income (loss) attributable to AllianceBernstein Unitholders $ 70,807 $ (65,581) $ 162,217 $ 192,513 $ 278,636
Income taxes 19,722 27,687 28,059 25,324 33,910
Net income (loss) $ 51,085 $ (93,268) $ 134,158 $ 167,189 $ 244,726
Basic net income (loss) per unit $ 0.51 $ (0.90) $ 1.33 $ 1.80 $ 2.79
Diluted net income (loss) per unit $ 0.51 $ (0.90) $ 1.32 $ 1.80 $ 2.79
Cash Distributions Per Unit(1)(2)(3) $ 1.23 $ 1.14 $ 1.31 $ 1.77 $ 2.68
Balance Sheet Data at Period End:
Total assets $1,566,493 $1,628,984 $1,788,496 $1,800,075 $1,566,810
Partners’ capital $1,560,082 $1,626,173 $1,787,110 $1,797,892 $1,561,523
(1) Holding is required to distribute all of its Available Cash Flow, as defined in the Holding Partnership Agreement, to its unitholders.
(2) The 2012 distribution excludes the impact of AllianceBernstein’s $207.0 million non-cash real estate charges recorded in the third and fourth quarters of 2012.See Note 3 to AllianceBernstein’s consolidated financial statements in Item 8 for a discussion of these charges.
(3) The 2011 distribution excludes the impact of AllianceBernstein’s $587.1 million one-time, non-cash long-term incentive compensation charge. See Note 2 toHolding’s financial statements in Item 8 for a discussion of this charge.
36 AllianceBernstein

AllianceBernstein L.P.
Selected Consolidated Financial DataYears Ended December 31,
2012 2011(1) 2010(1) 2009(1) 2008(1)
(in thousands, except per unit amounts and unless otherwise indicated)Income Statement Data:Revenues:
Investment advisory and services fees $1,772,257 $1,916,419 $2,051,692 $1,920,332 $2,839,526Bernstein research services 413,707 437,414 430,521 434,605 471,716Distribution revenues 401,706 351,621 338,597 277,328 378,425Dividend and interest income 21,286 21,499 22,902 26,730 91,752Investment gains (losses) 29,202 (82,081) (1,410) 144,447 (349,172)Other revenues 101,801 107,569 109,803 107,848 118,436Total revenues 2,739,959 2,752,441 2,952,105 2,911,290 3,550,683Less: interest expense 3,222 2,550 3,548 4,411 36,524
Net revenues 2,736,737 2,749,891 2,948,557 2,906,879 3,514,159Expenses:
Employee compensation and benefits:Employee compensation and benefits 1,168,645 1,246,898 1,320,495 1,296,386 1,452,017Long-term incentive compensation charge — 587,131 — — —
Promotion and servicing:Distribution-related payments 367,090 302,684 286,676 234,203 307,890Amortization of deferred sales commissions 40,262 37,675 47,397 54,922 79,111Other 202,191 219,197 193,822 178,070 202,749
General and administrative:General and administrative 508,364 533,578 516,185 520,372 513,098Real estate charges 223,038 7,235 101,698 8,276 —
Interest on borrowings 3,429 2,545 2,078 2,696 13,077Amortization of intangible assets 21,353 21,417 21,344 21,126 20,716
Total expenses 2,534,372 2,958,360 2,489,695 2,316,051 2,588,658Operating income (loss) 202,365 (208,469) 458,862 590,828 925,501Non-operating income — — 6,760 33,657 18,728Income (loss) before income taxes 202,365 (208,469) 465,622 624,485 944,229Income taxes 13,764 3,098 38,523 45,977 95,803Net income (loss) 188,601 (211,567) 427,099 578,508 848,426Net income (loss) of consolidated entities attributable to non-controlling interests (315) (36,799) (15,320) 22,381 9,186Net income (loss) attributable to AllianceBernstein Unitholders $ 188,916 $ (174,768) $ 442,419 $ 556,127 $ 839,240Basic net income (loss) per AllianceBernstein Unit $ 0.67 $ (0.62) $ 1.59 $ 2.07 $ 3.18Diluted net income (loss) per AllianceBernstein Unit $ 0.67 $ (0.62) $ 1.58 $ 2.07 $ 3.18Operating margin(2) 7.4% n/m 16.1% 19.6% 26.1%Cash Distributions Per AllianceBernstein Unit(3)(4)(5) $ 1.36 $ 1.38 $ 1.58 $ 2.06 $ 3.07Balance Sheet Data at Period End:Total assets $8,115,050 $7,708,389 $7,580,315 $7,214,940 $8,503,459Debt $ 323,163 $ 444,903 $ 224,991 $ 248,987 $ 284,779Total Capital $3,803,268 $4,029,487 $4,495,356 $4,701,955 $4,486,826Assets Under Management at Period End (in millions) $ 430,017 $ 405,897 $ 478,019 $ 486,683 $ 448,808
(1) Certain prior-year amounts have been reclassified to conform to our 2012 presentation. See Note 2 to AllianceBernstein’s consolidated financial statements inItem 8 for a discussion of reclassifications.
(2) Operating income excluding net income (loss) attributable to non-controlling interests as a percentage of net revenues.(3) AllianceBernstein is required to distribute all of its Available Cash Flow, as defined in the AllianceBernstein Partnership Agreement, to its unitholders and the
General Partner.(4) The 2012 distribution excludes a total of $207.0 million of non-cash real estate charges recorded in the third and fourth quarters of 2012. See Note 3 to
AllianceBernstein’s consolidated financial statements in Item 8 for a discussion of these charges.(5) The 2011 distribution excludes the $587.1 million one-time, non-cash long-term incentive compensation charge. See Note 2 to AllianceBernstein’s consolidated
financial statements in Item 8 for a discussion of this charge.
Annual Report 2012 37

Item 7. Management’s Discussion and Analysis ofFinancial Condition and Results of Operations
Percentage change figures are calculated using assets under management rounded to the nearest million and financial statement amounts rounded tothe nearest thousand.
Executive OverviewWe made significant progress in stabilizing our business in 2012, and demonstrated improvement in a number of areas of our business. In thefourth quarter, our total net flows turned positive for the first time since before the financial crisis, due to a second consecutive $5 billion-plusnet inflow quarter in Retail and our first net flow positive quarter in Institutions since the first quarter of 2008. Our Fixed Income servicescontinued to outperform their benchmarks during the fourth quarter, as did many of our core Growth and Value Equity services.
These results conclude a year during which we were successful in executing our long-term strategy to improve our investment performance,diversify our business, innovate for clients with our offerings and strengthen our financial condition. In Fixed Income, we finished 2012 withapproximately 89% of our assets in strategies that outperformed their benchmarks for the three-year period. In Equities, our Global, Interna-tional, Emerging Markets and U.S. Strategic Value strategies significantly outperformed their benchmarks in the fourth quarter of 2012, whileGrowth strategies such as U.S. Thematic, and U.S. Large and Small Cap Growth outperformed their benchmarks for the full year, and stabil-ity services such as Select U.S. Equity and Global Market Neutral beat benchmarks across multiple time periods.
Our total AUM as of December 31, 2012 were $430.0 billion, up $24.1 billion, or 5.9%, during 2012. The increase in AUM wasdriven by market appreciation of $38.5 billion and $16.2 billion of net inflows in the Retail channel, partially offset by net outflowsof $21.6 billion and $9.0 billion in the Institutions and Private Client channels, respectively.
Institutional AUM decreased $4.1 billion, or 1.8%, to $219.8 billion during 2012. The decrease in AUM resulted from net outflowsof $21.6 billion, partially offset by market appreciation of $17.6 billion. Gross sales increased $4.0 billion, or 23.2%, from $17.3 bil-lion in 2011 to $21.3 billion in 2012. In addition, redemptions and terminations decreased $14.0 billion, or 26.4%, from $52.8 bil-lion in 2011 to $38.8 billion in 2012. The pipeline of awarded but unfunded Institutional mandates was $8.0 billion as of year-end2012, compared with $4.3 billion as of year-end 2011. We completed nearly 400 requests for proposals during 2012 across diversefixed income and equity services—an 18% annual increase. Fixed Income is driving our improvement in this important business,but clients increasingly ask us about our equity, alternatives and multi-asset strategies.
Retail AUM increased $31.8 billion, or 28.2%, to $144.4 billion during 2012, resulting from net inflows of $16.2 billion and marketappreciation of $15.5 billion. Gross sales increased $25.3 billion, or 81.7%, from $31.0 billion in 2011 to record annual gross sales of$56.3 billion in 2012 as a result of strong sales in Fixed Income products and significant sales increases from all geographic regions.Our strength was particularly pronounced in Asia Ex-Japan, where we won 23 awards for both performance and innovation in2012, and where we command leading local market shares by AUM in Taiwan and Hong Kong.
Private Client AUM decreased $3.6 billion, or 5.2%, to $65.8 billion during 2012. The decrease in AUM was driven by net out-flows of $9.0 billion, offset by market appreciation of $5.4 billion. Gross sales decreased $3.0 billion, or 41.5%, from $7.3 billion in2011 to $4.3 billion in 2012. During 2012, we enhanced our fully diversified investment offering to better meet client needs byintroducing Strategic Equities, a new multi-style, all-cap approach to equity investment that captures our highest conviction ideas,and providing broader client access to alternatives through a fund-of-hedge-funds registered investment company.
Bernstein Research Services revenue decreased $23.7 million, or 5.4% to $413.7 million in 2012, as a result of a significant declinein market trading volumes, partially offset by market share gains.
Our full year 2012 revenues decreased $13.2 million, or 0.5%, to $2,736.7 million in 2012. The decrease was driven by lowerinvestment advisory base fees of $194.3 million and lower Bernstein Research Services revenue of $23.7 million, offset by invest-ments gains in 2012 compared to losses in 2011 resulting in a positive net impact of $111.3 million, higher performance-based feesof $50.1 million and higher distribution revenues of $50.1 million. Full year 2012 operating expenses decreased $424.0 million, or14.3% to $2,534.4 million in 2012, due to the one-time long-term incentive compensation charge of $587.1 million recorded in2011, lower employee compensation and benefits expense of $78.3 million (excluding the compensation charge) and lower officeand related expenses of $32.8 million (excluding the real estate charges), offset by higher real estate charges of $215.8 million(discussed below in this Item 7) and higher promotion and servicing expenses of $50.0 million.
Finally, we improved our firm’s operating leverage, finishing the year on schedule in executing our global real estate consolidationplan and anticipated related cost savings. With this and other firm-wide rationalization efforts, we increased our adjusted operatingmargin by 1.8 percentage points in 2012, to 18.8%, and achieved a second-half margin of 20.4%.
38 AllianceBernstein

Holding
Holding’s principal source of income and cash flow is attributable to its investment in AllianceBernstein Units. The Holding finan-cial statements and notes and management’s discussion and analysis of financial condition and results of operations (“MD&A”)should be read in conjunction with those of AllianceBernstein.
Results of OperationsYears Ended December 31, % Change
2012 2011 2010 2012-11 2011-10
(in thousands, except per unit amounts)
Net income (loss) attributable to AllianceBernstein Unitholders $188,916 $(174,768) $442,419 n/m n/m
Weighted average equity ownership interest 37.5% 37.5% 36.7%
Equity in net income (loss) attributable to AllianceBernstein Unitholders $ 70,807 $ (65,581) $162,217 n/m n/m
Net income (loss) of Holding $ 51,085 $ (93,268) $134,158 n/m n/m
Diluted net income (loss) per Holding Unit $ 0.51 $ (0.90) $ 1.32 n/m n/m
Distribution per Holding Unit(1)(2) $ 1.23 $ 1.14 $ 1.31 7.9% (13.0)%
(1) The 2012 distribution excludes the impact of AllianceBernstein’s $207.0 million non-cash real estate charges recorded in the third and fourth quarters of 2012.See the AllianceBernstein section of this Item 7 for a discussion of these charges.
(2) The 2011 distribution excludes the impact of AllianceBernstein’s $587.1 million one-time, non-cash long-term incentive compensation charge. See theAllianceBernstein section of this Item 7 for a discussion of this charge.
Holding had net income of $51.1 million in 2012 as compared to a net loss of $93.3 million in 2011. The change reflects higher netincome attributable to AllianceBernstein Unitholders. Holding had a net loss of $93.3 million in 2011 as compared to net income of$134.2 million in 2010. The net loss in 2011 reflects the impact of AllianceBernstein’s $587.1 million one-time, non-cash long-termincentive compensation charge.
Holding’s income taxes represent a 3.5% federal tax on its partnership gross income from the active conduct of a trade or business.Holding’s partnership gross income is derived from its interest in AllianceBernstein. Holding’s income tax is computed by multi-plying certain AllianceBernstein qualifying revenues (primarily U.S. investment advisory fees and SCB LLC commissions) by Hol-ding’s ownership interest in AllianceBernstein (adjusted for Holding Units owned by AllianceBernstein’s consolidated rabbi trust),multiplied by the 3.5% tax rate. Holding’s effective tax rate was 27.9% in 2012 compared to (42.2)% in 2011 and 17.3% in 2010.See Note 6 to Holding’s financial statements in Item 8 for a further description.
As supplemental information, AllianceBernstein provides the performance measures “adjusted net revenue”, “adjusted operatingincome” and “adjusted operating margin”, which are the principal metrics management uses in evaluating and comparing theperiod-to-period operating performance of AllianceBernstein. Such measures are not based on generally accepted accountingprinciples (“non-GAAP measures”). The impact of these non-GAAP measures on Holding’s net income and diluted net income perHolding Unit are as follows:
Years Ended December 31,2012 2011 2010
(in thousands, except per unit amounts)
AllianceBernstein non-GAAP adjustments, before taxes $221,530 $ 585,242 $ 79,463
Income tax effect on non-GAAP adjustments (11,573) (23,234) (2,066)
AllianceBernstein non-GAAP adjustments, after taxes 209,957 562,008 77,397
Holding’s weighted average equity ownership interest in AllianceBernstein 37.5% 37.5% 36.7%
Impact on Holding’s net income of AllianceBernstein non-GAAP adjustments $ 78,693 $210,891 $28,378
Annual Report 2012 39

Years Ended December 31,2012 2011 2010
(in thousands, except per unit amounts)
Net income (loss)—diluted, GAAP basis $ 51,085 $ (93,268) $135,798
Impact on Holding’s net income of AllianceBernstein non-GAAP adjustments 78,693 210,891 28,378
Adjusted net income—diluted $129,778 $117,623 $164,176
Diluted net income (loss) per Holding Unit, GAAP basis $ 0.51 $ (0.90) $ 1.32
Impact of AllianceBernstein non-GAAP adjustments 0.77 2.04 0.28
Adjusted diluted net income per Holding Unit $ 1.28 $ 1.14 $ 1.60
The impact on Holding’s net income (loss) of AllianceBernstein’s non-GAAP adjustments reflects Holding’s share (based on itsownership percentage of AllianceBernstein over the applicable period) of AllianceBernstein’s non-GAAP adjustments to its netincome (see Management Operating Metrics in this Item 7). These non-GAAP measures are provided in addition to, and not as sub-stitutes for, net revenues, operating income and operating margin, and they may not be comparable to non-GAAP measures pre-sented by other companies. Management uses both the GAAP and non-GAAP measures in evaluating our financial performance.The non-GAAP measures alone may pose limitations because they do not include all of AllianceBernstein’s revenues and expenses.
Proposed Tax Legislation
See “Risk Factors” in Item 1A.
Capital Resources and Liquidity
During the year ended December 31, 2012, net cash provided by operating activities was $99.9 million, compared to $151.4 mil-lion during the corresponding 2011 period. The decrease was primarily due to lower cash distributions received fromAllianceBernstein of $57.8 million. During the year ended December 31, 2011, net cash provided by operating activities was $151.4million, compared to $153.6 million during the corresponding 2010 period. The decrease was primarily due to lower cash dis-tributions received from AllianceBernstein of $3.7 million.
During the years ended December 31, 2012, 2011 and 2010, net cash used in investing activities was $11.6 million, $7.2 millionand $10.5 million, respectively, reflecting investments in AllianceBernstein from cash distributions paid to the AllianceBernsteinconsolidated rabbi trust and with proceeds from exercises of compensatory options to buy Holding Units.
During the year ended December 31, 2012, net cash used in financing activities was $88.3 million, compared to $144.2 millionduring the corresponding 2011 period. The decrease was primarily due to lower cash distributions paid to unitholders of $57.3 mil-lion. During the year ended December 31, 2011, net cash used in financing activities was $144.2 million, compared to $143.1 mil-lion during the corresponding 2010 period. The increase was due to lower proceeds from the exercise of compensatory options tobuy Holding Units of $6.8 million, offset by lower cash distributions paid to unitholders of $5.7 million.
Management believes that the cash flow realized from its investment in AllianceBernstein will provide Holding with the resourcesto meet its financial obligations.
Cash Distributions
Holding is required to distribute all of its Available Cash Flow, as defined in the Holding Partnership Agreement, to its unitholders(including the General Partner). Typically in the past, Available Cash Flow has been the diluted earnings per unit for the quartermultiplied by the number of units outstanding at the end of the quarter, except when, as was the case with the compensation-related charge in the fourth quarter of 2011 and the real estate charge in the third quarter of 2012, the effects of these non-cashcharges were eliminated. Starting in the third quarter of 2012, Available Cash Flow is the adjusted diluted net income per unit forthe quarter multiplied by the number of units outstanding at the end of the quarter. In future periods, management anticipates that
40 AllianceBernstein

Available Cash Flow typically will be based on adjusted diluted net income per unit, unless management determines that one ormore non-GAAP adjustments should not be made with respect to the Available Cash Flow calculation. See Note 2 to Holding’sfinancial statements in Item 8 for a description of Available Cash Flow.
Commitments and Contingencies
See Note 7 to Holding’s financial statements in Item 8.
AllianceBernstein
Assets Under Management
Assets under management by distribution channel were as follows:As of December 31, % Change
2012 2011 2010 2012-11 2011-10
(in billions)
Institutions $ 219.8 $ 223.9 $ 272.9 (1.8)% (18.0)%Retail 144.4 112.6 127.0 28.2 (11.4)Private Client 65.8 69.4 78.1 (5.2) (11.1)Total $430.0 $405.9 $478.0 5.9 (15.1)
Assets under management by investment service were as follows:As of December 31, % Change
2012 2011 2010 2012-11 2011-10
(in billions)
EquityValue:
U.S. $ 19.0 $ 25.2 $ 37.8 (24.6)% (33.5)%Global and International 38.1 55.6 106.5 (31.5) (47.8)
57.1 80.8 144.3 (29.3) (44.0)Growth:
U.S. 21.6 21.8 30.3 (1.4) (28.0)Global and International 17.8 22.4 44.0 (20.2) (49.1)
39.4 44.2 74.3 (10.9) (40.5)Total Equity 96.5 125.0 218.6 (22.8) (42.8)Fixed Income:
U.S. 133.5 127.4 119.0 4.8 7.0Global and International 122.1 90.2 87.2 35.3 3.5
255.6 217.6 206.2 17.5 5.5
Other(1):U.S. 33.1 29.6 28.7 11.7 3.2Global and International 44.8 33.7 24.5 33.2 37.6
77.9 63.3 53.2 23.1 19.1Total:
U.S. 207.2 204.0 215.8 1.5 (5.5)Global and International 222.8 201.9 262.2 10.4 (23.0)
Total $430.0 $405.9 $478.0 5.9 (15.1)
(1) Includes index, structured, asset allocation services and certain other alternative investments.
Annual Report 2012 41

Changes in assets under management during 2012 and 2011 were as follows:Distribution Channel Investment Service
Institutions RetailPrivateClient Total
ValueEquity
GrowthEquity
FixedIncome Other(1) Total
(in billions)
Balance as of December 31, 2011 $ 223.9 $ 112.6 $ 69.4 $ 405.9 $ 80.8 $ 44.2 $ 217.6 $ 63.3 $ 405.9
Long-term flows:
Sales/new accounts 21.3 56.3 4.3 81.9 5.2 5.0 62.4 9.3 81.9
Redemptions/terminations (38.8) (33.0) (10.9) (82.7) (32.0) (14.3) (33.8) (2.6) (82.7)
Cash flow/unreinvested dividends (4.1) (7.1) (2.4) (13.6) (5.7) (1.6) (6.0) (0.3) (13.6)
Net long-term (outflows) inflows (21.6) 16.2 (9.0) (14.4) (32.5) (10.9) 22.6 6.4 (14.4)
Transfers (0.1) 0.1 — — — — — — —
Market appreciation 17.6 15.5 5.4 38.5 8.8 6.1 15.4 8.2 38.5
Net change (4.1) 31.8 (3.6) 24.1 (23.7) (4.8) 38.0 14.6 24.1
Balance as of December 31, 2012 $219.8 $144.4 $65.8 $430.0 $57.1 $39.4 $255.6 $77.9 $430.0
Distribution Channel Investment Service
Institutions RetailPrivateClient Total
ValueEquity
GrowthEquity
FixedIncome Other(1) Total
(in billions)
Balance as of December 31, 2010 $ 272.9 $ 127.0 $ 78.1 $ 478.0 $144.3 $ 74.3 $ 206.2 $ 53.2 $ 478.0
Long-term flows:
Sales/new accounts 17.3 31.0 7.3 55.6 6.5 5.2 31.4 12.5 55.6
Redemptions/terminations (52.8) (34.8) (9.5) (97.1) (43.3) (24.7) (27.8) (1.3) (97.1)
Cash flow/unreinvested dividends (9.3) (7.1) (4.6) (21.0) (13.1) (6.3) (0.4) (1.2) (21.0)
Net long-term (outflows) inflows (44.8) (10.9) (6.8) (62.5) (49.9) (25.8) 3.2 10.0 (62.5)
Transfers 0.1 — (0.1) — — — — — —
Acquisitions 1.1 0.2 0.1 1.4 — 1.2 0.2 — 1.4
Market (depreciation) appreciation (5.4) (3.7) (1.9) (11.0) (13.6) (5.5) 8.0 0.1 (11.0)
Net change (49.0) (14.4) (8.7) (72.1) (63.5) (30.1) 11.4 10.1 (72.1)
Balance as of December 31, 2011 $223.9 $112.6 $69.4 $405.9 $ 80.8 $44.2 $217.6 $63.3 $405.9
Average assets under management by distribution channel and investment service were as follows:Years Ended December 31, % Change
2012 2011 2010 2012-11 2011-10
(in billions)
Distribution Channel:Institutions $ 218.9 $ 252.6 $ 277.1 (13.3)% (8.8)%
Retail 128.2 124.0 122.8 3.4 1.0
Private Client 68.9 75.3 74.7 (8.6) 0.9
Total $416.0 $451.9 $474.6 (8.0) (4.8)
Investment Service:Value Equity $ 69.5 $ 117.2 $ 153.5 (40.7)% (23.6)%
Growth Equity 41.1 61.0 81.3 (32.6) (25.0)
Fixed Income 235.2 214.0 198.9 9.9 7.6
Other(1) 70.2 59.7 40.9 17.7 46.0
Total $416.0 $451.9 $474.6 (8.0) (4.8)
(1) Includes index, structured, asset allocation services and certain other alternative investments.
42 AllianceBernstein
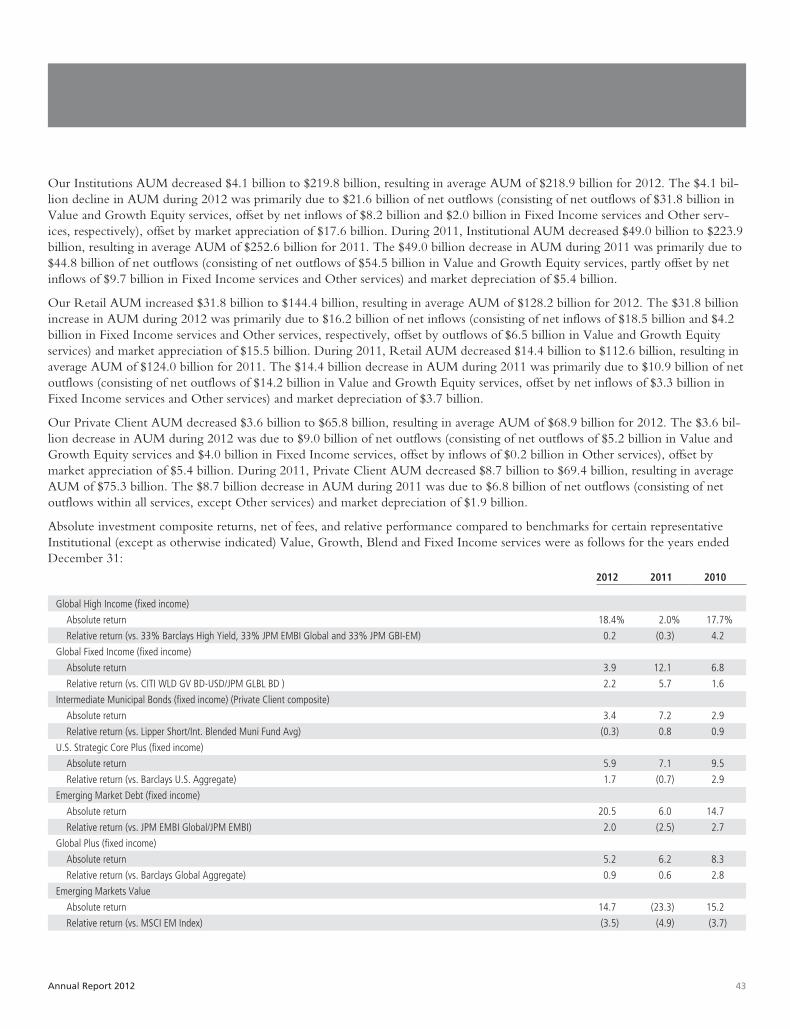
Our Institutions AUM decreased $4.1 billion to $219.8 billion, resulting in average AUM of $218.9 billion for 2012. The $4.1 bil-lion decline in AUM during 2012 was primarily due to $21.6 billion of net outflows (consisting of net outflows of $31.8 billion inValue and Growth Equity services, offset by net inflows of $8.2 billion and $2.0 billion in Fixed Income services and Other serv-ices, respectively), offset by market appreciation of $17.6 billion. During 2011, Institutional AUM decreased $49.0 billion to $223.9billion, resulting in average AUM of $252.6 billion for 2011. The $49.0 billion decrease in AUM during 2011 was primarily due to$44.8 billion of net outflows (consisting of net outflows of $54.5 billion in Value and Growth Equity services, partly offset by netinflows of $9.7 billion in Fixed Income services and Other services) and market depreciation of $5.4 billion.
Our Retail AUM increased $31.8 billion to $144.4 billion, resulting in average AUM of $128.2 billion for 2012. The $31.8 billionincrease in AUM during 2012 was primarily due to $16.2 billion of net inflows (consisting of net inflows of $18.5 billion and $4.2billion in Fixed Income services and Other services, respectively, offset by outflows of $6.5 billion in Value and Growth Equityservices) and market appreciation of $15.5 billion. During 2011, Retail AUM decreased $14.4 billion to $112.6 billion, resulting inaverage AUM of $124.0 billion for 2011. The $14.4 billion decrease in AUM during 2011 was primarily due to $10.9 billion of netoutflows (consisting of net outflows of $14.2 billion in Value and Growth Equity services, offset by net inflows of $3.3 billion inFixed Income services and Other services) and market depreciation of $3.7 billion.
Our Private Client AUM decreased $3.6 billion to $65.8 billion, resulting in average AUM of $68.9 billion for 2012. The $3.6 bil-lion decrease in AUM during 2012 was due to $9.0 billion of net outflows (consisting of net outflows of $5.2 billion in Value andGrowth Equity services and $4.0 billion in Fixed Income services, offset by inflows of $0.2 billion in Other services), offset bymarket appreciation of $5.4 billion. During 2011, Private Client AUM decreased $8.7 billion to $69.4 billion, resulting in averageAUM of $75.3 billion. The $8.7 billion decrease in AUM during 2011 was due to $6.8 billion of net outflows (consisting of netoutflows within all services, except Other services) and market depreciation of $1.9 billion.
Absolute investment composite returns, net of fees, and relative performance compared to benchmarks for certain representativeInstitutional (except as otherwise indicated) Value, Growth, Blend and Fixed Income services were as follows for the years endedDecember 31:
2012 2011 2010
Global High Income (fixed income)
Absolute return 18.4% 2.0% 17.7%
Relative return (vs. 33% Barclays High Yield, 33% JPM EMBI Global and 33% JPM GBI-EM) 0.2 (0.3) 4.2
Global Fixed Income (fixed income)
Absolute return 3.9 12.1 6.8
Relative return (vs. CITI WLD GV BD-USD/JPM GLBL BD ) 2.2 5.7 1.6
Intermediate Municipal Bonds (fixed income) (Private Client composite)
Absolute return 3.4 7.2 2.9
Relative return (vs. Lipper Short/Int. Blended Muni Fund Avg) (0.3) 0.8 0.9
U.S. Strategic Core Plus (fixed income)
Absolute return 5.9 7.1 9.5
Relative return (vs. Barclays U.S. Aggregate) 1.7 (0.7) 2.9
Emerging Market Debt (fixed income)
Absolute return 20.5 6.0 14.7
Relative return (vs. JPM EMBI Global/JPM EMBI) 2.0 (2.5) 2.7
Global Plus (fixed income)
Absolute return 5.2 6.2 8.3
Relative return (vs. Barclays Global Aggregate) 0.9 0.6 2.8
Emerging Markets Value
Absolute return 14.7 (23.3) 15.2
Relative return (vs. MSCI EM Index) (3.5) (4.9) (3.7)
Annual Report 2012 43
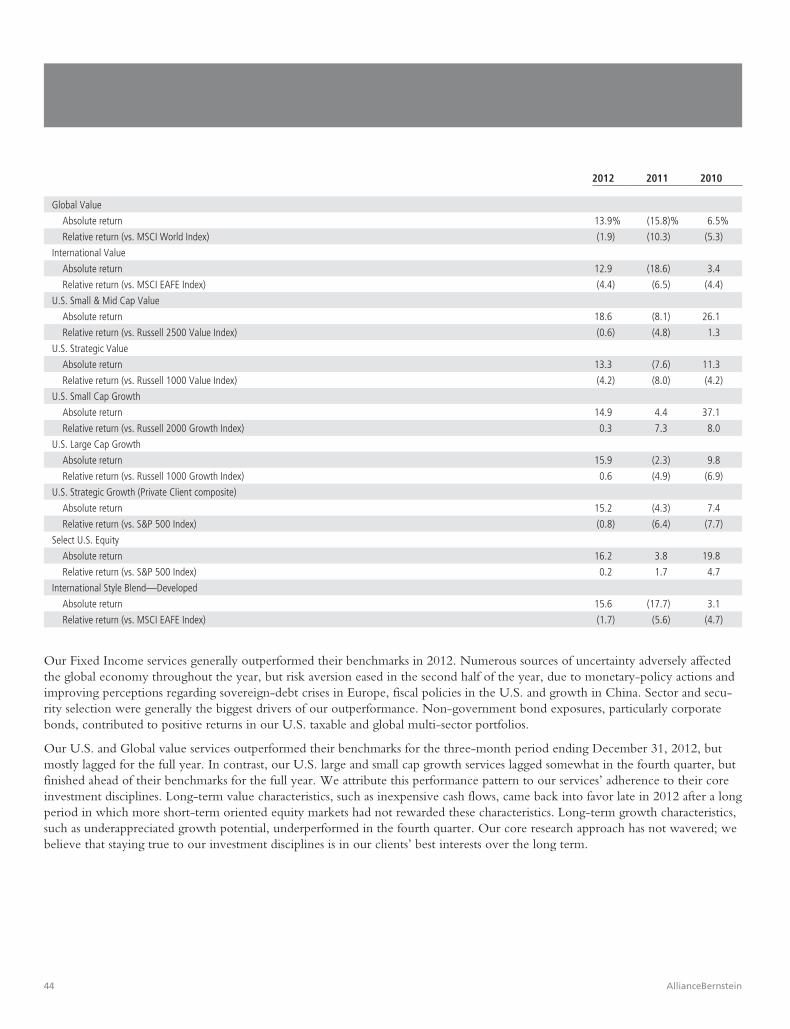
2012 2011 2010
Global Value
Absolute return 13.9% (15.8)% 6.5%
Relative return (vs. MSCI World Index) (1.9) (10.3) (5.3)
International Value
Absolute return 12.9 (18.6) 3.4
Relative return (vs. MSCI EAFE Index) (4.4) (6.5) (4.4)
U.S. Small & Mid Cap Value
Absolute return 18.6 (8.1) 26.1
Relative return (vs. Russell 2500 Value Index) (0.6) (4.8) 1.3
U.S. Strategic Value
Absolute return 13.3 (7.6) 11.3
Relative return (vs. Russell 1000 Value Index) (4.2) (8.0) (4.2)
U.S. Small Cap Growth
Absolute return 14.9 4.4 37.1
Relative return (vs. Russell 2000 Growth Index) 0.3 7.3 8.0
U.S. Large Cap Growth
Absolute return 15.9 (2.3) 9.8
Relative return (vs. Russell 1000 Growth Index) 0.6 (4.9) (6.9)
U.S. Strategic Growth (Private Client composite)
Absolute return 15.2 (4.3) 7.4
Relative return (vs. S&P 500 Index) (0.8) (6.4) (7.7)
Select U.S. Equity
Absolute return 16.2 3.8 19.8
Relative return (vs. S&P 500 Index) 0.2 1.7 4.7
International Style Blend—Developed
Absolute return 15.6 (17.7) 3.1
Relative return (vs. MSCI EAFE Index) (1.7) (5.6) (4.7)
Our Fixed Income services generally outperformed their benchmarks in 2012. Numerous sources of uncertainty adversely affectedthe global economy throughout the year, but risk aversion eased in the second half of the year, due to monetary-policy actions andimproving perceptions regarding sovereign-debt crises in Europe, fiscal policies in the U.S. and growth in China. Sector and secu-rity selection were generally the biggest drivers of our outperformance. Non-government bond exposures, particularly corporatebonds, contributed to positive returns in our U.S. taxable and global multi-sector portfolios.
Our U.S. and Global value services outperformed their benchmarks for the three-month period ending December 31, 2012, butmostly lagged for the full year. In contrast, our U.S. large and small cap growth services lagged somewhat in the fourth quarter, butfinished ahead of their benchmarks for the full year. We attribute this performance pattern to our services’ adherence to their coreinvestment disciplines. Long-term value characteristics, such as inexpensive cash flows, came back into favor late in 2012 after a longperiod in which more short-term oriented equity markets had not rewarded these characteristics. Long-term growth characteristics,such as underappreciated growth potential, underperformed in the fourth quarter. Our core research approach has not wavered; webelieve that staying true to our investment disciplines is in our clients’ best interests over the long term.
44 AllianceBernstein

Consolidated Results of OperationsYears Ended December 31, % Change
2012 2011 2010 2012-11 2011-10
(in millions, except per unit amounts)
Net revenues $2,736.7 $2,749.9 $2,948.6 (0.5)% (6.7)%
Expenses 2,534.4 2,958.4 2,489.7 (14.3) 18.8
Operating income (loss) 202.3 (208.5) 458.9 n/m n/m
Non-operating income — — 6.7 — (100.0)
Income (loss) before income taxes 202.3 (208.5) 465.6 n/m n/m
Income taxes 13.7 3.1 38.5 344.3 (92.0)
Net income (loss) 188.6 (211.6) 427.1 n/m n/m
Net income (loss) of consolidated entities attributable to non-controlling interests (0.3) (36.8) (15.3) (99.1) 140.2
Net income (loss) attributable to AllianceBernstein Unitholders $ 188.9 $ (174.8) $ 442.4 n/m n/m
Diluted net income (loss) per AllianceBernstein Unit $ 0.67 $ (0.62) $ 1.58 n/m n/m
Distributions per AllianceBernstein Unit(1)(2) $ 1.36 $ 1.38 $ 1.58 (1.4) (12.7)
Operating margin(3) 7.4% n/m 16.1%
(1) The 2012 distribution excludes the impact of $207.0 million of non-cash real estate charges recorded in the third and fourth quarters of 2012.
(2) The 2011 distribution excludes the impact of the $587.1 million one-time, non-cash long-term incentive compensation charge.
(3) Operating income excluding net (loss) income attributable to non-controlling interests as a percentage of net revenues.
Net income attributable to AllianceBernstein unitholders for the year ended December 31, 2012 was $188.9 million, as comparedto net loss attributable to AllianceBernstein unitholders of $174.8 million for the year ended December 31, 2011. The change wasprimarily due to (in millions):
Higher real estate charges $(215.8)
Lower base advisory fees (194.3)
Lower Bernstein Research Services revenues (23.7)
2011 long-term incentive compensation charge 587.1
Lower employee compensation and benefits (excluding $587.1 million compensation charge) 78.3
Higher performance-based fees 50.1
Higher long-term incentive compensation investment gains 37.0
Seed capital investment gains compared to 2011 losses 28.2
Lower other promotion and servicing expenses 17.0
Other (0.2)
$ 363.7
Annual Report 2012 45

Net loss attributable to AllianceBernstein unitholders for the year ended December 31, 2011 was $174.8 million, as compared to netincome attributable to AllianceBernstein unitholders of $442.4 million for the year ended December 31, 2010. The change wasprimarily due to (in millions):
2011 long-term incentive compensation charge $(587.1)
Lower investment advisory base fees (131.3)
Long-term incentive compensation investment losses compared to 2010 gains (47.4)
Higher other promotion and servicing expenses (25.5)
Seed money investment losses compared to 2010 gains (12.4)
Higher portfolio services (9.8)
Lower real estate charges 94.5
Lower employee compensation and benefits (excluding $587.1 million compensation charge) 73.6
Lower income tax expense 35.4
2011 insurance proceeds 10.7
Other (17.9)
$(617.2)
Real Estate Charges
Since the fourth quarter of 2008, we consistently have taken steps to reduce our cost structure, including headcount reductions, andthe consolidation of office locations, in response to declines in our AUM and fee revenues.
During 2010, we performed a comprehensive review of our real estate requirements in New York in connection with our work-force reductions commencing in 2008. As a result, during 2010 we decided to sub-lease over 380,000 square feet in New York(approximately 80% of this space has been sublet) and largely consolidate our New York-based employees into two office locationsfrom three. We recorded pre-tax real estate charges of $101.7 million in 2010 that reflected the net present value of the differencebetween the amount of our ongoing contractual operating lease obligations for this space and our estimate of current market rentalrates ($76.2 million), as well as the write-off of leasehold improvements, furniture and equipment related to this space ($25.5million). We periodically review the assumptions and estimates we used in recording these charges.
During 2011, we recorded pre-tax real estate charges totaling $7.2 million for our office space in London, England, New York andother U.S. locations. The London charge was $8.8 million, consisting of a $5.8 million payment to the party to which the lease wasassigned, as well as the write-off of $3.0 million of leasehold improvements, furniture and equipment related to the space. We alsowrote off an additional $1.5 million of leasehold improvements, furniture and equipment related to the New York space and hadmiscellaneous charges of $0.4 million. These charges were offset by a $3.5 million credit we recorded in 2011 due to changes inestimates of our 2010 charge.
During the first six months of 2012, we recorded pre-tax real estate charges totaling $16.1 million, reflecting $8.8 million resultingfrom the abandonment of our leased New York City Data Center office space and $7.3 million resulting from a change in estimatesrelating to previously recorded real estate charges. The New York City Data Center charge consisted of the net present value of thedifference between the amount of ongoing contractual operating lease obligations for this space and our estimate of current marketrental rates ($7.1 million) and the write-off of leasehold improvements, furniture and equipment related to this space ($1.7 million).
During the third quarter of 2012, in an effort to further reduce our global real estate footprint, we completed a comprehensivereview of our worldwide office locations and began implementing a global space consolidation plan. As a result, our intention is tosub-lease approximately 510,000 square feet of office space, over 70% of which is New York office space (in addition to the380,000 square feet written-off in 2010), with the remainder comprised of office space in London, England, Melbourne, Australiaand various U.S. locations. We expect that the actions we are taking to vacate and market space for sublease will result over time inprojected non-cash real estate charges of $225 million to $250 million, with the bulk of the charges having occurred in the thirdand fourth quarters of 2012. These charges are in addition to the earlier non-cash real estate charges for New York City office spacewe recorded, and they will not affect our future quarterly distributions. We ultimately expect to realize reduced annual operatingexpenses of $38 million to $43 million once we have successfully subleased the vacated space. These projections are based on
46 AllianceBernstein

current market conditions and could change over time as conditions evolve. We believe implementing our global spaceconsolidation plan will meaningfully improve our cost structure and will play an important part in positioning our firm for astronger future.
During the third quarter of 2012, we recorded pre-tax real estate charges of $168.1 million, reflecting the net present value of thedifference between the amount of our ongoing contractual operating lease obligations for this space and our estimate of currentmarket rental rates ($131.8 million), as well as the write-off of leasehold improvements, furniture and equipment related to thisspace ($31.3 million), and changes in estimates relating to previously recorded real estate charges ($5.0 million).
During the fourth quarter of 2012, we recorded pre-tax real estate charges of $38.9 million, reflecting the net present value of thedifference between the amount of our ongoing contractual operating lease obligations for this space and our estimate of currentmarket rental rates ($32.0 million), as well as the write-off of leasehold improvements, furniture and equipment related to this space($8.4 million), offset by changes in estimates relating to previously recorded real estate charges of ($1.5 million).
Long-term Incentive Compensation Charge
During the fourth quarter of 2011, we implemented changes to our employee long-term incentive compensation award program toensure that our compensation practices are competitive, and to better align the costs of employee compensation and benefits withthe company’s current year financial performance and provide employees with a higher degree of certainty that they will receive theincentive compensation they are awarded. We amended all outstanding year-end long-term incentive compensation awards ofactive employees (i.e., those employees who we employed as of December 31, 2011), so that employees who terminate theiremployment or are terminated without cause may retain their awards, subject to compliance with certain agreements and restrictivecovenants set forth in the applicable award agreement, including restrictions on competition and employee and client solicitation,and a claw-back for failing to follow existing risk management policies. Most equity replacement, sign-on or similar long-termincentive compensation awards included in separate employment agreements or arrangements were not amended in 2011 to reflectthese changes.
We recognize compensation expense related to equity compensation grants in the financial statements using the fair value method.Fair value of restricted Holding Unit awards is the closing price of a Holding Unit on the grant date; fair value of options isdetermined using the Black-Scholes option valuation model. Under the fair value method, compensatory expense is measured at thegrant date based on the estimated fair value of the award and is recognized over the required service period. Prior to the changesmade to the employee long-term incentive compensation award program in the fourth quarter of 2011, an employee’s servicerequirement was typically the same as the delivery dates. These changes eliminated employee service requirements but did notmodify delivery dates contained in the original award agreements.
As a result of these changes, we recorded a one-time, non-cash charge of $587.1 million in the fourth quarter of 2011 for allunrecognized long-term incentive compensation on the amended outstanding awards from prior years. In addition, we recorded100% of the expense associated with our 2011 long-term incentive compensation awards of $159.9 million in the fourth quarterof 2011.
Awards granted in 2011 contained the provisions described above, as did awards granted in 2012, and we expect to include theseprovisions in long-term incentive compensation awards in future years. Accordingly, our annual incentive compensation expensewill reflect 100% of the expense associated with the long-term incentive compensation awarded in each year. This approach toexpense recognition will more closely match the economic cost of awarding long-term incentive compensation to the period inwhich the related service is performed.
Units Outstanding
We engage in open-market purchases of Holding Units to help fund anticipated obligations under our incentive compensationaward program and for other corporate purposes, and purchase Holding Units from employees to allow them to fulfill statutory taxwithholding requirements at the time of distribution of long-term incentive compensation awards. During 2012 and 2011,
Annual Report 2012 47

AllianceBernstein purchased 15.7 million and 13.5 million Holding Units for $238.0 million and $220.8 million, respectively. Theseamounts reflect open-market purchases of 12.3 million and 11.1 million Holding Units for $182.3 million and $192.1 million,respectively, with the remainder relating to purchases of Holding Units from employees to allow them to fulfill statutory tax with-holding requirements at the time of distribution of long-term incentive compensation awards, offset by Holding Units purchased byemployees as part of a distribution reinvestment election.
Since the third quarter of 2011, we have implemented plans each quarter to repurchase Holding Units pursuant to Rule 10b5-1under the Exchange Act. A Rule 10b5-1 plan allows a company to repurchase its shares at times when it otherwise might be pre-vented from doing so because of self-imposed trading blackout periods and because it possesses material non-public information.Each broker we have selected has the authority under the terms and limitations specified in the plan to repurchase Holding Units onour behalf in accordance with the terms of the plan. Repurchases are subject to SEC regulations as well as certain price, marketvolume and timing constraints specified in the plan. The plan adopted during the fourth quarter of 2012 did not specify anaggregate limitation and expired at the close of business on February 11, 2013. We intend to adopt additional Rule 10b5-1 plans sothat we can continue to engage in open-market purchases of Holding Units to help fund anticipated obligations under our incentivecompensation award programs and for other corporate purposes.
We granted to employees and Eligible Directors 12.1 million restricted Holding Unit awards (including 2.7 million granted in June2012 to Peter Kraus, our Chief Executive Officer (see “Employee Compensation and Benefits” in this Item 7) and 8.7 million granted inJanuary 2012 for 2011 year-end awards) and 1.7 million restricted Holding Unit awards during 2012 and 2011, respectively. Tofund these awards, we allocated previously repurchased Holding Units that had been held in the consolidated rabbi trust. The 2012and 2011 long-term incentive compensation awards allowed most employees to allocate their award between restricted HoldingUnits and deferred cash. As a result, 6.5 million restricted Holding Unit awards for the December 2012 awards and 8.7 millionrestricted Holding Unit awards for the December 2011 awards were awarded and allocated as such within the consolidated rabbitrust in January 2013 and 2012, respectively. There were approximately 17.9 million and 12.0 million unallocated Holding Unitsremaining in the consolidated rabbi trust as of December 31, 2012 and January 31, 2013, respectively. The balance as of January 31,2013 also reflects repurchases and other activity during January 2013.
Cash Distributions
AllianceBernstein is required to distribute all of its Available Cash Flow, as defined in the AllianceBernstein Partnership Agreement,to its unitholders (including the General Partner). Typically in the past, Available Cash Flow has been the diluted earnings per unitfor the quarter multiplied by the number of general and limited partnership interests at the end of the quarter, except when, as wasthe case with the compensation-related charge in the fourth quarter of 2011 and the real estate charge in the third quarter of 2012,the effects of the non-cash charges were eliminated. Starting in the third quarter of 2012, Available Cash Flow is the adjusteddiluted net income per unit for the quarter multiplied by the number of general and limited partnership interests at the end of thequarter. In future periods, management anticipates that Available Cash Flow typically will be based on adjusted diluted net incomeper unit, unless management determines that one or more non-GAAP adjustments should not be made with respect to the AvailableCash Flow calculation. See Note 2 to AllianceBernstein’s consolidated financial statements contained in Item 8 for a description of AvailableCash Flow.
Management Operating Metrics
We are providing the non-GAAP measures “adjusted net revenues”, “adjusted operating income” and “adjusted operating margin”because they are the principal operating metrics management uses in evaluating and comparing period-to-period operatingperformance and we believe they are useful to investors. Management principally uses these metrics in evaluating performancebecause they present a clearer picture of our operating performance, and allow management to see long-term trends without thedistortion primarily caused by long-term incentive compensation-related mark-to-market adjustments, real estate consolidationcharges and other adjustment items. Similarly, these management operating metrics help investors better understand the underlyingtrends in our results and, accordingly, we believe they provide a valuable perspective for investors.
48 AllianceBernstein

These non-GAAP measures are provided in addition to, and not as substitutes for, net revenues, operating income and operating margin,and they may not be comparable to non-GAAP measures presented by other companies. Management uses both the GAAP and non-GAAP measures in evaluating our financial performance. The non-GAAP measures alone may pose limitations because they do notinclude all of our revenues and expenses.
Years Ended December 31,2012 2011 2010
(in thousands)
Net revenues, GAAP basis $2,736,737 $2,749,891 $2,948,557
Exclude:
Long-term incentive compensation-related investment (gains) losses (16,711) 20,302 (27,053)
Long-term incentive compensation-related dividends and interest (2,245) (4,364) (6,513)
90% of consolidated venture capital fund investment (gains) losses (1,118) 35,778 16,527
Distribution-related payments (367,090) (302,684) (286,676)
Amortization of deferred sales commissions (40,262) (37,675) (47,397)
Pass-through fees and expenses (49,010) (35,103) (32,684)
Adjusted net revenues $2,260,301 $2,426,145 $2,564,761
Operating income (loss), GAAP basis $ 202,365 $ (208,469) $ 458,862
Exclude:
Long-term incentive compensation-related investment (gains) losses (16,711) 20,302 (27,053)
Long-term incentive compensation-related dividends and interest (2,245) (4,364) (6,513)
Long-term incentive compensation-related mark-to-market vesting expense (credit) 14,858 (19,425) 2,791
Long-term incentive compensation-related dividends and interest expense 2,590 5,054 8,540
2011 long-term incentive compensation charge — 587,131 —
Net impact of long-term incentive compensation-related items (1,508) 588,698 (22,235)
Insurance proceeds — (10,691) —
Real estate charges 223,038 7,235 101,698
Sub-total of non-GAAP adjustments 221,530 585,242 79,463
Less: Net (loss) income of consolidated entities attributable to non-controlling interests (315) (36,799) (15,320)
Adjusted operating income $ 424,210 $ 413,572 $ 553,645
Adjusted operating margin 18.8% 17.0% 21.6%
Adjusted operating income for the year ended December 31, 2012 increased $10.6 million, or 2.6%, from the year ended December 31,2011, primarily as a result of lower employee compensation expense (excluding the impact of long-term incentive compensation-relateditems) of $110.1 million, lower general and administrative expenses (excluding real estate charges) of $52.0 million, higher investment gainsof $37.4 million and higher performance-based fees of $32.1 million, offset by lower base advisory fees of $192.4 million and lower Bern-stein Research Services revenues of $23.7 million. Adjusted operating income for the year ended December 31, 2011 decreased $140.1million, or 25.3%, from the year ended December 31, 2010, primarily as a result of lower investment advisory fees of $136.2 million,higher seed money losses of $12.4 million, higher general and administrative expenses (excluding real estate charges) of $27.1 million andhigher other promotion and servicing expenses of $23.9 million, partially offset by higher Bernstein Research Services revenues of $6.9million and lower employee compensation expense (excluding the impact of long-term incentive compensation-related items) of $48.0million.
Adjusted Net RevenuesAdjusted net revenues exclude investment gains and losses and dividends and interest on long-term incentive compensation-relatedinvestments, and 90% of the investment gains and losses of our consolidated venture capital fund attributable to non-controllinginterests. In addition, adjusted net revenues offset distribution-related payments to third parties as well as amortization of deferredsales commissions against distribution revenues. We believe the offset of distribution-related payments from net revenues is usefulfor our investors and other users of our financial statements because such presentation appropriately reflects the nature of these costsas pass-through payments to third parties who perform functions on behalf of our sponsored mutual funds and/or shareholders of
Annual Report 2012 49
these funds. Amortization of deferred sales commissions is offset against net revenues because such costs, over time, essentially offsetdistribution revenues earned by the company. We also exclude additional pass-through expenses we incur (primarily through ourtransfer agency) that are reimbursed and recorded as fees in revenues. During 2012, we offset sub-advisory payments to third partiesagainst performance-based fees earned on the Public-Private Investment Program (“PPIP”) fund we managed. These fees have noimpact on operating income, but they do have an impact on our operating margin. As such, we exclude these fees from adjusted netrevenues.
Adjusted Operating IncomeAdjusted operating income represents operating income on a GAAP basis excluding (1) the impact on net revenues and compensa-tion expense of the mark-to-market gains and losses (as well as the dividends and interest) associated with employee long-termincentive compensation-related investments, (2) the 2011 compensation charge, (3) real estate charges, (4) insurance proceeds, and(5) the net loss or income of consolidated entities attributable to non-controlling interests.
Prior to 2009, a large proportion of employee compensation was in the form of long-term incentive compensation awards that werenotionally invested in AllianceBernstein investment services and generally vested over a period of four years. AllianceBernstein haseconomically hedged the exposure to market movements by purchasing and holding these investments on its balance sheet. The fullvalue of the investments’ appreciation (depreciation) is recorded within investment gains and losses on the income statement in thecurrent period. U.S. GAAP requires the appreciation (depreciation) in the compensation liability to be expensed over the awardvesting period in proportion to the vested amount of the award as part of compensation expense. This creates a timing differencebetween the recognition of the compensation expense and the investment gain or loss impacting operating income, which will fluc-tuate over the life of the award and net to zero at the end of the multi-year vesting period. Although during periods of high marketvolatility these timing differences have an impact on operating income and operating margin, over the life of the award any impactis ultimately offset. Because these plans are economically hedged, management believes it is useful to reflect the offset ultimatelyachieved from hedging the investments’ market exposure in the calculation of adjusted operating income, adjusted operating marginand adjusted diluted net income per Holding Unit, which will produce core operating results from period to period. The non-GAAP measures exclude gains and losses and dividends and interest on long-term incentive compensation-related investmentsincluded in revenues and compensation expense, thus eliminating the timing differences created by different treatment under U.S.GAAP of the market movement on the expense and the investments. In the fourth quarter of 2011, we implemented changes toour employee long-term incentive compensation award program. As a result, mark-to-market investment gains or losses recognizedin compensation expense will closely approximate mark-to-market investment gains and losses recognized in revenues.
Real estate charges have been excluded because they are not considered part of our core operating results when comparing financialresults from period to period and to industry peers.
In the third quarter of 2011, we received significant insurance proceeds from the settlement of a claim that are not considered partof our core operating results.
Most of the net income or loss of consolidated entities attributable to non-controlling interests relates to the 90% limited partnerinterests held by third parties in our consolidated venture capital fund. We own a 10% limited partner interest in the fund. Becausewe are the general partner of the venture capital fund and are deemed to have a controlling interest, U.S. GAAP requires us toconsolidate the financial results of the fund. However, recognizing 100% of the gains or losses in operating income while onlyretaining 10% is not reflective of our underlying financial results at the operating income level. As a result, we are excluding the90% limited partner interests we do not own from our adjusted operating income. Similarly, net income of joint ventures attribut-able to non-controlling interests, although not significant, is excluded because it does not reflect the economic interest attributableto AllianceBernstein.
Adjusted Operating MarginAdjusted operating margin allows us to monitor our financial performance and efficiency from period to period and to compare ourperformance to industry peers without the volatility noted above in our discussion of adjusted operating income. Adjusted operatingmargin is derived by dividing adjusted operating income by adjusted net revenues.
50 AllianceBernstein

Net Revenues
The following table summarizes the components of net revenues:Years Ended December 31, % Change
2012 2011 2010 2012-11 2011-10
(in millions)
Investment advisory and services fees:
Institutions:
Base fees $ 426.0 $ 600.2 $ 745.5 (29.0)% (19.5)%
Performance-based fees 59.3 16.0 18.7 271.1 (14.4)
485.3 616.2 764.2 (21.2) (19.4)
Retail:
Base fees 702.3 652.5 639.8 7.6 2.0
Performance-based fees 2.9 — 0.1 n/m (100.0)
705.2 652.5 639.9 8.1 2.0
Private Client:
Base fees 577.3 647.2 645.9 (10.8) 0.2
Performance-based fees 4.4 0.5 1.7 658.6 (66.8)
581.7 647.7 647.6 (10.2) —
Total:
Base fees 1,705.6 1,899.9 2,031.2 (10.2) (6.5)
Performance-based fees 66.6 16.5 20.5 302.6 (19.4)
1,772.2 1,916.4 2,051.7 (7.5) (6.6)
Bernstein research services 413.7 437.4 430.5 (5.4) 1.6
Distribution revenues 401.7 351.6 338.6 14.2 3.8
Dividend and interest income 21.3 21.5 22.9 (1.0) (6.1)
Investment gains (losses) 29.2 (82.1) (1.4) n/m n/m
Other revenues 101.8 107.6 109.8 (5.4) (2.0)
Total revenues 2,739.9 2,752.4 2,952.1 (0.5) (6.8)
Less: Interest expense 3.2 2.5 3.5 26.4 (28.1)
Net revenues $2,736.7 $2,749.9 $2,948.6 (0.5) (6.7)
Investment Advisory and Services FeesInvestment advisory and services fees are the largest component of our revenues. These fees are generally calculated as a percentageof the value of AUM as of a specified date, or as a percentage of the value of average AUM for the applicable billing period, andvary with the type of investment service, the size of account and the total amount of assets we manage for a particular client.Accordingly, fee income generally increases or decreases as AUM increase or decrease and is therefore affected by market apprecia-tion or depreciation, the addition of new client accounts or client contributions of additional assets to existing accounts, withdrawalsof assets from and termination of client accounts, purchases and redemptions of mutual fund shares, shifts of assets between accountsor products with different fee structures, and acquisitions. Our average basis points realized (investment advisory fees divided byaverage AUM) generally approximate 50 to 70 basis points for equity services, 25 to 45 basis points for fixed income services and 5to 15 basis points for other services. As such, a shift of client assets from active equity services toward fixed income services and/orother services results in a decline in revenues just as a shift of assets toward active equity services would increase revenues.
We calculate AUM using established fair valuation methodologies, including market-based valuation methods and fair valuationmethods. Market-based valuation methods include: last sale/settle prices from an exchange for actively-traded listed equities, optionsand futures; evaluated bid prices from recognized pricing vendors for fixed income, asset-backed or mortgage-backed issues; midprices from recognized pricing vendors and brokers for credit default swaps; and quoted bids or spreads from pricing vendors andbrokers for other derivative products. Fair valuation methods include discounted cash flow models, evaluation of assets versus
Annual Report 2012 51

liabilities or any other methodology that is validated and approved by our Valuation Committee. Fair valuation methods are usedonly where AUM cannot be valued using market-based valuation methods, such as in the case of private equity or illiquid securities.Investments utilizing fair value methods typically make up an insignificant amount of our total AUM. Market volatility has not hada significant effect on our ability to acquire market data and, accordingly, our ability to use market-based valuation methods.
The Valuation Committee, which is composed of senior officers and employees, is responsible for overseeing the pricing and valu-ation of all investments held in client and AllianceBernstein portfolios. The Valuation Committee has adopted a Statement of Pric-ing Policies describing principles and policies that apply to pricing and valuing investments held in these portfolios. We have alsoestablished a Pricing Group, which reports to the Valuation Committee. The Valuation Committee has delegated to the PricingGroup responsibility for overseeing the pricing process for all investments.
We sometimes charge our clients performance-based fees. In these situations, we charge a base advisory fee and are eligible to earnan additional performance-based fee or incentive allocation that is calculated as either a percentage of absolute investment results ora percentage of investment results in excess of a stated benchmark over a specified period of time. Some performance-based feesinclude a high-watermark provision, which generally provides that if a client account underperforms relative to its performancetarget (whether absolute or relative to a specified benchmark), it must gain back such underperformance before we can collectfuture performance-based fees. Therefore, if we fail to achieve our performance target for a particular period, we will not earn aperformance-based fee for that period and, for accounts with a high-watermark provision, our ability to earn future performance-based fees will be impaired. We are eligible to earn performance-based fees on approximately 8% of the assets we manage forinstitutional clients and approximately 3% of the assets we manage for private clients (in total, approximately 4% of our company-wide AUM). A majority of our hedge fund AUM is subject to high-watermarks and a significant majority of this AUM is below thehigh-watermarks. Accordingly, it is very unlikely we will earn performance-based fees on these hedge funds in 2013 on the AUMbelow high-watermarks. If the percentage of our AUM subject to performance-based fees grows, seasonality and volatility of rev-enue and earnings are likely to become more significant.
Our investment advisory and services fees decreased $144.2 million, or 7.5%, in 2012, primarily due to a decrease in base fees of$194.3 million, or 10.2%, which primarily resulted from an 8.0% decrease in average AUM and a continued shift in product mixfrom Equities to Fixed Income and Other in our Institutional AUM, offset by a $50.1 million increase in performance-base fees.During 2012, we recorded a $39.6 million performance fee from PPIP ($18.0 million of which is payable to third party sub-advisors). Our investment advisory and services fees decreased $135.3 million, or 6.6%, in 2011, primarily due to a decrease of 4.8%in average AUM.
Institutional investment advisory and services fees decreased $130.9 million, or 21.2%, in 2012, due to a $174.2 million, or 29.0%,decrease in base fees, partly offset by a $43.3 million increase in performance-based fees (as a result of PPIP). The decrease in basefees was primarily due to a decrease in average AUM of 13.3% as well as a continued shift in product mix from Equities to FixedIncome. Average AUM for Equity services decreased 52.6% while average AUM for Fixed Income and Other products increased7.6% and 16.6%, respectively. Institutional investment advisory and services fees decreased $148.0 million, or 19.4%, in 2011, pri-marily due to a decrease in average AUM of 8.8% as well as a shift in product mix from Equities to Fixed Income products. Aver-age AUM for Equity services decreased 32.9% while average AUM for Fixed Income and Other services increased 7.1% and 63.2%,respectively.
Retail investment advisory and services fees increased $52.7 million, or 8.1%, in 2012, due to a 3.4% increase in average AUM. Theincrease in fees as compared to an increase in average AUM is primarily due to a shift in product mix towards long-term non-U.S.global fixed income mutual funds from long-term U.S. mutual funds and other Retail products and services, which generally havehigher fees as compared to long-term U.S. mutual funds and other Retail products and services. Retail investment advisory andservices fees increased $12.6 million, or 2.0%, in 2011, primarily due to a 1.0% increase in average AUM and the impact of sig-nificant net sales of long-term non-U.S. global fixed income mutual funds, which generally have higher fees as compared to long-term U.S. mutual funds.
Private Client investment advisory and services fees decreased $66.0 million, or 10.2%, in 2012, primarily as a result of a decline inbase fees of $69.9 million, or 10.8%, reflecting a decrease in average billable AUM of 8.5% and the impact of a shift in product mix
52 AllianceBernstein
from Equities to Other products. Private Client investment advisory and services fees increased by $0.1 million in 2011, primarily asa result of higher base fees of $1.3 million, reflecting an increase in average billable AUM of 1.4%, offset by $1.2 million in lowerperformance-based fees.
Bernstein Research ServicesBernstein Research Services revenue consists principally of equity commissions received for providing equity research andbrokerage-related services to institutional investors.
Revenues from Bernstein Research Services decreased $23.7 million, or 5.4%, in 2012. The decrease in 2012 was the result of asignificant decline in market trading volumes, partially offset by market share gains. Revenues from Bernstein Research Servicesincreased $6.9 million, or 1.6%, in 2011. The increase in 2011 was the result of higher trading commissions in Europe and Asia,partially offset by lower trading commissions in the U.S. During the fourth quarter of 2011, however, trading activity declinedsharply, which adversely affected our sell-side revenues.
Distribution RevenuesAllianceBernstein Investments and AllianceBernstein (Luxembourg) act as distributor and/or placing agent of company-sponsoredmutual funds and receive distribution services fees from certain of those funds as partial reimbursement of the distribution expensesthey incur. Period-over-period fluctuations of distribution revenues are typically in-line with fluctuations of the correspondingaverage AUM of these mutual funds.
Distribution revenues increased $50.1 million, or 14.2%, and $13.0 million, or 3.8%, in 2012 and 2011, respectively, while thecorresponding average AUM of these mutual funds grew 14.6% and 8.1%, respectively. Average AUM of non B-share and nonC-share mutual funds (which have lower distribution fee rates than B-share and C-share mutual funds) increased 18.3% and 12.0%,respectively, while average AUM of B-share and C-share mutual funds increased by 0.6% in 2012 and decreased by 5.9% in 2011.
During 2010, the SEC proposed a rule amendment that would significantly change and restrict the ability of U.S. mutual funds topay distribution and servicing fees (“12b-1 fees”) to financial services firms for distributing their shares. If rules are adopted asproposed, changes in existing 12b-1 fee arrangements for a number of share classes offered by company-sponsored mutual fundswould be required, which would reduce the net fund distribution revenues we receive from company-sponsored mutual funds. Theimpact of this rule change, which we do not anticipate being material, is dependent upon the final rules adopted by the SEC, anyphase-in or grandfathering period, and any other changes made with respect to share class distribution arrangements. For additionalinformation, see “Risk Factors” in Item 1A and “Cautions Regarding Forward-Looking Statements” in this Item 7.
Dividend and Interest Income and Interest ExpenseDividend and interest income consists primarily of investment income and interest earned on customer margin balances and U.S.Treasury Bills. Interest expense principally reflects interest accrued on cash balances in customers’ brokerage accounts. Dividend andinterest income, net of interest expense, decreased $0.9 million and $0.4 million, in 2012 and 2011, respectively.
Investment Gains (Losses)Investment gains (losses) consist of realized and unrealized investment gains or losses on: (i) employee long-term incentivecompensation-related investments, (ii) investments owned by our consolidated venture capital fund, (iii) U.S. Treasury Bills,(iv) market-making in cash equities and exchange-traded options and equities, (v) seed capital investments and (vi) derivatives.Investment gains (losses) also include realized gains or losses on the sale of seed capital investments classified as available-for-salesecurities and equity in earnings of proprietary investments in limited partnership hedge funds that we sponsor and manage.
Annual Report 2012 53

Investment gains (losses) are as follows:Years Ended December 31,
2012 2011 2010
(in millions)
Long-term incentive compensation-related investments
Realized gains (losses) $ 1.3 $ (8.3) $(12.0)
Unrealized gains (losses) 15.4 (12.0) 39.1
Consolidated private equity fund investments
Realized gains (losses) (17.0) (0.8) 21.2
Unrealized gains (losses) 18.2 (39.0) (39.6)
Seed capital investments
Realized gains (losses) (21.1) 15.8 (6.5)
Unrealized gains (losses) 39.2 (25.8) 8.9
Brokerage-related investments
Realized gains (losses) (4.8) (12.4) (13.4)
Unrealized gains (losses) (2.0) 0.4 0.9
$29.2 $(82.1) $ (1.4)
Realized gains or losses on long-term incentive compensation-related investments typically occur in December of each year, as wellas during the first quarter, as award tranches vest and related investments are sold to provide cash for payments to employees. Theunrealized gains during 2012 and 2010 reflect the favorable financial markets during those periods, while unrealized losses onemployee long-term incentive compensation-related investments during 2011 reflect unfavorable financial markets.
During 2012, the publicly-traded securities held by our consolidated private equity fund incurred realized losses compared to real-ized gains during 2011, while the non-public investments incurred realized losses during both periods. The fund incurred unrealizedmark-to-market gains relating to both its publicly-traded and non-public investments during 2012 compared to unrealized mark-to-market losses during 2011. Our consolidated private equity fund during 2011 incurred slightly higher mark-to-market losses relatingto privately-held securities held by the fund, offset by slightly lower mark-to-market losses relating to publicly-traded securities.Also, 2010 reflects gains on the sale of securities.
Our seed capital investments had unrealized gains in 2012 and 2010 as compared to unrealized losses in 2011. Offsetting these gainsand losses were realized losses in 2012 and 2010 as compared to realized gains in 2011, on our derivatives we use to hedge our seedcapital investments.
Other RevenuesOther revenues consist of fees earned for transfer agency services provided to company-sponsored mutual funds, fees earned foradministration and recordkeeping services provided to company-sponsored mutual funds and the general accounts of AXA and itssubsidiaries, and other miscellaneous revenues. Other revenues decreased 5.4% and 2.0% in 2012 and 2011, respectively, primarilydue to lower shareholder servicing fees.
54 AllianceBernstein
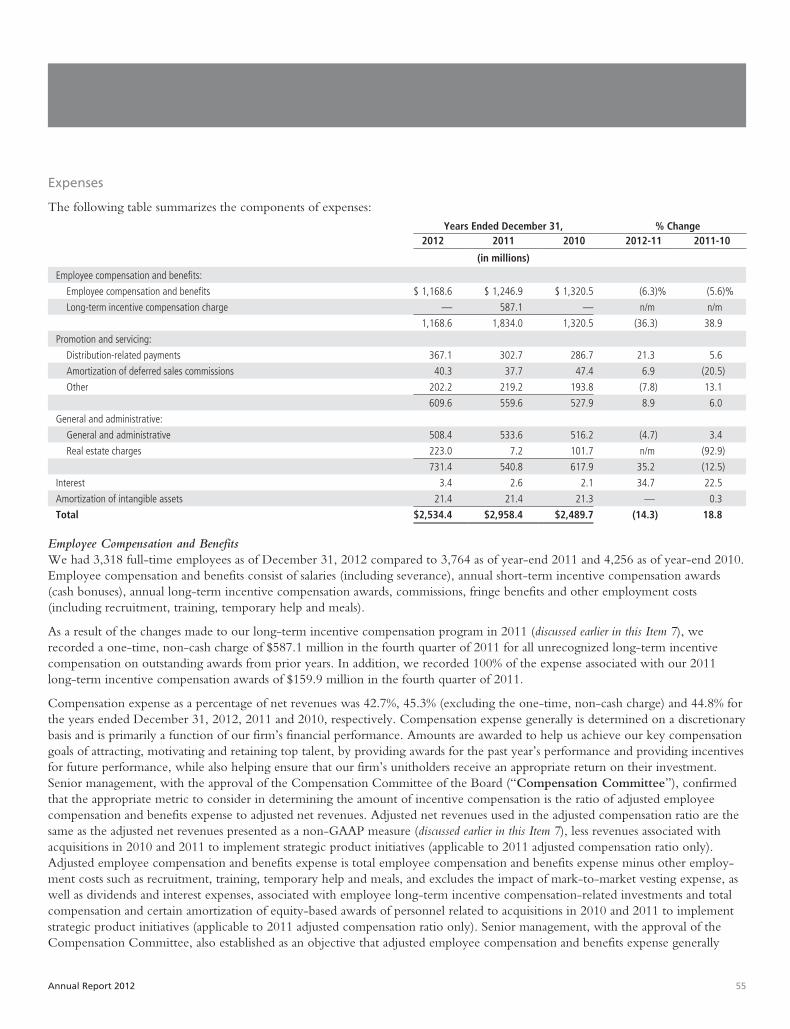
Expenses
The following table summarizes the components of expenses:Years Ended December 31, % Change
2012 2011 2010 2012-11 2011-10
(in millions)
Employee compensation and benefits:
Employee compensation and benefits $ 1,168.6 $ 1,246.9 $ 1,320.5 (6.3)% (5.6)%
Long-term incentive compensation charge — 587.1 — n/m n/m
1,168.6 1,834.0 1,320.5 (36.3) 38.9
Promotion and servicing:
Distribution-related payments 367.1 302.7 286.7 21.3 5.6
Amortization of deferred sales commissions 40.3 37.7 47.4 6.9 (20.5)
Other 202.2 219.2 193.8 (7.8) 13.1
609.6 559.6 527.9 8.9 6.0
General and administrative:
General and administrative 508.4 533.6 516.2 (4.7) 3.4
Real estate charges 223.0 7.2 101.7 n/m (92.9)
731.4 540.8 617.9 35.2 (12.5)
Interest 3.4 2.6 2.1 34.7 22.5
Amortization of intangible assets 21.4 21.4 21.3 — 0.3
Total $2,534.4 $2,958.4 $2,489.7 (14.3) 18.8
Employee Compensation and BenefitsWe had 3,318 full-time employees as of December 31, 2012 compared to 3,764 as of year-end 2011 and 4,256 as of year-end 2010.Employee compensation and benefits consist of salaries (including severance), annual short-term incentive compensation awards(cash bonuses), annual long-term incentive compensation awards, commissions, fringe benefits and other employment costs(including recruitment, training, temporary help and meals).
As a result of the changes made to our long-term incentive compensation program in 2011 (discussed earlier in this Item 7), werecorded a one-time, non-cash charge of $587.1 million in the fourth quarter of 2011 for all unrecognized long-term incentivecompensation on outstanding awards from prior years. In addition, we recorded 100% of the expense associated with our 2011long-term incentive compensation awards of $159.9 million in the fourth quarter of 2011.
Compensation expense as a percentage of net revenues was 42.7%, 45.3% (excluding the one-time, non-cash charge) and 44.8% forthe years ended December 31, 2012, 2011 and 2010, respectively. Compensation expense generally is determined on a discretionarybasis and is primarily a function of our firm’s financial performance. Amounts are awarded to help us achieve our key compensationgoals of attracting, motivating and retaining top talent, by providing awards for the past year’s performance and providing incentivesfor future performance, while also helping ensure that our firm’s unitholders receive an appropriate return on their investment.Senior management, with the approval of the Compensation Committee of the Board (“Compensation Committee”), confirmedthat the appropriate metric to consider in determining the amount of incentive compensation is the ratio of adjusted employeecompensation and benefits expense to adjusted net revenues. Adjusted net revenues used in the adjusted compensation ratio are thesame as the adjusted net revenues presented as a non-GAAP measure (discussed earlier in this Item 7), less revenues associated withacquisitions in 2010 and 2011 to implement strategic product initiatives (applicable to 2011 adjusted compensation ratio only).Adjusted employee compensation and benefits expense is total employee compensation and benefits expense minus other employ-ment costs such as recruitment, training, temporary help and meals, and excludes the impact of mark-to-market vesting expense, aswell as dividends and interest expenses, associated with employee long-term incentive compensation-related investments and totalcompensation and certain amortization of equity-based awards of personnel related to acquisitions in 2010 and 2011 to implementstrategic product initiatives (applicable to 2011 adjusted compensation ratio only). Senior management, with the approval of theCompensation Committee, also established as an objective that adjusted employee compensation and benefits expense generally
Annual Report 2012 55
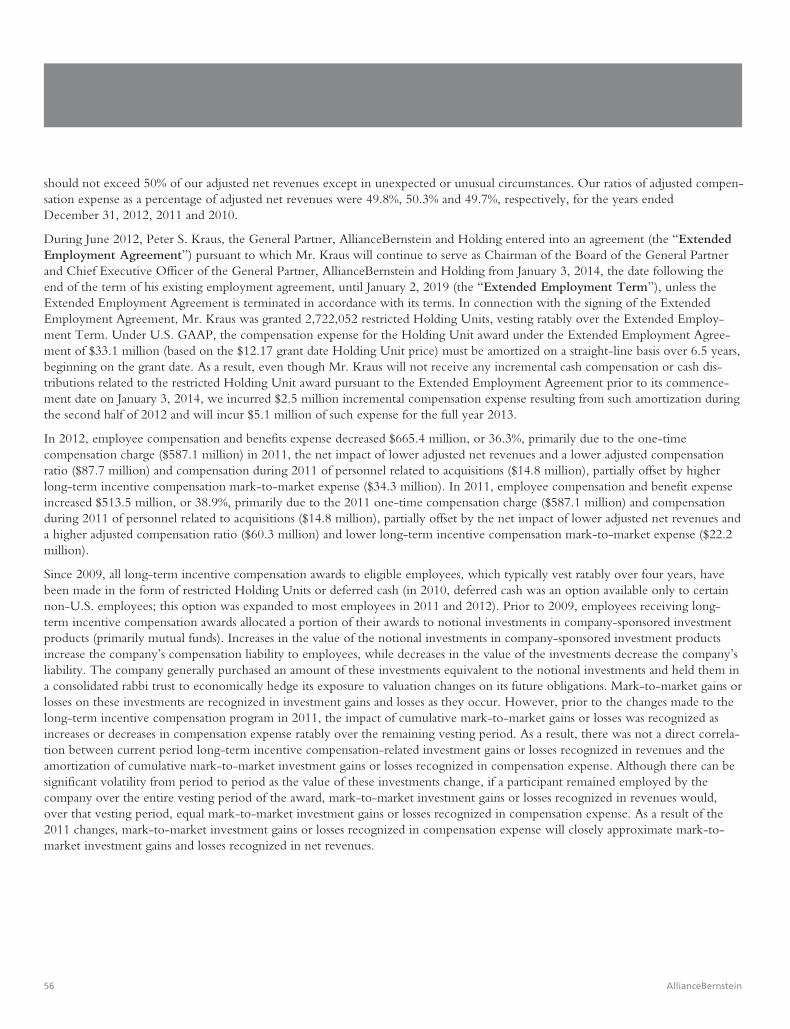
should not exceed 50% of our adjusted net revenues except in unexpected or unusual circumstances. Our ratios of adjusted compen-sation expense as a percentage of adjusted net revenues were 49.8%, 50.3% and 49.7%, respectively, for the years endedDecember 31, 2012, 2011 and 2010.
During June 2012, Peter S. Kraus, the General Partner, AllianceBernstein and Holding entered into an agreement (the “ExtendedEmployment Agreement”) pursuant to which Mr. Kraus will continue to serve as Chairman of the Board of the General Partnerand Chief Executive Officer of the General Partner, AllianceBernstein and Holding from January 3, 2014, the date following theend of the term of his existing employment agreement, until January 2, 2019 (the “Extended Employment Term”), unless theExtended Employment Agreement is terminated in accordance with its terms. In connection with the signing of the ExtendedEmployment Agreement, Mr. Kraus was granted 2,722,052 restricted Holding Units, vesting ratably over the Extended Employ-ment Term. Under U.S. GAAP, the compensation expense for the Holding Unit award under the Extended Employment Agree-ment of $33.1 million (based on the $12.17 grant date Holding Unit price) must be amortized on a straight-line basis over 6.5 years,beginning on the grant date. As a result, even though Mr. Kraus will not receive any incremental cash compensation or cash dis-tributions related to the restricted Holding Unit award pursuant to the Extended Employment Agreement prior to its commence-ment date on January 3, 2014, we incurred $2.5 million incremental compensation expense resulting from such amortization duringthe second half of 2012 and will incur $5.1 million of such expense for the full year 2013.
In 2012, employee compensation and benefits expense decreased $665.4 million, or 36.3%, primarily due to the one-timecompensation charge ($587.1 million) in 2011, the net impact of lower adjusted net revenues and a lower adjusted compensationratio ($87.7 million) and compensation during 2011 of personnel related to acquisitions ($14.8 million), partially offset by higherlong-term incentive compensation mark-to-market expense ($34.3 million). In 2011, employee compensation and benefit expenseincreased $513.5 million, or 38.9%, primarily due to the 2011 one-time compensation charge ($587.1 million) and compensationduring 2011 of personnel related to acquisitions ($14.8 million), partially offset by the net impact of lower adjusted net revenues anda higher adjusted compensation ratio ($60.3 million) and lower long-term incentive compensation mark-to-market expense ($22.2million).
Since 2009, all long-term incentive compensation awards to eligible employees, which typically vest ratably over four years, havebeen made in the form of restricted Holding Units or deferred cash (in 2010, deferred cash was an option available only to certainnon-U.S. employees; this option was expanded to most employees in 2011 and 2012). Prior to 2009, employees receiving long-term incentive compensation awards allocated a portion of their awards to notional investments in company-sponsored investmentproducts (primarily mutual funds). Increases in the value of the notional investments in company-sponsored investment productsincrease the company’s compensation liability to employees, while decreases in the value of the investments decrease the company’sliability. The company generally purchased an amount of these investments equivalent to the notional investments and held them ina consolidated rabbi trust to economically hedge its exposure to valuation changes on its future obligations. Mark-to-market gains orlosses on these investments are recognized in investment gains and losses as they occur. However, prior to the changes made to thelong-term incentive compensation program in 2011, the impact of cumulative mark-to-market gains or losses was recognized asincreases or decreases in compensation expense ratably over the remaining vesting period. As a result, there was not a direct correla-tion between current period long-term incentive compensation-related investment gains or losses recognized in revenues and theamortization of cumulative mark-to-market investment gains or losses recognized in compensation expense. Although there can besignificant volatility from period to period as the value of these investments change, if a participant remained employed by thecompany over the entire vesting period of the award, mark-to-market investment gains or losses recognized in revenues would,over that vesting period, equal mark-to-market investment gains or losses recognized in compensation expense. As a result of the2011 changes, mark-to-market investment gains or losses recognized in compensation expense will closely approximate mark-to-market investment gains and losses recognized in net revenues.
56 AllianceBernstein

The investment gains and losses on long-term incentive compensation-related investments recognized in net revenues as comparedto the amortization of long-term incentive compensation awards notionally invested in company-sponsored investment products areas follows:
Years Ended December 31,2012 2011 2010
(in millions)
Investment gains (losses) $16.7 $ (20.3) $ 27.1
Amortization of awards notionally invested in company-sponsored investments products:
Original award — 105.0 119.7
Prior periods’ mark-to-market — 18.0 (12.0)
Current period mark-to-market 14.9 (19.4) 14.8
Total 14.9 103.6 122.5
Net operating income impact $ 1.8 $(123.9) $(95.4)
Promotion and ServicingPromotion and servicing expenses include distribution-related payments to financial intermediaries for distribution ofAllianceBernstein mutual funds and amortization of deferred sales commissions paid to financial intermediaries for the sale of back-end load shares of AllianceBernstein mutual funds. Also included in this expense category are costs related to travel and entertain-ment, advertising and promotional materials.
Promotion and servicing expenses increased $50.0 million, or 8.9%, in 2012. The increase reflects higher distribution-related pay-ments of $64.4 million, or 21.3%, higher amortization of deferred sales commissions of $2.6 million and higher marketing andadvertising costs of $2.7 million, partially offset by lower travel and entertainment of $11.4 million, lower trade execution of $5.0million and lower transfer fees of $4.5 million all due to the prior year’s increased business activity and new product launches.Promotion and servicing expenses increased $31.7 million, or 6.0%, in 2011. The increase reflects higher distribution-related pay-ments of $16.0 million, or 5.6%, higher travel and entertainment of $8.1 million, higher trade and execution and clearing costs of$8.1 million and higher transfer fees of $6.3 million, all attributable to increased business activity and new product launches. Theseincreases were partially offset by a decrease in amortization of deferred sales commissions of $9.7 million. The increases indistribution-related payments in both 2012 and 2011 were generally in line with the 14.2% and 3.8% increases in distribution rev-enues, respectively, as well as higher broker-related distribution costs each year as compared to prior year costs.
General and AdministrativeGeneral and administrative expenses include technology, professional fees, occupancy, communications and similar expenses. Generaland administrative expenses as a percentage of net revenues were 26.7% (18.6% excluding real estate charges), 19.7% (19.4% excludingreal estate charges) and 21.0% (17.5% excluding real estate charges) for the years ended December 31, 2012, 2011 and 2010,respectively. General and administrative expenses increased $190.6 million, or 35.2%, in 2012, primarily due to higher real estatecharges of $215.8 million, higher portfolio services expenses of $18.6 million (primarily due to PPIP sub-advisor payments) and higherlegal expenses of $15.6 million (primarily due to our receipt of insurance proceeds of $10.7 million in 2011), partially offset by loweroffice and related expenses of $32.8 million (excluding real estate charges), lower technology expenses of $13.7 million and a cashreceipt of $6.5 million in 2012 relating to the finalization of a claims processing contingency originally recorded in 2006. General andadministrative expenses decreased $77.1 million, or 12.5%, in 2011, primarily due to lower real estate charges of $94.5 million, partiallyoffset by higher portfolio services expenses of $9.8 million (including market data services and sub-advisory fees).
Income Taxes
AllianceBernstein, a private limited partnership, is not subject to federal or state corporate income taxes, but we are subject to theNew York City unincorporated business tax (“UBT”). Our domestic corporate subsidiaries are subject to federal, state and localincome taxes, and are generally included in the filing of a consolidated federal income tax return. Separate state and local incometax returns are also filed. Foreign corporate subsidiaries are generally subject to taxes in the jurisdictions where they are located.
Annual Report 2012 57

Income tax expense increased $10.6 million, or 344.3%, in 2012 compared to 2011. The increase was primarily due to higher oper-ating income in 2012 (in large part due to the 2011 compensation charge offset by the 2012 real estate charges), partially offset bythe UBT tax benefit recorded in the third quarter of 2012 ($5.7 million). In the third quarter of 2012, application of the New YorkCity tax law that sources various types of receipts from services performed by registered brokers and dealers of securities and com-modities for purposes of apportioning income resulted in a reduction of our rate of tax for 2012 and to the rate of tax that weexpect to pay in the future. As a result, we recognized a $5.7 million tax benefit in the third quarter of 2012 relating to our full year2011 and nine months 2012 UBT.
Income tax expense decreased $35.4 million, or 92.0%, in 2011 compared to 2010. Prior to the fourth quarter 2011 compensationcharge of $587.1 million, our estimate of our full-year 2011 effective tax rate was 7.1%. As a result of the compensation charge, aswell as the immediate recognition of the 2011 long-term incentive compensation awards, we had a fourth quarter 2011 effective taxrate of 3.8% (pre-tax loss of $540.2 million and income tax benefit of $20.3 million, that resulted in a full-year 2011 pre-tax loss of$208.5 million and income tax expense of $3.1 million). The compensation charge resulted in a one-time change to the historicalmix of business between AllianceBernstein, which incurs a 4.0% UBT, and its corporate subsidiaries that incur corporate levelincome taxes. In addition, the recorded tax benefit associated with the future deliveries of vested Holding Units was based on thecurrent market value in most jurisdictions, which was lower than the grant price of the awards included in the compensationcharge. Both contributed to us incurring tax expense of $3.1 million rather than a benefit at the full-year estimated effective taxrate of 7.1%.
Net Income (Loss) in Consolidated Entities Attributable to Non-Controlling Interests
Net income (loss) of consolidated entities attributable to non-controlling interests consists of limited partner interests owned byother investors representing 90% of the total limited partner interests in our consolidated venture capital fund. It also included the50% interest owned by AXA and its subsidiaries in our consolidated joint venture in Australia through March 31, 2011, when wepurchased the remaining 50% interest in the Australian joint venture for $21.4 million. In 2012, we had a $0.3 million net loss ofconsolidated entities attributable to non-controlling interests, due primarily to a $1.2 million net investment gain attributable to ourconsolidated venture capital fund (of which 90% belongs to non-controlling interests) and management fees of $1.5 million. In2011, we had a $36.8 million net loss of consolidated entities attributable to non-controlling interests, due primarily to a $39.8 mil-lion net investment loss attributable to our consolidated venture capital fund.
Capital Resources and Liquidity
During 2012, net cash provided by operating activities was $684.0 million, compared to $578.2 million during 2011. The changewas primarily due to lower net purchases of investments of $247.5 million, primarily related to broker-dealer investments and seedcapital investments, and lower broker-dealer related net receivables and segregated U.S. Treasury Bills of $80.4 million, partiallyoffset by lower cash provided by net income of $103.6 million and increases in fees receivable and deferred sales commissions.During 2011, net cash provided by operating activities was $578.2 million, compared with $830.1 million during 2010. The changewas primarily due to an increase in seed investments and a decrease in accounts payable and accrued expenses.
During 2012, net cash used in investing activities was $18.3 million, compared to $76.7 million during 2011. The change was pri-marily due to the three acquisitions we made during 2011. In addition, our net additions to furniture, equipment and leaseholdimprovements decreased $19.3 million in 2012 as compared to 2011. During 2011, net cash used in investing activities was $76.7million, compared to $33.5 million during 2010. During 2011, we made three acquisitions for $41.8 million compared to our 2010acquisition for $14.3 million. In addition, our net additions to furniture, equipment and leasehold improvement also increased $14.8million in 2011 as compared to 2010.
During 2012, net cash used in financing activities was $682.2 million, compared to $512.2 million during 2011. The increasereflects commercial paper net payments of $123.3 million in 2012 compared to $219.4 million of net issuances during 2011, offsetby lower distributions to the General Partner and unitholders of $155.0 million as a result of lower earnings (distributions on earn-ings are paid one quarter in arrears) and changes in overdrafts payable of $38.4 million. During 2011, net cash used in financing
58 AllianceBernstein

activities was $512.2 million, compared to $760.6 million during 2010. The decrease reflects net issuance of commercial paper of$219.4 million in 2011 compared to net repayment of commercial paper of $24.2 million in 2010 and lower distributions to theGeneral Partner and unitholders of $18.6 million as a result of lower earnings (distributions on earnings are paid one quarter inarrears), offset by changes in overdrafts payable of $53.9 million.
As of December 31, 2012, AllianceBernstein had $627.2 million of cash and cash equivalents, all of which is available for liquidity,but is comprised primarily of cash on deposit for our broker-dealers to comply with various customer clearing activities and cashheld by foreign entities for which a permanent investment assertion for U.S. tax purposes is taken. If the cash held at our foreignsubsidiaries of $305.4 million, which includes cash on deposit for our foreign broker-dealers, was to be repatriated to the U.S., wewould be required to accrue and pay U.S. income taxes on these funds, based on the unremitted amount. Our intent is to perma-nently reinvest these earnings outside the U.S. We currently do not anticipate a liquidity need requiring a repatriation of these fundsto the U.S.
Debt and Credit FacilitiesAs of December 31, 2012 and 2011, AllianceBernstein had $323.2 million and $444.9 million, respectively, in commercial paperoutstanding with weighted average interest rates of approximately 0.5% and 0.2%, respectively. The commercial paper is short termin nature, and as such, recorded value is estimated to approximate fair value. Average daily borrowings of commercial paper during2012 and 2011 were $404.9 million and $273.6 million, respectively, with weighted average interest rates of approximately 0.4%and 0.2%, respectively.
AllianceBernstein has a $1.0 billion committed, unsecured senior revolving credit facility (the “Credit Facility”) with a group ofcommercial banks and other lenders, which matures on January 17, 2017. The Credit Facility provides for possible increases in theprincipal amount by up to an aggregate incremental amount of $250 million, any such increase being subject to the consent of theaffected lenders. The Credit Facility is available for AllianceBernstein’s and SCB LLC’s business purposes, including the support ofAllianceBernstein’s $1.0 billion commercial paper program. Both AllianceBernstein and SCB LLC can draw directly under theCredit Facility and management expects to draw on the Credit Facility from time to time. AllianceBernstein has agreed to guaranteethe obligations of SCB LLC under the Credit Facility.
The Credit Facility contains affirmative, negative and financial covenants, which are customary for facilities of this type, including,among other things, restrictions on dispositions of assets, restrictions on liens, a minimum interest coverage ratio and a maximumleverage ratio. We are in compliance with these covenants. The Credit Facility also includes customary events of default (with cus-tomary grace periods, as applicable), including provisions under which, upon the occurrence of an event of default, all outstandingloans may be accelerated and/or lender’s commitments may be terminated. Also, under such provisions, upon the occurrence ofcertain insolvency- or bankruptcy-related events of default, all amounts payable under the Credit Facility would automaticallybecome immediately due and payable, and the lender’s commitments would automatically terminate.
Amounts under the Credit Facility may be borrowed, repaid and re-borrowed by us from time to time until the maturity of thefacility. Voluntary prepayments and commitment reductions requested by us are permitted at any time without fee (other than cus-tomary breakage costs relating to the prepayment of any drawn loans) upon proper notice and subject to a minimum dollarrequirement. Borrowings under the Credit Facility bear interest at a rate per annum, which will be, at our option, a rate equal to anapplicable margin, which is subject to adjustment based on the credit ratings of AllianceBernstein, plus one of the following indexes:London Interbank Offered Rate; a floating base rate; or the Federal Funds rate.
As of December 31, 2012 and 2011, we had no amounts outstanding under the Credit Facility. During 2012, we did not drawupon the Credit Facility. During 2011, $40.0 million was outstanding for one day in February (with an interest rate of 1.3%) result-ing in average daily borrowings of $0.1 million under the Credit Facility.
In addition, SCB LLC has five uncommitted lines of credit with four financial institutions. Two of these lines of credit permit us toborrow up to an aggregate of approximately $200.0 million while three lines have no stated limit.
As of December 31, 2012 and 2011, we had no uncommitted bank loans outstanding. Average daily borrowings of uncommittedbank loans during 2012 and 2011 were $18.1 million and $6.4 million, respectively, with weighted average interest rates of
Annual Report 2012 59

approximately 1.3% for both years. In May 2012, AllianceBernstein was named an additional borrower under a $100.0 million SCBuncommitted line of credit. As of December 31, 2012, AllianceBernstein had no loans outstanding. During 2012, $5.0 million wasoutstanding for one day with an interest rate of 1.4%. In January 2013, AllianceBernstein was named an additional borrower on asecond $100.0 million SCB uncommitted line of credit.
Our financial condition and access to public and private debt markets should provide adequate liquidity for our general businessneeds. Management believes that cash flow from operations and the issuance of debt and AllianceBernstein Units or Holding Unitswill provide us with the resources necessary to meet our financial obligations. See “Risk Factors” in Item 1A and “Cautions RegardingForward-Looking Statements” in this Item 7 for a discussion of credit markets and our ability to renew our credit facilities at expiration.
Off-Balance Sheet Arrangements and Aggregate Contractual Obligations
We have no off-balance sheet arrangements other than the guarantees and contractual obligations that are discussed below.
GuaranteesUnder various circumstances, AllianceBernstein guarantees the obligations of its consolidated subsidiaries.
AllianceBernstein maintains a guarantee in connection with the $1.0 billion Credit Facility. If SCB LLC is unable to meet its obliga-tions, AllianceBernstein will pay the obligations when due or on demand. In addition, AllianceBernstein maintains guarantees total-ing $400 million for three of SCB LLC’s uncommitted lines of credit.
AllianceBernstein maintains a guarantee with a commercial bank, under which we guarantee the obligations in the ordinary courseof business of SCBL. We also maintain three additional guarantees with other commercial banks, under which we guaranteeapproximately $430 million of obligations for SCBL. In the event SCBL is unable to meet its obligations, AllianceBernstein will paythe obligations when due or on demand.
We also have three smaller guarantees with a commercial bank totaling approximately $3 million, under which we guarantee certainobligations in the ordinary course of business of two foreign subsidiaries.
We have not been required to perform under any of the above agreements and currently have no liability in connection with theseagreements.
Aggregate Contractual ObligationsThe following table summarizes our contractual obligations as of December 31, 2012:
Payments Due by Period
TotalLess than
1 Year 1-3 Years 3-5 YearsMore than
5 Years
(in millions)
Commercial paper $ 323.2 $ 323.2 $ — $ — $ —
Operating leases, net of sublease commitments 1,511.1 117.1 223.4 223.3 947.3
Funding commitments 28.7 5.4 23.3 — —
Accrued compensation and benefits 449.0 207.4 181.5 31.2 28.9
Unrecognized tax benefits 3.7 0.8 1.9 1.0 —
Total $2,315.7 $653.9 $430.1 $255.5 $976.2
During 2009, we entered into a subscription agreement under which we committed to invest up to $35 million, as amended in 2011,in a venture capital fund over a six-year period. As of December 31, 2012, we have funded $22.8 million of this commitment.
During 2010, as general partner of the AllianceBernstein U.S. Real Estate L.P. Fund, we committed to invest $25 million in theReal Estate Fund. As of December 31, 2012, we had funded $8.7 million of this commitment.
During 2012, we entered into an investment agreement under which we committed to invest up to $8 million in an oil and gasfund over a three-year period. As of December 31, 2012, we had funded $7.8 million of this commitment.
60 AllianceBernstein

Accrued compensation and benefits amounts in the table above exclude our accrued pension obligation. Offsetting our accruedcompensation obligations are long-term incentive compensation-related investments and money market investments we fundedtotaling $132.9 million, which are included in our consolidated statement of financial condition. Any amounts reflected on theconsolidated statement of financial condition as payables (to broker-dealers, brokerage clients and company-sponsored mutual funds)and accounts payable and accrued expenses are excluded from the table above.
We expect to make contributions to our qualified profit sharing plan of approximately $14 million in each of the next four years.We currently estimate that we will contribute $4.0 million to the Retirement Plan during 2013.
Contingencies
See Note 13 to AllianceBernstein’s consolidated financial statements in Item 8 for a discussion of our commitments and contingencies.
Critical Accounting Estimates
The preparation of the consolidated financial statements and notes to consolidated financial statements requires management tomake estimates and judgments that affect the reported amounts of assets, liabilities, revenues and expenses.
Management believes that the critical accounting policies and estimates discussed below involve significant management judgmentdue to the sensitivity of the methods and assumptions used.
Variable Interest EntitiesIn accordance with ASU 2009-17, Consolidations (Topic 810)—Improvements to Financial Reporting by Enterprises Involved with VariableInterest Entities, the determination of whether a company is required to consolidate an entity is based on, among other things, anentity’s purpose and design, a company’s ability to direct the activities of the entity that most significantly impact the entity’s eco-nomic performance, and whether a company is obligated to absorb losses or receive benefits that could potentially be significant tothe entity. The standard also requires ongoing assessments of whether a company is the primary beneficiary of a variable interestentity (“VIE”).
Significant judgment is required in the determination of whether we are the primary beneficiary of a VIE. If we, together with ourrelated party relationships, are determined to be the primary beneficiary of a VIE, the entity will be consolidated within our con-solidated financial statements. In order to determine whether we are the primary beneficiary of a VIE, management must make sig-nificant estimates and assumptions of probable future cash flows and assign probabilities to different cash flow scenarios. Assumptionsmade in such analyses include, but are not limited to, market prices of securities, market interest rates, potential credit defaults onindividual securities or default rates on a portfolio of securities, gain realization, liquidity or marketability of certain securities, dis-count rates and the probability of certain other outcomes.
GoodwillAs of December 31, 2012, goodwill of $3.0 billion on the consolidated statement of financial condition included $2.8 billion as aresult of the Bernstein Transaction and $154 million in regard to various smaller acquisitions. We have determined thatAllianceBernstein has only one reporting segment and reporting unit.
We test our goodwill annually, as of September 30, for impairment. As of September 30, 2012, the impairment test indicated thatgoodwill was not impaired. The carrying value of goodwill is also reviewed if facts and circumstances occur that suggest possibleimpairment, such as significant declines in AUM, revenues, earnings or the price of a Holding Unit.
The impairment test is a two-step process. The first step of the goodwill impairment test is used to identify potential impairment bycomparing the fair value of AllianceBernstein, the reporting unit, with its carrying value, including goodwill. If the fair value of thereporting unit exceeds its carrying value, goodwill is considered not impaired and the second step of the impairment test is not per-formed. However, if the carrying value of the reporting unit exceeds its fair value, the second step of the goodwill impairment testis performed to measure the amount of impairment loss, if any. The second step compares the implied fair value of the reportingunit to the aggregated fair values of its individual assets and liabilities to determine the amount of impairment, if any.
Annual Report 2012 61
As of September 30, 2012, AllianceBernstein estimated its fair value under both the market approach and income approach. Thetypes of assumptions and methodologies used under both approaches were consistent with those used in impairment tests performedin prior periods. Under the market approach, the fair value of the reporting unit was based on its unadjusted market valuation(AllianceBernstein Units outstanding multiplied by the price of a Holding Unit) and adjusted market valuations assuming a controlpremium and earnings multiples. The price of a publicly-traded AllianceBernstein Holding Unit serves as a reasonable starting pointfor valuing an AllianceBernstein Unit because each represents the same fractional interest in our underlying business. On anunadjusted basis, AllianceBernstein’s fair value per unit as of September 30, 2012 was $15.41 (the price of a Holding Unit as of thatdate) as compared to its carrying value, or book value, of $14.09 per unit. Also under the market approach, we typically assume acontrol premium of 10% - 20% for the reporting unit, which was determined based on an analysis of control premiums for relevantrecent acquisitions, as well as comparable industry earnings multiples applied to our current earnings forecast. A control premiumwas not needed in the analysis for fair value to exceed carrying value. Under the income approach, the fair value of the reportingunit was based on the present value of estimated future cash flows. Determining estimated fair value using a discounted cash flowvaluation technique consists of applying business growth rate assumptions over the estimated life of the goodwill asset and then dis-counting the resulting expected cash flows using an estimated weighted average cost of capital of market participants to arrive at apresent value amount that approximates fair value. In our tests, our discounted expected cash flow model uses management’s currentfive-year business plan, which factored in current market conditions and all material events that had impacted, or that we believed atthe time could potentially impact, future expected cash flows and a declining annual growth rate thereafter for three years beforeusing a terminal value growth rate. We ran multiple discounted cash flow analyses under several scenarios. We used a weightedaverage cost of equity ranging from 7% to 10% as the discount rate. We used a cost of equity rate, as opposed to a cost of capital,due to using net income in our expected cash flow model (as a result of generally distributing 100% of our earnings). The cost ofdebt is already factored into the net income projections. We used terminal value growth rates ranging from 2% to 4% and we usedour business plan growth rates as a base case and at stressed levels approximately 50% lower, as a result of current economicuncertainty and market dynamics.
Management considered the results of the market approach and income approach analysis performed along with a number of otherfactors (including current market conditions) and has determined that AllianceBernstein’s fair value exceeded its carrying value as ofSeptember 30, 2012 by approximately 9% using the market approach (excluding any control premium), and by more than 50%using the income approach (using the most stressed scenarios). As such, no goodwill impairment existed and the second step of thegoodwill impairment test was not required.
As a result of increased economic uncertainty and current market dynamics, determining whether an impairment of the goodwillasset exists requires management to exercise significant judgment. In addition, to the extent that securities valuations are depressedfor prolonged periods of time and market conditions worsen, or if we experience significant net redemptions, our AUM, revenues,profitability and unit price may be adversely affected. Although the price of a Holding Unit is just one factor in the calculation offair value, if current Holding Unit price levels decline significantly, reaching the conclusion that fair value exceeds carrying valuewill, over time, become more difficult. In addition, control premiums, industry earnings multiples and discount rates are impactedby economic conditions. As a result, subsequent impairment tests may occur more frequently and be based on more negativeassumptions and future cash flow projections, and may result in an impairment of goodwill. Any impairment could reduce materi-ally the recorded amount of this asset, with a corresponding charge to our earnings.
Real Estate ChargesDuring 2010 and 2012, we performed comprehensive reviews of our office real estate requirements and determined to consolidateoffice space and sub-lease the excess office space. As a result, we recorded real estate charges that reflect the net present value of thedifference between the amount of our on-going contractual lease obligations for the vacated floors and our estimate of currentmarket rental rates for such floors. The charges we recorded were based on current assumptions at the time of the charges regardingsublease marketing periods, costs to prepare the properties to market, market rental rates, broker commissions and subtenant allow-ances/incentives, all of which are factors largely beyond our control. If our assumptions prove to be incorrect, we may need torecord additional charges or reduce previously recorded charges.
62 AllianceBernstein
Retirement PlanWe maintain a qualified, noncontributory, defined benefit retirement plan covering current and former employees who wereemployed by the company in the United States prior to October 2, 2000. Service and compensation after December 31, 2008 arenot taken into account in determining participants’ retirement benefits. The amounts recognized in the consolidated financialstatements related to the retirement plan are determined from actuarial valuations. Inherent in these valuations are assumptions,including expected return on plan assets, discount rates at which liabilities could be settled, rates of annual salary increases and mor-tality rates. The assumptions are reviewed annually and may be updated to reflect the current environment. Key assumptions aredescribed in Note 16 to AllianceBernstein’s consolidated financial statements in Item 8. In accordance with U.S. generally accepted account-ing principles, actual results that differ from those assumed are accumulated and amortized over future periods and, therefore, affectexpense recognized and liabilities recorded in future periods.
In developing the expected long-term rate of return on plan assets of 8.0%, we considered the historical returns and future expect-ations for returns for each asset category, as well as the target asset allocation of the portfolio. The expected long-term rate of returnon assets is based on weighted average expected returns for each asset class. We assumed a target allocation weighting of 50% to 70%for equity securities, 20% to 40% for debt securities, and 0% to 10% for real estate investment trusts. Exposure of the total portfolioto cash equivalents on average should not exceed 5% of the portfolio’s value on a market value basis. The plan seeks to provide arate of return that exceeds applicable benchmarks over rolling five-year periods. The benchmark for the plan’s large cap domesticequity investment strategy is the S&P 500 Index; the small cap domestic equity investment strategy is measured against the Russell2000 Index; the international equity investment strategy is measured against the MSCI EAFE Index; and the fixed income invest-ment strategy is measured against the Barclays Aggregate Bond Index. The actual rates of return on plan assets were 12.5%, (9.3)%and 9.8% in 2012, 2011 and 2010, respectively. A 25 basis point adjustment, up or down, in the expected long-term rate of returnon plan assets would have decreased or increased the 2012 net pension expense of $0.4 million by approximately $0.2 million.
The objective of our discount rate assumption was to reflect the rate at which our pension obligations could be effectively settled.In making this determination, we considered the timing and amount of benefits that would be payable under the plan’s lump sumoption. Our methodology for selecting the discount rate as of December 31, 2012 and 2011 was to construct a hypothetical bondportfolio whose cash flow from coupons and maturities match the year-by-year, projected benefit cash flow from the plan. Theselection of the 4.4% and 5.1% discount rate as of December 31, 2012 and 2011, respectively, represents the Mercer HumanResources (“Mercer”) Bond Model (to the nearest five basis points). The discount rate as of December 31, 2011 was used indeveloping the 2012 net pension charge. A lower discount rate increases pension expense and the present value of benefit obliga-tions. A 25 basis point adjustment, up or down, in the discount rate (along with a corresponding adjustment in the assumed lumpsum interest rate) would have decreased or increased the 2012 net pension expense of $0.4 million by approximately $0.1 million.
Loss ContingenciesManagement continuously reviews with legal counsel the status of regulatory matters and pending or threatened litigation. Weevaluate the likelihood that a loss contingency exists and record a loss contingency if it is probable and reasonably estimable as of thedate of the financial statements. See Note 13 to AllianceBernstein’s consolidated financial statements in Item 8.
Accounting Pronouncements
See Note 24 to AllianceBernstein’s consolidated financial statements in Item 8.
Cautions Regarding Forward-Looking Statements
Certain statements provided by management in this report are “forward-looking statements” within the meaning of the PrivateSecurities Litigation Reform Act of 1995. Such forward-looking statements are subject to risks, uncertainties and other factors thatcould cause actual results to differ materially from future results expressed or implied by such forward-looking statements. The mostsignificant of these factors include, but are not limited to, the following: the performance of financial markets, the investment
Annual Report 2012 63

performance of sponsored investment products and separately-managed accounts, general economic conditions, industry trends,future acquisitions, competitive conditions and government regulations, including changes in tax regulations and rates and themanner in which the earnings of publicly-traded partnerships are taxed. We caution readers to carefully consider such factors. Fur-ther, such forward-looking statements speak only as of the date on which such statements are made; we undertake no obligation toupdate any forward-looking statements to reflect events or circumstances after the date of such statements. For further informationregarding these forward-looking statements and the factors that could cause actual results to differ, see “Risk Factors” in Item 1A. Anyor all of the forward-looking statements that we make in this Form 10-K, other documents we file with or furnish to the SEC, andany other public statements we issue, may turn out to be wrong. It is important to remember that other factors besides those listed in“Risk Factors” and those listed below could also adversely affect our revenues, financial condition, results of operations and businessprospects.
The forward-looking statements referred to in the preceding paragraph include statements regarding:
• Our belief that the cash flow Holding realizes from its investment in AllianceBernstein will provide Holding with the resources neces-sary to meet its financial obligations: Holding’s cash flow is dependent on the quarterly cash distributions it receives fromAllianceBernstein. Accordingly, Holding’s ability to meet its financial obligations is dependent on AllianceBernstein’s cash flowfrom its operations, which is subject to the performance of the capital markets and other factors beyond our control.
• Our financial condition and ability to issue public and private debt providing adequate liquidity for our general business needs: Ourfinancial condition is dependent on our cash flow from operations, which is subject to the performance of the capital markets,our ability to maintain and grow client assets under management and other factors beyond our control. Our ability to issuepublic and private debt on reasonable terms, as well as the market for such debt or equity, may be limited by adverse marketconditions, our firm’s long-term credit ratings, our profitability and changes in government regulations, including tax rates andinterest rates.
• The possible impairment of goodwill in the future: As a result of increased economic uncertainty and current market dynamics,determining whether an impairment of the goodwill asset exists requires management to exercise significant judgment. In addi-tion, to the extent that securities valuations are depressed for prolonged periods of time and market conditions worsen, or if weexperience significant net redemptions, our AUM, revenues, profitability and unit price may be adversely affected. Althoughthe price of a Holding Unit is just one factor in the calculation of fair value, if current Holding Unit price levels decline sig-nificantly, reaching the conclusion that fair value exceeds carrying value will, over time, become more difficult. As a result,subsequent impairment tests may occur more frequently and be based on more negative assumptions and future cash flow pro-jections, and may result in an impairment of goodwill. Any impairment could reduce materially the recorded amount of thisasset, with a corresponding charge to our earnings.
• The outcome of litigation: Litigation is inherently unpredictable, and excessive damage awards do occur. Though we have statedthat we do not expect certain legal proceedings to have a material adverse effect on our results of operations or financial con-dition, any settlement or judgment with respect to a legal proceeding could be significant, and could have such an effect.
• Our anticipation that the proposed 12b-1 fee-related rule changes will not have a material effect on us: We cannot predict theimpact of this rule change, which is dependent upon the final rules adopted by the SEC, any phase-in or grandfathering period,and any other changes made with respect to share class distribution arrangements.
• Our intention to continue to engage in open market purchases of Holding Units to help fund anticipated obligations under ourincentive compensation award program: The number of Holding Units needed in future periods to make incentive compensationawards is dependent upon various factors, some of which are beyond our control, including the fluctuation in the price of aHolding Unit (NYSE: AB).
• Our determination that adjusted employee compensation expense should not exceed 50% of our adjusted net revenues: Aggregateemployee compensation reflects employee performance and competitive compensation levels. Fluctuations in our revenues and/or changes in competitive compensation levels could result in adjusted employee compensation expense being higher than 50%of our adjusted net revenues.
64 AllianceBernstein

• The pipeline of new institutional mandates not yet funded: Before they are funded, institutional mandates do not represent legallybinding commitments to fund and, accordingly, the possibility exists that not all mandates will be funded in the amounts and atthe times currently anticipated, or that mandates ultimately will not be funded.
• Our belief that our global space consolidation plan will be effective in meaningfully improving our cost structure and helping positionour firm for a stronger future: Any charges we record and our estimates of reduced occupancy expenses in future years are basedon our current assumptions regarding sublease marketing periods, costs to prepare the properties to market, market rental rates,broker commissions and subtenant allowances/incentives, all of which are factors largely beyond our control. If our assumptionsprove to be incorrect, we may be forced to record an additional charge and/or our estimated occupancy cost reduction may beless than we currently project.
Annual Report 2012 65
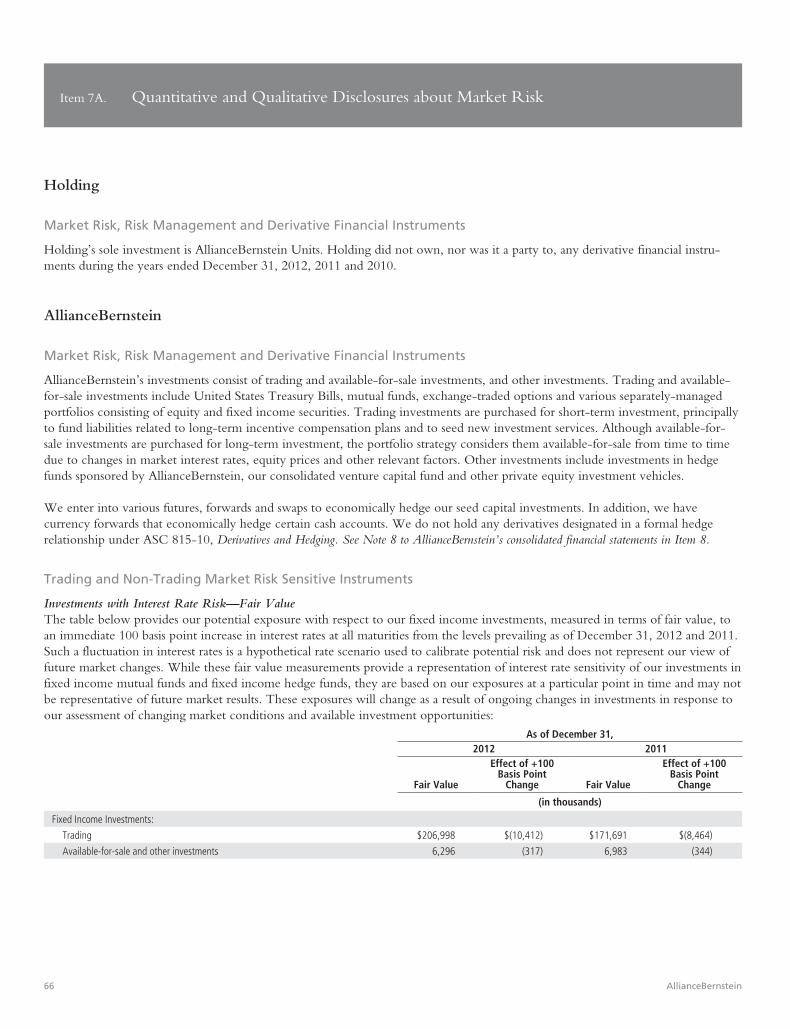
Item 7A. Quantitative and Qualitative Disclosures about Market Risk
Holding
Market Risk, Risk Management and Derivative Financial Instruments
Holding’s sole investment is AllianceBernstein Units. Holding did not own, nor was it a party to, any derivative financial instru-ments during the years ended December 31, 2012, 2011 and 2010.
AllianceBernstein
Market Risk, Risk Management and Derivative Financial Instruments
AllianceBernstein’s investments consist of trading and available-for-sale investments, and other investments. Trading and available-for-sale investments include United States Treasury Bills, mutual funds, exchange-traded options and various separately-managedportfolios consisting of equity and fixed income securities. Trading investments are purchased for short-term investment, principallyto fund liabilities related to long-term incentive compensation plans and to seed new investment services. Although available-for-sale investments are purchased for long-term investment, the portfolio strategy considers them available-for-sale from time to timedue to changes in market interest rates, equity prices and other relevant factors. Other investments include investments in hedgefunds sponsored by AllianceBernstein, our consolidated venture capital fund and other private equity investment vehicles.
We enter into various futures, forwards and swaps to economically hedge our seed capital investments. In addition, we havecurrency forwards that economically hedge certain cash accounts. We do not hold any derivatives designated in a formal hedgerelationship under ASC 815-10, Derivatives and Hedging. See Note 8 to AllianceBernstein’s consolidated financial statements in Item 8.
Trading and Non-Trading Market Risk Sensitive Instruments
Investments with Interest Rate Risk—Fair ValueThe table below provides our potential exposure with respect to our fixed income investments, measured in terms of fair value, toan immediate 100 basis point increase in interest rates at all maturities from the levels prevailing as of December 31, 2012 and 2011.Such a fluctuation in interest rates is a hypothetical rate scenario used to calibrate potential risk and does not represent our view offuture market changes. While these fair value measurements provide a representation of interest rate sensitivity of our investments infixed income mutual funds and fixed income hedge funds, they are based on our exposures at a particular point in time and may notbe representative of future market results. These exposures will change as a result of ongoing changes in investments in response toour assessment of changing market conditions and available investment opportunities:
As of December 31,2012 2011
Fair Value
Effect of +100Basis Point
Change Fair Value
Effect of +100Basis Point
Change
(in thousands)
Fixed Income Investments:
Trading $206,998 $(10,412) $171,691 $(8,464)
Available-for-sale and other investments 6,296 (317) 6,983 (344)
66 AllianceBernstein

Investments with Equity Price Risk—Fair ValueOur investments also include investments in equity securities, mutual funds and hedge funds. The following table provides our poten-tial exposure with respect to our equity investments, measured in terms of fair value, to an immediate 10% drop in equity prices fromthose prevailing as of December 31, 2012 and 2011. A 10% decrease in equity prices is a hypothetical scenario used to calibrate poten-tial risk and does not represent our view of future market changes. While these fair value measurements provide a representation ofequity price sensitivity of our investments in equity securities, mutual funds and hedge funds, they are based on our exposures at a par-ticular point in time and may not be representative of future market results. These exposures will change as a result of ongoing portfo-lio activities in response to our assessment of changing market conditions and available investment opportunities:
As of December 31,2012 2011
Fair Value
Effect of -10%Equity Price
Change Fair Value
Effect of -10%Equity Price
Change
(in thousands)
Equity Investments:
Trading $268,541 $(26,854) $339,308 $(33,931)
Available-for-sale and other investments 250,666 (25,067) 277,312 (27,731)
Annual Report 2012 67

Item 8. Financial Statements and Supplementary Data
Report of Independent Registered Public Accounting Firm
To the General Partner and Unitholders ofAllianceBernstein Holding L.P.:
In our opinion, the accompanying statements of financial condition and the related statements of income, comprehensive income,changes in partners’ capital and cash flows present fairly, in all material respects, the financial position of AllianceBernstein Holding L.P.(“AllianceBernstein Holding”) at December 31, 2012 and 2011, and the results of its operations and its cash flows for each of the threeyears in the period ended December 31, 2012 in conformity with accounting principles generally accepted in the United States ofAmerica. Also in our opinion, AllianceBernstein Holding maintained, in all material respects, effective internal control over financialreporting as of December 31, 2012, based on criteria established in Internal Control-Integrated Framework issued by the Committee ofSponsoring Organizations of the Treadway Commission (COSO). AllianceBernstein Holding’s management is responsible for thesefinancial statements, for maintaining effective internal control over financial reporting and for its assessment of the effectiveness ofinternal control over financial reporting, included in Management’s Report on Internal Control over Financial Reporting appearing underItem 9A. Our responsibility is to express opinions on these financial statements and on AllianceBernstein Holding’s internal controlover financial reporting based on our integrated audits. We conducted our audits in accordance with the standards of the Public Com-pany Accounting Oversight Board (United States). Those standards require that we plan and perform the audits to obtain reasonableassurance about whether the financial statements are free of material misstatement and whether effective internal control over financialreporting was maintained in all material respects. Our audits of the financial statements included examining, on a test basis, evidencesupporting the amounts and disclosures in the financial statements, assessing the accounting principles used and significant estimatesmade by management, and evaluating the overall financial statement presentation. Our audit of internal control over financial reportingincluded obtaining an understanding of internal control over financial reporting, assessing the risk that a material weakness exists, andtesting and evaluating the design and operating effectiveness of internal control based on the assessed risk. Our audits also includedperforming such other procedures as we considered necessary in the circumstances. We believe that our audits provide a reasonablebasis for our opinions.
A company’s internal control over financial reporting is a process designed to provide reasonable assurance regarding the reliabilityof financial reporting and the preparation of financial statements for external purposes in accordance with generally acceptedaccounting principles. A company’s internal control over financial reporting includes those policies and procedures that (i) pertain tothe maintenance of records that, in reasonable detail, accurately and fairly reflect the transactions and dispositions of the assets of thecompany; (ii) provide reasonable assurance that transactions are recorded as necessary to permit preparation of financial statements inaccordance with generally accepted accounting principles, and that receipts and expenditures of the company are being made onlyin accordance with authorizations of management and directors of the company; and (iii) provide reasonable assurance regardingprevention or timely detection of unauthorized acquisition, use, or disposition of the company’s assets that could have a materialeffect on the financial statements.
Because of its inherent limitations, internal control over financial reporting may not prevent or detect misstatements. Also, projec-tions of any evaluation of effectiveness to future periods are subject to the risk that controls may become inadequate because ofchanges in conditions, or that the degree of compliance with the policies or procedures may deteriorate.
/s/ PricewaterhouseCoopers LLPNew York, New YorkFebruary 12, 2013
68 AllianceBernstein
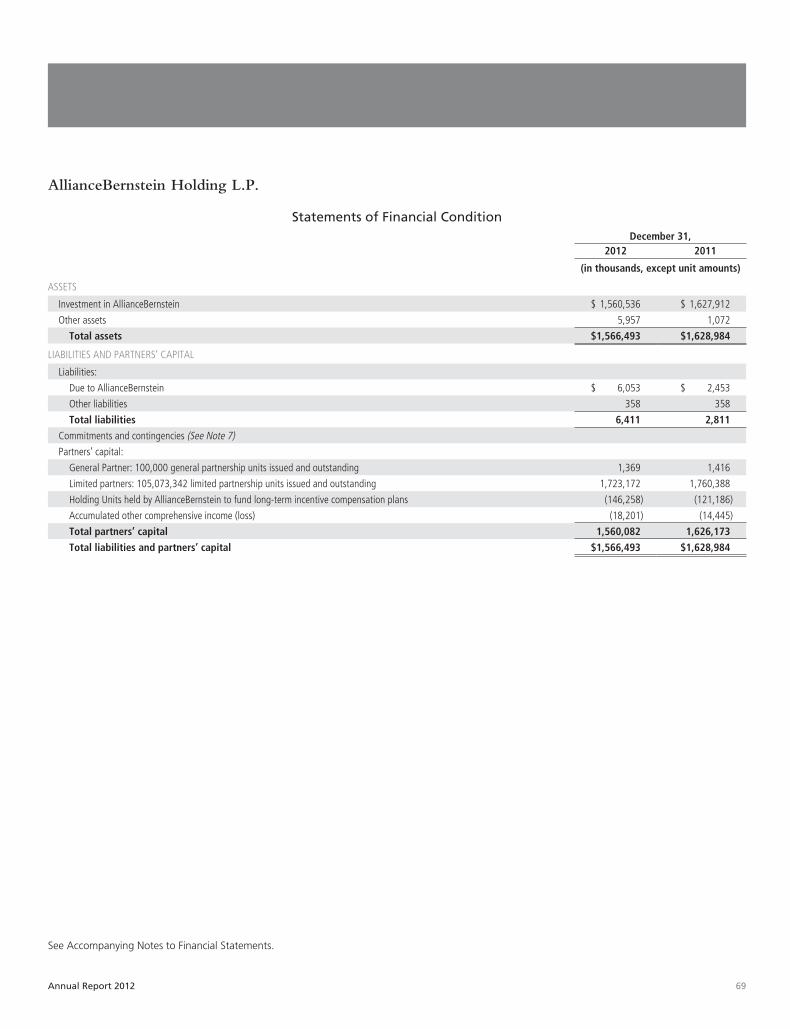
AllianceBernstein Holding L.P.
Statements of Financial ConditionDecember 31,
2012 2011
(in thousands, except unit amounts)
ASSETS
Investment in AllianceBernstein $ 1,560,536 $ 1,627,912
Other assets 5,957 1,072
Total assets $1,566,493 $1,628,984
LIABILITIES AND PARTNERS’ CAPITAL
Liabilities:
Due to AllianceBernstein $ 6,053 $ 2,453
Other liabilities 358 358
Total liabilities 6,411 2,811
Commitments and contingencies (See Note 7)
Partners’ capital:
General Partner: 100,000 general partnership units issued and outstanding 1,369 1,416
Limited partners: 105,073,342 limited partnership units issued and outstanding 1,723,172 1,760,388
Holding Units held by AllianceBernstein to fund long-term incentive compensation plans (146,258) (121,186)
Accumulated other comprehensive income (loss) (18,201) (14,445)
Total partners’ capital 1,560,082 1,626,173
Total liabilities and partners’ capital $1,566,493 $1,628,984
See Accompanying Notes to Financial Statements.
Annual Report 2012 69

AllianceBernstein Holding L.P.
Statements of IncomeYears Ended December 31,
2012 2011 2010
(in thousands, except per unit amounts)
Equity in net income (loss) attributable to AllianceBernstein Unitholders $ 70,807 $ (65,581) $ 162,217
Income taxes 19,722 27,687 28,059
Net income (loss) $51,085 $(93,268) $134,158
Net income (loss) per unit:
Basic $ 0.51 $ (0.90) $ 1.33
Diluted $ 0.51 $ (0.90) $ 1.32
See Accompanying Notes to Financial Statements.
70 AllianceBernstein

AllianceBernstein Holding L.P.
Statements of Comprehensive IncomeYears Ended December 31,
2012 2011 2010
(in thousands)
Net income (loss) $ 51,085 $ (93,268) $ 134,158
Other comprehensive income (loss):
Foreign currency translation adjustments (453) 3,510 96
Income tax benefit (expense) 296 (531) (243)
Foreign currency translation adjustments, net of tax (157) 2,979 (147)
Unrealized gains on investments:
Unrealized gains arising during period 516 73 257
Less: reclassification adjustments for gains (losses) included in net income 17 (13) 19
Changes in unrealized gains on investments 499 86 238
Income tax (expense) benefit (242) 62 (99)
Unrealized gains on investments, net of tax 257 148 139
Changes in employee benefit related items:
Amortization of transition asset (54) (53) (49)
Amortization of prior service cost 40 40 (316)
Recognized actuarial loss (gain) (3,792) (5,791) (3,585)
Changes in employee benefit related items (3,806) (5,804) (3,950)
Income tax (expense) benefit (50) 128 46
Employee benefit related items, net of tax (3,856) (5,676) (3,904)
Other comprehensive income (loss) (3,756) (2,549) (3,912)
Comprehensive income (loss) $47,329 $(95,817) $130,246
See Accompanying Notes to Financial Statements.
Annual Report 2012 71

AllianceBernstein Holding L.P.
Statements of Changes in Partners’ CapitalYears Ended December 31,
2012 2011 2010
(in thousands)
General Partner’s Capital
Balance, beginning of year $ 1,416 $ 1,648 $ 1,668
Net income (loss) 49 (88) 131
Cash distributions to unitholders (96) (144) (151)
Balance, end of year 1,369 1,416 1,648
Limited Partners’ Capital
Balance, beginning of year 1,760,388 1,997,642 1,927,991
Net income (loss) 51,036 (93,180) 134,027
Cash distributions to unitholders (88,252) (145,552) (151,208)
Issuance of Holding Units to fund long-term incentive compensation plan awards — — 78,545
Proceeds from exercise of compensatory options to buy Holding Units — 1,478 8,287
Balance, end of year 1,723,172 1,760,388 1,997,642
Holding Units held by AllianceBernstein to fund long-term incentive compensation plans
Balance, beginning of year (121,186) (200,284) (123,783)
Holding Units held by AllianceBernstein to fund long-term incentive compensation plans (25,072) 79,098 (76,501)
Balance, end of year (146,258) (121,186) (200,284)
Accumulated Other Comprehensive Income (Loss)
Balance, beginning of year (14,445) (11,896) (7,984)
Unrealized gain (loss) on investments, net of tax 256 149 139
Foreign currency translation adjustment, net of tax (157) 2,979 (147)
Changes in employee benefit related items, net of tax (3,855) (5,677) (3,904)
Balance, end of year (18,201) (14,445) (11,896)
Total Partners’ Capital $1,560,082 $1,626,173 $1,787,110
See Accompanying Notes to Financial Statements.
72 AllianceBernstein

AllianceBernstein Holding L.P.
Statements of Cash FlowsYears Ended December 31,
2012 2011 2010
(in thousands)
Cash flows from operating activities:
Net income (loss) $ 51,085 $ (93,268) $ 134,158
Adjustments to reconcile net income (loss) to net cash provided by operating activities:
Equity in net (income) loss attributable to AllianceBernstein Unitholders (70,807) 65,581 (162,217)
Cash distributions received from AllianceBernstein 120,950 178,757 182,410
Changes in assets and liabilities:
(Increase) decrease in other assets (4,885) (1,072) 10
Increase (decrease) in due to AllianceBernstein 3,600 1,525 (556)
(Decrease) in other liabilities — (100) (241)
Net cash provided by operating activities 99,943 151,423 153,564
Cash flows from investing activities:
Investments in AllianceBernstein from cash distributions paid to AllianceBernstein consolidated rabbi trust (11,595) (5,727) (2,205)
Investments in AllianceBernstein with proceeds from exercises of compensatory options to buy Holding Units — (1,478) (8,287)
Net cash used in investing activities (11,595) (7,205) (10,492)
Cash flows from financing activities:
Cash distributions to unitholders (88,348) (145,696) (151,359)
Proceeds from exercise of compensatory options to buy Holding Units — 1,478 8,287
Net cash used in financing activities (88,348) (144,218) (143,072)
Change in cash and cash equivalents — — —
Cash and cash equivalents as of beginning of the year — — —
Cash and cash equivalents as of end of the year $ — $ — $ —
Cash paid:
Income taxes $ 24,606 $ 28,854 $ 28,305
Non-cash investing activities:
Issuance of Holding Units to fund long-term incentive compensation plan awards — — 78,545
See Accompanying Notes to Financial Statements.
Annual Report 2012 73

AllianceBernstein Holding L.P.Notes to Financial Statements
The words “we” and “our” refer collectively to AllianceBernstein Holding L.P. (“Holding”) and AllianceBernstein L.P. and its subsidiaries(“AllianceBernstein”), or to their officers and employees. Similarly, the word “company” refers to both Holding and AllianceBernstein. Where thecontext requires distinguishing between Holding and AllianceBernstein, we identify which company is being discussed. Cross-references are in italics.
1. Business Description and Organization
Holding’s principal source of income and cash flow is attributable to its investment in AllianceBernstein limited partnership interests.
AllianceBernstein provides research, diversified investment management and related services globally to a broad range of clients. Itsprincipal services include:
• Institutional Services—servicing its institutional clients, including unaffiliated corporate and public employee pension funds,endowment funds, domestic and foreign institutions and governments, and affiliates such as AXA and certain of its insurancecompany subsidiaries, by means of separately-managed accounts, sub-advisory relationships, structured products, collectiveinvestment trusts, mutual funds, hedge funds and other investment vehicles.
• Retail Services—servicing its retail clients, primarily by means of retail mutual funds sponsored by AllianceBernstein or an affili-ated company, sub-advisory relationships with mutual funds sponsored by third parties, separately-managed account programssponsored by financial intermediaries worldwide and other investment vehicles.
• Private Client Services—servicing its private clients, including high-net-worth individuals, trusts and estates, charitable founda-tions, partnerships, private and family corporations, and other entities, by means of separately-managed accounts, hedge funds,mutual funds and other investment vehicles.
• Bernstein Research Services—servicing institutional investors seeking high-quality research, portfolio strategy advice andbrokerage-related services.
AllianceBernstein also provides distribution, shareholder servicing and administrative services to the mutual funds it sponsors.
AllianceBernstein’s high-quality, in-depth research is the foundation of its business. AllianceBernstein’s research disciplines includefundamental, quantitative and economic research and currency forecasting. In addition, AllianceBernstein has created severalspecialized research initiatives, including research examining global strategic developments that can affect multiple industries andgeographies.
AllianceBernstein provides a broad range of investment services with expertise in:
• Value equities, generally targeting stocks that are out of favor and considered undervalued;
• Growth equities, generally targeting stocks with under-appreciated growth potential;
• Fixed income securities, including taxable and tax-exempt securities;
• Blend strategies, combining style-pure investment components with systematic rebalancing;
• Passive management, including index and enhanced index strategies;
• Alternative investments, including hedge funds, fund of funds, currency management strategies and private equity (e.g., directreal estate investing); and
• Asset allocation services, including dynamic asset allocation, customized target date funds, target risk funds and other strategiestailored to help clients meet their investment goals.
AllianceBernstein provides these services using various investment disciplines, including market capitalization (e.g., large-, mid- andsmall-cap equities), term (e.g., long-, intermediate- and short-duration debt securities), and geography (e.g., U.S., international,global and emerging markets), as well as local and regional disciplines in major markets around the world.
74 AllianceBernstein

AllianceBernstein Holding L.P.Notes to Financial Statements (continued)
As of December 31, 2012, AXA, société anonyme organized under the laws of France and the holding company for an internationalgroup of insurance and related financial services companies, through certain of its subsidiaries (“AXA and its subsidiaries”) ownedapproximately 1.4% of the issued and outstanding units representing assignments of beneficial ownership of limited partnershipinterests in Holding (“Holding Units”).
As of December 31, 2012, the ownership structure of AllianceBernstein, expressed as a percentage of general and limited partner-ship interests, was as follows:
AXA and its subsidiaries 61.0%
Holding 37.5
Unaffiliated holders 1.5
100.0%
AllianceBernstein Corporation (an indirect wholly-owned subsidiary of AXA, “General Partner”) is the general partner of both Hold-ing and AllianceBernstein. AllianceBernstein Corporation owns 100,000 general partnership units in Holding and a 1% general partner-ship interest in AllianceBernstein. Including both the general partnership and limited partnership interests in Holding andAllianceBernstein, AXA and its subsidiaries had an approximate 65.5% economic interest in AllianceBernstein as of December 31, 2012.
2. Summary of Significant Accounting Policies
Basis of Presentation
The financial statements have been prepared in accordance with accounting principles generally accepted in the United States ofAmerica. The preparation of the financial statements requires management to make certain estimates and assumptions that affect thereported amounts of assets and liabilities and disclosure of contingent assets and liabilities at the dates of the financial statements andthe reported amounts of revenues and expenses during the reporting periods. Actual results could differ from those estimates.
Holding’s financial statements and notes should be read in conjunction with the consolidated financial statements and notes ofAllianceBernstein. AllianceBernstein’s consolidated financial statements and notes are included in Holding’s Form 10-K.
Investment in AllianceBernstein
Holding records its investment in AllianceBernstein using the equity method of accounting. Holding’s investment is increased toreflect its proportionate share of income of AllianceBernstein and decreased to reflect its proportionate share of losses ofAllianceBernstein and cash distributions made by AllianceBernstein to its unitholders. In addition, its investment is adjusted toreflect its proportionate share of certain capital transactions of AllianceBernstein.
Revision
During 2012, we identified an error in the classification of our cash distributions to AllianceBernstein on unallocated Holding Unitsheld in its consolidated rabbi trust. As such, we revised the classification of prior period amounts recorded for our cash distributionsto AllianceBernstein on unallocated Holding Units held in its consolidated rabbi trust from due from AllianceBernstein to invest-ments in AllianceBernstein in the statements of financial condition. In addition, changes in due from AllianceBernstein included incash flows from operating activities in prior periods are now presented as additional investments in AllianceBernstein included incash flows from investing activities. As of December 31, 2011, the cumulative impact of the revision on the investments inAllianceBernstein in the statement of financial condition was $7.9 million. The impact of the revision for 2011 and 2010 in thestatements of cash flows was $5.7 million and $2.2 million, respectively. Management concluded that the error did not, individuallyor in the aggregate, result in a material misstatement of Holding’s financial statements for any prior period.
Annual Report 2012 75

AllianceBernstein Holding L.P.Notes to Financial Statements (continued)
Cash Distributions
Holding is required to distribute all of its Available Cash Flow, as defined in the Amended and Restated Agreement of LimitedPartnership of Holding (“Holding Partnership Agreement”), to its unitholders pro rata in accordance with their percentage inter-ests in Holding. Available Cash Flow is defined as the cash distributions Holding receives from AllianceBernstein minus suchamounts as the General Partner determines, in its sole discretion, should be retained by Holding for use in its business or plus suchamounts as the General Partner determines, in its sole discretion, should be released from previously retained cash flow.
On February 12, 2013, the General Partner declared a distribution of $42.1 million, or $0.40 per unit, representing Available CashFlow for the three months ended December 31, 2012. Each general partnership unit in Holding is entitled to receive distributionsequal to those received by each Holding Unit. The distribution is payable on March 14, 2013 to holders of record at the close of busi-ness on February 22, 2013. This distribution excludes the impact of AllianceBernstein’s non-cash real estate charge of $38.9 millionrecorded in the fourth quarter of 2012.
Total cash distributions per Unit paid to unitholders during 2012, 2011 and 2010 were $0.95, $1.44 and $1.51, respectively.
Long-term Incentive Compensation Plans
AllianceBernstein maintains several unfunded, non-qualified long-term incentive compensation plans under which awards ofrestricted Holding Units and options to buy Holding Units are granted to employees of AllianceBernstein and eligible members ofthe Board of Directors (“Eligible Directors”).
During the fourth quarter of 2011, AllianceBernstein implemented changes to its employee long-term incentive compensationaward program to ensure that its compensation practices are competitive, and to better align the costs of employee compensationand benefits with the company’s current year financial performance and provide employees with a higher degree of certainty thatthey will receive the incentive compensation they are awarded. Specifically, AllianceBernstein amended all outstanding year-endlong-term incentive compensation awards of active employees, so that employees who terminate their employment or are termi-nated without cause may retain their award, subject to compliance with certain agreements and restrictive covenants set forth in theapplicable award agreement, including restrictions on competition and employee and client solicitation, and a claw-back for failingto follow existing risk management policies. Most equity replacement, sign-on or similar deferred compensation awards included inseparate employment agreements or arrangements were not amended in 2011 to reflect these changes.
AllianceBernstein recognizes compensation expense related to equity compensation grants in the financial statements using the fairvalue method. Fair value of restricted Holding Unit awards is the closing price of a Holding Unit on the grant date; fair value ofoptions is determined using the Black-Scholes option valuation model. Under the fair value method, compensatory expense ismeasured at the grant date based on the estimated fair value of the award and is recognized over the required service period. Priorto the changes made to the employee long-term incentive compensation award program in the fourth quarter of 2011, an employ-ee’s service requirement was typically the same as the delivery dates. These changes eliminated employee service requirements, butdid not modify delivery dates contained in the original award agreements.
As a result of these changes, AllianceBernstein recorded a one-time, non-cash charge of $587.1 million in the fourth quarter of 2011for all unrecognized long-term incentive compensation on the amended outstanding awards from prior years. In addition, upon appro-val and communication of the dollar value of the 2011 awards in December 2011, AllianceBernstein recorded 100% of the expenseassociated with its 2011 long-term incentive compensation awards of $159.9 million. In January 2012, 8.7 million restricted HoldingUnits held in the consolidated rabbi trust were awarded for the 2011 awards and AllianceBernstein reclassified $130.3 million of theliability to partners’ capital as equity-based awards.
Awards granted in 2012 and 2011 contained the provisions described above and we expect to include these provisions in long-termincentive compensation awards in future years. Accordingly, AllianceBernstein’s annual incentive compensation expense will reflect100% of the expense associated with the long-term incentive compensation awarded in each year. This approach to expense recog-nition will more closely match the economic cost of awarding long-term incentive compensation to the period in which the relatedservice is performed.
76 AllianceBernstein

AllianceBernstein Holding L.P.Notes to Financial Statements (continued)
Grants of restricted Holding Units and options to buy Holding Units are typically awarded to Eligible Directors during the secondquarter. Restricted Holding Units vest on the third anniversary of the grant date and the options become exercisable ratably overthree years. These restricted Holding Units and options are not forfeitable (except if the Eligible Director is terminated for “Cause”,as that term is defined in the applicable award agreement). Due to there being no service requirement, AllianceBernstein fullyexpenses these awards on each grant date.
AllianceBernstein funds its restricted Holding Unit awards either by purchasing Holding Units on the open market or purchasingnewly-issued Holding Units from Holding, all of which are held in a consolidated rabbi trust until they are distributed to employeesupon vesting. In accordance with the AllianceBernstein Partnership Agreement, when AllianceBernstein purchases newly-issuedHolding Units from Holding, Holding is required to use the proceeds it receives from AllianceBernstein to purchase the equivalentnumber of newly-issued AllianceBernstein Units, thus increasing its percentage ownership interest in AllianceBernstein. HoldingUnits held in the consolidated rabbi trust are corporate assets in the name of the trust and are available to the general creditors ofAllianceBernstein.
During 2012 and 2011, AllianceBernstein purchased 15.7 million and 13.5 million Holding Units for $238.0 million and $220.8 million,respectively. These amounts reflect open-market purchases of 12.3 million and 11.1 million Holding Units for $182.3 million and$192.1 million, respectively, with the remainder relating to purchases of Holding Units from employees to allow them to fulfill statutory taxwithholding requirements at the time of distribution of long-term incentive compensation awards, offset by Holding Units purchased byemployees as part of a distribution reinvestment election.
Since the third quarter of 2011, AllianceBernstein has implemented plans each quarter to repurchase Holding Units pursuant toRule 10b5-1 under the Securities Exchange Act of 1934, as amended (“Exchange Act”). A Rule 10b5-1 plan allows a company torepurchase its shares at times when it otherwise might be prevented from doing so because of self-imposed trading blackout periodsand because it possesses material non-public information. Each broker selected by AllianceBernstein has the authority under theterms and limitations specified in the plan to repurchase Holding Units on AllianceBernstein’s behalf in accordance with the termsof the plan. Repurchases are subject to SEC regulations as well as certain price, market volume and timing constraints specified inthe plan. The plan adopted during the fourth quarter of 2012 does not specify an aggregate limitation and expires at the close ofbusiness on February 11, 2013. AllianceBernstein intends to adopt additional Rule 10b5-1 plans so that the firm can continue toengage in open-market purchases of Holding Units to help fund anticipated obligations under its incentive compensation awardprogram and for other corporate purposes.
AllianceBernstein granted to employees and Eligible Directors 12.1 million restricted Holding Unit awards (including 2.7 milliongranted in June 2012 to Peter Kraus, our Chief Executive Officer, in connection with his extended employment agreement and8.7 million granted in January 2012 for 2011 year-end awards) and 1.7 million restricted Holding Unit awards during 2012 and2011, respectively. To fund these awards, AllianceBernstein allocated previously repurchased Holding Units that had been held inAllianceBernstein’s consolidated rabbi trust. The 2012 and 2011 long-term incentive compensation awards allowed most employeesto allocate their awards between restricted Holding Units and deferred cash. As a result, 6.5 million restricted Holding Unit awardsfor the December 2012 awards and 8.7 million restricted Holding Unit awards for the December 2011 awards were awarded andallocated as such within the consolidated rabbi trust in January 2013 and 2012, respectively. There were approximately 17.9 millionand 12.0 million unallocated Holding Units remaining in AllianceBernstein’s consolidated rabbi trust as of December 31, 2012 andJanuary 31, 2013, respectively. The balance as of January 31, 2013 also reflects repurchases and other activity during January 2013.
New Holding Units also may be issued upon exercise of options. Proceeds received by Holding upon exercise of options are usedto acquire newly-issued AllianceBernstein Units, increasing Holding’s percentage ownership interest in AllianceBernstein. As ofDecember 31, 2012, there were 8,553,345 options to buy Holding Units outstanding, of which 4,237,915 were exercisable.
Annual Report 2012 77

AllianceBernstein Holding L.P.Notes to Financial Statements (continued)
3. Net Income (Loss) Per Unit
Basic net income (loss) per unit is derived by dividing net income (loss) by the basic weighted average number of units outstandingfor each year. Diluted net income (loss) per unit is derived by adjusting net income (loss) for the assumed dilutive effect of compen-satory options (“Net income (loss)—diluted”) and dividing by the diluted weighted average number of units outstanding for eachyear.
Years Ended December 31,2012 2011 2010
(in thousands, except per unit amounts)
Net income (loss)—basic $ 51,085 $ (93,268) $134,158
Additional allocation of equity in net income (loss) attributable to AllianceBernstein resulting from assumed dilutive effect ofcompensatory options — — 1,640
Net income (loss)—diluted $ 51,085 $ (93,268) $135,798
Weighted average units outstanding—basic 101,067 103,288 101,162
Dilutive effect of compensatory options 1 — 1,639
Weighted average units outstanding—diluted 101,068 103,288 102,801
Basic net income (loss) per unit $ 0.51 $ (0.90) $ 1.33
Diluted net income (loss) per unit $ 0.51 $ (0.90) $ 1.32
As of December 31, 2012, 2011 and 2010, we excluded 8,438,902, 3,813,567 and 4,783,472 options, respectively, from the dilutednet income (loss) per unit computation due to their anti-dilutive effect. Weighted average units outstanding do not include Hol-ding’s proportional shares (37.5% in 2012, 37.5% in 2011 and 36.7% in 2010) of the Holding Units held by AllianceBernstein in itsconsolidated rabbi trust.
The 2012 net income per unit includes the impact of AllianceBernstein’s $223.0 million non-cash real estate charges recorded in2012 in regard to its global space consolidation plan.
The 2011 net loss per unit includes the impact of AllianceBernstein’s one-time, non-cash long-term incentive compensation chargeof $587.1 million recorded in the fourth quarter of 2011. See further discussion above in Note 2, Long-term Incentive Compensation Plans.
4. Investment in AllianceBernstein
Changes in Holding’s investment in AllianceBernstein for the years ended December 31, 2012 and 2011 were as follows:2012 2011
(in thousands)
Investment in AllianceBernstein as of January 1, $ 1,627,912 $ 1,788,496
Equity in net income (loss) attributable to AllianceBernstein Unitholders 70,807 (65,581)
Changes in accumulated other comprehensive income (loss) (3,756) (2,549)
Cash distributions received from AllianceBernstein (120,950) (178,757)
Additional investments in AllianceBernstein from cash distributions paid to AllianceBernstein consolidated rabbi trust 11,595 5,727
Additional investments with proceeds from exercises of compensatory options to buy Holding Units, net — 1,478
Change in Holding Units held by AllianceBernstein for long-term incentive compensation plans (25,072) 79,098
Investment in AllianceBernstein as of December 31, $1,560,536 $1,627,912
78 AllianceBernstein
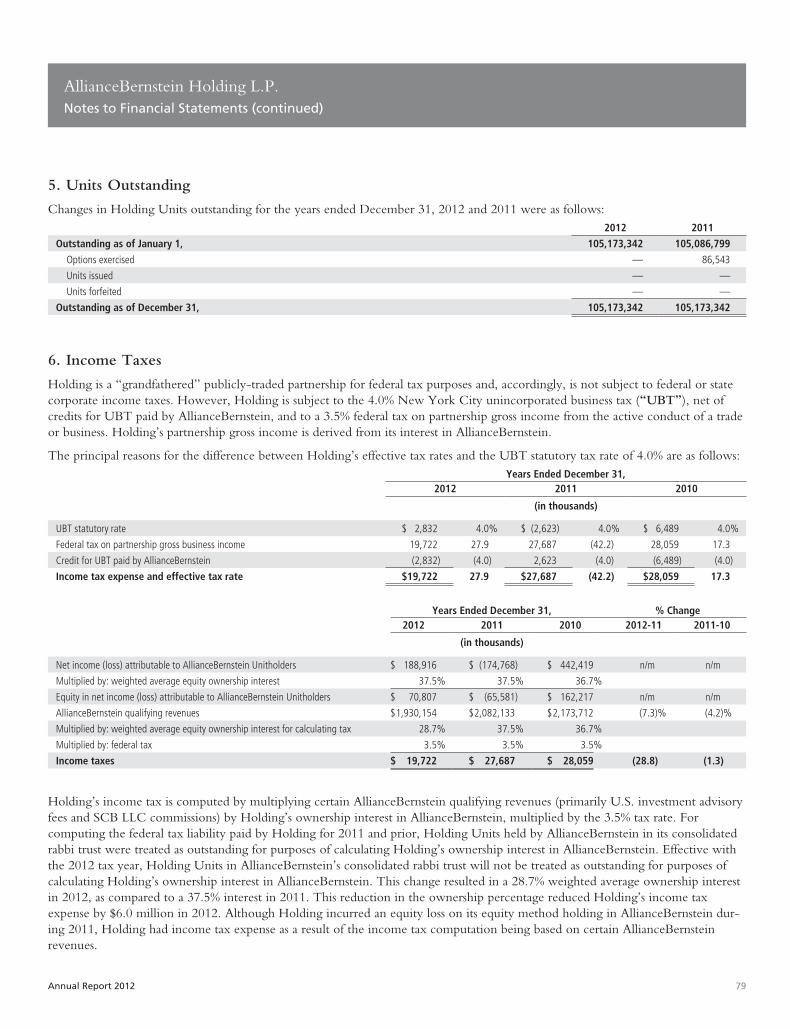
AllianceBernstein Holding L.P.Notes to Financial Statements (continued)
5. Units Outstanding
Changes in Holding Units outstanding for the years ended December 31, 2012 and 2011 were as follows:2012 2011
Outstanding as of January 1, 105,173,342 105,086,799
Options exercised — 86,543
Units issued — —
Units forfeited — —
Outstanding as of December 31, 105,173,342 105,173,342
6. Income Taxes
Holding is a “grandfathered” publicly-traded partnership for federal tax purposes and, accordingly, is not subject to federal or statecorporate income taxes. However, Holding is subject to the 4.0% New York City unincorporated business tax (“UBT”), net ofcredits for UBT paid by AllianceBernstein, and to a 3.5% federal tax on partnership gross income from the active conduct of a tradeor business. Holding’s partnership gross income is derived from its interest in AllianceBernstein.
The principal reasons for the difference between Holding’s effective tax rates and the UBT statutory tax rate of 4.0% are as follows:Years Ended December 31,
2012 2011 2010
(in thousands)
UBT statutory rate $ 2,832 4.0% $ (2,623) 4.0% $ 6,489 4.0%
Federal tax on partnership gross business income 19,722 27.9 27,687 (42.2) 28,059 17.3
Credit for UBT paid by AllianceBernstein (2,832) (4.0) 2,623 (4.0) (6,489) (4.0)
Income tax expense and effective tax rate $19,722 27.9 $27,687 (42.2) $28,059 17.3
Years Ended December 31, % Change2012 2011 2010 2012-11 2011-10
(in thousands)
Net income (loss) attributable to AllianceBernstein Unitholders $ 188,916 $ (174,768) $ 442,419 n/m n/m
Multiplied by: weighted average equity ownership interest 37.5% 37.5% 36.7%
Equity in net income (loss) attributable to AllianceBernstein Unitholders $ 70,807 $ (65,581) $ 162,217 n/m n/m
AllianceBernstein qualifying revenues $1,930,154 $2,082,133 $2,173,712 (7.3)% (4.2)%
Multiplied by: weighted average equity ownership interest for calculating tax 28.7% 37.5% 36.7%
Multiplied by: federal tax 3.5% 3.5% 3.5%
Income taxes $ 19,722 $ 27,687 $ 28,059 (28.8) (1.3)
Holding’s income tax is computed by multiplying certain AllianceBernstein qualifying revenues (primarily U.S. investment advisoryfees and SCB LLC commissions) by Holding’s ownership interest in AllianceBernstein, multiplied by the 3.5% tax rate. Forcomputing the federal tax liability paid by Holding for 2011 and prior, Holding Units held by AllianceBernstein in its consolidatedrabbi trust were treated as outstanding for purposes of calculating Holding’s ownership interest in AllianceBernstein. Effective withthe 2012 tax year, Holding Units in AllianceBernstein’s consolidated rabbi trust will not be treated as outstanding for purposes ofcalculating Holding’s ownership interest in AllianceBernstein. This change resulted in a 28.7% weighted average ownership interestin 2012, as compared to a 37.5% interest in 2011. This reduction in the ownership percentage reduced Holding’s income taxexpense by $6.0 million in 2012. Although Holding incurred an equity loss on its equity method holding in AllianceBernstein dur-ing 2011, Holding had income tax expense as a result of the income tax computation being based on certain AllianceBernsteinrevenues.
Annual Report 2012 79

AllianceBernstein Holding L.P.Notes to Financial Statements (continued)
In order to preserve Holding’s status as a “grandfathered” publicly-traded partnership for federal income tax purposes, managementensures that Holding does not directly or indirectly (through AllianceBernstein) enter into a substantial new line of business. IfHolding were to lose its status as a “grandfathered” publicly-traded partnership, it would be subject to corporate income tax, whichwould reduce materially Holding’s net income and its quarterly distributions to Holding unitholders.
The effect of a tax position is recognized in the financial statements only if, as of the reporting date, it is “more likely than not” tobe sustained based solely on its technical merits. In making this assessment, a company must assume that the taxing authority willexamine the tax position and have full knowledge of all relevant information. Accordingly, we have no liability for unrecognizedtax benefits as of December 31, 2012 and 2011. A liability for unrecognized tax benefits, if required, would be recorded in incometax expense and affect the company’s effective tax rate.
We are no longer subject to federal, state and local income tax examinations by tax authorities for all years prior to 2009. Currently,there are no examinations in progress and to date we have not been notified of any future examinations by applicable taxing authorities.
7. Commitments and Contingencies
Legal and regulatory matters described below pertain to AllianceBernstein and are included here due to their potential significanceto Holding’s investment in AllianceBernstein.
With respect to all significant litigation matters, we consider the likelihood of a negative outcome. If we determine the likelihood ofa negative outcome is probable, and the amount of the loss can be reasonably estimated, we record an estimated loss for theexpected outcome of the litigation. If the likelihood of a negative outcome is reasonably possible and we are able to determine anestimate of the possible loss or range of loss in excess of amounts already accrued, if any, we disclose that fact together with theestimate of the possible loss or range of loss. However, it is often difficult to predict the outcome or estimate a possible loss or rangeof loss because litigation is subject to inherent uncertainties, particularly when plaintiffs allege substantial or indeterminate damages,the litigation is in its early stages, or when the litigation is highly complex or broad in scope. In such cases, we disclose that we areunable to predict the outcome or estimate a possible loss or range of loss.
During the first quarter of 2012, AllianceBernstein received a legal letter of claim (the “Letter of Claim”) sent on behalf of a for-mer European pension fund client, alleging that AllianceBernstein Limited (a wholly-owned subsidiary of AllianceBernsteinorganized in the U.K.) was negligent and failed to meet certain applicable standards of care with respect to the initial investment inand management of a £500 million portfolio of U.S. mortgage-backed securities. The alleged damages range between $177 millionand $234 million, plus compound interest on an alleged $125 million of realized losses in the portfolio. AllianceBernstein believesthat any losses to this client resulted from adverse developments in the U.S. housing and mortgage market that precipitated thefinancial crisis in 2008 and not any negligence or failure on its part. AllianceBernstein believes that it has strong defenses to theseclaims, which are set forth in AllianceBernstein’s October 12, 2012 response to the Letter of Claim, and will defend this mattervigorously. Currently, AllianceBernstein is unable to estimate a reasonably possible range of loss because the matter remains in itsearly stages.
In addition to the Letter of Claim, AllianceBernstein is involved in various other matters, including regulatory inquiries, admin-istrative proceedings and litigation, some of which allege significant damages.
In the opinion of AllianceBernstein’s management, an adequate accrual has been made as of December 31, 2012 to provide for anyprobable losses regarding any litigation matters for which it can reasonably estimate an amount of loss. It is reasonably possible thatAllianceBernstein could incur additional losses pertaining to these matters, but currently it cannot estimate any such additional losses.
Management, after consultation with legal counsel, currently believes that the outcome of any matter that is pending or threatened,or all of them combined, will not have a material adverse effect on our results of operations, financial condition or liquidity. How-ever, as any inquiry, proceeding or litigation has an element of uncertainty, management cannot determine whether furtherdevelopments relating to any matter that is pending or threatened, or all of them combined, will have a material adverse effect onour results of operations, financial condition or liquidity in any future reporting period.
80 AllianceBernstein
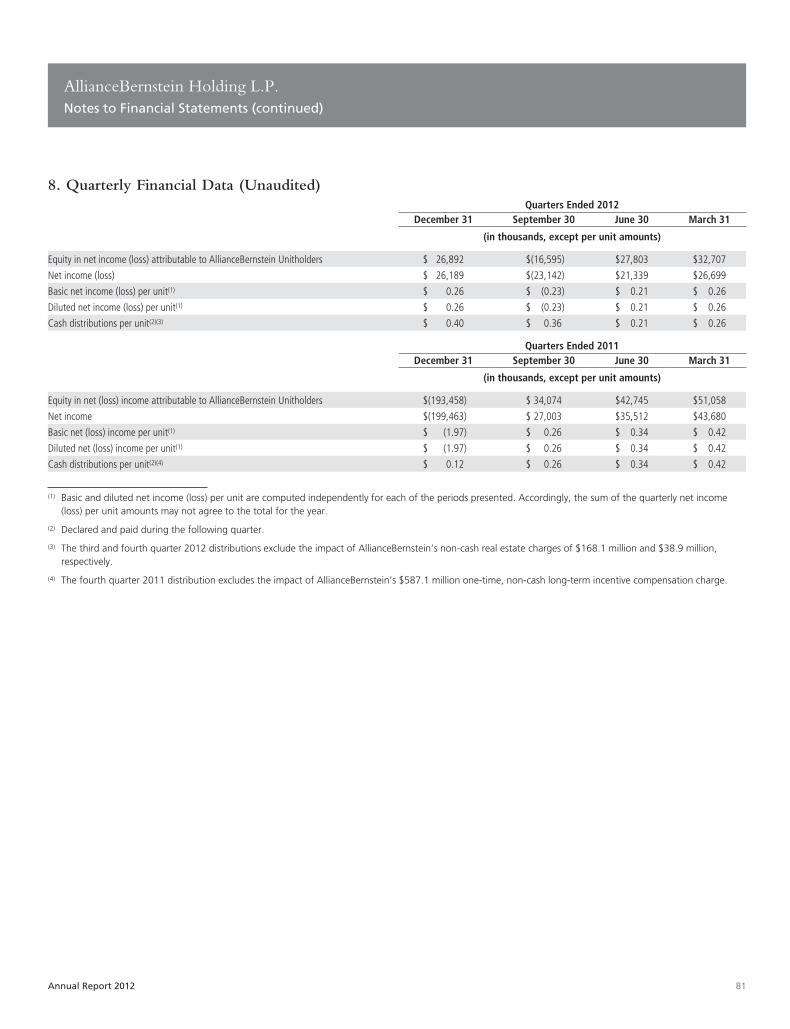
AllianceBernstein Holding L.P.Notes to Financial Statements (continued)
8. Quarterly Financial Data (Unaudited)Quarters Ended 2012
December 31 September 30 June 30 March 31
(in thousands, except per unit amounts)
Equity in net income (loss) attributable to AllianceBernstein Unitholders $ 26,892 $(16,595) $27,803 $32,707
Net income (loss) $ 26,189 $(23,142) $21,339 $26,699
Basic net income (loss) per unit(1) $ 0.26 $ (0.23) $ 0.21 $ 0.26
Diluted net income (loss) per unit(1) $ 0.26 $ (0.23) $ 0.21 $ 0.26
Cash distributions per unit(2)(3) $ 0.40 $ 0.36 $ 0.21 $ 0.26
Quarters Ended 2011December 31 September 30 June 30 March 31
(in thousands, except per unit amounts)
Equity in net (loss) income attributable to AllianceBernstein Unitholders $(193,458) $ 34,074 $42,745 $51,058
Net income $(199,463) $ 27,003 $35,512 $43,680
Basic net (loss) income per unit(1) $ (1.97) $ 0.26 $ 0.34 $ 0.42
Diluted net (loss) income per unit(1) $ (1.97) $ 0.26 $ 0.34 $ 0.42
Cash distributions per unit(2)(4) $ 0.12 $ 0.26 $ 0.34 $ 0.42
(1) Basic and diluted net income (loss) per unit are computed independently for each of the periods presented. Accordingly, the sum of the quarterly net income(loss) per unit amounts may not agree to the total for the year.
(2) Declared and paid during the following quarter.
(3) The third and fourth quarter 2012 distributions exclude the impact of AllianceBernstein’s non-cash real estate charges of $168.1 million and $38.9 million,respectively.
(4) The fourth quarter 2011 distribution excludes the impact of AllianceBernstein’s $587.1 million one-time, non-cash long-term incentive compensation charge.
Annual Report 2012 81

Report of Independent Registered Public Accounting Firm
To the General Partner and Unitholders ofAllianceBernstein L.P.:
In our opinion, the accompanying consolidated statements of financial condition and the related consolidated statements of income,comprehensive income, changes in partners’ capital and cash flows present fairly, in all material respects, the financial position ofAllianceBernstein L.P. and its subsidiaries (“AllianceBernstein”) at December 31, 2012 and 2011, and the results of their operations andtheir cash flows for each of the three years in the period ended December 31, 2012 in conformity with accounting principles generallyaccepted in the United States of America. Also in our opinion, AllianceBernstein maintained, in all material respects, effective internalcontrol over financial reporting as of December 31, 2012, based on criteria established in Internal Control-Integrated Framework issued bythe Committee of Sponsoring Organizations of the Treadway Commission (COSO). AllianceBernstein’s management is responsible forthese financial statements, for maintaining effective internal control over financial reporting and for its assessment of the effectiveness ofinternal control over financial reporting, included in Management’s Report on Internal Control over Financial Reporting appearing underItem 9A. Our responsibility is to express opinions on these financial statements and on AllianceBernstein’s internal control over finan-cial reporting based on our integrated audits. We conducted our audits in accordance with the standards of the Public CompanyAccounting Oversight Board (United States). Those standards require that we plan and perform the audits to obtain reasonable assur-ance about whether the financial statements are free of material misstatement and whether effective internal control over financialreporting was maintained in all material respects. Our audits of the financial statements included examining, on a test basis, evidencesupporting the amounts and disclosures in the financial statements, assessing the accounting principles used and significant estimatesmade by management, and evaluating the overall financial statement presentation. Our audit of internal control over financial reportingincluded obtaining an understanding of internal control over financial reporting, assessing the risk that a material weakness exists, andtesting and evaluating the design and operating effectiveness of internal control based on the assessed risk. Our audits also includedperforming such other procedures as we considered necessary in the circumstances. We believe that our audits provide a reasonablebasis for our opinions.
A company’s internal control over financial reporting is a process designed to provide reasonable assurance regarding the reliabilityof financial reporting and the preparation of financial statements for external purposes in accordance with generally acceptedaccounting principles. A company’s internal control over financial reporting includes those policies and procedures that (i) pertain tothe maintenance of records that, in reasonable detail, accurately and fairly reflect the transactions and dispositions of the assets of thecompany; (ii) provide reasonable assurance that transactions are recorded as necessary to permit preparation of financial statements inaccordance with generally accepted accounting principles, and that receipts and expenditures of the company are being made onlyin accordance with authorizations of management and directors of the company; and (iii) provide reasonable assurance regardingprevention or timely detection of unauthorized acquisition, use, or disposition of the company’s assets that could have a materialeffect on the financial statements.
Because of its inherent limitations, internal control over financial reporting may not prevent or detect misstatements. Also, projec-tions of any evaluation of effectiveness to future periods are subject to the risk that controls may become inadequate because ofchanges in conditions, or that the degree of compliance with the policies or procedures may deteriorate.
/s/ PricewaterhouseCoopers LLPNew York, New YorkFebruary 12, 2013
82 AllianceBernstein

AllianceBernstein L.P. and Subsidiaries
Consolidated Statements of Financial ConditionDecember 31,
2012 2011
(in thousands,except unit amounts)
ASSETS
Cash and cash equivalents $ 627,182 $ 638,681
Cash and securities segregated, at fair value (cost $1,551,177 and $1,279,779) 1,551,326 1,279,855
Receivables, net:
Brokers and dealers 408,037 291,276
Brokerage clients 942,034 782,697
Fees 265,685 265,248
Investments:
Long-term incentive compensation-related 122,977 176,370
Other 609,357 618,924
Furniture, equipment and leasehold improvements, net 196,125 273,104
Goodwill 2,954,327 2,954,327
Intangible assets, net 169,208 190,000
Deferred sales commissions, net 95,430 59,999
Other assets 173,362 177,908
Total assets $8,115,050 $7,708,389
LIABILITIES AND CAPITAL
Liabilities:
Payables:
Brokers and dealers $ 220,736 $ 279,655
Securities sold not yet purchased 63,838 39,307
Brokerage clients 2,563,061 1,895,972
AllianceBernstein mutual funds 156,679 122,151
Accounts payable and accrued expenses 499,076 362,570
Accrued compensation and benefits 485,229 534,344
Debt 323,163 444,903
Total liabilities 4,311,782 3,678,902
Commitments and contingencies (See Note 13)
Capital:
General Partner 41,213 42,632
Limited partners: 277,600,901 and 277,847,588 units issued and outstanding 4,165,461 4,306,760
Capital contributions receivable from General Partner (8,441) (12,135)
Holding Units held for long-term incentive compensation plans (389,941) (323,382)
Accumulated other comprehensive income (loss) (48,526) (38,413)
Partners’ capital attributable to AllianceBernstein Unitholders 3,759,766 3,975,462
Non-controlling interests in consolidated entities 43,502 54,025
Total capital 3,803,268 4,029,487
Total liabilities and capital $8,115,050 $7,708,389
See Accompanying Notes to Consolidated Financial Statements.
Annual Report 2012 83

AllianceBernstein L.P. and Subsidiaries
Consolidated Statements of IncomeYears Ended December 31,
2012 2011 2010
(in thousands, except per unit amounts)
Revenues:
Investment advisory and services fees $1,772,257 $1,916,419 $2,051,692
Bernstein research services 413,707 437,414 430,521
Distribution revenues 401,706 351,621 338,597
Dividend and interest income 21,286 21,499 22,902
Investment gains (losses) 29,202 (82,081) (1,410)
Other revenues 101,801 107,569 109,803
Total revenues 2,739,959 2,752,441 2,952,105
Less: Interest expense 3,222 2,550 3,548
Net revenues 2,736,737 2,749,891 2,948,557
Expenses:
Employee compensation and benefits:
Employee compensation and benefits 1,168,645 1,246,898 1,320,495
Long-term incentive compensation charge — 587,131 —
Promotion and servicing:
Distribution-related payments 367,090 302,684 286,676
Amortization of deferred sales commissions 40,262 37,675 47,397
Other 202,191 219,197 193,822
General and administrative:
General and administrative 508,364 533,578 516,185
Real estate charges 223,038 7,235 101,698
Interest on borrowings 3,429 2,545 2,078
Amortization of intangible assets 21,353 21,417 21,344
Total expenses 2,534,372 2,958,360 2,489,695
Operating income (loss) 202,365 (208,469) 458,862
Non-operating income — — 6,760
Income (loss) before income taxes 202,365 (208,469) 465,622
Income tax expense 13,764 3,098 38,523
Net income (loss) 188,601 (211,567) 427,099
Net (loss) income of consolidated entities attributable to non-controlling interests (315) (36,799) (15,320)
Net income (loss) attributable to AllianceBernstein Unitholders $ 188,916 $ (174,768) $ 442,419
Net income (loss) per AllianceBernstein Unit:
Basic $ 0.67 $ (0.62) $ 1.59
Diluted $ 0.67 $ (0.62) $ 1.58
See Accompanying Notes to Consolidated Financial Statements.
84 AllianceBernstein
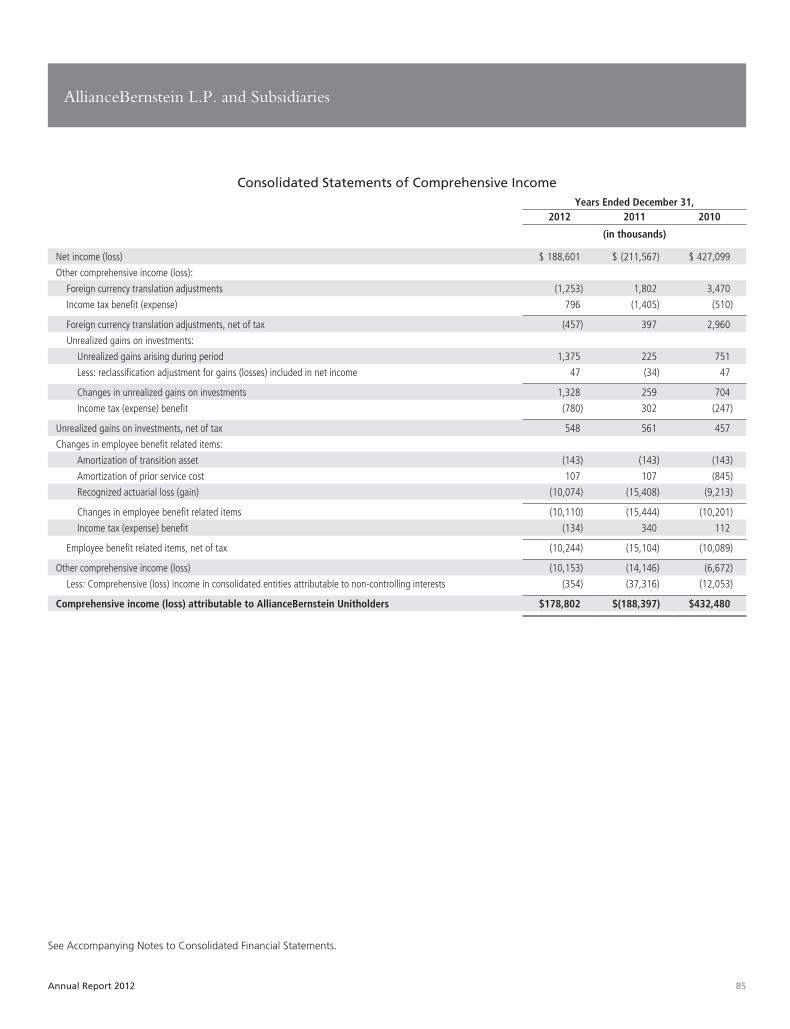
AllianceBernstein L.P. and Subsidiaries
Consolidated Statements of Comprehensive IncomeYears Ended December 31,
2012 2011 2010
(in thousands)
Net income (loss) $ 188,601 $ (211,567) $ 427,099
Other comprehensive income (loss):
Foreign currency translation adjustments (1,253) 1,802 3,470
Income tax benefit (expense) 796 (1,405) (510)
Foreign currency translation adjustments, net of tax (457) 397 2,960
Unrealized gains on investments:
Unrealized gains arising during period 1,375 225 751
Less: reclassification adjustment for gains (losses) included in net income 47 (34) 47
Changes in unrealized gains on investments 1,328 259 704
Income tax (expense) benefit (780) 302 (247)
Unrealized gains on investments, net of tax 548 561 457
Changes in employee benefit related items:
Amortization of transition asset (143) (143) (143)
Amortization of prior service cost 107 107 (845)
Recognized actuarial loss (gain) (10,074) (15,408) (9,213)
Changes in employee benefit related items (10,110) (15,444) (10,201)
Income tax (expense) benefit (134) 340 112
Employee benefit related items, net of tax (10,244) (15,104) (10,089)
Other comprehensive income (loss) (10,153) (14,146) (6,672)
Less: Comprehensive (loss) income in consolidated entities attributable to non-controlling interests (354) (37,316) (12,053)
Comprehensive income (loss) attributable to AllianceBernstein Unitholders $178,802 $(188,397) $432,480
See Accompanying Notes to Consolidated Financial Statements.
Annual Report 2012 85

AllianceBernstein L.P. and Subsidiaries
Consolidated Statements of Changes in Partners’ CapitalYears Ended December 31,
2012 2011 2010
(in thousands)
General Partner’s CapitalBalance, beginning of year $ 42,632 $ 48,986 $ 48,671Net income (loss) 1,889 (1,748) 4,424Cash distributions to General Partner (3,226) (4,775) (4,978)Long-term incentive compensation plans activity (82) 132 954Retirement of AllianceBernstein Units — — (85)Purchase of Australian joint venture non-controlled interest — 37 —Balance, end of year 41,213 42,632 48,986
Limited Partners’ CapitalBalance, beginning of year 4,306,760 4,905,037 4,862,158Net income (loss) 187,027 (173,020) 437,995Cash distributions to unitholders (318,208) (471,691) (490,118)Long-term incentive compensation plans activity (6,923) 49,290 103,438Retirement of AllianceBernstein Units (3,195) (6,522) (8,436)Purchase of Australian joint venture non-controlled interest — 3,666 —Balance, end of year 4,165,461 4,306,760 4,905,037
Capital Contributions ReceivableBalance, beginning of year (12,135) (15,973) (19,664)Capital contributions from General Partner 4,440 4,793 4,879Compensation plan accrual (746) (955) (1,188)Balance, end of year (8,441) (12,135) (15,973)
Holding Units held for Long-term Incentive Compensation PlansBalance, beginning of year (323,382) (535,410) (338,941)Purchases of Holding Units to fund long-term compensation plans, net (238,015) (220,813) (226,370)Reclassification from liability-based awards 130,281 — —Issuance of Holding Units to fund long-term incentive compensation plan awards, net of forfeitures — — (78,506)Amortization of long-term incentive compensation awards 20,661 437,743 113,548Re-valuation of Holding Units held in rabbi trust 20,514 (4,902) (5,141)Balance, end of year (389,941) (323,382) (535,410)
Accumulated Other Comprehensive Income (Loss)Balance, beginning of year (38,413) (31,801) (21,862)Unrealized gain (loss) on investments, net of tax 548 528 348Foreign currency translation adjustment, net of tax (418) 7,964 (199)Changes in employee benefit related items, net of tax (10,243) (15,104) (10,088)Balance, end of year (48,526) (38,413) (31,801)
Total Partners’ Capital attributable to AllianceBernstein Unitholders 3,759,766 3,975,462 4,370,839Non-controlling Interests in Consolidated Entities
Balance, beginning of year 54,025 124,517 171,593Net (loss) income (315) (36,799) (15,320)Unrealized gain (loss) on investments — 33 108Foreign currency translation adjustment (39) (550) 3,159Acquisitions (1) (32,103) —Distributions to non-controlling interests of our consolidated venture capital fund activities (10,168) (1,073) (35,023)Balance, end of year 43,502 54,025 124,517
Total Capital $3,803,268 $4,029,487 $4,495,356
See Accompanying Notes to Consolidated Financial Statements.
86 AllianceBernstein

AllianceBernstein L.P. and Subsidiaries
Consolidated Statements of Cash FlowsYears Ended December 31,
2012 2011 2010
(in thousands)Cash flows from operating activities:Net income (loss) $ 188,601 $(211,567) $ 427,099Adjustments to reconcile net income (loss) to net cash provided by operating activities:
Amortization of deferred sales commissions 40,262 37,675 47,397Amortization of non-cash long-term incentive compensation 21,830 474,103 122,612Depreciation and other amortization 76,257 83,489 81,697Unrealized (gains) losses on long-term incentive compensation-related investments (15,395) 12,037 (39,094)Unrealized (gains) losses on consolidated venture capital fund (18,233) 38,974 39,534Unrealized (gains) losses on other investments (40,541) 23,535 (10,414)Real estate asset write-off charges 41,450 4,639 25,521Other, net 1,552 5,069 3,722
Changes in assets and liabilities:(Increase) in segregated cash and securities (271,471) (169,964) (124,560)(Increase) decrease in receivables (226,553) 1,164 (399,549)Decrease (increase) in investments 136,901 (110,600) 24,062(Increase) in deferred sales commissions (75,693) (21,518) (33,366)Decrease (increase) in other assets 4,363 (26,048) 26,223Increase in payables 613,345 284,680 543,638Increase (decrease) in accounts payable and accrued expenses 137,898 (26,343) 86,567Increase in accrued compensation and benefits 69,406 178,870 9,045
Net cash provided by operating activities 683,979 578,195 830,134Cash flows from investing activities:Purchases of investments (108) (56) (73)Proceeds from sales of investments 780 3,507 4,349Purchases of furniture, equipment and leasehold improvements (21,650) (39,590) (25,302)Proceeds from sales of furniture, equipment and leasehold improvements 2,636 1,251 1,801Purchase of businesses, net of cash acquired — (41,835) (14,298)Net cash used in investing activities (18,342) (76,723) (33,523)Cash flows from financing activities:(Repayment) issuance of commercial paper, net (123,250) 219,363 (24,247)(Decrease) increase in overdrafts payable (244) (38,640) 15,278Distributions to General Partner and unitholders (321,434) (476,466) (495,096)Distributions to non-controlling interests in consolidated entities (10,168) (1,073) (35,023)Capital contributions from General Partner 4,440 4,793 4,879Additional investments by Holding with proceeds from exercise of compensatory options to buy Holding Units — 1,478 8,287Additional investments by Holding from distributions paid to AllianceBernstein consolidated rabbi trust 11,595 5,727 2,205Purchases of Holding Units to fund long-term incentive compensation plan awards, net (238,015) (220,813) (226,370)Purchases of AllianceBernstein Units (3,195) (6,522) (8,521)Debt issuance costs (1,933) (69) (1,932)Other (31) (26) (51)Net cash used in financing activities (682,235) (512,248) (760,591)Effect of exchange rate changes on cash and cash equivalents 5,099 (734) (45)Net (decrease) increase in cash and cash equivalents (11,499) (11,510) 35,975Cash and cash equivalents as of beginning of the period 638,681 650,191 614,216Cash and cash equivalents as of end of the period $ 627,182 $ 638,681 $ 650,191Cash paid:Interest paid $ 4,809 $ 3,001 $ 3,721Income taxes paid 10,063 29,477 43,072Non-cash investing activities:Fair value of assets acquired — 30,368 49,041Fair value of liabilities assumed — (4,999) (34,743)
See Accompanying Notes to Consolidated Financial Statements.
Annual Report 2012 87

AllianceBernstein L.P. and SubsidiariesNotes to Consolidated Financial Statements
The words “we” and “our” refer collectively to AllianceBernstein L.P. and its subsidiaries (“AllianceBernstein”), or to their officers and employ-ees. Similarly, the word “company” refers to AllianceBernstein. Cross-references are in italics.
1. Business Description and Organization
We provide research, diversified investment management and related services globally to a broad range of clients. Our principalservices include:
• Institutional Services—servicing our institutional clients, including unaffiliated corporate and public employee pension funds,endowment funds, domestic and foreign institutions and governments, and affiliates such as AXA and certain of its insurancecompany subsidiaries, by means of separately-managed accounts, sub-advisory relationships, structured products, collectiveinvestment trusts, mutual funds, hedge funds and other investment vehicles.
• Retail Services—servicing our retail clients, primarily by means of retail mutual funds sponsored by AllianceBernstein or an affili-ated company, sub-advisory relationships with mutual funds sponsored by third parties, separately-managed account programssponsored by financial intermediaries worldwide and other investment vehicles.
• Private Client Services—servicing our private clients, including high-net-worth individuals, trusts and estates, charitable founda-tions, partnerships, private and family corporations, and other entities, by means of separately-managed accounts, hedge funds,mutual funds and other investment vehicles.
• Bernstein Research Services—servicing institutional investors seeking high-quality research, portfolio strategy advice andbrokerage-related services.
We also provide distribution, shareholder servicing and administrative services to the mutual funds we sponsor.
Our high-quality, in-depth research is the foundation of our business. Our research disciplines include fundamental, quantitativeand economic research and currency forecasting. In addition, we have created several specialized research initiatives, includingresearch examining global strategic developments that can affect multiple industries and geographies.
We provide a broad range of investment services with expertise in:
• Value equities, generally targeting stocks that are out of favor and considered undervalued;
• Growth equities, generally targeting stocks with under-appreciated growth potential;
• Fixed income securities, including taxable and tax-exempt securities;
• Blend strategies, combining style-pure investment components with systematic rebalancing;
• Passive management, including index and enhanced index strategies;
• Alternative investments, including hedge funds, fund of funds, currency management strategies and private equity (e.g., directreal estate investing); and
• Asset allocation services, including dynamic asset allocation, customized target date funds, target risk funds and other strategiestailored to help clients meet their investment goals.
We provide these services using various investment disciplines, including market capitalization (e.g., large-, mid- and small-capequities), term (e.g., long-, intermediate- and short-duration debt securities), and geography (e.g., U.S., international, global andemerging markets), as well as local and regional disciplines in major markets around the world.
As of December 31, 2012, AXA, société anonyme organized under the laws of France and the holding company for an internationalgroup of insurance and related financial services companies, through certain of its subsidiaries (“AXA and its subsidiaries”) ownedapproximately 1.4% of the issued and outstanding units representing assignments of beneficial ownership of limited partnershipinterests in AllianceBernstein Holding L.P. (“Holding Units”).
88 AllianceBernstein

AllianceBernstein L.P. and SubsidiariesNotes to Consolidated Financial Statements (continued)
As of December 31, 2012, the ownership structure of AllianceBernstein, expressed as a percentage of general and limited partner-ship interests, was as follows:
AXA and its subsidiaries 61.0%
Holding 37.5
Unaffiliated holders 1.5
100.0%
AllianceBernstein Corporation (an indirect wholly-owned subsidiary of AXA, “General Partner”) is the general partner of bothAllianceBernstein Holding L.P. (“Holding”) and AllianceBernstein. AllianceBernstein Corporation owns 100,000 general partner-ship units in Holding and a 1% general partnership interest in AllianceBernstein. Including both the general partnership and limitedpartnership interests in Holding and AllianceBernstein, AXA and its subsidiaries had an approximate 65.5% economic interest inAllianceBernstein as of December 31, 2012.
2. Summary of Significant Accounting Policies
Basis of Presentation
The consolidated financial statements have been prepared in accordance with accounting principles generally accepted in the UnitedStates of America. The preparation of the consolidated financial statements requires management to make certain estimates andassumptions that affect the reported amounts of assets and liabilities and disclosure of contingent assets and liabilities at the dates ofthe consolidated financial statements and the reported amounts of revenues and expenses during the reporting periods. Actual resultscould differ from those estimates.
Principles of Consolidation
The consolidated financial statements include AllianceBernstein and its majority-owned and/or controlled subsidiaries. All sig-nificant inter-company transactions and balances among the consolidated entities have been eliminated.
Recently Adopted Accounting Pronouncements
In May 2011, the Financial Accounting Standards Board (“FASB”) issued Accounting Standards Update (“ASU”) No. 2011-04,Fair Value Measurement. The changes to the existing guidance included how and when the valuation premise of highest and best useapplies, the application of premiums and discounts, as well as new required disclosures (included in Note 9). We adopted this standardon January 1, 2012 and there was no material impact on our consolidated financial statements.
In June 2011, the FASB issued ASU No. 2011-05, Presentation of Comprehensive Income. This standard eliminated the option toreport other comprehensive income and its components in the statement of changes in equity. An entity can elect to present itemsof net income and other comprehensive income in one continuous statement or in two separate, but consecutive statements. Thisstandard did not change the items that constitute net income and other comprehensive income, when an item of other compre-hensive income must be reclassified to net income or the earnings per unit computation (which will continue to be based on netincome). We adopted this standard on January 1, 2012 utilizing the two statement approach and there was no material impact onour consolidated financial statements.
In September 2011, the FASB issued ASU No. 2011-08, Testing Goodwill for Impairment. The revised standard was intended toreduce the cost and complexity of the annual goodwill impairment test by providing entities an option to perform a “qualitative”assessment to determine whether further impairment testing is necessary. We adopted this standard on January 1, 2012 and therewas no material impact on our consolidated financial statements.
Annual Report 2012 89
AllianceBernstein L.P. and SubsidiariesNotes to Consolidated Financial Statements (continued)
Reclassifications and Revision
We reclassified prior period Private Client commissions representing payments to third parties, from employee compensation andbenefits expense in the consolidated statements of income to other promotion and servicing expense to conform to the currentyear’s presentation. In addition, unrealized gains (losses) on other investments, previously included in other adjustments to reconcilenet income to net cash provided by operating activities in the consolidated statements of cash flows, is currently shown separately.
During 2012, we identified an error in the classification of Holding’s cash distributions to us on unallocated Holding Units held inour consolidated rabbi trust. As such, we revised the classification of prior period amounts recorded for Holding’s cash distributionsto us on unallocated Holding Units held in our consolidated rabbi trust from due to Holding to additional investments by Holdingin AllianceBernstein in partners’ capital in the consolidated statements of financial condition. In addition, changes in due to Holdingincluded in cash flows from operating activities in prior periods are now presented as additional investments by Holding inAllianceBernstein included in cash flows from financing activities. As of December 31, 2012, the cumulative impact of the revisionon partners’ capital in the consolidated statement of financial condition was $7.9 million. The impact of the revision for 2011 and2010 in the consolidated statements of cash flows was $5.7 million and $2.2 million, respectively. Management concluded that theerror did not, individually or in the aggregate, result in a material misstatement of AllianceBernstein’s consolidated financial state-ments for any prior period.
Variable Interest Entities
In accordance with ASU 2009-17, Consolidation (Topic 810)—Improvements to Financial Reporting by Enterprises Involved with VariableInterest Entities, the determination of whether a company is required to consolidate an entity is based on, among other things, anentity’s purpose and design, a company’s ability to direct the activities of the entity that most significantly impact the entity’s eco-nomic performance, and whether a company is obligated to absorb losses or receive benefits that could potentially be significant tothe entity. The standard also requires ongoing assessments of whether a company is the primary beneficiary of a variable interestentity (“VIE”). The provisions of this standard became effective January 1, 2010. In January 2010, the FASB deferred portions ofASU 2009-17 that relate to asset managers. We determined that all entities for which we are a sponsor and/or investment manager,other than collateralized debt obligations and collateralized loan obligations (collectively “CDOs”), qualify for the scope deferraland will continue to be assessed for consolidation under prior accounting guidance for consolidation of variable interest entities.
As of December 31, 2012, we were the investment manager for five CDOs that meet the definition of a VIE due primarily to thelack of unilateral decision-making authority of the equity holders. The CDOs are alternative investment vehicles created for the solepurpose of issuing collateralized debt instruments that offer investors the opportunity for returns that vary with the risk level of theirinvestment. Our management fee structure for these CDOs will typically include a senior management fee, and may also includesubordinated and incentive management fees. We hold no equity interest in any of these CDOs. For each of the CDOs, we eval-uated the management fee structure, the current and expected economic performance of the entities and other provisions includedin the governing documents of the CDOs that might restrict or guarantee an expected loss or residual return. In accordance withASC 810, Consolidation, we concluded that our investment management contract does not represent a variable interest in four of thefive CDOs. As such, we are not required to consolidate these entities.
For the remaining CDO, we concluded our collateral management agreement represented a variable interest primarily due to thelevel of subordinated fees. We evaluated whether we possessed both of the following characteristics of a controlling financial inter-est: (1) the power to direct the activities of the VIE that most significantly impact the entity’s economic performance, and (2) theobligation to absorb losses of the entity or the right to receive benefits from the entity that could potentially be significant to theVIE. We determined that we possessed the decision-making power noted in criteria (1).
In evaluating criteria (2), we considered all facts regarding the design, terms and characteristics of the CDO and concluded that wedo not meet the criteria. Our conclusion was based on the following quantitative and qualitative factors: (a) we have no involve-ment with the CDO beyond providing investment management services, (b) we hold no equity or debt interests in the CDO,(c) we are not a transferor of any of the assets of the CDO, (d) our expected aggregate fees in future periods are insignificant relativeto the expected cash flows of the CDO, (e) the variability of our expected fees in relation to the expected cash flows of the CDO is
90 AllianceBernstein

AllianceBernstein L.P. and SubsidiariesNotes to Consolidated Financial Statements (continued)
insignificant, (f) our maximum exposure to loss for the CDO is our investment management fee, which is based upon the fair valueof the CDO’s assets, (g) the CDO has no recourse against us for any losses sustained in the CDO structure, (h) we have not pro-vided, nor do we expect to provide, any financial or other support to the CDO, and (i) there are no liquidity arrangements, guaran-tees and/or other commitments by third parties that would impact our variable interest in the CDO. As such, we do not have acontrolling financial interest in the CDO and we should not consolidate the CDO into our consolidated financial statements. Thecash, collateral investments (at fair value) and notes payable (at amortized cost) as of December 31, 2012 of this CDO were $21.4million, $313.8 million and $317.1 million, respectively.
For the entities that meet the scope deferral, management reviews its agreements quarterly and its investments in, and other financialarrangements with, certain entities that hold client assets under management (“AUM”) to determine the variable interest entitiesthat the company is required to consolidate. These entities include certain mutual fund products, hedge funds, structured products,group trusts, collective investment trusts and limited partnerships. We earn investment management fees on AUM of these entities,but we derive no other benefit from the AUM and cannot use them in our operations.
As of December 31, 2012, we have significant variable interests in certain structured products and hedge funds with approximately$21.9 million in AUM. However, these VIEs do not require consolidation because management has determined that we are not theprimary beneficiary of the expected losses or expected residual returns of these entities. Our maximum exposure to loss is limited toour investment of $0.1 million in these entities.
Cash and Cash Equivalents
Cash and cash equivalents include cash on hand, demand deposits, money market accounts, overnight commercial paper and highlyliquid investments with original maturities of three months or less. Due to the short-term nature of these instruments, the recordedvalue has been determined to approximate fair value.
Fees Receivable, Net
Fees receivable are shown net of allowances. An allowance for doubtful accounts related to investment advisory and services fees isdetermined through an analysis of the aging of receivables, assessments of collectibility based on historical trends and other qual-itative and quantitative factors, including the following: our relationship with the client, the financial health (or ability to pay) of theclient, current economic conditions and whether the account is closed or active. The allowance for doubtful accounts is notmaterial to fees receivable.
Collateralized Securities Transactions
Customers’ securities transactions are recorded on a settlement date basis, with related commission income and expenses reported ona trade date basis. Receivables from and payables to clients include amounts due on cash and margin transactions. Securities ownedby customers are held as collateral for receivables; such collateral is not reflected in the consolidated financial statements. We havethe ability by contract or custom to sell or re-pledge this collateral, and have done so at various times. As of December 31, 2012,the fair value of these securities re-pledged was $2.7 million. Principal securities transactions and related expenses are recorded on atrade date basis.
Securities borrowed and securities loaned by Sanford C. Bernstein & Co., LLC (“SCB LLC”) and Sanford C. Bernstein Limited(“SCBL”), each of which is our indirect wholly-owned subsidiary, are recorded at the amount of cash collateral advanced orreceived in connection with the transaction and are included in receivables from and payables to brokers and dealers in the con-solidated statements of financial condition. Securities borrowed transactions require SCB LLC and SCBL to deposit cash collateralwith the lender. As of December 31, 2012 and 2011, cash collateral on deposit with lenders was $106.3 million and $34.9 million,respectively. With respect to securities loaned, SCB LLC and SCBL receive cash collateral from the borrower. As of December 31,2012 and 2011, cash collateral received from borrowers was $12.5 million and $151.6 million, respectively. The initial collateraladvanced or received approximates or is greater than the fair value of securities borrowed or loaned. SCB LLC and SCBL monitor
Annual Report 2012 91

AllianceBernstein L.P. and SubsidiariesNotes to Consolidated Financial Statements (continued)
the fair value of the securities borrowed and loaned on a daily basis and request additional collateral or return excess collateral, asappropriate. As of December 31, 2012 and 2011, there is no allowance provision required for the collateral advanced. Income orexpense is recognized over the life of the transactions.
As of December 31, 2012 and 2011, we had $25.8 million and $16.8 million, respectively, of cash on deposit with clearing orga-nizations for trade facilitation purposes. In addition, as of December 31, 2012 and 2011, SCB LLC held U.S. Treasury Bills withvalues totaling $28.0 million and $38.0 million, respectively, in its investment account which are pledged as collateral with clearingorganizations. These clearing organizations have the ability by contract or custom to sell or re-pledge this collateral.
Investments
Investments include United States Treasury Bills, unconsolidated mutual funds and limited partnership hedge funds we sponsor andmanage, various separately-managed portfolios comprised of equity and fixed income securities, exchange-traded options andinvestments owned by a consolidated venture capital fund in which we own a controlling interest as the general partner and a 10%limited partnership interest.
Investments in United States Treasury Bills, mutual funds, and equity and fixed income securities are classified as either trading oravailable-for-sale securities. Trading investments are stated at fair value with unrealized gains and losses reported in investment gainsand losses on the consolidated statements of income. Available-for-sale investments are stated at fair value with unrealized gains andlosses reported as a separate component of accumulated other comprehensive income in partners’ capital. Realized gains and losseson the sale of investments are reported in investment gains and losses on the consolidated statements of income. Average cost is usedto determine realized gain or loss on investments sold.
We use the equity method of accounting for investments in limited partnership hedge funds. The equity in earnings of our limitedpartnership hedge fund investments is reported in investment gains and losses on the consolidated statements of income.
The investments owned by our consolidated venture capital fund are generally illiquid and are initially valued at cost. These invest-ments are adjusted to fair value to reflect the occurrence of “significant developments” (i.e., capital transactions or business,economic or market events). Adjustments to fair value are reported in investment gains and losses on the consolidated statements ofincome. There are three private equity investments that we own directly outside of our consolidated venture capital fund. One ofthe investments is accounted for using the cost method; the other two are accounted for at fair value.
See Note 9 for a description of how we measure the fair value of our investments.
Furniture, Equipment and Leasehold Improvements, Net
Furniture, equipment and leasehold improvements are stated at cost, less accumulated depreciation and amortization. Depreciation isrecognized on a straight-line basis over the estimated useful lives of eight years for furniture and three to six years for equipment andsoftware. Leasehold improvements are amortized on a straight-line basis over the lesser of their estimated useful lives or the terms ofthe related leases.
Goodwill
In 2000, AllianceBernstein acquired the business and assets of SCB Inc., an investment research and management company formerlyknown as Sanford C. Bernstein Inc. (“Bernstein”), and assumed the liabilities of Bernstein (“Bernstein Transaction”). The pur-chase price consisted of a cash payment of approximately $1.5 billion and 40.8 million newly-issued AllianceBernstein Units. TheBernstein Transaction was accounted for under the purchase method and the cost of the acquisition was allocated on the basis of theestimated fair value of the assets acquired and the liabilities assumed. The excess of the purchase price over the fair value of identifi-able assets acquired, net of liabilities assumed, resulted in the recognition of goodwill of approximately $3.0 billion.
As of December 31, 2012, goodwill of $3.0 billion on the consolidated statement of financial condition included $2.8 billion as aresult of the Bernstein Transaction and $154 million in regard to various smaller acquisitions. We have determined thatAllianceBernstein has only one reporting segment and reporting unit.
92 AllianceBernstein
AllianceBernstein L.P. and SubsidiariesNotes to Consolidated Financial Statements (continued)
We test our goodwill annually, as of September 30, for impairment. As of September 30, 2012, the impairment test indicated thatgoodwill was not impaired. The carrying value of goodwill is also reviewed if facts and circumstances occur that suggest possibleimpairment, such as significant declines in AUM, revenues, earnings or the price of a Holding Unit.
The impairment test is a two-step process. The first step of the goodwill impairment test is used to identify potential impairment bycomparing the fair value of AllianceBernstein, the reporting unit, with its carrying value, including goodwill. If the fair value of thereporting unit exceeds its carrying value, goodwill is considered not impaired and the second step of the impairment test is not per-formed. However, if the carrying value of the reporting unit exceeds its fair value, the second step of the goodwill impairment testis performed to measure the amount of impairment loss, if any. The second step compares the implied fair value of the reportingunit to the aggregated fair values of its individual assets and liabilities to determine the amount of impairment, if any.
As of September 30, 2012, AllianceBernstein estimated its fair value under both the market approach and income approach. Thetypes of assumptions and methodologies used under both approaches were consistent with those used in impairment tests performedin prior periods. Under the market approach, the fair value of the reporting unit was based on its unadjusted market valuation(AllianceBernstein Units outstanding multiplied by the price of a Holding Unit) and adjusted market valuations assuming a controlpremium and earnings multiples. The price of a publicly-traded AllianceBernstein Holding Unit serves as a reasonable starting pointfor valuing an AllianceBernstein Unit because each represents the same fractional interest in our underlying business. On anunadjusted basis, AllianceBernstein’s fair value per unit as of September 30, 2012 was $15.41 (the price of a Holding Unit as of thatdate) as compared to its carrying value, or book value, of $14.09 per unit. Also under the market approach, we typically assume acontrol premium of 10% - 20% for the reporting unit, which was determined based on an analysis of control premiums for relevantrecent acquisitions, as well as comparable industry earnings multiples applied to our current earnings forecast. A control premiumwas not needed in this analysis for fair value to exceed carrying value. Under the income approach, the fair value of the reportingunit was based on the present value of estimated future cash flows. Determining estimated fair value using a discounted cash flowvaluation technique consists of applying business growth rate assumptions over the estimated life of the goodwill asset and then dis-counting the resulting expected cash flows using an estimated weighted average cost of capital of market participants to arrive at apresent value amount that approximates fair value. In our tests, our discounted expected cash flow model used management’s cur-rent five-year business plan, which factored in current market conditions and all material events that had impacted, or that webelieved at the time could potentially impact, future expected cash flows and a declining annual growth rate thereafter for threeyears before using a terminal value growth rate. We ran multiple discounted cash flow analyses under several scenarios. We used aweighted average cost of equity ranging from 7% to 10% as the discount rate. We used a cost of equity rate, as opposed to a cost ofcapital, due to using net income in our expected cash flow model (as a result of generally distributing 100% of our earnings). Thecost of debt is already factored into the net income projections. We used terminal value growth rates ranging from 2% to 4%, andwe used our business plan growth rates as a base case and at stressed levels approximately 50% lower, as a result of current economicuncertainty and market dynamics.
Management considered the results of the market approach and income approach analysis performed along with a number of otherfactors (including current market conditions) and determined that AllianceBernstein’s fair value exceeded its carrying value as ofSeptember 30, 2012 by approximately 9% using the market approach (excluding any control premium), and by more than 50%using the income approach (using the most stressed scenarios). As such, no goodwill impairment existed and the second step of thegoodwill impairment test was not required.
As a result of increased economic uncertainty and current market dynamics, determining whether an impairment of the goodwillasset exists requires management to exercise significant judgment. In addition, to the extent that securities valuations are depressedfor prolonged periods of time and market conditions worsen, or if we experience significant net redemptions, our AUM, revenues,profitability and unit price may be adversely affected. Although the price of a Holding Unit is just one factor in the calculation offair value, if current Holding Unit price levels decline significantly, reaching the conclusion that fair value exceeds carrying valuewill, over time, become more difficult. In addition, control premiums, industry earnings multiples and discount rates are impactedby economic conditions. As a result, subsequent impairment tests may occur more frequently and be based on more negativeassumptions and future cash flow projections, and may result in an impairment of goodwill. Any impairment could reduce materi-ally the recorded amount of this asset, with a corresponding charge to our earnings.
Annual Report 2012 93
AllianceBernstein L.P. and SubsidiariesNotes to Consolidated Financial Statements (continued)
Intangible Assets, Net
Intangible assets consist primarily of costs assigned to acquired investment management contracts of SCB Inc. based on their esti-mated fair value at the time of acquisition, less accumulated amortization. As of December 31, 2012, intangible assets, net ofaccumulated amortization, of $169.2 million on the consolidated statement of financial condition was composed of $166.7 millionof definite-lived intangible assets subject to amortization, of which $160.4 million relates to the Bernstein Transaction, and $2.5million of indefinite-lived intangible assets not subject to amortization in regard to a smaller acquisition. Intangible assets are recog-nized at fair value and are generally amortized on a straight-line basis over their estimated useful life of approximately 20 years. Thegross carrying amount of intangible assets totaled $425.3 million as of December 31, 2012 and $424.7 million as of December 31,2011, and accumulated amortization was $256.1 million as of December 31, 2012 and $234.7 million as of December 31, 2011,resulting in the net carrying amount of intangible assets subject to amortization of $169.2 million as of December 31, 2012 and$190.0 million as of December 31, 2011. Amortization expense was $21.4 million for 2012, $21.4 million for 2011 and $21.3 mil-lion for 2010. Estimated annual amortization expense for each of the next five years is approximately $22 million.
We periodically review intangible assets for impairment as events or changes in circumstances indicate that the carrying value maynot be recoverable. If the carrying value exceeds fair value, additional impairment tests are performed to measure the amount of theimpairment loss, if any.
Deferred Sales Commissions, Net
We pay commissions to financial intermediaries in connection with the sale of shares of open-end company-sponsored mutual fundssold without a front-end sales charge (“back-end load shares”). These commissions are capitalized as deferred sales commissionsand amortized over periods not exceeding five and one-half years for U.S. fund shares and four years for non-U.S. fund shares, theperiods of time during which deferred sales commissions are generally recovered. We recover these commissions from distributionservices fees received from those funds and from contingent deferred sales commissions (“CDSC”) received from shareholders ofthose funds upon the redemption of their shares. CDSC cash recoveries are recorded as reductions of unamortized deferred salescommissions when received. Since January 31, 2009, our U.S. mutual funds have not offered back-end load shares to new investors.However, our non-U.S. funds continue to offer back-end load shares.
We periodically review the deferred sales commission asset for impairment as events or changes in circumstances indicate that thecarrying value may not be recoverable. If the carrying value exceeds fair value, additional impairment tests are performed to meas-ure the amount of the impairment loss, if any.
Loss Contingencies
With respect to all significant litigation matters, we consider the likelihood of a negative outcome. If we determine the likelihood ofa negative outcome is probable, and the amount of the loss can be reasonably estimated, we record an estimated loss for theexpected outcome of the litigation. If the likelihood of a negative outcome is reasonably possible and we are able to determine anestimate of the possible loss or range of loss in excess of amounts already accrued, if any, we disclose that fact together with theestimate of the possible loss or range of loss. However, it is often difficult to predict the outcome or estimate a possible loss or rangeof loss because litigation is subject to inherent uncertainties, particularly when plaintiffs allege substantial or indeterminate damages,the litigation is in its early stages, or when the litigation is highly complex or broad in scope. In such cases, we disclose that we areunable to predict the outcome or estimate a possible loss or range of loss.
Revenue Recognition
Investment advisory and services fees, generally calculated as a percentage of AUM, are recorded as revenue as the related servicesare performed. Certain investment advisory contracts, including those associated with hedge funds or other alternative investments,provide for a performance-based fee, in addition to a base advisory fee, which is calculated as either a percentage of absoluteinvestment results or a percentage of investment results in excess of a stated benchmark over a specified period of time.Performance-based fees are recorded as a component of revenue at the end of each contract’s measurement period.
94 AllianceBernstein
AllianceBernstein L.P. and SubsidiariesNotes to Consolidated Financial Statements (continued)
We calculate AUM using established fair valuation methodologies, including market-based valuation methods and fair valuationmethods. Market-based valuation methods include: last sale/settle prices from an exchange for actively-traded listed equities, optionsand futures; evaluated bid prices from recognized pricing vendors for fixed income, asset-backed or mortgage-backed issues; midprices from recognized pricing vendors and brokers for credit default swaps; and quoted bids or spreads from pricing vendors andbrokers for other derivative products. Fair valuation methods include discounted cash flow models, evaluation of assets versusliabilities or any other methodology that is validated and approved by our Valuation Committee. Fair valuation methods are usedonly where AUM cannot be valued using market-based valuation methods, such as in the case of private equity or illiquid securities.Investments utilizing fair valuation methods typically make up an insignificant amount of our total AUM. Recent market volatilityhas not had a significant effect on our ability to acquire market data and, accordingly, our ability to use market-based valuationmethods.
The Valuation Committee, which is composed of senior officers and employees, is responsible for overseeing the pricing and valu-ation of all investments held in client and AllianceBernstein portfolios. The Valuation Committee has adopted a Statement of Pric-ing Policies describing principles and policies that apply to pricing and valuing investments held in these portfolios. We have alsoestablished a Pricing Group, which reports to the Valuation Committee. The Valuation Committee has delegated to the PricingGroup responsibility for overseeing the pricing process for all investments.
Bernstein Research Services revenue consists primarily of brokerage commissions received by SCB LLC and SCBL for research andbrokerage-related services provided to institutional investors. Brokerage commissions earned and related expenses are recorded on atrade-date basis.
Distribution revenues, shareholder servicing fees (included in other revenues), and dividend and interest income are accrued asearned.
Mutual Fund Underwriting Activities
Purchases and sales of shares of company-sponsored mutual funds in connection with the underwriting activities of our subsidiaries,including related commission income, are recorded on trade date. Receivables from brokers and dealers for sale of shares ofcompany-sponsored mutual funds are generally realized within three business days from trade date, in conjunction with thesettlement of the related payables to company-sponsored mutual funds for share purchases. Distribution plan and other promotionand servicing payments are recognized as expense when incurred.
Long-term Incentive Compensation Plans
We maintain several unfunded, non-qualified long-term incentive compensation plans under which annual awards to employees aremade generally in the fourth quarter.
For awards made before 2009, participants were permitted to allocate their awards: (i) among notional investments in HoldingUnits, certain of the investment services we provided to our clients and a money market fund or (ii) under limited circumstances, inoptions to buy Holding Units.
• We made investments in our services that were notionally elected by participants and maintained them in a consolidated rabbitrust or separate custodial account.
• Awards generally vested over four years but could vest more quickly depending on the terms of the individual award, the age ofthe participant, or the terms of the participant’s employment, separation or retirement agreement. Upon vesting, an award isdistributed to the participant unless the participant has made a voluntary long-term election to defer receipt.
• Quarterly cash distributions on unvested Holding Units for which a long-term deferral election has not been made are paidcurrently to participants. Quarterly cash distributions on notional investments in Holding Units and income credited onnotional investments in our investment services or the money market fund for which a long-term deferral election has beenmade are reinvested and distributed as elected by participants.
Annual Report 2012 95

AllianceBernstein L.P. and SubsidiariesNotes to Consolidated Financial Statements (continued)
• Prior to a fourth quarter 2011 amendment made to all outstanding long-term incentive compensation awards of active employ-ees (discussed below), compensation expense for awards under the plans, including changes in participant account balances result-ing from gains and losses on related investments (other than in Holding Units and options to buy Holding Units), wasrecognized on a straight-line basis over the applicable vesting periods. Mark-to-market gains or losses on investments made tofund long-term incentive compensation obligations (other than in Holding Units and options to buy Holding Units) were, andcontinue to be, recognized as investment gains (losses) in the consolidated statements of income. In addition, our equity in theearnings of investments in limited partnership hedge funds made to fund long-term incentive compensation obligations was, andcontinues to be, recognized as investment gains (losses) in the consolidated statements of income.
Awards in 2010 and 2009 consisted solely of restricted Holding Units and deferred cash. (In 2010, deferred cash was an optionavailable only to certain non-U.S. employees.)
• We engaged in open-market purchases of Holding Units, or purchased newly-issued Holding Units from Holding, that wereawarded to participants and held in a consolidated rabbi trust.
• Upon vesting, awards are distributed to the participant unless the participant has made a voluntary long-term election to deferreceipt.
• Quarterly cash distributions on vested and unvested Holding Units are paid currently to participants, regardless of whether ornot a long-term deferral election has been made.
• Prior to a fourth quarter 2011 amendment made to all outstanding long-term incentive compensation awards of active employ-ees (discussed below), compensation expense for awards under the plans was recognized on a straight-line basis over the applicablevesting periods.
Awards in December 2012 and 2011 allowed participants to allocate their awards between restricted Holding Units and deferredcash. Participants (except certain members of senior management) generally could allocate up to 50% of their awards to deferredcash, not to exceed a total of $250,000 per award, and had until mid-January 2013 and 2012, respectively, to make their elections.The number of restricted Holding Units issued equaled the remaining dollar value of the award divided by the average of the clos-ing prices of a Holding Unit for a five business day period in January after participants made their elections each year.
• We engaged in open-market purchases of Holding Units, or purchased newly-issued Holding Units from Holding, that wereawarded to participants and held them in a consolidated rabbi trust.
• Quarterly distributions on vested and unvested Holding Units are paid currently to participants, regardless of whether or not along-term deferral election has been made.
• Interest on deferred cash is accrued monthly based on our monthly weighted average cost of funds.
During the fourth quarter of 2011, we implemented changes to our employee long-term incentive compensation award program toensure that our compensation practices are competitive, and to better align the costs of employee compensation and benefits withour current year financial performance and provide employees with a higher degree of certainty that they will receive the incentivecompensation they are awarded. Specifically, we amended all outstanding year-end long-term incentive compensation awards ofactive employees, so that employees who terminate their employment or are terminated without cause may retain their award, sub-ject to compliance with certain agreements and restrictive covenants set forth in the applicable award agreement, includingrestrictions on competition and employee and client solicitation, and a claw-back for failing to follow existing risk managementpolicies. Most equity replacement, sign-on or similar deferred compensation awards included in separate employment agreements orarrangements were not amended in 2011 to reflect these changes.
We recognize compensation expense related to equity compensation grants in the financial statements using the fair value method.Fair value of restricted Holding Unit awards is the closing price of a Holding Unit on the grant date; fair value of options isdetermined using the Black-Scholes option valuation model. Under the fair value method, compensatory expense is measured at thegrant date based on the estimated fair value of the award and is recognized over the required service period. Prior to the changesmade to the employee long-term incentive compensation award program in the fourth quarter of 2011, an employee’s servicerequirement was typically the same as the delivery dates. These changes eliminated employee service requirements, but did notmodify delivery dates contained in the original award agreements.
96 AllianceBernstein

AllianceBernstein L.P. and SubsidiariesNotes to Consolidated Financial Statements (continued)
As a result of these changes, we recorded a one-time, non-cash charge of $587.1 million in the fourth quarter of 2011 for allunrecognized long-term incentive compensation on the amended outstanding awards from prior years. In addition, upon approvaland communication of the dollar value of the 2011 awards in December 2011, we recorded 100% of the expense associated withour 2011 long-term incentive compensation awards of $159.9 million. In January 2012, 8.7 million restricted Holding Units held inthe consolidated rabbi trust were awarded for the 2011 awards and we reclassified $130.3 million of the liability to partners’ capitalas equity-based awards.
During 2012, we recorded $150.1 million of expense associated with our 2012 long-term incentive compensation awards. In Jan-uary 2013, 6.5 million restricted Holding Units held in the consolidated rabbi trust were awarded for the 2012 awards and wereclassified $129.2 million of the liability to partners’ capital as equity-based awards.
Awards granted in 2012 and 2011 contained the provisions described above and we expect to include these provisions in long-termincentive compensation awards in future years. Accordingly, our annual incentive compensation expense will reflect 100% of theexpense associated with the long-term incentive compensation awarded in each year. This approach to expense recognition willmore closely match the economic cost of awarding long-term incentive compensation to the period in which the related service isperformed.
Grants of restricted Holding Units and options to buy Holding Units are typically awarded to eligible members of the Board ofDirectors (“Eligible Directors”) of the General Partner during the second quarter. Restricted Holding Units vest on the thirdanniversary of the grant date and the options become exercisable ratably over three years. These restricted Holding Units andoptions are not forfeitable (except if the Eligible Director is terminated for “Cause”, as that term is defined in the applicable awardagreement). Due to there being no service requirement, we fully expense these awards on each grant date.
We fund our restricted Holding Unit awards either by purchasing Holding Units on the open market or purchasing newly-issuedHolding Units from Holding, all of which are then held in a consolidated rabbi trust until they are distributed to employees uponvesting. In accordance with the Amended and Restated Agreement of Limited Partnership of AllianceBernstein(“AllianceBernstein Partnership Agreement”), when AllianceBernstein purchases newly-issued Holding Units from Holding,Holding is required to use the proceeds it receives from AllianceBernstein to purchase the equivalent number of newly-issuedAllianceBernstein Units, thus increasing its percentage ownership interest in AllianceBernstein. Holding Units held in the con-solidated rabbi trust are corporate assets in the name of the trust and are available to the general creditors of AllianceBernstein.
During 2012 and 2011, we purchased 15.7 million and 13.5 million Holding Units for $238.0 million and $220.8 million,respectively. These amounts reflect open-market purchases of 12.3 million and 11.1 million Holding Units for $182.3 million and$192.1 million, respectively, with the remainder relating to purchases of Holding Units from employees to allow them to fulfillstatutory tax withholding requirements at the time of distribution of long-term incentive compensation awards, offset by HoldingUnits purchased by employees as part of a distribution reinvestment election.
Since the third quarter of 2011, we have implemented plans each quarter to repurchase Holding Units pursuant to Rule 10b5-1under the Securities Exchange Act of 1934, as amended (“Exchange Act”). A Rule 10b5-1 plan allows a company to repurchase itsshares at times when it otherwise might be prevented from doing so because of self-imposed trading blackout periods and because itpossesses material non-public information. Each broker we select has the authority under the terms and limitations specified in theplan to repurchase Holding Units on our behalf in accordance with the terms of the plan. Repurchases are subject to SEC regu-lations as well as certain price, market volume and timing constraints specified in the plan. The plan adopted during the fourth quar-ter of 2012 does not specify an aggregate limitation and expires at the close of business on February 11, 2013. We intend to adoptadditional Rule 10b5-1 plans so that we can continue to engage in open-market purchases of Holding Units to help fund antici-pated obligations under our incentive compensation award program and for other corporate purposes.
We granted to employees and Eligible Directors 12.1 million restricted Holding Unit awards (including 2.7 million granted in June2012 to Peter Kraus, our Chief Executive Officer, in connection with his extended employment agreement and 8.7 million grantedin January 2012 for 2011 year-end awards) and 1.7 million restricted Holding Unit awards during 2012 and 2011, respectively. Tofund these awards, we allocated previously repurchased Holding Units that had been held in the consolidated rabbi trust. The 2012and 2011 long-term incentive compensation awards allowed most employees to allocate their awards between restricted Holding
Annual Report 2012 97

AllianceBernstein L.P. and SubsidiariesNotes to Consolidated Financial Statements (continued)
Units and deferred cash. As a result, 6.5 million restricted Holding Unit awards for the December 2012 awards and 8.7 millionrestricted Holding Unit awards for the December 2011 awards were awarded and allocated as such within the consolidated rabbitrust in January 2013 and 2012, respectively. There were approximately 17.9 million and 12.0 million unallocated Holding Unitsremaining in the consolidated rabbi trust as of December 31, 2012 and January 31, 2013, respectively. The balance as of January 31,2013 also reflects repurchases and other activity during January 2013.
Foreign Currency Translation
Assets and liabilities of foreign subsidiaries are translated into United States dollars (“US$”) at exchange rates in effect at the balancesheet dates, and related revenues and expenses are translated into US$ at average exchange rates in effect during each period. Netforeign currency gains and losses resulting from the translation of assets and liabilities of foreign operations into US$ are reported asa separate component of other comprehensive income in the consolidated statements of comprehensive income. Net foreign cur-rency transaction gains (losses) were $(1.1) million, $(2.4) million and $1.3 million for 2012, 2011 and 2010, respectively.
Cash Distributions
AllianceBernstein is required to distribute all of its Available Cash Flow, as defined in the AllianceBernstein Partnership Agreement,to its unitholders and to the General Partner. Available Cash Flow can be summarized as the cash flow received byAllianceBernstein from operations minus such amounts as the General Partner determines, in its sole discretion, should be retainedby AllianceBernstein for use in its business, or plus such amounts as the General Partner determines, in its sole discretion, should bereleased from previously retained cash flow.
The General Partner computes cash flow received from operations by determining the sum of:
• net cash provided by operating activities of AllianceBernstein,
• proceeds from borrowings and from sales or other dispositions of assets in the ordinary course of business, and
• income from investments in marketable securities, liquid investments and other financial instruments that are acquired forinvestment purposes and that have a value that may be readily established,
and then subtracting from this amount the sum of:
• payments in respect of the principal of borrowings, and
• amounts expended for the purchase of assets in the ordinary course of business.
On February 12, 2013, the General Partner declared a distribution of $106.6 million, or $0.38 per AllianceBernstein Unit, represent-ing a distribution of Available Cash Flow for the three months ended December 31, 2012. The General Partner, as a result of its 1%general partnership interest, is entitled to receive 1% of each distribution. The distribution is payable on March 14, 2013 to holdersof record on February 22, 2013. This distribution excludes $38.9 million of non-cash real estate charges recorded in the fourthquarter of 2012.
Total cash distributions per Unit paid to the General Partner and unitholders during 2012, 2011 and 2010 were $1.15, $1.70 and$1.79, respectively.
Comprehensive Income
We report all changes in comprehensive income in the consolidated statements of comprehensive income. Comprehensive incomeincludes net income, as well as unrealized gains and losses on investments classified as available-for-sale, foreign currency translationadjustments, and unrecognized actuarial net losses and transition assets. Deferred taxes are not recognized on foreign currency trans-lation adjustments for foreign subsidiaries whose earnings are considered permanently invested outside the United States.
98 AllianceBernstein

AllianceBernstein L.P. and SubsidiariesNotes to Consolidated Financial Statements (continued)
3. Real Estate Charges
Since the fourth quarter of 2008, we consistently have taken steps to reduce our cost structure, including headcount reductions, andthe consolidation of office locations, in response to declines in our AUM and fee revenues.
During 2010, we performed a comprehensive review of our real estate requirements in New York in connection with our workforcereductions commencing in 2008. As a result, during 2010 we decided to sub-lease over 380,000 square feet in New York(approximately 80% of this space has been sublet) and largely consolidate our New York-based employees into two office locationsfrom three. We recorded pre-tax real estate charges of $101.7 million in 2010 that reflected the net present value of the differencebetween the amount of our ongoing contractual operating lease obligations for this space and our estimate of current market rental rates($76.2 million), as well as the write-off of leasehold improvements, furniture and equipment related to this space ($25.5 million). Weperiodically review the assumptions and estimates we used in recording these charges.
During 2011, we recorded pre-tax real estate charges totaling $7.2 million for our office space in London, England, New York andother U.S. locations. The London charge was $8.8 million, consisting of a $5.8 million payment to the party to which the lease wasassigned, as well as the write-off of $3.0 million of leasehold improvements, furniture and equipment related to the space. We alsowrote off an additional $1.5 million of leasehold improvements, furniture and equipment related to the New York space and hadmiscellaneous charges of $0.4 million. These charges were offset by a $3.5 million credit we recorded in 2011 due to changes inestimates of our 2010 charge.
During the first six months of 2012, we recorded pre-tax real estate charges totaling $16.1 million, reflecting $8.8 million resultingfrom the abandonment of our leased New York City Data Center office space and $7.3 million resulting from a change in estimatesrelating to previously recorded real estate charges. The New York City Data Center charge consisted of the net present value of thedifference between the amount of ongoing contractual operating lease obligations for this space and our estimate of current marketrental rates ($7.1 million) and the write-off of leasehold improvements, furniture and equipment related to this space ($1.7 million).
During the third quarter of 2012, in an effort to further reduce our global real estate footprint, we completed a comprehensivereview of our worldwide office locations and began implementing a global space consolidation plan. As a result, our intention is tosub-lease approximately 510,000 square feet of office space, over 70% of which is New York office space (in addition to the380,000 square feet written-off in 2010), with the remainder comprised of office space in London, England, Melbourne, Australiaand various U.S. locations. We expect that the actions we are taking to vacate and market space for sublease will result over time inprojected non-cash real estate charges of $225 million to $250 million, with the bulk of the charges having occurred in the thirdand fourth quarters of 2012. These charges are in addition to the earlier non-cash real estate charges for New York City office spacewe recorded, and they did not affect our third and fourth quarter 2012 distributions.
During the third quarter of 2012, we recorded pre-tax real estate charges of $168.1 million, reflecting the net present value of thedifference between the amount of our ongoing contractual operating lease obligations for this space and our estimate of currentmarket rental rates ($131.8 million), as well as the write-off of leasehold improvements, furniture and equipment related to thisspace ($31.3 million), and changes in estimates relating to previously recorded real estate charges ($5.0 million).
During the fourth quarter of 2012, we recorded pre-tax real estate charges of $38.9 million, reflecting the net present value of thedifference between the amount of our ongoing contractual operating lease obligations for this space and our estimate of currentmarket rental rates ($32.0 million), as well as the write-off of leasehold improvements, furniture and equipment related to this space($8.4 million), offset by changes in estimates relating to previously recorded real estate charges of ($1.5 million).
Annual Report 2012 99

AllianceBernstein L.P. and SubsidiariesNotes to Consolidated Financial Statements (continued)
The following table summarizes the activity in the liability account relating to our 2010 and 2012 office space consolidation ini-tiatives for the following periods:
Years Ended December 31,2012 2011
(in thousands)
Balance as of January 1, $ 71,164 $ 89,793
Expense (credit) incurred 181,589 (3,506)
Deferred rent 27,000 2,288
Payments made (42,833) (18,696)
Interest accretion 1,864 1,285
Balance as of end of period $238,784 $71,164
4. Net Income (Loss) Per Unit
Basic net income (loss) per unit is derived by reducing net income (loss) for the 1% general partnership interest and dividing theremaining 99% by the basic weighted average number of units outstanding for each year. Diluted net (loss) income per unit isderived by reducing net income (loss) for the 1% general partnership interest and dividing the remaining 99% by the total of thebasic weighted average number of units outstanding and the dilutive unit equivalents resulting from outstanding compensatoryoptions to buy Holding Units as follows:
Years Ended December 31,2012 2011 2010
(in thousands, except per unit amounts)
Net income (loss) attributable to AllianceBernstein Unitholders $188,916 $(174,768) $442,419
Weighted average units outstanding—basic 277,721 278,018 275,415
Dilutive effect of compensatory options to buy Holding Units 1 — 1,639
Weighted average units outstanding—diluted 277,722 278,018 277,054
Basic net income (loss) per AllianceBernstein Unit $ 0.67 $ (0.62) $ 1.59
Diluted net income (loss) per AllianceBernstein Unit $ 0.67 $ (0.62) $ 1.58
For the years ended December 31, 2012, 2011 and 2010, we excluded 8,438,902, 3,813,567 and 4,783,472 options, respectively,from the diluted net income (loss) per unit computation due to their anti-dilutive effect.
The 2012 net income per unit includes $223.0 million of non-cash real estate charges recorded in 2012. See further discussion above inNote 3, Real Estate Charges.
The 2011 net (loss) per unit includes the one-time, non-cash compensation charge of $587.1 million recorded in the fourth quarterof 2011. See further discussion above in Note 2, Long-term Incentive Compensation Plans.
5. Cash and Securities Segregated Under Federal Regulations and Other Requirements
As of December 31, 2012 and 2011, $1.5 billion and $1.2 billion, respectively, of United States Treasury Bills were segregated in aspecial reserve bank custody account for the exclusive benefit of brokerage customers of SCB LLC under Rule 15c3-3 of theExchange Act.
100 AllianceBernstein

AllianceBernstein L.P. and SubsidiariesNotes to Consolidated Financial Statements (continued)
AllianceBernstein Investments, Inc. (“AllianceBernstein Investments”), an indirect wholly-owned subsidiary of AllianceBernstein andthe distributor of company-sponsored mutual funds, maintains several special bank accounts for the exclusive benefit of customers. Asof December 31, 2012 and 2011, $42.2 million and $39.9 million, respectively, of cash were segregated in these bank accounts.
6. Fees Receivables, Net
Fees receivable, net consists of:December 31,
2012 2011
(in thousands)
AllianceBernstein mutual funds $ 154,415 $ 120,828
Unaffiliated clients (net of allowance of $844 in 2012 and $752 in 2011) 103,392 135,416
Affiliated clients 7,878 9,004
Total fees receivables, net $265,685 $265,248
7. Investments
Investments consist of:December 31,
2012 2011
(in thousands)
Available-for-sale (primarily seed capital) $ 13,361 $ 13,883
Trading:
Long-term incentive compensation-related 90,825 135,832
United States Treasury Bills 27,982 37,998
Seed capital 307,795 278,932
Equities and exchange-traded options 48,937 58,237
Investments in limited partnership hedge funds:
Long-term incentive compensation-related 32,152 40,538
Seed capital 109,328 123,920
Consolidated private equity fund (10% seed capital) 47,045 58,749
Private equity (seed capital) 47,853 35,726
Other 7,056 11,479
Total investments $732,334 $795,294
Total investments related to long-term incentive compensation obligations of $123.0 million and $176.4 million as of December 31,2012 and 2011, respectively, consist of company-sponsored mutual funds and hedge funds. We typically made investments in ourservices that were notionally elected by long-term incentive compensation plan participants and maintained them in a consolidatedrabbi trust or separate custodial account. The rabbi trust and custodial account enable us to hold such investments separate from ourother assets for the purpose of settling our obligations to participants. The investments held in the rabbi trust and custodial accountremain available to the general creditors of AllianceBernstein.
The underlying investments of hedge funds in which we invest include long and short positions in equity securities, fixed incomesecurities (including various agency and non-agency asset-based securities), currencies, commodities and derivatives (including vari-ous swaps and forward contracts). These investments are valued at quoted market prices or, where quoted market prices are notavailable, are fair valued based on the pricing policies and procedures of the underlying funds.
Annual Report 2012 101

AllianceBernstein L.P. and SubsidiariesNotes to Consolidated Financial Statements (continued)
United States Treasury Bills are held by SCB LLC in its investment account, the majority of which are pledged as collateral withclearing organizations. These clearing organizations have the ability by contract or custom to sell or re-pledge this collateral.
We provide seed capital to our investment teams to develop new products and services for our clients.
Trading securities also include long positions in corporate equities and long exchange-traded options traded through our optionsdesk.
The following is a summary of the cost and fair value of available-for-sale and trading investments held as of December 31, 2012and 2011:
AmortizedCost
GrossUnrealized
Gains
GrossUnrealized
LossesFair
Value
(in thousands)
December 31, 2012:
Available-for-sale:
Equity investments $ 5,769 $ 1,445 $ (149) $ 7,065
Fixed income investments 6,265 33 (2) 6,296
$ 12,034 $ 1,478 $ (151) $ 13,361
Trading:
Equity investments $239,368 $32,003 $ (2,830) $268,541
Fixed income investments 199,191 12,098 (4,291) 206,998
$438,559 $44,101 $ (7,121) $475,539
December 31, 2011:
Available-for-sale:
Equity investments $ 6,753 $ 489 $ (342) $ 6,900
Fixed income investments 6,857 133 (7) 6,983
$ 13,610 $ 622 $ (349) $ 13,883
Trading:
Equity investments $375,287 $ 5,959 $(41,938) $339,308
Fixed income investments 172,142 3,475 (3,926) 171,691
$547,429 $ 9,434 $(45,864) $510,999
Proceeds from sales of available-for-sale investments were approximately $0.8 million, $3.5 million and $4.3 million in 2012, 2011and 2010, respectively. Realized gains from our sales of available-for-sale investments were $0.1 million in 2012, $0.1 million in2011 and $0.5 million in 2010. Realized losses from our sales of available-for-sale investments were $0.1 million in 2012, $0.1 mil-lion in 2011 and $0.4 million in 2010. We assess valuation declines to determine the extent to which such declines are fundamentalto the underlying investment or attributable to temporary market-related factors. Based on our assessment, we do not believe thedeclines are other than temporary as of December 31, 2012.
8. Derivative Instruments
We enter into various futures, forwards and swaps to economically hedge certain of our seed money investments. In addition, wehave currency forwards that economically hedge certain cash accounts. We do not hold any derivatives designated in a formal hedgerelationship under ASC 815-10, Derivatives and Hedging.
102 AllianceBernstein

AllianceBernstein L.P. and SubsidiariesNotes to Consolidated Financial Statements (continued)
The following table presents the notional value, fair value and gains and losses recognized in investment gains (losses) in the con-solidated statements of income as of December 31, 2012 and 2011 for derivative instruments not designated as hedging instruments:
NotionalValue
DerivativeAssets
DerivativeLiabilities
Gains(Losses)
(in thousands)
December 31, 2012:
Exchange-traded futures $ 89,901 $ 64 $ 1,598 $ (18,291)
Currency forwards 80,445 473 429 (503)
Interest rate swaps 55,435 73 888 (1,358)
Credit default swaps 53,775 457 272 (8,598)
Option swaps 103 83 92 (424)
Total return swaps 90,673 1,475 3,791 (6,470)
Total derivatives $370,332 $2,625 $7,070 $(35,644)
December 31, 2011:
Exchange-traded futures $ 111,447 $ 127 $ 2,054 $ 8,979
Currency forwards 38,330 358 227 453
Interest rate swaps 47,640 136 3,301 (5,585)
Credit default swaps 84,215 2,962 639 676
Total return swaps 38,148 38 1,038 (184)
Total derivatives $319,780 $3,621 $7,259 $ 4,339
As of December 31, 2012 and 2011, the derivative assets and liabilities are included in both receivables and payables to brokers and dealerson our consolidated statements of financial condition. Gains and losses on derivative instruments are reported in investments gains andlosses on the consolidated statements of income.
We may be exposed to credit-related losses in the event of nonperformance by counterparties to derivative financial instruments.We take steps to minimize our counterparty exposure through a credit review and approval process. In addition, we executed vari-ous collateral arrangements with counterparties to the over-the-counter derivative transactions that require both pledging andaccepting collateral in the form of cash. As of December 31, 2012 and 2011, we held $1.5 million and $4.4 million, respectively, ofcash collateral payable to trade counterparties. This obligation to return cash is reported in payables to brokers and dealers in ourconsolidated statements of financial condition.
Although notional amount is the most commonly used measure of volume in the derivative market, it is not used as a measure of creditrisk. Generally, the current credit exposure of our derivative contracts is limited to the net positive estimated fair value of derivativecontracts at the reporting date after taking into consideration the existence of netting agreements and any collateral received. Aderivative with positive value (a derivative asset) indicates existence of credit risk because the counterparty would owe us if the contractwere closed. Alternatively, a derivative contract with negative value (a derivative liability) indicates we would owe money to the coun-terparty if the contract were closed. Generally, if there is more than one derivative transaction with a single counterparty, a master net-ting arrangement exists with respect to derivative transactions with that counterparty to provide for aggregate net settlement.
Certain of our standardized contracts for over-the-counter derivative transactions (“ISDA Master Agreements”) contain credit riskrelated contingent provisions related to each counterparty’s credit rating. In some ISDA Master Agreements, if the counterparty’scredit rating (or in some agreements, our AUM) falls below a specified threshold, either a default or a termination event permittingthe counterparty to terminate the ISDA Master Agreement would be triggered. In all agreements that provide for collateralization,various levels of collateralization of net liability positions are applicable, depending on the credit rating of the counterparty. As ofDecember 31, 2012 and 2011, we delivered $8.4 million and $14.7 million, respectively, of cash collateral into brokerage accounts,which is reported in cash and cash equivalents in our consolidated statements of financial condition.
Annual Report 2012 103

AllianceBernstein L.P. and SubsidiariesNotes to Consolidated Financial Statements (continued)
9. Fair Value
Fair value is defined as the price that would be received to sell an asset or paid to transfer a liability (i.e., the “exit price”) in an orderlytransaction between market participants at the measurement date. The three broad levels of fair value hierarchy are as follows:
• Level 1—Quoted prices in active markets are available for identical assets or liabilities as of the reported date.
• Level 2—Quoted prices in markets that are not active or other pricing inputs that are either directly or indirectly observable asof the reported date.
• Level 3—Prices or valuation techniques that are both significant to the fair value measurement and unobservable as of thereported date. These financial instruments do not have two-way markets and are measured using management’s best estimate offair value, where the inputs into the determination of fair value require significant management judgment or estimation.
Assets Measured at Fair Value on a Recurring Basis
The following table summarizes the valuation of our financial instruments by pricing observability levels as of December 31, 2012and 2011:
December 31, 2012Level 1 Level 2 Level 3 Total
(in thousands)
Money markets $ 170,120 $ — $ — $ 170,120
U.S. Treasury bills — 1,537,150 — 1,537,150
U.K. Treasury bills — 125 — 125
Equity securities
Growth 125,242 — — 125,242
Value 36,126 — — 36,126
Multi-asset and asset allocation 59,449 — — 59,449
Other(1) 39,702 — — 39,702
Fixed Income securities
Taxable(2) 177,635 1,219 — 178,854
Tax-exempt(3) 5,661 797 — 6,458
Derivatives 64 2,561 — 2,625
Long exchange-traded options 15,087 — — 15,087
Private equity 7,695 — 76,953 84,648
Total assets measured at fair value $636,781 $1,541,852 $76,953 $2,255,586
Securities sold not yet purchased
Short equities-corporate $ 54,370 $ — $ — $ 54,370
Short exchange-traded options 9,197 — — 9,197
Other 271 — — 271
Derivatives 1,598 5,472 — 7,070
Total liabilities measured at fair value $ 65,436 $ 5,472 $ — $ 70,908
104 AllianceBernstein

AllianceBernstein L.P. and SubsidiariesNotes to Consolidated Financial Statements (continued)
December 31, 2011Level 1 Level 2 Level 3 Total
(in thousands)
Money markets $ 340,548 $ — $ — $ 340,548
U.S. Treasury bills — 1,277,944 — 1,277,944
U.K. Treasury bills — 119 — 119
Equity securities
Growth 107,802 189 — 107,991
Value 60,096 9 — 60,105
Blend 118,208 — — 118,208
Other(1) 45,583 — — 45,583
Fixed Income securities
Taxable(2) 110,062 14,488 — 124,550
Tax-exempt(3) 15,366 743 — 16,109
Other 17 — — 17
Derivatives 127 3,494 — 3,621
Long exchange-traded options 14,322 — — 14,322
Private equity 11,592 — 64,466 76,058
Total assets measured at fair value $823,723 $1,296,986 $64,466 $2,185,175
Securities sold not yet purchased
Short equities-corporate $ 34,469 $ — $ — $ 34,469
Short exchange-traded options 3,567 — — 3,567
Other 1,271 — — 1,271
Derivatives 2,054 5,205 — 7,259
Total liabilities measured at fair value $ 41,361 $ 5,205 $ — $ 46,566
(1) Primarily long positions in corporate equities traded through our options desk.
(2) Primarily corporate and government securities.
(3) Primarily municipal bonds.
Following is a description of the fair value methodologies used for instruments measured at fair value, as well as the general classi-fication of such instruments pursuant to the valuation hierarchy:
• Money markets: We invest excess cash in various money market funds that are valued based on quoted prices in active markets;these are included in Level 1 of the valuation hierarchy.
• Treasury bills: We hold United States Treasury Bills, which are primarily segregated in a special reserve bank custody account asrequired by Rule 15c3-3 of the Exchange Act. We also hold United Kingdom Treasury Bills. These securities are valued basedon quoted yields in secondary markets and are included in Level 2 of the valuation hierarchy.
• Equity and fixed income securities: Our equity and fixed income securities consist principally of company-sponsored mutualfunds with net asset values and various separately-managed portfolios consisting primarily of equity and fixed income securitieswith quoted prices in active markets, which are included in Level 1 of the valuation hierarchy. In addition, some securities arevalued based on observable inputs from recognized pricing vendors, which are included in Level 2 of the valuation hierarchy.
• Derivatives: We hold exchange-traded futures with counterparties that are included in Level 1 of the valuation hierarchy. Inaddition, we hold currency forward contracts, interest rate swaps, credit default swaps, option swaps and total return swaps withcounterparties that are included in Level 2 of the valuation hierarchy.
• Options: We hold long exchange-traded options that are included in Level 1 of the valuation hierarchy.
Annual Report 2012 105

AllianceBernstein L.P. and SubsidiariesNotes to Consolidated Financial Statements (continued)
• Private equity: Generally, the valuation of private equity investments owned by our consolidated venture capital fund requiressignificant management judgment due to the absence of quoted market prices, inherent lack of liquidity and the long-termnature of such investments. Private equity investments are valued initially at cost. The carrying values of private equity invest-ments are adjusted either up or down from cost to reflect expected exit values as evidenced by financing and sale transactionswith third parties, or when determination of a valuation adjustment is confirmed through ongoing review in accordance withour valuation policies and procedures. A variety of factors are reviewed and monitored to assess positive and negative changes invaluation including, but not limited to, current operating performance and future expectations of investee companies, industryvaluations of comparable public companies, changes in market outlooks and the third party financing environment over time.In determining valuation adjustments resulting from the investment review process, particular emphasis is placed on currentcompany performance and market conditions. For these reasons, which make the fair value of private equity investmentsunobservable, equity investments are included in Level 3 of the valuation hierarchy. However, if private equity investmentsowned by our consolidated venture capital fund become publicly-traded, they are included in Level 1 of the valuation hier-archy. Also, if they contain trading restrictions, publicly-traded equity investments are included in Level 2 of the valuation hier-archy. One of our private securities went public in the first quarter of 2011 and, due to a trading restriction period, $3.6 millionwas transferred from a Level 3 classification to a Level 2 classification. During the second quarter of 2011, the trading restrictionperiod for one of our public securities lapsed, and, as a result, $20.6 million was transferred from a Level 2 classification to aLevel 1 classification. During the third quarter of 2011, the trading restriction period for one of our public securities lapsed, and,as a result, $3.7 million was transferred from a Level 2 classification to a Level 1 classification. During the first quarter of 2012,one of our private securities went public and, due to a trading restriction period, $13.5 million was transferred from a Level 3classification to a Level 2 classification. During the third quarter of 2012, the trading restriction period for one of our publicsecurities lapsed and, as a result, $6.0 million was transferred from a Level 2 classification to a Level 1 classification.
• Securities sold not yet purchased: Securities sold not yet purchased, primarily reflecting short positions in equities and exchange-traded options, are included in Level 1 of the valuation hierarchy.
The following table summarizes the change in carrying value associated with Level 3 financial instruments carried at fair value:December 31,
2012 2011
(in thousands)
Balance as of beginning of period $ 64,466 $ 59,414
Transfers (out) in, net (13,548) (3,588)
Purchases 19,660 10,002
Sales (1,823) (214)
Realized gains (losses), net (7,524) (3,106)
Unrealized gains (losses), net 15,722 1,958
Balance as of end of period $76,953 $64,466
Transfers into and out of all levels of the fair value hierarchy are reflected at end-of-period fair values. Realized and unrealized gainsand losses on Level 3 financial instruments are recorded in investment gains and losses in the consolidated statements of income. Amajority of the Level 3 investments are private equity investments owned by our consolidated venture capital fund, of which weown 10% and non-controlling interests own 90%.
106 AllianceBernstein

AllianceBernstein L.P. and SubsidiariesNotes to Consolidated Financial Statements (continued)
The following table provides quantitative information about Level 3 fair value measurements:Fair Value
as ofDecember 31,
2012 Valuation TechniqueUnobservable
Input Range
(in thousands)
Private Equity:
Technology, Media and Telecommunications $23,256 Market comparable companies Revenue multiple 2.5 – 6
Discount rate 18%
Discount years 1 – 2
Healthcare and Cleantech $14,871 Market comparable companies Revenue multiple(1) 0.6 – 62.5
R&D multiple(1) 1.0 – 30.6
Discount for lack of marketabilityand risk factors 40 – 60%
(1) The median for the Healthcare and Cleantech revenue multiple is 10.1; the majority of the R&D multiples fall between 4.0 and 11.4.
The significant unobservable inputs used in the fair value measurement of the reporting entities’ venture capital securities in thetechnology, media and telecommunications areas are enterprise value to revenue multiples and a discount rate to account for thetime until the securities are likely monetized and various risk factors. Significant increases (decreases) in the enterprise value to rev-enue multiple inputs in isolation would result in a significantly higher (lower) fair value measurement. Significant increases(decreases) in the discount rate would result in a significantly lower (higher) fair value measurement.
The significant unobservable inputs used in the fair value measurement of the reporting entities’ venture capital securities in thehealthcare and cleantech areas are enterprise value to revenue multiples, enterprise value to R&D investment multiples, and a dis-count for lack of marketability and various risk factors. Significant increases (decreases) in the enterprise value to revenue multipleand enterprise value to R&D investment multiple inputs in isolation would result in a significantly higher (lower) fair valuemeasurement. Significant increases (decreases) in the discount for lack of marketability and various risk factors in isolation wouldresult in a significantly lower (higher) fair value measurement. Generally, a change in the assumption used for the level of enterprisevalue to revenue multiple is accompanied by a directionally similar change in the assumption used for the enterprise value to R&Dmultiple. In addition, a change in the assumption used for the discount for lack of marketability and various risk factors is not corre-lated to changes in the assumptions used for the enterprise value to revenue multiple or the enterprise value to R&D investmentmultiple.
We have one private equity investment, which is a venture capital fund (fair value of $29.9 million and unfunded commitment of$12.2 million as of December 31, 2012) investing in communications, consumer, digital media, healthcare and informationtechnology markets. We also have a second private equity investment which is an investment in a private equity fund focusedexclusively on the energy sector (fair value of $7.7 million and unfunded commitment of $0.2 million as of December 31, 2012). Inaddition, one of the investments included in our consolidated private equity fund (fair value of $1.2 million and unfundedcommitment of $0.2 million as of December 31, 2012) is a venture capital fund investing in clean energy, resource and energy effi-ciency and other sustainable industries. The fair value of each of these investments has been estimated using the capital accountbalances provided by the partnerships. The interests in these partnerships cannot be redeemed.
Assets Measured at Fair Value on a Nonrecurring Basis
There were no impairments recognized for goodwill, intangible assets or other long-lived assets as of December 31, 2012.
Annual Report 2012 107

AllianceBernstein L.P. and SubsidiariesNotes to Consolidated Financial Statements (continued)
10. Furniture, Equipment and Leasehold Improvements, Net
Furniture, equipment and leasehold improvements, net consist of:December 31,
2012 2011
(in thousands)
Furniture and equipment $ 525,292 $ 564,958
Leasehold improvements 273,433 348,987
798,725 913,945
Less: Accumulated depreciation and amortization (602,600) (640,841)
Furniture, equipment and leasehold improvements, net $196,125 $273,104
Depreciation and amortization expense on furniture, equipment and leasehold improvements were $52.8 million, $60.9 million and$59.6 million for the years ended December 31, 2012, 2011 and 2010, respectively.
During 2012, 2011 and 2010, we recorded $223.0 million, $7.2 million and $101.7 million, respectively, in pre-tax real estate charg-es. Included in these charges were $41.4 million, $4.6 million and $25.5 million, respectively, worth of leasehold improvements,furniture and equipment we wrote off related to the respective spaces. See Note 3 for further discussion of the real estate charges.
11. Deferred Sales Commissions, Net
The components of deferred sales commissions, net for the years ended December 31, 2012 and 2011 were as follows (excludingamounts related to fully amortized deferred sales commissions):
December 31,2012 2011
(in thousands)
Carrying amount of deferred sales commissions $ 758,127 $ 660,735
Less: Accumulated amortization (475,032) (434,770)
Cumulative CDSC received (187,665) (165,966)
Deferred sales commissions, net $ 95,430 $ 59,999
Amortization expense was $40.3 million, $37.7 million and $47.4 million for the years ended December 31, 2012, 2011 and 2010,respectively. Estimated future amortization expense related to the December 31, 2012 net asset balance, assuming no additionalCDSC is received in future periods, is as follows (in thousands):
2013 $ 39,560
2014 25,760
2015 20,179
2016 9,312
2017 541
2018 78
$95,430
108 AllianceBernstein

AllianceBernstein L.P. and SubsidiariesNotes to Consolidated Financial Statements (continued)
12. Debt
As of December 31, 2012 and 2011, AllianceBernstein had $323.2 million and $444.9 million, respectively, in commercial paper out-standing with weighted average interest rates of approximately 0.5% and 0.2%, respectively. The commercial paper is short term in nature,and as such, recorded value is estimated to approximate fair value. Average daily borrowings of commercial paper during 2012 and 2011were $404.9 million and $273.6 million, respectively, with weighted average interest rates of approximately 0.4% and 0.2%, respectively.
AllianceBernstein has a $1.0 billion committed, unsecured senior revolving credit facility (the “Credit Facility”) with a group ofcommercial banks and other lenders which matures on January 17, 2017. The Credit Facility provides for possible increases in theprincipal amount by up to an aggregate incremental amount of $250 million, any such increase being subject to the consent of theaffected lenders. The Credit Facility is available for AllianceBernstein’s and SCB LLC’s business purposes, including the support ofAllianceBernstein’s $1.0 billion commercial paper program. Both AllianceBernstein and SCB LLC can draw directly under theCredit Facility and management expects to draw on the Credit Facility from time to time. AllianceBernstein has agreed to guaranteethe obligations of SCB LLC under the Credit Facility.
The Credit Facility contains affirmative, negative and financial covenants, which are customary for facilities of this type, including,among other things, restrictions on dispositions of assets, restrictions on liens, a minimum interest coverage ratio and a maximumleverage ratio. We are in compliance with these covenants. The Credit Facility also includes customary events of default (with cus-tomary grace periods, as applicable), including provisions under which, upon the occurrence of an event of default, all outstandingloans may be accelerated and/or lender’s commitments may be terminated. Also, under such provisions, upon the occurrence ofcertain insolvency- or bankruptcy-related events of default, all amounts payable under the Credit Facility would automaticallybecome immediately due and payable, and the lender’s commitments would automatically terminate.
Amounts under the Credit Facility may be borrowed, repaid and re-borrowed by us from time to time until the maturity of thefacility. Voluntary prepayments and commitment reductions requested by us are permitted at any time without fee (other than cus-tomary breakage costs relating to the prepayment of any drawn loans) upon proper notice and subject to a minimum dollarrequirement. Borrowings under the Credit Facility bear interest at a rate per annum, which will be, at our option, a rate equal to anapplicable margin, which is subject to adjustment based on the credit ratings of AllianceBernstein, plus one of the following indexes:London Interbank Offered Rate; a floating base rate; or the Federal Funds rate.
As of December 31, 2012 and 2011, we had no amounts outstanding under the Credit Facility. During 2012, we did not drawupon the Credit Facility. During 2011, $40.0 million was outstanding for one day in February (with an interest rate of 1.3%) result-ing in average daily borrowings of $0.1 million under the Credit Facility.
In addition, SCB LLC has five uncommitted lines of credit with four financial institutions. Two of these lines of credit permit us toborrow up to an aggregate of approximately $200.0 million while three lines have no stated limit.
As of December 31, 2012 and 2011, we had no uncommitted bank loans outstanding. Average daily borrowings of uncommittedbank loans during 2012 and 2011 were $18.1 million and $6.4 million, respectively, with weighted average interest rates of approx-imately 1.3% for both years. In May 2012, AllianceBernstein was named an additional borrower under a $100.0 million SCBuncommitted line of credit. As of December 31, 2012, AllianceBernstein had no loans outstanding. During 2012, $5.0 million wasoutstanding for one day with an interest rate of 1.4%. In January 2013, AllianceBernstein was named an additional borrower on asecond $100.0 million SCB uncommitted line of credit.
Annual Report 2012 109

AllianceBernstein L.P. and SubsidiariesNotes to Consolidated Financial Statements (continued)
13. Commitments and Contingencies
Operating Leases
We lease office space, furniture and office equipment under various operating leases. The future minimum payments under non-cancelable leases, sublease commitments and related payments we are obligated to make, net of sublease commitments of third partylessees to make payments to us, as of December 31, 2012 are as follows:
PaymentsSubleaseReceipts
NetPayments
(in millions)
2013 $ 139.4 $ 22.3 $ 117.1
2014 136.0 24.4 111.6
2015 136.2 24.4 111.8
2016 135.6 24.4 111.2
2017 136.9 24.8 112.1
2018 and thereafter 1,084.4 137.1 947.3
Total future minimum payments $1,768.5 $257.4 $1,511.1
Office leases contain escalation clauses that provide for the pass through of increases in operating expenses and real estate taxes. Rentexpense, which is amortized on a straight-line basis over the life of the lease, was $100.4 million, $121.2 million and $121.5 million,respectively, for the years ended December 31, 2012, 2011 and 2010, net of sublease income of $3.2 million for each of the yearsended December 31, 2012, 2011 and 2010. In addition, we accelerated rent of $181.6 million, $2.6 million and $76.2 million in2012, 2011 and 2010, respectively. See Note 3 for further discussion of the real estate charges.
Legal Proceedings
During the first quarter of 2012, we received a legal letter of claim (the “Letter of Claim”) sent on behalf of a former Europeanpension fund client, alleging that AllianceBernstein Limited (a wholly-owned subsidiary of ours organized in the U.K.) was negli-gent and failed to meet certain applicable standards of care with respect to the initial investment in and management of a£500 million portfolio of U.S. mortgage-backed securities. The alleged damages range between $177 million and $234 million, pluscompound interest on an alleged $125 million of realized losses in the portfolio. We believe that any losses to this client resultedfrom adverse developments in the U.S. housing and mortgage market that precipitated the financial crisis in 2008 and not anynegligence or failure on our part. We believe that we have strong defenses to these claims, which are set forth in our October 12,2012 response to the Letter of Claim, and will defend this matter vigorously. Currently, we are unable to estimate a reasonablypossible range of loss because the matter remains in its early stages.
In addition to the Letter of Claim, we are involved in various other matters, including regulatory inquiries, administrative proceed-ings and litigation, some of which allege significant damages.
In management’s opinion, an adequate accrual has been made as of December 31, 2012 to provide for any probable losses regardingany litigation matters for which we can reasonably estimate an amount of loss. It is reasonably possible that we could incur addi-tional losses pertaining to these matters, but currently we cannot estimate any such additional losses.
Management, after consultation with legal counsel, currently believes that the outcome of any matter that is pending or threatened,or all of them combined, will not have a material adverse effect on our results of operations, financial condition or liquidity. How-ever, as any inquiry, proceeding or litigation has an element of uncertainty, management cannot determine whether furtherdevelopments relating to any matter that is pending or threatened, or all of them combined, will have a material adverse effect onour results of operations, financial condition or liquidity in any future reporting period.
110 AllianceBernstein

AllianceBernstein L.P. and SubsidiariesNotes to Consolidated Financial Statements (continued)
Other
During 2009, we entered into a subscription agreement under which we committed to invest up to $35 million, as amended in2011, in a venture capital fund over a six-year period. As of December 31, 2012, we had funded $22.8 million of this commitment.
During 2010, as general partner of the AllianceBernstein U.S. Real Estate L.P. (the “Real Estate Fund”), we committed to invest$25 million in the Real Estate Fund. As of December 31, 2012, we had funded $8.7 million of this commitment.
During 2012, we entered into an investment agreement under which we committed to invest up to $8 million in an oil and gasfund over a three-year period. As of December 31, 2012, we had funded $7.8 million of this commitment.
14. Net Capital
SCB LLC, a broker-dealer and a member organization of the New York Stock Exchange (“NYSE”), is subject to the Uniform Net Capi-tal Rule 15c3-1 of the Exchange Act. SCB LLC computes its net capital under the alternative method permitted by the rule, whichrequires that minimum net capital, as defined, equal the greater of $1 million, or two percent of aggregate debit items arising fromcustomer transactions, as defined. As of December 31, 2012, SCB LLC had net capital of $144.4 million, which was $125.9 million inexcess of the minimum net capital requirement of $18.5 million. Advances, dividend payments and other equity withdrawals by SCB LLCare restricted by the regulations of the U.S. Securities and Exchange Commission (“SEC”), the Financial Industry Regulatory Authority,Inc., and other securities agencies.
SCBL is a member of the London Stock Exchange. As of December 31, 2012, SCBL was subject to financial resources require-ments of $21.6 million imposed by the Financial Services Authority of the United Kingdom and had aggregate regulatory financialresources of $39.0 million, an excess of $17.4 million.
AllianceBernstein Investments serves as distributor and/or underwriter for certain company-sponsored mutual funds.AllianceBernstein Investments is registered as a broker-dealer under the Exchange Act and is subject to the minimum net capitalrequirements imposed by the SEC. AllianceBernstein Investments’ net capital as of December 31, 2012 was $31.0 million, whichwas $30.9 million in excess of its required net capital of $0.1 million.
Many of our subsidiaries around the world are subject to minimum net capital requirements by the local laws and regulations towhich they are subject. As of December 31, 2012, each of our subsidiaries subject to a minimum net capital requirement satisfiedthe applicable requirement.
15. Counterparty Risk
Customer Activities
In the normal course of business, brokerage activities involve the execution, settlement and financing of various customer securitiestrades, which may expose SCB LLC and SCBL to off-balance sheet risk by requiring SCB LLC and SCBL to purchase or sell secu-rities at prevailing market prices in the event the customer is unable to fulfill its contractual obligations.
SCB LLC’s customer securities activities are transacted on either a cash or margin basis. In margin transactions, SCB LLC extends credit tothe customer, subject to various regulatory and internal margin requirements. These transactions are collateralized by cash or securities in thecustomer’s account. In connection with these activities, SCB LLC may execute and clear customer transactions involving the sale of secu-rities not yet purchased. SCB LLC seeks to control the risks associated with margin transactions by requiring customers to maintain collateralin compliance with the aforementioned regulatory and internal guidelines. SCB LLC monitors required margin levels daily and, pursuant tosuch guidelines, requires customers to deposit additional collateral, or reduce positions, when necessary. A majority of SCB LLC’s customermargin accounts are managed on a discretionary basis whereby AllianceBernstein maintains control over the investment activity in theaccounts. For these discretionary accounts, SCB LLC’s margin deficiency exposure is minimized through maintaining a diversified portfolioof securities in the accounts and by virtue of AllianceBernstein’s discretionary authority and SCB LLC’s role as custodian.
Annual Report 2012 111

AllianceBernstein L.P. and SubsidiariesNotes to Consolidated Financial Statements (continued)
SCB LLC may enter into forward foreign currency contracts on behalf of accounts for which SCB LLC acts as custodian. SCBLLC minimizes credit risk associated with these contracts by monitoring these positions on a daily basis, as well as by virtue ofAllianceBernstein’s discretionary authority and SCB LLC’s role as custodian.
In accordance with industry practice, SCB LLC and SCBL record customer transactions on a settlement date basis, which is gen-erally three business days after trade date. SCB LLC and SCBL are exposed to risk of loss on these transactions in the event of thecustomer’s or broker’s inability to meet the terms of their contracts, in which case SCB LLC and SCBL may have to purchase orsell financial instruments at prevailing market prices. The risks assumed by SCB LLC and SCBL in connection with these trans-actions are not expected to have a material adverse effect on AllianceBernstein’s, SCB LLC’s, or SCBL’s financial condition orresults of operations.
Other Counterparties
SCB LLC and SCBL are engaged in various brokerage activities on behalf of clients, including Sanford C. Bernstein (Hong Kong)Limited (an indirect wholly-owned subsidiary of AllianceBernstein), in which counterparties primarily include broker-dealers, banksand other financial institutions. In the event counterparties do not fulfill their obligations, SCB LLC and SCBL may be exposed torisk. The risk of default depends on the creditworthiness of the counterparty or issuer of the instrument. It is SCB LLC’s andSCBL’s policy to review, as necessary, each counterparty’s creditworthiness.
In connection with security borrowing and lending arrangements, SCB LLC and SCBL enter into collateralized agreements, whichmay result in credit exposure in the event the counterparty to a transaction is unable to fulfill its contractual obligations. Securityborrowing arrangements require SCB LLC and SCBL to deposit cash collateral with the lender. With respect to security lendingarrangements, SCB LLC (SCBL does not participate in security lending arrangements) receives collateral in the form of cash inamounts generally in excess of the market value of the securities loaned. SCB LLC minimizes credit risk associated with these activ-ities by establishing credit limits for each broker and monitoring these limits on a daily basis. Additionally, security borrowing andlending collateral is marked to market on a daily basis, and additional collateral is deposited by or returned to SCB LLC and SCBLas necessary.
AllianceBernstein enters into various futures, forwards and swaps to economically hedge certain of its seed money investments, aswell as currency forwards to hedge certain cash accounts. AllianceBernstein is exposed to credit losses in the event of non-performance by counterparties to these derivative financial instruments. See Note 8 for further discussion.
16. Qualified Employee Benefit Plans
We maintain a qualified profit sharing plan covering U.S. employees and certain foreign employees. Employer contributions arediscretionary and generally limited to the maximum amount deductible for federal income tax purposes. Aggregate contributions for2012, 2011 and 2010 were $13.0 million, $13.7 million and $14.6 million, respectively.
We maintain several defined contribution plans for foreign employees working for our subsidiaries in the United Kingdom, Australia,Japan and other foreign locations outside the United States. Employer contributions are generally consistent with regulatory require-ments and tax limits. Defined contribution expense for foreign entities was $6.7 million, $7.7 million and $7.1 million in 2012, 2011and 2010, respectively.
We maintain a qualified, noncontributory, defined benefit retirement plan (“Retirement Plan”) covering current and formeremployees who were employed by AllianceBernstein in the United States prior to October 2, 2000. Benefits are based on years ofcredited service, average final base salary (as defined in the Retirement Plan), and primary Social Security benefits. Service andcompensation after December 31, 2008 are not taken into account in determining participants’ retirement benefits.
Our policy is to satisfy our funding obligation for each year in an amount not less than the minimum required by the EmployeeRetirement Income Security Act of 1974, as amended, and not greater than the maximum amount we can deduct for federalincome tax purposes. We contributed $4.9 million to the Retirement Plan during 2012. We currently estimate that we will
112 AllianceBernstein

AllianceBernstein L.P. and SubsidiariesNotes to Consolidated Financial Statements (continued)
contribute $4.0 million to the Retirement Plan during 2013. Contribution estimates, which are subject to change, are based onregulatory requirements, future market conditions and assumptions used for actuarial computations of the Retirement Plan’s obliga-tions and assets. Management, at the present time, has not determined the amount, if any, of additional future contributions thatmay be required.
The Retirement Plan’s projected benefit obligation, fair value of plan assets, and funded status (amounts recognized in the con-solidated statements of financial condition) were as follows:
Years Ended December 31,2012 2011
(in thousands)
Change in projected benefit obligation:
Projected benefit obligation at beginning of year $ 94,655 $ 87,733
Interest cost 4,633 4,627
Actuarial loss 13,481 4,585
Benefits paid (4,963) (2,290)
Projected benefit obligation at end of year 107,806 94,655
Change in plan assets:
Plan assets at fair value at beginning of year 63,325 64,627
Actual return on plan assets 8,408 (5,912)
Employer contribution 4,850 6,900
Benefits paid (4,963) (2,290)
Plan assets at fair value at end of year 71,620 63,325
Funded status $(36,186) $(31,330)
The amounts recognized in other comprehensive income (loss) for 2012 and 2011 were as follows:2012 2011
(in thousands)
Unrecognized net loss from experience different from that assumed and effects of changes and assumptions $ (9,194) $ (15,231)
Unrecognized net plan assets as of January 1, 1987 being recognized over 26.3 years (143) (143)
(9,337) (15,374)
Income tax (expense) benefit (126) 332
Other comprehensive loss $(9,463) $(15,042)
The amounts included in accumulated other comprehensive income (loss) as of December 31, 2012 and 2011 were as follows:2012 2011
(in thousands)
Unrecognized net loss from experience different from that assumed and effects of changes and assumptions $ (48,264) $ (39,070)
Unrecognized net plan assets as of January 1, 1987 being recognized over 26.3 years 47 190
(48,217) (38,880)
Income tax benefit 723 849
Accumulated other comprehensive loss $(47,494) $(38,031)
The estimated initial plan assets and amortization of loss for the Retirement Plan that will be amortized from accumulated othercomprehensive income over the next year is $47,129 and $1,105,698, respectively. The accumulated benefit obligation for the planwas $107.8 million and $94.7 million, respectively, as of December 31, 2012 and 2011.
Annual Report 2012 113

AllianceBernstein L.P. and SubsidiariesNotes to Consolidated Financial Statements (continued)
The discount rates used to determine benefit obligations as of December 31, 2012 and 2011 (measurement dates) were 4.4% and5.1%, respectively.
The following benefit payments are expected to be paid as follows (in thousands):
2013 $ 3,331
2014 3,019
2015 4,822
2016 5,763
2017 4,889
2018-2022 30,153
Net expense under the Retirement Plan consisted of:Years Ended December 31,
2012 2011 2010
(in thousands)
Interest cost on projected benefit obligations $ 4,633 $ 4,627 $ 4,600
Expected return on plan assets (4,969) (5,133) (4,453)
Amortization of transition asset (143) (143) (143)
Recognized actuarial loss 848 399 262
Net pension expense (benefit) $ 369 $ (250) $ 266
Actuarial computations used to determine net periodic costs were made utilizing the following weighted-average assumptions:Years Ended December 31,
2012 2011 2010
Discount rate on benefit obligations 5.10% 5.50% 6.05%
Expected long-term rate of return on plan assets 8.00 8.00 8.00
The Retirement Plan’s asset allocation percentages consisted of:December 31,
2012 2011
Equity securities 67% 62%
Debt securities 28 28
Real estate 2 10
Cash 3 —
100% 100%
In developing the expected long-term rate of return on plan assets of 8.0%, management considered the historical returns and futureexpectations for returns for each asset category, as well as the target asset allocation of the portfolio. The expected long-term rate ofreturn on assets is based on weighted average expected returns for each asset class.
The guidelines regarding allocation of assets formalized in the Investment Policy Statement were adopted by the Investment Committeefor the Retirement Plan to reflect the Plan’s liquidity requirements, funded status, growth expectations and risk tolerance. The guidelinesspecify an allocation weighting of 50% to 70% for global equity securities (target of 60%), 20% to 40% for fixed income securities (targetof 30%) and 0% to 10% for real estate investment trusts (target of 10%). Alternative investments are permitted under the guidelines, withsuch investments to be allocated to one or more of the above security classes and subject to the indicated tactical ranges.
114 AllianceBernstein

AllianceBernstein L.P. and SubsidiariesNotes to Consolidated Financial Statements (continued)
Exposure of the total portfolio to cash equivalents on average should not exceed 5% of the portfolio’s value on a market value basis.The plan seeks to provide a rate of return that exceeds applicable benchmarks over rolling five-year periods. The benchmark for theplan’s large cap domestic equity investment strategy is the S&P 500 Index; the small cap domestic equity investment strategy ismeasured against the Russell 2000 Index; the international equity investment strategy is measured against the MSCI EAFE Index;and the fixed income investment strategy is measured against the Barclays Aggregate Bond Index.
See Note 9 for a description of how we measure the fair value of our plan assets. The following table summarizes the valuation ofour Retirement Plan assets by pricing observability levels as of December 31, 2012:
Level 1 Level 2 Level 3 Total
(in thousands)
Cash $ 2,197 $ — $— $ 2,197
Fixed income mutual funds 22,135 — — 22,135
Equity mutual fund 12,356 — — 12,356
Equity securities 23,933 — — 23,933
Equity private investment trusts — 10,999 — 10,999
Total assets measured at fair value $60,621 $10,999 $— $71,620
During 2012, the Retirement Plan invested in two fixed income mutual funds. Both funds seek to generate income consistent withpreservation of capital. One mutual fund invests in a portfolio of fixed income securities of U.S. and non-U.S. companies and U.S.and non-U.S. government securities and supranational entities, including lower-rated securities. The second fund invests in a broadrange of fixed income securities in both developed and emerging markets with a range of maturities from short- to long-duration.
The Retirement Plan also invested in separate equity and fixed income mutual funds which seek to moderate the volatility of equity andfixed income oriented asset allocation over the long term, as part of an investor’s overall asset allocation managed by AllianceBernstein.
The Retirement Plan invested in a multi-style, multi-cap integrated portfolio adding incremental U.S. equity diversification to itsvalue and growth equity selections, designed to deliver a long-term premium to the S&P 500 with greater consistency across arange of market environments.
Finally, the Retirement Plan invested in two equity private investment trusts. One trust invests primarily in equity securities of non-U.S. companies located in emerging market countries, while the other trust invests in equity securities of established non-U.S.companies located in the countries comprising the MSCI EAFE Index, plus Canada.
The following table summarizes the valuation of our Retirement Plan assets by pricing observability levels as of December 31, 2011:Level 1 Level 2 Level 3 Total
(in thousands)
Cash $ 9 $ — $— $ 9
Government securities
U.S. Treasury bills — 662 — 662
Agency Discount notes — 208 — 208
Real estate mutual fund 6,358 — — 6,358
Fixed income mutual funds 16,591 — — 16,591
Equity mutual funds 10,938 — — 10,938
Equity private investment trusts — 28,559 — 28,559
Total assets measured at fair value $33,896 $29,429 $— $63,325
During 2011, the Retirement Plan invested in a real estate mutual fund which is an open-end fund that seeks total return fromlong-term growth of capital and income. Typically the mutual fund invests at least 80% of its net assets in real estate investmenttrusts and other real estate industry companies. The mutual fund is subject to certain risks associated with the direct ownership ofreal estate and with the real estate industry in general. To the extent that assets underlying the mutual fund’s investments are con-centrated geographically, by property type or in certain other respects, the mutual fund may be subject to additional risks.
Annual Report 2012 115
AllianceBernstein L.P. and SubsidiariesNotes to Consolidated Financial Statements (continued)
The Retirement Plan also invested in two fixed income mutual funds. One of the mutual funds seeks to provide safety of principaland a moderate rate of income that is subject to taxes. Typically the mutual funds invest at least 80% of their net assets in securitiesrated A or better by national rating agencies. The other fixed income mutual fund seeks to generate current income consistent withpreservation of capital. The mutual fund invests in debt securities with a range of maturities from short- to long-duration in bothdeveloped and emerging markets.
The Retirement Plan invested in two equity mutual funds. One equity mutual fund seeks long-term growth of capital through thepursuit of opportunistic growth by investing in a global universe of companies in multiple industries that may benefit from innovation.The second mutual fund’s objective is to maximize real return, which equals total return less the estimated effect of inflation. Themutual fund invests principally in instruments that are affected directly or indirectly by the level and change in rate of inflation.
Finally the Retirement Plan invested in two equity private investment trusts. One of these trusts invests primarily in equity secu-rities of companies located around the world, while the other invests primarily in equity securities of non-U.S. companies located inemerging market countries.
The government securities held by the Retirement Plan consist of United States Treasury Bills and Agency Discount notes.
We provide postretirement medical benefits which allow retirees between the ages of 55 and 65 meeting certain service requirements, attheir election, to continue to participate in our group medical program by paying 100% of the applicable group premium. Retirees olderthan 65 may also continue to participate in our group medical program, but are required to pay the full expected cost of benefits. To theextent that retirees’ medical costs exceed premiums paid, we incur the cost of providing a post-retirement medical benefit. During 2012,our net periodic benefit cost was $0.8 million, and our aggregate benefit obligation as of December 31, 2012 was $7.5 million.
17. Long-term Incentive Compensation Plans
We maintain an unfunded, non-qualified incentive compensation program known as the AllianceBernstein 2012 Incentive Compensa-tion Award Program (the “Incentive Compensation Program”), under which annual awards may be granted to eligible employees.See Note 2. Summary of Significant Accounting Policies—Long-term Incentive Compensation Plans’ for a discussion of the award provisions.
Under the Incentive Compensation Program, we made awards in 2012, 2011 and 2010 aggregating $150.1 million, $159.9 millionand $275.6 million, respectively. The amounts charged to employee compensation and benefits for the years ended December 31,2012, 2011 and 2010 were $151.4 million, $654.3 million (which includes $509.1 million of the one-time, non-cash compensationcharge) and $207.9 million, respectively.
During 2005, we established the AllianceBernstein Financial Advisor Wealth Accumulation Plan (“Wealth Accumulation Plan”),a voluntary unfunded, non-qualified incentive plan. The Wealth Accumulation Plan was established to attract, motivate and retaineligible employees expected to make significant contributions to the future growth and success of Bernstein Global WealthManagement, the unit of AllianceBernstein that services private clients. Participants designate the percentage of their awards to benotionally invested in Holding Units or certain of our investment services. No more than 50% of the award may be notionallyinvested in Holding Units. Prior to the changes made to incentive compensation awards in the fourth quarter of 2011 (see Note 2,“Summary of Significant Accounting Policies—Long-term Incentive Compensation Plans”), all awards vested annually on a pro rata basisover the term of the award. There have been no awards granted under this plan since 2009. The amounts charged to employeecompensation and benefits expense for the years ended December 31, 2012, 2011 and 2010 were $(0.5) million, $25.5 million(which includes $24.8 million of the one-time, non-cash compensation charge) and $8.5 million, respectively.
18. Compensatory Unit Awards and Option Plans
Effective as of July 1, 2010, we established the AllianceBernstein 2010 Long Term Incentive Plan, as amended (“2010 Plan”),which was adopted by Holding Unitholders at a special meeting of Holding Unitholders held on June 30, 2010. Since the 2010Plan was adopted, the following forms of awards have been available for grant to employees and Eligible Directors: (i) restricted
116 AllianceBernstein

AllianceBernstein L.P. and SubsidiariesNotes to Consolidated Financial Statements (continued)
Holding Units or phantom restricted Holding Units (a “phantom” award is a contractual right to receive Holding Units at a laterdate or upon a specified event); (ii) options to buy Holding Units; and (iii) other Holding Unit-based awards (including, withoutlimitation, Holding Unit appreciation rights and performance awards). The purpose of the 2010 Plan is to promote the interest ofAllianceBernstein by: (i) attracting and retaining talented officers, employees and directors, (ii) motivating such officers, employeesand directors by means of performance-related incentives to achieve longer-range business and operational goals, (iii) enabling suchofficers, employees and directors to participate in the long-term growth and financial success of AllianceBernstein, and (iv) aligningthe interests of such officers, employees and directors with those of Holding Unitholders. The 2010 Plan will expire on June 30,2020, and no awards under the 2010 Plan will be made after that date. Under the 2010 Plan, the aggregate number of HoldingUnits with respect to which awards may be granted is 60.0 million, including no more than 30.0 million newly-issued HoldingUnits.
The 2010 Plan was amended by the Board in May 2011, expanding the universe of persons eligible to receive awards under the2010 Plan to include any member of the Board who is a former executive or former employee of an affiliate of Holding. For pur-poses of this amendment, “affiliate” includes any company or other entity that directly, or indirectly through one or more inter-mediaries, controls, is controlled by or is under common control with, AllianceBernstein.
The 2010 Plan was further amended by the Compensation Committee of the Board (“Compensation Committee”) in December2011, clarifying that, where duly authorized by the Compensation Committee or the Board, continued vesting of Awards after aTermination (as those terms are defined in the 2010 Plan or the applicable award agreement) in circumstances where such con-tinued vesting is conditioned on compliance with (A) one or more restrictive covenants, and/or (B) a standard of conduct regardingappropriate consideration of risk set forth in the applicable award agreement, shall count towards satisfying the minimum vestingrequirement set forth in Section 6(b)(i) of the 2010 Plan.
The 2010 Plan was further amended by the Board in May 2012, when the Board authorized management to reacquire on the openmarket or otherwise all 60.0 million Holding Units available for awards under the 2010 Plan (less one Holding Unit for everynewly-issued Holding Unit already awarded under the 2010 Plan), while maintaining the 30.0 million Holding Unit limitation onnewly-issued Holding Units available for awards under the 2010 Plan.
As of December 31, 2012, 210,591 options to buy Holding Units had been granted and 24,563,327 Holding Units, net of for-feitures, were subject to other Holding Unit awards made under the 2010 Plan. Holding Unit-based awards (including options) inrespect of 35,226,082 Holding Units were available for grant as of December 31, 2012.
In 1997, we established the 1997 Long Term Incentive Plan (“1997 Plan”), under which options to buy Holding Units, restrictedHolding Units and phantom restricted Holding Units, performance awards, and other Holding Unit-based awards were available forgrant to key employees and Eligible Directors of the General Partner for terms established at the time of grant (generally 10 years).Options granted to employees are generally exercisable at a rate of 20% of the Holding Units subject to such options on each of thefirst five anniversary dates of the date of grant; options granted to Eligible Directors are generally exercisable at a rate of 33.3% ofthe Holding Units subject to such options on each of the first three anniversary dates of the date of grant. Restricted Holding Unitsawarded to Eligible Directors vest on the third anniversary of the grant date or immediately upon a director’s resignation. RestrictedHolding Units awarded to our CEO (as described below under “Restricted Holding Unit Awards”) vest 20% on each of the first fiveanniversary dates of the grant date. Restricted Holding Units awarded under the Incentive Compensation Program vest 25% onDecember 1st of the subsequent four years. The 1997 Plan expired on July 26, 2010.
Annual Report 2012 117

AllianceBernstein L.P. and SubsidiariesNotes to Consolidated Financial Statements (continued)
Option Awards
Options to buy Holding Units (including grants to Eligible Directors) were granted as follows: 114,443 options were granted during2012, 70,238 options were granted during 2011 and 387,661 options were granted during 2010. The weighted average fair value ofoptions to buy Holding Units granted during 2012, 2011 and 2010 was $3.67, $5.98 and $6.18, respectively, on the date of grant,determined using the Black-Scholes option valuation model with the following assumptions:
2012 2011 2010
Risk-free interest rate 0.7% 1.9% 2.2 – 2.3%
Expected cash distribution yield 6.2% 5.4% 7.2 – 8.2%
Historical volatility factor 49.2% 47.3% 46.2 – 46.6%
Expected term 6.0 years 6.0 years 6.0 years
Due to a lack of sufficient historical data, we have chosen to use the simplified method to calculate the expected term of options.
The following table summarizes the activity in our option plan during 2012:
Optionsto Buy
HoldingUnits
WeightedAverage
Exercise PricePer Option
WeightedAverage
RemainingContractualTerm (Years)
AggregateIntrinsicValue
Outstanding as of December 31, 2011 8,994,229 $39.63 6.4
Granted 114,443 14.58
Exercised — —
Forfeited (11,500) 33.18
Expired (543,827) 32.34
Outstanding as of December 31, 2012 8,553,345 39.77 5.8 $—
Exercisable as of December 31, 2012 4,237,915 33.85 5.7 —
Vested or expected to vest as of December 31, 2012 8,553,345 39.77 5.8 —
The aggregate intrinsic value as of December 31, 2012 on options outstanding, exercisable and expected to vest is negative, and istherefore presented as zero in the table above. The total intrinsic value of options exercised during 2012, 2011 and 2010 was zero,$0.4 million and $5.6 million, respectively.
Under the fair value method, compensation expense is measured at the grant date based on the estimated fair value of the optionsawarded (determined using the Black-Scholes option valuation model) and is recognized over the required service period. Werecorded compensation expense relating to option grants of $1.2 million, $36.4 million (which includes $35.2 million of the one-time, non-cash compensation charge) and $9.1 million, respectively, for the years ended December 31, 2012, 2011 and 2010. As ofDecember 31, 2012, there was $0.2 million of compensation cost related to unvested option grants not yet recognized in the con-solidated statement of income. The remaining cost is expected to be recognized during the first half of 2013.
Restricted Holding Unit Awards
In 2012, 2011 and 2010, restricted Holding Units were awarded to Eligible Directors. These Holding Units give the Eligible Directors, inmost instances, all the rights of other Holding Unitholders subject to such restrictions on transfer as the Board may impose. We awarded28,812, 19,313 and 5,275 restricted Holding Units, respectively, in 2012, 2011 and 2010 with grant date fair values of $14.58, $21.75 and$28.46, respectively, per restricted Holding Unit. All of the restricted Holding Units vest on the third anniversary of grant date orimmediately upon a director’s resignation. We fully expensed these awards on each grant date. We recorded compensation expense relat-ing to these awards of $0.4 million, $0.4 million and $0.2 million, respectively, for the years ended December 31, 2012, 2011 and 2010.
118 AllianceBernstein
AllianceBernstein L.P. and SubsidiariesNotes to Consolidated Financial Statements (continued)
In connection with the commencement of Mr. Kraus’s employment as our CEO on December 19, 2008, he was granted 2,722,052restricted Holding Units with a grant date fair value of $19.20. Subject to accelerated vesting provisions in Mr. Kraus’s employmentagreement, his restricted Holding Units vest ratably on each of the first five anniversaries of December 19, 2008, commencingDecember 19, 2009, provided, with respect to each installment, Mr. Kraus continues to be employed by AllianceBernstein on thevesting date. Mr. Kraus’s service requirement was not impacted by the changes to the employee long-term incentive compensationaward program in the fourth quarter of 2011. During June 2012, Mr. Kraus entered into an agreement (the “Extended EmploymentAgreement”) pursuant to which Mr. Kraus will continue to serve as our CEO from January 3, 2014, the day following the end ofthe term of his initial employment agreement, until January 2, 2019 (the “Extended Employment Term”), unless the ExtendedEmployment Agreement is terminated in accordance with its terms. In connection with the signing of the Extended EmploymentAgreement, Mr. Kraus was granted 2,722,052 restricted Holding Units, vesting ratably over the Extended Employment Term. UnderU.S. GAAP, the compensation expense for the Holding Unit award under the Extended Employment Agreement of $33.1 million(based on the $12.17 grant date Holding Unit price) must be amortized on a straight-line basis over 6.5 years, beginning on the grantdate. As a result, even though Mr. Kraus will not receive any incremental cash compensation or cash distributions related to therestricted Holding Unit award pursuant to the Extended Employment Agreement prior to its commencement on January 3, 2014,we incurred $2.5 million of incremental compensation expense during the second half of 2012 and will incur $5.1 million of suchexpense for the full year 2013. We recorded compensation expense relating to the CEO restricted Holding Unit grants of $13.0million, $10.5 million and $10.5 million, respectively, for each of the years ended December 31, 2012, 2011 and 2010.
In 1993, we established the Century Club Plan, under which employees of AllianceBernstein whose primary responsibilities are toassist in the distribution of company-sponsored mutual funds and who meet certain sales targets, are eligible to receive an award ofrestricted Holding Units. Awards granted prior to December 2010 vested ratably over three years and subsequent awards vest ratablyover four years. The service requirement for Century Club participants was impacted by the amendment to the employee long-term incentive compensation award program in the fourth quarter of 2011. We awarded 47,450, 57,828 and 95,531 restrictedHolding Units in 2012, 2011 and 2010, respectively. The grant date fair values of these awards were $17.91 in 2012, $13.38 in 2011and $27.45 and $23.72 in 2010 per Holding Unit. We recorded compensation expense relating to the Century Club Plan grants of$0.7 million, $3.0 million (which includes $2.2 million of the one-time, non-cash compensation charge) and $1.2 million,respectively, for the years ended December 31, 2012, 2011 and 2010.
Beginning in 2009, we awarded restricted Holding Units under the Incentive Compensation Program (see Note 17). We awarded8,671,253 (all of which were granted in January 2012 for 2011 year-end awards) in 2012 and 11,594,207 restricted Holding Unitsin 2010 with grant date fair values of $14.90 in 2012 and ranging between $23.72 and $32.06 in 2010 per restricted Holding Unit.
We also award restricted Holding Units in connection with certain employment and separation agreements with vesting schedulesranging between two to five years. The fair value of the restricted Holding Units is amortized over the required service period asemployee compensation expense. We awarded 630,630, 1,649,973 and 1,369,751 Holding Units in 2012, 2011 and 2010,respectively, with grant date fair values ranging between $12.13 and $17.58 in 2012, $16.29 and $22.71 in 2011 and $23.72 and$28.37 in 2010 per restricted Holding Unit. We recorded compensation expense relating to restricted Holding Unit grants in con-nection with certain employment and separation agreements of $20.1 million, $32.9 million (which includes $15.8 million of theone-time, non-cash compensation charge) and $23.2 million, respectively, for the years ended December 31, 2012, 2011 and 2010.
The following table summarizes the activity of unvested restricted Holding Units during 2012:
HoldingUnits
Weighted AverageGrant Date Fair
Value perHolding Unit
Unvested as of December 31, 2011 15,574,191 $23.88
Granted 12,099,291 14.48
Vested (8,507,437) 21.65
Forfeited (728,556) 20.67
Unvested as of December 31, 2012 18,437,489 18.79
Annual Report 2012 119

AllianceBernstein L.P. and SubsidiariesNotes to Consolidated Financial Statements (continued)
The total grant date fair value of restricted Holding Units that vested during 2012, 2011 and 2010 was $184.2 million, $140.2 mil-lion and $73.4 million, respectively. As of December 31, 2012, there was $59.3 million of compensation cost related to unvestedrestricted Holding Unit awards granted and not yet recognized in the consolidated statement of income. The cost is expected to berecognized over a weighted average period of 4.0 years.
19. Units Outstanding
Changes in units outstanding for the years ended December 31, 2012 and 2011 were as follows:2012 2011
Outstanding as of January 1, 277,847,588 278,115,232
Options exercised — 86,543
Units issued — —
Units retired (246,687) (354,187)
Units forfeited — —
Outstanding as of December 31, 277,600,901 277,847,588
During 2012 and 2011, we purchased 246,687 and 354,187 AllianceBernstein Units, respectively, in private transactions and retiredthem.
20. Income Taxes
AllianceBernstein is a private partnership for federal income tax purposes and, accordingly, is not subject to federal or state corporateincome taxes. However, AllianceBernstein is subject to a 4.0% New York City unincorporated business tax (“UBT”). Domesticcorporate subsidiaries of AllianceBernstein, which are subject to federal, state and local income taxes, are generally included in thefiling of a consolidated federal income tax return with separate state and local income tax returns being filed. Foreign corporate sub-sidiaries are generally subject to taxes in the foreign jurisdictions where they are located.
In order to preserve AllianceBernstein’s status as a private partnership for federal income tax purposes, AllianceBernstein Units mustnot be considered publicly traded. The AllianceBernstein Partnership Agreement provides that all transfers of AllianceBernsteinUnits must be approved by AXA Equitable Life Insurance Company (a wholly-owned subsidiary of AXA, “AXA Equitable”) andthe General Partner; AXA Equitable and the General Partner approve only those transfers permitted pursuant to one or more of thesafe harbors contained in relevant treasury regulations. If AllianceBernstein Units were considered readily tradable, AllianceBern-stein’s net income would be subject to federal and state corporate income tax, reducing its quarterly distribution to Holding. Fur-thermore, should AllianceBernstein enter into a substantial new line of business, Holding, by virtue of its ownership ofAllianceBernstein, would lose its status as a “grandfathered” publicly-traded partnership and would become subject to corporateincome tax, which would reduce materially Holding’s net income and its quarterly distributions to Holding unitholders.
Earnings (loss) before income taxes and income tax expense consist of:Years Ended December 31,
2012 2011 2010
(in thousands)
Earnings (loss) before income taxes:
United States $ 177,347 $ (120,159) $ 382,463
Foreign 25,018 (88,310) 83,159
Total $202,365 $(208,469) $465,622
120 AllianceBernstein

AllianceBernstein L.P. and SubsidiariesNotes to Consolidated Financial Statements (continued)
Years Ended December 31,2012 2011 2010
(in thousands)
Income tax expense:
Partnership UBT $ 2,626 $ 8,737 $ 10,363
Corporate subsidiaries:
Federal 2,367 10,600 2,570
State and local 541 1,772 1,401
Foreign 8,852 11,411 25,144
Current tax expense 14,386 32,520 39,478
Deferred tax (benefit) (622) (29,422) (955)
Income tax expense $13,764 $ 3,098 $38,523
The principal reasons for the difference between the effective tax rates and the UBT statutory tax rate of 4.0% are as follows:Years Ended December 31,
2012 2011 2010
(in thousands)
UBT statutory rate $ 8,095 4.0% $(8,339) 4.0% $ 18,625 4.0%
Corporate subsidiaries’ federal, state, local and foreign income taxes 12,548 6.2 2,998 (1.4) 25,544 5.5
Effect of ASC 740 adjustments, miscellaneous taxes, and other (9,665) (4.8) 2,560 (1.3) 1,445 0.3
Income not taxable resulting from use of UBT business apportionment factors and effectof compensation charge 2,786 1.4 5,879 (2.8) (7,091) (1.5)
Income tax expense and effective tax rate $13,764 6.8 $3,098 (1.5) $38,523 8.3
Income tax expenses increased $10.7 million, or 344.3%, in 2012 compared to 2011. The increase was primarily due to higheroperating income in 2012 (in large part due to the 2011 compensation charge offset by the 2012 real estate charges), partially offsetby the UBT tax benefit recorded in the third quarter of 2012 ($5.7 million). In the third quarter of 2012, application of the NewYork City tax law that sources various types of receipts from services performed by registered brokers and dealers of securities andcommodities for purposes of apportioning income resulted in a reduction of our rate of tax for the current year and to the rate oftax that we expect to pay in the future. As a result, we recognized a $5.7 million tax benefit in the third quarter of 2012 relating toour full year 2011 and nine months 2012 UBT.
Income tax expenses decreased $35.4 million, or 92.0%, in 2011 compared to 2010. Prior to the fourth quarter 2011 compensationcharge of $587.1 million, our estimate of our full year 2011 effective tax rate was 7.1%. As a result of the compensation charge, aswell as the immediate recognition of the 2011 long-term incentive compensation awards, we had a fourth quarter 2011 effective taxrate of 3.8% (pre-tax loss of $540.2 million and income tax benefit of $20.3 million that resulted in a full-year 2011 pre-tax loss of$208.5 million and income tax expense of $3.1 million). The compensation charge resulted in a one-time change to the historicalmix of business between AllianceBernstein, which incurs a 4.0% UBT, and its corporate subsidiaries that incur corporate levelincome taxes. In addition, the recorded tax benefit associated with the future deliveries of vested Holding Units was based on thecurrent market value in most jurisdictions, which was lower than the grant price of the awards included in the compensationcharge. Both contributed to us incurring tax expense of $3.1 million rather than a benefit at the full year estimated effective tax rateof 7.1%.
We recognize the effects of a tax position in the financial statements only if, as of the reporting date, it is “more likely than not” tobe sustained based solely on its technical merits. In making this assessment, we assume that the taxing authority will examine the taxposition and have full knowledge of all relevant information.
Annual Report 2012 121
AllianceBernstein L.P. and SubsidiariesNotes to Consolidated Financial Statements (continued)
A reconciliation of the beginning and ending amount of unrecognized tax benefits is as follows:Years Ended December 31,
2012 2011 2010
(in thousands)
Balance as of beginning of period $4,028 $5,326 $7,365
Additions for prior year tax positions 158 190 —
Reductions for prior year tax positions — — —
Additions for current year tax positions 918 761 823
Reductions for current year tax positions — — —
Reductions related to closed years/settlements with tax authorities (1,432) (2,249) (2,862)
Balance as of end of period $3,672 $4,028 $5,326
The amount of unrecognized tax benefits as of December 31, 2012, 2011 and 2010 when recognized, is recorded as a reduction toincome tax expense and reduces the company’s effective tax rate.
Interest and penalties, if any, relating to tax positions are recorded in income tax expense on the consolidated statements of income.The total amount of interest expense (credit) recorded in income tax expense during 2012, 2011 and 2010 was $(0.3) million, $(0.2)million and $(0.1) million, respectively. The total amount of accrued interest recorded on the consolidated statements of financialcondition as of December 31, 2012, 2011 and 2010 are $0.2 million, $0.5 million and $0.7 million, respectively. There were noaccrued penalties as of December 31, 2012, 2011 or 2010.
The company is generally no longer subject to U.S. federal, or state and local income tax examinations by tax authorities for anyyear prior to 2009, except as set forth below.
The Internal Revenue Service (“IRS”) initiated an examination of our domestic corporate subsidiaries’ federal tax returns for theyears 2008 through 2010 in the fourth quarter of 2011. This examination was completed in 2012 and we have received notificationthat the IRS has accepted our tax returns as filed.
In addition, examinations of five of AllianceBernstein’s domestic corporate subsidiaries were initiated in 2010 and 2011 by state andlocal taxing authorities. Two of these examinations were closed in 2012 with no change to our tax filings and one of these auditswas settled for $0.2 million and the remaining reserves were released. An assessment has been received for the fourth audit for years2007 through 2010. This matter remains in the appeal stage and we do not believe an increase in the existing reserve is necessary.The fifth audit remains in progress and we do not believe an increase in the reserve is necessary.
The Canadian Revenue Agency continues their examination of AllianceBernstein’s Canadian subsidiary tax returns for the years2005 through 2007. We have been advised verbally that there will be no change to the tax filing for the year 2005. An initialassessment has been made by the Canadian Revenue Agency with respect to years 2006 and 2007. The assessment is being chal-lenged and remains in the appeal stage. We do not believe an increase to the reserve is necessary. Currently, there are no otherincome tax examinations at our significant non-U.S. subsidiaries except as noted above. Years that remain open and may be subjectto examination vary under local law, and range from one to seven years.
During the third quarter of 2011, the City of New York notified us of an examination of AllianceBernstein’s UBT returns for theyears 2007 and 2008. The examination was started in the fourth quarter of 2012 and remains in progress. We do not believe anincrease in the reserve is necessary.
Since there are no significant examinations for the years 2009 and forward it is our opinion that there will not be any recognition ofunrecognized tax benefits. However, adjustment to the reserve could occur in light of changing facts and circumstances with respectto any future examinations.
122 AllianceBernstein

AllianceBernstein L.P. and SubsidiariesNotes to Consolidated Financial Statements (continued)
Deferred income taxes reflect the net tax effect of temporary differences between the carrying amounts of assets and liabilities forfinancial reporting purposes and the amounts used for income tax purposes. The tax effect of significant items comprising the netdeferred tax asset (liability) is as follows:
December 31,2012 2011
(in thousands)
Deferred tax asset:
Differences between book and tax basis:
Benefits from net operating loss carryforwards $ 15,352 $ 5,138
Long-term incentive compensation plans 28,340 35,716
Other, primarily accrued expenses deductible when paid 12,825 14,398
56,517 55,252
Less: valuation allowance (12,789) (5,138)
Deferred tax asset 43,728 50,114
Deferred tax liability:
Differences between book and tax basis:
Intangible assets 6,971 14,325
Translation adjustment 8,655 9,413
Other, primarily undistributed earnings of certain foreign subsidiaries — 330
Deferred tax liability 15,626 24,068
Net deferred tax asset $28,102 $26,046
Valuation allowances of $12.8 million and $5.1 million were established during 2012 and 2011, respectively, due to the uncertaintyof realizing certain net operating loss (“NOL”) carryforwards given the future losses expected to be incurred by the applicable sub-sidiaries. We had NOL carryforwards at December 31, 2012 of approximately $73.7 million in certain foreign locations with anindefinite expiration period.
The deferred tax asset is included in other assets. Management has determined that realization of the deferred tax asset is more likelythan not based on anticipated future taxable income.
The company provides income taxes on the undistributed earnings of non-U.S. corporate subsidiaries except to the extent that suchearnings are permanently invested outside the United States. As of December 31, 2012, $619.9 million of accumulated undis-tributed earnings of non-U.S. corporate subsidiaries were permanently invested. At existing applicable income tax rates, additionaltaxes of approximately $24.1 million, net of foreign tax credits, would need to be provided if such earnings were remitted.
Annual Report 2012 123

AllianceBernstein L.P. and SubsidiariesNotes to Consolidated Financial Statements (continued)
21. Business Segment Information
Management has assessed the requirements of ASC 280, Segment Reporting, and determined that, because we utilize a consolidatedapproach to assess performance and allocate resources, we have only one operating segment. Enterprise-wide disclosures as of andfor the years ended December 31, 2012, 2011 and 2010, were as follows:
Services
Net revenues derived from our investment management, research and related services were as follows:Years Ended December 31,
2012 2011 2010
(in millions)
Institutions $ 485 $ 617 $ 765
Retail 1,193 1,093 1,069
Private client 586 652 651
Bernstein research services 414 437 431
Other 62 (47) 37
Total revenues 2,740 2,752 2,953
Less: Interest expense 3 2 4
Net revenues $2,737 $2,750 $2,949
Our AllianceBernstein Global High Yield Portfolio, an open-end fund incorporated in Luxembourg (ACATEUH: LX), generatedapproximately 12%, 10% and 7% of our investment advisory and service fees and 13%, 11% and 8% of our net revenues during2012, 2011 and 2010, respectively.
Geographic Information
Net revenues and long-lived assets, related to our U.S. and international operations, as of and for the years ended December 31,were:
2012 2011 2010
(in millions)
Net revenues:
United States $ 1,700 $ 1,725 $ 1,933
International 1,037 1,025 1,016
Total $2,737 $2,750 $2,949
Long-lived assets:
United States $ 3,363 $ 3,403 $ 3,448
International 52 74 74
Total $3,415 $3,477 $3,522
Major Customers
Company-sponsored mutual funds are distributed to individual investors through broker-dealers, insurance sales representatives,banks, registered investment advisers, financial planners and other financial intermediaries. Certain subsidiaries of AXA, includingAXA Advisors, LLC, have entered into selected dealer agreements with AllianceBernstein Investments and have been responsiblefor 4%, 1% and 2% of our open-end mutual fund sales in 2012, 2011 and 2010, respectively. During 2012, Hong Kong and Shang-hai Banking Corporation (HSBC), UBS AG and Citigroup (or their respective subsidiaries) were responsible for approximately
124 AllianceBernstein

AllianceBernstein L.P. and SubsidiariesNotes to Consolidated Financial Statements (continued)
13%, 10% and 6%, respectively, of our open-end mutual fund sales. Neither AXA nor these unaffiliated companies are under anyobligation to sell a specific amount of AllianceBernstein Fund shares and each also sells shares of mutual funds that it sponsors andthat are sponsored by unaffiliated organizations.
AXA and the general and separate accounts of AXA Equitable (including investments by the separate accounts of AXA Equitable inthe funding vehicle EQ Advisors Trust) accounted for approximately 4%, 4% and 5% of total revenues for the years endedDecember 31, 2012, 2011 and 2010, respectively. No single institutional client other than AXA and its subsidiaries accounted formore than 1% of total revenues for the years ended December 31, 2012, 2011 and 2010.
22. Related Party Transactions
Mutual Funds
Investment management, distribution, shareholder and administrative, and brokerage services are provided to individual investors bymeans of retail mutual funds sponsored by our company, our subsidiaries and our affiliated joint venture companies. Substantially allof these services are provided under contracts that set forth the services to be provided and the fees to be charged. The contracts aresubject to annual review and approval by each of the mutual funds’ boards of directors or trustees and, in certain circumstances, bythe mutual funds’ shareholders. Revenues for services provided or related to the mutual funds are as follows:
Years Ended December 31,2012 2011 2010
(in thousands)
Investment advisory and services fees $885,669 $840,165 $778,284
Distribution revenues 400,763 351,621 338,597
Shareholder servicing fees 89,117 91,931 93,148
Other revenues 5,127 5,643 5,726
Bernstein research services 133 66 121
AXA and its Subsidiaries
We provide investment management and certain administration services to AXA and its subsidiaries. In addition, AXA and its sub-sidiaries distribute company-sponsored mutual funds, for which they receive commissions and distribution payments. Sales ofcompany-sponsored mutual funds through AXA and its subsidiaries, excluding cash management products, aggregated approx-imately $1.7 billion, $0.4 billion and $0.5 billion for the years ended December 31, 2012, 2011 and 2010, respectively. Also, we arecovered by various insurance policies maintained by AXA subsidiaries and we pay fees for technology and other services providedby AXA and its subsidiaries. Aggregate amounts included in the consolidated financial statements for transactions with AXA and itssubsidiaries are as follows:
Years Ended December 31,2012 2011 2010
(in thousands)
Revenues:
Investment advisory and services fees $ 113,076 $ 114,266 $ 135,004
Bernstein research services 982 802 492
Distribution revenues 943 — —
Other revenues 599 599 583
$115,600 $115,667 $136,079
Annual Report 2012 125

AllianceBernstein L.P. and SubsidiariesNotes to Consolidated Financial Statements (continued)
Years Ended December 31,2012 2011 2010
(in thousands)
Expenses:
Commissions and distribution payments to financial intermediaries $ 7,924 $ 7,411 $ 8,896
General and administrative 19,779 22,191 21,256
Other 1,550 1,467 264
$29,253 $31,069 $30,416
Balance Sheet:
Institutional investment advisory and services fees receivable $ 7,878 $ 9,004 $ 18,654
Prepaid insurance 1,342 1,411 1,199
Other due (to) from AXA and its subsidiaries (3,732) (4,319) (4,732)
$ 5,488 $ 6,096 $15,121
During the first quarter of 2011, AXA sold its 50% interest in our consolidated Australian joint venture to an unaffiliated third party as partof a larger transaction. On March 31, 2011, we purchased that 50% interest from the unaffiliated third party making our Australian entityan indirect wholly-owned subsidiary. Investment advisory and services fees earned by this company were approximately $8.5 million forthe first three months of 2011 and $37.1 million for the year ended December 31, 2010, of which approximately $3.0 million and$12.8 million, respectively, were from AXA affiliates and are included in the table above. Minority interest recorded for this company was$0.4 million for the first three months of 2011 and $3.6 million for the year ended December 31, 2010.
AllianceBernstein Venture Fund I, L.P. was launched during 2006. It seeks to achieve its investment objective, which is long-termcapital appreciation through equity and equity-related investments, by acquiring early-stage growth companies in private transactions.One of our subsidiaries is the general partner of the fund and, as a result, the fund is included in our consolidated financial statements,with approximately $47 million, $59 million and $101 million of investments on the consolidated statements of financial condition as ofDecember 31, 2012, 2011 and 2010, respectively. AXA Equitable holds a 10% limited partnership interest in this fund.
We maintain an unfunded, non-qualified long-term incentive compensation plan known as the Capital Accumulation Plan and also haveassumed obligations under contractual unfunded long-term incentive compensation arrangements covering certain executives (“ContractualArrangements”). The Capital Accumulation Plan was frozen on December 31, 1987 and no additional awards have been made. The Boardmay terminate the Capital Accumulation Plan at any time without cause, in which case our liability would be limited to benefits that havevested. Payment of vested benefits under both the Capital Accumulation Plan and the Contractual Arrangements will generally be made overa ten-year period commencing at retirement age. The General Partner is obligated to make capital contributions to AllianceBernstein inamounts equal to benefits paid under the Capital Accumulation Plan and the Contractual Arrangements. Amounts paid by the General Part-ner to AllianceBernstein for the Capital Accumulation Plan and the Contractual Arrangements for the years ended December 31, 2012, 2011and 2010 was $4.4 million, $4.8 million and $4.9 million, respectively.
Other Related Parties
The consolidated statements of financial condition include a net receivable from Holding as a result of cash transactions for fees andexpense reimbursements. The net receivable balance included in the consolidated statements of financial condition as ofDecember 31, 2012, 2011 and 2010 was $6.1 million, $2.5 million and $0.9 million, respectively.
23. Acquisitions
On October 1, 2010, we acquired SunAmerica’s alternative investment group, an experienced team that manages a portfolio ofhedge fund and private equity fund investments. The purchase price of this acquisition, accounted for under ASC 805, BusinessCombinations, was $49.0 million, consisting of $14.3 million of cash payments, $2.5 million of assumed deferred compensation
126 AllianceBernstein

AllianceBernstein L.P. and SubsidiariesNotes to Consolidated Financial Statements (continued)
liabilities and $32.2 million of net contingent consideration payable. The net contingent consideration payable consists of the netpresent value of three annual payments of $1.5 million to SunAmerica based on its assets under management transferred to us in theacquisition and the net present value of projected revenue sharing payments of $35.5 million based on projected newly-raised assetsunder management by the acquired group. This contingent consideration payable was offset by $4.1 million of performance-basedfees earned in 2010 determined to be pre-acquisition consideration. The excess of the purchase price over the fair value of identifi-able assets acquired resulted in the recognition of $46.1 million of goodwill. During 2012 and 2011, no adjustments were made tothe contingent consideration payable.
During the first quarter of 2011, AXA sold its 50% interest in our consolidated Australian joint venture to an unaffiliated third party aspart of a larger transaction. On March 31, 2011, we purchased that 50% interest from the unaffiliated third party for $21.4 million,making our Australian entity an indirect wholly-owned subsidiary. As a result, we eliminated $32.1 million of non-controlling interestsin consolidated entities and increased partner’s capital attributable to AllianceBernstein unitholders by $10.7 million.
On May 31, 2011, we acquired Pyrander Capital Management, LLC, an investment management company jointly owned byCaxton Associates L.P. (“Caxton”) and Kurt Feuerman, a Caxton portfolio manager. We hired Mr. Feuerman and members of histeam from Caxton, and acquired investment management contracts of the investment vehicles the team managed. The purchaseprice of this acquisition, accounted for under ASC 805, Business Combinations, was $10.2 million, consisting of $5.5 million of cashpayments, $4.4 million payable in 2012 and 2013 (if Mr. Feuerman remains with the company) and a miscellaneous liability of$0.3 million. The excess of the purchase price over the fair value of identifiable assets acquired resulted in the recognition of$5.7 million of goodwill. We also recorded $2.5 million of indefinite-lived intangible assets relating to the acquired fund’sinvestment management contracts and $2.0 million of definite-lived intangible assets relating to separately managed accountrelationships. Mr. Feuerman also received two restricted Holding Unit awards; one with a three-year service condition (the awardwas amended in December 2011 to eliminate the service condition) and one with a five-year service condition (with three specificservice dates) and performance conditions (with three specific assets under management targets, later amended to two). As a result ofthe service conditions at the time of the acquisition, for accounting purposes these awards are considered compensation expense, notpart of the purchase price. Also, we were contingently liable to pay Caxton up to an additional $4.4 million if Mr. Feuerman meetsall of his service conditions and performance targets. As of December 31, 2012, we accrued $1.5 million of this liability to Caxtondue to an amendment to the acquisition agreement eliminating the first of Mr. Feuerman’s three performance targets.
On November 30, 2011, we acquired Taiwan International Investment Management Co. (“TIIM”) to expand our business in theTaiwanese market. The purchase price of this acquisition, accounted for under ASC 805, Business Combinations, was a cash payment of$15.0 million, net of cash acquired. The valuation of the fair value of assets and liabilities acquired had been determined provisionally asof December 31, 2011. The excess of the purchase price over the current fair value of identifiable net assets acquired resulted in therecognition of $9.8 million of goodwill as of December 31, 2011. The valuation was completed in the first quarter of 2012. As a result,intangible assets relating to customer relationships of $0.3 million were recognized retrospectively as of December 31, 2011 with acorresponding reduction in goodwill.
The 2010 and 2011 acquisitions have not had a significant impact on 2012, 2011 or 2010 revenues and earnings. As a result, wehave not provided supplemental pro forma information.
24. Accounting Pronouncements
In December 2011, the FASB issued ASU 2011-11, Disclosures about Offsetting Assets and Liabilities. The amended standard requiresan entity to disclose information about offsetting and related arrangements to enable users of its financial statements to understandthe effect of those arrangements on its financial position. An entity is required to apply the amendments for annual reporting periodsbeginning on or after January 1, 2013, and interim periods within those annual periods. An entity should provide the disclosuresrequired by those amendments retrospectively for all comparative periods presented. This amendment is not expected to have amaterial impact on our consolidated financial statements.
Annual Report 2012 127
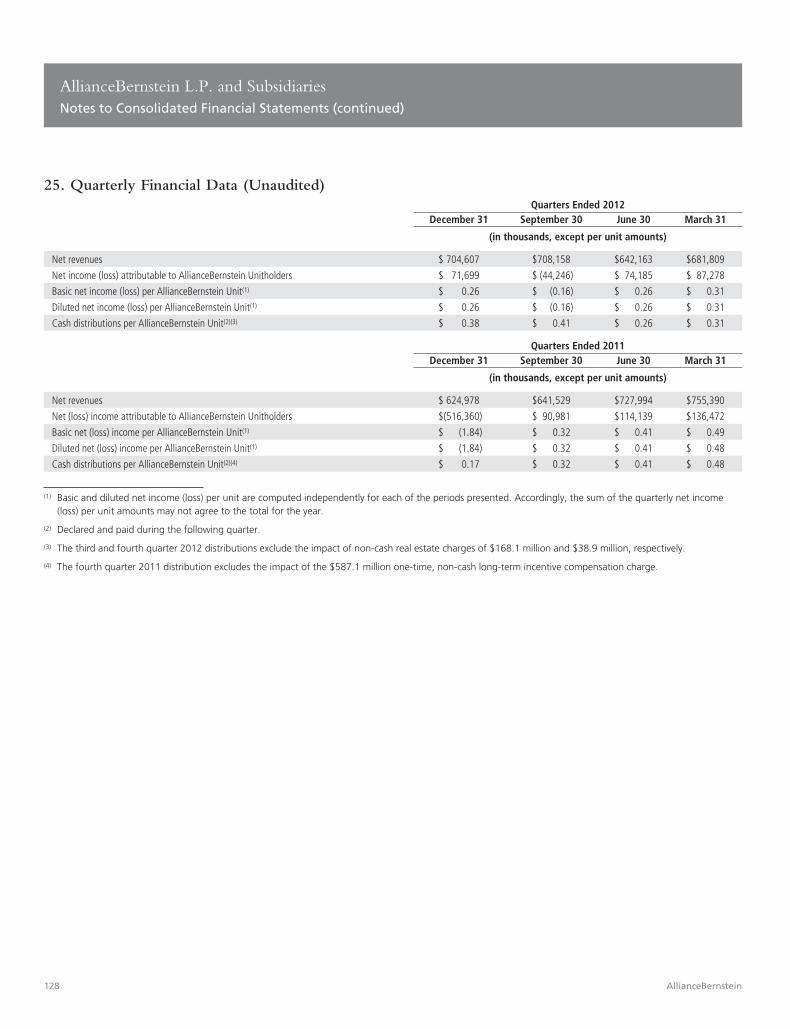
AllianceBernstein L.P. and SubsidiariesNotes to Consolidated Financial Statements (continued)
25. Quarterly Financial Data (Unaudited)Quarters Ended 2012
December 31 September 30 June 30 March 31
(in thousands, except per unit amounts)
Net revenues $ 704,607 $708,158 $642,163 $681,809
Net income (loss) attributable to AllianceBernstein Unitholders $ 71,699 $ (44,246) $ 74,185 $ 87,278
Basic net income (loss) per AllianceBernstein Unit(1) $ 0.26 $ (0.16) $ 0.26 $ 0.31
Diluted net income (loss) per AllianceBernstein Unit(1) $ 0.26 $ (0.16) $ 0.26 $ 0.31
Cash distributions per AllianceBernstein Unit(2)(3) $ 0.38 $ 0.41 $ 0.26 $ 0.31
Quarters Ended 2011December 31 September 30 June 30 March 31
(in thousands, except per unit amounts)
Net revenues $ 624,978 $641,529 $727,994 $755,390
Net (loss) income attributable to AllianceBernstein Unitholders $(516,360) $ 90,981 $114,139 $136,472
Basic net (loss) income per AllianceBernstein Unit(1) $ (1.84) $ 0.32 $ 0.41 $ 0.49
Diluted net (loss) income per AllianceBernstein Unit(1) $ (1.84) $ 0.32 $ 0.41 $ 0.48
Cash distributions per AllianceBernstein Unit(2)(4) $ 0.17 $ 0.32 $ 0.41 $ 0.48
(1) Basic and diluted net income (loss) per unit are computed independently for each of the periods presented. Accordingly, the sum of the quarterly net income(loss) per unit amounts may not agree to the total for the year.
(2) Declared and paid during the following quarter.
(3) The third and fourth quarter 2012 distributions exclude the impact of non-cash real estate charges of $168.1 million and $38.9 million, respectively.
(4) The fourth quarter 2011 distribution excludes the impact of the $587.1 million one-time, non-cash long-term incentive compensation charge.
128 AllianceBernstein

Item 9. Changes in and Disagreements with Accountants on Accounting and FinancialDisclosure
Neither AllianceBernstein nor Holding had any changes in or disagreements with accountants in respect of accounting or financialdisclosure.
Annual Report 2012 129

Item 9A. Controls and Procedures
Disclosure Controls and Procedures
Each of Holding and AllianceBernstein maintains a system of disclosure controls and procedures that is designed to ensure thatinformation required to be disclosed in our reports under the Exchange Act is (i) recorded, processed, summarized and reported in atimely manner, and (ii) accumulated and communicated to management, including the Chief Executive Officer and the ChiefFinancial Officer, to permit timely decisions regarding our disclosure.
As of the end of the period covered by this report, management carried out an evaluation, under the supervision and with the partic-ipation of the Chief Executive Officer and the Chief Financial Officer, of the effectiveness of the design and operation of disclosurecontrols and procedures. Based on this evaluation, the Chief Executive Officer and the Chief Financial Officer concluded that thedisclosure controls and procedures are effective.
Management’s Report on Internal Control Over Financial Reporting
Management acknowledges its responsibility for establishing and maintaining adequate internal control over financial reporting foreach of Holding and AllianceBernstein.
Internal control over financial reporting is a process designed by, or under the supervision of, a company’s principal executive offi-cer and principal financial officer, to provide reasonable assurance regarding the reliability of financial reporting and the preparationof financial statements for external purposes in accordance with U.S. generally accepted accounting principles (“GAAP”) andincludes those policies and procedures that:
• Pertain to the maintenance of records that, in reasonable detail, accurately and fairly reflect the transactions and dispositions ofthe assets of the company;
• Provide reasonable assurance that transactions are recorded as necessary to permit preparation of financial statements in accord-ance with GAAP and receipts and expenditures of the company are being made only in accordance with authorizations ofmanagement and directors of the company; and
• Provide reasonable assurance regarding prevention or timely detection of unauthorized acquisition, use or disposition of thecompany’s assets that could have a material effect on the financial statements.
All internal control systems, no matter how well designed, have inherent limitations. Therefore, even those internal control systemsdetermined to be effective can provide only reasonable assurance with respect to the reliability of financial statement preparation andpresentation. Because of these inherent limitations, internal control over financial reporting may not prevent or detect misstate-ments. Projections of any evaluation of effectiveness of internal control to future periods are subject to the risk that controls maybecome inadequate because of changes in conditions, or that the degree of compliance with the policies or procedures maydeteriorate.
Management assessed the effectiveness of Holding’s and AllianceBernstein’s internal control over financial reporting as ofDecember 31, 2012. In making its assessment, management used the criteria set forth by the Committee of Sponsoring Orga-nizations of the Treadway Commission in Internal Control-Integrated Framework (“COSO criteria”).
Based on its assessment, management concluded that, as of December 31, 2012, each of Holding and AllianceBernstein maintainedeffective internal control over financial reporting based on the COSO criteria.
PricewaterhouseCoopers LLP, the independent registered public accounting firm that audited the 2012 financial statements includedin this Form 10-K, has issued an attestation report on the effectiveness of each of Holding’s and AllianceBernstein’s internal controlover financial reporting as of December 31, 2012. These reports can be found in Item 8.
130 AllianceBernstein

Changes in Internal Control Over Financial Reporting
During the fourth quarter of 2011, we entered into a strategic outsourcing agreement with State Street Corporation (“State Street”), aprovider of financial services to institutional investors, pursuant to which State Street is performing certain of our investment operationsand control activities, including trade settlement, portfolio administration and reconciliations, derivative operations, client reporting,and performance measurement, for many of our client accounts. Since we entered into this agreement, State Street has continued toperform certain control activities utilizing our systems and approximately 100 of our former employees are now employed by StateStreet to provide global servicing support for our institutional client accounts. Over an approximate two-year period, certainAllianceBernstein technology platforms are being converted to similar platforms maintained by State Street so as to leverage their scaleand market expertise. During the fourth quarter of 2012, we converted our automated reconciliation system to State Street’s equivalentsystem and we implemented additional oversight controls to reflect our transition to State Street’s infrastructure.
We determined that there were no other changes in our internal control over financial reporting during the quarter endedDecember 31, 2012 that have materially affected, or are reasonably likely to materially affect, our internal control over financialreporting.
Annual Report 2012 131

Item 9B. Other Information
Both AllianceBernstein and Holding reported all information required to be disclosed on Form 8-K during the fourth quarter of2012.
132 AllianceBernstein

PART III
Item 10. Directors, Executive Officers and Corporate Governance
We use “Internet Site” in this Item 10 to refer to our company’s internet site, www.alliancebernstein.com.
To contact our company’s Corporate Secretary, you may send an email to [email protected] or write to Corpo-rate Secretary, AllianceBernstein L.P., 1345 Avenue of the Americas, New York, New York 10105.
General Partner
The Partnerships’ activities are managed and controlled by the General Partner. The Board of the General Partner (“Board”) acts asthe Board of each of the Partnerships. The General Partner has agreed that it will conduct no active business other than managingthe Partnerships, although it may make certain investments for its own account. Neither AllianceBernstein Unitholders nor HoldingUnitholders have any rights to manage or control the Partnerships or to elect directors of the General Partner. The General Partneris an indirect, wholly-owned subsidiary of AXA.
The General Partner does not receive any compensation from the Partnerships for services rendered to them as their general part-ner. The General Partner holds a 1% general partnership interest in AllianceBernstein and 100,000 units of general partnershipinterest in Holding. Each general partnership unit in Holding is entitled to receive distributions equal to those received by eachHolding Unit.
The General Partner is entitled to reimbursement by AllianceBernstein for any expenses it incurs in carrying out its activities asgeneral partner of the Partnerships, including compensation paid by the General Partner to its directors and officers (to the extentsuch persons are not compensated directly by AllianceBernstein).
Board of Directors
Our Board currently consists of 13 members, including our Chief Executive Officer, five senior executives of AXA and certain ofits other subsidiaries, one former senior executive of AXA Financial, and six independent members. While we do not have a formal,written diversity policy in place, we believe that an effective board consists of a diverse group of individuals who collectively possessa variety of complementary skills and perspectives and who will work together to provide a board with the needed leadership andexperience to successfully guide our company. As set forth in its charter, the Corporate Governance Committee of the Board(“Governance Committee”) assists the Board in identifying and evaluating such candidates, determining Board composition,developing and monitoring a process to assess Board effectiveness, developing and implementing corporate governance guidelines,and reviewing programs relating to matters of corporate responsibility.
As we indicate below, our directors have a combined wealth of leadership experience derived from extensive service leading large,complex organizations in their roles as either senior executives or board members and in government and academia. Each has theintegrity, business judgment, collegiality and commitment that are among the essential characteristics for a member of our Board.Collectively, they have substantive knowledge and skills applicable to our business, including expertise in regulatory; publicaccounting and financial reporting; finance; risk management; business development; operations; strategic planning; managementdevelopment, succession planning and compensation; corporate governance; investor relations; public policy; international matters;and financial services areas.
As of February 12, 2013, the members of the Board were as follows:
Peter S. KrausMr. Kraus, age 60, was elected Chairman of the Board of the General Partner and Chief Executive Officer of the General Partner,AllianceBernstein and Holding in December 2008. Mr. Kraus has in-depth experience in financial services, including investmentbanking, asset management and private wealth management. He served as an executive vice president, the head of global strategyand a member of the Management Committee of Merrill Lynch & Company Inc. (“Merrill Lynch”) from September 2008through December 2008. Mr. Kraus spent 22 years with Goldman Sachs Group Inc. (“Goldman”), where he most recently servedas co-head of the Investment Management Division and a member of the Management Committee, as well as head of firm-wide
Annual Report 2012 133

strategy and chairman of the Strategy Committee. Mr. Kraus also served as co-head of the Financial Institutions Group. He wasnamed a partner at Goldman in 1994 and managing director in 1996. In April 2010, Mr. Kraus was appointed a member of theManagement Committee of AXA, which was formed by Mr. de Castries in April 2010 to assist him with the operational manage-ment of AXA. He was named a Director of AXA Financial, AXA Equitable, MONY Life Insurance Company (a wholly-ownedsubsidiary of AXA Financial, “MONY”) and MONY Life Insurance Company of America (a wholly-owned subsidiary of MONY,“MLOA”) in February 2009. He is not compensated for serving in these roles for AXA and its subsidiaries. Mr. Kraus is alsoChairman of the Investment Committee of Trinity College, Chair of the Board of Overseers of CalArts, Co-Chair of the Friends ofCarnegie International, a member of the board of directors of Lincoln Center for the Performing Arts and the chairman of LincolnCenter’s Art Committee, a member of the board of Keewaydin Foundation, and a member of the National Board of Young Audi-ences, Inc., a non-profit organization that works with educational systems, the arts community and private and public sectors toprovide arts education to children.
Mr. Kraus brings to the Board extensive knowledge of our industry and in-depth experience in financial services, including experi-ence as co-head of the Investment Management Division and head of firm-wide strategy at Goldman.
Christopher M. CondronMr. Condron, age 65, was elected a Director of the General Partner in May 2001. Formerly Director, President and Chief Execu-tive Officer of AXA Financial since May 2001, he retired from his AXA positions effective January 1, 2011. Prior to retiring, hewas also Chairman of the Board, Chief Executive Officer and President of AXA Equitable and a member of the ManagementCommittee of AXA. In addition, Mr. Condron was Chairman of the Board, President and Chief Executive Officer of MONY andMLOA, which AXA Financial acquired in July 2004. During 2010, he assumed the additional responsibility of overseeing AXA’sGlobal Life & Savings and Health businesses. Prior to joining AXA Financial, Mr. Condron served as both President and ChiefOperating Officer of Mellon Financial Corporation (“Mellon”), from 1999, and as Chairman and Chief Executive Officer of TheDreyfus Corporation, a subsidiary of Mellon, from 1995. Mr. Condron has been a member of the Board of Directors of KeefeBruyette & Woods, Inc. (NYSE: KBW), a full-service investment bank and broker-dealer, since January 2007. He also serves asChairman of Keefe Bruyette & Woods’s compensation committee and as a member of its audit committee and its corporate gover-nance and nominating committee.
Mr. Condron brings to the Board extensive financial services, insurance, sales and sell-side experience obtained from his service toAXA and Mellon, as well as his directorship at Keefe Bruyette & Woods.
Henri de CastriesMr. de Castries, age 58, was elected a Director of the General Partner in October 1993. In April 2010, in connection with a changein AXA’s governance structure from dual boards (the Supervisory Board and the Management Board) to a single Board of Direc-tors, Mr. de Castries was appointed Chairman and Chief Executive Officer of AXA. From May 2000 through the change in AXA’sgovernance, Mr. de Castries was Chairman of the AXA Management Board. Prior thereto, he served AXA in various capacities,including Vice Chairman of the AXA Management Board; Senior Executive Vice President-Financial Services and Life InsuranceActivities in the United States, Germany, the United Kingdom and Benelux from 1996 to 2000; Senior Executive Vice President-Financial Services and Life Insurance Activities from 1993 to 1996; Corporate Secretary from 1991 to 1993; and Central Director ofFinances from 1989 to 1991. Before joining AXA, Mr. de Castries was part of the French Finance Ministry Inspection Office. He isa director or officer of AXA Financial, AXA Equitable and various other privately-held subsidiaries and affiliates of the AXA Group.Mr. de Castries was elected Vice Chairman of AXA Financial in February 1996 and was elected Chairman of AXA Financial inApril 1998. In addition, Mr. de Castries joined the board of directors and audit committee of Nestle, Inc. (VTX: NESN) in April2012.
Mr. de Castries brings to the Board his extensive experience as an AXA executive and, prior thereto, his financial and public sectorexperience gained from working in French government. The Board also benefits from his invaluable perspective as the Chairmanand Chief Executive Officer of AXA.
Denis DuverneMr. Duverne, age 59, was elected a Director of the General Partner in February 1996. In April 2010, he was appointed the DeputyChief Executive Officer of AXA and a member of the Board of Directors of AXA. In January 2010, he was selected to oversee
134 AllianceBernstein

AXA Group strategy, finance and operations with AXA’s Chief Operating Officer, Chief Financial Officer and Chief Risk Officerreporting to him. Mr. Duverne was a member of the AXA Management Board from February 2003 through the change in AXA’sgovernance in April 2010. He was Chief Financial Officer of AXA from May 2003 through December 2009. From January 2000 toMay 2003, Mr. Duverne served as Group Executive Vice President-Finance, Control and Strategy. Mr. Duverne joined AXA asSenior Vice President in 1995. He is a Director of AXA Financial, AXA Equitable and various other privately-held subsidiaries andaffiliates of the AXA Group.
Mr. Duverne brings to the Board the highly diverse experience he has attained throughout the years from the many key roles he hasserved for AXA.
Steven G. ElliottMr. Elliott, age 66, was elected a Director of the General Partner in January 2011. Until his retirement in December 2010,Mr. Elliott had served as Senior Vice Chairman of The Bank of New York Mellon (“BNY Mellon”) since 1998. In this role, hehelped oversee numerous company-wide growth initiatives and co-headed the integration of The Bank of New York and Mellonfrom 2007 to 2009. Mr. Elliott was Chief Financial Officer of Mellon from 1990 to 2002 and Head of Finance from 1987 to 1990,while also leading some of Mellon’s diverse lines of business, including asset servicing, securities lending, global cash managementand institutional banking. Before joining BNY Mellon, he held senior positions at First Commerce Corporation (1986-87), CrockerNational Bank (1984-86), Continental Illinois National Bank (1977-84) and United California Bank (1974-77). Since January 2011,he has been a member of the boards of directors of Huntington Bancshares Inc. (NASDAQ: HBAN) and PPL Corporation (NYSE:PPL). Since April 2011, he has served as Chairman of Huntington Bancshares’s risk oversight committee and, since January 2012,he has served as Chairman of PPL Corporation’s audit committee. Mr. Elliott served as a director of Mellon (NYSE: MEL) from2001 to the July 2007 merger with The Bank of New York and then as a director of BNY Mellon (NYSE: BK) through July 2008.
Mr. Elliott, an audit committee financial expert, brings to the Board the four decades of auditing and banking expertise he hasgained in the financial services industry.
Deborah S. HechingerMs. Hechinger, age 62, was elected a Director of the General Partner in May 2007. Currently an independent consultant on non-profit governance, she was President and Chief Executive Officer of BoardSource, a leading governance resource for non-profitorganizations, from 2003 to 2007. From 2004 to 2007, Ms. Hechinger also served as co-convener of the Governance and FiduciaryResponsibilities work group, one of the five groups established by the Panel on the Nonprofit Sector to make recommendations toCongress on ways to improve the governance and accountability of non-profit organizations. She also served on the Advisory Boardfor the Center for Effective Philanthropy and was a Member of the Ethics and Accountability Committee at Independent Sector.Prior to joining BoardSource, Ms. Hechinger was the Executive Vice President of the World Wildlife Fund, a large, global con-servation organization, where she oversaw all fundraising, communication and operations activities. She has also served as a DeputyComptroller and as Director of the Securities and Corporate Practices Division at the Office of the Comptroller of the Currencyand has held senior executive positions in the Division of Enforcement at the SEC. A graduate of Georgetown Law School,Ms. Hechinger has been a member in good standing of the District of Columbia Bar Association since 1975.
Ms. Hechinger brings to the Board the significant knowledge of corporate governance matters and public policy she has gainedthrough her extensive experience in both the private and public sectors.
Weston M. HicksMr. Hicks, age 56, was elected a Director of the General Partner in July 2005. He has been a Director and the President and chiefexecutive officer of Alleghany Corporation (NYSE: Y, “Alleghany”), an insurance and diversified financial services holding com-pany, since December 2004 and was Executive Vice President of Alleghany from October 2002 until December 2004. From March2001 through October 2002, Mr. Hicks was Executive Vice President and Chief Financial Officer of The Chubb Corporation.
Mr. Hicks brings to the Board extensive financial expertise, including his unique perspective as the chief executive officer of anunaffiliated publicly-traded company, his background as a professional investor and CFA charter holder, and his ten years of experi-ence as an equity research analyst.
Annual Report 2012 135

Andrew J. McMahonMr. McMahon, age 45, was elected a Director of the General Partner in April 2012. Mr. McMahon is President of AXA Equitableand a member of the company’s Executive Committee and Board of Directors. In this role, he has responsibility for the company’sFinancial Protection & Wealth Management business, including life insurance manufacturing, marketing, distribution and in-forcemanagement. He joined AXA Equitable in March 2005 as Senior Vice President to launch the company’s Strategic InitiativesGroup. Later that year, Mr. McMahon was promoted to Executive Vice President and was named Chief Operating Officer of AXAAdvisors, the company’s broker-dealer and retail distribution channel comprised of approximately 6,000 career contracted financialprofessionals. He served as Chairman of AXA Advisors from July 2007 to May 2012. Before joining AXA Equitable,Mr. McMahon was a principal at McKinsey & Co. (“McKinsey”) and served as a life insurance practice leader in North Amer-ica. Prior to McKinsey, he spent several years in management positions with various business divisions of General Electric(“GE”). Mr. McMahon has been a Director of AXA Financial, AXA Equitable, MONY and MLOA since May 2011. He is also amember of the Board of Directors of the American Council of Life Insurers.
Mr. McMahon brings to the Board the in-depth knowledge of finance, retail distribution and insurance he has developed throughkey roles he has served for AXA, McKinsey and GE.
Kevin MolloyMr. Molloy, age 42, was elected a Director of the General Partner in January 2011. He has been the Business Support and Develop-ment representative for AXA Equitable, AXA Investment Managers S.A. (a wholly-owned subsidiary of AXA), AXA Japan andAllianceBernstein since January 2011. From April 2010 to December 2010, Mr. Molloy was the Chief Financial Officer of AXAGlobal Life, a company formed by AXA to accelerate global synergies throughout its Life & Savings business. Prior to serving in thisrole, he was Senior Vice President of Distribution & Service Finance at AXA Equitable. From November 2003 to April 2007,Mr. Molloy served as Vice President and Head of AXA’s North American Investor Relations office. Mr. Molloy joined AXA Equi-table in 1999 as Director of Corporate Finance after beginning his career in 1993 as an economist and corporate profits analyst withThe United States Department of Commerce’s Bureau of Economic Analysis.
Mr. Molloy brings to the Board the finance, capital markets and investor relations experience he has developed through the keyroles he has served for AXA and the in-depth knowledge of global economies he gained while working for the U.S. government.
Mark PearsonMr. Pearson, age 54, was elected a Director of the General Partner in February 2011. Also during February 2011, he succeededMr. Condron as Director, President and Chief Executive Officer of AXA Financial, and as Chairman and Chief Executive Officerof AXA Equitable. Having joined AXA in 1995 when AXA acquired National Mutual Funds Management Limited (presently AXAAsia Pacific Holdings Limited), Mr. Pearson became a member of the Executive Committee of AXA in 2008 and the ManagementCommittee of AXA in 2011. He was appointed Regional Chief Executive of AXA Asia Life in 2001 and, in 2008, was namedPresident and Chief Executive Officer of AXA Japan Holding Co., Ltd. and AXA Life Insurance Co., Ltd. Prior to joining AXA,Mr. Pearson spent approximately 20 years in the insurance sector, holding several senior management positions at National Mutualand Friends Provident.
Mr. Pearson brings to the Board the in-depth knowledge of Asian markets and diverse experience he has developed through thekey roles he has served for AXA.
Lorie A. SlutskyMs. Slutsky, age 60, was elected a Director of the General Partner in July 2002. Since January 1990, she has been President andChief Executive Officer of The New York Community Trust, a community foundation that manages a $2 billion endowment andannually grants more than $150 million to non-profit organizations. Ms. Slutsky is Secretary and a board member of theIndependent Sector and co-chaired its National Panel on the Non-Profit Sector, which focused on reducing abuse and improvinggovernance practices at non-profit organizations. She served on the Board of Directors of BoardSource from 1999 to 2008 andserved as its Chair from 2005 to 2007. Ms. Slutsky also served as Trustee and Chair of the Budget Committee of Colgate Universityfrom 1989 to 1997 and as a member of the Council on Foundations from 1989 to 1995, for which she also served as Chair from1993 to 1995. She has been a Director of AXA Financial, AXA Equitable, MONY and MLOA since September 2006. In addition,
136 AllianceBernstein

Ms. Slutsky was a member of AXA Financial’s Audit Committee from 2006 through 2010. She has been a member of AXA Finan-cial’s Organization and Compensation Committee since 2006 and was elected Chair of the Organization and CompensationCommittee in February 2012.
Ms. Slutsky brings to the Board extensive corporate governance experience achieved through her executive and managerial roles atThe New York Community Trust, BoardSource, Independent Sector and various other non-profit organizations. She also bringsvaluable insight gained from serving on boards and board committees at certain of our parent companies.
A.W. (Pete) Smith, Jr.Mr. Smith, age 69, was elected a Director of the General Partner in July 2005. The former CEO of Watson Wyatt Worldwide(now Towers Watson), he was also President of the Private Sector Council, a non-profit public service organization dedicated toimproving the efficiency of the federal government, from September 2000 until May 2005. Mr. Smith has been President of SmithCompensation Consulting, a privately-held company specializing in executive compensation consulting, since June 2005.
Mr. Smith brings to the Board extensive financial services expertise, compensation expertise and leadership skills obtained throughhis wealth of experience as Towers Watson’s chief executive and the head of his own firm.
Peter J. TobinMr. Tobin, age 68, was elected a Director of the General Partner in May 2000. From September 2003 to June 2005, he was SpecialAssistant to the President of St. John’s University. Prior thereto, Mr. Tobin served as Dean of the Tobin College of Business of St.John’s University from August 1998 to September 2003. As Dean, Mr. Tobin was the chief executive and academic leader of theCollege of Business. Mr. Tobin was Chief Financial Officer at The Chase Manhattan Corporation from 1996 to 1997. Prior there-to, he was Chief Financial Officer of Chemical Bank (which merged with Chase in 1996) from 1991 to 1996 and Chief FinancialOfficer of Manufacturers Hanover Trust (which merged with Chemical in 1991) from 1985 to 1991. Mr. Tobin has served on theboard of directors of CIT Group Inc. (NYSE: CIT) since 1985 (except for one year during which CIT Group was owned byTyco). Until his retirement in February 2012, he had been a Director of AXA Financial and AXA Equitable since March 1999 andalso served on AXA Financial’s Audit Committee, Investment Committee, Investment and Finance Committee, Organization andCompensation Committee, and Executive Committee.
Mr. Tobin brings to the Board invaluable expertise as an audit committee financial expert and key leadership and analytical skillsfrom his positions in academia.
Executive Officers (other than Mr. Kraus)
Laurence E. Cranch, General CounselMr. Cranch, age 66, has been our General Counsel since he joined our firm in 2004. Prior to joining AllianceBernstein,Mr. Cranch was a partner of Clifford Chance, an international law firm. Mr. Cranch joined Clifford Chance in 2000 when Rog-ers & Wells, a New York law firm of which he was Managing Partner, merged with Clifford Chance.
James A. Gingrich, Chief Operating OfficerMr. Gingrich, age 54, joined our firm in 1999 as a senior research analyst with SCB LLC and has been our firm’s Chief OperatingOfficer since December 2011. Prior to becoming COO, Mr. Gingrich held senior managerial positions with SCB LLC, includingChairman and Chief Executive Officer of SCB LLC from February 2007 to November 2011 and Global Director of Research fromDecember 2002 to January 2007.
Lori A. Massad, Head of Human Capital and Chief Talent OfficerMs. Massad, age 48, joined our firm in 2006 as Chief Talent Officer. In February 2009, her role was expanded to include oversightof Human Capital in addition to Talent Development. Prior to joining our firm, Ms. Massad served as Chief Talent Officer andChief Operating Officer at Marakon Associates, a strategy consulting firm from 2004 to 2006. Before joining Marakon, Ms. Massadwas a founding member of two start-ups: Spencer Stuart Talent Network (in 2001) and EmployeeMatters, a human resources out-sourcing firm (in 2000). Prior to helping found EmployeeMatters, she spent eight years at The Boston Consulting Group, where
Annual Report 2012 137

she became a senior manager on the consulting staff and leader of the firm’s recruiting, training and development programs. While withThe Boston Consulting Group, Ms. Massad was also an adjunct professor at New York University’s Leonard Stern School of Business.
Robert P. van Brugge, Chairman and Chief Executive Officer of SCB LLCMr. van Brugge, age 44, has been Chairman of the Board and Chief Executive Officer of SCB LLC since December 2011. Prior tobecoming Chairman and CEO, Mr. van Brugge served as Global Director of Research from January 2008 to December 2011. Hejoined our firm in 2002 as a senior research analyst with SCB LLC.
John C. Weisenseel, Chief Financial OfficerMr. Weisenseel, age 53, joined our firm in May 2012 as Senior Vice President and Chief Financial Officer. From 2004 to April2012, he worked at The McGraw Hill Companies (“McGraw Hill”), where he served initially as Senior Vice President andCorporate Treasurer and, since 2007, as Chief Financial Officer of the firm’s Standard & Poor’s subsidiary. Prior to joining McGrawHill, Mr. Weisenseel was Vice President and Corporate Treasurer for Barnes & Noble, Inc. Before that, he spent ten years in vari-ous derivatives trading and financial positions at Citigroup. A Certified Public Accountant, Mr. Weisenseel also worked at KPMGLLP.
Board Meetings
In 2012, the Board held regular meetings in February, April, May, August, September and November; the Board held one specialmeeting in July 2012.
Generally, the Board holds six meetings annually: in February, April, May, July or August, September, and November. In addition,the Board holds special meetings or takes action by unanimous written consent as circumstances warrant. The Board has standingExecutive, Audit, Corporate Governance, Compensation and Special Committees, each of which is described in further detail below.Each member of the Board attended 75% or more of the aggregate of all Board and committee meetings that he or she was entitledto attend in 2012, except Mr. de Castries.
Committees of the Board
In 2012, the Executive Committee of the Board (“Executive Committee”) was composed of Ms. Slutsky and Messrs. Condron, deCastries, Duverne, Kraus (Chair) and Tobin. The Executive Committee exercises all of the powers and authority of the Board (withlimited exceptions) when the Board is not in session, or when it is impractical to assemble the full Board. The Executive Commit-tee held four meetings in 2012.
In 2012, the Governance Committee was composed of Mr. Condron, Mr. Duverne, Ms. Hechinger (Chair), Mr. Kraus andMs. Slutsky. The Governance Committee (i) assists the Board and the sole stockholder of the General Partner in (1) identifying andevaluating qualified individuals to become Board members and (2) determining the composition of the Board and its committees,and (ii) assists the Board in (1) developing and monitoring a process to assess Board effectiveness, (2) developing and implementingour corporate governance guidelines and (3) reviewing our policies and programs that relate to matters of corporate responsibility ofthe General Partner and the Partnerships. The Governance Committee held two meetings in 2012.
In 2012, the Audit Committee of the Board (“Audit Committee”) was composed of Messrs. Elliott, Hicks, Smith and Tobin(Chair). The primary purposes of the Audit Committee are to: (i) assist the Board in its oversight of (1) the integrity of the financialstatements of the Partnerships, (2) the Partnerships’ status and system of compliance with legal and regulatory requirements and busi-ness conduct, (3) the independent registered public accounting firm’s qualification and independence, and (4) the performance of thePartnerships’ internal audit function; and (ii) oversee the appointment, retention, compensation, evaluation and termination of thePartnerships’ independent registered public accounting firm. Consistent with this function, the Audit Committee encourages con-tinuous improvement of, and fosters adherence to, the Partnerships’ policies, procedures and practices at all levels. With respect tothese matters, the Audit Committee provides an open avenue of communication among the independent registered public account-ing firm, senior management, the Internal Audit Department and the Board. The Audit Committee held eight meetings in 2012.
138 AllianceBernstein

In 2012, the Compensation Committee of the Board (“Compensation Committee”) was composed of Mr. Condron (Chair),Mr. Duverne, Mr. Elliott, Mr. Kraus, Ms. Slutsky and Mr. Smith. Mr. de Castries served as a member of the Compensation Com-mittee during January 2012; he resigned as a member of the Compensation Committee in February 2012. The CompensationCommittee held eight meetings in 2012. For additional information about the Compensation Committee, see “Compensation Dis-cussion and Analysis—Compensation Committee” in Item 11.
The functions of each of the committees discussed above are more fully described in each committee’s charter. The charters areavailable on our Internet Site.
The Special Committee of the Board (“Special Committee”) is composed of all of the independent members of the Board and in2012 included Mr. Elliott, Ms. Hechinger, Mr. Hicks, Ms. Slutsky, Mr. Smith and Mr. Tobin (Chair). The Special Committee hasthe authority to direct and oversee any matters referred to it by the Board and/or management including, but not limited to, mat-ters relating to conflicts of interest and the relationship among AllianceBernstein, Holding and AXA. The members of the SpecialCommittee do not receive any additional compensation for their service on the Special Committee, apart from the ordinary meet-ing fees described in “Director Compensation” in Item 11. The Special Committee did not meet in 2012.
Audit Committee Financial Experts
In January 2012 and 2013, the Governance Committee, after reviewing materials prepared by management, recommended that theBoard determine that each of Steven G. Elliott and Peter J. Tobin is an “audit committee financial expert” within the meaning ofItem 407(d) of Regulation S-K. The Board so determined at its regular meetings in February 2012 and 2013. The Board alsodetermined at these meetings that each of Messrs. Elliott, Hicks, Smith and Tobin is financially literate and possesses accounting orrelated financial management expertise, as contemplated by Section 303A.07(a) of the NYSE Listed Company Manual.
Independence of Certain Directors
In January 2012 and 2013, the Governance Committee, after reviewing materials prepared by management, recommended that theBoard determine that each of Mr. Elliott, Ms. Hechinger, Mr. Hicks, Ms. Slutsky, Mr. Smith and Mr. Tobin is “independent”within the meaning of Section 303A.02 of the NYSE Listed Company Manual. The Board considered immaterial the relationshipsof Mr. Elliott (relating to the fact that AllianceBernstein and its family of mutual funds are clients of BNY Mellon and Mr. Elliott’sequity stake in BNY Mellon), Mr. Hicks (relating to the fact that Alleghany Corporation is a client of SCB LLC and Mr. Hicks wasemployed by Bernstein from 1991 to 1999), Ms. Slutsky (relating to contributions formerly made by AllianceBernstein to The NewYork Community Trust, of which she is President and Chief Executive Officer, and the fact that she is a member of the boards ofdirectors of AXA Financial and AXA Equitable) and Mr. Tobin (relating to the fact that, until his retirement in February 2012, hewas a member of the boards of directors of AXA Financial and AXA Equitable) and then determined, at its February 2012 and 2013regular meetings, that each of Mr. Elliott, Ms. Hechinger, Mr. Hicks, Ms. Slutsky, Mr. Smith and Mr. Tobin is independent withinthe meaning of the relevant rules.
Board Leadership Structure and Role in Risk Oversight
Leadership
The Board, together with the Governance Committee, is responsible for reviewing the Board’s leadership structure. In determiningthe appropriate individual to serve as our Chairman and Chief Executive Officer, the Board and the Governance Committeeconsider, among other things, the composition of the Board, the role of the Board’s lead director (discussed more fully below), ourcompany’s strong corporate governance practices, and the challenges and opportunities specific to our company.
Annual Report 2012 139

We believe that there are significant benefits to having the positions of Chairman and Chief Executive Officer shared by oneindividual, but only if a company has sufficient counter-balancing governance in place. We see significant value in having the leaderin the Board room also manage the affairs of our company, and we believe any potential doubts as to our Board’s objectivity inevaluating management are offset by the lead independent director we have in place and the fact that the affirmative consent of ourlargest Unitholder (AXA) is required in order for any action taken by the Executive Committee or the Compensation Committeeto be effective.
Lead Independent Director
Our lead independent director, Peter J. Tobin, was appointed unanimously by our Board in November 2005. He presides at allexecutive sessions of non-management and independent directors and makes himself available, if requested by Unitholders, forconsultation and communication. Interested parties wishing to communicate directly with Mr. Tobin may send an e-mail, with“confidential” in the subject line, to our Corporate Secretary or address mail to Mr. Tobin in care of our Corporate Secretary. OurCorporate Secretary will promptly forward such e-mail or mail to Mr. Tobin. We have posted this information in the“Management & Governance” section of our Internet Site.
Risk Oversight
The Board, together with the Audit Committee, has oversight for our company’s risk management framework, both investmentrisk and operational risk, and is responsible for helping to ensure that our company’s risks are managed in a sound manner. TheBoard has delegated to the Audit Committee, which is composed entirely of independent directors, the responsibility to considerour company’s policies and practices with respect to operational risk assessment and operational risk management, including discus-sing with management the major financial risk exposures and the steps taken to monitor and control such exposures. Members ofthe company’s Risk Management team responsible for identifying, managing and controlling the array of operational and invest-ment risks inherent in our company’s business and operations, make quarterly reports to the Audit Committee, including an annualrisk review which addresses operational risk identification, assessment and monitoring. The Chief Risk Officer, whose expertiseencompasses both quantitative research and associated investment risks, makes periodic presentations to the Board and reportsdirectly to our Chairman and Chief Executive Officer, and commencing in 2013, has a reporting line to the Audit Committee.
The Board has determined that its leadership and risk oversight are appropriate for our company. Mr. Kraus’s in-depth knowledgeof financial services and extensive executive experience in the investment management industry make him uniquely suited to serveas our Chairman and Chief Executive Officer, while Mr. Tobin’s leadership and expertise have proven invaluable at enhancing theoverall functioning of the Board. The Board believes that the combination of a single Chairman and Chief Executive Officer, a leadindependent director, the Audit Committee, a specialized risk management team, and significant involvement from our largestUnitholder (AXA) provide the appropriate leadership to help ensure effective risk oversight by the Board.
Code of Ethics and Related Policies
All of our directors, officers and employees are subject to our Code of Business Conduct and Ethics. The code is intended to com-ply with Section 303A.10 of the NYSE Listed Company Manual, Rule 204A-1 under the Investment Advisers Act and Rule 17j-1under the Investment Company Act, as well as with recommendations issued by the Investment Company Institute regarding,among other things, practices and standards with respect to securities transactions of investment professionals. The Code of BusinessConduct and Ethics establishes certain guiding principles for all of our employees, including sensitivity to our fiduciary obligationsand ensuring that we meet those obligations. Our Code of Business Conduct and Ethics may be found in the “Management &Governance” section of our Internet Site.
We have adopted a Code of Ethics for the Chief Executive Officer and Senior Financial Officers, which is intended to comply withSection 406 of the Sarbanes-Oxley Act of 2002 (“Item 406 Code”). The Item 406 Code, which may be found in the“Management & Governance” section of our Internet Site, was adopted on October 28, 2004 by the Executive Committee. We
140 AllianceBernstein
intend to satisfy the disclosure requirements under Item 5.05 of Form 8-K regarding certain amendments to, or waivers from, provi-sions of the Item 406 Code that apply to the Chief Executive Officer, Chief Financial Officer and Controller by posting suchinformation on our Internet Site. To date, there have been no such amendments or waivers.
NYSE Governance Matters
Section 303A.00 of the NYSE Listed Company Manual exempts limited partnerships from compliance with the following sectionsof the Manual: Section 303A.01 (board must have a majority of independent directors), 303A.04 (corporate governance committeemust have only independent directors as its members), and 303A.05 (compensation committee must have only independent direc-tors as its members). Holding is a limited partnership (as is AllianceBernstein). In addition, because the General Partner is a wholly-owned subsidiary of AXA, and the General Partner controls Holding (and AllianceBernstein), we believe we would also qualify forthe “controlled company” exemption. Notwithstanding the foregoing, the Board has adopted a Corporate Governance CommitteeCharter that complies with Section 303A.04 and a Compensation Committee Charter that complies with Section 303A.05. How-ever, not all members of these committees are independent.
Our Corporate Governance Guidelines (“Guidelines”) promote the effective functioning of the Board and its committees, promote theinterests of the Partnerships’ respective Unitholders, with appropriate regard to the Board’s duties to the sole stockholder of the GeneralPartner, and set forth a common set of expectations as to how the Board, its various committees, individual directors and managementshould perform their functions. The Guidelines may be found in the “Management & Governance” section of our Internet Site.
The Governance Committee is responsible for considering any request for a waiver under the Code of Business Conduct and Eth-ics, the Item 406 Code, the AXA Group Compliance and Ethics Guide, and the AXA Financial Policy Statement on Ethics fromany director or executive officer of the General Partner. Any such waiver that has been granted would be set forth in the“Management & Governance” section of our Internet Site.
Our Internet Site, under the heading “Meet our Directors”, provides an e-mail address for any interested party, including Unithold-ers, to communicate with the Board of Directors. Our Corporate Secretary reviews e-mails sent to that address and has some dis-cretion in determining how or whether to respond, and in determining to whom such e-mails should be forwarded. In ourexperience, substantially all of the e-mails received are ordinary client requests for administrative assistance that are best addressed bymanagement or solicitations of various kinds.
The 2012 Certification by our Chief Executive Officer under NYSE Listed Company Manual Section 303A.12(a) was submitted tothe NYSE on February 21, 2012.
Certifications by our Chief Executive Officer and Chief Financial Officer pursuant to Section 302 of the Sarbanes-Oxley Act of2002 have been furnished as exhibits to this Form 10-K.
Holding Unitholders and AllianceBernstein Unitholders may request a copy of any committee charter, the Guidelines, the Code of Busi-ness Conduct and Ethics, and the Item 406 Code by contacting our Corporate Secretary. The charters and memberships of the Executive,Audit, Governance and Compensation Committees may be found in the “Management & Governance” section of our Internet Site.
Fiduciary Culture
We maintain a robust fiduciary culture and, as a fiduciary, we place the interests of our clients first and foremost. We are committedto the fair and equitable treatment of all our clients, and to compliance with all applicable rules and regulations and internal policiesto which our business is subject. We pursue these goals through education of our employees to promote awareness of our fiduciaryobligations, incentives that align employees’ interests with those of our clients, and a range of measures, including active monitor-ing, to ensure regulatory compliance. Specific steps we have taken to help us achieve these goals include:
• establishing two committees, the Code of Ethics Oversight Committee (“Ethics Committee”) and the Internal ComplianceControls Committee (“Compliance Committee”), composed of our executive officers and other senior executives to overseeand resolve code of ethics and compliance-related issues;
Annual Report 2012 141

• creating an ombudsman office, where employees and others can voice concerns on a confidential basis;
• initiating firm-wide compliance and ethics training programs; and
• appointing a Conflicts Officer and establishing a Conflicts Committee to identify and mitigate conflicts of interest.
The Ethics Committee oversees all matters relating to issues arising under our Code of Business Conduct and Ethics. The EthicsCommittee meets on a quarterly basis and at such other times as circumstances warrant. The Ethics Committee and its sub-committee, the Personal Trading Subcommittee, have oversight of personal trading by our employees.
The Compliance Committee reviews compliance issues throughout our Company, endeavors to develop solutions to those issues asthey may arise from time to time, and oversees implementation of those solutions. The Compliance Committee meets on a quar-terly basis and at such other times as circumstances warrant.
Section 16(a) Beneficial Ownership Reporting Compliance
Section 16(a) of the Exchange Act requires directors of the General Partner and executive officers of the Partnerships, and personswho own more than 10% of the Holding Units or AllianceBernstein Units, to file with the SEC initial reports of ownership andreports of changes in ownership of Holding Units or AllianceBernstein Units. To the best of management’s knowledge, during2012: (i) all Section 16(a) filing requirements relating to Holding were complied with, except one Form 4 for each of Edward J.Farrell, James A. Gingrich and Robert P. van Brugge was filed late (each Form 4 related solely to Holding Units withheld duringJanuary 2012 to fulfill statutory tax withholding requirements at the time of distribution of long-term incentive compensationawards to each of these officers); and (ii) all Section 16(a) filing requirements relating to AllianceBernstein were complied with. OurSection 16 filings can be found under “Investor & Media Relations” / “Reports & SEC Filings” on our Internet Site.
142 AllianceBernstein

Item 11. Executive Compensation
Compensation Discussion and Analysis (“CD&A”)
Overview of Compensation Philosophy and Program
The intellectual capital of our employees is collectively the most important asset of our firm. We invest in people—we hire qualifiedpeople, train them, encourage them to give their best thinking to the firm and our clients, and compensate them in a mannerdesigned to motivate and retain them. As a result, the costs of employee compensation and benefits are significant, comprisingapproximately 46.1% of our operating expenses and representing approximately 42.7% of our revenues (49.8% of our adjusted netrevenues, as defined below) for 2012. Although these percentages are not unusual for companies in the financial services industry, themagnitude of these costs requires that they be monitored by management, and overseen by the Board, with the particular attentionof the Compensation Committee of the Board (“Compensation Committee”).
We believe that the quality, skill and dedication of our executives are critical to enhancing the long-term value of our company.Our key compensation goals are to attract, motivate and retain highly-qualified executive talent, provide rewards for the past year’sperformance and provide incentives for future performance, and align our executives’ long-term interests with those of our clientsand Unitholders. We believe that success in achieving good results for the firm, and for our Unitholders, flows from achievinginvestment success for our clients. We are focused on ensuring that our compensation practices are competitive with industry peersand provide sufficient potential for wealth creation for our executives and employees, which we believe will enable us to meet ourcompensation goals.
We utilize a variety of compensation elements to achieve the goals described above, including base salary, annual short-term incentivecompensation awards (cash bonuses), a long-term incentive compensation award program and a defined contribution plan, all ofwhich are discussed in detail below.
In 2011, we implemented changes to our long-term incentive compensation award program to ensure that our compensation practi-ces are competitive and to better align the costs of employee compensation and benefits with the firm’s current year financial per-formance and provide employees with a higher degree of certainty that they will receive the incentive compensation they areawarded. Most equity replacement, sign-on or similar long-term incentive compensation awards included in separate employmentagreements or arrangements were not amended in 2011 to reflect these changes.
The changes implemented in 2011, which have been incorporated into our 2012 long-term incentive compensation program,include the following:
• We provide our employees, except certain members of senior management, with the opportunity to diversify their long-termincentive compensation awards by allocating up to 50% of their awards to cash, up to a maximum cash amount of $250,000(“Deferred Cash”). The portion of an award allocated to Deferred Cash is subject to the same multi-year vesting periods(generally, four years) as the portion of the award allocated to Holding Units; and
• We permit all active employees (i.e., those employees who were employed by the company as of December 31, 2012) whoterminate their employment or are terminated without cause, to continue to vest (as used in this Item 11, “vest” refers to thetime at which the awards are no longer subject to forfeiture for breach of the restrictions or risk management policies discussedimmediately below) in their long-term incentive compensation awards if they comply with certain agreements and restrictivecovenants set forth in the applicable award agreement. These agreements and covenants, which in 2011 were added to ourlong-term incentive compensation award programs for 2011 and prior years, include restrictions on competition and employeeand client solicitation, and a claw-back for failing to follow existing risk management policies. We expect to include theseagreements and covenants in the award agreements relating to long-term incentive compensation awards in future years.
For information about the accounting impact of the changes implemented in 2011, see Note 2 to AllianceBernstein’s consolidated finan-cial statements in Item 8.
Annual Report 2012 143

Consideration of Risk Matters in Determining Compensation
We have considered whether our compensation practices encourage unnecessary or excessive risk-taking and whether any risksarising from our compensation practices are reasonably likely to have a material adverse effect on our company. For the reasons setforth below, we have determined that our current compensation practices do not incentivize, and actually discourage, ouremployees from engaging in unnecessary or excessively risky activities. Accordingly, we have concluded that our compensationpractices do not create risks that are reasonably likely to have a material adverse effect on our company.
In our effort to foster the spirit of partnership among our employees and better align their interests with those of HoldingUnitholders and our clients, eligible employees receive at least half of their long-term incentive compensation awards in the form ofrestricted Holding Units, with multi-year vesting periods (generally, four years). Our Chairman and Chief Executive Officer firmlybelieves that compensating key employees with equity ownership fosters a true partnership community, one that will help us growand achieve our firm’s goals. We believe that as our employees become more focused on partnering with each other to achieve ourfirm’s overall goals, they will serve as checks and balances on each other in assessing risk and performance.
Our approach to long-term incentive compensation is designed to reflect the firm’s current year and long-term financial perform-ance and the specific performance of each individual employee. The initial amount of an employee’s award is based on theperformance of the firm and the employee for the current year. But because a substantial portion of the award is denominated inHolding Units that are not distributed until subsequent years, the ultimate value that the employee derives from the award dependson the long-term performance of the firm. Denominating a substantial portion of the award in Holding Units and deferring theirdelivery also sensitizes employees to risk outcomes and discourages them from taking excessive risks that could lead to a decrease inthe value of the Holding Units. Furthermore, and as noted above, generally all outstanding long-term incentive compensation awardsinclude a provision permitting us to “claw-back” the unvested portion of an employee’s long-term incentive compensation award(whether denominated in restricted Holding Units or Deferred Cash) if the Compensation Committee determines that (i) theemployee failed to follow existing risk management policies and (ii) as a result of the employee’s failure, there has been or reason-ably could be expected to be a material adverse impact on our firm or the employee’s business unit. We expect to include thisprovision in the award agreements relating to long-term incentive compensation awards in future years.
Overview of 2012 Incentive Compensation Program
Our 2012 incentive compensation, generally consisting of annual cash bonuses and long-term incentive compensation awards(restricted Holding Unit awards and Deferred Cash awards to employees with 2012 total compensation in excess of $200,000), isintended to reward our executives and employees for their performance and encourage them to remain with the firm. Annual cashbonuses, which generally reflect individual performance and the firm’s current year financial performance, provide a shorter-termincentive to remain through year end because such bonuses are typically paid during the last week of the year. Long-term incentivecompensation awards (whether denominated in restricted Holding Units or Deferred Cash) provide future earnings potential. Theyare subject to multi-year vesting periods (generally, four years) and are subject to forfeiture in the event an award recipient violatescertain agreements and restrictive covenants set forth in the applicable award agreement (see “Compensation Elements for ExecutiveOfficers—Long-term Incentive Compensation” in this Item 11). Although estimates are developed for budgeting and strategic planningpurposes, executive compensation is not correlated with meeting any specific targets (except that some of our salespeople havecompensation incentives based on sales levels).
The aggregate amount of incentive compensation (i.e., the amount available to pay annual cash bonuses and to grant long-termincentive compensation awards to executives and other eligible employees) generally is determined on a discretionary basis and isprimarily a function of our firm’s current year financial performance. Amounts are awarded to help us achieve our goal of attracting,motivating and retaining top talent while also helping ensure that our Unitholders receive an appropriate return on their invest-ment. Senior management, with the approval of the Compensation Committee, confirmed that the appropriate metric to considerin determining the amount of incentive compensation for 2012 is the ratio of adjusted employee compensation and benefits expenseto adjusted net revenues, both of which are described immediately below:
• Adjusted net revenues (see our discussion of “Management Operating Metrics” in Item 7) exclude investment gains and losses anddividends and interest on employee long-term incentive compensation-related investments and 90% of the investment gains and
144 AllianceBernstein

losses of our consolidated venture capital fund attributable to non-controlling interests. In addition, adjusted net revenues offsetdistribution-related payments to third parties as well as amortization of deferred sales commissions against distribution revenues.We also exclude from adjusted net revenues additional pass-through expenses we incur (primarily through our transfer agent)that are reimbursed and recorded as fees in revenues.
• Adjusted employee compensation and benefits expense is total employee compensation and benefits expense minus other employ-ment costs such as recruitment, training, temporary help and meals, and excludes the impact of mark-to-market vesting expense, aswell as dividends and interest expense, associated with employee long-term incentive compensation-related investments.
Senior management, with the approval of the Compensation Committee, also confirmed that the firm’s adjusted employee compen-sation and benefits expense should not exceed 50% of our adjusted net revenues, except in unexpected or unusual circumstances. Asshown in the table below, in 2012, adjusted employee compensation and benefits expense amounted to 49.8% of adjusted net rev-enues (in thousands):
Net Revenues $ 2,736,737
Adjustments (see above) (476,436)
Adjusted Net Revenues $2,260,301
Employee Compensation & Benefits Expense $ 1,168,645
Adjustments (see above) (42,724)
Adjusted Employee Compensation & Benefits Expense $1,125,921
Adjusted Compensation Ratio 49.8 %
For the year ended December 31, 2012, the adjusted compensation ratio included incremental compensation expense recognizedduring the third and fourth quarters of 2012 attributable to the restricted Holding Unit award granted to our Chief Executive Offi-cer pursuant to his extended employment agreement dated as of June 21, 2012 (discussed below in “Overview of our Chief ExecutiveOfficer’s Compensation—June 2012 Extended Employment Agreement” in this Item 11, “Extended Employment Agreement”). UnderU.S. GAAP, the compensation expense for the restricted Holding Unit award granted pursuant to the Extended EmploymentAgreement, which amounted to $33.1 million (based on the $12.17 grant date Holding Unit price), must be amortized on astraight-line basis over 6.5 years, beginning on June 21, 2012, the grant date. As a result, even though Mr. Kraus will not receiveany incremental cash compensation or cash distributions related to the restricted Holding Unit award pursuant to the ExtendedEmployment Agreement prior to its commencement date on January 3, 2014, we incurred $2.5 million of incremental compensa-tion expense resulting from such amortization during the second half of 2012 and will incur $5.1 million of such expense for the fullyear 2013.
Our 2012 adjusted compensation ratio of approximately 50% reflects the need to keep compensation levels competitive withindustry peers. In determining the appropriate level of compensation for the firm’s executives, senior management retained McLa-gan Partners (“McLagan”) to provide compensation benchmarking data that included comparisons of estimated 2012 executivecompensation to executive compensation in 2011.
Employees with total compensation in excess of $200,000 received a portion of their 2012 incentive compensation in the form of acash bonus and a portion in the form of long-term incentive compensation (at least 50% of which must have been allocated torestricted Holding Units). The split between cash bonus and long-term incentive compensation varied depending on the eligibleemployee’s total compensation, with lower-paid employees receiving a greater percentage of their incentive compensation as cashbonuses than more highly-paid employees. Quarterly cash distributions on vested and unvested restricted Holding Units are paidcurrently to award recipients. If Deferred Cash is elected, interest accrues monthly based on our monthly weighted average cost offunds and is credited to the award recipient annually. Our cost of funds during 2012 was approximately 0.4%, representing a nomi-nal return.
Annual Report 2012 145

Overview of our Chief Executive Officer’s Compensation
Current Employment AgreementOn December 19, 2008, Peter S. Kraus, the General Partner, AllianceBernstein and Holding entered into an agreement (“KrausEmployment Agreement”) pursuant to which Mr. Kraus serves as Chairman of the Board of Directors of the General Partner andChief Executive Officer (“CEO”) of the General Partner, AllianceBernstein and Holding until January 2, 2014 (“EmploymentTerm”), unless the Kraus Employment Agreement is terminated in accordance with its terms.
The terms of the Kraus Employment Agreement were the result of arm’s-length negotiations between Mr. Kraus and a member ofthe Compensation Committee. The terms of the Kraus Employment Agreement (which are described in detail immediately below),including the compensation elements, were discussed and approved by the Compensation Committee and the full Board onDecember 19, 2008 and reflect their decision to structure the allocation of Mr. Kraus’s compensation more heavily toward a grantof restricted Holding Units.
In connection with the commencement of Mr. Kraus’s employment, on December 19, 2008, he was granted 2,722,052 restrictedHolding Units (“Restricted Holding Unit Grant”). Subject to accelerated vesting clauses in the Kraus Employment Agreement,Mr. Kraus’s restricted Holding Units vest ratably on each of the first five anniversaries of December 19, 2008, commencingDecember 19, 2009, provided, with respect to each installment, Mr. Kraus continues to be employed by AllianceBernstein on thevesting date. In connection with the Extended Employment Agreement (which is described in detail below), AllianceBernstein amendedthe Kraus Employment Agreement permitting Mr. Kraus to defer until December 19, 2018 the delivery of the final vesting of the544,410 restricted Holding Units remaining under that agreement and to continue to receive distributions on those Holding Unitsuntil such delivery.
The Kraus Employment Agreement provides for immediate vesting upon AXA ceasing to control the management of AllianceBernstein’sbusiness or Holding ceasing to be publicly traded. The Kraus Employment Agreement also provides for the immediate vesting of the nexttwo installments of restricted Holding Units or, if fewer remain as of the termination date, the balance of the installments that are unvested,upon certain qualifying terminations of employment, including termination of Mr. Kraus’s employment (i) by AllianceBernstein withoutcause (“cause” means, among other things, (1) the continued, willful failure by Mr. Kraus to perform substantially his duties withAllianceBernstein after a written demand for substantial performance is delivered to him by the Board; (2) Mr. Kraus’s conviction of, orplea of guilty or nolo contendere to, a crime that constitutes a felony; (3) the willful engaging by Mr. Kraus in misconduct that is materiallyand demonstrably injurious to AllianceBernstein or any of its affiliates; (4) the willful breach by Mr. Kraus of the covenant not to discloseany confidential information pertaining to AllianceBernstein or its affiliates or the covenant not to compete with AllianceBernstein or itsaffiliates; and (5) Mr. Kraus’s failure to comply with a material written company workplace policy applicable to him), and (ii) by Mr. Krausfor good reason (“good reason” generally means actions taken by AllianceBernstein resulting in a material negative change in Mr. Kraus’semployment relationship, including assignment to Mr. Kraus of duties materially inconsistent with his position, any material breach of theKraus Employment Agreement by AllianceBernstein or a requirement by AllianceBernstein that Mr. Kraus be based at any office or loca-tion more than 25 miles commuting distance from company headquarters, or a requirement that Mr. Kraus report to an officer oremployee of AllianceBernstein instead of reporting directly to the Board). In addition, upon death or disability, Mr. Kraus immediatelyvests in a pro-rated portion of any restricted Holding Units otherwise due to vest on the next vesting date. During the Employment Term,Mr. Kraus has been, and continues to be, paid the cash distributions payable with respect to his unvested restricted Holding Units and adollar amount equal to the cash distributions payable with respect to the number of any Holding Units that are withheld byAllianceBernstein to cover Mr. Kraus’s tax withholding obligations as the Holding Units vest. These cash distributions have been, andcontinue to be, paid at the time distributions are made to Holding Unitholders generally, provided that no such payments to Mr. Krauswill be required with respect to any cash distribution with a record date following the earlier of (i) the termination of Mr. Kraus’semployment for any reason, and (ii) December 19, 2018.
The five-year vesting schedule provides Mr. Kraus with a strong incentive to remain with our firm for the full five-year term of theKraus Employment Agreement and to cause our firm to have strong financial performance during each of those five years. The sizeof the Restricted Holding Unit Grant, which had a value of approximately $52 million based on the market price of a Holding Uniton December 19, 2008, reflected the determination by Mr. Kraus and the Board that this was a reasonable and appropriate amount
146 AllianceBernstein

of long-term incentive compensation in view of Mr. Kraus’s expertise and experience, his past compensation, the compensation ofhis predecessor and the compensation of other chief executive officers of comparable asset management companies.
Mr. Kraus, pursuant to the Kraus Employment Agreement, was paid a $6 million cash bonus in 2009, which represented theamount that Mr. Kraus and the Board agreed represented a reasonable and appropriate short-term financial inducement forMr. Kraus to join AllianceBernstein based on the same factors (listed immediately above) and reflected the significant uncertainty sur-rounding the level of 2009 quarterly cash distributions on Holding Units when he was hired; it most directly reflects the company’sgoal of attracting highly-qualified executive talent.
Mr. Kraus is paid an annual base salary of $275,000, which has not been increased since he was hired. The $275,000 base salary is inline with our firm’s policy generally to keep base salaries of executives and other highly-compensated employees low in relation tototal compensation.
During the Employment Term, AllianceBernstein has no commitment to pay additional cash bonuses to Mr. Kraus beyond the $6million he was paid in 2009 (with any additional bonuses being entirely in the discretion of the Compensation Committee) or tomake any additional equity-based awards to him. Accordingly, for 2010 and subsequent years during the Employment Term, thetotality of Mr. Kraus’s compensation (other than his salary and absent any additional awards the Compensation Committee maychoose to grant) has been, and continues to be, dependent on the level of cash distributions on the restricted Holding Units grantedto him and the evolution of the trading price of Holding Units, both of which are partially dependent on the financial and operat-ing results of our firm. Therefore, his long-term interests are directly aligned with the interests of our Unitholders and alsoindirectly aligned with the interests of our clients, as strong performance for our clients generally contributes directly to increases inassets under management and thus improved financial performance for the firm.
Mr. Kraus received neither a cash bonus nor a long-term incentive compensation award for 2012, 2011 or 2010.
Mr. Kraus is also entitled to receive perquisites and benefits, including full tax gross-ups by AllianceBernstein with respect topersonal air travel on company-owned aircraft, personal use of a company car and driver, any continued medical coverage due totermination by death or disability, and any payments for COBRA coverage due to termination of employment by AllianceBernsteinwithout cause or by Mr. Kraus for good reason. These terms reflect the results of the arm’s-length negotiation process describedimmediately above.
June 2012 Extended Employment AgreementOn June 21, 2012, Mr. Kraus, the General Partner, AllianceBernstein and Holding entered into the Extended Employment Agree-ment, pursuant to which Mr. Kraus will continue to serve as Chairman of the Board of the General Partner and CEO of the Gen-eral Partner, AllianceBernstein and Holding from January 3, 2014, the day following the end of the Employment Term, untilJanuary 2, 2019 (the “Extended Employment Term”), unless the Extended Employment Agreement is terminated in accordancewith its terms. Although the Extended Employment Term does not begin until January 3, 2014, certain provisions of the ExtendedEmployment Agreement became effective on entry into the agreement, including those provisions summarized below relating to thegrant of additional restricted Holding Units and termination of employment.
The terms of the Extended Employment Agreement were the result of arm’s-length negotiations between Mr. Kraus, members ofthe Compensation Committee, who discussed this matter during four Special Meetings of the Compensation Committee, and othermembers of the Board. In addition, the Compensation Committee considered comparative compensation benchmarking data fromJohnson Associates, Inc. (“Johnson”), a compensation consultant engaged by the Compensation Committee, which data summar-ized CEO compensation levels for 2011 at selected asset management companies and banks comparable to ours. This data providedranges of compensation levels for CEOs at these companies, including salary, cash bonus, total cash compensation and totalcompensation. The terms of the Extended Employment Agreement (which are described in detail immediately below), including thecompensation elements, were discussed and approved first by the Compensation Committee and then by the Executive Committeeand reflect both Committees’ decision to structure the allocation of Mr. Kraus’s compensation heavily toward an additional grant ofrestricted Holding Units. The Executive Committee exercises all of the powers and authority of the full Board (with limitedexceptions) when the Board is not in session or when it is impractical to assemble the full Board. For additional information regard-ing the Executive Committee, see “Committees of the Board” in Item 10 of this Form 10-K.
Annual Report 2012 147

In connection with the signing of the Extended Employment Agreement on June 21, 2012, Mr. Kraus was granted an additional2,722,052 restricted Holding Units. Subject to accelerated vesting clauses in the Extended Employment Agreement (e.g., immediatevesting upon AXA ceasing to control the management of AllianceBernstein’s business or Holding ceasing to be publicly traded),Mr. Kraus’s restricted Holding Units will vest ratably on each of the first five anniversaries of December 19, 2013, commencingDecember 19, 2014, provided, with respect to each installment, Mr. Kraus continues to be employed by AllianceBernstein on thevesting date. Pursuant to the Extended Employment Agreement, Mr. Kraus has elected to delay delivery of all of the restrictedHolding Units until after the final vesting date on December 19, 2018, subject to acceleration upon a “change in control” of ourfirm (i.e., AXA, our parent company, ceasing to control the management of AllianceBernstein’s business or Holding ceasing to bepublicly traded) and certain qualifying events of termination of employment. Beginning January 3, 2014, the commencement dateof the Extended Employment Agreement, Mr. Kraus will be paid the cash distributions payable with respect to his unvested andvested restricted Holding Units until they are delivered or forfeited. These cash distributions will be paid at the time distributionsare made to Holding Unitholders generally.
The terms set forth in the Extended Employment Agreement regarding potential payments to Mr. Kraus upon a change in controlof AllianceBernstein or a termination of employment are substantially the same as the comparable terms in the Kraus EmploymentAgreement (see “Overview of our Chief Executive Officer’s Compensation—Current Employment Agreement” above), except for the termsgoverning a termination of employment by AllianceBernstein without “cause” or by Mr. Kraus for “good reason”. If the ExtendedEmployment Agreement had been terminated for one of these reasons before December 19, 2012, Mr. Kraus would have forfeitedthe entire restricted Holding Unit award granted under the Extended Employment Agreement. If the Extended EmploymentAgreement is terminated for one of these reasons after December 19, 2012 but before December 19, 2013, Mr. Kraus immediatelywill vest in the installment of restricted Holding Units scheduled to vest on December 19, 2014. If the Extended EmploymentAgreement is terminated for one of these reasons after December 19, 2013, Mr. Kraus immediately will vest in the next twoinstallments of restricted Holding Units or, if fewer remain as of the termination date, the balance of the installments that areunvested.
Mr. Kraus will continue to be paid an annual base salary of $275,000, subject to increase by the Compensation Committee.
During the Extended Employment Term, AllianceBernstein has no commitment to pay any cash bonuses to Mr. Kraus (with anybonuses being entirely in the discretion of the Compensation Committee) or to make any additional equity-based awards tohim. Accordingly, during the Extended Employment Term, the totality of Mr. Kraus’s compensation (other than his salary) willcontinue to be primarily dependent on the level of cash distributions on the restricted Holding Units granted to him and the tradingprice of Holding Units, both of which are partially dependent on the financial and operating results of our firm. Therefore, hislong-term interests continue to be directly aligned with the interests of our Unitholders and also indirectly aligned with the interestsof our clients, as strong performance for our clients generally contributes directly to increases in assets under management and thusimproved financial performance for the firm.
The terms in the Extended Employment Agreement regarding perquisites and benefits are substantially the same as the comparableterms in the Kraus Employment Agreement (see “Overview of our Chief Executive Officer’s Compensation—Current Employment Agree-ment” above), except that, starting January 3, 2014, Mr. Kraus will reimburse AllianceBernstein for any incremental cost toAllianceBernstein associated with his personal use of company-owned aircraft and will not be entitled to tax gross-ups byAllianceBernstein with respect to personal use of company-owned aircraft or personal use of a company car and driver. These termsreflect the results of the arm’s length negotiation process described above.
During the second quarter of 2012, Johnson provided us with comparative compensation benchmarking data, which summarizedCEO compensation levels for 2011 at selected asset management companies and banks comparable to ours. As noted above, this dataprovided ranges of compensation levels for CEOs at these companies, including salary, cash bonus, total cash compensation and totalcompensation. The comparable companies, which were selected by management with input from Johnson in order to provideappropriate comparisons for the size and business mix of AllianceBernstein, include Affiliated Managers, Ameriprise Financial, Bankof New York Mellon, BlackRock Financial Management, Credit Suisse Asset Management, Eaton Vance, Federated Investors,Franklin Resources, Invesco Plc, Janus Capital Group, JPMorgan Asset Management, Lazard, Legg Mason, Morgan Stanley,Northern Trust Corp., State Street and T. Rowe Price Associates.
148 AllianceBernstein

Factors Considered when Determining Executive Compensation
Decisions about executive compensation are based primarily on our assessment of each executive’s leadership, operational performanceand potential to enhance investment returns and service for our clients, all of which contribute to long-term Unitholder value. We donot utilize quantitative formulas when determining the compensation of our CEO, our Chief Financial Officer (“CFO”), our FormerInterim CFO and our other three most highly-compensated executive officers (“named executive officers”), but rather rely on ourjudgment about each executive’s performance and whether each particular payment or award provides an appropriate reward for theexecutive officer’s and the firm’s current year performance. We begin this process by determining the total incentive compensationamounts available for a particular year (as more fully explained above in “Overview of 2012 Incentive Compensation Program”). We then con-sider a number of key factors for each of the named executive officers (other than Mr. Kraus, our CEO, whose compensation isdescribed above in “Overview of our Chief Executive Officer’s Compensation”). These factors include: total compensation paid to the namedexecutive officer in the previous year; the increase or decrease in the current year’s total incentive compensation amounts available; thenamed executive officer’s performance compared to individual business and operational goals established at the beginning of the year(or, in the case of Mr. Weisenseel, our CFO, the business and operational goals established when he joined us in May 2012); thenature, scope and level of responsibilities of the named executive officer; the contribution to our overall financial results; and the con-tribution of the executive’s business unit to our company’s fiduciary culture in which clients’ interests are paramount. In 2012, we alsoconsidered data provided by McLagan to benchmark the total compensation paid to each of our named executive officers.
This process, which is conducted by the CEO working with other members of senior management, results in specific incentivecompensation recommendations to the Compensation Committee supported by the factors considered. The Compensation Com-mittee then makes the final incentive compensation decisions. The Compensation Committee does not analyze quantifiable goalsrelating to the firm’s business units in determining the cash bonus of each of the named executive officers.
In addition to our CEO, our CFO and our other three most highly-compensated executive officers, for 2012, pursuant to appli-cable SEC rules and regulations, we also included our former Interim CFO, who returned to his duties as our firm’s CorporateController and Chief Accounting Officer after Mr. Weisenseel joined our firm in May 2012, as a “named executive officer”.
The priorities of our named executive officers (other than Mr. Kraus) generally include a robust set of factors relating to our firm’s finan-cial performance, its strategic and operational considerations, the specific business or function headed by each named executive officer,and each named executive officer’s management effectiveness, talent development and adherence to our firm’s culture, including risk/control management and regulatory compliance. Because specific factors will vary among business units, among individuals and duringdifferent business cycles, we do not adopt any specific weighting or formula under which these metrics are applied.
We have described below the business and operational goals established in 2012 for our named executive officers (other thanMr. Kraus) and the contribution to our company each made in achieving these goals:
• For Mr. Gingrich, our company’s Chief Operating Officer, the main elements of his business and operational goals for 2012included: increasing operating efficiency; optimizing retail, institutional, and private client strategy and sales efforts; enhancingplanning and organizational processes; optimizing revenue and profitability of Bernstein Research Services; fostering a culture ofmeritocracy, empowerment and accountability among our business leaders; and recruiting and retaining top talent.
• Mr. Gingrich was successful in meeting these goals in 2012. Operating costs were reduced significantly compared to theprevious year; important steps were taken to right-size our real estate footprint; operating margins were higher despitelower revenues; gross and net flows were substantially improved; processes were implemented to better manage costs andheadcount; new personnel were recruited to the firm, including our CFO; and Bernstein Research Services once againgained market share while improving margins. Mr. Gingrich’s compensation reflected Mr. Kraus’s and the CompensationCommittee’s judgment in assessing the importance of these contributions to our company.
• For Mr. van Brugge, the Chairman and CEO of SCB LLC, the main elements of his business and operational goals for 2012included: optimizing the revenue and profit contribution of Bernstein Research Services; further enhancing this unit’s researchcapabilities, trading services and product array; extending this unit’s geographic platform; and attracting, motivating and retain-ing top talent.
Annual Report 2012 149

• Mr. van Brugge was successful in meeting these goals in 2012. The most significant contributions made by Mr. van Bruggetoward achieving these goals included leading Bernstein Research Services to: strong market share and increasedprofitability; excellent results in third-party research surveys; and significant progress in growing its business in Asia.Mr. van Brugge’s compensation reflected Mr. Kraus’s and the Compensation Committee’s judgment in assessing theimportance of these contributions to our company.
• For Ms. Massad, our company’s Head of Human Capital and Chief Talent Officer, the main elements of her business and opera-tional goals for 2012 included: fostering a workplace that attracts, develops, engages and retains top talent; facilitating compensa-tion planning of our company’s strategic business units; establishing compensation principles and processes that support thecompany’s meritocracy-based culture; maintaining the company’s strong employee relations record; and refining the HumanCapital business model to serve client needs while strengthening operating leverage of the Human Capital department and thecompany generally.
• Ms. Massad was successful in meeting these goals in 2012. The most significant contributions made by Ms. Massad towardachieving these goals included: supporting the successful restructuring and right-sizing of our company’s strategic businessunits; establishing an effective recruiting processes outsourcing (“RPO”) model, which improved our company’s ability toidentify, access and attract top talent while reducing recruiting costs; establishing new corporate competencies to strengthenoverall employee performance; refining the company’s performance management and compensation processes tostrengthen the link between compensation and performance; evaluating the competitiveness of our global benefitsprograms and addressing these programs accordingly; and developing and facilitating management forums that strengthenedour culture and engagement of our people. Ms. Massad’s compensation reflected Mr. Kraus’s and the CompensationCommittee’s judgment in assessing the importance of these contributions to our company.
• For Mr. Weisenseel, our company’s CFO, the main elements of his business and operational goals for 2012 included: assuminghis new responsibilities as CFO in a seamless manner; focusing on improving the company’s adjusted operating margin with aparticular emphasis on reducing the firm’s cost structure, including its global real estate footprint; enhancing both internal andexternal financial reporting to provide more useful information to the Board, management and our Unitholders (including anincreased focus on management operating metrics); reviewing our firm’s global liquidity profile to identify any potentialenhancements; realigning our firm’s Finance and Administrative functions, and hiring new senior leaders in the FinanceDepartment, to improve the level of client service provided to our company and its business leaders; and identifying and devel-oping our Finance Department’s next generation of leaders.
• Mr. Weisenseel was successful in meeting these goals in 2012. The most significant contributions made by Mr. Weisenseeltoward achieving these goals included: improving our adjusted operating margin with a particular emphasis on reducing thefirm’s cost structure pertaining to various promotion and servicing and general and administrative services expense items;executing the global space consolidation plan to further reduce the firm’s office footprint by approximately 500,000 squarefeet, which is expected to ultimately generate occupancy-related annual expense savings in the range of $38 to $43 million;identifying improvements to internal financial reporting to enhance transparency and accountability of senior businessleaders and re-emphasizing in external financial reporting the management operating metrics we use internally to evaluateand compare period-to-period operating performance, including “adjusted net revenues”, “adjusted operating income” and“adjusted operating margin”; completing a review of our firm’s liquidity requirements, which resulted in the expansion ofthe firm’s credit facility by $100 million to match the potential size of its commercial paper program and securingadditional liquidity lines of credit to assist in funding client redemptions; and adding senior leaders to the Finance team andreorganizing the Finance Department to provide better client service to our organization. Mr. Weisenseel’s compensationreflected Mr. Kraus’s and the Compensation Committee’s judgment in assessing the importance of these contributions toour company.
• For Mr. Farrell, our Corporate Controller and former Interim CFO, the main elements of his business and operational goals for2012 included: facilitating the transition of his responsibilities as Interim CFO to Mr. Weisenseel (in May 2012) in a seamlessmanner; ensuring the firm’s internal control structure and financial reporting standards were adhered to; assisting in theintegration and support of new business and services; reviewing the firm’s global liquidity profile to ensure it supports current
150 AllianceBernstein

and future requirements; assisting in the review of the firm’s cost structure, including reducing its global real estate footprint;organizing the firm’s Finance Department to leverage and improve the service levels to the firm and its business leaders; andcontinuing to identify and develop our Finance Department’s next generation of business leaders.
• Mr. Farrell was successful in meeting these goals in 2012. The most significant contributions made by Mr. Farrell towardachieving these goals included: facilitating the transfer of CFO responsibilities to Mr. Weisenseel; providing technicalsupport for business development-related initiatives; evaluating the firm’s global liquidity profile to ensure that the firm’sfunding capabilities would not be compromised; assisting in the evaluation of the firm’s cost structure which, including thereview of the firm’s occupancy requirements, resulted in the consolidation of several office locations globally; andleveraging existing resources to provide the company and its business leaders with an efficient and effective financialsupport model. Mr. Farrell’s compensation reflected Mr. Kraus’s and the Compensation Committee’s judgment in assessingthe importance of these contributions to our company.
Consistent with the management approach taken by AllianceBernstein for its executives generally, the 2012 goals of our namedexecutive officers (other than Mr. Kraus, whose compensation is described above in “Overview of our Chief Executive Officer’sCompensation”) did not include specific revenue or profit targets. By their nature, the business and operational goals for each of theseother named executive officers are difficult to measure quantitatively and thus management uses discretion to determine whetherthose goals and objectives have been met.
During the fourth quarter of 2012, McLagan provided us with comparative compensation benchmarking data, which summarizedcompensation levels for the prior year at selected asset management companies and banks comparable to ours. This data providesranges of compensation levels for executive positions at these companies similar to those held by our named executive officers,including salary, total cash compensation and total compensation. The comparable companies, which are selected by managementwith input from McLagan in order to provide appropriate comparisons for the size and business mix of AllianceBernstein and theroles played by the named executive officers, include Bank of America Merrill Lynch, Barclays Capital Group, BlackRock, CreditSuisse, Deutsche Bank, Franklin Templeton, Goldman Sachs & Co., Goldman Sachs Asset Management, Invesco Plc, JPMorganAsset Management, JPMorgan Chase, Morgan Stanley, Morgan Stanley Investment Management, Nomura Securities, PIMCOAdvisors, T. Rowe Price Associates, UBS and The Vanguard Group.
Our CEO, and the Compensation Committee, retain discretion as to how to utilize the McLagan benchmarking data. The data isnot used in a formulaic or mechanical way to determine named executive officer compensation levels. Total compensation paid toour named executive officers in 2012 fell within or below the ranges of total compensation paid to executives in similar positions bythe companies included in the McLagan data. The Compensation Committee considered the McLagan data in concluding that thecompensation levels paid in 2012 to our named executive officers were appropriate and reasonable.
The Board, when it reviewed and approved the Kraus Employment Agreement in December 2008, also considered the McLagan data,which indicated that Mr. Kraus’s compensation arrangement was fully competitive, reasonable and appropriate given our size, scope andcomplexity, and Mr. Kraus’s experience, credentials and proven track record. Similarly, the Compensation Committee and the ExecutiveCommittee, in connection with the review and subsequent approval of the Extended Employment Agreement in June 2012, consideredthe Johnson data, which indicated that the compensation terms for Mr. Kraus set forth in the agreement were fully competitive and con-sistent with industry standards given our size, scope and complexity, the importance of CEO continuity, Mr. Kraus’s experience andintegral role in the ongoing execution of our firm’s long-term growth strategy, and the overwhelming equity focus of his compensation.
Compensation Elements for Executive Officers
Below we describe the major elements of our executive compensation.
1. Base Salary. Base salaries comprise a relatively small portion of our executives’ total compensation and are maintained at levelsgenerally lower than the salaries of executives at peer firms. Within the narrow range of base salaries paid to our executives, weconsider individual experience, responsibilities and tenure with the firm. The salaries we paid during 2012 to our named executiveofficers are shown in column (c) of the Summary Compensation Table.
Annual Report 2012 151

2. Short-term Incentive Compensation (Cash Bonus). In 2012, we paid annual cash bonuses in late December to reward individualperformance for the year. These bonuses are based on management’s evaluation (subject to the Compensation Committee’s review andapproval) of each executive’s performance during the year, and the performance of the executive’s business unit or function, compared tobusiness and operational goals established at the beginning of the year, and in the context of the firm’s current year financial performance.The cash bonuses we awarded in 2012 to our named executive officers are shown in column (d) of the Summary Compensation Table.
3. Long-term Incentive Compensation. In 2012, we granted annual long-term incentive compensation awards in December to sup-plement cash bonuses and to encourage retention of our executives. These awards are made under an unfunded, non-qualifiedincentive compensation plan under which awards may be granted to eligible employees.
As discussed above in “Overview of 2012 Incentive Compensation Program”, long-term incentive compensation awards generally aredenominated in restricted Holding Units. We employ this structure to directly align our executives’ long-term interests with theinterests of our Unitholders while also indirectly aligning our executives’ long-term interests with the interests of our clients, asstrong performance for our clients generally contributes directly to increases in assets under management and thus improved finan-cial performance for the firm. The 2012 long-term incentive compensation awards granted to our named executive officers areshown in column (e) of the Summary Compensation Table, column (i) of the Grants of Plan-based Awards Table and column (g) ofthe Outstanding Equity Awards at 2012 Fiscal Year End Table.
Long-term incentive compensation was awarded in 2012 as part of total incentive compensation based on a customized set of goalsfor each executive. The relative level of cash bonus compared to long-term incentive compensation is generally fixed using a slidingscale based on the total compensation level of the executive, with lower-paid executives receiving a greater percentage of theirincentive compensation as cash bonuses than more highly-paid executives.
In 2012, the number of restricted Holding Units comprising long-term incentive compensation awards was based on the average ofthe closing prices of a Holding Unit as reported for NYSE composite transactions for the five business day period that commencedon January 14, 2013 and concluded on January 18, 2013 (this calculation resulted in an average price of $19.972); the Compensa-tion Committee approved the awards on December 3, 2012.
Long-term incentive compensation awards generally vest ratably over four years. However, award recipients who terminate theiremployment or are terminated without cause continue to vest in their long-term incentive compensation awards if the awardrecipients comply with certain agreements and restrictive covenants set forth in the applicable award agreement, includingrestrictions on competition, employee and client solicitation, and a claw-back for failing to follow existing risk management policies.
Withdrawals prior to vesting are not permitted. Upon vesting, awards are distributed to participants unless the award recipient has,in advance, voluntarily elected to defer receipt to future periods. Quarterly cash distributions on vested and unvested restrictedHolding Units are paid currently to award recipients and are included in column (i) of the Summary Compensation Table.
4. Defined Contribution Plan. Employees of AllianceBernstein are eligible to participate in the Profit Sharing Plan for Employees ofAllianceBernstein L.P. (as amended and restated as of January 1, 2010, “Profit Sharing Plan”), a tax-qualified retirement plan. TheCompensation Committee determines the amount of company contributions (both the level of annual matching by the firm of anemployee’s pre-tax salary deferral contributions and the annual company profit sharing contribution). For 2012, the CompensationCommittee determined that employee deferral contributions would be matched on a one-to-one basis up to five percent of eligiblecompensation and there would be no profit sharing contribution. Company contributions to the Profit Sharing Plan on behalf ofthe named executive officers are shown in column (i) of the Summary Compensation Table.
5. CEO Arrangements. See “Overview of our Chief Executive Officer’s Compensation” above.
Compensation Committee
In 2012, the Compensation Committee was composed of Mr. Condron (Chair), Mr. Duverne, Mr. Elliott, Mr. Kraus, Ms. Slutskyand Mr. Smith. Mr. de Castries resigned as a member of the Compensation Committee in February 2012. The CompensationCommittee held eight meetings in 2012.
152 AllianceBernstein

As discussed above (see “Corporate Governance—NYSE Governance Matters” in Item 10), because Holding is a limited partnership, it isexempt from NYSE rules that require public companies to have a compensation committee composed solely of independent direc-tors. AXA owns, indirectly, an approximate 65.5% economic interest in AllianceBernstein (as of December 31, 2012), and compen-sation expense is a significant component of our financial results. For these reasons, Mr. Duverne, Deputy Chief Executive Officerof AXA, is a member of the Compensation Committee, and any action taken by the Compensation Committee requires theaffirmative vote or consent of an executive officer of one or more of our parent companies. (Presently, Mr. Duverne is the onlymember of the Compensation Committee who is also an executive officer of one or more of our parent companies.)
The Compensation Committee has general oversight of compensation and compensation-related matters, including:
(i) determining cash bonuses;
(ii) determining contributions and awards under incentive plans or other compensation arrangements (whether qualified ornon-qualified) for employees of AllianceBernstein and its subsidiaries, and amending or terminating such plans or arrange-ments or any welfare benefit plan or arrangement or making recommendations to the Board with respect to adopting anynew incentive compensation plan, including equity-based plans;
(iii) reviewing and approving the compensation of our CEO, evaluating his performance, and determining and approving hiscompensation level based on this evaluation, which in 2012 was done in connection with the process of negotiating andapproving the Extended Employment Agreement (our CEO recuses himself from voting on his own compensation and,accordingly, did not participate in the Compensation Committee’s or the Executive Committee’s discussions regarding theExtended Employment Agreement); and
(iv) reviewing and discussing the CD&A, and recommending to the Board its inclusion in the Partnerships’ Forms 10-K and, whenapplicable, proxy statements.
In 2007, the Compensation Committee delegated responsibility for managing AllianceBernstein’s non-qualified plans to the Omni-bus Committee for Non-Qualified Plans (“Omnibus Committee”), consisting of six members who are senior officers ofAllianceBernstein. The Omnibus Committee held four meetings in 2012.
The Compensation Committee’s year-end process has generally focused on the cash bonuses and long-term incentive compensationawards granted to senior management. Mr. Kraus plays an active role in the work of the Compensation Committee, but he doesnot participate in any committee discussions or votes regarding his own compensation. Mr. Kraus, working with other members ofsenior management, provides recommendations for individual employee awards to the Compensation Committee for its consid-eration. As part of this process, management provides the committee with compensation benchmarking data from compensationconsultants. For 2012, we paid $17,120 to McLagan for executive compensation benchmarking data and an additional $274,680 forsurvey and consulting services relating to the amount and form of compensation paid to employees other than executives.
The Compensation Committee held its regularly-scheduled meeting regarding year-end compensation on December 3, 2012, atwhich it discussed and approved senior management’s compensation recommendations. The Compensation Committee retainedJohnson when considering whether to approve the Extended Employment Agreement, but did not retain its own consultants forgeneral employee compensation purposes.
The Compensation Committee’s functions are more fully described in the committee’s charter, which is available online in the“Management & Governance” section of our Internet Site.
Other Compensation-Related Matters
AllianceBernstein and Holding are, respectively, private and public limited partnerships, and are subject to taxes other than federaland state corporate income tax (see “Business—Taxes” in Item 1 and “Structure-related Risks” in Item 1A). Accordingly, Section 162(m)of the Code, which limits tax deductions relating to executive compensation otherwise available to entities taxed as corporations, isnot applicable to either AllianceBernstein or Holding.
We have amended our qualified and non-qualified plans to the extent necessary to comply with applicable law.
Annual Report 2012 153
For long-term incentive compensation awards made during or before 2008, we typically purchased the investments that were notion-ally elected by plan participants and held these investments in a consolidated rabbi trust. Effective January 1, 2009, investments we pre-viously made in our investment services offered to clients are held in a custodial account, while we continue to hold investments inHolding Units in the consolidated rabbi trust. These investments are subject to the general creditors of AllianceBernstein.
All compensation awards approved during 2012 that involve the issuance of Holding Units were made under the 2010 Plan.
Compensation Committee Interlocks and Insider Participation
Mr. de Castries, who was a member of the Compensation Committee from February 2011 through February 2012, is the ChiefExecutive Officer of AXA, the ultimate parent of the General Partner.
Mr. Duverne is the Deputy Chief Executive Officer of AXA.
Mr. Condron served as the Chairman of the Board, President and Chief Executive Officer of AXA Equitable, the sole stockholderof the General Partner, until his retirement on January 1, 2011.
As of December 31, 2012, AXA Equitable and its affiliates owned an aggregate 65.5% economic interest in AllianceBernstein.
Mr. Kraus is Chairman of the Board and Chief Executive Officer of the General Partner and, accordingly, also serves in that capacity forAllianceBernstein and Holding. Mr. Kraus is also a director of AXA Financial, AXA Equitable, MONY and MLOA. In addition,Mr. Kraus is a member of the Management Board of AXA. Other than Mr. Kraus, no executive officer of AllianceBernstein served as (i) amember of a compensation committee or (ii) a director of another entity, an executive officer of which served as a member ofAllianceBernstein’s Compensation Committee or Board.
Compensation Committee Report
The members of the Compensation Committee reviewed and discussed with management the Compensation Discussion and Analy-sis set forth above and, based on such review and discussion, recommended to the Board its inclusion in this Form 10-K.
Christopher M. Condron (Chair) Denis DuverneSteven G. Elliott Peter S. KrausLorie A. Slutsky A.W. (Pete) Smith, Jr.
154 AllianceBernstein
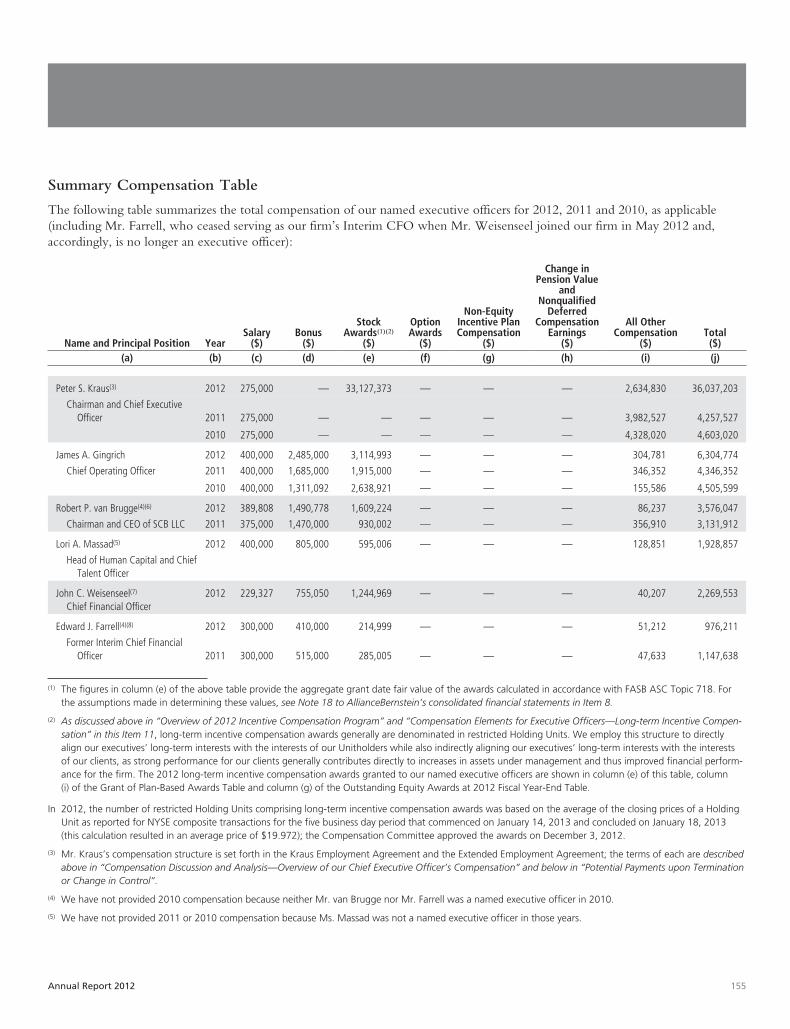
Summary Compensation Table
The following table summarizes the total compensation of our named executive officers for 2012, 2011 and 2010, as applicable(including Mr. Farrell, who ceased serving as our firm’s Interim CFO when Mr. Weisenseel joined our firm in May 2012 and,accordingly, is no longer an executive officer):
Name and Principal Position YearSalary
($)Bonus
($)
StockAwards(1)(2)
($)
OptionAwards
($)
Non-EquityIncentive PlanCompensation
($)
Change inPension Value
andNonqualified
DeferredCompensation
Earnings($)
All OtherCompensation
($)Total($)
(a) (b) (c) (d) (e) (f) (g) (h) (i) (j)
Peter S. Kraus(3) 2012 275,000 — 33,127,373 — — — 2,634,830 36,037,203
Chairman and Chief ExecutiveOfficer 2011 275,000 — — — — — 3,982,527 4,257,527
2010 275,000 — — — — — 4,328,020 4,603,020
James A. Gingrich 2012 400,000 2,485,000 3,114,993 — — — 304,781 6,304,774
Chief Operating Officer 2011 400,000 1,685,000 1,915,000 — — — 346,352 4,346,352
2010 400,000 1,311,092 2,638,921 — — — 155,586 4,505,599
Robert P. van Brugge(4)(6) 2012 389,808 1,490,778 1,609,224 — — — 86,237 3,576,047
Chairman and CEO of SCB LLC 2011 375,000 1,470,000 930,002 — — — 356,910 3,131,912
Lori A. Massad(5) 2012 400,000 805,000 595,006 — — — 128,851 1,928,857
Head of Human Capital and ChiefTalent Officer
John C. Weisenseel(7)
Chief Financial Officer2012 229,327 755,050 1,244,969 — — — 40,207 2,269,553
Edward J. Farrell(4)(8) 2012 300,000 410,000 214,999 — — — 51,212 976,211
Former Interim Chief FinancialOfficer 2011 300,000 515,000 285,005 — — — 47,633 1,147,638
(1) The figures in column (e) of the above table provide the aggregate grant date fair value of the awards calculated in accordance with FASB ASC Topic 718. Forthe assumptions made in determining these values, see Note 18 to AllianceBernstein’s consolidated financial statements in Item 8.
(2) As discussed above in “Overview of 2012 Incentive Compensation Program” and “Compensation Elements for Executive Officers—Long-term Incentive Compen-sation” in this Item 11, long-term incentive compensation awards generally are denominated in restricted Holding Units. We employ this structure to directlyalign our executives’ long-term interests with the interests of our Unitholders while also indirectly aligning our executives’ long-term interests with the interestsof our clients, as strong performance for our clients generally contributes directly to increases in assets under management and thus improved financial perform-ance for the firm. The 2012 long-term incentive compensation awards granted to our named executive officers are shown in column (e) of this table, column(i) of the Grant of Plan-Based Awards Table and column (g) of the Outstanding Equity Awards at 2012 Fiscal Year-End Table.
In 2012, the number of restricted Holding Units comprising long-term incentive compensation awards was based on the average of the closing prices of a HoldingUnit as reported for NYSE composite transactions for the five business day period that commenced on January 14, 2013 and concluded on January 18, 2013(this calculation resulted in an average price of $19.972); the Compensation Committee approved the awards on December 3, 2012.
(3) Mr. Kraus’s compensation structure is set forth in the Kraus Employment Agreement and the Extended Employment Agreement; the terms of each are describedabove in “Compensation Discussion and Analysis—Overview of our Chief Executive Officer’s Compensation” and below in “Potential Payments upon Terminationor Change in Control”.
(4) We have not provided 2010 compensation because neither Mr. van Brugge nor Mr. Farrell was a named executive officer in 2010.
(5) We have not provided 2011 or 2010 compensation because Ms. Massad was not a named executive officer in those years.
Annual Report 2012 155
(6) The 2011 bonus disclosed in column (d) for Mr. van Brugge includes a $1,220,000 cash bonus paid to Mr. van Brugge in December 2011 and the $250,000portion of Mr. van Brugge’s 2011 long-term incentive compensation award under the Incentive Compensation Program he elected to allocate to Deferred Cash.The Deferred Cash accrues interest monthly based on our monthly weighted average cost of funds (approximately 0.4% during 2012) and will be credited toMr. van Brugge annually until the cash is distributed to him in installments over the four-year vesting period. The interest on Mr. van Brugge’s Deferred Cash isshown in column (d) of the Non-Qualified Deferred Compensation Table.
(7) On May 14, 2012, Mr. Weisenseel joined our firm as Chief Financial Officer. We did not pay Mr. Weisenseel any compensation during 2011 or 2010.
Mr. Weisenseel was granted, as of May 14, 2012 (his first date of employment, “JCW Hire Date”), in accordance with the terms and conditions of the IncentiveCompensation Program, an award of restricted Holding Units initially valued at $1,000,000 in connection with his recruitment and as replacement equity forawards he forfeited by leaving McGraw Hill. The number of restricted Holding Units (69,629) was determined by dividing $1,000,000 by the average closingprice on the NYSE of a Holding Unit for the period covering the four trading days immediately preceding the JCW Hire Date, the JCW Hire Date and the fivetrading days immediately following the JCW Hire Date (this calculation resulted in an average price of $14.362) and rounded up to the nearest whole number(due to this rounding, the grant date fair value of the award reflected in column (e) is $1,000,012). This award is shown in column (e) of this table, column (i) ofthe Grant of Plan-Based Awards table and column (g) of the Outstanding Equity Awards at 2012 Fiscal Year-End Table.
The 2012 bonus disclosed in column (d) for Mr. Weisenseel includes a $655,000 cash bonus paid to Mr. Weisenseel in December 2012 and the $100,050 por-tion of Mr. Weisenseel’s 2012 long-term incentive compensation award under the Incentive Compensation Program he elected to allocate to Deferred Cash. TheDeferred Cash accrues interest monthly based on our monthly weighted average cost of funds (approximately 0.4% during 2012) and will be credited toMr. Weisenseel annually until the cash is distributed to him in installments over the four-year vesting period. The interest on Mr. Weisenseel’s Deferred Cash willbe shown in column (d) of the Non-Qualified Deferred Compensation Table.
(8) Mr. Farrell continued as our firm’s Corporate Controller after Mr. Weisenseel joined our firm in May 2012.
Column (i) includes the aggregate incremental cost to our company of certain other expenses and perquisites, including leased car and driver expenses, con-tributions to the Profit Sharing Plan, life insurance premiums, medical and dental coverage, financial planning, and tax services and tax gross-ups, as applicable.
In accordance with the Kraus Employment Agreement and the Restricted Holding Unit Grant, Mr. Kraus is paid the cash distributions payable with respect to hisunvested restricted Holding Units and a dollar amount equal to the cash distributions payable with respect to the number of any Holding Units that are withheld byAllianceBernstein to cover Mr. Kraus’s tax withholding obligations as the Holding Units vest.
For 2012, column (i) includes:
for Mr. Kraus, $1,825,268 for quarterly distributions related to his Restricted Holding Unit Grant ($1,034,380 of which was paid on Holding Units Mr. Krausowned and $790,888 of which was paid on Holding Units that had been withheld to cover taxes), $511,324 for personal use of aircraft, $172,598 for personaluse of a car and driver (including lease costs ($15,586), driver compensation ($138,005) and other car-related costs ($19,007), such as parking, gas, tolls, andrepairs and maintenance), $113,140 for gross-ups related to imputed income for personal use of aircraft and car, and a $12,500 contribution to the Profit Shar-ing Plan.
for Mr. Gingrich, $291,315 for quarterly distributions on Holding Units awarded as long-term incentive compensation, a $12,500 contribution to the Profit Shar-ing Plan and $966 of life insurance premiums.
for Mr. van Brugge, $129,240 for quarterly distributions on Holding Units awarded as long-term incentive compensation, a $12,500 contribution to the Profit SharingPlan, $11,178 for financial planning services, $9,549 for gross-ups related to imputed income for tax payments made on his behalf, $3,520 for tax preparation servicesand $405 of life insurance premiums, minus $80,155 representing an adjustment of tax equalization relating to U.K. taxes paid on his behalf.
for Ms. Massad, $87,094 for quarterly distributions on Holding Units awarded as long-term incentive compensation, $18,301 for financial planning services,$10,326 for gross-ups related to imputed income for the financial planning services, a $12,500 contribution to the Profit Sharing Plan, and $630 of life insurancepremiums.
for Mr. Weisenseel, $39,689 for quarterly distributions on Holding Units awarded as long-term incentive compensation and $518 of life insurance premiums.
for Mr. Farrell, $38,022 for quarterly distributions on Holding Units awarded as long-term incentive compensation, a $12,500 contribution to the Profit SharingPlan and $690 of life insurance premiums.
For additional information regarding the compensation of our named executive officers, including their respective business and operational goals, see “Factors Con-sidered when Determining Executive Compensation” and “Compensation Elements for Executive Officers” above.
During 2012, we owned a fractional interest in an aircraft with an aggregate operating cost of $344,338 (including $86,119 in maintenance fees, $201,132 inusage fees and $57,087 of amortization expense). We sold this fractional interest during 2012. We also leased two aircraft during 2012 with an aggregate operat-ing cost of $7,224,347 (including $2,116,247 in leasing costs, $2,092,718 in maintenance fees and $3,015,382 in usage fees).
Our interests in aircraft facilitate business travel of senior management. In 2012, we permitted our Chief Executive Officer to use the aircraft for personal travel. Hispersonal travel constituted approximately 17.6% of our actual use of the aircraft in 2012.
Our methodology for determining the reported value of personal use of aircraft includes fees paid to the managers of the aircraft (fees take into account the aircrafttype and weight, number of miles flown, flight time, number of passengers, and a variable fee), but excludes our fixed costs (amortization of original cost less esti-mated residual value and monthly maintenance fees). We included such amounts in column (i).
We use the Standard Industry Fare Level (“SIFL”) methodology to calculate the amount to include in the taxable income of executives for the personal use ofcompany-owned aircraft. Using the SIFL methodology, which was approved by our Compensation Committee, limits our ability to deduct the full cost of personaluse of company-owned aircraft by our executive officers. Taxable income for the 12 months ended October 31, 2012 for personal use imputed to Mr. Kraus is$84,897.
156 AllianceBernstein

Grants of Plan-based Awards in 2012
The following table describes each grant of an award made to a named executive officer during 2012 under the 2010 Plan, anequity compensation plan:
Estimated Future Payouts UnderNon-Equity Incentive Plan
AwardsEstimated Future Payouts Under
Equity Incentive Plan Awards
NameGrantDate
Threshold($)
Target($)
Maximum($)
Threshold(#)
Target(#)
Maximum(#)
All OtherStock
Awards:Number ofShares ofStock or
Units(#)
All OtherOption
Awards:Number ofSecuritiesUnderlying
Options(#)
Exerciseor BasePrice ofOptionAwards($/Sh)
GrantDate FairValue of
Stock andOptionAwards
($)(a) (b) (c) (d) (e) (f) (g) (h) (i) (j) (k) (l)
Peter S. Kraus(1) 6/21/2012 — — — — — — 2,722,052 — — 33,127,373
James A.Gingrich(2)(3) 12/3/2012 — — — — — — 155,968 — — 3,114,993
Robert P. vanBrugge(2)(3) 12/3/2012 — — — — — — 80,574 — — 1,609,224
Lori A. Massad(2)(3) 12/3/2012 — — — — — — 29,792 — — 595,006
John C.Weisenseel(2)(3)(4) 12/3/2012 — — — — — — 12,265 — — 244,957
5/14/2012 — — — — — — 69,629 — — 1,000,012
Edward J.Farrell(2)(3) 12/3/2012 — — — — — — 10,765 — — 214,999
(1) The amount shown in column (i) reflects the 2,722,052 Holding Units Mr. Kraus was granted pursuant to the Extended Employment Agreement, as discussedabove in “Overview of our Chief Executive Officer’s Compensation” in this Item 11.
(2) Amounts shown in column (i) reflect 2012 restricted Holding Unit awards granted under the Incentive Compensation Program and the 2010 Plan, an equitycompensation plan, and can also be found in column (e) of the Summary Compensation Table.
(3) As discussed above in “Overview of 2012 Incentive Compensation Program” and “Compensation Elements for Executive Officers—Long-term Incentive Compen-sation” in this Item 11, long-term incentive compensation awards generally are denominated in restricted Holding Units. We employ this structure to directlyalign our executives’ long-term interests with the interests of our Unitholders while also indirectly aligning our executives’ long-term interests with the interestsof our clients, as strong performance for our clients generally contributes directly to increases in assets under management and thus improved financial perform-ance for the firm. The 2012 long-term incentive compensation awards granted to our named executive officers are shown in column (i) of this table, column(e) of the Summary Compensation Table and column (g) of the Outstanding Equity Awards at 2012 Fiscal Year-End Table.
In 2012, the number of restricted Holding Units comprising long-term incentive compensation awards was based on the average of the closing prices of a Hold-ing Unit as reported for NYSE composite transactions for the five business day period that commenced on January 14, 2013 and concluded on January 18,2013 (this calculation resulted in an average price of $19.972); the Compensation Committee approved the awards on December 3, 2012.
(4) Mr. Weisenseel was granted, as of the JCW Hire Date, in accordance with the terms and conditions of the Incentive Compensation Program, an award ofrestricted Holding Units initially valued at $1,000,000 in connection with his recruitment and as replacement equity for awards he forfeited by leaving McGrawHill. The number of restricted Holding Units (69,629) was determined by dividing $1,000,000 by the average closing price on the NYSE of a Holding Unit for theperiod covering the four trading days immediately preceding the JCW Hire Date, the JCW Hire Date and the five trading days immediately following the JCWHire Date (this calculation resulted in an average price of $14.362) and rounded up to the nearest whole number (due to this rounding, the grant date fair valueof the award reflected in column (l) is $1,000,012). This award is shown in column (i) of this table, column (e) of the Summary Compensation Table and column(g) of the Outstanding Equity Awards at 2012 Fiscal Year-End Table.
Annual Report 2012 157
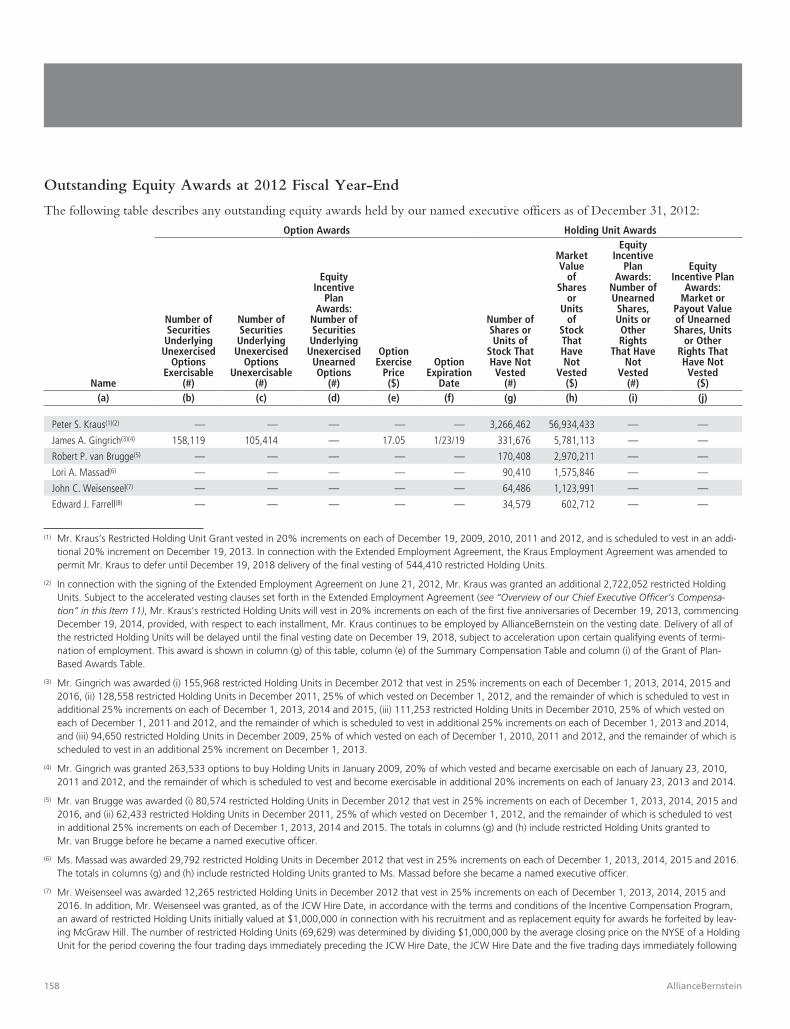
Outstanding Equity Awards at 2012 Fiscal Year-End
The following table describes any outstanding equity awards held by our named executive officers as of December 31, 2012:
Option Awards Holding Unit Awards
Name
Number ofSecuritiesUnderlyingUnexercised
OptionsExercisable
(#)
Number ofSecuritiesUnderlyingUnexercised
OptionsUnexercisable
(#)
EquityIncentive
PlanAwards:
Number ofSecuritiesUnderlyingUnexercisedUnearnedOptions
(#)
OptionExercise
Price($)
OptionExpiration
Date
Number ofShares orUnits of
Stock ThatHave NotVested
(#)
MarketValue
ofShares
orUnits
ofStockThatHaveNot
Vested($)
EquityIncentive
PlanAwards:
Number ofUnearnedShares,Units orOtherRights
That HaveNot
Vested(#)
EquityIncentive Plan
Awards:Market or
Payout Valueof UnearnedShares, Units
or OtherRights ThatHave NotVested
($)(a) (b) (c) (d) (e) (f) (g) (h) (i) (j)
Peter S. Kraus(1)(2) — — — — — 3,266,462 56,934,433 — —
James A. Gingrich(3)(4) 158,119 105,414 — 17.05 1/23/19 331,676 5,781,113 — —
Robert P. van Brugge(5) — — — — — 170,408 2,970,211 — —
Lori A. Massad(6) — — — — — 90,410 1,575,846 — —
John C. Weisenseel(7) — — — — — 64,486 1,123,991 — —
Edward J. Farrell(8) — — — — — 34,579 602,712 — —
(1) Mr. Kraus’s Restricted Holding Unit Grant vested in 20% increments on each of December 19, 2009, 2010, 2011 and 2012, and is scheduled to vest in an addi-tional 20% increment on December 19, 2013. In connection with the Extended Employment Agreement, the Kraus Employment Agreement was amended topermit Mr. Kraus to defer until December 19, 2018 delivery of the final vesting of 544,410 restricted Holding Units.
(2) In connection with the signing of the Extended Employment Agreement on June 21, 2012, Mr. Kraus was granted an additional 2,722,052 restricted HoldingUnits. Subject to the accelerated vesting clauses set forth in the Extended Employment Agreement (see “Overview of our Chief Executive Officer’s Compensa-tion” in this Item 11), Mr. Kraus’s restricted Holding Units will vest in 20% increments on each of the first five anniversaries of December 19, 2013, commencingDecember 19, 2014, provided, with respect to each installment, Mr. Kraus continues to be employed by AllianceBernstein on the vesting date. Delivery of all ofthe restricted Holding Units will be delayed until the final vesting date on December 19, 2018, subject to acceleration upon certain qualifying events of termi-nation of employment. This award is shown in column (g) of this table, column (e) of the Summary Compensation Table and column (i) of the Grant of Plan-Based Awards Table.
(3) Mr. Gingrich was awarded (i) 155,968 restricted Holding Units in December 2012 that vest in 25% increments on each of December 1, 2013, 2014, 2015 and2016, (ii) 128,558 restricted Holding Units in December 2011, 25% of which vested on December 1, 2012, and the remainder of which is scheduled to vest inadditional 25% increments on each of December 1, 2013, 2014 and 2015, (iii) 111,253 restricted Holding Units in December 2010, 25% of which vested oneach of December 1, 2011 and 2012, and the remainder of which is scheduled to vest in additional 25% increments on each of December 1, 2013 and 2014,and (iii) 94,650 restricted Holding Units in December 2009, 25% of which vested on each of December 1, 2010, 2011 and 2012, and the remainder of which isscheduled to vest in an additional 25% increment on December 1, 2013.
(4) Mr. Gingrich was granted 263,533 options to buy Holding Units in January 2009, 20% of which vested and became exercisable on each of January 23, 2010,2011 and 2012, and the remainder of which is scheduled to vest and become exercisable in additional 20% increments on each of January 23, 2013 and 2014.
(5) Mr. van Brugge was awarded (i) 80,574 restricted Holding Units in December 2012 that vest in 25% increments on each of December 1, 2013, 2014, 2015 and2016, and (ii) 62,433 restricted Holding Units in December 2011, 25% of which vested on December 1, 2012, and the remainder of which is scheduled to vestin additional 25% increments on each of December 1, 2013, 2014 and 2015. The totals in columns (g) and (h) include restricted Holding Units granted toMr. van Brugge before he became a named executive officer.
(6) Ms. Massad was awarded 29,792 restricted Holding Units in December 2012 that vest in 25% increments on each of December 1, 2013, 2014, 2015 and 2016.The totals in columns (g) and (h) include restricted Holding Units granted to Ms. Massad before she became a named executive officer.
(7) Mr. Weisenseel was awarded 12,265 restricted Holding Units in December 2012 that vest in 25% increments on each of December 1, 2013, 2014, 2015 and2016. In addition, Mr. Weisenseel was granted, as of the JCW Hire Date, in accordance with the terms and conditions of the Incentive Compensation Program,an award of restricted Holding Units initially valued at $1,000,000 in connection with his recruitment and as replacement equity for awards he forfeited by leav-ing McGraw Hill. The number of restricted Holding Units (69,629) was determined by dividing $1,000,000 by the average closing price on the NYSE of a HoldingUnit for the period covering the four trading days immediately preceding the JCW Hire Date, the JCW Hire Date and the five trading days immediately following
158 AllianceBernstein

the JCW Hire Date (this calculation resulted in an average price of $14.362) and rounded up to the nearest whole number. 25% of this award vested onDecember 1, 2012 and the remainder of this award is scheduled to vest in additional 25% increments on each of December 1, 2013, 2014 and 2015. Thisaward is shown in column (g) of this table, column (e) of the Summary Compensation Table and column (i) of the Grant of Plan-Based Awards Table.
(8) Mr. Farrell was awarded (i) 10,765 restricted Holding Units in December 2012 that vest in 25% increments on each of December 1, 2013, 2014, 2015 and 2016,and (ii) 19,133 restricted Holding Units in December 2011, 25% of which vested on December 1, 2012, and the remainder of which is scheduled to vest in addi-tional 25% increments on each of December 1, 2013, 2014 and 2015. The totals in columns (g) and (h) include restricted Holding Units granted to Mr. Farrellbefore he became a named executive officer.
Option Exercises and Holding Units Vested in 2012
The following table describes any Holding Units held by our named executive officers that vested during 2012:Option Awards Holding Unit Awards
Name
Number of UnitsAcquired on Exercise
(#)
Value Realizedon Exercise
($)
Number of Holding UnitsAcquired on Vesting
(#)
Value Realizedon Vesting
($)(a) (b) (c) (d) (e)
Peter S. Kraus — — 544,410 9,178,753
James A. Gingrich — — 83,615 1,469,952
Robert P. van Brugge — — 46,209 812,354
Lori A. Massad — — 31,060 546,035
John C. Weisenseel — — 17,407 306,015
Edward J. Farrell — — 12,073 212,243
Pension Benefits for 2012
None of our named executive officers are entitled to benefits under the Amended and Restated Retirement Plan for Employees ofAllianceBernstein L.P. (“Retirement Plan”), our company pension plan. For additional information regarding the Retirement Plan,including interest rates and actuarial assumptions, see Note 16 to AllianceBernstein’s consolidated financial statements in Item 8.
Non-Qualified Deferred Compensation for 2012
The following table describes our named executive officers’ vested and unvested non-qualified deferred compensation contributions,earnings and distributions during 2012 and their non-qualified deferred compensation plan balances as of December 31, 2012:
Name
ExecutiveContributions
in Last FY($)
RegistrantContributions
in Last FY($)
AggregateEarningsin Last FY
($)
AggregateWithdrawals/Distributions
($)
AggregateBalance atLast FYE
($)(a) (b) (c) (d) (e) (f)
Peter S. Kraus — — — — —
James A. Gingrich(1) — — 389,661 (460,482) 2,637,647
Robert P. van Brugge(1)(2)(3) — — 53,723 (705,685) 187,500
Lori A. Massad(1) — — 5,214 (41,933) —
John C. Weisenseel(4) — 100,050 — — 100,050
Edward J. Farrell(1) — — 51,184 (322,322) 360,831
(1) For Ms. Massad and Messrs. Gingrich, van Brugge and Farrell, amounts shown reflect their respective interests from pre-2009 awards under the Incentive Com-pensation Program. For additional information about the Incentive Compensation Program, see Note 17 to AllianceBernstein’s consolidated financial statementsin Item 8. For individuals (including Ms. Massad and Messrs. Gingrich, van Brugge and Farrell) with notional investments in Holding Units, amounts of quarterly
Annual Report 2012 159

distributions on such Holding Units are reflected as earnings in column (d) and, to the extent distributed to the named executive officer, as distributions in col-umn (e). Column (f) includes the value of all notional investments as of the close of business on December 31, 2012. As of that date, Messrs. Gingrich and Farrellnotionally held 12,735 Holding Units and 6,347 Holding Units, respectively, and Ms. Massad and Mr. van Brugge did not hold any Holding Units, as a result ofpre-2009 awards under the Incentive Compensation Program.
(2) The amount shown in column (d) for Mr. van Brugge reflects the interest payment to which he was entitled as a result of allocating a portion of his 2011 long-term incentive compensation award to Deferred Cash. Interest accrues monthly based on our monthly weighted average cost of funds (approximately 0.4% inDecember 2012) and will be credited to Mr. van Brugge annually until the cash is distributed to him in installments over the four-year vesting period.
(3) The amount shown in column (e) for Mr. van Brugge includes his Deferred Cash distribution during 2012.
(4) The amount shown in column (c) for Mr. Weisenseel reflects the portion of his 2012 long-term incentive compensation award that he elected to receivein Deferred Cash. This amount will accrue interest monthly based on our monthly weighed average cost of funds (approximately 0.4% during 2012)and will be credited to Mr. Weisenseel annually until the cash is distributed to him in installments over the four-year vesting period. In future years, thisinterest will be reflected in column (d) and these distributions will be reflected in column (e).
Potential Payments upon Termination or Change in Control
In connection with the commencement of Mr. Kraus’s employment, on December 19, 2008, he received the Restricted HoldingUnit Grant. During Mr. Kraus’s Employment Term, AllianceBernstein has no commitment to pay any cash bonuses to Mr. Krausbeyond the $6 million in 2009 (with any additional bonuses being entirely at the discretion of the Compensation Committee) or tomake any additional equity-based awards to him. Consequently, for 2010 and subsequent years during the Employment Term, thetotality of Mr. Kraus’s compensation (other than his salary and absent any additional awards the Compensation Committee maychoose to grant) has been, and continues to be, dependent on the level of cash distributions on the restricted Holding Units grantedto him and the evolution of the trading price of Holding Units, both of which are partially dependent on the financial andoperating results of our firm. Therefore, his long-term interests are directly aligned with the interests of other holders of HoldingUnits and also indirectly aligned with the interests of our clients as strong performance for our clients generally contributes toincreases in assets under management and thus improved financial performance for the firm. For additional information aboutMr. Kraus’s compensation, see “Overview of our Chief Executive Officer’s Compensation” above.
The Kraus Employment Agreement contains a number of accelerated vesting clauses, including immediate vesting upon a “changein control” of our firm (i.e., AXA, our parent company, ceasing to control the management of AllianceBernstein’s business orHolding ceasing to be publicly traded); immediate vesting of the next two installments of restricted Holding Units (or, if only oneinstallment remains as of the termination date, such installment) upon certain qualifying events of termination of employment,including termination of Mr. Kraus’s employment by AllianceBernstein “without cause” or by Mr. Kraus for “good reason”; andimmediate vesting of a pro-rata portion of any restricted Holding Units otherwise due to vest on the next vesting date uponMr. Kraus’s death or disability.
The change-in-control provisions in the Kraus Employment Agreement were required by Mr. Kraus as part of his negotiation inorder to assure him that AllianceBernstein would continue to be operated as a separately-managed entity, and with a certain degreeof independence, and that Holding would continue as a publicly-traded entity. Both AXA and Mr. Kraus believe that this arrange-ment adds significant value to AllianceBernstein. The Board understood that AXA had no intention of changing this arrangementduring the Employment Term and thus concluded that the change-in-control provisions were acceptable and necessary in order torecruit Mr. Kraus.
The provisions requiring accelerated vesting upon termination by AllianceBernstein without cause or by Mr. Kraus for good reasonwere required by Mr. Kraus in order to preserve the value of his long-term incentive compensation arrangement. The Board agreedto these provisions because they were typical of executive compensation agreements for executives at Mr. Kraus’s level and becausethe Board concluded that they were necessary to recruit Mr. Kraus.
The Board concluded that the change-in-control and termination provisions in the Kraus Employment Agreement fit into AllianceBernstein’soverall compensation objectives because they permitted AllianceBernstein to attract and retain a highly-qualified chief executive officer, wereconsistent with AXA’s and the Board’s expectations with respect to the manner in which AllianceBernstein and Holding would be operatedfrom 2009 to 2013, were consistent with the Board’s expectations that Mr. Kraus would not be terminated without cause and that no steps
160 AllianceBernstein

would be taken that would provide him with the ability to terminate the agreement with good reason (and thus that there was no incon-sistency between these provisions and AllianceBernstein’s goal of providing Mr. Kraus with effective incentives for future performance), andto align his long-term interests with those of AllianceBernstein’s Unitholders and clients.
As discussed above in “Overview of our Chief Executive Officer’s Compensation”, on June 21, 2012, Mr. Kraus, the General Partner,AllianceBernstein and Holding entered into the Extended Employment Agreement. The terms set forth in the Extended EmploymentAgreement regarding potential payments to Mr. Kraus upon a change in control of AllianceBernstein or a qualifying event of termi-nation of employment are substantially the same as the comparable terms in the Kraus Employment Agreement, except for the termsgoverning a termination of employment by AllianceBernstein without “cause” or by Mr. Kraus for “good reason”. If the ExtendedEmployment Agreement had been terminated for either of these reasons before December 19, 2012, Mr. Kraus would have forfeitedthe entire restricted Holding Unit award granted under the Extended Employment Agreement. If the Extended Employment Agree-ment is terminated for either of these reasons after December 19, 2012 but before December 19, 2013, Mr. Kraus will immediatelyvest in the installment of restricted Holding Units scheduled to vest on December 19, 2014. If the Extended Employment Agreementis terminated for either of these reasons after December 19, 2013, Mr. Kraus will immediately vest in the next two installments ofrestricted Holding Units or, if fewer remain as of the termination date, the balance of the installments that are unvested.
In 2011, we amended all outstanding long-term incentive compensation awards (including option awards) of active employees (i.e.,those employees who were employed by the company as of December 31, 2011) permitting those employees who terminate theiremployment or are terminated without cause to continue to vest in their long-term incentive compensation awards if they complywith certain agreements and restrictive covenants set forth in the applicable award agreement. These agreements and covenants includerestrictions on competition and employee and client solicitation, and a claw-back for failing to follow existing risk management poli-cies. Our 2012 long-term incentive compensation awards incorporated these changes and we expect the changes to apply to long-termincentive compensation awards in future years as well. The amounts shown for the named executive officers (other than Mr. Kraus) forresignation or termination by AllianceBernstein without cause in columns (b), (c) and (d) of the table below reflect the value of thesechanges to their outstanding awards, assuming such resignation or termination on December 31, 2012 and the executives’ continuedcompliance with these agreements and restrictive covenants through the vesting dates of the awards. For additional information, see“Overview of Compensation Philosophy and Program” in this Item 11 and Note 2 to AllianceBernstein’s consolidated financial statements in Item 8.In addition, there are amounts payable to the named executive officers upon death and disability.
The following table sets forth estimated payments and benefits to which our named executive officers would have been entitledupon a change in control of AllianceBernstein or the qualifying events of termination of employment as of December 31, 2012:
Name
CashPayments(1)(2)
($)
Accelerationor Grant ofRestrictedHolding
UnitAwards(2)
($)
Accelerationof OptionAwards(2)
($)
OtherBenefits
($)(a) (b) (c) (d) (e)
Peter S. Kraus(3)
Change in control - Kraus Employment AgreementChange in control - Extended Employment AgreementTermination by AllianceBernstein without cause - Kraus Employment AgreementTermination by AllianceBernstein without cause - Extended Employment AgreementTermination by Mr. Kraus for good reason - Kraus Employment AgreementTermination by Mr. Kraus for good reason - Extended Employment AgreementDeath or disability(4)(5) - Kraus Employment AgreementDeath or disability(4)(5) - Extended Employment Agreement
————————
9,489,06647,445,366
9,489,0669,489,0669,489,0669,489,0669,489,0669,489,066
—
—
———
16,46016,46016,46016,46016,46016,46016,46016,460
James A. GingrichResignation or termination by AllianceBernstein without cause(complies with applicable agreements and restrictive covenants)(2)
Death or disability(6)
——
5,781,1135,781,113
40,05740,057
——
Annual Report 2012 161

Name
CashPayments(1)(2)
($)
Accelerationor Grant ofRestrictedHolding
UnitAwards(2)
($)
Accelerationof OptionAwards(2)
($)
OtherBenefits
($)(a) (b) (c) (d) (e)
Robert P. van BruggeResignation or termination by AllianceBernstein without cause(complies with applicable agreements and restrictive covenants)(2)
Death or disability(6)
187,500187,500
2,970,2112,970,211
——
——
Lori A. MassadResignation or termination by AllianceBernstein without cause(complies with applicable agreements and restrictive covenants)(2)
Death or disability(6)
——
1,575,8461,575,846
——
——
John C. WeisenseelResignation or termination by AllianceBernstein without cause(complies with applicable agreements and restrictive covenants)(2)
Death or disability(6)
100,050100,050
1,123,9911,123,991
——
——
Edward J. FarrellResignation or termination by AllianceBernstein without cause(complies with applicable agreements and restrictive covenants)(2)
Death or disability(6)
——
602,712602,712
——
——
(1) For Messrs. van Brugge and Weisenseel, amounts shown represent the portions of their awards pursuant to the Incentive Compensation Program they elected toallocate to Deferred Cash. Mr. van Brugge allocated a portion of his 2011 award to Deferred Cash and Mr. Weisenseel allocated a portion of his 2012 award toDeferred Cash. In addition, it is possible that each named executive officer (other than Mr. Kraus) could receive a cash severance payment on the termination ofhis or her employment. As the amounts of any such cash severance payments would be determined at the time of such termination, we are unable to estimatesuch amounts.
(2) In 2011, we amended all outstanding long-term incentive compensation awards (including option awards) of active employees (i.e., those employees who wereemployed by the company as of December 31, 2011) permitting those employees, who terminate their employment or are terminated without cause, to con-tinue to vest in their long-term incentive compensation awards (including option awards) if they comply with certain agreements and restrictive covenants setforth in the applicable award agreement. These agreements and covenants include restrictions on competition and employee and client solicitation, and a claw-back for failing to follow existing risk management policies. Our 2012 long-term incentive compensation awards incorporated these changes and we expectthese changes also to apply to future long-term incentive compensation awards.
If a named executive officer fails to comply with the applicable agreements and restrictive covenants set forth in his or her award agreements, the named execu-tive officer would not be entitled to continue to vest in his or her restricted Holding Unit or option awards.
(3) If a change in control of AllianceBernstein or a qualifying event of termination of employment had occurred as of December 31, 2012, Mr. Kraus would havebeen entitled to receive (i) accelerated vesting under each of the Kraus Employment Agreement and the Extended Employment Agreement of all or a portion ofhis restricted Holding Unit awards, as shown in column (c), and (ii) only one payment of $16,460 for continuing health and welfare benefits under “OtherBenefits”, as shown in column (e). For additional information, please see “Overview of our Chief Executive Officer’s Compensation” in this Item 11.
(4) Each of the Kraus Employment Agreement and the Extended Employment Agreement defines “Disability” as a good faith determination by AllianceBernsteinthat Mr. Kraus is physically or mentally incapacitated and has been unable for a period of 120 days in the aggregate during any twelve-month period to performsubstantially all of the duties for which he is responsible immediately before the commencement of the incapacity.
(5) Under both the Kraus Employment Agreement and the Extended Employment Agreement, upon termination of Mr. Kraus’s employment due to death or dis-ability, AllianceBernstein will provide at its expense continued health and welfare benefits for Mr. Kraus, his spouse and his dependants through the end of thecalendar year in which termination occurs. Thereafter, until the date Mr. Kraus (or, in the case of his spouse, his spouse) reaches age 65, AllianceBernstein willprovide Mr. Kraus and his spouse with access to participation in AllianceBernstein’s medical plans at Mr. Kraus’s (or his spouse’s) sole expense based on areasonably determined fair market value premium rate.
(6) “Disability” is defined in the Incentive Compensation Program award agreements of Mr. Gingrich, Mr. van Brugge, Ms. Massad, Mr. Weisenseel and Mr. Farrell,and in the Special Option Program award agreements of Mr. Gingrich, as the inability to engage in any substantial gainful activity by reason of any medicallydeterminable physical or mental impairment that can be expected to last for a continuous period of not less than 12 months, as determined by the carrier of thelong-term disability insurance program maintained by AllianceBernstein or its affiliate that covers the executive officer.
162 AllianceBernstein
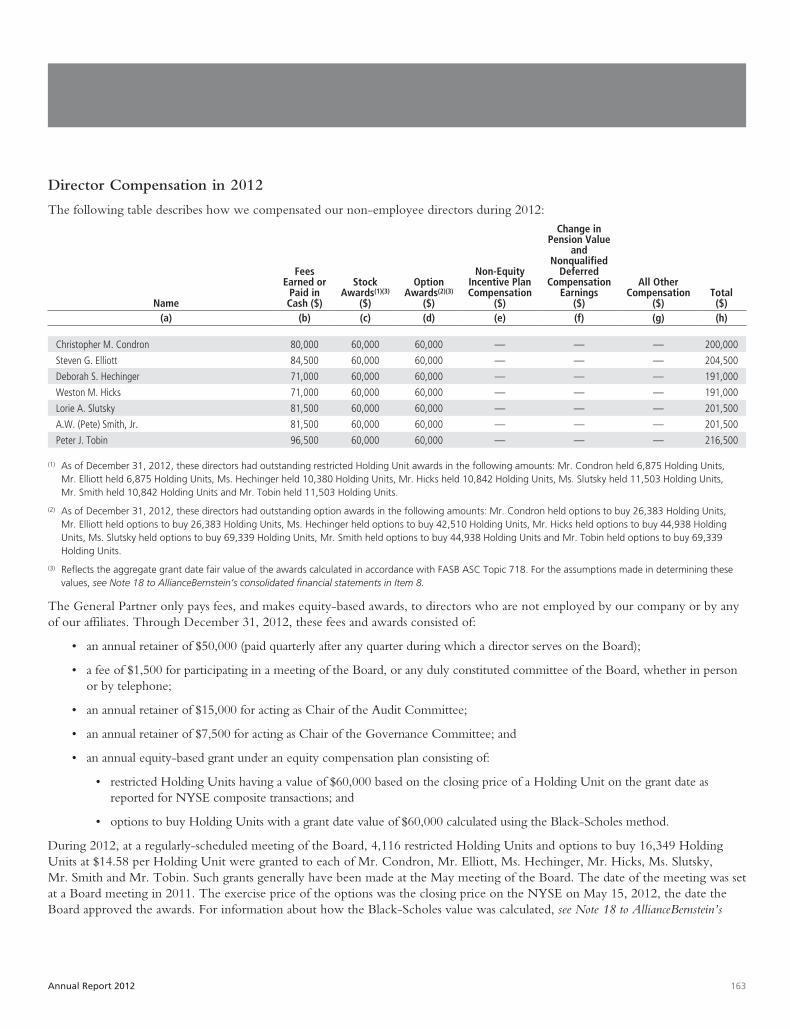
Director Compensation in 2012
The following table describes how we compensated our non-employee directors during 2012:
Name
FeesEarned or
Paid inCash ($)
StockAwards(1)(3)
($)
OptionAwards(2)(3)
($)
Non-EquityIncentive PlanCompensation
($)
Change inPension Value
andNonqualified
DeferredCompensation
Earnings($)
All OtherCompensation
($)Total($)
(a) (b) (c) (d) (e) (f) (g) (h)
Christopher M. Condron 80,000 60,000 60,000 — — — 200,000
Steven G. Elliott 84,500 60,000 60,000 — — — 204,500
Deborah S. Hechinger 71,000 60,000 60,000 — — — 191,000
Weston M. Hicks 71,000 60,000 60,000 — — — 191,000
Lorie A. Slutsky 81,500 60,000 60,000 — — — 201,500
A.W. (Pete) Smith, Jr. 81,500 60,000 60,000 — — — 201,500
Peter J. Tobin 96,500 60,000 60,000 — — — 216,500
(1) As of December 31, 2012, these directors had outstanding restricted Holding Unit awards in the following amounts: Mr. Condron held 6,875 Holding Units,Mr. Elliott held 6,875 Holding Units, Ms. Hechinger held 10,380 Holding Units, Mr. Hicks held 10,842 Holding Units, Ms. Slutsky held 11,503 Holding Units,Mr. Smith held 10,842 Holding Units and Mr. Tobin held 11,503 Holding Units.
(2) As of December 31, 2012, these directors had outstanding option awards in the following amounts: Mr. Condron held options to buy 26,383 Holding Units,Mr. Elliott held options to buy 26,383 Holding Units, Ms. Hechinger held options to buy 42,510 Holding Units, Mr. Hicks held options to buy 44,938 HoldingUnits, Ms. Slutsky held options to buy 69,339 Holding Units, Mr. Smith held options to buy 44,938 Holding Units and Mr. Tobin held options to buy 69,339Holding Units.
(3) Reflects the aggregate grant date fair value of the awards calculated in accordance with FASB ASC Topic 718. For the assumptions made in determining thesevalues, see Note 18 to AllianceBernstein’s consolidated financial statements in Item 8.
The General Partner only pays fees, and makes equity-based awards, to directors who are not employed by our company or by anyof our affiliates. Through December 31, 2012, these fees and awards consisted of:
• an annual retainer of $50,000 (paid quarterly after any quarter during which a director serves on the Board);
• a fee of $1,500 for participating in a meeting of the Board, or any duly constituted committee of the Board, whether in personor by telephone;
• an annual retainer of $15,000 for acting as Chair of the Audit Committee;
• an annual retainer of $7,500 for acting as Chair of the Governance Committee; and
• an annual equity-based grant under an equity compensation plan consisting of:
• restricted Holding Units having a value of $60,000 based on the closing price of a Holding Unit on the grant date asreported for NYSE composite transactions; and
• options to buy Holding Units with a grant date value of $60,000 calculated using the Black-Scholes method.
During 2012, at a regularly-scheduled meeting of the Board, 4,116 restricted Holding Units and options to buy 16,349 HoldingUnits at $14.58 per Holding Unit were granted to each of Mr. Condron, Mr. Elliott, Ms. Hechinger, Mr. Hicks, Ms. Slutsky,Mr. Smith and Mr. Tobin. Such grants generally have been made at the May meeting of the Board. The date of the meeting was setat a Board meeting in 2011. The exercise price of the options was the closing price on the NYSE on May 15, 2012, the date theBoard approved the awards. For information about how the Black-Scholes value was calculated, see Note 18 to AllianceBernstein’s
Annual Report 2012 163

consolidated financial statements in Item 8. Options granted to these directors become exercisable ratably over three years. RestrictedHolding Units granted to these directors “cliff” vest after three years (i.e., 100% of the award is distributed on the third anniversaryof the grant date). In order to avoid any perception that our directors’ exercise of their fiduciary duties might be impaired, theseoptions and restricted Holding Units are not forfeitable. Accordingly, vesting and exercisability of options continues following adirector’s resignation from the Board. Restricted Holding Units vest and are distributed as soon as administratively feasible followinga director’s resignation from the Board.
At a regular-scheduled meeting of the Board held on August 1, 2012, and effective with equity-based awards to be granted in May2013, the Board adjusted the equity-based awards it makes to directors who are not employed by our company or any of our affili-ates by permitting each of these directors to elect to receive his or her annual equity-based award in the form of (i) restricted Hold-ing Units having a value of $120,000 based on the closing price of a Holding Unit on the grant date as reported for NYSEcomposite transactions, (ii) options to buy Holding Units with a grant date value of $120,000 calculated using the Black-Scholesmethod, or (iii) a combination consisting of restricted Holding Units having a value of $60,000 and options to buy Holding Unitswith a grant date value of $60,000. The Board also determined that this election should be made in January of each year. The elec-tion form each director must complete is attached to this Form 10-K as Exhibit 10.05.
The General Partner may reimburse any director for reasonable expenses incurred in participating in Board meetings. Holding andAllianceBernstein, in turn, reimburse the General Partner for expenses incurred by the General Partner on their behalf, includingamounts in respect of directors’ fees and expenses. These reimbursements are subject to any relevant provisions of the HoldingPartnership Agreement and the AllianceBernstein Partnership Agreement.
164 AllianceBernstein

Item 12. Security Ownership of Certain Beneficial Owners and Management and RelatedStockholder Matters
Securities Authorized for Issuance under Equity Compensation Plans
The following table summarizes the Holding Units to be issued pursuant to our equity compensation plans as of December 31,2012:
Equity Compensation Plan Information
Plan Category
Number ofsecurities to be
issued uponexercise ofoutstanding
options, warrantsand rights
Weighted averageexercise price of
outstandingoptions, warrants
and rights
Number ofsecuritiesremaining
available for futureissuance(1)
(a) (b) (c)
Equity compensation plans approved by security holders 8,553,345 $ 39.77 35,226,082
Equity compensation plans not approved by security holders — — —
Total 8,553,345 $39.77 35,226,082
(1) All Holding Units remaining available for future issuance will be issued pursuant to the 2010 Plan.
There are no AllianceBernstein Units to be issued pursuant to an equity compensation plan.
For information about our equity compensation plans (2010 Plan, 1997 Plan, 1993 Unit Option Plan, Century Club Plan), see Note18 to AllianceBernstein’s consolidated financial statements in Item 8.
Principal Security Holders
As of December 31, 2012, we had no information that any person beneficially owned more than 5% of the outstanding HoldingUnits.
As of December 31, 2012, we had no information that any person beneficially owned more than 5% of the outstandingAllianceBernstein Units except AXA and certain of its wholly-owned subsidiaries as reported on Schedules 13D/A and Forms 4filed with the SEC on December 16, 2011 pursuant to the Exchange Act.
The table below and the notes following it have been prepared in reliance upon such filings for the nature of ownership and anexplanation of overlapping ownership.
Name and Address of Beneficial OwnerAmount and Nature of BeneficialOwnership Reported on Schedule Percent of Class
AXA(1)(2)(3)(4)
25 avenue Matignon 75008Paris, France 170,121,745(4)(5) 61.3%(4)(5)
(1) Based on information provided by AXA Financial, on December 31, 2012, AXA and certain of its subsidiaries beneficially owned all of AXA Financial’s out-standing common stock. For insurance regulatory purposes, the shares of common stock of AXA Financial beneficially owned by AXA and its subsidiaries havebeen deposited into a voting trust (“Voting Trust”), the term of which has been extended until April 29, 2021. The trustees of the Voting Trust (“VotingTrustees”) are Henri de Castries, Denis Duverne and Mark Pearson. Messrs. de Castries and Duverne serve on the Board of Directors of AXA, while Mr. Pearsonserves on the Management Committee of AXA. The Voting Trustees have agreed to exercise their voting rights to protect the legitimate economic interests ofAXA, but with a view to ensuring that certain minority shareholders of AXA do not exercise control over AXA Financial or certain of its insurance subsidiaries.
(2) Based on information provided by AXA, as of December 31, 2012, 14.35% of the issued ordinary shares (representing 23.05% of the voting power) of AXAwere owned directly and indirectly by two French mutual insurance companies (AXA Assurances IARD Mutuelle and AXA Assurances Vie Mutuelle) engaged inthe Property & Casualty insurance business and the Life & Savings insurance business in France (“Mutuelles AXA”).
Annual Report 2012 165

(3) The Voting Trustees and the Mutuelles AXA, as a group, may be deemed to be beneficial owners of all AllianceBernstein Units beneficially owned by AXA and itssubsidiaries. By virtue of the provisions of the Voting Trust Agreement, AXA may be deemed to have shared voting power with respect to the AllianceBernsteinUnits. AXA and its subsidiaries have the power to dispose or direct the disposition of all shares of the capital stock of AXA Financial deposited in the VotingTrust. The Mutuelles AXA, as a group, may be deemed to share the power to vote or to direct the vote and to dispose or to direct the disposition of all theAllianceBernstein Units beneficially owned by AXA and its subsidiaries. The address of each of AXA and the Voting Trustees is 25 avenue Matignon, 75008 Paris,France. The address of the Mutuelles AXA is 313 Terrasses de l’Arche, 92727 Nanterre Cedex, France.
(4) By reason of their relationships, AXA, the Voting Trustees, the Mutuelles AXA, AXA America Holdings, Inc. (a wholly-owned subsidiary of AXA), AXA IM RoseInc. (a 95.82%-owned subsidiary of AXA), AXA Financial, AXA Equitable, AXA Re Arizona Company (a wholly-owned subsidiary of AXA Financial), ColiseumReinsurance Company (a wholly-owned subsidiary of AXA Financial), ACMC, LLC (a wholly-owned subsidiary of AXA Financial), MONY and MLOA may bedeemed to share the power to vote or to direct the vote and to dispose or direct the disposition of all or a portion of the 170,121,745 issued and outstandingAllianceBernstein Units.
(5) As indicated above in note 4, AXA owns approximately 95.82% of AXA IM Rose Inc., which means that approximately 4.18% of the AllianceBernstein Unitsbeneficially owned by AXA IM Rose Inc. as of December 31, 2012 were not beneficially owned by AXA. As a result, as of December 31, 2012, AXA beneficiallyowned 168,368,879 AllianceBernstein Units, or 60.7% of the issued and outstanding AllianceBernstein Units.
As of December 31, 2012, Holding was the record owner of 105,173,342, or 37.9%, of the issued and outstandingAllianceBernstein Units.
Management
The following table sets forth, as of December 31, 2012, the beneficial ownership of Holding Units by each director and namedexecutive officer of the General Partner and by all directors and executive officers as a group:
Name of Beneficial Owner
Number of HoldingUnits and Nature of
Beneficial Ownership Percent of Class
Peter S. Kraus(1)(2) 4,337,643 4.1%
Christopher M. Condron(3) 55,219 *
Henri de Castries(1) 2,000 *
Denis Duverne(1) 2,000 *
Steven G. Elliott(4) 10,219 *
Deborah S. Hechinger(5) 28,123 *
Weston M. Hicks(6) 36,013 *
Andrew J. McMahon(1) — *
Kevin Molloy(1) 395 *
Mark Pearson(1) — *
Lorie A. Slutsky(1)(7) 56,863 *
A.W. (Pete) Smith, Jr.(8) 32,532 *
Peter J. Tobin(9) 56,075 *
James A. Gingrich(1)(10) 719,493 *
Lori A. Massad(1)(11) 131,231 *
Robert P. van Brugge(1)(12) 200,419 *
John C. Weisenseel(1)(13) 75,614 *
Edward J. Farrell(1)(14) 62,901 *
All directors and executive officers of the General Partner as a group (19 persons)(15)(16) 6,027,108 5.7%
* Number of Holding Units listed represents less than 1% of the Units outstanding.
(1) Excludes Holding Units beneficially owned by AXA and its subsidiaries. Ms. Slutsky and Messrs. Kraus, de Castries, Duverne, McMahon, Molloy and Pearson aredirectors and/or officers of AXA, AXA IM, AXA Financial, and/or AXA Equitable. Ms. Massad and Messrs. Kraus, Gingrich, van Brugge, Weisenseel and Farrell aredirectors and/or officers of the General Partner.
166 AllianceBernstein

(2) In connection with the commencement of Mr. Kraus’s employment, on December 19, 2008, he was granted 2,722,052 restricted Holding Units. Subject toaccelerated vesting clauses in the Kraus Employment Agreement (e.g., immediate vesting upon AXA ceasing to control the management of AllianceBernstein’sbusiness or Holding ceasing to be publicly traded), Mr. Kraus’s restricted Holding Units vest ratably on each of the first five anniversaries of December 19, 2008,which commenced December 19, 2009, provided, with respect to each installment, Mr. Kraus continues to be employed by AllianceBernstein on the vestingdate. AllianceBernstein withheld 280,263 Holding Units, 277,487 Holding Units, 274,764 Holding Units and 273,947 Holding Units, respectively, fromMr. Kraus’s distributions when the 2009, 2010, 2011 and 2012 tranches of his Restricted Holding Unit Grant vested to cover withholding tax obligations.Mr. Kraus’s total reflected in the table includes 544,410 Holding Units awarded under the Kraus Employment Agreement and 2,722,052 Holding Units under theExtended Employment Agreement that have not yet vested or been distributed to him.
(3) Includes 3,344 Holding Units Mr. Condron can acquire within 60 days under an AllianceBernstein option plan.
(4) Includes 3,344 Holding Units Mr. Elliott can acquire within 60 days under an AllianceBernstein option plan.
(5) Includes 17,743 Holding Units Ms. Hechinger can acquire within 60 days under an AllianceBernstein option plan.
(6) Includes 20,171 Holding Units Mr. Hicks can acquire within 60 days under an AllianceBernstein option plan.
(7) Includes 44,572 Holding Units Ms. Slutsky can acquire within 60 days under an AllianceBernstein option plan.
(8) Includes 20,171 Holding Units Mr. Smith can acquire within 60 days under an AllianceBernstein option plan.
(9) Includes 44,572 Holding Units Mr. Tobin can acquire within 60 days under an AllianceBernstein option plan.
(10) Includes 210,826 Holding Units Mr. Gingrich can acquire within 60 days under an AllianceBernstein option plan and 331,676 restricted Holding Units awarded toMr. Gingrich as long-term incentive compensation that have not yet vested or been distributed to him. These restricted Holding Units include 155,968 restrictedHolding Units granted to Mr. Gingrich as 2012 long-term incentive compensation. This award was approved by the Compensation Committee at a meeting dulycalled and held on December 3, 2012, at which meeting the Compensation Committee determined that the number of Holding Units would be derived usingthe average of the closing prices ($19.972) of a Holding Unit as reported for NYSE composite transactions for the five business day period that commenced onJanuary 14, 2013 and concluded on January 18, 2013.
(11) Includes 90,410 restricted Holding Units awarded to Ms. Massad as long-term incentive compensation that have not yet vested or been distributed to her. Theserestricted Holding Units include 29,792 restricted Holding Units granted to Ms. Massad as 2012 long-term incentive compensation. This award was approved bythe Compensation Committee at a meeting duly called and held on December 3, 2012, at which meeting the Compensation Committee determined that thenumber of Holding Units would be derived using the average of the closing prices ($19.972) of a Holding Unit as reported for NYSE composite transactions forthe five business day period that commenced on January 14, 2013 and concluded on January 18, 2013.
(12) Includes 170,408 restricted Holding Units awarded to Mr. van Brugge as long-term incentive compensation that have not yet vested or been distributed to him.These restricted Holding Units include 80,574 restricted Holding Units granted to Mr. van Brugge as 2012 long-term incentive compensation. This award wasapproved by the Compensation Committee at a meeting duly called and held on December 3, 2012, at which meeting the Compensation Committeedetermined that the number of Holding Units would be derived using the average of the closing prices ($19.972) of a Holding Unit as reported for NYSE compo-site transactions for the five business day period that commenced on January 14, 2013 and concluded on January 18, 2013.
(13) Includes 64,486 restricted Holding Units awarded to Mr. Weisenseel as long-term incentive compensation that have not vested or been distributed to him. Theserestricted Holding Units include 12,265 restricted Holding Units granted to Mr. Weisenseel as 2012 long-term incentive compensation (“2012 year-end award”)and 69,629 restricted Holding Units granted to him in connection with his recruitment and as replacement equity for awards he forfeited by leaving McGraw Hill.The 2012 year-end award was approved by the Compensation Committee at a meeting duly called and held on December 3, 2012, at which meeting theCompensation Committee determined that the number of Holding Units would be derived using the average of the closing prices ($19.972) of a Holding Unit asreported for NYSE composite transactions for the five business day period that commenced on January 14, 2013 and concluded on January 18, 2013.
(14) Includes 34,579 restricted Holding Units awarded to Mr. Farrell as long-term incentive compensation that have not yet vested or been distributed to him. Theserestricted Holding Units include 10,765 restricted Holding Units granted to him as 2012 long-term incentive compensation. This award was approved by theCompensation Committee at a meeting duly called and held on December 3, 2012, at which meeting the Compensation Committee determined that the num-ber of Holding Units would be derived using the average of the closing prices ($19.972) of a Holding Unit as reported for NYSE composite transactions for thefive business day period that commenced on January 14, 2013 and concluded on January 18, 2013.
(15) Includes 427,421 Holding Units the directors and executive officers as a group can acquire within 60 days under AllianceBernstein option plans.
(16) Includes 4,048,079 restricted Holding Units awarded to the executive officers as a group as long-term incentive compensation that have not yet vested or beendistributed to them.
Annual Report 2012 167

As of December 31, 2012, our directors and executive officers did not beneficially own any AllianceBernstein Units.
The following table sets forth, as of December 31, 2012, the beneficial ownership of the common stock of AXA by each directorand named executive officer of the General Partner and by all directors and executive officers as a group:
AXA Common Stock(1)
Name of Beneficial Owner
Number of Sharesand Nature of
Beneficial Ownership Percent of Class
Peter S. Kraus — *Christopher M. Condron(2) 3,407,930 *Henri de Castries(3) 4,458,696 *Denis Duverne(4) 2,565,402 *Steven G. Elliott — *Deborah S. Hechinger — *Weston M. Hicks — *Andrew J. McMahon(5) 239,105 *Kevin Molloy(6) 63,094 *Mark Pearson(7) 131,108 *Lorie A. Slutsky(8) 25,625 *A.W. (Pete) Smith, Jr. — *Peter J. Tobin(9) 37,548 *James A. Gingrich — *Lori A. Massad — *Robert P. van Brugge — *John C. Weisenseel — *Edward J. Farrell — *All directors and executive officers of the General Partner as a group (19 persons)(10) 10,928,508 *
* Number of shares listed represents less than 1% of the outstanding AXA common stock.
(1) Holdings of AXA American Depositary Shares (“ADS”) are expressed as their equivalent in AXA common stock. Each AXA ADS represents the right to receiveone AXA ordinary share.
(2) Includes 2,396,076 shares Mr. Condron can acquire within 60 days under option plans and 434,140 AXA ADSs Mr. Condron can acquire within 60 days underoption plans. Also includes (i) 349,365 deferred restricted ADS units under AXA’s Variable Deferred Compensation Plan for Executives, and (ii) 43,120 earnedand unpaid AXA performance units, which he can elect to receive in the form of ADSs or cash.
(3) Includes 2,950,340 shares Mr. de Castries can acquire within 60 days under option plans. Also includes 231,000 unvested AXA performance shares, which arepaid out when vested based on the price of AXA at that time and are subject to achievement of internal performance conditions.
(4) Includes 1,889,169 shares Mr. Duverne can acquire within 60 days under option plans.
(5) Includes 195,092 shares Mr. McMahon can acquire within 60 days under option plans. Also includes (i) 4,165 restricted AXA shares, representing the 30%payout of AXA performance units awarded to Mr. McMahon in 2009 (restriction will lift on March 20, 2013), (ii) 15,883 restricted shares that will vest onMay 20, 2015, and (iii) 11,375 earned and unpaid AXA performance units, which he can elect to receive in the form of ADSs or cash.
(6) Includes 16,744 shares Mr. Molloy can acquire within 60 days under options plans and 7,036 ADSs Mr. Molloy can acquire within 60 days under option plans.Also includes (i) 914 restricted AXA shares, representing the 30% payout of AXA performance units awarded to Mr. Molloy in 2009 (restriction will lift onMarch 20, 2013), and (ii) 2,120 earned and unpaid AXA performance units, which he can elect to receive in the form of ADSs or cash.
(7) Includes 84,399 shares Mr. Pearson can acquire within 60 days under options plans. Also includes (i) 4,719 restricted AXA shares, representing the 30% payoutof AXA performance units awarded to Mr. Pearson in 2009, and (ii) 8,721 earned and unpaid AXA performance units, which he can elect to receive in the formof ADSs or cash.
(8) Includes 4,735 shares Ms. Slutsky can acquire within 60 days under option plans.
(9) Includes 9,346 shares Mr. Tobin can acquire within 60 days under option plans.
(10) Includes 7,545,901 shares the directors and executive officers as a group can acquire within 60 days under option plans and 441,176 ADSs the directors andexecutive officers as a group can acquire within 60 days under option plans.
168 AllianceBernstein

Partnership Matters
The General Partner makes all decisions relating to the management of AllianceBernstein and Holding. The General Partner hasagreed that it will conduct no business other than managing AllianceBernstein and Holding, although it may make certain invest-ments for its own account. Conflicts of interest, however, could arise between AllianceBernstein and Holding, the General Partnerand the Unitholders of both Partnerships.
Section 17-403(b) of the Delaware Revised Uniform Limited Partnership Act (“Delaware Act”) states in substance that, except asprovided in the Delaware Act or the applicable partnership agreement, a general partner of a limited partnership has the liabilities ofa general partner in a general partnership governed by the Delaware Uniform Partnership Law (as in effect on July 11, 1999) to thepartnership and to the other partners. Accordingly, while under Delaware law a general partner of a limited partnership is liable as afiduciary to the other partners, those fiduciary obligations may be altered by the terms of the applicable partnership agreement. TheAllianceBernstein Partnership Agreement and Holding Partnership Agreement both set forth limitations on the duties and liabilitiesof the General Partner. Each partnership agreement provides that the General Partner is not liable for monetary damages for errorsin judgment or for breach of fiduciary duty (including breach of any duty of care or loyalty) unless it is established (the personasserting such liability having the burden of proof) that the General Partner’s action or failure to act involved an act or omissionundertaken with deliberate intent to cause injury, with reckless disregard for the best interests of the Partnerships or with actual badfaith on the part of the General Partner, or constituted actual fraud. Whenever the AllianceBernstein Partnership Agreement andthe Holding Partnership Agreement provide that the General Partner is permitted or required to make a decision (i) in its“discretion” or under a grant of similar authority or latitude, the General Partner is entitled to consider only such interests and fac-tors as it desires and has no duty or obligation to consider any interest of or other factors affecting the Partnerships or anyUnitholder of AllianceBernstein or Holding or (ii) in its “good faith” or under another express standard, the General Partner willact under that express standard and will not be subject to any other or different standard imposed by the AllianceBernstein Partner-ship Agreement and the Holding Partnership Agreement or applicable law or in equity or otherwise. The partnership agreementsfurther provide that to the extent that, at law or in equity, the General Partner has duties (including fiduciary duties) and liabilitiesrelating thereto to either Partnership or any partner, the General Partner acting under the AllianceBernstein Partnership Agreementor the Holding Partnership Agreement, as applicable, will not be liable to the Partnerships or any partner for its good faith relianceon the provisions of the partnership agreement.
In addition, the AllianceBernstein Partnership Agreement and the Holding Partnership Agreement grant broad rights ofindemnification to the General Partner and its directors and affiliates and authorize AllianceBernstein and Holding to enter intoindemnification agreements with the directors, officers, partners, employees and agents of AllianceBernstein and its affiliates andHolding and its affiliates. The Partnerships have granted broad rights of indemnification to officers and employees ofAllianceBernstein and Holding. The foregoing indemnification provisions are not exclusive, and the Partnerships are authorized toenter into additional indemnification arrangements. AllianceBernstein and Holding have obtained directors and officers/errors andomissions liability insurance.
The AllianceBernstein Partnership Agreement and the Holding Partnership Agreement also allow transactions betweenAllianceBernstein and Holding and the General Partner or its affiliates if the transactions are on terms determined by the GeneralPartner to be comparable to (or more favorable to AllianceBernstein or Holding than) those that would prevail with an unaffiliatedparty. The partnership agreements provide that those transactions are deemed to meet that standard if such transactions are approvedby a majority of those directors of the General Partner who are not directors, officers or employees of any affiliate of the GeneralPartner (other than AllianceBernstein and its subsidiaries or Holding) or, if in the reasonable and good faith judgment of the GeneralPartner, the transactions are on terms substantially comparable to (or more favorable to AllianceBernstein or Holding than) thosethat would prevail in a transaction with an unaffiliated party. The Delaware courts have held that provisions in partnership or lim-ited liability company agreements that permit affiliate transactions so long as they are on an arms-length basis operate to establish acontractually-agreed-to fiduciary duty standard of entire fairness on the part of the general partner or manager in connection withthe approval of affiliate transactions.
The AllianceBernstein Partnership Agreement and the Holding Partnership Agreement expressly permit all affiliates of the GeneralPartner (including AXA Equitable and its other subsidiaries) to compete, directly or indirectly, with AllianceBernstein and Holding,
Annual Report 2012 169

to engage in any business or other activity and to exploit any opportunity, including those that may be available toAllianceBernstein and Holding. AXA, AXA Financial, AXA Equitable and certain of their subsidiaries currently compete withAllianceBernstein. (See “Business—Competition” in Item 1.) The partnership agreements further provide that, except to the extentthat a decision or action by the General Partner is taken with the specific intent of providing an improper benefit to an affiliate ofthe General Partner to the detriment of AllianceBernstein or Holding, there is no liability or obligation with respect to, and nochallenge of, decisions or actions of the General Partner that would otherwise be subject to claims or other challenges as improperlybenefiting affiliates of the General Partner to the detriment of the Partnerships or otherwise involving any conflict of interest orbreach of a duty of loyalty or similar fiduciary obligation.
Section 17-1101(c) of the Delaware Act provides that it is the policy of the Delaware Act to give maximum effect to the principle offreedom of contract and to the enforceability of partnership agreements. Further, Section 17-1101(d) of the Delaware Act provides inpart that to the extent that, at law or in equity, a partner has duties (including fiduciary duties) to a limited partnership or to anotherpartner, those duties may be expanded, restricted, or eliminated by provisions in a partnership agreement (provided that a partnershipagreement may not eliminate the implied contractual covenant of good faith and fair dealing). In addition, Section 17-1101(f) of theDelaware Act provides that a partnership agreement may limit or eliminate any or all liability of a partner to a limited partnership oranother partner for breach of contract or breach of duties (including fiduciary duties); provided, however, that a partnership agreementmay not limit or eliminate liability for any act or omission that constitutes a bad faith violation of the implied contractual covenant ofgood faith and fair dealing. Decisions of the Delaware courts have recognized the right of parties, under the above provisions of theDelaware Act, to alter by the terms of a partnership agreement otherwise applicable fiduciary duties and liability for breach of duties.However, the Delaware courts have required that a partnership agreement make clear the intent of the parties to displace otherwiseapplicable fiduciary duties (the otherwise applicable fiduciary duties often being referred to as “default” fiduciary duties). Judicialinquiry into whether a partnership agreement is sufficiently clear to displace default fiduciary duties is necessarily fact driven and is madeon a case by case basis. Accordingly, the effectiveness of displacing default fiduciary obligations and liabilities of general partners con-tinues to be a developing area of the law and it is not certain to what extent the foregoing provisions of the AllianceBernstein Partner-ship Agreement and the Holding Partnership Agreement are enforceable under Delaware law.
170 AllianceBernstein

Item 13. Certain Relationships and Related Transactions, and Director Independence
Policies and Procedures Regarding Transactions with Related Persons
Each of the Holding Partnership Agreement and the AllianceBernstein Partnership Agreement expressly permits AXA and its affili-ates, which includes AXA Equitable and its affiliates (collectively, “AXA Affiliates”), to provide services to AllianceBernstein andHolding if the terms of the transaction are approved by the General Partner in good faith as being comparable to (or more favorableto each such partnership than) those that would prevail in a transaction with an unaffiliated party. This requirement is conclusivelypresumed to be satisfied as to any transaction or arrangement that (i) in the reasonable and good faith judgment of the General Part-ner, meets that unaffiliated party standard, or (ii) has been approved by a majority of those directors of the General Partner who arenot also directors, officers or employees of an affiliate of the General Partner.
In practice, our management pricing committees review investment advisory agreements with AXA Affiliates, which is the mannerin which the General Partner reaches a judgment regarding the appropriateness of the fees. Other transactions with AXA Affiliatesare submitted to the Audit Committee for their review and approval; in 2012, the unanimous consent of the Audit Committeeconstituted the consent of four of six independent directors on the Board. We are not aware of any transaction during 2012between our company and any related person with respect to which these procedures were not followed.
We do not have written policies regarding the employment of immediate family members of any of our related persons. Compensa-tion and benefits for all of our employees is established in accordance with our employment and compensation practices applicableto employees with equivalent qualifications and responsibilities who hold similar positions.
Financial Arrangements with AXA Affiliates
The General Partner has, in its reasonable and good faith judgment (based on its knowledge of, and inquiry with respect to, com-parable arrangements with or between unaffiliated parties), approved the following arrangements with AXA Equitable and its affili-ates as being comparable to, or more favorable to AllianceBernstein than, those that would prevail in a transaction with anunaffiliated party.
The following tables summarize transactions between AllianceBernstein and related persons during 2012. The first table summarizesservices we provide to related persons and the second table summarizes services our related persons provide to us:
Parties(1) General Description of Relationship(2)Amounts Received
or Accrued for in 2012
AXA Equitable(3) We provide investment management services and ancillary accounting, valuation,reporting, treasury and other services to the general and separate accounts of AXAEquitable and its insurance company subsidiaries.
$ 38,517,000(of which
$449,000relates to
the ancillaryservices)
AXA Life Japan Limited(3) $24,037,000
EQAT, AXA Enterprise Trust and AXA Premier VIP Trust We serve as sub-adviser to these open-end mutual funds, each of which issponsored by a subsidiary of AXA Financial.
$22,021,000
MONY Life Insurance Company and its subsidiaries(3)(4) We provide investment management services and ancillary accounting services. $ 8,756,000(of which
$150,000relates to
the ancillaryservices)
AXA Re Arizona Company(3) $ 7,248,000
AXA U.K. Group Pension Scheme $ 2,917,000
AXA Rosenberg Investment Management Asia Pacific(3) $ 2,701,000
AXA France(3) $ 2,234,000
AXA Germany(3) $ 1,706,000
Annual Report 2012 171
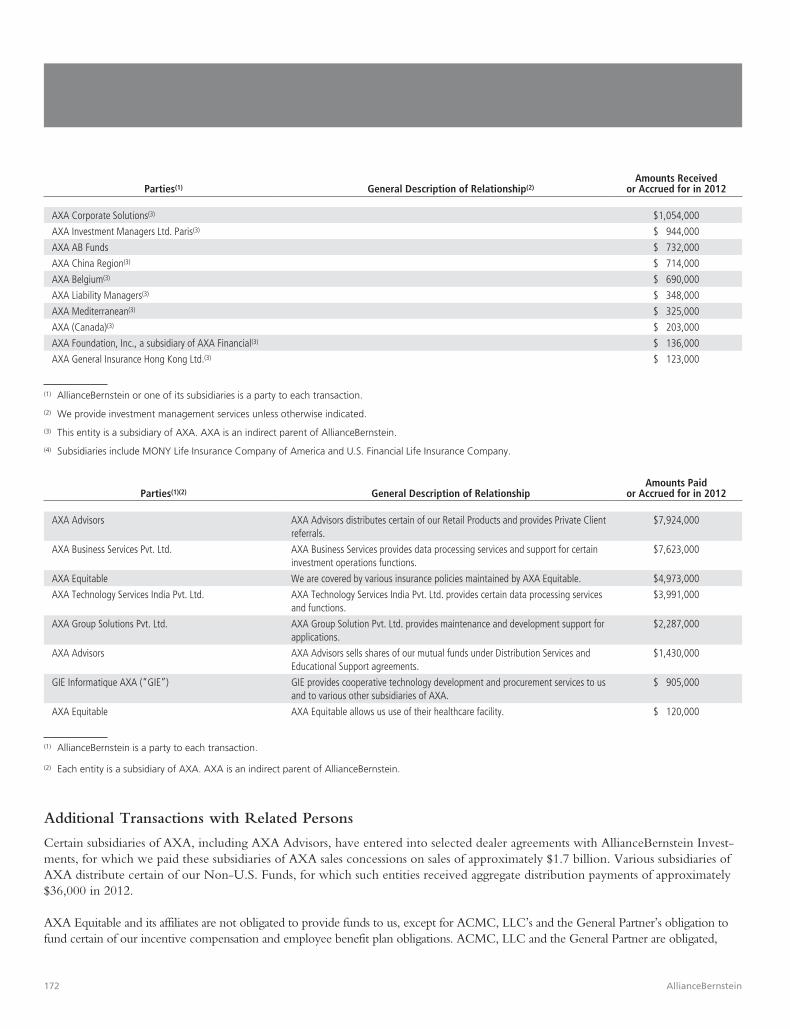
Parties(1) General Description of Relationship(2)Amounts Received
or Accrued for in 2012
AXA Corporate Solutions(3) $1,054,000
AXA Investment Managers Ltd. Paris(3) $ 944,000
AXA AB Funds $ 732,000
AXA China Region(3) $ 714,000
AXA Belgium(3) $ 690,000
AXA Liability Managers(3) $ 348,000
AXA Mediterranean(3) $ 325,000
AXA (Canada)(3) $ 203,000
AXA Foundation, Inc., a subsidiary of AXA Financial(3) $ 136,000
AXA General Insurance Hong Kong Ltd.(3) $ 123,000
(1) AllianceBernstein or one of its subsidiaries is a party to each transaction.
(2) We provide investment management services unless otherwise indicated.
(3) This entity is a subsidiary of AXA. AXA is an indirect parent of AllianceBernstein.
(4) Subsidiaries include MONY Life Insurance Company of America and U.S. Financial Life Insurance Company.
Parties(1)(2) General Description of RelationshipAmounts Paid
or Accrued for in 2012
AXA Advisors AXA Advisors distributes certain of our Retail Products and provides Private Clientreferrals.
$7,924,000
AXA Business Services Pvt. Ltd. AXA Business Services provides data processing services and support for certaininvestment operations functions.
$7,623,000
AXA Equitable We are covered by various insurance policies maintained by AXA Equitable. $4,973,000
AXA Technology Services India Pvt. Ltd. AXA Technology Services India Pvt. Ltd. provides certain data processing servicesand functions.
$3,991,000
AXA Group Solutions Pvt. Ltd. AXA Group Solution Pvt. Ltd. provides maintenance and development support forapplications.
$2,287,000
AXA Advisors AXA Advisors sells shares of our mutual funds under Distribution Services andEducational Support agreements.
$1,430,000
GIE Informatique AXA (“GIE”) GIE provides cooperative technology development and procurement services to usand to various other subsidiaries of AXA.
$ 905,000
AXA Equitable AXA Equitable allows us use of their healthcare facility. $ 120,000
(1) AllianceBernstein is a party to each transaction.
(2) Each entity is a subsidiary of AXA. AXA is an indirect parent of AllianceBernstein.
Additional Transactions with Related Persons
Certain subsidiaries of AXA, including AXA Advisors, have entered into selected dealer agreements with AllianceBernstein Invest-ments, for which we paid these subsidiaries of AXA sales concessions on sales of approximately $1.7 billion. Various subsidiaries ofAXA distribute certain of our Non-U.S. Funds, for which such entities received aggregate distribution payments of approximately$36,000 in 2012.
AXA Equitable and its affiliates are not obligated to provide funds to us, except for ACMC, LLC’s and the General Partner’s obligation tofund certain of our incentive compensation and employee benefit plan obligations. ACMC, LLC and the General Partner are obligated,
172 AllianceBernstein

subject to certain limitations, to make capital contributions to AllianceBernstein in an amount equal to the payments AllianceBernstein isrequired to make as incentive compensation under the employment agreements entered into in connection with AXA Equitable’s 1985acquisition of Donaldson, Lufkin and Jenrette Securities Corporation (since November 2000, a part of Credit Suisse Group) as well asobligations of AllianceBernstein to various employees and their beneficiaries under AllianceBernstein’s Capital Accumulation Plan. In 2012,ACMC, LLC made capital contributions to AllianceBernstein in the amount of approximately $4.4 million in respect of these obligations.ACMC, LLC’s obligations to make these contributions are guaranteed by Equitable Holdings, LLC (a wholly-owned subsidiary of AXAEquitable), subject to certain limitations. All tax deductions with respect to these obligations, to the extent funded by ACMC, LLC, theGeneral Partner or Equitable Holdings, LLC, will be allocated to ACMC, LLC or the General Partner.
Arrangements with Immediate Family Members of Related Persons
During 2012, we did not have arrangements with immediate family members of our directors and executive officers.
Director Independence
See “Corporate Governance—Independence of Certain Directors” in Item 10.
Annual Report 2012 173
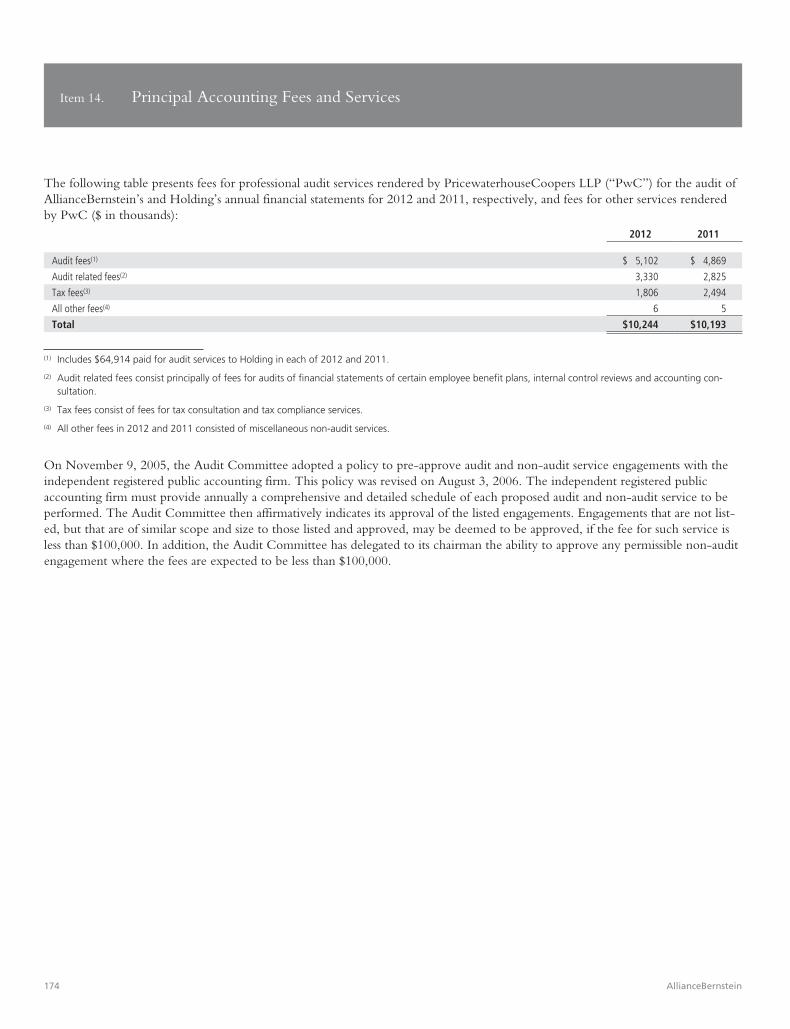
Item 14. Principal Accounting Fees and Services
The following table presents fees for professional audit services rendered by PricewaterhouseCoopers LLP (“PwC”) for the audit ofAllianceBernstein’s and Holding’s annual financial statements for 2012 and 2011, respectively, and fees for other services renderedby PwC ($ in thousands):
2012 2011
Audit fees(1) $ 5,102 $ 4,869
Audit related fees(2) 3,330 2,825
Tax fees(3) 1,806 2,494
All other fees(4) 6 5
Total $10,244 $10,193
(1) Includes $64,914 paid for audit services to Holding in each of 2012 and 2011.
(2) Audit related fees consist principally of fees for audits of financial statements of certain employee benefit plans, internal control reviews and accounting con-sultation.
(3) Tax fees consist of fees for tax consultation and tax compliance services.
(4) All other fees in 2012 and 2011 consisted of miscellaneous non-audit services.
On November 9, 2005, the Audit Committee adopted a policy to pre-approve audit and non-audit service engagements with theindependent registered public accounting firm. This policy was revised on August 3, 2006. The independent registered publicaccounting firm must provide annually a comprehensive and detailed schedule of each proposed audit and non-audit service to beperformed. The Audit Committee then affirmatively indicates its approval of the listed engagements. Engagements that are not list-ed, but that are of similar scope and size to those listed and approved, may be deemed to be approved, if the fee for such service isless than $100,000. In addition, the Audit Committee has delegated to its chairman the ability to approve any permissible non-auditengagement where the fees are expected to be less than $100,000.
174 AllianceBernstein

PART IV
Item 15. Exhibits, Financial Statement Schedules
(a) There is no document filed as part of this Form 10-K.
Financial Statement Schedule.
Attached to this Form 10-K is a schedule describing Valuation and Qualifying Account-Allowance for Doubtful Accountsfor the three years ended December 31, 2012, 2011 and 2010. PwC’s report regarding the schedule is also attached.
(b) Exhibits.
The following exhibits required to be filed by Item 601 of Regulation S-K are filed herewith or incorporated by referenceherein, as indicated:
Exhibit Description
3.01 Amended and Restated Certificate of Limited Partnership dated February 24, 2006 of Holding (incorporated by reference to Exhibit 99.06 to Form 8-K, as filedFebruary 24, 2006).
3.02 Amendment No. 1 dated February 24, 2006 to Amended and Restated Agreement of Limited Partnership of Holding (incorporated by reference to Exhibit 3.1 toForm 10-Q for the quarterly period ended September 30, 2006, as filed November 8, 2006).
3.03 Amended and Restated Agreement of Limited Partnership dated October 29, 1999 of Alliance Capital Management Holding L.P. (incorporated by reference toExhibit 3.2 to Form 10-K for the fiscal year ended December 31, 2003, as filed March 10, 2004).
3.04 Amended and Restated Certificate of Limited Partnership dated February 24, 2006 of AllianceBernstein (incorporated by reference to Exhibit 99.07 to Form 8-K,as filed February 24, 2006).
3.05 Amendment No. 1 dated February 24, 2006 to Amended and Restated Agreement of Limited Partnership of AllianceBernstein (incorporated by reference toExhibit 3.2 to Form 10-Q for the quarterly period ended September 30, 2006, as filed November 8, 2006).
3.06 Amended and Restated Agreement of Limited Partnership dated October 29, 1999 of Alliance Capital Management L.P. (incorporated by reference to Exhibit 3.3to Form 10-K for the fiscal year ended December 31, 2003, as filed March 10, 2004).
3.07 Certificate of Amendment to the Certificate of Incorporation of AllianceBernstein Corporation (incorporated by reference to Exhibit 99.08 to Form 8-K, as filedFebruary 24, 2006).
3.08 AllianceBernstein Corporation By-Laws with amendments through February 24, 2006 (incorporated by reference to Exhibit 99.09 to Form 8-K, as filed February 24, 2006).
10.01 AllianceBernstein 2012 Incentive Compensation Award Program.*
10.02 AllianceBernstein 2012 Deferred Cash Compensation Program.*
10.03 Form of 2012 Award Agreement under Incentive Compensation Award Program, Deferred Cash Compensation Program and 2010 Long Term Incentive Plan.*
10.04 Form of 2012 Award Agreement under 2010 Long Term Incentive Plan (relates to May 2012 equity compensation awards to Eligible Directors).*
10.05 Election Form relating to May 2013 equity compensation awards to Eligible Directors.*
10.06 Amendment No. 3 to the AllianceBernstein L.P. 2012 Long Term Incentive Plan.*
10.07 Guidelines for Transfer of AllianceBernstein L.P. Units.
10.08 Employment Agreement among Peter S. Kraus, AllianceBernstein Corporation, AllianceBernstein Holding L.P. and AllianceBernstein L.P., dated as of June 21,2012 (incorporated by reference to Exhibit 99.01 to Form 8-K/A, as filed June 26, 2012).*
10.09 Amendment No. 1 to Employment Agreement dated as of December 19, 2008 among Peter S. Kraus, AllianceBernstein Corporation, AllianceBernstein HoldingL.P. and AllianceBernstein L.P., dated as of June 21, 2012 (incorporated by reference to Exhibit 99.02 to Form 8-K, as filed June 21, 2012).*
10.10 Summary of AllianceBernstein’s Lease at 1345 Avenue of the Americas, New York, New York 10105 (incorporated by reference to Exhibit 10.07 to Form 10-Kfor the fiscal year ended December 31, 2011, as filed February 10, 2012).
10.11 Revolving Credit Agreement, dated as of December 9, 2010 and Amended and Restated as of January 17, 2012, among AllianceBernstein L.P. and Sanford C.Bernstein & Co., LLC, as Borrowers; Bank of America, N.A., as Administrative Agent; Merrill Lynch, Pierce, Fenner & Smith Incorporated, Citigroup GlobalMarkets Inc. and J.P. Morgan Securities LLC, as Joint Lead Arrangers and Joint Book Managers, and the other lenders party thereto (incorporated by reference toExhibit 10.01 to Form 8-K , as filed January 20, 2012).
Annual Report 2012 175

Exhibit Description
10.12 AllianceBernstein L.P. 2010 Long Term Incentive Plan, as amended (incorporated by reference to Exhibit 10.01 to Form 10-K for the fiscal year ended December 31,2010, as filed February 10, 2011).*
10.13 Form of Award Agreement under the Special Option Program (incorporated by reference to Exhibit 10.05 to Form 10-K for the fiscal year ended December 31,2008, as filed February 23, 2009).*
10.14 Amended and Restated Commercial Paper Dealer Agreement, dated as of February 10, 2009, among Banc of America Securities LLC, Merrill Lynch MoneyMarkets Inc., Deutsche Bank Securities Inc. and AllianceBernstein L.P. (incorporated by reference to Exhibit 10.11 to Form 10-K for the fiscal year endedDecember 31, 2008, as filed February 23, 2009).
10.15 Employment Agreement among Peter S. Kraus, AllianceBernstein Corporation, AllianceBernstein Holding L.P. and AllianceBernstein L.P., dated as of December 19,2008 (incorporated by reference to Exhibit 99.02 to Form 8-K, as filed December 24, 2008).*
10.16 Amended and Restated 1997 Long Term Incentive Plan, as amended through November 28, 2007 (incorporated by reference to Exhibit 10.02 to Form 10-K forthe fiscal year ended December 31, 2007, as filed February 25, 2008).*
10.17 Amended and Restated Issuing and Paying Agency Agreement, dated as of May 3, 2006 (incorporated by reference to Exhibit 10.2 to Form 10-Q for thequarterly period ended March 31, 2006, as filed May 8, 2006).
10.18 Investment Advisory and Management Agreement for MONY Life Insurance Company (incorporated by reference to Exhibit 10.4 to Form 10-K for the fiscal yearended December 31, 2004, as filed March 15, 2005).
10.19 Investment Advisory and Management Agreement for the General Account of AXA Equitable Life Insurance Company (incorporated by reference to Exhibit 10.5to Form 10-K for the fiscal year ended December 31, 2004, as filed March 15, 2005).
10.20 Alliance Capital Management L.P. Partners Plan of Repurchase adopted as of February 20, 2003 (incorporated by reference to Exhibit 10.2 to Form 10-K for thefiscal year ended December 31, 2002, as filed March 27, 2003).
10.21 Services Agreement dated as of April 22, 2001 between Alliance Capital Management L.P. and AXA Equitable Life Insurance Company (incorporated byreference to Exhibit 10.19 to Form 10-K for the fiscal year ended December 31, 2001, as filed March 28, 2002).
10.22 Extendible Commercial Notes Dealer Agreement, dated as of December 14, 1999 (incorporated by reference to Exhibit 10.10 to the Form 10-K for the fiscalyear ended December 31, 1999, as filed March 28, 2000).
10.23 Amended and Restated Investment Advisory and Management Agreement dated January 1, 1999 among Alliance Capital Management Holding L.P., AllianceCorporate Finance Group Incorporated, and AXA Equitable Life Insurance Company (incorporated by reference to Exhibit (a)(6) to Form 10-Q/A for the quarterlyperiod ended September 30, 1999, as filed on September 28, 2000).
10.24 Amended and Restated Accounting, Valuation, Reporting and Treasury Services Agreement dated January 1, 1999 between Alliance Capital ManagementHolding L.P., Alliance Corporate Finance Group Incorporated, and AXA Equitable Life Insurance Company (incorporated by reference to Exhibit (a)(7) to theForm 10-Q/A for the quarterly period ended September 30, 1999, as filed September 28, 2000).
10.25 Alliance Capital Accumulation Plan (incorporated by reference to Exhibit 10.11 to Form 10-K for the fiscal year ended December 31, 1988, as filed March 31,1989).*
12.01 AllianceBernstein Consolidated Ratio of Earnings to Fixed Charges in respect of the years ended December 31, 2012, 2011 and 2010.
21.01 Subsidiaries of AllianceBernstein.
23.01 Consents of PricewaterhouseCoopers LLP.
31.01 Certification of Mr. Kraus furnished pursuant to Section 302 of the Sarbanes-Oxley Act of 2002.
31.02 Certification of Mr. Weisenseel furnished pursuant to Section 302 of the Sarbanes-Oxley Act of 2002.
32.01 Certification of Mr. Kraus furnished for the purpose of complying with Rule 13a-14(b) or Rule 15d-14(b) of the Securities Exchange Act of 1934 and 18 U.S.C.Section 1350, as adopted pursuant to Section 906 of the Sarbanes-Oxley Act of 2002.
32.02 Certification of Mr. Weisenseel furnished for the purpose of complying with Rule 13a-14(b) or Rule 15d-14(b) of the Securities Exchange Act of 1934 and 18U.S.C. Section 1350, as adopted pursuant to Section 906 of the Sarbanes-Oxley Act of 2002.
101.INS XBRL Instance Document.
101.SCH XBRL Taxonomy Extension Schema.
176 AllianceBernstein

Exhibit Description
101.CAL XBRL Taxonomy Extension Calculation Linkbase.
101.LAB XBRL Taxonomy Extension Label Linkbase.
101.PRE XBRL Taxonomy Extension Presentation Linkbase.
101.DEF XBRL Taxonomy Extension Definition Linkbase.
* Denotes a compensatory plan or arrangement
Annual Report 2012 177

Signatures
Pursuant to the requirements of Section 13 or 15(d) of the Exchange Act, the Registrant has duly caused this report to be signed onits behalf by the undersigned, thereunto duly authorized.
AllianceBernstein Holding L.P.
Date: February 12, 2013 By: /s/ Peter S. Kraus
Peter S. KrausChairman of the Board and Chief Executive Officer
Pursuant to the requirements of the Exchange Act, this report has been signed by the following persons on behalf of the Registrantand in the capacities and on the dates indicated.
Date: February 12, 2013 /s/ John C. Weisenseel
John C. WeisenseelChief Financial Officer
178 AllianceBernstein

Directors
/s/ Peter S. Kraus /s/ Andrew J. McMahon
Peter S. Kraus Andrew J. McMahonChairman of the Board Director
/s/ Christopher M. Condron /s/ Kevin Molloy
Christopher M. Condron Kevin MolloyDirector Director
/s/ Henri de Castries /s/ Mark Pearson
Henri de Castries Mark PearsonDirector Director
/s/ Denis Duverne /s/ Lorie A. Slutsky
Denis Duverne Lorie A. SlutskyDirector Director
/s/ Steven G. Elliott /s/ A.W. (Pete) Smith, Jr.
Steven G. Elliott A.W. (Pete) Smith, Jr.Director Director
/s/ Deborah S. Hechinger /s/ Peter J. Tobin
Deborah S. Hechinger Peter J. TobinDirector Director
/s/ Weston M. Hicks
Weston M. HicksDirector
Annual Report 2012 179

This page intentionally left blank.

This page intentionally left blank.

This page intentionally left blank.

AllianceBernstein Holding L.P.New York Stock ExchangeSymbol: AB
Headquarters1345 Avenue of the AmericasNew York, NY 10105212.969.1000www.alliancebernstein.com
Unitholder Account AssistanceUnitholders who own units in certificate form should contact the transfer agent and registrar listed below with any questions:
(regular mail) Computershare P.O. Box 43006 Providence, RI 02940-3006
250 Royall StreetCanton, MA 02021US 866.737.9896Outside the US 201.680.6578E-mail [email protected]/investor
Unitholder Tax AssistanceUnitholders with Schedule K-1 or any tax-related questions can contact:
Phone 800.526.3132Fax 212.969.6870E-mail [email protected]/ab
Unitholder Investor RelationsPhone 800.962.2134Fax 212.969.2136E-mail [email protected] www.alliancebernstein.com/investorrelations
All forms that we file with the US Securities and Exchange Commission, as well as this annual report, can be found in the Investor & Media Relations section of our website.
Media RelationsJonathan Freedman212.823.2687
Independent Public AccountantsPricewaterhouseCoopers LLPNew York
Mutual Fund Shareholder InformationFor US Investors:AllianceBernstein Investor Services, Inc.P.O. Box 786003San Antonio, TX 78278-6003Monday to Friday, 8:30 am–7:00 pm ET800.221.5672US Direct Number 210.384.600024-Hour Automated Assistance (aka “Alliance Answer”) 800.251.0539www.alliancebernstein.com
For Non-US Investors:AllianceBernstein Investor Services,a unit of AllianceBernstein (Luxembourg) S.A. Société AnonymeR.C.S. Luxembourg B 34 40518, rue Eugène RuppertL-2453 LuxembourgInternational Access Code + 800.22.63.8637Be advised that only the international access code is required to dial this number and not the country code.Alternative Phone + 352.46.39.36.151
AllianceBernstein Institutional Investments Kelly Murphy212.969.6601www.alliancebernstein.com/institutional
Bernstein Global Wealth Management212.486.5800 www.bernstein.com
Bernstein Research ServicesLori Lewin 212.756.4226 www.bernsteinresearch.com
AllianceBernstein® and the AB AllianceBernstein logo are trademarks and service marks owned by AllianceBernstein L.P.© 2013 AllianceBernstein Holding L.P. and AllianceBernstein L.P. Printed in the USA
Cautions Regarding Forward-Looking StatementsCertain statements provided by management in this report are “forward-looking statements” within the meaning of the Private Securities Litigation Reform Act of 1995. Such forward-looking statements are subject to risks, uncertainties and other factors that could cause actual results to differ materially from future results expressed or implied by such forward-looking statements. The most significant of these factors include, but are not limited to, the following: the performance of financial markets, the investment performance of sponsored investment products and separately managed accounts, general economic conditions, industry trends, future acquisitions, competitive conditions, and government regulations, including changes in tax regulations and rates and the manner in which the earnings of publicly traded partnerships are taxed. We caution readers to carefully consider such factors. Further, such forward-looking statements speak only as of the date on which such statements are made; we undertake no obligation to update any forward-looking statements to reflect events or circumstances after the date of such statements. For further information regarding these forward-looking statements and the factors that could cause actual results to differ, see “Risk Factors” in Item 1A and “Cautions Regarding Forward-Looking Statements” in Item 7 of the enclosed Form 10-K. Any or all of the forward-looking statements that we make in this report, the enclosed Form 10-K, other documents we file with or furnish to the SEC, and any other public statements we issue, may turn out to be wrong. It is important to remember that other factors besides those listed in “Risk Factors” and “Cautions Regarding Forward-Looking Statements” could also adversely affect our revenues, financial condition, results of operations and business prospects.
2012 Company Information

AllianceBernstein Holding L.P.1345 Avenue of the Americas
New York, NY 10105
www.alliancebernstein.comAB–4737–0213


