52
Central Bank & Trust Co. Central Bank of Jefferson County Central Insurance Services Central Investment Center, Inc. 2012 ANNUAL REPORT Everything we do is centered around you.

Central Bank & Trust Co.
Central Bank of Jefferson County
Central Insurance Services
Central Investment Center, Inc.
2 0 1 2 a n n u a l r e p o r t
Everything we do is centered around you.
C e n t r a l B a n C s h a r e s ’ M i s s i o n s t a t e M e n t
he mission of Central Bancshares is to be a high-performance financial
services company that delivers superior service and value to each customer we
serve. We will emphasize employee and customer satisfaction – always mindful
that quality people will make the Central difference.
2 0 1 2 a n n u a l r e p o r t
ContentsFinancial Highlights............................................................................................................................. 1Letter to Employees, Shareholders, Customers and Communities...................................................... 2Management’s Discussion and Analysis .............................................................................................. 5Independent Auditor’s Report............................................................................................................ 12Consolidated Balance Sheets.............................................................................................................. 13Consolidated Statements of Income................................................................................................... 14Consolidated Statements of Cash Flows............................................................................................ 15Consolidated Statements of Changes in Shareholders’ Equity........................................................... 16Consolidated Statements of Comprehensive Income......................................................................... 16Notes to Consolidated Financial Statements..................................................................................... 16Boards of Directors............................................................................................................................. 43Officers............................................................................................................................................... 45Central Bancshares Locations............................................................................................................ 48In Memoriam.............................................................................................................................................49
For additional copies or information, visit centralbank.com or contact:
Stephen C. KellyCentral Bank300 West Vine StreetLexington, Kentucky 40507(859) 253-6201E-mail: [email protected]
t
Member FDIC

1
F i n a n c i a l H i g H l i g H t s
For twelve months ended December 31
2012 2011 2010 2009 2008Results of Operations: Net income $ 12,880,646 $ 11,017,235 $ 6,907,543 $ 1,768,610 $ 9,200,145 Net income per share 37.02 31.67 19.85 5.08 26.44 Cash dividends per share 0.00 0.00 0.00 5.00 9.00 Book value per share at year end 518.24 479.72 449.08 433.94 416.03 At December 31 Assets $ 2,175,446,603 $ 2,145,011,752 $ 2,192,013,038 $ 2,053,106,110 $ 1,910,399,779 Earning assets 2,000,062,125 1,956,857,364 2,019,276,028 1,863,911,997 1,729,851,957 Net loans and leases 1,645,063,290 1,644,350,387 1,747,181,237 1,717,017,748 1,536,559,682 Deposits 1,876,715,151 1,858,076,694 1,903,788,824 1,705,582,952 1,540,141,181 Shareholders’ equity 180,307,914 166,906,431 156,243,656 150,978,513 144,747,709
Averages Assets $ 2,142,605,932 $ 2,131,379,954 $ 2,145,488,233 $ 1,964,115,041 $ 1,818,243,648 Earning assets 1,970,266,865 1,954,372,859 1,963,138,178 1,793,440,419 1,649,263,780 Net loans and leases 1,626,097,871 1,683,941,150 1,732,507,700 1,602,265,904 1,467,592,067 Deposits 1,852,678,210 1,847,549,623 1,812,588,595 1,623,195,705 1,456,101,126 Shareholders’ equity 174,441,375 162,532,252 155,348,975 146,626,780 149,598,387
Performance Ratios: Return on average assets 0.60% 0.52% 0.32% 0.09% 0.51% Return on average shareholders’ equity 7.38% 6.78% 4.45% 1.21% 6.15% Average shareholders’ equity to average assets 8.14% 7.63% 7.24% 7.47% 8.23% Dividend payout ratio 0.00% 0.00% 0.00% 98.36% 34.04% Net charge-offs to average
loans and leases 0.81% 0.60% 0.93% 0.66% 0.44% Allowance for credit losses as a percentage
of year end loans and leases 1.64% 1.72% 1.29% 1.19% 1.40% Net interest margin (tax equivalent) 3.74% 3.97% 3.85% 3.58% 3.75%
Five-Year Growth
$2,500
$2,400
$2,300
$2,200
$2,100
$2,000
$1,900
$1,800
$1,700
$1,600
$1,500
$1,400
$1,300
$1,200 2008 2009 2010 2011 2012
IN M
ILL
ION
S
AssetsDepositsLoans
Shareholders’ Equity
$180
$170
$160
$150
$140
$130
$1202008 2009 2010 2011 2012
IN M
ILL
ION
S
entral Bank is on the move!
Supported by six decades of strength, stability and service
to our communities, Central Bank is poised to continue
its progress and help our customers, shareholders and
communities. Today, the economy is showing some signs
of a recovery. If we continue to emphasize service and
leadership to forge strong relationships, we can help our
customers meet the challenges of the new economy.
We are strengthening our “community banking brand” by
delivering a wide array of banking and income-generating
services. Those efforts are expanding our customer base
and adding new relationships in our markets across the
Commonwealth. During a time when the economy has
slowed the growth of traditional loan and deposit business,
these other lines of business have produced new opportunities
for our Company. We are pursuing a multiyear strategy to
diversify our balance sheet by focusing on core deposits and
relationship-based lending to support growth and prosperity
within our Kentucky markets. At the same time, we are
strengthening earnings by developing a growing emphasis on
income strategies that include insurance, wealth management,
mortgage origination and investment services.
Our customers are responding to these initiatives and to
the leadership shown by our team of Central Bankers who
are delivering truly outstanding service. Again in 2012, our
independent measurements of banking service quality place
Central Bank at or near the top. We continue to stress service
as the key competitive advantage that will sustain our bank
through all types of economic conditions and will help us
achieve superior financial performance in the days to come.
Financial performance continued to improve in 2012.
2012 Performance
These financial highlights for the Company include Central
Bank & Trust Co. and its subsidiaries, Central Investment
Center, Inc. and Central Insurance Services; Central Bank
of Jefferson County; and Salt Lick Deposit Bank (which
was acquired by Peoples Bank of Kentucky on January
1, 2013). We have provided a detailed discussion of our
financial results in the Management’s Discussion and Analysis
beginning on page 5.
• Net income rose 16.9 percent to $12,880,646 or $37.02
per share. For 2011 the result was $11,017,235 or
$31.67 per share.
• Return on average assets of $2.14 billion improved to
.60 percent from .52 percent in 2011.
• Deposit growth was modest, ending the year with an
increase of one percent, $1.88 billion.
• Loan opportunities were somewhat limited, ending the
year at $1.65 billion, the same level as in 2011.
• Shareholders’ equity grew to $180.3 million, up $13.4
million or 8.03 percent.
These results provide a solid basis for future earnings
when the credit cycle and economic conditions return to
more traditional levels.
Serving our Customers and Communities
Economic recovery is proceeding slowly in Kentucky,
and our customers are still cautious about their spending
and savings habits. We were extremely encouraged by the
strength of the mortgage industry that is leading the way to
a more robust economy. Home sales are climbing, along with
housing prices, and consumers are using low-interest rates to
refinance existing mortgage loans at an unprecedented pace.
Our mortgage lending and loan services staff has worked
tirelessly to meet those demands while delivering excellent
service. In addition, we are encouraged by the acceptance
of our new Affordable Housing Loan that serves low-and-
moderate-income families in our markets.
Customers have responded to the trusted advisors they
know, and our employees have been a tremendous source of
strength amid a troubled market. As a result, we used targeted
growth strategies to attract and retain core deposits.
With interest rates at historically low levels, our customer
relationships and service focus on customer needs were
valuable assets. The Bank’s exclusive corporate partnership
as the “Official Bank of UK Athletics” continues to expand
brand and service awareness, emphasizing insurance,
mortgage and wealth management services in 2012.
Deposit gathering entered a new phase with the launch
of online deposit accounts. We have expanded our reach
2
c
t o o u r E m p l o y E E s , s H a r E H o l d E r s , c u s t o m E r s a n d c o m m u n i t i E s
beyond our established markets into the surrounding states.
In the months to come, we expect the online channel to
serve as a consistent source of new deposits and a convenient
way for existing customers to expand their relationships.
Other Internet channels, including online and mobile
banking, are growing in popularity with convenient access
and control of personal and small business finances.
Throughout our existence, our Company has been a
driving force for economic development. We are very proud
to be providing the lending needed to support growth by
individuals and businesses across the state. Despite media
reports that “banks were not lending,” we supported our
customers and promoted economic development throughout
the year. Our lenders assisted a broad range of customers
in diverse industries and business segments. Likewise, we
moved to serve more of those business customers’ needs
with corporate cash management, remote deposit and credit
card services.
Other opportunities were created by our financial service
professionals who provide private banking, wealth management,
insurance and investment services. Our Wealth Management
team had a remarkable year, based on its ability to provide
a single source of service for people and companies with
sophisticated needs. Those customer relationships will
serve as a solid foundation for future growth across a wide
spectrum of financial services.
Community Sponsorships
Dedicated community service is a vital element for
community banks, and it’s the foundation on which we have
built our franchise. Our sponsorships and charitable giving
supported numerous organizations in the Commonwealth,
including American Cancer Society Relay for Life, American
Heart Association, Big Brothers/Big Sisters, Bluegrass
Tomorrow, Children’s Charities of the Bluegrass, Commerce
Lexington, Community Action Council, Downtown Lexington
Corporation, Everfi Financial Literacy Program, Greater
Louisville Inc., God’s Pantry, Headley-Whitney Museum,
Hospice, Junior Achievement, Kentucky Chamber of
Commerce, Kincaid Foundation, LexArts, REACH
low-income housing program, University of Kentucky,
Kentucky Children’s Hospital, Sanders Brown Center,
Tubby’s Klubhouse, United Way, Urban League and YMCA
Black Achievers, along with other excellent charitable and
civic organizations serving a wide range of our citizens.
Beyond financial investments, our officers and employees
are providing leadership and service through their participation
on community, charitable and civic boards. Each year the
Company recognizes staff members in all markets for
Community Service leadership as a means to express its
appreciation for their tireless efforts. Our community
involvement is a major force in our ability to attract and
retain the best talent, which allows Central Bank to have
been honored among the Best Places to Work in Kentucky
for eight consecutive years.
Looking forward to 2013
Central Bank is well-positioned to continue building market
share and expanding our reach in the markets we serve.
We are challenging our staff to consider best practices that
enhance our business processes while improving revenues
and reducing expenses. We believe that credit quality is
improving which will allow for reduced credit costs in 2013.
We plan to focus on commercial loans to qualified business
segments and consumer loans on an expanded basis. While
we still face significant challenges in the sluggish economy,
intense competition and excessive regulation, we believe that
moderate growth opportunities still exist.
Our staff members have been constant sources of pride as
they strive to provide our markets’ best service. Their experience
and expertise are tremendous resources for our Company,
our customers and our markets. We continue to invest in
training and education to ensure that our advantage endures
and that qualified employees are available in every area.
The banking center network is a tremendous resource
for gathering and serving customers. Although we are not
expanding brick and mortar facilities, we will continue to
explore online channels that serve customers when and
where they choose. Response to those initiatives has been
very encouraging, and we expect further progress to come
as we are able to offer expanded transaction capabilities.
3

4
Honored for Years of Service
Two Central Bankers retired in 2012 after serving our
company with dedication and distinction. I want to offer
my sincere appreciation to Olivia Davis, Client Services,
and Doug Fritz, Vice President, Wealth Management, who
completed their employment with Central Bank & Trust Co.
at yearend. We appreciate their long years of support and
will miss their leadership and wisdom as vital members of
our team.
With Appreciation
I appreciate the support and guidance of our directors during
the period of economic uncertainty. Their experience and
leadership provide an excellent resource and an insightful
connection to our local markets. We were deeply saddened
by the loss of Board Member Richard Furst, who made
tremendous contributions to our success and was a constant
source of inspiration and wise counsel. A tribute to him
is provided in this report.
It is an honor to serve with our team of dedicated Central
Bankers whose energy and enthusiastic service are the
cornerstones of our success. I am also thankful for the loy-
alty of our customers, many of whom have enjoyed relation-
ships with us spanning several decades.
Even though the economy has yet to provide a clear picture
of its future direction, Central Bank is well-positioned for
the challenges we face. We believe our community banking
brand provides the best solutions for the wide variety of
business and consumer needs we are in a position to serve.
Our commitment to our shareholders, customers and
communities is unwavering, for I believe our best days are
coming in the years ahead.
Sincerely,
Luther Deaton, Jr.
Chairman, President & CEO
March 15, 2013
“Central Bank is well-positioned to continue building market
share and expanding our reach in the markets we serve.”

entral Bancshares, Inc. (the “Company”), a bank holding
company located in Lexington, Kentucky, is the parent company
of Central Bank & Trust Co.; Central Bank of Jefferson County,
Inc.; and Salt Lick Deposit Bank. At December 31, 2012 the
Company had 28 full-service banking centers located in Bath,
Boone, Clark, Fayette, Jefferson, Jessamine, Kenton, Madison and
Scott counties, a full-service brokerage business and a full-service
insurance agency. Effective January 1, 2013, the Company sold
Salt Lick Deposit Bank. All assets of Salt Lick Deposit Bank were
sold, including the two banking centers located in Bath County.
Results of Operations The Company reported net income of $12,880,646 for 2012,
or $37.02 per share. This compares to $11,017,235, or $31.67
per share for 2011, and $6,907,543, or $19.85 per share for 2010.
During 2012 both the national and local economies showed signs
of recovery, and the Company experienced some improvement
in terms of real estate foreclosures and past due loans. However,
the need to continue working with clients previously impacted
by the slow economy continued. During 2012 we had $7.5
million of additions to foreclosed real estate and experienced
net charge-offs on outstanding loans of $13.5 million. This is a
decline of $3.3 million in additions to foreclosed assets, but an
increase of $3.2 million in net charge-offs. We were also able to
dispose of $9.3 million of real estate assets we had previously
foreclosed on. All this activity in other real estate plus market
valuation adjustments left us with a net balance of foreclosed
real estate assets held at December 31, 2012, of $21.0 million,
a decline of $4.7 million from December 31, 2011. A full
discussion of the performance of the loan portfolio is presented
later in this document.
Return on average equity was 7.38 percent and return on
average assets was 0.60 percent for 2012, compared with 6.78
percent and 0.52 percent, and 4.45 percent and 0.32 percent,
respectively, for 2011 and 2010.
Net Interest Income Net interest income in 2012 was $72.5 million compared
to $75.8 million in 2011, a decrease in 2012 of 4.40 percent.
The net interest rate spread is the difference between the tax
equivalent average rate of interest earned on average earning
assets and the average rate of interest expense on average
interest bearing liabilities. The net interest margin is the tax
equivalent net interest income divided by average earning assets.
For computational purposes, non-accrual loans are included in
earning assets. On average the net interest spread decreased
22 basis points during 2012, to 3.53 percent, while the net
interest margin declined 23 basis points to 3.74 percent for 2012.
Every basis point of deterioration in the net interest margin
equates to approximately $200,000 per year in income.
During 2011, the tax equivalent yield on earning assets
averaged 4.95 percent; the yield on earning assets averaged 4.51
percent in 2012. Weakness in the economy was demonstrated
through lackluster loan demand. With the weak loan demand
came increased competition between qualified lenders, causing
the interest rates on credit products to decline. The Company
was able to control the attrition of its loan portfolio to only 3.12
percent, but saw the tax equivalent yield on those outstanding
loans decline from 5.59 percent in 2011 to 5.32 percent in 2012.
The increased competition for loans was the primary cause for
the reduction in yield on the portfolio.
The investment portfolio averaged $270.4 million for 2011,
and had an average tax equivalent yield of 0.89 percent. The
investment portfolio averaged $344.2 million for 2012, and had
an average tax equivalent yield of 0.65 percent. The yield curve
was very flat for most of 2012, and the Company held a larger
percentage of its assets in very liquid overnight investments
as compared to 2011. Management is seeking to find the
appropriate balance between the safety of the increased liquidity,
and the interest rate risk required to earn a higher yield on the
investment portfolio.
While the average yield on earning assets declined 44 basis
points from 2011 to 2012, the cost of paying liabilities declined
22 basis points over the same period. Weak loan demand,
coupled with increased availability of deposits, led to less
competitive pressures in pricing deposits, and made management
more reluctant to pay higher prices to attract new deposits.
The Company was able to lower its cost on interest bearing
deposit accounts from an average of 1.08 percent in 2011 to 0.83
percent in 2012. While there may still be some room left for
improvement in the net interest margin from lowering deposit
rates, the opportunities for improvement are much less in 2013.
Gross loans outstanding averaged $1.66 billion for 2012,
5
m a n a g E m E n t ’ s d i s c u s s i o n a n d a n a l y s i s o F F i n a n c i a l c o n d i t i o n a n d r E s u l t s o F o p E r a t i o n s
Net Interest Margin
4.00%
3.75%
3.50%
3.25%
3.00%2008 2009 2010 2011 2012

6
TAxAbLE EquIvALENT RATE/voLuME ANALYSIS(In Thousands) 2012/2011 2011/2010 Increase/Decrease Increase/Decrease Net Due To Net Due To Change Rate Volume Change Rate Volume Interest income Loans $ (7,077 ) $ (4,105 ) $ (2,972 ) $ (4,936 ) $ (2,377 ) $ (2,559 )Investments Taxable (33 ) (514 ) 481 125 (214 ) 339 Tax exempt (142 ) 33 (175 ) (114 ) 128 (242 )Federal funds sold 81 (19 ) 100 73 23 50 –––––– –––––– –––––– –––––– –––––– –––––– Total interest income (7,171 ) (4,605 ) (2,566 ) (4,852 ) (2,440 ) (2,412 ) Interest expense Deposits NOW accounts (30 ) (71 ) 41 (538 ) (484 ) (54 ) Savings deposits (9 ) (24 ) 15 (48 ) (57 ) 9 Money market deposits (311) (504 ) 193 (1,815 ) (1,891 ) 76 Time deposits (3,476 ) (1,863 ) (1,613 ) (3,577 ) (3,343 ) (234 ) Borrowed funds (12 ) 162 (174 ) (940 ) 592 (1,532 ) –––––– –––––– –––––– –––––– –––––– –––––– Total interest expense (3,838 ) (2,300 ) (1,539 ) (6,918 ) (5,183 ) (1,735 ) –––––– –––––– –––––– –––––– –––––– –––––– Net interest income $ (3,333 ) $ (2,304 ) $ (1,028 ) $ 2,066 $ 2,743 $ (677 )
decreasing $53.3 million, or 3.12 percent on average from 2011.
The Company was able to increase average deposits by a mere
$5.1 million or 0.28 percent during 2012. Deposits averaged
$1.85 billion during 2012.
The Company averaged a loan to deposit ratio of 89.40
percent during 2012, a decrease of 313 basis points from the
2011 percentage of 92.53 percent. This is the fourth year in
a row that the Company’s average loan to deposit ratio has
declined. Liquidity was a primary emphasis of many financial
institutions and bank regulatory agencies during 2012. This
reduction in the loan to deposit ratio is a positive reflection of
management’s attention to liquidity management, and part of
an overall strategy to control growth on the balance sheet to
improve the Company’s capital ratios. However, management is
also keenly aware of the tradeoff between liquidity and earnings,
and is striving to maintain an appropriate balance.
In March 2009, the Company issued $22.6 million in Trust
Preferred Securities with a fixed rate of interest of 10 percent.
The Company still has $15 million in Trust Preferred Securities
outstanding from a previous issue, which have a variable rate of
interest equal to the sum of the three month London Interbank
Offered Rate (LIBOR) and 1.75 percent, which was 2.06 percent
at year end 2012. Interest expense associated with these two
debt issues totaled $2.6 million for 2012, an average rate of
7.05 percent.
The table below reflects the changes in net interest income in
2012 and 2011 due to changes in rates and volumes computed on
a tax equivalent basis for all interest-sensitive categories.
Non-Interest Income Generation of non-interest income has traditionally been a
strength of the Company’s financial performance, as it was in
2012. Fee income totaled $36.2 million for 2012, an increase
of $2.1 million, or 6.14 percent over fee income generated in
2011. Management considers this a significant achievement in
the Company’s financial performance for 2012 considering the
adverse impact of consumer protection legislation and other
recent regulatory changes on the Company’s ability to generate
fee income from our traditional sources.
The Company generated $4.8 million in fees from its trust
services during 2012, an increase of $459,000 from 2011, or
10.49 percent. At year end 2012, total assets under management
in the Trust Department stood at $1.0 billion, an increase of
$96.8 million over December 31, 2011. Personnel in the Trust
Department generated $80.3 million in asset growth from
business development efforts, with the remaining $16.5 million
in growth in assets coming from asset appreciation.
Service charges on deposit accounts decreased 12.29 percent,
or $1.3 million during 2012 compared to 2011. The Company’s

ANALYSIS oF NoN-INTEREST INcoME
2012/2011 2011/2010 2012 2011 2010 CHANGE % CHANGE %Trust income $ 4,837,557 $ 4,378,124 $ 3,671,734 $ 459,433 10.49 % $ 706,390 19.24 %Service charges on deposit accounts 9,630,467 10,979,706 11,501,419 (1,349,239 ) (12.29 )% (521,713 ) (4.54 )%Fees on mortgage loan sales and servicing 6,060,758 3,069,097 4,102,469 2,991,661 97.48 % (1,033,372 ) (25.19 )%Service charges on revolving credit 4,628,351 4,536,534 3,641,707 91,817 2.02 % 894,827 24.57 %Electronic banking fees 4,516,806 4,435,543 4,152,733 81,263 1.83 % 282,810 6.81 %Loss or valuation allowances for ORE (2,853,228 ) (2,812,082 ) (4,874,879 ) (41,146 ) 1.46 % 2,062,797 (42.31 )%Other income 9,342,152 9,485,479 7,769,324 (143,327 ) (1.51 )% 1,716,155 22.09 % –––––––––– –––––––––– –––––––––– –––––––––– –––––––––Total non-interest income $ 36,162,863 $ 34,072,401 $ 29,964,507 $ 2,090,462 6.14 % $ 4,107,894 13.71 %
7
Courtesy Coverage product permits a personal transaction
account which is maintained in good standing to be overdrawn
up to $800 for the normal insufficient funds check charge. Net
revenue of $6.5 million was generated during 2012 from this
product, a decrease of $1.2 million, or 15.95 percent from 2011.
The FDIC issued guidance in late 2010 on how banks are to
manage their automated overdraft protection programs. This
guidance includes specific instructions on the posting order of
items, required counseling with customers who are frequent
users of the service, and other specific steps a bank must take to
ensure that it is not maximizing fees generated from this product.
Management carefully implemented this new guidance in August
2011. It appears that implementation of this guidance has had
a negative impact upon income generated from insufficient
funds charges. Management recognizes that this product will
continue to generate significant income for the Company for
years to come, but it is a mature product that is not likely to
show significant growth without some change in the regulatory
environment, or an increase in the base fee.
Loans originated for sale during 2012 totaled $286.2 million. At
the end of 2012, the Company serviced $55.6 million in loans for
Fannie Mae and Freddie Mac. Approximately 3.78 percent of the
loans originated for sale during 2012 were sold service retained.
During 2012 the Company sold $275.4 million in mortgage
loans, service released. The interest rate on all loans originated
for sale is locked with the buyer and the investor, thus the
Company has no interest rate risk associated with these
transactions. During 2012 the Company generated $6.1 million
in income from loans sold in the secondary market, an increase
of $3.0 million from 2011, or nearly doubling income from the
previous year. While activity in the housing market continues to
be depressed, lower interest rates have provided an opportunity
for homeowners to refinance. The Mortgage Bankers Association
is predicting that mortgage originations in 2013 will decline 20
percent from 2012 levels.
Two residual impacts of the recent economic difficulties are
higher levels of past due loans than the Company’s normal
experience, and higher levels of foreclosed assets consisting
primarily of foreclosed real estate. Other real estate owned is
property that has been foreclosed upon, or has been taken back
in lieu of payment of customer debt. On December 31, 2012,
the Company held $20.1 million in other real estate. Other real
estate is recorded at estimated fair market value, less estimated
costs to sell the properties. During 2012, the Company either
realized losses on the disposal of pieces of other real estate or
recorded unrealized losses on properties in establishing valuation
reserves in the amount of $2.9 million, which is roughly equal
to the losses experienced in 2011. Despite the fact that the
loss experience was roughly equal between 2011 and 2012,
management did detect an improvement in the real estate market
as more pieces of real estate were sold, and more of those sold
at a value close to their appraised value in 2012 than in 2011.
Particularly the market for mid priced residential real estate
improved; several pieces of property in this price range were
sold in 2012. Management is comfortable that the other real
estate portfolio is properly recorded at its estimated fair value
as of December 31, 2012, but is also aware that in the current
economic conditions it is probable that some of these values may
continue to decline. The Company is aggressively marketing
these properties.
Non-Interest Expense Non-interest expense for 2012 totaled $83.6 million, a slight
increase of $263,000, or 0.32 percent from 2011. Several years
ago the Company implemented strategies to help control
operating expense. In the last three years, the Company has
experienced modest growth in operating expenses, less than
2.50 percent per year, despite increased expenses relating to loan
collection efforts.
Salaries and benefits are the largest component of non-interest

8
expense, totaling $38.2 million, an increase of $210,000, or
0.55 percent from 2011. On December 31, 2012, the Company
employed 478 full-time equivalent employees compared to 479
full-time equivalent employees at the same date in 2011.
Expenses related to loan collection efforts including legal
fees and costs associated with other real estate owned have been
unusually high for the past several years. During 2012 legal fees
and expenses associated with other real estate owned totaled
$4.1 million. This is a decline of $763,000, or 15.59 percent from
2011. This is still an unusually high level for these expenses, but
management feels that the declining number of properties held,
coupled with slowly improving economic conditions, will result
in further declines in these expenses in 2013.
Federal Income Tax The Company had a negative provision for federal income tax
of $55,000 during 2012. The Company’s tax planning strategy
includes the purchase of municipal securities to increase tax
exempt income, and participation in Industrial Revenue Bond
lending for non-profit organizations. The Company is also a
limited partner in 16 low-income housing projects and two
historic renovation projects for which it receives tax credits
and is an investor in two Community Development Entities for
which it receives New Market Tax Credits. It is the culmination
of these various tax exempt income investing activities which
generated tax savings and credits in excess of the liability from
taxable income.
Management is closely monitoring the Company’s income
tax position to ensure that it will be able to take advantage of
all of its deferred tax assets. The possibility of repositioning the
Company’s long-term tax planning strategy is under current
review. At this time management feels that the deferred tax assets
recorded on the Company’s books are not impaired.
Financial Condition On December 31, 2012, total assets of the Company were
$2.18 billion. The Company’s assets increased $30.4 million,
or 1.42 percent, from assets at December 31, 2011. During
2012, management continued a strategy of controlled attrition/
limited growth in order to strengthen the Company’s capital
ratios. Earning assets totaled $2.0 billion on December 31, 2012,
or 91.94 percent of total assets. The Company’s investment
portfolio, including federal funds sold and money market
investments, increased $42.5 million, while its gross loans
and leases, including loans held for sale, remained relatively
unchanged, with a slight decline of $590,000 or 0.04 percent.
Earning Assets Gross loans outstanding totaled $1.67 billion on December
31, 2012. Loan demand in all areas remained lackluster, at best,
during 2012. While the Company did experience a modest
increase in Commercial and Mortgage Loans, the Consumer
Loan Portfolios declined. Competitive pressures on installment
lending, particularly for loans secured by automobiles, produced
a rate environment that management did not find attractive. As
a result, the Company saw a decline in outstanding installment
loans of $21.9 million or 20.31 percent. We also saw a small
decline in Equity Line loans of $5.1 million, or 4.55 percent.
The Company is mindful of the importance of managing
exposure to credit risk. This is accomplished through
diversification of the loan portfolio, not only by loan type,
but by industry and customer. Diversification by industry and
geographic region within the Company’s loan portfolio helps
to maintain acceptable credit risk exposure. Concentrations of
credit are monitored on a monthly basis for compliance with
internal and external policies. As a result, there is no undue
concentration in any single sector.
ANALYSIS oF NoN-INTEREST ExpENSE 2012/2011 2011/2010 2012 2011 2010 CHANGE % CHANGE %Salaries and benefits $ 38,184,558 $ 37,975,052 $ 36,184,885 $ 209,506 0.55 % $ 1,790,167 4.95 %Occupancy 11,624,372 11,192,099 11,110,995 432,273 3.86 % 81,104 0.73 %Furniture and equipment expense 5,584,395 5,797,892 5,928,123 (213,497 ) (3.68 )% (130,231 ) (2.20 )%Advertising and business development 4,113,871 3,755,161 4,086,753 358,710 9.55 % (331,592 ) (8.11 )%Professional services 2,523,676 2,602,890 3,454,486 (79,214 ) (3.04 )% (851,596 ) (24.65 )% FDIC insurance expense 1,889,628 2,303,052 3,491,092 (413,424 ) (17.95 )% (1,188,040 ) (34.03 )%Other non-interest expense 19,711,207 19,742,610 17,380,693 (31,403 ) (0.16 )% 2,361,917 13.59 % ––––––––––– ––––––––––– –––––––––– ––––––––– –––––––––Total non-interest expense $ 83,631,707 $ 83,368,756 $ 81,637,027 $ 262,951 0.32 % $ 1,731,729 2.12 %

9
Management has always viewed the investment portfolio as
a means by which interest rate risk and liquidity are managed.
Management noted that bank examinations and regulatory
comments have an increased emphasis regarding on-balance-
sheet liquidity. That emphasis, coupled with a very flat yield
curve and some asset liability pressure to match immediately
repricing deposit liabilities, prompted management to leave a
larger than normal percentage of available cash in overnight
deposits with the Federal Reserve. On December 31, 2012, the
Company was selling $174.4 million to the Federal Reserve
as an overnight investment. On average, this balance was
$178.5 million for 2012. Management continues to look for
opportunities to invest in very short term securities that would
yield more than the 25 basis points we earn on the overnight
funds. For the most part, management is looking for short-term
government securities with a maturity of two years or less, and
variable rate securities to purchase. Any of these purchased will
be classified as available for sale.
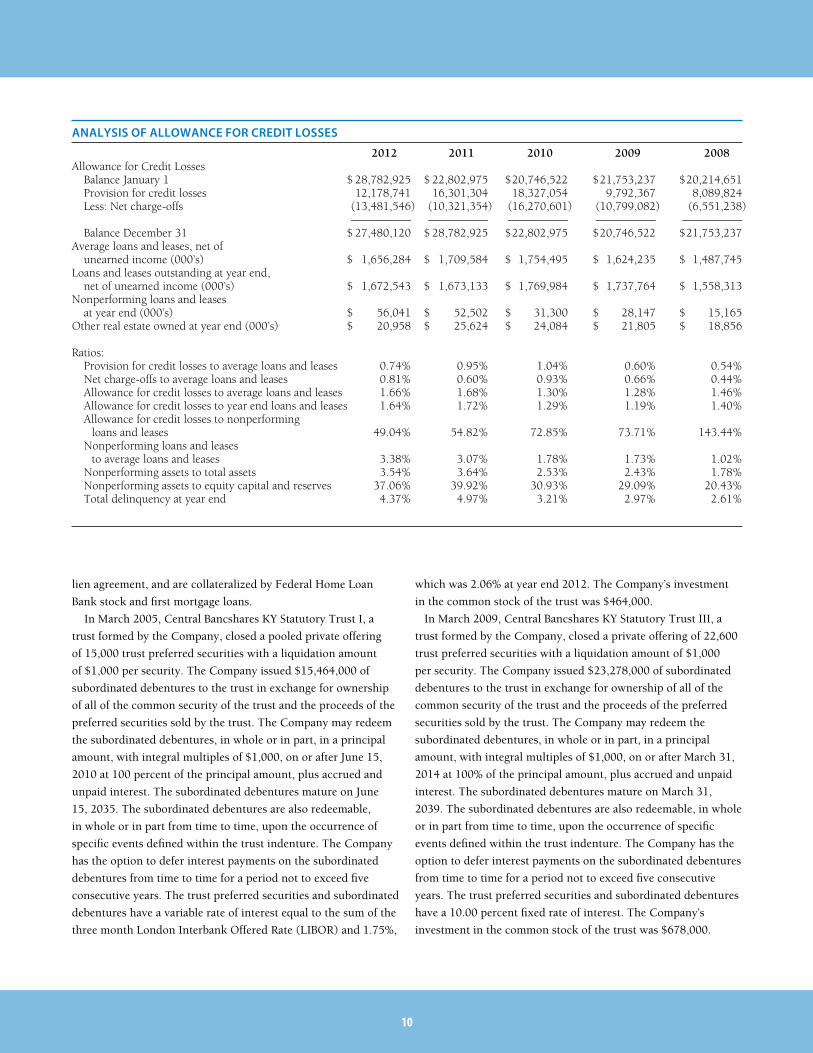
Allowance for Credit Losses At December 31, 2012, the allowance for credit losses was
$27.5 million, or 1.64 percent of gross loans outstanding,
compared with $28.8 million, or 1.72 percent, at December
31, 2011. Net credit losses for 2012 totaled $13.5 million, or
0.81 percent of gross average outstanding loans and leases. The
provision for credit losses during 2012 was $12.2 million.
Loans delinquent 90 days or more as of December 31, 2012,
totaled $43.8 million, as compared to $46.3 million on the same
date in 2011. Loans in non-accrual status totaled $52.7 million
on December 31, 2012, as compared to $51.6 million on the
same date in 2011. There were $3.3 million in loans past due at
least 90 days and still accruing interest on December 31, 2012,
compared to $922,000 on December 31, 2011.
The performance of the loan portfolio during 2012 reflected
the weakness of the economy. Total loans delinquent more than
30 days as a percentage of outstanding loans and leases was 4.37
percent on December 31, 2012. This is a decrease of 60 basis
points from December 31, 2011. Management has carefully
considered the delinquency in the portfolio as it evaluated the
level of allowance for credit losses needed. While no one can say
with certainty that the allowance is adequate, management is
comfortable that it is adequate.
ASC 310-10-35, “Accounting by Creditors for Impairment of
a Loan,” requires identification of all impaired loans. A loan is
considered to be impaired when it is probable that all principal
and interest amounts will not be collected in accordance with
the original loan terms. Loans with a carrying value of $109.5
million or 6.55 percent of gross loans and leases were identified
as impaired at December 31, 2012.
Deposits Total deposits were $1.88 billion at year end 2012, an increase
of $18.6 million from December 31, 2011. On average, total
deposits increased at a rate of 0.28 percent during 2012.
Due to weak loan demand, management concentrated its efforts
on maintaining current customer relationships, while reducing
the cost of funding particularly in the certificates of deposit.
As a result the Company experienced significant growth in
demand deposit, NOW and money market balances while
experiencing a decline in certificates of deposit. The Company
offers fixed-rate certificates of deposit with maturities ranging
from seven days to five years. Most of the certificates of deposit
purchased by customers have a maturity ranging from six months
to 24 months.
Non interest bearing deposits on December 31, 2012, totaled
$420.0 million, which was an increase of $5.99 million, or 1.45
percent over the $414.1 million on December 31, 2011.
Short-Term Borrowings Short-term borrowing sources consist of federal funds
purchased from downstream correspondents, repurchase
agreements, sweep accounts of commercial customers, and
overnight borrowings from Federal Home Loan Bank. The
cash management services offered by the Company continue
to be a valued service for our commercial deposit customers.
The balance in Commercial Sweep Accounts totaled $60.3
million on December 31, 2012. These accounts are overnight
repurchase agreements requiring a direct pledge from our
investment portfolio.
Weak loan demand throughout the year, resulted in the
Company accumulating large amounts of on-balance-sheet
liquidity. As a result, the Company did not utilize any of its
short-term borrowing capacity with Federal Home Loan Bank
during 2012.
Long-Term Borrowing The Company’s long-term borrowing consists of advances from
Federal Home Loan Bank. On December 31, 2012, the Company
had $5.7 million outstanding in advances from Federal Home
Loan Bank with maturities ranging from March 2013 through
December 2027. Each advance is payable at its maturity, with a
prepayment penalty. The advances are borrowed under a blanket
ANALYSIS oF NoN-INTEREST ExpENSE 2012/2011 2011/2010 2012 2011 2010 CHANGE % CHANGE %Salaries and benefits $ 38,184,558 $ 37,975,052 $ 36,184,885 $ 209,506 0.55 % $ 1,790,167 4.95 %Occupancy 11,624,372 11,192,099 11,110,995 432,273 3.86 % 81,104 0.73 %Furniture and equipment expense 5,584,395 5,797,892 5,928,123 (213,497 ) (3.68 )% (130,231 ) (2.20 )%Advertising and business development 4,113,871 3,755,161 4,086,753 358,710 9.55 % (331,592 ) (8.11 )%Professional services 2,523,676 2,602,890 3,454,486 (79,214 ) (3.04 )% (851,596 ) (24.65 )% FDIC insurance expense 1,889,628 2,303,052 3,491,092 (413,424 ) (17.95 )% (1,188,040 ) (34.03 )%Other non-interest expense 19,711,207 19,742,610 17,380,693 (31,403 ) (0.16 )% 2,361,917 13.59 % ––––––––––– ––––––––––– –––––––––– ––––––––– –––––––––Total non-interest expense $ 83,631,707 $ 83,368,756 $ 81,637,027 $ 262,951 0.32 % $ 1,731,729 2.12 %
10
lien agreement, and are collateralized by Federal Home Loan
Bank stock and first mortgage loans.
In March 2005, Central Bancshares KY Statutory Trust I, a
trust formed by the Company, closed a pooled private offering
of 15,000 trust preferred securities with a liquidation amount
of $1,000 per security. The Company issued $15,464,000 of
subordinated debentures to the trust in exchange for ownership
of all of the common security of the trust and the proceeds of the
preferred securities sold by the trust. The Company may redeem
the subordinated debentures, in whole or in part, in a principal
amount, with integral multiples of $1,000, on or after June 15,
2010 at 100 percent of the principal amount, plus accrued and
unpaid interest. The subordinated debentures mature on June
15, 2035. The subordinated debentures are also redeemable,
in whole or in part from time to time, upon the occurrence of
specific events defined within the trust indenture. The Company
has the option to defer interest payments on the subordinated
debentures from time to time for a period not to exceed five
consecutive years. The trust preferred securities and subordinated
debentures have a variable rate of interest equal to the sum of the
three month London Interbank Offered Rate (LIBOR) and 1.75%,
which was 2.06% at year end 2012. The Company’s investment
in the common stock of the trust was $464,000.
In March 2009, Central Bancshares KY Statutory Trust III, a
trust formed by the Company, closed a private offering of 22,600
trust preferred securities with a liquidation amount of $1,000
per security. The Company issued $23,278,000 of subordinated
debentures to the trust in exchange for ownership of all of the
common security of the trust and the proceeds of the preferred
securities sold by the trust. The Company may redeem the
subordinated debentures, in whole or in part, in a principal
amount, with integral multiples of $1,000, on or after March 31,
2014 at 100% of the principal amount, plus accrued and unpaid
interest. The subordinated debentures mature on March 31,
2039. The subordinated debentures are also redeemable, in whole
or in part from time to time, upon the occurrence of specific
events defined within the trust indenture. The Company has the
option to defer interest payments on the subordinated debentures
from time to time for a period not to exceed five consecutive
years. The trust preferred securities and subordinated debentures
have a 10.00 percent fixed rate of interest. The Company’s
investment in the common stock of the trust was $678,000.
ANALYSIS oF ALLoWANcE FoR cREDIT LoSSES
2012 2011 2010 2009 2008Allowance for Credit Losses Balance January 1 $ 28,782,925 $ 22,802,975 $ 20,746,522 $ 21,753,237 $ 20,214,651 Provision for credit losses 12,178,741 16,301,304 18,327,054 9,792,367 8,089,824 Less: Net charge-offs (13,481,546 ) (10,321,354 ) (16,270,601 ) (10,799,082) (6,551,238 ) –––––––––– –––––––––– –––––––––– –––––––––– –––––––––– Balance December 31 $ 27,480,120 $ 28,782,925 $ 22,802,975 $ 20,746,522 $ 21,753,237Average loans and leases, net of unearned income (000’s) $ 1,656,284 $ 1,709,584 $ 1,754,495 $ 1,624,235 $ 1,487,745Loans and leases outstanding at year end, net of unearned income (000’s) $ 1,672,543 $ 1,673,133 $ 1,769,984 $ 1,737,764 $ 1,558,313 Nonperforming loans and leases at year end (000’s) $ 56,041 $ 52,502 $ 31,300 $ 28,147 $ 15,165 Other real estate owned at year end (000’s) $ 20,958 $ 25,624 $ 24,084 $ 21,805 $ 18,856 Ratios: Provision for credit losses to average loans and leases 0.74% 0.95% 1.04% 0.60% 0.54% Net charge-offs to average loans and leases 0.81% 0.60% 0.93% 0.66% 0.44% Allowance for credit losses to average loans and leases 1.66% 1.68% 1.30% 1.28% 1.46% Allowance for credit losses to year end loans and leases 1.64% 1.72% 1.29% 1.19% 1.40% Allowance for credit losses to nonperforming loans and leases 49.04% 54.82% 72.85% 73.71% 143.44% Nonperforming loans and leases to average loans and leases 3.38% 3.07% 1.78% 1.73% 1.02% Nonperforming assets to total assets 3.54% 3.64% 2.53% 2.43% 1.78% Nonperforming assets to equity capital and reserves 37.06% 39.92% 30.93% 29.09% 20.43% Total delinquency at year end 4.37% 4.97% 3.21% 2.97% 2.61%

11
The $37.6 million in trust preferred securities may be included
in Tier 1 capital (with certain limitations applicable) under
current regulatory guidelines and interpretations.
Capital Capital adequacy guidelines of the regulatory agencies make
regulatory capital requirements more sensitive to the risk profiles
of individual banks, take off-balance-sheet exposure into account
in assessing capital adequacy, and minimize disincentives for
holding liquid, low risk assets.
In order for a bank holding company to be considered “well
capitalized” under prompt corrective action provisions, a
company must maintain a Total capital to risk-adjusted assets
ratio of 10.0 percent, a Tier I capital to risk-adjusted assets ratio
of 6.0 percent, and a Tier I capital to average assets ratio of 5.0
percent. On December 31, 2012, the Company had a Total capital
to risk-adjusted assets ratio of 12.4 percent, a Tier I capital to
risk-adjusted assets ratio of 11.2 percent, and a Tier I capital
to average assets ratio of 9.3 percent. It is generally anticipated
within the banking industry that new capital standards and
requirements will be released sometime in 2013.
Subsequent Events As part of the strategic planning process, management and the
Board of Directors determined that the future expansion plans for
the company did not include deeper penetration into the Eastern
part of Kentucky. As a result, it was determined that our Salt Lick
Deposit Bank subsidiary would be sold, an objective completed
on January 1, 2013. The Company accepted a cash purchase price
of $8.6 million for Salt Lick Deposit Bank, and recognized a net
gain of $196,000 from the sale.
On December 31, 2012, Salt Lick Deposit Bank had $72.3
million in total assets, $52.6 million in gross loans, and $61.7
million in total deposits. Shareholder’s equity totaled $8.0
million on December 31, 2012. For 2012 Salt Lick Deposit Bank
generated net income of $669,000.
Preliminary discussions between the Board of Directors and
management are that at least part of the cash generated from
the sale of Salt Lick Deposit Bank will be used to retire some
of the outstanding trust preferred securities within the next
18 months.
ANALYSIS oF ALLoWANcE FoR cREDIT LoSSES
2012 2011 2010 2009 2008Allowance for Credit Losses Balance January 1 $ 28,782,925 $ 22,802,975 $ 20,746,522 $ 21,753,237 $ 20,214,651 Provision for credit losses 12,178,741 16,301,304 18,327,054 9,792,367 8,089,824 Less: Net charge-offs (13,481,546 ) (10,321,354 ) (16,270,601 ) (10,799,082) (6,551,238 ) –––––––––– –––––––––– –––––––––– –––––––––– –––––––––– Balance December 31 $ 27,480,120 $ 28,782,925 $ 22,802,975 $ 20,746,522 $ 21,753,237Average loans and leases, net of unearned income (000’s) $ 1,656,284 $ 1,709,584 $ 1,754,495 $ 1,624,235 $ 1,487,745Loans and leases outstanding at year end, net of unearned income (000’s) $ 1,672,543 $ 1,673,133 $ 1,769,984 $ 1,737,764 $ 1,558,313 Nonperforming loans and leases at year end (000’s) $ 56,041 $ 52,502 $ 31,300 $ 28,147 $ 15,165 Other real estate owned at year end (000’s) $ 20,958 $ 25,624 $ 24,084 $ 21,805 $ 18,856 Ratios: Provision for credit losses to average loans and leases 0.74% 0.95% 1.04% 0.60% 0.54% Net charge-offs to average loans and leases 0.81% 0.60% 0.93% 0.66% 0.44% Allowance for credit losses to average loans and leases 1.66% 1.68% 1.30% 1.28% 1.46% Allowance for credit losses to year end loans and leases 1.64% 1.72% 1.29% 1.19% 1.40% Allowance for credit losses to nonperforming loans and leases 49.04% 54.82% 72.85% 73.71% 143.44% Nonperforming loans and leases to average loans and leases 3.38% 3.07% 1.78% 1.73% 1.02% Nonperforming assets to total assets 3.54% 3.64% 2.53% 2.43% 1.78% Nonperforming assets to equity capital and reserves 37.06% 39.92% 30.93% 29.09% 20.43% Total delinquency at year end 4.37% 4.97% 3.21% 2.97% 2.61%
AvERAGE EARNING ASSETS & AvERAGE FuNDS AvAILAbLE (in thousands) 2012/2011 2011/2010 2012 2011 2010 Change % Change %Gross loans $ 1,656,284 $ 1,709,584 $ 1,754,495 $ (53,300 ) (3.12 )% $ (44,911 ) (2.56 )% Less: Allowance for credit losses (30,186) (25,643 ) (21,987 ) (4,543 ) 17.72 % (3,656 ) 16.63 % ––––––––– ––––––––– ––––––––– –––––––– –––––––– Total net loans 1,626,098 1,683,941 1,732,508 (57,843 ) (3.43 )% (48,567 ) (2.80 )% Investment securities 165,710 130,542 110,788 35,168 26.94 % 19,754 17.83 % Money market investments 178,459 139,889 118,602 38,570 27.57 % 21,287 17.95 % ––––––––– ––––––––– ––––––––– –––––––– –––––––– Total investments 344,169 270,431 229,390 73,738 27.27 % 41,041 17.89 % ––––––––– ––––––––– ––––––––– –––––––– –––––––– Total earning assets $ 1,970,267 $ 1,954,372 $ 1,961,898 $ 15,895 0.81 % $ (7,526 ) (0.38 )% Demand deposits $ 406,306 $ 376,280 $ 329,509 $ 30,026 7.98 % $ 46,771 14.19 % Immediately repricing deposits 742,116 671,951 726,424 70,165 10.44 % (54,473 ) (7.50 )% Fixed-rate deposits 704,256 799,318 756,656 (95,062 ) (11.89 )% 42,662 5.64 % ––––––––– ––––––––– ––––––––– –––––––– –––––––– Total deposits 1,852,678 1,847,549 1,812,589 5,129 0.28 % 34,960 1.93 % Borrowed funds 103,394 109,426 166,393 (6,032 ) (5.51 )% (56,967 ) (34.24 )% ––––––––– ––––––––– ––––––––– –––––––– –––––––– Total funds available $ 1,956,072 $ 1,956,975 $ 1,978,982 $ (903 ) (0.05 )% $ (22,007 ) (1.11 )%

12
i n d E p E n d E n t a u d i t o r ’ s r E p o r t
Board of Directors and ShareholdersCentral Bancshares, Inc.Lexington, Kentucky
Report on the Financial Statements
We have audited the accompanying consolidated financial statements of Central Bancshares, Inc., which comprise the consolidated balance sheets as of December 31, 2012 and 2011, and the related consolidated statements of income, comprehensive income, changes in shareholders’ equity, and cash flows for the years then ended, and the related notes to the financial statements.
Management’s Responsibility for the Financial Statements
Management is responsible for the preparation and fair presentation of these consolidated financial statements in accordance with accounting principles generally accepted in the United States of America; this includes the design, implementation, and maintenance of internal control relevant to the preparation and fair presentation of consolidated financial statements that are free from material misstatement, whether due to fraud or error.
Auditor’s Responsibility
Our responsibility is to express an opinion on these consolidated financial statements based on our audits. We conducted our audits in accordance with auditing standards generally accepted in the United States of America. Those standards require that we plan and perform the audit to obtain reasonable assurance about whether the consolidated financial statements are free from material misstatement.
An audit involves performing procedures to obtain audit evidence about the amounts and disclosures in the consolidated financial statements. The procedures selected depend on the auditor’s judgment, including the assessment of the risks of material misstatement of the consolidated financial statements, whether due to fraud or error. In making those risk assessments, the auditor considers internal control relevant to the entity’s preparation and fair presentation of the consolidated financial statements in order to design audit procedures that are appropriate in the circumstances, but not for the purpose of expressing an opinion on the effectiveness of the entity’s internal control. Accordingly, we express no such opinion. An audit also includes evaluating the appropriateness of accounting policies used and the reasonableness of significant accounting estimates made by management, as well as evaluating the overall presentation of the consolidated financial statements.
We believe that the audit evidence we have obtained is sufficient and appropriate to provide a basis for our audit opinion.
Opinion
In our opinion, the consolidated financial statements referred to above present fairly, in all material respects, the financial position of Central Bancshares, Inc. as of December 31, 2012 and 2011, and the results of its operations and its cash flows for the years then ended in accordance with accounting principles generally accepted in the United States of America.
Crowe Horwath LLPLouisville, KentuckyMarch 1, 2013

ASSETSCash and due from financial institutions $ 46,597,962 $ 48,651,143 Federal funds sold 174,400,000 142,700,000 —————— —————— Total cash and cash equivalents 220,997,962 191,351,143
Available for sale securities 166,527,755 152,068,423 Held to maturity securities 2,820,945 6,401,139 —————— —————— Total securities 169,348,700 158,469,562
Loans 1,608,012,457 1,604,806,013Loans held for sale in the secondary market 11,906,207 13,521,673 Allowance for credit losses (26,839,981) (27,925,801) —————— —————— Loans, net 1,593,078,683 1,590,401,885
Premises and equipment, net 37,570,985 40,502,991 Other real estate owned 20,111,669 24,777,686Interest receivable 5,603,918 5,924,081 Federal Home Loan Bank stock, at cost 7,050,900 7,050,900 Goodwill 14,313,393 14,313,393 Other intangible assets 1,022,972 1,517,560 Other assets 44,612,665 46,298,546 Assets held for sale, Salt Lick Deposit Bank 61,734,756 64,404,005 —————— —————— Total assets $ 2,175,446,603 $ 2,145,011,752 LIABILITIES AND SHAREHOLDERS’ EQUITYDeposits Non-interest bearing $ 412,619,586 $ 407,283,561 Interest bearing 1,402,364,545 1,390,295,714 —————— —————— Total deposits 1,814,984,131 1,797,579,275
Federal funds purchased and repurchase agreements 60,302,320 52,494,526 Federal Home Loan Bank advances 3,222,343 13,759,676 Subordinated debentures 38,742,000 38,742,000 Interest payable 549,671 687,968Other liabilities 13,016,614 11,165,803 Liabilities held for sale, Salt Lick Deposit Bank 64,321,610 63,676,073 —————— —————— Total liabilities 1,995,138,689 1,978,105,321 SHAREHOLDERS’ EQUITYCommon stock, $10 par value, 350,000 shares authorized, 347,922 shares issued 3,479,220 3,479,220 Additional paid-in capital 6,890,468 6,890,468 Retained earnings 173,400,292 160,519,646 Accumulated other comprehensive income (loss) (3,462,066) (3,982,903) —————— —————— Total shareholders’ equity 180,307,914 166,906,431 —————— —————— Total liabilities and shareholders’ equity $ 2,175,446,603 $ 2,145,011,752
13
CONSOLIDATED BALANCE SHEETS
December 31 2012 2011
See accompanying notes.
c o n s o l i d a t E d F i n a n c i a l s t a t E m E n t s F o r t H E y E a r s E n d E d d E c E m b E r 3 1 , 2 0 1 2 a n d 2 0 1 1

INTEREST AND DIVIDEND INCOMELoans, including fees $ 85,481,727 $ 92,558,906Securities: U.S. Treasury and government agencies 388,620 535,990 Obligations of states and political subdivisions 124,198 269,802 Mortgage-backed securities 657,656 555,918 Corporate debt bonds 213,090 212,500Federal funds sold 445,492 364,315Federal Home Loan Bank stock 353,522 338,216 ————— ————— 87,664,305 94,835,647
INTEREST ExPENSEDeposits 12,037,119 15,863,337Federal funds purchased and repurchase agreements 50,625 55,362Federal Home Loan Bank advances 454,046 494,771Subordinated debentures 2,649,311 2,616,021 ————— ————— 15,191,101 19,029,491
Net interest income 72,473,204 75,806,156 Provision for credit losses 12,178,741 16,301,304 ————— —————Net interest income after provision for credit losses 60,294,463 59,504,852
OTHER INCOMEService charges on deposit accounts 9,630,467 10,979,706 Mortgage loan sales and servicing, net 6,060,758 3,069,097 Credit card related fees 4,628,351 4,536,534 Trust fees 4,837,557 4,378,124 Net loss on sales and write-downs of other real estate (2,853,228) (2,812,082) Other fees and income 13,858,958 13,921,022 ————— ————— 36,162,863 34,072,401 OTHER ExPENSES Salaries 31,644,833 31,061,073 Employee benefits 6,539,725 6,913,979 Occupancy expense 17,208,767 16,989,991 Other expenses 28,238,382 28,403,713 ————— ————— 83,631,707 83,368,756 ————— —————
Income before income tax benefit 12,825,619 10,208,497Income tax benefit (55,027) (808,738) ————— ————— NET INCOME $ 12,880,646 $ 11,017,235Basic earnings per share $ 37.02 $ 31.67Weighted average number of common shares outstanding 347,922 347,922
14
CONSOLIDATED STATEMENTS OF INCOME
Years Ended December 31 2012 2011
See accompanying notes.
15
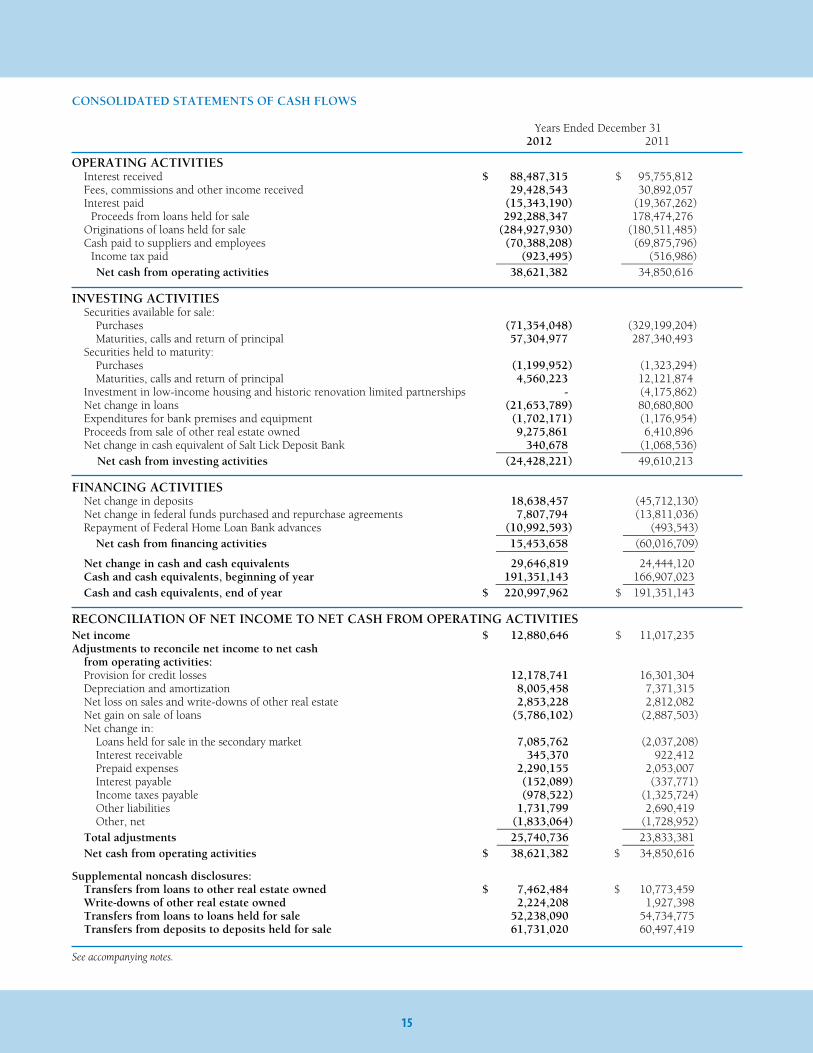
CONSOLIDATED STATEMENTS OF CASH FLOWS
OPERATING ACTIVITIES Interest received $ 88,487,315 $ 95,755,812 Fees, commissions and other income received 29,428,543 30,892,057 Interest paid (15,343,190) (19,367,262) Proceeds from loans held for sale 292,288,347 178,474,276 Originations of loans held for sale (284,927,930) (180,511,485) Cash paid to suppliers and employees (70,388,208) (69,875,796) Income tax paid (923,495) (516,986) —————— —————— Net cash from operating activities 38,621,382 34,850,616 INVESTING ACTIVITIES Securities available for sale: Purchases (71,354,048) (329,199,204) Maturities, calls and return of principal 57,304,977 287,340,493 Securities held to maturity: Purchases (1,199,952) (1,323,294) Maturities, calls and return of principal 4,560,223 12,121,874 Investment in low-income housing and historic renovation limited partnerships - (4,175,862) Net change in loans (21,653,789) 80,680,800 Expenditures for bank premises and equipment (1,702,171) (1,176,954) Proceeds from sale of other real estate owned 9,275,861 6,410,896 Net change in cash equivalent of Salt Lick Deposit Bank 340,678 (1,068,536) —————— —————— Net cash from investing activities (24,428,221) 49,610,213 FINANCING ACTIVITIES Net change in deposits 18,638,457 (45,712,130) Net change in federal funds purchased and repurchase agreements 7,807,794 (13,811,036) Repayment of Federal Home Loan Bank advances (10,992,593) (493,543) —————— —————— Net cash from financing activities 15,453,658 (60,016,709) —————— —————— Net change in cash and cash equivalents 29,646,819 24,444,120 Cash and cash equivalents, beginning of year 191,351,143 166,907,023 —————— —————— Cash and cash equivalents, end of year $ 220,997,962 $ 191,351,143
RECONCILIATION OF NET INCOME TO NET CASH FROM OPERATING ACTIVITIESNet income $ 12,880,646 $ 11,017,235 Adjustments to reconcile net income to net cash from operating activities: Provision for credit losses 12,178,741 16,301,304 Depreciation and amortization 8,005,458 7,371,315 Net loss on sales and write-downs of other real estate 2,853,228 2,812,082 Net gain on sale of loans (5,786,102) (2,887,503) Net change in: Loans held for sale in the secondary market 7,085,762 (2,037,208) Interest receivable 345,370 922,412 Prepaid expenses 2,290,155 2,053,007 Interest payable (152,089) (337,771) Income taxes payable (978,522) (1,325,724) Other liabilities 1,731,799 2,690,419 Other, net (1,833,064) (1,728,952) —————— —————— Total adjustments 25,740,736 23,833,381 —————— —————— Net cash from operating activities $ 38,621,382 $ 34,850,616
Supplemental noncash disclosures: Transfers from loans to other real estate owned $ 7,462,484 $ 10,773,459 Write-downs of other real estate owned 2,224,208 1,927,398 Transfers from loans to loans held for sale 52,238,090 54,734,775 Transfers from deposits to deposits held for sale 61,731,020 60,497,419
Years Ended December 312012 2011
See accompanying notes.

16
Accumulated Other Additional Comprehensive Common Paid-In Retained Income Stock Capital Earnings (Loss) Total –––––––––––––– –––––––––––––––––––––––––––––––––––––––––––––––––––––––––––Balances, January 1, 2011 $ 3,479,220 $ 6,890,468 $ 149,502,411 $ (3,628,443) $ 156,243,656
Comprehensive income: Net income - - 11,017,235 - 11,017,235 Other comprehensive loss - - - (354,460) (354,460) ————— ————— ——––——— –———— ——————Balances, December 31, 2011 3,479,220 6,890,468 160,519,646 (3,982,903) 166,906,431
Comprehensive income: Net income - - 12,880,646 - 12,880,646 Other comprehensive income - - - 520,837 520,837 ————— ————— —————— —–——— ——————Balances, December 31, 2012 $ 3,479,220 $ 6,890,468 $ 173,400,292 $ (3,462,066) $ 180,307,914
NOTES TO CONSOLIDATED FINANCIAL STATEMENTSYEARS ENDED DECEMBER 31, 2012 AND 2011
NOTE 1. SUMMARY OF SIGNIFICANT ACCOUNTING POLICIESBasis of Presentation and Nature of Operations: The consolidated financial statements include the accounts of Central Bancshares, Inc. (the “Company”), its wholly-owned Subsidiaries, Central Bank & Trust Co., Central Bank of Jefferson County, Inc., and Salt Lick Deposit Bank (the “Banks”), and Central Bank & Trust Co.’s wholly-owned Subsidiaries, Central Investment Center, Inc., Central Insurance Services, Inc., CB Investment Managers, LLC, Central Bank Title Agency, LLC, and CBT Real Estate Holdings, LLC. The Company merged the operations of Central Bank, FSB, into Central Bank & Trust Co. on January 18, 2011. On October 29, 2012, the Company agreed to sell Salt Lick Deposit Bank to a non-related third party financial institution. Salt Lick Deposit Bank’s assets and liabilities are presented as assets and liabilities held for sale on the consolidated balance sheets as of December 31, 2012 and 2011. The sale transaction closed on January 1, 2013. All significant intercompany balances and transactions have been eliminated in consolidation. The Banks grant commercial, consumer and residential loans to customers primarily located in Fayette, Boone, Kenton, Clark, Jessamine, Madison, Scott, Jefferson, Bath and surrounding counties in Kentucky. The Banks provide full banking services, including trust services. Although the Banks have diversified loan portfolios, a substantial portion of their debtors’ ability to honor their contracts is dependent upon the local economy. Substantially all loans are secured by specific items of collateral including business assets, consumer assets and real estate. Other financial instruments, which potentially represent concentrations of credit risk, include cash and cash equivalents held in other financial institutions. Central Investment Center, Inc. offers non-deposit investment products, including mutual funds, annuities, and certain debt and equity securities. Central Insurance Services, Inc. is a licensed agent for life, health, title, and property and casualty insurance. CBT Real Estate Holdings, LLC holds and disposes of real estate acquired in settlement of loans.
See accompanying notes.
CONSOLIDATED STATEMENTS OF CHANGES IN SHAREHOLDERS’ EQUITY
CONSOLIDATED STATEMENTS OF COMPREHENSIVE INCOME
Years Ended December 31, 2012 and 2011
Net income $ 12,880,646 $ 11,017,235 Other comprehensive income (loss): Unrealized gains/losses on securities: Unrealized holding gain (loss) arising during the period 893,380 (745,703) Tax effect (312,683) 260,996 —————— —————— Net of tax 580,697 (484,707)
Defined benefit pension plans: Net gain (loss) arising during the period (92,092) 200,380 Tax effect 32,232 (70,133) —————— —————— Net of tax (59,860) 130,247
Total other comprehensive income (loss) 520,837 (354,460) —————— ——————Comprehensive income $ 13,401,483 $ 10,662,775
Years Ended December 312012 2011

17
Subsequent Events: The Company has evaluated subsequent events for recognition and disclosure through March 1, 2013, which is the date the financial statements were available to be issued.
Estimates in the Financial Statements: The preparation of financial statements in conformity with accounting principles generally accepted in the United States of America requires management to make estimates and assumptions that affect the reported amounts of assets and liabilities, disclosure of contingent assets and liabilities at the date of the financial statements and the reported amounts of revenues and expenses during the reporting period. Actual results could differ from those estimates. The allowance for credit losses, other real estate valuation allowance, fair values of financial instruments, impairment of securities, mortgage servicing rights, pension obligation and contingent liabilities are particularly subject to change.
Cash Flows: Cash and cash equivalents include cash on hand, amounts due from financial institutions, securities purchased under resell agreements, money market investments and federal funds sold with maturities under 90 days. Net cash flows are reported for customer loan and deposit transactions, interest bearing deposits in other financial institutions, and federal funds purchased and repurchase agreements.
Securities: The Banks classify their security portfolios into two categories: available for sale and held to maturity. Securities are classified as available for sale when they might be sold before maturity. Securities are classified as held to maturity when management has the positive intent and ability to hold them to maturity. The Banks have no trading securities. Securities available for sale are carried at fair value, with unrealized holding gains and losses reported in other comprehensive income, net of tax. Securities held to maturity are stated at amortized cost. Interest income includes amortization of purchase premium or discount. Premiums and discounts on securities are amortized on the level-yield method without anticipating prepayments except for mortgage-backed securities where prepayments are anticipated. Gains and losses on dispositions are recorded on the trade date and based on the net proceeds and the adjusted carrying amount of the securities sold, using the specific identifica tion method. Management evaluates securities for other-than-temporary impairment (“OTTI”) at least on a quarterly basis, and more frequently when economic or market conditions warrant such an evaluation. For securities in an unrealized loss position, management considers the extent and duration of the unrealized loss, and the financial condition and near-term prospects of the issuer. Management also assesses whether it intends to sell, or it is more likely than not that it will be required to sell, a security in an unrealized loss position before recovery of its amortized cost basis. If either of the criteria regarding intent or requirement to sell is met, the entire difference between amortized cost and fair value is recognized as impairment through earnings. For debt securities that do not meet the aforementioned criteria, the amount of impairment is split into two components as follows: 1) OTTI related to credit loss, which must be recognized in the income statement and 2) OTTI related to other factors, which is recognized in other comprehensive income. The credit loss is defined as the difference between the present value of the cash flows expected to be collected and the amortized cost basis.
Loans: Loans that management has the intent and ability to hold for the foreseeable future or until maturity or payoff are reported at the principal balance outstanding, net of deferred loan fees and costs, and an allowance for credit losses. Loan origination fees, net of certain direct origination costs, are deferred and the net amount is amortized as a yield adjustment over the life of the related loans. Interest income is accrued on the principal balance. Classes of commercial and real estate loans are placed on nonaccrual, with interest income discontinued, at the time the loan is 90 days delinquent unless the loan is well-secured and in process of collection. Classes of consumer loans may be placed on nonaccrual if sufficient collateral exists, but are typically charged off no later than 120 days past due. All interest accrued but not received on loans placed on nonaccrual is reversed against interest income. Nonaccrual loans and loans past due 90 days still on accrual include both smaller balance homogeneous loans that are collectively evaluated for impairment and individually classified impaired loans. For all loan classes, payments received on nonaccrual loans are applied to principal only using the cost recovery method if the Company estimates that collection of all principal is not reasonably assured. If all principal is reasonably assured, payments on nonaccrual loans may be applied to interest income on the cash basis. Loans of all classes are returned to accrual status when all the principal and interest amounts contractually due are brought current and future payments are reasonably assured. For all loan classes, past due status is based on the contractual terms of the loan.
Allowance for Credit Losses: The allowance for credit losses is a valuation allowance for probable incurred credit losses. Loan losses are charged against the allowance when management believes the uncollectibility of a loan balance is confirmed. Subsequent recoveries, if any, are credited to the allowance. Management estimates the allowance balance required using past loan loss experience, the nature and volume of the portfolio, information about specific borrower situations and estimated collateral values, economic conditions, and other factors. Allocations of the allowance may be made for specific loans, but the entire allowance is available for any loan that, in management’s judgment, should be charged off. The allowance consists of specific and general components. The specific component relates to loans that are individually classified as impaired. Loans of all classes are considered impaired when, based on current information and events, it is probable that the Company will be unable to collect all amounts due according to the contractual terms of the loan agreement. Loans for which the terms have been modified resulting in a concession, and for which the borrower is experiencing financial difficulties, are considered troubled debt restructurings and classified as impaired.
18
Factors considered by management in determining impairment include payment status, collateral value, and the probability of collecting scheduled principal and interest payments when due. Loans that experience insignificant payment delays and payment shortfalls generally are not classified as impaired. Management determines the significance of payment delays and payment shortfalls on a case-by-case basis, taking into consideration all of the circumstances surrounding the loan and the borrower, including the length of the delay, the reasons for the delay, the borrower’s prior payment record, and the amount of the shortfall in relation to the principal and interest owed. Nonaccrual loans of certain classes are individually evaluated for impairment. If a loan is impaired, a portion of the allowance is allocated so that the loan is reported, net, at the present value of estimated future cash flows using the loan’s existing rate or at the fair value of collateral if repayment is expected solely from the collateral. Interest income on impaired loans is recognized on the cash basis unless the loan is a troubled debt restructured loan performing under its modified terms. Large groups of smaller balance homogeneous loans, such as consumer loans, are collectively evaluated for impairment, and accordingly, they are not separately identified for impairment disclosures. If such loans are part of a borrowing relationship in which other types of loans have been individually evaluated for impairment, they also are individually evaluated. Troubled debt restructurings are separately identified for impairment disclosures and are measured at the present value of estimated future cash flows using the loan’s effective rate at inception. If a troubled debt restructuring is considered to be a collateral dependent loan, the loan is reported, net, at the fair value of the collateral. For troubled debt restructurings that subsequently default, the Company determines the amount of reserve in accordance with the accounting policy for the allowance for credit losses. The general component covers non-impaired loans and is based on historical loss experience adjusted for current factors. The historical loss experience is determined by portfolio segment and is based on the actual loss history experienced by the Company over the most recent three years. This actual loss experience is supplemented with other economic factors based on the risks present for each portfolio segment. These economic factors include consideration of the following: levels of and trends in delinquencies and impaired loans; levels of and trends in charge-offs and recoveries; trends in volume and terms of loans; aggregate indebtedness of significant borrowing relationships; effects of any changes in risk selection and underwriting standards; other changes in lending policies, procedures, and practices; experience, ability, and depth of lending management and other relevant staff; local economic trends and conditions; industry conditions; and effects of changes in credit concentrations. The following portfolio segments and their associated risks have been identified:
• Commercial loans are dependent on the strength of the industries of the related borrowers and the success of their businesses. Commercial loans are advanced for equipment purchases or to provide working capital or meet other financing needs of business enterprises. These loans may be secured by accounts receivable, inventory, equipment or other business assets. Financial information is obtained from the borrowers and guarantors to evaluate ability to repay the loans.• Commercial real estate loans are dependent on the industries tied to these loans as well as the local commercial real estate market. Commercial real estate loans include completed projects as well as construction loans. The loans are secured by the real estate, and appraisals are obtained to support the loan amount. Financial information is obtained from the borrower(s) and guarantor(s) and/or an evaluation of the project’s cash flows is performed to evaluate the borrower’s ability to repay the loan. • Residential real estate loans are affected by the local residential real estate market and the local economy. The Bank evaluates the borrower’s repayment ability through a review of financial information obtained from the borrower. Appraisals or evaluations are obtained to support the loan amount.• Consumer loans, including installment loans and credit card receivables, are dependent on local economies. Consumer loans are generally secured by consumer assets, but may be unsecured. The Bank evaluates the borrower’s repayment ability through a review of financial information obtained from the borrower.
Mortgage Banking Activities: Mortgage loans originated and intended for sale in the secondary market are classified as held for sale and carried at the lower of aggregate cost or fair value as determined by outstanding commitments from investors. Gains on sales generated from mortgage banking activities are based on the difference between the selling price and the carrying value of the related loan sold. The Company enters into commitments to originate certain mortgage loans whereby the interest rate on the loans is determined prior to funding (rate lock commitments). Rate lock commitments on mortgage loans that are intended to be sold are considered to be derivatives. The period of time between issuance of a loan commitment, loan closing and the sale of the loan generally ranges from 30 to 90 days. The Company protects itself from changes in interest rates through the use of best efforts forward delivery contracts, whereby the Company commits to sell a loan at the time the borrower commits to an interest rate with the intent that the buyer has assumed interest rate risk on the loan. If the underlying loan does not close, there is no obligation on the Company’s part to deliver the loan to the investor. As a result, the Company is not exposed to losses nor will it realize significant gains related to its rate lock commitments due to changes in interest rates. The correlation between the rate lock commitments and the best efforts contracts is very high due to their similarity. Because of this high correlation, no gain or loss occurs on the rate lock commitments. As the Company sells loans servicing released and retained, servicing rights are recognized as assets for the allocated value of retained servicing rights on loans sold. Servicing rights are initially recorded at fair value based on market prices for comparable mortgage servicing contracts. Servicing rights are expensed in proportion to, and over the period of, estimated net servicing revenues. Impairment is evaluated based on the fair value of the rights, using groupings of the underlying loans as to interest rates. Any impairment of a grouping is reported as a valuation allowance.

19
Servicing fee income is recorded for fees earned for servicing loans. The fees are based on a contractual percentage of the outstanding principal or a fixed amount per loan and are recorded as income when earned. The amortization of mortgage servicing rights is netted against loan servicing fee income. Servicing fee income, gains on sales of mortgage loans held for sale and amortization of mortgage servicing rights are reported on the income statement as mortgage loan sales and servicing, net.
Premises and Equipment: Land is carried at cost. Premises are stated at cost less accumulated depreciation computed on the straight-line method over the estimated useful lives of the assets. Furniture, fixtures and equipment are depreciated using an accelerated method. Leasehold improvements are amortized on the straight-line method over the shorter of the estimated useful lives of the improvements or the terms of the related leases.
Income Taxes: Deferred income tax assets and liabilities are computed annually for differences between the financial statement and tax bases of assets and liabilities that will result in taxable or deductible amounts in the future based on enacted tax laws and rates applicable to the periods in which the differences are expected to affect taxable income. A valuation allowance, if needed, reduces deferred tax assets to the amount expected to be realized. Income tax expense is the tax payable or refundable for the period plus or minus the change during the period in deferred tax assets and liabilities. The Company recognizes a tax benefit only if it is more likely than not that the tax position would be sustained in a tax examination, with a tax examination being presumed to occur. The amount recognized is the largest amount of tax benefit that is greater than 50 percent likely of being realized on examination. For tax positions not meeting the more-likely-than-not test, no tax benefit is recorded. The Company recognizes interest and/or penalties related to income tax matters in income tax expense.
Federal Home Loan Bank (FHLB) Stock: The Banks are members of the FHLB system. Members are required to own a certain amount of stock based on the level of borrowings and other factors, and may invest in additional amounts. FHLB stock is carried at cost, classified as a restricted security, and periodically evaluated for impairment based on ultimate recovery of par value. Both cash and stock dividends are reported as income.
Transfers of Financial Assets: Transfers of financial assets are accounted for as sales when control over the assets has been relinquished. Control over transferred assets is deemed to be surrendered when the assets have been isolated from the Company, the transferee obtains the right (free of conditions that constrain it from taking advantage of that right) to pledge or exchange the transferred assets, and the Company does not maintain effective control over the transferred assets through an agreement to repurchase them before their maturity.
Foreclosed Assets: Assets acquired through or instead of loan foreclosure are initially recorded at fair value, less selling costs, when acquired, establishing a new cost basis. If fair value declines subsequent to acquisition, a valuation allowance is recorded through expense. These assets are subsequently accounted for at lower of cost or fair value less estimated costs to sell. Operating costs incurred after acquisition are expensed.
Goodwill and Other Intangible Assets: Goodwill results from business acquisitions and represents the excess of the purchase price over the fair value of acquired tangible assets and liabilities and identifiable intangible assets. Goodwill and other intangible assets acquired in a purchase business combination and determined to have an indefinite useful life are not amortized, but tested for impairment at least annually or more frequently if events and circumstances exist that indicate a goodwill impairment test should be performed. The Company has selected December 31 as the date to perform the annual impairment test. Intangible assets with definite useful lives are amortized over their estimated useful lives to their estimated residual values. Goodwill is the only intangible asset with an indefinite life on the Company’s balance sheet. Other intangible assets consist of customer relationship intangibles arising from acquisitions. They are initially measured at fair value and then are amortized on the straight-line method over their estimated useful lives, which is between 8 and 10 years.
Trust Department: Revenues from trust department services are recorded on the cash basis, which approximates the accrual basis, in accordance with customary banking practice. Securities and other properties, except cash deposits, held by the trust department in a fiduciary or agency capacity are not included in the consolidated financial statements since such items are not assets of the Company.
Investment in Limited Partnerships: Central Bank & Trust Co. is a limited equity partner in 16 low-income housing projects and two historic renovation projects. The investments are accounted for using the equity method and are included in other assets.
Benefit Plans: Pension expense is the net of interest cost, return on plan assets, and amortization of gains and losses not immediately recognized. Employee stock ownership and 401(k) plan expense is the amount contributed determined by Board decision. Deferred compensation plan expense is allocated over years of service. All ESOP shares are allocated to participants as of the end of each fiscal year. Compensation expense is based on the price paid for the shares acquired by the plan during the year. Since all ESOP shares are allocated to participants, all dividends reduce retained earnings.

20
NOTE 2. SECURITIES The fair value of securities available for sale and the related gross unrealized gains and losses recognized in accumulated other comprehensive income (loss) are as follows: Gross Gross Amortized Unrealized Unrealized Fair Cost Gains Losses Value –––––––––––––––––––––––––––––––––––––––––––––––––––––––––––––––2012 U.S. government agency securities $ 82,458,382 $ 111,915 $ (45,009) $ 82,525,288 Obligations of states and political subdivisions 1,229,830 30,116 (2,899) 1,257,047 Agency mortgage-backed securities: Residential 79,971,660 608,253 - 80,579,913 Corporate bond 5,000,000 - (111,500) 4,888,500 ————— ————— —–——— ————— Total 168,659,872 750,284 (159,408) 169,250,748 Less: available for sale securities, held for sale (2,721,686) (4,206) (2,899) (2,722,993) ————— ————— —–——— ————— $ 165,938,186 $ 746,078 $ (156,509) $ 166,527,755
2011 U.S. government agency securities $ 79,565,229 $ 87,697 $ (19,183) $ 79,633,743 Obligations of states and political subdivisions 1,297,970 42,923 (8,390) 1,332,503 Agency mortgage-backed securities: Residential 69,094,249 520,992 (62,565) 69,552,676 Corporate bond 5,000,000 - (862,500) 4,137,500 ————— ————— —–——— ————— Total 154,957,448 651,612 (952,638) 154,656,422 Less: available for sale securities, held for sale (2,588,140) (8,262) (8,403) (2,587,999) ————— ————— —–——— ————— $ 152,369,308 $ 643,350 $ (944,235) $ 152,068,423
Loan Commitments and Related Financial Instruments: Financial instruments include off-balance-sheet credit instruments, such as commitments to make loans and commercial letters of credit, issued to meet customer financing needs. The face amount for these items represents the exposure to loss, before considering customer collateral or ability to repay. Such financial instruments are recorded when they are funded.
Fair Value of Financial Instruments: Fair values of financial instruments, as more fully disclosed in Note 10, are estimated using relevant market information and other assumptions. Fair value estimates involve uncertainties and matters of significant judgment regarding interest rates, credit risk, prepayments, and other factors, especially in the absence of broad markets for particular items. Changes in assumptions or in market conditions could significantly affect the estimates.
Earnings per Share: Basic earnings per share is net income divided by the weighted average number of shares outstanding during the period. The Company has no instruments outstanding which are potentially dilutive.
Comprehensive Income (Loss): Comprehensive income (loss) consists of net income and other comprehensive income (loss). Other comprehensive income (loss) includes unrealized gains and losses on securities available for sale, net of related income tax, and changes in the funded status of the defined benefit pension plan, net of related income tax. Accumulated other comprehensive income (loss) is recognized as a separate component of equity.
Loss Contingencies: Loss contingencies, including claims and legal actions arising in the ordinary course of business, are recorded as liabilities when the likelihood of loss is probable and an amount or range of loss can be reasonably estimated. Management does not believe that there now are such matters that will have a material effect on the consolidated financial statements.
Dividend Restriction: Banking regulations require maintaining certain capital levels and may limit the dividends paid by the Banks to the holding company or by the holding company to shareholders.
Restrictions on Cash: Included in cash and due from financial institutions are certain deposits that are held at the Federal Reserve or maintained in vault cash in accordance with average balance requirements specified by the Federal Reserve Board of Governors. The average balance requirement was $27,159,000 and $28,047,000 at December 31, 2012 and 2011. These funds earn interest at an interest rate determined by the Federal Reserve.
Reclassifications: Some items in the prior year financial statements were reclassified to conform to the current year presentation. Reclassifications had no effect on prior year net income or shareholders’ equity.
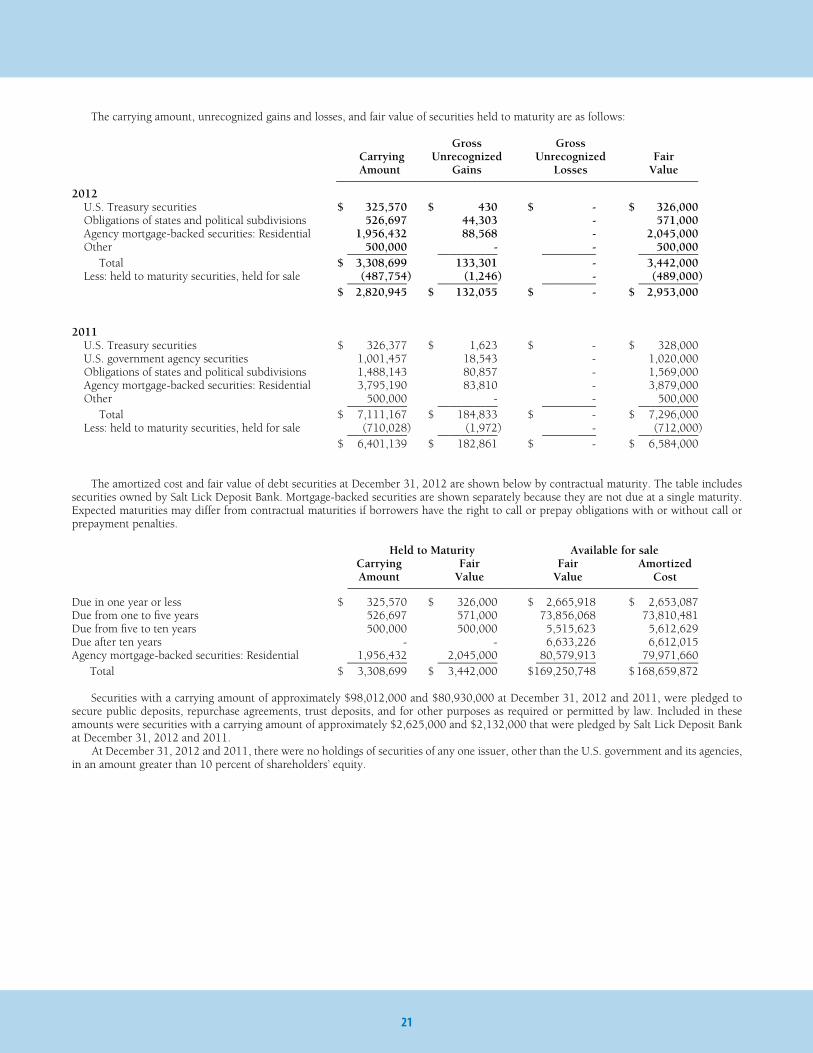
21
The amortized cost and fair value of debt securities at December 31, 2012 are shown below by contractual maturity. The table includes securities owned by Salt Lick Deposit Bank. Mortgage-backed securities are shown separately because they are not due at a single maturity. Expected maturities may differ from contractual maturities if borrowers have the right to call or prepay obligations with or without call or prepayment penalties.
Held to Maturity Available for sale Carrying Fair Fair Amortized Amount Value Value Cost –––––––––––––––––––––––––––––––––––––––––––––––––––––––––––––Due in one year or less $ 325,570 $ 326,000 $ 2,665,918 $ 2,653,087Due from one to five years 526,697 571,000 73,856,068 73,810,481Due from five to ten years 500,000 500,000 5,515,623 5,612,629Due after ten years - - 6,633,226 6,612,015Agency mortgage-backed securities: Residential 1,956,432 2,045,000 80,579,913 79,971,660 ————— ————— ————— ————— Total $ 3,308,699 $ 3,442,000 $ 169,250,748 $ 168,659,872
Securities with a carrying amount of approximately $98,012,000 and $80,930,000 at December 31, 2012 and 2011, were pledged to secure public deposits, repurchase agreements, trust deposits, and for other purposes as required or permitted by law. Included in these amounts were securities with a carrying amount of approximately $2,625,000 and $2,132,000 that were pledged by Salt Lick Deposit Bank at December 31, 2012 and 2011. At December 31, 2012 and 2011, there were no holdings of securities of any one issuer, other than the U.S. government and its agencies, in an amount greater than 10 percent of shareholders’ equity.
The carrying amount, unrecognized gains and losses, and fair value of securities held to maturity are as follows:
Gross Gross Carrying Unrecognized Unrecognized Fair Amount Gains Losses Value –––––––––––––––––––––––––––––––––––––––––––––––––––––––––––––––2012 U.S. Treasury securities $ 325,570 $ 430 $ - $ 326,000 Obligations of states and political subdivisions 526,697 44,303 - 571,000 Agency mortgage-backed securities: Residential 1,956,432 88,568 - 2,045,000 Other 500,000 - - 500,000 ————— ————— —–——— ————— Total $ 3,308,699 133,301 - 3,442,000 Less: held to maturity securities, held for sale (487,754) (1,246) - (489,000) ————— ————— —–——— ————— $ 2,820,945 $ 132,055 $ - $ 2,953,000
2011 U.S. Treasury securities $ 326,377 $ 1,623 $ - $ 328,000 U.S. government agency securities 1,001,457 18,543 - 1,020,000 Obligations of states and political subdivisions 1,488,143 80,857 - 1,569,000 Agency mortgage-backed securities: Residential 3,795,190 83,810 - 3,879,000 Other 500,000 - - 500,000 ————— ————— —–——— ————— Total $ 7,111,167 $ 184,833 $ - $ 7,296,000 Less: held to maturity securities, held for sale (710,028) (1,972) - (712,000) ————— ————— —–——— ————— $ 6,401,139 $ 182,861 $ - $ 6,584,000
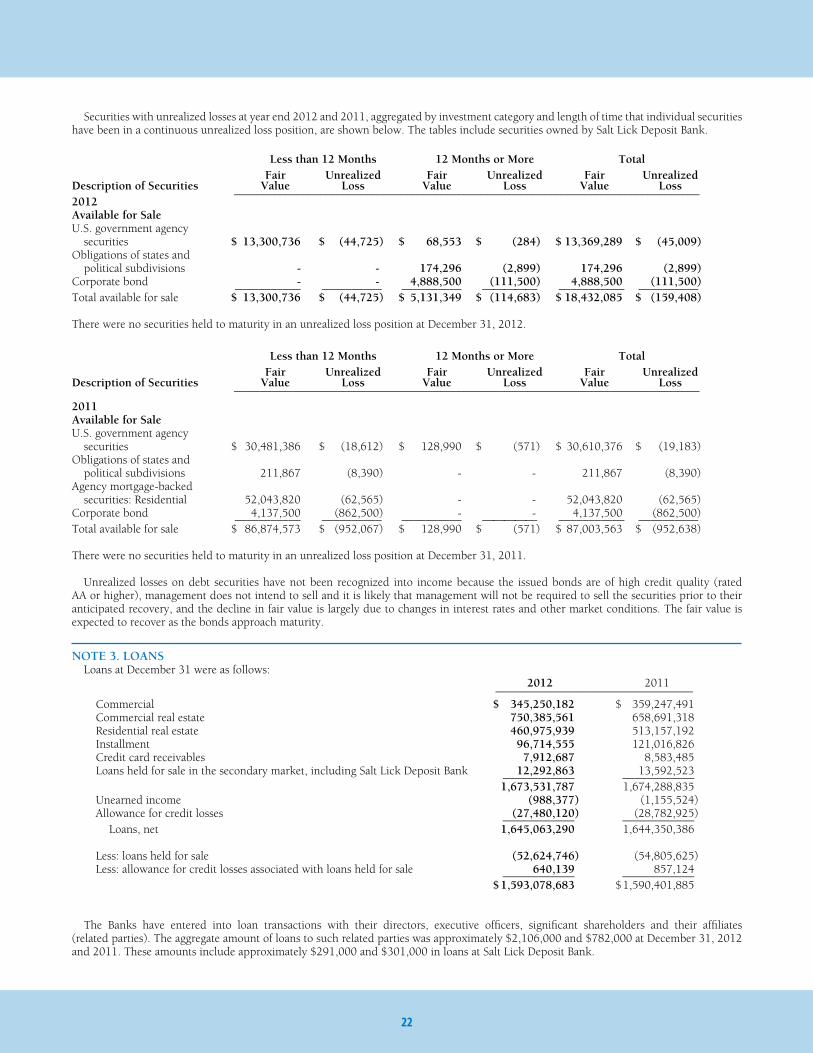
22
Securities with unrealized losses at year end 2012 and 2011, aggregated by investment category and length of time that individual securities have been in a continuous unrealized loss position, are shown below. The tables include securities owned by Salt Lick Deposit Bank.
Less than 12 Months 12 Months or More Total Fair Unrealized Fair Unrealized Fair UnrealizedDescription of Securities Value Loss Value Loss Value Loss –––––––––––––––––––––––––––––––––––––––––––––––––––––––––––––––––––––––––––––––––2012Available for SaleU.S. government agency securities $ 13,300,736 $ (44,725) $ 68,553 $ (284) $ 13,369,289 $ (45,009)Obligations of states and political subdivisions - - 174,296 (2,899) 174,296 (2,899)Corporate bond - - 4,888,500 (111,500) 4,888,500 (111,500) ———–––— —–––——– ————— ————— —–––––—— —————Total available for sale $ 13,300,736 $ (44,725) $ 5,131,349 $ (114,683) $ 18,432,085 $ (159,408)
There were no securities held to maturity in an unrealized loss position at December 31, 2012.
Less than 12 Months 12 Months or More Total Fair Unrealized Fair Unrealized Fair UnrealizedDescription of Securities Value Loss Value Loss Value Loss –––––––––––––––––––––––––––––––––––––––––––––––––––––––––––––––––––––––––––––––––2011Available for SaleU.S. government agency securities $ 30,481,386 $ (18,612) $ 128,990 $ (571) $ 30,610,376 $ (19,183)Obligations of states and political subdivisions 211,867 (8,390) - - 211,867 (8,390)Agency mortgage-backed securities: Residential 52,043,820 (62,565) - - 52,043,820 (62,565)Corporate bond 4,137,500 (862,500) - - 4,137,500 (862,500) ———–––— —–––——– ————— ————— —–––––—— —————Total available for sale $ 86,874,573 $ (952,067) $ 128,990 $ (571) $ 87,003,563 $ (952,638)
There were no securities held to maturity in an unrealized loss position at December 31, 2011.
Unrealized losses on debt securities have not been recognized into income because the issued bonds are of high credit quality (rated AA or higher), management does not intend to sell and it is likely that management will not be required to sell the securities prior to their anticipated recovery, and the decline in fair value is largely due to changes in interest rates and other market conditions. The fair value is expected to recover as the bonds approach maturity.
NOTE 3. LOANS Loans at December 31 were as follows: 2012 2011 —————–——————————— Commercial $ 345,250,182 $ 359,247,491 Commercial real estate 750,385,561 658,691,318 Residential real estate 460,975,939 513,157,192 Installment 96,714,555 121,016,826 Credit card receivables 7,912,687 8,583,485 Loans held for sale in the secondary market, including Salt Lick Deposit Bank 12,292,863 13,592,523 —————— —————— 1,673,531,787 1,674,288,835 Unearned income (988,377) (1,155,524) Allowance for credit losses (27,480,120) (28,782,925) —————— —————— Loans, net 1,645,063,290 1,644,350,386 Less: loans held for sale (52,624,746) (54,805,625) Less: allowance for credit losses associated with loans held for sale 640,139 857,124 —————— —————— $ 1,593,078,683 $ 1,590,401,885 The Banks have entered into loan transactions with their directors, executive officers, significant shareholders and their affiliates (related parties). The aggregate amount of loans to such related parties was approximately $2,106,000 and $782,000 at December 31, 2012 and 2011. These amounts include approximately $291,000 and $301,000 in loans at Salt Lick Deposit Bank.

23
The following table presents the activity in the allowance for credit losses by segment of loans for the years ended December 31, 2012 and 2011:
Commercial Residential Real Real Credit Card Commercial Estate Estate Installment Receivables Unallocated Total ––––––––––––––––––––––––––––––––––––––––––––––––––––––––––––––––––––––––––––––––––––––––––––––––––––2012Allowance for credit losses: Beginning balance $ 6,102,247 $ 8,995,142 $ 7,517,186 $ 2,961,504 $ 320,343 $ 2,886,503 $ 28,782,925 Provision for credit losses 6,130,486 6,660,335 (2,392,291) 376,185 389,714 1,014,312 12,178,741 Loans charged off (6,498,771) (3,066,646) (2,456,384) (2,706,762) (255,345) - (14,983,908) Recoveries 69,139 97,593 272,651 1,014,484 48,495 - 1,502,362 ———––––— ———––––— ———––––— ———––––— ———––––— ———––––— ———––––— Total ending allowance balance 5,803,101 12,686,424 2,941,162 1,645,411 503,207 3,900,815 27,480,120
Less: allowance for credit losses associated with loans held for sale (121,588) (264,403) (213,783) (40,365) - - (640,139) ———––––— ———––––— ———––––— ———––––— ———––––— ———––––— ———––––— $ 5,681,513 $ 12,422,021 $ 2,727,379 $ 1,605,046 $ 503,207 $ 3,900,815 $ 26,839,981
2011Allowance for credit losses: Beginning balance $ 2,810,473 $ 6,730,769 $ 6,919,254 $ 4,011,371 $ 343,634 $ 1,987,474 $ 22,802,975 Provision for credit losses 4,283,798 5,640,342 3,897,437 1,169,030 411,668 899,029 16,301,304 Loans charged off (1,110,928) (3,718,555) (3,451,354) (3,001,622) (517,650) - (11,800,109) Recoveries 118,904 342,586 151,849 782,725 82,691 - 1,478,755 ———––––— ———––––— ———––––— ———––––— ———––––— ———––––— ———––––— Total ending allowance balance 6,102,247 8,995,142 7,517,186 2,961,504 320,343 2,886,503 28,782,925
Less: allowance for credit losses associated with loans held for sale (197,958) (367,637) (217,261) (50,636) - (23,632) (857,124) ———––––— ———––––— ———––––— ———––––— ———––––— ———––––— ———––––— $ 5,904,289 $ 8,627,505 $ 7,299,925 $ 2,910,868 $ 320,343 $ 2,862,871 $ 27,925,801
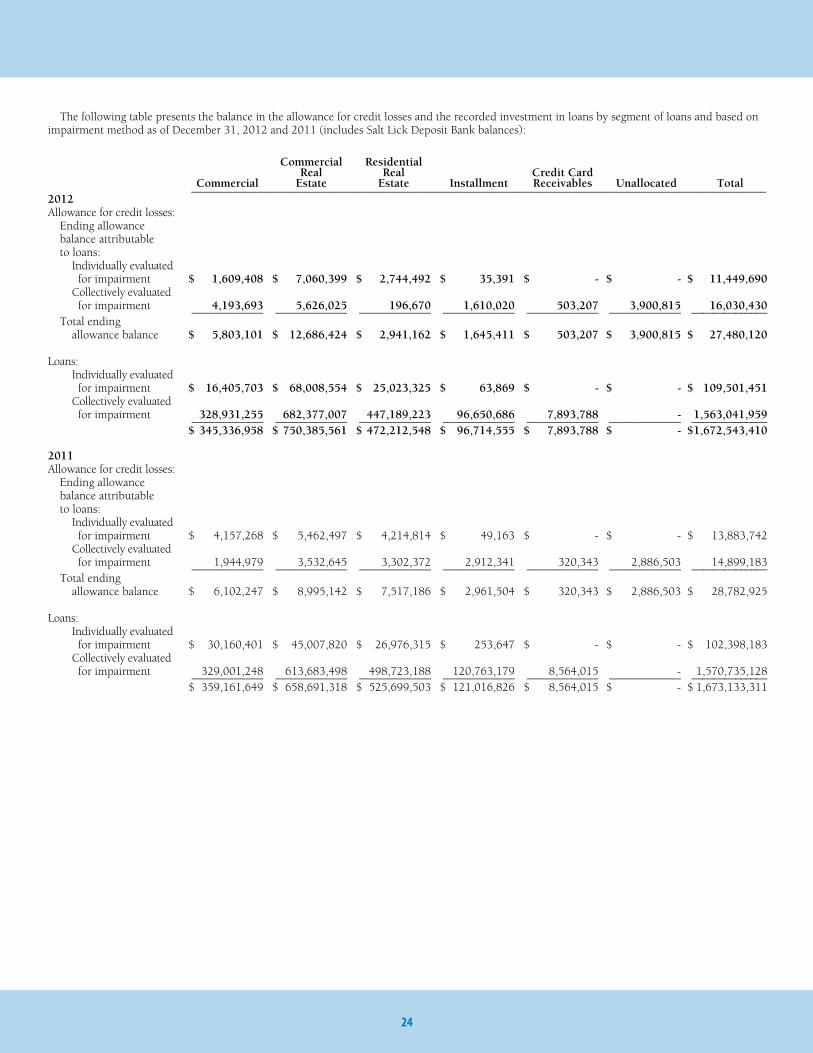
24
The following table presents the balance in the allowance for credit losses and the recorded investment in loans by segment of loans and based on impairment method as of December 31, 2012 and 2011 (includes Salt Lick Deposit Bank balances):
Commercial Residential Real Real Credit Card Commercial Estate Estate Installment Receivables Unallocated Total ––––––––––––––––––––––––––––––––––––––––––––––––––––––––––––––––––––––––––––––––––––––––––––––––––––2012Allowance for credit losses: Ending allowance balance attributable to loans: Individually evaluated for impairment $ 1,609,408 $ 7,060,399 $ 2,744,492 $ 35,391 $ - $ - $ 11,449,690 Collectively evaluated for impairment 4,193,693 5,626,025 196,670 1,610,020 503,207 3,900,815 16,030,430 ———––––— ———––––— ———––––— ———––––— ———––––— ———––––— ————––––— Total ending allowance balance $ 5,803,101 $ 12,686,424 $ 2,941,162 $ 1,645,411 $ 503,207 $ 3,900,815 $ 27,480,120
Loans: Individually evaluated for impairment $ 16,405,703 $ 68,008,554 $ 25,023,325 $ 63,869 $ - $ - $ 109,501,451 Collectively evaluated for impairment 328,931,255 682,377,007 447,189,223 96,650,686 7,893,788 - 1,563,041,959 ———––––— ———––––— ———––––— ———––––— ———––––— ———––––— ————––––— $ 345,336,958 $ 750,385,561 $ 472,212,548 $ 96,714,555 $ 7,893,788 $ - $ 1,672,543,410
2011Allowance for credit losses: Ending allowance balance attributable to loans: Individually evaluated for impairment $ 4,157,268 $ 5,462,497 $ 4,214,814 $ 49,163 $ - $ - $ 13,883,742 Collectively evaluated for impairment 1,944,979 3,532,645 3,302,372 2,912,341 320,343 2,886,503 14,899,183 ———––––— ———––––— ———––––— ———––––— ———––––— ———––––— ————––––— Total ending allowance balance $ 6,102,247 $ 8,995,142 $ 7,517,186 $ 2,961,504 $ 320,343 $ 2,886,503 $ 28,782,925
Loans: Individually evaluated for impairment $ 30,160,401 $ 45,007,820 $ 26,976,315 $ 253,647 $ - $ - $ 102,398,183 Collectively evaluated for impairment 329,001,248 613,683,498 498,723,188 120,763,179 8,564,015 - 1,570,735,128 ———––––— ———––––— ———––––— ———––––— ———––––— ———––––— ————––––— $ 359,161,649 $ 658,691,318 $ 525,699,503 $ 121,016,826 $ 8,564,015 $ - $ 1,673,133,311

25
The following table presents information related to impaired loans by segment of loans as of and for the years ended December 31, 2012 and 2011 (includes information for Salt Lick Deposit Bank):
Unpaid Allowance for Average Interest Cash Basis Principal Recorded Credit Losses Recorded Income Interest Balance Investment Allocated Investment Recognized Recognized –––––––––––––––––––––––––––––––––––––––––––––––––––––––––––––––––––––––––––––––––December 31, 2012With no related allowance recorded: Commercial $ 14,316,801 $ 12,376,857 $ - $ 14,096,730 $ 709,891 $ 709,891 Commercial real estate 50,047,210 48,560,322 - 47,231,457 1,533,205 1,533,205 Residential real estate 17,927,305 15,945,224 - 18,556,515 370,313 370,313 Installment 323,242 20,534 - 356,406 1,227 1,227 ———–––— —–––——– ————— ——--——-— —–––––—— ————— Subtotal 82,614,558 76,902,937 - 80,241,108 2,614,636 2,614,636
With an allowance recorded: Commercial 8,729,409 4,028,846 1,609,408 6,755,979 28,569 28,569 Commercial real estate 21,028,727 19,448,232 7,060,399 18,451,911 166,725 166,725 Residential real estate 9,146,664 9,078,101 2,744,492 7,725,455 284,613 284,613 Installment 43,335 43,335 35,391 46,556 4,227 4,227 ———–––— —–––——– ————— ——--——-— —–––––—— ————— Subtotal 38,948,135 32,598,514 11,449,690 32,979,901 484,134 484,134 ———–––— —–––——– ————— ——--——-— —–––––—— ————— Total $ 121,562,693 $ 109,501,451 $ 11,449,690 $ 113,221,009 $ 3,098,770 $ 3,098,770
December 31, 2011With no related allowance recorded: Commercial $ 22,762,646 $ 20,373,310 $ - $ 20,100,583 $ 905,837 $ 905,837 Commercial real estate 29,424,716 27,172,659 - 24,918,947 868,260 868,260 Residential real estate 19,282,443 18,930,816 - 19,673,454 677,634 677,634 Installment 498,939 160,660 - 174,878 2,401 2,401 ———–––— —–––——– ————— ——--——-— —–––––—— ————— Subtotal 71,968,744 66,637,445 - 64,867,862 2,454,132 2,454,132
With an allowance recorded: Commercial 9,882,218 9,787,091 4,157,268 2,863,821 111,511 111,511 Commercial real estate 18,666,310 17,835,161 5,462,497 15,231,993 301,925 301,925 Residential real estate 8,230,554 8,045,499 4,214,814 9,273,711 242,782 242,782 Installment 331,961 92,987 49,163 106,322 156 156 ———–––— —–––——– ————— ——--——-— —–––––—— ————— Subtotal 37,111,043 35,760,738 13,883,742 27,475,847 656,374 656,374 ———–––— —–––——– ————— ——--——-— —–––––—— ————— Total $ 109,079,787 $ 102,398,183 $ 13,883,742 $ 92,343,709 $ 3,110,506 $ 3,110,506
The recorded investment in loans excludes accrued interest receivable and loan origination fees, net due to immateriality. For purposes of this disclosure, the unpaid principal balance is not reduced for net charge-offs.
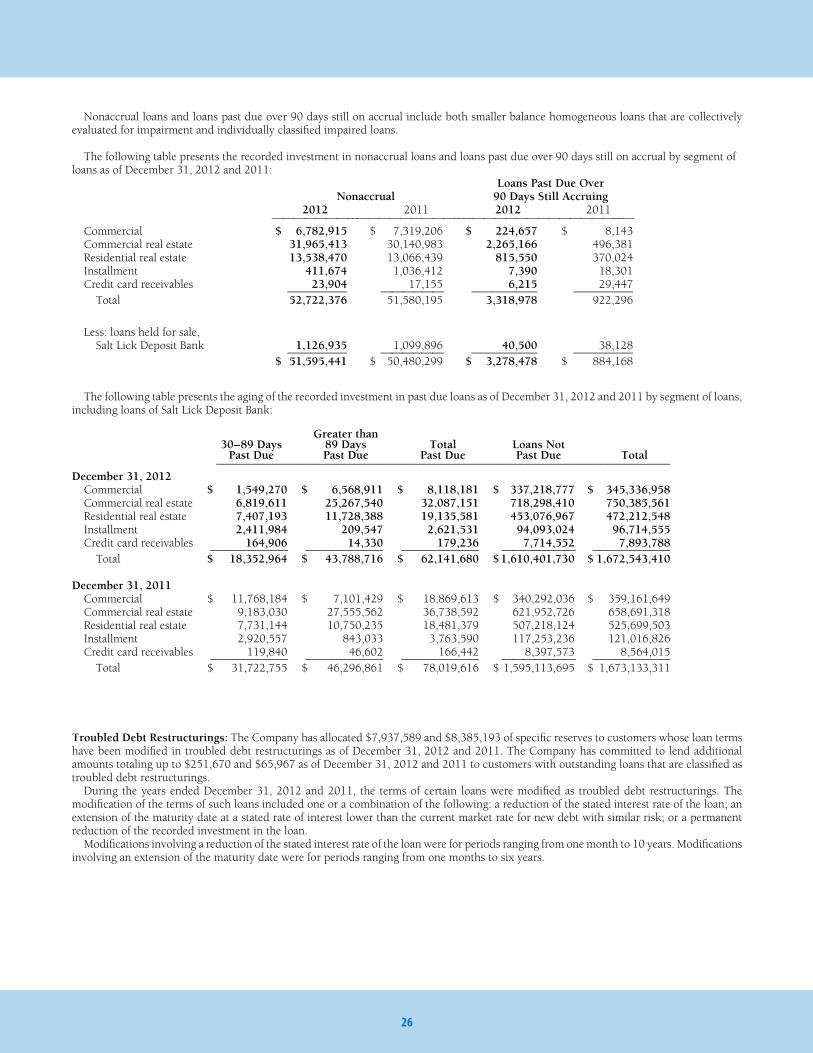
26
The following table presents the aging of the recorded investment in past due loans as of December 31, 2012 and 2011 by segment of loans, including loans of Salt Lick Deposit Bank:
Greater than 30–89 Days 89 Days Total Loans Not Past Due Past Due Past Due Past Due Total –––––––––––––––––––––––––––––––––––––––––––––––––––––––––––––––––––––––––––––––December 31, 2012 Commercial $ 1,549,270 $ 6,568,911 $ 8,118,181 $ 337,218,777 $ 345,336,958 Commercial real estate 6,819,611 25,267,540 32,087,151 718,298,410 750,385,561 Residential real estate 7,407,193 11,728,388 19,135,581 453,076,967 472,212,548 Installment 2,411,984 209,547 2,621,531 94,093,024 96,714,555 Credit card receivables 164,906 14,330 179,236 7,714,552 7,893,788 ———–––––— —–––—–––—– ————–––— ———––––—— —–––––––—— Total $ 18,352,964 $ 43,788,716 $ 62,141,680 $ 1,610,401,730 $ 1,672,543,410
December 31, 2011 Commercial $ 11,768,184 $ 7,101,429 $ 18,869,613 $ 340,292,036 $ 359,161,649 Commercial real estate 9,183,030 27,555,562 36,738,592 621,952,726 658,691,318 Residential real estate 7,731,144 10,750,235 18,481,379 507,218,124 525,699,503 Installment 2,920,557 843,033 3,763,590 117,253,236 121,016,826 Credit card receivables 119,840 46,602 166,442 8,397,573 8,564,015 ———–––––— —–––—–––—– ————–––— ———––––—— —–––––––—— Total $ 31,722,755 $ 46,296,861 $ 78,019,616 $ 1,595,113,695 $ 1,673,133,311
Troubled Debt Restructurings: The Company has allocated $7,937,589 and $8,385,193 of specific reserves to customers whose loan terms have been modified in troubled debt restructurings as of December 31, 2012 and 2011. The Company has committed to lend additional amounts totaling up to $251,670 and $65,967 as of December 31, 2012 and 2011 to customers with outstanding loans that are classified as troubled debt restructurings. During the years ended December 31, 2012 and 2011, the terms of certain loans were modified as troubled debt restructurings. The modification of the terms of such loans included one or a combination of the following: a reduction of the stated interest rate of the loan; an extension of the maturity date at a stated rate of interest lower than the current market rate for new debt with similar risk; or a permanent reduction of the recorded investment in the loan. Modifications involving a reduction of the stated interest rate of the loan were for periods ranging from one month to 10 years. Modifications involving an extension of the maturity date were for periods ranging from one months to six years.
Nonaccrual loans and loans past due over 90 days still on accrual include both smaller balance homogeneous loans that are collectively evaluated for impairment and individually classified impaired loans.
The following table presents the recorded investment in nonaccrual loans and loans past due over 90 days still on accrual by segment of loans as of December 31, 2012 and 2011: Loans Past Due Over Nonaccrual 90 Days Still Accruing 2012 2011 2012 2011 ———————––—————————––––—————————————––— Commercial $ 6,782,915 $ 7,319,206 $ 224,657 $ 8,143 Commercial real estate 31,965,413 30,140,983 2,265,166 496,381 Residential real estate 13,538,470 13,066,439 815,550 370,024 Installment 411,674 1,036,412 7,390 18,301 Credit card receivables 23,904 17,155 6,215 29,447 ————— ———---—— —–––––—— ————— Total 52,722,376 51,580,195 3,318,978 922,296
Less: loans held for sale, Salt Lick Deposit Bank 1,126,935 1,099,896 40,500 38,128 ————— ———---—— —–––––—— ————— $ 51,595,441 $ 50,480,299 $ 3,278,478 $ 884,168

27
The following table presents loans by segment modified as troubled debt restructurings that occurred during the years ended December 31, 2012 and 2011 and includes troubled debt restructurings of Salt Lick Deposit Bank:
Pre-Modification Post-Modification Number Outstanding Recorded Outstanding Recorded of Loans Investment Investment ——— ——–—–—— ——–—–—— December 31, 2012Troubled debt restructurings: Commercial 13 $ 4,639,242 $ 4,616,780 Commercial real estate 15 23,860,041 24,240,512 Residential real estate 22 4,081,395 3,994,636 Installment 1 5,348 5,537 Credit card receivables 0 - - ——— ——–——— ——–——— Total 51 $ 32,586,026 $ 32,857,465
December 31, 2011Troubled debt restructurings: Commercial 5 $ 6,312,940 $ 6,442,446 Commercial real estate 10 19,446,831 19,758,226 Residential real estate 13 3,724,283 3,702,952 Installment 1 13,494 11,613 Credit card receivables 0 - - ——— ——–——— ——–——— Total 29 $ 29,497,548 $ 29,915,237
The troubled debt restructurings described above increased the allowance for credit losses by $1,179,380 and resulted in charge-offs of $35,902 during the year ended December 31, 2012. The troubled debt restructurings described above increased the allowance for credit losses by $4,264,460 and resulted in charge-offs of $143,785 during the year ended December 31, 2011. The troubled debt restructurings described above which are presented as loans held for sale in the Salt Lick Deposit Bank transaction total $0 and $59,335 for the years ended December 31, 2012 and 2011.
The following table presents loans by segment modified as troubled debt restructurings for which there was a payment default within 12 months following the modification during the years ended December 31, 2012 and 2011 and includes troubled debt restructurings of Salt Lick Deposit Bank:
Number Recorded of Loans Investment ——— ——–—–—— December 31, 2012Troubled debt restructurings that subsequently defaulted: Commercial 3 $ 212,547 Commercial real estate 5 1,469,159 Residential real estate 9 1,950,628 Installment 0 - Credit card receivables 0 - ——— ——–——— Total 17 $ 3,632,334
December 31, 2011Troubled debt restructurings that subsequently defaulted: Commercial 4 $ 6,382,514 Commercial real estate 7 17,688,550 Residential real estate 5 1,275,195 Installment 0 - Credit card receivables 0 - ——— ——–——— Total 16 $ 25,346,259
A loan is considered to be in payment default once it is 30 days contractually past due under the modified terms. The troubled debt restructurings that subsequently defaulted described above increased the allowance for credit losses by $103,820 and resulted in charge-offs of $6,884 during the year ended December 31, 2012. The troubled debt restructurings that subsequently defaulted described above increased the allowance for credit losses by $4,173,610 and resulted in charge-offs of $143,785 during the year ended December 31, 2011. The troubled debt restructurings that subsequently defaulted during the years ended December 31, 2012 and 2011 reported as loans held for sale in the Salt Lick Deposit Bank transaction total $0 and $45,402, respectively.

28
Credit Quality Indicators: The Company categorizes loans into risk categories based on relevant information about the ability of borrowers to service their debt such as: current financial information, historical payment experience, credit documentation, public information, and current economic trends, among other factors. The Company analyzes loans individually by classifying the loans as to credit risk. This analysis includes loans with an outstanding balance greater than $25,000 and non-homogeneous loans, such as commercial, commercial real estate and residential real estate loans, and homogeneous loans that are part of a borrowing relationship. This analysis is performed on a monthly basis. The Company uses the following definitions for risk ratings:
Special Mention. Loans classified as special mention have a potential weakness that deserves management’s close attention. If left uncorrected, these potential weaknesses may result in deterioration of the repayment prospects for the loan or of the institution’s credit position at some future date.
Substandard. Loans classified as substandard are inadequately protected by the current net worth and paying capacity of the obligor or of the collateral pledged, if any. Loans so classified have a well-defined weakness or weaknesses that jeopardize the liquidation of the debt. They are characterized by the distinct possibility that the institution will sustain some loss if the deficiencies are not corrected.
Doubtful. Loans classified as doubtful have all the weaknesses inherent in those classified as substandard, with the added characteristic that the weaknesses make collection or liquidation in full, on the basis of currently existing facts, conditions and values, highly questionable and improbable.
Loans not meeting the criteria above that are analyzed individually as part of the above described process are considered to be pass rated loans. Loans listed as not rated are included in groups of homogeneous loans, such as installment loans and credit card receivables. Credit quality indicators similar to those described above, including delinquency and other performance indicators, are used for loans that are not rated.
Based on the most recent analysis performed, the risk category of loans by segment of loans, including loans of Salt Lick Deposit Bank, is as follows:
Special Not Pass Mention Substandard Doubtful Rated Total ––––––––––––––––––––––––––––––––––––––––––––––––––––––––––––––––––––––––––––––––––––––––December 31, 2012 Commercial $ 325,037,922 $ 3,918,642 $ 16,293,618 $ - $ - $ 345,250,182 Commercial real estate 664,216,250 27,462,727 58,626,229 80,355 - 750,385,561 Residential real estate 430,520,190 5,769,460 24,560,561 125,728 - 460,975,939 Installment - - - - 96,714,555 96,714,555 Credit card receivables - - - - 7,912,687 7,912,687 Loans held for sale in the secondary market - - - - 12,292,863 12,292,863 ———–––––— —––––——– ———–—— ———–—— —––––––—— ———–––—— $ 1,419,774,362 $ 37,150,829 $ 99,480,408 $ 206,083 $ 116,920,105 $ 1,673,531,787
December 31, 2011 Commercial $ 324,463,041 $ 5,162,154 $ 29,428,924 $ 161,831 $ 31,541 $ 359,247,491 Commercial real estate 589,030,844 22,220,121 47,440,353 - - 658,691,318 Residential real estate 481,591,522 4,881,259 25,911,859 772,552 - 513,157,192 Installment - - - - 121,016,826 121,016,826 Credit card receivables - - - - 8,583,485 8,583,485 Loans held for sale in the secondary market - - - - 13,592,523 13,592,523 ———–––––— —––––——– ———–—— ———–—— —––––––—— ———–––—— $ 1,395,085,407 $ 32,263,534 $ 102,781,136 $ 934,383 $ 143,224,375 $ 1,674,288,835
The terms of certain other loans were modified during the year ended December 31, 2012 that did not meet the definition of a troubled debt restructuring. These loans have a total recorded investment as of December 31, 2012 of $178,755,568. The modification of these loans involved either a modification of the terms of a loan to borrowers who were not experiencing financial difficulties or a delay in a payment that was considered to be insignificant. The terms of certain other loans were modified during the year ended December 31, 2011 that did not meet the definition of a troubled debt restructuring. These loans have a total recorded investment as of December 31, 2011 of $36,862,000. The modification of these loans involved either a modification of the terms of a loan to borrowers who were not experiencing financial difficulties or a delay in a payment that was considered to be insignificant. In order to determine whether a borrower is experiencing financial difficulty, an evaluation is performed of the probability that the borrower will be in payment default on any of its debt in the foreseeable future without the modification. This evaluation is performed under the Company’s internal underwriting policy. Certain loans which were modified during the year ended December 31, 2012 and did not meet the definition of a troubled debt restructuring as the modification was a delay in a payment that was considered to be insignificant, had delays in payment ranging from 30 days to three months.

29
NOTE 5. OTHER REAL ESTATE OWNED Activity in other real estate owned was as follows: 2012 2011 ––––––––––––––––––––––––––––––––––– Other real estate owned, beginning of year $ 25,624,246 $ 24,083,659
Acquisition and improvement of other real estate, net 7,462,484 10,763,565 Proceeds from sales of other real estate (9,275,861) (6,410,896) Provision for valuation allowance of other real estate (2,224,208) (2,126,738) Net loss on sales and direct write-downs (629,020) (685,344) ––––––––––– ––––––––––– Other real estate owned, end of year 20,957,641 25,624,246 Less: other real estate owned, held for sale (845,972) (846,560) ––––––––––– ––––––––––– $ 20,111,669 $ 24,777,686
Activity in the valuation allowance was as follows: 2012 2011 ––––––––––––––––––––––––––––––––––– Beginning of year $ 7,545,922 $ 5,618,524 Additions charged to expense 2,224,208 2,126,738 Direct write-downs (1,129,295) (199,340) ––––––––––– ––––––––––– End of year 8,640,835 7,545,922 Less: valuation allowance, held for sale (12,500) - ––––––––––– ––––––––––– $ 8,628,335 $ 7,545,922
Expenses related to foreclosed assets include: 2012 2011 ––––––––––––––––––––––––––––––––––– Net loss (gain) on sales and direct write-downs $ 629,020 $ 685,344 Provision for valuation allowance 2,224,208 2,126,738 Operating expenses, net of rental income 1,809,361 2,948,724 ––––––––––– ––––––––––– $ 4,662,589 $ 5,760,806
NOTE 4. MORTGAGE BANKING ACTIVITIES Loans originated for sale in the secondary market and subsequently sold totaled approximately $286,227,000 and $175,587,000 during 2012 and 2011. The Company had commitments to originate $31,027,237 in loans at December 31, 2012, which it intends to sell after the loans are closed. The Company had $12,292,863 and $13,592,523 in loans held for sale at December 31, 2012 and 2011; these totals included $386,656 and $70,850 held for sale by Salt Lick Deposit Bank. Loans serviced for others, which are not reported as assets, totaled approximately $55,554,000 and $60,370,000 at December 31, 2012 and 2011. Activity for capitalized mortgage servicing rights included in other assets during 2012 and 2011 was as follows:
2012 2011 ––––––––––––––––––––––––––––––––––– Servicing rights Beginning of year $ 227,087 $ 228,999 Originated 81,159 55,978 Amortized to expense (61,934) (57,890) ––––––––– –––––––– End of year $ 246,312 $ 227,087 No valuation allowance for impaired servicing rights is considered necessary. The fair value of capitalized mortgage servicing rights was estimated to be approximately $283,000 and $261,000 at year end 2012 and 2011. On April 1, 2011, the Company entered into a settlement with a mortgage investor which had been demanding repayment on three mortgage loans that the Company had sold to the investor. Compliance with loan origination guidelines was at issue. The Company made a $325,000 payment to the investor in return for release from any further buy back demands or potential penalties on all loans sold by the Company to the investor on or before December 31, 2008. The payment resulted in additional expense of approximately $250,000 in 2011, which is included in other expenses.

30
NOTE 7. GOODWILL AND INTANGIBLE ASSETS Goodwill was $15,004,524 at December 31, 2012 and 2011. Included in goodwill at December 31, 2012 and 2011 was $691,131 generated from the Company’s acquisition of Salt Lick Deposit Bank. Impairment exists when a reporting unit’s carrying value of goodwill exceeds its fair value. At December 31, 2012, the Company’s reporting unit had positive equity and the Company performed a qualitative assessment to determine if it was more likely than not that the fair value of the reporting unit exceeded its carrying value, including goodwill. The qualitative assessment indicated that it was more likely than not that the fair value of the reporting unit exceeded its carrying value, resulting in no impairment. Management also quantitatively determined the fair value of the reporting unit and compared it to its carrying amount. The result of this assessment supported the qualitative analysis. Acquired intangible assets were as follows as of December 31: 2012 2011 Gross Gross Carrying Accumulated Carrying Accumulated Amount Amortization Amount Amortization ––––––––––––––––––––––––––––––––––––––––––––––––––––––––––– Customer relationship intangibles $ 4,923,564 $ 3,900,592 $ 4,923,564 $ 3,406,004
Aggregate amortization expense was $494,588 for 2012 and 2011.
Estimated amortization expense for each of the next five years is as follows: 2013 $ 413,968 2014 263,348 2015 263,348 2016 82,308 2017 -
NOTE 6. PREMISES AND EQUIPMENT Premises and equipment at December 31 are as follows: 2012 2011 ––––––––––––––––––––––––––––––––––– Land $ 3,580,756 $ 3,580,756 Buildings and improvements 24,060,048 24,027,298 Leasehold improvements 26,493,124 26,487,431 Furniture, fixtures and equipment 38,880,829 37,583,151 Construction in progress 382,506 162,913 Accumulated depreciation (52,986,617) (48,357,514) ––––––––––– ––––––––––– 40,410,646 43,484,035 Less: premises and equipment held for sale, net (2,839,661) (2,981,044) ––––––––––– ––––––––––– Total $ 37,570,985 $ 40,502,991
Depreciation and amortization expense amounted to $4,775,559 and $5,056,754 in 2012 and 2011.
Operating Leases: The Company leases its main office, 12 banking center locations and its mortgage and insurance center in addition to its land leases for three banking centers. The Company currently subleases a portion of its space to eight tenants. Salt Lick Deposit Bank had no leases as of December 31, 2012. Rent expense for the Company was approximately $5,150,000 and $4,880,000 in 2012 and 2011. Rent commitments under noncancelable operating leases, and certain renewal provisions, net of subleases, are as follows:
2013 $ 5,019,467 2014 5,103,431 2015 5,329,867 2016 5,610,919 2017 5,614,672 Thereafter 32,832,641 ––––––––––– $ 59,510,997
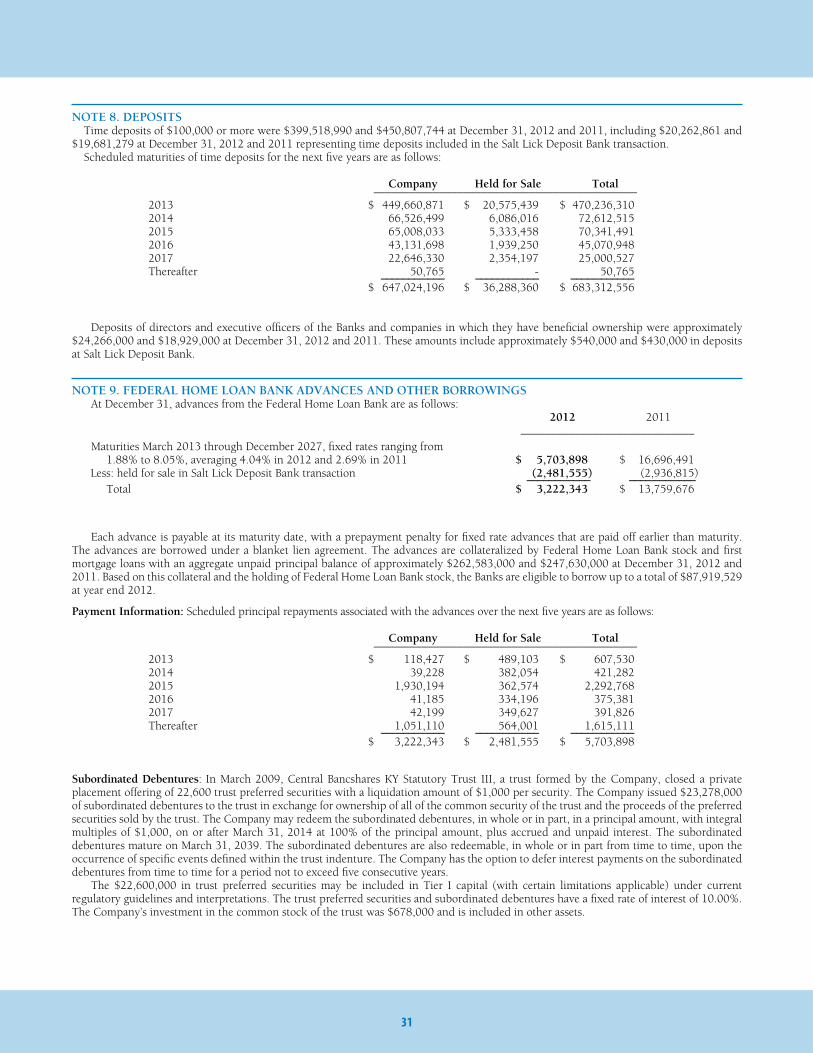
NOTE 8. DEPOSITS Time deposits of $100,000 or more were $399,518,990 and $450,807,744 at December 31, 2012 and 2011, including $20,262,861 and $19,681,279 at December 31, 2012 and 2011 representing time deposits included in the Salt Lick Deposit Bank transaction. Scheduled maturities of time deposits for the next five years are as follows: Company Held for Sale Total –––––––––––––––––––––––––––––––––––––––––––– 2013 $ 449,660,871 $ 20,575,439 $ 470,236,310 2014 66,526,499 6,086,016 72,612,515 2015 65,008,033 5,333,458 70,341,491 2016 43,131,698 1,939,250 45,070,948 2017 22,646,330 2,354,197 25,000,527 Thereafter 50,765 - 50,765 –––––––-–––– –––––––-–––– ––––-––––––– $ 647,024,196 $ 36,288,360 $ 683,312,556
Deposits of directors and executive officers of the Banks and companies in which they have beneficial ownership were approximately $24,266,000 and $18,929,000 at December 31, 2012 and 2011. These amounts include approximately $540,000 and $430,000 in deposits at Salt Lick Deposit Bank.
31
NOTE 9. FEDERAL HOME LOAN BANK ADVANCES AND OTHER BORROWINGS At December 31, advances from the Federal Home Loan Bank are as follows: 2012 2011 ––––––––––––––––––––––––––––– Maturities March 2013 through December 2027, fixed rates ranging from 1.88% to 8.05%, averaging 4.04% in 2012 and 2.69% in 2011 $ 5,703,898 $ 16,696,491 Less: held for sale in Salt Lick Deposit Bank transaction (2,481,555) (2,936,815) –––––––-–––– ––––-–––-–––– Total $ 3,222,343 $ 13,759,676
Each advance is payable at its maturity date, with a prepayment penalty for fixed rate advances that are paid off earlier than maturity. The advances are borrowed under a blanket lien agreement. The advances are collateralized by Federal Home Loan Bank stock and first mortgage loans with an aggregate unpaid principal balance of approximately $262,583,000 and $247,630,000 at December 31, 2012 and 2011. Based on this collateral and the holding of Federal Home Loan Bank stock, the Banks are eligible to borrow up to a total of $87,919,529 at year end 2012.
Payment Information: Scheduled principal repayments associated with the advances over the next five years are as follows: Company Held for Sale Total –––––––––––––––––––––––––––––––––––––––––––– 2013 $ 118,427 $ 489,103 $ 607,530 2014 39,228 382,054 421,282 2015 1,930,194 362,574 2,292,768 2016 41,185 334,196 375,381 2017 42,199 349,627 391,826 Thereafter 1,051,110 564,001 1,615,111 –––––––-–––– –––––––-–––– ––––-––––––– $ 3,222,343 $ 2,481,555 $ 5,703,898
Subordinated Debentures: In March 2009, Central Bancshares KY Statutory Trust III, a trust formed by the Company, closed a private placement offering of 22,600 trust preferred securities with a liquidation amount of $1,000 per security. The Company issued $23,278,000 of subordinated debentures to the trust in exchange for ownership of all of the common security of the trust and the proceeds of the preferred securities sold by the trust. The Company may redeem the subordinated debentures, in whole or in part, in a principal amount, with integral multiples of $1,000, on or after March 31, 2014 at 100% of the principal amount, plus accrued and unpaid interest. The subordinated debentures mature on March 31, 2039. The subordinated debentures are also redeemable, in whole or in part from time to time, upon the occurrence of specific events defined within the trust indenture. The Company has the option to defer interest payments on the subordinated debentures from time to time for a period not to exceed five consecutive years. The $22,600,000 in trust preferred securities may be included in Tier I capital (with certain limitations applicable) under current regulatory guidelines and interpretations. The trust preferred securities and subordinated debentures have a fixed rate of interest of 10.00%. The Company’s investment in the common stock of the trust was $678,000 and is included in other assets.
32
In March 2005, Central Bancshares KY Statutory Trust I, a trust formed by the Company, closed a pooled private offering of 15,000 trust preferred securities with a liquidation amount of $1,000 per security. The Company issued $15,464,000 of subordinated debentures to the trust in exchange for ownership of all of the common security of the trust and the proceeds of the preferred securities sold by the trust. The Company may redeem the subordinated debentures, in whole or in part, in a principal amount with integral multiples of $1,000, on or after June 15, 2010 at 100% of the principal amount, plus accrued and unpaid interest. The subordinated debentures mature on June 15, 2035. The subordinated debentures are also redeemable, in whole or in part from time to time, upon the occurrence of specific events defined within the trust indenture. The Company has the option to defer interest payments on the subordinated debentures from time to time for a period not to exceed five consecutive years. The $15,000,000 in trust preferred securities may be included in Tier I capital (with certain limitations applicable) under current regulatory guidelines and interpretations. The trust preferred securities and subordinated debentures have a variable rate of interest equal to the sum of the three month London Interbank Offered Rate (“LIBOR”) and 1.75%, which was 2.06% at year end 2012. The Company’s investment in the common stock of the trust was $464,000 and is included in other assets. The Company has an outstanding line of credit for $10,000,000 from a commercial bank for the purpose of securing additional funds for capital infusion to its Subsidiaries or for debt service needs. As of December 31, 2012, the Company had not drawn upon this line. Terms of the line of credit include a variable interest rate equal to the sum of prime as published in The Wall Street Journal and 0.50% (3.75% as of December 31, 2012) with a floor of 4.75%, and monthly payments of interest only with the balance due at maturity on September 30, 2013. The line of credit is secured by 100% of the stock of Central Bank & Trust Co.
NOTE 10. FAIR VALUE Fair value is the exchange price that would be received for an asset or paid to transfer a liability (exit price) in the principal or most advantageous market for the asset or liability in an orderly transaction between market participants on the measurement date. There are three levels of inputs that may be used to measure fair values: Level 1: Quoted prices (unadjusted) for identical assets or liabilities in active markets that the entity has the ability to access as of the measurement date. Level 2: Significant other observable inputs other than Level 1 prices such as quoted prices for similar assets or liabilities; quoted prices in markets that are not active; or other inputs that are observable or can be corroborated by observable market data. Level 3: Significant unobservable inputs that reflect a reporting entity’s own assumptions about the assumptions that market participants would use in pricing an asset or liability. The Company used the following methods and significant assumptions to estimate fair value:
Investment Securities: The fair values of securities available for sale are determined by obtaining quoted prices on nationally recognized securities exchanges (Level 1 inputs) or matrix pricing, which is a mathematical technique widely used in the industry to value debt securities without relying exclusively on quoted prices for the specific securities but rather by relying on the securities’ relationship to other benchmark quoted securities (Level 2 inputs). Impaired Loans: At the time a loan is considered impaired, it is valued at the lower of cost or fair value. Impaired loans carried at fair value generally receive specific allocations of the allowance for loan losses. For collateral dependent loans, fair value is commonly based on recent real estate appraisals. These appraisals may utilize a single valuation approach or a combination of approaches including comparable sales and the income approach. Adjustments are routinely made in the appraisal process by the independent appraisers to adjust for differences between the comparable sales and income data available. Such adjustments are usually significant and typically result in a Level 3 classification of the inputs for determining fair value. Non-real estate collateral may be valued using an appraisal, net book value per the borrower’s financial statements, or aging reports, adjusted or discounted based on management’s historical knowledge, changes in market conditions from the time of the valuation, and management’s expertise and knowledge of the client and client’s business, resulting in a Level 3 fair value classification. Impaired loans are evaluated on a quarterly basis for additional impairment and adjusted accordingly.Other Real Estate Owned: Assets acquired through or instead of loan foreclosure are initially recorded at fair value less costs to sell when acquired, establishing a new cost basis. These assets are subsequently accounted for at lower of cost or fair value less estimated costs to sell. Fair value is commonly based on recent real estate appraisals. These appraisals may utilize a single valuation approach or a combination of approaches including comparable sales and the income approach. Adjustments are routinely made in the appraisal process by the independent appraisers to adjust for differences between the comparable sales and income data available. Such adjustments are usually significant and typically result in a Level 3 classification of the inputs for determining fair value. Appraisals for both collateral-dependent impaired loans and other real estate owned are performed by certified general appraisers (for commercial properties) or certified residential appraisers (for residential properties) whose qualifications and licenses have been reviewed and verified by the Company. Once received, a member of the Loan Review Department reviews the assumptions and approaches utilized in the appraisal as well as the overall resulting fair value in comparison with independent data sources such as recent market data or industry-wide statistics. On an annual basis, the Company compares the actual selling price of collateral that has been sold to the most recent appraised value to determine what additional adjustment should be made to the appraisal value to arrive at fair value. The most recent analysis performed indicated that a discount of 10% should be applied to all appraisal values. The Company has all collateral-dependent impaired loans and other real estate owned appraised annually.Loans Held For Sale in the Secondary Market: Loans held for sale in the secondary market are carried at the lower of cost or fair value, which is evaluated on a pool-level basis. The fair value of loans held for sale is determined using quoted prices for similar assets, adjusted for specific attributes of that loan or other observable market data, such as outstanding commitments from third party investors (Level 2).
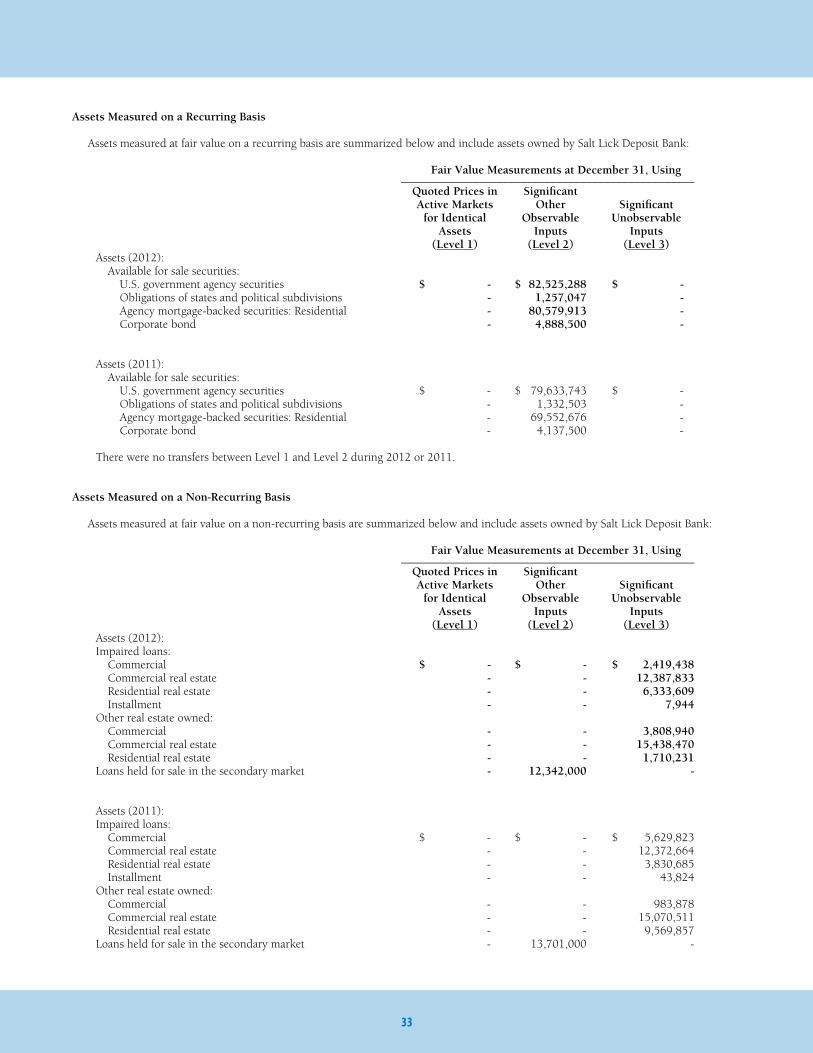
33
Assets Measured on a Recurring Basis
Assets measured at fair value on a recurring basis are summarized below and include assets owned by Salt Lick Deposit Bank:
Fair Value Measurements at December 31, Using _________________________________________________ Quoted Prices in Significant Active Markets Other Significant for Identical Observable Unobservable Assets Inputs Inputs (Level 1) (Level 2) (Level 3) Assets (2012): Available for sale securities: U.S. government agency securities $ - $ 82,525,288 $ - Obligations of states and political subdivisions - 1,257,047 - Agency mortgage-backed securities: Residential - 80,579,913 - Corporate bond - 4,888,500 -
Assets (2011): Available for sale securities: U.S. government agency securities $ - $ 79,633,743 $ - Obligations of states and political subdivisions - 1,332,503 - Agency mortgage-backed securities: Residential - 69,552,676 - Corporate bond - 4,137,500 -
There were no transfers between Level 1 and Level 2 during 2012 or 2011.
Assets Measured on a Non-Recurring Basis
Assets measured at fair value on a non-recurring basis are summarized below and include assets owned by Salt Lick Deposit Bank:
Fair Value Measurements at December 31, Using _________________________________________________ Quoted Prices in Significant Active Markets Other Significant for Identical Observable Unobservable Assets Inputs Inputs (Level 1) (Level 2) (Level 3) Assets (2012): Impaired loans: Commercial $ - $ - $ 2,419,438 Commercial real estate - - 12,387,833 Residential real estate - - 6,333,609 Installment - - 7,944 Other real estate owned: Commercial - - 3,808,940 Commercial real estate - - 15,438,470 Residential real estate - - 1,710,231 Loans held for sale in the secondary market - 12,342,000 -
Assets (2011): Impaired loans: Commercial $ - $ - $ 5,629,823 Commercial real estate - - 12,372,664 Residential real estate - - 3,830,685 Installment - - 43,824 Other real estate owned: Commercial - - 983,878 Commercial real estate - - 15,070,511 Residential real estate - - 9,569,857 Loans held for sale in the secondary market - 13,701,000 -

34
The following represents impairment charges recognized during the period:
Impaired loans that are measured for impairment using the fair value of the collateral for collateral dependent loans, had a principal balance of $109,501,451 at December 31, 2012. Those collateral dependent loans with a valuation allowance of $11,449,690 at December 31, 2012, resulting in $1,879,473 of additional provision for loan losses for the year ended December 31, 2012. Impaired loans that are measured for impairment using the fair value of the collateral for collateral dependent loans, had a principal balance of $102,398,183 at December 31, 2011. Those collateral dependent loans with a valuation allowance of $13,883,742 at December 31, 2011, resulting in $9,306,762 of additional provision for loan losses for the year ended December 31, 2011. Other real estate owned measured at fair value less costs to sell, had a net carrying amount of $20,957,641, which is made up of the outstanding balance of $29,598,476, net of a valuation allowance of $8,640,835 at December 31, 2012, resulting in an additional provision of $2,224,208 for the year ended December 31, 2012. Other real estate owned measured at fair value less costs to sell, had a net carrying amount of $25,624,246, which is made up of the outstanding balance of $33,170,168, net of a valuation allowance of $7,545,922 at December 31, 2011, resulting in an additional provision of $2,126,738 for the year ended December 31, 2011.
The carrying amount and estimated fair value of the Company’s financial instruments at December 31, including Salt Lick Deposit Bank’s financial instruments, are as follows:
2012 2011 Carrying Estimated Carrying Estimated Amount Fair Value Amount Fair Value ———————————––—————————––––—————————————––—Financial assets Cash and cash equivalents $ 221,725,820 $ 221,725,820 $ 192,419,679 $ 192,419,679 Securities available for sale 169,250,748 169,250,748 154,656,422 154,656,422 Securities held to maturity 3,308,699 3,442,000 7,111,167 7,296,000 Loans, net 1,632,770,427 1,639,354,000 1,630,757,863 1,644,057,000 Loans held for sale 12,292,863 12,342,000 13,592,523 13,701,000 Federal Home Loan Bank stock 7,959,300 not applicable 7,959,300 not applicable Interest receivable 5,773,081 5,773,081 6,118,451 6,118,451 Financial liabilities Deposits $ 1,876,715,151 $ 1,879,986,000 $ 1,858,076,694 $ 1,862,551,000 Federal funds purchased and repurchase agreements 60,302,320 60,302,320 52,494,526 52,494,526 Federal Home Loan Bank advances 5,703,898 6,274,000 16,696,491 17,448,000 Subordinated debentures 38,742,000 32,148,000 38,742,000 34,109,000 Interest payable 605,084 605,084 757,173 757,173
The following is a summary of the fair value estimation methodologies, not previously presented, used by the Company for the financial instruments above:
Cash and cash equivalents and interest receivable and payable are presented at their carrying value, which is a reasonable estimate of their fair value. The fair value of loans is estimated by discounting the future cash flows using market rates currently offered for loans of similar remaining maturities. It is not practicable to determine the fair value of Federal Home Loan Bank stock due to restrictions placed on its transferability.
The following table presents qualitative information about Level 3 fair value measurements for financial instruments measured at fair value on a non-recurring basis at December 31, 2012: Range Valuation Asset (Weighted Techniques Fair Value Category Unobservable Input(s) Average) —————————––----------------------------------------------------------------------—————————––––———————------——————––— Sales approach $ 16,648,244 Other real estate owned, Adjustment for differences 5%–29% (21%) commercial all classes of between the comparable impaired loans sales, selling costs, aging, and specific borrower information
Income approach $ 25,458,221 Other real estate owned, Adjustments for aging, 10%–23% (19%) all classes of selling costs, and specific impaired loans borrower information
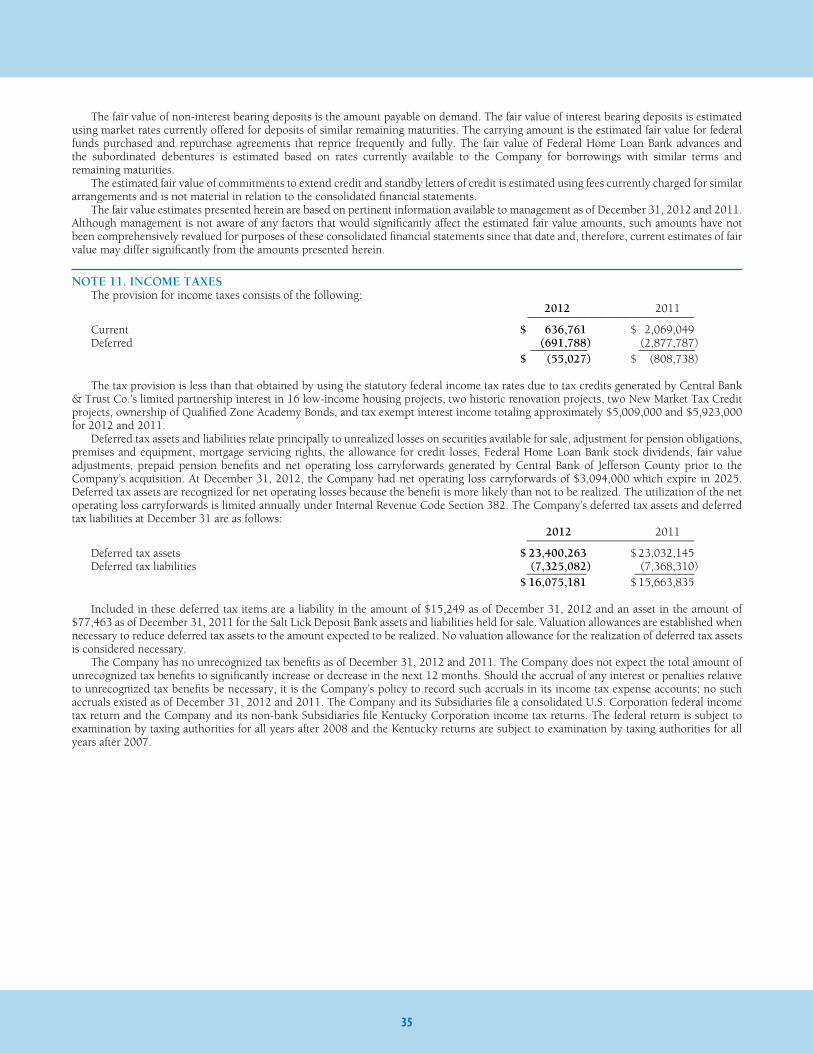
35
The fair value of non-interest bearing deposits is the amount payable on demand. The fair value of interest bearing deposits is estimated using market rates currently offered for deposits of similar remaining maturities. The carrying amount is the estimated fair value for federal funds purchased and repurchase agreements that reprice frequently and fully. The fair value of Federal Home Loan Bank advances and the subordinated debentures is estimated based on rates currently available to the Company for borrowings with similar terms and remaining maturities. The estimated fair value of commitments to extend credit and standby letters of credit is estimated using fees currently charged for similar arrangements and is not material in relation to the consolidated financial statements. The fair value estimates presented herein are based on pertinent information available to management as of December 31, 2012 and 2011. Although management is not aware of any factors that would significantly affect the estimated fair value amounts, such amounts have not been comprehensively revalued for purposes of these consolidated financial statements since that date and, therefore, current estimates of fair value may differ significantly from the amounts presented herein.
NOTE 11. INCOME TAxES The provision for income taxes consists of the following: 2012 2011 —————–————————— Current $ 636,761 $ 2,069,049 Deferred (691,788) (2,877,787) ————— —––——— $ (55,027) $ (808,738)
The tax provision is less than that obtained by using the statutory federal income tax rates due to tax credits generated by Central Bank & Trust Co.’s limited partnership interest in 16 low-income housing projects, two historic renovation projects, two New Market Tax Credit projects, ownership of Qualified Zone Academy Bonds, and tax exempt interest income totaling approximately $5,009,000 and $5,923,000 for 2012 and 2011. Deferred tax assets and liabilities relate principally to unrealized losses on securities available for sale, adjustment for pension obligations, premises and equipment, mortgage servicing rights, the allowance for credit losses, Federal Home Loan Bank stock dividends, fair value adjustments, prepaid pension benefits and net operating loss carryforwards generated by Central Bank of Jefferson County prior to the Company’s acquisition. At December 31, 2012, the Company had net operating loss carryforwards of $3,094,000 which expire in 2025. Deferred tax assets are recognized for net operating losses because the benefit is more likely than not to be realized. The utilization of the net operating loss carryforwards is limited annually under Internal Revenue Code Section 382. The Company’s deferred tax assets and deferred tax liabilities at December 31 are as follows: 2012 2011 —————————————— Deferred tax assets $ 23,400,263 $ 23,032,145 Deferred tax liabilities (7,325,082) (7,368,310) –––––––––– –––––––––– $ 16,075,181 $ 15,663,835 Included in these deferred tax items are a liability in the amount of $15,249 as of December 31, 2012 and an asset in the amount of $77,463 as of December 31, 2011 for the Salt Lick Deposit Bank assets and liabilities held for sale. Valuation allowances are established when necessary to reduce deferred tax assets to the amount expected to be realized. No valuation allowance for the realization of deferred tax assets is considered necessary. The Company has no unrecognized tax benefits as of December 31, 2012 and 2011. The Company does not expect the total amount of unrecognized tax benefits to significantly increase or decrease in the next 12 months. Should the accrual of any interest or penalties relative to unrecognized tax benefits be necessary, it is the Company’s policy to record such accruals in its income tax expense accounts; no such accruals existed as of December 31, 2012 and 2011. The Company and its Subsidiaries file a consolidated U.S. Corporation federal income tax return and the Company and its non-bank Subsidiaries file Kentucky Corporation income tax returns. The federal return is subject to examination by taxing authorities for all years after 2008 and the Kentucky returns are subject to examination by taxing authorities for all years after 2007.
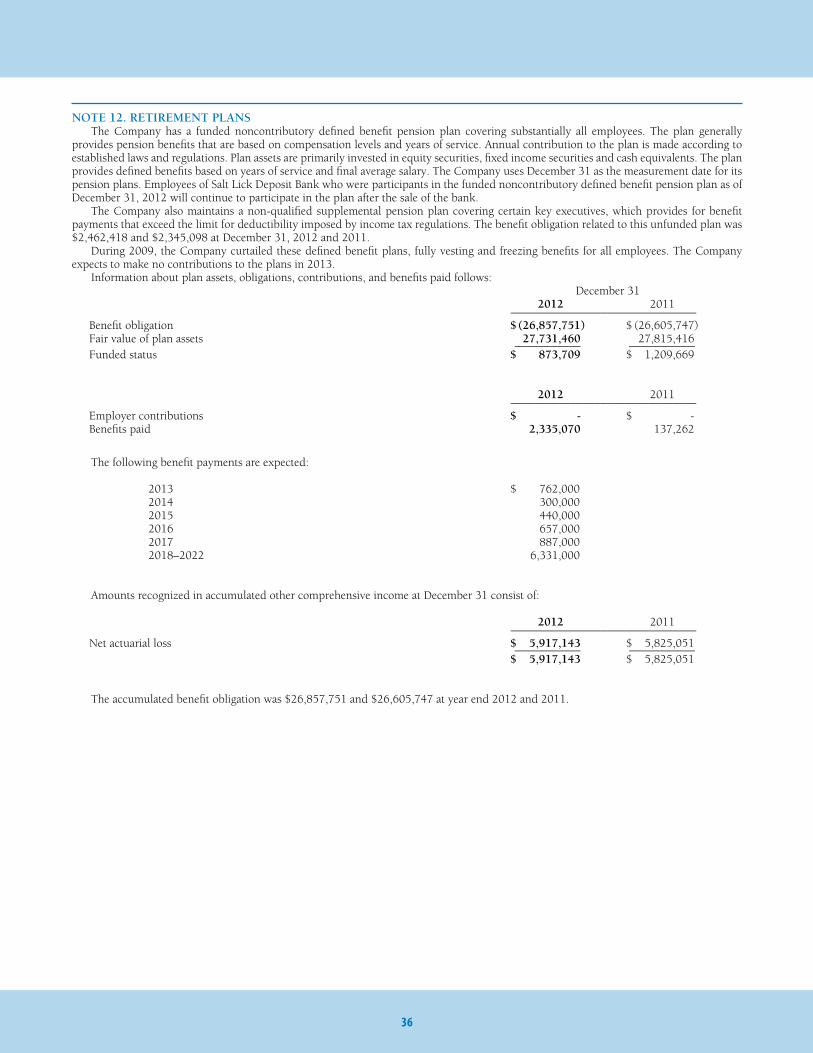
36
NOTE 12. RETIREMENT PLANS The Company has a funded noncontributory defined benefit pension plan covering substantially all employees. The plan generally provides pension benefits that are based on compensation levels and years of service. Annual contribution to the plan is made according to established laws and regulations. Plan assets are primarily invested in equity securities, fixed income securities and cash equivalents. The plan provides defined benefits based on years of service and final average salary. The Company uses December 31 as the measurement date for its pension plans. Employees of Salt Lick Deposit Bank who were participants in the funded noncontributory defined benefit pension plan as of December 31, 2012 will continue to participate in the plan after the sale of the bank. The Company also maintains a non-qualified supplemental pension plan covering certain key executives, which provides for benefit payments that exceed the limit for deductibility imposed by income tax regulations. The benefit obligation related to this unfunded plan was $2,462,418 and $2,345,098 at December 31, 2012 and 2011. During 2009, the Company curtailed these defined benefit plans, fully vesting and freezing benefits for all employees. The Company expects to make no contributions to the plans in 2013. Information about plan assets, obligations, contributions, and benefits paid follows: December 31 2012 2011 ———————–––——————— Benefit obligation $ (26,857,751) $ (26,605,747) Fair value of plan assets 27,731,460 27,815,416 ———–—— ——–——— Funded status $ 873,709 $ 1,209,669
2012 2011 ———————–––——————— Employer contributions $ - $ - Benefits paid 2,335,070 137,262
The following benefit payments are expected:
2013 $ 762,000 2014 300,000 2015 440,000 2016 657,000 2017 887,000 2018–2022 6,331,000
Amounts recognized in accumulated other comprehensive income at December 31 consist of:
2012 2011 ———————–––——————— Net actuarial loss $ 5,917,143 $ 5,825,051 ———–—— ——–——— $ 5,917,143 $ 5,825,051
The accumulated benefit obligation was $26,857,751 and $26,605,747 at year end 2012 and 2011.

37
Components of net periodic pension cost and other amounts recognized in other comprehensive income for 2012 and 2011 for the Company’s defined benefit pension plans included the following:
2012 2011 ———————–––——————— Service cost – benefits earned during the period $ - $ - Interest cost on projected benefit obligation 1,296,843 1,268,585 Expected return on plan assets (1,357,326) (1,303,573) Net amortization of net gain (loss) 304,351 409,955 ———–—— ———–—— Net periodic pension cost 243,868 374,967 ———–—— ———–—— Net loss (gain) (678,726) 209,575 Net amortization of net gain (loss) 770,818 (409,955) ———–—— ———–—— Total recognized in other comprehensive income (loss) 92,092 (200,380) ———–—— ———–—— Total recognized in net periodic pension cost and other comprehensive income $ 335,960 $ 174,587
The estimated net gain (loss) for the defined benefit pension plans that will be amortized from accumulated other comprehensive income into net periodic pension cost over the next fiscal year was $314,400 and $304,351 as of December 31, 2012 and 2011. The weighted average assumptions used to determine net periodic pension cost were a discount rate of 4.75% and 5% for 2012 and 2011 and an expected return on plan assets of 4.75% and 5% for 2012 and 2011.
Plan Assets: The Company’s overall investment strategy is to achieve a mix of long-term growth and fixed income investments. The target allocations for plan assets are shown in the table below. Equity securities primarily include investments in mutual funds and blue chip stocks. Debt securities include agency securities and municipal securities. The weighted-average expected long-term rate of return is estimated based on current trends in the plan assets as well as projected future rates of return on those assets. The long-term rate of return considers historical returns. The Company’s pension plan asset allocation at year end 2012 and 2011, target allocation for 2013, and expected long-term rate of return by asset category are as follows: Weighted- Target Percentage of Plan Average Expected Allocation Assets at Year End Long-Term RateAsset Category 2013 2012 2011 of Return ———— ———— ———— ———— Equity securities 20-25% 26.45% 25.16% 6.00% - 8.00% Investment funds: Mutual funds 10-15% 13.03 20.49 6.00% - 8.00% Real estate 0-3% 2.06 2.12 6.00% - 8.00% Debt securities: U.S. government agency securities 0-3% 0.01 3.64 4.00% Obligations of states and political subdivisions 50-55% 58.45 39.94 4.00% Corporate bonds 0-2% - 8.65 - ——— ——— Total 100.00% 100.00%
Fair Value of Plan Assets: Fair value is the exchange price that would be received for an asset in the principal or most advantageous market for the asset in an orderly transaction between market participants on the measurement date. The Company used the following methods and significant assumptions to estimate the fair value of each type of financial instrument:Equity and Debt Securities: The fair values for investment securities are determined by quoted market prices, if available (Level 1). For securities where quoted prices are not available, fair values are calculated based on market prices of similar securities (Level 2). For securities where quoted prices or market prices of similar securities are not available, fair values are calculated using discounted cash flows or other market indicators (Level 3). Discounted cash flows are calculated using spread to swap and LIBOR curves that are updated to incorporate loss severities, volatility, credit spread and optionality. During times when trading is more liquid, broker quotes are used (if available) to validate the model. Rating agency and industry research reports as well as defaults and deferrals on individual securities are reviewed and incorporated into the calculations.

38
The fair value of the plan assets at December 31, 2012 and 2011, by asset category, is as follows:
Fair Value Measurements at December 31, Using __________________________________________________________ Quoted Prices in Significant Active Markets Other Significant for Identical Observable Unobservable Carrying Assets Inputs Inputs Value (Level 1) (Level 2) (Level 3) 2012 Plan assets Cash and cash equivalents $ 235,000 $ 235,000 $ - $ - Equity securities 7,273,000 7,273,000 - - Investment funds: Mutual funds 3,582,000 3,582,000 - - Real estate 567,000 567,000 - - Debt securities: U.S. government agency securities 1,000 - 1,000 - Obligations of states and political subdivisions 16,073,000 - 16,073,000 - ————— ————— ————— ————— Total plan assets $ 27,731,000 $ 11,657,000 $ 16,074,000 $ -
2011 Plan assets Cash and cash equivalents $ 210,000 $ 210,000 $ - $ - Equity securities 6,945,000 6,945,000 - - Investment funds: Mutual funds 5,656,000 5,656,000 - - Real estate 584,000 584,000 - - Debt securities: U.S. government agency securities 1,005,000 - 1,005,000 - Obligations of states and political subdivisions 11,026,000 - 11,026,000 - Corporate bonds 2,389,000 2,389,000 - - ————— ————— ————— ————— Total plan assets $ 27,815,000 $ 15,784,000 $ 12,031,000 $ -
There were no transfers between Level 1 and Level 2 during 2012 or 2011.
Deferred Compensation Plans: The Company maintains deferred compensation plans covering selected directors and key employees. Net deferred compensation expense was $36,970 and $101,070 in 2012 and 2011. The accrued liability associated with these plans of $609,629 and $573,159 at December 31, 2012 and 2011 is included in other liabilities.
Employee Stock Ownership Plan: The Company maintains an employee stock ownership plan (the “ESOP”). Contributions are determined annually by the Board of Directors in amounts not to exceed 15 percent of the total compensation of all participants. ESOP expense was $609,150 and $935,028 in 2012 and 2011. As of December 31, 2012 and 2011, a total of 34,579 and 35,139 shares with a fair value of approximately $13,313,000 and $14,091,000 were allocated to active participants as well as $6,400 and $0 in cash. There were no unallocated shares. Any participant who receives a distribution of Company stock under the ESOP has the option to require the Company to repurchase the shares at fair value during a defined period within each of the succeeding two years. The total “put” obligation at December 31, 2012 is the fair value of all ESOP shares distributed in 2012 and shares to be distributed in 2013 to participants who had terminated as of year-end 2012. The Company has a right of first refusal with respect to distributed ESOP shares, which requires former participants to offer to sell their shares to the Company before selling them to another purchaser.
401(k) Retirement Plan: The Company has a 401(k) retirement plan. The Company determines annually the rate at which employee contributions will be matched and the maximum amount of employee contributions which will be matched. The Company made matching contributions totaling $1,364,716 and $1,341,380 in 2012 and 2011.

39
NOTE 13. REGULATORY MATTERS The Company is a bank holding company and is subject to regulation by the Federal Reserve. Central Bank & Trust Co., Salt Lick Deposit Bank, and Central Bank of Jefferson County, Inc. operate under state bank charters and are subject to regulation by the Kentucky Department of Financial Institutions and the Federal Deposit Insurance Corporation. The Company and the Banks are subject to various regulatory capital requirements administered by the federal banking agencies. Failure to meet minimum capital requirements can initiate certain mandatory and possible additional discretionary actions by regulators that, if undertaken, could have a direct material effect on the Company’s financial statements. Under capital adequacy guidelines and the regulatory framework for prompt corrective action, the Company and the Banks must meet specific capital guidelines that involve quantitative measures of the Company’s and the Banks’ assets, liabilities, and certain off-balance-sheet items as calculated under regulatory accounting practices. The Company’s and the Banks’ capital amounts and classifications are also subject to qualitative judgments by the regulators about components, risk weightings, and other factors. As of December 31, 2012, Central Bank of Jefferson County, Inc. is required under a regulatory agreement to maintain a Tier I capital to average assets ratio of 8.00 percent. The Bank was in compliance as of that date. Prompt corrective action regulations provide five classifications: well capitalized, adequately capitalized, undercapitalized, significantly undercapitalized, and critically undercapitalized, although these terms are not used to represent overall financial condition. If adequately capitalized, regulatory approval is required to accept brokered deposits. If undercapitalized, capital distributions are limited, as are asset growth and expansion, and capital restoration plans are required. Quantitative measures established by regulation to ensure capital adequacy require the Company and the Banks to maintain minimum amounts and ratios (set forth in the following table) of Total and Tier I capital (as defined in the regulations) to risk-weighted assets (as defined), and of Tier I capital to average assets (as defined). Management believes, as of December 31, 2012 and 2011, that the Company and the Banks meet all capital adequacy requirements to which they are subject. Notification from the Federal Deposit Insurance Corporation as of December 31, 2012 and 2011, categorized the Banks as well capitalized under the regulatory framework for prompt corrective action. There are no conditions or events since that notification that management believes have changed the institutions’ category.
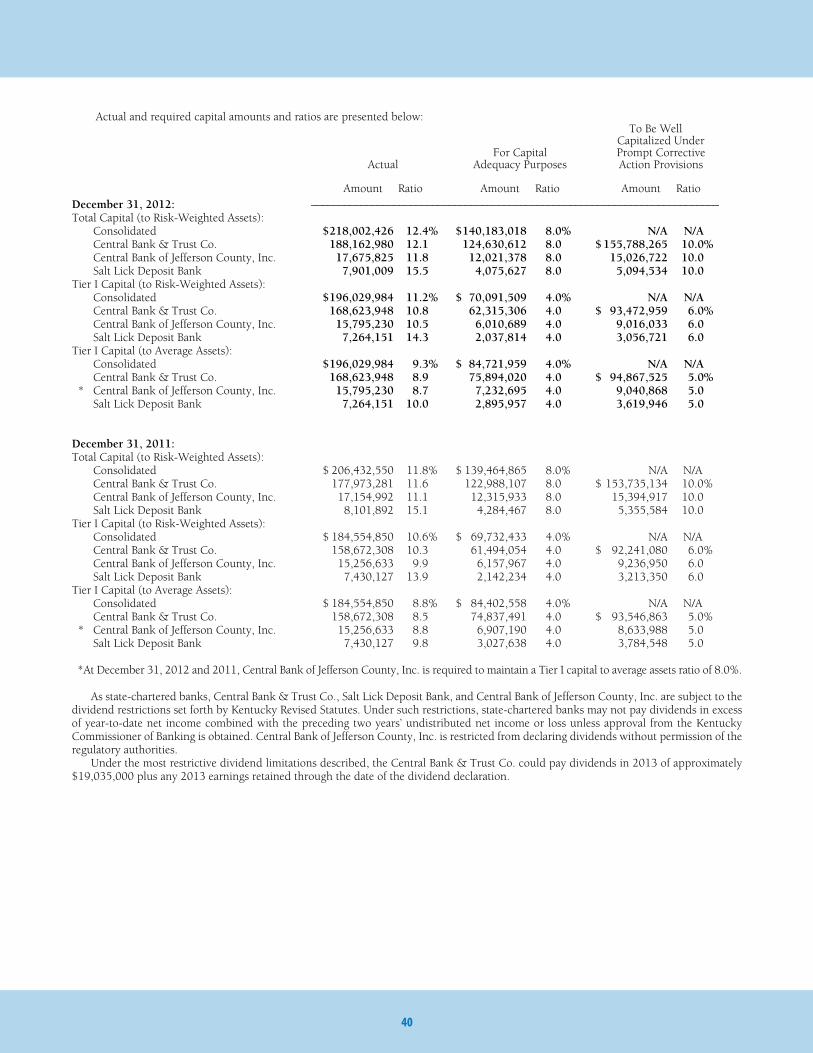
40
Actual and required capital amounts and ratios are presented below: To Be Well Capitalized Under For Capital Prompt Corrective Actual Adequacy Purposes Action Provisions
Amount Ratio Amount Ratio Amount RatioDecember 31, 2012: ––––––––––––––––––––––––––––––––––––––––––––––––––––––––––––––––––––––––––Total Capital (to Risk-Weighted Assets): Consolidated $ 218,002,426 12.4% $ 140,183,018 8.0% N/A N/A Central Bank & Trust Co. 188,162,980 12.1 124,630,612 8.0 $ 155,788,265 10.0% Central Bank of Jefferson County, Inc. 17,675,825 11.8 12,021,378 8.0 15,026,722 10.0 Salt Lick Deposit Bank 7,901,009 15.5 4,075,627 8.0 5,094,534 10.0Tier I Capital (to Risk-Weighted Assets): Consolidated $ 196,029,984 11.2% $ 70,091,509 4.0% N/A N/A Central Bank & Trust Co. 168,623,948 10.8 62,315,306 4.0 $ 93,472,959 6.0% Central Bank of Jefferson County, Inc. 15,795,230 10.5 6,010,689 4.0 9,016,033 6.0 Salt Lick Deposit Bank 7,264,151 14.3 2,037,814 4.0 3,056,721 6.0Tier I Capital (to Average Assets): Consolidated $ 196,029,984 9.3% $ 84,721,959 4.0% N/A N/A Central Bank & Trust Co. 168,623,948 8.9 75,894,020 4.0 $ 94,867,525 5.0% * Central Bank of Jefferson County, Inc. 15,795,230 8.7 7,232,695 4.0 9,040,868 5.0 Salt Lick Deposit Bank 7,264,151 10.0 2,895,957 4.0 3,619,946 5.0
December 31, 2011: Total Capital (to Risk-Weighted Assets): Consolidated $ 206,432,550 11.8% $ 139,464,865 8.0% N/A N/A Central Bank & Trust Co. 177,973,281 11.6 122,988,107 8.0 $ 153,735,134 10.0% Central Bank of Jefferson County, Inc. 17,154,992 11.1 12,315,933 8.0 15,394,917 10.0 Salt Lick Deposit Bank 8,101,892 15.1 4,284,467 8.0 5,355,584 10.0Tier I Capital (to Risk-Weighted Assets): Consolidated $ 184,554,850 10.6% $ 69,732,433 4.0% N/A N/A Central Bank & Trust Co. 158,672,308 10.3 61,494,054 4.0 $ 92,241,080 6.0% Central Bank of Jefferson County, Inc. 15,256,633 9.9 6,157,967 4.0 9,236,950 6.0 Salt Lick Deposit Bank 7,430,127 13.9 2,142,234 4.0 3,213,350 6.0Tier I Capital (to Average Assets): Consolidated $ 184,554,850 8.8% $ 84,402,558 4.0% N/A N/A Central Bank & Trust Co. 158,672,308 8.5 74,837,491 4.0 $ 93,546,863 5.0% * Central Bank of Jefferson County, Inc. 15,256,633 8.8 6,907,190 4.0 8,633,988 5.0 Salt Lick Deposit Bank 7,430,127 9.8 3,027,638 4.0 3,784,548 5.0 *At December 31, 2012 and 2011, Central Bank of Jefferson County, Inc. is required to maintain a Tier I capital to average assets ratio of 8.0%.
As state-chartered banks, Central Bank & Trust Co., Salt Lick Deposit Bank, and Central Bank of Jefferson County, Inc. are subject to the dividend restrictions set forth by Kentucky Revised Statutes. Under such restrictions, state-chartered banks may not pay dividends in excess of year-to-date net income combined with the preceding two years’ undistributed net income or loss unless approval from the Kentucky Commissioner of Banking is obtained. Central Bank of Jefferson County, Inc. is restricted from declaring dividends without permission of the regulatory authorities. Under the most restrictive dividend limitations described, the Central Bank & Trust Co. could pay dividends in 2013 of approximately $19,035,000 plus any 2013 earnings retained through the date of the dividend declaration.

41
NOTE 14. FINANCIAL INSTRUMENTS WITH OFF-BALANCE-SHEET RISK The Banks are parties to financial instruments with off-balance-sheet risk in the normal course of business to meet the financing needs of their customers. The financial instruments are commitments to extend credit, unused lines of credit and standby letters of credit. Such financial instruments are recorded in the consolidated financial statements when they become payable. The Banks use the same credit policies in making conditional obligations as they do for on-balance-sheet instruments. At December 31, 2012 and 2011, the Banks, including Salt Lick Deposit Bank, had the following financial instruments: 2012 2011 –––––––––––––––––––––––––––––––Standby letters of credit $ 33,395,000 $ 25,094,000 Commitments to extend credit $ 127,572,000 $ 158,417,000 Unused lines of credit $ 254,090,000 $ 229,453,000 Standby letters of credit represent conditional commitments issued by the Banks to guarantee the performance of a customer to a third party. The credit risk involved in issuing letters of credit is essentially the same as the credit risk involved in extending loans to customers. The Banks hold certificates of deposit and real estate as collateral supporting those commitments for which collateral is deemed necessary. Commitments to extend credit are agreements to lend to a customer as long as there is no violation of any condition established in the contract. Commitments generally have fixed expiration dates or other termination clauses and may require payment of a fee. Commitments are generally made for periods of 45 days or less. The Banks evaluate each customer’s creditworthiness on a case-by-case basis. Since many of the commitments are expected to expire without being drawn upon, the total commitment amounts do not necessarily represent future cash requirements. Collateral held varies but may include accounts receivable, marketable securities, inventory, property and equipment, and income-producing properties.
Following are components of SLDB’s assets and liabilities as of December 31: 2012 2011 ———————–––——————— Cash and cash equivalents $ 727,858 $ 1,068,536 Available for sale securities 2,722,993 2,587,999 Held to maturity securities 487,754 710,028 Loans held for sale in the secondary market 386,656 70,850 Loans 52,238,090 54,734,775 Allowance for credit losses (640,139) (857,124) Premises and equipment, net 2,839,661 2,981,044 Other real estate owned 845,972 846,560 Federal Home Loan Bank stock, at cost 908,400 908,400 Goodwill 691,131 691,131 Other assets 526,380 661,806 ———–—— ———–—— Total assets held for sale $ 61,734,756 $ 64,404,005
Deposits $ 61,731,020 $ 60,497,419 Federal Home Loan Bank advances 2,481,555 2,936,815 Other liabilities 109,035 241,839 ———–—— ———–—— Total liabilities held for sale $ 64,321,610 $ 63,676,073
SLDB also held $10,542,985 and $7,393,235 in intercompany federal funds sold as of December 31, 2012 and 2011. These amounts were eliminated during consolidation.
NOTE 15 – BUSINESS COMBINATIONS
Salt Lick Deposit Bank Transaction On October 29, 2012, the Company agreed to sell Salt Lick Deposit Bank (“SLDB”) to a non-related third-party financial institution. SLDB’s assets and liabilities are presented as assets and liabilities held for sale on the consolidated balance sheets. The sale was consummated on January 1, 2013. The sale price of $8,630,000 was paid in cash and resulted in a gain, net of tax, of $196,119. Management evaluated the assets and liabilities held for sale for impairment as of December 31, 2012. As the transaction resulted in a net gain, management determined there was no impairment and, accordingly, the assets and liabilities held for sale were carried at their historical cost, net of any previously established valuation allowance.

42
SLDB’s condensed income statements for the years ended December 31, 2012 and 2011 follow: 2012 2011 ———————–––——————— Interest and dividend income $ 3,092,727 $ 3,478,400 Interest expense 770,767 1,062,442 ———–—— ———–—— Net interest income 2,321,960 2,415,958 Provision for credit losses 101,313 381,000 Noninterest income 716,315 704,837 Noninterest expense 1,981,196 1,932,279 Provision for income taxes 286,742 243,956 ———–—— ———–—— Net income $ 669,024 $ 563,560
Central Bank, FSB Transaction On January 18, 2011, the operations of Central Bank, FSB (“FSB”) were merged into Central Bank & Trust Co. (“CB&T”). This transaction was a business combination under common control as both CB&T and FSB are Subsidiaries of the Company. Assets and liabilities were recorded at their carrying amounts in the financial statements. The business combination resulted in gross assets of $192 million, gross liabilities of $174 million, and $18 million in total capital transferred to CB&T’s financial statements. The combination did not have an impact on the consolidated balance sheets, or the consolidated statements of income, changes in shareholders’ equity and cash flows as of and for the year ended December 31, 2011.

central bancshares, Inc. andcentral bank & Trust co.board of Directors
Luther Deaton, Jr. Chairman, President & CEO Central Bancshares, Inc. andCentral Bank & Trust Co.
Michael D. Foley Partner Ray, Foley, Hensley & Company, PLLCCertified Public Accountants
Joan D. Kincaid Vice Chairman of the BoardCentral Bancshares, Inc. and Central Bank & Trust Co.
Wayne M. MartinRetiredWKYT-TV
Nick Nicholson Retired Keeneland Association
G. Michael RitchiePresident & CEO Photo Science, Inc.
Paul E. Sullivan PartnerFrost Brown Todd, LLC
central bank, GeorgetownAdvisory board of Directors
Dallas BlankenshipRetired SuperintendentScott County Board of Education
Mason “Butch” GlassCommunity Volunteer
William C. HaughCEO, Georgetown Community Hospital
George H. LusbyScott County Judge Executive
Kimberly E. MarshallPresident
Randy MasonOwner-Operator, McDonald’s
W. Thomas PratherChairman, Central Bank, Georgetown
central bank, LexingtonAdvisory board of Directors
Dennis AndersonPresident, Anderson Communities
Sheila BayesOwner, Sheila Bayes Fine Jewelry
Edward D. BullardChairman, E.D. Bullard Company
Marian GuinnExecutive DirectorGod’s Pantry
Patrick HaydenRetired, Rector Hayden Real Estate
Shea HopkinsExecutive Director & CEO, KET
Dave HouchinPresident, Intech Contracting
Dr. Michael KarpfExecutive Vice President for Health Affairs/UK HealthCare
William Lear, Jr.Managing Director, Stoll, Keenon, Ogden, PLLC
Debbie LongOwner, Dudley’s On Short
Pat MaddenPresident, Pro Sports Management
Anne McBrayerPresident, Kentucky Eagle Beer
Bill OwenPresident, Lexington Convention Center
P.G. PeeplesPresident, Urban League of Lexington
Lynn RedmondPresident, Medical Rehab Center
Brent RiceAttorney, McBrayer, McGinnis, Leslie and Kirkland
Charlie ScrogginSenior Vice President HDR-Quest Engineers, Inc.
Lisa Ball SharpVice President, Ball Homes
Steve ShermanPresident, Sherman-Carter-Barnhart Architects
Linda SlagelPresident, Highbridge Spring Water
Denis SteinerPresident, Denham BlytheCompany, Inc.
Nick StrongOwner, Old Colony Insurance Services
Mike TearneyGatton College Associate Dean Emeritus,University of Kentucky
Billy WilcoxsonPresident, Pro Sports Management
central bank, Madison county Advisory board of Directors
Dianna Ackerman Broker/Owner, ERA Professional Hometown Services
Frankie C. Blevins, Jr.Attorney, Blevins Law, LLC
Robert R. BlytheEKU ProfessorPastor, First Baptist Church
James R. CarrBuilder and Developer
Shannon Combs Partner, Combs, Parsons and Collins Funeral Home
Jeff FultzPresident
James Ernest HillardOwner, Middletown Industrial
Mike Rice Owner, Cars of Kentucky, Inc.
Rita H. SmartOwner, The Bennett House
central bank, NicholasvilleAdvisory board of Directors
Sandra J. AdamsOwner, Zaxby’s
Michael D. Foley Partner Ray, Foley, Hensley & Company, PLLC Certified Public Accountants
Joan D. KincaidVice Chairman of the BoardCentral Bancshares, Inc.
Ben A. RainwaterTutt Construction
Paul E. Sullivan Partner, Frost Brown Todd, LLC
Benjamin G. TaylorTaylor Made Farm & Sales Agency, Inc.
Alan S. VanArsdallPresident
central bank, Northern Kentucky Advisory board of Directors Chris CarleSenior Vice President, Chief Operating OfficerSt. Elizabeth Heathcare, Florence
Helen CarrollManager, Community RelationsToyota Motor Manufacturing
Joseph A. Creevy, M.D.Retired Urologist
Mark GoetzOwner, Edgewood Electric
Merwin Grayson, Jr.President
Ron HillManaging Director TPS Solutions, LTD
Kim PattonVice PresidentTurner Construction
Doug RidenourPresident, Federal Equipment
Gregory ShumateMember, Frost Brown Todd, LLC
Ray Will, M.D.Cardiothoracic Surgeon
John YeagerOwner, Ashley Development
43
b o a r d s o F d i r E c t o r s

44
b o a r d s o F d i r E c t o r s
central bank, WinchesterAdvisory board of Directors
James AllenFormer Clark County Judge-Executive
Gerald F. (Kelly) Healy IIIDirector of Operations McDonald’s
Nancy LawwillRetired Vice President & Assistant Treasurer Central Bank, Winchester
Glenn LeveridgePresident
Terry LittrellBuilder and Developer
Rex McCrary, D.M.D.Dentist
Jeff MonohanAssistant Vice President The Allen Company
Ralph J. PalmerPresident, Palmer Engineering Co.
Patricia M. SmithPresident, MD Consulting, Inc.
Robert Strode Retired
Mary Jane WarnerManager of Power Delivery, East Kentucky Power Cooperative, Inc.
central bank of Jefferson county board of Directors
Jonathan S. BlueChairman, Blue Equity, LLC
Ronald L. CarmicleChairman, Central Bank of Jefferson County, President & Owner, River City Development
Marcia CassadyDirector, Classical Studies Institute of Louisville
Luther Deaton, Jr. CEO, Central Bank of Jefferson County
Michael D. Foley Partner Ray, Foley, Hensley & Company, PLLC Certified Public Accountants
William P. MaloneRetired, Deming, Malone, Livesay & Ostroff
James Clay SmithPresident
William E. Summers, IVRetired, Deputy Mayor, Louisville Metro Government
Jude ThompsonOwner & CEO, Transform Business Solutions, LLC

45
o F F i c E r s
oFFIcERS
central bancshares, Inc.officers
Luther Deaton, Jr. Chairman, President & CEO
Joan D. Kincaid Vice Chairman
Anne B. Carter Vice President
Ranee LelandCorporate Secretary
Patricia P. Price Treasurer
Jeff D. JacobSecurity Officer
Lisa S. Grant, CRCMCompliance Officer
central bank, Lexington
ADMINISTRATION
Luther Deaton, Jr. Chairman, President & CEO
Ernest W. Dolihite Executive Vice President
Ranee LelandCorporate Secretary
Auditing
Craig L. Daniels, CPA Senior Vice President
Lisa S. Grant, CRCMVice President & Compliance Officer
Donna J. Craven, CRCMVice President
Danny C. NolandVice President
CREDIT ADMINISTRATION
Ben WassonVice President
Loan Review
Marie A. YoungVice President
David ChrismanSenior Vice President
Danny G. AbnerVice President
Leigh M. CarrAssistant Vice President
LeeAnn LayneLoan Review Officer
Michael WilliamsLoan Review Officer
Loan Services
Laura L. SchweitzerSenior Vice President
Timothy R. AustinAssistant Vice President
Jarred W. PaullCRE Officer
Loan Processing
Donna M. TurnerVice President
Special Assets
Ellen Sharp Vice President
Steve HallVice President
Julie SzymanskiAssistant Vice President
Becky MullinsSpecial Assets Officer
COMMERCIAL BANKING
Gregory A. Bibb Executive Vice President
Commercial Lending
Mark KaufmannSenior Vice President
Mark R. Fox Vice President
David RossVice President
Jason A. SmithVice President
Stephen J. MalloryAssistant Vice President
Consumer Lending
Jerry F. Smalley Vice President
Mortgage Lending
George R. Lathram Senior Vice President
Paul B. DrakeVice President
Christopher R. KincaidVice President
Paul R. ThornsberryVice President
Jordan OwensCommercial Mortgage Officer
Central Bank Mortgage
Ed WorkmanSenior Vice President
Susan BradleyVice President
Tom BreathittVice President
Brad FieldsVice President Rebecca HaddixVice President
Catherine HimesVice President
Lorraine KinleyVice President
Brian W. West Vice President
HUMAN RESOURCES
Rose Douglass Executive Vice President
Amy ManningVice President
Shelia Plymale Vice President
June CarpenterHuman Resources Officer
TECHNOLOGY SERVICES
Julia Bondra Executive Vice President
Anna EliassenVice President
E. Sean ProfittVice President
Kevin J. LippertAssistant Vice President
Brian D. CatronApplication Development Officer
Chris SchumInformation Security Officer
Paul StewartTechnology Services Officer
RETAIL BANKING
David L. Moore Executive Vice President
Michael GartnerSenior Vice President
Chris McGaugheyCRA Community Development Officer
Banking Centers
Richard D. Hartley Vice President Retail Development Officer
Terri A. Jones Vice President Retail Development Officer
D. Keith PrestonVice President Retail Development Officer

46
o F F i c E r s o F F i c E r s
Alicia F. SmithAssistant Vice President Retail Development Officer
Karen Burton Assistant Vice President
Lana AlexanderRetail Banking Officer
Ugochi E. AlinnorRetail Banking Officer
Jeffrey BentonRetail Banking Officer
Gina EnsmingerRetail Banking Officer
Angela M. FrieszRetail Banking Officer
Barbara JohnsonRetail Banking Officer
Pamela LancasterRetail Banking Officer
Terra LongRetail Banking Officer
Laura M. OwensRetail Banking Officer
Philip RochesterRetail Banking Officer
Alexandra E. TerryRetail Banking Officer
Client Services
Cathy K. Combs Senior Vice President
Diane Williams Client Services Officer
FINANCIAL PLANNING AND CONTROL
Patricia P. Price Executive Vice President & CFO
Edward BarnesSenior Vice President
Shawn PresnellVice President
Lisa A. WilliamsonFinancial Planning Officer
ENTERPRISE RISKMANAGEMENT
C. Gregory StacyExecutive Vice President
Jimmy HamiltonRisk Management Officer
Funds Management
James R. NallAssistant Vice President
MARKETING
Stephen C. Kelly Executive Vice President
Lesley WrightMarketing Officer
Correspondent Banking
Doug Flynn Correspondent Banking Officer
OPERATIONS AND SUPPORT
Operations
Anne B. Carter Executive Vice President
Karen G. Crawley Senior Vice President
Robin Michul Senior Vice President
Harvey SwordVice President
Internet Banking
Brenda P. Oaks Internet Banking Officer
Card Services
Beverly Smalley Assistant Vice President
Corporate Services
Karen RowlandSenior Vice President &Corporate Treasury Manager
Maggie AbneyVice President
Tracy ReidVice President
Lisa K. Vickers Vice President
Chris CampbellAssistant Vice President
Deposit Services
Alisa DurhamVice President
Bank Security
Jeff D. Jacob Senior Vice President & Security, BSA & AML Officer
Angela D. CampbellOperations Officer
WEALTH MANAGEMENT
Trust
Barry HickeySenior Vice President &Trust Manager
Business Development
Charles N. Rush, Jr.Vice President
Employee Benefits
David L. Turner Senior Vice President
Sheila C. Parks Vice President
Operations
Marcia E. Wade Vice President
Personal Trust
Kathryn Wilson GibsonSenior Vice President
Eloise G. Penn Vice President
Carolyn BishopTrust Officer
Anna HovekampTrust Officer
Investment Management
Timothy D. FyffeSenior Vice President &Senior Portfolio Manager
Thomas CorrVice President & Senior Portfolio Manager
Private Banking
Gregory M. ShewmakerSenior Vice President &Private Banking Manager
Rita L. BuggVice President
Leslie FanninVice President
Alicia JordanVice President
Christopher ThomasonVice President
Matthew FrankPrivate Banking Officer
central Insurance Services
Ross BarnettePresident
Tom FrancisVice President
Rob WesselVice President
Steven P. WrightVice President
Don YadenVice President
Beverly HicksCommercial Insurance Officer
Sherry WrightEmployee Benefits Officer

47
o F F i c E r s
central Investment center, Inc.
Jeff GinnanExecutive Vice President & Senior Financial Advisor
Jeff Fields, CRPS®
Vice President & Financial Advisor
Don GraeterVice President & Financial Advisor
Drew GraeterVice President &Financial Advisor
Tony BrownFinancial Advisor
Jim DeMossFinancial Advisor
Deborah FisherFinancial Advisor
Jacobus M. Ockers Financial Advisor
Thomas E. Roberts, CFP®
Financial Advisor
Spencer GraeterInvestment Officer
central bank, Georgetown
Kimberly E. MarshallPresident
Jennifer J. RobertsVice President
Patricia Voigt Vice President
Jennifer BaldwinAssistant Vice President
Ashley WeirAssistant Vice President
central bank, Madison county
Jeff FultzPresident
Cameron AbneySenior Vice President,Senior Market Lender
Scott JohnsonVice President
Ken RileyVice President
Donna HaneyAssistant Vice President
central bank, Nicholasville
Alan S. VanArsdallPresident
Thomas P. PorterExecutive Vice President,Senior Market Lender
Cathy LoweVice President
Marcus P. HanksAssistant Vice President
Jill SloneAssistant Vice President
Brandy OsborneCommercial Lending Officer
central bank, Northern Kentucky
Merwin Grayson, Jr.President
Matthew E. EilersVice President,Senior Market Lender
Karen J. HomanVice President
Joseph NienaberVice PresidentRetail Development Officer
Dennis BarnesAssistant Vice President
central bank, Winchester
Glenn LeveridgePresident
Tim M. DuncanSenior Vice President
Lisa T. EarlywineVice President
Lee ColemanAssistant Vice President
Tammy M. CarrollAssistant Vice PresidentRetail Development Officer
Amy TurnerAssistant Vice President
James McVeyRetail Banking Officer
Melissa ShimfesselRetail Banking Officer
central bank,Jefferson county
James Clay SmithPresident
Jeff D. Jacob Senior Vice President &Security, BSA & AML Officer
Lisa S. Grant, CRCMVice President &Compliance Officer
William E. Summers, VSenior Vice President &Business Development Officer
Commercial Banking
Amy SullivanSenior Vice President
Mortgage Lending
Jeanie GammonAssistant Vice President
Leslie SampsonAssistant Vice President
Retail Banking
Elaine FawbushAssistant Vice President
Casey SteitzRetail Banking Officer
Private Banking
Robert SliderSenior Vice President
Mary LittrellVice President
Wealth Management
Bill KaiserVice President

48
c E n t r a l b a n c s H a r E s l o c a t i o n s
SAT SOUTHLAND (859) 253-6053 256 Southland Drive
SAT TATES CREEK CENTRE (859) 253-6387 4090 Tates Creek Centre Drive
TATES CREEK ROAD (859) 253-6113 3270 Tates Creek Road
VERSAILLES ROAD (859) 253-6093 2347 Versailles Road
MADISON COUNTySAT BEREA (859) 986-0357 101 Brenwood Street
SAT RICHMOND (859) 625-6500 350 W. Main Street
SAT NICHOLASVILLE (859) 885-2282 301 N. Main Street 1471 Keene Road
NORTHERN KENTUCKySAT CRESTVIEW HILLS (859) 905-5580 2850 Turkeyfoot Road
FLORENCE (859) 647-0222 7310 Turfway Road Suite 110
SAT FT. MITCHELL (859) 905-5590 2075 Dixie Highway
WINCHESTER (859) 744-3972 43 N. Maple StreetSAT 1110 Pioneer Drive
Central Bank of Jefferson County
LOUISVILLE Hurstbourne Place (502) 499-5600 9300 Shelbyville Road Suite 100
SAT TAyLORSVILLE ROAD (502) 493-2366 4630 Taylorsville Road
WATERFRONT PLAZA (502) 456-3838 321 W. Main Street
Whom to Call for More InformationThe Central Card
To report a lost or stolen card, call (859) 253-6359.
ATM Card
To report a lost or stolen card, call (859) 253-6359.
Central Insurance Services
(859) 253-6283
Central Investment Center
(859) 253-6435
Wealth Management
(859) 253-6246
Consumer Lending
(859) 253-6302
Client Services
For account information or for problem resolution, call (859) 253-6359 or (800) 637-6884.
MasterCard®/Visa®
For MasterCard®/Visa® account inquiries or to report a lost or stolen MasterCard® or Visa®, call (859) 253-6359.
Central Bank & Trust Co.
GEORGETOWN (502) 570-2265 100 W. Main StreetSAT 410 Connector Road
LEXINGTON MAIN OFFICE (859) 253-6222 300 W. Vine Street (ATM available in lobby and drive-thru)
SAT ANDOVER (859) 253-6127 3101 Maple Leaf Drive
EASTLAND (859) 253-6063 649 E. New Circle Road
NICHOLASVILLE ROAD (859) 253-6073 100 E. Reynolds Road
SAT NORTH PARK (859) 253-6104 515 New Circle Road, NW
SAT PALOMAR CENTRE (859) 253-6177 3700 Palomar Centre Drive
SAT RICHMOND ROAD (859) 253-6083 2233 Richmond Road
SIR BARTON, HAMBURG (859) 253-8760 2443 Sir Barton Way Suite 175
Free-Standing ATM Locations
CENTRAL BAPTIST HOSPITAL1740 S. Limestone, Lexington
FAyETTE DISTRICT COURT*150 N. Limestone Street, Lexington
SAINT JOSEPH HOSPITALOne Saint Joseph Drive, Lexington
WATTERSON TOWER1930 Bishop Lane, Louisville
RJ CORMAN AMBULATORy CENTER* 1250 Keene Road, Nicholasville
UK COMMONWEALTH STADIUM*
UK HOSPITAL* Pavilion A 1000 S. Limestone, Lexington
* Cash machine only
Banking Center Hours for Central Bank & Trust Co.
Lobbies are open Monday through Thursday from 9:00 a.m. to
4:00 p.m. and Friday from 9:00 a.m. to 6:00 p.m.
Our drive-thrus are open 8:00 a.m. to 6:00 p.m.
Monday through Friday.
SAT Saturday hours 9:00 a.m. to 1:00 p.m., as indicated.
Hours may vary by location. Please call for details or
visit centralbank.com for hours and locations.
Central Bank Mortgage
(859) 253-6001
Web Site
centralbank.com
Note: Products may vary by location and are subject to change without notice.

IN MEMORIAMRichard W. Furst
Director, Central Bank & Trust Co. & Central Bancshares, Inc.
We lost a trusted friend and advisor with the death of our associate Dr. Richard W. Furst on May 19, 2012. He was a valued friend who will be dearly missed and whose contributions to the Bank, its Board of Directors, the University of Kentucky, central Kentucky and the entire Commonwealth will be forever remembered and treasured. Since joining our Board, he provided sound advice and expert guidance on a wide variety of business and banking subjects. We will miss his tireless dedication to excellence, his unbending loyalty and his broad vision that served as a beacon of inspiration to all who knew him. He was truly a friend and comrade to all. Dr. Furst was a member of the Board of Central Bank & Trust Co. and Central Bancshares, Inc., having served since 2003. He was former Dean of the Gatton College of Business and Economics at the University of Kentucky and had been associated with the College of Business at the University of South Carolina and with the University of Missouri-St. Louis. His community service included the boards of Community Ventures, Inc.; Economic Development Planning Commission, Commonwealth of Kentucky; Commerce Lexington; Host Communications; UK Business Partnership Foundation; Office Suites Plus; Foam Design, Inc.; Seed Restaurant Group, Inc.; Armada Funds; and Parkstone Funds. Dr. Furst was a graduate of Alfred University and held a Doctorate in Business Administration and a Masters in Business Administration from Washington University. Our deepest sympathy has been extended to his family, including his wife, Janis Hatton Furst, his two children, Pamela Shunk and Stacie Holloway, one sister, Norma Gibson and six grandchildren: Stephen, Meaghan and Katherine Shunk, Ellie Furst and Andrew and Emily Holloway.
49

Central Bank & Trust Co. and Central Bank of Jefferson County are subsidiaries of Central Bancshares, Inc.
www.centralbank.com(859) 253-6222(800) 637-6884
Member FDIC


