50
LETOVÉ PREVÁDZKOVÉ SLUŽBY SLOVENSKEJ REPUBLIKY, štátny podnik AIR NAVIGATION SERVICES PROVIDER ANNUAL REPORT 2012
LETOVÉ PREVÁDZKOVÉ SLUŽBYSLOVENSKEJ REPUBLIKY,
štátny podnik
AIR NAVIGATION SERVICES PROVIDER
ANNUAL REPORT 2012
Letové prevádzkové služby Slovenskej republiky, štátny podnikAir navigation services provider
Ivanská cesta 93, 823 07 Bratislava 216, Slovak Republic

Letové prevádzkové služby Slovenskej republiky, štátny podnikAir navigation services provider
Ivanská cesta 93, 823 07 Bratislava 216, Slovak Republic
1ANNUAL REPORT 2012
Table of Contents
Preface by the Director General 2
Supervisory Board Report 3
Company Activities in 2012 4
Outlook for 2013 23
Independent auditor’s report DOMINANT AUDIT s. r. o. 24
Auditors’ report supplement 25
LPS SR Balance Sheet as of 31 December 2012 (EUR) 26
LPS SR Full Profit and Loss Statement as of 31. 12. 2012 (EUR) 27
Independent Auditors’ Report KPMG Slovensko spol. s r. o. 28
Independent Auditors’ Report 29
List of Abbreviations 47
2 ANNUAL REPORT 2012
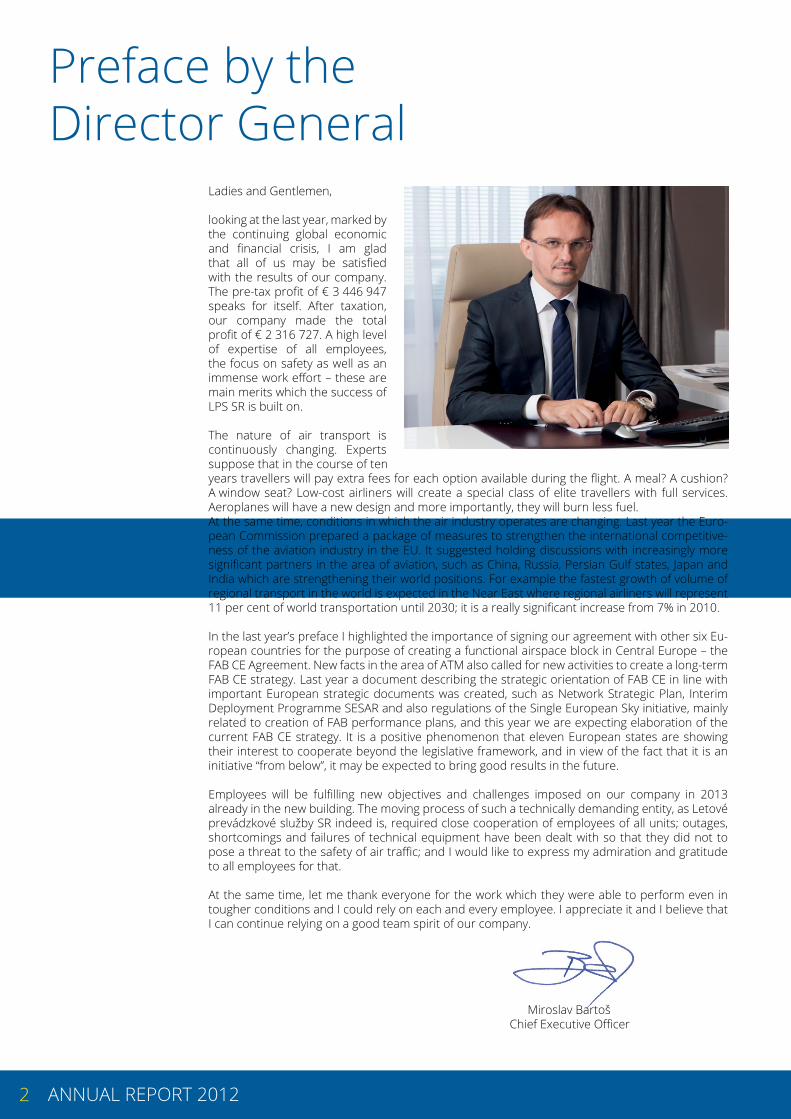
Preface by the Director General
Ladies and Gentlemen,
looking at the last year, marked by the continuing global economic and financial crisis, I am glad that all of us may be satisfied with the results of our company. The pre-tax profit of € 3 446 947 speaks for itself. After taxation, our company made the total profit of € 2 316 727. A high level of expertise of all employees, the focus on safety as well as an immense work effort – these are main merits which the success of LPS SR is built on.
The nature of air transport is continuously changing. Experts suppose that in the course of ten years travellers will pay extra fees for each option available during the flight. A meal? A cushion? A window seat? Low-cost airliners will create a special class of elite travellers with full services. Aeroplanes will have a new design and more importantly, they will burn less fuel.At the same time, conditions in which the air industry operates are changing. Last year the Euro-pean Commission prepared a package of measures to strengthen the international competitive-ness of the aviation industry in the EU. It suggested holding discussions with increasingly more significant partners in the area of aviation, such as China, Russia, Persian Gulf states, Japan and India which are strengthening their world positions. For example the fastest growth of volume of regional transport in the world is expected in the Near East where regional airliners will represent 11 per cent of world transportation until 2030; it is a really significant increase from 7% in 2010.
In the last year’s preface I highlighted the importance of signing our agreement with other six Eu-ropean countries for the purpose of creating a functional airspace block in Central Europe – the FAB CE Agreement. New facts in the area of ATM also called for new activities to create a long-term FAB CE strategy. Last year a document describing the strategic orientation of FAB CE in line with important European strategic documents was created, such as Network Strategic Plan, Interim Deployment Programme SESAR and also regulations of the Single European Sky initiative, mainly related to creation of FAB performance plans, and this year we are expecting elaboration of the current FAB CE strategy. It is a positive phenomenon that eleven European states are showing their interest to cooperate beyond the legislative framework, and in view of the fact that it is an initiative “from below”, it may be expected to bring good results in the future.
Employees will be fulfilling new objectives and challenges imposed on our company in 2013 already in the new building. The moving process of such a technically demanding entity, as Letové prevádzkové služby SR indeed is, required close cooperation of employees of all units; outages, shortcomings and failures of technical equipment have been dealt with so that they did not to pose a threat to the safety of air traffic; and I would like to express my admiration and gratitude to all employees for that.
At the same time, let me thank everyone for the work which they were able to perform even in tougher conditions and I could rely on each and every employee. I appreciate it and I believe that I can continue relying on a good team spirit of our company.
Miroslav Bartoš Chief Executive Officer

3ANNUAL REPORT 2012
Supervisory BoardReport
In line with the Act No. 111/1990 Coll. on state enterprise, and in line with its statute, the Supervi-sory Board performed controlling activities focused on company’s economy and management in 2012.
At its meeting held on 13 May 2013, based on the audit of Financial Statements conducted by the auditing company of Dominant Audit s.r.o., J.Zemana 99, 911 01 Trenčín, SKAU license No 319, the Supervisory Board of Letové prevádzkové služby Slovenskej republiky, štátny podnik evaluated profit/loss of the company achieved in 2012.
It concluded that economic performance is in compliance with the current legislation and accoun-ting principles; and that the presented Financial Statements of Letové prevádzkové služby Sloven-skej republiky, štátny podnik show fairly, with all relevant respects, a financial situation and assets of the company as of 31 December 2012 and its profit/loss for the given year; and that it has been elaborated in compliance with the Act. No. 431/2002 Coll. on Accounting as amended, and in compliance with the Accounting Standards valid for corporate subjects using double entry bo-okkeeping in 2012. The Supervisory Board also stated that financial management of the company was balanced.
The Supervisory Board also discussed the company’s 2012 Financial Management Report com-piled for company’s founder and took it into consideration.
Ing. Martin Čatloš President of the Supervisory Board of Letové prevádzkové služby Slovenskej republiky, štátny podnik

4 ANNUAL REPORT 2012
Company Activities in 2012
ATM Domain
DERS (Division En-Route Services)There were 365,518 movements in FIR Bratislava in 2012 altogether, representing a total increase by 0.4%. No delay was reported in provision of air traffic control.In addition to their routine operational practice, the DERS staff contributed, through the Depart-ment of Methodology, to creation and adjustment of methodology related to the scope of work of the Division, and to assessment of changes in the ATM system in view of safety.
Theoretical and practical ATCO training In 2012 all ATCOs underwent a theoretical and practical training. The minimum number of exercises in the practical refresher training for 2012 was fully met. All DFICs, FDOs and AMMs underwent their theoretical and practical refresher training for 2012.
Sectorization in FIR BratislavaNot more than four sectors were activated at ACC Bratislava in 2012; the air traffic flow regulation was not applied.

5ANNUAL REPORT 2012
Air traffic - ACC Bratislava - IFR flights
Table 1: Comparison of the number of movements in 2011 and 2012
Overflights Inbound / Outbound flights Domestic flights Total
2011 2012 % 2011 2012 % 2011 2012 % 2011 2012 %1 22 762 22 232 -2,3 997 844 -15,3 164 140 -14,6 23 923 23 216 -3,0 2 19 530 19 814 1,5 896 852 -4,9 154 169 9,7 20 580 20 835 1,2 3 22 527 23 226 3,1 1 046 970 -7,3 217 213 -1,8 23 790 24 409 2,6 4 25 232 25 552 1,3 899 901 0,2 205 227 10,7 26 336 26 680 1,3 5 30 646 30 454 -0,6 1 207 971 -19,6 305 280 -8,2 32 158 31 705 -1,4 6 35 300 36 372 3,0 1 271 1 136 -10,6 273 258 -5,5 36 844 37 766 2,5 7 40 188 40 958 1,9 1 363 1 172 -14,0 202 231 14,4 41 753 42 361 1,5 8 38 051 39 666 4,2 1 314 1 195 -9,1 305 297 -2,6 39 670 41 158 3,8 9 35 686 36 170 1,4 1 195 1 087 -9,0 282 279 -1,1 37 163 37 536 1,0
10 32 654 31 054 -4,9 1 072 942 -12,1 226 287 27,0 33 952 32 283 -4,9 11 23 269 23 606 1,4 832 715 -14,1 206 192 -6,8 24 307 24 513 0,8 12 22 651 22 242 -1,8 844 678 -19,7 148 136 -8,1 23 643 23 056 -2,5
1-12 348 496 351 346 0,8 12 936 11 463 -11,4 2 687 2 709 0,8 364 119 365 518 0,4
Chart 1: Comparison of the total number of movements in 2011 and 2012
Chart 2: Comparison of the development of the number of movements for 2008 - 2012
Note: The significant drop in traffic in 2010 was caused by the eruption of the Icelandic volcano Eyjafjallajokull, leading to a full or partial closure of airspace of the Slovak Republic for three days.
0
10000
20000
30000
40000
1 2 3 4 5 6 7 8 9 10 11 12
20112012
2010
2011
2012
2008
2009
1 400
1 200
1 000
800
600
400
200

6 ANNUAL REPORT 2012
DAAS (Division Aerodrome and Approach Service)In 2012 the Division Aerodrome and Approach Service provided its services at TWR and APP units at the following aerodromes: TWR and APP Bratislava/M. R. Štefánik, Košice and TWR Piešťany, Poprad – Tatry and Žilina. There were no major shortcomings in the provision of air traffic services at these units.
APP/TWR Štefánik and TWR Piešťany
In 2012 there were no major shortcomings in the provision of air traffic services on the part of ATCOs.Provision of air traffic services and operational activity of the APP/TWR Štefánik units and the TWR Piešťany unit were performed in line with the 2012 Plan.
In the period from January to May an ATCO refresher training was carried out at APP/TWR Štefánik as well as a pre-OJT training to obtain the ADI/TWR rating of ATCO trainees.
In February a verification operation of extension of the EUROCAT system – E2000-PLCA - was launched.
In March an On-the-Job training in real operation started at the APP Štefánik unit.
Table 2: Comparison of the number of movements in 2011 and 2012 - Bratislava/M. R. Štefánik
NoAM - IFR NoAM - VFR NoAM NoOF NoM
2011 2012 % 2011 2012 % 2011 2012 % 2011 2012 % 2011 2012 %1 1 448 1 170 -19,2 85 90 5,9 1 533 1 260 -17,8 543 485 -10,7 2 076 1 745 -15,9 2 1 355 1 106 -18,4 133 137 3,0 1 488 1 243 -16,5 569 497 -12,7 2 057 1 740 -15,4 3 1 747 1 439 -17,6 276 334 21,0 2 023 1 773 -12,4 742 705 -5,0 2 765 2 478 -10,4 4 1 542 1 506 -2,3 223 343 53,8 1 765 1 849 4,8 861 846 -1,7 2 626 2 695 2,6 5 1 886 1 803 -4,4 396 370 -6,6 2 282 2 173 -4,8 1 022 929 -9,1 3 304 3 102 -6,1 6 2 513 2 192 -12,8 391 346 -11,5 2 904 2 538 -12,6 1 232 1 163 -5,6 4 136 3 701 -10,5 7 2 725 2 390 -12,3 309 425 37,5 3 034 2 815 -7,2 1 171 1 306 11,5 4 205 4 121 -2,0 8 2 639 2 417 -8,4 390 465 19,2 3 029 2 882 -4,9 1 479 1 295 -12,4 4 508 4 177 -7,3 9 2 487 2 262 -9,0 404 449 11,1 2 891 2 711 -6,2 1 328 1 293 -2,6 4 219 4 004 -5,1
10 1 843 1 778 -3,5 243 409 68,3 2 086 2 187 4,8 1 032 1 030 -0,2 3 118 3 217 3,2 11 1 425 1 228 -13,8 116 245 111,2 1 541 1 473 -4,4 708 770 8,8 2 249 2 243 -0,3 12 1 239 1 057 -14,7 78 84 7,7 1 317 1 141 -13,4 599 544 -9,2 1 916 1 685 -12,1
1-12 22 849 20 348 -10,9 3 044 3 697 21,5 25 893 24 045 -7,1 11 286 10 863 -3,7 37 179 34 908 -6,1
Chart 3: Comparison of the number of movements in 2011 and 2012 - Bratislava/M. R. Štefánik
0
1000
2000
3000
4000
1 2 3 4 5 6 7 8 9 10 11 12
20112012
7ANNUAL REPORT 2012
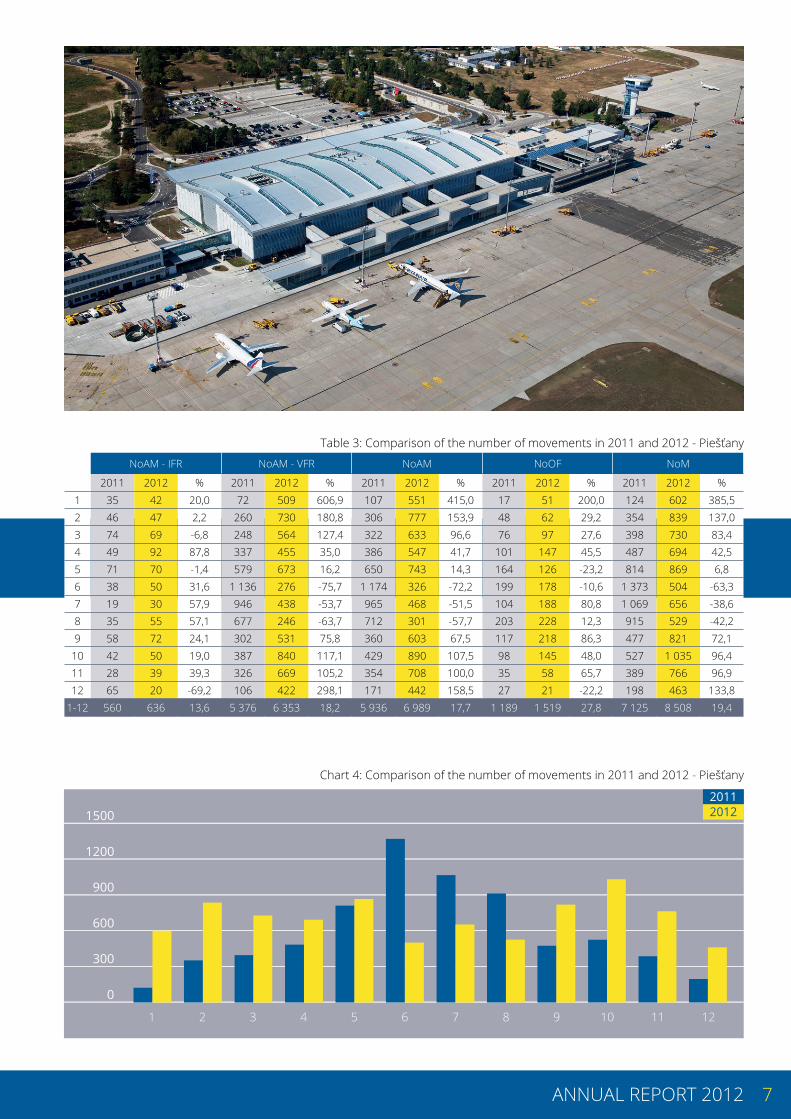
Table 3: Comparison of the number of movements in 2011 and 2012 - Piešťany
NoAM - IFR NoAM - VFR NoAM NoOF NoM
2011 2012 % 2011 2012 % 2011 2012 % 2011 2012 % 2011 2012 %1 35 42 20,0 72 509 606,9 107 551 415,0 17 51 200,0 124 602 385,5 2 46 47 2,2 260 730 180,8 306 777 153,9 48 62 29,2 354 839 137,0 3 74 69 -6,8 248 564 127,4 322 633 96,6 76 97 27,6 398 730 83,4 4 49 92 87,8 337 455 35,0 386 547 41,7 101 147 45,5 487 694 42,5 5 71 70 -1,4 579 673 16,2 650 743 14,3 164 126 -23,2 814 869 6,8 6 38 50 31,6 1 136 276 -75,7 1 174 326 -72,2 199 178 -10,6 1 373 504 -63,3 7 19 30 57,9 946 438 -53,7 965 468 -51,5 104 188 80,8 1 069 656 -38,6 8 35 55 57,1 677 246 -63,7 712 301 -57,7 203 228 12,3 915 529 -42,2 9 58 72 24,1 302 531 75,8 360 603 67,5 117 218 86,3 477 821 72,1
10 42 50 19,0 387 840 117,1 429 890 107,5 98 145 48,0 527 1 035 96,4 11 28 39 39,3 326 669 105,2 354 708 100,0 35 58 65,7 389 766 96,9 12 65 20 -69,2 106 422 298,1 171 442 158,5 27 21 -22,2 198 463 133,8
1-12 560 636 13,6 5 376 6 353 18,2 5 936 6 989 17,7 1 189 1 519 27,8 7 125 8 508 19,4
Chart 4: Comparison of the number of movements in 2011 and 2012 - Piešťany
0
300
600
900
1200
1500
1 2 3 4 5 6 7 8 9 10 11 12
20112012
8 ANNUAL REPORT 2012
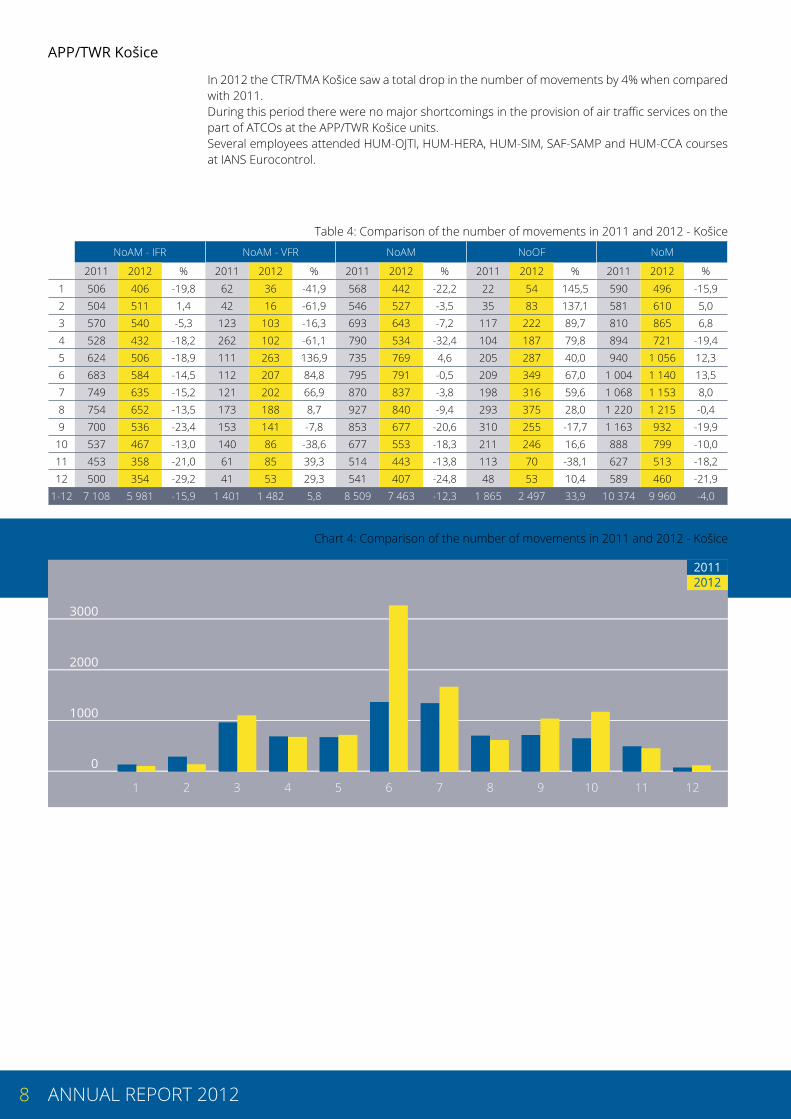
APP/TWR Košice
In 2012 the CTR/TMA Košice saw a total drop in the number of movements by 4% when compared with 2011.During this period there were no major shortcomings in the provision of air traffic services on the part of ATCOs at the APP/TWR Košice units.Several employees attended HUM-OJTI, HUM-HERA, HUM-SIM, SAF-SAMP and HUM-CCA courses at IANS Eurocontrol.
Table 4: Comparison of the number of movements in 2011 and 2012 - Košice
NoAM - IFR NoAM - VFR NoAM NoOF NoM
2011 2012 % 2011 2012 % 2011 2012 % 2011 2012 % 2011 2012 %1 506 406 -19,8 62 36 -41,9 568 442 -22,2 22 54 145,5 590 496 -15,9 2 504 511 1,4 42 16 -61,9 546 527 -3,5 35 83 137,1 581 610 5,0 3 570 540 -5,3 123 103 -16,3 693 643 -7,2 117 222 89,7 810 865 6,8 4 528 432 -18,2 262 102 -61,1 790 534 -32,4 104 187 79,8 894 721 -19,4 5 624 506 -18,9 111 263 136,9 735 769 4,6 205 287 40,0 940 1 056 12,3 6 683 584 -14,5 112 207 84,8 795 791 -0,5 209 349 67,0 1 004 1 140 13,5 7 749 635 -15,2 121 202 66,9 870 837 -3,8 198 316 59,6 1 068 1 153 8,0 8 754 652 -13,5 173 188 8,7 927 840 -9,4 293 375 28,0 1 220 1 215 -0,4 9 700 536 -23,4 153 141 -7,8 853 677 -20,6 310 255 -17,7 1 163 932 -19,9
10 537 467 -13,0 140 86 -38,6 677 553 -18,3 211 246 16,6 888 799 -10,0 11 453 358 -21,0 61 85 39,3 514 443 -13,8 113 70 -38,1 627 513 -18,2 12 500 354 -29,2 41 53 29,3 541 407 -24,8 48 53 10,4 589 460 -21,9
1-12 7 108 5 981 -15,9 1 401 1 482 5,8 8 509 7 463 -12,3 1 865 2 497 33,9 10 374 9 960 -4,0
Chart 4: Comparison of the number of movements in 2011 and 2012 - Košice
0
1000
2000
3000
1 2 3 4 5 6 7 8 9 10 11 12
20112012
9ANNUAL REPORT 2012
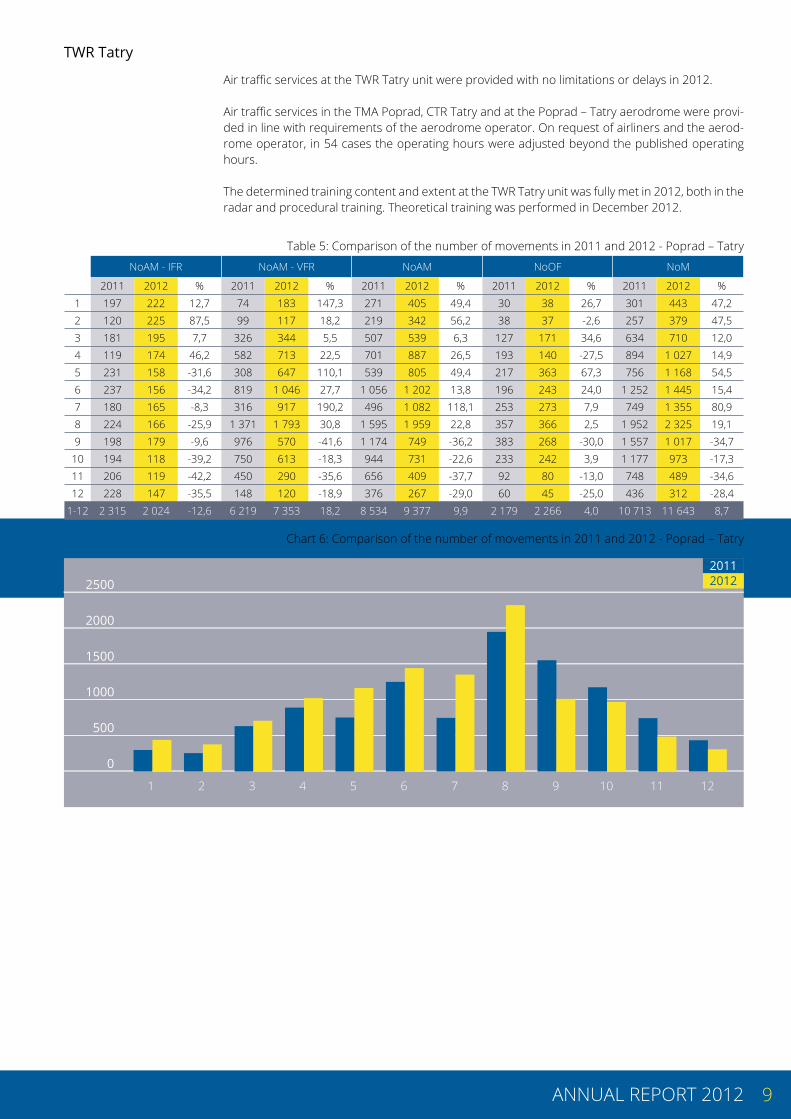
TWR Tatry
Air traffic services at the TWR Tatry unit were provided with no limitations or delays in 2012.
Air traffic services in the TMA Poprad, CTR Tatry and at the Poprad – Tatry aerodrome were provi-ded in line with requirements of the aerodrome operator. On request of airliners and the aerod-rome operator, in 54 cases the operating hours were adjusted beyond the published operating hours.
The determined training content and extent at the TWR Tatry unit was fully met in 2012, both in the radar and procedural training. Theoretical training was performed in December 2012.
Table 5: Comparison of the number of movements in 2011 and 2012 - Poprad – Tatry
NoAM - IFR NoAM - VFR NoAM NoOF NoM
2011 2012 % 2011 2012 % 2011 2012 % 2011 2012 % 2011 2012 %1 197 222 12,7 74 183 147,3 271 405 49,4 30 38 26,7 301 443 47,2 2 120 225 87,5 99 117 18,2 219 342 56,2 38 37 -2,6 257 379 47,5 3 181 195 7,7 326 344 5,5 507 539 6,3 127 171 34,6 634 710 12,0 4 119 174 46,2 582 713 22,5 701 887 26,5 193 140 -27,5 894 1 027 14,9 5 231 158 -31,6 308 647 110,1 539 805 49,4 217 363 67,3 756 1 168 54,5 6 237 156 -34,2 819 1 046 27,7 1 056 1 202 13,8 196 243 24,0 1 252 1 445 15,4 7 180 165 -8,3 316 917 190,2 496 1 082 118,1 253 273 7,9 749 1 355 80,9 8 224 166 -25,9 1 371 1 793 30,8 1 595 1 959 22,8 357 366 2,5 1 952 2 325 19,1 9 198 179 -9,6 976 570 -41,6 1 174 749 -36,2 383 268 -30,0 1 557 1 017 -34,7
10 194 118 -39,2 750 613 -18,3 944 731 -22,6 233 242 3,9 1 177 973 -17,3 11 206 119 -42,2 450 290 -35,6 656 409 -37,7 92 80 -13,0 748 489 -34,6 12 228 147 -35,5 148 120 -18,9 376 267 -29,0 60 45 -25,0 436 312 -28,4
1-12 2 315 2 024 -12,6 6 219 7 353 18,2 8 534 9 377 9,9 2 179 2 266 4,0 10 713 11 643 8,7
Chart 6: Comparison of the number of movements in 2011 and 2012 - Poprad – Tatry
0
500
1000
1500
2000
2500
1 2 3 4 5 6 7 8 9 10 11 12
20112012

10 ANNUAL REPORT 2012
TWR Žilina
In 2012 no major shortcomings in air traffic control were on the part of the ATS staff; there were no delays or flight denials at the Žilina aerodrome. In comparison with 2011, the traffic increased by 36.2%, mainly due to a significant increase in the number of VFR flights.The operating hours of the TWR Žilina unit were changed in view of new flight schedules and requirements of the aerodrome operator.
The ATCO theoretical and practical training was divided into a spring and autumn part. Cooperation with other LPS SR units or other entities within the Žilina aerodrome was flawless.
Table 6: Comparison of the number of movements in 2011 and 2012 - Žilina
NoAM - IFR NoAM - VFR NoAM NoOF NoM
2011 2012 % 2011 2012 % 2011 2012 % 2011 2012 % 2011 2012 %1 43 47 9,3 93 38 -59,1 136 85 -37,5 9 30 233,3 145 115 -20,7 2 93 34 -63,4 186 78 -58,1 279 112 -59,9 18 37 105,6 297 149 -49,8 3 131 78 -40,5 763 952 24,8 894 1 030 15,2 80 81 1,3 974 1 111 14,1 4 125 190 52,0 522 400 -23,4 647 590 -8,8 51 98 92,2 698 688 -1,4 5 124 155 25,0 461 478 3,7 585 633 8,2 99 95 -4,0 684 728 6,4 6 203 195 -3,9 1 092 3 012 175,8 1 295 3 207 147,6 78 69 -11,5 1 373 3 276 138,6 7 162 71 -56,2 1 137 1 500 31,9 1 299 1 571 20,9 54 102 88,9 1 353 1 673 23,7 8 173 91 -47,4 406 372 -8,4 579 463 -20,0 133 161 21,1 712 624 -12,4 9 134 142 6,0 487 804 65,1 621 946 52,3 104 99 -4,8 725 1 045 44,1
10 198 137 -30,8 411 955 132,4 609 1 092 79,3 51 89 74,5 660 1 181 78,9 11 128 99 -22,7 331 331 0,0 459 430 -6,3 44 34 -22,7 503 464 -7,8 12 57 26 -54,4 16 79 393,8 73 105 43,8 14 23 64,3 87 128 47,1
1-12 1 571 1 265 -19,5 5 905 8 999 52,4 7 476 10 264 37,3 735 918 24,9 8 211 11 182 36,2
Chart 7: Comparison of the number of movements in 2011 and 2012 - Žilina
In 2012 the DAAS staff contributed, through the Department of Methodology, to creation and adjustment of methodology related to the scope of work of the Division, and to assessment of changes in the ATM system in view of safety.
0
300
600
900
1200
1500
1 2 3 4 5 6 7 8 9 10 11 12
20112012
11ANNUAL REPORT 2012
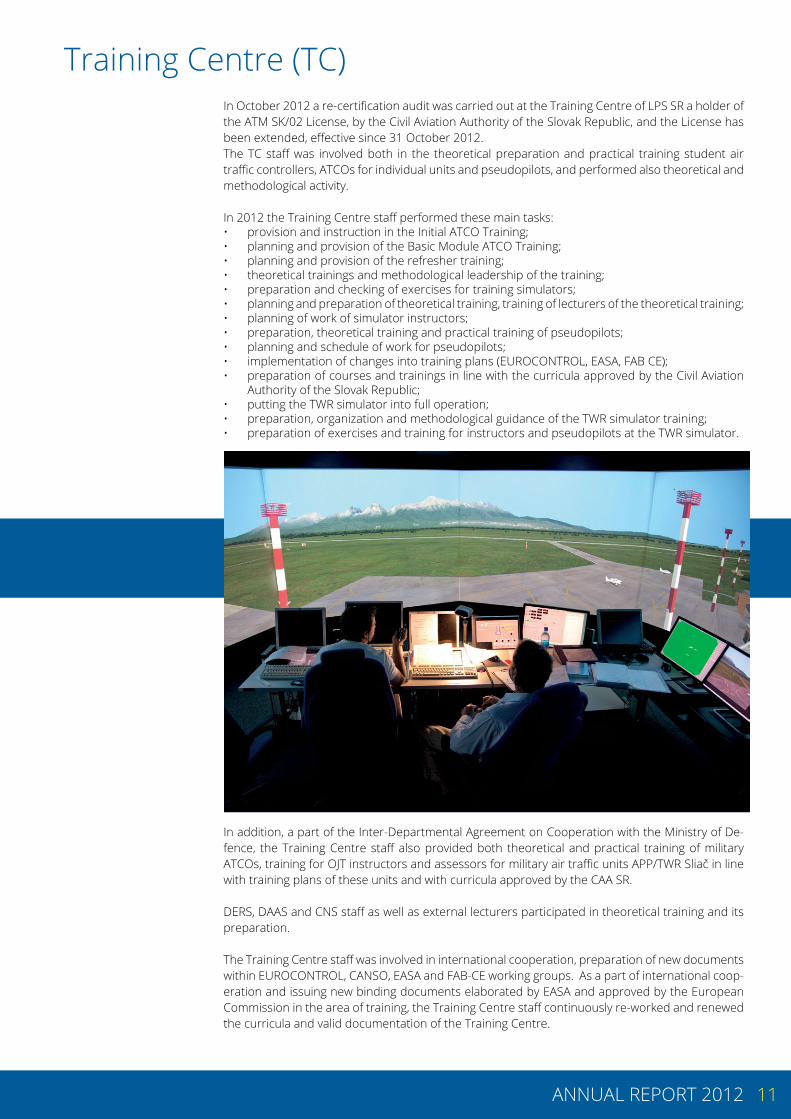
Training Centre (TC)In October 2012 a re-certification audit was carried out at the Training Centre of LPS SR a holder of the ATM SK/02 License, by the Civil Aviation Authority of the Slovak Republic, and the License has been extended, effective since 31 October 2012. The TC staff was involved both in the theoretical preparation and practical training student air traffic controllers, ATCOs for individual units and pseudopilots, and performed also theoretical and methodological activity.
In 2012 the Training Centre staff performed these main tasks: • provision and instruction in the Initial ATCO Training;• planning and provision of the Basic Module ATCO Training; • planning and provision of the refresher training;• theoretical trainings and methodological leadership of the training;• preparation and checking of exercises for training simulators;• planning and preparation of theoretical training, training of lecturers of the theoretical training;• planning of work of simulator instructors;• preparation, theoretical training and practical training of pseudopilots; • planning and schedule of work for pseudopilots;• implementation of changes into training plans (EUROCONTROL, EASA, FAB CE); • preparation of courses and trainings in line with the curricula approved by the Civil Aviation
Authority of the Slovak Republic;• putting the TWR simulator into full operation; • preparation, organization and methodological guidance of the TWR simulator training; • preparation of exercises and training for instructors and pseudopilots at the TWR simulator.
In addition, a part of the Inter-Departmental Agreement on Cooperation with the Ministry of De-fence, the Training Centre staff also provided both theoretical and practical training of military ATCOs, training for OJT instructors and assessors for military air traffic units APP/TWR Sliač in line with training plans of these units and with curricula approved by the CAA SR.
DERS, DAAS and CNS staff as well as external lecturers participated in theoretical training and its preparation.
The Training Centre staff was involved in international cooperation, preparation of new documents within EUROCONTROL, CANSO, EASA and FAB-CE working groups. As a part of international coop-eration and issuing new binding documents elaborated by EASA and approved by the European Commission in the area of training, the Training Centre staff continuously re-worked and renewed the curricula and valid documentation of the Training Centre.
12 ANNUAL REPORT 2012
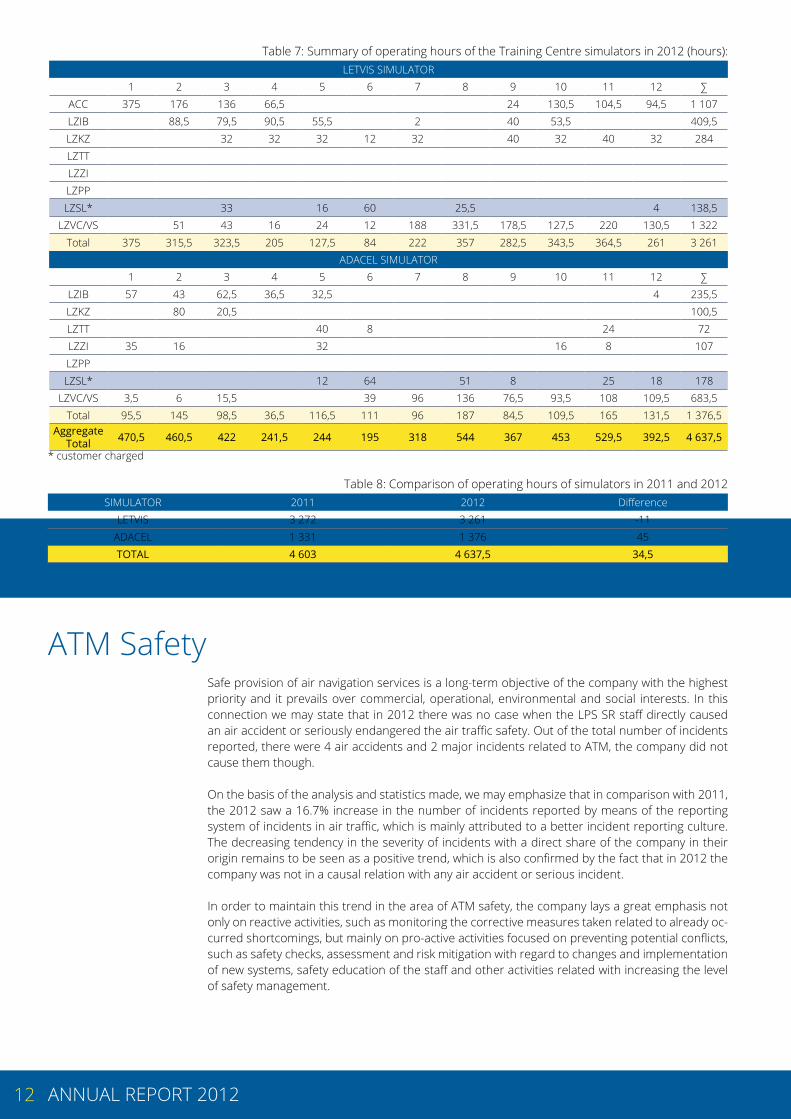
Table 7: Summary of operating hours of the Training Centre simulators in 2012 (hours):LETVIS SIMULATOR
1 2 3 4 5 6 7 8 9 10 11 12 ∑ACC 375 176 136 66,5 24 130,5 104,5 94,5 1 107LZIB 88,5 79,5 90,5 55,5 2 40 53,5 409,5LZKZ 32 32 32 12 32 40 32 40 32 284LZTTLZZILZPPLZSL* 33 16 60 25,5 4 138,5
LZVC/VS 51 43 16 24 12 188 331,5 178,5 127,5 220 130,5 1 322Total 375 315,5 323,5 205 127,5 84 222 357 282,5 343,5 364,5 261 3 261
ADACEL SIMULATOR1 2 3 4 5 6 7 8 9 10 11 12 ∑
LZIB 57 43 62,5 36,5 32,5 4 235,5LZKZ 80 20,5 100,5LZTT 40 8 24 72LZZI 35 16 32 16 8 107LZPPLZSL* 12 64 51 8 25 18 178
LZVC/VS 3,5 6 15,5 39 96 136 76,5 93,5 108 109,5 683,5Total 95,5 145 98,5 36,5 116,5 111 96 187 84,5 109,5 165 131,5 1 376,5
Aggregate Total 470,5 460,5 422 241,5 244 195 318 544 367 453 529,5 392,5 4 637,5
* customer charged
Table 8: Comparison of operating hours of simulators in 2011 and 2012SIMULATOR 2011 2012 Difference
LETVIS 3 272 3 261 -11ADACEL 1 331 1 376 45TOTAL 4 603 4 637,5 34,5
ATM SafetySafe provision of air navigation services is a long-term objective of the company with the highest priority and it prevails over commercial, operational, environmental and social interests. In this connection we may state that in 2012 there was no case when the LPS SR staff directly caused an air accident or seriously endangered the air traffic safety. Out of the total number of incidents reported, there were 4 air accidents and 2 major incidents related to ATM, the company did not cause them though.
On the basis of the analysis and statistics made, we may emphasize that in comparison with 2011, the 2012 saw a 16.7% increase in the number of incidents reported by means of the reporting system of incidents in air traffic, which is mainly attributed to a better incident reporting culture. The decreasing tendency in the severity of incidents with a direct share of the company in their origin remains to be seen as a positive trend, which is also confirmed by the fact that in 2012 the company was not in a causal relation with any air accident or serious incident. In order to maintain this trend in the area of ATM safety, the company lays a great emphasis not only on reactive activities, such as monitoring the corrective measures taken related to already oc-curred shortcomings, but mainly on pro-active activities focused on preventing potential conflicts, such as safety checks, assessment and risk mitigation with regard to changes and implementation of new systems, safety education of the staff and other activities related with increasing the level of safety management.
13ANNUAL REPORT 2012
Search and RescueIn the period under review, activities of the RCC unit were performed in compliance with the mission of the company, i.e. they were aimed at organization, coordination and management of search and rescue services assisting any aircraft in emergency.
In 2012 the services of the centre were used 457 times in 407 particular cases, representing an increase by 10% in comparison with 2011. This fact is a result of a higher number of emergency phases, an increased number of outages of ground equipment, as well as a higher number of SATM.
37 cases involved receiving transmissions on frequencies determined for emergency locator trans-mitters (ELT), whereas their source was not identified in 15 cases, but after their assessment it was determined that they could not have been serious incidents and the transmission was caused by mis-manipulation with the stated device, unreported maintenance, or they were false.
174 cases were incidents, 2 cases were serious incidents. Nonetheless, there were as many as 11 air accidents (in 2011 there were only 6) in which two persons died.
There were 22 cases of prolonged lost of communication flights within the airspace of the Slovak Republic; the radio communication was lost 11 times.
In 3 cases it was necessary to declare the distress phase DETRESFA (2 times in connection with an aircraft crash and once after an aircraft’s engine failure), in 10 cases it was necessary to declare the alert phase ALERFA, but except for one case of an aircraft accident, the remaining flights ended up with safe landing without any further problems. In 10 cases also the uncertainty phase INCERFA was declared, always because pilots did not report landing at the determined time or due to con-nection failure.
In 172 cases a SATM report was distributed by 57 reports more in comparison with the last year when there were only 115 of them, and there were 17 ‚miscellaneous incidents’. There were 29 cases of birdstrikes; last year there were as many as 34 cases.Last year’s flight crews have reported aircraft exposed to lasers. This year there were 23 cases of such exposure, representing a drop by 5 compared to the last year.
10 cases required coordination with neighbouring RCCs and in 24 cased we received reports from the Cospas-Sarsat centre on receiving emergency frequency (406 MHz) transmission which had to be assessed and localized, but in none of the cases was it related to an aircraft crash in our territory and in most cases they were ELT device serviceability tests.
14 ANNUAL REPORT 2012
CNS DomainBased on the achieved figures defining reliability (availability) of the supplied services, CNS systems and devices in operation, it is clear that the overall average availability was higher than 99.5% in 2012.
Total availability of technical devices and systems which provide aeronautical telecommunication services, data transfer telecommunication services and technical support of air traffic services is requested to be higher than 99.5% for the period under review.
In 2012 there were 787 components of CNS systems and devices registered in the SPI SERVIO databases. The increase in the number of registered components in comparison with 2011 has been caused by introducing a new SPI SERVIO system where the output function of a CNS device is monitored in view of availability of the technical functionality of redundant parts of the given device.
In addition to ensuring the provision of ATS technical services and supporting information sys-tems necessary for company’s administration, in 2012 work activities of the CNS Division were also focused on key projects, mainly testing new systems and equipment forming a part of the new administrative and operational building of LPS SR (AOB) and on taking over the AOB as a whole. Then on 5 November 2012 a shadow operation started in the new operational building. The CNS Division also actively participated in the implementation stage of the FAB CE project.
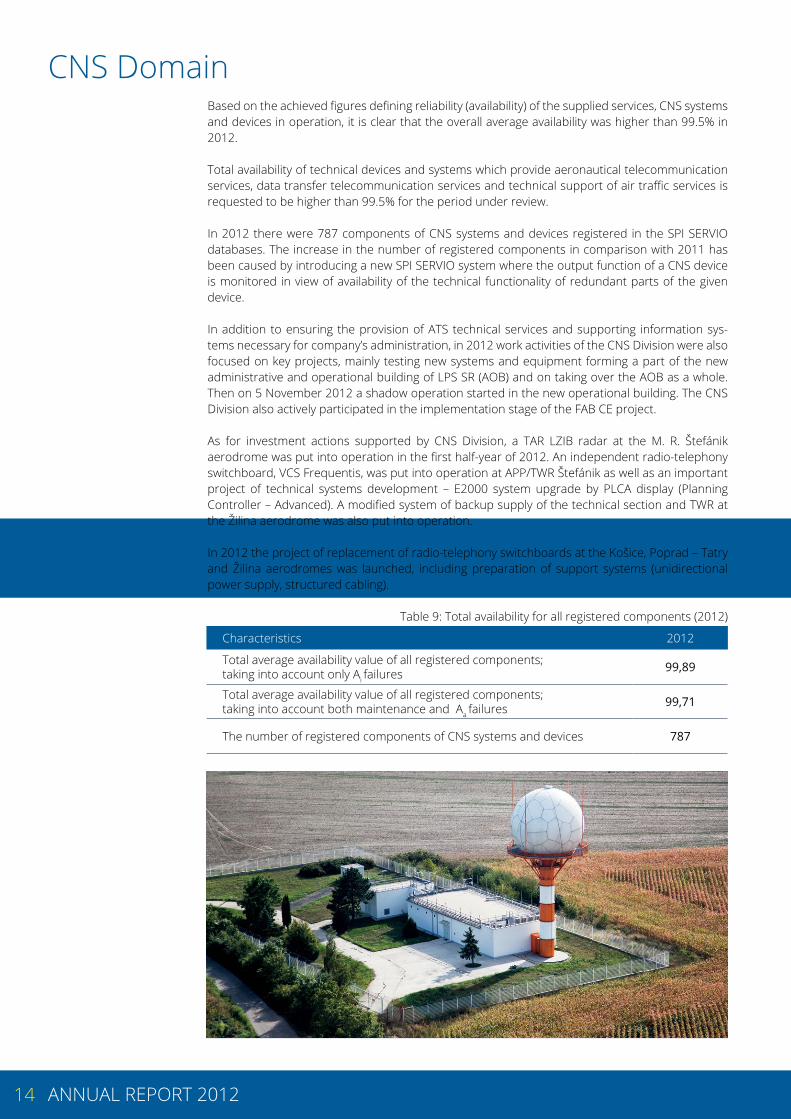
As for investment actions supported by CNS Division, a TAR LZIB radar at the M. R. Štefánik aerodrome was put into operation in the first half-year of 2012. An independent radio-telephony switchboard, VCS Frequentis, was put into operation at APP/TWR Štefánik as well as an important project of technical systems development – E2000 system upgrade by PLCA display (Planning Controller – Advanced). A modified system of backup supply of the technical section and TWR at the Žilina aerodrome was also put into operation.
In 2012 the project of replacement of radio-telephony switchboards at the Košice, Poprad – Tatry and Žilina aerodromes was launched, including preparation of support systems (unidirectional power supply, structured cabling).
Table 9: Total availability for all registered components (2012)
Characteristics 2012
Total average availability value of all registered components; taking into account only Ai failures 99,89
Total average availability value of all registered components; taking into account both maintenance and Aa failures 99,71
The number of registered components of CNS systems and devices 787
15ANNUAL REPORT 2012
Aeronautical Information Service (AIS)In addition to main activities of the Department of Aeronautical Information Management (AIM) and performance of the Aeronautical Information Service (AIS), the AIM staff also performed other activities, namely issuing L-series of aviation regulations as well as other documents, and activities of a sales point of ICAO documents. Amendment service of the Aeronautical Information Publi-cation of the SR was ensured as a part of performing aeronautical information service, and other parts of the integrated set of aeronautical information were issued in line with requirements and needs of users. No shortcomings in the provision of the aeronautical information service were seen during monitored period.
Commission Regulation No 73/2010 In relation to implementation of the Commission Regulation (EU) No 73/2010 laying down require-ments on the quality of aeronautical data and aeronautical information for the single European sky, the AIM staff actively participated in activities of a working group established for this purpose by the Ministry of Transport.At the same time, there were intensive activities related to preparation of an application which is supposed to ensure creating, commenting, approving and processing background documents for amending aeronautical information in the electronic form, which is one of essential conditions of implementation of the Regulation.
Ensuring compliance with the SES legislationIn line with the certificate of the air navigation services provider issued by the National Supervisory Authority of the Slovak Republic (NSA), activities were performed which ensure compliance with common requirements of relevant regulations of the European Commission. The CAA ensured compliance by continuous supervision.
Preparation of FAB CE ATC catalogue of aeronautical informationIn the second half of 2012 the AIM staff intensively participated in activities of the FAB CE working group (OPS WG Interface with MET and AIS) in order to define a uniform catalogue of aeronautical information which should be commonly available for ATS within FAB CE. The AIM Department per-formed activities in order to coordinate requirements with other units of the company.
Implementation of changes in the ICAO flight plan content and form (FPL 2012)The International Civil Aviation Organization (ICAO) approved changes in the ICAO flight plan con-tent and format (FPL), effective from 15 November 2012. In this connection in September the AIM staff was involved in testing the planned changes within testing blocks of EUROCONTROL, OPT5 and OPT6. At the same time, coordination with other units within the company and preparation of procedures for common transfer were carried out. Based on the results of testing and re-quirements of users, adjustments of the IBAF system were planned, and coordination with other entities, such as CAA SR, air carriers, etc. was carried out. The transfer to the FPL 2012 format was successful in line with the transfer plan.
Aeronautical information service provision systems In order to provide high-quality services and to meet the requirements of the users, in 2012 new functionalities were designed, tested and implemented in the eWizard, IntegMon and IBAF sys-tems and also adjustments of the AIM web page were made.
Human ResourcesLegal agenda and general administration cross sectional tasksThe General Administration Department was providing general advisory activities and legal advi-sory activities, including information on valid legal standards and opinions on legal issues. It was assessing and elaborating opinions on directive documents of the company.
As of 31 December 2012, out of the total number of 166 contract drafts or annexes to concluded contracts recorded in the DMS system, the Legal Department (PRAV) assessed and commented on 132 contract drafts in the area of commercial and civil law, and contracts related to handling the state property administered by the company. Within its activities, PRAV was involved in prepara-
16 ANNUAL REPORT 2012
tion of contracts, and it assessed and commented on all contract drafts, and performed inspection of legal and formal correctness of contracts. It acted in the agenda of regulation of ownership relations to the new administrative-operational building.PRAV evaluated claims from the point of view of their enforceability and prevented them from coming under the statute of limitation by filing a claim at a relevant court. It proposed deprecia-tion of bad debts in cases of foreign debtors after finding out certain facts in the debtor’s country.
Human ResourcesAs of 31 December 2012, the company had 472 employees, of whom 132 were women. The aver-age registered number of employees calculated for the monitored period was 469. The human resources development policy was focused on meeting the requirements resulting from international contracts and requirements of EU legislation for the safety of air traffic.As a part of enhancing the staff qualification, an emphasis was laid on language preparation of employees. The language education was focused on courses of the English language for the staff - internal forms of education, external courses for employees who work outside Bratislava and spe-cial courses for air traffic controllers in relation to their preparation for examination in accordance with ICAO requirements. Trainings, courses and seminars held in Slovakia, as well as enhancement of expert qualification of staff was focused on trainings for new technologies, amendments of legal regulations in the legal-labour area, tax and wage issues, on increasing the quality of managerial skills, expert skills in the area of information technologies and team-work skills. Attention was also paid to foreign expert courses – professional courses were arranged for 79 employees at the In-stitute of Air Navigation Services, EUROCONTROL.
Occupational health and safety (OHS) and fire prevention (FP)The unit performed several checks in the premises of the new AOB. It participated in several in-spection days as well as individual acceptance discussions.The unit continued to perform trainings for employees of supplier organizations as well as for the employees of LPS SR focused on OHS and FP for the new building.It carried out OHS and FP inspections at the aerodromes in Poprad, Košice and holiday house Stará Lesná.
InspectionIn 2012 the inspection activity in LPS SR was performed in line with the Internal Directive of LPS SR – Internal inspection activity – and the approved controlling plan. In 2012 ten inspections were planned to be performed by the Legal Department and the Department of Internal Control. The inspections were aimed at checking if public statutes and internal directives were being followed, mainly in the area of procurement, stock management, travel compensations and maintenance and repairs of assets. Five inspections were finished with inspection reports (no shortcomings were identified) and five inspections were finished with inspection protocols (less serious – mainly administrative shortcomings were identified). Measures were taken based on the inspection pro-tocols.In 2012 only one inspection was performed by external inspection authorities in LPS SR The in-spection was performed by the Ministry of Interior of SR – Slovak National Archive. The inspection was focused on administration of the filing department for the period since the Act No 395/2002 Coll. on Archives and Filing Departments and on amendments and supplements to certain laws, as amended, became effective. Two cases of inconsistence were identified during the inspection and measures were imposed to remedy them (to change the colour of a stamp and to ensure keeping file covers).
Company’s specialized establishmentsIn the company’s recovery, training and recreation centre in Rajecké Teplice there were 651 per-sons put up in 2012.88 air traffic controllers participated in recovery stays. LPS SR’s methodological days and other work events were held at the establishment (69 persons). Recreation stays were provided to 494 persons.
In 2012 there were 288 persons put up in the specialized establishment in Banská Štiavnica. There were business trips, 1-week-long recreation stays organized during school holidays as well as short weekend stays organized in the establishment.
In the holiday house in Stará Lesná there were 129 persons put up in 2012, mostly for 1-week-long stays.

17ANNUAL REPORT 2012
Economic situationEvaluation of company’s economic performance as of 31 December 2012The tasks set in the 2012 Financial Plan expected a continuing trend of increasing the company’s efficiency and achieving the necessary volume of revenues to make a profit.
As for the costs, the 2012 Financial Plan supposed drawing of costs at the height of € 62 704 598. The actual volume of costs drawn was € 59 891 600, representing a saving of € 2 812 998, i.e. ex-pressed in percentage, the projected costs were drawn at 95.51%.
As of 31 December 2012, the total LPS SR revenues amounted to € 62 208 328, representing 98.60% of the Annual Plan, set at € 63 092 741.
The 2012 Financial Plan expected a post-tax profit of € 388 143. The actual post-tax profit amount-ed to € 2 316 727.
CostsAs for costs, the 2012 Plan of LPS SR established the total volume of costs for providing safe and smooth air traffic at € 62 704 598. As of 31 December 2012, the actual drawing amounted to € 59 891 600, i.e. the annual Financial Plan was drawn up to 95.51%.
Divided into individual kinds of costs items, the actual drawing in comparison with the 2012 Plan was as follows: • Consumed purchases: 85.40% of the Annual Plan were drawn.• Services: 75.88% of the Annual Plan were drawn.• Total staff costs: 97.19% of the Annual Plan were drawn. In 2012 96.70% of wages were drawn
in comparison with the planned volume of this costs item. The costs item ‘remuneration of Board members of company’ was drawn at 98.39%.
• Taxes and fees: 130.89% of the Annual Plan were drawn. The Plan was exceeded in the ‘motor vehicle tax’ and ‘other taxes and fees’ items.
• Other business costs: 114.87% of the Annual Plan were drawn The increase was caused by creation of provisions for uncollectible receivables.
• Depreciation and amortization: 90.13% of the Annual Plan were drawn. • Financial costs: 20.05% of the Annual Plan were drawn. The reason for low pursuance of finan-
cial costs is negotiation of a significantly lower interest rate applied for the investment loan than expected in the Plan.
RevenuesAs of 31 December 2012, LPS SR achieved the total revenues of € 62 208 328, representing 98.60% of the Annual PlanThis result was largely influenced by revenues from en-route navigation services (en-route charg-es), invoiced in the amount of € 55 049 338. In comparison with 2011, the revenues from en-route services increased by 14.84%; in financial terms, that means an increase by € 7 112 633.
2012 saw a drop in the ‘terminal services’ item (terminal charges) by € 493 414 in comparison with
60 000
40 000
20 000
0
2008 2009 2010 2011 2012
60 000
40 000
20 000
0
2008 2009 2010 2011 2012
Chart 8: Total costs evolution for 2008- 2012 Chart 9: Total revenues evolution for 2008- 2012
18 ANNUAL REPORT 2012
2011, representing a drop by 10.20%.
As for the structure of revenues classified according to the kind of services provided, the pursuing of revenues as of 31 December 2012 in comparison with the Annual Plan was as follows:• En-route charges: 95.78% of the Annual Plan.• Terminal charges: 101.71% of the Annual Plan.• Other revenues from the sale of services: 121.40% of the Annual Plan.• Other business revenues: 538.66% of the Annual Plan.• Financial revenues: 207.18% of the Annual Plan.
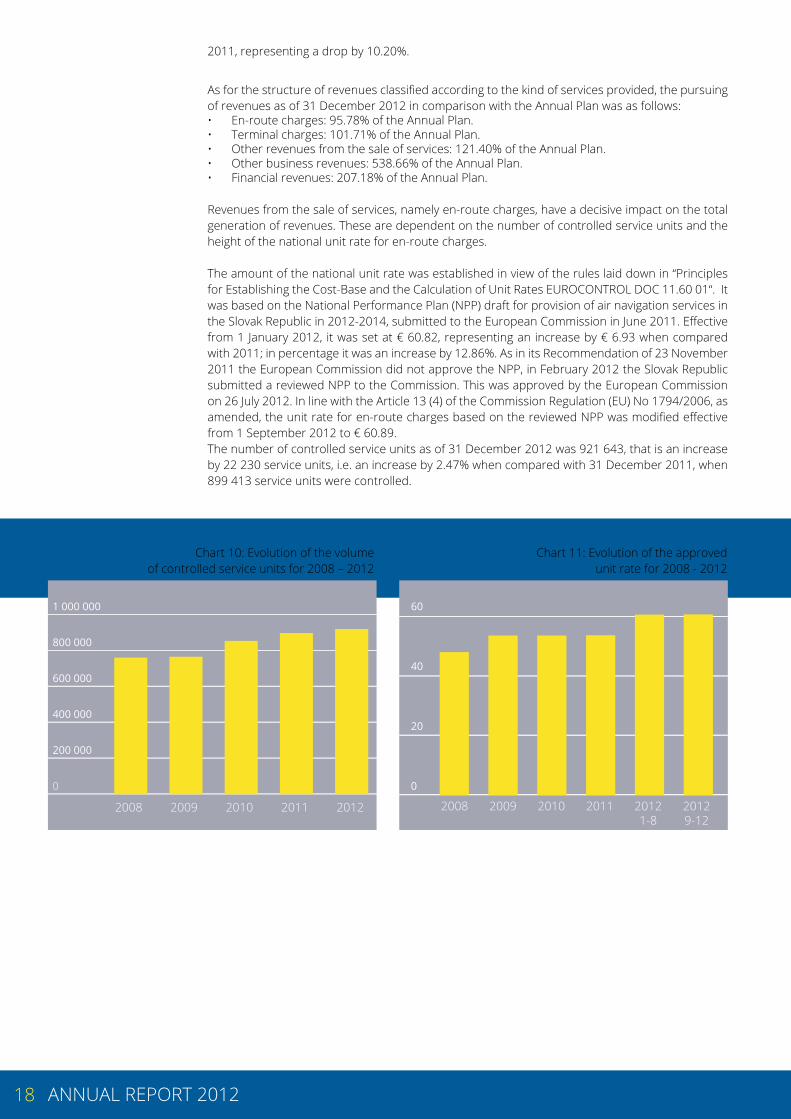
Revenues from the sale of services, namely en-route charges, have a decisive impact on the total generation of revenues. These are dependent on the number of controlled service units and the height of the national unit rate for en-route charges.
The amount of the national unit rate was established in view of the rules laid down in “Principles for Establishing the Cost-Base and the Calculation of Unit Rates EUROCONTROL DOC 11.60 01“. It was based on the National Performance Plan (NPP) draft for provision of air navigation services in the Slovak Republic in 2012-2014, submitted to the European Commission in June 2011. Effective from 1 January 2012, it was set at € 60.82, representing an increase by € 6.93 when compared with 2011; in percentage it was an increase by 12.86%. As in its Recommendation of 23 November 2011 the European Commission did not approve the NPP, in February 2012 the Slovak Republic submitted a reviewed NPP to the Commission. This was approved by the European Commission on 26 July 2012. In line with the Article 13 (4) of the Commission Regulation (EU) No 1794/2006, as amended, the unit rate for en-route charges based on the reviewed NPP was modified effective from 1 September 2012 to € 60.89.The number of controlled service units as of 31 December 2012 was 921 643, that is an increase by 22 230 service units, i.e. an increase by 2.47% when compared with 31 December 2011, when 899 413 service units were controlled.
1 000 000
800 000
600 000
400 000
200 000
0
2008 2009 2010 2011 2012
60
40
20
0
2008 2009 2010 2011 2012 1-8
2012 9-12
Chart 10: Evolution of the volume of controlled service units for 2008 – 2012
Chart 11: Evolution of the approved unit rate for 2008 - 2012
19ANNUAL REPORT 2012
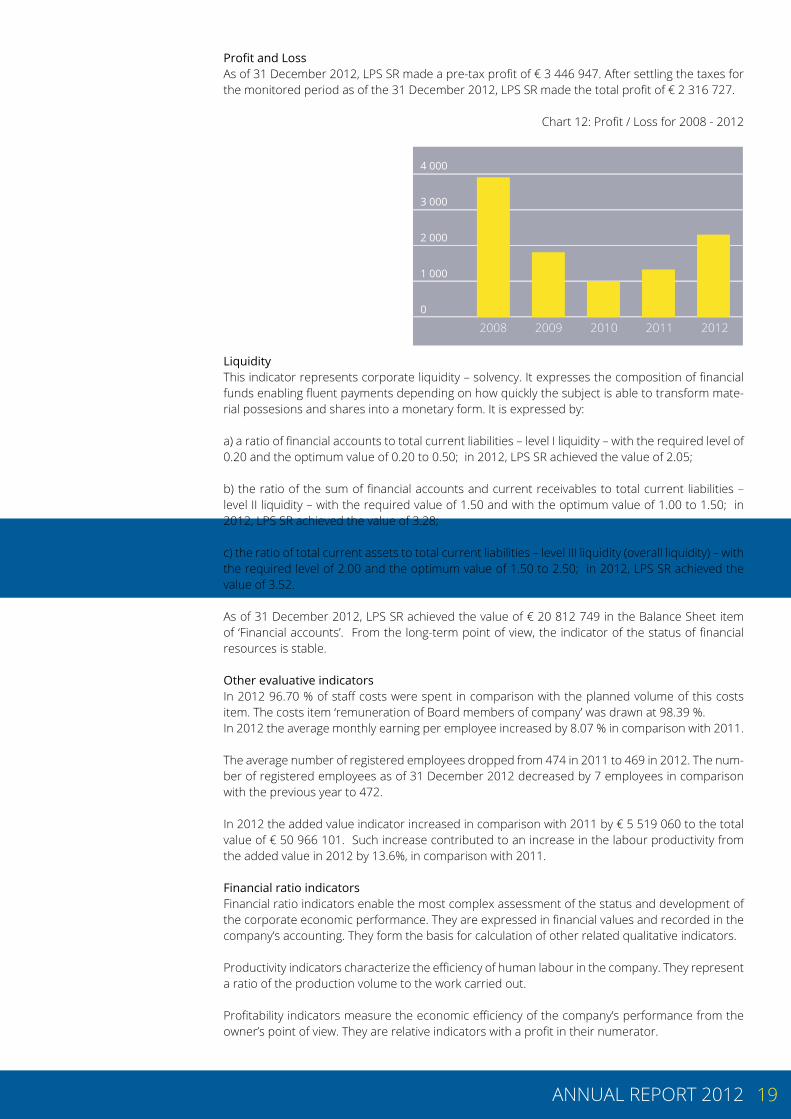
Profit and Loss As of 31 December 2012, LPS SR made a pre-tax profit of € 3 446 947. After settling the taxes for the monitored period as of the 31 December 2012, LPS SR made the total profit of € 2 316 727.
Chart 12: Profit / Loss for 2008 - 2012
LiquidityThis indicator represents corporate liquidity – solvency. It expresses the composition of financial funds enabling fluent payments depending on how quickly the subject is able to transform mate-rial possesions and shares into a monetary form. It is expressed by:
a) a ratio of financial accounts to total current liabilities – level I liquidity – with the required level of 0.20 and the optimum value of 0.20 to 0.50; in 2012, LPS SR achieved the value of 2.05;
b) the ratio of the sum of financial accounts and current receivables to total current liabilities – level II liquidity – with the required value of 1.50 and with the optimum value of 1.00 to 1.50; in 2012, LPS SR achieved the value of 3.28;
c) the ratio of total current assets to total current liabilities – level III liquidity (overall liquidity) – with the required level of 2.00 and the optimum value of 1.50 to 2.50; in 2012, LPS SR achieved the value of 3.52.
As of 31 December 2012, LPS SR achieved the value of € 20 812 749 in the Balance Sheet item of ‘Financial accounts’. From the long-term point of view, the indicator of the status of financial resources is stable.
Other evaluative indicatorsIn 2012 96.70 % of staff costs were spent in comparison with the planned volume of this costs item. The costs item ‘remuneration of Board members of company’ was drawn at 98.39 %.In 2012 the average monthly earning per employee increased by 8.07 % in comparison with 2011.
The average number of registered employees dropped from 474 in 2011 to 469 in 2012. The num-ber of registered employees as of 31 December 2012 decreased by 7 employees in comparison with the previous year to 472.
In 2012 the added value indicator increased in comparison with 2011 by € 5 519 060 to the total value of € 50 966 101. Such increase contributed to an increase in the labour productivity from the added value in 2012 by 13.6%, in comparison with 2011.
Financial ratio indicatorsFinancial ratio indicators enable the most complex assessment of the status and development of the corporate economic performance. They are expressed in financial values and recorded in the company’s accounting. They form the basis for calculation of other related qualitative indicators.
Productivity indicators characterize the efficiency of human labour in the company. They represent a ratio of the production volume to the work carried out.
Profitability indicators measure the economic efficiency of the company’s performance from the owner’s point of view. They are relative indicators with a profit in their numerator.
4 000
3 000
2 000
1 000
0
2008 2009 2010 2011 2012
20 ANNUAL REPORT 2012
As of 31 December 2012, LPS SR achieved the following values of the selected indicators:
Labour productivity from the added value = Added value = € 108 670Number of employees
This indicator shows the amount of the added value falling on one employee. It is the most impor-tant indicator of economic efficiency. In comparison with 2011, the labour productivity from the added value is higher by € 12 790.
Labour productivity from revenues = Revenues = € 132 640Number of employees
The labour productivity measured by revenues represents the volume of the total company revenues per one employee. In comparison with 2011, the indicator of the labour productivity from revenues was higher by € 16 535. The 2011 labour productivity from revenues reached € 116 105.
Financial productivity of labour from added value = Added value = 1,65Staff costs
The indicator of the financial labour productivity from added value expresses the amount of the added value per one EUR of staff costs. In comparison with 2011 (1.57), this indicator is higher by 0.08.
Revenues profitability = Post-tax profit/loss x 100% = 3,72%Revenues
Revenues profitability is also denoted as profitability and represents the share of post-tax profit/loss in total revenues. In comparison with 2011, the profitability of revenues increased by 1.3%.
Technical and Investment Evolution Plan The 2012 Investment Plan was elaborated on the basis of investment actions coming to the Invest-ment Plan from previous years as well as new requirements of relevant major organizational units of LPS SR for procurement of long-term tangible and intangible assets to ensure the company’s activities and continuation.
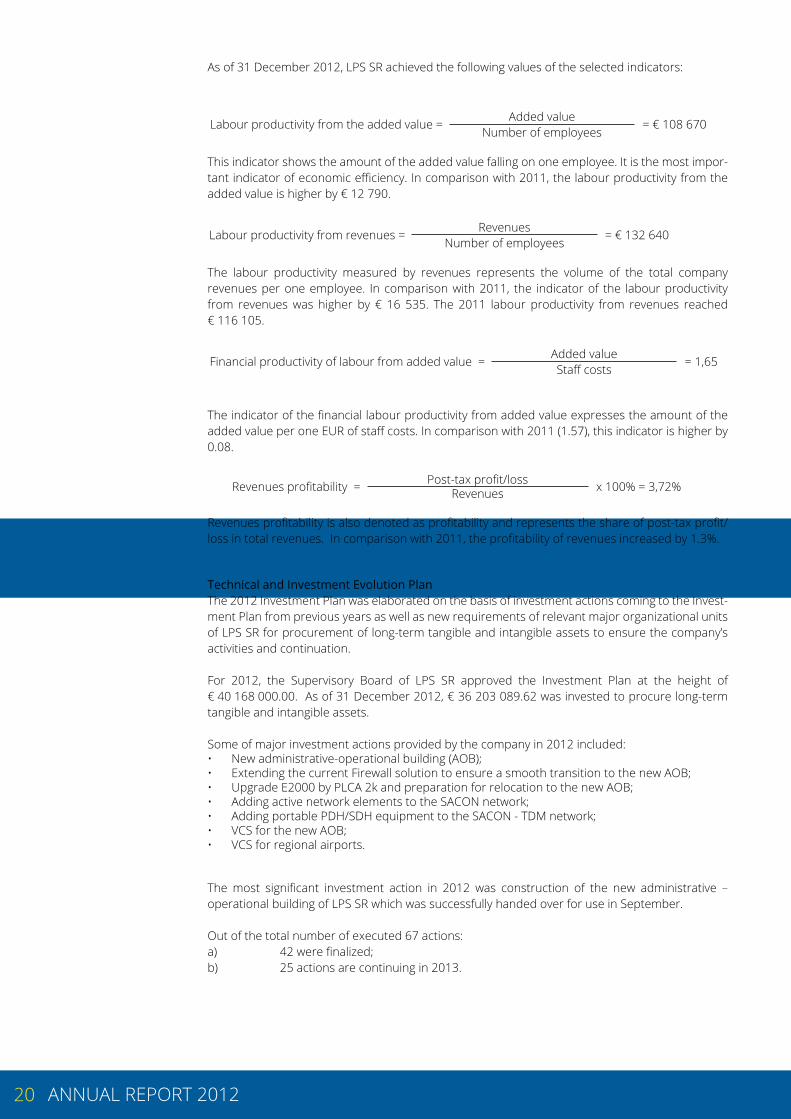
For 2012, the Supervisory Board of LPS SR approved the Investment Plan at the height of € 40 168 000.00. As of 31 December 2012, € 36 203 089.62 was invested to procure long-term tangible and intangible assets.
Some of major investment actions provided by the company in 2012 included:• New administrative-operational building (AOB); • Extending the current Firewall solution to ensure a smooth transition to the new AOB;• Upgrade E2000 by PLCA 2k and preparation for relocation to the new AOB; • Adding active network elements to the SACON network;• Adding portable PDH/SDH equipment to the SACON - TDM network;• VCS for the new AOB;• VCS for regional airports.
The most significant investment action in 2012 was construction of the new administrative – operational building of LPS SR which was successfully handed over for use in September.
Out of the total number of executed 67 actions:a) 42 were finalized;b) 25 actions are continuing in 2013.
21ANNUAL REPORT 2012
Table 11: Capital expenditure, resources and their use (in EUR) for 2012Planned resources - total 40 168 000
out of that - loan 25 393 750
- own resources 14 774 250Actual drawing - total 36 203 089 out of that - loan 25 392 797
- own resources 10 810 292use - long-term tangible assets 36 023 006
- long-term intangible assets 180 083- lands 0
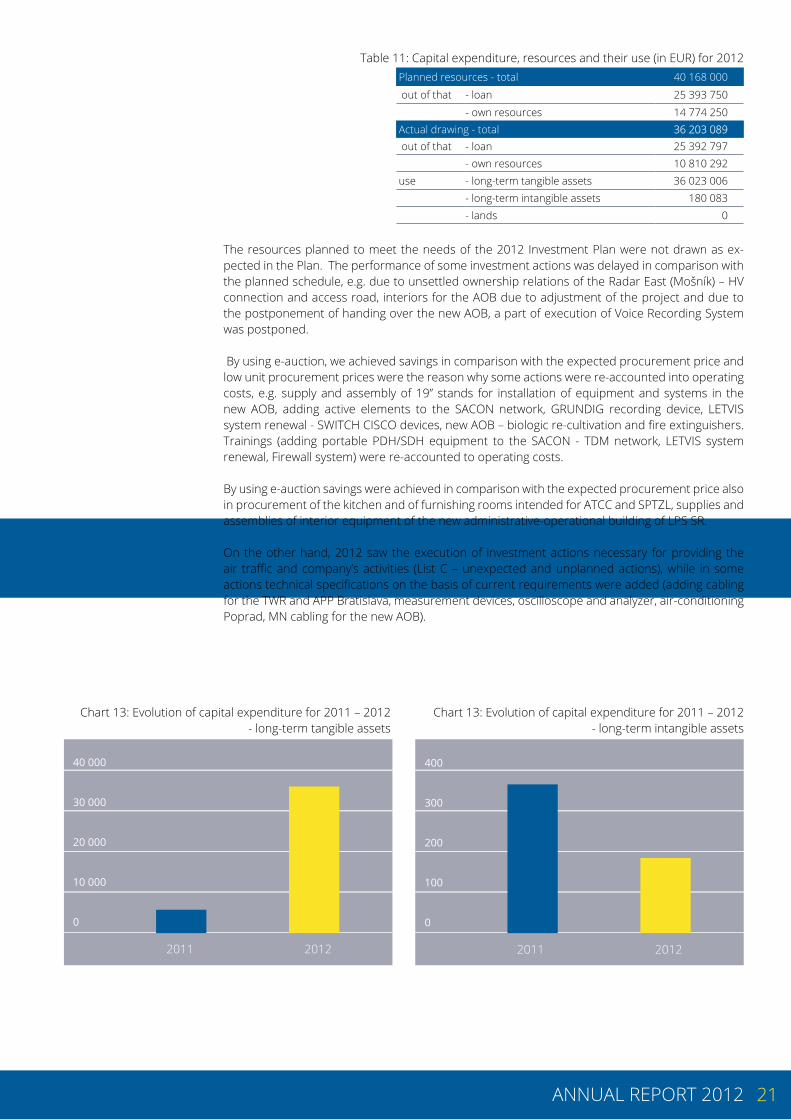
The resources planned to meet the needs of the 2012 Investment Plan were not drawn as ex-pected in the Plan. The performance of some investment actions was delayed in comparison with the planned schedule, e.g. due to unsettled ownership relations of the Radar East (Mošník) – HV connection and access road, interiors for the AOB due to adjustment of the project and due to the postponement of handing over the new AOB, a part of execution of Voice Recording System was postponed.
By using e-auction, we achieved savings in comparison with the expected procurement price and low unit procurement prices were the reason why some actions were re-accounted into operating costs, e.g. supply and assembly of 19’’ stands for installation of equipment and systems in the new AOB, adding active elements to the SACON network, GRUNDIG recording device, LETVIS system renewal - SWITCH CISCO devices, new AOB – biologic re-cultivation and fire extinguishers. Trainings (adding portable PDH/SDH equipment to the SACON - TDM network, LETVIS system renewal, Firewall system) were re-accounted to operating costs.
By using e-auction savings were achieved in comparison with the expected procurement price also in procurement of the kitchen and of furnishing rooms intended for ATCC and SPTZL, supplies and assemblies of interior equipment of the new administrative-operational building of LPS SR.
On the other hand, 2012 saw the execution of investment actions necessary for providing the air traffic and company’s activities (List C – unexpected and unplanned actions), while in some actions technical specifications on the basis of current requirements were added (adding cabling for the TWR and APP Bratislava, measurement devices, oscilloscope and analyzer, air-conditioning Poprad, MN cabling for the new AOB).
40 000
30 000
20 000
10 000
0
400
300
200
100
0
2011 2012 2011 2012
Chart 13: Evolution of capital expenditure for 2011 – 2012- long-term tangible assets
Chart 13: Evolution of capital expenditure for 2011 – 2012- long-term intangible assets

22 ANNUAL REPORT 2012
Transfer of the state enterprise’s propertyIn line with the Act No 111/1990 Coll., Article 21 (1) (j), in 2012 the Supervisory Board did not ap-prove any state property transfer.
Profit allocationIn line with the Article 19 (6) of the Act No 111/1990 Coll on State Enterprise as amended, the Founder – Ministry of Transport, Construction and Regional Development - allocated the 2012 post-tax profit of € 2 316 727.15 as follows:
a) reserve fund replenishment (5% of profit) € 115 836.36 b) social fund replenishment € 950 000.00 c) allocation to the development fund € 1 223 540.79 d) allocation to the statutory fund € 10 000.00 e) Director’s General bonus € 12 000.00 f) Supervisory Board members bonus € 5 350.00
Annual remuneration of the Director and of the Supervisory Board membersHaving assessed the results of the company’s activities in 2012, the Ministry of Transport, Con-struction and Regional Development awarded a yearly bonus to the Director General of the com-pany in view of the Article 19 (8) of the Act No 111/1990 Coll at the height of € 12 000.00.
At the same time the Supervisory Board members were awarded bonuses in view of the Article 20 (10) in the amount of € 5 350.00.
Meetings with civil aircraft operatorsIn 2012 the company was represented at four meetings with users; one of them was organized on the national level in cooperation with the MoT SR, SHMÚ and CAA SR (held in Bratislava on 11 May), and the other three were held on the level of EUROCONTROL member states as a part of regular meetings of the Enlarged Committee for En-Route Charges (multilateral consultation meetings in Brussels held on 15 May, 27 June and 21 November).
23ANNUAL REPORT 2012
Outlook for 2013The 2013 Financial Plan of Costs and Revenues is made on the basis of expected costs and revenues of LPS SR which are expected to incur to the company when providing air navigation services in the airspace of the Slovak Republic.
Compared to the 2012 Financial Plan (€ 62 704.6 thous.) the total 2013 cost base is higher by 2.88% on average. The total costs amount to € 64 507.5 thousand, representing an increase by € 1 802.9 thousand compared to the 2012 Financial Plan. When comparing costs planned for 2013 in comparison with 2012, the Financial Plan includes increases in these cost groups: material consumption, staff costs, taxes and fees and depreciation.
In relation to performing state expert supervision over the air navigation services in line with the Act No 278/2009 Coll., amending and supplementing the Act No 143/1998 Coll. on Civil Aviation (‘Aviation Act’) and on amendments and supplements to certain laws, as amended, in 2013 the company will incur related costs of € 1 185.7 thousand.
As of 31 December 2013, LPS SR projects the loan amounting to € 22 142.8 thousand, i.e. the balance of the long-term loan for the purposes of procurement of the new administrative-operational building of the company.
In its revenues part, the 2013 Plan counts with the total revenues of € 64 670.2 thousand, repre-senting an increase of 2.50% when compared to the 2012 Plan; in absolute figures it is an increase by € 1 577.4 thousand. The major part of the LPS SR revenues is created by revenues from en-route services, at the total planned height of € 58 065.3 thousand, which is more than 85% of all revenues.
The 2013 Plan counts with the pre-tax total profit of € 211.2 thous. and with the post-tax profit of € 162.6.
Calculation of the unit rate for en-route navigation services for 2013 included all expected 2013 costs of the air traffic management services, communication services, radio-navigation services, surveillance services, search & rescue coordination services, aeronautical information services, aeronautical MET services, ATM staff training, training activities and services of expert supervision with the projected air traffic density of 967 000 chargeable en-route units in 2013. In comparison with the 2012 Plan (945 000 chargeable en-route units), this value is higher by 2.4%.
For 2013, the projected amount of the unit rate of the en-route navigation services reached € 60.77.
The unit rate for terminal navigation services at APP/TWR units is expected to reach € 6.47 in 2013 with the projected air traffic density of 649 734 terminal units.
24 ANNUAL REPORT 2012
Independent auditor’s report
For the Supervisory Board of the state enterprise Letové prevádzkové služby Slovenskej republiky, š.p.:
We performed an audit of the attached individual Financial Statements of the state enterprise Letové prevádzkové služby Slovenskej republiky, š.p. (hereinafter referred to as the “state enter-prise”), containing the Balance Sheet drawn up as of 31 December 2012, Profit and Loss Statement for the year which terminated as of the stated date and Notes, including a summary of significant accounting principles.
Responsibility of management of the state enterprise for the Financial State-mentsThe management of the state enterprise bears responsibility for preparation and true presenta-tion of the Financial Statements in line with the Slovak Accounting Act and with the Accounting Principles. This responsibility also involves proposal, implementation and maintenance of an in-ternal inspection relevant for elaboration and faithful presentation of financial statements which do not contain any major inaccuracies caused by a fraud or mistake, selection and application of suitable accounting principles and performance of accounting estimations which are appropriate under given circumstances.
Auditors’ responsibilityOur responsibility is to express our opinion on these Financial Statements, in line with valid au-ditors’ standards, based on the outcomes of auditors’ works. We performed the audit of the in-dividual Financial Statements in accordance with the Act on Auditors, Audit and Supervision over Audit Performance and in line with the International Auditing Standards (ISA). According to these standards we shall observe ethical requirements, plan and perform the audit in such a way that we obtain reasonable assurance that the Financial Statements do not include any major inaccuracies. The audit also involves performance of procedures for obtaining audit evidence about sums and data included in the Financial Statements. The selected procedures depend on the auditor’s deci-sion, including a risk assessment of occurrence of major inaccuracies in the Financial Statements caused by a fraud or mistake. The audit also contains evaluation of the accounting principles used and evaluation of suitability of significant estimates made by the company’s management, as well as evaluation of presentation of the Financial Statements as a whole.We are convinced that on the basis of outcomes of auditors’ procedures used, our audit provides a reasonable basis for our opinion.
OpinionWe are of the opinion that the individual Financial Statements of the state enterprise Letové pre-vádzkové služby Slovenskej republiky, š.p. provide a true and objective view, in all its significant connections, of the financial situation of the state enterprise and its assets as of 31 December 2012, its economic results for the mentioned year, and it has been drawn up in line with the Slovak Act on Accounting and Accounting Procedures.
Bratislava, 20 March 2013
DOMINANT AUDIT s.r.o. Audítorská spoločnosť Ing. Jana TomšíkováSKAU Licence No. 319 Auditor in ChargeJ. Zemana 99, 91101 Trenčín SKAU Licence No. 454

25ANNUAL REPORT 2012
Auditors’ report supplement
Auditor’s Report Supplement on Verification of Reconciliation of the Annual Report and Financial Statements pursuant to the Act No. 540/2007 Coll., Article 23 (5) for the management of the state enterprise of Letové prevádzkové služby Slovenskej republiky, štátny podnik
I. We verified the Financial Statements of the state enterprise Letové prevádzkové služby Slovenskej republiky, štátny podnik, as of 31 December 2012, in relation to which, on 20 March 2013, we issued an auditor’s report and in which we expressed the following auditor’s opinion:
OpinionWe are of the opinion that the Financial Statements of the state enterprise Letové prevádzkové služby Slovenskej republiky, štátny podnik provide a true and objective view of the financial situation of the state enterprise of Letové prevádzkové služby Slovenskej republiky, štátny podnik as of 31 December 2012 in all major respects, and of its economic results for the specified year, and it has been elaborated in accordance with the Slovak Act on Accounting and with accounting principles.
II. We also verified reconciliation of the Annual Report with the above-mentioned Financial Statements. The state enterprise’s statutory body is responsible for correctness of the Annual Report. Based on the verification, my task is to express my opinion on the reconciliation of the Annual Report and the Financial Statements. The verification was made in accordance with the International Accounting Standards requiring the auditor to plan and to perform verification in such a way that they will be reasonably sure that the information stated in the Annual Report, and presented in the Financial Statements, corresponds with the respective Financial Statements in all significant respects. The information stated in the Annual Report was verified in relation to the information specified in the Financial Statements as of 31 December 2012. Other data and information than the accounting information obtained from the Financial Statements and books of accounts, was not verified. We are convinced that the performed verification provides an appropriate basis for expressing auditor’s opinion.
OpinionWe are of the opinion that the accounting information stated in the Annual Report of Letové prevádzkové služby Slovenskej republiky, štátny podnik, provides a true and faithful picture of the Financial Statements as of 31 December 2012 in all major respects, and is in harmony with the Act on Accounting No. 431/2002 Coll. as amended.
Bratislava, 7 October 2013
DOMINANT AUDIT s.r.o. Audítorská spoločnosť Ing. Jana TomšíkováSKAU Licence No. 319 Auditor in ChargeJ. Zemana 99, 91101 Trenčín SKAU Licence No. 454
26 ANNUAL REPORT 2012
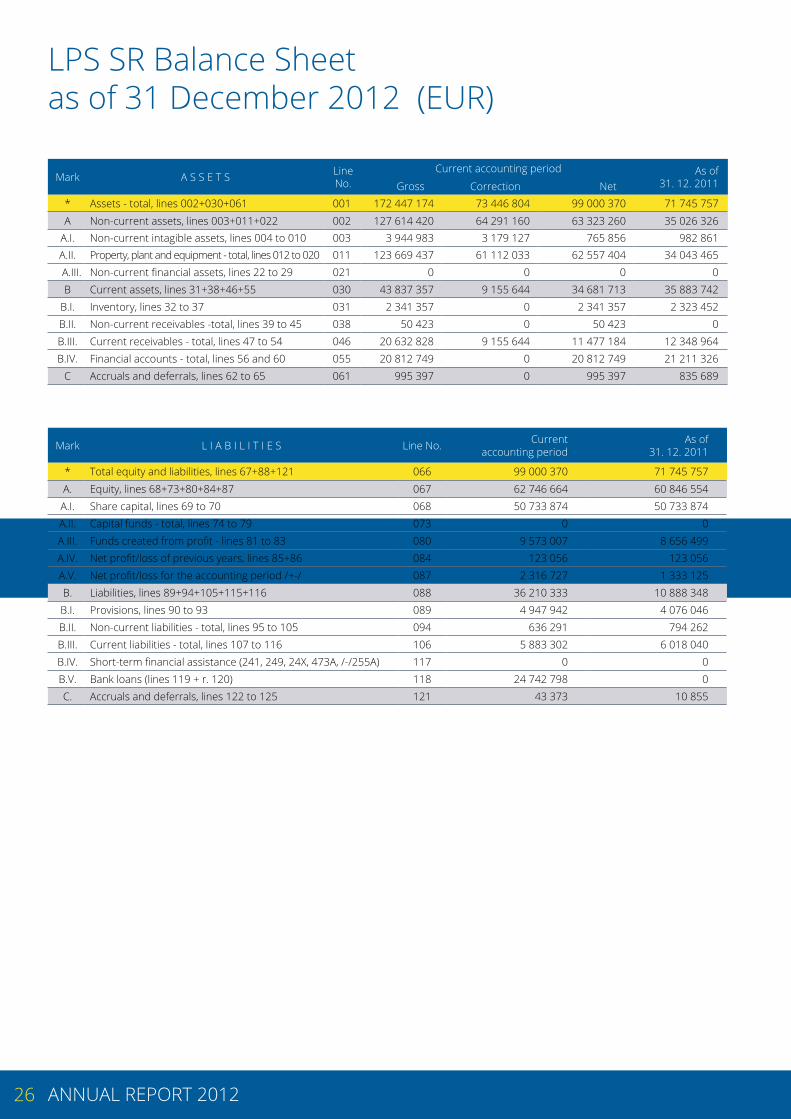
LPS SR Balance Sheet as of 31 December 2012 (EUR)
Mark A S S E T S Line No.
Current accounting period As of 31. 12. 2011Gross Correction Net
* Assets - total, lines 002+030+061 001 172 447 174 73 446 804 99 000 370 71 745 757A Non-current assets, lines 003+011+022 002 127 614 420 64 291 160 63 323 260 35 026 326
A.I. Non-current intagible assets, lines 004 to 010 003 3 944 983 3 179 127 765 856 982 861A.II. Property, plant and equipment - total, lines 012 to 020 011 123 669 437 61 112 033 62 557 404 34 043 465
A.III. Non-current financial assets, lines 22 to 29 021 0 0 0 0B Current assets, lines 31+38+46+55 030 43 837 357 9 155 644 34 681 713 35 883 742
B.I. Inventory, lines 32 to 37 031 2 341 357 0 2 341 357 2 323 452B.II. Non-current receivables -total, lines 39 to 45 038 50 423 0 50 423 0B.III. Current receivables - total, lines 47 to 54 046 20 632 828 9 155 644 11 477 184 12 348 964B.IV. Financial accounts - total, lines 56 and 60 055 20 812 749 0 20 812 749 21 211 326
C Accruals and deferrals, lines 62 to 65 061 995 397 0 995 397 835 689
Mark L I A B I L I T I E S Line No. Current accounting period
As of 31. 12. 2011
* Total equity and liabilities, lines 67+88+121 066 99 000 370 71 745 757A. Equity, lines 68+73+80+84+87 067 62 746 664 60 846 554A.I. Share capital, lines 69 to 70 068 50 733 874 50 733 874A.II. Capital funds - total, lines 74 to 79 073 0 0A.III. Funds created from profit - lines 81 to 83 080 9 573 007 8 656 499A.IV. Net profit/loss of previous years, lines 85+86 084 123 056 123 056A.V. Net profit/loss for the accounting period /+-/ 087 2 316 727 1 333 125B. Liabilities, lines 89+94+105+115+116 088 36 210 333 10 888 348B.I. Provisions, lines 90 to 93 089 4 947 942 4 076 046B.II. Non-current liabilities - total, lines 95 to 105 094 636 291 794 262B.III. Current liabilities - total, lines 107 to 116 106 5 883 302 6 018 040B.IV. Short-term financial assistance (241, 249, 24X, 473A, /-/255A) 117 0 0B.V. Bank loans (lines 119 + r. 120) 118 24 742 798 0C. Accruals and deferrals, lines 122 to 125 121 43 373 10 855
27ANNUAL REPORT 2012
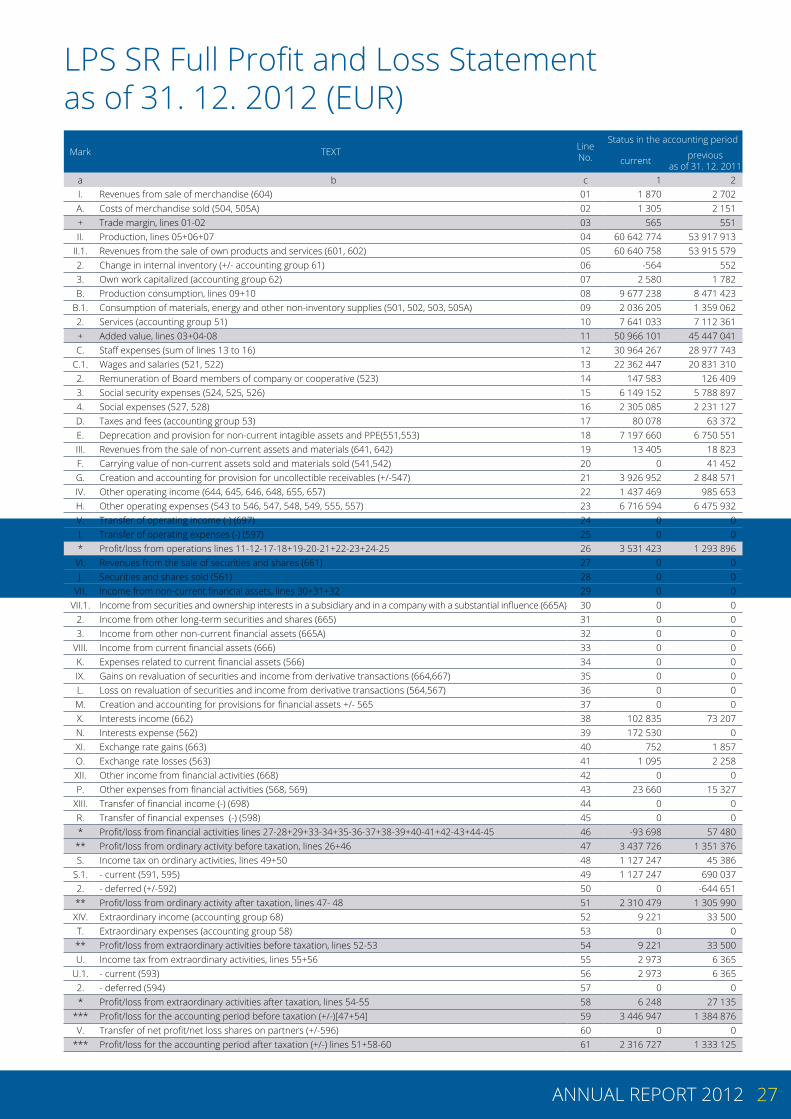
LPS SR Full Profit and Loss Statement as of 31. 12. 2012 (EUR)
Mark TEXT Line No.
Status in the accounting period
current previous as of 31. 12. 2011
a b c 1 2I. Revenues from sale of merchandise (604) 01 1 870 2 702A. Costs of merchandise sold (504, 505A) 02 1 305 2 151+ Trade margin, lines 01-02 03 565 551II. Production, lines 05+06+07 04 60 642 774 53 917 913
II.1. Revenues from the sale of own products and services (601, 602) 05 60 640 758 53 915 5792. Change in internal inventory (+/- accounting group 61) 06 -564 5523. Own work capitalized (accounting group 62) 07 2 580 1 782B. Production consumption, lines 09+10 08 9 677 238 8 471 423
B.1. Consumption of materials, energy and other non-inventory supplies (501, 502, 503, 505A) 09 2 036 205 1 359 0622. Services (accounting group 51) 10 7 641 033 7 112 361+ Added value, lines 03+04-08 11 50 966 101 45 447 041C. Staff expenses (sum of lines 13 to 16) 12 30 964 267 28 977 743
C.1. Wages and salaries (521, 522) 13 22 362 447 20 831 3102. Remuneration of Board members of company or cooperative (523) 14 147 583 126 4093. Social security expenses (524, 525, 526) 15 6 149 152 5 788 8974. Social expenses (527, 528) 16 2 305 085 2 231 127D. Taxes and fees (accounting group 53) 17 80 078 63 372E. Deprecation and provision for non-current intagible assets and PPE(551,553) 18 7 197 660 6 750 551III. Revenues from the sale of non-current assets and materials (641, 642) 19 13 405 18 823F. Carrying value of non-current assets sold and materials sold (541,542) 20 0 41 452G. Creation and accounting for provision for uncollectible receivables (+/-547) 21 3 926 952 2 848 571IV. Other operating income (644, 645, 646, 648, 655, 657) 22 1 437 469 985 653H. Other operating expenses (543 to 546, 547, 548, 549, 555, 557) 23 6 716 594 6 475 932V. Transfer of operating income (-) (697) 24 0 0I. Transfer of operating expenses (-) (597) 25 0 0* Profit/loss from operations lines 11-12-17-18+19-20-21+22-23+24-25 26 3 531 423 1 293 896VI. Revenues from the sale of securities and shares (661) 27 0 0J. Securities and shares sold (561) 28 0 0
VII. Income from non-current financial assets, lines 30+31+32 29 0 0VII.1. Income from securities and ownership interests in a subsidiary and in a company with a substantial influence (665A) 30 0 0
2. Income from other long-term securities and shares (665) 31 0 03. Income from other non-current financial assets (665A) 32 0 0
VIII. Income from current financial assets (666) 33 0 0K. Expenses related to current financial assets (566) 34 0 0IX. Gains on revaluation of securities and income from derivative transactions (664,667) 35 0 0L. Loss on revaluation of securities and income from derivative transactions (564,567) 36 0 0M. Creation and accounting for provisions for financial assets +/- 565 37 0 0X. Interests income (662) 38 102 835 73 207N. Interests expense (562) 39 172 530 0XI. Exchange rate gains (663) 40 752 1 857O. Exchange rate losses (563) 41 1 095 2 258XII. Other income from financial activities (668) 42 0 0P. Other expenses from financial activities (568, 569) 43 23 660 15 327
XIII. Transfer of financial income (-) (698) 44 0 0R. Transfer of financial expenses (-) (598) 45 0 0* Profit/loss from financial activities lines 27-28+29+33-34+35-36-37+38-39+40-41+42-43+44-45 46 -93 698 57 480
** Profit/loss from ordinary activity before taxation, lines 26+46 47 3 437 726 1 351 376S. Income tax on ordinary activities, lines 49+50 48 1 127 247 45 386
S.1. - current (591, 595) 49 1 127 247 690 0372. - deferred (+/-592) 50 0 -644 651** Profit/loss from ordinary activity after taxation, lines 47- 48 51 2 310 479 1 305 990XIV. Extraordinary income (accounting group 68) 52 9 221 33 500T. Extraordinary expenses (accounting group 58) 53 0 0** Profit/loss from extraordinary activities before taxation, lines 52-53 54 9 221 33 500U. Income tax from extraordinary activities, lines 55+56 55 2 973 6 365
U.1. - current (593) 56 2 973 6 3652. - deferred (594) 57 0 0* Profit/loss from extraordinary activities after taxation, lines 54-55 58 6 248 27 135
*** Profit/loss for the accounting period before taxation (+/-)[47+54] 59 3 446 947 1 384 876V. Transfer of net profit/net loss shares on partners (+/-596) 60 0 0
*** Profit/loss for the accounting period after taxation (+/-) lines 51+58-60 61 2 316 727 1 333 125
28 ANNUAL REPORT 2012
Independent Auditors’ Report
To the Management of Letové prevádzkové služby Slovenskej republiky, štátny podnik:
We have audited the accompanying financial statements of Letové prevádzkové služby Slovenskej republiky, štátny podnik (“the State Enterprise”), which comprise the statement of financial position as at 31 December 2012, the statements of comprehensive income, changes in equity and cash flows for the year then ended, and notes, comprising a summary of significant accounting policies and other explanatory information.
Management’s Responsibility for the Financial StatementsManagement as represented by the statutory body is responsible for the preparation of finan-cial statements that give a true and fair view in accordance with International Financial Reporting Standards as adopted by the European Union and for such internal control as management de-termines is necessary to enable the preparation of financial statements that are free from material misstatement, whether due to fraud or error.
Auditors’ ResponsibilityOur responsibility is to express an opinion on these financial statements based on our audit. We conducted our audit in accordance with International Standards on Auditing. Those standards require that we comply with ethical requirements and plan and perform the audit to obtain rea-sonable assurance about whether the financial statements are free from material misstatement.
An audit involves performing procedures to obtain audit evidence about the amounts and disclosures in the financial statements. The procedures selected depend on our judgment, including the assessment of the risks of material misstatement of the financial statements, whether due to fraud or error. In making those risk assessments, we consider internal control relevant to the entity’s preparation of the financial statements that give a true and fair view in order to design audit procedures that are appropriate in the circumstances, but not for the purpose of expressing an opinion on the effectiveness of the entity’s internal control. An audit also includes evaluating the appropriateness of accounting policies used and the reasonableness of accounting estimates made by management, as well as evaluating the overall presentation of the financial statements. We believe that the audit evidence we have obtained is sufficient and appropriate to provide a basis for our opinion.
Opinion In our opinion, the financial statements give a true and fair view of the financial position of the State Enterprise as at 31 December 2012, and of its financial performance and its cash flows for the year then ended in accordance with International Financial Reporting Standards as adopted by the European Union.
31 May 2013Bratislava, Slovak Republic
Auditing company: Responsible auditor:KPMG Slovensko spol. s r. o. Ing. Ľuboš VančoLicence SKAU No. 96 Licence SKAU No. 745

29ANNUAL REPORT 2012
Independent Auditors’ Report
To the Management of Letové prevádzkové služby Slovenskej republiky, štátny podnik:
We have audited the financial statements of Letové prevádzkové služby Slovenskej republiky, štát-ny podnik (the „State Enterprise“) as at 31 December 2012 prepared in accordance with Interna-tional Financial Reporting Standards.
We conducted our audit in accordance with International Standards on Auditing.
On 31 May 2013 we have issued our independent auditor‘s report on the audit of these financial statements, where we have expressed an unqualified opinion.
Financial statements in short form presented on pages 32-35 of this annual report were derived from the audited financial statements of the State Enterprise. In our opinion, financial statements in short form presented in the annual report are in all material aspects in accordance with the financial statements, from which they were derived.
For better understanding of the financial position of the State Enterprise as at 31 December 2012, its financial performance and cash flows for the year ending 31 December 2012 and of the scope of our audit, financial statements in short form should be assessed together with the complete financial statements, from which they were derived, and with our auditor‘s report to these financial statements.
21 October 2013 Bratislava, Slovak Republic
Auditing company: Responsible auditor:KPMG Slovensko spol. s r. o. Ing. Ľuboš VančoLicence SKAU No. 96 Licence SKAU No. 745
30 ANNUAL REPORT 2012
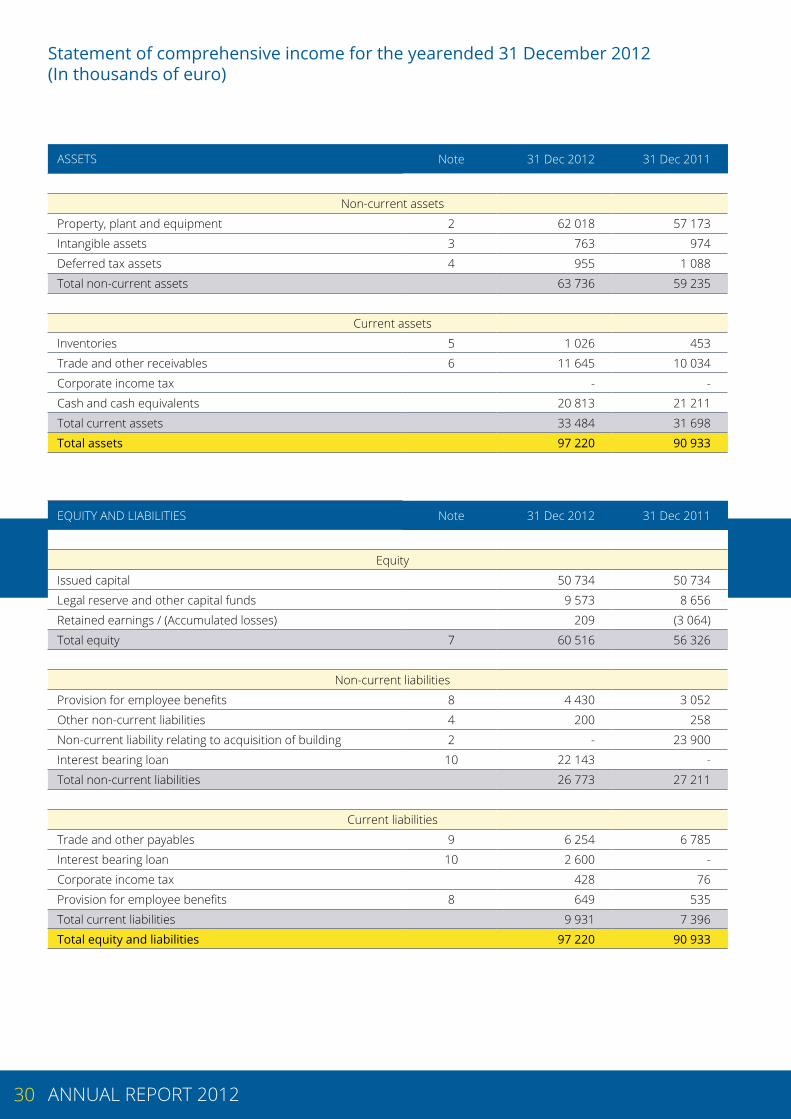
Statement of comprehensive income for the yearended 31 December 2012 (In thousands of euro)
ASSETS Note 31 Dec 2012 31 Dec 2011
Non-current assets
Property, plant and equipment 2 62 018 57 173
Intangible assets 3 763 974
Deferred tax assets 4 955 1 088
Total non-current assets 63 736 59 235
Current assets
Inventories 5 1 026 453
Trade and other receivables 6 11 645 10 034
Corporate income tax - -
Cash and cash equivalents 20 813 21 211
Total current assets 33 484 31 698
Total assets 97 220 90 933
EQUITY AND LIABILITIES Note 31 Dec 2012 31 Dec 2011
Equity
Issued capital 50 734 50 734
Legal reserve and other capital funds 9 573 8 656
Retained earnings / (Accumulated losses) 209 (3 064)
Total equity 7 60 516 56 326
Non-current liabilities
Provision for employee benefits 8 4 430 3 052
Other non-current liabilities 4 200 258
Non-current liability relating to acquisition of building 2 - 23 900
Interest bearing loan 10 22 143 -
Total non-current liabilities 26 773 27 211
Current liabilities
Trade and other payables 9 6 254 6 785
Interest bearing loan 10 2 600 -
Corporate income tax 428 76
Provision for employee benefits 8 649 535
Total current liabilities 9 931 7 396
Total equity and liabilities 97 220 90 933
31ANNUAL REPORT 2012
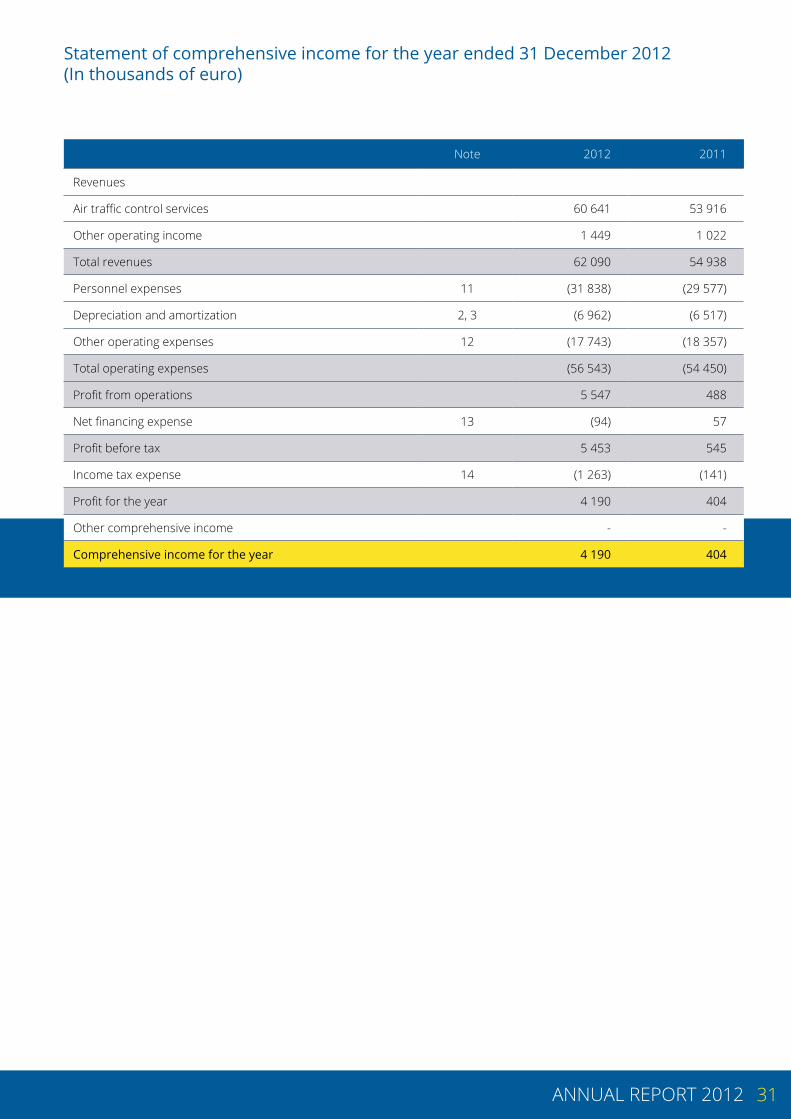
Statement of comprehensive income for the year ended 31 December 2012 (In thousands of euro)
Note 2012 2011
Revenues
Air traffic control services 60 641 53 916
Other operating income 1 449 1 022
Total revenues 62 090 54 938
Personnel expenses 11 (31 838) (29 577)
Depreciation and amortization 2, 3 (6 962) (6 517)
Other operating expenses 12 (17 743) (18 357)
Total operating expenses (56 543) (54 450)
Profit from operations 5 547 488
Net financing expense 13 (94) 57
Profit before tax 5 453 545
Income tax expense 14 (1 263) (141)
Profit for the year 4 190 404
Other comprehensive income - -
Comprehensive income for the year 4 190 404
32 ANNUAL REPORT 2012
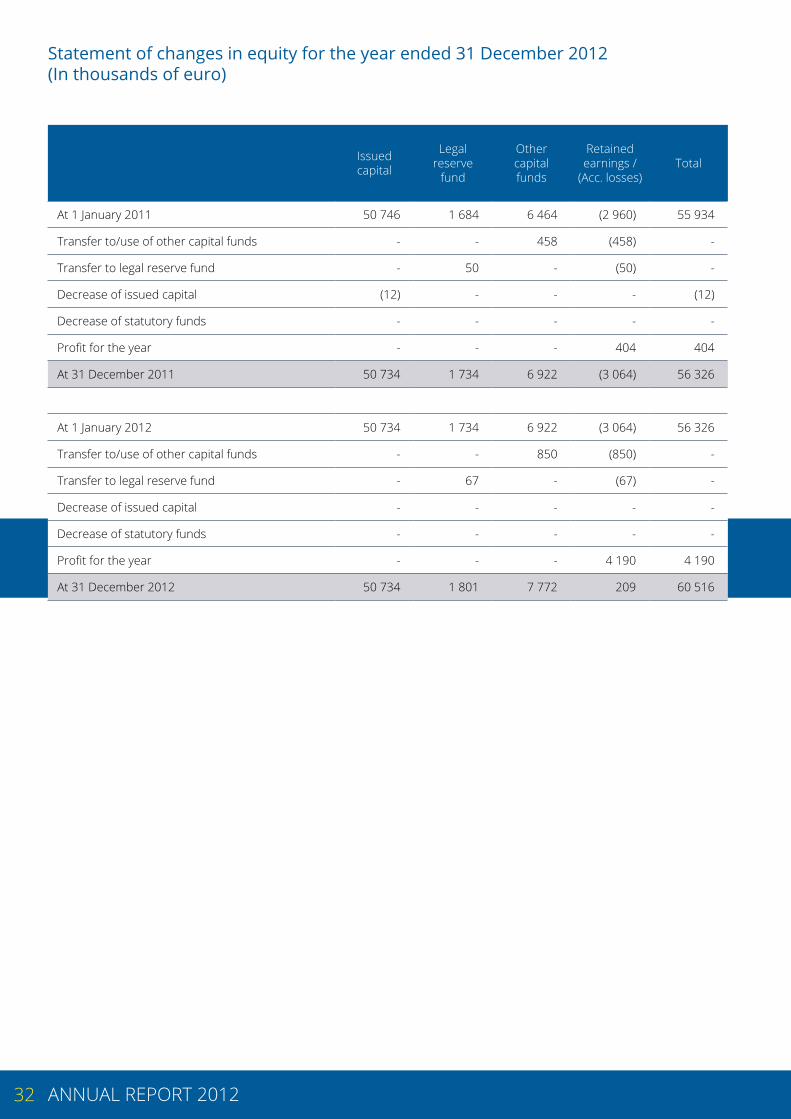
Statement of changes in equity for the year ended 31 December 2012 (In thousands of euro)
Issued capital
Legal reserve
fund
Other capital funds
Retained earnings /
(Acc. losses)Total
At 1 January 2011 50 746 1 684 6 464 (2 960) 55 934
Transfer to/use of other capital funds - - 458 (458) -
Transfer to legal reserve fund - 50 - (50) -
Decrease of issued capital (12) - - - (12)
Decrease of statutory funds - - - - -
Profit for the year - - - 404 404
At 31 December 2011 50 734 1 734 6 922 (3 064) 56 326
At 1 January 2012 50 734 1 734 6 922 (3 064) 56 326
Transfer to/use of other capital funds - - 850 (850) -
Transfer to legal reserve fund - 67 - (67) -
Decrease of issued capital - - - - -
Decrease of statutory funds - - - - -
Profit for the year - - - 4 190 4 190
At 31 December 2012 50 734 1 801 7 772 209 60 516
33ANNUAL REPORT 2012
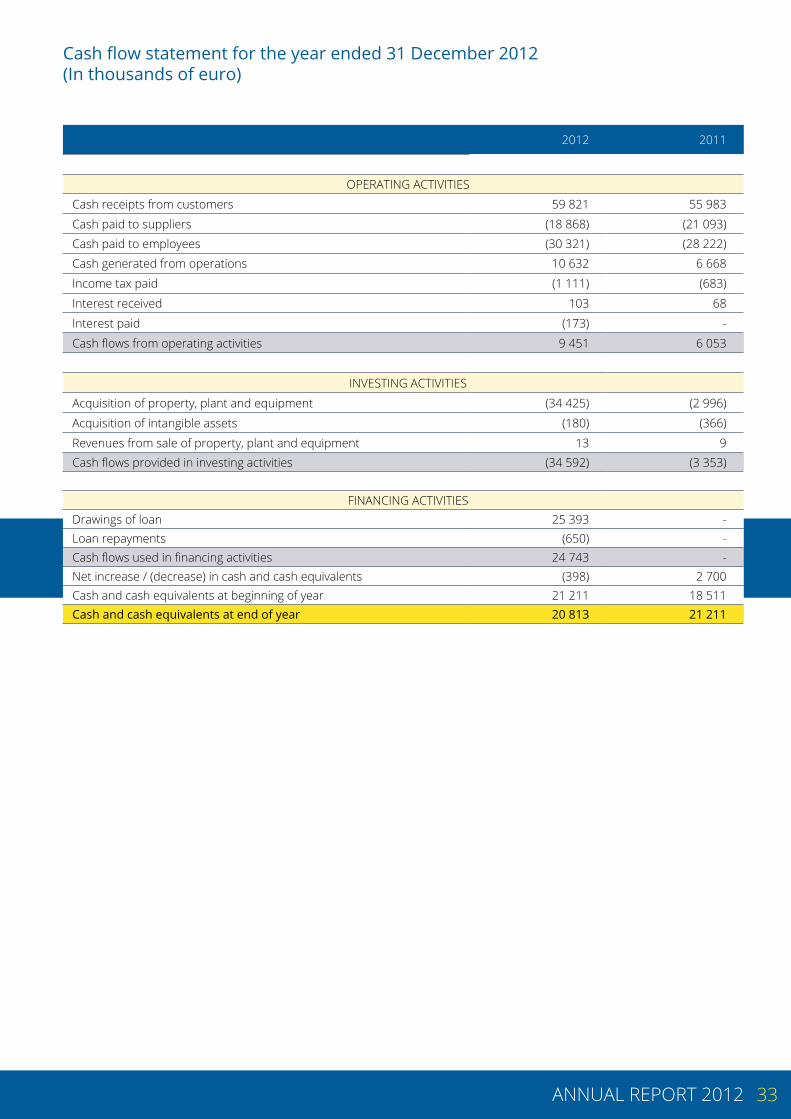
Cash flow statement for the year ended 31 December 2012 (In thousands of euro)
2012 2011
OPERATING ACTIVITIES
Cash receipts from customers 59 821 55 983
Cash paid to suppliers (18 868) (21 093)Cash paid to employees (30 321) (28 222)Cash generated from operations 10 632 6 668
Income tax paid (1 111) (683)
Interest received 103 68
Interest paid (173) -
Cash flows from operating activities 9 451 6 053
INVESTING ACTIVITIES
Acquisition of property, plant and equipment (34 425) (2 996)
Acquisition of intangible assets (180) (366)
Revenues from sale of property, plant and equipment 13 9 Cash flows provided in investing activities (34 592) (3 353)
FINANCING ACTIVITIESDrawings of loan 25 393 -Loan repayments (650) -Cash flows used in financing activities 24 743 -Net increase / (decrease) in cash and cash equivalents (398) 2 700 Cash and cash equivalents at beginning of year 21 211 18 511 Cash and cash equivalents at end of year 20 813 21 211
34 ANNUAL REPORT 2012
Notes to the financial statements for the year ended 31 December 2012GENERAL INFORMATION
Letové prevádzkové služby Slovenskej republiky, štátny podnik (hereinafter “the Enterprise”) is a state owned enterprise domiciled at Letisko M. R. Štefánika, 823 07 Bratislava, the Slovak Republic.
Air Traffic Control of the Slovak Republic was established as a state owned budget contributory organization on 1 January 1993 following the separation of the Slovak and Czech Republics. On 17 November 1999 the Slovak Ministry of Transportation, Post Offices and Telecommunications issued a decision on dissolution of the budget contributory organization Air Traffic Control of the Slovak Republic as at 31 December 1999 and establishment of the state owned enterprise Letové prevádzkové služby Slovenskej republiky, š.p. as at 1 January 2000. All assets were transferred under the administration of the Slovak Ministry of Transportation, Post Offices and Telecommu-nications as of the dissolution of the budget contributory organization. These assets were trans-ferred into the stewardship of the state owned enterprise. The assets used for the Enterprise’s operations and administrated by the Enterprise are owned by the State and they are disclosed in the Enterprise’s accounts.
The main activity of the Enterprise is the provision of air navigation services to airline operators flying over the Slovak Republic and to those landing at public controlled Slovak airports.
The Slovak Republic has been a member of EUROCONTROL, the European Organization for the Safety of Air Navigation since 1 January 1997. At that time, the Slovak Republic became a party to a multilateral agreement with EUROCONTROL relating to the collection of en route navigation ser-vice charges. As required by EUROCONTROL, the Enterprise applies the “Principles for establishing the cost-base for route facility charges and the calculation of the unit rates”, dated March 2012. The Enterprise applies the principles according to Regulation (EC) No 550/2004 of the European Parliament and of the Council of 10 March 2004 on the provision of air navigation services over a unified European airspace, and has established a cost allocation system related to the main activities.
1. SIGNIFICANT ACCOUNTING POLICIES
The significant accounting policies adopted in the preparation of these financial statements are set out below.
Statement of complianceThe financial statements have been prepared in accordance with International Financial Report-ing Standards as adopted by the European Union (IFRS) issued by the International Accounting Standards Board (“IASB”) and with interpretations issued by the International Financial Reporting Interpretations Committee of the IASB (“IFRIC”).
Basis of preparationThe financial statements have been prepared under the historical cost convention and do not form part of the statutory accounts of the Enterprise, which have been prepared separately in accordance with the Slovak Act on Accounting. The financial statements were approved by the Directors on 31 May 2013.
Financial statements were prepared under the going concern assumption.
The accounting policies are consistent with those used in the previous year.
The preparation of financial statements requires management to make judgments, estimates and assumptions that affect the application of policies and the reported amounts of assets, liabilities, income and expenses. The estimates and associated assumptions are based on historical expe-rience and various other factors that are considered to be reasonable under the circumstances.
35ANNUAL REPORT 2012
Actual results may differ from these estimates. The estimates and underlying assumptions are re-viewed on an ongoing basis and revisions to accounting estimates are recognised in the period in which the estimate is revised if the revision affects only that period, or in the period of the revision and future periods if the revision affects both current and future periods.
New interpretations and standards already endorsed by EU not yet effectiveThe following new standards and interpretations, which were issued and are applicable for the Company for annual periods beginning after 1 January 2013 or later, the Company has not early adopted:
Amendments to IFRS 7 Disclosures - Offsetting Financial Assets and Financial Liabilities. The Amendments contain new disclosure requirements for financial assets and liabilities that are off-set in the statement of financial position or subject to master netting arrangements or similar agreements.
Amendments to IAS 1 Presentation of Financial Statements: Presentation of Items of Other Com-prehensive Income. The amendments require that an entity presents separately the items of other comprehensive income that may be reclassified to profit or loss in the future from those that would never be reclassified to profit or loss. If items of other comprehensive income are pre-sented before related tax effects, then the aggregated tax amount should be allocated between these sections. The amendments also require change the title of the Statement of Comprehensive Income to Statement of Profit or Loss and Other Comprehensive Income, however, other titles are also allowed to be used.
Amendments to IAS 12: Deferred Tax: Recovery of Underlying Assets. The amendments introduce a rebuttable presumption that the carrying value of investment property measured using the fair value model would be recovered entirely by sale. Management’s intention would not be relevant unless the investment property is depreciable and held within a business model whose objective is to consume substantially all of the asset’s economic benefits over the life of the asset. This is the only instance in which the presumption can be rebutted.
IAS 19 (2011) Employee Benefits. The amendment requires actuarial gains and losses to be recog-nised immediately in other comprehensive income. The amendment removes the corridor meth-od previously applicable to recognising actuarial gains and losses, and eliminates the ability for entities to recognise all changes in the defined benefit obligation and in plan assets in profit or loss, which currently is allowed under the requirements of IAS 19. The amendment also requires the expected return on plan assets recognised in profit or loss to be calculated based on rate used to discount the defined benefit obligation.
Amendments to IAS 32 – Offsetting Financial Assets and Financial Liabilities. The Amendments do not introduce new rules for offsetting financial assets and liabilities; rather they clarify the offset-ting criteria to address inconsistencies in their application. The Amendments clarify that an entity currently has a legally enforceable right to set-off if that right is not contingent on a future event and enforceable both in the normal course of business and in the event of default, insolvency or bankruptcy of the entity and all counterparties.
Cash and cash equivalentsCash and cash equivalents comprise of cash deposits and petty cash.
Trade and other receivablesTrade and other receivables are stated at their cost less provision for bad and doubtful debts.
InventoriesInventories, mainly spare parts and supplies, are stated at the lower of cost and net realizable val-ue. Net realizable value is the estimated selling price in the ordinary course of business.The costs of spare parts and supplies are determined using the weighted average cost method and includes expenditures incurred in acquiring the inventories and bringing them to their existing location.
Property, plant and equipmentProperty, plant and equipment are stated at acquisition cost less accumulated depreciation and impairment losses. Land is not depreciated.

36 ANNUAL REPORT 2012
Depreciation is provided using the straight-line method over the estimated useful life of each asset as follows:
Asset Period
Building and infrastructure 12 - 40 years
Plant and equipment 4 - 15 years
Expenditures on repairs and maintenance of property, plant and equipment made to restore or maintain future economic benefits expected from the assets are recognized as an expense when incurred.
ImpairmentThe carrying amounts of the Enterprise’s assets, other than inventories and deferred tax assets are reviewed at each balance sheet date to determine whether there is any indication of impair-ment. If any such indication exists, the asset’s recoverable amount is estimated. An impairment loss is recognized whenever the carrying amount of an asset or its cash-generating unit exceeds its recoverable amount. Impairment losses are recognized in the income statement.
Intangible assets Intangible assets are amortized using the straight-line method. Software is amortized over a peri-od from two to five years and valuable rights over the period of twelve years.
Provision for employee benefits The Enterprise creates provision for retirement benefits (other long-term employee benefits). The Enterprise’s net obligation in respect of long-term service benefits, other than pension plans, is the amount of future benefits that employees have earned in return for their service in the current and prior periods. The obligation is calculated using the projected unit credit method and is dis-counted to its present value using the risk-free interest rate.
Employee benefits – contributions for supplementary pension insuranceObligations for contributions to supplementary pension insurance are recognized as an expense in the income statement as incurred.
Trade and other payablesTrade and other payables are stated at cost.
Foreign currencyBalances presented in the financial statements and related notes are expressed in the currency used in the economic environment of the Enterprise (functional currency). Financial statements are presented in thousands of euro which is the functional and presentational currency of the Enterprise.
Transactions denominated in foreign currencies are translated to euro at the exchange rate on the transaction date. Monetary assets and liabilities denominated in foreign currencies are translated to euro at the exchange rate of the European Central Bank on the balance sheet date. Resulting exchange differences, both realized and unrealized, are recognized in the income statement for the year.Non-monetary assets and liabilities in foreign currency valued in acquisition cost are translated to euro at the exchange rate on the transaction date. Non-monetary assets and liabilities in foreign currency valued at fair value are translated to euro using the exchange rate of the fair value recal-culation date.
Revenue recognitionRevenue from services rendered is recognized in the income statement based on transactions (overflights and approaches) completed at the balance sheet date.
Operating lease paymentsPayments made under operating leases are recognized in the income statement on a straight-line basis over the term of the lease.
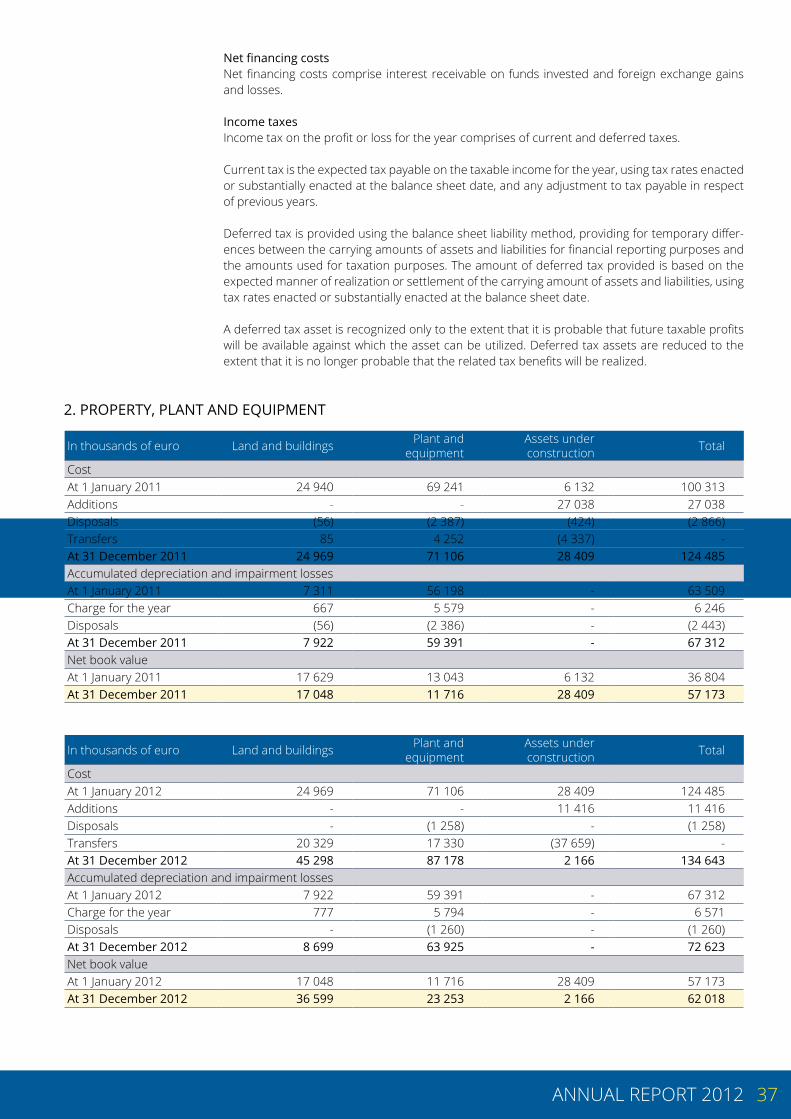
37ANNUAL REPORT 2012
Net financing costsNet financing costs comprise interest receivable on funds invested and foreign exchange gains and losses.
Income taxesIncome tax on the profit or loss for the year comprises of current and deferred taxes.
Current tax is the expected tax payable on the taxable income for the year, using tax rates enacted or substantially enacted at the balance sheet date, and any adjustment to tax payable in respect of previous years.
Deferred tax is provided using the balance sheet liability method, providing for temporary differ-ences between the carrying amounts of assets and liabilities for financial reporting purposes and the amounts used for taxation purposes. The amount of deferred tax provided is based on the expected manner of realization or settlement of the carrying amount of assets and liabilities, using tax rates enacted or substantially enacted at the balance sheet date.
A deferred tax asset is recognized only to the extent that it is probable that future taxable profits will be available against which the asset can be utilized. Deferred tax assets are reduced to the extent that it is no longer probable that the related tax benefits will be realized.
2. PROPERTY, PLANT AND EQUIPMENT
In thousands of euro Land and buildings Plant and equipment
Assets under construction Total
CostAt 1 January 2011 24 940 69 241 6 132 100 313 Additions - - 27 038 27 038 Disposals (56) (2 387) (424) (2 866)Transfers 85 4 252 (4 337) - At 31 December 2011 24 969 71 106 28 409 124 485 Accumulated depreciation and impairment lossesAt 1 January 2011 7 311 56 198 - 63 509 Charge for the year 667 5 579 - 6 246 Disposals (56) (2 386) - (2 443)At 31 December 2011 7 922 59 391 - 67 312 Net book valueAt 1 January 2011 17 629 13 043 6 132 36 804 At 31 December 2011 17 048 11 716 28 409 57 173
In thousands of euro Land and buildings Plant and equipment
Assets under construction Total
CostAt 1 January 2012 24 969 71 106 28 409 124 485 Additions - - 11 416 11 416 Disposals - (1 258) - (1 258)Transfers 20 329 17 330 (37 659) - At 31 December 2012 45 298 87 178 2 166 134 643 Accumulated depreciation and impairment lossesAt 1 January 2012 7 922 59 391 - 67 312 Charge for the year 777 5 794 - 6 571 Disposals - (1 260) - (1 260)At 31 December 2012 8 699 63 925 - 72 623 Net book valueAt 1 January 2012 17 048 11 716 28 409 57 173 At 31 December 2012 36 599 23 253 2 166 62 018
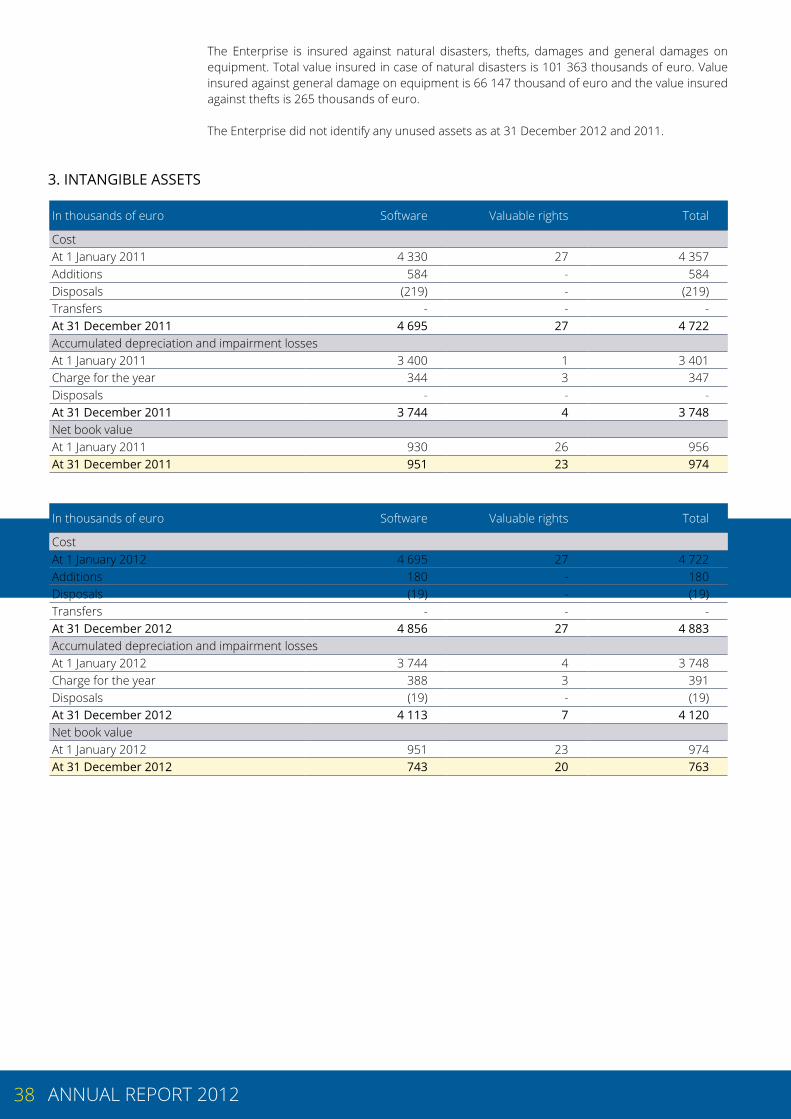
38 ANNUAL REPORT 2012
The Enterprise is insured against natural disasters, thefts, damages and general damages on equipment. Total value insured in case of natural disasters is 101 363 thousands of euro. Value insured against general damage on equipment is 66 147 thousand of euro and the value insured against thefts is 265 thousands of euro.
The Enterprise did not identify any unused assets as at 31 December 2012 and 2011.
3. INTANGIBLE ASSETS
In thousands of euro Software Valuable rights Total
CostAt 1 January 2011 4 330 27 4 357 Additions 584 - 584 Disposals (219) - (219)Transfers - - - At 31 December 2011 4 695 27 4 722 Accumulated depreciation and impairment lossesAt 1 January 2011 3 400 1 3 401 Charge for the year 344 3 347 Disposals - - - At 31 December 2011 3 744 4 3 748 Net book valueAt 1 January 2011 930 26 956 At 31 December 2011 951 23 974
In thousands of euro Software Valuable rights Total
CostAt 1 January 2012 4 695 27 4 722 Additions 180 - 180 Disposals (19) - (19)Transfers - - - At 31 December 2012 4 856 27 4 883 Accumulated depreciation and impairment lossesAt 1 January 2012 3 744 4 3 748 Charge for the year 388 3 391 Disposals (19) - (19)At 31 December 2012 4 113 7 4 120 Net book valueAt 1 January 2012 951 23 974 At 31 December 2012 743 20 763

39ANNUAL REPORT 2012
4. DEFERRED TAX LIABILITY AND ASSET
Deferred tax assets and liabilities as at 31 December 2012 and 2011 are attributable to the items detailed in the table below:
In thousands of euro Assets Liabilities Net
2012 2011 2012 2011 2012 2011Property, plant and equipment - - (1 720) (915) (1 720) (915)Inventories 314 354 - - 314 354 Receivables 1 193 967 - - 1 193 967 Provision for employee benefits 1 168 682 - - 1 168 682 Deferred tax assets / (liabilities) 2 675 2 003 (1 720) (915) 955 1 088 Set off of tax - - - - - - Net deferred tax 2 675 2 003 (1 720) (915) 955 1 088
The deferred tax liability/asset as at 31 December 2012 has been calculated using a tax rate of 23% (2011: 19%).
5. INVENTORIES
In thousands of euro 2012 2011
Spare parts and supplies 2 335 2 316 Provision for slow-moving items (1 309) (1 863)
1 026 453
6. TRADE AND OTHER RECEIVABLES
In thousands of euro 2012 2011
Trade accounts receivable 20 056 16 951 Provision for bad and doubtful debt (9 342) (7 830)Advances to suppliers 235 204 Value added tax receivable 384 567 Other receivables and prepaid expenses 312 141
11 645 10 034
7. CAPITAL AND RESERVES
Issued capitalFollowing the separation of the Czech and Slovak Air Traffic Services on 1 January 1993 the State contributed as capital net assets of 8 579 thousand euro and made subsequent cash contribu-tions of 7 347 thousand euro. With the transformation of the Enterprise from a budget contrib-utory organization to a state owned enterprise on 1 January 2000, statutory funds amounting to 17 615 thousand euro were capitalized, thereby increasing the issued capital to 33 541 thousand euro.
Issued capital was increased in 2002 by the transfer of 5 066 thousand euro from other capital funds. The increase in issued capital was approved by the Supervisory Board on 28 August 2002. In 2006 and 2007 no changes occurred. In 2008, the issued capital was increased by the transfer of 12 193 thousand euro from other capital funds as approved by the Supervisory Board on 29 April 2008. As at 31 December 2008, the Issued capital was 50 801 thousand euro.
The Enterprise transferred land close to Sliač to Ministry of Defence reward-free during 2009. As this land was a non-monetary contribution to share capital, this transfer in amount of 21 thousand euro represents decrease of share capital.
In 2010 the Enterprise additionally transferred property indisseverable from the transferred land

40 ANNUAL REPORT 2012
also reward free. As this property was a non-monetary contribution to share capital, this transfer in amount of 34 thousand euro represents decrease of share capital.
In 2011 the Enterprise additionally disposed of property in amount of 13 thousand euro. As this property was a non-monetary contribution to share capital, this disposal in amount of 13 thousand euro represents decrease of share capital. As at 31 December 2012, the issued capital amounts to 50 734 thousand euro.
Other capital fundsOther capital funds consist of Fund for expansion and Statutory fund. The Minister of Transpor-tation, Construction and Regional Development of the Slovak Republic decided on 2 April 2012 to transfer to fund for expansion an amount of 840 thousand euro and to the statutory fund, 10 thousands of euro from 2011 profit (profit as presented in statutory financial statements prepared in accordance with the Slovak Act on Accouting). The remuneration of statutory representatives and the members of supervisory board was in total 17 thousand euro. The remuneration of the Supervisory was paid during 2012. Transfer to social fund out of profit for the year ended 2011 was 400 thousand euro. Movements in other capital funds represent movements in statutory funds based on Slovak accounting framework. As at 31 December 2012, other capital funds were 7 772 thousand euro.
Legal reserve fundThe increase in legal reserve fund in amount of 67 thousand euro was approved by the Minister of Transportation, Post Offices and Telecommunications on 2 April 2012. As at 31 December 2012, the legal reserve fund amounted to 1 801 thousand euro. This reserve fund is not available for distribution and should only be used as a reserve against future losses arising from business ac-tivities.
8. PROVISION FOR EMPLOYEE BENEFITS
In thousands of euro 2012 2011
At 1 January 3 587 2 309
Interest costs 50 27 Current service costs 781 702 Actuarial (gains) / losses 1 213 909 Benefits paid (552) (359)At 31 December 5 079 3 587
Actuarial loss (1 213 thousand of euro) is caused mainly by the change of discount rates, change of inflation, change of estimated future payroll growth and change of fluctuation (1.85% in 2011; 2.14% in 2012).
Under collective agreements with employees, the Enterprise pays to employees certain retirement benefits. Each employee, who has been employed with the Enterprise for 5 years or less, is eligible for a retirement benefit of 1 average monthly salary and, if employed for more than 5 years this amount increases to 4 times the monthly salary. For the employees with ATCO licence this benefit is increased to 24 times of the monthly salary.
9. TRADE AND OTHER PAYABLES
In thousands of euro 2012 2011
Trade accounts payable 1 048 2 063 Salaries, wages and social security payable 2 825 2 454 Employee income taxes 612 518 Social fund 543 670 Other payables and accrued expenses 1 226 1 080
6 254 6 785

41ANNUAL REPORT 2012
Based on collective agreements with employees, the Enterprise operates a defined contribution plan for endowment insurance of employees from the social fund. It was agreed with the insur-ance enterprise that the minimum amount contributed by the Enterprise should not be lower than 100 euro per annum per employee. In 2012, the Enterprise contributed to the employees’ endowment insurance an amount of 452 thousand euro (2011: 374 thousand euro). In 2012, the Enterprise also contributed from the social fund to the employees’ supplementary pension insur-ance an amount of 17 thousand euro (2011: 12 thousand euro).
10. INTEREST BEARING LOAN
The scheduled repayment of loan is as follows:
In thousands of euro
Carrying amount
Interestrate
Finalmaturity
Maturity< 1 year
Maturity1 to 5 years
Maturity>5 years
Loan from Komerční banka 24 743 1,75%
+ Euribor 15.8.2019 2 600 10 400 11 743
24 743 2 600 10 400 11 743
11. PERSONNEL EXPENSES
In thousands of euro 2012 2011
Wages and salaries 23 047 21 251 Legal social insurance 4 895 4 666 Supplementary pension insurance 1 297 1 206 Provision for retirement benefits 1 297 1 238 Additional contribution to social fund 400 350 Social fund expense 290 269 Remuneration of the Supervisory Board and Directors 148 159 Retirement benefits 67 43 Other personnel expenses 397 395
31 838 29 577
The average number of employees during 2012 was 469 (2011: 474) including 5 directors (2011: 5).
There was an additional contribution to the social fund from profit 2012 (profit as presented in statutory financial statements prepared in accordance with the Slovak Act on Accouting) in the amount of 400 thousand euro based on the decision of Ministry of transport, post and telecom-munications dated 2 April 2012.
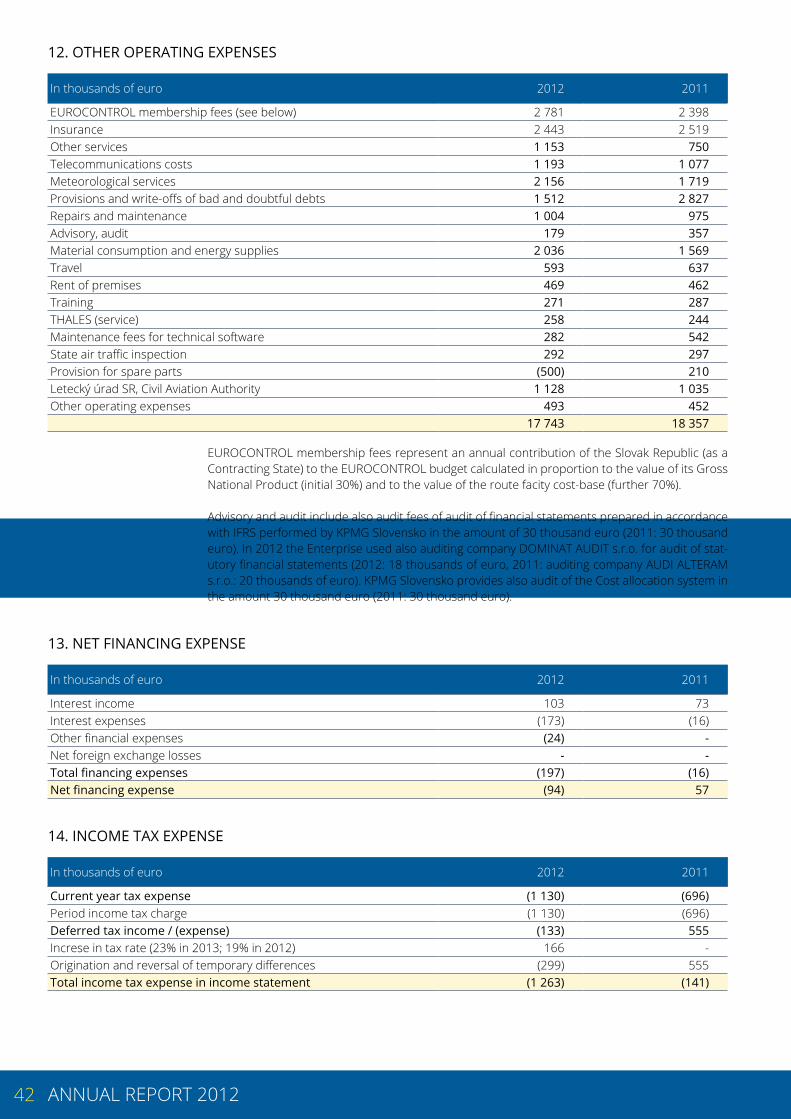
42 ANNUAL REPORT 2012
12. OTHER OPERATING EXPENSES
In thousands of euro 2012 2011
EUROCONTROL membership fees (see below) 2 781 2 398Insurance 2 443 2 519Other services 1 153 750Telecommunications costs 1 193 1 077Meteorological services 2 156 1 719Provisions and write-offs of bad and doubtful debts 1 512 2 827Repairs and maintenance 1 004 975Advisory, audit 179 357Material consumption and energy supplies 2 036 1 569Travel 593 637Rent of premises 469 462Training 271 287THALES (service) 258 244Maintenance fees for technical software 282 542State air traffic inspection 292 297Provision for spare parts (500) 210Letecký úrad SR, Civil Aviation Authority 1 128 1 035Other operating expenses 493 452
17 743 18 357
EUROCONTROL membership fees represent an annual contribution of the Slovak Republic (as a Contracting State) to the EUROCONTROL budget calculated in proportion to the value of its Gross National Product (initial 30%) and to the value of the route facity cost-base (further 70%).
Advisory and audit include also audit fees of audit of financial statements prepared in accordance with IFRS performed by KPMG Slovensko in the amount of 30 thousand euro (2011: 30 thousand euro). In 2012 the Enterprise used also auditing company DOMINAT AUDIT s.r.o. for audit of stat-utory financial statements (2012: 18 thousands of euro, 2011: auditing company AUDI ALTERAM s.r.o.: 20 thousands of euro). KPMG Slovensko provides also audit of the Cost allocation system in the amount 30 thousand euro (2011: 30 thousand euro).
13. NET FINANCING EXPENSE
In thousands of euro 2012 2011
Interest income 103 73 Interest expenses (173) (16)Other financial expenses (24) - Net foreign exchange losses - - Total financing expenses (197) (16)Net financing expense (94) 57
14. INCOME TAX EXPENSE
In thousands of euro 2012 2011
Current year tax expense (1 130) (696)Period income tax charge (1 130) (696)Deferred tax income / (expense) (133) 555 Increse in tax rate (23% in 2013; 19% in 2012) 166 - Origination and reversal of temporary differences (299) 555 Total income tax expense in income statement (1 263) (141)

43ANNUAL REPORT 2012
In thousands of euro 2012 % 2011 %
Profit before tax 5 453 545 Income tax using the demestic corporation tax rate (1 036) 19% (104) 19%Increase in tax rate 166 -3% (37) 7%Tax non-deductible expenses and other items (393) 7% - 0%Recognitions of previously unrecognized deferred tax assets - 0% - 0%Change in unrecognized temporary differences - 0% - 0%
(1 263) 23% (141) 26%
15. RELATED PARTY TRANSACTIONS
During the year ended 31 December 2012, the Directors of the Enterprise and members of the Supervisory Board received wages and salaries amounting to 1 074 thousand euro (2011: 1 225 thousand euro) and 368 thousand euro (2011: 337 thousand euro), respectively.
16. COMMITMENTS
Capital commitmentsAs at 31 December 2012, the Enterprise has entered into purchase agreements for property, plant and equipment totalling approximately 5 110 thousand euro (2011: 16 453 thousand euro).
Lease obligationsThe Enterprise leases for offices and warehouses spaces based on the contracts with the mini-mum cancellation period of six months. The minimum annual lease payments are 255 thousand euro (2011: 470 thousand euro).
17. FINANCIAL INSTRUMENTS
Exposure to credit and foreign currency risks arises in the normal course of the Enterprise’s busi-ness.
Credit riskThe Enterprise has potential credit risk exposures for trade receivables and cash investments. The exposure to credit risk with regard to trade receivables is not concentrated due to a large customer base. Adequate provision is made for doubtful debts. The Enterprise’s cash balances are deposited with international banks operating in Slovakia. The maximum exposure to credit risk is represented by the carrying amount of each financial asset in the balance sheet.
Foreign currency riskThe Enterprise is not exposed to foreign currency risk as majority of transactions are in euro, the functional currency.
Liquidity riskThe Enterprise maintains liquidity management with the objective of ensuring that funds will be available at all times to honour all cash flow obligations as they become due. The table shows as-sets and liabilities by remaining contractual maturity.

44 ANNUAL REPORT 2012
In thousands of euro
2012
1 year or less
1-5 years
More than5 years Total
AssetsTrade and other receivables 11 645 - - 11 645Cash and cash equivalents 20 813 - - 20 813Equity and liabilitiesProvision for employee benefits (649) (1 131) (3 299) (5 079)Other non-current liabilities - (200) - (200)Corporate income tax (428) - - (428)Interest bearing loan (2 600) (10 400) (11 743) (24 743)Trade and other payables (6 254) - - (6 254)Net position 22 527 (11 731) (15 042) (4 246)
In thousands of euro
2011
1 year or less
1-5 years
More than5 years Total
AssetsTrade and other receivables 10 034 - - 10 034Cash and cash equivalents 21 211 - - 21 211Equity and liabilitiesProvision for employee benefits (535) (909) (2 143) (3 587)Other non-current liabilities - (258) - (258)Corporate income tax (76) - - (76)Trade and other payables (30 685) - - (30 685)Net position (51) (1 167) (2 143) (3 361)
Fair valuesThe carrying value of financial instruments (cash and cash equivalents, receivables, payables) ap-proximates their fair value.
Interest rate riskManagement has entered into a loan contract which is exposed to floating interest rates in the normal course of business.
18. INFORMATION ON EVENTS OCCURING BETWEEN THE BALANCE SHEET DATE AND THE DATE OF PREPARATION OF FINANCIAL STATEMENTS
There are no subsequent events in 2013 which would have impact on the financial statements for the year 2012.
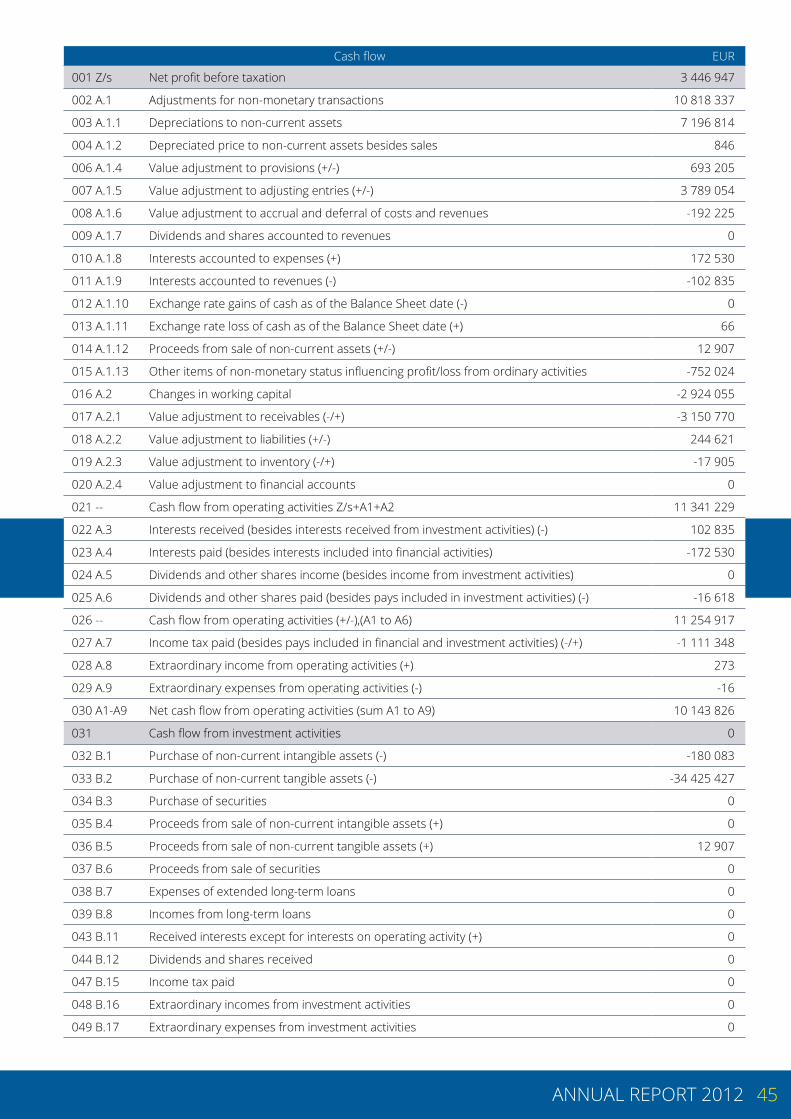
45ANNUAL REPORT 2012
Cash flow EUR
001 Z/s Net profit before taxation 3 446 947
002 A.1 Adjustments for non-monetary transactions 10 818 337
003 A.1.1 Depreciations to non-current assets 7 196 814
004 A.1.2 Depreciated price to non-current assets besides sales 846
006 A.1.4 Value adjustment to provisions (+/-) 693 205
007 A.1.5 Value adjustment to adjusting entries (+/-) 3 789 054
008 A.1.6 Value adjustment to accrual and deferral of costs and revenues -192 225
009 A.1.7 Dividends and shares accounted to revenues 0
010 A.1.8 Interests accounted to expenses (+) 172 530
011 A.1.9 Interests accounted to revenues (-) -102 835
012 A.1.10 Exchange rate gains of cash as of the Balance Sheet date (-) 0
013 A.1.11 Exchange rate loss of cash as of the Balance Sheet date (+) 66
014 A.1.12 Proceeds from sale of non-current assets (+/-) 12 907
015 A.1.13 Other items of non-monetary status influencing profit/loss from ordinary activities -752 024
016 A.2 Changes in working capital -2 924 055
017 A.2.1 Value adjustment to receivables (-/+) -3 150 770
018 A.2.2 Value adjustment to liabilities (+/-) 244 621
019 A.2.3 Value adjustment to inventory (-/+) -17 905
020 A.2.4 Value adjustment to financial accounts 0
021 -- Cash flow from operating activities Z/s+A1+A2 11 341 229
022 A.3 Interests received (besides interests received from investment activities) (-) 102 835
023 A.4 Interests paid (besides interests included into financial activities) -172 530
024 A.5 Dividends and other shares income (besides income from investment activities) 0
025 A.6 Dividends and other shares paid (besides pays included in investment activities) (-) -16 618
026 -- Cash flow from operating activities (+/-),(A1 to A6) 11 254 917
027 A.7 Income tax paid (besides pays included in financial and investment activities) (-/+) -1 111 348
028 A.8 Extraordinary income from operating activities (+) 273
029 A.9 Extraordinary expenses from operating activities (-) -16
030 A1-A9 Net cash flow from operating activities (sum A1 to A9) 10 143 826
031 Cash flow from investment activities 0
032 B.1 Purchase of non-current intangible assets (-) -180 083
033 B.2 Purchase of non-current tangible assets (-) -34 425 427
034 B.3 Purchase of securities 0
035 B.4 Proceeds from sale of non-current intangible assets (+) 0
036 B.5 Proceeds from sale of non-current tangible assets (+) 12 907
037 B.6 Proceeds from sale of securities 0
038 B.7 Expenses of extended long-term loans 0
039 B.8 Incomes from long-term loans 0
043 B.11 Received interests except for interests on operating activity (+) 0
044 B.12 Dividends and shares received 0
047 B.15 Income tax paid 0
048 B.16 Extraordinary incomes from investment activities 0
049 B.17 Extraordinary expenses from investment activities 0

46 ANNUAL REPORT 2012
Cash flow EUR
050 B.18 Other investment incomes 0
051 B.19 Other investment expenses 0
052 B1-B20 Net cash flow from investment activities 0
053 Cash flow from financial activities -34 592 603
054 C.1 Cash flow in equity (C.1.1-C.1.8) 0
055 C.1.1 Proceeds from issuance of share capital 0
056 C.1.2 Proceeds from other deposits 0
057 C.1.3 Received financial donations 0
060 C.1.6 Expenses related to decrease of funds created by accounting entity (-) 0
062 C.1.8 Expenses related to decrease of share capital (-) 0
063 C.2 Cash flow from long-term and short-term financial activities (C.2.1-C.2.10) 24 092 798
064 C.2.3 Proceeds from bank loans 0
065 C.2.4 Repayment of received bank loans 0
066 C.2.5 Proceeds from received loans 24 772 315
067 C.2.6 Repayment of received loans -679 517
068 C.2.7 Expenses of financial leasing 0
069 C.2.8 Incomes from other long-term and short-term liabilities from financial activities 0
070 C.2.9 Expenditures from other long-term and short-term liabilities from financial activities 0
072 C.3 Interests paid included to financial activities 0
076 C.7 Income tax paid from financial activities (-) -18 8711
077 C.8 Extraordinary incomes related to financial activities 0
078 C.9 Extraordinary expenses related to financial activities -23 660
079 C 1-C9 Net cash flow from financial activities 24 050 266
080 D Net increase / decrease of funds -398 511
081 E Cash and cash equivalents at the start of the period 21 211 326
082 F Cash and cash equivalents at the end of the period, exchange-rate differences excluded 20 812 815
083 G Exchange-rate difference as of the Balance Sheet date -66
084 H Cash and cash equivalents with exchange-rate difference 20 812 750
Miroslav Bartoš Chief Executive Officer
The 2012 LPS SR Annual Report was elaborated on 17 June 2013. There have been no consequent occurrences since the elaboration of the 2012 LPS SR Annual Report as of the day when the Finan-cial Statements of LPS SR were elaborated.
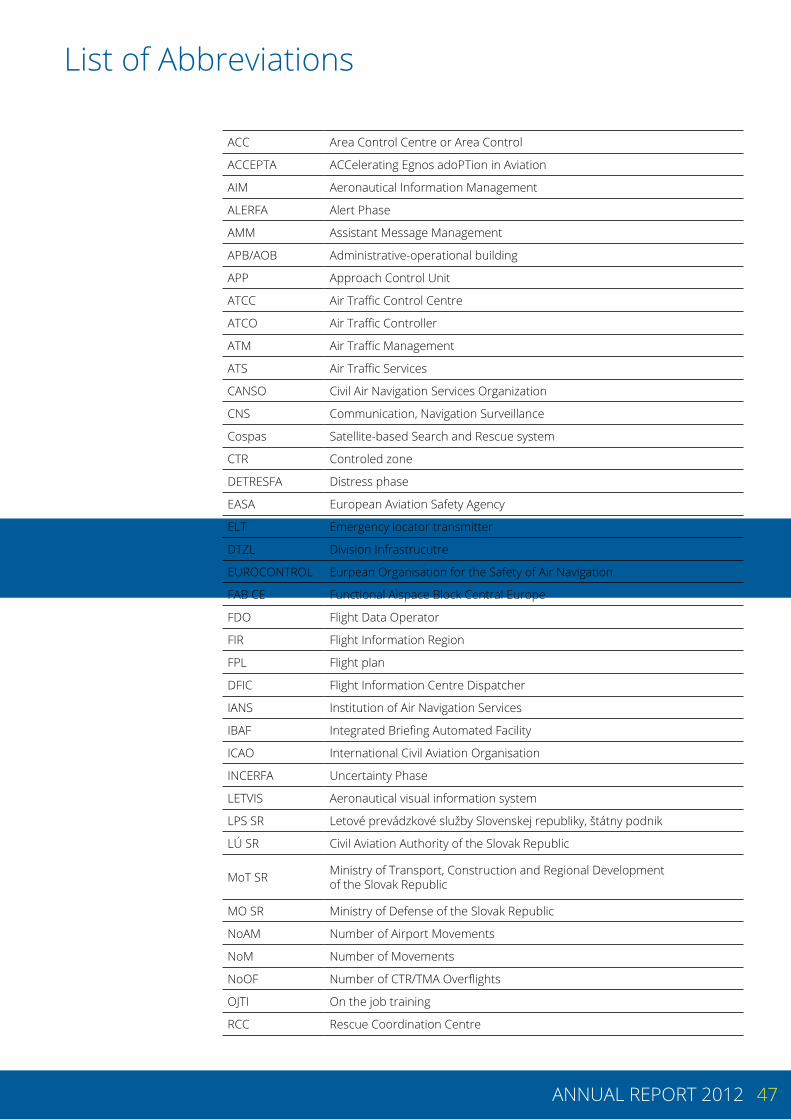
47ANNUAL REPORT 2012
List of Abbreviations
ACC Area Control Centre or Area Control
ACCEPTA ACCelerating Egnos adoPTion in Aviation
AIM Aeronautical Information Management
ALERFA Alert Phase
AMM Assistant Message Management
APB/AOB Administrative-operational building
APP Approach Control Unit
ATCC Air Traffic Control Centre
ATCO Air Traffic Controller
ATM Air Traffic Management
ATS Air Traffic Services
CANSO Civil Air Navigation Services Organization
CNS Communication, Navigation Surveillance
Cospas Satellite-based Search and Rescue system
CTR Controled zone
DETRESFA Distress phase
EASA European Aviation Safety Agency
ELT Emergency locator transmitter
DTZL Division Infrastrucutre
EUROCONTROL Eurpean Organisation for the Safety of Air Navigation
FAB CE Functional Aispace Block Central Europe
FDO Flight Data Operator
FIR Flight Information Region
FPL Flight plan
DFIC Flight Information Centre Dispatcher
IANS Institution of Air Navigation Services
IBAF Integrated Briefing Automated Facility
ICAO International Civil Aviation Organisation
INCERFA Uncertainty Phase
LETVIS Aeronautical visual information system
LPS SR Letové prevádzkové služby Slovenskej republiky, štátny podnik
LÚ SR Civil Aviation Authority of the Slovak Republic
MoT SR Ministry of Transport, Construction and Regional Development of the Slovak Republic
MO SR Ministry of Defense of the Slovak Republic
NoAM Number of Airport Movements
NoM Number of Movements
NoOF Number of CTR/TMA Overflights
OJTI On the job training
RCC Rescue Coordination Centre
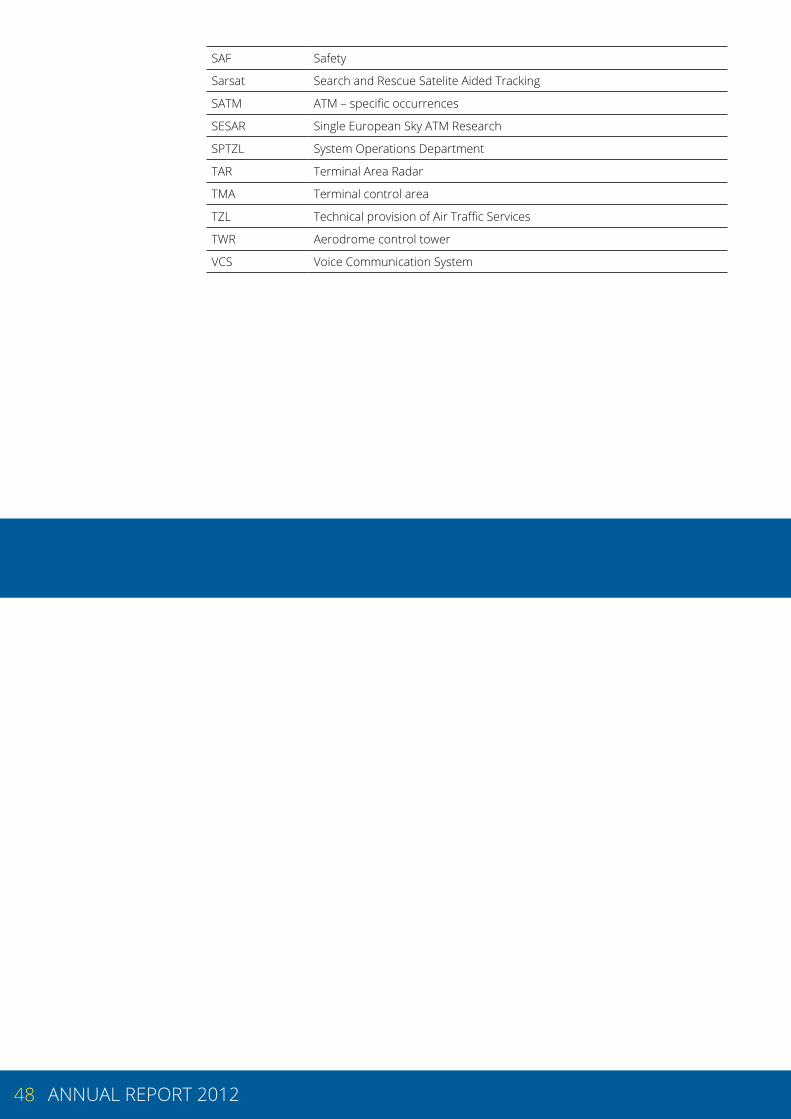
48 ANNUAL REPORT 2012
SAF Safety
Sarsat Search and Rescue Satelite Aided Tracking
SATM ATM – specific occurrences
SESAR Single European Sky ATM Research
SPTZL System Operations Department
TAR Terminal Area Radar
TMA Terminal control area
TZL Technical provision of Air Traffic Services
TWR Aerodrome control tower
VCS Voice Communication System


