57
Annual Report 2014–15

Annual Report 2014–15
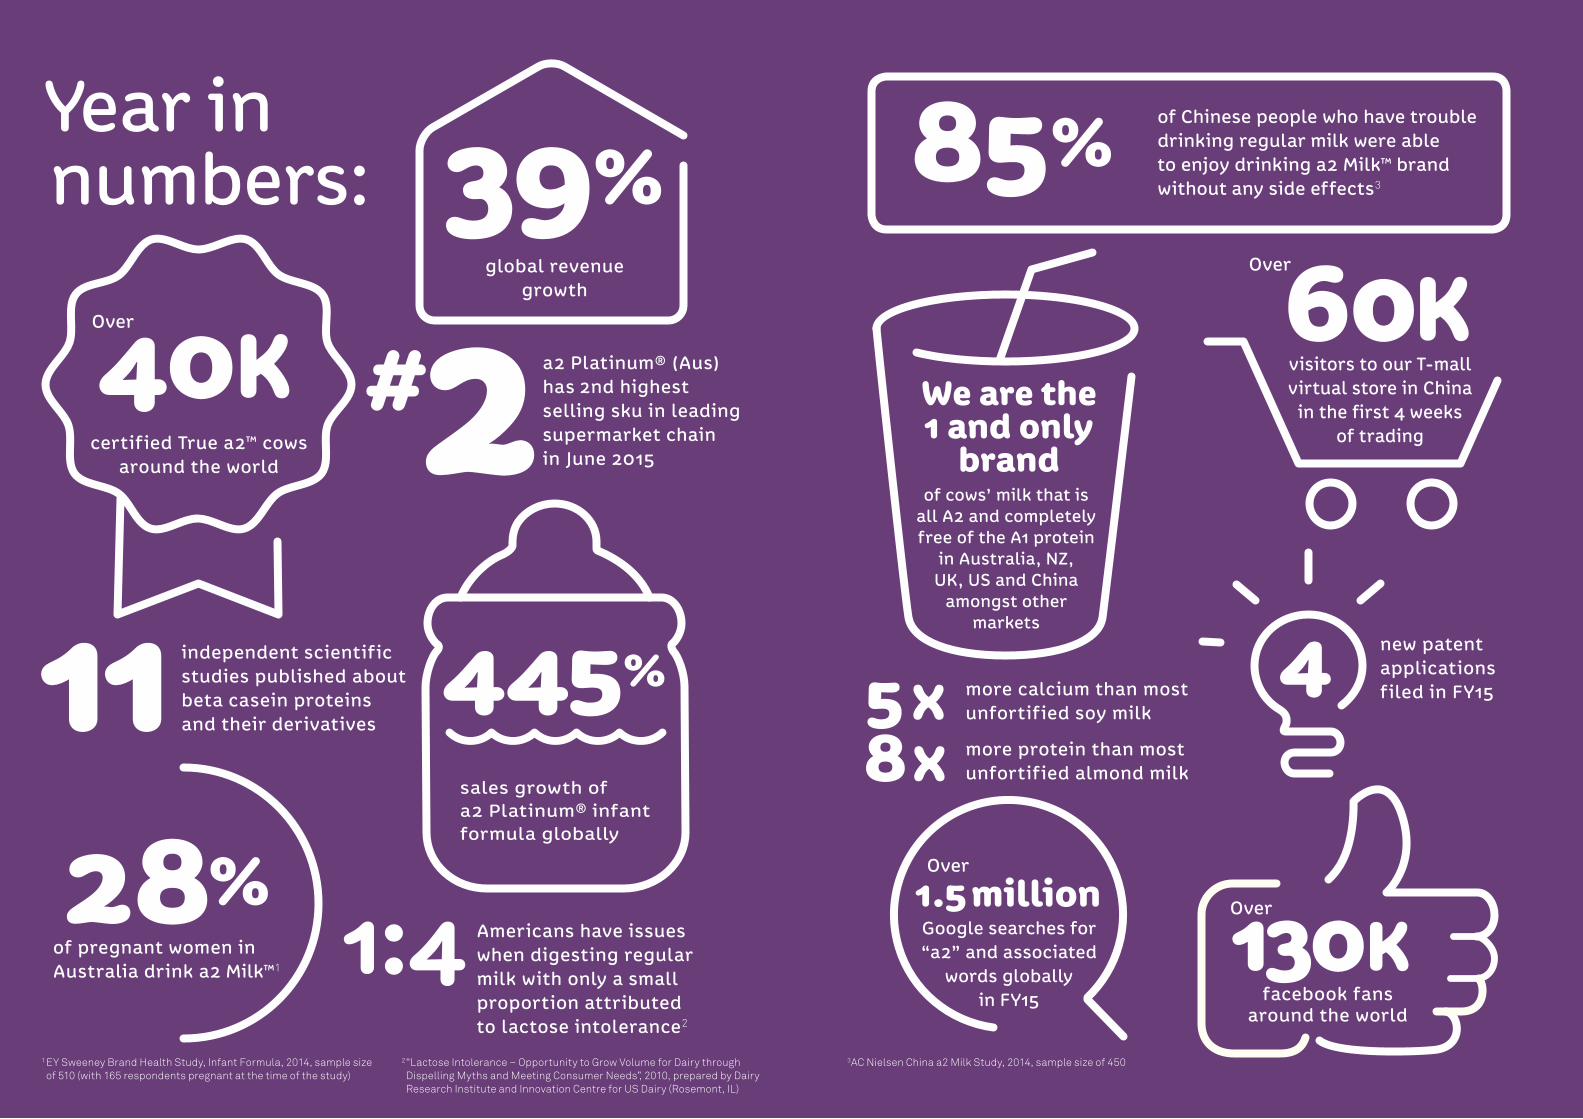
85%
visitors to our T-mall virtual store in China
in the first 4 weeks of trading
60K
of cows’ milk that is all A2 and completely free of the A1 protein
in Australia, NZ, UK, US and China
amongst other markets
130K
of Chinese people who have trouble drinking regular milk were able to enjoy drinking a2 Milk™ brand without any side effects3
Google searches for “a2” and associated
words globally in FY15
1.5 million
facebook fans around the world
Over
Over
Over
8 x more protein than most unfortified almond milk
more calcium than most unfortified soy milk
new patent applications filed in FY155 x
We are the 1 and only
brand
3AC Nielsen China a2 Milk Study, 2014, sample size of 450
39%global revenue
growth
Year in numbers:
sales growth of a2 Platinum® infant formula globally
a2 Platinum® (Aus) has 2nd highest selling sku in leading supermarket chain in June 2015
independent scientific studies published about beta casein proteins and their derivatives
1:4 Americans have issues when digesting regular milk with only a small proportion attributed to lactose intolerance2
28%of pregnant women in Australia drink a2 Milk™1
112#
certified True a2™ cows around the world
40KOver
1 EY Sweeney Brand Health Study, Infant Formula, 2014, sample size of 510 (with 165 respondents pregnant at the time of the study)
2 “Lactose Intolerance – Opportunity to Grow Volume for Dairy through Dispelling Myths and Meeting Consumer Needs”, 2010, prepared by Dairy Research Institute and Innovation Centre for US Dairy (Rosemont, IL)

Contents
1 Year in numbers
Chairman’s letter
Expanding our horizons: places, products, people
CEO’s report
Recent history
The a2 Milk™ difference
Governance & disclosures
Financial statements
Company directory
65
1422242653
108
2
The a2 Milk Company 2014–15
3
Contents
I am delighted to be writing to you as your new chairman following the retirement of Cliff Cook from the role after successfully leading The a2 Milk Company for more than 11 years. On behalf of all shareholders I would like totake this opportunity to thank Cliffand your other recent retiring directors, David Mair and Perry Gunner, for their significant contribution to the success of the business over many years.
I am pleased to be able to report that the business overall continues in good health. The company has delivered another year of exceptional underlying growth in our core Australian business and there are improving signs of traction in our developing international markets. The strategic plan is focused on diversifying the breadth and range of the business both to capture significant new opportunities and to provide greater long term resilience for the company as a whole. This has been demonstrated through a number of significant initiatives in the last 12 months. These initiatives combine with the underlying operational performance to further strengthen the foundation of the business now and into the future.
Specifically there are four key developments whichI would like to highlight.
Firstly, our core Australian operation is continuing to provide the base and importantly the cash flow to underwrite our international expansion. Encouragingly, despite many years of strong growth, the last twelve months have seen our Australian business accelerate ahead even faster with an increase in revenues of 40%to over $140 million. This performance gives confidencein the future opportunities that still lie ahead for thisoutstanding business.
Secondly, we have continued to develop our overseas operations in the last year with a launch into the giant US liquid milk market in the fourth quarter, a major repositioning of our business in the UK and a restructuring of our China operations to better control and manage the commercial elements of our business in this significant market. These initiatives are designed both to access larger attractive markets for the company over time, and also importantly to broaden our business base thus making the company’s future more secure.
Chairman’s letter
Thirdly, our move to aggressively develop an infant formula business is a key growth driver within our strategic plan. The exceptional performance of a2 Platinum® infant formula in Australia, combined with increasing traction of the brand in China, has enabled us to build an infant formula business of over $40 million revenue in approximately eighteen months. This now accounts for 27% of total revenue. The current market place indicators give us real confidence of an even stronger year of growth ahead.
Finally, our company made the important move to dual-list on the Australian Securities Exchange (ASX) at the end of March 2015. This move, also part of our overalldiversification strategy, better aligns the shareholder register with our business base. It also gives the companyaccess to a wider shareholder pool and, critically, to deeper capital markets which will be important in the future. The move has been well received by our current shareholders and has already resulted in the Australian register now accounting for nearly 40% of shareson issue.
As part of the move to list on the ASX, we also restructuredyour board and we remain committed to considering the appointment of at least one further director in the future.Any appointment will be designed to ensure that the board best reflects the base and breadth of the business going forward.
I would like to take this opportunity to thank all our staff who have worked so hard over the last twelve months to deliver yet another record result for the business. I personally believe that The a2 Milk Company is on the cusp of converting our recent investments into business platforms, both at home and abroad, which will generate significant growing returns for the long term.
David HearnChairman16 September 2015
The company has deliveredanother year of exceptional
underlying growth in ourcore Australian business,
and there are improving signsof traction in our developing
international markets.
4
The a2 Milk Company 2014–15
5
Chairman’s letter

Expanding our horizons
We’re connecting more people to more
a2 Milk™ products, in more places
around the world.
6 7
The a2 Milk Company 2014–15 Expanding our horizons

Key
Financial Year 2014–2015 Revenue
Breaking new ground,creating new products
China & Other Asia
$149mAustralia & NZ
40%
USA & UK
$2m 90%
% Growth year on year
Countries in which a2MC branded products are available
$4m 46%
$
9
Expanding our horizons
8
The a2 Milk Company 2014–15

Fiona (Australia)
“Thank you, thank you, thank you and I feel good we are all having something
not modified but a milk which is the same as our grandparents used to
drink, proper milk. Thank you again.”
Ms Yu (China)
“My baby used to suffer from a skin rash, the doctor recommended
a2 Platinum because of the A2 protein, the same as what is in breastmilk.My baby tried it and felt better.”
Adrianna (Australia)
“ My son lovesthe taste.I love the taste.”
We’re bringing milk back to more people around the world.
Building a global
community
Martha (USA)
“This milk is fabulous! Milk became a digestive problem for me 2 yrs ago.
a2 is NO PROBLEM and tastes delicious. It is great to have this good source of protein back on the menu. THANK YOU
for bringing this to the USA!!!!!!”
Ryhanne (Australia)
“ It tastes the same and looks the same, but it made me feel so much better!”
Ashley (UK) “ It tastes
amazing! The health benefits are justa bonus.”
10
The a2 Milk Company 2014–15
11
Expanding our horizons

DAN RICE
Prairieland Dairies Nebraska, USA “I’m delighted to be part of what promises to be a hugely exciting and successful business opportunity.”
“There are millions of Americans looking for a2 Milk because it’s a natural solution for their milk problems. As soon as I met The a2 Milk Company, I knew they were the right company with the right product for the US market and I’m delighted to be part of what promises to be a hugely exciting and successful business opportunity for both The a2 Milk Company and the broader US dairy industry.”
PETER MULCAHY
Kyvalley Farms Kyabram, Victoria, Australia
“My brother and I became a2 Milk farmers back in 2001 because I found that my daughter had issues drinking regular milk, yet could enjoy a2 Milk. Over the years we have found that lots of Australians are the same and that by producing a2 Milk we’re helping many more people, like my daughter, enjoy all the goodness and taste of fresh milk without the downsides.”
PAUL BEAUMONT (3rd generation dairy farmer shown with wife Leah and daughter Evelyn)
Beaumont FarmDorrigo, NSW, Australia “I’m loving it, life is good.”
“Getting back into dairy with The a2 Milk Company after a 6 year break was a great opportunity for my family. Without an a2 Milk herd, we weren’t needed by the dairy industry. I’m loving it, life is good.”
NEALE SADDLER
Bridge Farms Shropshire, UK “It is good to have a feeling of optimism in the a2 Milk product.”
“In the current climate of depressed milk prices in a volatile market it is good to have a feeling of optimism in the a2 Milk product, a product that brings all of the dairy goodness and health benefits to a proportion of consumers that would otherwise be unable to benefit and at the same time be confident that The a2 Milk Company currently pay a premium for the milk.”
OUR NUMBERS ARE GROWING:
“All the goodness and taste of fresh milk without the downsides.”
• There are now over 40,000 certified True a2™ cows across 77 small
and large farms in Australia, New Zealand, United Kingdom and the
United States of America
• We work with approximately 14 quality certified processing sites
across our markets
• We now have capabilities and experience in producing a wide range
of products including fresh milk, UHT, ESL, condensed and powdered
milk alongside cream, ice cream and nutritional powdered products
Building a passionate
and committed community of
global farmers and processors
Synlait Milk powder processing plant, Canterbury, New Zealand
1312
The a2 Milk Company 2014–15 Expanding our horizons
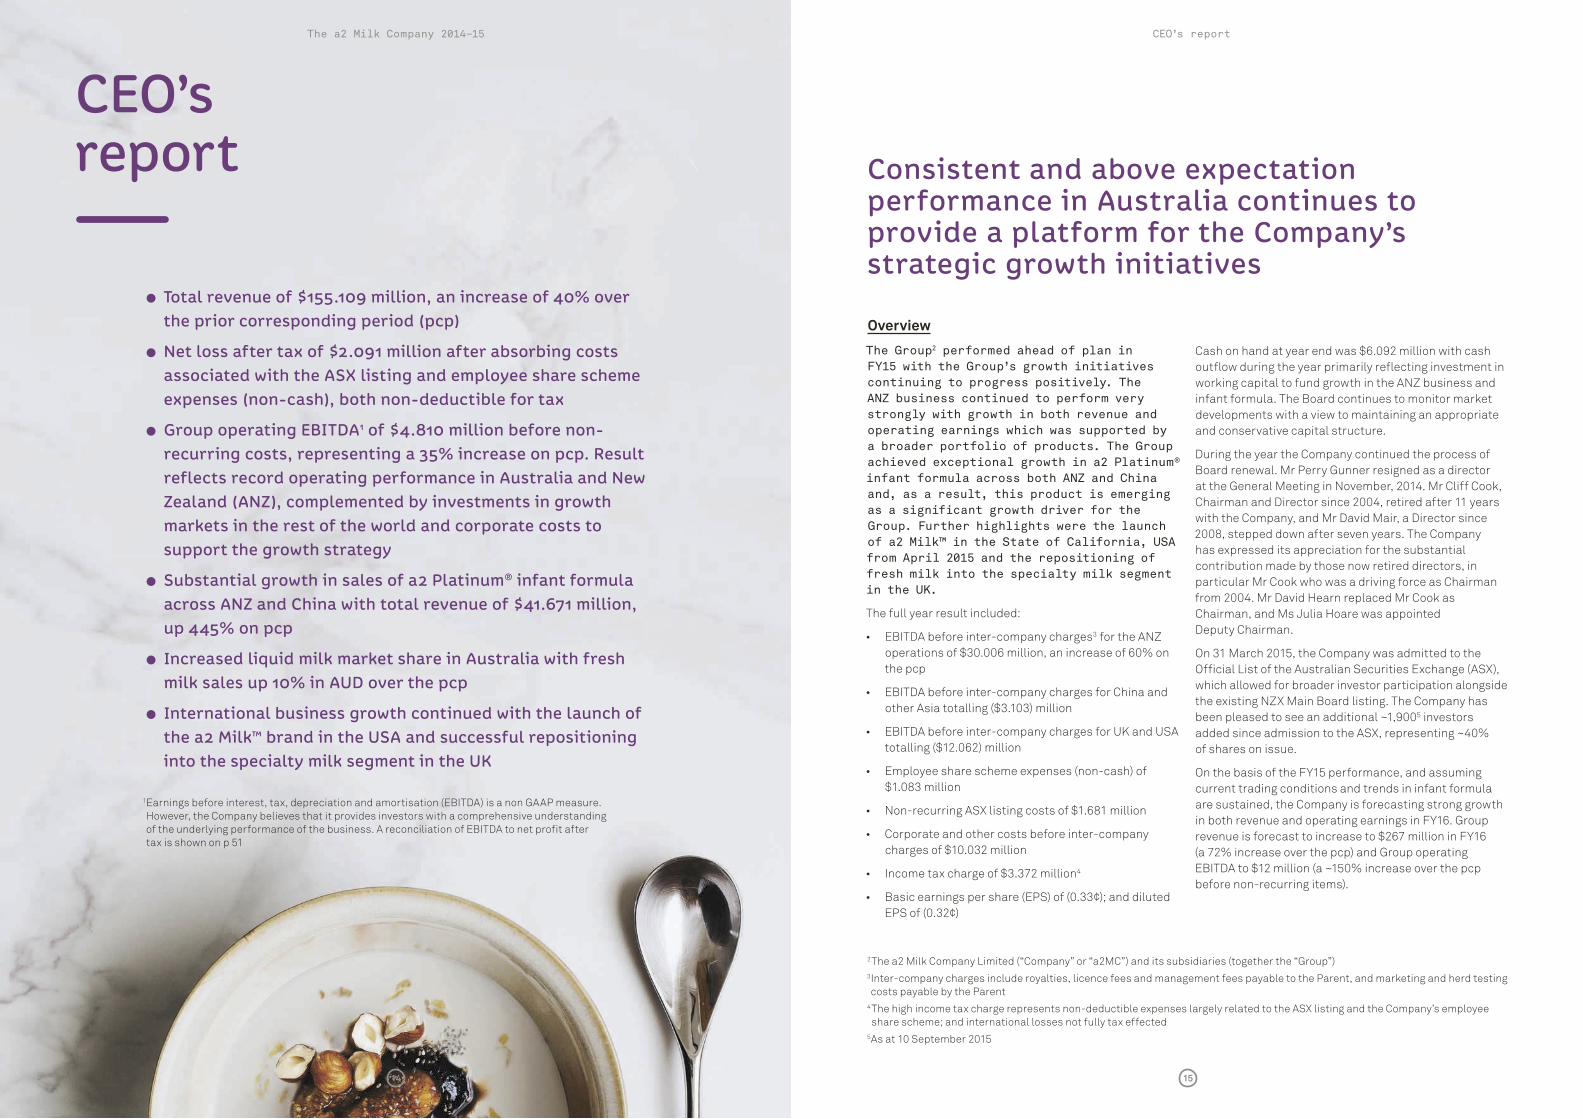
Overview
The Group2 performed ahead of plan in FY15 with the Group’s growth initiatives continuing to progress positively. The ANZ business continued to perform very strongly with growth in both revenue and operating earnings which was supported by a broader portfolio of products. The Group achieved exceptional growth in a2 Platinum®
infant formula across both ANZ and China and, as a result, this product is emerging as a significant growth driver for the Group. Further highlights were the launch of a2 Milk™ in the State of California, USA from April 2015 and the repositioning of fresh milk into the specialty milk segment in the UK.
The full year result included:
• 3 for the ANZ operations of $30.006 million, an increase of 60% on the pcp
•other Asia totalling ($3.103) million
•totalling ($12.062) million
•$1.083 million
•
•charges of $10.032 million
• 4
•
CEO’s report
� Total revenue of $155.109 million, an increase of 40% over the prior corresponding period (pcp)
� Net loss after tax of $2.091 million after absorbing costs associated with the ASX listing and employee share scheme expenses (non-cash), both non-deductible for tax
� Group operating EBITDA1 of $4.810 million before non-recurring costs, representing a 35% increase on pcp. Result reflects record operating performance in Australia and New Zealand (ANZ), complemented by investments in growth markets in the rest of the world and corporate costs to support the growth strategy
� Substantial growth in sales of a2 Platinum® infant formula across ANZ and China with total revenue of $41.671 million, up 445% on pcp
� Increased liquid milk market share in Australia with fresh milk sales up 10% in AUD over the pcp
� International business growth continued with the launch of the a2 Milk™ brand in the USA and successful repositioning into the specialty milk segment in the UK
Consistent and above expectation performance in Australia continues to provide a platform for the Company’s strategic growth initiatives
Cash on hand at year end was $6.092 million with cash outflow during the year primarily reflecting investment in working capital to fund growth in the ANZ business and
developments with a view to maintaining an appropriate and conservative capital structure.
2008, stepped down after seven years. The Company has expressed its appreciation for the substantial contribution made by those now retired directors, in particular Mr Cook who was a driving force as Chairman
On 31 March 2015, the Company was admitted to the Official List of the Australian Securities Exchange (ASX),which allowed for broader investor participation alongside
been pleased to see an additional ~1,9005 investors added since admission to the ASX, representing ~40% of shares on issue.
On the basis of the FY15 performance, and assuming current trading conditions and trends in infant formula are sustained, the Company is forecasting strong growth
revenue is forecast to increase to $267 million in FY16
before non-recurring items).
2
3Inter-company charges include royalties, licence fees and management fees payable to the Parent, and marketing and herd testing costs payable by the Parent
4The high income tax charge represents non-deductible expenses largely related to the ASX listing and the Company’s employee
5As at 10 September 2015
1
tax is shown on p 51
14 15
The a2 Milk Company 2014–15 CEO’s report

CEO’s report¤(cont’d)
Strategic Agenda
The Company continues to execute on its strategy of growing and broadening the ANZ business and developing international growth opportunities in the rest of the world. This strategy is resulting in an expansion of the product portfolio across an increasingly global distribution framework.
Infant formula is emerging as a significant and meaningful
FY15 with revenue of NZ$41.7 million across ANZ and China, now accounting for 27% of total business turnover within two years of launch. The majority of sales occurred within the Australian grocery and pharmacy channels, although the Company believes a proportion may relate to products which were on-sold into China, as is the case with other premium infant formula brands sold in domestic markets.
To foster further growth in infant formula, the Company is broadening the portfolio and distribution of the a2 Platinum® brand. This includes launching new infant formula based products and expanding distribution routes into China by combining cross border and
channel to maximise consumer accessibility in the region. Furthermore, the Company is considering a product launch in the UK in the short to medium term.
The Company has commented previously on its intention to broaden the product portfolio in Australia. New offerings are underway, with the introduction of a2 Milk™ whole milk powder in June 2015. This is expected to have a broader distribution rollout throughout FY16. In addition the Australian business recently launched a2 Ice Cream™ in August 2015. The Company is optimistic about the growth prospects for these new products in Australia and potentially in other markets over time.
The Company also expanded the a2 Milk™ brand into new markets during FY15. The China business began selling a2 Milk™ fresh milk sourced from Australia in August 2014 and will launch a2 Milk™ whole milk powder through e-commerce and cross border distribution channels during FY16.
With the initial launch of a2 Milk™ into the California market in the USA underway, the Company is looking to extend distribution into additional states over the next 12 months.
within the premium specialty milk segment, the Company is focussed on broadening the product portfolio with the
®
infant formula.
Furthermore, the Company is investigating further opportunities in relation to dairy and infant formula products, including the sale of liquid milk in New Zealand.
ANZ
The ANZ business continued to deliver very strong revenue and earnings growth on the prior year, with FY15 returning a record result for the region. Total gross revenue in AUD across all product categories increased by 45% on the pcp to $148.4 million, and Operating EBITDA before intercompany charges totalled NZ$30.0 million. This result reflects the continued strong performance of fresh milk combined with the exceptional growth of a2 Platinum® infant formula.
Australian fresh milk sales continued to achieve solid
increased competitor activity. This is a pleasing growth rate driven by growing consumer awareness of the benefits of the product, and the breadth of distribution in the retail trade. Importantly, during FY15, gross sales for Australian fresh milk exceeded AU$100 million for the first time – a significant achievement for the business.
2015) for fresh milk in Australia.
The business experienced a marginal decline in fresh milk gross margin, driven by increased farm-gate raw
processing facility. The business continues to focus on achieving processing efficiencies with the objective of maintaining attractive gross margins.
As indicated, sales of a2 Platinum® infant formula in Australia exceeded expectations in the year. a2 Platinum®
has recently been the fastest growing infant formula
16 17
The a2 Milk Company 2014–15 CEO’s report

CEO’s report¤(cont’d)
brand in the Australian market with an estimated 12% grocery market share for the 13 weeks ending 11 August 2015 by value, notwithstanding only achieving ranging in a second major retailer from November 2014. This rapid growth in demand led to stock shortages, which impacted total sales and market share for the year. In addition, and in response to the growing demand for a2 Platinum® infant formula, the Company extended the existing range of three variants to include a fourth product in July 2015.
Further revenue growth was achieved from new products including a full year’s revenue from a2 Cream™ and the launch of a2 Milk™ whole milk powder in limited release within one major retailer in June 2015. The Company experienced a positive initial consumer response to the launch of whole milk powder, and is optimistic about future growth prospects for this product.
In response to the increasing demand for infant formula and whole milk powder products, the business has been active in securing new long term milk supply contracts in New Zealand, with annual milk supply doubling to over 100 million litres.
On the basis of the strong performance in FY15, and assuming current trading conditions and trends in infant formula are sustained, the Company is forecasting
China
As previously advised, the growth of a2 Platinum® infant formula within China was impacted by changes in access arrangements for manufacturers and brand owners from ANZ into China during calendar 2014. The Company’s manufacturing partner Synlait Milk achieved the new form of registration in late September 2014 and shipments of a2 Platinum® infant formula to China recommenced from December. The Company continued to invest in marketing activity and sales support for distributors during FY15 in order to build a solid foundation for future growth.
In November 2014, the Company announced changes to its supply and distribution arrangements with China
revised arrangements, CSF has become the exclusive import agent and government relations partner for a2 Platinum®. The Company has now assumed direct responsibility for distribution of a2 Platinum® in China with an experienced local team of eight, based in Shanghai. a2 Platinum® was showcased at the annual
July 2015, attracting significant interest from local distributors. The network of local distributors has grown to 25 as at August 2015 with strength emerging across East and West China. As a direct result of these changes and the increased exposure of the a2 Platinum® brand on digital platforms in China, the Company remains very positive regarding the growth prospects in this market.
a2 Milk™ fresh milk sourced from Australia was launched in China in August 2014 in premium supermarkets,
China’s largest online direct sales platform. Whilst the
milk is modest, these initiatives will help establish the a2 Milk™ brand in China and broaden the trial base.
To take further advantage of the growing e-commerce and cross-border platforms, the Company also recently
during July 2015 selling Australasian label a2 Platinum®
infant formula direct to Chinese consumers. Within its first four weeks of operation there were approximately 60,000 unique visitors to the online store. It is anticipated that further e-commerce initiatives will follow.
18 19
The a2 Milk Company 2014–15 CEO’s report

Intellectual property (IP) and other matters
The Company continues to enhance and extend the scope of its comprehensive IP portfolio and provide support for targeted research and development associated with the benefits of the A2 protein and the absence of A1 protein.
new patent applications relating to health benefits, physical properties and testing methodologies for A1 protein free products. These have relevance for both liquid and powder products.
for misleading and deceptive conduct in relation to The Checkout program. A first directions hearing took place in the Federal Court in mid July 2015 and the matter is proceeding according to a Court ordered timetable.
In addition to the publication of the first human digestion trial conducted by Curtin University (published in the European Journal of Clinical Nutrition in August 2014), further scientific progress has been made. A US based
2014 reports a parallel in the intolerance effects of the
higher levels of dairy intolerance in China, the Company sponsored a human clinical study in this market during the year. The results lend further support around the digestive benefits of milk free of the A1 protein and has been submitted for publication.
The Company continues to make progress in developing and applying its brands consistently around the world across packaging, communication and digital assets. Further, a number of trade mark applications achieved registration during FY15 with a number of new filings being made across all markets.
Geoffrey BabidgeManaging Director and CEO16 September 2015
CEO’s report¤(cont’d)
UK
During FY15, the Company repositioned the a2 Milk™ brand in the UK into the premium specialty milk segment away from mainstream dairy. The strategy draws on theexperiences in Australia and focuses on three key elements – building distribution in existing accounts; increasing awareness of the unique attributes of the product in a targeted manner; and enhancing price positioning through new packaging formats to improve margins.
The Company has been pleased with the acceptance across the retail trade for the new one litre pack format, with the product now represented in the majority of supermarket accounts in the UK. The pack transition and the associated pricing realignment have significantly improved unit gross margins. The introduction of the new format and shift in shelf location was dependent on the timing of retailer reviews and was completed during March 2015. New ranging in J Sainsbury stores
2015. In addition, the Company’s existing retail partners Tesco, Waitrose, Ocado and Morrisons all progressively transitioned to the new pack format.
The phased execution timings resulted in second half sales momentum below expectation. Notwithstanding this, the Company is confident of achieving positive growth in FY16 in fresh milk. Importantly, the Company has now established a more solid brand platform for further product extensions.
The Company continues to be well supported by its
product consistently supplied to a high quality standard.
USA
The a2 Milk™ brand launched into the Southern California region during April 2015 and will commence its roll-out into Northern California from September. The Company has made solid progress in building retailer distribution and is on target to achieve approximately 65% of retail weighted distribution in Southern California by late August. Overall initial retailer acceptance has been high, with only one major retailer group presented to being yet to place an order. The focus has now turned to achieving similar distribution in Northern California.
After evaluating the early positive trends, the roll-out plans beyond California are now focussed on building distribution across a number of select national customers, which best align with the a2 Milk™ brand’s healthy and natural positioning. Already the brand is being distributed on a nationwide basis by two of the largest natural food specialty chains in the USA, Sprouts
additional national retailers are progressing.
In addition to expanding retail distribution with key customers, the Company has been building internal capabilities and infrastructure to support the roll-out plans. The Company has recently established national broker relationships with an emphasis on key customer representation, along with retail activation of the a2 Milk™ brand. The Company is also focussed on building awareness and educating consumers about the digestive benefits of a2 Milk™.
Pleasing progress has been made in establishing the product supply chain, including engagement with a growing group of local farmers that fit well with the Company’s expansion plans. The Company has also established a strong local management team based
While it is early in the launch, feedback from retailers and consumers is consistently favourable. Call centre and on-line interest continues to grow weekly, reflecting growing consumer awareness for, and interest in, the a2 Milk™ brand in the USA.
20 21
The a2 Milk Company 2014–15 CEO’s report

The a2 Milk™ brand launches into the California region in USA
a2 Milk™ brand in Australia extends into whole milk powder and ice cream whilst continuing to expand its value share within fresh milk and infant formula
The a2 Milk Company T-mall global digital store opens in China and cross border selling commences on JD.com
Four patent applications are filed relating to health benefits, physical properties and testing methodologies for A1 protein free products
The a2 Milk Company Limited is dual listed and admitted to the Australian Securities Exchange (ASX)
Recenthistory
2012 2013 2014 2015
EBITDA before non-recurring itemsFY11¤–¤FY15 (NZ$ million)
2.8
4.7
10.6
3.64.8
Successfully completed capital raising and transferred listing from NZX Alternate Board to the NZX Main Board
A new, state-of-the-art milk processing facility is commissioned in Sydney, Australia
a2 Milk™ is launched into the UK under a joint venture agreement with Robert Wiseman Dairies (subsequently Müller Wiseman Dairies)
a2 Platinum® infant formula is launched across China, Australia and New Zealand and total infant formula business gaining momentum
Company name and subsidiary names become aligned to one new brand identity: The a2 Milk Company™
a2 Milk™ brand launches UHT and fresh milk into China and thickened cream in Australia
The a2 Milk Company takes full ownership of the UK joint venture from Müller Wiseman Dairies repositioning the brand into specialty milk and UK business momentum continues
Human digestion trial published in European Journal of Clinical Nutrition reporting a digestive difference between A1 and A2 beta casein protein and supporting previous studies
Three patent applications are filed relating to digestive and metabolic benefits of the A2 protein
SalesFY11¤–¤FY15 (NZ$ million)
42.262.5
94.3110.6
154.8
FY11 FY12 FY13 FY14 FY15
FY11 FY12 FY13 FY14 FY15
full calendar year.
22 23
The a2 Milk Company 2014–15 Recent history

Today, regular milk contains a mix of A1 and A2 protein types
Originally all cows produced milk containing only the A2 type of beta casein protein
Following domestication the A1 protein type emerged through genetic mutation
~70% of cows today produce milk containing the A1 protein type
What is thea2 Milk™¤difference?
All our milk products naturally contain the A2 protein and are completely free from the A1 protein type
Our company was founded on a profound discovery, unique intellectual property and a growing belief of the effect different milk proteins have on human health. To this day we continue to have a long term commitment to increasing science backed evidence and pioneering new thinking, new products and new markets
We’re passionate about the unique and meaningful difference we make to peoples’ lives who may otherwise restrict or avoid dairy
We’re pioneersat heart
We’re fortransformingpeoples’ lives
We create simple, relevant and credible ways to educate people about the unique benefi ts of theA2 protein whether they are consumers, health care professionals or opinion leaders from around the world
We simplifythe complex
24 25
The a2 Milk Company 2014–15 The a2 Milk™ difference

David Hearn
Chairman & Executive Director
Master of Arts
Director since February 2014
David has been Chairman of the Company since 30 March 2015. David is also a member of the Nomination and Remuneration Committees. David has experience and skills in executive management, sales and marketing and strategy development in FMCG in international markets. He has held senior executive roles including Chief Executive Officer or Managing Director roles for FMCG companies including Goodman Fielder Limited, UB Snack Foods Europe/Asia, Del Monte UK and Smith’s Crisps and for the marketing services group, Cordiant Communications Group.
In addition to his a2MC directorship, David is also a Director of Lovat Partners Limited, Robin Partington & Partners Limited, and Committed Capital Limited. David resides in the United Kingdom.
Julia Hoare
Deputy Chairman & Non-Executive Director
Bachelor of Commerce, FCA, MInstD
Director since November 2013
Julia has been Deputy Chairman of the Company since 30 March 2015. Julia is also Chairman of both the Nomination Committee and the Audit and Risk Management Committee. Prior to joining the Board, Julia had extensive chartered accounting experience in Australia, the UK and New Zealand and was a partner with PwC New Zealand for 20 years.
In addition to her Company directorship, Julia is a Director of New Zealand Post Limited, Watercare Services Limited, AWF Madison Group Limited and Port of Tauranga Limited (appointed 20 August 2015).
Julia is also a member of the New Zealand External Reporting Advisory Panel (XRAP), a body designed to support the standard setting process of the New Zealand External Reporting Board (XRB), and the New Zealand Institute of Directors National Council. Julia resides in New Zealand.
Geoffrey Babidge
Managing Director & Chief Executive Officer (CEO)
Bachelor of Economics
Director since September 2010
Geoffrey has over 25 years senior management experience working in the Australian FMCG industry. Prior to his appointment as CEO of the Company in 2010, Geoffrey held senior executive roles with a number of companies in Australia including Freedom Foods Group Limited, Bunge Defiance and National Foods.
Prior to these roles he was a practicing chartered accountant and Partner at Price Waterhouse. Geoffrey resides in Australia.
Richard Le Grice
Non-Executive Director
Bachelor of Laws
Director since February 2007
Richard has experience in management of, and as a shareholder in, a number of private companies. He brings considerable international experience with these companies operating in a number of countries including Australia.
In addition to his Company directorship, Richard is also a Director of several other companies including Energi Advertising Limited, Thode Knife & Saw Limited and The Gravitas Group Limited. Richard is Chairman of the Remuneration Committee and a member of both the Audit and Risk Management Committee and the Nomination Committee. Richard resides in New Zealand.
Melvyn Miles
Non-Executive Director
Bachelor of Science (Hons)
Director since July 2010
Melvyn has over 30 years Australian and international senior executive experience in the FMCG industry, and has held Vice President roles in Carlton & United Breweries and Foster’s Group and General Manager roles in Visy Industries and Amcor.
Melvyn is a member of both the Audit and Risk Management Committee and the Remuneration Committee. Melvyn resides in Australia.
Director profiles
Governance & disclosures
Contents
Director Profiles .................................................... 27
Executive Team ..................................................... 28
Corporate Governance Framework ..................... 30
The Board ............................................................... 32
Remuneration ........................................................ 40
Diversity ................................................................. 44
Disclosures ............................................................ 45
2726
The a2 Milk Company 2014–15 Governance & disclosures
Geoffrey Babidge
Managing Director & Chief Executive Officer (CEO)
Bachelor of Economics
See the Directors’ profiles above for details of Geoffrey’s qualifications and experience.
Craig Louttit
Chief Financial Officer & Company Secretary
Bachelor of Commerce,CA
Craig joined the Group in April 2014 from ASX listed public company UGL Limited where, since 2007, he had held senior finance roles including as General Manager Finance, Transport and Technology Systems, and Group Financial Controller. Prior to this he held senior finance roles with EMI Group PLC from 1999 in London, UK. Craig is a member of the Institute of Chartered Accountants in Australia.
Susan Massasso
Chief Marketing Officer
Bachelor of Commerce (Accounting/Marketing)
Susan has over 18 years’ experience in the FMCG industry. She joined the Group in September 2013 as Chief Marketing Officer with oversight of marketing and brand development across all markets. Susan has held several senior leadership positions across the Campbell Arnott’s business including most recently Asia Pacific Regional Marketing Director. Prior to this she held a number of commercial roles including Marketing Director Arnott’s ANZ, Marketing Director Campbell’s ANZ and General Manager Campbell’s ANZ. Prior to this Susan spent a number of years at Unilever where she held a number of marketing, consumer insight and logistics roles. Susan attended the University of Sydney under scholarship from accounting firm Price Waterhouse where she also gained undergraduate employment throughout her degree.
Dr Andrew Clarke
Chief Scientific Officer
Bachelor of Science (Hons), Master of Science, PhD
Andrew joined the Group in 2003. Andrew has over 15 years’ experience in private sector pharmaceutical research and agricultural biotechnology. He received a PhD in Biochemistry and Molecular Biology from the University of Auckland. In his role as Chief Scientific Officer, Andrew oversees all aspects of the Group’s science-based activities including research and development, scientific communications and the expansion of intellectual property.
Simon Hennessy
General Manager, International Development
Bachelor of Science (Chemistry), Graduate Diploma, Corporate Finance
Simon joined the Group in 2007 as the Business Unit Manager for the Australian joint venture with Freedom Foods. In 2010 Simon took on the responsibilities for Group operations and development of new markets. Simon has over 25 years’ experience in manufacturing operations, sales and marketing, after an early career in research and development and quality management.
Shareef Khan
General Manager, Operations
Bachelor of Science, CSCP, APICS
Shareef joined the Group in June 2012. He has over 13 years’ senior management experience as a qualified supply chain professional. He is experienced across a number of industries, some of which include FMCG, infant nutrition, office products and construction.
Peter Nathan
Chief Executive, Australia & New Zealand
Bachelor of Business (Marketing)
Peter joined the Group in 2008 and in 2010 took on the role of Chief Executive of the Australia and New Zealand region. During his time with the Company, Peter has led the successful re-launch of a2MC branded milk in the Australian market. He has over 20 years’ experience working in the FMCG industry, as evidenced by his previous senior marketing and sales roles for Gillette and Colgate Palmolive in Australia and Asia as well as his involvement with Freedom Foods Group Limited as General Manager.
Scott Wotherspoon
Chief Executive, UK and China
Bachelor of Arts (Hons) (Law)
Scott joined the Group in January 2014 assuming the role of Chief Executive of the wholly owned subsidiary, The a2 Milk Company Limited (UK). More recently Scott’s role has expanded to include responsibility for the China business. Prior to his appointment Scott held a number of senior roles including 15 years in marketing, sales and commercial roles both in Europe and Asia with the Unilever Group, CEO of a specialist beauty devices business and CEO of Plum Baby, a private equity backed food business in the UK which was recently acquired by Campbell’s Soup Company. Scott has also received a degree from Cambridge University.
Jeffrey O’Neill
Chief Executive, USA
Bachelor of Business Administration (Hons)
Jeffrey joined the Group in April 2015, assuming the role of Chief Executive of the USA region. Jeffrey has an extensive senior leadership background with over 30 years’ experience in brand marketing, sales and strategic planning in Canada and the United States. Jeff’s prior roles include President and CEO for Pepsi-Cola Canada, President and CEO for Priszm/YUM brands Canada and more recently President and CEO for The Einstein Noah Restaurant Group, a publically traded restaurant chain with over 800 restaurants throughout the USA.
Executive team Executive team
28 29
The a2 Milk Company 2014–15 Governance & disclosures

The a2 Milk Company Limited (the “Company” or “a2MC”) is a company incorporated in New Zealand under the Companies Act 1993 (NZ) (Companies Act) and is listed on the New Zealand Main Board (NZX) and the Australian Securities Exchange (ASX).
The Board of a2MC is committed to ensuring that the Company maintains the highest standards of corporate governance. Through the establishment of the corporate governance framework, the Board seeks to ensure that its Directors, officers and employees fulfil their functions responsibly, whilst protecting and enhancing the interests of shareholders.
The Company’s corporate governance framework has been developed with regard to:
• the NZX Listing Rules and the NZX Corporate Governance Best Practice Code (NZX Code);
• the Financial Markets Authority’s Corporate Governance in New Zealand: Principles and Guidelines2; and
• the ASX Listing Rules and the ASX Corporate Governance Council’s Corporate Governance Principles and Recommendations (3rd Edition) (ASX Principles).
This corporate governance section sets out the Company’s commitment to best practice corporate governance and addresses the Company’s compliance with the ASX Principles and the NZX Code.
For the year ended 30 June 2015, a2MC considers that its corporate governance framework materially aligns with the NZX Code, except where noted below:
NZX Code, section 2.4Directors should undertake appropriate training to remain current on how to best perform their duties as Directors
The Company does not have specific training requirements for its Directors. However the Nomination Committee has considered and is satisfied that the composition of the Board reflects an appropriate range of skills and experience for a2MC to effectively discharge its responsibilities.
NZX Code, section 2.7Directors are encouraged to take a portion of their remuneration under a performance-based equity security compensation plan
The Directors do not take a portion of their remuneration as Directors under a performance-based equity security plan.
From the time a2MC was admitted to the ASX3, being 31 March 2015, to 30 June 2015, a2MC considers that its corporate governance framework adheres to the ASX Principles, except where noted below, and provides the reason(s) for not following those ASX Principles4:
ASX Recommendation 2.4A majority of the board should be independent Directors
The Company has five Directors and only two were considered independent for ASX purposes as at 30 June 2015.
The Board believes that the current mix of Directors is appropriate for the Company’s business and circumstances and is in the best interests of shareholders as a whole. Further, the Board believes that, the Board as a whole is not hindered in its ability to exercise independent view and judgement. The Chair of each Board sub-committee is an independent Director.
The Board is mindful of the recommendation that a majority of the Board should be independent Directors. Accordingly, the Board is looking to increase the number of independent Directors on the Board and is considering appointing an additional independent Director with appropriate skills and experience.
2December 2014
3The Company was admitted to the Official List of the ASX on 31 March 2015 (refer page 34 for further details)
4 The ASX Corporate Governance Council has instilled an “if not, why not” approach with regard to reporting the Company’s compliance with its recommendations
ASX recommendation 2.5 The chair of the board should be an independent Director and, in particular, should not be the same person as the CEO
The Chairman of the Board is David Hearn. Mr Hearn is not considered an independent Director for ASX purposes because of his limited executive role with the Group. Mr Hearn does not have any conflicts of interest with the Company and the Board is confident that Mr Hearn is capable of exercising independent view and judgement in exercising his role as Chairman. Further, the Board believes that the significant skills and experience gained in other businesses that Mr Hearn will bring to the role of Chairman outweighs any perceived lack of independence.
The Board is mindful of the recommendation that the Chairman be an independent Director and will continue to review Mr Hearn’s performance in that capacity in the context of prevailing circumstances and needs of the Company.
The roles of Chairman and Chief Executive Officer are not exercised by the same individual. The role of Chief Executive Officer is held by Geoffrey Babidge.
ASX recommendation 7.3(b) If a Company does not have an internal audit function, the Company should disclose that fact, and the processes the Company employs for evaluating and continually improving the effectiveness of its risk management and internal control processes
Due to the Company’s current size and business circumstances, the Company does not have an internal audit function. The Company will appoint an internal auditor if, and when, the Company considers this necessary. Under the Audit and Risk Management Committee Charter, the Audit and Risk Management Committee is responsible for providing an independent and objective assessment to the Board regarding the adequacy, effectiveness and efficiency of the Company’s risk management and internal control processes.
ASX recommendation 8.1(a)(1) The board should have a remuneration committee which has at least three members, a majority of whom are independent Directors
The Remuneration Committee consists of Richard Le Grice, Melvyn Miles and David Hearn. Whilst a majority of the members of the Committee were non-executive, the majority were not independent Directors for ASX purposes as David Hearn and Melvyn Miles are not considered independent Directors as at 30 June 2015 for the reasons outlined on page 33. The Board believes that the members of the Committee as a whole are not hindered in their ability to exercise independent view and judgement. Further, the Board believes the Committee maintains its independence as the Remuneration Committee Charter prohibits a member of the Committee from being present for discussions at a Committee meeting on, or vote on a matter regarding, his or her remuneration.
The Remuneration Committee is chaired by Richard Le Grice, who is an independent Director for ASX purposes.
This Corporate Governance statement is current as at 30 June 2015 and has been approved by the Board
Corporate governance framework Corporate governance framework cont.
30 31
The a2 Milk Company 2014–15 Governance & disclosures

THE BOARD
Role of the Board and delegation of authority
The Board is responsible for the overall governance of the Company. Issues of substance affecting the Company are considered by the Board, with advice from external advisers as required. Each Director must bring an independent view and judgment to the Board and must declare all actual or potential conflicts of interest on an ongoing basis. Any issue concerning a Director’s ability to properly act as a Director must be discussed at a Board meeting as soon as practicable, and a Director may not participate in discussions or resolutions pertaining to any matter in which the Director has a material personal interest.
The role of the Board is set out in the Board Charter, which records the Board’s roles and responsibilities. A copy of the Board Charter is available on the Company’s website at www.thea2milkcompany.com/about-us/corporate-governance.
The Board delegates certain functions to its three Board Committees (Audit and Risk Management Committee, Remuneration Committee and Nomination Committee). The role of each of these Committees is outlined on pages 36 to 37.
Board procedures ensure that all Directors have the information needed to contribute to informed discussion on all monthly agenda items and effectively carry out their duties. Senior managers make direct presentations to the Board on a regular basis to give the Directors a broad understanding of management philosophies and capabilities.
Role of senior executives
To enable the effective day-to-day management and leadership of the Company, the Board has delegated the management responsibilities of the Company to the Chief Executive Officer. The Chief Executive Officer has in turn sub-delegated parts of his authority to senior executives in his leadership team to enable effective and timely decision making. The Board meets regularly with management to provide strategic guidance for the Company and effective oversight of management.
Role of Chairman
The Chairman’s role is set out in clause 6 of the Board Charter and includes to lead and manage the Board so that it operates effectively, and to facilitate interaction between the Board and the Chief Executive Officer. The Board supports the separation of the role of the Chairman (Mr David Hearn) and Chief Executive Officer (Mr Geoffrey Babidge) in accordance with the requirements of the NZX Code and the ASX Principles. The ASX Principles recommend that the Chairman should be an independent Director. Mr David Hearn is not considered an independent Director for the reasons outlined on page 33. However, the Board is confident that Mr David Hearn is capable of exercising independent view and judgement in exercising his role as Chairman.
Role of Company Secretary
The Company Secretary, Craig Louttit, is accountable directly to the Board, through the Chairman, on all matters to do with the proper functioning of the Board. Each Director is able to communicate directly with the Company Secretary
and vice versa. The role of the Company Secretary is outlined in clause 15 of the Board Charter.
Board size and structure
At 30 June 2015, the Board was comprised of five Directors (three non-executive Directors and two executive Directors). The a2MC constitution currently requires a minimum of four Directors and provides for a maximum of eight, of which at least two must be New Zealand residents in order to comply with the Companies Act 1993. The Directors’ profiles can be found on page 27.
The Nomination Committee has considered and is satisfied that the composition of the Board reflects an appropriate range of skills and experience for a2MC to effectively discharge its responsibilities. Director’s skills, experience, expertise and the term of office held by each Director at the date of this Annual Report is set out in the “Director Profiles” section of this Annual Report.
Nomination Committee
The Company’s Nomination Committee is responsible for regularly reviewing the size, composition and skills of the Board to ensure that the Board is able to discharge its duties and responsibilities effectively and to identify any gaps in the skills or experience of the Board. The Nomination Committee is also responsible for reviewing the performance of the Board.
The Board Charter provides that it is intended the Board should, where practicable, comprise a majority of independent Directors, and comprise Directors with a broad range of skills, expertise, and experience from a 5Melvyn Miles resigned as Director of Freedom Foods Group Limited, effective 14 August 2015
diverse range of backgrounds that is relevant to the Company and its strategy.
Director independence
The Board Charter provides that it is intended that, the Board should, where practicable, comprise a majority of independent Directors.
Director independence is initially assessed upon each Director’s appointment and reviewed each year, or as required when a new personal interest or conflict of interest is disclosed. For this purpose, each Director is required to bring an independent view and judgment to the Board and to declare all actual or potential conflicts of interest on an ongoing basis. Any issue concerning a Director’s ability to properly act as a Director must be discussed at a Board meeting as soon as practicable, and a Director may not participate in discussions or resolutions pertaining to any matter in which the Director has a material personal interest.
In determining the independence of its Directors, the Board takes into account the guidance for independence which are set out in Principle 2 of the ASX Principles, the NZX Listing Rules and the NZX Code. Under those rules and recommendations, Directors are considered to be independent if they are a non-executive Director and do not have any direct or indirect interest or relationship that could, or could reasonably be perceived to, materially interfere with the Director’s ability to act in the best interests of the Company and security holders generally.
As at 30 June 2015, the Board considered that Richard
Le Grice and Julia Hoare were independent Directors.
As at 30 June 2015, the Board considered that David Hearn, Geoffrey Babidge and Melvyn Miles were not independent Directors for the following reason(s):
• Chairman and Executive Director, David Hearn, was not considered to be independent because of his executive role in relation to the Group’s business in the Northern Hemisphere. Mr Hearn brings a strong skill set in executive management, sales and marketing and strategy development in fast moving consumer goods in international markets. The Company believes that Mr Hearn’s extensive experience in the industry and in business generally is invaluable and outweigh any perceived lack of independence
• CEO, Geoffrey Babidge, was not considered to be independent because of his executive role with the Company. Mr Babidge was appointed to the Board in 2010 and has over 25 years senior management experience in the industry
• Non-executive Director, Melvyn Miles, was not considered to be independent because he was also a Director of a substantial shareholder of the Company, Freedom Foods Group Limited5. Mr Miles was appointed to the Board in 2010 and has over 30 years domestic and international senior executive experience in the industry. Mr Miles brings extensive experience and in-depth knowledge of the industry to the Company and the Board
considers that the interests of shareholders are best met by the continued contribution of Mr Miles
Whilst, the Board did not as at 30 June 2015 comply with the ASX Principle that a majority of the Board should be independent Directors, the Board considers it has an appropriate mix of skills, experience and independence to ensure that the Company is governed in a manner that ensures that the best interests of shareholders as a whole are represented. The Board is also confident that proper processes are in place to manage any actual or potential conflicts of interest. The Board Charter outlines the Board’s policy on conflicts of interest.
Nominations, appointments and ongoing education
The Company’s process for selection, appointment, and re-appointment of Directors is detailed in the Nomination Committee Charter, a copy of which is available on the Company’s website at www.thea2milkcompany.com/ about-us/corporate-governance.
The primary objectives of the Nomination Committee are to ensure that a formal and transparent process for the nomination and appointment of Directors exists, to recommend Director appointments to the Board and to regularly review the composition of the Board to ensure the right composition of Directors is maintained.
The board cont. The board cont.
32 33
The a2 Milk Company 2014–15 Governance & disclosures
The Nomination Committee recommends to the Board suitable candidates for appointment as Directors. The Committee will consider, among other things:
• the candidate’s experience as a Director
• their skills, expertise and competencies;
• the extent to which those skills complement the skills of existing Directors
• their degree of independence; and
• their ability to devote sufficient time to the Directorship
The Nomination Committee undertakes appropriate checks before appointing a person or putting forward to shareholders a new candidate for election, as a Director. Such checks have been undertaken in relation to all current Board members, and will be undertaken prior to appointment or election of any new Board candidate.
The Company will provide information to shareholders about Directors seeking re-election at a general meeting to enable them to make an informed decision on whether or not to re-elect the Director, including their relevant qualifications and experience and the skills they bring to the Board; details of any other material Directorships currently held by the candidate; the term of office already served by the Director; whether the Director is considered to be independent; and a recommendation by the Board in respect of the re-election of the Director.
The Company will, in the case of a candidate standing for election as a Director for the first time, provide
information to shareholders about the candidate to enable them to make an informed decision on whether or not to elect the candidate, including material adverse information revealed by any checks the Nomination Committee has performed on the candidate, details of any interest, position, association or relationship that might influence, or reasonably be perceived to influence, in a material respect the candidate’s capacity to exercise judgement on board matters or to act in the best interests of the Company and its shareholders; the Board’s view on whether the candidate will be considered to be an independent Director; and a recommendation by the Board in respect of the election on the candidate.
On appointment to the Board, Directors receive a formal letter of appointment outlining their duties and obligations, and participate in an induction program, which provides new Directors with all such information and advice which may be considered necessary or desirable for the Director to commence their appointment to the Board.
To ensure ongoing education, Directors are regularly informed of developments that affect a2MC’s industry and business environment, as well as company and legal issues that impact the Directors themselves. Directors receive comprehensive board papers and briefing information before Board meetings and have unrestricted access to management and any additional information they consider necessary to perform their roles as Directors effectively.
A Director may obtain independent professional advice relating to the affairs of the Company or
his/her responsibilities as a Director or Committee member. Where the Director has the approval of the Board Chairman to obtain independent professional advice, the Company will meet the reasonable costs of the advice.
Board renewal
On 18 November 2014, Perry Gunner retired as Deputy Chairman after over four years as a Director of the Company.
On 31 March 2015 the Company was admitted to the Official List of the ASX (“ASX Listing”). In conjunction with the ASX Listing, the Board brought into effect a number of changes consistent with the process of review and renewal of the Board, which the Company commenced during 2013. The following changes took place:
• Chairman, Clifford Cook, resigned as both Chairman and a Director of the Company. Mr Cook had been a Director and the Chairman of the Company since 2004 and was instrumental in leading the evolution of the Company since that time. Mr Cook advised that the decision to resign was made with careful consideration of the Company’s leadership requirements for the future
With the Company now well established and strongly positioned to pursue further growth in the UK, China and the USA, Mr Cook believed the Chairman should possess significant fast moving consumer goods skills, broad international experience consistent with the Company’s target market strategies and be located closer to those markets. The remaining members of the Board concur
with this approach, which is consistent with the ongoing process of Board renewal
• Director, David Mair, resigned as a Director of the Company. Mr Mair had been a Director since October 2008. He was an active Board member since this time including in his role as Chairman of the Remuneration Committee since FY11 and as the designated Non-executive Director assisting the Group’s Asian growth initiatives. Mr Mair’s decision to leave the Board is consistent with the process of Board renewal which commenced two years ago and is also a result of other professional commitments
• Deputy Chairman, David Hearn, assumed the role of Chairman of the Company. The Board believes Mr Hearn is well positioned to lead the Company through its next phase of growth and brings a strong skill set in international executive management, sales and marketing and strategy development particularly in the food and beverage sectors. Mr Hearn has worked in senior executive roles, including at CEO level, for a number of large international fast moving consumer goods businesses and has significant experience in this industry. In addition to his role as Chairman, Mr Hearn will further assist the Company through a defined executive role involving guidance and support of the Group’s business, particularly in the United Kingdom and United States of America
• Director, Julia Hoare, assumed the role of Deputy Chairman of the Company. Ms Hoare, who is also Chair of the Audit & Risk Committee, and Chair of the Nomination Committee, is suitably experienced to support Mr Hearn in his role as Chairman. Having served as a senior finance professional at PwC, and more recently serving as Director on a number of public and private entities within New Zealand, Ms Hoare brings a wealth of experience in terms of financial management, strategy development and corporate governance
The Board will continue to consider appointing an additional independent non-executive Director with appropriate skills.
The length of service of each Director on the Board is disclosed on the ‘Director Profiles’ section on page 27.
Performance review of the Board and individual Directors
The Board recognises that the performance of the Directors and the Board Committees are pivotal to the Company’s success and to the interests of shareholders. Under the Board Charter, the Board is required, with the advice and assistance of the Nomination Committee, to undertake an annual assessment of the performance of the Board and individual Directors against the relevant charters, corporate governance policies, and agreed goals and objectives.
For the financial year ended 30 June 2015, a formal performance evaluation of the Board and individual
Directors6 was not undertaken. However, the Board informally evaluates performance regularly. The Company proposes to undertake a formal evaluation of the Board and individual Directors during 2016.
Performance review of senior executives
The Board, with the advice and assistance of the Nomination Committee, is responsible for annually reviewing the performance of the Chief Executive Officer and senior executives in accordance with the process established by the Nomination Committee. For the financial year ended 30 June 2015, a performance evaluation of the Chief Executive Officer and senior executives was undertaken in accordance with the process established by the Nomination Committee.
Indemnities and insurance
The Company has provided Directors Deeds of Indemnity for potential liabilities and costs they may incur for acts or omissions in their capacity as Directors. Directors’ and officers’ liability insurance is in place for Directors and employees acting on behalf of the Company.
Director share ownership
All Directors and employees are required to comply with the Company’s Insider Trading Policy in undertaking any trading in the Company’s shares. The number of shares held by each Director and their dealings in the Company’s securities during the financial year are disclosed on pages 45 and 46.
The board cont. The board cont.
6Excludes CEO who received a performance review in his capacity as CEO of the Group
34 35
The a2 Milk Company 2014–15 Governance & disclosures

The Board Committees are governed by Charters, which detail their specific functions and responsibilities. The Charter for each Committee is reviewed by the Board annually. A copy of the Committee Charters is available on the Company’s website at www.thea2milkcompany.com/ about-us/corporate-governance.
The Committees make recommendations to the Board. They have no decision making power except where expressly provided by the Board. The relevant qualifications and experience of individual Committee members are set out in the Director profiles section on page 27. The number of times each Committee met and the attendance of individual members at each Committee meeting is set out on page 37.
With the advice and assistance of the Nomination Committee, the Board reviews the performance of the Committees against their relevant Charter and agreed goals and objectives on an annual basis. For the financial year ended 30 June 2015, a performance evaluation of the Board Committees was not undertaken. The Company proposes to undertake Committee evaluations during 2016.
1. Audit and Risk Management Committee
This committee comprises three non-executive Directors, two of whom were considered independent as at 30 June 2015. The Committee is chaired by Julia Hoare (independent Director). The Chief Executive Officer and the Chief Financial Officer attend as ex-officio members; and the external auditors attend by invitation
of the Chairman. This Committee meets a minimum of four times each year. The Audit and Risk Management Committee Charter sets out the responsibilities of the Committee, including to:
• ensure the Company meets its financial reporting requirements, including the release of yearly and half-yearly financial statements;
• review the scope and outcome of the external audit;
• review the effectiveness of the Company’s internal controls regarding all matters of financial performance and reporting;
• advise the board on accounting policies, practices and disclosures;
Board committees
The Board has three standing committees to facilitate and assist the Board in fulfilling its responsibilities. Other committees are established from time to time to examine specific issues as required by the Board.
Committee Overview Overview
Audit and Risk Management Committee
Responsible for monitoring and advising the Board on the Company’s audit, risk management and regulatory compliance policies and procedures
Julia Hoare (Chairman)*Melvyn Miles**Richard Le Grice*
Nomination Committee Responsible for advising the Board on the composition of the Board and its committees, reviewing the performance of the Board, its committees, the individual Directors and senior executives, ensuring the proper succession plans are in place and advising the Board in respect of the effectiveness of its corporate governance policies and developments in corporate governance
Julia Hoare (Chairman)*David Hearn**Richard Le Grice*
Remuneration Committee Responsible for establishing the policies and practices of the Company regarding the remuneration of Directors and other senior executives and reviewing all components of the remuneration framework and associated performance
Richard Le Grice (Chairman)*Melvyn Miles**David Hearn**
*Independent Director as at 30 June 2015** Non-independent Director as at 30 June 2015
• ensure the Company has developed an adequate Risk Management Policy, and that controls are in place to facilitate adherence to this policy;
• keep the Board informed of all significant business risks; and
• review any incident which indicates a breakdown in the Company’s risk management framework
The current composition of the Audit and Risk Management Committee is Julia Hoare (Chair), Melvyn Miles and Richard Le Grice.
The Committee regularly reports to the Board about the Committee’s activities, issues and related recommendations.
2. Remuneration Committee
This committee comprises two non-executive Directors and one executive Director. The Committee is chaired by Richard Le Grice (independent Director).
The Committee meets as required to advise the Board on the matters outlined in the Remuneration Committee Charter, including to:
• review the remuneration packages of the Chief Executive Officer and Senior Managers; and
• make recommendations to shareholders in relation to non-executive Director remuneration packages
Remuneration packages are reviewed annually. Independent external surveys are used as a basis for establishing competitive packages. No Director is involved in Committee meetings at which his or her remuneration is being discussed. The current composition of the Remuneration Committee is Richard Le Grice (Chair), Melvyn Miles and David Hearn. The Company’s remuneration policies for Directors and senior executives are set out on pages 40 to 43.
Following each meeting, the Chairman of the Committee provides a report to the Board. The Chairman is also required to provide an annual report summarising the Committee’s activities, findings, and results for the past year.
3. Nomination Committee
This Committee comprises three Directors, a majority of whom are independent. The Committee is chaired by Julia Hoare (independent Director). The Committee meets as required to advise the Board on the matters outlined in the Nomination
Committee Charter, including to recommend new appointments to the Board. The current composition of the Nomination Committee is Julia Hoare (Chair), David Hearn and Richard Le Grice.
Every new Director appointment that is approved by the Board is considered and decided by the Board as a whole, taking into account the range of skills and experience a potential new Director may offer the Board and, his or her ability to fully commit the time needed to be effective as a Director of the Company.
Following each meeting, the Chairman of the Committee provides a report to the Board. The Chairman is also required to provide an annual report summarising the Committee’s activities, findings and results for the past year.
Record of attendance at Board and committee meetings
There were nine Board meetings during the reporting period to 30 June 2015. Director attendance at Board and Committee meetings is set out below.
Meetings of the Board
Audit & Risk Committee
Remuneration Committee
Nomination Committee Total
Mr Cliff Cook (Chairman, retired)1 ............................... 7 – – 1 8
Mr David Hearn (Chairman)2 ........................................ 8 – 2 1 11
Mr David Mair3 .............................................................. 6 – 1 1 8
Mr Perry Gunner4 .......................................................... 3 – 1 1 5
Ms Julia Hoare .............................................................. 9 4 – 2 15
Mr Geoffrey Babidge (CEO) .......................................... 9 – – – 9
Mr Melvyn Miles ........................................................... 9 4 3 – 16
Mr Richard Le Grice ...................................................... 9 4 2 1 16
1Cliff Cook retired as Chairman on 30/03/2015; 2David Hearn appointed to Chairman on 30/03/20153David Mair retired as Director on 30/03/2015; 4Perry Gunner retired as Director on 18/11/2014
The board cont. The board cont.
36 37
The a2 Milk Company 2014–15 Governance & disclosures
Board’s role in risk oversight
The Board’s role in risk oversight includes receiving reports from management and the Audit and Risk Management Committee on a regular basis regarding material risks faced by the Group and applicable mitigation strategies and activities. Those reports detail the effectiveness of the risk management programme and identify and address material business risks such as technological, strategic, business, operational, financial, human resources and legal/regulatory risks. The Board and its committees consider these reports, discuss matters with management and identify and evaluate any potential strategic or operational risks including appropriate activity to address those risks.
Internal financial control
The Board, advised by the Audit and Risk Management Committee, approves the Company’s system of internal financial control. This system includes clearly defined policies controlling treasury operations and capital expenditure authorisation.
The Chief Financial Officer is responsible to the Chief Executive Officer for ensuring that all operations within the Company adhere to the Board approved financial control policies.
The Board has established a framework for the relationship between the Company and the external auditor. This framework ensures that:
• Recommendations made by the external auditor and other independent advisers are critically evaluated and, where appropriate, applied; and
• The Company has defined policies and procedures in place as appropriate internal controls to manage risk effectively
Risk management
The Board ensures that adequate external insurance cover is in place appropriate to the Company’s size and risk profile.
The Company maintains a risk register that identifies the key risks facing the business, and the status of initiatives implemented to manage them.
This risk register is reviewed and updated on a regular basis.
Corporate governance policies
The Company has adopted the following policies, each of which has been prepared having regard to the ASX Principles and the NZX Code and which are available on the Company’s website at www.thea2milkcompany.com/ about-us/corporate-governance.
The Board regularly reviews the performance and effectiveness of the Company’s corporate governance policies and procedures and, if appropriate, amends those policies and procedures or adopts new policies or procedures, to uphold the integrity of the Company’s corporate governance framework.
Code of ethics
The Company expects its Directors, officers and employees to conduct themselves in accordance with the highest ethical standards of corporate and individual behaviour. The Company has developed a Code of Ethics designed to set out the practices which are necessary to maintain confidence in the Company’s integrity. Employees are required to comply with both the spirit and letter of the code.
A copy of the Code of Ethics is available on the Company’s website at www.thea2milkcompany.com/about-us/corporate-governance.
The Company requires all employees who become aware of an actual or suspected violation of the code to report to a nominated and independent reporting person. This process allows for confidential reporting of any potential violation without disadvantage to the employee. No instances of violation were reporting during the reporting period.
Continuous disclosure policy
The Company has adopted a set of procedures and guidelines to ensure that it complies with its disclosure obligations in accordance with all applicable legal and regulatory requirements, including the NZX Listing Rules and the ASX Listing Rules. This is to ensure the Company discloses to the ASX and the NZX any information concerning the Company which is not generally available and which a reasonable person would expect to have a material effect on the price or value of the Shares. A copy of the Continuous Disclosure Policy is available on the Company’s website at www.thea2milkcompany.com/about-us/corporate-governance.
Risk management policy
The Company considers ongoing risk management to be a core component of the management of the Company. The Company’s ability to identify and address risk is central to achieving its corporate objectives.
The Company’s risk management program comprises a series of processes, structures and guidelines which assist the Company to identify, assess, monitor and manage its
business risk, including any material changes to its risk profile. To achieve this, the Company has clearly defined the responsibility and authority of the Board to oversee and manage the risk management program, while conferring responsibility and authority on the Audit and Risk Management Committee to develop and maintain the risk management program in light of the day-to-day needs of the Company.
The Audit and Risk Management Committee is governed by the Audit and Risk Management Committee Charter, a copy of which is available on the Company’s website at www.thea2milkcompany.com/ about-us/corporate-governance.
The Audit and Risk Management Committee is responsible for reviewing whether the Company has any material exposure to any economic, environmental and social sustainability risks, and if so, to develop strategies to manage such risks, and present such strategies to the Board. For the reporting period to 30 June 2015, the Audit and Risk Management Committee is of the view that the Company does not have any material exposure to economic, environmental or social sustainability risks.
The Company, at least annually, evaluates the effectiveness of its risk management framework to ensure that its internal control systems and processes are monitored and updated on an ongoing basis. Under the Audit and Risk Management Committee Charter, the Audit and Risk Management Committee is responsible for providing an independent and objective assessment to the Board regarding the adequacy, effectiveness and
efficiency of the Company’s risk management and internal control process. A review of the Company’s risk management framework has been conducted in the reporting period by the Audit and Risk Management Committee. No significant changes to the framework or policy were identified.
Regular internal communication between the Company’s management and Board supplements the Company’s quality system, complaint handling processes, employee policies and standard operating procedures which are all designed to address various forms of risks.
In line with ASX Principle 4.2, the Audit and Risk Management Committee is required to receive from the CEO and CFO an annual declaration in relation to the Company’s financial statements, namely that in their opinion:
• the Company’s financial records have been properly maintained; and
• the Company’s financial statements and accompanying notes comply with generally accepted accounting practice in New Zealand and International Financial Reporting Standards; and
• the Company’s financial statements and accompanying notes give a true and fair view of the financial position and performance of the Group.
This declaration is provided to the Board with an assurance that the opinion has been formed on the basis of a sound system of risk management and internal control, and that system is operating
effectively with regard to the identification of material financial reporting risk.
Shareholder communication policy
The Company has adopted a Shareholder Communications Policy for Shareholders wishing to communicate with the Board, a copy of which is available on the Company’s website at www.thea2milkcompany.com/ about-us/corporate-governance. The Company seeks to recognise numerous modes of communication, including electronic communication, to ensure that its communication with Shareholders is timely, clear and accessible. The Company provides investors with comprehensive and timely access to information about itself and its governance on its website at www.thea2milkcompany.com. The website includes copies of past annual reports, results announcements, media releases (including NZX and ASX announce-ments) and general Company information. The Company website also has a comprehensive corporate governance section for shareholders at www.thea2milkcompany.com/about-us/corporate-governance.
All Shareholders are invited to attend the Company’s annual meeting, either in person or by representative. The Board regards the annual meeting as an excellent forum in which to discuss issues relevant to the Company and accordingly encourages full participation by Shareholders. Shareholders have an opportunity to submit questions to the Board and to the Company’s external auditor.
The board cont. The board cont.
38 39
The a2 Milk Company 2014–15 Governance & disclosures

Securities trading policy
The Company has adopted a Securities Trading Policy for Directors and employees wishing to participate in the shareholding of the Company. A copy of the policy is available on the Company’s website at www.thea2milkcompany.com/about-us/corporate-governance.
Under New Zealand and Australian legislation, the insider trading laws operate to prohibit people in possession of non–public price sensitive information from dealing in securities or passing on the information to other people who may deal in securities. The a2MC policy is designed to protect Directors, employees and their associates, as well as the Company’s shareholders against acts of insider trading that, either willingly or unknowingly, would disadvantage holders of the Company’s securities.
The Policy employs the use of blackout periods to restrict Directors, senior executives, employees and their associates from trading during times where sensitive, non-public information may be held. In addition, the Company must be notified in advance of any proposed dealing in the Company’s securities.
REMUNERATION
a2MC remuneration model
The Remuneration Committee is responsible for establishing the policies and practices of the Company regarding the remuneration of Directors and other senior executives of the Group and reviewing all components of the remuneration framework. A Remuneration Committee Charter has been developed that sets out the objectives, responsibilities
and authority of the Remuneration Committee in relation to remuneration matters. The Charter stipulates that the Committee will countenance advice and make recommendations to the Board, but all decision-making authority in relation to remuneration remains with the Board.
The Board’s policy for remunerating the Chief Executive Officer and other key executives is to provide market based remuneration packages comprising a blend of fixed and incentive based remuneration with clear links between individual and company performance, and reward. The Remuneration Committee reviews the remuneration packages of the Chief Executive Officer and other senior executives at least annually.
All employees have a fixed remuneration package. Selected senior executives and senior managers also have variable remuneration in the form of a short-term incentive (STI) as part of their remuneration package. In addition to this, selected senior executives have long-term incentives (LTI) as part of their remuneration package.
1. Fixed remuneration
The fixed remuneration model is informed and adjusted each year based on data from multiple independent remuneration specialists and sources. Employee’s fixed remuneration is based on a matrix of an individual’s skills and experience, their individual performance and their current level of remuneration relative to the market. Fixed remuneration is reviewed on an annual basis and, where appropriate, is adjusted based on consideration of
individual performance and market remuneration movement. The Board reviews and approves all movements in fixed remuneration.
2. Variable remuneration
All incentive programs that provide the potential to receive payment over and above fixed remuneration are based on a framework whereby such payments are discretionary, are appropriate to the results delivered by the Group, and are based on a principle of reward for performance.
There are two forms of variable remuneration used by a2MC.
2.1 Short Term Incentive plan (STI)
The STI model is focussed on clearly articulating performance goals that align with Company direction, driving outcomes, differentiating high performance and rewarding delivery over a 12-month period. Alignment with shareholder interests is maintained by the regular review of STI targets and objectives throughout the period. Individual progress towards objectives is tracked and discussed throughout the performance period as part of a2MC performance management process.
STI values are calculated as either a percentage of fixed remuneration or as a fixed dollar amount, based on the complexity of the role.
STI payments are determined and paid annually following the finalisation of audited company results and are contingent on achievement of business unit or Group financial targets and specific agreed personal objectives.
2.2 Long-Term Incentive plan (LTI)
The Company has adopted a Long Term Incentive Plan to assist in the reward, retention and motivation of certain employees and Directors of the Company and its subsidiaries (“Participants”).
The LTI model has been established to:
• assist in the reward and retention of selected senior executives;
• link the reward available to senior executives to shareholder value creation; and
• align the interests of senior executives and shareholders by providing executives with an equity interest in the Company
Participation in the LTI plan is by invitation only, at the sole and absolute discretion of The Board. The Company may grant options and/or performance rights (“Awards”) to eligible participants under the plan. Each Award granted represents a right to receive one fully paid share in the Company once the Award vests and is exercised by the relevant Participant. The number of Awards
and the vesting conditions for Awards issued under the LTI Plan are determined by and at the sole discretion of The Board.
Further details on the Long-Term Incentive Plan can be found at Note 14.3.
For each Director the number of Awards granted during the financial year ended 30 June 2015 and the applicable period over which performance is measured is set out below.
Managing executive performance
The Company has robust processes for supporting and evaluating the performance of its senior executives.
The Board and CEO determine and agree annual targets and objectives for the Company based on the Company’s strategic plan, supported by a comprehensive and collaborative forecasting and budgeting process. The CEO is accountable to the Board for the delivery of the agreed objectives.
The objectives agreed between the Board and the CEO are discussed and cascaded to each member of the Executive Team, and captured in individual performance delivery documents and STI agreements. The CEO uses the performance delivery documents to facilitate individual
conversations with each member of the Executive Team periodically throughout the performance period. The discussions provide a forum for regular feedback on progress and performance. They provide checkpoints for the CEO and Executive Team to determine whether there is a need to realign priorities in order to deliver on the agreed objectives, and identify what support may be needed to do so. The periodic performance discussions are documented and form the basis of the annual performance review that each individual undertakes with the CEO at the end of the performance period.
The outcome of the executive’s performance over the course of the year contributes to considerations
surrounding changes to fixed remuneration and the awarding of variable remuneration and incentives.
For the financial year ended 30 June 2015, each member of the Executive Team has had at least one periodic performance discussion with the CEO documented.
Grant date Options granted
Exercise price
Date exercisable6
Expiry Date Fair Value at Grant Date
David Hearn 30 Mar 2015 5,000,000 $0.6330 Mar 16 – 30 Mar 20 30 Jun 2020 $503,000
Total 5,000,000
6The options will vest in five equal tranches over five years commencing on the first anniversary of the date of grant
Remuneration
The board cont.
Remuneration
40 41
The a2 Milk Company 2014–15 Governance & disclosures

Directors’ fees
The Board approved revised annual remuneration arrangements for the Directors, which took effect from 31 March 2015 in line with the Company’s ASX Listing. The below table summarises the fees paid or payable to the Directors of the Company. The Remuneration Committee is responsible for reviewing Directors’ fees.
12-months ended 30 June 2015
$
Cliff Cook (Chairman, retired)7 ..................................................................... 97,500
David Hearn (Chairman)8.............................................................................. 57,346
David Mair9 ................................................................................................... 60,000
Perry Gunner10 .............................................................................................. 26,252
Julia Hoare ................................................................................................... 101,250
Melvyn Miles 11 ............................................................................................. 73,047
Richard Le Grice ........................................................................................... 73,750
489,145
Remuneration of the CEO
The Company has entered into an executive services agreement with Geoffrey Babidge in respect of his employment as CEO of the Company. Geoffrey receives an annual base salary of AUD 525,300 and has the opportunity to receive 30% of his annual remuneration in the form of a short term incentive, subject to the achievement of performance objectives determined by the Chairman of the Company and the Chairman of the Remuneration Committee of the Board. At 30 June 2015 Geoffrey held 11 million partly paid shares which were issued to him under the long term incentive scheme described in Note 14. Geoffrey’s employment commenced in 2010 and continues until 31 December 2015, after which his employment will automatically extend for successive 12 month terms unless the Company serves him with notice to terminate.
The actual remuneration paid to Geoffrey Babidge in the financial year was as follows:
Fixed Remuneration ..................................................................................... 525,300
Short-Term Incentive (related to the year ended 30 June 2014) ................ 51,000
Total remuneration received AUD 576,300
7Cliff Cook retired as Chairman on 30/03/20158 David Hearn appointed to Chairman on 30/03/2015. Director fees are in addition to, and separate from, consultancy fees paid to Lovat Partners Limited, an entity controlled by David Hearn, for services rendered during the year. Refer Note 22 Related Party Transactions for details of consultancy fees paid during the year, and page 41 Long Term Incentive plan (LTI) for options granted
9David Mair retired as Director on 30/03/201510Perry Gunner retired as Director on 18/11/201411 Director fees are in addition to, and separate from, consultancy fees paid to Melvyn Miles for services rendered during the
year. Refer Note 22 Related Party Transactions for details of consultancy fees paid during the year
Remuneration of the CEO cont.
In addition, the fair value of partly-paid shares granted to Geoffrey and the applicable vesting period is shown below:
Grant date Shares issued Exercise price
Vesting date Expiry date Fair value at grant date
NZD
Geoffrey Babidge 25 Aug 2010 6,000,000 $0.101 Sep 2011 –1 Sep 2015 25 Aug 2015 $233,542
Geoffrey Babidge 29 Oct 2013 5,000,000 $0.64 29 Oct 2018 1 Dec 2050 $1,235,000
Total 11,000,000
Under the terms of the Company’s Securities Trading Policy, Directors are prohibited from entering into transactions which operate to limit the economic risk of their securities in the Company (including under any equity-based remuneration scheme).
Employee remuneration range
The following table shows the number of employees and former employees of the Company and its subsidiaries (not being Directors or former Directors, except for the CEO) who, in their capacity as employees, received remuneration and other benefits valued at or in excess of $100,000 during the year to 30 June 2015.
The remuneration bands are expressed in New Zealand Dollars.
Remuneration range$ (Gross)
Number of employees in the year ended 30 June 2015
(Based on actual payments)
$110,000 – $119,999 ............................................ 2
$120,000 – $129,999 ............................................ 3
$140,000 – $149,999 ............................................ 3
$150,000 – $159,999 ............................................ 2
$160,000 – $169,999 ............................................ 2
$170,000 – $179,999 ............................................ 1
$200,000 – $209,999 ............................................ 1
$220,000 –$229,999 ............................................. 2
$230,000 – $239,999 ............................................ 2
$270,000 – $279,999 ............................................ 1
$330,000 – $339,999 ............................................ 1
$350,000 – $359,999 ............................................ 1
$390,000 – $399,999 ............................................ 1
$410,000 – $419,999 ............................................ 1
$420,000 – $429,999 ............................................ 1
$470,000 – $479,999 ............................................ 1
$620,000 – $629,999 ............................................ 1
Total 26
Remuneration Remuneration
42 43
The a2 Milk Company 2014–15 Governance & disclosures

DIVERSITY
The Company has a strong commitment to diversity and recognises the value of attracting and retaining employees with different backgrounds, gender, culture, knowledge, experiences and abilities. Diversity contributes to the Group’s business success and benefits individuals, clients, teams, shareholders and stakeholders. Our business policies, practices and behaviours promote diversity and equal opportunity and create an environment where individual differences are valued and all employees have the opportunity to realise their potential and contribute to the Group’s success.
The Company has adopted a Diversity Policy, which is available on the Company’s website at www.thea2milkcompany.com/about-us/corporate-governance
1. Board’s responsibility
The Board is responsible for designing and overseeing the implementation of this diversity policy. The Directors of the Company are responsible for promoting diversity within the Company’s culture and monitoring the effectiveness of this diversity policy. The Board is also responsible for developing initiatives that will promote and achieve diversity goals.
The Company recognises that it needs to provide management with appropriate guidance in order to foster a value for diversity within its management culture. To achieve this, the Company is committed to providing its management with the appropriate training and resources to understand the benefits of diversity in recruitment strategies and day-to-day management strategies.
The Board considers that overall the Company is making good progress in line with its diversity objectives and is performing well against the policy.
2. Setting objectives
Given that the Company’s Diversity Policy was only adopted recently, no measurable objectives were set for the reporting period ended 30 June 2015. The Board will set measureable objectives during 2016.
3. Gender representation across the Group
The following table shows gender representation across the Group as at 30 June 2015.
Male
As at 30 June 2015 As at 30 June 2014
Percentage male (%)
FemalePercentage female (%)
MalePercentage
male (%)Female
Percentage female (%)
Directors12 ..................... 4 80% 1 20% 7 87% 1 13%
Senior Executives13 ...... 8 89% 1 11% 7 87% 1 13%
Remaining Staff ........... 40 50% 40 50% 28 49% 29 51%
Total 52 55% 42 45% 42 58% 31 42%
These figures include permanent full-time, permanent part-time and fixed term employees, but not independent contractors.
12Includes executive Directors: David Hearn (Chairman) and Geoffrey Babidge (CEO)13Senior Executives are defined as those directly reporting to the CEO
DISCLOSURES
1. Substantial product holders
According to substantial product holder notices and the Company’s records, the following persons were substantial product holders in respect of the fully paid ordinary shares of the Company as at 30 June 2015 (such disclosure being required pursuant to Subpart 5 of Part 5 of the Financial Markets Conduct Act 2013) and as at 27 August 2015 (such disclosure being required pursuant to ASX Listing Rule 4.10.4):
As at 30 June 2015 As at 27 August 2015
Number of Ordinary Shares in the Company
in which a Relevant Interest is Held
% of ordinary shares held
Number of Ordinary Shares in the Company
in which a Relevant Interest is Held
% of ordinary shares held
Arrovest Pty Limited15 ................................. 126,397,884 19.15 126,397,884 19.15
Freedom Foods Group Limited ................... 117,699,229 17.83 117,699,229 17.83
Mountain Road Investments Limited ......... 57,558,701 8.72 57,558,701 8.72
Milford Asset Management Limited .......... 59,912,297 9.08 42,792,872 6.48
Perpetual Limited and subsidiaries ........... (Was not a substantial product holder) 49,502,632 7.50
First NZ Capital Group Limited .................. 33,324,572 5.05 33,324,572 5.05
The total number of voting shares on issue as at 30 June 2015 and as at 27 August 2015 was 660,066,979 consisting of 633,326,979 fully paid shares (27 August 2015: 639,326,979) and 26,740,000 partly paid shares (27 August 2015: 20,740,000).
2. Directors’ relevant interests & share dealings
Directors and a former Director reported the following acquisitions and disposals of relevant interests in financial products of the Company during the period 1 July 2014 to 30 June 2015:
Name of director/former director
Registered holder
Nature of relevant interest
Acquired/ (sold)No’s
Class of financial product
Date Consideration paid/
(received)
David MairPublic Trust Forte Nominees Limited Non beneficial 107,400
Fully paid ordinary shares 29 Jul 2014 $67,662
David MairPublic Trust Forte Nominees Limited Non beneficial 35,131
Fully paid ordinary shares 30 Jul 2014 $22,133
David MairPublic Trust Forte Nominees Limited Non beneficial 180,000
Fully paid ordinary shares 6 Aug 2014 $117,000
David MairPublic Trust Forte Nominees Limited Non beneficial 500,000
Fully paid ordinary shares 26 Aug 2014 $315,000
David MairPublic Trust Forte Nominees Limited Non beneficial 300,000
Fully paid ordinary shares 15 Sep 2014 $180,000
Richard Le Grice Richard Le Grice Beneficial (100,000)Fully paid ordinary
shares 15 Sep 2014 ($61,460)
David MairPublic Trust Forte Nominees Limited Non beneficial 300,000
Fully paid ordinary shares 25 Feb 2015 $159,000
David Hearn17
Lovat Partners Limited Beneficial 5,000,000 Unlisted options 30 Mar 2015 –
David MairPublic Trust Forte Nominees Limited Non beneficial 200,000
Fully paid ordinary shares 30 Apr 2015 $100,000
David MairPublic Trust Forte Nominees Limited Non beneficial 500,000
Fully paid ordinary shares 29 May 2015 $242,500
David MairPublic Trust Forte Nominees Limited Non beneficial (250,000)
Fully paid ordinary shares 24 Jun 2015 ($189,175)
15 According to Arrovest Pty Limited’s substantial product holder notice dated 9 June 2015, Arrovest Pty Limited is deemed to have a relevant interest in the ordinary shares of the Company as a result of holding 20% or more of the voting products in Freedom Foods Group Limited
17Shares were issued as part of the Long Term Incentive Plan (refer note 14.3)
Diversity Disclosures
44 45
The a2 Milk Company 2014–15 Governance & disclosures

2. Directors’ relevant interests & share dealings cont.
Directors held the following relevant interests in the financial products of the Company as at 30 June 2015:
Name of director Registered holder
Nature of relevant interest
Balance heldNo’s
Class of financial product
Date
Geoffrey Babidge GCAA Investments Pty Ltd Beneficial 11,000,000 Fully paid ordinary shares 30 June 2015
David Hearn Lovat Partners Limited Beneficial 5,000,000 Fully paid ordinary shares 30 June 2015
3. Twenty largest fully paid equity security holders
The names of the 20 largest holders of equity securities as at 27 August 2015 are listed below:
No’s %
Freedom Foods Group Limited ....................................................................... 117,699,229 17.83
Mountain Road Investments Limited ............................................................. 57,558,701 8.72
National Nominees New Zealand Limited ..................................................... 44,098,638 6.68
J P Morgan Chase Bank .................................................................................. 25,532,849 3.87
RBC Investor Services Australia Nominees Pty Limited .............................. 23,497,398 3.56
Tea Custodians Limited .................................................................................. 19,802,156 3.00
UBS Nominees Pty Ltd .................................................................................... 19,085,174 2.89
Accident Compensation Corporation............................................................. 18,898,312 2.86
Citibank Nominees (NZ) Limited .................................................................... 18,249,063 2.76
Cogent Nominees Limited .............................................................................. 12,731,722 1.93
BNP Paribas Nominees NZ Limited ............................................................... 12,131,530 1.84
Premier Nominees Limited ............................................................................. 11,000,221 1.67
HSBC Custody Nominees (Australia) Limited ............................................... 10,931,859 1.66
New Zealand Superannuation Fund Nominees Limited ............................... 9,747,844 1.48
J P Morgan Nominees Australia Limited ....................................................... 8,603,037 1.30
HSBC Nominees (New Zealand) Limited ........................................................ 8,092,428 1.23
Ulrike Mclachlan ............................................................................................. 7,035,163 1.07
National Nominees Limited ............................................................................ 7,025,740 1.06
Gregory Paul Hinton ........................................................................................ 7,000,000 1.06
Pershing Australia Nominees Pty Ltd ............................................................ 6,946,910 1.05
445,667,974 67.52
4. Spread of security holders as at 27 August 2015:
a) Fully paid ordinary shareholders
Size of ShareholdingNumber of
holders % Numbers
1–1,000 373 0.05 290,352
1,001–5,000 1,698 0.83 5,311,468
5,001–10,000 1,169 1.51 9,663,099
10,001–50,000 1,540 5.68 36,284,059
50,001–100,000 254 3.08 19,680,188
100,001–500,000 177 5.83 37,272,865
500,001–1,000,000 13 1.42 9,076,046
1,000,001 shares or more 32 81.6 521,748,902
5,256 100.00 639,326,97918
b) Partly paid ordinary shareholders
Size of ShareholdingNumber of
holders % Numbers
1,000,001 shares or more 6 100.00 20,740,000
6 100.00 20,740,000
As at 27 August 2015, the number of holders holding less than a marketable parcel19 of the Company’s fully paid ordinary shares, based on the closing market price, was 134.
5. Credit rating status
Not applicable.
6. Changes in directors
During the accounting period, the following changes took place:
• Perry Gunner resigned as Deputy Chairman and Director of the Company with effect from 18 November 2014
• Cliff Cook resigned as both Chairman and a Director of the Company with effect from 30 March 2015
• David Mair resigned as a Director of the Company with effect from 30 March 2015
• David Hearn was appointed Deputy Chairman on 18 November 2014, and as Chairman of the Company with effect from 30 March 2015
• Julia Hoare was appointed as Deputy Chairman of the Company with effect from 30 March 2015
7. NZX trading halt
On 10 March 2015, NZX halted trading in the Company’s ordinary shares for less than two hours pending an announcement in relation to its infant formula products.
On 1 September 2015, NZX halted trading in the Company’s ordinary shares for less than two hours pending an announcement in relation to an Expression of Interest received in respect of the acquisition of all the shares in the Company.
18 The total number of fully paid shares as at 27 August 2015 includes the conversion of 6,000,000 partly paid shares on 24 July 2015, details of which can be found in Note 25 Subsequent Events
19 For the purposes of this disclosure, a marketable parcel is defined as a parcel of shares with a market value of less than AUD 500
Disclosures cont. Disclosures cont.
46 47
The a2 Milk Company 2014–15 Governance & disclosures
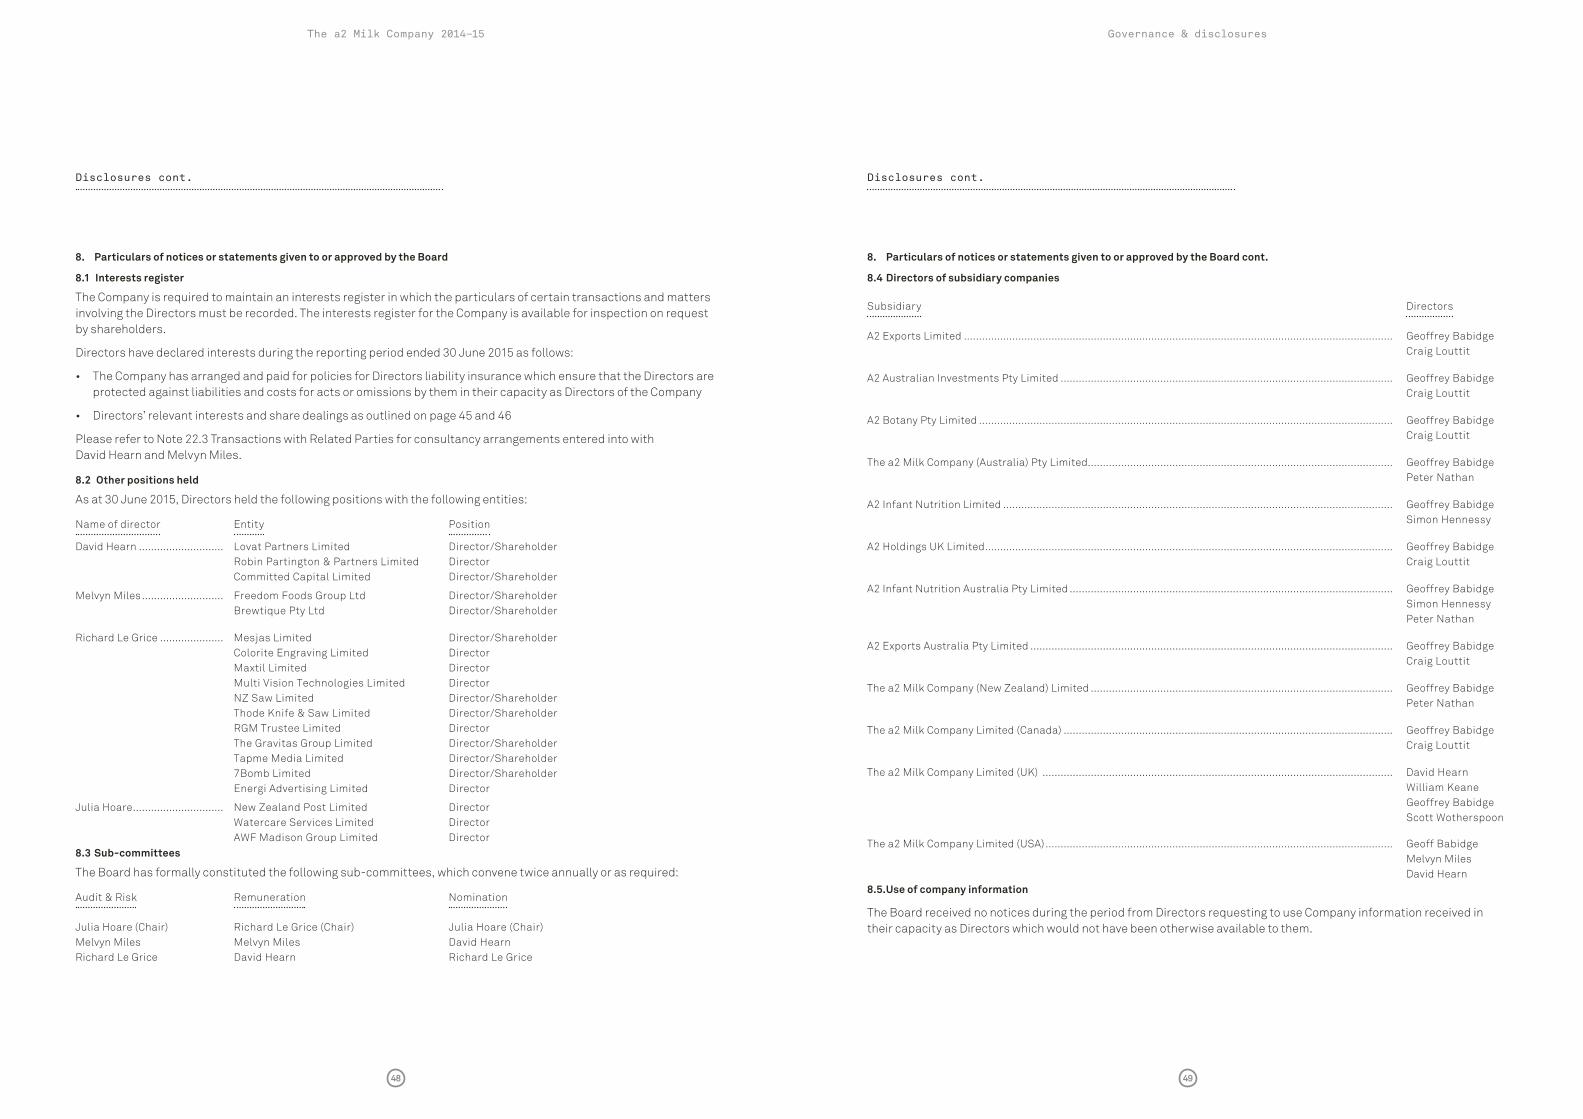
8. Particulars of notices or statements given to or approved by the Board
8.1 Interests register
The Company is required to maintain an interests register in which the particulars of certain transactions and matters involving the Directors must be recorded. The interests register for the Company is available for inspection on request by shareholders.
Directors have declared interests during the reporting period ended 30 June 2015 as follows:
• The Company has arranged and paid for policies for Directors liability insurance which ensure that the Directors are protected against liabilities and costs for acts or omissions by them in their capacity as Directors of the Company
• Directors’ relevant interests and share dealings as outlined on page 45 and 46
Please refer to Note 22.3 Transactions with Related Parties for consultancy arrangements entered into with David Hearn and Melvyn Miles.
8.2 Other positions held
As at 30 June 2015, Directors held the following positions with the following entities:
Name of director Entity Position
David Hearn ............................ Lovat Partners Limited Director/ShareholderRobin Partington & Partners Limited DirectorCommitted Capital Limited Director/Shareholder
Melvyn Miles ........................... Freedom Foods Group Ltd Director/ShareholderBrewtique Pty Ltd Director/Shareholder
Richard Le Grice ..................... Mesjas Limited Director/ShareholderColorite Engraving Limited DirectorMaxtil Limited DirectorMulti Vision Technologies Limited DirectorNZ Saw Limited Director/ShareholderThode Knife & Saw Limited Director/ShareholderRGM Trustee Limited DirectorThe Gravitas Group Limited Director/ShareholderTapme Media Limited Director/Shareholder7Bomb Limited Director/ShareholderEnergi Advertising Limited Director
Julia Hoare .............................. New Zealand Post Limited DirectorWatercare Services Limited DirectorAWF Madison Group Limited Director
8.3 Sub-committees
The Board has formally constituted the following sub-committees, which convene twice annually or as required:
Audit & Risk Remuneration Nomination
Julia Hoare (Chair) Richard Le Grice (Chair) Julia Hoare (Chair)Melvyn Miles Melvyn Miles David HearnRichard Le Grice David Hearn Richard Le Grice
8. Particulars of notices or statements given to or approved by the Board cont.
8.4 Directors of subsidiary companies
Subsidiary Directors
A2 Exports Limited .............................................................................................................................................. Geoffrey BabidgeCraig Louttit
A2 Australian Investments Pty Limited .............................................................................................................. Geoffrey BabidgeCraig Louttit
A2 Botany Pty Limited ......................................................................................................................................... Geoffrey BabidgeCraig Louttit
The a2 Milk Company (Australia) Pty Limited..................................................................................................... Geoffrey BabidgePeter Nathan
A2 Infant Nutrition Limited ................................................................................................................................. Geoffrey BabidgeSimon Hennessy
A2 Holdings UK Limited ....................................................................................................................................... Geoffrey BabidgeCraig Louttit
A2 Infant Nutrition Australia Pty Limited ........................................................................................................... Geoffrey BabidgeSimon HennessyPeter Nathan
A2 Exports Australia Pty Limited ........................................................................................................................ Geoffrey BabidgeCraig Louttit
The a2 Milk Company (New Zealand) Limited .................................................................................................... Geoffrey BabidgePeter Nathan
The a2 Milk Company Limited (Canada) ............................................................................................................. Geoffrey BabidgeCraig Louttit
The a2 Milk Company Limited (UK) .................................................................................................................... David HearnWilliam KeaneGeoffrey BabidgeScott Wotherspoon
The a2 Milk Company Limited (USA) ................................................................................................................... Geoff BabidgeMelvyn MilesDavid Hearn
8.5.Use of company information
The Board received no notices during the period from Directors requesting to use Company information received in their capacity as Directors which would not have been otherwise available to them.
Disclosures cont. Disclosures cont.
48 49
The a2 Milk Company 2014–15 Governance & disclosures

9. Limitations on the acquisition of securities
The Company is not subject to chapters 6, 6A, 6B and 6C of the Corporations Act 2001 (Cth) dealing with the acquisition of its shares (including substantial holdings and takeovers).
Limitations on the acquisition of the securities imposed by New Zealand law are as follows:
(i) In general, fully paid ordinary shares in the Company are freely transferable, and the only significant restrictions or limitations in relation to the acquisition of fully paid ordinary shares in the Company are those imposed by New Zealand laws relating to takeovers, overseas investment and competition.
(ii) The New Zealand Takeovers Code creates a general rule under which the acquisition of more than 20% of the voting rights in the Company, or the increase of an existing holding of 20% or more of the voting rights in the Company, can only occur in certain permitted ways. These include a full takeover offer in accordance with the New Zealand Takeovers Code, a partial takeover offer in accordance with the New Zealand Takeovers Code, an acquisition approved by an ordinary resolution, an allotment approved by an ordinary resolution, a creeping acquisition (in certain circumstances) or compulsory acquisition if a shareholder holds 90% or more shares in the Company.
(iii) The New Zealand Overseas Investment Act 2005 regulates certain investments in New Zealand by overseas persons. In general terms, the consent of the New Zealand Overseas Investment Office will likely be required where an ‘overseas person’ acquires shares or an interest in shares in the Company that amount to more than 25% of the shares issued by the Company or, if the overseas person already holds 25% or more, the acquisition increases that holding.
(iv) The New Zealand Commerce Act 1986 is likely to prevent a person from acquiring shares in the Company if the acquisition would have, or would be likely to have, the effect of substantially lessening competition in a market.
The Company has complied with, and continues to comply with, the requirements of the NZX Listing with respect to the issue of new securities.
10. Disclosure following admission to ASX
As previously noted, the Company achieved its ASX listing on 31 March 2015. Since this time and up to the period ending 30 June 2015, the Company has used its cash and assets that it had at the time of admission, for purposes consistent with its strategic objectives as set out in the Company’s Information Memorandum dated 24 February 2015.
11. Donations
The Company made donations of cash and inventories totalling NZD 196,462 during the year ended 30 June 2015 (2014: NZD 150,991), primarily related to donations of inventory to charitable organisations.
12. Reconciliation of EBITDA to profit after tax:
EBITDA is a non GAAP measure, however, the Company believes that it provides investors with a comprehensive understanding of the underlying performance of the business.
2015 $’000
2014 $’000
EBITDA before non-recurring items .................................................................................................. 4,810 3,566
Share of associate earnings ............................................................................................................... – (1,361)
Non-recurring items20 ......................................................................................................................... (1,681) –
Interest income ................................................................................................................................... 150 455
Interest expense ................................................................................................................................. (49) (40)
Depreciation/amortisation ................................................................................................................ (1,949) (1,900)
Income tax income/(expense) ............................................................................................................ (3,372) (710)
Net Profit After Tax (NPAT) ................................................................................................................. (2,091) 10
13. Summaries of the material terms of the following agreements
13.1 Lease of Smeaton Grange Premises and Option to Purchase the Site
The Smeaton Grange milk processing plant is leased by the a2 Milk Company (Australia) Pty Limited (“a2MC Australia) from RRT Investments Pty Limited, a company owned by the Perich Group, under a lease dated 1 February 2012. The lease was negotiated at arms’ length and provides for an annual adjustment to the rent payable by a2MC Australia and for a mark-to-market rent review process to be undertaken every five years. The lease is for a term of 10 years with an option for a2MC Australia to renew the lease for a further 10 years and an option for a2MC Australia to purchase the site on the expiry of the initiator extended lease term for fair market value.
20Non-recurring items in 2015 relate to costs associated with the ASX listing process during the period
Disclosures cont. Disclosures cont.
50 51
The a2 Milk Company 2014–15 Governance & disclosures

13. Summaries of the material terms of the following agreements cont.
13.2 Leppington Pastoral Milk Supply Agreement
a2MC Australia and Leppington Pastoral Company (Leppington) entered into a contract for the supply of A1 protein free milk commencing 1 July 2014. Leppington acknowledges that its appointment is not exclusive in any respect and that a2MC Australia is entitled to purchase milk from any third party at any time.
Term and renewal
The initial term of the agreement is for three years commencing on 1 July 2014, unless or until the agreement is terminated in accordance with its terms.
Quality assurance
Leppington agrees that it shall be responsible for the compliance with all laws, regulations, codes of practice, food standards and other requirements of any governmental or regulatory authority applicable to its operations and the agreement.
Volume
For each year, commencing 1 July 2014, Leppington agrees to maintain sufficient quantities of A1 protein free milk to supply to a2MC Australia’s specified minimum volume requirements. Separately, a2MC Australia undertakes to purchase a minimum volume of A1 protein free milk from Leppington each year until the termination of the agreement.
Price
Generally, the price per litre that a2MC Australia will pay Leppington for its supply of A1 protein free milk will increase each year.
Intellectual property
Unless otherwise agreed in writing by the Company or a2MC Australia, Leppington is not licensed to use, licence or sub-license any trademark or brand forming part of the Company’s intellectual property. Further, Leppington agrees that it, and any related parties, will not at any time during the term or after expiry or early termination of the agreement directly or indirectly challenge the validity or ownership of the Company’s intellectual property.
Termination
A party is entitled to terminate the agreement by written notice to the other party upon the occurrence of a breach of any obligation or duty owed under the agreement or if a party is or becomes unable to pay all of the party’s debts as and when they become due and payable. a2MC Australia may also terminate the agreement where there is a proposed or actual change of control of Leppington by giving 30 business days’ notice or immediately on written notice in the event that the license granted from the Company to a2MC Australia is terminated. Both parties may terminate the agreement at any time for any reason on 180 days’ written notice to the other party.
Indemnity
Leppington indemnifies a2MC Australia against any losses incurred by the Group arising from any negligent act or omission by Leppington, its employees, consultants or representatives or any breach, non-performance or negligent performance of Leppington’s obligations under the agreement.
Disclosures cont.
Financial statements
Contents
Directors’ approval of financial statements ............................................ 54
Auditor’s report ..................................................... 55
Consolidated statement of comprehensive income ........................................ 56
Consolidated statement of changes in equity .................................................. 57
Consolidated statement of financial position .................................................. 58
Consolidated statement of cash flows ............... 59
Notes to the financial statements ...................... 60
52 53
The a2 Milk Company 2014–15

Signed on behalf of the Board by:
Directors’ approval of the financial statements
For the year ended 30 June 2015
David HearnChairman16 September 2015
Geoffrey BabidgeManaging Director and Chief Executive Officer
The Directors of The a2 Milk Company Limited are pleased to present to shareholders the consolidated financial statements for The a2 Milk Company Limited (“Company” or “a2MC”) and its subsidiaries (together the “Group”) for the year ended 30 June 2015.
The Directors are responsible for presenting financial statements in accordance with New Zealand law and generally accepted accounting practice, which give a true and fair view of the financial position of the Group as at 30 June 2015 and the results of its operations and cash flows for the period ended on that date.
The Directors consider the financial statements of the Group to have been prepared using accounting policies which have been consistently applied and supported by reasonable judgements and estimates and that all relevant financial reporting and accounting standards have been followed.
The Directors believe that proper accounting records have been kept which enable, with reasonable accuracy, the determination of the financial position of the Group and facilitate compliance of the financial statements with the Financial Markets Conduct Act 2013.
The Directors consider that they have taken adequate steps to safeguard the assets of the Group, and to prevent and detect fraud and other irregularities. Internal control procedures are also considered to be sufficient to provide a reasonable assurance as to the integrity and reliability of the financial statements.
These financial statements are prepared on a going concern basis.
54 55
The a2 Milk Company 2014–15 Financial statements

Consolidated statement of comprehensive income
For the year ended 30 June 2015
Notes 2015 $’000
2014 $’000
Notes 2015 $’000
2014 $’000
Continuing operations
Sales 154,803 110,621Cost of sales (100,387) (70,802)
Gross margin 54,416 39,819
Interest income 150 455
Other revenue 3.1 306 224
Administrative expenses 3.2 (15,369) (11,753)
Finance costs 3.3 (130) (81)
Marketing expenses (10,253) (9,706)
Occupancy expenses (495) (456)
Other expenses 3.4 (27,344) (16,421)
Profit before tax and share of loss from an associate 1,281 2,081
Share of net loss of an associate accounted for using the equity method 21.3 – (1,361)
Profit before tax 1,281 720
Income tax expense 4.1 (3,372) (710)
(LOSS)/PROFIT AFTER TAX FOR THE YEAR (2,091) 10
OTHER COMPREHENSIVE INCOME/(LOSS)
Items that may be reclassified to profit or loss:
Foreign currency translation gain/(loss) 4.2 & 17 954 (4,497)
TOTAL COMPREHENSIVE LOSS (1,137) (4,487)
Earnings/(Loss) per share
Basic (cents per share) 13.1 (0.33) –
Diluted (cents per share) 13.2 (0.32) –
Equity at beginning of year 58,644 59,930Total comprehensive loss for the year (1,137) (4,487)
57,507 55,443
TRANSACTIONS WITH OWNERS
Issue of ordinary shares ............................................................................................................... 12 39 2,011
Employee equity settled payments reserve 15 1,083 1,190
Equity at end of year ........................................................................................................................... 58,629 58,644
EQUITY COMPRISES:
Share capital
Balance at beginning of year .............................................................................................................. 86,264 84,253
Issue of ordinary shares ..................................................................................................................... 39 2,011
Balance at end of year .................................................................................................................. 12 86,303 86,264
Retained earnings/(deficit)
Balance at beginning of year .............................................................................................................. (23,974) (23,984)
Net surplus/(deficit) for the period including associate/joint venture surplus/(losses) .......................................................................................... (2,091) 10
Balance at end of year .................................................................................................................. 16 (26,065) (23,974)
Foreign currency translation reserve
Balance at beginning of year .............................................................................................................. (6,665) (2,168)
Movements during the period ............................................................................................................ 954 (4,497)
Balance at end of year .................................................................................................................. 17 (5,711) (6,665)
Employee equity settled payments reserve
Balance at beginning of year .............................................................................................................. 3,019 1,829
Movements during the period ............................................................................................................ 1,083 1,190
Balance at end of year .................................................................................................................. 15 4,102 3,019
EQUITY AT END OF YEAR 58,629 58,644
Consolidated statement of changes in equity
For the year ended 30 June 2015
The accompanying notes form part of these financial statements. The accompanying notes form part of these financial statements.
56 57
The a2 Milk Company 2014–15 Financial statements

Consolidated statement of cash flows
For the year ended 30 June 2015
Consolidated statement of financial position
For the year ended 30 June 2015
Notes 2015 $’000
2014 $’000
Notes 2015 $’000
2014 $’000
ASSETS
Current assets
Cash & short term deposits ............................................................................................................ 5 6,092 15,979
Trade and other receivables ............................................................................................................ 6 39,944 27,358
Prepayments ....................................................................................................................................... 9,651 1,992
Inventories ........................................................................................................................................ 7 4,846 5,583
Current tax assets .............................................................................................................................. – 225
Total current assets 60,533 51,137
Non-current assets
Property, plant & equipment .......................................................................................................... 8 9,301 9,163
Goodwill .......................................................................................................................................... 10 10,993 10,587
Other intangible assets ................................................................................................................. 11 6,230 4,194
Deferred tax asset ........................................................................................................................ 4.4 1,810 1,562
Total non-current assets 28,334 25,506
TOTAL ASSETS 88,867 76,643
LIABILITIES
Current liabilities
Accounts payable .......................................................................................................................... 9.1 28,357 17,875
Current tax liabilities .......................................................................................................................... 595 –
Total current liabilities 28,952 17,875
Non-current liabilities
Accounts payable .......................................................................................................................... 9.2 189 124
Deferred tax liability ..................................................................................................................... 4.4 1,097 –
Total non-current liabilities 1,286 124
TOTAL LIABILITIES 30,238 17,999
EQUITY
Equity attributable to equity holders of the parent
Share capital ................................................................................................................................... 12 86,303 86,264
Retained earnings/(deficit) ............................................................................................................ 16 (26,065) (23,974)
Foreign currency translation reserve ............................................................................................ 17 (5,711) (6,665)
Employee equity settled payments reserve ................................................................................. 15 4,102 3,019
Total equity 58,629 58,644
TOTAL LIABILITIES & EQUITY 88,867 76,643
CASH FLOWS FROM OPERATING ACTIVITIES
Receipts from customers ................................................................................................................... 144,708 107,446
Interest received ................................................................................................................................. 150 403
Other income ....................................................................................................................................... 306 224
Tax refunds .......................................................................................................................................... – 756
Payments to suppliers & employees ................................................................................................. (150,633) (106,699)
Interest paid ........................................................................................................................................ (49) (40)
Taxes paid ............................................................................................................................................ (2,548) (1,655)
Net cash (outflow)/inflow from operating activities 27 (8,066) 435
CASH FLOWS FROM INVESTING ACTIVITIES
Payment for property, plant & equipment .................................................................................... 8 (995) (871)
Investment in other intangible assets ......................................................................................... 11 (2,632) (2,042)
Investment in The a2 Milk Company Limited (UK) ................................................................... 21.2 – (4,574)
Net cash outflow from investing activities (3,627) (7,487)
CASH FLOWS FROM FINANCING ACTIVITIES
Proceeds from issue of equity shares ............................................................................................... 39 2,011
Net cash inflow from financing activities 39 2,011
Net increase/(decrease) in cash & short term deposits .................................................................. (11,654) (5,041)
Cash & short term deposits at the beginning of the year ................................................................ 15,979 20,187
Effect of exchange rate changes on cash ......................................................................................... 1,767 (605)
Cash acquired with The a2 Milk Company Limited (UK) ................................................................... – 1,438
Cash and short term deposits at the end of the year 6,092 15,979
COMPRISED OF:
Cash & short term deposits ............................................................................................................ 5 6,092 15,979
The accompanying notes form part of these financial statements. The accompanying notes form part of these financial statements.
58 59
The a2 Milk Company 2014–15 Financial statements

Contents
Notesto the financial
statements
1. Corporate information ..................................... 61
2. Summary of significant accounting policies .. 61
3. Revenue & expenses ........................................ 74
4. Income taxes ..................................................... 75
5. Cash & cash equivalents ................................. 78
6. Trade & other receivables ................................ 78
7. Inventories ......................................................... 79
8. Property, plant & equipment .......................... 80
9. Accounts payable ............................................. 81
10. Goodwill ............................................................. 81
11. Other intangible assets ................................... 83
12. Share capital ..................................................... 84
13. Earnings per share (EPS) ................................. 85
14. Equity settled share-based payments .......... 86
15. Employee equity settled payments reserve .. 92
16. Retained earnings ............................................ 93
17. Foreign currency translation reserve............. 93
18. Operating & finance lease commitments ...... 93
19. Investment in subsidiaries .............................. 94
20. Acquisition of subsidiaries ............................. 96
21. Investments in associates/joint ventures ..... 96
22. Related party transactions ............................. 97
23. Commitments for expenditure ........................ 99
24. Contingent liability ........................................... 99
25. Subsequent events .......................................... 99
26. Operating segment information ..................... 99
27. Notes to the cash flow statement ................ 102
28. Financial instruments .................................... 103
1. CORPORATE INFORMATIONThe a2 Milk Company Limited is a profit-oriented entity incorporated and domiciled in New Zealand. The registered office is located at c/o Simpson Grierson, Level 27, 88 Shortland Street, Auckland, New Zealand.
The principal activity of the Company is the commercialisation of a2MC branded milk and related products as supported by the ownership of intellectual property that enables the identification of cattle for the production of A1 protein free milk products. The Company sources and supplies a2MC branded milk in Australia through its 100% owned subsidiary The a2 Milk Company (Australia) Pty Limited, in the UK through its 100% owned subsidiary The a2 Milk Company Limited (UK), and in the USA through its 100% owned subsidiary The a2 Milk Company Limited (USA). The Company supplies a2MC branded infant nutrition through its 100% owned subsidiaries A2 Infant Nutrition Limited and A2 Infant Nutrition Australia Pty Limited.
The a2 Milk Company Limited is registered in New Zealand under the Companies Act 1993. The Company is a FMC reporting entity for the purposes of Part 7 of the Financial Markets Conduct Act 2013 and its financial statements comply with that Act and the Companies Act 1993. The shares of The a2 Milk Company Limited are publicly traded on the New Zealand Stock Exchange (NZX), and the Australian Securities Exchange (ASX).
The Company is not subject to chapters 6, 6A, 6B and 6C of the Corporations Act 2001 (Cth) dealing with the acquisition of its shares (including substantial holdings and takeovers).
2. SUMMARY OF SIGNIFICANT ACCOUNTING POLICIES
2.1 Basis of preparation
The financial statements have been prepared on the basis of historical cost. Cost is based on the fair values of the consideration given in exchange for assets.
Accounting policies are selected and applied in a manner which ensures that the resulting financial information satisfies the concepts of relevance and reliability, thereby ensuring that the substance of the underlying transactions or other events is reported.
The financial statements are presented in New Zealand dollars and all values are rounded to the nearest thousand ($000), except where otherwise indicated.
2.2 Statement of compliance
The financial statements have been prepared in accordance with Generally Accepted Accounting Practice in New Zealand (“NZ GAAP”). They comply with the New Zealand Equivalents to International Financial Reporting Standards (“NZ IFRS”) and other applicable financial reporting standards as appropriate for profit-oriented entities.
The financial statements comply with International Financial Reporting Standards (‘IFRS’).
2. Summary of significant accounting policies
1. Corporate information and
60 61
The a2 Milk Company 2014–15 Notes to the financial statements

2.3 Changes in accounting policies and disclosures
(i) Standards and interpretations in issue and adopted during the year
Reference Summary Application to the group
NZ IFRS 2: Share Based Payments
Amends the definitions of ’vesting condition’ and ’market condition’ and adds definitions for ’performance condition’ and ’service condition’ (previously part of the definition of ’vesting condition’)
The basis of accounting for the Group has not changed as a result of the adoption of this Standard
NZ IFRS 8: Operating Segments
There are two key amendments to this standard:
(i) an entity is required to disclose the judgements made by management in applying the aggregation criteria to operating segments; and
(ii) clarification has been given with regard to the reporting of segment assets and liabilities, whereby reporting on these amounts is only applicable if they are regularly provided to the chief operating decision maker
For the period ending 30 June 2015, the Group has applied the aggregation allowances for the combination of the USA and UK operating segments into a single reporting segment. As a result, the judgements applied in determining this application have been disclosed as part of the Note 26 Operating Segment Information
Amendments to NZ IAS 32 Financial Instruments: Presentation – Offsetting Financial Assets and Financial Liabilities
The amendments to NZ IAS 32 clarify the meaning of “currently has a legally enforceable right to set-off” financial assets and financial liabilities. The definition of “legally enforceable right” now must not be contingent on a future event, and must be legally enforceable in the normal course of business, in the event of default and in the event of insolvency or bankruptcy of the entity and all counterparties
The basis of accounting for the Group has not changed as a result of the adoption of this Standard
Amendments to NZ IAS 36 Recoverable Amount Disclosures for Non-Financial Assets
The amendments to NZ IAS 36 remove the requirement introduced by NZ IFRS 13 to disclose the recoverable amount for each cash-generating unit for which the carrying amount of goodwill or intangible assets with indefinite useful lives allocated to that unit was significant in comparison with the entity’s total carrying amount of goodwill or intangible assets with indefinite useful lives
Additionally, the amendments require disclosure of:
(i) additional information about the fair value measurement of impaired assets when the recoverable amount is based on fair value less costs of disposal
(ii) information about the discount rates that have been used when the recoverable amount is based on fair value less costs of disposal using a present value technique. The amendments harmonises disclosure requirements between value in use and fair value less costs of disposal
The basis of accounting for the Group has not changed as a result of the adoption of this Standard
2. Summary of significant accounting policies cont. 2. Summary of significant accounting policies cont.
2.3 Changes in accounting policies and disclosures cont.
(ii) Standards and interpretations in issue not yet adopted
The following new standards and amendments to existing standards are not a comprehensive list of standards and amendments but are only those that are likely to affect the Group.
Reference Summary Application to the group Date of application
NZ IFRS 15: Revenue from Contracts with Customers
NZ IFRS 15 supersedes a number of existing revenue standards, including the current guiding revenue standard for the Group, being NZ IAS 18 Revenue. The new standard establishes principles for revenue recognition that focus on the achievement of performance obligations, such that revenue is recognised in line with the pattern of transfer of control
The Group is yet to assess the full impact of this standard, however the following observations are noted:
(i) The standard is unlikely to materially change the way the Group recognises revenue for the milk and milk-based products it sells;
(ii) Consideration will need to be given to the way revenue is booked in relation to licence fees, royalties, or other revenues generated from the use of the Group’s Intellectual Property (IP); and
(iii) It is likely that additional disclosures will be required including the disaggregation of total revenue; information about performance obligations; movements in contract receivables and payables; and key judgements and estimates employed
1 July 2017 for application in the financial year ended 30 June 2018 (unless adopted sooner)
62 63
The a2 Milk Company 2014–15 Notes to the financial statements

2. Summary of significant accounting policies cont. 2. Summary of significant accounting policies cont.
2.3 Changes in accounting policies and disclosures cont.
(ii) Standards and Interpretations in Issue not yet adopted
The following new standards and amendments to existing standards are not a comprehensive list of standards and amendments but are only those that are likely to affect the Group.
Reference Summary Application to the group Date of application
NZ IFRS 9 (2014): Financial Instruments
This version of the standard will replace NZ IAS 39 Financial Instruments: Recognition and Measurement and all previous versions of NZ IFRS 9
The amendments to the previous standard are comprehensive, however the key changes relevant (or potentially relevant) to the Group are as follows:
(i) The number of categories of financial assets has been reduced from four to two. The two revised categories are (a) assets held at fair value; and (b) assets held at amortised cost;
(ii) There is an option for investments in equity instruments which are not held for trading and where fair value changes are booked to Other Comprehensive Income (OCI), to avoid impairment testing; and also the recycling of gains/losses through profit or loss on derecognition;
(iii) Where the fair value option has been used for financial liabilities, the change in fair value related to credit risk are presented in OCI, with the remaining change presented in profit or loss, unless this creates an accounting mismatch; and
(iv) New hedge accounting requirements relating to effectiveness testing, treatment of hedging costs, risk components and disclosures
NZ IFRS 9 was issued on 4 September 2014 by the New Zealand Accounting Standards Board. The Group is yet to assess the full impact of this standard. However, a full and thorough assessment will be performed in due course
1 July 2018 for application in the financial year ended 30 June 2019 (unless adopted sooner)
2.4 Critical accounting judgements
In the application of the Group’s accounting policies the Directors are required to make judgements, estimates and assumptions about carrying values of assets and liabilities that are not readily apparent from other sources. The estimates and associated assumptions are based on historical experience and various other factors that are believed to be reasonable under the circumstances, the results of which form the basis of the judgements. Actual results may differ from these estimates.
The estimates and underlying assumptions are reviewed on an ongoing basis. Revisions to accounting estimates are recognised in the period in which the estimate is revised if the revision affects only that period or in the period of the revision and future periods if the revision affects both current and future periods.
2.5 Key sources of estimation uncertainty
Judgements made by Directors in the application of the Group’s accounting policies that have significant effects on the financial statements; and estimates with a significant risk of material adjustments in the next year are disclosed, where applicable, in the relevant Notes to the Financial Statements.
Key sources of estimation uncertainty include:
• Assessment of impairment of goodwill (refer Note 2.12 and Note 10)
• Assessment of impairment of intangible assets (refer Note 2.12 and Note 11)
• Capitalisation of intangible assets (refer Note 2.11)
• Estimation of fair value of share based payments (refer Notes 14.2 & 14.4)
• Assessment of recognition of deferred tax on temporary differences and tax losses (refer Note 4)
Estimates and judgements are continually evaluated and are based on historical experience and other factors, including expectations of future events that are believed to be measurable under the circumstances.
2.6 Basis of consolidation
The consolidated financial statements incorporate the financial statements of the Company and entities controlled by the Company (its subsidiaries). Control is achieved when the Company:
• has power over the investee;
• is exposed, or has rights, to variable returns from its involvement with the investee; and
• has the ability to use its power to affect its returns
The Company reassesses whether or not it controls an investee if facts and circumstances indicate that there are changes to one or more of the three elements of control listed above.
The results of subsidiaries acquired or disposed of during the period are included in the consolidated statement of comprehensive income from the effective date of acquisition or up to the effective date of disposal, as appropriate.
Where necessary, adjustments are made to the financial statements of subsidiaries to bring their accounting policies in line with those used by other members of the Group.
All intra-group transactions, balances, income and expenses are eliminated in full on consolidation. The exception to this is any foreign exchange gain or loss relating to intra-group transactions that represents a real exposure to foreign currency for the Group.
Investments in subsidiaries are recorded at cost less any impairment in the parent Company’s financial statements.
2.7 Business combinations
Business combinations are accounted for using the acquisition method. The consideration transferred in a business combination shall be measured at fair value, which shall be calculated as the sum of the acquisition date fair values of the assets transferred by the Group, the liabilities incurred by the Group to former owners of the acquiree and the equity issued by the Group, and the amount of any non-controlling interest in the acquiree. For each business combination, the Group measures the non-controlling interest in the acquiree either at fair value or at the proportionate share of the acquiree’s identifiable net assets. Acquisition-related costs are expensed as incurred.
64 65
The a2 Milk Company 2014–15 Notes to the financial statements

When the Group acquires a business, it assesses the assets and liabilities assumed for appropriate classification and designation in accordance with the contractual terms, economic conditions, the Group’s operating or accounting policies and other pertinent conditions as at the acquisition date. If the business combination is achieved in stages, the acquisition date fair value of the Group’s previously held equity interest in the acquiree is remeasured at fair value as at the acquisition date through profit or loss.
Any contingent consideration to be transferred by the Group will be recognised at fair value at the acquisition date. Subsequent changes to the fair value of the contingent consideration which is deemed to be an asset or liability will be recognised in accordance with NZ IAS 39 either in profit or loss or in other comprehensive income. If the contingent consideration is classified as equity, it shall not be re-measured.
2.8 Investments in associates & joint ventures
An associate is an entity over which the Group has significant influence and that is neither a subsidiary nor an interest in a joint venture. Significant influence is the power to participate in the financial and operating policy decisions of the investee but is not control or joint control over these policies.
The results and assets and liabilities of associates are incorporated in these financial statements using the equity method of accounting. Under the equity method, investments in associates are carried in the consolidated balance sheet at cost as adjusted for post-acquisition changes in the Group’s share of the net assets of the associate, less any impairment in the value of individual investments. Gains or losses on the investment are recognised in other comprehensive income.
A joint venture is a joint arrangement whereby the parties that have joint control of the arrangement have rights to the net assets of the joint arrangement. Joint control is the contractually agreed sharing of control of an arrangement, which exists only when decisions about the relevant activities require unanimous consent of the parties sharing control.
Where a Group entity transacts with an associate of the Group, profits and losses are eliminated to the extent of the Group’s interest in the relevant associate. Investments in associates are recorded at cost less any impairment in the parent Company’s financial statements.
The interest in a joint venture entity is accounted for in the consolidated financial statements using the equity method of accounting. Under the equity method, the Group’s share of the results of the joint venture entity is recognised in the statement of comprehensive income, and the investment is presented as a non-current asset on the face of the statement of financial position.
At each reporting date, the Group reviews investments in associates or joint ventures for impairment.
2.9 Property, plant & equipment
All items of property, plant and equipment are stated at cost less accumulated depreciation, and impairment. Cost includes expenditure that is directly attributable to the acquisition of the item.
Depreciation is calculated on a straight line basis so as to write off the net cost of the asset over its expected useful life to its estimated residual value. The estimated useful lives, residual values and depreciation method are reviewed at each year end, with the effect of any changes in estimate accounted for on a prospective basis. The following estimated useful lives are used in the calculation of depreciation:
Plant and equipment 10–15 years
Furniture and fittings 5–10 years
Office and computer equipment 3–10 years
Lease improvements 6–10 years
The carrying value of an item of property, plant and equipment is derecognised either upon disposal or when no future economic benefits are expected from the asset. Any gain or loss arising from the de-recognition (representing the difference between the net disposal proceeds and the carrying amount of the asset) is included in profit or loss when the asset is derecognised.
2. Summary of significant accounting policies cont. 2. Summary of significant accounting policies cont.
2.10 Goodwill
Goodwill arising on the acquisition of a subsidiary or a jointly controlled entity represents the excess of the cost of acquisition over the Group’s interest in the net fair value of the identifiable assets, liabilities and contingent liabilities of the subsidiary or jointly controlled entity recognised at the date of acquisition.
Goodwill is initially recognised as an asset at cost and is subsequently measured at cost less any accumulated impairment losses. For the purposes of impairment testing, goodwill acquired in a business combination is, from the date of acquisition, allocated to the Group’s cash-generating units that are expected to benefit from the synergies of the combination. For the Group, this allocation is performed at the level of operating segments.
Where goodwill has been allocated to a cash-generating unit and part of the operation within that unit is disposed of, the goodwill associated with the disposed operation is included in the carrying amount of the operation for the purposes of calculating the gain or loss on disposal.
2.11 Intangible assets
Intellectual property
The cost of intellectual property including patents, trademarks and licenses are capitalised where there is sufficient evidence to support the probability of the expenditure generating sufficient future economic benefits for the Group.
Patents are considered to have a finite life and amortisation is charged on a straight line basis over the lifetime of the patent. Software is amortised on a straight line basis over 3 years. All other intellectual property, where there is a probability of generating sufficient future economic benefits, is considered to have an infinite life. These assets are tested for impairment annually and whenever there is an indication that the intangible asset may be impaired.
Project development costs
An intangible asset arising from project development expenditure on an internal project is recognised only when the Group can demonstrate:
• the technical feasibility of completing the intangible asset so that it will be available for use or sale;
• its intention to complete and its ability to use or sell the asset;
• how the asset will generate future economic benefits;
• the availability of resources to complete the development; and
• the ability to measure reliably the expenditure attributable to the intangible asset during its development
Following the initial recognition of the project development expenditure, the cost model is applied requiring the asset to be carried at cost less any accumulated amortisation and accumulated impairment losses. Any expenditure so capitalised is amortised over the period of expected benefit from the related project.
The carrying value of an intangible asset arising from project development expenditure is tested for impairment annually when the asset is not yet available for use, or more frequently when an indication of impairment arises during the reporting period.
2.12 Impairment of tangible and intangible assets including goodwill
Further disclosures relating to the impairment of non-financial assets can be found in the following notes:
• Property, Plant & Equipment Note 8
• Goodwill Note 10
• Intangible Assets Note 11
At each balance sheet date, the Group considers whether there is any indication that its assets may be impaired. If any such indication exists, the recoverable amount of the asset is estimated in order to determine the extent of the impairment loss (if any).
Where it is not possible to estimate the recoverable amount of an individual asset, the Group estimates the recoverable amount of the cash-generating unit (CGU) to which the asset belongs. Where a reasonable and consistent basis of allocation can be identified, corporate assets are also allocated to individual CGU’s, or otherwise they are allocated to the smallest group of CGU’s for which a reasonable and consistent allocation basis can be identified.
66 67
The a2 Milk Company 2014–15 Notes to the financial statements

The recoverable amount is the higher of fair value less costs to sell and value in use. In assessing value in use, the estimated future cash flows are discounted to their present value using a pre-tax discount rate that reflects current market assessments of the time value of money and the risks specific to the asset for which the estimates of future cash flows have not been adjusted.
If the recoverable amount of an asset (CGU) is estimated to be less than its carrying amount, the carrying amount of the asset (CGU) is reduced to its recoverable amount. An impairment loss is recognised in profit or loss immediately, unless the asset is carried at fair value, in which case the impairment loss is treated as a revaluation decrease.
Where an impairment loss subsequently reverses, the carrying amount of the asset (CGU) is increased to the revised estimate of its recoverable amount, but only to the extent that the increased carrying amount does not exceed the carrying amount that would have been determined had no impairment loss been recognised for the asset (CGU) in prior years. A reversal of an impairment loss is recognised as income immediately unless the asset is carried at fair value, in which case the reversal of the impairment loss is treated as a revaluation increase.
Non-financial assets requiring additional focus:
Goodwill
Goodwill is tested for impairment annually (whether or not there is an indication that the asset it impaired), and more frequently when indicators suggest that the carrying value may be impaired.
Impairment for goodwill is assessed by determining the recoverable amount of each CGU to which the goodwill relates (has been assigned). When the recoverable amount of the CGU is less than the carrying value of the goodwill, an impairment loss is recognised. Impairment losses in relation to goodwill are not reversed in a subsequent period.
Intangible assets
Intangible assets with indefinite useful lives, and intangible assets not yet available for use are tested for impairment annually (whether or not there is an indication that the asset is impaired), and more frequently when indicators suggest that the carrying value may be impaired.
2.13 Share-based payment transactions
The Group has a range of ownership-based compensation schemes for executives and senior employees of the Group, whereby equity instruments are provided as consideration for services rendered. The Group uses independent experts for the valuation of its share-based payment schemes.
Equity-settled transactions
This is applicable to the following:
• Partly paid shares provided under the Company’s Partly Paid Share scheme;
• Share options provided under the Company’s Long-Term Incentive Plan (LTIP)
The cost of these equity-settled transactions with employees is measured by reference to the fair value of the equity instruments at the date at which they are granted. The fair value is determined using a Black-Scholes option pricing and Binomial option pricing model, further details of which are given in Notes 14.2 and 14.4.
In valuing equity-settled transactions, no account is taken of any vesting conditions, other than conditions linked to the price of the shares of The a2 Milk Company Limited if applicable.
The cost of equity-settled transactions is recognised, together with a corresponding increase in equity, over the period in which the service conditions are fulfilled (the vesting period), ending on the date on which the relevant employees become fully entitled to the award (the vesting date).
At each reporting date until vesting, the cumulative charge to the statement of comprehensive income is the product of:
• The grant date fair value of the award;
• The current best estimate of the number of awards that will vest, taking into account such factors as the likelihood of employee turnover during the vesting period and the likelihood of non-market performance conditions being met; and
• The expired portion of the vesting period
2. Summary of significant accounting policies cont. 2. Summary of significant accounting policies cont.
The charge to the income statement for the period is the cumulative amount as calculated above less the amounts already charged in previous periods. There is a corresponding entry to equity.
Until an award has vested, any amounts recorded are contingent and will be adjusted if more or fewer awards vest than were originally anticipated to do so. Any award subject to a market condition is considered to vest irrespective of whether or not that market condition is fulfilled, provided that all other conditions are satisfied.
If the terms of an equity-settled transaction are modified, as a minimum, an expense is recognised as if the terms had not been modified. An additional expense is recognised for any modification that increases the total fair value of the share- based payment arrangement, or is otherwise beneficial to the employee, as measured at the date of modification.
If an equity-settled transaction is cancelled, it is treated as if it had vested on the date of cancellation, and any expense not yet recognised for the award is recognised immediately. However, if a new award is substituted for the cancelled award and designated as a replacement award on the date that it is granted, the cancelled and new award are treated as if they were a modification of the original award, as described in the previous paragraph.
There is a dilution effect on earnings per share (EPS) from the offer of unsettled equity instruments. This is reflected in diluted earnings per share (refer note 13).
Cash-settled transactions
The Group had no cash-settled transactions outstanding as at 30 June 2015.
2.14 Revenue recognitionRevenue is recognised and measured at the fair value of the consideration received or receivable.
Sale of goods
Revenue from the sale of goods is recognised when the significant risks and rewards of ownership have been transferred to the buyer, recovery of the consideration is probable and there is no continuing management involvement with the goods. Revenue is recognised net of trade discounts and volume rebates.
Interest revenue
Interest revenue is accrued on a time basis, by reference to the principal and the effective interest rate applicable, which is the rate that exactly discounts estimated future cash receipts through the expected life of the financial asset to that asset’s net carrying amount.
Royalties
Royalty revenue is recognised on an accrual basis in accordance with the substance of the relevant agreement. Royalties determined on a time basis are recognised on a straight-line basis over the period of the agreement. Royalty arrangements that are based on production, sales and other measures are recognised by reference to the underlying arrangement.
Management fees
Management fees are recognised on a ’cost-plus’ basis and are due and payable when services are rendered.
Other income
Licence fee income is spread over the term of the licence where there is a specified termination date. Where the licence fee is for an indefinite period, income is recognised when received.
2.15 Operating segments
The Group has adopted NZ IFRS-8 Operating Segments with effect from 1 January 2009. NZ IFRS-8 requires operating segments to be identified on the basis of internal reports about components of the Group that are regularly reviewed by the chief operating decision maker in order to allocate resources to the segment and assess its performance.
Information regarding the Group’s reportable segments is presented in Note 26.
2.16 Borrowing costs
All borrowing costs are recognised in the income statement in the period in which they are incurred, unless they are directly attributable to qualifying assets in which case they are capitalised.
2.17 Taxation
Income tax expense represents the sum of the tax currently payable and deferred tax.
68 69
The a2 Milk Company 2014–15 Notes to the financial statements

Current and deferred tax are recognised as an expense or income in profit or loss, except when they relate to items credited or debited in other comprehensive income, in which case the tax is also recognised in other comprehensive income, or where they arise from the initial accounting for a business combination. In the case of a business combination, the tax effect is taken into account in calculating goodwill or in determining the excess of the acquirer’s interest in the net fair value of the acquiree’s identifiable assets, liabilities and contingent liabilities over the cost of the business combination.
The tax currently payable is based on taxable profit for the year. The Group’s liability for current tax is calculated using tax rates that have been enacted or substantively enacted by the balance sheet date, and any adjustment to tax payable in respect of previous years.
Deferred tax is recognised on differences between the carrying amount of assets and liabilities in the financial statements and the corresponding tax bases used in the computation of taxable profit, and is accounted for using the balance sheet liability method. Deferred tax liabilities are generally recognised for all taxable temporary differences, and deferred tax assets are generally recognised for all deductible temporary differences to the extent that it is probable that taxable profits will be available against which those deductible temporary differences can be utilised. Such assets and liabilities are not recognised if the temporary difference arises from goodwill or from the initial recognition (other than in a business
combination) of other assets and liabilities in a transaction that affects neither the taxable profit nor the accounting profit.
Deferred tax assets and liabilities are measured at the tax rates that are expected to apply in the period in which the liability is settled or the asset realised, based on tax rates (and tax laws) that have been enacted or substantively enacted by the balance sheet date. The measurement of deferred tax liabilities and assets reflects the tax consequences that would follow from the manner in which the Group expects, at the reporting date, to recover or settle the carrying amount of its assets and liabilities.
Deferred tax assets and liabilities are offset when there is a legally enforceable right to set off current tax assets against current tax liabilities and when they relate to income taxes levied by the same taxation authority and the Group intends to settle its current tax assets and liabilities on a net basis.
The carrying amount of deferred tax assets is reviewed at each reporting date for recoverability. Deferred tax assets are reduced when it is no longer probable that sufficient taxable profits will be available in the future to utilise the asset. Likewise, unrecognised tax assets (not booked to balance sheet) are reassessed at each reporting date, and recognised, to the extent that future taxable profits are deemed likely to allow the asset to be recovered.
2.18 Goods & services tax (GST)
Revenue, expenses and assets are recognised net of the amount of Goods and Service Tax (GST) and other similar taxes such as Value Added Tax, except:
• Where the amount of GST incurred is not recovered from the taxation authority, it is recognised as part of the cost of acquisition of an asset or as part of an item of expense; or
• For receivables and payables which are recognised inclusive of GST
The net amount of GST recoverable from, or payable to, the taxation authority is included as part of receivables or payables.
Cash flows are included in the cash flow statement on a gross basis. The GST component of cash flows arising from investing and financing which is recoverable from, or payable to, the taxation authority is classified as operating cash flow.
2.19 Inventories
Inventories are stated at the lower of cost and net realisable value. Cost is calculated using standard or weighted average costing methods. Standard costs are regularly reviewed and, if necessary, revised to reflect actual costs.
Net realisable value represents the estimated selling price less all estimated costs of completion and costs to be incurred in marketing, selling and distribution.
2. Summary of significant accounting policies cont. 2. Summary of significant accounting policies cont.
2.20 Financial assets
Financial assets are classified into the following specified categories:
• financial assets at fair value through profit or loss (FVTPL);
• held-to-maturity investments;
• loans and receivables; and
• Available for sale (AFS) assets
The classification depends on the nature and purpose of the financial assets and is determined at the time of initial recognition.
The Group does not currently hold any financial assets that are classified as FVTPL, held to maturity or available-for-sale. At the reporting date, the Group held no derivative financial assets, and had no designated hedging relationships for hedge accounting purposes.
Loans & receivables
Trade receivables, loans and other receivables that have fixed or determinable payments that are not quoted in an active market are classified as loans and receivables. Loans and receivables are measured at amortised cost using the effective interest method, less any impairment. Interest income is recognised by applying the effective interest rate, except for short-term receivables when the recognition of interest would be immaterial.
Impairment of financial assets
Financial assets, other than those at FVTPL, are assessed for indicators of impairment at each balance sheet date. Financial assets are impaired where there is objective evidence that, as a result of one or more events that occurred after the initial recognition of the financial asset, the estimated future cash flows of the investment have been impacted.
For financial assets carried at amortised cost, the amount of the impairment is the difference between the asset’s carrying amount and the present value of estimated future cash flows, discounted at the financial asset’s original effective interest rate.
The carrying amount of the financial asset is reduced by the impairment loss directly for all financial assets with the exception of trade receivables, where the carrying amount is reduced through the use of an allowance account. Changes in the carrying amount of the allowance account are recognised in profit or loss.
If, in a subsequent period, the amount of the impairment loss decreases and the decrease can be related objectively to an event occurring after the impairment was recognised, the previously recognised impairment loss is reversed through profit or loss to the extent that the carrying amount of the investment at the date the impairment is reversed does not exceed what the amortised cost would have been had the impairment not been recognised.
2.21 Financial liabilities
Financial liabilities, including trade and other payables and borrowings, are initially measured at fair value, net of transaction costs.
Financial liabilities are subsequently measured at amortised cost using the effective interest method, with interest expense recognised on an effective yield basis.
The effective interest method is a method of calculating the amortised cost of a financial liability and of allocating interest expense over the relevant period. The effective interest rate is the rate that exactly discounts estimated future cash payments through the expected life of the financial liability, or, where appropriate, a shorter period.
At the reporting date, the Group held no derivative financial liabilities, and had no designated hedging relationships for hedge accounting purposes.
2.22 Employee benefits
Provision is made for benefits accruing to employees in respect of wages and salaries, annual leave, long service leave and sick leave when it is probable that settlement will be required and they are capable of being measured reliably.
Provisions made in respect of employee benefits expected to be settled within 12 months are measured at their nominal values using the remuneration rate expected to apply at the time of settlement.
70 71
The a2 Milk Company 2014–15 Notes to the financial statements

Provisions made in respect of employee benefits which are not expected to be settled within 12 months are measured as the present value of the estimated future cash outflows to be made by the Group in respect of services provided by employees up to the reporting date.
2.23 ProvisionsProvisions are recognised when the Group has a present obligation (legal or constructive) as a result of a past event, it is probable that the Group will be required to settle the obligation, and a reliable estimate can be made of the amount of the obligation.
The amount recognised as a provision is the best estimate of the consideration required to settle the present obligation at the balance sheet date, taking into account the risks and uncertainties surrounding the obligation. Where a provision is measured using the cash flows estimated to settle the present obligation, its carrying amount is the present value of those cash flows.
When some or all of the economic benefits required to settle a provision are expected to be recovered from a third party, the receivable is recognised as an asset if it is virtually certain that reimbursement will be received and the amount of the receivable can be measured reliably.
2.24 Leases The determination of whether an arrangement is or contains a lease is based on the substance of the arrangement at inception date, whether fulfilment of the arrangement is dependent on the use of a specific asset or assets or the arrangement conveys a right to use the asset, even if that right is not explicitly specified in an arrangement.
Group as a lessee
Finance leases, which transfer to the Group substantially all the risks and benefits incidental to ownership of the leased item, are capitalised at the inception of the lease at the fair value of the leased asset or, if lower, at the present value of the minimum lease payments. Lease payments are apportioned between the finance charges and reduction of the lease liability so as to achieve a constant rate of interest on the remaining balance of the liability. Finance charges are recognised in finance costs in profit or loss.
Capitalised lease assets are depreciated over the shorter of the estimated useful life of the asset and the lease term if there is no reasonable certainty that the Group will obtain ownership by the end of the lease term.
Operating lease payments are recognised as an operating expense in the statement of comprehensive income on a straight line basis over the lease term. Operating lease incentives are recognised as a liability when received and subsequently reduced by allocating lease payments between rental expense and reduction of the liability.
2.25 Foreign currency
For the purpose of the consolidated financial statements, the results and financial position of each entity are expressed in New Zealand dollars, which is the functional currency of the Company, and the presentation currency for the consolidated financial statements. The Group uses the direct method of consolidation.
For the purpose of presenting the Group financial statements, the assets and liabilities of the Group’s foreign operations are expressed in New Zealand dollars using exchange rates prevailing at the balance sheet date. Income and expense items are translated at the average exchange rates for the period, unless exchange rates fluctuated significantly during that period, in which case the exchange rates at the dates of the transactions are used. Exchange differences arising, if any, are classified as equity and recognised in the Group’s foreign currency translation reserve. Such exchange differences are recognised in profit or loss in the period in which the foreign operation is disposed of.
Differences arising on settlement or translation of monetary items that form part of the Company’s net investment in a foreign operation are recognised in Other Comprehensive Income (OCI) until the net investment is disposed of.
Goodwill and fair value adjustments arising on the acquisition of a foreign operation are treated as assets and liabilities of the foreign operation and translated at the closing rate.
2. Summary of significant accounting policies cont.
2.26 Statement of cash flows
For the purpose of the cash flow statement, cash and cash equivalents include cash at bank and in hand and investments in money market instruments, net of outstanding bank overdrafts. The following terms are used in the statement of cash flows:
• Operating Activities – are the principal revenue producing activities of the Group and other activities that are not investing or financing activities
• Investing Activities – are the acquisition and disposal of long-term assets and other investments not included in cash equivalents
• Financing Activities – are activities that result in changes in the size and composition of the contributed equity and borrowings of the entity
Cash flows of foreign subsidiaries, and cash flows from transactions denominated in a foreign currency, have been translated at the prevailing average exchange rate in the month when the cash flow took place.
2.27 Trade & other payables
Trade and other payables are carried at amortised cost due to their short term nature and they are not discounted. They represent liabilities for goods and services provided to the Group prior to the end of the financial year that are unpaid and arise when the Group becomes obliged to make future payments in respect of the purchase of these goods and services. The amounts are unsecured and are usually paid within 48 days of recognition.
2.28 Earnings per share
Basic earnings per share is calculated as net profit attributable to members of the parent, adjusted to exclude any costs of servicing equity (other than dividends), divided by the weighted average number of ordinary shares, adjusted for options that can be exercised at less than the current market price.
Diluted earnings per share is calculated as net profit attributable to members of the parent, adjusted for:
• Costs of servicing equity (other than dividends);
• The after tax effect of dividends and interest associated with dilutive potential ordinary shares that have been recognised as expenses; and
• Other non-discretionary changes in revenues or expenses during the period that would result from the dilution of potential ordinary shares
This is divided by the weighted average number of ordinary shares and dilutive potential ordinary shares, adjusted for options that can be exercised at less than the current market price. More detail is contained in Note 13.
2.29 Cash and cash equivalents
Cash and cash equivalents in the statement of financial position comprise cash at bank and in hand and short term deposits with an original maturity of three months or less that are readily convertible to known amounts of cash, and which are subject to an insignificant risk of changes in value.
2. Summary of significant accounting policies cont.
72 73
The a2 Milk Company 2014–15 Notes to the financial statements

Notes to the financial statements
For the year ended 30 June 2015
Notes to the financial statements
For the year ended 30 June 2015
2015 $’000
2014 $’000
2015 $’000
2014 $’000
3. REVENUE & EXPENSES
3.1 Other revenue
Royalties .............................................................................................................................................. 192 140
Other .................................................................................................................................................... 114 84
306 224
Royalties are received in relation to the sale of a2 milk products under licencing agreement with third parties.
3.2 Administrative expenses
Board meeting costs ........................................................................................................................... 68 38
Employee equity compensation ........................................................................................................ 1,083 1,190
Salary and wage costs ........................................................................................................................ 10,177 7,564
Travel costs ......................................................................................................................................... 2,121 1,592
Other administrative expenses .......................................................................................................... 1,920 1,369
15,369 11,753
3.3 Finance costs
Interest expense ................................................................................................................................. 49 40
Other finance costs ............................................................................................................................ 81 41
130 81
3.4 Other expenses
Audit fees ............................................................................................................................................ 291 186
Bad and doubtful debts ...................................................................................................................... – 12
Consultancy, accounting & secretarial fees ..................................................................................... 4,693 2,359
Directors’ fees and expenses ............................................................................................................. 489 352
Freight.................................................................................................................................................. 9,283 7,942
Foreign exchange (gain)/loss ............................................................................................................. (831) 597
Legal expenses .................................................................................................................................... 1,739 1,199
Loss on disposal, plant & equipment ................................................................................................ 17 –
Patents, trademarks and international development ...................................................................... 384 253
Costs associated with ASX listing ..................................................................................................... 1,681 –
Depreciation & amortisation .............................................................................................................. 1,949 1,900
Promotion & merchandising .............................................................................................................. 4,235 164
Other operating expenses .................................................................................................................. 3,414 1,457
27,344 16,421
4. INCOME TAXES
4.1 Income tax recognised in profit or loss
Current tax expense............................................................................................................................ 2,962 1,522
Prior period adjustment to tax expense – current tax ...................................................................... 299 (917)
Deferred tax expense/(income) relating to the origination and reversal of timing differences and tax losses ................................................................................................. (1,295) (810)
Prior period adjustment to tax expense – deferred tax timing differences .................................... (701) 560
Tax losses utilised (previously not recognised) ................................................................................ (19) (195)
Effect on deferred tax balances due to the change in UK income tax rate from 20.75% to 20% ............................................................................................................................ 148 80
Unutilised foreign tax credits forfeited ............................................................................................. 30 40
Deferred tax asset not recognised .................................................................................................... 1,948 430
Total tax expense ................................................................................................................................ 3,372 710
The prima facie income tax on pre-tax accounting profit from operations reconciles to:
Profit from operations ........................................................................................................................ 1,281 2,081
Income tax expense calculated at 28% (2014: 28%) ........................................................................ 359 583
Difference in UK (20.75%), Australian (30%), and USA income tax rate (40.75%) .......................... 215 115
Non-deductible expenses .................................................................................................................. 917 14
Tax losses utilised (previously not recognised) ................................................................................ (19) (195)
Prior period adjustment to tax expense ............................................................................................ (403) (357)
Effect on deferred tax balances due to the change in UK income tax rate from 20.75% to 20% ............................................................................................................................ 148 80
Tax expense relating to Australian branch ........................................................................................ 177 –
Unutilised foreign tax credits forfeited ............................................................................................. 30 40
Deferred tax asset not recognised .................................................................................................... 1,948 430
Total tax expense ................................................................................................................................ 3,372 710
74 75
The a2 Milk Company 2014–15 Notes to the financial statements

Notes to the financial statements
For the year ended 30 June 2015
Notes to the financial statements
For the year ended 30 June 2015
2015 $’000
2014 $’000
4.2 Income tax recognised in other comprehensive income
The tax charge relating to components of other comprehensive income is as follows:
Foreign currency translation reserve before tax .............................................................................. 1,881 (4,497)
Tax charge relating to foreign currency translation reserve (FCTR) ............................................... (927) –
Movement in foreign currency translation reserve after tax ........................................................... 954 (4,497)
4.3 Tax losses
The Group has estimated tax losses of $20,929,000 not recognised at balance date (2014: $12,388,000) which comprises $16,163,000 relating to the United Kingdom (2014: $9,378,000), $3,373,000 (2014: $1,211,000) relating to the United States of America and $1,393,000 (2014: $1,799,000) relating to Australia. These are subject to confirmation by the HM Revenue & Customs, the Internal Revenue Service and the Australian Tax Office and subject to meeting the requirements of the income tax legislation in each jurisdiction.
4.4 Deferred tax balances
Deferred tax assets are only recognised in the financial statements to the extent that it is probable that sufficient taxable profits will be available. The Group has a net deferred tax asset of $1,810,000 (2014: $1,562,000), and a net deferred tax liability of $1,097,000 (2014: $nil).
2015
Opening Balance
$’000
Charged to income
$’000
Closing Balance
$’000
Gross deferred tax assets
Intellectual property ........................................................................................ 469 (277) 192
Provisions ......................................................................................................... 563 462 1,025
Tax losses ......................................................................................................... 1,008 3 1,011
2,040 188 2,228
Gross deferred tax liabilities
Property, plant & equipment .......................................................................... (478) (299) (777)
Unrealised foreign exchange gains recognised in FCTR (Note 4.2) .............. – (738) (738)
(478) (1,037) (1,515)
Net deferred tax 713
4.4 Deferred tax balances cont.
2014
Opening Balance
$’000
Charged to income
$’000
Closing Balance
$’000
Gross deferred tax assets
Intellectual property ........................................................................................ 1,322 (853) 469
Provisions ......................................................................................................... 594 (31) 563
Tax losses ......................................................................................................... – 1,008 1,008
1,916 124 2,040
Gross deferred tax liabilities
Property, plant & equipment .......................................................................... (288) (190) (478)
(288) (190) (478)
Net deferred tax 1,562
2015 $’000
2014 $’000
Net deferred tax balances recognised in the financial statements
Net deferred tax assets ...................................................................................................................... 1,810 1,562
Net deferred tax liabilities ................................................................................................................. (1,097) –
Net deferred tax 713 1,562
The net deferred tax position of the Group has been shown in accordance with accounting standards.
2015 $’000
2014 $’000
4.5 Imputation credit account balances
Balance at beginning of the year ....................................................................................................... 314 230
Provisional tax paid/payable.............................................................................................................. 196 640
Accrual ................................................................................................................................................. 474 (556)
Balance at end of the year .................................................................................................................. 984 314
The Company is a member of a Consolidated Tax Group. Balances in the Imputation Credit Account represent the imputation credits available to the Company as a member of the Consolidated Tax Group.
76 77
The a2 Milk Company 2014–15 Notes to the financial statements

Notes to the financial statements
For the year ended 30 June 2015
Notes to the financial statements
For the year ended 30 June 2015
2015 $’000
2014 $’000
2015 $’000
2014 $’000
4.6 Franking credit account balances
Balance at beginning of the year ....................................................................................................... 2,035 860
Income tax paid/payable .................................................................................................................... 1,747 1,325
Impact of foreign exchange movement ............................................................................................. 103 (77)
Accrual ................................................................................................................................................. 426 (73)
Balance at end of the year .................................................................................................................. 4,311 2,035
Balances in the Franking Credit Account are shown in NZD and refer exclusively to credits held by the Company and available to shareholders in the event of future payment of dividends.
5. CASH & CASH EQUIVALENTS2015
$’0002014
$’000
Cash at banks and on hand ................................................................................................................ 6,092 15,979
Balance at end of the year .................................................................................................................. 6,092 15,979
Bank balances and cash comprise cash held by the Group. Interest is earned at floating rates based on daily bank deposit rates. No short-term deposits were held during the year, or in the prior year. The carrying value of cash assets approximates their fair value.
Cash on hand includes AUD 3,741,000 (2014: AUD 10,939,000), GBP 127,000 (2014: GBP 20,000), USD 730,000 (2014: USD 3,582,000) and EUR 2,500 (2014: EUR 3,000).
The Group had available an AUD 3,000,000 debtor finance facility, which was undrawn as at 30 June 2015.
6. TRADE & OTHER RECEIVABLES2015
$’0002014
$’000
Trade receivables ................................................................................................................................ 36,189 24,811
Allowance for doubtful debts ............................................................................................................. (48) (46)
Other receivables ................................................................................................................................ 3,803 2,593
Balance at end of the year .................................................................................................................. 39,944 27,358
The average credit period on sales is 72 days (2014: 78 days). No interest is charged on trade receivables outstanding.
Included in the Group’s accounts receivable balance are debtors with a carrying amount of $1,025,448 (2014: $394,000) which are past due at the reporting date but not considered doubtful. These relate to a number of accounts of which there is no recent history of default. The Group has not provided for these debtors as there has not been a significant change in credit quality and the amounts are still considered recoverable. The ageing of the debtors that are past due but not impaired are predominantly 30 days or more beyond the due date of commercial trading terms.
6.1 Movement in allowance for doubtful debts
Balance at beginning of year .............................................................................................................. 46 38
Amount charged to the statement of comprehensive income ........................................................ – 12
Net foreign currency exchange differences ...................................................................................... 2 (4)
Balance at end of year ........................................................................................................................ 48 46
In determining the recoverability of a trade receivable, the Group considers any change in perceived credit quality of the trade receivable from the date credit was initially granted up to the reporting date. Accordingly, the Directors believe that there is no further credit provision required in excess of the allowance for impairment losses.
7. INVENTORIES2015
$’0002014
$’000
Raw materials ..................................................................................................................................... 627 486
Finished goods .................................................................................................................................... 4,219 5,097
Total inventories at the lower of cost and net realisable value ....................................................... 4,846 5,583
78 79
The a2 Milk Company 2014–15 Notes to the financial statements

Notes to the financial statements
For the year ended 30 June 2015
8. PROPERTY, PLANT & EQUIPMENT
2015
Office &computer
$’000
Furniture& fittings
$’000
Leaseimprove
ments
$’000
Plant &equipment
$’000
Capital WIP
$’000
Total property,
plant &equipment
$’000
Cost 1 July 2014 ............................................................. 383 92 18 10,550 394 11,437Acquisition through business combination .................Additions......................................................................... 231 5 50 510 199 995Transfers......................................................................... 62 58 – 78 (305) (107)Disposals ........................................................................ (73) – – (167) – (240)Net foreign currency exchange differences 45 7 2 533 15 602
Cost 30 June 2015 .......................................................... 648 162 70 11,504 303 12,687
Accumulated depreciation & impairment charges 1 July 2014 ...................................................................... (192) (27) (11) (2,044) – (2,274)Depreciation expense .................................................... (159) (10) (25) (980) – (1,174)
Accumulated depreciation reversed on disposal ........ 42 – – 167 – 209Net foreign currency exchange differences (17) (2) (2) (126) – (147)Accumulated depreciation and impairment charges 30 June 2015................................................................... (326) (39) (38) (2,983) – (3,386)
Book Value 30 June 2015 ............................................... 322 123 32 8,521 303 9,301
2014
Office &computer
$’000
Furniture& fittings
$’000
Leaseimprove
ments
$’000
Plant &equipment
$’000
Capital WIP
$’000
Total property,
plant &equipment
$’000
Cost 1 July 2013 ............................................................. 273 104 22 12,350 121 12,870Acquisition through business combination ................. 32 – – – – 32Additions......................................................................... 130 4 – 441 296 871Net foreign currency exchange differences (52) (16) (4) (2,241) (23) (2,336)
Cost 30 June 2014 .......................................................... 383 92 18 10,550 394 11,437
Accumulated depreciation & impairment charges 1 July 2013 ...................................................................... (151) (21) (10) (1,279) – (1,461)Depreciation expense .................................................... (69) (9) (3) (983) – (1,064)Net foreign currency exchange differences 28 3 2 218 – 251Accumulated depreciation and impairment charges 30 June 2014................................................................... (192) (27) (11) (2,044) – (2,274)
Book Value 30 June 2014 ............................................... 191 65 7 8,506 394 9,163
Notes to the financial statements
For the year ended 30 June 2015
2015 $’000
2014 $’000
9. ACCOUNTS PAYABLE
9.1 Accounts payable – current
Trade creditors .................................................................................................................................... 15,178 8,391
Accruals ............................................................................................................................................... 10,447 7,160
Employee entitlements ...................................................................................................................... 1,301 1,167
Withholding tax payable ..................................................................................................................... 1,431 1,157
28,357 17,875
The average credit period on purchases is 53 days (2014: 48 days). No interest was charged on trade creditors outstanding.
9.2 Accounts payable – non current2015
$’0002014
$’000
Employee entitlements ...................................................................................................................... 189 124
189 124
2015 $’000
2014 $’000
10. GOODWILL
Cost
Balance at beginning of the year ....................................................................................................... 10,587 9,370
Acquisition of The a2 Milk Company Limited (UK) ............................................................................ – 2,061
Effects of foreign currency exchange differences ........................................................................... 406 (844)
Balance at end of the year .................................................................................................................. 10,993 10,587
Carrying amount
At beginning of the year ...................................................................................................................... 10,587 9,370
At end of the year ................................................................................................................................ 10,993 10,587
80 81
The a2 Milk Company 2014–15 Notes to the financial statements

Notes to the financial statements
For the year ended 30 June 2015
Notes to the financial statements
For the year ended 30 June 2015
10. GOODWILL CONT.
Annual test for impairment
All goodwill relates to the principal activity of the Company being the commercialisation of a2™ brand milk and related products.
Goodwill has been allocated for impairment testing purposes at the level of its respective cash generating unit, which is also an operating segment (refer to Note 26).
Australia & New Zealand
$’000
UK
$’000
USA
$’000
Total
$’000
Goodwill allocated to CGU’s .................................................................................... 8,585 2,061 347 10,993
The recoverable amount of this goodwill has been determined based on a value in use basis using a discounted cash flow approach, and projections based on financial budgets and business plans approved by senior management covering a 5 year period.
Key assumptions
• Discount rate (pre-tax) range: 10.0% to 11.0%• Terminal growth rate 2.0%
Sensitivity to change in assumptions
The calculation of value in use for the above operating segments is most sensitive to the following assumptions:
• Gross margins• Discount rates• Revenue growth during the forecast period• Growth rates used to extrapolate cash flows beyond the forecast period (terminal growth rate)
Gross margins – Gross margins are based on budgeted margins for FY16, and conservative estimates for future years, which have been adjusted where appropriate to account for expected future trading conditions. Consideration has been given to the growth profile of each business when forecasting future margin returns.
Discount rates – Discount rates represent the risks specific to each CGU, taking into consideration the time value of money and individual risks of the underlying assets being assessed. Segment-specific risk is incorporated by applying individual beta factors. The discount rate calculation is based on the specific circumstances of the Group and its operating segments and is derived from its weighted average cost of capital (WACC). The WACC takes into account both debt and equity. The cost of equity is derived from the expected return on investment by the Group’s investors. Noting that the Group had no debt at 30 June 2015, the cost of debt is based on the capital structure that could be expected from a similar market participant.
Revenue growth – Revenue projections have been constructed with reference to the FY16 budget and 5-year strategic plan (set in financial year 2014), and adjusted for recent performance trends across the particular regions (where necessary). A conservative approach has been adopted by the Company to reduce the risk of inflating estimated recoverable values.
Terminal growth rate – A terminal growth rate of 2.0% per annum has been used as the base assumption for future cash flow growth beyond the 5 year forecast period. This is a conservative rate when compared to annual growth rates during the forecast period. The terminal value (being the total value of expected cash flows beyond the forecast period) is discounted to present values using the discount rate specific to each CGU.
Management believes that no reasonably possible change in any of the key assumptions would cause the carrying value of the cash generating unit to exceed its recoverable amount. On the basis of this assessment, no impairment write downs are considered necessary.
2015
11. OTHER INTANGIBLE ASSETS
Patents
$’000
Trademarks
$’000
Software
$’000
Projectdevelopment
$’000
Total
$’000
Cost
Balance at the beginning of the year ................................. 346 526 763 3,511 5,146
Additions.............................................................................. 44 387 39 2,162 2,632
Transfers.............................................................................. – – 107 – 107
Net foreign currency exchange differences ...................... – – 40 55 95
Balance at the end of the year ........................................... 390 913 949 5,728 7,980
Amortisation
At beginning of year ............................................................ (80) – (164) (708) (952)
Current year change ........................................................... (31) – (251) (493) (775)
Net foreign currency exchange differences ...................... – – (15) (8) (23)
At end of year....................................................................... (111) – (430) (1,209) (1,750)
Carrying amount
At beginning of year ............................................................ 266 526 599 2,803 4,194
At end of year....................................................................... 279 913 519 4,519 6,230
2014
Patents
$’000
Trademarks
$’000
Software
$’000
Projectdevelopment
$’000
Total
$’000
Cost
Balance at the beginning of the year ................................. 296 379 176 2,316 3,167
Additions.............................................................................. 50 147 533 1,312 2,042
Transfers.............................................................................. – – 86 (86) –
Net foreign currency exchange differences ...................... – – (32) (31) (63)
Balance at the end of the year ........................................... 346 526 763 3,511 5,146
Amortisation
At beginning of year ............................................................ (49) – (82) – (131)
Current year change ........................................................... (31) – (95) (710) (836)
Net foreign currency exchange differences ...................... – – 13 2 15
At end of year....................................................................... (80) – (164) (708) (952)
Carrying amount
At beginning of year ............................................................ 247 379 94 2,316 3,036
At end of year....................................................................... 266 526 599 2,803 4,194
Project Development costs are amortised over a maximum useful life of five years.
82 83
The a2 Milk Company 2014–15 Notes to the financial statements

2015 $’000
2014 $’000
12. SHARE CAPITAL
a) Share capital Balance at beginning of the year 86,264 84,253
Ordinary shares: Partly paid shares fully paid ............................................................................ 39 2,011
Balance at end of the year 86,303 86,264
2015 No.
2014 No.
b) Number of ordinary shares on issue
i) Fully paid ordinary shares
Balance at beginning of the year 633,066,979 615,165,990
Shares issued ................................................................................................................................. 260,000 17,900,989
Balance at end of the year 633,326,979 633,066,979
ii) Partly paid ordinary shares
Balance at beginning of the year 27,000,000 30,000,989
Shares fully paid ............................................................................................................................ (260,000) (17,500,989)
Shares issued ................................................................................................................................. – 14,500,000
Balance at end of the year 26,740,000 27,000,000
Total ordinary shares on issue 660,066,979 660,066,979
During the year ended 30 June 2015, 260,000 partly paid ordinary shares became fully paid (2014: 17,500,989).
During the year ended 30 June 2015, no additional partly paid ordinary shares were issued by the Company.
Partly paid ordinary shares carry the same rights and entitlements on a fractional basis, as fully paid ordinary shares, with such fractions being the equivalent to the proportion which the amount paid is of the total amount paid and amounts still payable on the shares.
On 31 March 2015, the Company was admitted to the Official List of the Australian Securities Exchange, and its ordinary shares became available for trade on that day. No new capital was issued as part of this compliance listing.
Notes to the financial statements
For the year ended 30 June 2015
Notes to the financial statements
For the year ended 30 June 2015
2015 Cents per
share
2014 Cents per
share
13. EARNINGS PER SHARE
13.1 Basic earnings/(loss) per share
From continuing operations ............................................................................................................... (0.33) –
Total basic earnings per share ........................................................................................................... (0.33) –
The earnings and weighted average number of ordinary shares used in the calculation of basic earnings per share are as follows:
2015 $’000
2014 $’000
Net surplus/(deficit):
From continuing operations .............................................................................................................. (2,091) 10
(2,091) 10
No. No.Weighted average number of ordinary shares (’000) for the purpose of basic earnings per share ................................................................................................. 633,337 626,324
2015 Cents per
share
2014 Cents per
share
13.2 Diluted earnings/(loss) per share
From continuing operation ................................................................................................................. (0.32) –
Total diluted earnings per share ........................................................................................................ (0.32) –
The earnings and weighted average number of ordinary shares used in the calculation of diluted earnings per share are as follows:
2015 $’000
2014 $’000
Net surplus/(deficit):
From continuing operations .............................................................................................................. (2,091) 10
(2,091) 10
No. No.Weighted average number of ordinary shares (’000) for the purpose of diluted earnings per share .................................................................................. 633,337 626,324
Effect of dilution due to partly paid ordinary shares (’000) ............................................................. 9,736 27,897
Weighted average number of ordinary shares (’000) for thepurpose of diluted earnings per share .............................................................................................. 643,073 654,221
84 85
The a2 Milk Company 2014–15 Notes to the financial statements

Notes to the financial statements
For the year ended 30 June 2015
Notes to the financial statements
For the year ended 30 June 2015
14. EQUITY SETTLED SHARE-BASED PAYMENTS
14.1 Partly paid shares
Partly paid ordinary shares have been issued to certain key management personnel (the purchasers). The partly paid shares were issued on the following terms:
a) Restrictions on transfer
Each partly paid share is issued on terms that require a vesting period (settlement date) to pass before the purchaser can transfer the shares (settlement date). This restriction applies even if the shares have been fully paid prior to the settlement date. Under the various agreements these vesting periods range from 1–5 years.
b) Issue price
The issue price of each partly paid share is set at the lesser of:
• The closing price quoted on the New Zealand Exchange Limited’s NZX Market for the Company’s shares as at the date the parties enter into the share subscription agreement; and
• The average closing price on the New Zealand Exchange Limited’s NZX Market for the Group’s shares over the three months prior to the date the parties enter into the share subscription agreement;
provided that such price must not be lower than 10 cents per share for Tranches II–IV and 15 cents per share for Tranches V–VII.
Under the share subscription agreements the issue prices were calculated as follows:
• 10 cents per share for Tranches II – IV;
• 15 cents per share for Tranches V – VII;
• 55 cents per share for Tranches VIII – IX;
• 64 cents per share for Tranche X; and
• 72 cents per share for Tranche XI.
These Tranches were issued as partly paid shares at 1% of the issue price.
The purchasers have an unconditional right to put the partly paid shares to the Company prior to settlement date and receive a full refund of any monies paid.
c) Rights
Each partly paid ordinary share issued carries a fractional right to a distribution and a fractional voting right, such fractions being the equivalent to the proportion which the amount paid is of the total amount paid and amounts still payable on the shares.
14. EQUITY SETTLED SHARE-BASED PAYMENTS CONT.
14.1 Partly paid shares cont.
d) Summary of partly paid share series
The following share-based payment arrangements were in existence as at 30 June 2015:
Partly paid shares series Number Grant date Vesting date Expiry date Exercise price
Fair value at grant date
(1) Partly paid shares – Tranche IV 6,000,000 25 Aug 2010 1 Sep 2011 – 1 Sep 2015 25 Aug 2015 $0.10 $233,542
(2) Partly paid shares – Tranche VI 3,000,000 28 Mar 2011 28 Mar 2016 28 Mar 2016 $0.15 $151,358
(3) Partly paid shares – Tranche VII 3,240,000 28 Mar 2011 28 Mar 2016 28 Mar 2016 $0.15 $163,466
(4) Partly paid shares – Tranche VIII 2,500,000 9 Jul 2013 9 Jul 2018 9 Jul 2018 $0.55 $457,250
(5) Partly paid shares – Tranche IX 2,000,000 15 Jul 2013 15 Jul 2018 15 Jul 2018 $0.55 $565,600
(6) Partly paid shares – Tranche X 5,000,000 29 Oct 2013 29 Oct 2018 1 Dec 2050 $0.64 $1,235,000
(7) Partly paid shares – Tranche XI 5,000,000 9 Apr 2014 9 Apr 2019 9 Apr 2019 $0.72 $1,284,250
e) Issues during the period
During the year, nil partly paid shares were issued to key management personnel (the purchasers) under partly paid share plans (2014: 14,500,000). As at 30 June 2015, purchasers had paid $115,058 for tranches IV to XI (2014: $115,448). This payment has been recognised as a financial liability until such time as vesting conditions are met.
f) Shares exercised/forfeited during the period
During the year, 260,000 partly paid shares were exercised and fully paid to the issue price (2014: 11,500,000). These partly paid shares were fully paid to $0.15 per share (2014: 9,000,000 were fully paid to $0.10 and 2,500,000 were fully paid to $0.15).
No partly paid shares lapsed during the year ended 30 June 2015 (2014: Nil).
g) Shares expired during the period
No partly paid shares expired during the year ended 30 June 2015 (2014: Nil).
h) Weighted average remaining contractual life
The weighted average remaining contractual life of the partly paid shares at 30 June 2015 is 8.05 years (2014: 8.98 years).
i) Weighted average exercise price
The weighted average exercise price of the partly paid shares outstanding as at 30 June 2015 is $0.404 (2014: $0.402).
86 87
The a2 Milk Company 2014–15 Notes to the financial statements

Notes to the financial statements
For the year ended 30 June 2015
Notes to the financial statements
For the year ended 30 June 2015
14. EQUITY SETTLED SHARE-BASED PAYMENTS CONT.
14.2 Estimation of fair value of partly paid shares at measurement date
a) Valuation methodology
The partly paid shares are valued using a Black Scholes option pricing and Binomial option pricing model. Employees holding these tranches can purchase the remaining balance of the shares at any point up until the expiry date and this is consistent with ’American’ Options. The Black Scholes pricing model allows for this.
The fair value at grant date has been updated to reflect vesting conditions which were varied during the period for Tranches X and XI.
b) Input assumptions
The fair values above have been derived using the following input assumptions:
Party paid shares series Valuation date
Share price
Exercise price
Volatility Time to expiry(years)
Expected dividends
Risk-free rate
(1) Partly paid shares – Tranche IV 25 Aug 2010 $0.087 $0.10 50% 5.00 0% 4.37%
(2) Partly paid shares – Tranche VI 28 Mar 2011 $0.11 $0.15 50% 5.00 0% 4.28%
(3) Partly paid shares – Tranche VII 28 Mar 2011 $0.11 $0.15 50% 5.00 0% 4.28%
(4) Partly paid shares – Tranche VIII 9 Jul 2013 $0.63 $0.55 30% 5.00 0% 3.56%
(5) Partly paid shares – Tranche IX 15 Jul 2013 $0.68 $0.55 30% 5.00 0% 3.48%
(6) Partly paid shares – Tranche X 29 Oct 2013 $0.68 $0.64 30% 37.12 0% 4.10%
(7) Partly paid shares – Tranche XI 17 Dec 2013 $0.75 $0.72 30% 5.00 0% 4.30%
c) Early exercise
For Tranche X, an early exercise has been assumed after five years. The timing of early exercise has been estimated after taking into consideration factors including: the employee’s age and employment contract term; and that the partly paid shares must be exercised within 12 months of the employee leaving the Company. For Tranche XI, it is assumed that exercise will occur mid-way during the period between the date of vesting and the expiry date.
No allowance has been made for the possibility of early exercise for other Tranches. For these Tranches the partly paid shares are held by a small number of executives and the Company has no reason to believe that the partly paid shares will be exercised early.
14. EQUITY SETTLED SHARE-BASED PAYMENTS CONT.
14.2 Estimation of fair value of partly paid shares at measurement date cont.
d) Volatility
Volatility has been assessed by considering the historical volatility of the Company and comparable companies, as well as other factors that influence expected future volatility. Prior to the Company moving to the NZX Main Board in December 2012, the Company’s historical share price movements were characterised by infrequent share trading and wide trading spreads giving rise to volatile price movements. Such share price returns can be as much (if not more) reflective of trading conditions as much as of underlying value. The Company’s historical volatility is therefore considered to be too high to be predictive of future volatility. For partly paid shares granted prior to December 2012 a volatility of 50% has been adopted for each of the Company’s partly paid share valuations.
For partly paid shares granted after December 2012 a volatility of 30% has been adopted for each of the Company’s partly paid share valuations.
e) Other factors
No other factors have been incorporated into the partly paid share valuations.
f) Amounts recognised in financial statements
The impact of the share based payments on the financial statements of the Company is summarised as follows:
Period ended 30 June 2015 30 June 2014
Amount recognised as employee
expense in profit or loss$’000
Amount recognised in other
comprehensive income$’000
Amount recognised as employee
expense in profit or loss$’000
Amount recognised in other
comprehensive income$’000
(1) Partly paid shares – Tranche II – – – –
(2) Partly paid shares – Tranche III – – – –
(3) Partly paid shares – Tranche IV 47 47 114 114
(4) Partly paid shares – Tranche V – – – –
(5) Partly paid shares – Tranche VI 30 30 30 30
(6) Partly paid shares – Tranche VII 35 35 35 35
(7) Partly paid shares – Tranche VIII (153) (153) 610 610
(8) Partly paid shares – Tranche IX 113 113 109 109
(9) Partly paid shares – Tranche X 514 514 155 155
(10) Partly paid shares – Tranche XI 444 444 137 137
Total 1,030 1,030 1,190 1,190
Tranche VIII is partly paid shares held by a former employee. An acceleration of vesting was recognised in the 2014 year for Tranche VIII when the employee left the Company. In the 2015 financial year, the negative expense of ($153,000) represents a correction to amounts expensed in the 2014 financial year.
88 89
The a2 Milk Company 2014–15 Notes to the financial statements

Notes to the financial statements
For the year ended 30 June 2015
Notes to the financial statements
For the year ended 30 June 2015
14. EQUITY SETTLED SHARE-BASED PAYMENTS CONT.
14.3 Long term incentive plan
The Company has adopted a Long Term Incentive Plan (LTIP) to assist in the reward, retention and motivation of certain employees and Directors of the Company and its subsidiaries (“Participants”).
The Company may grant options and/or performance rights (“Awards”) to eligible participants under its LTIP. Each Award granted represents a right to receive one fully paid share in the Company once the Award vests and is exercised by the relevant Participant.
In accordance with the rules of the LTIP, the Board will determine in its sole and absolute discretion the terms and conditions of Awards which are granted under the LTIP including, but not limited to, the following:
• which individuals will be invited to participate in the Long Term Incentive Plan (“Invitation”)
• the number of Awards to be granted to each Participant
• the fee payable (if any) by Participants on the grant of Awards to Participants
• the terms on which the Awards will vest and become exercisable, including any vesting conditions or performance hurdles which must be met
• the exercise price of each option granted to Participants
• the period during which a vested option can be exercised
• any forfeiture conditions or disposal restrictions applying to the Awards and any Fully Paid Shares that Participants receive upon exercise of their Awards
The Board may delegate management and administration of the LTIP together with any of its powers or discretions under the LTIP to a committee of the Board or to any one or more persons selected by it as the Board thinks fit, including but not limited to the Company Secretary.
a) Maximum Awards allocation
Unless prior shareholder approval is obtained, the number of Awards which may be granted under this Plan, which upon exercise will vest Plan Shares, (a fully paid ordinary share in the capital of the Company) must not exceed in aggregate 5% of the total Issued Capital of the Company.
b) Awards rights and terms
Subject to the Board determining otherwise prior to an Invitation, each vested option and each vested performance right entitles the Participant holding the option or the performance right to subscribe for, or to be transferred, a fully paid ordinary share in the capital of the Company, in the case of an option, on payment of the Exercise Price (if any).
A Participant who holds an Award is not entitled to:
i) vote at or attend a meeting of the Shareholders unless, and until the Awards are exercised, the Participant holds fully paid ordinary shares of the Company
ii) receive any dividends declared by the Company in respect of such Awards
Plan Shares allotted, issued or transferred by the Company to a Participant under the Plan will rank equally with all existing Shares on and from the date of allotment, issue or transfer.
14. EQUITY SETTLED SHARE-BASED PAYMENTS CONT.
14.3 Long term incentive plan cont.
c) Conditions for vesting and exercise
The Board will determine prior to an Invitation being made and specify in the Invitation any performance hurdles and/or vesting conditions attaching to the Awards. Options and/or performance rights will only vest and be exercisable if the applicable performance hurdles and/or vesting conditions have been satisfied, or are deemed to have been satisfied under the Plan rules.
d) Restrictions on transfer
Awards granted under the Plan may not be assigned, transferred, or otherwise disposed of by a Participant without the prior consent from the Board.
e) Summary of Awards
The following Awards were in existence as at 30 June 2015:
LTIP Awards Number Grant date Vesting date21 Expiry date Exercise price
Fair value at grant date
(1) Share Options – Tranche 1 5,000,000 30 Mar 2015 30 Mar 2016 – 30 Mar 2020 30 Jun 2020 $0.63 $503,000
f) Options issued during the period
During the year 5,000,000 options were issued to Plan Participants (2014: nil).
14.4 Estimation of fair value of options at measurement date
a) Valuation methodology
The share options are valued using a Black Scholes pricing model. Employees holding these options can purchase the remaining balance of the shares at any point up until the expiry date (use the right to exercise the Option) and this is consistent with ’American’ Options.
b) Input assumptions
The fair values above have been derived using the following input assumptions:
LTIP Awards Valuation date
Share price
Exercise price
Volatility Time to expiry(years)
Expected dividends
Risk-free rate
(1) Share Options – Tranche 1 30 Mar 2015 $0.50 $0.63 30% 5.26 0% 3.20%
21 The options will vest in five equal tranches over five years commencing on the first anniversary of the date of grant
90 91
The a2 Milk Company 2014–15 Notes to the financial statements

Notes to the financial statements
For the year ended 30 June 2015
Notes to the financial statements
For the year ended 30 June 2015
14. EQUITY SETTLED SHARE-BASED PAYMENTS CONT.
14.4 Estimation of fair value of options at measurement date cont.
c) Exercise
It is assumed that the options will be exercised mid-way during the period between the date of vesting and the expiry date.
d) Volatility
Volatility has been assessed by considering the historical volatility of the Company, as well as other factors that influence expected future volatility. The average volatility of the Company’s equity over the year leading up to 30 March 2015 (grant date) was approximately 30%. Therefore, an average volatility of 30% has been used as a valuation input.
e) Amounts recognised in financial statements
The impact of the share based payments on the financial statements of the Company is summarised as follows:
Period ended 30 June 2015 30 June 2014
Amount recognised as employee
expense in profit or loss$’000
Amount recognised in other
comprehensive income$’000
Amount recognised as employee
expense in profit or loss$’000
Amount recognised in other
comprehensive income$’000
(1) ) Share Options – Tranche 1 53 53 – –
Total 53 53 – –
2015 $’000
2014 $’000
15. EMPLOYEE EQUITY SETTLED PAYMENTS RESERVE
Balance at beginning of the year ....................................................................................................... 3,019 1,829
Movements during the period ............................................................................................................ 1,083 1,190
Balance at end of the year .................................................................................................................. 4,102 3,019
The employee equity settled payments reserve is used to record the value of share based payments provided to employees and contractors, including key management personnel.
2015 $’000
2014 $’000
16. RETAINED EARNINGS (DEFICIT)
Balance at beginning of the year ....................................................................................................... (23,974) (23,984)
Net surplus/(deficit) for the period excluding associate/joint venture net profits/(losses) ......... (2,091) 1,371
Share of net profits/(loss) of associates and joint ventures accounted for using the equity method ............................................................................................................................... – (1,361)
(2,091) 10
Balance at end of year ........................................................................................................................ (26,065) (23,974)
2015 $’000
2014 $’000
17. FOREIGN CURRENCY TRANSLATION RESERVE
Balance at the beginning of the year ................................................................................................. (6,665) (2,168)
Arising on translation of foreign operations ..................................................................................... 954 (4,497)
Balance at end of the year .................................................................................................................. (5,711) (6,665)
The foreign currency translation reserve is used to record exchange differences arising from the translation of the financial statements of foreign operations.
18. OPERATING & FINANCE LEASE COMMITMENTS
Operating leases relate to The a2 Milk Company Limited and The a2 Milk Company (Australia) Pty Limited. All operating lease contracts contain market review clauses in the event that the Company exercises its option to renew. The Company has an option to purchase some leased assets at the expiry of the relevant lease period.
2015 $’000
2014 $’000
18.1 Non-cancellable operating lease payments
Not longer than 1 year ........................................................................................................................ 1,095 855
Longer than 1 year and not longer than 5 years ............................................................................... 2,397 2,392
Longer than 5 years ............................................................................................................................ 893 1,369
4,385 4,616
92 93
The a2 Milk Company 2014–15 Notes to the financial statements
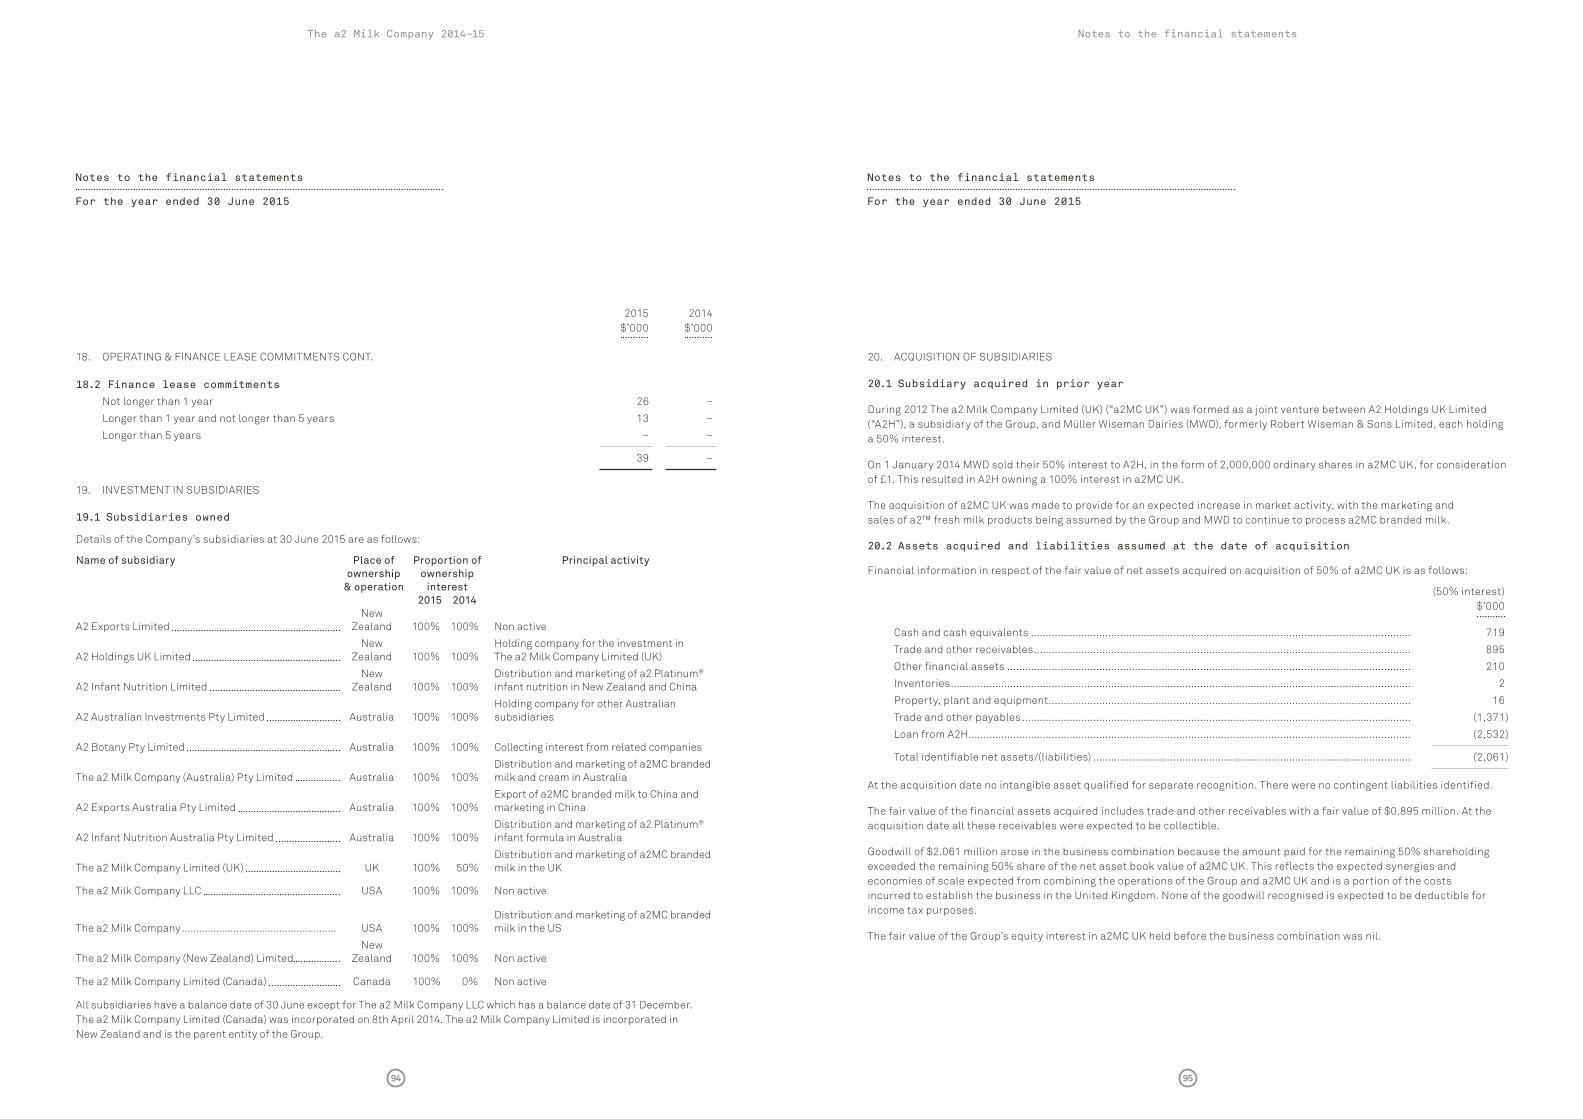
Notes to the financial statements
For the year ended 30 June 2015
Notes to the financial statements
For the year ended 30 June 2015
2015 $’000
2014 $’000
18. OPERATING & FINANCE LEASE COMMITMENTS CONT.
18.2 Finance lease commitments
Not longer than 1 year 26 –
Longer than 1 year and not longer than 5 years 13 –
Longer than 5 years – –
39 –
19. INVESTMENT IN SUBSIDIARIES
19.1 Subsidiaries owned
Details of the Company’s subsidiaries at 30 June 2015 are as follows:
Name of subsidiary Place of ownership
& operation
Proportion ofownership
interest2015 2014
Principal activity
A2 Exports Limited New
Zealand 100% 100% Non active
A2 Holdings UK Limited New
Zealand 100% 100%Holding company for the investment in The a2 Milk Company Limited (UK)
A2 Infant Nutrition Limited New
Zealand 100% 100%Distribution and marketing of a2 Platinum® infant nutrition in New Zealand and China
A2 Australian Investments Pty Limited Australia 100% 100%Holding company for other Australian subsidiaries
A2 Botany Pty Limited Australia 100% 100% Collecting interest from related companies
The a2 Milk Company (Australia) Pty Limited Australia 100% 100%Distribution and marketing of a2MC branded milk and cream in Australia
A2 Exports Australia Pty Limited Australia 100% 100%Export of a2MC branded milk to China and marketing in China
A2 Infant Nutrition Australia Pty Limited Australia 100% 100%Distribution and marketing of a2 Platinum® infant formula in Australia
The a2 Milk Company Limited (UK) UK 100% 50%Distribution and marketing of a2MC branded milk in the UK
The a2 Milk Company LLC USA 100% 100% Non active
The a2 Milk Company ...................................................... USA 100% 100%Distribution and marketing of a2MC branded milk in the US
The a2 Milk Company (New Zealand) Limited New
Zealand 100% 100% Non active
The a2 Milk Company Limited (Canada) Canada 100% 0% Non active
All subsidiaries have a balance date of 30 June except for The a2 Milk Company LLC which has a balance date of 31 December. The a2 Milk Company Limited (Canada) was incorporated on 8th April 2014. The a2 Milk Company Limited is incorporated in New Zealand and is the parent entity of the Group.
20. ACQUISITION OF SUBSIDIARIES
20.1 Subsidiary acquired in prior year
During 2012 The a2 Milk Company Limited (UK) (“a2MC UK”) was formed as a joint venture between A2 Holdings UK Limited (“A2H”), a subsidiary of the Group, and Müller Wiseman Dairies (MWD), formerly Robert Wiseman & Sons Limited, each holding a 50% interest.
On 1 January 2014 MWD sold their 50% interest to A2H, in the form of 2,000,000 ordinary shares in a2MC UK, for consideration of £1. This resulted in A2H owning a 100% interest in a2MC UK.
The acquisition of a2MC UK was made to provide for an expected increase in market activity, with the marketing and sales of a2™ fresh milk products being assumed by the Group and MWD to continue to process a2MC branded milk.
20.2 Assets acquired and liabilities assumed at the date of acquisition
Financial information in respect of the fair value of net assets acquired on acquisition of 50% of a2MC UK is as follows:
(50% interest) $’000
Cash and cash equivalents ................................................................................................................................ 719
Trade and other receivables ............................................................................................................................... 895
Other financial assets ........................................................................................................................................ 210
Inventories ........................................................................................................................................................... 2
Property, plant and equipment .......................................................................................................................... 16
Trade and other payables ................................................................................................................................... (1,371)
Loan from A2H ..................................................................................................................................................... (2,532)
Total identifiable net assets/(liabilities) ........................................................................................................... (2,061)
At the acquisition date no intangible asset qualified for separate recognition. There were no contingent liabilities identified.
The fair value of the financial assets acquired includes trade and other receivables with a fair value of $0.895 million. At the acquisition date all these receivables were expected to be collectible.
Goodwill of $2.061 million arose in the business combination because the amount paid for the remaining 50% shareholding exceeded the remaining 50% share of the net asset book value of a2MC UK. This reflects the expected synergies and economies of scale expected from combining the operations of the Group and a2MC UK and is a portion of the costs incurred to establish the business in the United Kingdom. None of the goodwill recognised is expected to be deductible for income tax purposes.
The fair value of the Group’s equity interest in a2MC UK held before the business combination was nil.
94 95
The a2 Milk Company 2014–15 Notes to the financial statements

Notes to the financial statements
For the year ended 30 June 2015
21. INVESTMENTS IN ASSOCIATES/JOINT VENTURES
21.1 Interest in associates/joint ventures
During the 2014 financial year the Group purchased the remaining 50% interest in the joint venture, a2MC UK. The carrying value of the investment was derecognised at this point. The entity was a 100% owned subsidiary for the 2015 financial year.
21.2 Movements in the amount of the groups investment in associates/joint ventures
2015 $’000
2014 $’000
Carrying value at beginning of year ................................................................................................... – 377
Funds advanced/(repaid) ................................................................................................................... – 4,574
Share of net surplus/(deficit) ............................................................................................................. – (1,361)
– 3,590
Carrying value derecognised when associates/joint ventures became a Subsidiary ................... – (3,590)
Carrying value at end of year.............................................................................................................. – –
Represented by:
Investment in associates/joint ventures .......................................................................................... – –
Non-current receivables in Associates/Joint Ventures ................................................................... – –
– –
21.3 Summarised Financial Information
The following summarises financial information relating to the Group’s associates/joint ventures:
2015 $’000
2014 $’000
Extract from the associate/joint venture’s balance sheets:
Total assets ......................................................................................................................................... – –
Current liabilities ................................................................................................................................ – –
Net assets/(liabilities) ........................................................................................................................ – –
Share of associate/joint venture’s net assets/(liabilities) ............................................................... – –
Extract from the associates/joint venture’s income statements:
The 2014 figures are to the date the joint venture became a subsidiary.
Revenue – 1,049
Net surplus/(deficit) – (2,722)
Share of associates/joint ventures surplus/(deficit) – (1,361)
Notes to the financial statements
For the year ended 30 June 2015
22. RELATED PARTY TRANSACTIONS
22.1 Ultimate parent
The a2 Milk Company Limited is the parent of the Group. The Group consists of The a2 Milk Company Limited and its subsidiaries.
22.2 Key management personnel
The compensation of the Managing Director, Directors and other senior management, being the key management personnel of the entity, is set out below:
2015 $’000
2014 $’000
Wages and salaries and other short-term employee benefits ........................................................ 4,160 3,419
Other long-term benefits ................................................................................................................... 43 51
Share-based payments ...................................................................................................................... 1,083 1,190
5,286 4,660
The amounts shown in the table are the amounts recognised as an expense during the reporting period related to key management personnel.
Key management personnel include the following employees of the Group:
Executive Director: Managing Director and CEO
Other key management personnel: Chief Financial Officer
Chief Marketing Officer
Chief Scientific Officer
General Manager, International Development
General Manager, Operations
Chief Executive, Australia & New Zealand
Chief Executive, UK & Europe
Chief Executive, Asia
Chief Executive, USA
Key management personnel are defined as those persons having significant authority and responsibility for the planning, directing and controlling of the Group, and include all executives and senior managers reporting directly to the Managing Director.
96 97
The a2 Milk Company 2014–15 Notes to the financial statements

Notes to the financial statements
For the year ended 30 June 2015
22. RELATED PARTY TRANSACTIONS CONT.
22.3 Transactions with related parties
The amounts outstanding are unsecured and will be settled in cash. No guarantees have been given and no expense has been recognised in the period for bad or doubtful debts in respect of the amounts owed by related parties.
The transactions set out in this section deal with “related parties” in terms of relevant financial reporting standards, and not to “Related Parties” as defined in rule 9.2.3 of the NZX Listing Rules (or chapter 19 of the ASX Listing Rules).
The following table provides details of transactions that were entered into with related parties for the relevant financial year.
Related partySales to related
parties
Other transactions with related
parties
Outstanding transactions with related
parties
2015$’000
2014$’000
2015$’000
2014$’000
2015$’000
2014$’000
Associate/Joint Venture:
The a2 Milk Company Limited (UK) – expenses recharged for overseas travel and accommodation incurred by The a2 Milk Company Limited in relation to the business activities of The a2 Milk Company Limited (UK)
– – – 125 – –
The a2 Milk Company Limited (UK) – interest received by A2 Holdings UK Limited
– – – 52 – –
Other:The a2 Milk Company (USA) (2014 – A2 Holdings (UK) Limited) – consultancy fees paid to Melvyn Miles, a Director of the Company. The fees were charged at commercial rates
– – 19 7 – –
A2 Holdings (UK) Limited (2014 – The a2 Milk Company Limited (UK)) – consultancy fees paid to Lovat Partners Limited, an entity controlled by David Hearn, Chairman of the Company. The fees were charged at commercial rates.
– – 79 41 – 41
The a2 Milk Company (Australia) Pty Limited entered into an agreement with Pactum Australia Pty Limited (a wholly owned subsidiary of Freedom Foods Group Limited) and Pactum Dairy Group (PDG), a joint venture between Freedom Foods Group Limited and Australian Consolidated Milk (ACM), for the processing and packaging of a2MC branded long life milk at Pactum Australia’s facility at Taren Point in New South Wales and at Pactum Dairy Group’s facility at Shepperton in Victoria. The amounts were charged at commercial rates.
– – 31022 1,574 – –
22 Freedom Foods Group Limited ceased being a related party of the Group, in terms of relevant financial reporting standards, on 18 November 2014 in conjunction with the retirement of Mr Perry Gunner as director
Notes to the financial statements
For the year ended 30 June 2015
23. COMMITMENTS FOR EXPENDITURE
23.1 Capital expenditure commitments
As at 30 June 2015, there were no capital expenditure commitments (2014: $nil).
24. CONTINGENT LIABILITY
As at 30 June 2015, there were no material contingent liabilities (2014: $nil).
25. SUBSEQUENT EVENTS
• As announced on 27 July 2015, 6 million partly paid shares belonging to GCAA Investments Pty Ltd were converted to fully paid ordinary shares in the Company
• As announced on 10 August 2015, the Board of Directors approved the issue of a total of 15 million options and 1.6 million performance rights representing rights to acquire ordinary shares in the Company to certain members of the Company’s senior management team that report to the CEO
• On 20 August 2015, The a2 Milk Company (Australia) Pty Limited increased its debtor finance facility to AUD 10,000,000
26. OPERATING SEGMENT INFORMATION
The Group has adopted NZ IFRS-8 Operating Segments. NZ IFRS-8 requires operating segments to be identified on the basis of internal reports about components of the Company that are regularly reviewed by the chief operating decision maker in order to allocate resources to the segment and assess its performance.
For management purposes, the Group is organised into business units based on geographical location along with a corporate function, and has four reportable operating segments as follows:
• The Australia and New Zealand segment receives external revenue from milk, cream and infant formula sales, and royalty and licence fee income
• The China and other Asia segment receives external revenue from milk and infant formula sales. This segment is responsible for the infant formula supply chain to all markets
• The United Kingdom and USA segment receives external revenue from milk sales23
• The Corporate and other segment external revenue comprises external royalty and licence fee income. Corporate and other segment profit also includes:
– internal royalty, licence fee and management fee income from subsidiaries; and
– costs, such as marketing and herd testing costs, associated with development of intellectual property globally
23 Prior to 1 January 2014 this segment comprised a share of joint venture profits and losses which related to The a2 Milk Company Limited’s (a2MC’s) 50% shareholding of the UK business. a2MC acquired the remaining 50% shareholding of this business on 1 January 2014, from which point the UK business was 100% consolidated in the financial results and therefore included in segment profit
98 99
The a2 Milk Company 2014–15 Notes to the financial statements

Notes to the financial statements
For the year ended 30 June 2015
26. OPERATING SEGMENT INFORMATION CONT.
Change in segment categories from prior period
For the 2015 financial year, the Group reclassified its reporting segments in keeping with the way the chief operating decision maker reviews performance and manages the affairs of the Group. The following changes have been made from the prior year:
• The Australia and New Zealand (ANZ) business is now reported as a combined operating segment, reflecting the existing reporting and accountability framework through which the business is managed in this region;
• The USA segment has been combined with the UK segment by way of the aggregation allowances in NZ IFRS 8 Operating Segments. This is in keeping with the similarities in economic performance characteristics between the two segments;
• The Corporate and other segment now reflects the results of the Corporate function consistent with the way the chief operating decision maker reviews the performance of this function
Prior year comparatives have been adjusted for consistency to reflect the segments categories as outlined above.
Management monitors the operating results of its business units separately for the purpose of making decisions about resource allocation and performance assessment. Segment performance is evaluated based on operating profit or loss and is measured consistently with operating profit or loss in the consolidated financial statements.
Transfer prices between operating segments are on an arm’s length basis in a manner similar to transactions with third parties.
Segment revenue24 Segment EBITDA25
2015 $’000
2014 $’000
2015 $’000
2014 $’000
Continuing operations
Australia and New Zealand ................................................................ 149,097 106,866 5,724 4,517
China and other Asia ........................................................................... 4,044 2,745 1,774 (1,777)
UK and USA.......................................................................................... 1,929 1,108 (7,653) (2,178)
Corporate and other ........................................................................... 39 126 3,284 3,004
Segment revenue & EBITDA 155,109 110,845 3,129 3,566
Net Interest income ............................................................................ 101 415
Share in associate/joint venture losses ............................................ – (1,361)
Depreciation and amortisation .......................................................... (1,949) (1,900)
Income tax income/(expense) ............................................................ (3,372) (710)
Consolidated segment profit/(loss) (2,091) 10
Over 67% of milk and infant formula sales come from three customers. (2014: over 86% from three customers)
24Represents sales and other revenue25Segment EBITDA for 2015 includes non-recurring ASX listing costs of $1,681,000
Notes to the financial statements
For the year ended 30 June 2015
26. OPERATING SEGMENT INFORMATION CONT.
Depreciation & amortisation
Additions to non-current assets
2015 $’000
2014 $’000
2015 $’000
2014 $’000
Australia and New Zealand ................................................................ 1,155 1,234 288 1,057
China and other Asia ........................................................................... 393 – 4 –
UK and USA.......................................................................................... 172 8 2,680 –
Corporate and other ........................................................................... 229 658 654 1,856
1,949 1,900 3,626 2,913
Assets Liabilities
2015 $’000
2014 $’000
2015 $’000
2014 $’000
Australia and New Zealand ................................................................ 47,969 45,172 14,691 9,354
China and other Asia ........................................................................... 18,372 10,355 8,522 4,356
UK and USA.......................................................................................... 6,412 1,922 3,818 1,717
Corporate and other ........................................................................... 16,114 19,194 3,207 2,572
88,867 76,643 30,238 17,999
100 101
The a2 Milk Company 2014–15 Notes to the financial statements

Notes to the financial statements
For the year ended 30 June 2015
27. NOTES TO THE CASH FLOW STATEMENT
a. Reconciliation of net surplus/(deficit) after taxation with net cash flows from operating activities
2015
$’0002014
$’000
Net surplus/(deficit) for the year ....................................................................................................... (2,091) 10
Adjustments for non-cash items:
Depreciation & amortisation expense ............................................................................................... 1,949 1,900
Loss on disposal ................................................................................................................................. 17 –
Expense recognised in profit & loss in respect of equity-settled share-based payments........... 1,083 1,190
Net foreign exchange gain .................................................................................................................. (1,732) (1,448)
Share of loss of associates/joint ventures ....................................................................................... – 1,361
Deferred tax ........................................................................................................................................ 849 66
75 3,079
Movements in working capital
(Increase) in trade and other receivables.......................................................................................... (12,586) (1,193)
(Increase)/decrease in prepayments ................................................................................................. (7,659) 827
Decrease/(increase) in inventories .................................................................................................... 737 (4,838)
Increase in accounts payable ............................................................................................................ 10,482 2,742
Increase/(decrease) in current tax liabilities .................................................................................... 820 (226)
(8,131) 391
Plus/(less) items classified as investing and financing activities:
Movement in non-current accounts payable .................................................................................... 65 44
Net cash inflow (outflow) from operating activities (8,066) 435
Notes to the financial statements
For the year ended 30 June 2015
28. FINANCIAL INSTRUMENTS
a. Financial risk management objectives
Exposure to credit, interest rate, foreign currency, equity price and liquidity risks arises in the normal course of the Group’s business.
The Group’s corporate treasury function provides services to the business, co-ordinates access to domestic and international financial markets, monitors and manages the financial risks relating to the operations of the Group through internal risk reports which analyse exposures by degree and magnitude of risks. These risks include market risk (including currency risk, fair value interest rate risk and price risk), credit risk, liquidity risk and cash flow interest rate risk.
The Group seeks to minimise the effects of these risks by reviewing compliance with policies and exposure limits on a continuous basis.
The Group does not enter into or trade financial instruments, including derivative financial instruments, for speculative purposes. Specific risk management objectives and policies are set out below.
b. Capital risk management
The Group manages its capital to ensure that entities in the Group will be able to continue as a going concern while maximising the return to stakeholders through the optimisation of the debt and equity balance.
The capital structure of the Group consists of cash and short term deposits, and equity attributable to equity holders of the parent comprising issued capital, retained earnings and reserves as disclosed in Notes 5, 12, 15, 16 and 17 respectively.
The Group is not subject to externally imposed capital requirements and the Group’s Board of Directors reviews the capital structure on a regular basis. As part of this review, the Board considers the cost of capital and the risks associated with each class of capital.
c. Categories of financial instruments
2015 $’000
2014 $’000
Financial assets
Trade and other receivables ............................................................................................................... 39,944 27,358
Cash and short term deposits............................................................................................................ 6,092 15,979
Financial liabilities at amortised cost
Trade creditors .................................................................................................................................... 15,178 8,391
d. Market risk
Market risk is the potential for change in the value of on and off balance sheet positions caused by a change in the value, volatility or relationship between market risks and prices. Market risk arises from the mismatch between assets and liabilities, both on and off balance sheet, and from controlled funding undertaken in pursuit of profit. The Group’s activities expose it to the financial risks of change in foreign currency exchange rates and interest rates (see (e), (f), and (g) below).
Market risk exposures continue to be monitored by management on an ongoing basis and there has been no change during the year to the Group’s exposure to market risks or the manner in which it manages and measures risk.
102 103
The a2 Milk Company 2014–15 Notes to the financial statements

Notes to the financial statements
For the year ended 30 June 2015
28. FINANCIAL INSTRUMENTS CONT.
e. Foreign currency risk management
In the course of normal trading activities, the Group undertakes transactions denominated in foreign currencies, hence exposures to exchange rate fluctuations arise. The Group does not hedge this risk.
The carrying amount of the Group’s foreign currency denominated financial instruments at the balance date are as follows:
2015 $’000
2014 $’000
US Dollars
Assets:
Cash and short term deposits............................................................................................................ 1,080 4,092
Accounts receivable ........................................................................................................................... 4,139 811
5,219 4,903
Liabilities:
Trade creditors .................................................................................................................................... 3,740 1,794
3,740 1,794
AUS Dollars
Assets:
Cash and short term deposits............................................................................................................ 4,225 11,772
Accounts receivable ........................................................................................................................... 33,862 25,287
38,087 37,059
Liabilities:
Trade creditors .................................................................................................................................... 12,647 8,348
12,647 8,348
GB Pounds
Assets:
Cash and short term deposits............................................................................................................ 293 38
Accounts receivable ........................................................................................................................... 763 380
1,056 418
Liabilities:
Trade creditors .................................................................................................................................... 2,486 1,677
2,486 1,677
The above tables express the foreign currency amounts in New Zealand dollar equivalents using the exchange rates at 30 June 2015 and 30 June 2014.
Notes to the financial statements
For the year ended 30 June 2015
28. FINANCIAL INSTRUMENTS CONT.
f. Foreign currency sensitivity analysis
The Group is exposed to foreign currency risk arising from revenues and costs denominated in currencies other than the Group’s functional currency. The majority of foreign currency related exposures relate to balances of inter-entity advances. The Group is mainly exposed to the currency of Australia (AUD), the currency of the United Kingdom (GBP) and the currency of the United States of America (USD).
The following table details the Group’s sensitivity to a 10% increase and decrease in the New Zealand dollar against the relevant foreign currencies. 10% is the sensitivity rate used when reporting foreign currency risk internally to key management personnel and represents management’s assessment of the reasonably possible change in foreign exchange rates. The sensitivity analysis includes only outstanding foreign currency denominated monetary items and adjusts their translation at the period end for a 10% change in foreign currency rates. The sensitivity analysis includes external bank accounts and external receivables as well as loans to foreign operations within the group where the denomination of the loan is in currency other than the currency of the lender or the borrower. A positive number below indicates an increase in profit where the New Zealand dollar strengthens 10% against the relevant currency and vice versa for a weakening of the New Zealand dollar.
2015 $’000
2014 $’000
Currency impact on profit or loss
Strengthening in NZD/AUD ................................................................................................................. (4) 4
Weakening in NZD/AUD....................................................................................................................... 4 (4)
Strengthening in NZD/GBP ................................................................................................................ 12 1
Weakening in NZD/GBP ...................................................................................................................... (12) (1)
Strengthening in NZD/USD ................................................................................................................ 232 311
Weakening in NZD/USD ...................................................................................................................... (232) (311)
Currency impact on equity
Strengthening in NZD/AUD ................................................................................................................. 4,288 4,948
Weakening in NZD/AUD....................................................................................................................... (4,288) (4,948)
Strengthening in NZD/USD ................................................................................................................ 266 311
Weakening in NZD/USD ...................................................................................................................... (266) (311)
Strengthening in NZD/GBP ................................................................................................................ (73) (85)
Weakening in NZD/GBP ...................................................................................................................... 73 85
In management’s opinion, the sensitivity analysis is unrepresentative of the inherent foreign exchange risk as the year end exposure does not reflect the exposure during the year. But with the continuing volatile global financial markets, management continue to monitor offshore monetary investments on a regular basis.
104 105
The a2 Milk Company 2014–15 Notes to the financial statements

Notes to the financial statements
For the year ended 30 June 2015
28. FINANCIAL INSTRUMENTS CONT.
g. Interest rate risk
The Group has been exposed to interest rate risk during the period as it invests cash on call at floating interest rates and cash in short term deposits at fixed interest rates.
The Directors consider that the Group’s sensitivity to a reasonably possible change in interest rates would not have a material impact on profit or equity.
h. Other price risk management
The Group is not exposed to equity price risks arising from equity investments. All equity investments are investments in 100% owned subsidiaries.
i. Credit risk management
Credit risk refers to the risk that a counter-party will default on its contractual obligations resulting in financial loss to the Group. The Group has adopted a policy of only dealing with creditworthy counterparties and obtaining sufficient collateral, where appropriate, as a means of mitigating the risk of financial loss from defaults. The Group only transacts with banks that are rated the equivalent of investment grade and above. The Group utilises information supplied by independent rating agencies where available and, if not available, the Group uses other publicly available financial information and its own trading records to rate its major customers.
The Group has credit risk exposure as a large portion of sales are to three customers. However this risk is mitigated as these customers are all creditworthy, have sufficient collateral and are not related entities.
Except as detailed in the following table, the carrying amount of financial assets recorded in the financial statements, which is net of impairment losses, represents the Group’s maximum exposure to credit risk without taking account of the value of any collateral obtained:
2015 $’000
2014 $’000
The maximum exposures to credit risk at balance date are:
Cash, short term deposits and short term borrowings .................................................................... 6,092 15,979
Trade and other receivables ............................................................................................................... 39,944 27,358
Prepayments ....................................................................................................................................... 9,651 1,992
55,687 45,329
At balance date, the Group’s bank accounts were held with National Australia Bank Limited, Bank of New Zealand Limited, Great Western Bank and Clydesdale Bank. The Group does not have any other concentrations of credit risk. The Group does not require any collateral or security to support financial instruments.
Notes to the financial statements
For the year ended 30 June 2015
28. FINANCIAL INSTRUMENTS CONT.
j. Liquidity risk management
Ultimate responsibility for liquidity risk management rests with the Board of Directors, who have built an appropriate liquidity risk management framework for the management of the Group’s short, medium and long-term funding and liquidity management requirements. The Group manages liquidity risk by maintaining adequate reserves by continuously monitoring forecast and actual cash flows and matching the maturity profiles of financial assets and liabilities.
The maturity profiles of the Group’s interest bearing investments are disclosed later in this note.
k. Liquidity & interest risk tables
The following tables detail the Group’s remaining contractual maturity for its non-derivative financial liabilities. The tables have been drawn up based on the undiscounted contractual maturities of financial liabilities including interest that will accrue to those assets or liabilities except where the Group is entitled and intends to repay a liability before its maturity. The tables also disclose those financial liabilities subject to interest rate risk.
Weighted average
effective interest rate
%
Fixed maturity dates
Less than 1 month
1–3 months
3 months – 1 year 1–5 years 5+ years Total
2015 $’000 $’000 $’000 $’000 $’000 $’000
Financial liabilities:
Trade creditors .............................. 12,994 2,184 – – – 15,178
12,994 2,184 – – – 15,178
Weighted average
effective interest rate
%
Fixed maturity dates
Less than 1 month
1–3 months
3 months – 1 year 1–5 years 5+ years Total
2014 $’000 $’000 $’000 $’000 $’000 $’000
Financial liabilities:
Trade creditors .............................. 8,391 – – – – 8,391
8,391 – – – – 8,391
106 107
The a2 Milk Company 2014–15 Notes to the financial statements

Company The a2 Milk Company Limited
Level 2788 Shortland StreetAuckland 1010New Zealand
New Zealand Share Registry
Link Market Services Limited
Victoria Street WestAuckland 1142New ZealandTelephone: +64 9 375 5998
Australian Share Registry
Link Market Services Limited
Sydney South NSW 1235AustraliaTelephone: +61 1300 554 474
Legal AdvisorsLevel 2788 Shortland StreetAuckland 1010New Zealand
Level 221 Martin PlaceSydney NSW 2000Australia
Financial Advisor Level 39
Vero Centre48 Shortland StreetAuckland 1010New Zealand
Auditor Ernst & Young
Sydney NSW 2000Australia
Bank
Sydney NSW 2000Australia
Registered office Level 27
88 Shortland StreetAuckland 1010New Zealand
Level 1180 Mount StreetNorth Sydney NSW 2060AustraliaTelephone: +61 2 9697 7000
Corporate website
www.thea2milkcompany.com
Corporate directory
108
The a2 Milk Company 2014–15


