142
Building the workforce to meet the economic and community needs of Western Australia. Annual Report 2015–16 Department of Training and Workforce Development
| Date post: | 10-Apr-2018 |
| Category: |
Documents |
| Upload: | duongthuan |
| View: | 220 times |
| Download: | 4 times |
Building the workforce to meet the economic and community needs of Western Australia.
Annual Report2015–16
Department of Training and Workforce Development
2015–16 Annual Report | 2
© Department of Training and Workforce Development
Reproductions of this work in whole or part for educational purposes, within an educational institution and on condition that it is not offered for sale, are permitted by the Department of Training and Workforce Development.
While every effort has been made to vet the contents of this report, it may contain references to, or images of, people who are now deceased. The Department of Training and Workforce Development regrets any offence this might cause.
The term ‘Aboriginal’ is intended to include reference to Torres Strait Islanders and Indigenous Australians.
The term ‘the Department’ refers to the Department of Training and Workforce Development.
This report was developed in line with the Public Sector Commission’s annual reporting framework for the 2015–2016 reporting year.
This report is also published on the Department’s website at dtwd.wa.gov.au and can be viewed in PDF format. Alternative formats are available on request.
Postal address:Locked Bag 16, Osborne Park Delivery Centre Osborne Park, WA 6916
Street address:Optima Centre – Building B 16 Parkland Road Osborne Park, WA 6017
T: 08 6551 5000 E: [email protected] W: dtwd.wa.gov.au
2015–16 Annual Report | 3
Statement of compliance 4
Training and Workforce Development in Western Australia 2015–16 5
Performance summary 6From the Director General 7
Focus 10
Framework 11
Finances 12
Agency overview 13Vision, mission and values 14
Corporate Executive in 2015–16 15
Organisational structure 16
Form and function 17
Operating environment 18National and State context 19
Stakeholder engagement 20
Agency performance 21Strategic Goal 1 22
Strategic Goal 2 26
Strategic Goal 3 35
Strategic Goal 4 43
Significant issues impacting on the agency 45
Disclosures and legal compliance 48Financial statements 49
Additional key performance indicators information 114
Certification of key performance indicators 114
Key outcome effectiveness indicators 115
Service efficiency indicators 116
Ministerial directives 120
Other financial disclosures 121
Pricing policies of services provided 121
Major capital works 122
Staffing 124
Employee profile 124
Staffing policies 125
Government policy requirements 130
Appendices 135Appendix 1: Corporate Executive 136
Appendix 2: Legislation 137
Appendix 3: Department services contact details 138
Appendix 4: Terms used in this report 139
Appendix 5: Acronyms 140
Appendix 6: Feedback form 141
Contents
2015–16 Annual Report | 4
For year ended 30 June 2016
Hon Liza Harvey MLA Deputy Premier; Minister for Police; Road Safety; Training and Workforce Development; Women’s Interests
In accordance with Section 63 of the Financial Management Act 2006, I hereby submit for your information and presentation to Parliament, the Annual Report of the Department of Training and Workforce Development for the financial year ended 30 June 2016.
The Annual Report has been prepared in accordance with the provisions of the Financial Management Act 2006.
DR RUTH SHEAN DIRECTOR GENERAL (ACCOUNTABLE AUTHORITY)
5 September 2016
Statement of compliance

2015–16 Annual Report | 5
Training and Workforce Development in Western Australia 2015–16
88% of VET graduates satisfied with the quality of training
Graduates employed or in further study88.8%
Overseas qualification assessments2 624
Qualifications awarded51 881
Apprentice and trainee completions14 663
Career and workforce development clients entering training, employment or a new career77%
5.8% of the population participated in training
Enrolments in priority training66%
Priority industry qualifications available148
Total enrolments 134 381 Apprentices and trainees in training38 103
Career and workforce development clients42 812
Regional44 800
Aboriginal11 379
Youth66 620
VET in Schools7 411
International enrolments in TAFE 11 531
63.5% of the population in the workforce
Total number of people employed1.344 million
Workforce participation rate67.4%
People in skilled occupations701 500
People in State priority occupations312 600
Net overseas migrationIncrease of 14 610
Largest industry employerhealth care and social assistance
Building a skilled workforce for the future
Qualifications and transitions for tomorrow
Training and careers for today

Performance summaryFrom the Director GeneralFocus FrameworkFinances
2015–16 Annual Report | 6

2015–16 Annual Report | 7
A key focus for 2015–16 has been the Training Sector Reform Project, the third of three major reforms since 2014.
Future Skills WA, a student centred approach to service delivery, was launched in 2014 to ensure people gain skills that lead to employment in areas required by industry. And also launched in 2014, the Independent Review of the Vocational Education and Training Sector – the Seares Review – set out a separate range of reforms for the Western Australian vocational education and training sector. Emeritus Professor Margaret Seares consulted extremely widely throughout the State seeking advice on directions for the Western Australian State training provider network.
The Seares report, among other things, specified that the State Training Board and the Department of Training and Workforce Development work with the Minister for Training and Workforce Development to provide clarity around the design of the State’s VET system and the Government’s expectations of that system over the next five years.
In 2015, the Minister for Training and Workforce Development, the Hon Liza Harvey MLA convened the Training Sector Reform Project to address this and other elements of the Seares Review. The Hon
Cheryl Edwardes, herself a former minister for training in the Western Australian Government, chaired the Project Steering Committee. With strategic and executive leadership from former Western Australian Under Treasurer John Langoulant, Ms Edwardes translated the general directions of the Seares Review into a blueprint for a new approach to the operations of the State’s 11 State training providers.
The recommendations were endorsed by State Government in February 2016.
The key change to the State’s TAFE arrangements has been streamlining the number of TAFE colleges from 11 to five and introducing arrangements which will see these colleges work more collaboratively than has previously occurred.
As the Report specifies, although the TAFE system had performed well against its counterparts in other states, there was need for structural improvement. The previous structure of 11 colleges was not capable of delivering high training system standards across the State. Several colleges had become too small in a rapidly growing market to respond effectively to changes in market circumstances. This was challenging their viability.
From the Director General
DR RUTH SHEANDIRECTOR GENERALDepartment of Training and Workforce Development
2015–16 Annual Report | 8
Streamlining the system to five colleges, with two in the metropolitan area and three regionally, will enable the colleges to offer broader and more diverse training programs. They will also have greater capability to respond to changes in demand for training.
The five TAFE colleges will also form a network that will be expected to engage with their local communities and industries to ensure programs are meeting emerging skill requirements, especially in regional areas. The 70 campuses themselves will not change their course delivery to students or their location. The administration function is being streamlined to create a more effective service.
New Governing Councils have been formed and Interim Managing Directors appointed, with substantive Managing Director appointments to be made early in the new financial year. The new TAFE structure commenced operating from 11 April 2016.
The TAFE system must now apply its resources to meet the skills needs of both students and industry by harnessing the collective strengths of the TAFE college network rather than seeing them in competition.
Consolidating the TAFE colleges will increase the sustainability of the VET sector. This will be achieved through the following strategies:
• The TAFE sector will increase student access to a broader range of high quality VET programs across Western Australia.
• The skills needs of industry and employment prospects of students will be enhanced through more coordinated delivery of training programs across the TAFE sector, in consultation with local industries and communities.
• Cost effective measures in delivering training and administration practices across the TAFE sector will be maximised through greater collaboration and adoption of best practice methods.
• The TAFE sector will develop more specialised programs and locations through the creation of Centres of Excellence to ensure highest standards of skill development.
• The viability of the three regional TAFE colleges will be strengthened through a broader range of training programs being delivered to a larger number of students.
• Collaboration across the VET sector will be enhanced through the provision of greater information on the activities of the TAFE colleges and clarification of their roles and responsibilities.
The five TAFE colleges:
2015–16 Annual Report | 9
The consolidation of the 11 former State training providers is but one area of reform. Other reforms related to governance and reporting, specialisation and collaboration, commercial activities, efficient operations and infrastructure. These reforms will be progressively implemented over the next two years.
Not surprisingly, since the commencement of the work on this project, the Department of Training and Workforce Development has been focused on the planning and implementation of this major and complex reform. More recently, the Managing Directors and staff from the five new TAFE colleges have also been actively involved.
I am very grateful to all of those who have worked hard on this challenge. They include my senior colleagues at the Department and indeed the whole DTWD team. They also include all those in the TAFE sector, and especially the Managing Directors of all 11 former colleges. As ever, the work of the last financial year has been the result of collaboration from a wider group of stakeholders – colleagues from other government departments, private training providers and industry training councils to name but a few.
Of course, while some days it might feel as if the Training Sector Reform Project is our core business, it is but one of many ongoing work areas within the Department. This annual report outlines those areas, their scope and achievements. A strong, vibrant VET sector is dependent upon the strong and vibrant contributions of all. Thank you for your commitment and effort over the last year. We look forward to working with you in the years ahead.
DR RUTH SHEANDIRECTOR GENERAL
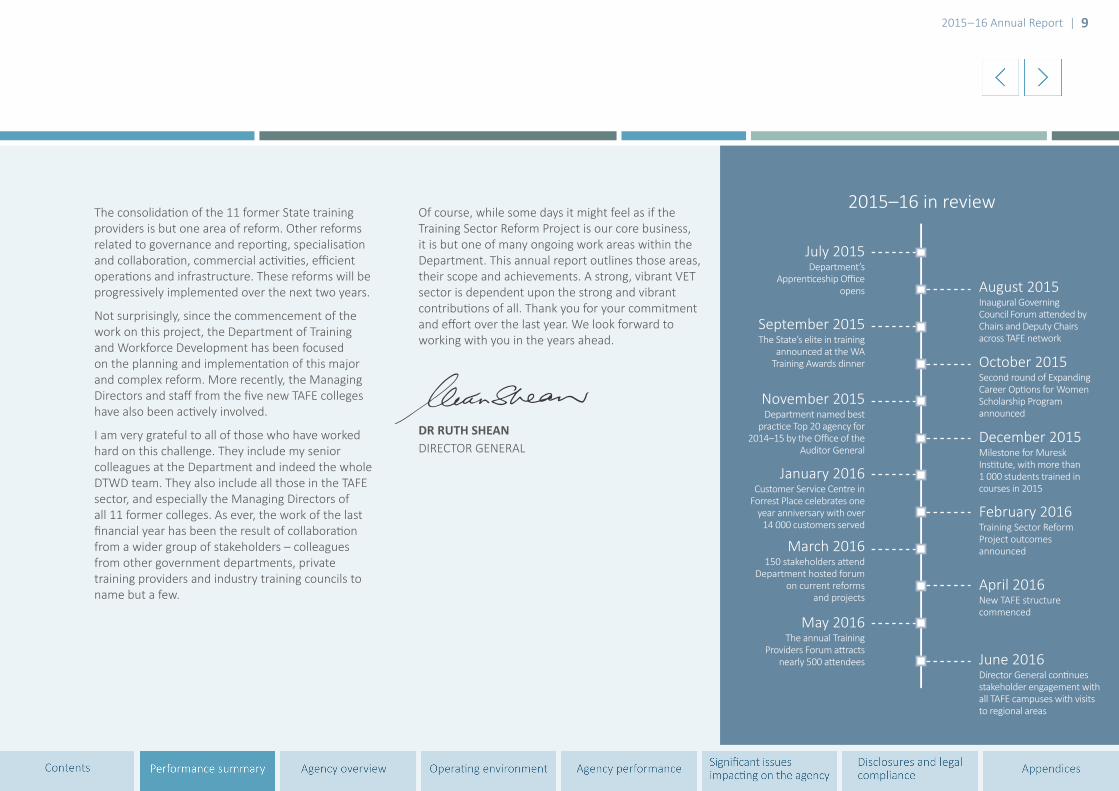
July 2015Department’s
Apprenticeship Office opens
September 2015The State’s elite in training
announced at the WA Training Awards dinner
November 2015Department named best
practice Top 20 agency for 2014–15 by the Office of the
Auditor General
January 2016 Customer Service Centre in
Forrest Place celebrates one year anniversary with over
14 000 customers served
March 2016150 stakeholders attend
Department hosted forum on current reforms
and projects
May 2016 The annual Training
Providers Forum attracts nearly 500 attendees
August 2015Inaugural Governing Council Forum attended by Chairs and Deputy Chairs across TAFE network
October 2015Second round of Expanding Career Options for Women Scholarship Program announced
December 2015 Milestone for Muresk Institute, with more than 1 000 students trained in courses in 2015
February 2016Training Sector Reform Project outcomes announced
April 2016New TAFE structure commenced
June 2016Director General continues stakeholder engagement with all TAFE campuses with visits to regional areas
2015–16 in review
2015–16 Annual Report | 10
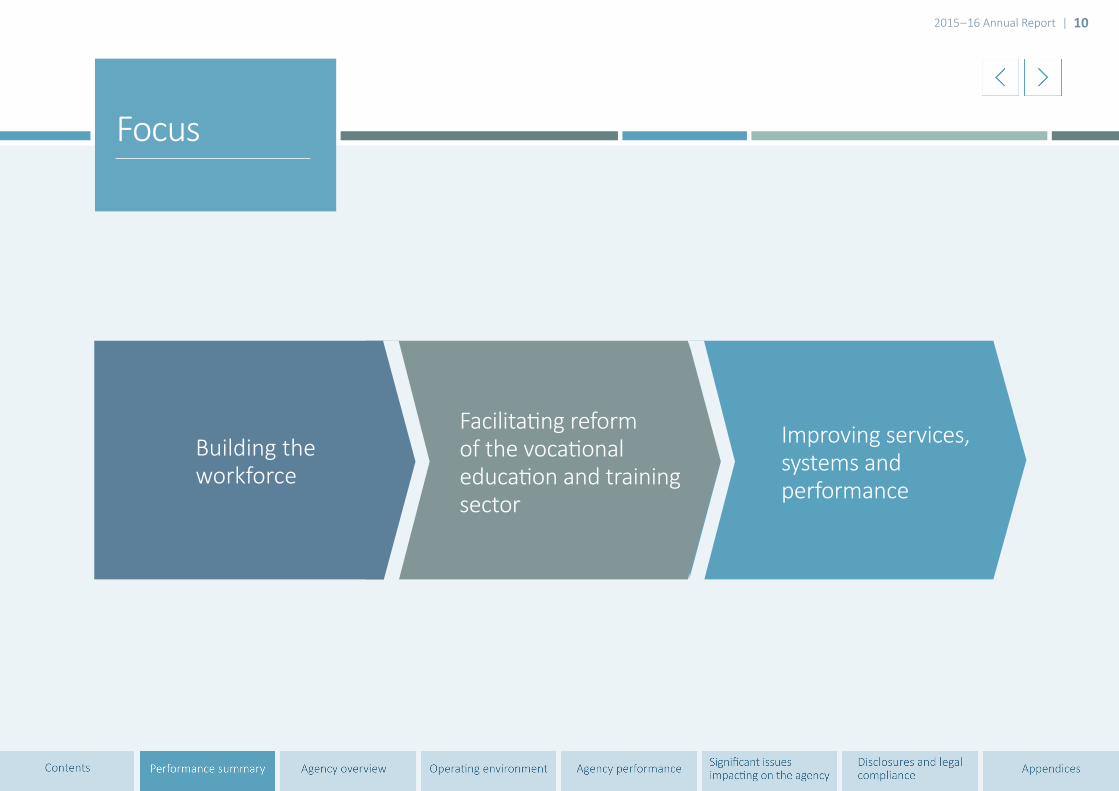
Improving services, systems and performance
Focus
Building the workforce
Facilitating reform of the vocational education and training sector
2015–16 Annual Report | 11
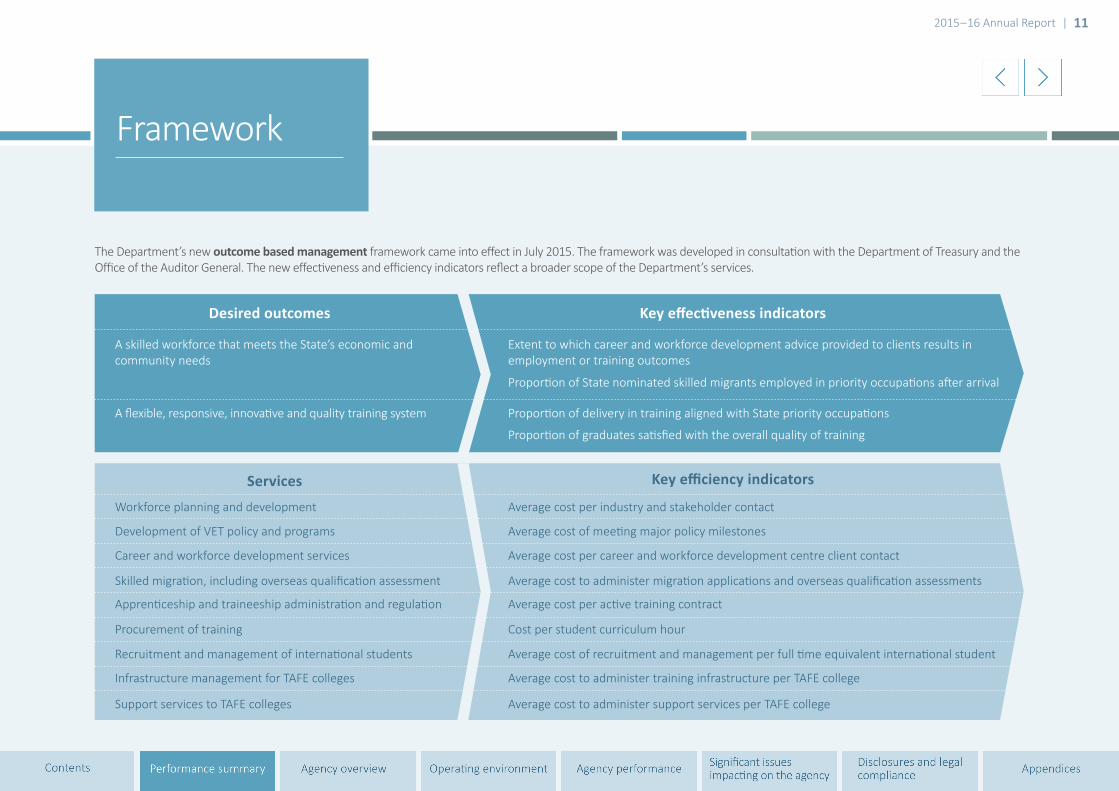
The Department’s new outcome based management framework came into effect in July 2015. The framework was developed in consultation with the Department of Treasury and the Office of the Auditor General. The new effectiveness and efficiency indicators reflect a broader scope of the Department’s services.
Framework
A skilled workforce that meets the State’s economic and community needs
Workforce planning and development Average cost per industry and stakeholder contact
Development of VET policy and programs Average cost of meeting major policy milestones
Career and workforce development services Average cost per career and workforce development centre client contact
Skilled migration, including overseas qualification assessment Average cost to administer migration applications and overseas qualification assessments
Apprenticeship and traineeship administration and regulation Average cost per active training contract
Procurement of training Cost per student curriculum hour
Recruitment and management of international students Average cost of recruitment and management per full time equivalent international student
Infrastructure management for TAFE colleges Average cost to administer training infrastructure per TAFE college
Support services to TAFE colleges Average cost to administer support services per TAFE college
Extent to which career and workforce development advice provided to clients results in employment or training outcomes
Proportion of delivery in training aligned with State priority occupations
Proportion of graduates satisfied with the overall quality of training
Proportion of State nominated skilled migrants employed in priority occupations after arrival
A flexible, responsive, innovative and quality training system
Desired outcomes
Services
Key effectiveness indicators
Key efficiency indicators
2015–16 Annual Report | 12
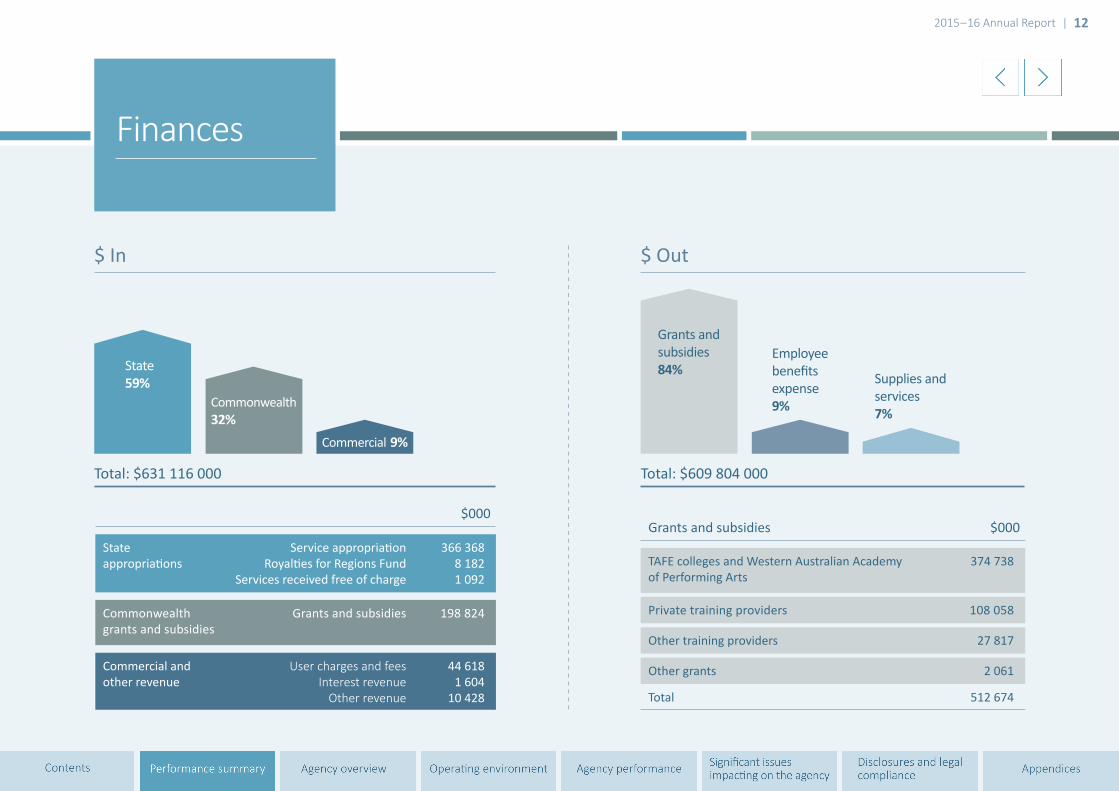
Finances
Total: $631 116 000 Total: $609 804 000
Grants and subsidies 84%State
59%
Commercial 9%
Commonwealth32%
Supplies and services 7%
Employee benefits expense 9%
$000
State appropriations
Service appropriationRoyalties for Regions Fund
Services received free of charge
366 3688 1821 092
Commonwealth grants and subsidies
Grants and subsidies 198 824
Commercial and other revenue
User charges and feesInterest revenue
Other revenue
44 6181 604
10 428
Grants and subsidies $000
TAFE colleges and Western Australian Academy of Performing Arts
374 738
Private training providers 108 058
Other training providers 27 817
Other grants 2 061
Total 512 674
$ In $ Out

2015–16 Annual Report | 13
Agency overviewVision, mission and valuesCorporate ExecutiveOrganisational structureForm and function
2015–16 Annual Report | 13
2015–16 Annual Report | 14
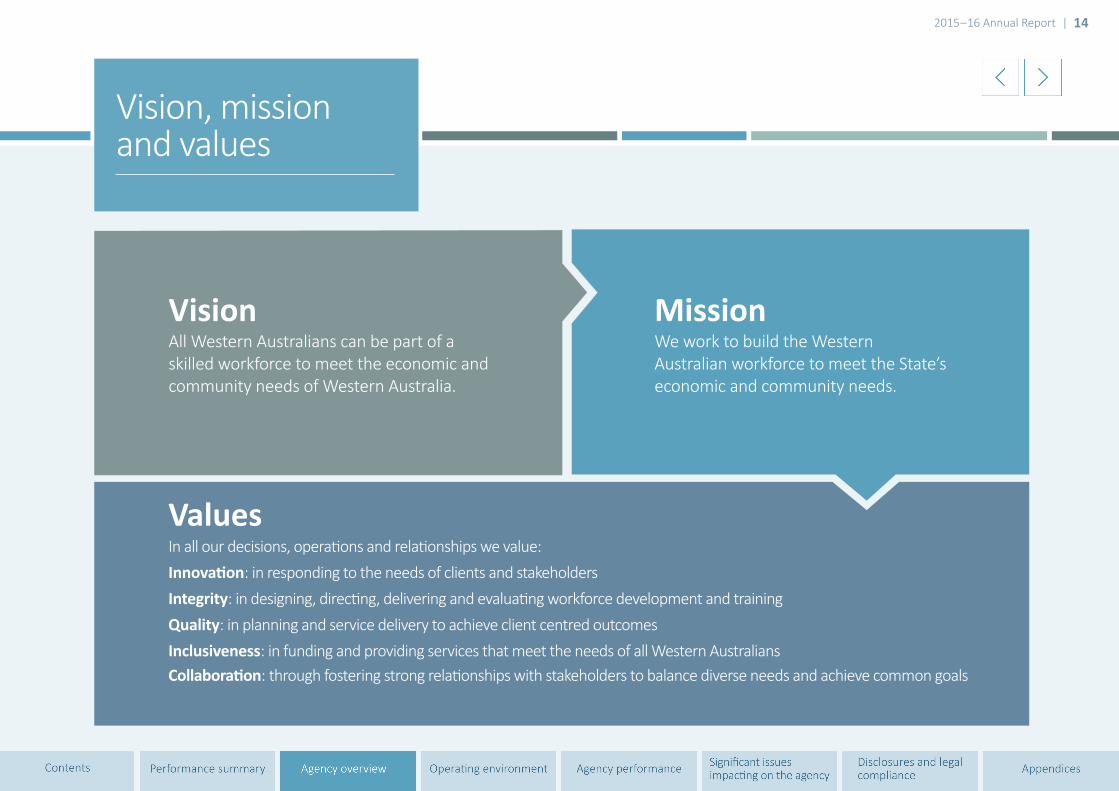
Vision All Western Australians can be part of a skilled workforce to meet the economic and community needs of Western Australia.
ValuesIn all our decisions, operations and relationships we value: Innovation: in responding to the needs of clients and stakeholdersIntegrity: in designing, directing, delivering and evaluating workforce development and training Quality: in planning and service delivery to achieve client centred outcomes Inclusiveness: in funding and providing services that meet the needs of all Western Australians Collaboration: through fostering strong relationships with stakeholders to balance diverse needs and achieve common goals
Mission We work to build the Western Australian workforce to meet the State’s economic and community needs.
Vision, mission and values
2015–16 Annual Report | 15
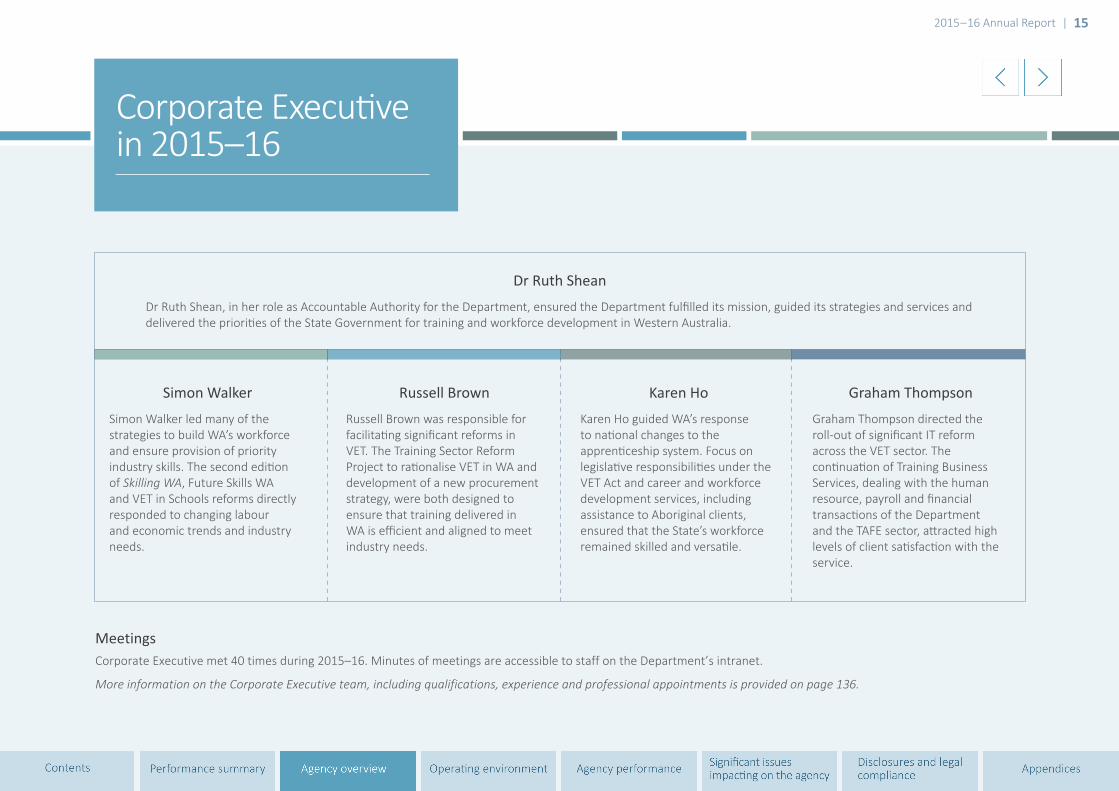
Corporate Executive in 2015–16
Dr Ruth Shean
Dr Ruth Shean, in her role as Accountable Authority for the Department, ensured the Department fulfilled its mission, guided its strategies and services and delivered the priorities of the State Government for training and workforce development in Western Australia.
Simon Walker
Simon Walker led many of the strategies to build WA’s workforce and ensure provision of priority industry skills. The second edition of Skilling WA, Future Skills WA and VET in Schools reforms directly responded to changing labour and economic trends and industry needs.
Karen Ho
Karen Ho guided WA’s response to national changes to the apprenticeship system. Focus on legislative responsibilities under the VET Act and career and workforce development services, including assistance to Aboriginal clients, ensured that the State’s workforce remained skilled and versatile.
Russell Brown
Russell Brown was responsible for facilitating significant reforms in VET. The Training Sector Reform Project to rationalise VET in WA and development of a new procurement strategy, were both designed to ensure that training delivered in WA is efficient and aligned to meet industry needs.
Graham Thompson
Graham Thompson directed the roll-out of significant IT reform across the VET sector. The continuation of Training Business Services, dealing with the human resource, payroll and financial transactions of the Department and the TAFE sector, attracted high levels of client satisfaction with the service.
MeetingsCorporate Executive met 40 times during 2015–16. Minutes of meetings are accessible to staff on the Department’s intranet.
More information on the Corporate Executive team, including qualifications, experience and professional appointments is provided on page 136.

2015–16 Annual Report | 16
Organisational structure
Director GeneralDr Ruth Shean
Policy Planning and InnovationSimon WalkerExecutive Director
Policy Planning and ResearchDr Ross KellyDirector
State Workforce PlanningGary FitzgeraldDirector
Office of the State Training BoardKathy HoareDirector
Performance Evaluation and StatisticsMark BloomfieldDirector
Service Resource ManagementRussell BrownExecutive Director
Training Resource AllocationKevin CoombesDirector
Procurement StrategyGeoff HoldenDirector
Muresk InstitutePrue JenkinsGeneral Manager
Training Infrastructure ManagementHelen Smart Director
Service Delivery OperationsJodie WallaceDirector
Migration ServicesPeta Pollock – A/ManagerCareer CentrePeta Pollock – ManagerTraining Sector ServicesFritzi Krogel – A/Director
Business Improvement and ReportingDeborah Myers – A/Manager
Finance Sector ServicesGabriel See – A/Director
Human Resources Sector ServicesDave Sale – A/Director
ICT Business SystemsCaroline Niewiarowski-Fish Director
ICT Portfolio OfficeRob Mitchell – Manager
ICT Service and Information ManagementDave Wimbridge – Director
ICT Infrastructure and OperationsEd Harris – A/Director
Service Delivery StrategyPhilip WylesDirector
Apprenticeship OfficeAngela Chen – DirectorAWDCJason Cottier – Director
TAFE International WACarmen BroderickDirector
Human ResourcesPeter WishartDirector
Finance ServicesSatvinder SekhonA/Director
Information and Communications TechnologyDarren PointerA/Director
Training Business ServicesGlenda HuskDirector
Communications Executive Services Internal Audit
Service DeliveryKaren HoExecutive Director
CorporateGraham ThompsonExecutive Director
Office of the Director GeneralPhil TorrisiDirector
2015–16 Annual Report | 17
The Department of Training and Workforce Development:
• builds the Western Australian workforce to meetthe State’s economic and community needs; and
• delivers a high performance vocational educationand training sector for all Western Australians.
Functions are directly aligned to the Strategic Plan 2014–18 and the goals of Skilling WA, a whole of government plan for Western Australia’s workforce of 1.3 million people.
The Department is structured around a funder/purchaser/provider model, where the funder of a service is distanced from both the purchaser and the provider of that service. The model increases client responsiveness, transparency and accountability.
Funder sections determine how the Department’s funding will be allocated.
Purchaser sections procure the services to meet the needs identified.
Provider sections deliver services directly to the community.
The Corporate directorate ensures that the Department’s financial, physical and information and communications technology resources are managed efficiently and in an open, transparent and accountable manner.
Responsible MinisterThe Department is responsible to the Minister for Training and Workforce Development, Hon Liza Harvey MLA.
Enabling legislationThe Department was established on 30 October 2009, under section 35 of the Public Sector Management Act 1994.
Administered legislation*The Vocational Education and Training Act 1996 is administered by the Minister for Training and Workforce Development with the assistance of the Department.
State Government goalsThe Department’s outcomes directly assist the State Government to achieve its goals of:
• results-based service delivery: greater focus onachieving results in key service delivery areas, forthe benefit of all Western Australians; and
• stronger focus on the regions: greater focus onservice delivery, infrastructure investment andeconomic development to improve the overallquality of life in remote and regional areas.
*The Department complies with a range of national and state legislation. Please see page 137 for the full list.
Form and function

Operating environmentNational and State contextStakeholder engagement
2015–16 Annual Report | 18
2015–16 Annual Report | 19
A key focus of Commonwealth and State Governments for 2015–16 was the reform of the vocational education and training sector to provide higher quality relevant VET services and maintain a skilled and flexible workforce.
National During 2015–16, the Council of Australian Governments Industry and Skills Council and its sub-committees, developed a VET Reform agenda.
Through representation of the Minister for Training and Workforce Development and senior Department officials, the Department provided input and advice on key reform areas, including:
• reform of training packages and accredited courses;
• review of VET FEE-HELP funding;
• effective VET regulation;
• improving the quality of assessment in the VET sector; and
• better student information and data to VET consumers.
StateWestern Australia’s economy continues to experience the effects of the post resource sector investment downturn, with soft overall labour market conditions common across the State. Weak employment growth of 0.1% over the past year has been mainly concentrated in part time positions, while youth unemployment has tracked higher.
Despite such challenges, the need to address longer term workforce issues such as the State’s ageing population and specific skills requirements are still present, with the need for priority skills continuing to be identified in sectors such as Health and Community Services, Education and Training, and many others.
In addition, it is expected that across the globe, most employers will increasingly look for applicants who hold some level of post school qualifications, and who have higher skill levels. The State Priority Occupation List has helped to guide purchasing of publicly-funded training and inform State nominated migration to continue to build the Western Australian workforce. Future Skills WA has been effective in increasing accessibility to subsidised priority training and matching students with skills in demand.
Significant reform of Western Australia’s public training sector in February 2016 was aimed at ensuring the sustainability of TAFE colleges and the provision of high quality training.
National and State context
2015–16 Annual Report | 20
Consultation and engagement with stakeholders is part of the Department’s corporate culture. Vocational education and training reform at both national and State level in 2015–16 called for continuing consultation and collaboration.
Meetings with key stakeholders included:
• Training Sector Reform Project (and other issues) – 160 participants
• VET in Schools Qualifications Register – 10 training councils
• TAFE Governing Councils – 22 participants
• Industry training advisory arrangements – 54 participants
• Training Together – Working Together Director General forum – 46 participants
• Government Building Training Policy – 165 participants
• Aboriginal Training and Employment providers – 8 participants
• VET sector capability – 96 sessions
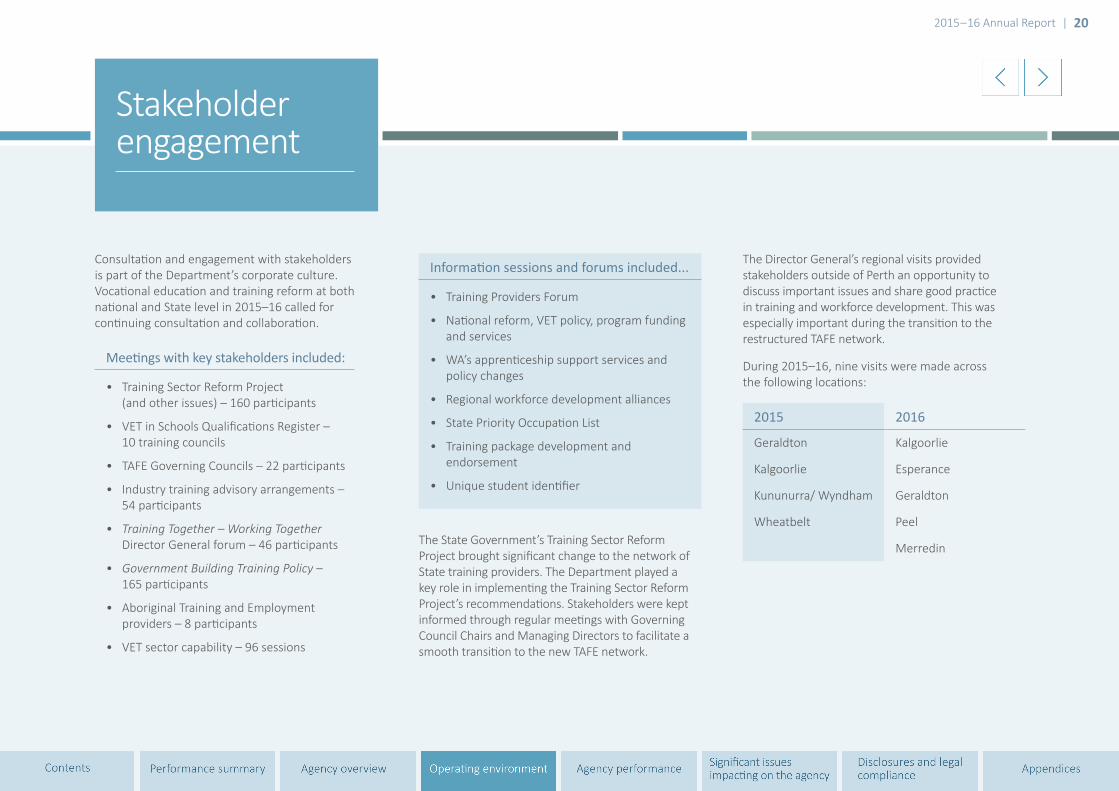
The Director General’s regional visits provided stakeholders outside of Perth an opportunity to discuss important issues and share good practice in training and workforce development. This was especially important during the transition to the restructured TAFE network.
During 2015–16, nine visits were made across the following locations:
2015 2016
Geraldton Kalgoorlie
Kalgoorlie Esperance
Kununurra/ Wyndham Geraldton
Wheatbelt Peel
Merredin
Information sessions and forums included...
• Training Providers Forum
• National reform, VET policy, program funding and services
• WA’s apprenticeship support services and policy changes
• Regional workforce development alliances
• State Priority Occupation List
• Training package development and endorsement
• Unique student identifier
The State Government’s Training Sector Reform Project brought significant change to the network of State training providers. The Department played a key role in implementing the Training Sector Reform Project’s recommendations. Stakeholders were kept informed through regular meetings with Governing Council Chairs and Managing Directors to facilitate a smooth transition to the new TAFE network.
Stakeholder engagement

Agency performanceThe Department’s performance against the strategic goals
2015–16 Annual Report | 21
2015–16 Annual Report | 22
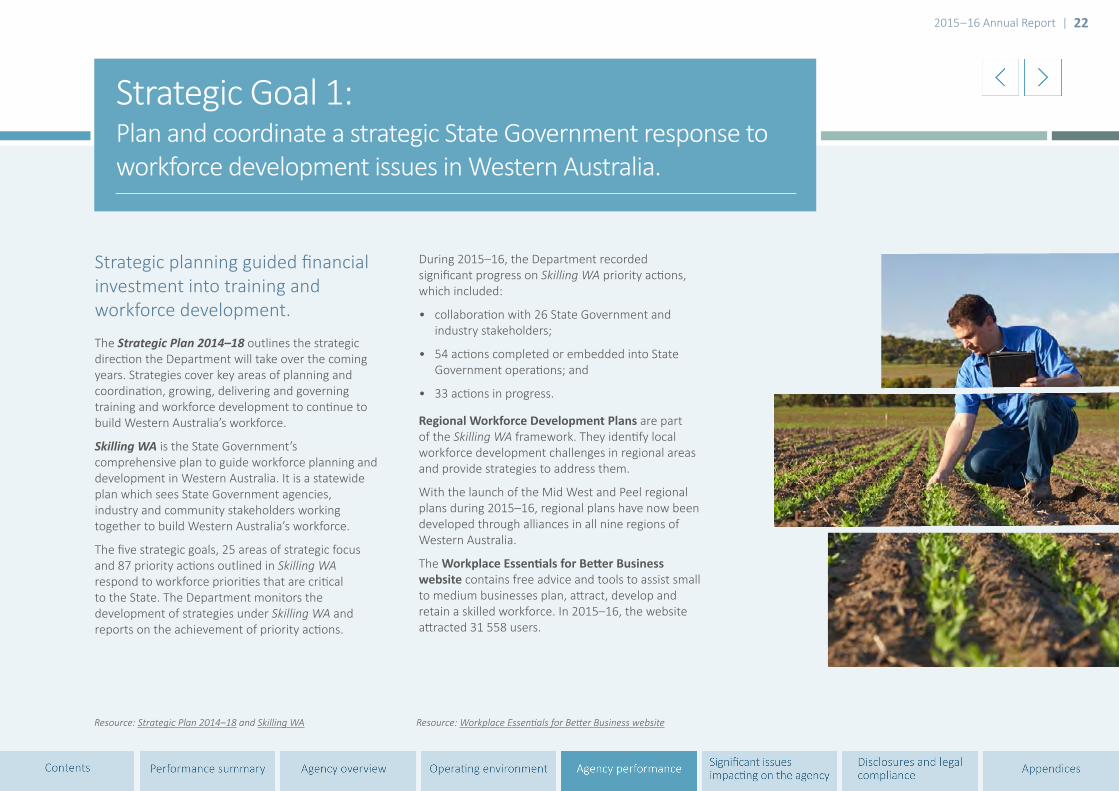
Strategic planning guided financial investment into training and workforce development.
The Strategic Plan 2014–18 outlines the strategic direction the Department will take over the coming years. Strategies cover key areas of planning and coordination, growing, delivering and governing training and workforce development to continue to build Western Australia’s workforce.
Skilling WA is the State Government’s comprehensive plan to guide workforce planning and development in Western Australia. It is a statewide plan which sees State Government agencies, industry and community stakeholders working together to build Western Australia’s workforce.
The five strategic goals, 25 areas of strategic focus and 87 priority actions outlined in Skilling WA respond to workforce priorities that are critical to the State. The Department monitors the development of strategies under Skilling WA and reports on the achievement of priority actions.
During 2015–16, the Department recorded significant progress on Skilling WA priority actions, which included:
• collaboration with 26 State Government and industry stakeholders;
• 54 actions completed or embedded into State Government operations; and
• 33 actions in progress.
Regional Workforce Development Plans are part of the Skilling WA framework. They identify local workforce development challenges in regional areas and provide strategies to address them.
With the launch of the Mid West and Peel regional plans during 2015–16, regional plans have now been developed through alliances in all nine regions of Western Australia.
The Workplace Essentials for Better Business website contains free advice and tools to assist small to medium businesses plan, attract, develop and retain a skilled workforce. In 2015–16, the website attracted 31 558 users.
Strategic Goal 1: Plan and coordinate a strategic State Government response to workforce development issues in Western Australia.
Resource: Strategic Plan 2014–18 and Skilling WA Resource: Workplace Essentials for Better Business website
2015–16 Annual Report | 23
In accordance with the Vocational Education and Training Act 1996, the Department developed the State Training Plan 2016–2019 on behalf of the State Training Board for submission to the Minister for Training and Workforce Development.
The plan is a key strategic document that identifies the State Government’s investment in the vocational education and training sector over a four year period.
The State Training Plan 2016–2019 identifies six broad priorities:
• ensuring that training delivery is focussed on occupations linked to growth industry sectors;
• increasing the pool of higher level qualifications;
• supporting young people to make an effective transition to employment or further education and training;
• increasing the skills of under-represented groups, including Aboriginal people, people with disability, mature aged workers and people in regional areas to improve participation in the workforce;
• up-skilling and reskilling workers to meet the requirements of structural change, the need for productivity, improvement and participation in innovation and technology; and
• continuing the emphasis on training for the health and community services sector to meet the needs of an ageing population.
These priorities take into account current State and national VET priorities and strategies.
The State Priority Occupation List is an annually produced list of occupations which are rated according to their identified priority status in Western Australia. It is a key influence in determining the level of State Government subsidy through Future Skills WA.
The SPOL also informs workforce development planning and the State Training Plan and is used both internally and externally as a Western Australian labour market evidence base.
The SPOL is structured around three key indicators:
• the level of criticality of an occupation to WA industry and/or the wider economy;
• whether there is evidence of unmet demand in the labour market; and/or
• the existence of other non-market factors which may impact upon training or migration requirements (for example changes in regulations and/or licensing arrangements).
The SPOL is also used in developing the Western Australian Skilled Migration Occupation List. The WASMOL identifies those occupations which are industry-critical and/or have unmet demand, and guides the State-nominated migration program to ensure it targets those highly-skilled jobs that cannot be easily filled locally.
Resource: WA Skilled Migration Occupation list Resource: State priority occupation list
The State Priority Occupation List informs workforce development planning and is used as a key source of labour
market evidence.

2015–16 Annual Report | 24
Centre for Health Industries Training and WorkforceDevelopment at Central Regional TAFE’s Geraldton Campus.
$16.72 million
Major refurbishment to create a simulated hospital teaching space at McLarty Avenue, Joondalup campus. This was a component of an overall campus refurbishment ($6 million) to bring facilities up to industry and occupational health and safety standards.
$3.1 millionCompleted projects
Specialist Pilbara training facilities to provide a Health and Allied Services Training Centre at Pundulmurra campus and an Electrical and Instrumentation Centre of Specialisation at Karratha campus. Construction commenced early 2016.
$19.9 million
A new three storey training centre for Murdoch campus to accommodate programs relocating from Beaconsfield to enable the redevelopment of Fremantle campus. The new Murdoch training centre will house hairdressing, business and IT, community services and health, sports and lifestyle, and access and participation programs. Construction commenced in January 2016.
$39.9 million
A new specialist Engineering Centre at the Australian Centre for Energy and Process Training campus, Munster to expand the training capacity for the oil and gas industry. Planning commenced in 2015–16.
$14.4 million
Upgrades for ageing facilities at Pundulmurra campus, South Hedland and Karratha campus. Projects include a recently completed Industrial Skills Centre at Karratha campus. Final works to be completed by end of 2016.
$15.22 million
Refurbishment of the Goldfields Arts Centre to address electrical, structural and universal access issues and some modernising of front of house facilities and the facade were undertaken.
$5 million
In progress
*The status of these projects reflects progress in relation to the completion and occupation of the building. Projects in the Major Capital Projects section (page 122) include all capital works projects that have recorded expenditure against them in the financial year.
The preparation of a State Training Asset Management Plan is a requirement of the Department of Treasury. The STAMP is used to recommend infrastructure funding proposals to the State Government which are strategically important
for the State training sector to enhance the training capacity of TAFE campuses.
The Department works closely with TAFE colleges to identify priority infrastructure requirements and critical remedial works to support quality training
delivery and workforce development needs. The STAMP includes the Goldfields Arts Centre which is within the Department’s property portfolio.
Major construction projects funded* for 2015–16 included the following:

2015–16 Annual Report | 25
Partnerships and alliances with government, industry and the community were essential in planning and service delivery.
The ten Industry Training Councils provide strategic information and advice to the Western Australian Government, the Department and State Training Board on the workforce development and vocational education and training needs of industry in Western Australia.
The Department works closely with the training councils and during 2015–16, they provided advice on a range of issues, including:
• occupations and skill demand;
• apprenticeships and traineeships;
• the development and review of training packages;
• VET in Schools;
• policy and planning;
• industry specific initiatives; and
• industry workforce development.
The Department works with 26 Skilling WA Partners on the framework for delivery of workforce planning and development in Western Australia.
Regional plans have been developed through Regional Workforce Development Alliances in all nine regions of Western Australia. The alliances provide leadership and oversight for the development and implementation of the regional workforce development plans. Members represent local business, industry groups, local governments, State government agencies and the local TAFE college.
Norman Baker, Chairperson of the Peel Workforce Development Alliance, and former Acting Chief Executive Officer of the Peel Development Commission, said he had been excited to lead the Peel Alliance.
“The Alliance, through its membership, has developed an extensive stakeholder network and strategic partnerships. Without these relationships and the collaboration that comes with them, the Alliance would be unable to achieve its aim of a skilled workforce which can respond to the region’s current and future workforce requirements.”
The State Training Board is the peak body that provides industry and training advice to the Minister for Training and Workforce Development in Western Australia.
The Office of the State Training Board provides high level strategic and administrative support to the board, including:
• managing:
▫ strategic projects on behalf of the STB;
▫ establishment and variation of apprenticeship processes;
▫ appeals against decisions of the Training Accreditation Council;
▫ STB recognition process for industry training councils; and
▫ collaboration between the STB, the industry training councils and the Department;
• organising six board meetings each year;
• preparing the STB’s annual report to Parliament; and
• providing a general coordination and administrative support role.
Resource: Quarterly labour market snapshot Resource: Annual labour market review
2015–16 Annual Report | 26
A Departmental staff member is located in the Western Australian Government’s European office in London, with the dual role of managing international student recruitment and promoting WA as a destination for skilled migration. This arrangement enables prospective migrants from the United Kingdom, Ireland and other European countries to learn more about the opportunities of migrating to Western Australia as they consider their migration preferences and decisions.
In 2015–16, 17 promotional activities and expos to promote Western Australia were conducted and attended.
Skilled migration helped to enhance, diversify and supplement the Western Australian workforce.
On 1 July 2015 the Department initiated a Settlement Service for Skilled Migrants in response to Skilling WA’s priority action regarding the Western Australian migration settlement program. The service provides recently arrived skilled migrants and their dependants with information, referrals and advice to assist them with settling in Western Australia. This includes assistance with finding accommodation, employment and accessing health care. A comprehensive guide to assist skilled migrants to settle in Western Australia is available on the Migration Portal.
Recently arrived skilled migrants can also phone or email the Migration Services branch or visit the Department’s Customer Service Centre to receive settlement assistance. During 2015–16, 1 972 people were assisted through the service.
The Overseas Qualifications Unit provides comparative assessments of overseas qualifications against Australian qualification levels. This free service provided to onshore clients assures employers, professional associations and regulatory bodies that potential employees have a recognised level of education. The work of the OQU is integrated with the settlement service and assists clients with overseas qualifications who live in Western Australia to access education, training and employment. In 2015, the OQU completed 2 617 assessments for 2 020 applicants.
The Regional Sponsored Migration Scheme assists employers facing skills shortages in Western Australia. The Department continued its role as certifying body for the scheme during 2015–16.
Through an agreement with the Commonwealth Government, the State Nominated Migration Program allows the State to nominate skilled workers for a permanent visa in priority occupations. In 2015–16, the Department issued 348 State nominations.
Strategic Goal 2: Western Australia’s workforce needs are met through attraction, retention, participation and skilled migration strategies.
Resource: Overseas Qualifications Unit website

2015–16 Annual Report | 27
“The Whadjuk Noongar people are recognised as the traditional custodians of the lands and waters of the Perth region. Naming a room in their language shows respect for the traditional owners, and helps to raise awareness among staff and customers of the importance of Aboriginal heritage.”Philip Wyles, Director of Service Delivery Strategy.
Customer service centreDuring 2015–16, 13 764 people were assisted by the Department’s Customer Service Centre, which operates from Forrest Place in Perth.
The Centre celebrated its first year at the new premises where four key Department services are located: the Career Centre, TAFE International WA (formerly Education and Training International), Migration Services and the Perth Aboriginal Workforce Development Centre.
As part of a continuing commitment to promote understanding and respect for Aboriginal culture and language and consistent with the Department’s Reconciliation Action Plan a special effort has been made to make Aboriginal people feel welcome at the Centre.
The Centre’s large training room has been named ‘Ngala Maya Kadidjiny’, which means ‘our place for thinking, listening and learning’ in the Noongar language.
The AWDC often hosts large groups of Aboriginal jobseekers as well as interested employers and service providers and Ngala Maya Kadidjiny is an appropriate venue, as it also features some unique pieces of Aboriginal art and artefacts.
Since the new Centre was opened, there has been greater interaction and cross-referral between services, allowing the needs of customers to be met from the one location.
A key inclusion of the Centre is a concierge service which provides a personalised approach to ensure customers are directed to the most appropriate area. It has also allowed customers to learn more about Department services that are provided.
The Centre also provides a range of self-serve facilities which allow greater flexibility and assistance to customers. This has been helpful for many people when applying for jobs, and especially for those who have no online access at home.

2015–16 Annual Report | 28
The Department continued to fund and support strategies to increase participation in the workforce.
The Career Centre provides career information and guidance services to assist people of all ages to make informed career, employment, education and training decisions.
The Career Centre’s services can be accessed from anywhere in Western Australia through email, telephone, web chat and social media. Increasing numbers of client contacts have been handled efficiently with high levels of customer satisfaction recorded.
During 2015–16, the Career Centre provided training information and career guidance through 16 173 client contacts. In addition:
• Career guidance workshops were held for 10 school groups and 13 community groups, with a total of 294 participants.
• There were over 2.9 million visits to the Career Centre website, an increase of more than 25% from 2014–15.
Complementing the services of the Career Centre is a network of 11 Department-funded Workforce Development Centres which provide career development services across the State.
During 2015–16, 11 952 initial assessments were undertaken through the workforce development centres to identify client needs and 12 982 career guidance sessions were conducted.
The Participation Program aims to increase the participation of groups experiencing barriers to training or employment by providing additional support services to help engagement and retention of participants in training.
During 2015–16, case managers reported that support services such as mentoring, transport and provision of personal protective equipment improved the chances of participants completing a VET qualification and finding employment.
There were 5 942 course enrolments in 2015 in comparison with 4 545 recorded in 2014.
Resource: Career Centre website
Number of enrolments in the Participation Program
2014 2015
Aboriginal people 1 032 1 382
Culturally and Linguistically Diverse 743 1 148
Ex-offenders 16 14
Jobseekers 1 862 2 428
People with disability 134 189
Youth at risk 758 781
Total 4 545 5 942
Ninety five per cent of customers indicated
that they were satisfied with the assistance provided by Career
Centre staff.

2015–16 Annual Report | 29
Peel Workforce Development CentreA new workforce development centre in the Peel region provides local jobseekers with greater access to free career advice and services.
Jointly funded through the Department of Training and Workforce Development and the Royalties for Regions program, the centre aims to increase participation in the workforce, particularly among underemployed, disengaged and under-represented groups in the community.
It ensures local residents have access to meaningful training and career development opportunities, providing local services to support people of any age to make education, training and occupational choices and to manage their careers.
Local organisation, Bridging the Gap, delivers the services through a hub in Mandurah and outreach centres across
the region. Support is provided by way of guidance and assistance to develop a career action plan, school-based career development activities, and employability workshops.
The centre complements and works with existing employment and training support services in the region, enabling residents to tap into the career opportunities that are available throughout the State.
In addition to providing free career services, the Peel Workforce Development Centre will have a role in implementing relevant priority actions included in the Peel workforce development plan 2015–2018.
The launch of the Peel Workforce Development Centre in February 2016 was attended by Training and Workforce Development Minister Liza Harvey.
“The workforce development centre careers bus has been a particular success and has been exceptionally busy with the high demand from local high schools for career guidance workshops. We make sure the careers bus attends the local communities of Byford, Boddington, Pinjarra and Waroona each fortnight, with staff working closely with the local Community Resource Centres to promote workforce development centre services.” Laureen Weyell, Programs Manager at Bridging the Gap.

2015–16 Annual Report | 30
Aboriginal jobseekers were assisted into employment.
Now in its sixth year, the Training Together – Working Together strategy continues to assist Aboriginal people to participate in the workforce.
Following a review in 2014, further steps were identified and are being rolled out; in particular, a new focus on helping Aboriginal high school students to develop career plans and then transition to further education, training or work when they leave school.
The Aboriginal Training and Employment Program established in 2011, assists Aboriginal communities to develop and access locally based training and employment initiatives. The program is delivered by not for profit organisations whose services are procured by the Department. Flexible service agreements allow providers to tailor services to meet local individual and community needs.
ATE centres are located in the Pilbara, Wheatbelt, Peel and Great Southern regions.
In 2015–16, more than 1 000 Aboriginal people were assisted with training and employment through the ATE program.
Since its establishment in 2010, the network of Aboriginal Workforce Development Centres has helped to increase the participation of Aboriginal
people in the workforce. Developing and strengthening connections with employers and reducing barriers to employment are key strategies, with services including:
• advice to employers on recruitment andretention;
• linking employers with jobseekers and serviceproviders;
• liaison with schools; and
• career support.
AWDCs are located in Perth, Bunbury, Broome, Kalgoorlie and Geraldton.
In 2015–16, AWDCs assisted 331 Aboriginal jobseekers into employment or training and 310 employers with their Aboriginal employment strategies.
Major projects that met local Aboriginal workforce development priorities included:
• Bunbury Aboriginal mentoring support services($85 000); and
• Kwinana driver training program ($150 000).
Eighty three per cent of jobseekers were satisfied with AWDC services. The centres liaised with 318 service providers.
Resource: Aboriginal Workforce Development Centre jobs board
Choose a path
Skill up
Get a job
Information and resources
2015–16 Annual Report | 31
Vocational education and training in schools continued to increase participation in training.
Through Vocational Education and Training in Schools, secondary students are able to undertake a nationally recognised VET qualification while completing their Western Australian Certificate of Education.
During 2015, the total enrolments in VET in Schools was 7 411.
The VET in Schools top industries in 2015 were building construction, administrative services, and repair and maintenance. Around 30% of VET in Schools enrolments were in these industries.
Effective collaboration with all school sectors ensured that VET in Schools continued to increase skill levels amongst students and provide access to employment in industry priority occupations.
The quality and relevance of programs delivered in secondary schools were enhanced through maintenance of a VET in Schools Qualifications Register. The Register provides industry advice on the suitability of VET qualifications and delivery requirements to meet industry standards.
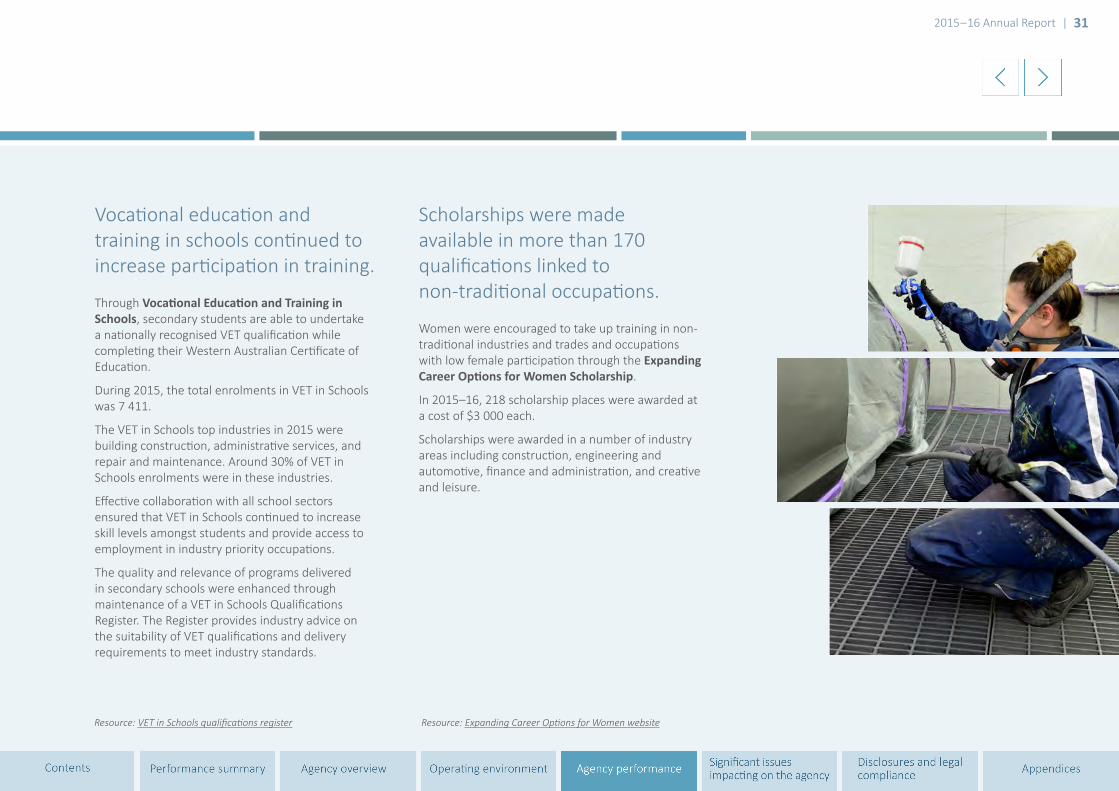
Scholarships were made available in more than 170 qualifications linked to non-traditional occupations.
Women were encouraged to take up training in non-traditional industries and trades and occupations with low female participation through the Expanding Career Options for Women Scholarship.
In 2015–16, 218 scholarship places were awarded at a cost of $3 000 each.
Scholarships were awarded in a number of industry areas including construction, engineering and automotive, finance and administration, and creative and leisure.
Resource: VET in Schools qualifications register Resource: Expanding Career Options for Women website

2015–16 Annual Report | 32
Expanding Career Options for WomenIn the second round of the Expanding Career Options for Women scholarship program, 118 women were awarded training scholarships to pursue careers in areas where women make up less than 25% of the total workforce.
“My lecturer encouraged me to apply for the scholarship,” says Amy Matthews, a student from South Regional TAFE who received a $3 000 scholarship.
“I am very grateful and happy that I did.”
Amy combines her studies with work in the viticulture industry. She also works with a local farmer to grow, sell and market produce at farmers markets throughout the Great Southern and South West regions.
Amy encourages other women to consider a non-traditional occupation and to apply for a scholarship when the next round opens.
The State Government has committed $1.2 million over four years to provide 400 scholarships to the value of $3 000 each. These are available to women who have left school to undertake training in an eligible qualification. Offers have also been made to employers to fund apprenticeship and traineeship places.
The program is now in its second year, with more than 200 scholarships offered through the program for training in 2015 and 2016.
Many of the scholarship recipients are keen to gain skills to get back into the workforce or to learn skills to pursue a new career.
Funds can be used towards costs associated with training, including learning resources, mentoring and fees, as well as for transport costs and childcare.
“The scholarship will enable me to pay my course fees and complete my Certificate III. I would also like to go on to a Certificate IV, and further my knowledge.”Amy Matthews, scholarship recipient.
2015–16 Annual Report | 33
The skills of Western Australians were showcased through international, national and State competitions.
The WA Training Awards recognise Western Australia’s outstanding achievements in vocational education and training. The program promotes apprenticeships, traineeships and the successful career pathways provided through VET courses. The Awards recognise the achievements of a diverse range of people, including those who are generally under-represented in the workforce – mature-aged students, people from culturally and linguistically diverse backgrounds and people of Aboriginal and Torres Strait Islander descent.
In 2016, there are 140 WA Training Award applicants across 13 award categories.
WA award winners will be announced at a presentation dinner in September 2016.
The Australian Training Awards are the peak national awards for the VET sector. These Awards are the culmination of the state and territory training award programs.
There were 10 Western Australian winners selected as finalists in the Australian Training Awards in 2015.
WA winners at the Australian Training Awards 2015 included:
• Jared Stone – Australian Apprentice of the Year 2015
• Sandra Van Der Gaag – Australian Apprentice (Trainee) of the Year 2015
• Crown Perth – Australian Employer of the Year 2015
• Clinipath Pathology – Australian Apprenticeships – Employer Award 2015
Western Australia tied with New South Wales to win four awards; the most awards of any state or territory.
During 2015–16, the Department continued to promote the skills and talents of Western Australians through WorldSkills competitions at regional, State, national and international levels, showcasing the vocational skills of Western Australians including those in occupations that are a priority for the State.
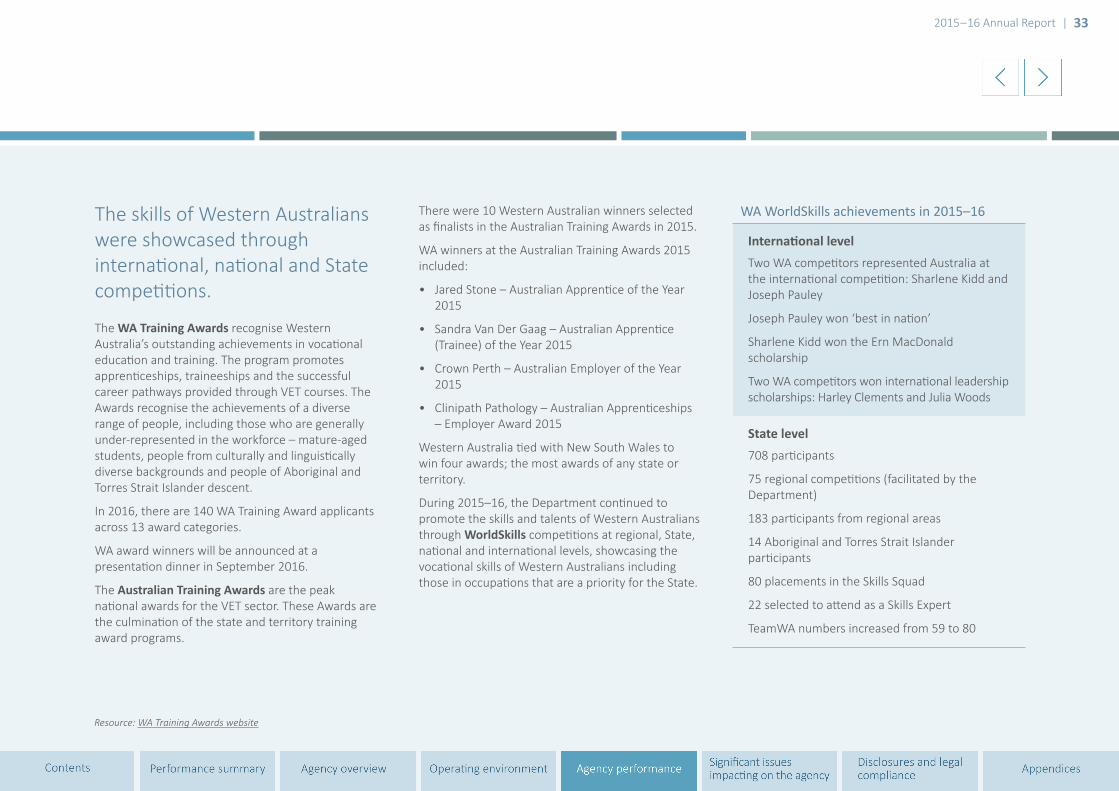
WA WorldSkills achievements in 2015–16
International levelTwo WA competitors represented Australia at the international competition: Sharlene Kidd and Joseph Pauley
Joseph Pauley won ‘best in nation’
Sharlene Kidd won the Ern MacDonald scholarship
Two WA competitors won international leadership scholarships: Harley Clements and Julia Woods
State level708 participants
75 regional competitions (facilitated by the Department)
183 participants from regional areas
14 Aboriginal and Torres Strait Islander participants
80 placements in the Skills Squad
22 selected to attend as a Skills Expert
TeamWA numbers increased from 59 to 80
Resource: WA Training Awards website

2015–16 Annual Report | 34
WA Training AwardsThe WA Training Awards is the State’s most prestigious training awards program, recognising outstanding achievements in the training sector.
Now celebrating 21 years, the Awards have showcased a range of Western Australians, including 124 individual winners and 143 winning organisations.
TAFE colleges have featured prominently in the Awards, with over 60% of applications coming from the TAFE sector each year. In the past nine years alone, 62 Awards (45 individual category winners and 17 organisation category winners) have been taken out by the TAFE network.
Durack Institute of Technology (now part of Central Regional TAFE) won three organisation awards over the past six years including WA Large Training Provider of the Year in 2010 and 2015, as well as the WA Training Initiative Award in 2013. Following the WA Training Awards presentation dinner in 2015, Durack’s Managing Director Bill Swetman
attributed their ongoing success to Durack’s passionate and creative staff.
“College staff are very passionate about what they do. They service a wide range of communities and because of that, they have to be very creative and committed to servicing regional and remote needs,” said Mr Swetman.
The 2016 Awards program started on a high note following the State’s success at the 2015 Australian Training Awards, where Western Australia tied with New South Wales to win the most awards of any state or territory.
The WA Training Awards team hopes to continue this momentum in 2016, particularly with more opportunities for applicants to be recognised both locally and nationally, and to serve in their role as ambassadors for training in Western Australia.
There are 13 categories in the WA Training Awards 2016 – eight individual categories and five for organisations.
A highlight from the 2015 awards was when police cadet Kahli King Elliott was named WA Aboriginal and Torres Strait Islander Student of the Year and received her award from the Deputy Premier and Minister for Training and Workforce Development, Liza Harvey, who is also the Minister for Police.
Photo courtesy of Tim Acker
2015–16 Annual Report | 35
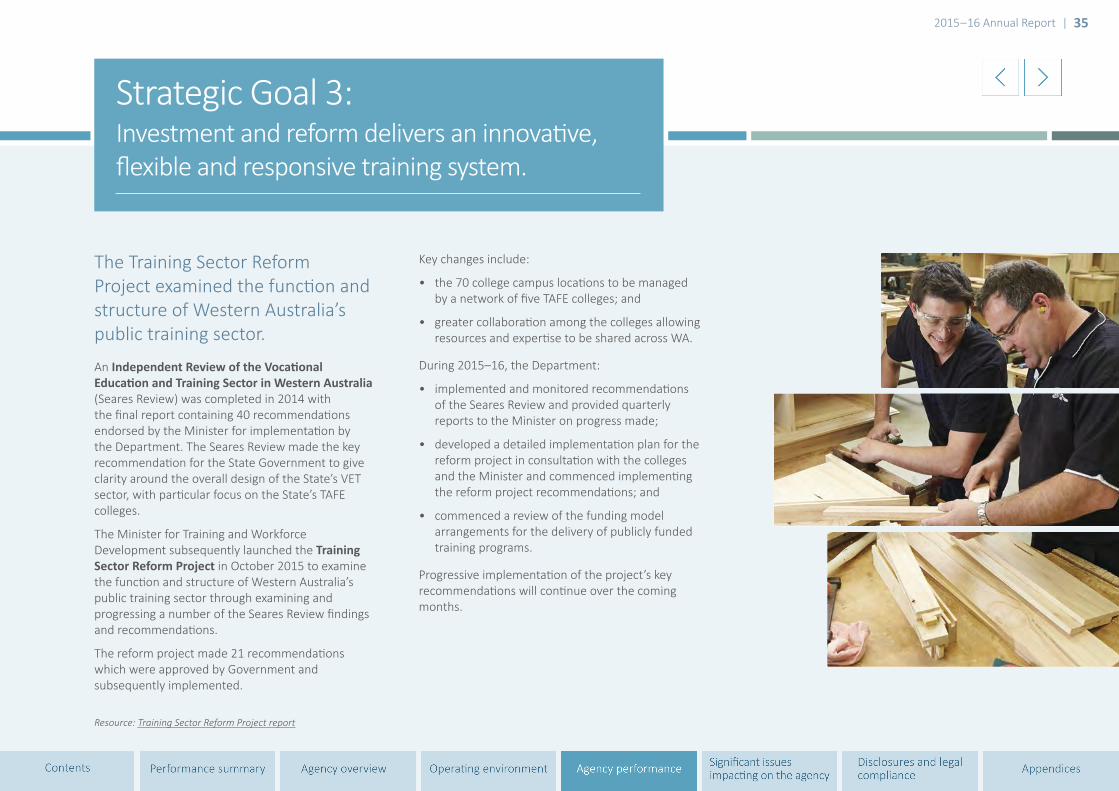
The Training Sector Reform Project examined the function and structure of Western Australia’s public training sector.
An Independent Review of the Vocational Education and Training Sector in Western Australia (Seares Review) was completed in 2014 with the final report containing 40 recommendations endorsed by the Minister for implementation by the Department. The Seares Review made the key recommendation for the State Government to give clarity around the overall design of the State’s VET sector, with particular focus on the State’s TAFE colleges.
The Minister for Training and Workforce Development subsequently launched the Training Sector Reform Project in October 2015 to examine the function and structure of Western Australia’s public training sector through examining and progressing a number of the Seares Review findings and recommendations.
The reform project made 21 recommendations which were approved by Government and subsequently implemented.
Key changes include:
• the 70 college campus locations to be managed by a network of five TAFE colleges; and
• greater collaboration among the colleges allowing resources and expertise to be shared across WA.
During 2015–16, the Department:
• implemented and monitored recommendations of the Seares Review and provided quarterly reports to the Minister on progress made;
• developed a detailed implementation plan for the reform project in consultation with the colleges and the Minister and commenced implementing the reform project recommendations; and
• commenced a review of the funding model arrangements for the delivery of publicly funded training programs.
Progressive implementation of the project’s key recommendations will continue over the coming months.
Strategic Goal 3: Investment and reform delivers an innovative, flexible and responsive training system.
Resource: Training Sector Reform Project report

2015–16 Annual Report | 36
The maps show the new structure for TAFE colleges towards which the Department and colleges have been working during the 2015–16 reporting year.
Note: Balga campus, Midland campus and Brigadoon Equine Centre will transfer from South Metropolitan TAFE to North Metropolitan TAFE on 1 January 2017.
New TAFE regions: metropolitanNew TAFE regions: non-metropolitan
2015–16 Annual Report | 37
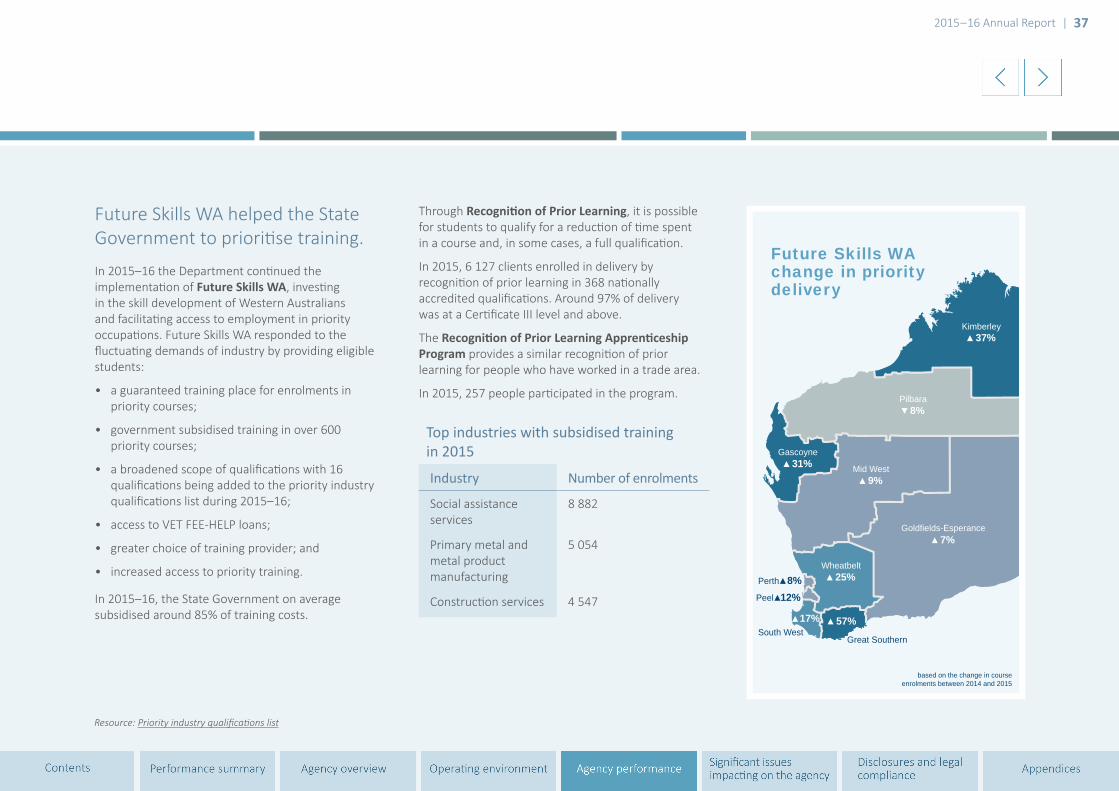
Future Skills WA helped the State Government to prioritise training.
In 2015–16 the Department continued the implementation of Future Skills WA, investing in the skill development of Western Australians and facilitating access to employment in priority occupations. Future Skills WA responded to the fluctuating demands of industry by providing eligible students:
• a guaranteed training place for enrolments in priority courses;
• government subsidised training in over 600 priority courses;
• a broadened scope of qualifications with 16 qualifications being added to the priority industry qualifications list during 2015–16;
• access to VET FEE-HELP loans;
• greater choice of training provider; and
• increased access to priority training.
In 2015–16, the State Government on average subsidised around 85% of training costs.
Through Recognition of Prior Learning, it is possible for students to qualify for a reduction of time spent in a course and, in some cases, a full qualification.
In 2015, 6 127 clients enrolled in delivery by recognition of prior learning in 368 nationally accredited qualifications. Around 97% of delivery was at a Certificate III level and above.
The Recognition of Prior Learning Apprenticeship Program provides a similar recognition of prior learning for people who have worked in a trade area.
In 2015, 257 people participated in the program.
Top industries with subsidised training in 2015
Industry Number of enrolments
Social assistance services
8 882
Primary metal and metal product manufacturing
5 054
Construction services 4 547
Resource: Priority industry qualifications list
Kimberley
Pilbara
Mid West
Gascoyne
Goldfields-Esperance
Wheatbelt
Great SouthernSouth West
Peel
Perth
37%
8%
9%
7%
31%
25%
57%17%
12%8%
Future Skills WAchange in prioritydelivery
based on the change in courseenrolments between 2014 and 2015

2015–16 Annual Report | 38
The Department played a central role in the governance of the TAFE college network.
TAFE College Governance included coordinating governing council representation, reporting, strategic planning and management of government investment in the TAFE sector.
During 2015–16, the Department managed the strategic and business planning process for TAFE colleges, including evaluation, quality assurance and risk management assessment.
VET sector reforms announced during the year led to an increased responsibility by the Department for TAFE Sector Governance.
Building on the reviews of the governing council handbook and reporting requirements conducted in the previous year, the following processes are being further streamlined in accordance with the recommendations of the Training Sector Reform project report:
• Ministerial authorisations and delegations;
• college strategic and annual business planning processes;
• governance maturity model; and
• governing council nomination guidelines.
Strategic investment continued to build the capacity of the VET sector.
Investment in building the capacity of the vocational education and training sector continued in 2015–16 through the provision of a range of professional development activities to TAFE colleges, registered training organisations and schools. In 2015–16, the Department conducted 117 professional development workshops including 62 webinars with a total of 1 298 participants.
Ninety nine per cent of survey participants reported they were satisfied with the professional development services provided.
In addition, the 2016 Training Providers Forum attracted 486 participants, representing TAFE and private training providers, industry, schools, universities and government. The key themes for this major professional development forum were national training package reforms, good teaching and assessment practice in VET, compliance and regulation, and innovation and technology.
International VET maintained its market share during 2015–16 with the Department providing a centralised recruitment and admissions function for international students across the TAFE sector. Courses offered range from Childcare, Hospitality and Tourism to Engineering, Maritime Operations and Aviation as well as English Language Intensive Courses for Overseas Students.
In 2015–16, Western Australia recorded 5 865 VET, higher education and ELICOS student enrolments.India, Vietnam, Malaysia, South Korea and China provided the highest number of student enrolments.
Resource: TAFE International WA website

2015–16 Annual Report | 39
Muresk progressed as a multi-tenanted, multi-use facility.
Muresk Institute has been rapidly transformed to become a hub for agricultural education, training and research and development under a range of innovative partnership models.
Since its return to the State Government from Curtin University in 2012, the number of courses has increased from three to 95 and the number of students increased from 44 to 1 610, indicating that the establishment of Muresk Institute as a multi-tenanted, multi-use facility has been successful and continues to grow.
Muresk has gained significant traction in becoming recognised as a major contributor towards meeting the demand for skilled workers in the agricultural sector. Industry has shown substantial support for the Muresk business model and the suite of training products and flexible delivery strategies.
Events at Muresk in 2015–16
Muresk Open Day
National Agricultural Educators Conference
Careers and Employment in Agriculture
Training at Muresk in 2015–16
Integrated Diploma Program delivered through the University of Queensland’s Gatton Vocational Education Centre
Bachelor of Agricultural Business Management (in partnership with Central Regional TAFE and Charles Sturt University)
Certificate IV Veterinary Nursing through Central Regional TAFE
Station hand courses through North Regional TAFE
A diverse range of industry-driven short courses and skills sets provided through South Regional TAFE and 27 other public and private training providers
Western Australia’s Murdoch and Curtin universities, partnering with Muresk for practical block release for students and research and development activities
Work experience and other initiatives on site supporting long term unemployed regional people, Aboriginal people and people with disability to achieve employment outcomes
Resource: Muresk Institute website
2015–16 Annual Report | 40
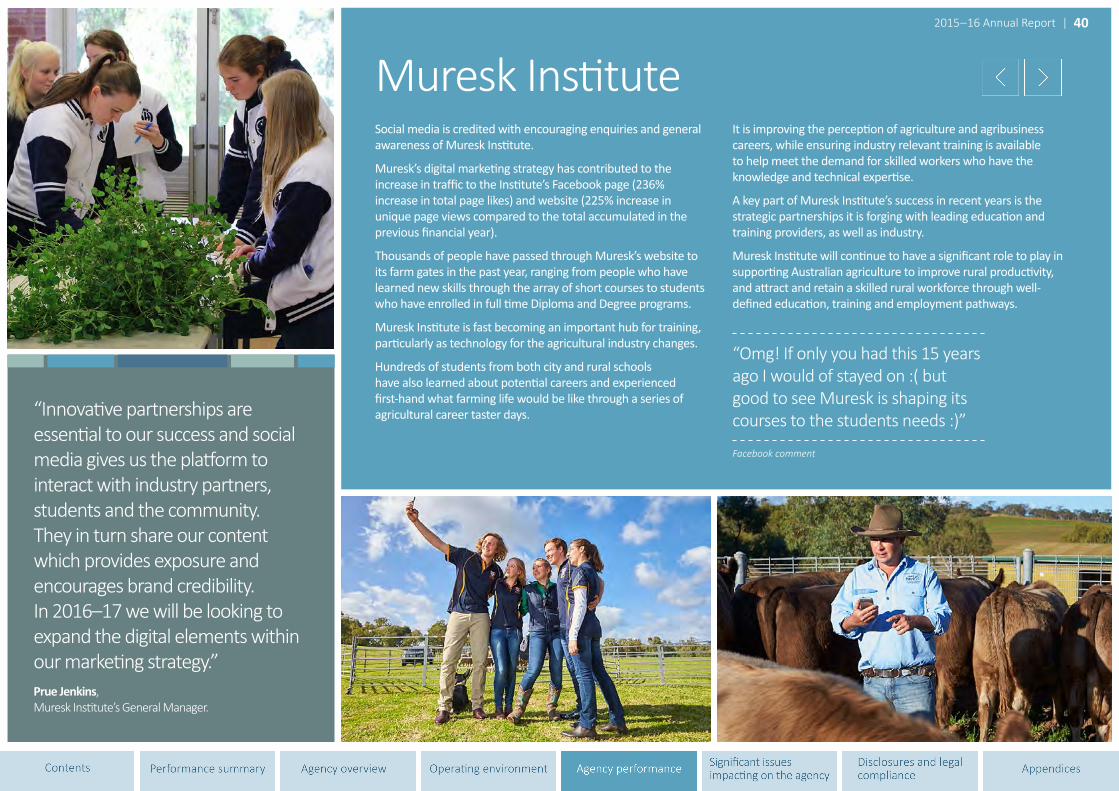
Muresk InstituteSocial media is credited with encouraging enquiries and general awareness of Muresk Institute.
Muresk’s digital marketing strategy has contributed to the increase in traffic to the Institute’s Facebook page (236% increase in total page likes) and website (225% increase in unique page views compared to the total accumulated in the previous financial year).
Thousands of people have passed through Muresk’s website to its farm gates in the past year, ranging from people who have learned new skills through the array of short courses to students who have enrolled in full time Diploma and Degree programs.
Muresk Institute is fast becoming an important hub for training, particularly as technology for the agricultural industry changes.
Hundreds of students from both city and rural schools have also learned about potential careers and experienced first-hand what farming life would be like through a series of agricultural career taster days.
It is improving the perception of agriculture and agribusiness careers, while ensuring industry relevant training is available to help meet the demand for skilled workers who have the knowledge and technical expertise.
A key part of Muresk Institute’s success in recent years is the strategic partnerships it is forging with leading education and training providers, as well as industry.
Muresk Institute will continue to have a significant role to play in supporting Australian agriculture to improve rural productivity, and attract and retain a skilled rural workforce through well-defined education, training and employment pathways.
“Innovative partnerships are essential to our success and social media gives us the platform to interact with industry partners, students and the community. They in turn share our content which provides exposure and encourages brand credibility. In 2016–17 we will be looking to expand the digital elements within our marketing strategy.”Prue Jenkins, Muresk Institute’s General Manager.
“Omg! If only you had this 15 years ago I would of stayed on :( but good to see Muresk is shaping its courses to the students needs :)”
Facebook comment
2015–16 Annual Report | 41
disability, school-based, regional and remote area apprentices and trainees.
In 2015–16, GTOs recorded:
• 995 apprenticeship commencements
• 1 053 traineeship commencements
In 2015–16, there were 27 GTOs operating in Western Australia.
Apprenticeships and traineeships helped build Western Australia’s workforce.
Following the establishment of the Commonwealth Government’s Australian Apprenticeship Support Network in July 2015, the Department reshaped its apprenticeship and traineeship services. The new Apprenticeship Office was established in July 2015 to regulate and administer training contracts under the Vocational Education and Training Act 1996. New activities and processes were introduced, designed to achieve two main objectives:
• the efficient administration of training contracts; and
• improvement in the quality and integrity of the apprenticeship system through targeted compliance activities.
During 2015–16, the Apprenticeship Office:
• registered 25 282 training contracts in total for apprenticeships (7 236) and traineeships (18 046);
• handled 22 578 phone enquiries;
• completed 461 training plan audits and recovered 4 760 overdue training plans;
• further assessed over 9 000 training contracts on registration eligibility; and
• contacted over 1 200 new employers of apprentices and trainees.
During 2015–16, the new Government Building Training Policy was introduced, to increase the overall number of apprentices and trainees in the building and construction industry. It replaced the Priority Start – Building Policy.
The new policy applies to State Government building, construction and maintenance contracts with an estimated labour value of $2 million and over. Tenders issued from 1 October 2015 are subject to the new policy.
Companies awarded these contracts are required to meet industry training benchmarks by employing sufficient numbers of apprentices and trainees.
Group Training Organisations employ apprentices and trainees and place them with host employers, giving businesses access to apprentices and trainees on a rotational basis without having to commit to a full term.
In June 2015, the Commonwealth government withdrew funding for the Joint Group Training Program. In response, a new State funded program, the Western Australian Group Training Program, was established on 1 July 2015 maintaining commitment to Aboriginal people, at risk students, people with
The Apprenticeship Office values feedback
and uses this information to improve services and
investigate potential issues or concerns.
Resource: Apprenticeship Office website
2015–16 Annual Report | 42 2015–16 Annual Report | 42
Full time students are able to undertake School-based Apprenticeships and Traineeships, with achievements contributing towards the Western Australian Certificate of Education.
During 2015–16, there were 1 518 commencements in school-based apprenticeships and traineeships, and 802 completions.
The numbers of young Aboriginal students undertaking training are increased through the Aboriginal School-based Training Program. The program provides an opportunity for Aboriginal students in years 10, 11 and 12 to start training while at school to gain a qualification or sustainable employment.
There are two pathways available in the program – an institutional based training pathway and an employment based training pathway. Students undertaking school-based apprenticeships and traineeships through the EBT pathway are supported by a group training organisation.
During 2015, there were:
• 253 Certificate I and 68 Certificate II enrolments in the ASBT IBT pathway.
During 2015–16, there were:
• 259 commencements in the ASBT EBT pathway.
Harmonisation of Australian Apprenticeships continued to be a key national strategy, with Western Australia implementing strategies against the seven principles to streamline the apprenticeship system, reducing red tape for employers and increasing mobility for apprentices and trainees.
During 2015–16, the Department progressed the alignment of nominal durations for 186 qualifications where Western Australia was inconsistent with other jurisdictions and worked with industry to ensure State specific requirements for nominal durations were maintained.
Apprenticeship and traineeship numbers were increased through the Travel and Accommodation Allowance which offers financial assistance to apprentices and trainees required to travel long distances to attend off the job training. The TAA continued to assist a significant number of apprentices and trainees and the doubling of the allowance from February 2015 was met within the existing budget.
Title
2015–16 Annual Report | 43
New training systems were developed.
The Department continued to support training and workforce development services through enhanced Information and Communication Technology Systems. Initiatives included the Training Systems for the Future Project, a multi-year program delivering contemporary, flexible and enterprise-scale systems that support the national vocational education and training reform agenda.
During 2015–16, Department and TAFE systems were enhanced to meet new regulatory and compliance standards, including:
• changes to align with the new VET FEE-HELP regulations;
• simplifying user access; and
• an integrated authentication model across systems and services.
As part of the Training Sector Reform Project, significant changes were made to Western Australia’s TAFE system which required a consolidated
reconfigured ICT system. Major projects scheduled for 2016–17 include:
• standardisation and centralisation of ICT services across the training sector;
• implementation of a new apprenticeship and traineeship management system; and
• continued implementation of a new student management system for TAFE colleges for student enrolment, class management and resulting.
Historically, the TAFE (formerly State training provider) network has been funded to deliver VET through annual Delivery and Performance Agreements with individual colleges.
The operational funding provided to the TAFE network through DPAs for publicly-subsidised training remains the single largest expenditure item for the Department each year.
DPAs are negotiated annually on broad training profiles including apprenticeship, traineeship and regular delivery for all TAFE colleges across all industry areas, certificate levels and training regions.
Strategic Goal 4: The Department’s services, systems and performance are client centred, of the highest quality and managed in an open, transparent and accountable manner.
The training sector reform project recommended a review of current funding model arrangements for the delivery of publicly funded training programs which will have significant impact on the DPAs.
In response to the recommendations of the training sector reform project report, a funding model review commenced in March 2016 that will ensure value for money for the State’s investment in training, and a model that is equitable and that supports improved outcomes for students.
It is anticipated the funding model review will be completed by the end of 2016 with full implementation in 2018.

2015–16 Annual Report | 44 2015–16 Annual Report | 44
High standards of contractual compliance and monitoring were maintained.
High standards of Contractual Compliance and Monitoring for registered training organisations continued in 2015–16. Vigilant processes established by the Department ensured that private training providers in receipt of public funding were required to comply with higher auditing standards.
In 2015–16, the Department conducted:
• 100 desktop contractual audits;
• 36 on site contractual audits; and
• 2 strategic audits that resulted in 184 registered training organisations being audited.
In 2015–16, 39% of the publicly funded private training providers that were audited were fully compliant. The remaining 61% had non-compliances, a majority of which were minor and mostly involved administrative issues. This compares to 23% fully compliant, and 77% non-compliances in 2014–15.
Evaluation is a key strategy to ensure that Department programs continue to maintain quality and transparency and meet performance targets.
Evaluations are conducted in accordance with an evaluation framework and post evaluation reporting and monitoring ensures that recommendations are implemented.
During 2015–16, evaluations were completed or progressed on the:
• Participation program;
• Professional Development program;
• WA Group Training Program; and
• Expanding Career Options for Women scholarship program.
During 2015–16, in compliance with the national requirement, Western Australian training providers were required to have a valid Unique Student Identifier for every student undertaking nationally recognised vocational education and training courses, before issuing them with a qualification or statement of attainment.
The USI will enable students to access their VET achievements attained from 1 January 2015 online through a single transcript document.

2015–16 Annual Report | 45
Significant issues impacting on the agency
2015–16 Annual Report | 46
The Training Sector Reform Project was launched in October 2015 to examine the function and structure of Western Australia’s public training sector.
Consolidating the TAFE colleges will increase the sustainability of the VET sector.
This will be achieved through the following strategies.
• The TAFE sector will increase student access to a broader range of high quality VET programs across Western Australia.
• The skills needs of industry and employment prospects of students will be enhanced through more coordinated delivery of training programs across the TAFE sector, in consultation with local industries and communities.
• Cost effective measures in delivering training and administration practices across the TAFE sector will be maximised through greater collaboration and adoption of best practice methods.
• The TAFE sector will develop more specialised programs and locations through the creation of Centres of Excellence to ensure highest standards of skill development.
• The viability of the three regional TAFE colleges will be strengthened through a broader range of training programs being delivered to a larger number of students.
• Collaboration across the VET sector will be enhanced through the provision of greater information on the activities of the TAFE colleges and clarification of their roles and responsibilities.
• Internationally, TAFE colleges will market their services with a consistent brand: TAFE International Western Australia. By adopting a centralised approach to marketing, and working collaboratively to achieve higher international student enrolment, retention and satisfaction rates, a range of economic and social benefits can be realised for the State.
Significant issues impacting on the agency
TAFE colleges, a significant cornerstone of Western
Australia’s vocational education and training
system, will be maintained and enhanced into
the future.
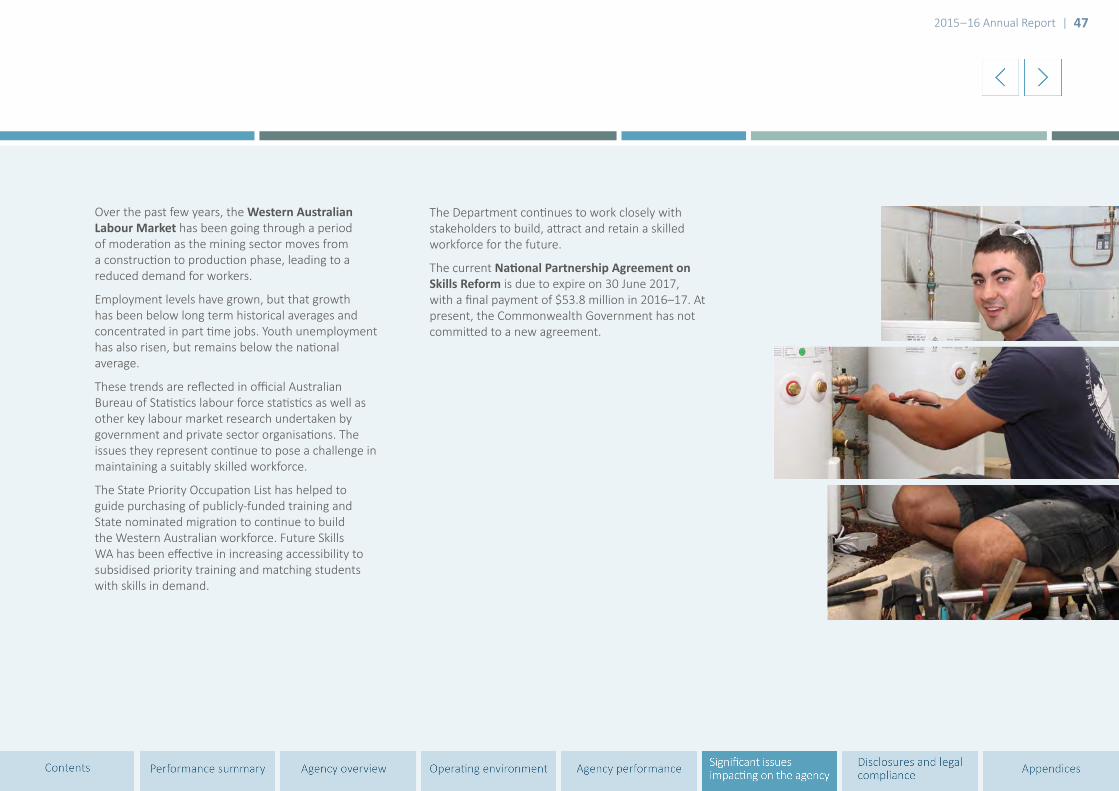
2015–16 Annual Report | 47
Over the past few years, the Western Australian Labour Market has been going through a period of moderation as the mining sector moves from a construction to production phase, leading to a reduced demand for workers.
Employment levels have grown, but that growth has been below long term historical averages and concentrated in part time jobs. Youth unemployment has also risen, but remains below the national average.
These trends are reflected in official Australian Bureau of Statistics labour force statistics as well as other key labour market research undertaken by government and private sector organisations. The issues they represent continue to pose a challenge in maintaining a suitably skilled workforce.
The State Priority Occupation List has helped to guide purchasing of publicly-funded training and State nominated migration to continue to build the Western Australian workforce. Future Skills WA has been effective in increasing accessibility to subsidised priority training and matching students with skills in demand.
The Department continues to work closely with stakeholders to build, attract and retain a skilled workforce for the future.
The current National Partnership Agreement on Skills Reform is due to expire on 30 June 2017, with a final payment of $53.8 million in 2016–17. At present, the Commonwealth Government has not committed to a new agreement.
2015–16 Annual Report | 48
Disclosures and legal complianceFinancial statements
Additional key performance indicators information
Ministerial directives
Other financial disclosures
Staffing
Government policy requirements
2015–16 Annual Report | 48

2015–16 Annual Report | 49
Financial Statements
SATVINDER SEKHON DR RUTH SHEANCHIEF FINANCE OFFICER DIRECTOR GENERAL
5 September 2016 5 September 2016
Certification of Financial Statements
For the year ended 30 June 2016
The accompanying financial statements of the Department of Training and Workforce Developmenthave been prepared in compliance with the provisions of the Financial Management Act 2006 fromproper accounts and records to present fairly the financial transactions for the financial year ended30 June 2016 and the financial position as at 30 June 2016.
At the date of signing we are not aware of any circumstances which would render the particularsincluded in the financial statements misleading or inaccurate.

2015–16 Annual Report | 50
2015–16 Annual Report | 51
2015–16 Annual Report | 52

2015–16 Annual Report | 53
Statement of Comprehensive Income
For the year ended 30 June 2016$000 $000
COST OF SERVICES Note
ExpensesEmployee benefits expense 6 52 515 59 456 Supplies and services 7 25 507 29 798 Depreciation and amortisation expense 8 2 119 1 803 Accommodation expenses 5 133 6 217 Grants and subsidies 9 512 674 549 290 Loss on disposal of non-current assets 14 - 6 Loss arising from changes in net realisable value - inventories - 4 Other expenses 10 11 856 24 852
Total cost of services 609 804 671 426
Income
RevenueUser charges and fees 11 44 618 44 477 Commonwealth grants and contributions 12 198 824 200 695 Interest revenue 1 604 1 722 Other revenue 13 8 449 7 990
Total revenue 253 495 254 884
GainsGain on disposal of non-current assets 14 1 785 - Gain arising from changes in net realisable value - inventories 9 - Gain arising from changes in fair value - livestock 185 100
Total gains 1 979 100
Total income other than income from State Government 255 474 254 984
NET COST OF SERVICES 354 330 416 442
Income from State Government 15Service appropriation 366 368 439 711 Services received free of charge 1 092 1 642 Royalties for Regions Fund 8 182 4 356
Total income from State Government 375 642 445 709
SURPLUS FOR THE PERIOD 21 312 29 267
OTHER COMPREHENSIVE INCOMEItems not reclassified subsequently to profit and loss
Changes in asset revaluation surplus 29 (783) 157
Total other comprehensive income (783) 157
TOTAL COMPREHENSIVE INCOME FOR THE PERIOD 20 529 29 424
See also the 'Schedule of income and expenses by service'.
The Statement of Comprehensive Income should be read in conjunction with the accompanying notes.
2016 2015
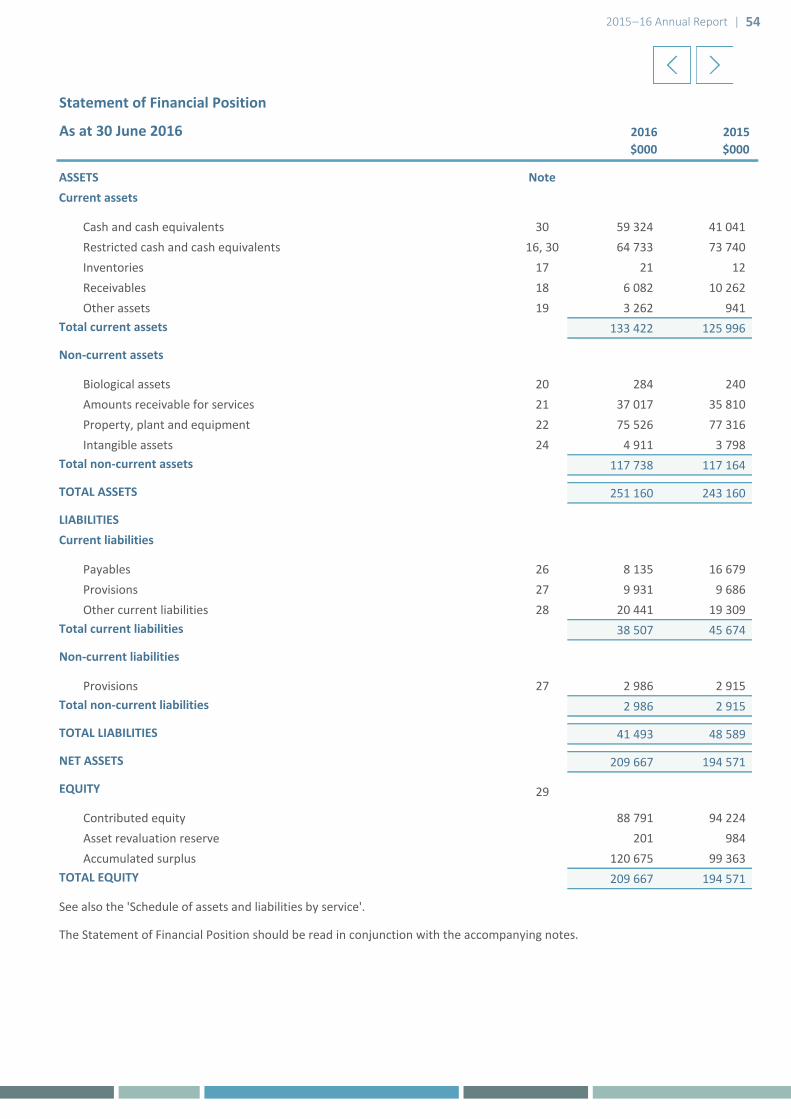
2015–16 Annual Report | 54
Statement of Financial Position
$000 $000
ASSETS NoteCurrent assets
Cash and cash equivalents 30 59 324 41 041 Restricted cash and cash equivalents 16, 30 64 733 73 740 Inventories 17 21 12 Receivables 18 6 082 10 262 Other assets 19 3 262 941
Total current assets 133 422 125 996
Non-current assets
Biological assets 20 284 240 Amounts receivable for services 21 37 017 35 810 Property, plant and equipment 22 75 526 77 316 Intangible assets 24 4 911 3 798
Total non-current assets 117 738 117 164
TOTAL ASSETS 251 160 243 160
LIABILITIESCurrent liabilities
Payables 26 8 135 16 679 Provisions 27 9 931 9 686 Other current liabilities 28 20 441 19 309
Total current liabilities 38 507 45 674
Non-current liabilities
Provisions 27 2 986 2 915 Total non-current liabilities 2 986 2 915
TOTAL LIABILITIES 41 493 48 589
NET ASSETS 209 667 194 571
EQUITY 29
Contributed equity 88 791 94 224 Asset revaluation reserve 201 984 Accumulated surplus 120 675 99 363
TOTAL EQUITY 209 667 194 571
See also the 'Schedule of assets and liabilities by service'.
The Statement of Financial Position should be read in conjunction with the accompanying notes.
As at 30 June 2016 2016 2015

2015–16 Annual Report | 55
Statement of Changes in Equity
Contributed equity
ReservesAccumulated
surplusTotal
equity$000 $000 $000 $000
Note
Balance at 1 July 2014 29 116 738 827 70 096 187 661
Surplus - - 29 267 29 267 Other comprehensive income - 157 - 157
Total comprehensive income for the period - 157 29 267 29 424
Capital appropriations 1 474 - - 1 474 Royalties for Regions capital funding 30 033 - - 30 033 Contribution of capital funding from other sources 1 358 - - 1 358 Other contributions by owners 25 - - 25 Distributions to owners (55 404) - - (55 404)
Total (22 514) - - (22 514)
Balance at 30 June 2015 94 224 984 99 363 194 571
Balance at 1 July 2015 94 224 984 99 363 194 571
Surplus - - 21 312 21 312 Other comprehensive income - (783) - (783)
Total comprehensive income for the period - (783) 21 312 20 529
Capital appropriations 8 279 - - 8 279 Royalties for Regions capital funding 19 675 - - 19 675 Contribution of capital funding from TAFE colleges 2 215 - - 2 215 Contribution of capital funding from other sources 388 - - 388 Other contributions by owners 1 052 - - 1 052 Distribution to owners (37 042) - - (37 042)
Total (5 433) - - (5 433)
Balance at 30 June 2016 88 791 201 120 675 209 667
For the year ended 30 June 2016
The Statement of Changes in Equity should be read in conjunction with the accompanying notes.
Transactions with owners in their capacity as owners:
Transactions with owners in their capacity as owners:

2015–16 Annual Report | 56
Statement of Cash Flows
$000 $000
CASH FLOWS FROM STATE GOVERNMENT Note
Service appropriation 365 161 438 504 Capital appropriation 8 279 1 474 Royalties for Regions Fund 27 857 34 389 Contribution of capital funding from other sources 2 603 1 358 Non-retained revenue distributed to owner (1 290) -
Net cash provided by State Government 402 610 475 725
Utilised as follows:
CASH FLOWS FROM OPERATING ACTIVITIES
Payments
Employee benefits (56 024) (54 730)Supplies and services and other expenses (38 832) (57 407)Grants and subsidies (515 493) (550 717)GST payments on purchases (18 738) (21 050)
Receipts
User charges and fees 43 948 50 125 Commonwealth grants and contributions 200 876 205 271 Interest received 1 568 1 728 GST receipts on sales 876 1 105 GST receipts from taxation authority 17 133 19 148 Other receipts 8 061 5 539
Net cash provided by / (used in) operating activities 30 (356 625) (400 988)
CASH FLOWS FROM INVESTING ACTIVITIES
Payments
Purchase of non-current physical assets (38 017) (50 329)
Receipts
Proceeds from sale of non-current physical assets 1 308 - Net cash provided by / (used in) investing activities (36 709) (50 329)
Net increase / (decrease) in cash and cash equivalents 9 276 24 408 Cash and cash equivalents at the beginning of the period 114 781 90 373
30 124 057 114 781
The Statement of cash flows should be read in conjunction with the accompanying notes.
2015For the year ended 30 June 2016
CASH AND CASH EQUIVALENTS AT THE END OF THE PERIOD
2016
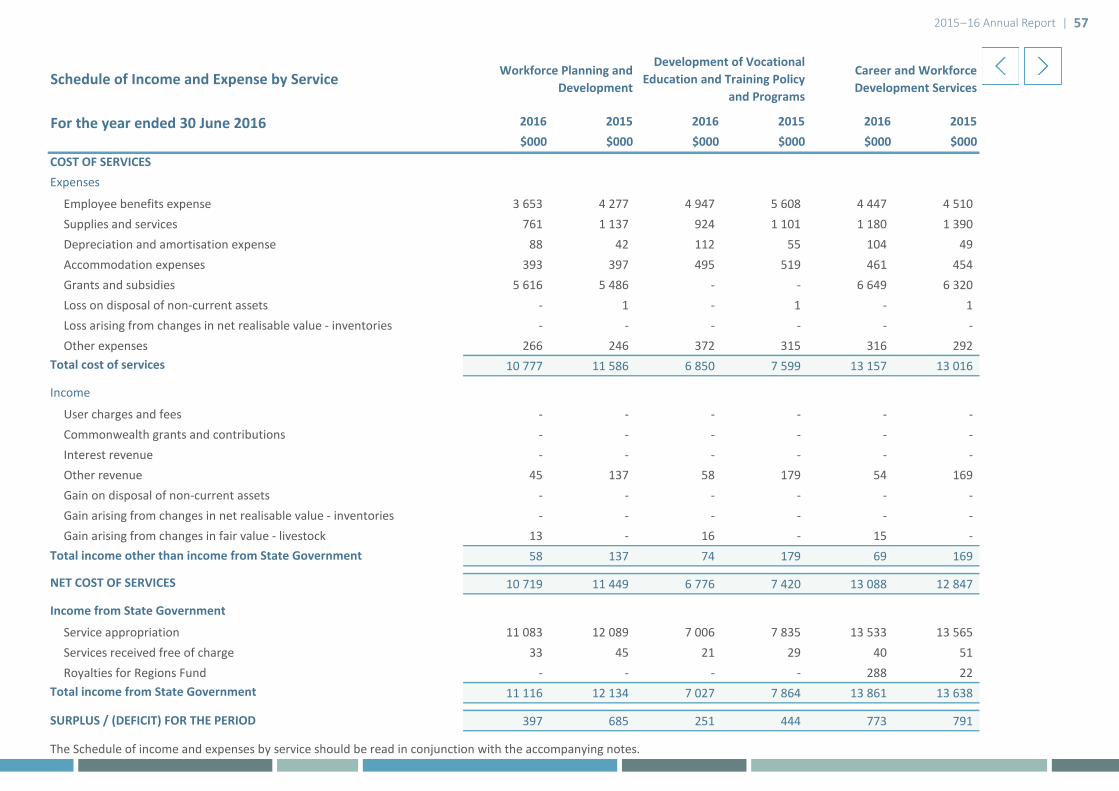
2015–16 Annual Report | 57
2016 2015 2016 2015 2016 2015$000 $000 $000 $000 $000 $000
Employee benefits expense 3 653 4 277 4 947 5 608 4 447 4 510 Supplies and services 761 1 137 924 1 101 1 180 1 390 Depreciation and amortisation expense 88 42 112 55 104 49 Accommodation expenses 393 397 495 519 461 454 Grants and subsidies 5 616 5 486 - - 6 649 6 320 Loss on disposal of non-current assets - 1 - 1 - 1 Loss arising from changes in net realisable value - inventories - - - - - - Other expenses 266 246 372 315 316 292
10 777 11 586 6 850 7 599 13 157 13 016
User charges and fees - - - - - - Commonwealth grants and contributions - - - - - - Interest revenue - - - - - - Other revenue 45 137 58 179 54 169 Gain on disposal of non-current assets - - - - - - Gain arising from changes in net realisable value - inventories - - - - - - Gain arising from changes in fair value - livestock 13 - 16 - 15 -
58 137 74 179 69 169
10 719 11 449 6 776 7 420 13 088 12 847
Service appropriation 11 083 12 089 7 006 7 835 13 533 13 565 Services received free of charge 33 45 21 29 40 51 Royalties for Regions Fund - - - - 288 22
11 116 12 134 7 027 7 864 13 861 13 638
397 685 251 444 773 791
The Schedule of income and expenses by service should be read in conjunction with the accompanying notes.
Total cost of services
Income
COST OF SERVICESExpenses
Workforce Planning and DevelopmentSchedule of Income and Expense by Service Career and Workforce
Development Services
For the year ended 30 June 2016
SURPLUS / (DEFICIT) FOR THE PERIOD
Total income other than income from State Government
NET COST OF SERVICES
Income from State Government
Total income from State Government
Development of Vocational Education and Training Policy
and Programs
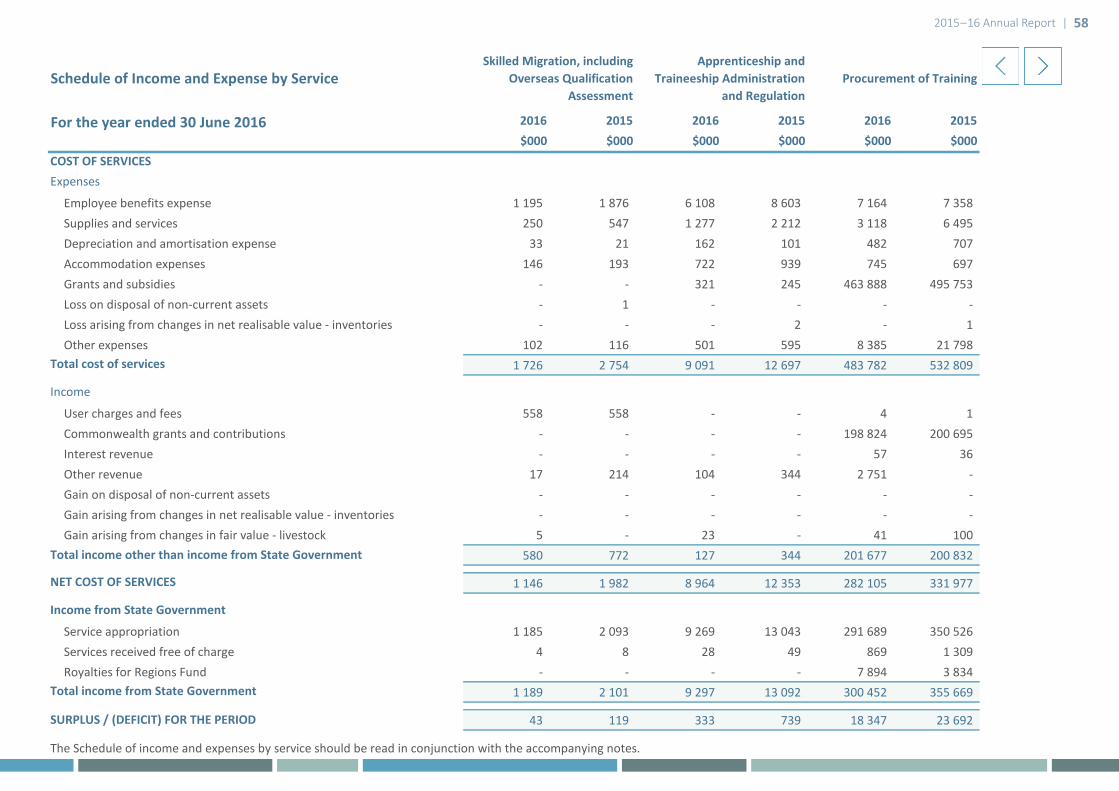
2015–16 Annual Report | 58
2016 2015 2016 2015 2016 2015$000 $000 $000 $000 $000 $000
Employee benefits expense 1 195 1 876 6 108 8 603 7 164 7 358 Supplies and services 250 547 1 277 2 212 3 118 6 495 Depreciation and amortisation expense 33 21 162 101 482 707 Accommodation expenses 146 193 722 939 745 697 Grants and subsidies - - 321 245 463 888 495 753 Loss on disposal of non-current assets - 1 - - - - Loss arising from changes in net realisable value - inventories - - - 2 - 1 Other expenses 102 116 501 595 8 385 21 798
1 726 2 754 9 091 12 697 483 782 532 809
User charges and fees 558 558 - - 4 1 Commonwealth grants and contributions - - - - 198 824 200 695 Interest revenue - - - - 57 36 Other revenue 17 214 104 344 2 751 - Gain on disposal of non-current assets - - - - - - Gain arising from changes in net realisable value - inventories - - - - - - Gain arising from changes in fair value - livestock 5 - 23 - 41 100
580 772 127 344 201 677 200 832
1 146 1 982 8 964 12 353 282 105 331 977
Service appropriation 1 185 2 093 9 269 13 043 291 689 350 526 Services received free of charge 4 8 28 49 869 1 309 Royalties for Regions Fund - - - - 7 894 3 834
1 189 2 101 9 297 13 092 300 452 355 669
43 119 333 739 18 347 23 692
The Schedule of income and expenses by service should be read in conjunction with the accompanying notes.
SURPLUS / (DEFICIT) FOR THE PERIOD
Expenses
Total cost of services
Income
Total income other than income from State Government
NET COST OF SERVICES
Apprenticeship and Traineeship Administration
and RegulationProcurement of Training
Income from State Government
Total income from State Government
Skilled Migration, including Overseas Qualification
Assessment
For the year ended 30 June 2016
COST OF SERVICES
Schedule of Income and Expense by Service

2015–16 Annual Report | 59
2016 2015 2016 2015 2016 2015 2016 2015$000 $000 $000 $000 $000 $000 $000 $000
Employee benefits expense 3 969 3 745 1 515 2 329 19 517 21 150 52 515 59 456 Supplies and services 6 176 5 742 503 432 11 318 10 742 25 507 29 798 Depreciation and amortisation expense 76 2 34 23 1 028 803 2 119 1 803 Accommodation expenses 355 605 150 199 1 666 2 214 5 133 6 217 Grants and subsidies 35 432 36 034 668 5 452 100 - 512 674 549 290 Loss on disposal of non-current assets - - - - - 2 - 6 Loss arising from changes in net realisable value - inventories - - - - - 1 - 4 Other expenses 191 62 80 120 1 643 1 308 11 856 24 852
46 199 46 190 2 950 8 555 35 272 36 220 609 804 671 426
User charges and fees 44 023 43 879 - - 33 39 44 618 44 477 Commonwealth grants and contributions - - - - - - 198 824 200 695 Interest revenue 1 547 1 686 - - - - 1 604 1 722 Other revenue 405 432 168 69 4 847 6 446 8 449 7 990 Gain on disposal of non-current assets - - 1 785 - - - 1 785 - Gain arising from changes in net realisable value - inventories - - 9 - - - 9 - Gain arising from changes in fair value - livestock - - 17 - 55 - 185 100
45 975 45 997 1 979 69 4 935 6 485 255 474 254 984
224 193 971 8 486 30 337 29 735 354 330 416 442
Service appropriation 232 204 1 004 8 960 31 367 31 396 366 368 439 711 Services received free of charge 1 1 3 33 93 117 1 092 1 642 Royalties for Regions Fund - - - 500 - - 8 182 4 356
233 205 1 007 9 493 31 460 31 513 375 642 445 709
9 12 36 1 007 1 123 1 778 21 312 29 267
The Schedule of income and expenses by service should be read in conjunction with the accompanying notes.
SURPLUS / (DEFICIT) FOR THE PERIOD
Support Services to TAFE Colleges
Total
For the year ended 30 June 2016
COST OF SERVICESExpenses
Total cost of services
Schedule of Income and Expense by ServiceRecruitment and
Management of International Students
Infrastructure Management for TAFE Colleges
Income
Total income other than income from State Government
NET COST OF SERVICES
Income from State Government
Total income from State Government

2015–16 Annual Report | 60
2016 2015 2016 2015 2016 2015 2016 2015 2016 2015$000 $000 $000 $000 $000 $000 $000 $000 $000 $000
Current assets 2 358 2 174 1 499 1 426 2 879 2 443 378 517 1 989 2 383 Non-current assets 2 081 2 022 1 323 1 326 2 540 2 271 333 481 1 755 2 216
4 439 4 196 2 822 2 752 5 419 4 714 711 998 3 744 4 599
Current liabilities 681 788 433 517 831 885 109 187 574 864 Non-current liabilities 53 50 34 33 64 57 8 12 45 55
734 838 467 550 895 942 117 199 619 919
3 705 3 358 2 355 2 202 4 524 3 772 594 799 3 125 3 680
The Schedule of Assets and Liabilities by Service should be read in conjunction with the accompanying notes.
TOTAL LIABILITIES
As at 30 June 2016
TOTAL ASSETS
Liabilities
Career and Workforce Development Services
Assets
Workforce Planning and Development
Development of Vocational Education and Training Policy
and Programs
Schedule of Assets and Liabilities by Service
Apprenticeship and Traineeship Administration
and Regulation
Skilled Migration, including Overseas Qualification
Assessment
NET ASSETS

2015–16 Annual Report | 61
2016 2015 2016 2015 2016 2015 2016 2015 2016 2015$000 $000 $000 $000 $000 $000 $000 $000 $000 $000
Current assets 105 849 99 984 10 108 8 668 645 1 605 7 717 6 796 133 422 125 996 Non-current assets 93 406 92 975 8 920 8 060 570 1 493 6 810 6 320 117 738 117 164
199 255 192 959 19 028 16 728 1 215 3 098 14 527 13 116 251 160 243 160
Current liabilities 30 549 36 245 2 917 3 142 186 582 2 227 2 464 38 507 45 674 Non-current liabilities 2 369 2 313 226 201 14 37 173 157 2 986 2 915
32 918 38 558 3 143 3 343 200 619 2 400 2 621 41 493 48 589
166 337 154 401 15 885 13 385 1 015 2 479 12 127 10 495 209 667 194 571
The Schedule of Assets and Liabilities by Service should be read in conjunction with the accompanying notes.
Schedule of Assets and Liabilities by Service
Total
NET ASSETS
As at 30 June 2016
Assets
TOTAL ASSETS
Liabilities
TOTAL LIABILITIES
Procurement of TrainingRecruitment and
Management of International Students
Infrastructure Management for TAFE Colleges
Support Services to TAFE Colleges

2015–16 Annual Report | 62
Summary of Consolidated Account Appropriations and Income Estimates2016 2016 2016 2015
Estimate Actual Variance Actual Actual Variance $000 $000 $000 $000 $000 $000
Item 42 Net amount appropriated to deliver services 383 691 363 378 (20 313) 363 378 436 721 (73 343)Amount authorised by other statutes- Salaries and Allowances Act 1975 2 990 2 990 - 2 990 2 990 -
386 681 366 368 (20 313) 366 368 439 711 (73 343)
Item 129 Capital appropriations 8 279 8 279 - 8 279 1 474 6 805 8 279 8 279 - 8 279 1 474 6 805
394 960 374 647 (20 313) 374 647 441 185 (66 538)
Workforce planning and development 12 898 10 777 (2 121) 10 777 11 586 (809)Development of vocational education and training policy and programs 8 429 6 850 (1 579) 6 850 7 599 (749)Career and workforce development services 14 119 13 157 (962) 13 157 13 016 141 Skilled migration, including overseas qualification assessment 2 997 1 726 (1 271) 1 726 2 754 (1 028)Apprenticeship and traineeship administration and regulation 11 489 9 091 (2 398) 9 091 12 697 (3 606)Procurement of training 488 831 483 782 (5 049) 483 782 532 809 (49 027)Recruitment and management of international students 44 775 46 199 1 424 46 199 46 190 9 Infrastructure management for TAFE colleges 4 724 2 950 (1 774) 2 950 8 555 (5 605)Support services to TAFE colleges 35 509 35 272 (237) 35 272 36 220 (948)Total cost of services 623 771 609 804 (13 967) 609 804 671 426 (61 622)Less Total income 257 428 255 474 (1 954) 255 474 254 984 490 Net cost of services 366 343 354 330 (12 013) 354 330 416 442 (62 112)Adjustments 20 338 12 038 (8 300) 12 038 23 269 (11 231)
386 681 366 368 (20 313) 366 368 439 711 (73 343)
Purchase of non-current physical assets 66 321 38 017 (28 304) 38 017 50 329 (12 312) 66 321 38 017 (28 304) 38 017 50 329 (12 312)
For the year ended 30 June 2016
Delivery of services
Total appropriations provided to deliver services
Capital appropriations
Capital expenditure
Total capital
Total appropriations provided to deliver services
Capital
GRAND TOTAL
Details of expenses by service
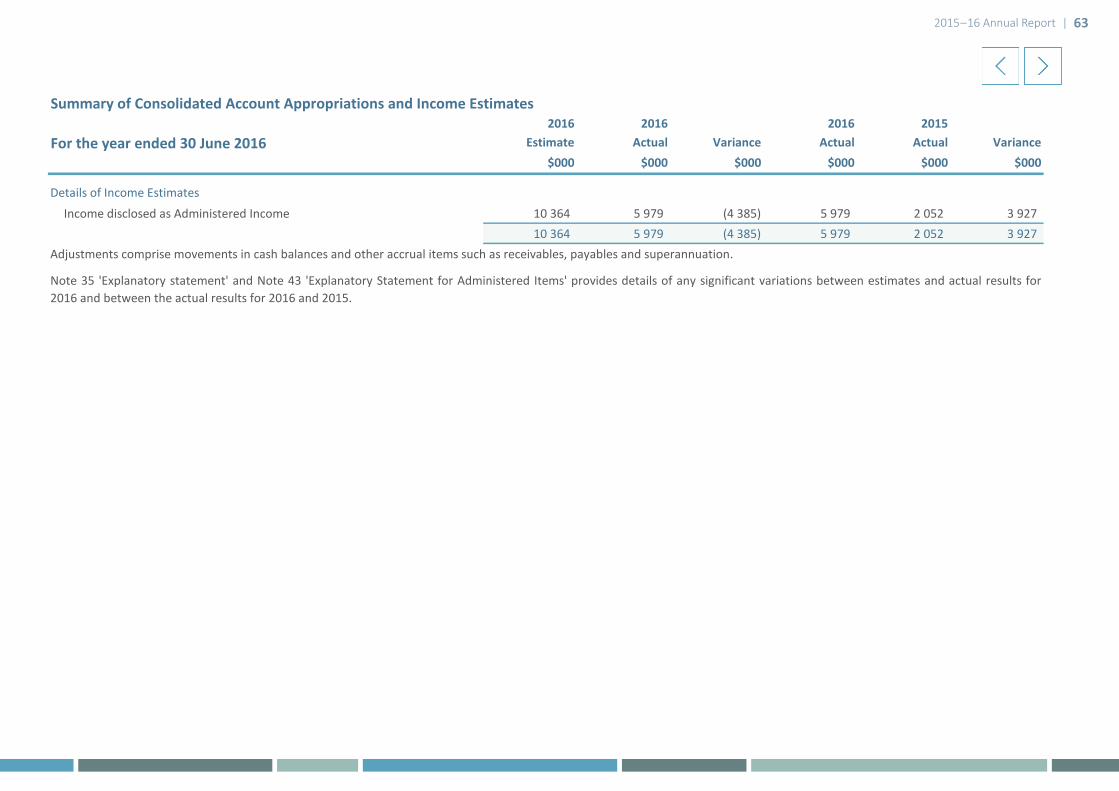
2015–16 Annual Report | 63
Summary of Consolidated Account Appropriations and Income Estimates2016 2016 2016 2015
Estimate Actual Variance Actual Actual Variance $000 $000 $000 $000 $000 $000
For the year ended 30 June 2016
Income disclosed as Administered Income 10 364 5 979 (4 385) 5 979 2 052 3 927 10 364 5 979 (4 385) 5 979 2 052 3 927
Adjustments comprise movements in cash balances and other accrual items such as receivables, payables and superannuation.
Note 35 'Explanatory statement' and Note 43 'Explanatory Statement for Administered Items' provides details of any significant variations between estimates and actual results for2016 and between the actual results for 2016 and 2015.
Details of Income Estimates

2015–16 Annual Report | 64
For the year ended 30 June 2016
Notes to the Financial Statements
General
Note 4 ‘Key sources of estimation uncertainty’ discloses key assumptions made concerning the future, and other key sourcesof estimation uncertainty at the end of the reporting period, that have a significant risk of causing a material adjustment tothe carrying amounts of assets and liabilities within the next financial year.
Early adoption of Standards
(c) Reporting entity
The financial statements are presented in Australian dollars and all values are rounded to the nearest thousand dollars ($000).
The Department’s financial statements for the year ended 30 June 2016 have been prepared in accordance with AustralianAccounting Standards. The term 'Australian Accounting Standards' includes Standards and Interpretations issued by theAustralian Accounting Standards Board (AASB).
The financial statements have been prepared on the accrual basis of accounting using the historical cost convention, exceptfor land and buildings which have been measured at fair value.
(b) Basis of preparation
Where modification is required and has had a material or significant financial effect upon the reported results, details of thatmodification and the resulting financial effect are disclosed in the notes to the financial statements.
(a) General statement
The Financial Management Act 2006 and the Treasurer's instructions impose legislative provisions that govern thepreparation of financial statements and take precedence over Australian Accounting Standards, the Framework, Statements ofAccounting Concepts and other authoritative pronouncements of the AASB.
The Department cannot early adopt an Australian Accounting Standard unless specifically permitted by TI 1101 Application ofAustralian Accounting Standards and Other Pronouncements. Partial exemption permitting early adoption of AASB 2015-7Amendments to Australian Accounting Standards - Fair Value Disclosures of Not-for-Profit Public Sector Entities has beengranted. Aside from 2015-7, there has been no early adoption of any other Australian Accounting Standards that have beenissued or amended (but not operative) by the Department for the annual reporting period ended 30 June 2016.
The reporting entity comprises the Department of Training and Workforce Development which includes Muresk Institute.
The Department is a not-for-profit reporting entity that prepares general purpose financial statements in accordance with theAustralian Accounting Standards, the Framework, Statements of Accounting Concepts and other authoritativepronouncements of the AASB as applied by the Treasurer’s Instructions. Several of these are modified by the Treasurer’sInstructions to vary application, disclosure, format and wording.
The accounting policies adopted in the preparation of the financial statements have been consistently applied throughout allperiods presented unless otherwise stated.
Note 3 'Judgements made by management in applying accounting policies’ discloses judgements that have been made in theprocess of applying the Department’s accounting policies resulting in the most significant effect on amounts recognised in thefinancial statements.
The Department has adopted any applicable new and revised Australian Accounting Standards from their operative dates.
Note 1. Australian Accounting Standards
Note 2. Summary of significant accounting policies
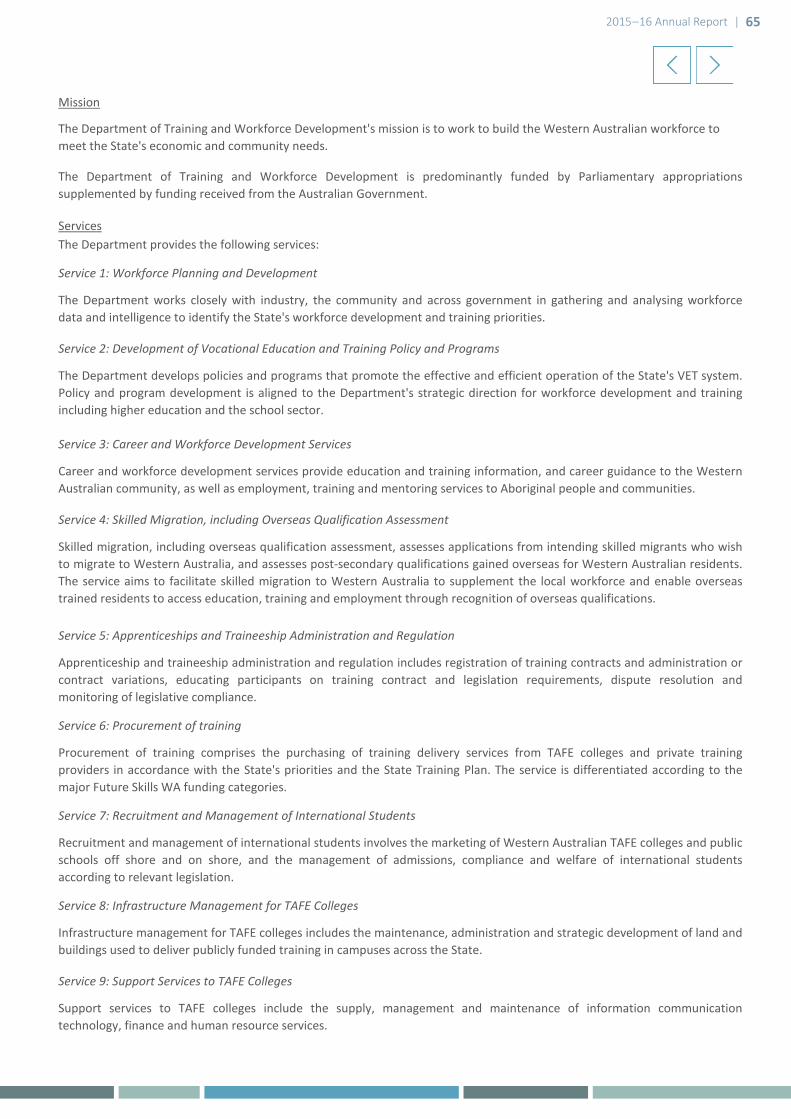
2015–16 Annual Report | 65
Mission
Services
Recruitment and management of international students involves the marketing of Western Australian TAFE colleges and publicschools off shore and on shore, and the management of admissions, compliance and welfare of international studentsaccording to relevant legislation.
Service 8: Infrastructure Management for TAFE Colleges
Infrastructure management for TAFE colleges includes the maintenance, administration and strategic development of land andbuildings used to deliver publicly funded training in campuses across the State.
Procurement of training comprises the purchasing of training delivery services from TAFE colleges and private trainingproviders in accordance with the State's priorities and the State Training Plan. The service is differentiated according to themajor Future Skills WA funding categories.
Service 7: Recruitment and Management of International Students
Service 3: Career and Workforce Development Services
Career and workforce development services provide education and training information, and career guidance to the WesternAustralian community, as well as employment, training and mentoring services to Aboriginal people and communities.
Service 9: Support Services to TAFE Colleges
Support services to TAFE colleges include the supply, management and maintenance of information communicationtechnology, finance and human resource services.
The Department provides the following services:
The Department develops policies and programs that promote the effective and efficient operation of the State's VET system.Policy and program development is aligned to the Department's strategic direction for workforce development and trainingincluding higher education and the school sector.
Service 2: Development of Vocational Education and Training Policy and Programs
The Department of Training and Workforce Development is predominantly funded by Parliamentary appropriationssupplemented by funding received from the Australian Government.
Apprenticeship and traineeship administration and regulation includes registration of training contracts and administration orcontract variations, educating participants on training contract and legislation requirements, dispute resolution andmonitoring of legislative compliance.
Service 6: Procurement of training
The Department of Training and Workforce Development's mission is to work to build the Western Australian workforce to meet the State's economic and community needs.
Service 1: Workforce Planning and Development
The Department works closely with industry, the community and across government in gathering and analysing workforcedata and intelligence to identify the State's workforce development and training priorities.
Service 4: Skilled Migration, including Overseas Qualification Assessment
Skilled migration, including overseas qualification assessment, assesses applications from intending skilled migrants who wishto migrate to Western Australia, and assesses post-secondary qualifications gained overseas for Western Australian residents.The service aims to facilitate skilled migration to Western Australia to supplement the local workforce and enable overseastrained residents to access education, training and employment through recognition of overseas qualifications.
Service 5: Apprenticeships and Traineeship Administration and Regulation
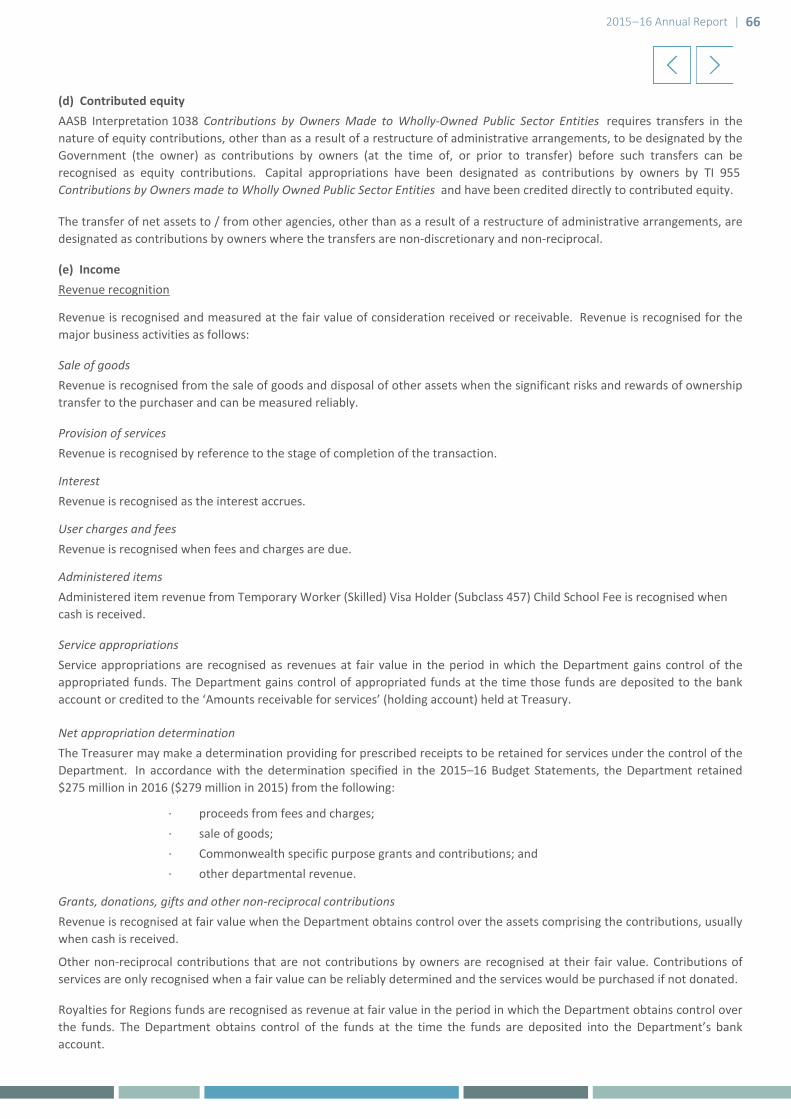
2015–16 Annual Report | 66
· Commonwealth specific purpose grants and contributions; and
· proceeds from fees and charges;
Service appropriations
(d) Contributed equity
· sale of goods;
Revenue is recognised and measured at the fair value of consideration received or receivable. Revenue is recognised for themajor business activities as follows:
Service appropriations are recognised as revenues at fair value in the period in which the Department gains control of theappropriated funds. The Department gains control of appropriated funds at the time those funds are deposited to the bankaccount or credited to the ‘Amounts receivable for services’ (holding account) held at Treasury.
Net appropriation determinationThe Treasurer may make a determination providing for prescribed receipts to be retained for services under the control of theDepartment. In accordance with the determination specified in the 2015–16 Budget Statements, the Department retained$275 million in 2016 ($279 million in 2015) from the following:
Interest
Administered itemsAdministered item revenue from Temporary Worker (Skilled) Visa Holder (Subclass 457) Child School Fee is recognised when cash is received.
Revenue recognition
The transfer of net assets to / from other agencies, other than as a result of a restructure of administrative arrangements, aredesignated as contributions by owners where the transfers are non-discretionary and non-reciprocal.
AASB Interpretation 1038 Contributions by Owners Made to Wholly-Owned Public Sector Entities requires transfers in thenature of equity contributions, other than as a result of a restructure of administrative arrangements, to be designated by theGovernment (the owner) as contributions by owners (at the time of, or prior to transfer) before such transfers can berecognised as equity contributions. Capital appropriations have been designated as contributions by owners by TI 955Contributions by Owners made to Wholly Owned Public Sector Entities and have been credited directly to contributed equity.
Sale of goods
User charges and feesRevenue is recognised when fees and charges are due.
Provision of services
Revenue is recognised as the interest accrues.
Royalties for Regions funds are recognised as revenue at fair value in the period in which the Department obtains control overthe funds. The Department obtains control of the funds at the time the funds are deposited into the Department’s bankaccount.
Other non-reciprocal contributions that are not contributions by owners are recognised at their fair value. Contributions ofservices are only recognised when a fair value can be reliably determined and the services would be purchased if not donated.
Revenue is recognised at fair value when the Department obtains control over the assets comprising the contributions, usuallywhen cash is received.
(e) Income
Revenue is recognised by reference to the stage of completion of the transaction.
Revenue is recognised from the sale of goods and disposal of other assets when the significant risks and rewards of ownershiptransfer to the purchaser and can be measured reliably.
Grants, donations, gifts and other non-reciprocal contributions
· other departmental revenue.
2015–16 Annual Report | 67
For items of property, plant and equipment acquired at no cost or for nominal cost, the cost is the fair value at the date ofacquisition.
Derecognition
Asset revaluation surplus
Subsequent measurement
Upon disposal or derecognition of an item of property, plant and equipment, any revaluation surplus relating to that asset isretained in the asset revaluation surplus.
The most significant assumptions in estimating fair value are made in assessing whether to apply the existing use basis toassets and in determining estimated useful life. Professional judgment by the valuer is required where the evidence does notprovide a clear distinction between market type assets and existing use assets.
Realised or unrealised gains are usually recognised on a net basis. These include gains arising on the disposal of non-currentassets and some revaluations of non-current assets.
Property, plant and equipment are initially recognised at cost.
Where market-based evidence is available, the fair value of land and buildings is determined on the basis of current marketbuying values determined by reference to recent market transactions. When buildings are revalued by reference to recentmarket transactions, the accumulated depreciation is eliminated against the gross carrying amount of the asset and the netamount restated to the revalued amount.
Land and buildings are independently valued annually by the Western Australian Land Information Authority (ValuationServices) and recognised annually to ensure that the carrying amount does not differ materially from the asset’s fair value atthe end of the reporting period.
The asset revaluation surplus is used to record increments and decrements on the revaluation of non-current assets on a classof assets basis.
In the absence of market-based evidence, fair value of land and buildings is determined on the basis of existing use. Thisnormally applies where buildings are specialised or where land use is restricted. Fair value for existing use buildings isdetermined by reference to the cost of replacing the remaining future economic benefits embodied in the asset, i.e. thedepreciated replacement cost. Where the fair value of buildings is determined on the depreciated replacement cost basis, thegross carrying amount and the accumulated depreciation are restated proportionately. Fair value for restricted use land isdetermined by comparison with market evidence for land with similar approximate utility (high restricted use land) or marketvalue of comparable unrestricted land (low restricted use land).
Subsequent to initial recognition as an asset, the revaluation model is used for the measurement of land and buildings andhistorical cost for all other property, plant and equipment. Land and buildings are carried at fair value less accumulateddepreciation (buildings only) and accumulated impairment losses. All other items of property, plant and equipment are statedat historical cost less accumulated depreciation and accumulated impairment losses.
Gains
(f) Property, plant and equipment
Initial recognition and measurement
Items of property, plant and equipment costing $5 000 or more are recognised as assets and the cost of utilising assets isexpensed (depreciated) over their useful lives. Items of property, plant and equipment costing less than $5 000 areimmediately expensed direct to the Statement of Comprehensive Income (other than where they form part of a group ofsimilar items which are significant in total).
Capitalisation / expensing of assets
2015–16 Annual Report | 68
Buildings 40 yearsPlant and equipment 8 yearsOffice equipment 5-10 yearsCommunication equipment 5 yearsComputer equipment 3-5 yearsFurniture and fittings 10 yearsMotor vehicles 5 yearsLeasehold improvements 7 years
Capitalisation / expensing of assets
Computer software(a) 3-5 yearsComputer licences 7-10 yearsInternally developed software 3-5 years
Licences
Development costs
The Department owns works of art, which are anticipated to have long and indeterminate useful lives. Their service potentialhas not, in any material sense, been consumed during the reporting period and consequently no depreciation has beenrecognised.
Acquisitions of intangible assets costing $5 000 or more and internally generated intangible assets costing $1 000 000 or moreare capitalised. The cost of utilising the assets is expensed (amortised) over their useful life. Costs incurred below thesethresholds are immediately expensed directly to the Statement of Comprehensive Income.
All non-current assets having a limited useful life are systematically depreciated over their estimated useful lives in a mannerthat reflects the consumption of their future economic benefits.
(g) Intangible assets
Depreciation
Depreciation is calculated using the straight line method, using rates which are reviewed annually. Estimated useful lives foreach class of depreciable asset are:
Subsequent to initial recognition as an asset, the valuation model is used for the measurement of works of art. TheDepartment has a policy of revaluing artworks at fair value and is carried out every 3-5 years. The revaluation of theDepartment's art works was last undertaken in 2013 by an independent valuer - Japingka Indigenous Fine Art Gallery.
(a) Software that is not integral to the operation of any related hardware.
Subsequent measurement
All intangible assets controlled by the Department have a finite useful life and zero residual value. Amortisation is calculatedfor the period of the expected benefit (estimated useful life which is reviewed annually) on the straight line basis.
The cost model is applied for subsequent measurement requiring the asset to be carried at cost less any accumulatedamortisation and accumulated impairment losses.
Intangible assets are initially recognised at cost. For assets acquired at no cost or for nominal cost, the cost is their fair value atthe date of acquisition.
Licences have a finite useful life and are carried at cost less accumulated amortisation and accumulated impairment losses.
Land is not depreciated.
The expected useful lives for each class of intangible assets are:
Research costs are expensed as incurred. Development costs incurred for an individual project are carried forward when thefuture economic benefits can reasonably be regarded as assured and the total project costs are likely to exceed $50 000. Otherdevelopment costs are expensed as incurred.
2015–16 Annual Report | 69
Computer software
Website costsWebsite costs are charged as expenses when they are incurred unless they relate to the acquisition or development of anasset when they may be capitalised and amortised. Generally, costs in relation to feasibility studies during the planning phaseof a website, and ongoing costs of maintenance during the operating phase are expensed. Costs incurred in building orenhancing a website, to the extent that they represent probable future economic benefits that can be reliably measured, arecapitalised.
Software that is an integral part of the related hardware is recognised as property, plant and equipment. Software that is notan integral part of the related hardware is recognised as an intangible asset. Software costing less than $5 000 is expensed inthe year of acquisition.
Finance lease rights and obligations are initially recognised, at the commencement of the lease term, as assets and liabilitiesequal in amount to the fair value of the leased item or, if lower, the present value of the minimum lease payments,determined at the inception of the lease. The assets are disclosed as plant, equipment and vehicles under lease, and aredepreciated over the period during which the Department is expected to benefit from their use. Minimum lease payments areapportioned between the finance charge and the reduction of the outstanding lease liability, according to the interest rateimplicit in the lease.
The Department holds operating leases for head office and a number of branch office buildings and motor vehicles. Operatingleases are expensed on a straight line basis over the lease term as this represents the pattern of benefits derived from theleased properties.
Property, plant and equipment and intangible assets are tested for any indication of impairment at the end of each reportingperiod. Where there is an indication of impairment, the recoverable amount is estimated. Where the recoverable amount isless than the carrying amount, the asset is considered impaired and is written down to the recoverable amount and animpairment loss is recognised. Where an asset measured at cost is written down to recoverable amount, an impairment loss isrecognised in profit or loss. Where a previously revalued asset is written down to recoverable amount, the loss is recognised asa revaluation decrement in other comprehensive income. As the Department is a not-for-profit entity, unless an asset hasbeen identified as a surplus asset, the recoverable amount is the higher of an asset’s fair value less costs to sell anddepreciated replacement cost.
Non-current assets (or disposal groups) held for sale are recognised at the lower of carrying amount and fair value less costs tosell, and are disclosed separately from other assets in the Statement of Financial Position. Assets classified as held for sale arenot depreciated or amortised.
All Crown land holdings are vested in the Department by the Government. The Department of Lands is the only agency withthe power to sell Crown land. The Department transfers the Crown land and any attached buildings to DoL when the landbecomes available for sale.
(j) Leases
(h) Impairment of assets
(i) Non-current assets (or disposal groups) classified as held for sale
The recoverable amount of assets identified as surplus assets is the higher of fair value less costs to sell and the present valueof future cash flows expected to be derived from the asset. Surplus assets carried at fair value have no risk of materialimpairment where fair value is determined by reference to market-based evidence. Where fair value is determined byreference to depreciated replacement cost, surplus assets are at risk of impairment and the recoverable amount is measured.Surplus assets at cost are tested for indications of impairment at the end of each reporting period.
The risk of impairment is generally limited to circumstances where an asset’s depreciation is materially understated, where thereplacement cost is falling or where there is a significant change in useful life. Each relevant class of assets is reviewedannually to verify that the accumulated depreciation / amortisation reflects the level of consumption or expiration of theasset’s future economic benefits and to evaluate any impairment risk from falling replacement costs.
Intangible assets with an indefinite useful life and intangible assets not yet available for use are tested for impairment at theend of each reporting period irrespective of whether there is any indication of impairment.

2015–16 Annual Report | 70
(o) Inventories
Accrued salaries ( see note 26 'Payables') represent the amount due to staff but unpaid at the end of the financial year.Accrued salaries are settled within a fortnight of the financial year end. The Department considers the carrying amount ofaccrued salaries to be equivalent to its fair value.
The Department receives funding on an accrual basis. The appropriations are paid partly in cash and partly as an asset (holdingaccount receivable). The accrued amount receivable is accessible on the emergence of the cash funding requirement to coverleave entitlements and asset replacement.
· Cash and cash equivalents
(k) Financial instruments
· Financial liabilities measured at amortised cost.
· Amounts receivable for services
· Payables
For the purpose of the Statement of Cash Flows, cash and cash equivalent (and restricted cash and cash equivalent) assetscomprise cash on hand and short-term deposits with original maturities of three months or less that are readily convertible toa known amount of cash and which are subject to insignificant risk of changes in value.
Biological assets comprising of livestock are valued at fair value less estimated point of sale costs and costs necessary to getthem to market. A gain or loss on valuation is recognised in the Statement of Comprehensive Income. See note 20 ‘Biologicalassets’.
· Other liabilities
Inventories are measured at the lower of cost and net realisable value. Costs are assigned by the method most appropriate foreach particular class of inventory, with the majority being measured on a first in first out basis.
Inventories not held for resale are measured at cost unless they are no longer required, in which case they are measured atnet realisable value.
The accrued salaries suspense account (see note 16 ‘Restricted cash and cash equivalents’) consists of amounts paid annuallyinto a suspense account over a period of 10 financial years to largely meet the additional cash outflow in each eleventh yearwhen 27 pay days occur instead of the normal 26. No interest is received on this account.
(p) Biological assets
The fair value of short term receivables and payables is the transaction cost or the face value because there is no interest rateapplicable and subsequent measurement is not required as the effect of discounting is not material.
· Receivables; and
Financial assetsFinancial instruments have been disaggregated into the following classes:
· Receivables
Initial recognition and measurement of financial instruments is at fair value which normally equates to the transaction cost orthe face value. Subsequent measurement is at amortised cost using the effective interest method.
(n) Amounts receivable for services (holding account)
(m) Accrued salaries
(l) Cash and cash equivalents
Financial liabilities
· Restricted cash and cash equivalents
In addition to cash, the Department has two categories of financial instruments:
2015–16 Annual Report | 71
All annual leave and long service leave provisions are in respect of employees’ services up to the end of the reporting period.Provisions – employee benefits
(r) Payables
Deferred LeaveThe provision for deferred leave relates to Public Service employees who have entered into an agreement to self-fund anadditional 12 months leave in the fifth year of the agreement. The provision recognises the value of salary set aside foremployees to be used in the fifth year. This liability is measured on the same basis as annual leave. Deferred leave is reportedas a current provision as employees can leave the scheme at their discretion at any time.
Provisions are liabilities of uncertain timing or amount and are recognised where there is a present legal or constructiveobligation as a result of a past event and when the outflow of resources embodying economic benefits is probable and areliable estimate can be made of the amount of the obligation. Provisions are reviewed at the end of each reporting period.
Annual leave is not expected to be settled wholly within 12 months after the end of the reporting period and is thereforeconsidered to be ‘other long term employee benefits’. The annual leave liability is recognised and measured at the presentvalue of amounts expected to be paid when the liabilities are settled using the remuneration rate expected to apply at thetime of settlement.
When assessing expected future payments consideration is given to expected future wage and salary levels including non-salary components such as employer superannuation contributions, as well as the experience of employee departures andperiods of service. The expected future payments are discounted using market yields at the end of the reporting period onnational government bonds with terms to maturity that match, as closely as possible, the estimated future cash outflows.
Unconditional long service leave provisions are classified as current liabilities as the Department does not have anunconditional right to defer settlement of the liability for at least 12 months after the end of the reporting period. Pre-conditional and conditional long service leave provisions are classified as non-current liabilities because the Department hasan unconditional right to defer the settlement of the liability until the employee has completed the requisite years of service.
When assessing expected future payments consideration is given to expected future wage and salary levels including non-salary components such as employer superannuation contributions, as well as the experience of employee departures andperiods of service. The expected future payments are discounted using market yields at the end of the reporting period onnational government bonds with terms to maturity that match, as closely as possible, the estimated future cash outflows.
The provision for annual leave is classified as a current liability as the Department does not have an unconditional right todefer settlement of the liability for at least 12 months after the end of the reporting period.
Receivables are recognised at original invoice amount less an allowance for any uncollectible amounts (i.e. impairment). Thecollectability of receivables is reviewed on an ongoing basis and any receivables identified as uncollectible are written-offagainst the allowance account. The allowance for uncollectible amounts (doubtful debts) is raised when there is objectiveevidence that the Department will not be able to collect the debts. The carrying amount is equivalent to fair value as it is duefor settlement within 30 days.
Annual leave
(s) Provisions
(q) Receivables
Payables are recognised at the amount payable when the Department becomes obliged to make future payments as a resultof a purchase of assets or services. The carrying amount is equivalent to fair value, as settlement is generally within 30 days.
Long service leaveLong service leave is not expected to be settled wholly within 12 months after the end of the reporting period and is thereforerecognised and measured at the present value of amounts expected to be paid when the liabilities are settled using theremuneration rate expected to apply at the time of settlement.
2015–16 Annual Report | 72
The GSS is a defined benefit scheme for the purposes of employees and whole-of-government reporting. However, it is adefined contribution plan for agency purposes because the concurrent contributions (defined contributions) made by theDepartment to GESB extinguishes the agency’s obligations to the related superannuation liability.
The Government Employees Superannuation Board (GESB) and other fund providers administer public sector superannuationarrangements in Western Australia in accordance with legislative requirements. Eligibility criteria for membership in particularschemes for public sector employee vary according to commencement and implementation dates.
Assets or services received from other State Government agencies are separately disclosed under Income from StateGovernment in the Statement of Comprehensive Income.
Assets or services received free of charge or for nominal cost that the Department would otherwise purchase if not donated,are recognised as income at the fair value of the assets or services where they can be reliably measured. A correspondingexpense is recognised for services received. Receipts of assets are recognised in the Statement of Financial Position.
The Department has no liabilities under the Pension Scheme or the GSS. The liabilities for the unfunded Pension Scheme andthe unfunded GSS transfer benefits attributable to members who transferred from the Pension Scheme, are assumed by theTreasurer. All other GSS obligations are funded by concurrent contributions made by the Department to the GESB.
Eligible employees contribute to the Pension Scheme, a defined benefit pension scheme closed to new members since 1987,or the Gold State Superannuation Scheme (GSS), a defined benefit lump sum scheme closed to new members since 1995.
Superannuation
The GESB makes all benefit payments in respect of the Pension Scheme and GSS, and is recouped from the Treasurer for theemployer’s share.
Superannuation expenses is recognised in the profit or loss of the Statement of Comprehensive Income and comprises ofemployer contributions paid to the GSS (concurrent contributions), the WSS, the GESBS, or other superannuation funds. Theemployer contribution paid to the GESB in respect of the GSS is paid back into the Consolidated Account by the GESB.
(t) Superannuation expense
Employment on-costs, including workers’ compensation insurance, are not employee benefits and are recognised separatelyas liabilities and expenses when the employment to which they relate has occurred. Employment on-costs are included as partof ‘Other expenses’ and are not included as part of the Department’s ‘Employee benefits expense’. The related liability isincluded in 'Employment on-costs provision'.
(u) Assets and services received free of charge or for nominal cost
(v) Comparative figures
Employment on-costs
Employees commencing employment prior to 16 April 2007 who were not members of either the Pension Scheme or the GSSbecame non-contributory members of the West State Superannuation Scheme (WSS). Employees commencing employmenton or after 16 April 2007 became members of the GESB Super Scheme (GESBS). From 30 March 2012, existing members of theWSS or GESBS and new employees have been able to choose their preferred superannuation fund provider. The Departmentmakes contributions to GESB or other fund providers on behalf of employees in compliance with the Commonwealth Government’s Superannuation Guarantee (Administration) Act 1992 . Contributions to these accumulation schemes extinguishthe Department's liability for superannuation charges in respect of employees who are not members of the Pension Scheme orGSS.
Comparative figures are, where appropriate, reclassified to be comparable with the figures presented in the current financialyear.
Provisions – other
2015–16 Annual Report | 73
Note 3. Judgements made by management in applying accounting policies
Note 4. Key sources of estimation uncertainty
Several estimations and assumptions used in calculating the Department’s long service leave provision include expected futuresalary rates, discount rates, employee retention rates and expected future payments. Changes in these estimations andassumptions may impact on the carrying amount of the long service leave provision.
Long service leave
The Department has entered into a number of leases for buildings for branch office accommodation. Some of these leasesrelate to buildings of a temporary nature and it has been determined that the lessor retains substantially all the risks andrewards incidental to ownership. Accordingly, these leases have been classified as operating leases.
The preparation of financial statements requires management to make judgements about the application of accountingpolicies that have a significant effect on the amounts recognised in the financial statements. The Department evaluates thesejudgements regularly.
Impairment of intangible assets are assessed at the end of each reporting period. The impact of impairment of intangibleassets is minimal. Where there is an indication of impairment (such as falling replacement costs), the recoverable amount(depreciated replacement cost) of the intangible asset is estimated.
Operating lease commitments
Key estimates and assumptions concerning the future are based on historical experience and various other factors that have asignificant risk of causing a material adjustment to the carrying amount of assets and liabilities within the next financial year.
Impairment of intangible assets with indefinite useful lives
2015–16 Annual Report | 74
Note 5. Disclosure of changes in accounting policy and estimates
AASB 2013-9
AASB 2014-8
AASB 2015-3
The Department has made a change to its revenue recognition policy for administered item revenue as disclosed in note 2(e).Effective 1 July 2015 The Department recognises administered item revenue for the Temporary Worker (Skilled) Visa Holder(Subclass 457) Child School Fee when cash is received.
The Department acts as a collection agency for 457 Visa School Fee for the Department of Education. Fees collected by theDepartment are directed by the School Education Act 1999 and School Education Regulations 2000.
The 2014–15 comparatives have been restated to reflect this change in the policy. The impact of this accounting policy changeis a decrease in administered item revenue of $2.969m and administered receivables of $2.969m for 2014–15. Thisrestatement is disclosed in notes 42 to 44.
Voluntary changes in accounting policy
Amendments to Australian Accounting Standards - Conceptual Framework, Materiality and FinancialInstruments
Part C of this Standard defers the application of AASB 9 to 1 January 2017. The application date of AASB 9was subsequently deferred to 1 January 2018 by AASB 2014-1. The Department has not yet determinedthe application or the potential impact of AASB 9.
The Department has applied the following Australian Accounting Standards effective for annual reporting periods beginningon or after 1 July 2015 that impacted on the Department.
Initial application of an Australian Accounting Standard
Amendments to Australian Accounting Standards arising from AASB 9 (December 2014) – Application ofAASB 9 (December 2009) and AASB 9 (December 2010) [AASB 9 (2009 & 2010)]
This Standard makes amendments to AASB 9 Financial Instruments (December 2009) and AASB 9 FinancialInstruments (December 2010), arising from the issuance of AASB 9 Financial Instruments in December2014. The Department has not yet determined the application or the potential impact of AASB 9.
Amendments to Australian Accounting Standards arising from the Withdrawal of AASB 1031 Materiality
This Standard completes the withdrawal of references to AASB 1031 in all Australian AccountingStandards and Interpretations, allowing that Standard to effectively be withdrawn. There is no financialimpact.
2015–16 Annual Report | 75
Operative for reporting periods beginning on / after
AASB 9 1 Jan 2018
AASB 15 1 Jan 2018
AASB 16 1 Jan 2019
AASB 1057 1 Jan 2016
Future impact of Australian Accounting Standards not yet operative
The Department cannot early adopt an Australian Accounting Standard unless specifically permitted by TI 1101 Application ofAustralian Accounting Standards and Other Pronouncements or by an exemption from TI 1101. By virtue of a limitedexemption, the Department has early adopted AASB 2015-7 Amendments to Australian Accounting Standards - Fair ValueDisclosures of Not-for-Profit Public Sector Entities. Where applicable, the Department plans to apply the following AustralianAccounting Standards from their application date.
Financial Instruments
This Standard supersedes AASB 139 Financial Instruments:Recognition and Measurement, introducing a number ofchanges to accounting treatments.
The mandatory application date of this Standard is currently1 January 2018 after being amended by AASB 2012-6, AASB2013-9 and AASB 2014-1 Amendments to AustralianAccounting Standards . The Department has not yetdetermined the application or the potential impact of theStandard.
Application of Australian Accounting Standards
This Standard lists the application paragraphs for each otherStandard (and Interpretation), grouped where they are thesame. There is no financial impact.
Revenue from Contracts with Customers
This Standard establishes the principles that the Departmentshall apply to report useful information to users of financialstatements about the nature, amount, timing anduncertainty of revenue and cash flows arising from acontract with a customer. The Department has not yetdetermined the application or the potential impact of theStandard.
Leases
This Standard introduces a single lessee accounting modeland requires a lessee to recognise assets and liabilities for allleases with a term of more than 12 months, unless theunderlying asset is of low value. The Department has not yetdetermined the application or the potential impact of theStandard.
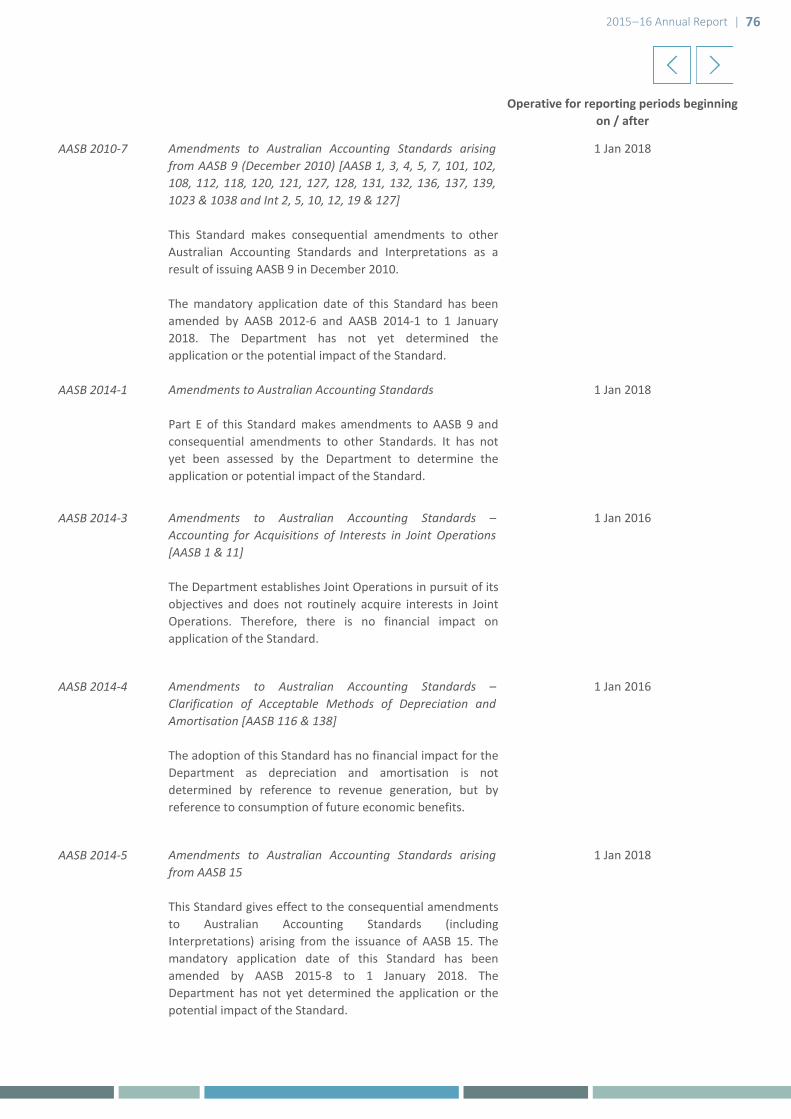
2015–16 Annual Report | 76
Operative for reporting periods beginning on / after
AASB 2010-7 1 Jan 2018
AASB 2014-1 1 Jan 2018
AASB 2014-3 1 Jan 2016
AASB 2014-4 1 Jan 2016
AASB 2014-5 1 Jan 2018
Amendments to Australian Accounting Standards
Part E of this Standard makes amendments to AASB 9 andconsequential amendments to other Standards. It has notyet been assessed by the Department to determine theapplication or potential impact of the Standard.
Amendments to Australian Accounting Standards –Accounting for Acquisitions of Interests in Joint Operations[AASB 1 & 11]
The Department establishes Joint Operations in pursuit of itsobjectives and does not routinely acquire interests in JointOperations. Therefore, there is no financial impact onapplication of the Standard.
Amendments to Australian Accounting Standards –Clarification of Acceptable Methods of Depreciation andAmortisation [AASB 116 & 138]
The adoption of this Standard has no financial impact for theDepartment as depreciation and amortisation is notdetermined by reference to revenue generation, but byreference to consumption of future economic benefits.
Amendments to Australian Accounting Standards arisingfrom AASB 15
This Standard gives effect to the consequential amendmentsto Australian Accounting Standards (includingInterpretations) arising from the issuance of AASB 15. Themandatory application date of this Standard has beenamended by AASB 2015-8 to 1 January 2018. TheDepartment has not yet determined the application or thepotential impact of the Standard.
Amendments to Australian Accounting Standards arisingfrom AASB 9 (December 2010) [AASB 1, 3, 4, 5, 7, 101, 102,108, 112, 118, 120, 121, 127, 128, 131, 132, 136, 137, 139,1023 & 1038 and Int 2, 5, 10, 12, 19 & 127]
This Standard makes consequential amendments to otherAustralian Accounting Standards and Interpretations as aresult of issuing AASB 9 in December 2010.
The mandatory application date of this Standard has beenamended by AASB 2012-6 and AASB 2014-1 to 1 January2018. The Department has not yet determined theapplication or the potential impact of the Standard.

2015–16 Annual Report | 77
Operative for reporting periods beginning on / after
AASB 2014-7 1 Jan 2018
AASB 2014-9 1 Jan 2016
AASB 2014-10 1 Jan 2016
AASB 2015-1 1 Jan 2016
Amendments to Australian Accounting Standards arisingfrom AASB 9 (December 2014)
This Standard gives effect to the consequential amendmentsto Australian Accounting Standards (includingInterpretations) arising from the issuance of AASB 9(December 2014). The Department has not yet determinedthe application or the potential impact of the Standard.
Amendments to Australian Accounting Standards – EquityMethod in Separate Financial Statements [AASB 1, 127 &128]
This Standard amends AASB 127, and consequentiallyamends AASB 1 and AASB 128, to allow entities to use theequity method of accounting for investments in subsidiaries,joint ventures and associates in their separate financialstatements. The Department has not yet determined theapplication or the potential impact of the Standard.
Amendments to Australian Accounting Standards – Sale orContribution of Assets between an Investor and its Associateor Joint Venture [AASB 10 & 128]
This Standard amends AASB 10 and AASB 128 to address aninconsistency between the requirements in AASB 10 andthose in AASB 128 (August 2011), in dealing with the sale orcontribution of assets between an investor and its associateor joint venture. The Department has not yet determinedthe application or the potential impact of the Standard.
Amendments to Australian Accounting Standards – AnnualImprovements to Australian Accounting Standards2012–2014 Cycle [AASB 1, 2, 3, 5, 7, 11, 110, 119, 121, 133,134, 137 & 140]
These amendments arise from the issuance of InternationalFinancial Reporting Standard Annual Improvements to IFRSs2012–2014 Cycle in September 2014, and editorialcorrections. The Department has not yet determined theapplication or the potential impact of the Standard.

2015–16 Annual Report | 78
Operative for reporting periods beginning on / after
AASB 2015-2 1 Jan 2016
AASB 2015-6 1 Jul 2016
AASB 2015-8 1 Jan 2017
AASB 2015-10 1 Jan 2016Amendments to Australian Accounting Standards – EffectiveDate of Amendments to AASB 10 & 128
This Standard defers the mandatory effective date(application date) of amendments to AASB 10 & 128 thatwere originally made in AASB 2014-10 so that theamendments are required to be applied for annual reportingperiods beginning on or after 1 January 2018 instead of 1January 2016. The Department has not yet determined theapplication or the potential impact of AASB 2014-10.
Amendments to Australian Accounting Standards –Disclosure Initiative: Amendments to AASB 101 [AASB 7, 101, 134 & 1049]
This Standard amends AASB 101 to provide clarificationregarding the disclosure requirements in AASB 101.Specifically, the Standard proposes narrow-focusamendments to address some of the concerns expressedabout existing presentation and disclosure requirements andto ensure entities are able to use judgement when applyinga Standard in determining what information to disclose intheir financial statements. There is no financial impact.
Amendments to Australian Accounting Standards –Extending Related Party Disclosures to Not-for-Profit PublicSector Entities [AASB 10, 124 & 1049]
The amendments extend the scope of AASB 124 to includeapplication by not-for-profit public sector entities.Implementation guidance is included to assist application ofthe Standard by not-for-profit public sector entities. TheDepartment has not yet determined the application of theStandard, though there is no financial impact.
Amendments to Australian Accounting Standards – EffectiveDate of AASB 15
This Standard amends the mandatory effective date(application date) of AASB 15 Revenue from Contracts withCustomers so that AASB 15 is required to be applied forannual reporting periods beginning on or after 1 January2018 instead of 1 January 2017. The Department has not yetdetermined the application or the potential impact of AASB15.

2015–16 Annual Report | 79
Operative for reporting periods beginning on / after
AASB 2016-2 1 Jan 2017
AASB 2016-3 1 Jan 2018
AASB 2016-4 1 Jan 2017
Amendments to Australian Accounting Standards –Disclosure Initiative: Amendments to AASB 107
This Standard amends AASB 107 Statement of Cash Flows(August 2015) to require disclosures that enable users offinancial statements to evaluate changes in liabilities arisingfrom financing activities, including both changes arising fromcash flows and non-cash changes. There is no financialimpact.
Amendments to Australian Accounting Standards –Clarifications to AASB 15
This Standard clarifies identifying performance obligations,principal versus agent considerations, timing of recognisingrevenue from granting a licence, and, provides furthertransitional provisions to AASB 15. The Department has notyet determined the application or the potential impact.
There have been no changes in accounting estimates in the 2015–16 Financial Statements.Changes in accounting estimates
Amendments to Australian Accounting Standards –Recoverable Amount of Non-Cash-Generating SpecialisedAssets of Not-for-Profit Entities
This Standard clarifies that the recoverable amount ofprimarily non-cash-generating assets of not-for-profitentities, which are typically specialised in nature and held forcontinuing use of their service capacity, is expected to bematerially the same as fair value determined under AASB 13Fair Value Measurement. The Department has not yetdetermined the application or the potential impact.
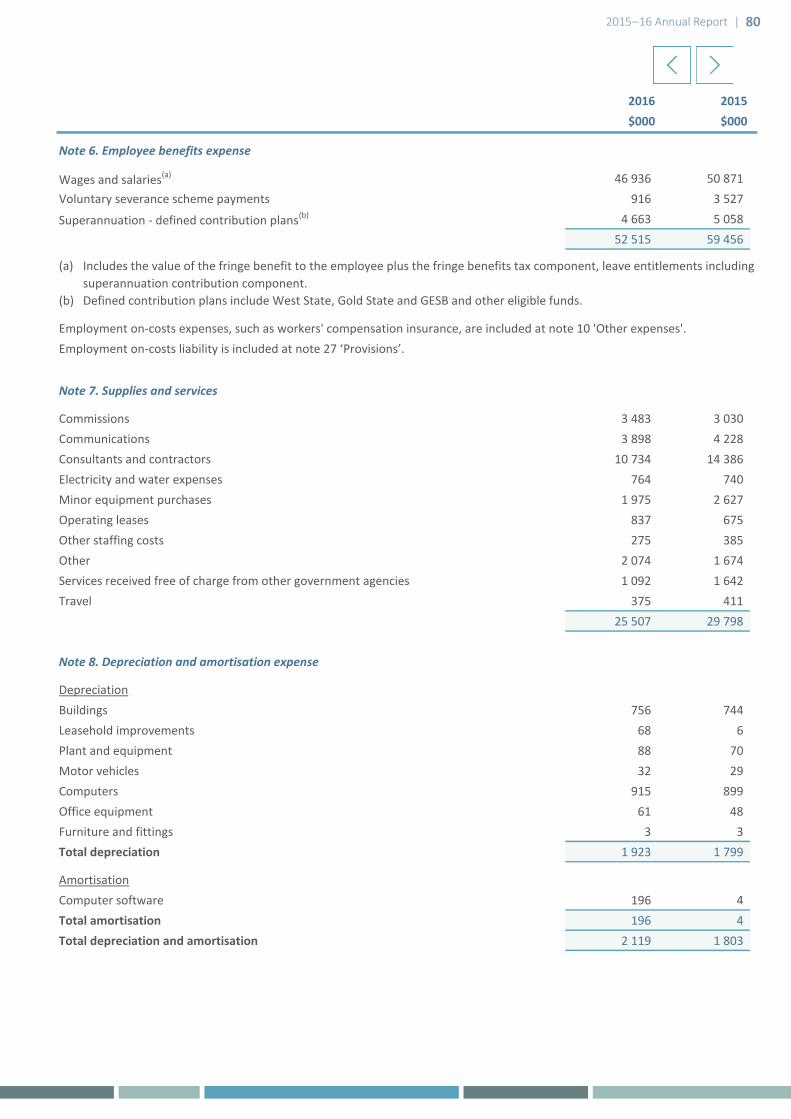
2015–16 Annual Report | 80
2016 2015$000 $000
Note 6. Employee benefits expense
Wages and salaries(a) 46 936 50 871 Voluntary severance scheme payments 916 3 527
Superannuation - defined contribution plans(b) 4 663 5 058 52 515 59 456
(b)
Note 7. Supplies and services
Commissions 3 483 3 030 Communications 3 898 4 228 Consultants and contractors 10 734 14 386 Electricity and water expenses 764 740 Minor equipment purchases 1 975 2 627 Operating leases 837 675 Other staffing costs 275 385 Other 2 074 1 674 Services received free of charge from other government agencies 1 092 1 642 Travel 375 411
25 507 29 798
Note 8. Depreciation and amortisation expense
DepreciationBuildings 756 744 Leasehold improvements 68 6 Plant and equipment 88 70 Motor vehicles 32 29 Computers 915 899 Office equipment 61 48 Furniture and fittings 3 3 Total depreciation 1 923 1 799
AmortisationComputer software 196 4 Total amortisation 196 4 Total depreciation and amortisation 2 119 1 803
Includes the value of the fringe benefit to the employee plus the fringe benefits tax component, leave entitlements including superannuation contribution component.Defined contribution plans include West State, Gold State and GESB and other eligible funds.
(a)
Employment on-costs expenses, such as workers' compensation insurance, are included at note 10 'Other expenses'. Employment on-costs liability is included at note 27 ‘Provisions’.
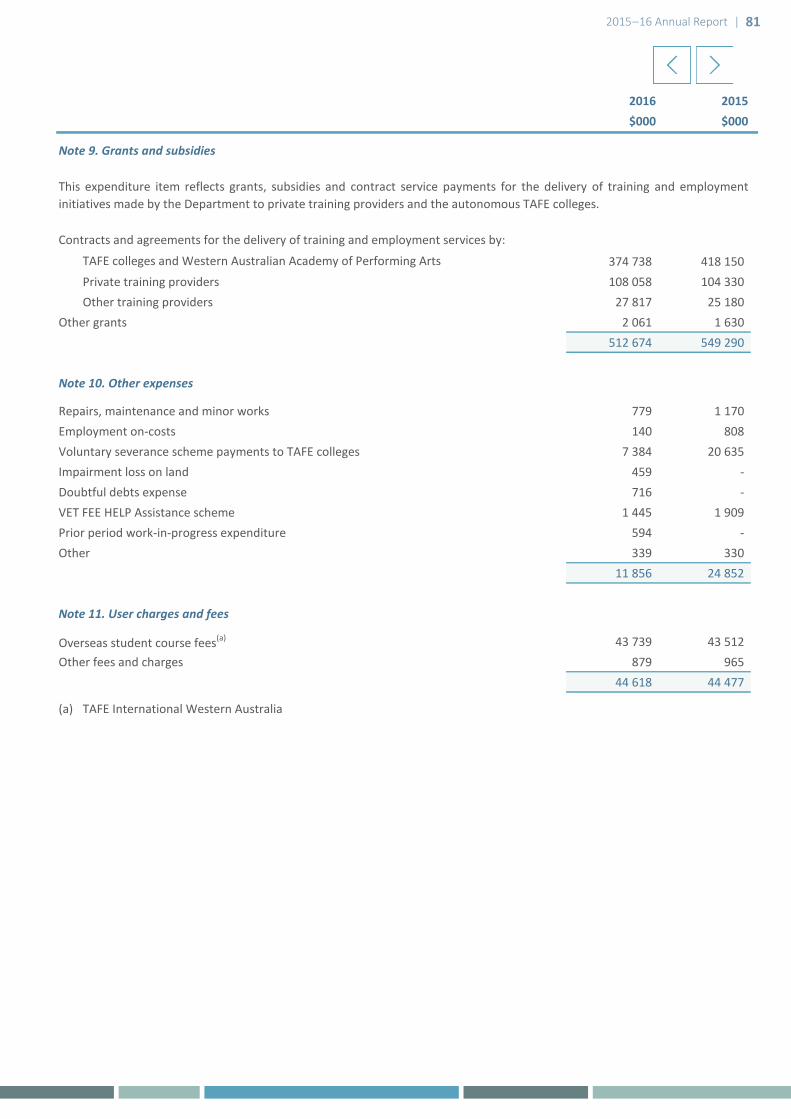
2015–16 Annual Report | 81
2016 2015$000 $000
Note 9. Grants and subsidies
374 738 418 150 Private training providers 108 058 104 330 Other training providers 27 817 25 180
Other grants 2 061 1 630 512 674 549 290
Note 10. Other expenses
Repairs, maintenance and minor works 779 1 170 Employment on-costs 140 808 Voluntary severance scheme payments to TAFE colleges 7 384 20 635 Impairment loss on land 459 - Doubtful debts expense 716 - VET FEE HELP Assistance scheme 1 445 1 909 Prior period work-in-progress expenditure 594 - Other 339 330
11 856 24 852
Note 11. User charges and fees
Overseas student course fees(a) 43 739 43 512 Other fees and charges 879 965
44 618 44 477
(a) TAFE International Western Australia
This expenditure item reflects grants, subsidies and contract service payments for the delivery of training and employmentinitiatives made by the Department to private training providers and the autonomous TAFE colleges.
TAFE colleges and Western Australian Academy of Performing Arts
Contracts and agreements for the delivery of training and employment services by:

2015–16 Annual Report | 82
2016 2015$000 $000
Note 12. Commonwealth grants and contributions
Commonwealth grants 198 824 200 695 198 824 200 695
Undischarged grants
COAG National Partnership Program 1 202 2 481 COPE 318 424 Special projects - other 232 230
1 752 3 135
Note 13. Other revenue
Commissions 319 427 Impairment losses reversed during the period - 73 Other miscellaneous revenue 271 325 Recoveries and refunds 1 085 13 Rental premises 754 452 Sale of goods and services 1 990 1 270 Service revenue 4 030 5 430
8 449 7 990
Note 14. Net gain / (loss) on disposal of non-current assets
Net proceeds from disposal of non-current assetsLand 1 805 - Plant, equipment and motor vehicles 18 - Computers - - Office equipment - -
1 823 -
Carrying amount of non-current assets disposedLand - - Plant, equipment and motor vehicles 10 6 Computers 19 - Office equipment 9 -
38 6 Net gain / (loss) 1 785 (6)
The Department receives certain Commonwealth grants on the condition that the monies shall be expended in a particularmanner. Grants of this nature which are yet to be fully spent as at the balance sheet date do not constitute a liability and aredetailed below:

2015–16 Annual Report | 83
2016 2015$000 $000
Note 15. Income from State Government
Appropriation received during the period:
Service appropriation(a) 366 368 439 711 366 368 439 711
Department of Education 83 365 Department of Finance 891 1 161 Landgate 4 31 State Solicitors' Office 114 85
1 092 1 642
Royalties for Regions Fund:
Regional Community Services Fund(b) 7 853 3 256
Regional Infrastructure and Headworks Fund(b) 329 1 100 8 182 4 356
375 642 445 709
(b)
Services received free of charge from other State Government agencies during theperiod:
Service appropriations fund the net cost of services delivered. Appropriation revenue comprises a cash component and areceivable (asset). The receivable (holding account) comprises the budgeted depreciation expense for the year and anyagreed increase in leave liabilities during the year.
This is a sub-fund within the over-arching ‘Royalties for Regions Fund’. The recurrent funds are committed to projects andprograms in WA regional areas.
(a)
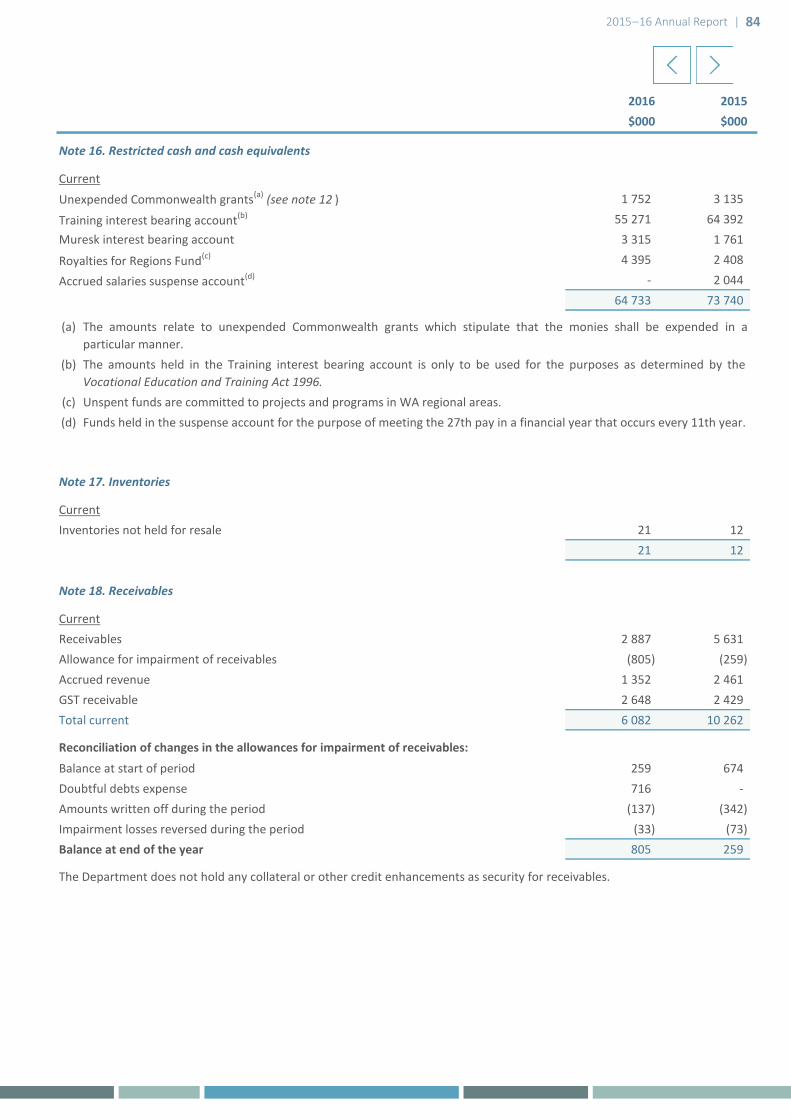
2015–16 Annual Report | 84
2016 2015$000 $000
Note 16. Restricted cash and cash equivalents
Current 1 752 3 135
Training interest bearing account(b) 55 271 64 392 Muresk interest bearing account 3 315 1 761
Royalties for Regions Fund(c) 4 395 2 408
Accrued salaries suspense account(d) - 2 044 64 733 73 740
(c)
Note 17. Inventories
CurrentInventories not held for resale 21 12
21 12
Note 18. Receivables
CurrentReceivables 2 887 5 631 Allowance for impairment of receivables (805) (259)Accrued revenue 1 352 2 461 GST receivable 2 648 2 429 Total current 6 082 10 262
Balance at start of period 259 674 Doubtful debts expense 716 - Amounts written off during the period (137) (342)Impairment losses reversed during the period (33) (73)Balance at end of the year 805 259
The Department does not hold any collateral or other credit enhancements as security for receivables.
Reconciliation of changes in the allowances for impairment of receivables:
Unexpended Commonwealth grants(a) (see note 12 )
The amounts relate to unexpended Commonwealth grants which stipulate that the monies shall be expended in aparticular manner.The amounts held in the Training interest bearing account is only to be used for the purposes as determined by theVocational Education and Training Act 1996.
Funds held in the suspense account for the purpose of meeting the 27th pay in a financial year that occurs every 11th year.
(a)
(b)
(d)Unspent funds are committed to projects and programs in WA regional areas.

2015–16 Annual Report | 85
2016 2015$000 $000
Note 19. Other assets
Prepayments 3 262 941 3 262 941
Note 20. Biological assets
Livestock 284 240 284 240
Note 21. Amounts receivable for services (Holding account)
Non-current 37 017 35 810 37 017 35 810
Represents the non-cash component of service appropriations. It is restricted in that it can only be used for asset replacement or payment of leave liability.

2015–16 Annual Report | 86
2016 2015$000 $000
Note 22. Property, plant and equipmentLand
At fair value(a) 11 701 12 160 11 701 12 160
Buildings
At fair value(a) 26 257 27 423 26 257 27 423
Leasehold ImprovementsAt cost 476 476 Accumulated amortisation (74) (6)
402 470 Plant and equipmentAt cost 590 390 Accumulated depreciation (245) (172)
345 218 Motor vehiclesAt cost 159 159 Accumulated depreciation (65) (33)
94 126 Computers At cost 3 337 3 718 Accumulated depreciation (2 507) (1 906)
830 1 812 Office equipmentAt cost 569 359 Accumulated depreciation (447) (240)
122 119 ArtworkAt fair value 111 111
111 111 Furniture and fittingsAt cost 33 33 Accumulated depreciation (11) (7)
22 26 Capital works in progressAt cost 35 642 34 851
35 642 34 851 Total property, plant and equipment 75 526 77 316
Information on fair value measurements is provided in Note 23.
Land and buildings were revalued as at 1 July 2015 by the Western Australian Land Information Authority (ValuationServices). The valuations were performed during the year ended 30 June 2016 and recognised at 30 June 2016. Inundertaking the revaluation, fair value was determined by reference to current use for land: $11 701 000 (2015: $12 160000) and depreciated replacement cost for buildings: $26 257 410 (2015: $27 423 160).
(a)
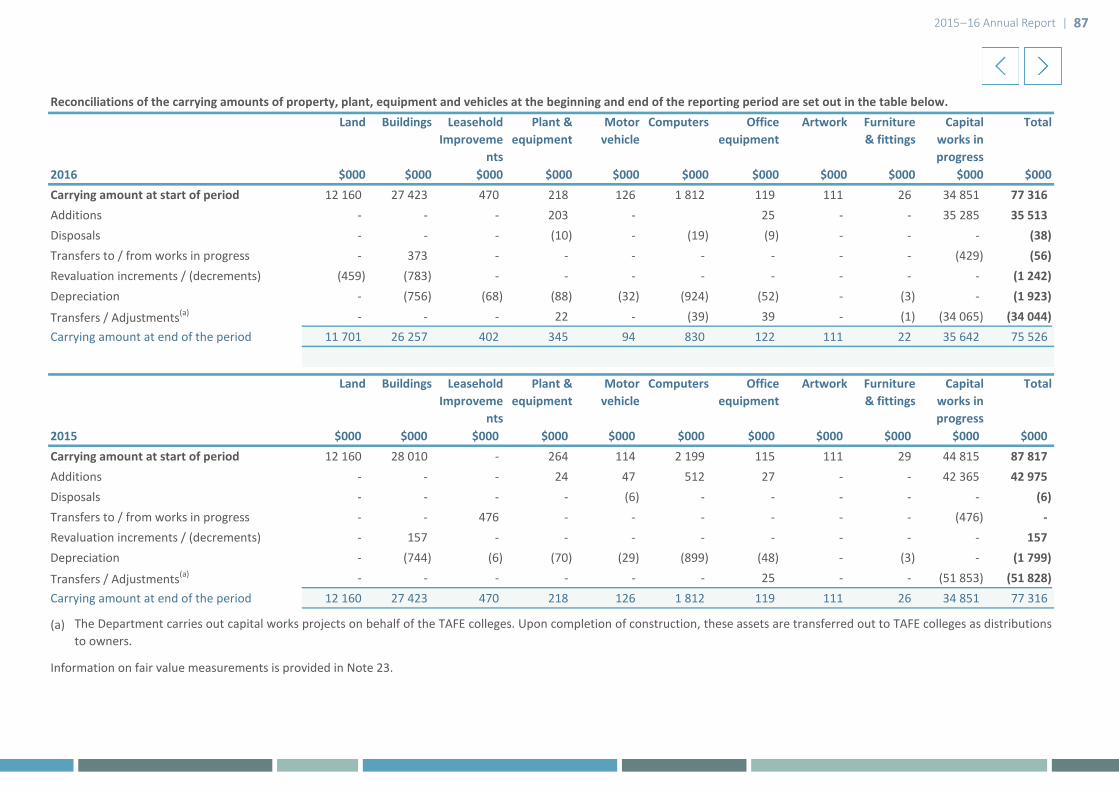
2015–16 Annual Report | 87
2016 $000 $000 $000 $000 $000 $000 $000 $000 $000 $000 $000Carrying amount at start of period 12 160 27 423 470 218 126 1 812 119 111 26 34 851 77 316 Additions - - - 203 - 25 - - 35 285 35 513 Disposals - - - (10) - (19) (9) - - - (38)Transfers to / from works in progress - 373 - - - - - - - (429) (56)Revaluation increments / (decrements) (459) (783) - - - - - - - - (1 242)Depreciation - (756) (68) (88) (32) (924) (52) - (3) - (1 923)
Transfers / Adjustments(a) - - - 22 - (39) 39 - (1) (34 065) (34 044)Carrying amount at end of the period 11 701 26 257 402 345 94 830 122 111 22 35 642 75 526
2015 $000 $000 $000 $000 $000 $000 $000 $000 $000 $000 $000Carrying amount at start of period 12 160 28 010 - 264 114 2 199 115 111 29 44 815 87 817 Additions - - - 24 47 512 27 - - 42 365 42 975 Disposals - - - - (6) - - - - - (6)Transfers to / from works in progress - - 476 - - - - - - (476) - Revaluation increments / (decrements) - 157 - - - - - - - - 157 Depreciation - (744) (6) (70) (29) (899) (48) - (3) - (1 799)
Transfers / Adjustments(a) - - - - - - 25 - - (51 853) (51 828)Carrying amount at end of the period 12 160 27 423 470 218 126 1 812 119 111 26 34 851 77 316
(a)
Information on fair value measurements is provided in Note 23.
The Department carries out capital works projects on behalf of the TAFE colleges. Upon completion of construction, these assets are transferred out to TAFE colleges as distributionsto owners.
Land
Total Capital works in progress
Artwork TotalFurniture & fittings
Artwork Plant & equipment
Motor vehicle
Reconciliations of the carrying amounts of property, plant, equipment and vehicles at the beginning and end of the reporting period are set out in the table below.Plant &
equipmentComputers
Furniture & fittings
Office equipment
Buildings
Land
Motor vehicle
Office equipment
Leasehold Improveme
nts
Leasehold Improveme
nts
Computers
Capital works in progress
Buildings
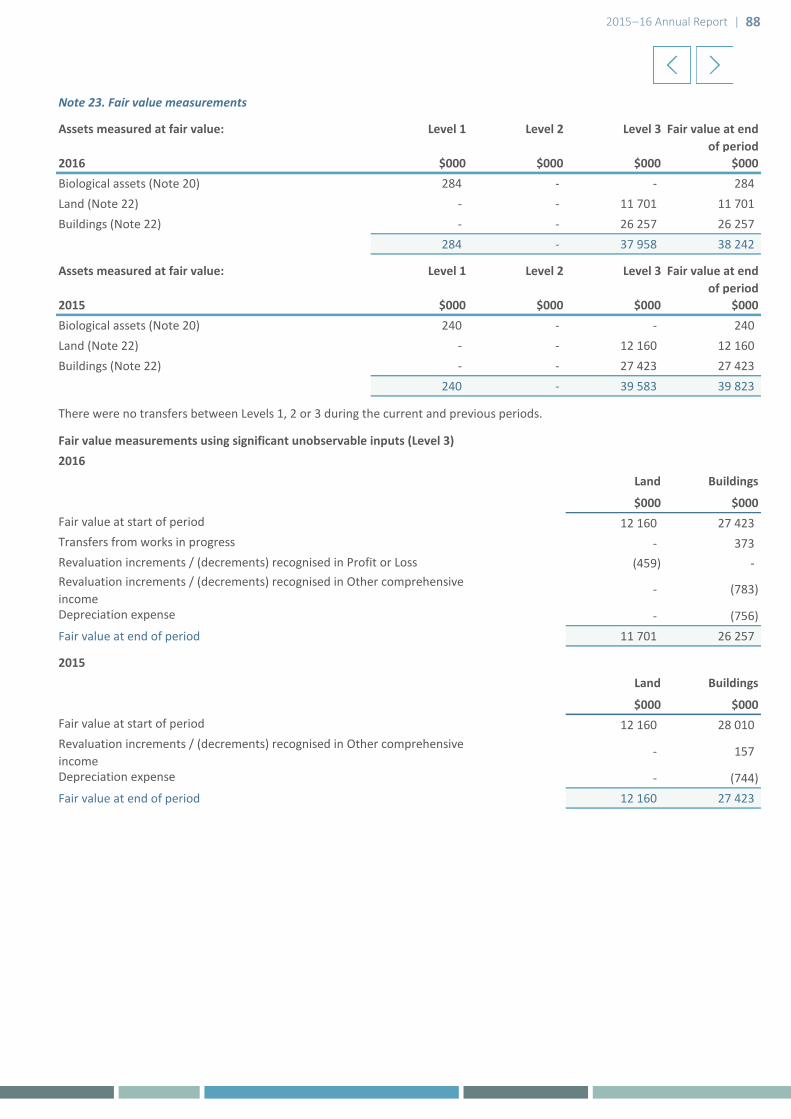
2015–16 Annual Report | 88
Note 23. Fair value measurements
Assets measured at fair value: Level 1 Level 2 Level 3 Fair value at end of period
2016 $000 $000 $000 $000Biological assets (Note 20) 284 - - 284 Land (Note 22) - - 11 701 11 701 Buildings (Note 22) - - 26 257 26 257
284 - 37 958 38 242
Assets measured at fair value: Level 1 Level 2 Level 3 Fair value at end of period
2015 $000 $000 $000 $000Biological assets (Note 20) 240 - - 240 Land (Note 22) - - 12 160 12 160 Buildings (Note 22) - - 27 423 27 423
240 - 39 583 39 823
Fair value measurements using significant unobservable inputs (Level 3)2016
Land Buildings
$000 $000Fair value at start of period 12 160 27 423 Transfers from works in progress - 373
(459) -
- (783)
Depreciation expense - (756)Fair value at end of period 11 701 26 257
2015Land Buildings
$000 $000Fair value at start of period 12 160 28 010
- 157
Depreciation expense - (744)Fair value at end of period 12 160 27 423
Revaluation increments / (decrements) recognised in Other comprehensive income
There were no transfers between Levels 1, 2 or 3 during the current and previous periods.
Revaluation increments / (decrements) recognised in Other comprehensive income
Revaluation increments / (decrements) recognised in Profit or Loss
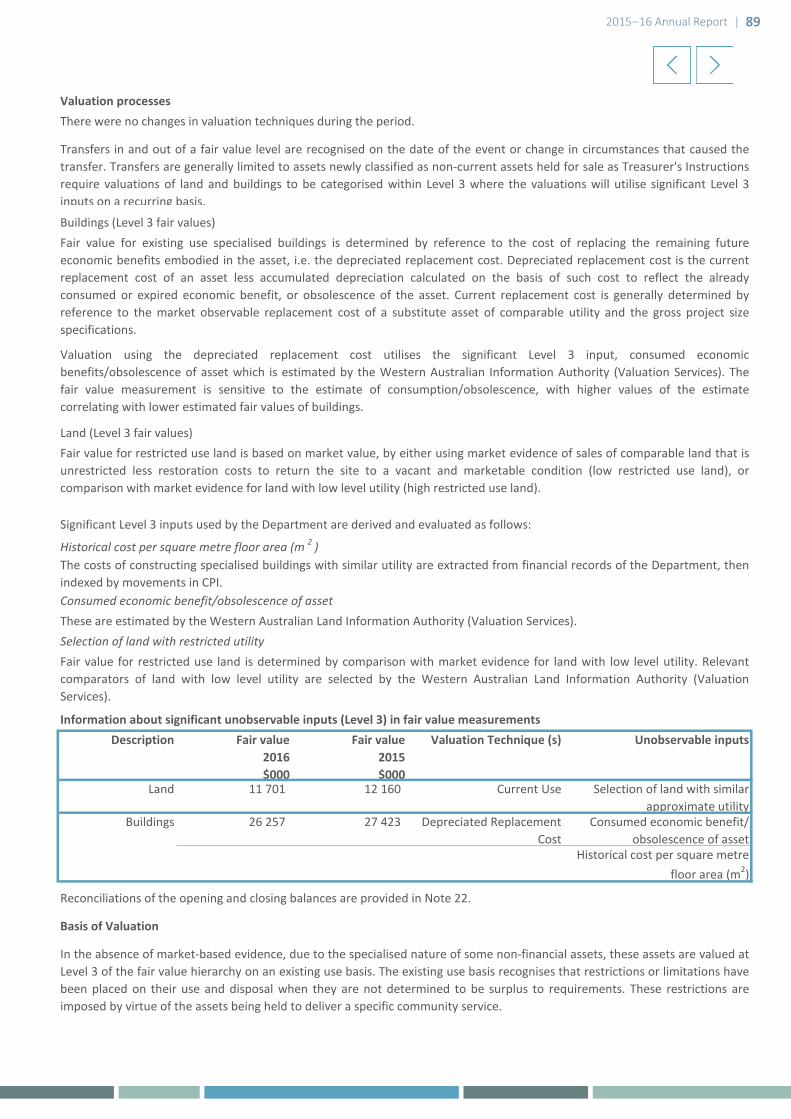
2015–16 Annual Report | 89
Valuation processes
Buildings (Level 3 fair values)
Land (Level 3 fair values)
Information about significant unobservable inputs (Level 3) in fair value measurements
Land 11 701 12 160 Current Use Selection of land with similar approximate utility
26 257 27 423 Depreciated Replacement Cost
Consumed economic benefit/ obsolescence of asset
Historical cost per square metre floor area (m2)
Fair value for restricted use land is determined by comparison with market evidence for land with low level utility. Relevantcomparators of land with low level utility are selected by the Western Australian Land Information Authority (ValuationServices).
Historical cost per square metre floor area (m 2 )The costs of constructing specialised buildings with similar utility are extracted from financial records of the Department, thenindexed by movements in CPI.Consumed economic benefit/obsolescence of assetThese are estimated by the Western Australian Land Information Authority (Valuation Services).Selection of land with restricted utility
There were no changes in valuation techniques during the period.
Transfers in and out of a fair value level are recognised on the date of the event or change in circumstances that caused thetransfer. Transfers are generally limited to assets newly classified as non-current assets held for sale as Treasurer's Instructionsrequire valuations of land and buildings to be categorised within Level 3 where the valuations will utilise significant Level 3inputs on a recurring basis.
Fair value for existing use specialised buildings is determined by reference to the cost of replacing the remaining futureeconomic benefits embodied in the asset, i.e. the depreciated replacement cost. Depreciated replacement cost is the currentreplacement cost of an asset less accumulated depreciation calculated on the basis of such cost to reflect the alreadyconsumed or expired economic benefit, or obsolescence of the asset. Current replacement cost is generally determined byreference to the market observable replacement cost of a substitute asset of comparable utility and the gross project sizespecifications.
Fair value for restricted use land is based on market value, by either using market evidence of sales of comparable land that isunrestricted less restoration costs to return the site to a vacant and marketable condition (low restricted use land), orcomparison with market evidence for land with low level utility (high restricted use land).
Significant Level 3 inputs used by the Department are derived and evaluated as follows:
Valuation using the depreciated replacement cost utilises the significant Level 3 input, consumed economicbenefits/obsolescence of asset which is estimated by the Western Australian Information Authority (Valuation Services). Thefair value measurement is sensitive to the estimate of consumption/obsolescence, with higher values of the estimatecorrelating with lower estimated fair values of buildings.
In the absence of market-based evidence, due to the specialised nature of some non-financial assets, these assets are valued atLevel 3 of the fair value hierarchy on an existing use basis. The existing use basis recognises that restrictions or limitations havebeen placed on their use and disposal when they are not determined to be surplus to requirements. These restrictions areimposed by virtue of the assets being held to deliver a specific community service.
Buildings
Description Fair value2016$000
Fair value2015$000
Valuation Technique (s) Unobservable inputs
Basis of Valuation
Reconciliations of the opening and closing balances are provided in Note 22.

2015–16 Annual Report | 90
2016 2015$000 $000
Note 24. Intangible assets
Computer softwareAt cost 2 573 91 Accumulated amortisation (200) (4)
2 373 87
Work in progress (internally developed software)At cost 2 538 3 711
2 538 3 711
4 911 3 798 Reconciliations
Computer softwareCarrying amount at start of period 87 - Transfer from work in progress 2 482 91 Amortisation expense (196) (4)Carrying amount at end of period 2 373 87
Internally developed software - in progressCarrying amount at start of period 3 711 - Additions 1 847 3 711 Transfer to software (2 482) - Adjustment (expensed) (538) - Carrying amount at end of period 2 538 3 711
Note 25. Impairment of assets
Note 26. Payables
CurrentTrade payables 1 641 1 007 Accrued expenses 6 313 11 164 Accrued salaries 181 4 508 Total current 8 135 16 679
There were no indications of impairment to property, plant and equipment or intangible assets at 30 June 2016.
The Department held no goodwill or intangible assets with an indefinite useful life during the reporting period.
All surplus assets at 30 June 2016 have either been classified as assets held for sale or written-off.

2015–16 Annual Report | 91
2016 2015$000 $000
Note 27. Provisions
CurrentEmployee benefits provision
Annual leave(a) 2 952 3 018
Long service leave(b) 6 927 6 551
Deferred salary scheme(c) 8 - 9 887 9 569
Other provisions
Employment on-costs(d) 44 117 44 117
9 931 9 686
Non-current Employee benefits provision
Long service leave(b) 2 973 2 880 2 973 2 880
Other provisions
Employment on-costs(d) 13 35 13 35
2 986 2 915
(a)
Within 12 months of the end of the reporting period 2 290 2 369 More than 12 months after the end of the reporting period 662 649
2 952 3 018
(b)
Within 12 months of the end of the reporting period 2 587 2 490 More than 12 months after the end of the reporting period 7 313 6 941
9 900 9 431
(c)
More than 12 months after the end of the reporting period 8 - 8 -
(d)
Annual leave liabilities have been classified as current as there is no unconditional right to defer settlement for at least 12months after the end of the reporting period. Assessments indicate that actual settlement of the liabilities is expected tooccur as follows:
Long service leave liabilities have been classified as current where there is no unconditional right to defer settlement for atleast 12 months after the end of the reporting period. Assessments indicate that actual settlement of the liabilities isexpected to occur as follows:
The settlement of annual and long service leave liabilities gives rise to the payment of employment on-costs includingworkers’ compensation insurance. The provision is the present value of expected future payments. The associated expense, apart from the unwinding of the discount (finance cost), is disclosed in note 10 ‘Other expenses’.
Deferred salary scheme liabilities have been classified as current where there is no unconditional right to defer settlementfor at least 12 months after the end of the reporting period. Actual settlement of the liabilities is expected to occur asfollows:
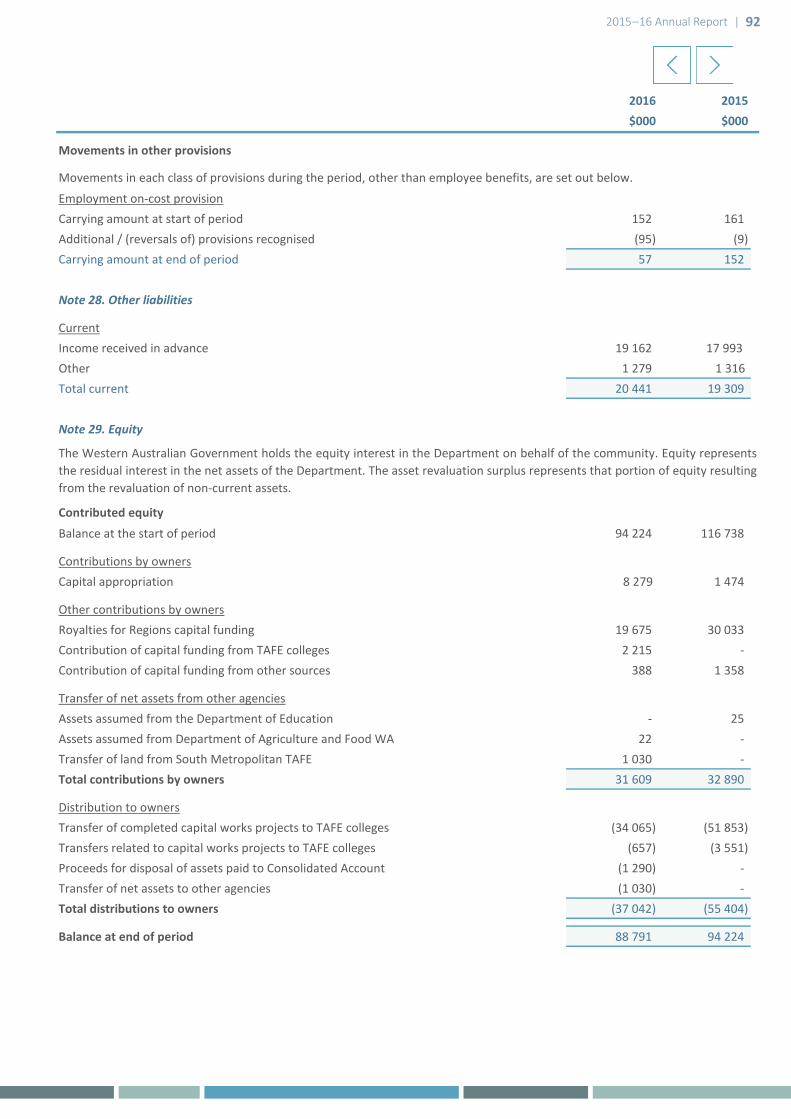
2015–16 Annual Report | 92
2016 2015$000 $000
Movements in other provisions
Employment on-cost provisionCarrying amount at start of period 152 161 Additional / (reversals of) provisions recognised (95) (9)Carrying amount at end of period 57 152
Note 28. Other liabilities
CurrentIncome received in advance 19 162 17 993 Other 1 279 1 316 Total current 20 441 19 309
Note 29. Equity
Balance at the start of period 94 224 116 738
Contributions by ownersCapital appropriation 8 279 1 474
Other contributions by ownersRoyalties for Regions capital funding 19 675 30 033 Contribution of capital funding from TAFE colleges 2 215 - Contribution of capital funding from other sources 388 1 358
Transfer of net assets from other agenciesAssets assumed from the Department of Education - 25 Assets assumed from Department of Agriculture and Food WA 22 - Transfer of land from South Metropolitan TAFE 1 030 - Total contributions by owners 31 609 32 890
Distribution to ownersTransfer of completed capital works projects to TAFE colleges (34 065) (51 853)Transfers related to capital works projects to TAFE colleges (657) (3 551)Proceeds for disposal of assets paid to Consolidated Account (1 290) - Transfer of net assets to other agencies (1 030) - Total distributions to owners (37 042) (55 404)
Balance at end of period 88 791 94 224
The Western Australian Government holds the equity interest in the Department on behalf of the community. Equity representsthe residual interest in the net assets of the Department. The asset revaluation surplus represents that portion of equity resultingfrom the revaluation of non-current assets.
Contributed equity
Movements in each class of provisions during the period, other than employee benefits, are set out below.
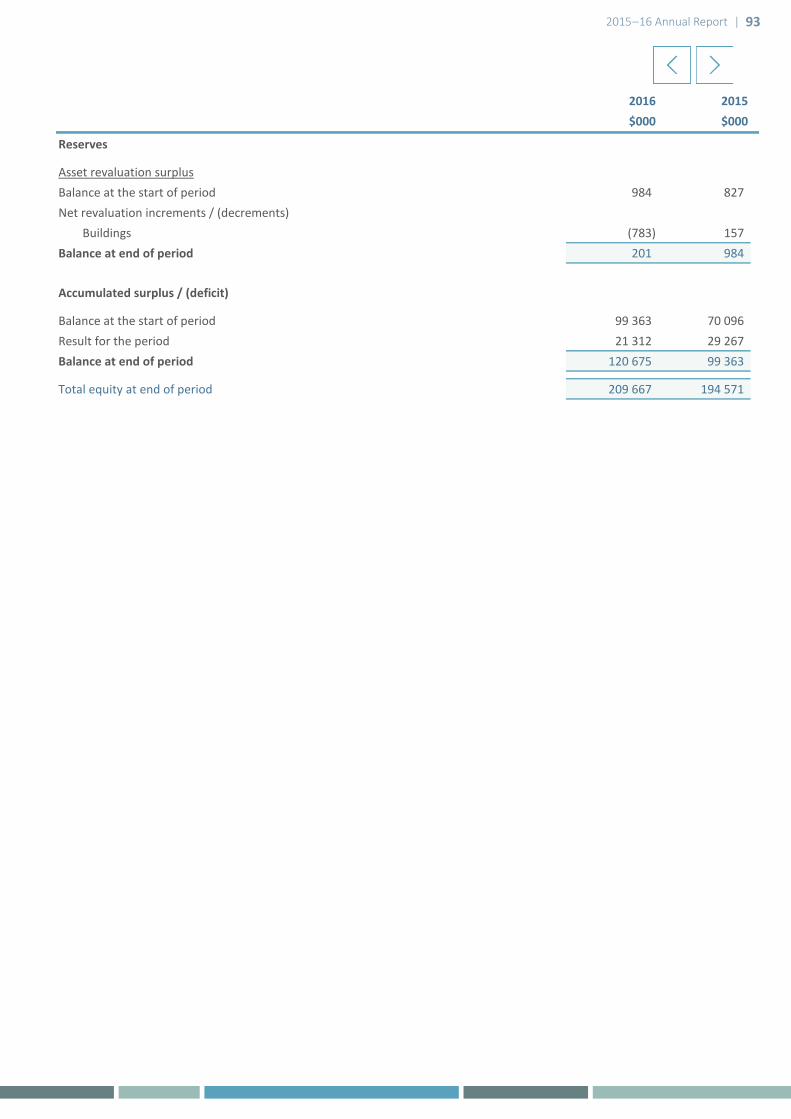
2015–16 Annual Report | 93
2016 2015$000 $000
Reserves
Asset revaluation surplusBalance at the start of period 984 827 Net revaluation increments / (decrements)
Buildings (783) 157 Balance at end of period 201 984
Accumulated surplus / (deficit)
Balance at the start of period 99 363 70 096 Result for the period 21 312 29 267 Balance at end of period 120 675 99 363
Total equity at end of period 209 667 194 571

2015–16 Annual Report | 94
2016 2015$000 $000
Note 30. Notes to the statement of cash flows
Reconciliation of cash
Cash and cash equivalents 59 324 41 041
64 733 73 740
124 057 114 781
Net cost of services (354 330) (416 442)
Non-cash items 2 119 1 803
Doubtful debts expense (note 18 'Receivables') 546 (415) 1 092 1 642
(1 270) 6 Impairment loss on fixed assets 459 - Transfer of prior year capital expenditure 594 - Gain from changes in fair value of biological assets (185) (99)Gain from changes in net realisable value of inventories (9) - Loss from changes in net realisable value of biological assets - 13 Loss from changes in net realisable value of inventories - 4 Adjustments for other non-cash items - 94
(Increase) / decrease in assets
Current receivables(a) 1 563 8 389Non-current biological assets 141 (108)
Increase / (decrease) in liabilities
Current payables(a) (8 489) 4 002 Other current liabilities 1 132 (977)Current provisions 245 819Non-current provisions 71 681
Net GST receipts / (payments)(b) 730 797
Change in GST in receivables / payables(c) (1 034) (1 197)Net cash provided by / (used in) operating activities (356 625) (400 988)
(a)
(b) This is the net GST paid / received, i.e. cash transactions.(c) This reverses out the GST in receivables and payables.
Cash at the end of the financial year as shown in the Statement of cash flows is reconciled to the related items in the Statementof financial position as follows:
Reconciliation of net cost of services to net cash flows provided by / (used in) operating activities
Restricted cash and cash equivalents (note 16 'Restricted cash and cash equivalents')
Note that the Australian Taxation Office receivable / payable in respect of GST and the receivable / payable in respect of thesale / purchase of non-current assets are not included in these items as they do not form part of the reconciling items.
Depreciation and amortisation expense (note 8 ‘Depreciation and amortisation expense’)
Net (gain) / loss on disposal of property, plant and equipment (note 14 ‘Net gain / (loss) on disposal of non-current assets')
Services received free of charge (note 15 ‘Income from State Government’)
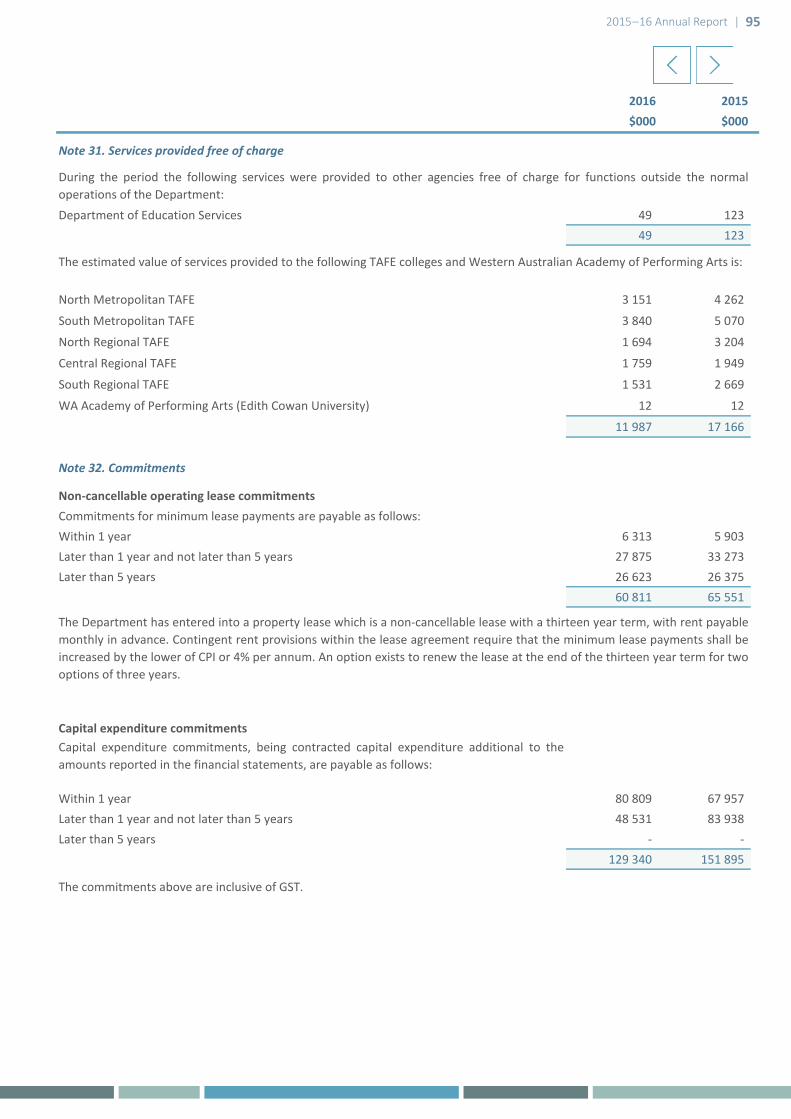
2015–16 Annual Report | 95
2016 2015$000 $000
Note 31. Services provided free of charge
Department of Education Services 49 123 49 123
North Metropolitan TAFE 3 151 4 262
South Metropolitan TAFE 3 840 5 070
North Regional TAFE 1 694 3 204
Central Regional TAFE 1 759 1 949
South Regional TAFE 1 531 2 669
WA Academy of Performing Arts (Edith Cowan University) 12 12
11 987 17 166
Note 32. Commitments
Non-cancellable operating lease commitmentsCommitments for minimum lease payments are payable as follows:Within 1 year 6 313 5 903 Later than 1 year and not later than 5 years 27 875 33 273 Later than 5 years 26 623 26 375
60 811 65 551
Capital expenditure commitments
Within 1 year 80 809 67 957 Later than 1 year and not later than 5 years 48 531 83 938 Later than 5 years - -
129 340 151 895
The commitments above are inclusive of GST.
During the period the following services were provided to other agencies free of charge for functions outside the normaloperations of the Department:
The estimated value of services provided to the following TAFE colleges and Western Australian Academy of Performing Arts is:
The Department has entered into a property lease which is a non-cancellable lease with a thirteen year term, with rent payablemonthly in advance. Contingent rent provisions within the lease agreement require that the minimum lease payments shall beincreased by the lower of CPI or 4% per annum. An option exists to renew the lease at the end of the thirteen year term for twooptions of three years.
Capital expenditure commitments, being contracted capital expenditure additional to theamounts reported in the financial statements, are payable as follows:

2015–16 Annual Report | 96
Note 33. Contingent liabilities and contingent assets
Note 34. Events occurring after the end of the reporting period
During 2015–16, the Department did not identify any contingent liabilities or contingent assets.
No events have occurred after reporting date, which would cause the financial statements to be misleading in the absence of disclosure.
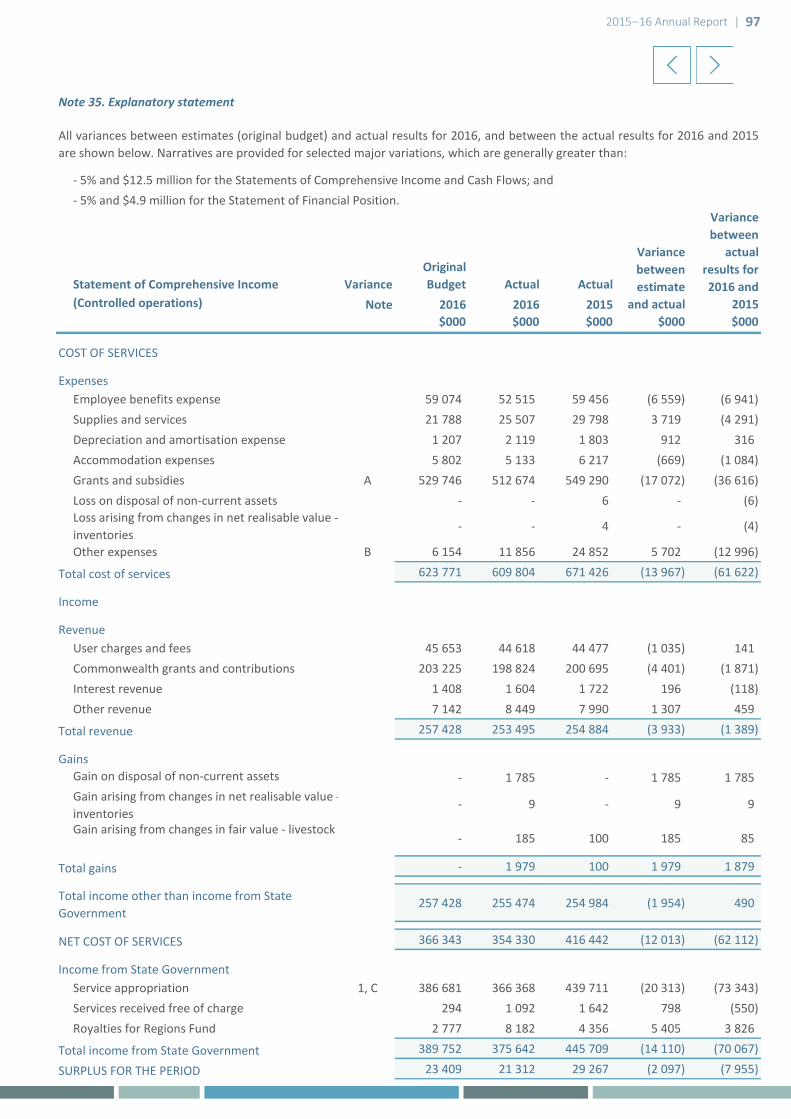
2015–16 Annual Report | 97
Note 35. Explanatory statement
- 5% and $12.5 million for the Statements of Comprehensive Income and Cash Flows; and- 5% and $4.9 million for the Statement of Financial Position.
Statement of Comprehensive Income VarianceOriginal Budget Actual Actual
(Controlled operations) Note 2016 2016 2015$000 $000 $000 $000 $000
COST OF SERVICES
ExpensesEmployee benefits expense 59 074 52 515 59 456 (6 559) (6 941)Supplies and services 21 788 25 507 29 798 3 719 (4 291)Depreciation and amortisation expense 1 207 2 119 1 803 912 316Accommodation expenses 5 802 5 133 6 217 (669) (1 084)Grants and subsidies A 529 746 512 674 549 290 (17 072) (36 616)Loss on disposal of non-current assets - - 6 - (6)Loss arising from changes in net realisable value - inventories
- - 4 - (4)
Other expenses B 6 154 11 856 24 852 5 702 (12 996)
Total cost of services 623 771 609 804 671 426 (13 967) (61 622)
Income
RevenueUser charges and fees 45 653 44 618 44 477 (1 035) 141Commonwealth grants and contributions 203 225 198 824 200 695 (4 401) (1 871)Interest revenue 1 408 1 604 1 722 196 (118)Other revenue 7 142 8 449 7 990 1 307 459
Total revenue 257 428 253 495 254 884 (3 933) (1 389)
GainsGain on disposal of non-current assets - 1 785 - 1 785 1 785 Gain arising from changes in net realisable value - inventories
- 9 - 9 9
Gain arising from changes in fair value - livestock- 185 100 185 85
Total gains - 1 979 100 1 979 1 879
257 428 255 474 254 984 (1 954) 490
NET COST OF SERVICES 366 343 354 330 416 442 (12 013) (62 112)
Income from State GovernmentService appropriation 1, C 386 681 366 368 439 711 (20 313) (73 343)Services received free of charge 294 1 092 1 642 798 (550)Royalties for Regions Fund 2 777 8 182 4 356 5 405 3 826
Total income from State Government 389 752 375 642 445 709 (14 110) (70 067)
SURPLUS FOR THE PERIOD 23 409 21 312 29 267 (2 097) (7 955)
Variance between estimate
and actual
Variance between
actual results for 2016 and
2015
All variances between estimates (original budget) and actual results for 2016, and between the actual results for 2016 and 2015are shown below. Narratives are provided for selected major variations, which are generally greater than:
Total income other than income from State Government

2015–16 Annual Report | 98
Statement of Comprehensive Income VarianceOriginal Budget Actual Actual
(Controlled operations) Note 2016 2016 2015$000 $000 $000 $000 $000
Variance between estimate
and actual
Variance between
actual results for 2016 and
2015
OTHER COMPREHENSIVE INCOMEChanges in asset revaluation surplus - (783) 157 (783) (940)
Total other comprehensive income - (783) 157 (783) (940)
23 409 20 529 29 424 (2 880) (8 895)
Major Estimate and Actual (2016) Variance Narratives1)
Major Actual (2016) and Comparative (2015) Variance NarrativesA)
B)
C)
Service appropriation was lower than estimates by $20.3 million (5.3%) largely due to savings from the 2014–15 TargetedVoluntary Separation Scheme.
Grants and subsidies expense decreased by $36.6 million (6.7%) mainly due to changes in Student Fee Subsidy Levels underFuture Skills WA, savings from the Targeted Voluntary Severance Scheme, implementation of the Agency Expenditure Review- Existing Worker Traineeship Program and Public Sector Workforce Renewal Policy.
Other expenses decreased by $13.0 million (52.3%) due largely to one-off payments to TAFE Colleges in 2014–15 under theTargeted Voluntary Severance Scheme payment offset in part by payment to TAFE Colleges for voluntary severances as part ofthe implementation of the Training Sector Reform project in 2015–16.
Service appropriation decreased by $73.3 million (16.7%) largely due to changes in the subsidy and fee settings under FutureSkills WA, a one-off funding for the 2014–15 Targeted Voluntary Severance Scheme, ongoing savings from the TargetedVoluntary Severance Scheme, the implementation of the Agency Expenditure Review - Existing Worker Traineeship Programand Public Sector Workforce Renewal Policy.
TOTAL COMPREHENSIVE INCOME FOR THE PERIOD
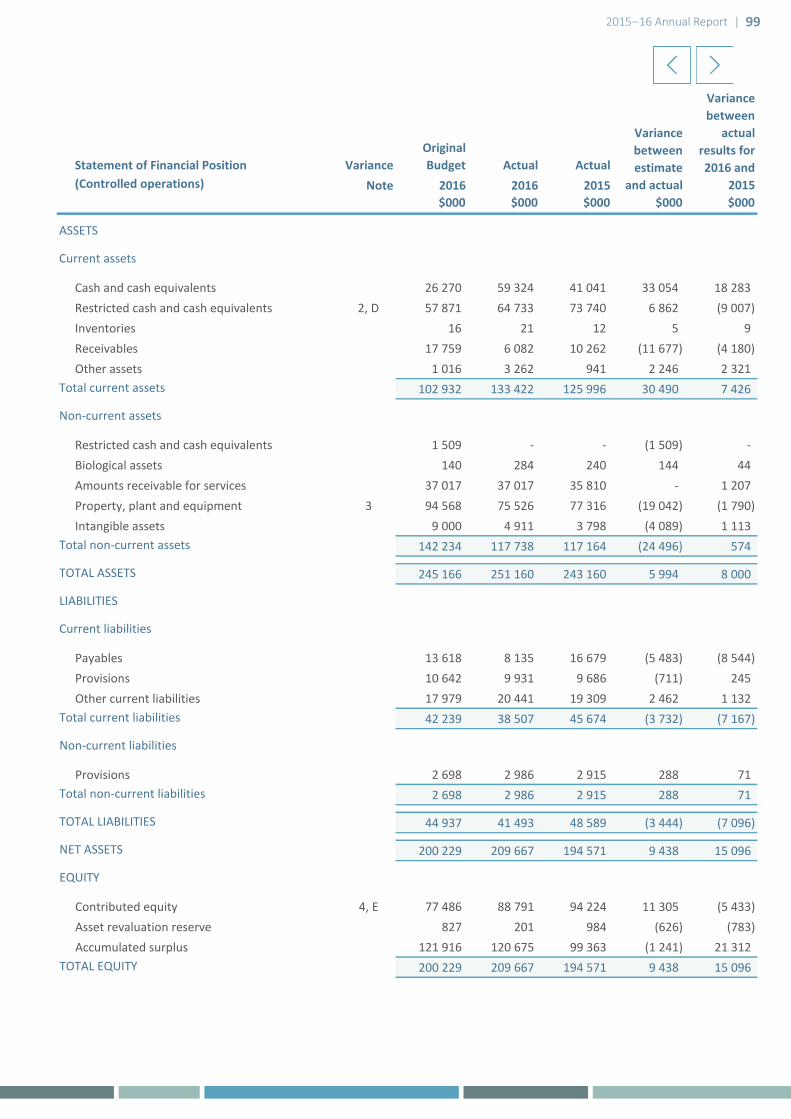
2015–16 Annual Report | 99
Statement of Financial Position VarianceOriginal Budget Actual Actual
(Controlled operations) Note 2016 2016 2015$000 $000 $000 $000 $000
ASSETS
Current assets
Cash and cash equivalents 26 270 59 324 41 041 33 054 18 283 Restricted cash and cash equivalents 2, D 57 871 64 733 73 740 6 862 (9 007)Inventories 16 21 12 5 9 Receivables 17 759 6 082 10 262 (11 677) (4 180)Other assets 1 016 3 262 941 2 246 2 321
Total current assets 102 932 133 422 125 996 30 490 7 426
Non-current assets
Restricted cash and cash equivalents 1 509 - - (1 509) - Biological assets 140 284 240 144 44 Amounts receivable for services 37 017 37 017 35 810 - 1 207 Property, plant and equipment 3 94 568 75 526 77 316 (19 042) (1 790)Intangible assets 9 000 4 911 3 798 (4 089) 1 113
Total non-current assets 142 234 117 738 117 164 (24 496) 574
TOTAL ASSETS 245 166 251 160 243 160 5 994 8 000
LIABILITIES
Current liabilities
Payables 13 618 8 135 16 679 (5 483) (8 544)Provisions 10 642 9 931 9 686 (711) 245 Other current liabilities 17 979 20 441 19 309 2 462 1 132
Total current liabilities 42 239 38 507 45 674 (3 732) (7 167)
Non-current liabilities
Provisions 2 698 2 986 2 915 288 71 Total non-current liabilities 2 698 2 986 2 915 288 71
TOTAL LIABILITIES 44 937 41 493 48 589 (3 444) (7 096)
NET ASSETS 200 229 209 667 194 571 9 438 15 096
EQUITY
Contributed equity 4, E 77 486 88 791 94 224 11 305 (5 433)Asset revaluation reserve 827 201 984 (626) (783)Accumulated surplus 121 916 120 675 99 363 (1 241) 21 312
TOTAL EQUITY 200 229 209 667 194 571 9 438 15 096
- 0 -
Variance between estimate
and actual
Variance between
actual results for 2016 and
2015

2015–16 Annual Report | 100
Major Estimate and Actual (2016) Variance Narratives2)
3)
4)
Major Actual (2016) and Comparative (2015) Variance NarrativesD)
E)
Restricted cash and cash equivalents was higher than estimates by $6.9 million (11.9%) largely due to the timing ofexpenditure associated with training delivery for international students.
Contributed equity decreased by $5.4 million (5.8%) largely due to the timing of the transfer of assets for capital worksprojects carried out on behalf of the TAFE colleges.
Property plant and equipment was lower than estimates by $19.0 million (20.1%) due to the timing of transfer of capitalworks projects to the TAFE colleges.
Contributed equity was higher than estimates by $11.3 million (14.6%) largely due to the timing of transfers of assets forcapital works projects carried out on behalf of TAFE colleges.
Restricted cash and cash equivalents decreased by $9.0 million (12.2 %) largely due to the timing of expenditure associatedwith training delivery for international students.
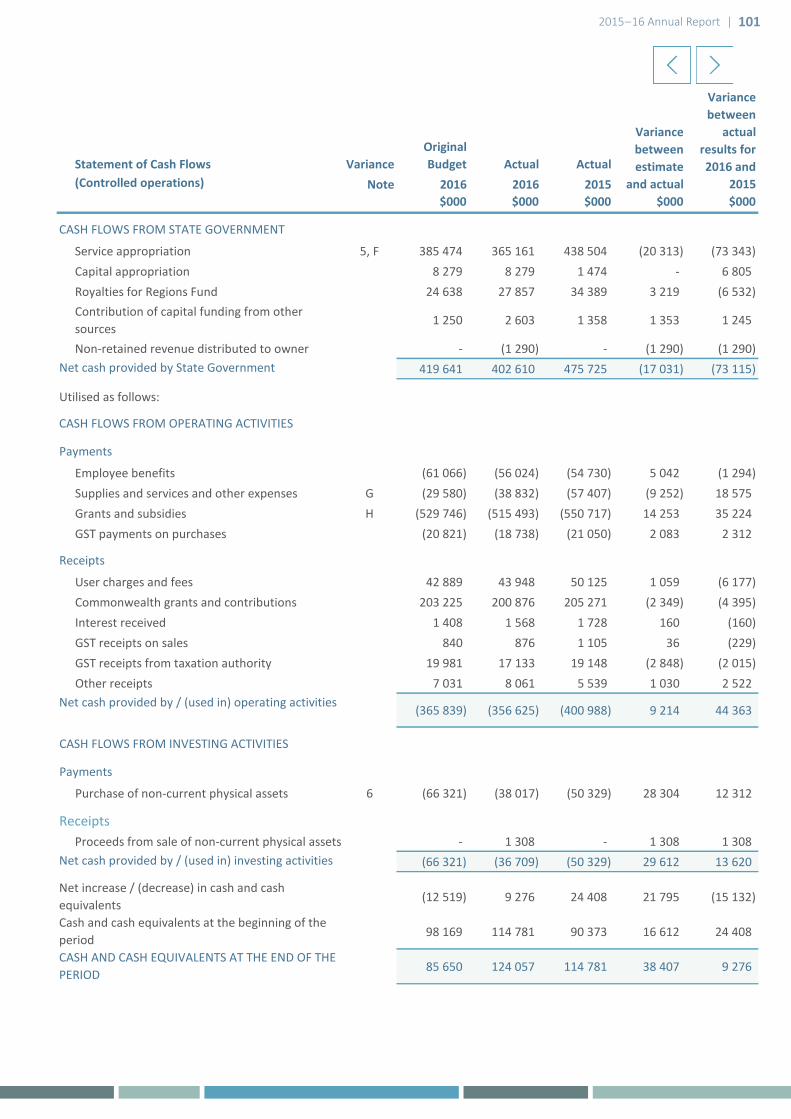
2015–16 Annual Report | 101
Statement of Cash Flows VarianceOriginal Budget Actual Actual
(Controlled operations) Note 2016 2016 2015$000 $000 $000 $000 $000
CASH FLOWS FROM STATE GOVERNMENT
Service appropriation 5, F 385 474 365 161 438 504 (20 313) (73 343)Capital appropriation 8 279 8 279 1 474 - 6 805Royalties for Regions Fund 24 638 27 857 34 389 3 219 (6 532)Contribution of capital funding from other sources
1 250 2 603 1 358 1 353 1 245
Non-retained revenue distributed to owner - (1 290) - (1 290) (1 290)Net cash provided by State Government 419 641 402 610 475 725 (17 031) (73 115)
Utilised as follows:
Payments
Employee benefits (61 066) (56 024) (54 730) 5 042 (1 294)Supplies and services and other expenses G (29 580) (38 832) (57 407) (9 252) 18 575Grants and subsidies H (529 746) (515 493) (550 717) 14 253 35 224GST payments on purchases (20 821) (18 738) (21 050) 2 083 2 312
Receipts
User charges and fees 42 889 43 948 50 125 1 059 (6 177)Commonwealth grants and contributions 203 225 200 876 205 271 (2 349) (4 395)Interest received 1 408 1 568 1 728 160 (160)GST receipts on sales 840 876 1 105 36 (229)GST receipts from taxation authority 19 981 17 133 19 148 (2 848) (2 015)Other receipts 7 031 8 061 5 539 1 030 2 522
(365 839) (356 625) (400 988) 9 214 44 363
CASH FLOWS FROM INVESTING ACTIVITIES
Payments
Purchase of non-current physical assets 6 (66 321) (38 017) (50 329) 28 304 12 312
ReceiptsProceeds from sale of non-current physical assets - 1 308 - 1 308 1 308
(66 321) (36 709) (50 329) 29 612 13 620
(12 519) 9 276 24 408 21 795 (15 132)
98 169 114 781 90 373 16 612 24 408
85 650 124 057 114 781 38 407 9 276
- (0) -
CASH AND CASH EQUIVALENTS AT THE END OF THE PERIOD
Variance between estimate
and actual
Variance between
actual results for 2016 and
2015
Net cash provided by / (used in) operating activities
Net cash provided by / (used in) investing activities
Net increase / (decrease) in cash and cash equivalentsCash and cash equivalents at the beginning of the period
CASH FLOWS FROM OPERATING ACTIVITIES
2015–16 Annual Report | 102
Major Estimate and Actual (2016) Variance Narratives5)
6)
Major Actual (2016) and Comparative (2015) Variance NarrativesF)
G)
H)
Service appropriation decreased by $20.3 million (5.3%) largely due to savings from the 2014–15 Targeted VoluntarySeparation Scheme.
Purchase of non-current physical assets decreased by $28.3 million (42.7%) mainly due to timing of payments under the AssetInvestment Program.
Service appropriation decreased by $73.3 million (16.7%) largely due to changes in the subsidy and fee settings under FutureSkills WA, a one-off funding for the 2014–15 Targeted Voluntary Severance Scheme, ongoing savings from the TargetedVoluntary Severance Scheme, the implementation of the Agency Expenditure Review - Existing Worker Traineeship Programand Public Sector Workforce Renewal Policy.
Supplies and services and other expenses decreased by $18.6 million (32.4%) due largely to one-off payments to TAFEColleges in 2014–15 under the Targeted Voluntary Severance Scheme payment offset in part by payment to TAFE Colleges forvoluntary severances as part of the implementation of the Training Sector Reform project in 2015–16 and lower consultantsand contractors costs due to the completion of a number of ICT projects and workforce development plans.
Grants and subsidies expense decreased by $35.2 million (6.4%) mainly due to changes in Student Fee Subsidy Levels underFuture Skills WA, savings from the Targeted Voluntary Severance Scheme, implementation of the Agency ExpenditureReview - Existing Worker Traineeship Program and Public Sector Workforce Renewal Policy.
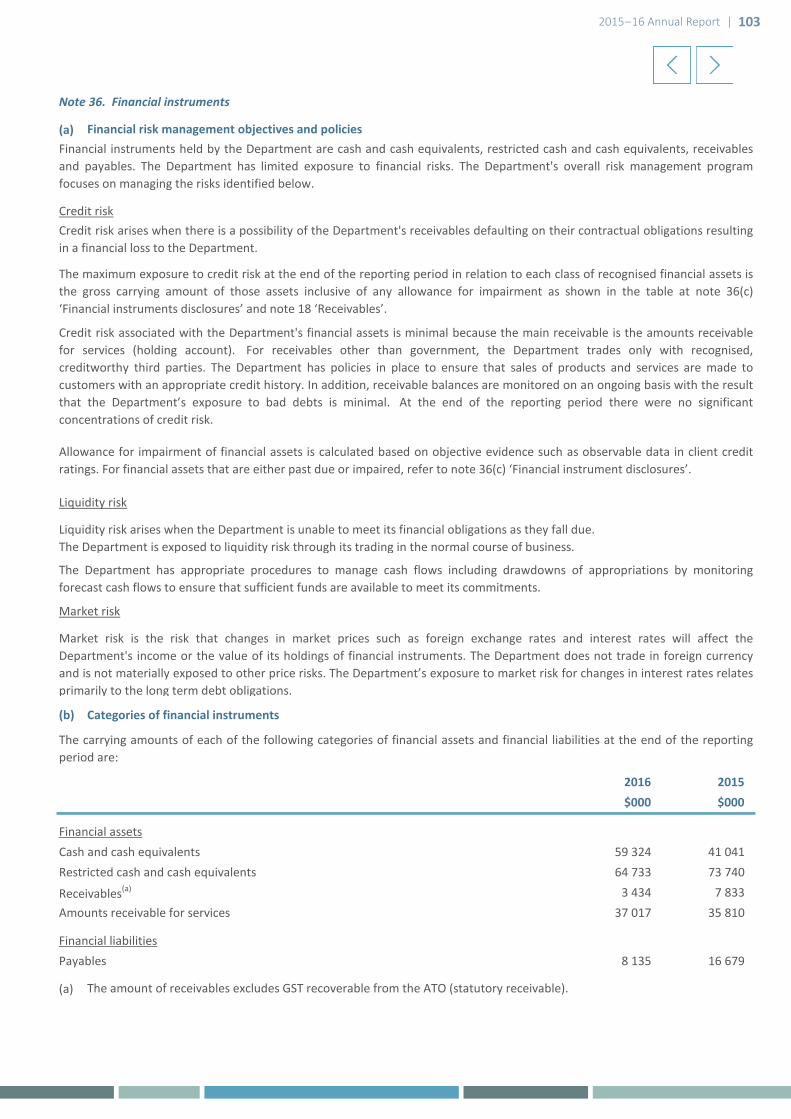
2015–16 Annual Report | 103
Note 36. Financial instruments
(a)
(b) Categories of financial instruments
2016 2015$000 $000
Financial assetsCash and cash equivalents 59 324 41 041 Restricted cash and cash equivalents 64 733 73 740
Receivables(a) 3 434 7 833 Amounts receivable for services 37 017 35 810
Financial liabilitiesPayables 8 135 16 679
(a)
The carrying amounts of each of the following categories of financial assets and financial liabilities at the end of the reportingperiod are:
The amount of receivables excludes GST recoverable from the ATO (statutory receivable).
Financial risk management objectives and policiesFinancial instruments held by the Department are cash and cash equivalents, restricted cash and cash equivalents, receivablesand payables. The Department has limited exposure to financial risks. The Department's overall risk management programfocuses on managing the risks identified below.
Credit risk
Credit risk associated with the Department's financial assets is minimal because the main receivable is the amounts receivablefor services (holding account). For receivables other than government, the Department trades only with recognised,creditworthy third parties. The Department has policies in place to ensure that sales of products and services are made tocustomers with an appropriate credit history. In addition, receivable balances are monitored on an ongoing basis with the resultthat the Department’s exposure to bad debts is minimal. At the end of the reporting period there were no significantconcentrations of credit risk.
The maximum exposure to credit risk at the end of the reporting period in relation to each class of recognised financial assets isthe gross carrying amount of those assets inclusive of any allowance for impairment as shown in the table at note 36(c)‘Financial instruments disclosures’ and note 18 ‘Receivables’.
Market risk is the risk that changes in market prices such as foreign exchange rates and interest rates will affect theDepartment's income or the value of its holdings of financial instruments. The Department does not trade in foreign currencyand is not materially exposed to other price risks. The Department’s exposure to market risk for changes in interest rates relatesprimarily to the long term debt obligations.
Market risk
Credit risk arises when there is a possibility of the Department's receivables defaulting on their contractual obligations resultingin a financial loss to the Department.
The Department has appropriate procedures to manage cash flows including drawdowns of appropriations by monitoringforecast cash flows to ensure that sufficient funds are available to meet its commitments.
Liquidity risk
Liquidity risk arises when the Department is unable to meet its financial obligations as they fall due. The Department is exposed to liquidity risk through its trading in the normal course of business.
Allowance for impairment of financial assets is calculated based on objective evidence such as observable data in client creditratings. For financial assets that are either past due or impaired, refer to note 36(c) ‘Financial instrument disclosures’.

2015–16 Annual Report | 104
(c) Financial instrument disclosures
Credit risk
$000 $000 $000 $000 $000 $000 $000 $000
2016Cash and cash equivalents 59 324 59 324 - - - - - - Restricted cash and cash equivalents 64 733 64 733 - - - - - -
Receivables(a) 3 434 3 100 85 182 67 - - - Amounts receivable for services 37 017 37 017 - - - - - -
164 508 164 174 85 182 67 - - -
2015Cash and cash equivalents 41 041 41 041 - - - - - - Restricted cash and cash equivalents 73 740 73 740 - - - - - -
Receivables(a) 7 833 4 484 101 137 2 550 547 14 - Amounts receivable for services 35 810 35 810 - - - - - -
158 424 155 075 101 137 2 550 547 14 -
(a) The amount of receivables excludes the GST recoverable from the ATO (statutory receivable).
The following table details the Department's maximum exposure to credit risk and the ageing analysis of financial assets. The Department's maximum exposure to creditrisk at the end of the reporting period is the carrying amount of financial assets as shown below. The table discloses the ageing of financial assets that are past due butnot impaired and impaired financial assets. The table is based on information provided to senior management of the Department.
The Department does not hold any collateral as security or other credit enhancement relating to the financial assets it holds.
Impaired financial
assets
Ageing analysis of financial assets
1 - 5 yearsNot past due and not
impaired
Up to 1 month
Past due but not impairedMore than 5
years1-3 months 3 months to 1
yearCarrying amount
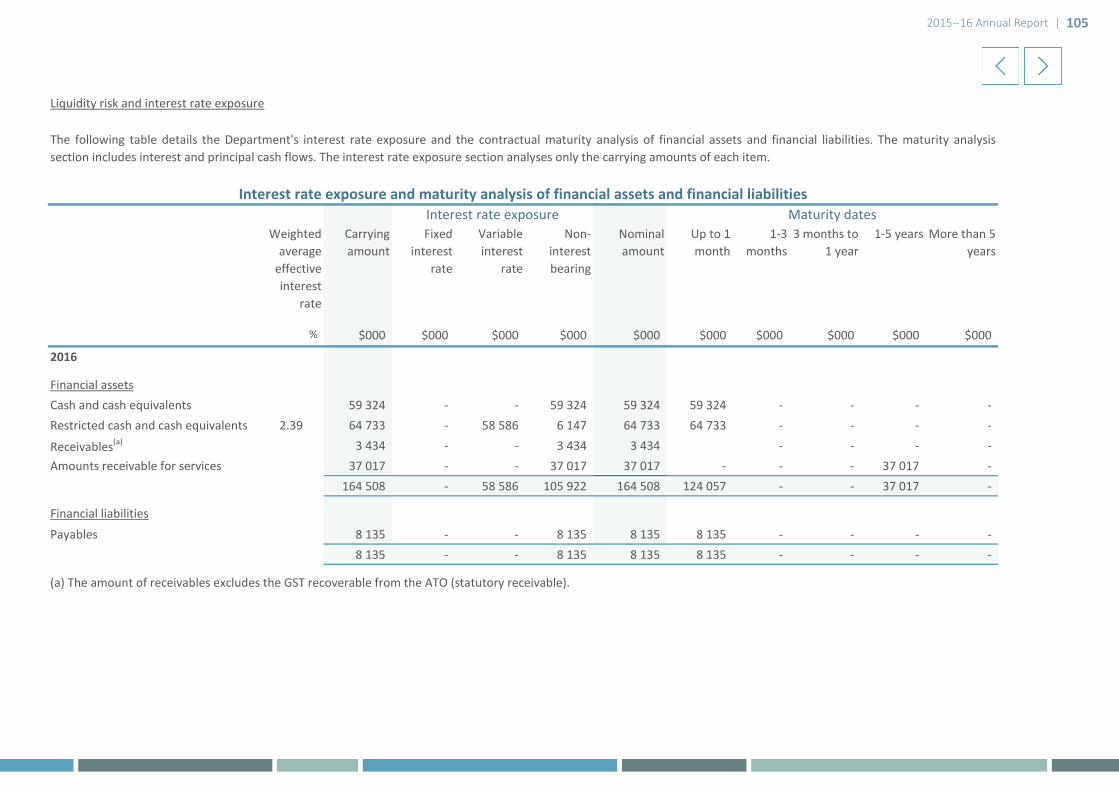
2015–16 Annual Report | 105
Liquidity risk and interest rate exposure
% $000 $000 $000 $000 $000 $000 $000 $000 $000 $000
2016
Financial assetsCash and cash equivalents 59 324 - - 59 324 59 324 59 324 - - - - Restricted cash and cash equivalents 2.39 64 733 - 58 586 6 147 64 733 64 733 - - - -
Receivables(a) 3 434 - - 3 434 3 434 - - - - Amounts receivable for services 37 017 - - 37 017 37 017 - - - 37 017 -
164 508 - 58 586 105 922 164 508 124 057 - - 37 017 -
Payables 8 135 - - 8 135 8 135 8 135 - - - - 8 135 - - 8 135 8 135 8 135 - - - -
(a) The amount of receivables excludes the GST recoverable from the ATO (statutory receivable).
Variable interest
rate
Carrying amount
Fixed interest
rate
Weighted average
effective interest
rate
Financial liabilities
The following table details the Department's interest rate exposure and the contractual maturity analysis of financial assets and financial liabilities. The maturity analysissection includes interest and principal cash flows. The interest rate exposure section analyses only the carrying amounts of each item.
3 months to 1 year
Nominal amount
Interest rate exposure and maturity analysis of financial assets and financial liabilities
1-5 yearsUp to 1 month
1-3 months
Non-interest bearing
Maturity datesMore than 5
years
Interest rate exposure

2015–16 Annual Report | 106
% $000 $000 $000 $000 $000 $000 $000 $000 $000 $000
2015
Financial assetsCash and cash equivalents 41 041 - - 41 041 41 041 41 041 - - - - Restricted cash and cash equivalents 2.44 73 740 - 66 153 7 587 73 740 73 740 - - - -
Receivables(a) 7 833 - - 7 833 7 833 - - - - - Amounts receivable for services 35 810 - - 35 810 35 810 - - - 35 810 -
158 424 - 66 153 92 271 158 424 114 781 - - 35 810 -
16 679 - - 16 679 16 679 16 679 - - - - 16 679 - - 16 679 16 679 16 679 - - - -
(a) The amount of receivables excludes the GST recoverable from the ATO (statutory receivable).
PayablesFinancial liabilities
Weighted average
effective interest
rate
Carrying amount
Fixed interest
rate
Interest rate exposure and maturity analysis of financial assets and financial liabilities
Up to 1 month
Variable interest
rate
Maturity datesNominal amount
3 months to 1 year
Non-interest bearing
1-3 months
1-5 years More than 5 years
Interest rate exposure
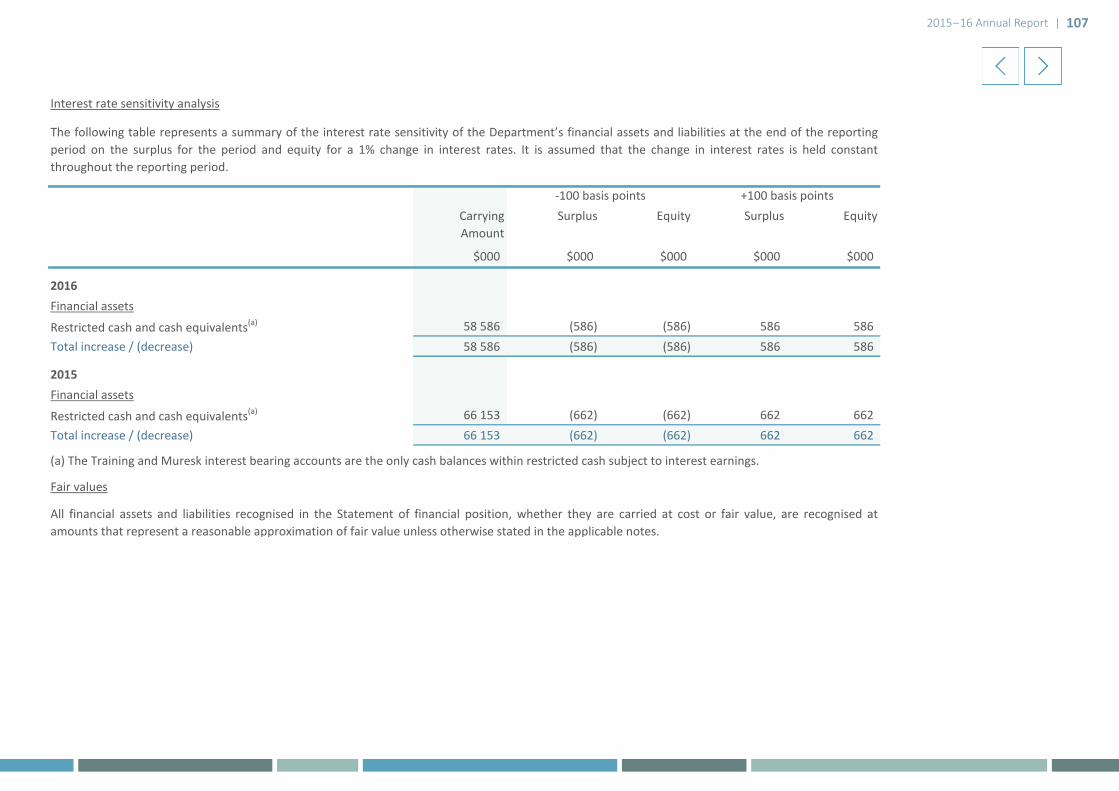
2015–16 Annual Report | 107
Interest rate sensitivity analysis
$000 $000 $000 $000 $000
2016Financial assets
Restricted cash and cash equivalents(a) 58 586 (586) (586) 586 586 Total increase / (decrease) 58 586 (586) (586) 586 586
2015Financial assets
Restricted cash and cash equivalents(a) 66 153 (662) (662) 662 662 Total increase / (decrease) 66 153 (662) (662) 662 662
The following table represents a summary of the interest rate sensitivity of the Department’s financial assets and liabilities at the end of the reportingperiod on the surplus for the period and equity for a 1% change in interest rates. It is assumed that the change in interest rates is held constantthroughout the reporting period.
-100 basis points +100 basis points
All financial assets and liabilities recognised in the Statement of financial position, whether they are carried at cost or fair value, are recognised atamounts that represent a reasonable approximation of fair value unless otherwise stated in the applicable notes.
Fair values
(a) The Training and Muresk interest bearing accounts are the only cash balances within restricted cash subject to interest earnings.
CarryingAmount
Surplus Equity Surplus Equity

2015–16 Annual Report | 108
2016 2015$000 $000
Note 37. Remuneration of senior officers
Remuneration band ($)190 001 - 200 000 1 1 200 001 - 210 000 2 - 210 001 - 220 000 - 2 220 001 - 230 000 - 1 230 001 - 240 000 1 - 390 001 - 400 000 1 - 400 001 - 410 000 - 1
Base remuneration and superannuation 1 245 1 171 Annual leave and long service leave accruals (36) 36 Other benefits 27 55
Total remuneration of senior officers 1 236 1 262
Note 38. Remuneration of auditor
Auditing the accounts, financial statements and key performance indicators 180 150
180 150
Note 39. Affiliated bodies
524 566 524 566 524 566 524 567 587 634 649 701
Food, Fibre & Timber Industries Training Council 587 634 649 701 524 567 524 566
Total 5 616 6 068
The number of senior officers whose total fees, salaries, superannuation, non-monetary benefits and other benefits for the financial year fall within the following bands are:
The table below are government affiliated bodies that received grants from the Department. These Training Councils are not subject to operational control.
Electrical, Utilities and Public Administration Training CouncilEngineering and Automotive Training Council
The total remuneration includes the superannuation expense incurred by the Department in respect of senior officers.
No senior officers are members of the Pension Scheme.
Remuneration paid or payable to the Auditor General in respect of the audit for the current financial year is as follows:
Construction Training Council
Community Services, Health and Education Training CouncilResources Industry Training Council
Retail and Personal Services Industry Training Council
Financial, Administrative and Professional Services Training Council
Futurenow - Creative and Leisure Industries Training CouncilLogistics Training Council

2015–16 Annual Report | 109
2016 2015$000 $000
Note 40. Supplementary financial information
(a) Write-offs
The accountable authority 140 349 140 349
Note 41. Indian Ocean Territories
Opening balance (1) (2)Receipts 177 220 Payments (174) (219)Closing balance 2 (1)
Reconciliation of Commonwealth funds received and expended for the Indian OceanTerritories
During the financial year, $140 174.03 (2015: $349 074.32) was written off under the authority of:
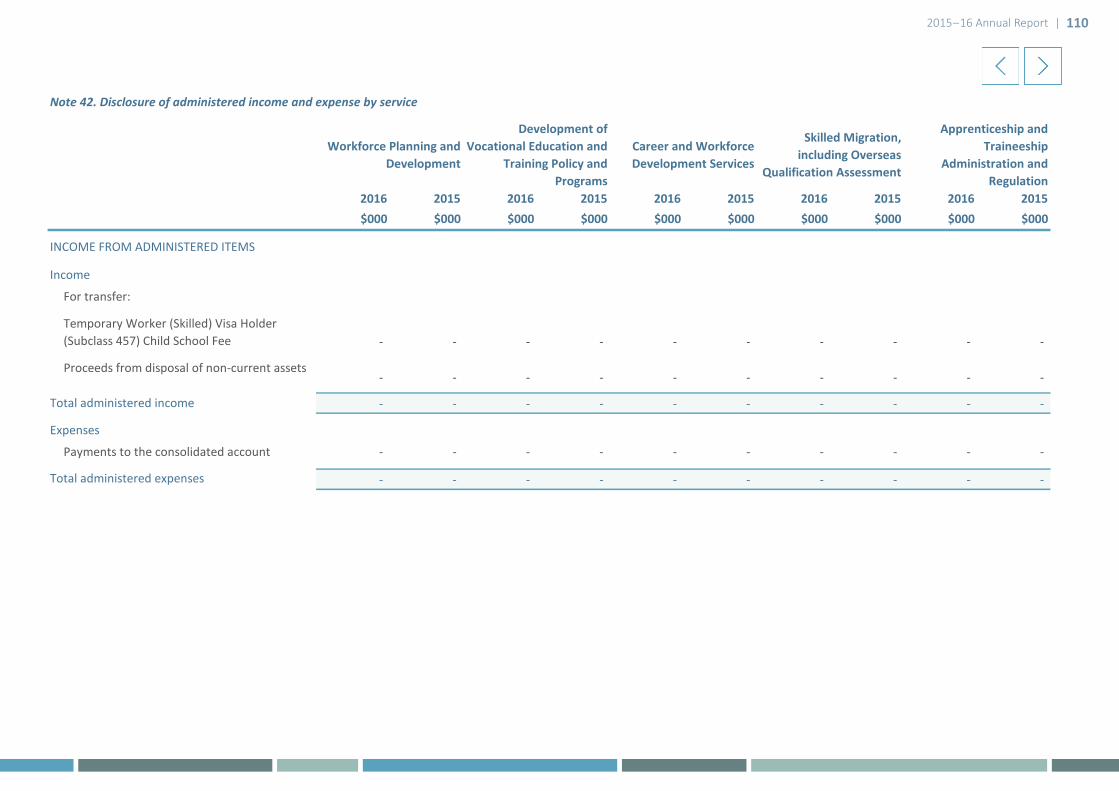
2015–16 Annual Report | 110
Note 42. Disclosure of administered income and expense by service
2016 2015 2016 2015 2016 2015 2016 2015 2016 2015$000 $000 $000 $000 $000 $000 $000 $000 $000 $000
For transfer: - - -
Temporary Worker (Skilled) Visa Holder (Subclass 457) Child School Fee - - - - - - - - - -
Proceeds from disposal of non-current assets- - - - - - - - - -
- - - - - - - - - -
Payments to the consolidated account - - - - - - - - - -
- - - - - - - - - -
Workforce Planning and Development
Development of Vocational Education and
Training Policy and Programs
Career and Workforce Development Services
INCOME FROM ADMINISTERED ITEMS
Skilled Migration, including Overseas
Qualification Assessment
Apprenticeship and Traineeship
Administration and Regulation
Income
Total administered income
Expenses
Total administered expenses

2015–16 Annual Report | 111
2016 2015 2016 2015 2016 2015 2016 2015 2016 2015 *$000 $000 $000 $000 $000 $000 $000 $000 $000 $000
For transfer: - - -
Temporary Worker (Skilled) Visa Holder (Subclass 457) Child School Fee - - 5 979 2 052 - - - - 5 979 2 052
Proceeds from disposal of non-current assets- - - - 1 805 - - - 1 805 -
- - 5 979 2 052 1 805 - - - 7 784 2 052
Payments to the consolidated account - - 6 107 1 924 - - - - 6 107 1 924
- - 6 107 1 924 - - - - 6 107 1 924
* See note 5 for details regarding the restatement of comparatives.
Expenses
Total administered expenses
Procurement of TrainingRecruitment and Management of
International Students
Infrastructure Management for TAFE
Colleges
Support services to TAFE Colleges
Total
Total administered income
INCOME FROM ADMINISTERED ITEMS
Income
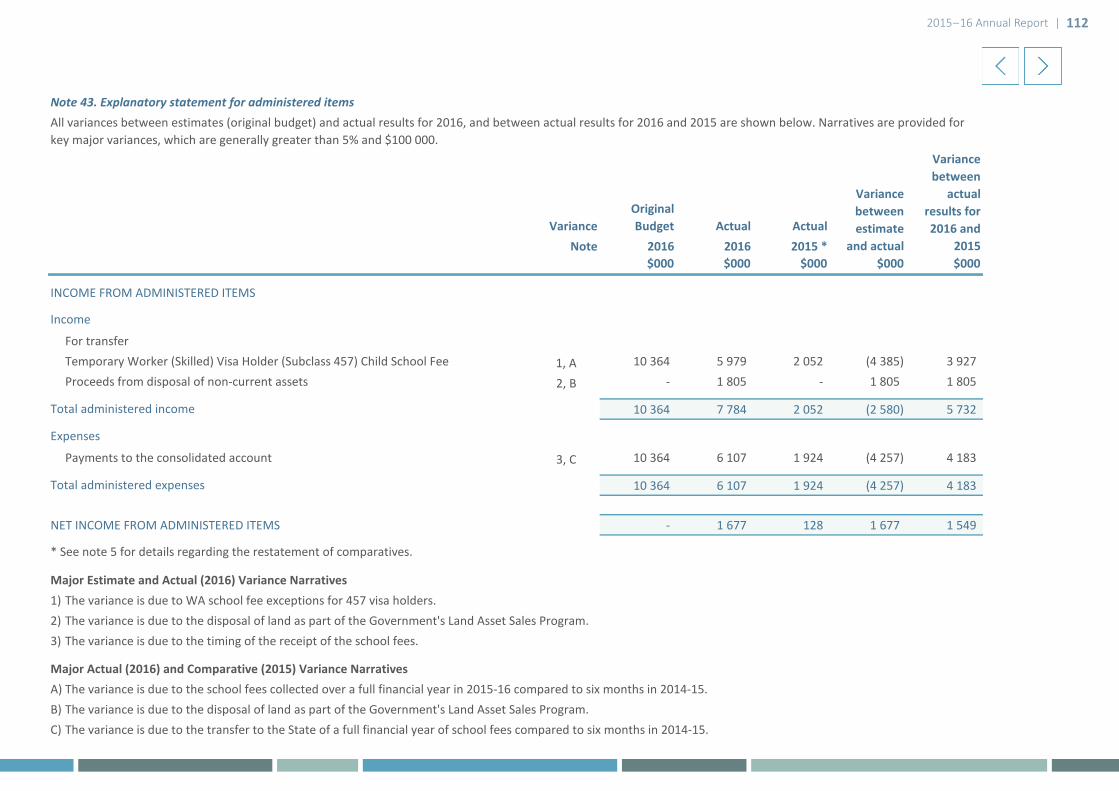
2015–16 Annual Report | 112
Note 43. Explanatory statement for administered items
VarianceOriginal Budget Actual Actual
Note 2016 2016 2015 *$000 $000 $000 $000 $000
INCOME FROM ADMINISTERED ITEMS
For transferTemporary Worker (Skilled) Visa Holder (Subclass 457) Child School Fee 1, A 10 364 5 979 2 052 (4 385) 3 927 Proceeds from disposal of non-current assets 2, B - 1 805 - 1 805 1 805
10 364 7 784 2 052 (2 580) 5 732
Payments to the consolidated account 3, C 10 364 6 107 1 924 (4 257) 4 183
10 364 6 107 1 924 (4 257) 4 183
NET INCOME FROM ADMINISTERED ITEMS - 1 677 128 1 677 1 549
Major Estimate and Actual (2016) Variance Narratives1) The variance is due to WA school fee exceptions for 457 visa holders.2) The variance is due to the disposal of land as part of the Government's Land Asset Sales Program.3) The variance is due to the timing of the receipt of the school fees.
Major Actual (2016) and Comparative (2015) Variance NarrativesA) The variance is due to the school fees collected over a full financial year in 2015-16 compared to six months in 2014-15.B) The variance is due to the disposal of land as part of the Government's Land Asset Sales Program.C) The variance is due to the transfer to the State of a full financial year of school fees compared to six months in 2014-15.
All variances between estimates (original budget) and actual results for 2016, and between actual results for 2016 and 2015 are shown below. Narratives are provided for key major variances, which are generally greater than 5% and $100 000.
Variance between estimate
and actual
Variance between
actual results for 2016 and
2015
* See note 5 for details regarding the restatement of comparatives.
Income
Total administered income
Expenses
Total administered expenses
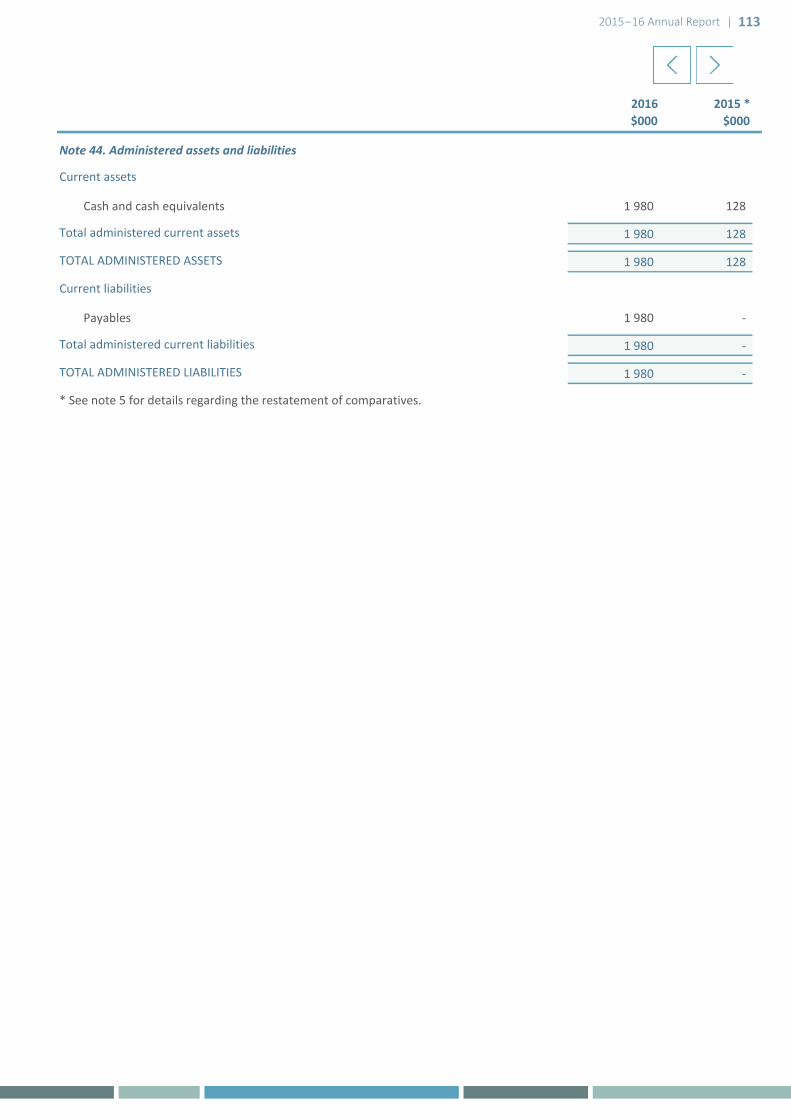
2015–16 Annual Report | 113
2016 2015 *$000 $000
Note 44. Administered assets and liabilities
Current assets
Cash and cash equivalents 1 980 128
Total administered current assets 1 980 128
TOTAL ADMINISTERED ASSETS 1 980 128
Current liabilities
Payables 1 980 -
Total administered current liabilities 1 980 -
TOTAL ADMINISTERED LIABILITIES 1 980 -
* See note 5 for details regarding the restatement of comparatives.
2015–16 Annual Report | 114
Certification of key performance indicators
For the year ended 30 June 2016
I hereby certify that the key performance indicators are based on proper records, are relevant and appropriate for assisting users to assess the Department of Training and Workforce Development’s performance, and fairly represent the performance of the Department of Training and Workforce Development for the financial year ended 30 June 2016.
DR RUTH SHEAN DIRECTOR GENERAL (ACCOUNTABLE AUTHORITY)
5 September 2016
Additional key performance indicators information
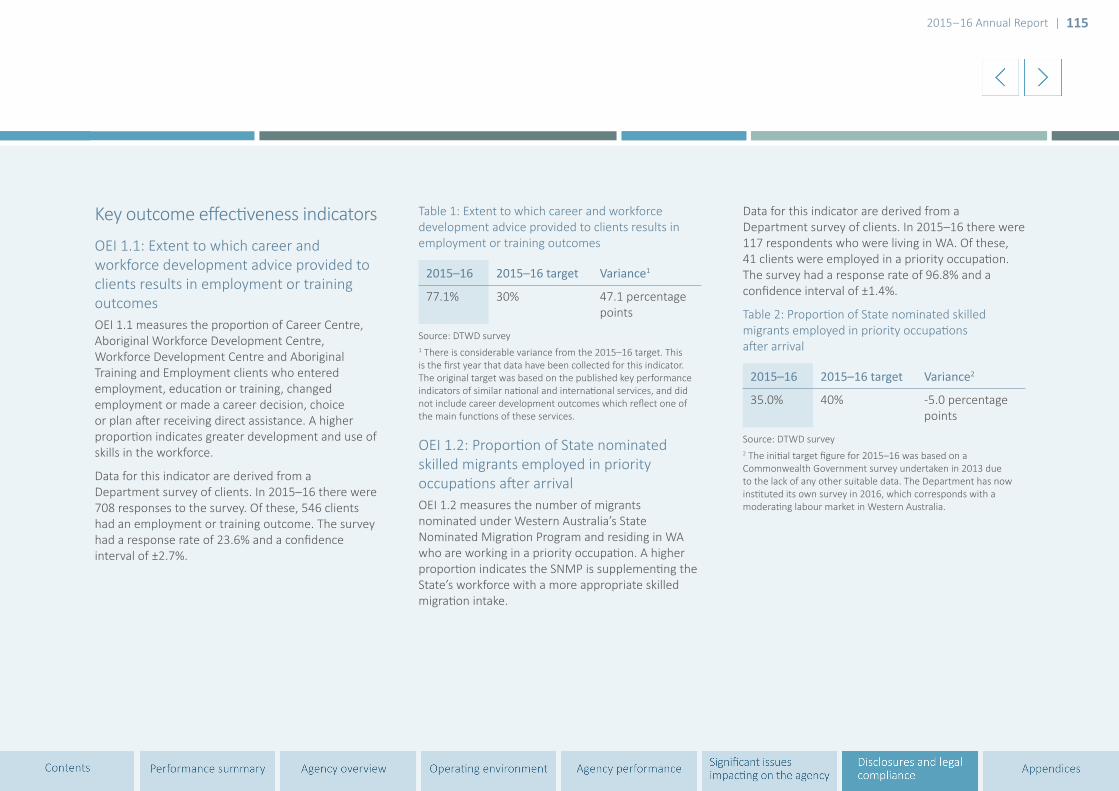
2015–16 Annual Report | 115
Key outcome effectiveness indicators
OEI 1.1: Extent to which career and workforce development advice provided to clients results in employment or training outcomesOEI 1.1 measures the proportion of Career Centre, Aboriginal Workforce Development Centre, Workforce Development Centre and Aboriginal Training and Employment clients who entered employment, education or training, changed employment or made a career decision, choice or plan after receiving direct assistance. A higher proportion indicates greater development and use of skills in the workforce.
Data for this indicator are derived from a Department survey of clients. In 2015–16 there were 708 responses to the survey. Of these, 546 clients had an employment or training outcome. The survey had a response rate of 23.6% and a confidence interval of ±2.7%.
Table 1: Extent to which career and workforce development advice provided to clients results in employment or training outcomes
2015–16 2015–16 target Variance1
77.1% 30% 47.1 percentage points
Source: DTWD survey1 There is considerable variance from the 2015–16 target. This is the first year that data have been collected for this indicator. The original target was based on the published key performance indicators of similar national and international services, and did not include career development outcomes which reflect one of the main functions of these services.
OEI 1.2: Proportion of State nominated skilled migrants employed in priority occupations after arrivalOEI 1.2 measures the number of migrants nominated under Western Australia’s State Nominated Migration Program and residing in WA who are working in a priority occupation. A higher proportion indicates the SNMP is supplementing the State’s workforce with a more appropriate skilled migration intake.
Data for this indicator are derived from a Department survey of clients. In 2015–16 there were 117 respondents who were living in WA. Of these, 41 clients were employed in a priority occupation. The survey had a response rate of 96.8% and a confidence interval of ±1.4%.
Table 2: Proportion of State nominated skilled migrants employed in priority occupations after arrival
2015–16 2015–16 target Variance2
35.0% 40% -5.0 percentage points
Source: DTWD survey2 The initial target figure for 2015–16 was based on a Commonwealth Government survey undertaken in 2013 due to the lack of any other suitable data. The Department has now instituted its own survey in 2016, which corresponds with a moderating labour market in Western Australia.

2015–16 Annual Report | 116
OEI 2.1: Proportion of delivery in training aligned with State priority occupationsOEI 2.1 measures the hours of publicly funded delivery in priority training as a proportion of all publicly funded delivery. A higher proportion indicates the training system is more responsive to the employment and skill needs of the State and flexible in adapting to the State’s priorities.
Hours are calculated based on the 2015 calendar year. In 2015 there was a total of 34 364 902 publicly funded delivery hours. Of these, 21 919 845 hours were delivered in priority training areas.
Table 3: Proportion of delivery in training aligned with State priority occupations
2015–16 2015–16 target Variance3
63.8% 55% 8.8 percentage points
Source: DTWD VET Enrolment Collection3 The 2015–16 figure is higher than the target. Enrolments in delivery in training aligned with State priority occupations grew by a further 11% in 2015 after a 9% increase in 2014, reflecting the addition of 55 qualifications to the 2015 priority industry qualifications list.
OEI 2.2: Proportion of graduates satisfied with the overall quality of trainingOEI 2.2 measures the proportion of vocational education and training graduates in Western Australia who are satisfied with the overall quality of training. A higher proportion indicates a better quality training system.
Data for this indicator are derived from a National Centre for Vocational Education Research survey. The survey had a response rate of 40.9% among Western Australian graduates and a confidence interval of ±0.9%.
Table 4: Proportion of graduates satisfied with the overall quality of training
2015–16 2015–16 target Variance4
87.9% 90% -2.1 percentage points
Source: National Centre for Vocational Education Research, Student Outcomes Survey 20154 The figure for 2015–16 is marginally lower than the target.
Service efficiency indicators
SEI 1.1: Average cost per industry and stakeholder contactThe Department works closely with industry, the community and across government in gathering and analysing workforce data and intelligence to identify the State’s workforce development and training priorities.
SEI 1.1 measures the average cost (including overheads) per formal contact on workforce planning and development matters with external organisations identified on an endorsed stakeholder list. Grants to industry training councils are excluded from the total cost.
A lower cost indicates more cost effective coordination of workforce planning and development consultations. Total costs for 2015–16 were $5 161 325.
In 2015–16 there were 1 185 formal contacts with stakeholders. These include planning meetings and official correspondence via letters, emails and scheduled phone calls. This was an increase on the estimated target primarily resulting from the increased scope of industry and stakeholder contacts relating to training curriculum.
Table 5: Average cost per industry and stakeholder contact
2015–16 2015–16 target Variance
$4 356 $4 341 $15
Source: DTWD finance and administrative data

2015–16 Annual Report | 117
SEI 3.1: Average cost per career and workforce development centre client contactCareer and workforce development services provide education and training information, and career guidance to the Western Australian community, as well as employment, training and mentoring services to Aboriginal people and communities.
SEI 3.1 measures the average cost (including overheads) of providing career and workforce development services per client contact. A lower cost indicates a more cost effective provision of career and workforce development services.
The total number of client contacts was 42 812, including 14 192 at the Career Centre, 8 186 at Aboriginal Workforce Development Centres, 18 218 at Workforce Development Centres and 2 216 at Aboriginal Training and Employment providers.
Total expenditure on career and workforce development centres in 2015–16 was $13 157 258.
Table 7: Average cost per career and workforce development centre client contact
2015–16 2015–16 target Variance6
$307 $391 -$84
Source: DTWD finance and administrative data
6 The variance from the 2015–16 target is due to the incorporation of WDC and ATE services, managed by the contracted not for
SEI 2.1: Average cost of meeting major policy milestonesThe Department develops policies and programs that promote the effective and efficient operation of the State’s vocational education and training system. Policy and program development is aligned to the Department’s strategic direction for workforce development and training including higher education and the school sector.
SEI 2.1 measures the cost of the Policy, Planning and Research branch (including overheads) per Ministerial briefing note. A lower cost indicates more cost effective policy and program development.
The number of Ministerial briefing notes in 2015–16 was 246. Total branch costs were $6 849 426.
Table 6: Average cost of meeting major policy milestones
2015–16 2015–16 target Variance5
$27 843 $42 146 -$14 303
Source: DTWD finance and administrative data5 The variance from the 2015–16 target is due largely to an increase in briefings relating to the research, policy development and implementation of reforms in 2015–16 at both State and national level, as well as expenditure savings in contracts and services and staff vacancies.
profit organisations, into this measure during the reporting year. The target was set on the assumption these services would be incorporated in 2016–17. The large number of WDC client contacts accounts for the majority of the variance.
SEI 4.1: Average cost to administer migration applications and overseas qualification assessmentsSkilled migration, including overseas qualification assessment, assesses applications from intending skilled migrants who wish to migrate to Western Australia, and assesses post-secondary qualifications gained overseas for Western Australian residents. The service aims to facilitate skilled migration to Western Australia to supplement the local workforce and enable overseas trained residents to access education, training and employment through recognition of overseas qualifications.
SEI 4.1 measures the average cost (including overheads) to process migration and overseas qualification applications. A lower cost indicates a more cost effective process for assessing overseas qualifications and administering migration program applications.
In 2015–16 there were 5 387 migration applications and qualification assessments. Total expenditure was $1 725 649.

2015–16 Annual Report | 118
Table 8: Average cost to administer migration applications and overseas qualification assessments
2015–16 2015–16 target Variance7
$320 $576 -$256
Source: DTWD finance and administrative data7 The variance is due largely to lower than anticipated contracts and services expenditure and overheads associated with corporate support and administrative functions.
SEI 5.1: Average cost per active training contractApprenticeship and traineeship administration and regulation includes registration of training contracts and administration of contract variations, educating participants on training contract and legislation requirements, dispute resolution and monitoring of legislative compliance.
SEI 5.1 measures the average cost to Apprenticeship Office (including overheads) of administering apprenticeship and traineeship training contracts. A lower cost indicates more cost effective administration and regulation of apprenticeships and traineeships.
In 2015–16 there were 40 359 active training contracts (this figure is weighted according to the number of days contracts were active during the year). Total expenditure was $9 091 262.
Table 9: Average cost per active training contract
2015–16 2015–16 target Variance8
$225 $243 -$18
Source: DTWD finance data and Training Records System8 The variance from the 2015–16 target is due largely to lower than anticipated overheads associated with corporate support and administrative functions.
SEI 6.1: Cost per student curriculum hour Procurement of training comprises the purchasing of training delivery services from TAFE colleges and private training providers in accordance with the State’s priorities and the State Training Plan. The service is differentiated according to the major Future Skills WA funding categories.
SEI 6.1 measures the average value of Government subsidy per student curriculum hour for each funding category. Hours are reported on a calendar year non-adjusted end of study basis. A lower cost indicates a more cost effective administration of the State training system.
The number of funded hours in 2015 was 34 364 902. Total expenditure on procurement of training in 2015–16 was $475 845 400.
Table 10: Cost per student curriculum hour
2015–16 2015–16 target
Variance
Diploma and above
$10.71 $10.76 -$0.05
Apprentices and trainees (Certificate IV and below)
$13.96 $14.04 -$0.08
Priority industry training (Certificate I to Certificate IV)
$12.72 $12.70 $0.02
General industry training (Certificate I to Certificate IV)
$15.25 $14.64 $0.61
Foundation skills courses
$16.75 $15.60 $1.15
Source: DTWD finance data and VET Enrolment Collection
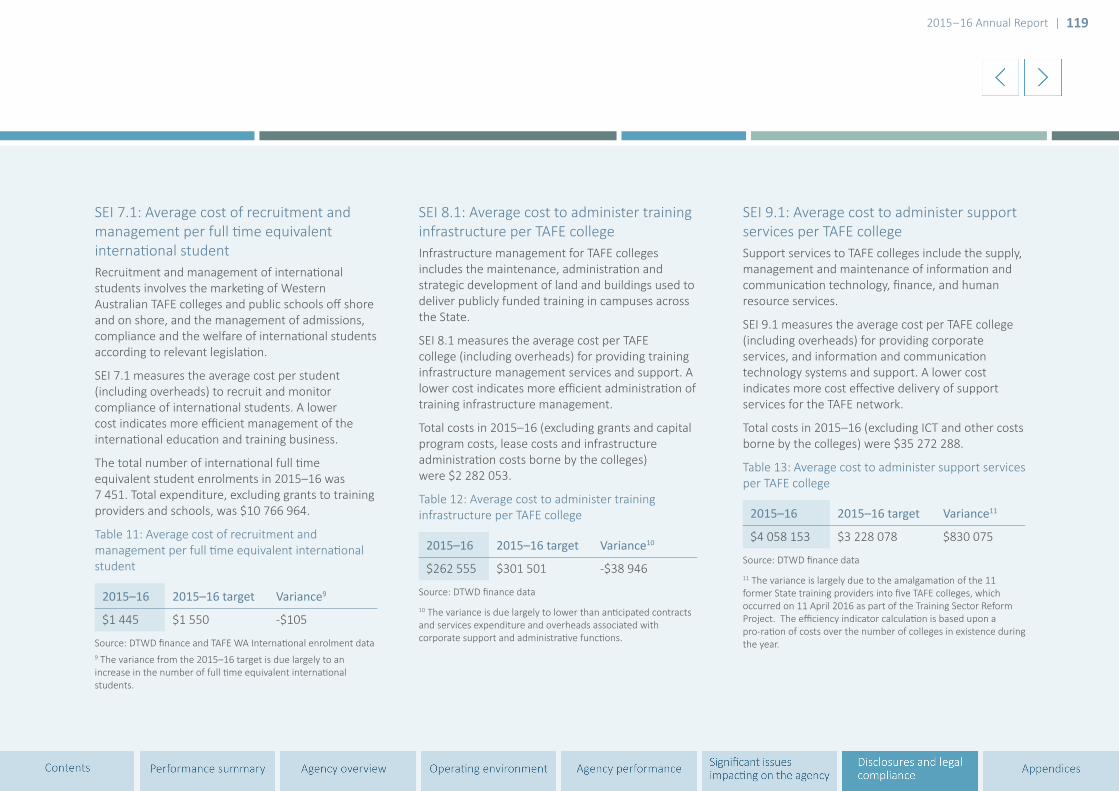
2015–16 Annual Report | 119
SEI 7.1: Average cost of recruitment and management per full time equivalent international studentRecruitment and management of international students involves the marketing of Western Australian TAFE colleges and public schools off shore and on shore, and the management of admissions, compliance and the welfare of international students according to relevant legislation.
SEI 7.1 measures the average cost per student (including overheads) to recruit and monitor compliance of international students. A lower cost indicates more efficient management of the international education and training business.
The total number of international full time equivalent student enrolments in 2015–16 was 7 451. Total expenditure, excluding grants to training providers and schools, was $10 766 964.
Table 11: Average cost of recruitment and management per full time equivalent international student
2015–16 2015–16 target Variance9
$1 445 $1 550 -$105
Source: DTWD finance and TAFE WA International enrolment data9 The variance from the 2015–16 target is due largely to an increase in the number of full time equivalent international students.
SEI 8.1: Average cost to administer training infrastructure per TAFE collegeInfrastructure management for TAFE colleges includes the maintenance, administration and strategic development of land and buildings used to deliver publicly funded training in campuses across the State.
SEI 8.1 measures the average cost per TAFE college (including overheads) for providing training infrastructure management services and support. A lower cost indicates more efficient administration of training infrastructure management.
Total costs in 2015–16 (excluding grants and capital program costs, lease costs and infrastructure administration costs borne by the colleges) were $2 282 053.
Table 12: Average cost to administer training infrastructure per TAFE college
2015–16 2015–16 target Variance10
$262 555 $301 501 -$38 946
Source: DTWD finance data
10 The variance is due largely to lower than anticipated contracts and services expenditure and overheads associated with corporate support and administrative functions.
SEI 9.1: Average cost to administer support services per TAFE collegeSupport services to TAFE colleges include the supply, management and maintenance of information and communication technology, finance, and human resource services.
SEI 9.1 measures the average cost per TAFE college (including overheads) for providing corporate services, and information and communication technology systems and support. A lower cost indicates more cost effective delivery of support services for the TAFE network.
Total costs in 2015–16 (excluding ICT and other costs borne by the colleges) were $35 272 288.
Table 13: Average cost to administer support services per TAFE college
2015–16 2015–16 target Variance11
$4 058 153 $3 228 078 $830 075
Source: DTWD finance data
11 The variance is largely due to the amalgamation of the 11 former State training providers into five TAFE colleges, which occurred on 11 April 2016 as part of the Training Sector Reform Project. The efficiency indicator calculation is based upon a pro-ration of costs over the number of colleges in existence during the year.

2015–16 Annual Report | 120
Ministerial directives
Treasurer’s Instruction 903 (12) requires the Department to disclose details of any Ministerial directives relevant to the setting of desired outcomes or operational objectives, the achievement of desired outcomes or operational objectives, investment activities and financing activities.
No such directives were issued by the Minister for Training and Workforce Development in 2015–16.
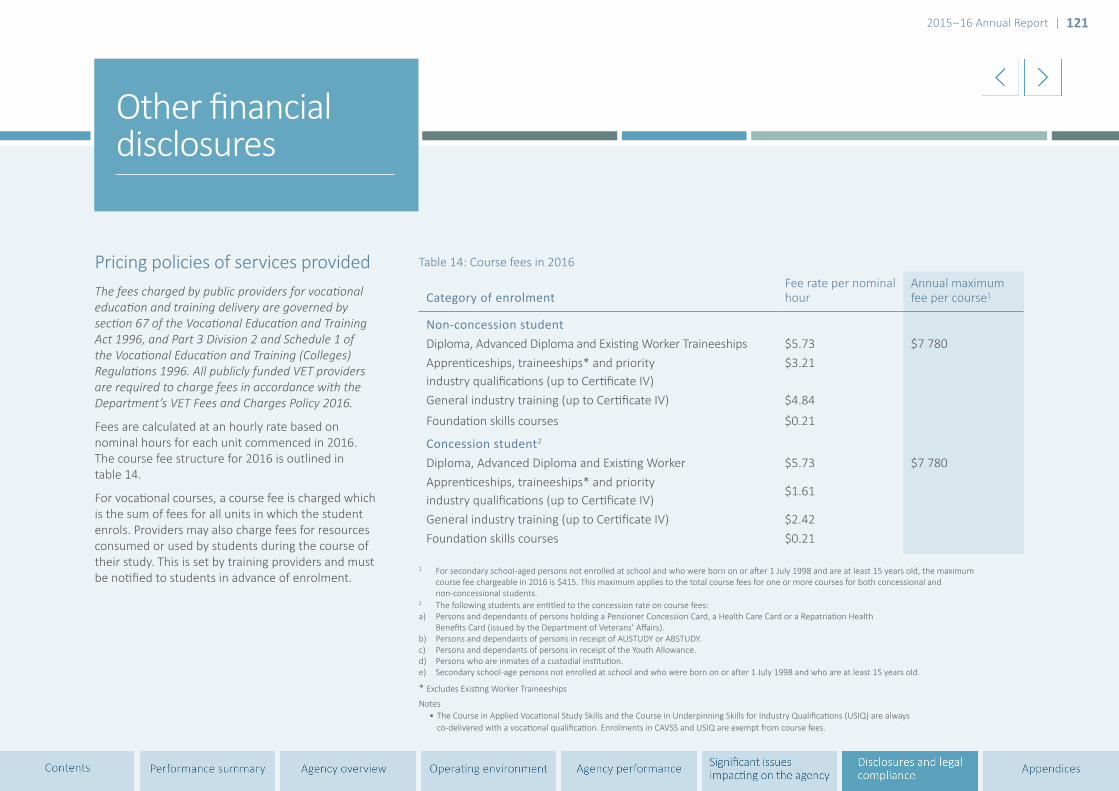
2015–16 Annual Report | 121
Pricing policies of services providedThe fees charged by public providers for vocational education and training delivery are governed by section 67 of the Vocational Education and Training Act 1996, and Part 3 Division 2 and Schedule 1 of the Vocational Education and Training (Colleges) Regulations 1996. All publicly funded VET providers are required to charge fees in accordance with the Department’s VET Fees and Charges Policy 2016.
Fees are calculated at an hourly rate based on nominal hours for each unit commenced in 2016. The course fee structure for 2016 is outlined in table 14.
For vocational courses, a course fee is charged which is the sum of fees for all units in which the student enrols. Providers may also charge fees for resources consumed or used by students during the course of their study. This is set by training providers and must be notified to students in advance of enrolment.
Other financial disclosures
Table 14: Course fees in 2016
Category of enrolmentFee rate per nominal hour
Annual maximum fee per course1
Non-concession studentDiploma, Advanced Diploma and Existing Worker Traineeships $5.73 $7 780Apprenticeships, traineeships* and priorityindustry qualifications (up to Certificate IV)
$3.21
General industry training (up to Certificate IV) $4.84
Foundation skills courses $0.21
Concession student2
Diploma, Advanced Diploma and Existing Worker $5.73 $7 780Apprenticeships, traineeships* and priorityindustry qualifications (up to Certificate IV)
$1.61
General industry training (up to Certificate IV) $2.42Foundation skills courses $0.21
1 For secondary school-aged persons not enrolled at school and who were born on or after 1 July 1998 and are at least 15 years old, the maximum course fee chargeable in 2016 is $415. This maximum applies to the total course fees for one or more courses for both concessional and non-concessional students.2 The following students are entitled to the concession rate on course fees:a) Persons and dependants of persons holding a Pensioner Concession Card, a Health Care Card or a Repatriation Health Benefits Card (issued by the Department of Veterans’ Affairs).b) Persons and dependants of persons in receipt of AUSTUDY or ABSTUDY.c) Persons and dependants of persons in receipt of the Youth Allowance.d) Persons who are inmates of a custodial institution.e) Secondary school-age persons not enrolled at school and who were born on or after 1 July 1998 and who are at least 15 years old.
* Excludes Existing Worker Traineeships
Notes• The Course in Applied Vocational Study Skills and the Course in Underpinning Skills for Industry Qualifications (USIQ) are always
co-delivered with a vocational qualification. Enrolments in CAVSS and USIQ are exempt from course fees.

2015–16 Annual Report | 122
Major capital works
A. Projects completedThe following capital works projects were completed in the 2015–16 financial year:
• Centre for Resource Sector Workforce Training in Geraldton (Central Regional TAFE)
• Centre for Health Industries Training and Workforce Development in Geraldton (Central Regional TAFE)
• Goldfields Arts Centre refurbishment
Pictured above: Aboriginal Learning Centre (part of the Centre for Health Industries Training and Workforce Development, Central Regional TAFE)

2015–16 Annual Report | 123
* Part of $31.3 million remedial works package. + Includes a co-contribution. ++ State Government Asset Investment Program efficiency measure included.
B. Projects in progress
TAFE colleges ProjectExpected completion date
Actual expenditure 2015–16 ($'000)
Actual expenditure 2014–15 (includes capital grants) ($'000)
Estimated cost to complete ($'000)
Estimated total cost ($'000)
North Regional TAFE (formerly Pilbara Institute)
South Hedland and Karratha campuses – upgrade and expansion (Royalties for Regions)
December 2016 5 095 3 304 1 085 15 219
South Metropolitan TAFE (formerly Challenger Institute of Technology)+ ++
Murdoch campus – stage 4 September 2017 7 493 2 278 31 552 41 970
Muresk Institute++ Muresk Institute campus upgrade December 2016 930 1 094 918 4 707
South Metropolitan TAFE (formerly Challenger Institute of Technology)++
Australian Centre of Energy and Process Training
July 2017 340 482 10 530 12 000
North Regional TAFE (formerly Pilbara Institute)+
Health and Allied Services Training
January 2017 6 310 979 2 920 12 400
North Regional TAFE (formerly Pilbara Institute)+
Electrical Instrumentation Centre January 2017 3 523 1 171 4 625 7 760
North Metropolitan TAFE (formerly West Coast Institute)
McLarty campus – new remedial works project*
February 2017 3 904 1 946 150 6 000
North Metropolitan TAFE (formerly Central Institute of Technology)
Mt Lawley campus – remedial works project
January 2018 1 611 2 436 4 047

2015–16 Annual Report | 124
Employee profile The Department employs public service officers who are primarily located in the metropolitan area. From the 2014–15 to 2015–16 reporting period there was relative stability in the Department’s Full Time Equivalent employee numbers.
2014–15 2015–16
Male Female Male Female
Employee by gender (headcount) 194 360 189 353
Employee median age (headcount) 45.9 44.5 45 44
Employment arrangement: part time (headcount) 8 69 11 68
Employment arrangement: full time (headcount) 186 289 178 285
Employee work location: metropolitan (FTE) 479 469
Employee work location: regional (FTE) 21.5 16.5
Employment status: permanent (headcount) 472 472
Employment status:fixed term (headcount) 80 70
Employment status: casual (headcount) 2 0
Source: Human Resources Management Information System 30 June 2016.
Note: Includes officers on secondment from other Government agencies.
Staffing
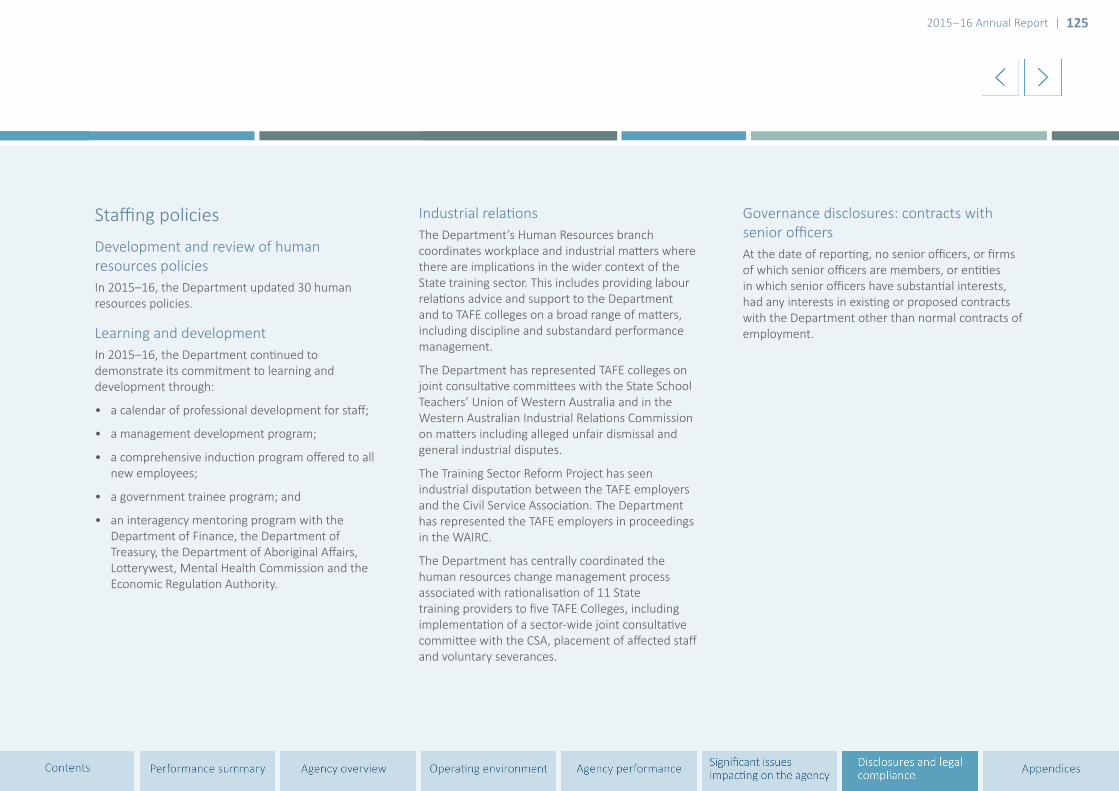
2015–16 Annual Report | 125
Staffing policies
Development and review of human resources policiesIn 2015–16, the Department updated 30 human resources policies.
Learning and developmentIn 2015–16, the Department continued to demonstrate its commitment to learning and development through:
• a calendar of professional development for staff;
• a management development program;
• a comprehensive induction program offered to all new employees;
• a government trainee program; and
• an interagency mentoring program with the Department of Finance, the Department of Treasury, the Department of Aboriginal Affairs, Lotterywest, Mental Health Commission and the Economic Regulation Authority.
Industrial relationsThe Department’s Human Resources branch coordinates workplace and industrial matters where there are implications in the wider context of the State training sector. This includes providing labour relations advice and support to the Department and to TAFE colleges on a broad range of matters, including discipline and substandard performance management.
The Department has represented TAFE colleges on joint consultative committees with the State School Teachers’ Union of Western Australia and in the Western Australian Industrial Relations Commission on matters including alleged unfair dismissal and general industrial disputes.
The Training Sector Reform Project has seen industrial disputation between the TAFE employers and the Civil Service Association. The Department has represented the TAFE employers in proceedings in the WAIRC.
The Department has centrally coordinated the human resources change management process associated with rationalisation of 11 State training providers to five TAFE Colleges, including implementation of a sector-wide joint consultative committee with the CSA, placement of affected staff and voluntary severances.
Governance disclosures: contracts with senior officersAt the date of reporting, no senior officers, or firms of which senior officers are members, or entities in which senior officers have substantial interests, had any interests in existing or proposed contracts with the Department other than normal contracts of employment.

2015–16 Annual Report | 126
Outcome Strategies Status
People with disability have the same opportunities as other people to access the services of, and any events organised by, the Department of Training and Workforce Development.
Department policies promote inclusion and participation for people with disability. Completed
People with disability are able to fully participate in State funded training. Completed
Data regarding students with disability are valid and reliable. Completed
Stronger links with State and private training providers. Completed
Staff are aware of disability and DAIP requirements. Completed
People with disability are encouraged to access services and events. Completed
People with disability are able to participate in events. Completed
Contractors and agents are aware of their responsibilities under the Department’s DAIP. Completed
Online reporting tool developed for collection and analysis of data from agents and contractors.
Completed
Disability access and inclusion plan outcomesIn accordance with the Disability Services Act 1993 (amended 2004) the Department has developed and implemented a Disability Access and Inclusion Plan 2011–2016.
The DAIP specifies actions and responsibilities for each directorate to improve access to the Department’s facilities, services and information for
people with disability. The final progress report for this DAIP was submitted to the Disability Services Commission in June 2016. The Department is to develop a new DAIP for 2017–2021, to be published by 1 January 2017.
All Department policies are required to be developed in the context of the DAIP and information is provided to staff at induction and online. The DAIP is also available in electronic format on
the Department’s website. The DAIP provides guidelines to agents and contractors to ensure that everyone has equal access to services provided by the Department.
For more information on the DAIP, visit dtwd.wa.gov.au.

2015–16 Annual Report | 127
Outcome Strategies Status
People with disability have the same opportunities as other people to access the buildings and other facilities of the Department of Training and Workforce Development.
All Department buildings and facilities are accessible to people with disability.
State training provider funding is available to make training more accessible.
Completed
Completed
People with disability receive information from the Department of Training and Workforce Development in a format that will enable them to access the information as readily as other people are able to access it.
The Department’s website is accessible to people with disability.
Department publications are accessible to people with disability.
Language used in Department communication and publications is inclusive and contemporary.
Staff are aware of publication standards and use of inclusive language.
Department information is accessible by people with disability.
Ongoing
Completed
Completed
Completed
Completed
People with disability receive the same level and quality of service from the staff of the Department of Training and Workforce Development as other people receive from the staff of the Department.
Staff are aware of the expected code of conduct and responsibilities of the DAIP.
Completed
People with disability have the same opportunities as other people to make complaints to the Department of Training and Workforce Development.
Staff and public are aware of complaints process. Completed
People with disability have the same opportunities as other people to participate in any public consultation by the Department of Training and Workforce Development.
Public consultation venues support participation by people with disability.
Completed
People with disability have the same opportunities as other people to access and participate in employment at the Department of Training and Workforce Development.
Increase participation of people with disability in the Department’s workforce. Ongoing(The Department relies on voluntary disclosure to capture statistics)

2015–16 Annual Report | 128
Compliance with Public Sector Standards and ethical codesThe Department complies with Public Sector Standards and the Public Sector Commission’s Code of ethics through its own Code of conduct. Breach of standard claims are managed as required by the Public Sector Management (Breaches of Public Sector Standards) Regulations 2005.
The Department ensures compliance with Public Sector Standards through:
• providing information about the standards in relevant human resource management policies and resources;
• providing an advisory and consultancy service to staff on standards related matters;
• including information about the PSC’s Code of ethics and the Department’s Code of conduct in the staff induction program;
• notifying job applicants of their rights and obligations prescribed by the regulations; and
• requiring all new staff to complete training in accountable and ethical decision making.
During the reporting period, there were no breach claims lodged with the Department.
Management of complaints General complaints are managed in accordance with the Department’s Complaints Management Policy through:• E: [email protected]• T: (08) 6551 5000
The policy conforms to Australian standard and public sector requirements.
In 2015–16, one complaint from a member of the public was received and satisfactorily resolved. Key program areas manage complaints and enquiries through:
Apprenticeship Office• E: [email protected]• T: 13 19 54
Career Centre• E: [email protected]• T: 13 23 98 or (08) 9224 6500
Future Skills WA• E: [email protected]• T: (08) 6551 5567
Enquiries are referred to the relevant area and responses are quality checked and processed efficiently.
Internal grievance issues are managed in accordance with the Grievance Resolution Policy consistent with relevant legislation, the PSC’s Code of ethics, the Department’s Code of conduct and relevant Department policies.
The Commonwealth Government’s National Training Complaints Hotline set up in early 2015 resides with the Department, receiving complaints referred by the Commonwealth to Western Australia. The Department’s Complaints Management Policy applies for complaints received about its own products and services. All other complaints are referred to relevant agencies for action. Quarterly updates are provided to the Department’s Corporate Executive.
Misconduct managementThe Department reports potential serious misconduct to the Crime and Corruption Commission and potential minor misconduct to the PSC as required under the relevant legislation. In 2015–16 two new notifications of potential serious misconduct were made to the CCC and no new notifications of potential minor misconduct were made to the PSC.

2015–16 Annual Report | 129
Public interest disclosureThe Public Interest Disclosure Act 2003 facilitates the disclosure of information in the public interest about matters of wrongdoing, corruption or improper conduct within the Western Australian public sector. The legislation provides protections for the person raising the disclosure and any person about whom the disclosure is made. The Department has eight fully trained Public Interest Disclosure officers. There was one public interest disclosure during 2015–16.
The Department’s induction program provides information and raises awareness in relation to the PID legislation, including the process for making disclosures.
Working with children checksThe Working with Children (Criminal Record Checking) Act 2004 makes it compulsory for people in child related work to apply for a Working with children check. The Department currently has 68 positions assessed as requiring a Working with children check.
Criminal convictions screeningThe Department’s Criminal Convictions Screening Policy requires all employees to hold a National Police Certificate which is valid for five years. In the 2015–16 year, 34 employees were screened for criminal convictions.
Record keeping Under the State Records Act 2000, each government agency is required to develop a Record keeping plan. The efficiency and effectiveness of the Department’s RKP is evaluated regularly to ensure compliance to the Act. Work is continuing on the next submission to the State Records Commission due in December 2016. The Department is working closely with the five TAFE Colleges to ensure their record keeping responsibilities are adequately addressed in light of the recent Training Sector Reform Project.
The effective disposal of records is essential to the efficient operation of the records system. A disposal program has commenced in the last six months to ensure records are being managed in an appropriate and compliant manner.
The Department uses the Electronic Document and Records Management System HP TRIM to manage physical and electronic records including the
management of the retention and disposal of such records. The Department continues to support two instances of TRIM, one for Training Business Services and one for the remainder of the Department (Corporate). In 2015–16, approximately 185 000 documents were registered in TBS TRIM and 175 000 documents in Corporate TRIM.
New staff are provided with an overview, and made aware, of their record keeping obligations as part of the Department’s induction program. Under the Department’s Records Management Policy, all staff must complete records awareness training, and the TRIM introduction course and assessment before access to TRIM is granted. During 2015–16, 43 Department staff completed the TRIM introductory course. TRIM help sheets and videos are available on the Department’s intranet to assist staff to meet their obligations.
Work is well underway to upgrade the current version of TRIM to the retitled HP Records Manager.
During 2015–16, 56 staff completed records awareness training.

Title
2015–16 Annual Report | 130
Government policy requirements
Substantive equalityThe Department ensured that substantive equality was integrated into policies, workplaces and services provided to and by the Department.
The Substantive equality framework and the Substantive Equality Policy continued to be implemented in 2015–16. Strategies and services which helped to reduce systemic discrimination included:
• Training Together – Working Together, Aboriginal workforce development strategy;
• Aboriginal Workforce Development Centres;
• Aboriginal Youth Transitions program, including the Employer Engagement project with Regional Chambers of Commerce and Industry WA, initiated on 1 June 2016;
• Aboriginal Training and Employment services;
• Mercycare Workforce Development Centre (assists people from a culturally and linguistically diverse background);
• migration services (overseas qualification assessment, and information and referrals to help skilled migrants and their dependants settle in WA);
• Reconciliation action plan 2013–2015;
• Aboriginal School-based Training program;
• Language Services Policy (assisting people who require interpreters);
• Western Australian Group Training program;
• regional workforce development plans; and
• foundation skills training under Future Skills WA.
During 2015–16, the Department continued its participation on two committees statewide which were established to assist under-represented groups. The Substantive Equality Policy was reviewed to broaden its scope to cover all forms of systemic discrimination.
Language services policyThe Western Australian Language Services Policy aims to ensure that language is not a barrier to Government services and programs. The Department focuses on business areas which deliver services directly to the public. In the reporting period, translating and interpreting services were provided for clients of TAFE International WA and the Overseas Qualification Unit.
Occupational safety and health and injury managementThe Department endeavours at all times to provide a safe and healthy workplace and ensure compliance with the Occupational Safety and Health Act 1984.
The Department’s Occupational safety and health management plan 2015–16 was endorsed by the Occupational Safety and Health Committee.
The Department is committed to providing a safe and healthy work environment for employees, contractors and visitors. In 2015–16, one new safety and health representative was elected.
The Department provided a comprehensive in-house ergonomic assessment service with 19 assessments completed since July 2015.

2015–16 Annual Report | 131
Workers’ compensationTo ensure best practice in the management of workers’ compensation claims the Department holds regular claim review meetings with RiskCover. All workers’ compensation claims are managed by RiskCover and the Department in accordance with legislative requirements to minimise time lost. In 2015–16, there were seven new compensation claims and one carried over from the previous reporting period.
This compares to four compensation claims recorded in 2014–15.
The Department provides assistance to employees who sustain an injury or illness in the course of their duties and facilitates an early return to work where practicable. The Department has an Injury Management and Workers’ Compensation Policy developed in accordance with the requirements of the Workers’ Compensation and Injury Management Act 1981.
The Department also provides assistance to employees with non-compensable injuries or illnesses to remain in the workplace where possible or facilitate an early return to work. A comprehensive Return to work program is developed for each case under medical supervision.
Measure
Actual results
Target Comment on result2014–15 2015–16
Number of fatalities 0 0 0 Target achieved
Lost time injury and/or disease incidence rate 0.399 0.6171 0 or 10% reduction There was one additional incident
Lost time injury and/or disease severity rate 0 33.332 0 or 10% reduction There was one severe injury
Percentage of injured workers returned to work(i) within 13 weeks(ii) within 26 weeks
100%100%
100%100%
100% 80%
Target achievedTarget achieved
Percentage of managers trained in occupational safety, health and injury 86% 82% Greater than or equal to 80% Target achieved
Notes:1 There were two lost time injury claims in 2014–15, while the number of full time equivalents in 2014–15 was 500.5. There were three LTI claims in 2015–16, while the full time equivalents in 2015–16 were 485.5.2 There were no claims lodged in 2014–15 with greater than 60 days lost from work. There was one claim lodged in 2015–16 with greater than 60 days or more lost from work.
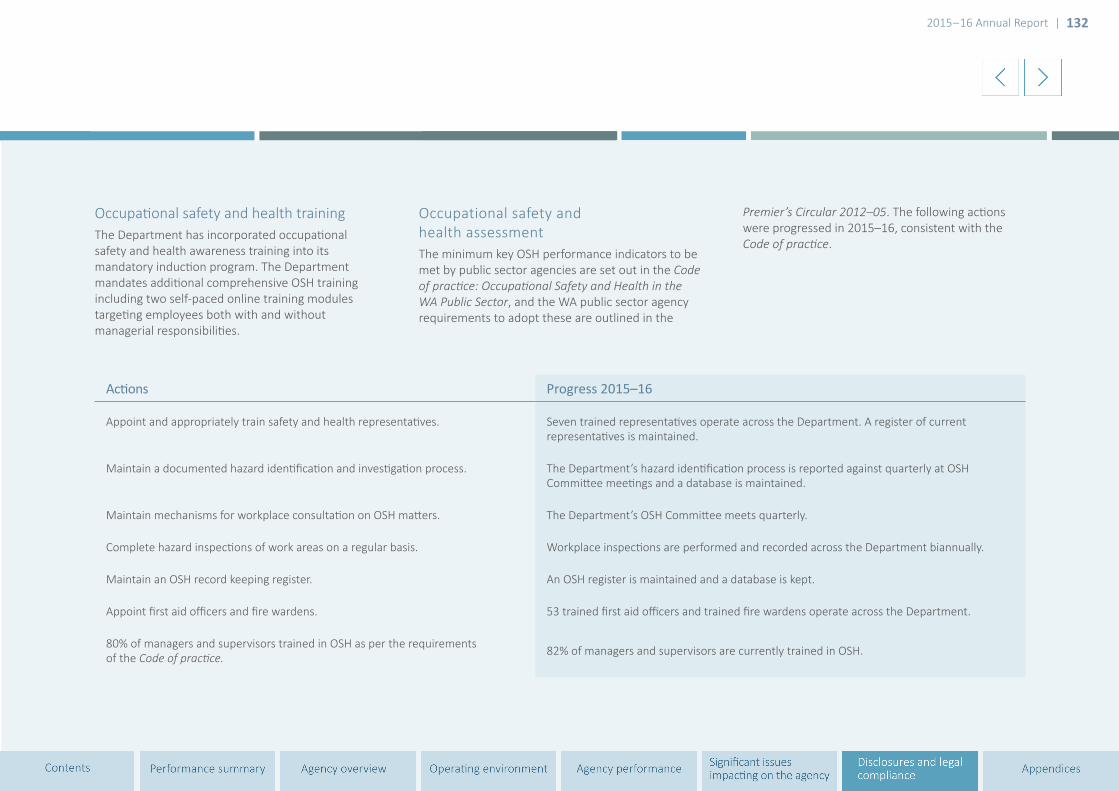
2015–16 Annual Report | 132
Occupational safety and health trainingThe Department has incorporated occupational safety and health awareness training into its mandatory induction program. The Department mandates additional comprehensive OSH training including two self-paced online training modules targeting employees both with and without managerial responsibilities.
Occupational safety and health assessmentThe minimum key OSH performance indicators to be met by public sector agencies are set out in the Code of practice: Occupational Safety and Health in the WA Public Sector, and the WA public sector agency requirements to adopt these are outlined in the
Premier’s Circular 2012–05. The following actions were progressed in 2015–16, consistent with the Code of practice.
Actions Progress 2015–16
Appoint and appropriately train safety and health representatives. Seven trained representatives operate across the Department. A register of current representatives is maintained.
Maintain a documented hazard identification and investigation process. The Department’s hazard identification process is reported against quarterly at OSH Committee meetings and a database is maintained.
Maintain mechanisms for workplace consultation on OSH matters. The Department’s OSH Committee meets quarterly.
Complete hazard inspections of work areas on a regular basis. Workplace inspections are performed and recorded across the Department biannually.
Maintain an OSH record keeping register. An OSH register is maintained and a database is kept.
Appoint first aid officers and fire wardens. 53 trained first aid officers and trained fire wardens operate across the Department.
80% of managers and supervisors trained in OSH as per the requirements of the Code of practice. 82% of managers and supervisors are currently trained in OSH.
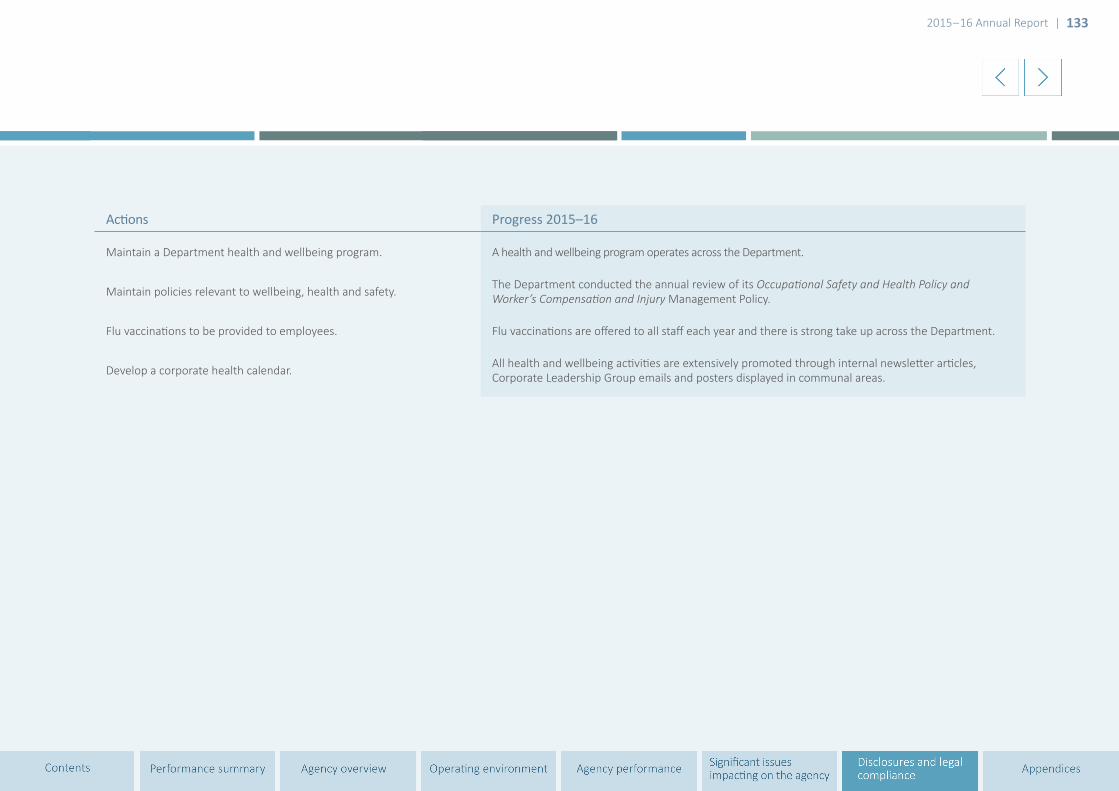
2015–16 Annual Report | 133
Actions Progress 2015–16
Maintain a Department health and wellbeing program. A health and wellbeing program operates across the Department.
Maintain policies relevant to wellbeing, health and safety. The Department conducted the annual review of its Occupational Safety and Health Policy and Worker’s Compensation and Injury Management Policy.
Flu vaccinations to be provided to employees. Flu vaccinations are offered to all staff each year and there is strong take up across the Department.
Develop a corporate health calendar. All health and wellbeing activities are extensively promoted through internal newsletter articles, Corporate Leadership Group emails and posters displayed in communal areas.
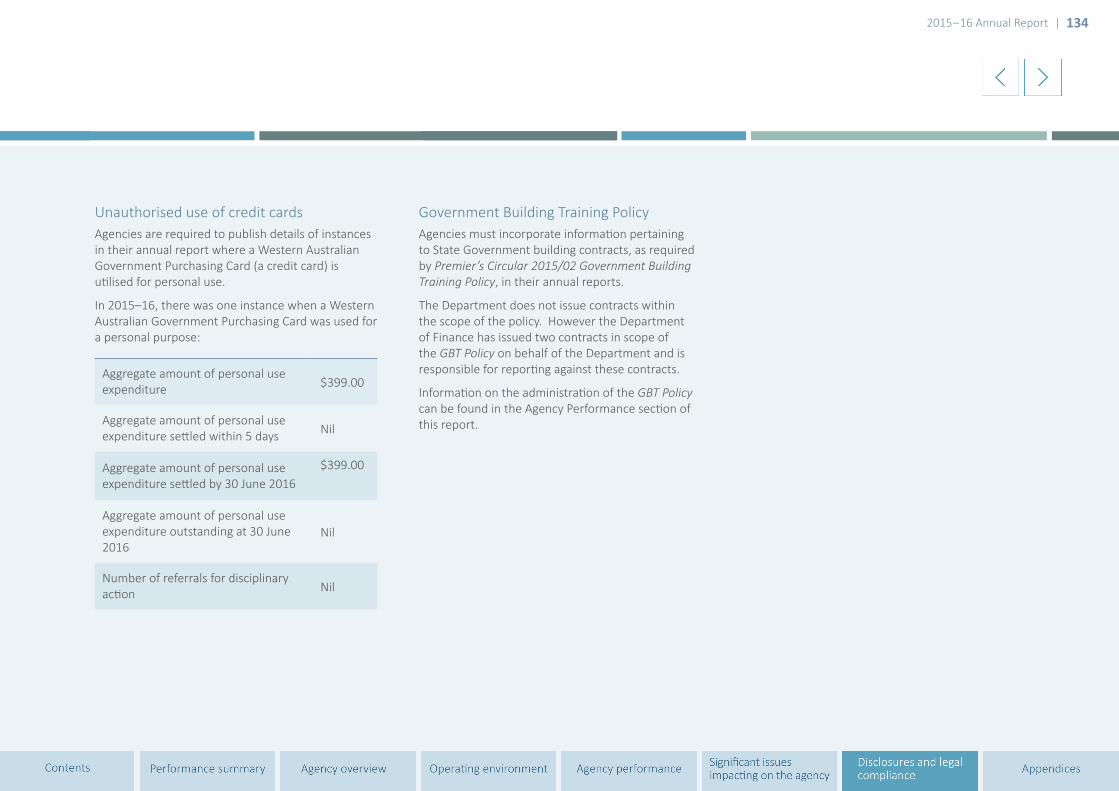
2015–16 Annual Report | 134
Unauthorised use of credit cards Agencies are required to publish details of instances in their annual report where a Western Australian Government Purchasing Card (a credit card) is utilised for personal use.
In 2015–16, there was one instance when a Western Australian Government Purchasing Card was used for a personal purpose:
Aggregate amount of personal use expenditure $399.00
Aggregate amount of personal use expenditure settled within 5 days Nil
Aggregate amount of personal use expenditure settled by 30 June 2016
$399.00
Aggregate amount of personal use expenditure outstanding at 30 June 2016
Nil
Number of referrals for disciplinary action Nil
Government Building Training PolicyAgencies must incorporate information pertaining to State Government building contracts, as required by Premier’s Circular 2015/02 Government Building Training Policy, in their annual reports.
The Department does not issue contracts within the scope of the policy. However the Department of Finance has issued two contracts in scope of the GBT Policy on behalf of the Department and is responsible for reporting against these contracts.
Information on the administration of the GBT Policy can be found in the Agency Performance section of this report.

2015–16 Annual Report | 135 2015–16 Annual Report | 135
AppendicesAppendix 1: Corporate Executive
Appendix 2: LegislationAppendix 3: Department services
contact detailsAppendix 4: Terms used in this
reportAppendix 5: AcronymsAppendix 6: Feedback form
2015–16 Annual Report | 135
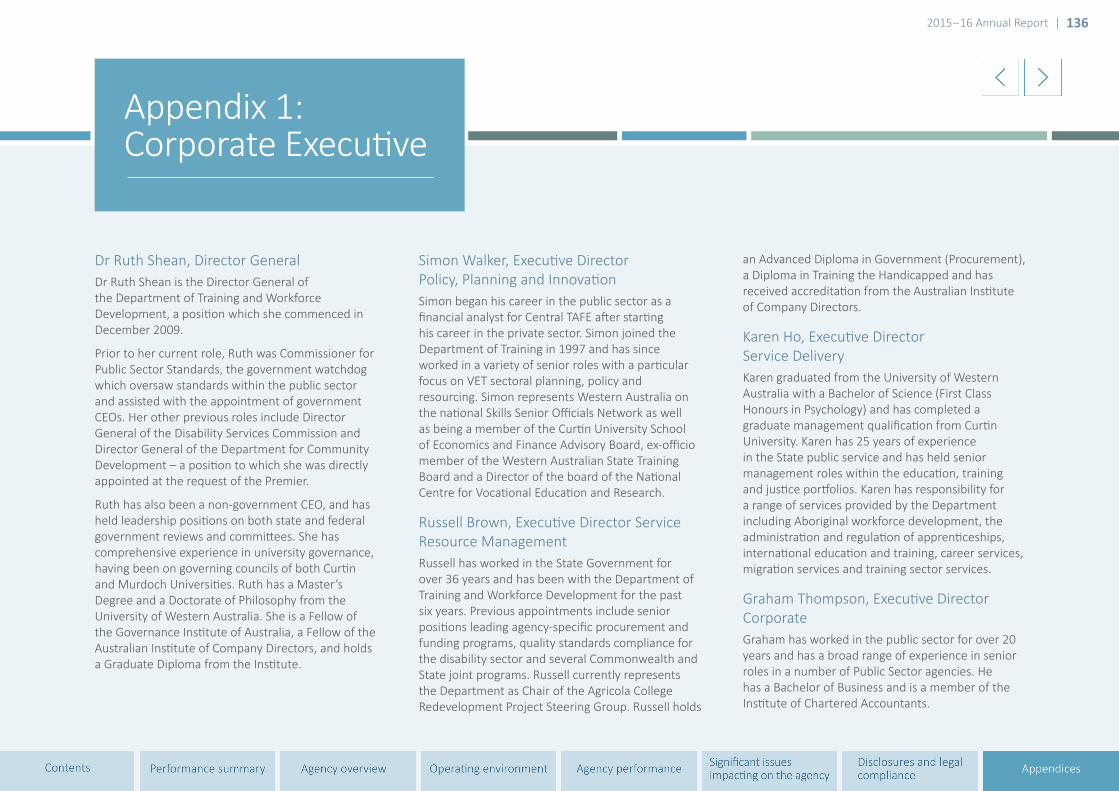
2015–16 Annual Report | 136
Dr Ruth Shean, Director GeneralDr Ruth Shean is the Director General of the Department of Training and Workforce Development, a position which she commenced in December 2009.
Prior to her current role, Ruth was Commissioner for Public Sector Standards, the government watchdog which oversaw standards within the public sector and assisted with the appointment of government CEOs. Her other previous roles include Director General of the Disability Services Commission and Director General of the Department for Community Development – a position to which she was directly appointed at the request of the Premier.
Ruth has also been a non-government CEO, and has held leadership positions on both state and federal government reviews and committees. She has comprehensive experience in university governance, having been on governing councils of both Curtin and Murdoch Universities. Ruth has a Master’s Degree and a Doctorate of Philosophy from the University of Western Australia. She is a Fellow of the Governance Institute of Australia, a Fellow of the Australian Institute of Company Directors, and holds a Graduate Diploma from the Institute.
Simon Walker, Executive Director Policy, Planning and InnovationSimon began his career in the public sector as a financial analyst for Central TAFE after starting his career in the private sector. Simon joined the Department of Training in 1997 and has since worked in a variety of senior roles with a particular focus on VET sectoral planning, policy and resourcing. Simon represents Western Australia on the national Skills Senior Officials Network as well as being a member of the Curtin University School of Economics and Finance Advisory Board, ex-officio member of the Western Australian State Training Board and a Director of the board of the National Centre for Vocational Education and Research.
Russell Brown, Executive Director Service Resource ManagementRussell has worked in the State Government for over 36 years and has been with the Department of Training and Workforce Development for the past six years. Previous appointments include senior positions leading agency-specific procurement and funding programs, quality standards compliance for the disability sector and several Commonwealth and State joint programs. Russell currently represents the Department as Chair of the Agricola College Redevelopment Project Steering Group. Russell holds
an Advanced Diploma in Government (Procurement), a Diploma in Training the Handicapped and has received accreditation from the Australian Institute of Company Directors.
Karen Ho, Executive Director Service DeliveryKaren graduated from the University of Western Australia with a Bachelor of Science (First Class Honours in Psychology) and has completed a graduate management qualification from Curtin University. Karen has 25 years of experience in the State public service and has held senior management roles within the education, training and justice portfolios. Karen has responsibility for a range of services provided by the Department including Aboriginal workforce development, the administration and regulation of apprenticeships, international education and training, career services, migration services and training sector services.
Graham Thompson, Executive Director CorporateGraham has worked in the public sector for over 20 years and has a broad range of experience in senior roles in a number of Public Sector agencies. He has a Bachelor of Business and is a member of the Institute of Chartered Accountants.
Appendix 1: Corporate Executive
Title
2015–16 Annual Report | 137
Administered legislationThe Vocational Education and Training Act 1996 is administered by the Minister for Training and Workforce Development with the assistance of the Department.
The Training Legislation Amendment and Repeal Act 2008 came into operation on 10 June 2009. This legislation amended the Vocational Education and Training Act 1996 and repealed the Industrial Training Act 1975.
It provided a new legislative framework which allows for greater flexibility and a more contemporary training system.
Other key legislation impacting on the Department’s activitiesIn the performance of its functions the Department complies with the following relevant written laws.
• Auditor General Act 2006
• Contaminated Sites Act 2003
• Corruption and Crime Commission Act 2003
• Disability Services Act 1993
• Education Services for Overseas Students Act 2000
• Electoral Act 1907
• Equal Opportunity Act 1984
• Financial Management Act 2006
• Freedom of Information Act 1992
• Industrial Relations Act 1979
• Minimum Conditions of Employment Act 1993
• Occupational Safety and Health Act 1984
• Public Sector Management Act 1994
• Public Interest Disclosure Act 2003
• Salaries and Allowances Act 1975
• State Records Act 2000
• State Supply Commission Act 1991
• Student Identifiers Act 2014
• Workers’ Compensation and Injury Management Act 1981
• Working with Children (Criminal Record Checking) Act 2004
Appendix 2: Legislation

2015–16 Annual Report | 138
Apprenticeship OfficeW: dtwd.wa.gov.auE: [email protected]: 13 19 54
Muresk InstituteMuresk Road, Northam WA 6401W: dtwd.wa.gov.au/mureskinstituteE: [email protected] T: 1300 994 031
Appendix 3: Department services contact details
Customer Service Centre
Level 7, 3 Forrest Place(GPO Building), Perth WA 6000
Career Centre T: 13 23 98TTY: 9225 7831E: [email protected]
TAFE International WA T: +618 9218 2100E: [email protected]
Overseas Qualifications Unit T: 9224 6530E: [email protected]
Skilled Migration WA T: +618 9224 6593E: [email protected]
Aboriginal Workforce Development Centre (Metropolitan)
T: 1800 441 043 or 9224 6535 E: [email protected]
Aboriginal Workforce Development Centres (Regional)
Broome Shop 6/20 Dampier Terrace T: 9194 9450E: [email protected]
Bunbury Podium Level61 Victoria Street
T: 9722 9550E: [email protected]
Geraldton Margaret House, Bill Sewell ComplexChapman Road
T: 9938 4450E: [email protected]
Kalgoorlie Unit 1/37 Brookman Street T: 9093 8650E: [email protected]
2015–16 Annual Report | 139
Calendar year: While most data in this report describe the 2015–16 financial year, some data describe the 2015 calendar year. This is because most VET courses are delivered by calendar year. Where possible, snapshots of training activity as at 30 June 2016 are also provided, to provide an indication of more recent activity. The number of apprentices and trainees in training is measured as at 30 June 2016.
Course enrolments: This measure is used in preference to a head-count of students, because it provides a more reliable measure, allowing the data to be consistently analysed by variables such as delivery location and funding source. Enrolments are considered valid once some activity has been recorded which excludes cases where students enrol but do not commence training. Enrolment data are based on a calendar year.
Module load completion rate: This describes the extent to which clients complete the training in which they enrol. Modules are the components from which courses are constructed, and the module load is the total student curriculum hours (see below) attributed to a module. The MLCR is the proportion of module load successfully completed out of the total commenced. This measure is used in preference to qualification completions, which may take several years to be reported (reducing their usefulness for regular monitoring and reporting)
and because students may enrol with the intention of only completing a few units, rather than a whole qualification.
Student curriculum hours: This measure describes the agreed nominal value of hours associated with a module or unit of competency. It is a fixed value (or ‘weighting’) and does not describe the actual hours that an individual student spends in class or doing homework. SCH is considered the most objective measure of VET effort as it reflects the volume of training activity occurring.
Training and labour market statistics and definitions
Priority training and priority training qualifications Future Skills WA – futureskillswa.wa.gov.au
Population statistics ABS 3101.0 – Table 2 (December 2015) Australian Bureau of Statistics – abs.gov.au
Labour market statistics Source: ABS 6202.0 – Table 8 (June 2016), Seasonally Adjusted.ABS 6291.0.55.003 – Datacube E08 (May 2016), Four Quarter Moving Average of Original Data Australian Bureau of Statistics – abs.gov.au
Definitions• Employed – this definition involves persons
aged 15 years and over who meet one of
several criteria. For the exact definition visit the Australian Bureau of Statistics website.
• Participation Rate – for any group, the labour force expressed as a percentage of the civilian population aged 15 years and over in the same group.
• Employment to Population Ratio – for any group, the number of employed persons expressed as a percentage of the civilian population in the same group.
• Skilled Occupation – persons employed in managerial, professional or trades and technician level occupations as identified by the Australian and New Zealand Standard Classification of Occupations.
• State Priority Occupations – occupations as identified by the ANZSCO that are rated of the highest or high State level priority through the annual State Priority Occupation List process undertaken by the Department. For more information on the SPOL visit dtwd.wa.gov.au.
• Net Overseas Migration – the net gain or loss of population through immigration and emigration to and from Australia.
For more details visit the Australian Bureau of Statistics website at abs.gov.au.
Appendix 4: Terms used in this report

2015–16 Annual Report | 140
ABS Australian Bureau of Statistics
ANZSCO Australian and New Zealand standard classification of occupations
ASBT Aboriginal school-based training
ATE Aboriginal Training and Employment program
AWDC Aboriginal Workforce Development Centre
CCC Crime and Corruption Commission
CISC COAG Industry and Skills Council
COAG Council of Australian Governments
CSA Civil Service Association
DAIP Disability access and inclusion plan
DPA Delivery and performance agreements
DTWD Department of Training and Workforce Development
EBT Employment based training
ELICOS English Language Intensive Course for Overseas Students
FTE Full time equivalent
GBT Government Building Training Policy
GTO Group training organisation
IBT Institutional based training
ICT Information and communications technology
MLCR Module load completion rate
OQU Overseas Qualifications Unit
OSH Occupational safety and health
PID Public interest disclosure
PSC Public Sector Commission
RKP Record keeping plan
RPL Recognition of prior learning
RTW Return to work
SCH Student curriculum hours
SNMP State nominated migration program
SPOL State priority occupation list
SRC State Records Commission
STAMP State training asset management plan
STB State Training Board
STP State training provider
TAA Travel and accommodation allowance
TAFE Technical and further education
TRIM Total record information management
TSRP Training Sector Reform Project
USI Unique student identifier
VET Vocational education and training
WAIRC Western Australian Industrial Relations Commission
WASMOL Western Australian skilled migration occupation list
WDC Workforce development centre
Appendix 5: Acronyms

2015–16 Annual Report | 141
Appendix 6: Feedback form
The Department of Training and Workforce Development welcomes your feedback on the Annual Report 2015–16.
1. Overall how effective is the Annual Report in describing our activities in 2015–16?
Very effective Effective Average Poor
2. For what purpose did you read or refer to the Annual Report 2015–16?
Information on the Department and its services
Information on the Department’s performance in 2015–16
Information on the future direction of the Department
Other (please specify)
3. Please rate the following elements of the Annual Report (please tick in the relevant box to indicate your rating):
Excellent Good Average Poor
Information/content
Layout of information
Ease of finding information
Readability
Relevance
4. Please tell us whether you are a:
Member of the public
Industry/employer representative
VET student
VET professional
State Government employee
Other
2015–16 Annual Report | 142
5. In your opinion, how could our next Annual Report be improved?
6. General comments
7. Overall, how do you rate this Annual Report?
Excellent Good Satisfactory Poor
Thank you for participating in the survey. Please return completed form to: E: [email protected]
Post: Performance Evaluation and Statistics Branch Department of Training and Workforce Development Locked Bag 16, Osborne Park Delivery Centre Osborne Park, WA 6916
This form is also available on the Department’s website at dtwd.wa.gov.au.


