93
ANNUAL REPORT 2016 BANGKO KABAYAN INC. (A PRIVATE DEVELOPMENT BANK)

ANNUAL REPORT 2016
BANGKO KABAYAN INC. (A PRIVATE DEVELOPMENT BANK)

VISIONWith a God-centered united workforce, we will be the preferred financial institution of MSMEs in Region 4, delivering relevant financial services
with excellence.
MISSIONBangko Kabayan is committed to become the region’s partner in economic development by providing quality financial products and services to MSMEs and individuals in the communities we serve. Through continuous growth, we will provide optimum returns to our shareholders as well as opportunities for our employees to develop themselves as fulfilled and holistic individuals, aware of the important role they play
in the lives of others.
CONTENTSHistory
Presidents Report - Financial Highlights - Operational & Organizational Highlights - Awards - Events - Bangko Kabayan Foundation Inc.
Risk Management Profile
Enterprise Risk Management
Credit Risk
Corporate Governance
Branches
Capital Structure and Capital Adequacy
Audited Financial Statement
Notes to Financial Statement

HISTORYIbaan Rural Bank, Inc. was established on August 19, 1957 by Mr. Bienvenido M. Medrano, former President of the Philippine Chamber of Commerce and Industry and co-founder of Far East Bank, and Mr. Manuel M. Agregado, then newly retired Auditor General, with the vision of becoming of service to the people of Ibaan, Batangas by providing reasonably priced credit particularly to small merchants, farmers and traders in the community. Aiming to spread the benefits of what he believed would be a profitable business, Mr. Medrano invited relatives and town mates to invest in IRB in whatever capacity they had. A year later, another prominent investor joined IRB in the person of Mr. Roman Ozaeta, a retired Supreme Court Justice.
With the end-goal of uplifting the quality of life of the people in the countryside, IRB participated in government programs aimed at providing credit to the rural population. Like most rural banks did, IRB, in its early years, operated largely with rediscounting funds from the Central Bank. However, while delivering the usual savings and loan services, Ibaan Rural Bank pioneered the use of checking account in the Batangas area, in as early as 1967, for its founding fathers, being progressive businessmen themselves, appreciated the importance of providing such service, to further develop the budding SME sector in Batangas at that time.
Upon the entry of the second generation, namely, Atty. Francis S. Ganzon and Ms. Teresa M. Ganzon, IRB was placed in a premier position in the rural banking industry. In 1980, the Human Resource Department was formally established and the first Vision and Mission Statements of IRB were crafted. Inspired by the Economy of Communion proposed by Chiara Lubich of the Focolare Movement, in 1991 IRB embarked on an expansion program to be able to make a bigger impact, both as an employer and as a rural-based financial conduit. Deposit generation became its major thrust, in order to wean itself away from the Central Bank and develop its capacity to operate as a stable rural bank. From 1991 to 1996, eight branches were established in various municipalities of Batangas – Calaca, Cuenca, Mabini, Nasugbu, Rosario, San Jose, San Juan and San Pascual.
In 1996, the Ibaan Rural Bank Foundation was established, funded out of the bank’s profits (3% of NIAT), to highlight the Corporate Social Responsibility of the bank, with the purpose of extending micro-
credit and scholarship programs such as “Study now, pay later” for the poor but deserving students and sponsoring community-building seminars.
When the bank celebrated its 40th anniversary, it adopted the business name “Bangko Kabayan” with a resolve to be of service not only to Batangueños but also to other communities in nearby provinces.
In 2000, in search of a new product after the financial crisis affected many of their SME clients, BK explored the possibility of going into microfinance lending. They first studied the Grameen replication (group method) and after making some adjustments, moved the activity from the foundation to the bank as a formal product. A year later, the USAID introduced the Microenterprise Access to Banking Services program or the MABS, and BK became a pilot project in Region 4 to try out individual microfinance services. Passionate in their desire to effectively reach the unbanked sectors and introduce them to banking services, top management of the bank gave full support to the program and even
Founding fathers of Bangko Kabayan Inc.
Bangko Kabayan’s first building.
3
structure, with profit sharing once a year, fringe benefit loans, car plans for the managers, HMO benefits. Branch managers are recruited from within and management trainings conducted by drill masters from AIM and Ateneo Graduate school of business, as well as senior officers who are themselves, holders of masters’ degrees. They are all actively involved in marketing the bank products and are considered the primary account officers in the bank.
The Credit Advisers or loan processors, have also undergone extensive training. Our partner for more than five years in this aspect is ADFIAP, or a group of retired DBP specialists on SME financing, headed by an internationally known training consultant – Ms. Cora Conde.
But the unique program Bangko Kabayan as an insitution is the Culture Circles. A group of volunteers from each branch and department, undergo a training for trainors in the beginning of the year, and themselves facilitate one hour sessions every other month, with their respective group, on aspects of the core values of the institution – Belief in Divine Providence, Integrity, Service Excellence, Unity and Commitment to Community Development. It has been the dream of the BK owners that the organization evolves to be a truly value-driven work community, and each person experiences the fullness of his being and develops in a wholistic manner while a member of the BK family. We believe that this is the secret of what BK has achieved to this day.
if the USAID ended its project, the MABS individual microfinance product has continued to grow as a stable MF product. Today, microfinance embraces not only lending but also savings and microinsurance, micro-housing products as well. Reaching some 10,850 clients and generating P168.45M in loans, making up 12.17% of total loan portfolio, BK’s microfinance program has also generated P121.6M in low cost savings, long-term. Gross interest income of the product has accounted for 22% of total gross income of the bank today. Likewise, BK has been awarded the prestigious MF EAGLE (Efficiency, Asset Quality, Growth, Liability Structure and Earnings) Award from 2003 – 2007 and again in 2010 and 2011 when the last awarding took place – the only rural bank in the country to have won the award 7 times making it to the Hall of Fame in the USAID progam.
In 2007, Bangko Kabayan celebrated its 50th Anniversary and unveiled its new corporate logo, representing its achievement in becoming a solid rural bank in the region. During that year, it received the Best Capital Build-up in the Landbank Awards and was included in the Global Top 100 of Microfinance Information Exchange (MIX). In fact, BK has been the outstanding LBP partner bank in the region from 2008 – 2011 and again in 2013 and 2015.
In 2015, in line with the efforts of Bangko Sentral ng Pilipinas (BSP) and the National Government to push microinsurance as a response to the devastation caused by climate change, Bangko Kabayan, in partnership with the Country Bankers Life Insurance Corporation, launched the CB Kalinga Microinsurance for the benefit of both MF clients and depositors.
In celebration of its 59th anniversary, Bangko Kabayan launched its new face as a Private Development Bank. It has consistently maintained its CAMELS rating of 4 in the past 4 years, became 100% compliant with Cir. 855 within a year of its introduction with minimal effect on its balance Sheet. It has 23 branches in the provinces of Batangas, Quezon and Laguna, focusing on municipalities with growth potential in the MSME sector, a deposit base of 51,283 depositors and resources of over P2.7B today.
Our people are our greatest resource and we invest in them a lot as an institution. We encourage especially the management corps to acquire a master’s degree in management or related fields and today, 5% of the entire work force are holders of masters’ degrees. To keep our people, we have a 15-month compensation
4

PRESIDENT’S REPORT
Atty. Francis S. Ganzon, BK President
1.75 1.90
2.11
2014 2015 2016
DEP
OSI
TS
BILLION
BILLION
BILLION
34.9
50.0
40.1
2014 2015 2016
NET
INCO
ME
MILLIO
MILLION
MILLION
MILLION
442.8 459.8 464.2
2014 2015 2016
CA
PIT
AL
MILLION
MILLION MILLION
1.52
1.44
1.38
2014 2015 2016
LOA
NS
BILLIONBILLIO
BILLIO
BILLIBILLION
BILLION
2.47
2.60
2.75
2014 2015 2016
RES
OU
RC
ES
BILLION
BILLIO
BILLIOBILLION
BILLION
FINANCIAL HIGHLIGHTSIn the year 2016, we experienced a confluence of challenges and triumphs as the bank carried on in its pursuit of becoming the preferred financial institution of MSMEs and individuals in CALABARZON. The Bangko Sentral ng Pilipinas (BSP) tightened up on their credit standards and instituted policies that compelled us to become more meticulous in our credit underwriting process. At the same time, we continued to feel the presence of strong competitors in the region – mostly commercial and thrift banks – who were very aggressive in their expansion in the markets that we currently serve. Although our Microfinance portfolio increased by 5.4% from P159 Million to P168 Million, our regular loans dipped by 4.6% from P1.27 Billion to P1.21 Billion. This resulted to a slight decrease in our total loan portfolio of 3.5%, ending at P1.38 Billion by
year-end.
On a more positive note, your bank’s total deposits finally surpassed the P2 Billion-peso mark, as we increased by 10.8% from our previous year’s balance. This shows the sustained confidence of our depositors in our institution that we have preserved and built up through 60 years of responsible and prudent banking.
The decline in our loan portfolio caused a 2.1% decrease in our total revenues, while expenses related to the bank’s expansion program and its ongoing effort to upgrade and be at par with industry trends not only in terms of technology but also in its human resources gave us a lower net income compared to the previous year. We ended with a net income after tax of P40.1 Million. Overall, our resources grew by 6% as we ended the year with P2.75 Billion, P156 Million higher than last year’s figure. Our Capital Adequacy Ratio – the ultimate indicator of strength and stability of banks – is at 16.7%, still way above the industry limit of 10%.
OPERATIONAL & ORGANIZATIONAL DEVELOPMENTSAppointment of COOLast year, Bangko Kabayan officially appointed a new Chief Operations Officer in the person of Mr. Leandro Ofrecio. Mr. Ofrecio has a Masters Degree in Business Administration from the Asian Institute of Management and has been with BK
for 5 years. He is tasked to support BK with key capabilities as required from a strategic and operational perspective.
Conversion to PDBAfter years of waiting, we finally received our license from the Bangko Sentral ng Pilipinas upgrading BK into a Private Development Bank. Last May 27, the certificate was formally turned over to us at the BSP head office and this was personally received by our chairman, Mr. Gerardo H. Ozaeta, Sr.
It was during the celebration of our 59th anniversary last August that we made this known to the public through an unveiling ceremony here at the head office. We have since then been known as Bangko Kabayan (A Private Development Bank). Following this, a general assembly with the theme “Isang Bigkis: Sa bagong yugto…sa bagong anyo” was held with all our employees to celebrate this milestone and to renew everyone’s commitment to the growing organization.
New BranchesIn our desire to continuously provide quality service to MSMEs in the region, we opened 3 new branches last year – in Talisay, Atimonan and Gumaca in Quezon – increasing our total branch network to 23.
Mini MBARecognizing that our people are our best assets in this enterprise, we hired a professional team to conduct
*AFT
ER T
AX
5 4

a Mini-MBA program for our managers to help improve their competency in Self-Management, Business and People. With the goal of providing maximum exposure to learning, they were tasked to develop projects which are currently being implemented by the organization. A total of 28 officers participated in and completed the course.
AWARDSLandbank Gawad CFI for Southern LuzonLast November, we received another recognition from Land Bank of the Philippines as Gawad CFI 2016, this time as a Group Winner for CALABARZON, MIMAROPA & BICOL. Now on its 13th year, this award is given to Landbank’s partners with significant accomplishments in promoting economic and social development in their communities. This is the 7th consecutive year that BK was recognized.
2 CMA AwardeesWe also take pride in being recognized not just as an institution but as one whose clients are also recognized in their respective endeavors. Last year, BK produced 2 winners for the 2016 Citi Microentrepreneurship awards – the 6th time for the institution since we started sending nominees 10 years ago.
Pastillas and candy maker Mr. Wilberto Dagame from Brgy. Dagatan Lipa City won the Special Award for Community Leadership while Mr. Renato Mercado from Brgy. Sulpoc in Tanauan City was hailed as CMA awardee for Micro-Agribusiness for his advocacy in organic farming making his barangay a pioneer of the practice.
EVENTSGA ala SurvivorCelebrating camaraderie and competitiveness, Bangko Kabayan held last year’s General Assembly ala “Survivor” at Virgin Beach Resort in Laiya, San Juan.
True to its theme, the event was conducted to give due recognition to those who have “survived” and succeeded in achieving their respective targets in the year 2015, as well as those who went out of their way to perform their job excellently and to serve the communities where they belong.
SportsfestBelieving that a strong body produces a stronger mind, Bangko Kabayan held its annual Sportsfest at the Convention Center in Padre Garcia last April 23, 2016. Hosted by Cluster 3, it was participated in by all branches from the different clusters and various departments from the executive office. The Green team from the Executive
Unveiling of the new logo of BK as a Private Development Bank.
BK Executives receive the Landbank Gawad CFI for Southern Luzon.
Mr. Wilberto Dagame Mr. Renato Mercado
6

Office emerged as last season’s overall champion.
16th MF GABK has continuously grown its Microfinance client base since 2001. With over 10,000 clients in the region, we conducted our 16th Microfinance General Assembly last year to recognize best practices, promote economic empowerment of low-income individuals and to be inspired by microentrepreneurs who have made a difference in their communities.
BANGKO KABAYAN FOUNDATION, INC.The Economy of Sharing begins at home. 2016 was a year that showcased the small heroes in our employees as we rolled out several “Bayani ng Komunidad” projects. Among the beneficiaries of these projects are underprivileged children in a home in Taal, senior citizens of Sariaya and SPED students of Ibaan Central School. We also forged a partnership with the Philippine Business for Social Progress and rolled out 2 projects benefitting a school in Laurel that received 5 mini library sets through the generosity of our employees and former scholars. This was followed by a Safe Motherhood caravan in Tanauan City attended by over 200 women representing the different barangays. In our effort to help protect the environment, the foundation has been working with Kapitan women of Macalamcam B in Rosario, Batangas for the fruition of a Solid Waste Management Project.
Thru ABS CBN Bayan Academy, we continue to facilitate the Grassroots Entrepreneurship Program (Entrep Eskwela) with 14 graduates from the Western Cluster of Batangas last year. Entrepreneurs are trained in basic business principles including the use of social media, researching on designs, giving value to one’s labor, recording sales and managing expenses among others.
In October last year, we piloted the Financial Literacy, Leadership, and Social Entrepreneurship Program for OFWs and their relatives in partnership with the Ateneo School of Government. We have 17 students whom we expect to graduate by next month upon the submission of their respective social enterprise business plan.
This year, BKFI’s thrusts will be focused on Values Formation, Sustainable Development and Good Entrepreneurship. With the many projects lined up for the year, we have mobilized BK employees to sign up and become BKFI volunteers, an invitation we wish to extend to you our dear stakeholders and to others who are looking for opportunities to help in any way they can.
Management Trainees Batch 8 facilitates GA ala Survivor.
Kapitan members who were present during the 16th Microfinance General Assembly.
Participants of the Financial Literacy, Leadership, and Social Entrepreneurship Program for OFWs and their relatives.
Students from Leviste Elementary School in Laurel, Batangas who received five mini library sets.
7 6
RISK MANAGEMENT PROFILERISK MANAGEMENTWith the fast changing business environment, financial institutions like Bangko Kabayan (BK) are exposed to different kinds of risks that increase probabilities of financial losses, and to mitigate these risks, BK established its Risk Management (RM) system as a component of good governance and made it an integral part of BK’s culture.
RM underlying principles display that it is an element of good governance and shall promote transparency, accountability and control. Effective RM system ultimate responsibility lies with the Board of Directors (BOD) through its Risk Management Committee (RMC) who shall oversee the bank’s infrastructure that can define, analyze, measure and report on effective control of
the risks with in the bank. BOD oversight shall include monitoring of senior management’s activities in managing credit, liquidity, operational, compliance, interest, market, strategic and reputation risks inherent in BK. BOD shall also adopt a RM approach that is suited with the structure of BK.
BK use the Enterprise Risk Management (ERM) integrated approach to view risks enterprise-wide, considering the risks at all levels of the organization and the inter-dependencies of its various units. BK’s ERM aims to identify the risks associated with the core activities and business strategies of the bank and craft risk strategies to address these risks at the same time inculcating RM as part of BK’s
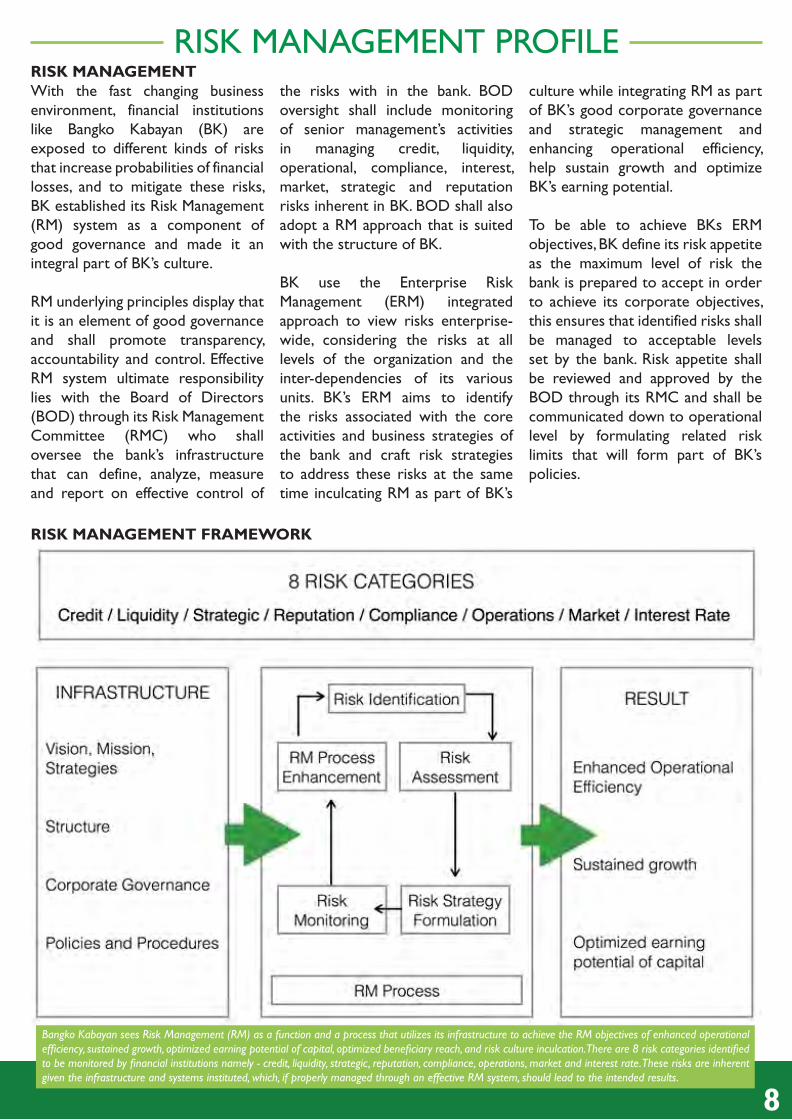
RISK MANAGEMENT FRAMEWORK
culture while integrating RM as part of BK’s good corporate governance and strategic management and enhancing operational efficiency, help sustain growth and optimize BK’s earning potential.
To be able to achieve BKs ERM objectives, BK define its risk appetite as the maximum level of risk the bank is prepared to accept in order to achieve its corporate objectives, this ensures that identified risks shall be managed to acceptable levels set by the bank. Risk appetite shall be reviewed and approved by the BOD through its RMC and shall be communicated down to operational level by formulating related risk limits that will form part of BK’s policies.
Bangko Kabayan sees Risk Management (RM) as a function and a process that utilizes its infrastructure to achieve the RM objectives of enhanced operational efficiency, sustained growth, optimized earning potential of capital, optimized beneficiary reach, and risk culture inculcation. There are 8 risk categories identified to be monitored by financial institutions namely - credit, liquidity, strategic, reputation, compliance, operations, market and interest rate. These risks are inherent given the infrastructure and systems instituted, which, if properly managed through an effective RM system, should lead to the intended results.
8
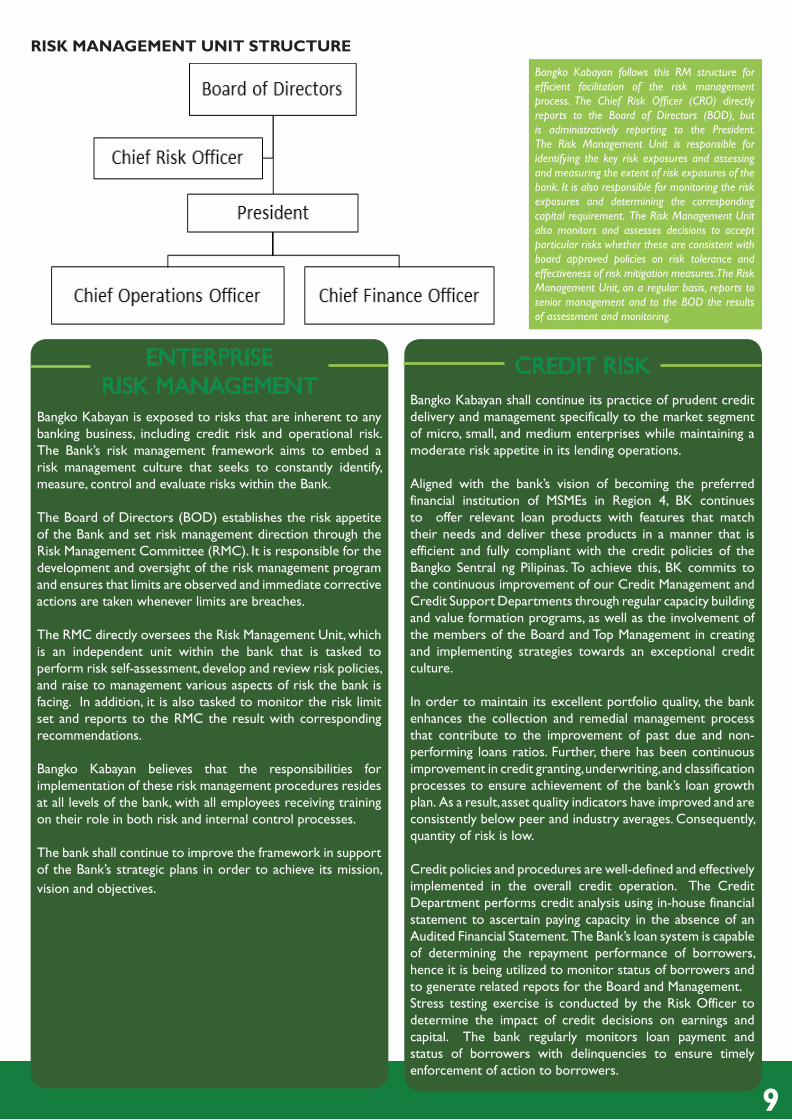
RISK MANAGEMENT UNIT STRUCTURE
Bangko Kabayan follows this RM structure for efficient facilitation of the risk management process. The Chief Risk Officer (CRO) directly reports to the Board of Directors (BOD), but is administratively reporting to the President. The Risk Management Unit is responsible for identifying the key risk exposures and assessing and measuring the extent of risk exposures of the bank. It is also responsible for monitoring the risk exposures and determining the corresponding capital requirement. The Risk Management Unit also monitors and assesses decisions to accept particular risks whether these are consistent with board approved policies on risk tolerance and effectiveness of risk mitigation measures. The Risk Management Unit, on a regular basis, reports to senior management and to the BOD the results of assessment and monitoring.
Bangko Kabayan shall continue its practice of prudent credit delivery and management specifically to the market segment of micro, small, and medium enterprises while maintaining a moderate risk appetite in its lending operations.
Aligned with the bank’s vision of becoming the preferred financial institution of MSMEs in Region 4, BK continues to offer relevant loan products with features that match their needs and deliver these products in a manner that is efficient and fully compliant with the credit policies of the Bangko Sentral ng Pilipinas. To achieve this, BK commits to the continuous improvement of our Credit Management and Credit Support Departments through regular capacity building and value formation programs, as well as the involvement of the members of the Board and Top Management in creating and implementing strategies towards an exceptional credit culture.
In order to maintain its excellent portfolio quality, the bank enhances the collection and remedial management process that contribute to the improvement of past due and non-performing loans ratios. Further, there has been continuous improvement in credit granting, underwriting, and classification processes to ensure achievement of the bank’s loan growth plan. As a result, asset quality indicators have improved and are consistently below peer and industry averages. Consequently, quantity of risk is low.
Credit policies and procedures are well-defined and effectively implemented in the overall credit operation. The Credit Department performs credit analysis using in-house financial statement to ascertain paying capacity in the absence of an Audited Financial Statement. The Bank’s loan system is capable of determining the repayment performance of borrowers, hence it is being utilized to monitor status of borrowers and to generate related repots for the Board and Management. Stress testing exercise is conducted by the Risk Officer to determine the impact of credit decisions on earnings and capital. The bank regularly monitors loan payment and status of borrowers with delinquencies to ensure timely enforcement of action to borrowers.
CREDIT RISKENTERPRISE RISK MANAGEMENT
Bangko Kabayan is exposed to risks that are inherent to any banking business, including credit risk and operational risk. The Bank’s risk management framework aims to embed a risk management culture that seeks to constantly identify, measure, control and evaluate risks within the Bank.
The Board of Directors (BOD) establishes the risk appetite of the Bank and set risk management direction through the Risk Management Committee (RMC). It is responsible for the development and oversight of the risk management program and ensures that limits are observed and immediate corrective actions are taken whenever limits are breaches.
The RMC directly oversees the Risk Management Unit, which is an independent unit within the bank that is tasked to perform risk self-assessment, develop and review risk policies, and raise to management various aspects of risk the bank is facing. In addition, it is also tasked to monitor the risk limit set and reports to the RMC the result with corresponding recommendations.
Bangko Kabayan believes that the responsibilities for implementation of these risk management procedures resides at all levels of the bank, with all employees receiving training on their role in both risk and internal control processes.
The bank shall continue to improve the framework in support of the Bank’s strategic plans in order to achieve its mission, vision and objectives.
9 8

CORPORATE GOVERNANCEBOARD OF DIRECTORS
Gerardo H. Ozaeta Sr.Chairman
Atty. Francis S. GanzonPresident
Cristina Ganzon-OzaetaCorporate Secretary
Teresa M. Ganzon
Frances G. Costa Fides Ganzon-Ofrecio
Liza V. Mercado
Gregorio O. Ozaeta Leonardo P. Sangalang Jr.
Atty. Alan John B. Tantoco
Executive Committee (Execom)The executive committee provides a mechanism to engage within the limits set by board, in decision making, relating to the transaction routine, administrative matters, oversight and communication of important organizational matters.
Members: 1. President 2. Chief Financial Officer 3. Chief Operating Officer 4. Branch Banking Group Head 5. Corporate Planning Head 6. Comptroller 7. Credit Group Head 8. Chief Compliance Officer 9. Risk Officer - Designated Secretary 10. Strategic Support Group Head 11. IT Head 12. HR Manager
Personnel Committee (PerCom)The Personnel Committees provides direction and decision-making for employee policies, compensation and benefits, legal compliance and staff evaluation and trainings. The Personnel Committee ensures that all employees have the training and tools to perform their jobs, are held accountable for achieving goals, and are compensated appropriately for their efforts.
Members: 1. Strategic Support Group Head 2. HR Manager 3. Operations Control Officer 4. OD & Training & Development Specialist - Designated Secretary Asset and Liability CommitteeThe Asset/Liability Committee (ALCO) has been established to assess the adequacy and monitoring the implementation, of the Bank and Company’s Asset/Liability Management policy and related procedures. The ALM Policy will include specific policies and procedures relating to (i) interest rate risk, (ii) market/investment risk, (iii) liquidity risk, (iv) credit risk, and (v) capital risk.
Members: 1. President 2. Executive Vice President - CFO 3. Comptroller - Designated Secretary
10

Executive Credit Committee (ExeCreCom)In line with the Bank’s trusts of maintaining a high quality, sound and profitable loan portfolio, the Executive Credit Committee was formed to evaluate and approve loan accounts within its credit approval authority, review credit evaluation and approval procedures and recommend changes, if necessary, to ensure continues relevancy and effectiveness, review loan product performance and act/resolve credit risk limit breached as discussed with the risk board committee.
The Committee carries out the following responsibilities: (1) Reviewing and approving credit decision that may pose material risks to the Bank’s business strategy or reputation, (2) Reviewing the financial results of the Bank and determining action plans and (3) Reviewing and approving all loans and credit transactions with the scope of its authority.Members:
Members: 1. President - BOD Member
2. Managing Director - BOD Member 3. CFO - BOD Member 4. Corporate Planning Head - BOD Member 5. Credit Group Head - CGH 6. Credit Management Head - Designated Secretary
Management Committee (ManCom)The Management Committee (ManCom) is responsible for crafting strategic decisions to ensure that the organization stays true to its Vision and Mission as it carries out its daily operations. The Committee makes important decisions to direct the future of the organization.
Members: 1. Executive Officers 2. Department Heads 3. Area Heads
ORGANIZATIONAL STRUCTURE
11
B.R No. 1258-12/16/2016
Remuneration Policy Bangko Kabayan aims to establish internal/external equity in compensation to attract, retain, and motivate employees to superior performance. In consistency with this policy, the Bank shall maintain and administer a formal Position Classification Plan recognizing the relative value of all salaries and positions within the organization when compared with each other.
The following policy regulations are followed in the administration of the programs:
1. All rank-and-file positions/jobs are classified into four (4) non-officer job levels depending on the qualification standards, skills requirement, responsibility/accountability and working condition required by the position. There is minimum and maximum salary cap. These pay ranges will function as a system control since it identifies the proper levels of compensation and the parameter extremes. For uniformity and equity, each job level has been defined taking into consideration certain basic job elements such as character of supervision received, degree of knowledge and experience required, physical and mental demands of the job, etc.
2. The minimum salary in each job level roughly reflects the pay needed to hire candidates with the minimum qualification in that level. An employee whose job duties and responsibilities closely approximate the definition of a particular job level and who meets the necessary qualifications shall receive the minimum of the rate range.
3. The maximum salary of each job level represents the pay of an employee who is performing at his/her highest level so much so that his only limitation to a promotional increase is the nature of the job he/she is performing. Thus, an employee who has reached the maximum pay of his/her job shall no longer be entitled to salary adjustments.
4. All salary adjustments covering promotions and reclassifications must be accompanied with a performance appraisal report before such adjustments may be approved.
5. Salary ranges are regularly reviewed every two years. However, special salary reviews may be conducted anytime and salary ranges may be adjusted to respond to economic and market conditions, or salary distortion.
Employee Benefits • Rice Subsidy • Longevity pay • Leave credits
• Service Incentive Leave • Bonuses (Mid-year, 13th month, Christmas) • Profit sharing • Health Insurance • Group Life Insurance • Uniform • Study Grant Program • Retirement Benefit • Fringe Benefit Loan • Car Plan for Officers • Motorcycle loan for field personnel • Performance Incentives • Premium Pay • Overtime Pay
DOSRI PolicyBangko Kabayan dealings with any of its DOSRI and Related Parties are in the regular course of business and upon terms not less favorable to the bank than those offered to others. Loans, granted to non-officers/non-directors who later became officers/directors of the bank shall be considered as a DOSRI loan only upon renewal or restructuring of the loan after the original maturity date. The Board and Management requires that directors and/or officers avoid placing themselves in a position that creates a conflict of interest or the appearance of conflict of interest. It requires full disclosure of personal interest that they may have in credit transactions. Directors and officers with personal interest in a transaction shall not be allowed to participate in any deliberation, approval or voting on the matter. All DOSRI and RPT shall be subject to regular review of the Internal Audit and adverse observations, if any, are disclosed and reported to the BSP. The total outstanding loans, other credit accommodations and guarantees to each of the bank’s DOSRI shall be limited to an amount equivalent to their respective unencumbered deposits and book value of their paid-in capital contribution in the Bank. Provided, however, that unsecured loans and other credit accommodations and guarantees to each of the bank’s DOSRI shall not exceed thirty percent (30%) of their respective total loans, other credit accommodations and guarantees.
Total outstanding loans, other credit accommodations and guarantees to DOSRI shall not exceed fifteen percent (15%) of the total loan portfolio of the bank or 100% of net worth whichever is lower. Provided, that in no case shall the total unsecured loans, other credit accommodations and guarantees to said DOSRI exceed thirty percent (30%) of the aggregate ceiling or the outstanding loans, other credit accommodations and guarantees, whichever is lower.
12

BRANCHES
BRANCH DIRECTORY
13

BK
BR
AN
CH
NE
TW
OR
K
14
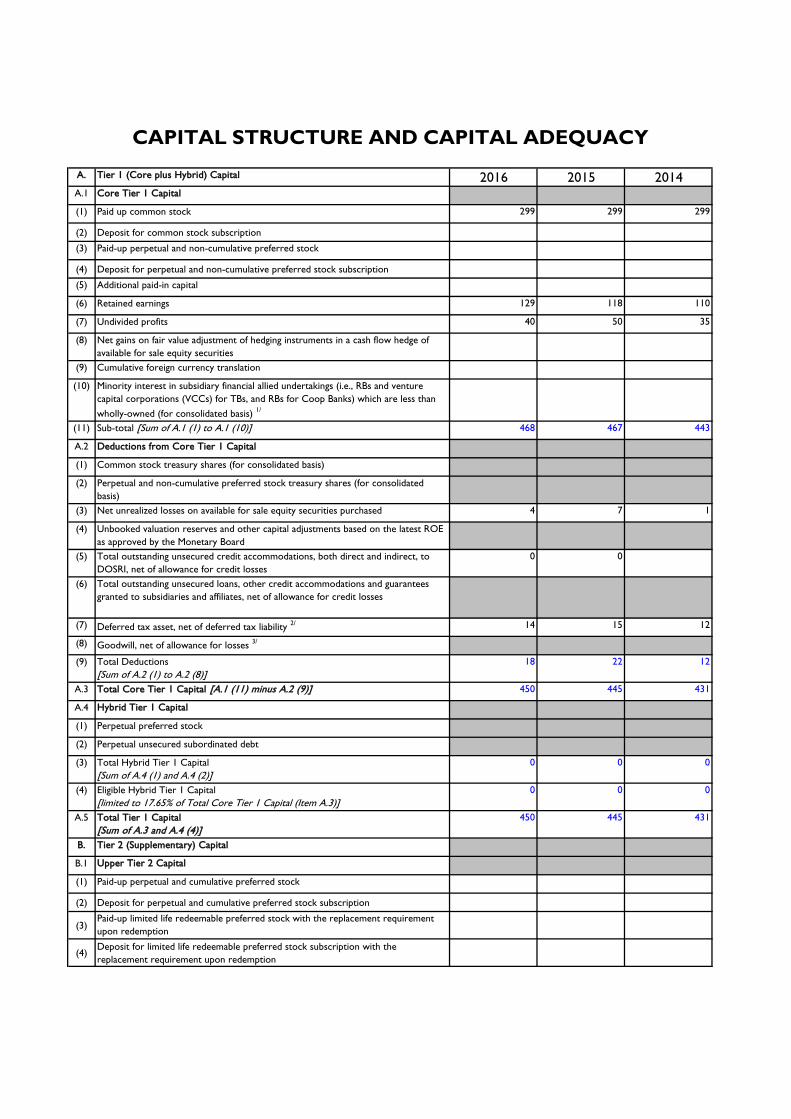
A. Tier 1 (Core plus Hybrid) Capital 2016 2015 2014A.1 Core Tier 1 Capital
(1) Paid up common stock 299 299 299
(2) Deposit for common stock subscription
(3) Paid-up perpetual and non-cumulative preferred stock
(4) Deposit for perpetual and non-cumulative preferred stock subscription
(5) Additional paid-in capital
(6) Retained earnings 129 118 110
(7) Undivided profits 40 50 35
(8) Net gains on fair value adjustment of hedging instruments in a cash flow hedge of
available for sale equity securities
(9) Cumulative foreign currency translation
(10) Minority interest in subsidiary financial allied undertakings (i.e., RBs and venture
capital corporations (VCCs) for TBs, and RBs for Coop Banks) which are less than
wholly-owned (for consolidated basis) 1/
(11) Sub-total [Sum of A.1 (1) to A.1 (10)] 468 467 443
A.2 Deductions from Core Tier 1 Capital
(1) Common stock treasury shares (for consolidated basis)
(2) Perpetual and non-cumulative preferred stock treasury shares (for consolidated
basis)
(3) Net unrealized losses on available for sale equity securities purchased 4 7 1
(4) Unbooked valuation reserves and other capital adjustments based on the latest ROE
as approved by the Monetary Board
(5) Total outstanding unsecured credit accommodations, both direct and indirect, to
DOSRI, net of allowance for credit losses
0 0
(6) Total outstanding unsecured loans, other credit accommodations and guarantees
granted to subsidiaries and affiliates, net of allowance for credit losses
(7) Deferred tax asset, net of deferred tax liability 2/ 14 15 12
(8) Goodwill, net of allowance for losses 3/
(9) Total Deductions
[Sum of A.2 (1) to A.2 (8)]
18 22 12
A.3 Total Core Tier 1 Capital [A.1 (11) minus A.2 (9)] 450 445 431
A.4 Hybrid Tier 1 Capital
(1) Perpetual preferred stock
(2) Perpetual unsecured subordinated debt
(3) Total Hybrid Tier 1 Capital
[Sum of A.4 (1) and A.4 (2)]
0 0 0
(4) Eligible Hybrid Tier 1 Capital
[limited to 17.65% of Total Core Tier 1 Capital (Item A.3)]
0 0 0
A.5 Total Tier 1 Capital
[Sum of A.3 and A.4 (4)]
450 445 431
B. Tier 2 (Supplementary) Capital
B.1 Upper Tier 2 Capital
(1) Paid-up perpetual and cumulative preferred stock
(2) Deposit for perpetual and cumulative preferred stock subscription
(3)Paid-up limited life redeemable preferred stock with the replacement requirement
upon redemption
(4)Deposit for limited life redeemable preferred stock subscription with the
replacement requirement upon redemption
CAPITAL STRUCTURE AND CAPITAL ADEQUACY

(5)Appraisal increment reserve – bank premises, as authorized by the Monetary Board
(6)Net unrealized gains on available for sale equity securities purchased (subject to a
55% discount)
(7)General loan loss provision [limited to 1.00% of total credit risk-weighted assets
computed per Part I, Item B.1(d)]
19 13 18
(8)
Unsecured subordinated debt with a minimum original maturity of at least 10 years
(subject to a cumulative discount factor of 20% per year during the last 5 years to
maturity, i.e., 20% if the remaining life is 4 years to less than 5 years, 40% if the
remaining life is 3 years to less than 4 years, etc.)
(9) Hybrid Tier 1 Capital (in excess of the max allowable 15% limit of total Tier 1
capital)
[A.4 (3) minus A.4 (4)]
0 0 0
(10) Sub-total
[Sum of B.1 (1) to B.1 (9)]
19 13 18
B.2 Deductions from Upper Tier 2
(1) Perpetual and cumulative preferred stock treasury shares (for consolidated basis)
(2) Limited life redeemable preferred stock treasury shares with the replacement
requirement upon redemption (for consolidated basis)
(3) Sinking fund for redemption of limited life redeemable preferred stock with the
replacement requirement upon redemption
(4) Net losses in fair value adjustment of hedging instruments in a cash flow hedge of
available for sale equity securities
(5) Total Deductions [Sum of B.2 (1) to B.2 (4)] 0 0 0
B.3 Total Upper Tier 2 Capital [B.1 (10) minus B.2 (5)] 19 13 18
B.4 Lower Tier 2 Capital
(1) Paid-up limited life redeemable preferred stock without the replacement
requirement upon redemption (subject to a cumulative discount factor of 20% per
year during the last 5 years to maturity, i.e., 20% if the remaining life is 4 years to
less than 5 years, 40% if the remaining life is 3 years to less than 4 years, etc.)
(2) Deposit for limited life redeemable preferred stock subscription without the
replacement requirement upon redemption
(3) Unsecured subordinated debt with a minimum original maturity of at least 5 years
(subject to a cumulative discount factor of 20% per year during the last 5 years to
maturity, i.e., 20% if the remaining life is 4 years to less than 5 years, 40% if the
remaining life is 3 years to less than 4 years, etc.)
(4) Sub-total [Sum of B.4 (1) to B.4 (3)] 0 0 0
B.5 Deductions from Lower Tier 2
(1) Limited life redeemable preferred stock treasury shares without the replacement
requirement upon redemption (for consolidated basis)
(2) Sinking fund for redemption of limited life redeemable preferred stock without the
replacement requirement upon redemption (limited to the balance of redeemable
preferred stock after applying the cumulative discount factor)
(3) Total Deductions
[Sum of B.5 (1) and B.5 (2)]
0 0 0
B.6 Total Lower Tier 2 Capital [B.4 (4) minus B.5 (3)] 0 0 0
B.7 Eligible Amount of Lower Tier 2 Capital (limited to 50% of total Tier 1 capital per
Item A.5)
0 0 0
B.8 Total Tier 2 Capital [Sum of B.3 and B.7] 19 13 18
B.9 Eligible Amount of Tier 2 Capital (limited to 100% of total Tier 1 capital per Item
A.5)
19 13 18
C. Gross Qualifying Capital
(Sum of A.5 and B.9)
469 458 449
(1) Total Tier 1 Capital (Item A.5) 450 445 431

(2) Total Tier 2 Capital (Item B.9) 19 13 18
D. Deductions from Tier 1 and Tier 2 Capital
(1) Investments in equity of unconsolidated subsidiary RBs and VCCs for TBs, and RBs
for Coop Banks after deducting related goodwill, if any (for solo basis)
(2) Investments in other regulatory capital instruments of unconsolidated subsidiary RBs
for Coop Banks (for solo basis)
(3) Investments in equity of unconsolidated subsidiary non-financial allied undertakings
after deducting related goodwill, if any (for both solo and consolidated bases)
(4) Significant minority investments (20%-50% of voting stock) in banks and other
financial allied undertakings (for both solo and consolidated bases)
(5) Reciprocal investments in equity/other regulatory capital instruments of other
banks/quasi-banks/enterprises
(6) Total Deductions [Sum of D (1) to D (5)] 0 0 0
E. Net Tier 1 and Tier 2 Capital
E.1 Net Tier 1 Capital 4/ {C (1) minus [D (6) multiply by 50%]} 450 445 431
E.2 Net Tier 2 Capital 4/ {C (2) minus [D (6) multiply by 50%]} 19 13 18
F. Total Qualifying Capital [C minus D (6)] 469 458 449
Risk Weighted Assets
G.1 Credit Risk Weighted Assets 2,404 2,346 2,211
G.2 Market Risk Weighted Assets 0 0 0
G.3 Operational Risk Weighted Assets 373 352 327
G.4 Total Risk Weighted Assets 2,777 2,697 2,538
H Capital to Risk Assets
H.1 Capital Adequacy Ratio (F divided by G.4) 18.4% 20.1% 24.3% 16.87% 16.98% 17.68%
H.2 Tier 1 Capital to Risk Weighted Assets (A.5 divided by G.4) 16.21% 16.49% 16.98%


DRAFT As reviewed by P&A- March 10, 2017
BANGKO KABAYAN INC. (A PRIVATE DEVELOPMENT BANK) NOTES TO FINANCIAL STATEMENTS
DECEMBER 31, 2016, 2015 AND 2014 (Amounts in Philippine Pesos)
1. CORPORATE MATTERS
1.1 Incorporation and Operations
Bangko Kabayan Inc. (A Private Development Bank) formerly known as Bangko Kabayan (A Rural Bank) Inc. (the Bank), was incorporated in the Philippines on August 2, 2007 to engage in the business of rural banking. It was organized to carry the merger between Bangko Kabayan (Ibaan Rural Bank, Inc.) and Banco de Jesus Rural Bank, Inc. On April 25, 2016, the Securities and Exchange Commission approved the Bank’s application to operate as a thrift bank. The Monetary Board of the Bangko Sentral ng Pilipinas (BSP) issued the Bank’s authority to operate as a thrift bank on May 27, 2016. The Bank was authorized to engage in the business of extending financial services to farmers, employees, entrepreneurs, commercial, manufacturing and industrial enterprises and to such other persons or entities that require financial intermediation, and to have and to exercise all authority and powers and to do and perform all acts and to transact all business which may legally be done by Thrift Banks organized under and in accordance with the existing New thrift Banks Act of 1995 (Republic Act No. 7906). As of December 31, 2016, the Bank has 23 branches, including the head office, in the area of Batangas, Laguna and Quezon (Southern Luzon). The Bank’s registered address, which is also its principal place of business, is at Santiago Street, Poblacion, Ibaan, Batangas. 1.2 Approval of Financial Statements
The financial statements of the Bank as of and for the year ended December 31, 2016 (including the comparative financial statements as of December 31, 2015 and for the years ended December 31, 2015 and 2014) were authorized for issue by the Bank’s Board of Directors (BOD) on March 19, 2017.
2. SUMMARY OF SIGNIFICANT ACCOUNTING POLICIES
The significant accounting policies that have been used in the preparation of these financial statements are summarized in the succeeding pages. These policies have been consistently applied to all the years presented, unless otherwise stated.
- 2 -
DRAFT As reviewed by P&A- March 10, 2017
2.1 Basis of Preparation of Financial Statements (a) Statement of Compliance with Philippine Financial Reporting Standards
The financial statements of the Bank have been prepared in accordance with Philippine Financial Reporting Standards (PFRS). PFRS are adopted by the Financial Reporting Standards Council (FRSC) from the pronouncements issued by the International Accounting Standards Board and approved by the Philippine Board of Accountancy.
The financial statements have been prepared using the measurement bases specified by PFRS for each type of asset, liability, income and expense. The measurement bases are more fully described in the accounting policies that follow.
(b) Presentation of Financial Statements
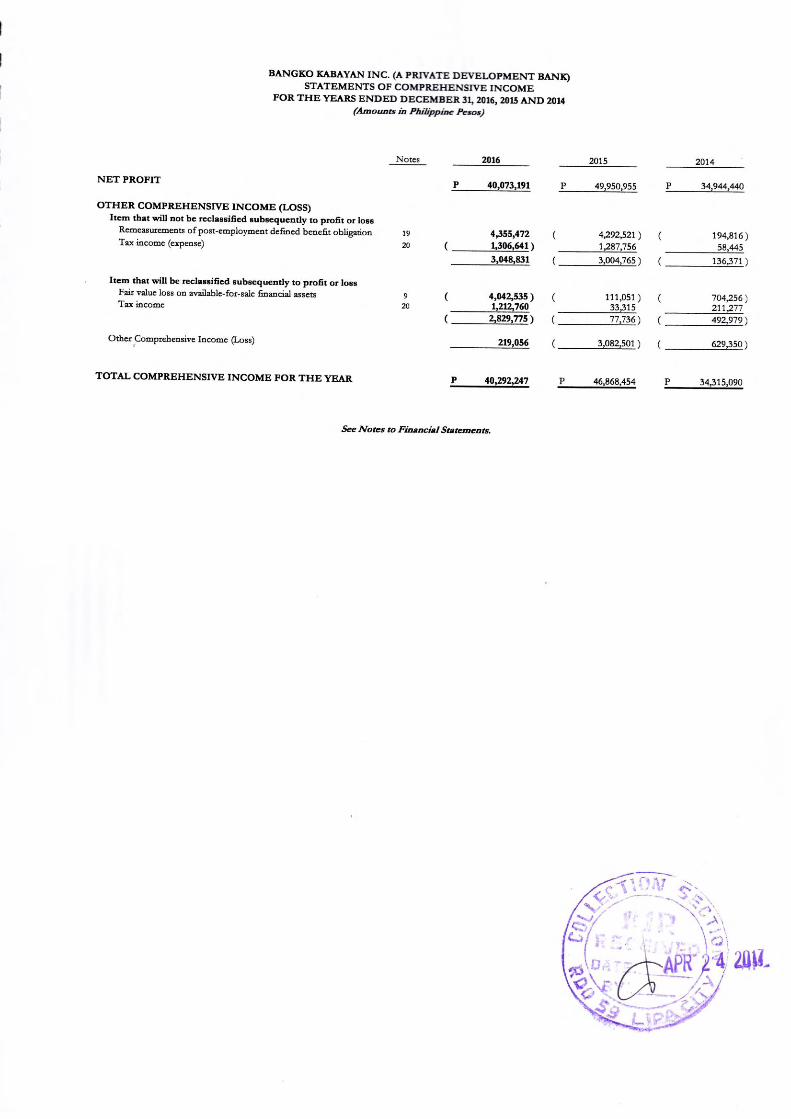
The financial statements are presented in accordance with Philippine Accounting Standards (PAS) 1, Presentation of Financial Statements. The Bank presents the statement of comprehensive income separate from the statement of income.
The Bank presents a third statement of financial position as at the beginning of the
preceding period when it applies an accounting policy retrospectively, or makes a retrospective restatement or reclassification of items that has a material effect on the information in the statement of financial position at the beginning of the preceding period. The related notes to the third statement of financial position are not required to be disclosed.
(c) Functional and Presentation Currency
These financial statements are presented in Philippine pesos, the Bank’s functional and presentation currency, and all values represent absolute amounts except when otherwise indicated. Items included in the financial statements of the Bank are measured using its functional currency. Functional currency is the currency of the primary economic environment in which the Bank operates.
2.2 Adoption of New and Amended PFRS
(a) Effective in 2016 that are Relevant to the Bank
The Bank adopted for the first time the following amendments and annual improvements to PFRS, which are mandatorily effective for annual periods beginning on or after January 1, 2016:
PAS 1 (Amendments) : Presentation of Financial Statements – Disclosure Initiative PAS 16 and PAS 38 (Amendments) : Property, Plant and Equipment, and Intangible Assets – Clarification of Acceptable Methods of Depreciation and Amortization
- 3 -
DRAFT As reviewed by P&A- March 10, 2017
PAS 16 and PAS 41 (Amendments) : Property, Plant and Equipment, and
Agriculture – Bearer Plants Annual Improvements : Annual Improvements to PFRS (2012-2014 Cycle)
Discussed below are the relevant information about these amendments and improvements.
(i) PAS 1 (Amendments), Presentation of Financial Statements – Disclosure
Initiative. The amendments encourage entities to apply professional judgment in presenting and disclosing information in the financial statements. Accordingly, they clarify that materiality applies to the whole financial statements and an entity shall not reduce the understandability of the financial statements by obscuring material information with immaterial information or by aggregating material items that have different natures or functions. They further clarify that in determining the order of presenting the notes and disclosures, an entity shall consider the understandability and comparability of the financial statements.
(ii) PAS 16 (Amendments), Property, Plant and Equipment, and PAS 38 (Amendments), Intangible Assets – Clarification of Acceptable Methods of Depreciation and Amortization. The amendments in PAS 16 clarify that a depreciation method that is based on revenue that is generated by an activity that includes the use of an asset is not appropriate for property, plant and equipment. In addition, amendments to PAS 38 introduce a rebuttable presumption that an amortization method that is based on the revenue generated by an activity that includes the use of an intangible asset is not appropriate, which can only be overcome in limited circumstances where the intangible asset is expressed as a measure of revenue, or when it can be demonstrated that revenue and the consumption of the economic benefits of an intangible asset are highly correlated. The amendments also provide guidance that the expected future reductions in the selling price of an item that was produced using the asset could indicate an expectation of technological or commercial obsolescence of an asset, which may reflect a reduction of the future economic benefits embodied in the asset.
(iii) PAS 16 (Amendments), Property, Plant and Equipment, and
PAS 41 (Amendments), Agriculture – Bearer Plants. The amendments define a bearer plant as a living plant that is used in the production or supply of agricultural produce, is expected to bear produce for more than one period and has a remote likelihood of being sold as agricultural produce, except for incidental scrap sales. On this basis, bearer plant is now included within the scope of PAS 16 rather than PAS 41, allowing such assets to be accounted for as property, plant and equipment and to be measured after initial recognition at cost or revaluation basis in accordance with PAS 16. The amendments further clarify that produce growing on bearer plants remains within the scope of PAS 41.
- 4 -
DRAFT As reviewed by P&A- March 10, 2017
(iv) Annual Improvements to PFRS (2012-2014 Cycle). Among the improvements, the following amendments are relevant to the Bank but had no material impact on the Bank’s financial statements as these amendments merely clarify the existing requirements:
PAS 19 (Amendments), Employee Benefits – Discount Rate: Regional Market Issue. The amendments clarify that the currency and term of the high quality corporate bonds which were used to determine the discount rate for post-employment benefit obligations shall be made consistent with the currency and estimated term of the post-employment benefit obligations.
PFRS 7 (Amendments), Financial Instruments: Disclosures – Servicing Contracts. The amendments provide additional guidance to help entities identify the circumstances under which a contract to “service” financial assets is considered to be a continuing involvement in those assets for the purposes of applying the disclosure requirements of PFRS 7. Such circumstances commonly arise when, for example, the servicing is dependent on the amount or timing of cash flows collected from the transferred asset or when a fixed fee is not paid in full due to non-performance of that asset.
(b) Effective in 2016 that are not Relevant to the Bank
The following new PFRS, amendments and annual improvements to existing standards are mandatorily effective for annual periods beginning on or after January 1, 2016 but are not relevant to the Bank’s financial statements:
PAS 27 (Amendments) : Separate Financial Statements – Equity Method in Separate Financial Statements
PFRS 10, PFRS 12 and PAS 28 (Amendments) : Consolidated Financial Statements, Disclosure of Interests in Other
Entities, and Investments in Associates and Joint Ventures – Investment Entities – Applying the Consolidation
Exception PFRS 11 (Amendments) : Joint Arrangements – Accounting for Acquisitions of Interests in Joint Operations PFRS 14 : Regulatory Deferral Accounts
Annual Improvements to PFRS (2012-2014 Cycle)
PFRS 5 (Amendments) : Non-current Assets Held for Sale and Discontinued Operations – Changes in Methods of Disposal
PFRS 7 (Amendments) : Financial Instruments: Disclosures – Applicability of the Amendments to PFRS 7 to Condensed Interim Financial Statements

- 5 -
DRAFT As reviewed by P&A- March 10, 2017
PAS 34 (Amendments) : Interim Financial Reporting – Disclosure of Information “Elsewhere in the
Interim Financial Report”
(c) Effective Subsequent to 2016 but not Adopted Early
There are new PFRS and amendments to existing standards effective for annual periods subsequent to 2016, which are adopted by the FRSC. Management will adopt the following relevant pronouncements in accordance with their transitional provisions; and, unless otherwise stated, none of these are expected to have significant impact on the Bank’s financial statements: (i) PAS 7 (Amendments), Statement of Cash Flows – Disclosure Initiative (effective
from January 1, 2017). The amendments are designed to improve the quality of information provided to users of financial statements about changes in an entity’s debt and related cash flows (and non-cash changes). They require an entity to provide disclosures that enable users to evaluate changes in liabilities arising from financing activities. An entity applies its judgment when determining the exact form and content of the disclosures needed to satisfy this requirement. Moreover, they suggest a number of specific disclosures that may be necessary in order to satisfy the above requirement, including: (a) changes in liabilities arising from financing activities caused by changes in financing cash flows, foreign exchange rates or fair values, or obtaining or losing control of subsidiaries or other businesses; and, (b) a reconciliation of the opening and closing balances of liabilities arising from financing activities in the statement of financial position including those changes identified immediately above.
(ii) PAS 12 (Amendments), Income Taxes – Recognition of Deferred Tax Assets for
Unrealized Losses (effective from January 1, 2017). The focus of the amendments is to clarify how to account for deferred tax assets related to debt instruments measured at fair value, particularly where changes in the market interest rate decrease the fair value of a debt instrument below cost. The amendments provide guidance in the following areas where diversity in practice previously existed: (a) existence of a deductible temporary difference; (b) recovering an asset for more than its carrying amount; (c) probable future taxable profit against which deductible temporary differences are assessed for utilization; and, (d) combined versus separate assessment of deferred tax asset recognition for each deductible temporary difference.
(iii) PFRS 9 (2014), Financial Instruments (effective from January 1, 2018). This
new standard on financial instruments will replace PAS 39, Financial Instruments: Recognition and Measurement, and PFRS 9 (2009, 2010 and 2013 versions). This standard contains, among others, the following:
three principal classification categories for financial assets based on the business model on how an entity is managing its financial instruments;
- 6 -
DRAFT As reviewed by P&A- March 10, 2017
an expected loss model in determining impairment of all financial assets that are not measured at fair value through profit or loss (FVTPL), which generally depends on whether there has been a significant increase in credit risk since initial recognition of a financial asset; and,
a new model on hedge accounting that provides significant improvements principally by aligning hedge accounting more closely with the risk management activities undertaken by entities when hedging their financial and non-financial risk exposures.
In accordance with the financial asset classification principle of PFRS 9 (2014), a financial asset is classified and measured at amortized cost if the asset is held within a business model whose objective is to hold financial assets in order to collect the contractual cash flows that represent solely payments of principal and interest (SPPI) on the principal outstanding. Moreover, a financial asset is classified and subsequently measured at fair value through other comprehensive income if it meets the SPPI criterion and is held in a business model whose objective is achieved by both collecting contractual cash flows and selling the financial assets. All other financial assets are measured at FVTPL.
In addition, PFRS 9 (2014) allows entities to make an irrevocable election to present subsequent changes in the fair value of an equity instrument that is not held for trading in other comprehensive income.
The accounting for embedded derivatives in host contracts that are financial assets is simplified by removing the requirement to consider whether or not they are closely related, and, in most arrangements, does not require separation from the host contract.
For liabilities, the standard retains most of the PAS 39 requirements which include amortized cost accounting for most financial liabilities, with bifurcation of embedded derivatives. The amendment also requires changes in the fair value of an entity’s own debt instruments caused by changes in its own credit quality to be recognized in other comprehensive income rather than in profit or loss.
Management is currently assessing the impact of PFRS 9 (2014) on the financial statements of the Bank and it will conduct a comprehensive study of the potential impact of this standard prior to its mandatory adoption date to assess the impact of all changes.

- 7 -
DRAFT As reviewed by P&A- March 10, 2017
(iv) PFRS 15, Revenue from Contracts with Customers (effective January 1, 2018). This standard will replace PAS 18, Revenue, and PAS 11, Construction Contracts, the related Interpretations on revenue recognition: International Financial Reporting Interpretations Committee (IFRIC) 13, Customer Loyalty Programmes, IFRIC 15, Agreement for the Construction of Real Estate, IFRIC 18, Transfers of Assets from Customers, and Standing Interpretations Committee 31, Revenue – Barter Transactions Involving Advertising Services. This new standard establishes a comprehensive framework for determining when to recognize revenue and how much revenue to recognize. The core principle in the said framework is for an entity to recognize revenue to depict the transfer of promised goods or services to the customer in an amount that reflects the consideration to which the entity expects to be entitled in exchange for those goods or services. Management is currently assessing the impact of this standard on the Bank’s financial statements.
(v) PFRS 16, Leases (effective from January 1, 2019). The new standard will
eventually replace PAS 17, Leases. For lessees, it requires to account for leases “on-balance sheet” by recognizing a “right of use” asset and a lease liability. The lease liability is initially measured as the present value of future lease payments. For this purpose, lease payments include fixed, non-cancellable payments for lease elements, amounts due under residual value guarantees, certain types of contingent payments and amounts due during optional periods to the extent that extension is reasonably certain. In subsequent periods, the “right-of-use” asset is accounted for similarly to a purchased asset and depreciated or amortized. The lease liability is accounted for similar to a financial liability using the effective interest method. However, the new standard provides important reliefs or exemptions for short-term leases and leases of low value assets. If these exemptions are used, the accounting is similar to operating lease accounting under PAS 17 where lease payments are recognized as expenses on a straight-line basis over the lease term or another systematic basis (if more representative of the pattern of the lessee’s benefit).
For lessors, lease accounting is similar to PAS 17’s. In particular, the distinction between finance and operating leases is retained. The definitions of each type of lease, and the supporting indicators of a finance lease, are substantially the same as PAS 17’s. The basic accounting mechanics are also similar, but with some different or more explicit guidance in few areas. These include variable payments, sub-leases, lease modifications, the treatment of initial direct costs and lessor disclosures.
Management is currently assessing the impact of this new standard on the Bank’s financial statements.
- 8 -
DRAFT As reviewed by P&A- March 10, 2017
2.3 Financial Assets Financial assets are recognized when the Bank becomes a party to the contractual terms of the financial instrument. Financial assets other than those designated and effective as hedging instruments are classified into the following categories: financial assets at FVTPL, loans and receivables, held-to-maturity (HTM) and available-for-sale (AFS) financial assets. Financial assets are assigned to the different categories by management on initial recognition, depending on the purpose for which the investments were acquired. Regular purchases and sales of financial assets are recognized on their trade date. All financial assets that are not classified as at FVTPL are initially recognized at fair value plus any directly attributable transaction costs. Financial assets carried at FVTPL are initially recorded at fair value and the related transaction costs are recognized in profit or loss.
A more detailed description of the applicable categories of financial assets is as follows: (a) Loans and Receivables
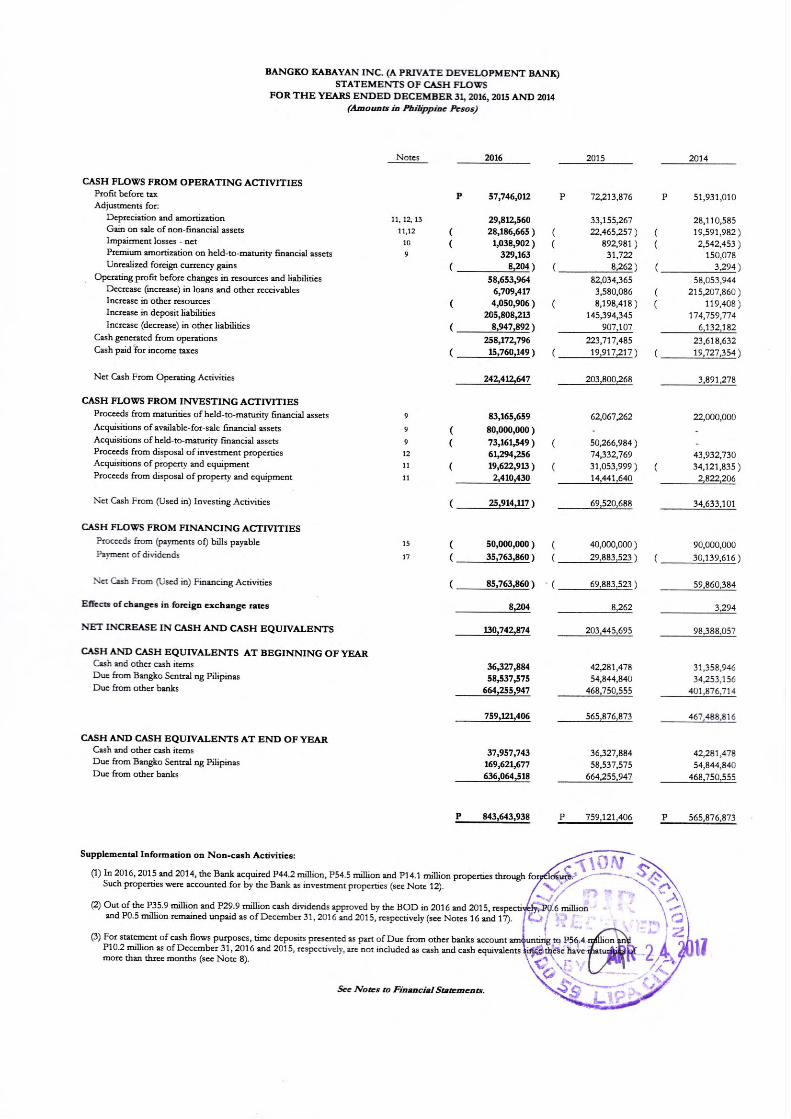
Loans and receivables are non-derivative financial assets with fixed or determinable payments that are not quoted in an active market. They arise when the Bank provides money or services directly to a debtor with no intention of trading the receivables. The Bank’s financial assets categorized as loans and receivables are presented as Cash and Other Cash Items, Due from BSP, Due from Other Banks, Loans and Other Receivables and Refundable deposits (presented under Other Resources account) in the statement of financial position. For purposes of reporting cash flows, cash and cash equivalents include cash and other cash items, due from BSP and due from other banks with original maturities of three months or less from placement date. Loans and receivables are subsequently measured at amortized cost using the effective interest method, less impairment loss, if any. Impairment loss is provided when there is objective evidence that the Bank will not be able to collect all amounts due to it in accordance with the original terms of the receivables (see Note 2.16). The carrying amount of the asset shall be reduced either directly or through the use of an allowance account. The amount of the loss shall be recognized in profit or loss.
- 9 -
DRAFT As reviewed by P&A- March 10, 2017
(b) HTM Financial Assets
This category includes non-derivative financial assets with fixed or determinable payments and a fixed date of maturity that the Bank has the positive intention and ability to hold to maturity. Investments intended to be held for an undefined period are not included in this classification. If the Bank were to sell other than an insignificant amount of HTM financial assets, the whole category would be tainted and reclassified to AFS financial assets. The Bank currently holds government and government-owned and controlled corporation bonds designated into this category.
Subsequent to initial recognition, HTM financial assets are measured at amortized
cost using the effective interest method, less impairment losses, if any. Impairment loss, which is the difference between the carrying value and the present value of estimated future cash flows of the investment, is recognized when there is objective evidence that the investment has been impaired
(see Note 2.16). (c) AFS Financial Assets
This category includes non-derivative financial assets that are either designated to this category or do not qualify for inclusion in any of the other categories of financial assets. The Bank’s AFS financial assets include government bonds.
All financial assets within this category are subsequently measured at fair value. Gains and losses from changes in fair value are recognized in other comprehensive income, net of any income tax effects, and are reported as part of the Revaluation Reserves account in equity, except for interest and dividend income, impairment losses and foreign exchange differences on monetary assets, which are recognized in profit or loss.
When the financial asset is disposed of or is determined to be impaired, that is,
when there is a significant or prolonged decline in the fair value of the security below its cost (see Note 2.16), the cumulative fair value gains or losses recognized in other comprehensive income is reclassified from equity to profit or loss and is presented as reclassification adjustment within other comprehensive income even though the financial asset has not been derecognized.
Reversal of impairment losses is recognized in other comprehensive income,
except for financial assets that are debt securities which are recognized in profit or loss only if the reversal can be objectively related to an event occurring after the impairment loss was recognized.
All income and expenses relating to financial assets that are recognized in profit or loss
are presented under Other Operating Income account and Other Operating Expenses account, respectively, in the statement of comprehensive income. Impairment losses, on the other hand, is presented separately under Impairment Losses – net account in the statement of income.
Non-compounding interest and other cash flows resulting from holding financial assets are recognized in profit or loss when earned, regardless of how the related carrying amount of financial assets is measured.
- 10 -
DRAFT As reviewed by P&A- March 10, 2017
The financial assets are derecognized when the contractual rights to receive cash flows from the financial instruments expire, or when the financial assets and all substantial risks and rewards of ownership have been transferred to another party. If the Bank neither transfers nor retains substantially all the risks and rewards of ownership and continues to control the transferred asset, the Bank recognizes its retained interest in the asset and an associated liability for amounts it may have to pay. If the Bank retains substantially all the risks and rewards of ownership of a transferred financial asset, the Bank continues to recognize the financial asset and also recognizes a collateralized borrowing for the proceeds received. 2.4 Bank Premises, Furniture, Fixtures and Equipment Land is stated at cost less allowance for impairment losses, if any. All other bank premises, furniture, fixtures and equipment are stated at cost less accumulated depreciation, amortization and any impairment in value.
The cost of an asset comprises its purchase price and directly attributable costs of bringing the asset to working condition for its intended use. Expenditures for additions, major improvements and renewals are capitalized while expenditures for repairs and maintenance are charged to expense as incurred.
Depreciation is computed on a straight-line basis over the estimated useful lives of the assets as follows:
Building and improvements 5 to 25 years Transportation equipment 3 to 5 years Furniture, fixtures and equipment 3 to 5 years Leasehold improvements are amortized over the term of the lease or useful lives of the improvements of ten years, whichever is shorter. Construction in progress represents property under construction and is stated at cost. This includes cost of construction and other direct costs (see Note 2.18). The account is not depreciated until such time that the assets are completed and available for use.
An asset’s carrying amount is written down immediately to its recoverable amount if the asset’s carrying amount is greater than its estimated recoverable amount (see Note 2.15).
The residual values, estimated useful lives and method of depreciation and amortization
of bank premises, furniture, fixtures and equipment are reviewed, and adjusted if appropriate, at the end of each reporting period.
An item of bank premises, furniture, fixtures and equipment, including the related
accumulated depreciation and amortization and any impairment losses, is derecognized upon disposal or when no future economic benefits are expected to arise from the continued use of the asset. Any gain or loss arising on derecognition of the asset (calculated as the difference between the net disposal proceeds and the carrying amount of the item) is presented as part of Gain on sale of non-financial assets under Other Operating Income account in the statement of income in the year the item is derecognized.
- 11 -
DRAFT As reviewed by P&A- March 10, 2017
2.5 Investment Properties
Investment properties pertain to parcels of land and improvements acquired by the Bank in settlement of loans from defaulting borrowers through foreclosure or dacion in payment which are held either to earn rental income or for capital appreciation or both, but not for sale in the ordinary course of business, use in the production or supply of goods or services or for administrative purposes. Investment properties are measured initially at acquisition cost. Directly attributable cost incurred such as legal fees, transfer taxes and other transaction costs are capitalized as part of the carrying amount of investment properties.
The Bank adopted the cost model in measuring its investment properties; hence, these are carried at cost less accumulated depreciation and any impairment in value, if any. Investment properties except land are depreciated on a straight-line basis over a period of 10 years.
Investment property is derecognized upon disposal or when permanently withdrawn from use and no future economic benefit is expected from its disposal. Any gain or loss on the disposal of an investment property is recognized in profit or loss and is presented as part of Gain on sale of non-financial assets under Other Operating Income account in the statement of income in the year of disposal. Direct operating expenses related to investment properties, such as repairs and maintenance, and real estate taxes are normally charged against current operations in the period in which these costs are incurred. 2.6 Other Resources Other resources pertain to other assets that are controlled by the Bank as a result of past events. These are recognized in the financial statements when it is probable that the future economic benefits will flow to the Bank and the asset has a cost or value that can be measured reliably. 2.7 Intangible Assets Intangible assets include computer software licenses, which is presented as part of Other Resources account. Acquired computer software licenses are capitalized on the basis of the costs incurred to acquire and install the specific software. These costs are amortized on a straight-line basis over the expected useful life of three to seven years. Costs associated with maintaining computer software are expensed as incurred. When an intangible asset is disposed of, the gain or loss on disposal is determined as the difference between the proceeds and the carrying amount of the asset and is recognized in profit or loss.
2.8 Financial Liabilities Financial liabilities, which include deposit liabilities, bills payable and other liabilities (except tax-related payables) are recognized when the Bank becomes a party to the contractual terms of the instrument.

- 12 -
DRAFT As reviewed by P&A- March 10, 2017
All interest-related charges incurred on a financial liability are recognized as an expense in profit or loss as part of Interest Expense in the statement of income. Deposit liabilities and other liabilities are recognized initially at their fair values and subsequently measured at amortized cost, using effective interest method for maturities beyond one year, less settlement payments.
Bills payable are recognized initially at fair value, equivalent to the issue proceeds (fair value of consideration received), net of direct issue costs. Bills payable are subsequently measured at amortized cost. Any difference between proceeds, net of transaction costs, and the redemption value is recognized in profit or loss over the period of the borrowings using the effective interest method. Dividend distributions to shareholders are recognized as financial liabilities when the dividends are declared by the Bank. Financial liabilities are derecognized from the statement of financial position only when the obligations are extinguished either through discharge, cancellation or expiration. The difference between the carrying amount of the financial liability derecognized and the consideration paid or payable is recognized in profit or loss.
2.9 Equity
Capital stock represents the nominal value of shares that have been issued.
Surplus includes all current and prior period results of operations as reported in the statement of income, reduced by the amount of dividends declared. Revaluation reserves pertain to the net cumulative unrealized fair value gains (losses) on AFS financial assets arising from mark-to-market valuation and remeasurements of post-employment defined benefit plan, net of any related income tax benefits.
2.10 Offsetting of Financial Instruments
Financial assets and financial liabilities are offset and the resulting net amount, considered as a single financial asset or financial liability, is reported in the statement of financial position when there is a legally enforceable right to set-off the recognized amounts and there is an intention to settle on a net basis, or realize the asset and settle the liability simultaneously. The right of set-off must be available at the end of the reporting period, that is, it is not contingent on future event. It must also be enforceable in the normal course of business, in the event of default, and in the event of insolvency or bankruptcy; and must be legally enforceable for both entity and all counterparties to the financial instruments.
2.11 Provisions and Contingencies
Provisions are recognized when present obligations will probably lead to an outflow of economic resources and they can be estimated reliably even if the timing or amount of the outflow may still be uncertain. A present obligation arises from the presence of a legal or constructive obligation that has resulted from past events.

- 13 -
DRAFT As reviewed by P&A- March 10, 2017
Provisions are measured at the estimated expenditure required to settle the present obligation, based on the most reliable evidence available at the end of the reporting period, including the risks and uncertainties associated with the present obligation. Where there are a number of similar obligations, the likelihood that an outflow will be required in settlement is determined by considering the class of obligations as a whole. When time value of money is material, long-term provisions are discounted to their present values using a pretax rate that reflects market assessments and the risks specific to the obligation. The increase in the provision due to passage of time is recognized as interest expense. Provisions are reviewed at the end of each reporting period and adjusted to reflect the current best estimate.
In those cases where the possible outflow of economic resource as a result of present obligations is considered improbable or remote, or the amount to be provided for cannot be measured reliably, no liability is recognized in the financial statements. Similarly, possible inflows of economic benefits to the Bank that do not yet meet the recognition criteria of an asset are considered contingent assets, hence, are not recognized in the financial statements. On the other hand, any reimbursement that the Bank can be virtually certain to collect from a third party with respect to the obligation is recognized as a separate asset not exceeding the amount of the related provision.
2.12 Revenue and Expense Recognition Revenue is recognized to the extent that the revenue can be reliably measured; it is probable that future economic benefits will flow to the Bank; and, the costs incurred or to be incurred can be measured reliably. Costs and expenses are recognized in profit or loss upon utilization of the assets or services or at the date they are incurred. The following specific recognition criteria of income and expenses must also be met before revenue and expense are recognized: (a) Interest – Interest income and expenses are recognized in profit or loss for all
financial assets or liabilities using the effective interest method. The effective interest method is a method of calculating the amortized cost of a
financial asset or a financial liability and of allocating the interest income or interest expense over the relevant period. The effective interest rate is the rate that exactly discounts estimated future cash payments or receipts through the expected life of the financial instrument or, when appropriate, a shorter period to the net carrying amount of the financial asset or financial liability. When calculating the effective interest rate, the Bank estimates cash flows considering all contractual terms of the financial instrument but does not consider future credit losses. The calculation includes all fees and points paid or received between parties to the contract that are an integral part of the effective interest rate, transaction costs and all other premiums or discounts.
Once a financial asset or a group of similar financial assets has been written down
as a result of an impairment loss, interest income is recognized using the rate of interest used to discount the future cash flows for the purpose of measuring the impairment loss.

- 14 -
DRAFT As reviewed by P&A- March 10, 2017
(b) Fees and commissions – Fees and commissions are generally recognized when the service has been provided. These include commissions and fees arising from loans, deposits and other banking transactions and are taken up as income based on agreed terms and conditions.
(c) Gain on sale of non-financial assets – Gain from assets sold or exchanged is
recognized when the title to the properties is transferred to the buyer or when the collectibility of the entire sales price is reasonably assured. This is included in profit or loss as part of Other Operating Income.
2.13 Leases – Bank as Lessee
Leases, which do not transfer to the Bank substantially all the risks and benefits of ownership of the asset are classified as operating leases. Operating lease payments (net of any incentive received from the lessor) are recognized as expense in profit or loss on a straight-line basis over the lease term. Associated costs, such as repairs and maintenance and insurance, are expensed as incurred. The Bank determines whether an arrangement is, or contains, a lease based on the substance of the arrangement. It makes an assessment of whether the fulfillment of the arrangement is dependent on the use of a specific asset or assets and the arrangement conveys a right to use the asset. 2.14 Foreign Currency Transactions and Translations
The accounting records of the Bank are maintained in Philippine pesos. Foreign currency transactions during the year are translated into the functional currency at exchange rates which approximate those prevailing on transaction dates.
Foreign currency gains and losses resulting from the settlement of such transactions and from the translation at year-end exchange rates of monetary assets and liabilities denominated in foreign currencies are recognized in profit or loss. 2.15 Impairment of Non-financial Assets
The Bank’s bank premises, furniture, fixture and equipment, investment properties, intangible assets, and other non-financial assets are subject to impairment testing. All other individual assets or cash-generating units are tested for impairment whenever events or changes in circumstances indicate that the carrying amount of those assets may not be recoverable. For purposes of assessing impairment, assets are grouped at the lowest levels for which there are separately identifiable cash flows (cash-generating units). As a result, assets are tested for impairment either individually or at the cash-generating unit level.
- 15 -
DRAFT As reviewed by P&A- March 10, 2017
Impairment loss is recognized for the amount by which the asset’s or cash-generating unit’s carrying amount exceeds its recoverable amounts, which is the higher of its fair value less costs to sell and its value in use. The recoverable amount is the higher of fair value, reflecting market conditions, less costs to sell and value in use. In determining value in use, management estimates the expected future cash flows from each
cash-generating unit and determines the suitable interest rate in order to calculate the present value of those cash flows. The data used for impairment testing procedures are directly linked to the Bank’s latest approved budget, adjusted as necessary to exclude the effects of asset enhancements. Discount factors are determined individually for each cash-generating unit and reflect management’s assessment of respective risk profiles, such as market and asset-specific risk factors. All assets are subsequently reassessed for indications that an impairment loss previously recognized may no longer exist and the carrying amount of the asset is adjusted to the recoverable amount resulting in the reversal of the impairment loss.
2.16 Impairment of Financial Assets The Bank assesses at the end of each reporting period whether there is objective evidence that a financial asset or group of financial assets is impaired. A financial asset or a group of financial assets is impaired and impairment losses are incurred if, and only if, there is objective evidence of impairment as a result of one or more events that occurred after the initial recognition of the asset (a loss event) and that loss event has an impact on the estimated future cash flows of the financial asset or group of financial assets that can be reliably estimated. Objective evidence that a financial asset or group of assets is impaired includes observable data that comes to the attention of the Bank about certain loss events, including, among others: (i) significant financial difficulty of the issuer or debtor; (ii) a breach of contract, such as a default or delinquency in interest or principal payments; (iii) the probability that the borrower will enter bankruptcy or other financial reorganization; (iv) the disappearance of an active market for that financial asset because of financial difficulties; or, (v) observable data indicating that there is a measurable decrease in the estimated future cash flows from a group of financial assets since the initial recognition of those assets, although the decrease cannot be identified yet with the individual financial assets in the group. (a) Assets carried at amortized cost
The Bank first assesses whether objective evidence of impairment exists individually for financial assets that are individually significant and individually or collectively for financial assets that are not individually significant. If the Bank determines that no objective evidence of impairment exists for an individually assessed financial asset, whether significant or not, the Bank includes the asset in a group of financial assets with similar credit risk characteristics and collectively assesses them for impairment. Financial assets that are individually assessed for impairment and for which an impairment loss is or continues to be recognized are not included in a collective assessment of impairment.
- 16 -
DRAFT As reviewed by P&A- March 10, 2017
If there is an objective evidence that an impairment loss on loans and receivables or HTM financial assets carried at amortized cost has been incurred, the amount of the loss is measured as the difference between the asset’s carrying amount and the present value of estimated future cash flows (excluding future credit losses that have not been incurred) discounted at the financial asset’s original effective interest rate. The carrying amount of the asset is reduced through the use of an allowance account and the amount of the loss is recognized in profit or loss. If a loan and receivable or HTM financial asset has a variable interest rate, the discount rate for measuring any impairment loss is the current effective interest rate determined under the contract. When practicable, the Bank may measure impairment on the basis of an instrument’s fair value using an observable market price. The calculation of the present value of the estimated future cash flows of a collateralized financial asset reflects the cash flows that may result from foreclosures less costs for obtaining and selling the collateral, whether or not the foreclosure is probable.
For the purpose of a collective evaluation of impairment, financial assets are grouped on the basis of similar credit risk characteristics, i.e., on the basis of the Bank’s or BSP’s grading process that considers asset type, industry, collateral type, status and other relevant factors. Those characteristics are relevant to the estimation of future cash flows for groups of such assets by being indicative of the debtors’ ability to pay all amounts due according to the contractual terms of the assets being evaluated. Future cash flows in a group of financial assets that are collectively evaluated for impairment are estimated on the basis of the contractual cash flows of the assets and historical loss experience for assets with credit risk characteristics similar to those in the group. Historical loss experience is adjusted on the basis of current observable data to reflect the effects of current conditions that did not affect the period on which the historical loss experience is based and to remove the effects of conditions in the historical period that do not exist currently. Estimates of changes in future cash flows for groups of assets should reflect and be consistent with changes in related observable data from period to period. The methodologies and assumptions used for estimating future cash flows are reviewed regularly by the Bank to reduce any differences between loss estimates and actual loss experience. When a loan is uncollectible, it is written off against the related allowance for loan impairment. Such loans are written off after all the necessary procedures, including approval from the management and the BOD, have been completed and the amount of the loss has been determined. Subsequent recoveries of amounts previously written off are recognized as an income. If, in a subsequent period, the amount of the impairment loss decreases and the decrease can be related objectively to an event occurring after the impairment was recognized (such as an improvement in the debtor’s credit rating), the previously recognized impairment loss is reversed by adjusting the allowance account. The amount of the reversal is recognized in profit or loss.
- 17 -
DRAFT As reviewed by P&A- March 10, 2017
When possible, the Bank seeks to restructure loans rather than to take possession of collateral. This may involve extending the payment arrangements and the agreement of new loan conditions. Management continuously reviews restructured loans to ensure that all criteria are met and that future payments are likely to occur. The loans continue to be subjected to an individual or collective impairment assessment, calculated using the loans’ original effective interest rate. The difference between the original loan and the present value of the restructured cash flows, discounted at the original effective interest rate, is recognized in profit or loss as part of Impairment Losses.
(b) Assets carried at fair value with changes recognized in other comprehensive income
In the case of investments classified as AFS financial assets, a significant or prolonged decline in the fair value of the security below its cost is considered in determining whether the assets are impaired. If any such evidence exists for AFS financial assets, the cumulative loss – measured as the difference between the acquisition cost and the current fair value, less any impairment loss on that financial asset previously recognized in other comprehensive income as part of equity – is reclassified from other comprehensive income to profit or loss as a reclassification adjustment. Impairment losses recognized in profit or loss on equity instruments are not reversed through profit or loss. If, in a subsequent period, the fair value of a debt instrument classified as AFS financial assets increases and the increase can be objectively related to an event occurring after the impairment loss was recognized in profit or loss, the impairment loss is reversed through profit or loss.
2.17 Employee Benefits
The Bank provides post-employment benefits to employees through a defined benefit plan, defined contribution plan, and other employee benefits which are recognized and measured as follows:
(a) Post-employment Defined Benefit
A defined benefit plan is a post-employment plan that defines an amount of post - employment benefit that an employee will receive on retirement, usually dependent on one or more factors such as age, years of service and salary. The legal obligation for any benefits from this kind of post-employment plan remains with the Bank, even if plan assets for funding the defined benefit plan have been acquired. Plan assets may include assets specifically designated to a long-term benefit fund, as well as qualifying insurance policies. The Bank’s defined benefit post-employment plan covers all regular full-time employees. The post-employment plan is tax-qualified, noncontributory and administered by trustees.

- 18 -
DRAFT As reviewed by P&A- March 10, 2017
The asset recognized in the statement of financial position for defined benefit post-employment plans is the fair value of plan assets at the end of reporting period less the present value of the defined benefit obligation, together with adjustments for asset ceiling. The defined benefit obligation is calculated annually by independent actuaries using the projected unit credit method. The present value of the defined benefit obligation is determined by discounting the estimated future cash outflows using a discount rate derived from the interpolated yields of government bonds as published by Philippine Dealing & Exchange Corp. (PDEx), that are denominated in the currency in which the benefits will be paid and that have terms to maturity approximating to the terms of the related post-employment liability.
Remeasurements, comprising of actuarial gains and losses arising from experience adjustments and changes in actuarial assumptions and the return on plan assets (excluding amount included in net interest) are reflected immediately in the statement of financial position with a charge or credit recognized in other comprehensive income in the period in which they arise. Net interest is calculated by applying the discount rate at the beginning of the period, taking account of any changes in the net defined benefit liability or asset during the period as a result of contributions and benefit payments. Net interest is reported as part of Interest Expense or Interest Income account in the statement of income. Past-service costs are recognized immediately in profit or loss in the period of plan amendment and curtailment.
(b) Defined Contribution Plan
A defined contribution plan is a post-employment plan under which the Bank pays fixed contributions into an independent entity (e.g. Social Security System). The Bank has no legal or constructive obligations to pay further contributions after payment of the fixed contribution. The contributions recognized in respect of defined contribution plans are expensed as they fall due. Liabilities or assets may be recognized if underpayment or prepayment has occurred.
(c) Termination Benefits
Termination benefits are payable when employment is terminated by the Bank before the normal retirement date, or whenever an employee accepts voluntary redundancy in exchange for these benefits. The Bank recognizes termination benefits at the earlier of when it can no longer withdraw the offer of such benefits and when it recognizes costs for a restructuring that is within the scope of PAS 37, Provisions, Contingent Liabilities and Contingent Assets, and involves the payment of termination benefits. In the case of an offer made to encourage voluntary redundancy, the termination benefits are measured based on the number of employees expected to accept the offer. Benefits falling due more than 12 months after the reporting period are discounted to their present value.
(d) Bonuses
The Bank recognizes a liability and an expense for accrual of bonuses. The Bank recognizes a provision where it is contractually obliged to pay the benefits.
- 19 -
DRAFT As reviewed by P&A- March 10, 2017
(e) Compensated Absences Unavailed leaves, included in Accrued expenses under Other Liabilities account in the statement of financial position, are recognized as expense at the amount the Bank expects to pay at the end of reporting period. Each regular employee is entitled to 15 days vacation and sick leaves each year. Five of the vacation leaves are convertible into cash when unused and can be carried forward to the next taxable year. The maximum vacation leaves that can be accumulated by each employee is 45 days. Sick leaves, on the other hand, are non-convertible but cumulative.
2.18 Borrowing Costs
Borrowing costs are recognized as expenses in the period in which they are incurred, except to the extent that they are capitalized. Borrowing costs that are directly attributable to the acquisition, construction or production of a qualifying asset (i.e., an asset that takes a substantial period of time to get ready for its intended use or sale) are capitalized as part of cost of such asset. The capitalization of borrowing costs commences when expenditures for the asset and borrowing costs are being incurred and activities that are necessary to prepare the asset for its intended use or sale are in progress. Capitalization ceases when substantially all such activities are complete. Investment income earned on the temporary investment of specific borrowings pending their expenditure on qualifying assets is deducted from the borrowing costs eligible for capitalization.
2.19 Income Taxes Tax expense recognized in profit or loss comprises the sum of deferred tax and current tax not recognized in other comprehensive income or directly in equity, if any.
Current tax assets or liabilities comprise those claims from, or obligations to, fiscal authorities relating to the current or prior reporting period, that are uncollected or unpaid at the end of the reporting period. They are calculated using the tax rates and tax laws applicable to the fiscal periods to which they relate, based on the taxable profit for the year. All changes to current tax assets or liabilities are recognized as a component of tax expense in profit or loss. Deferred tax is accounted for using the liability method, on temporary differences at the end of each reporting period between the tax base of assets and liabilities and their carrying amounts for financial reporting purposes. Under the liability method, with certain exceptions, deferred tax liabilities are recognized for all taxable temporary differences and deferred tax assets are recognized for all deductible temporary differences and the carryforward of unused tax losses and unused tax credits to the extent that it is probable that taxable profit will be available against which the deductible temporary differences can be utilized. Unrecognized deferred tax assets are reassessed at the end of each reporting period and are recognized to the extent that it has become probable that future taxable profit will be available to allow such deferred tax assets to be recovered.

- 20 -
DRAFT As reviewed by P&A- March 10, 2017
Deferred tax assets and liabilities are measured at the tax rates that are expected to apply in the period when the asset is realized or the liability is settled provided such tax rates have been enacted or substantively enacted at the end of the reporting period. The carrying amount of deferred tax assets is reviewed at the end of each reporting period and reduced to the extent that it is probable that sufficient taxable profit will be available to allow all or part of the deferred tax asset to be utilized.
The measurement of deferred tax liabilities and assets reflects the tax consequences that would follow from the manner in which the Bank expects, at the end of the reporting period, to recover or settle the carrying amount of its assets and liabilities.
Most changes in deferred tax assets or liabilities are recognized as a component of tax expense in profit or loss, except to the extent that it relates to items recognized in other comprehensive income or directly in equity. In this case, the tax is also recognized in other comprehensive income or directly in equity, respectively. Deferred tax assets and deferred tax liabilities are offset if the Bank has a legally enforceable right to set-off current tax assets against current tax liabilities and the deferred taxes relate to the same taxation authority.
2.20 Related Party Transactions and Relationships
Related party transactions are transfers of resources, services or obligations between the Bank and its related parties, regardless of whether a price is charged. Parties are considered to be related if one party has the ability to control the other party or exercise significant influence over the other party in making financial and operating decisions. These include: (a) individuals owning, directly or indirectly through one or more intermediaries, control or are controlled by, or under common control with the Bank; (b) associates; (c) individuals owning, directly or indirectly, an interest in the voting power of the Bank that gives them significant influence over the Bank and close members of the family of any such individual; and, (d) the Bank’s funded retirement plan.
In considering each possible related party relationship, attention is directed to the substance of the relationship and not merely on the legal form.
2.21 Earnings Per Share
Basic earnings per share is determined by dividing the net profit by the weighted average number of common shares subscribed and issued during the year after retroactive adjustment for stock dividend, stock split and reverse stock split declared during the year, if any.
Diluted earnings per share is computed by adjusting the weighted average number of ordinary shares outstanding to assume conversion of dilutive potential shares. Currently, the Bank does not have dilutive potential shares outstanding, hence, the diluted earnings per share is equal to the basic earnings per share.

- 21 -
DRAFT As reviewed by P&A- March 10, 2017
2.22 Events After the End of the Reporting Period
Any post-year-end event that provides additional information about the Bank’s financial position at the end of reporting period (adjusting event) is reflected in the financial statements. Post-year-end events that are not adjusting events, if any, are disclosed when material to the financial statements.
3. SIGNIFICANT ACCOUNTING JUDGMENTS AND ESTIMATES
The preparation of the Bank’s financial statements in accordance with PFRS requires management to make judgments and estimates that affect the amounts reported in the financial statements and related notes. Judgments and estimates are continually evaluated and are based on historical experience and other factors, including expectations of future events that are believed to be reasonable under the circumstances. Actual results may ultimately differ from these estimates. 3.1 Critical Management Judgments in Applying Accounting Policies In the process of applying the Bank’s accounting policies, management has made the following judgments, apart from those involving estimation, which have the most significant effect on the amounts recognized in the financial statements:
(a) Classifying Financial Assets as HTM Financial Assets
In classifying non-derivative financial assets with fixed or determinable payments and fixed maturity, such as bonds, as HTM financial assets, the Bank evaluates its intention and ability to hold such investments up to maturity. Management has confirmed its intention and determined its ability to hold the investments up to maturity. If the Bank fails to keep these investments to maturity other than for specific circumstances as allowed under the standard, it will be required to reclassify the whole class as AFS financial assets. In such a case, the investments would, therefore, be measured at fair value, not at amortized cost.
(b) Evaluating Impairment of AFS Financial Assets
The determination when an investment is other-than-temporarily impaired requires significant judgment. In making this judgment, the Bank evaluates, among other factors, the duration and extent to which the fair value of an investment is less than its cost, and the financial health of and near-term business outlook for the investee, including factors such as industry and sector performance, changes in technology and operational and financing cash flows. Based on the recent evaluation of information and circumstances affecting the Bank’s AFS financial assets, management concluded that the assets are not impaired as of December 31, 2016 and 2015. Future changes in those information and circumstances might significantly affect the carrying amount of the assets.

- 22 -
DRAFT As reviewed by P&A- March 10, 2017
(c) Distinguishing Investment Properties and Owner-occupied Properties
The Bank determines whether a property qualifies as investment property. In making its judgment, the Bank considers whether the property generates cash flows largely independent of the other assets held by the Bank. Owner-occupied properties generate cash flows that are attributable not only to the property but also to the other resources used in the supply process. The management has determined that the land and improvements acquired by the Bank from the defaulting borrowers are classified as investment properties.
(d) Distinguishing Operating and Finance Leases
The Bank has entered into various lease agreements as a lessee. Critical judgment was exercised by management to distinguish each lease agreement as either an operating or finance lease by looking at the transfer or retention of significant risks and rewards of ownership of the properties covered by the agreements. Failure to make the right judgment will result in either overstatement or understatement of resources and liabilities. Based on management’s judgment, such leases were determined to be operating leases.
(e) Recognition of Provisions and Contingencies
Judgment is exercised by management to distinguish between provisions and contingencies. Policies on recognition of provisions and contingencies are discussed in Note 2.11 and relevant disclosures are presented in Note 24.
3.2 Key Sources of Estimation Uncertainty The following are the key assumptions concerning the future, and other key sources of estimation uncertainty at the end of the reporting period, that have a significant risk of causing a material adjustment to the carrying amounts of resources and liabilities within the next reporting period:
(a) Impairment of HTM Financial Assets and Loans and Other Receivables
The Bank reviews its HTM financial assets and loans and other receivables portfolios to assess impairment at least on a monthly basis. In determining whether an impairment loss should be recorded in profit or loss, the Bank makes judgments as to whether there is any observable data indicating that there is a measurable decrease in the estimated future cash flows from the financial asset or a portfolio of similar financial assets. This evidence may include observable data indicating that there has been an adverse change in the payment status of borrowers or issuers in a group, or national or local economic conditions that correlate with defaults on assets in the group.
- 23 -
DRAFT As reviewed by P&A- March 10, 2017
Management evaluates the amount of impairment loss based on historical loss experience for assets with credit risk characteristics and objective evidence of impairment similar to those in the portfolio when scheduling its future cash flows. The methodology and assumptions used for estimating both the amount and timing of future cash flows are reviewed regularly to reduce any differences between loss estimates and actual loss experience. The carrying value of HTM financial assets and loans and other receivables and the analysis of their respective allowances for impairment are shown in Notes 9.2 and 10, respectively.
(b) Fair Value Measurement for Financial Instruments
Management applies valuation techniques to determine the fair value of financial instruments where active market quotes are not available. This requires management to develop estimates and assumptions based on market inputs, using observable data that market participants would use in pricing the instrument. Where such data is not observable, management uses its best estimate. Estimated fair values of financial instruments may vary from the actual prices that would be achieved in an arm’s length transaction at the end of the reporting period.
The fair value information related to financial assets and financial liabilities is disclosed in Note 6. The carrying values of the Bank’s AFS financial assets and the amounts of fair value changes recognized on those assets are disclosed in Note 9.1.
(c) Estimation of Useful Lives of Bank Premises, Furniture, Fixtures and Equipment, Investment Properties and Computer Software
The Bank estimates the useful lives of property and equipment, investment properties and computer software (classified under Other Resources) based on the period over which the assets are expected to be available for use. The estimated useful lives of bank premises, furniture, fixtures and equipment, investment properties and computer software are reviewed periodically and are updated if expectations differ from previous estimates due to physical wear and tear, technical or commercial obsolescence and legal or other limits on the use of the assets. The carrying amounts of bank premises, furniture, fixtures and equipment are analyzed in Note 11 while investment properties and computer software are analyzed in Notes 12 and 13, respectively. Based on management’s assessment as at December 31, 2016 and 2015, there is no change in estimated useful lives of bank premises, furniture, fixtures and equipment, investment properties and computer software during those years. Actual results, however, may vary due to changes in estimates brought about by changes in factors mentioned above.

- 24 -
DRAFT As reviewed by P&A- March 10, 2017
(d) Determination of Fair Value of Investment Properties
Investment properties are measured using the cost model. The fair value disclosed in Note 12 to the financial statements as determined using the market comparable approach that reflects the recent transaction prices for similar properties in nearby locations adjusted for differences in key attributes such as property size, zoning, and accessibility. The most significant input into this valuation approach is the price per square foot, hence, the higher the price per square foot, the higher the fair value. The Bank engages services of professional and independent appraisers applying the relevant valuation methodologies as discussed in Note 6.4.
For investment properties with appraisal conducted prior to the end of the current reporting period, management determines whether there are significant circumstances during the intervening period that may require adjustments or changes in the disclosure of fair value of those properties.
(e) Determination of Realizable Amount of Deferred Tax Assets
The Bank reviews its deferred tax assets at the end of each reporting period and reduces the carrying amount to the extent that it is no longer probable that sufficient taxable profit will be available to allow all or part of the deferred tax assets to be utilized. Management assessed that the deferred tax assets recognized as at December 31, 2016 and 2015 will be fully utilized within the prescribed availment period. The carrying value of deferred tax assets as of those dates is disclosed in Note 20.
(f) Estimation of Impairment of Non-financial Assets
In assessing impairment, management estimates the recoverable amount of each asset or a cash-generating unit based on expected future cash flows and uses an interest rate to calculate the present value of those cash flows. Estimation uncertainty relates to assumptions about future operating results and the determination of a suitable discount rate (see Note 2.15). Though management believes that the assumptions used in the estimation of fair values reflected in the financial statements are appropriate and reasonable, significant changes in those assumptions may materially affect the assessment of recoverable values and any resulting impairment loss could have a material adverse effect on the results of operations.
As of December 31, 2016 and 2015, the Bank has not recognized any impairment losses on its bank premises, furniture, fixtures and equipment and computer software. Impairment losses recognized by the Bank on investment properties, on the other hand, are discussed in Note 12.
- 25 -
DRAFT As reviewed by P&A- March 10, 2017
(g) Valuation of Post-employment Defined Benefit Plan
The determination of the Bank’s obligation and cost of post-employment and other retirement benefits is dependent on the selection of certain assumptions used by actuaries in calculating such amounts. Those assumptions are described in Note 19 and include, among others, discount rates and salary increase rates. A significant change in any of these actuarial assumptions may generally affect the recognized expense, other comprehensive income or losses and the carrying amount of the retirement benefit asset or obligation in the next reporting period. The amounts of retirement benefit asset (obligation) and expense and an analysis of the movements in the estimated present value of defined benefit obligation, as well as the significant assumptions used in estimating such obligations are presented in Note 19.2.
4. RISK MANAGEMENT OBJECTIVES AND POLICIES
The Bank is exposed to a variety of financial risks in relation to financial instruments. The Bank’s financial assets and financial liabilities by category are summarized in Note 5. The main types of risks are market risk, credit risk and liquidity risk. The Bank recognizes that risk management is an activity critical to its success. It is committed to ensure constant adherence to best practices and standards and to apply prudence and accountability in its risk-taking activities. The Bank exposes itself to a myriad of risks arising from the use of financial instruments. In particular, these financial risks are mainly exposure to credit, liquidity and market risks. Consequently, the Bank has put in place the appropriate risk management structures, policies, and processes to address each type of risk. The key risk processes involve identifying, measuring, controlling and monitoring risks.
4.1 Risk Management Structure The following structure shows the Bank’s overall approach to risk management: (a) Board of Directors The BOD has the ultimate responsibility for approving and periodically reviewing the risk strategies and significant policies of the Bank. It adopts policies and guidelines to govern the safe and prudent functioning of the Bank with the end in view of effectively managing all risks in its activities. The policies to be formulated include, but not limited to, lending, investing, fund sourcing, liquidity management, personnel administration, and internal control.
(b) Risk Management Committee
Risk Management Committee (RMC) is the board level committee responsible for the development and oversight of the risk management program of the Bank. It oversees the system of limits to discretionary authority that the BOD delegates to management, ensures that the system remains effective, that the limits are observed and that immediate corrective actions are taken whenever limits are breached.

- 26 -
DRAFT As reviewed by P&A- March 10, 2017
(c) Senior Management
Senior management is responsible for the implementation of the strategies on risk control and makes adjustments to overall business strategy. They also ensure compliance with laws and regulations and create systems to measure and monitor performance.
(d) Risk Management Unit
Risk Management Unit (RMU) performs an independent risk governance function within the Bank. It is tasked with identifying, measuring, controlling and monitoring existing and emerging risks inherent in the Bank. The unit develops and employs risk assessment tools to facilitate risk identification and measurement. It is responsible for developing and implementing the framework for policies and practices to assess and manage enterprise-wide risks. It also develops and endorses risk tolerance limits for approval of the RMC, and monitors compliance with the approved risk tolerance limits. It regularly reports to the BOD, through the RMC, the results of its risk monitoring. (e) Executive Credit Committee A board level committee responsible to oversee the credit risk-taking activities, quality and profitability of the credit portfolio, and credit evaluation process. All credit proposals beyond the credit approving limit of the Credit Committee passes through this committee for final approval. This committee also endorses credit proposals beyond its approving limit to the BOD for final approval. (f) Asset-Liability Management Committee
A management level committee responsible for the overall management of the Bank’s liquidity risks. It monitors the Bank’s liquidity position and reviews the impact of strategic decisions on liquidity. It is responsible for managing liquidity risks and ensuring exposures remain within established tolerance levels. (g) Compliance Unit
This unit is responsible for reviewing any legal or regulatory matters that could have a significant impact on the Bank’s financial statements and compliance with laws and regulations. It reviews the effectiveness and adequacy of the system for monitoring compliance with laws and regulations. The Chief Compliance Officer regularly reports to the BOD.
(h) Internal Audit Department
Internal Audit Department (IAD) provides an independent assessment of the Bank’s management and effectiveness of existing internal control systems through adherence testing of processes and controls across the organization. The IAD audits risk management processes throughout the Bank. It employs a risk-based audit approach that examines both the adequacy of the procedures and the Bank’s compliance with the procedures. It discusses the results of all assessments with management, and reports its findings and recommendations to the Audit Committee of the BOD.
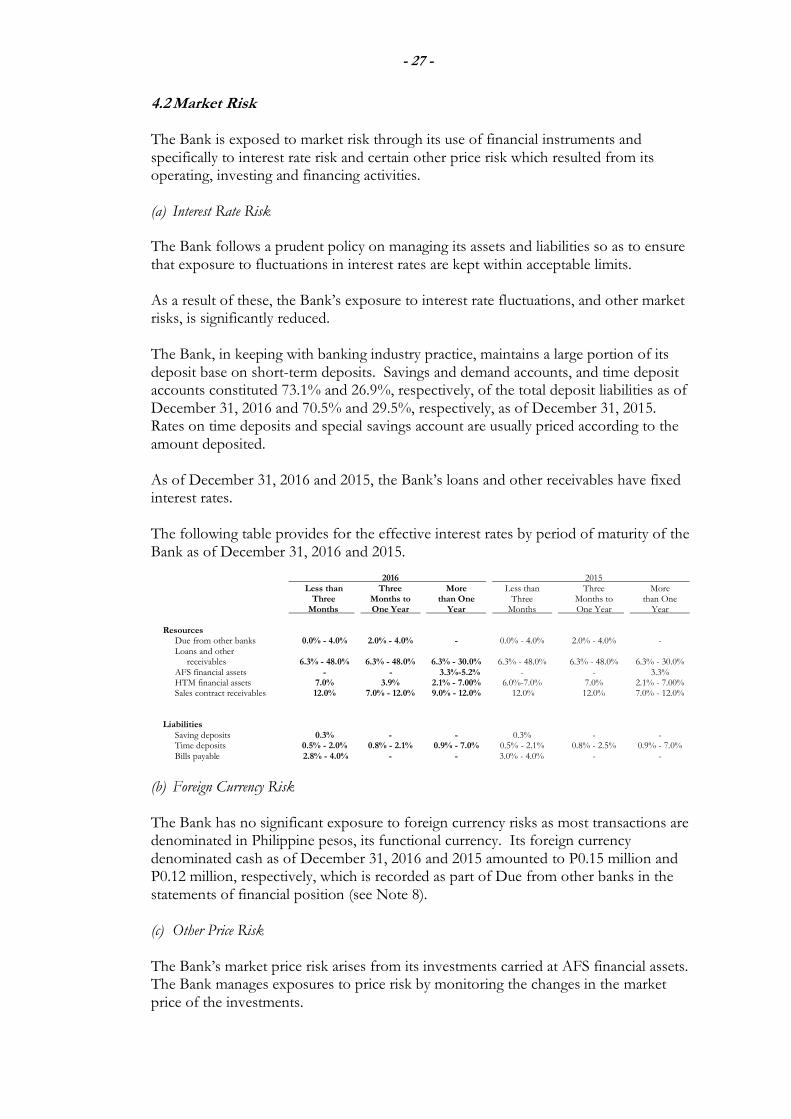
- 27 -
DRAFT As reviewed by P&A- March 10, 2017
4.2 Market Risk
The Bank is exposed to market risk through its use of financial instruments and specifically to interest rate risk and certain other price risk which resulted from its operating, investing and financing activities. (a) Interest Rate Risk
The Bank follows a prudent policy on managing its assets and liabilities so as to ensure that exposure to fluctuations in interest rates are kept within acceptable limits. As a result of these, the Bank’s exposure to interest rate fluctuations, and other market risks, is significantly reduced. The Bank, in keeping with banking industry practice, maintains a large portion of its deposit base on short-term deposits. Savings and demand accounts, and time deposit accounts constituted 73.1% and 26.9%, respectively, of the total deposit liabilities as of December 31, 2016 and 70.5% and 29.5%, respectively, as of December 31, 2015. Rates on time deposits and special savings account are usually priced according to the amount deposited. As of December 31, 2016 and 2015, the Bank’s loans and other receivables have fixed interest rates. The following table provides for the effective interest rates by period of maturity of the Bank as of December 31, 2016 and 2015.
2016 2015 Less than Three More Less than Three More Three Months to than One Three Months to than One Months One Year Year Months One Year Year Resources Due from other banks 0.0% - 4.0% 2.0% - 4.0% - 0.0% - 4.0% 2.0% - 4.0% - Loans and other receivables 6.3% - 48.0% 6.3% - 48.0% 6.3% - 30.0% 6.3% - 48.0% 6.3% - 48.0% 6.3% - 30.0% AFS financial assets - - 3.3%-5.2% - - 3.3% HTM financial assets 7.0% 3.9% 2.1% - 7.00% 6.0%-7.0% 7.0% 2.1% - 7.00% Sales contract receivables 12.0% 7.0% - 12.0% 9.0% - 12.0% 12.0% 12.0% 7.0% - 12.0%
Liabilities
Saving deposits 0.3% - - 0.3% - - Time deposits 0.5% - 2.0% 0.8% - 2.1% 0.9% - 7.0% 0.5% - 2.1% 0.8% - 2.5% 0.9% - 7.0% Bills payable 2.8% - 4.0% - - 3.0% - 4.0% - -
(b) Foreign Currency Risk The Bank has no significant exposure to foreign currency risks as most transactions are denominated in Philippine pesos, its functional currency. Its foreign currency denominated cash as of December 31, 2016 and 2015 amounted to P0.15 million and P0.12 million, respectively, which is recorded as part of Due from other banks in the statements of financial position (see Note 8). (c) Other Price Risk The Bank’s market price risk arises from its investments carried at AFS financial assets. The Bank manages exposures to price risk by monitoring the changes in the market price of the investments.

- 28 -
DRAFT As reviewed by P&A- March 10, 2017
For government bonds, an average volatility of 4.19% has been observed during 2016. If quoted price for these securities increased or decreased by that amount, profit before tax would have changed by P1.2 million in 2016. On the other hand, equity would have changed by P0.8 million in 2016. The effect of the volatility of market price in 2015 is insignificant. 4.3 Credit Risk Credit risk refers to the potential loss of the Bank’s earnings arising from the inability to review and analyze requests for credit to determine likelihood of repayment. This includes the failure to manage the risk that loss is incurred if counter party does not fulfill its financial obligations in a timely manner. Managing credit risk involves defining the principles and parameters governing credit activities at various levels, i.e. strategic level, portfolio level down to individual transaction or account level. The following tools, among others, are used in identifying, assessing and managing credit risk:
Established credit policies, asset allocations and concentration limits, collateral acceptance criteria, target market and clearly defined approving authorities;
Defined documentation policies of approved credit lines;
Independence of credit control and monitoring functions from the credit risk-taking function;
Periodic monitoring of individual account performance;
Regular review of the adequacy of valuation reserves;
Active loan portfolio management to determine the quality of the loan portfolio, including risks associated with particular industry sectors, loan size and maturity, monitoring portfolio growth, collection performance and delinquency trends, trend of non-performing loans, concentration risk, and other performance indicators; and,
Close monitoring of remedial accounts.
(a) Credit concentration
Excessive concentration of lending poses undue risk on the Bank’s asset quality. The Bank believes that good diversification across economic sectors and kinds of borrowers will lessen this risk. RMU reviews the Bank’s loan portfolio monthly, in line with its policy of avoiding significant credit concentration to specific industry or group of borrowers. To maintain the quality of its loan portfolio, the Bank keeps its risk tolerance limits on asset quality lower than the industry ratio and enforce a stringent policy on credit evaluation, review and monitoring. Credit concentration profile as of December 31, 2016 and 2015 is presented in Note 10. (b) Credit Quality Loan classification is an integral part of the Bank’s management of credit risk. On a regular basis, loans are reviewed, classified and rated based on internal and external factors that affect their performance. Loan classifications of impaired accounts are assessed and the results are used as basis for the review of loan loss provisions.
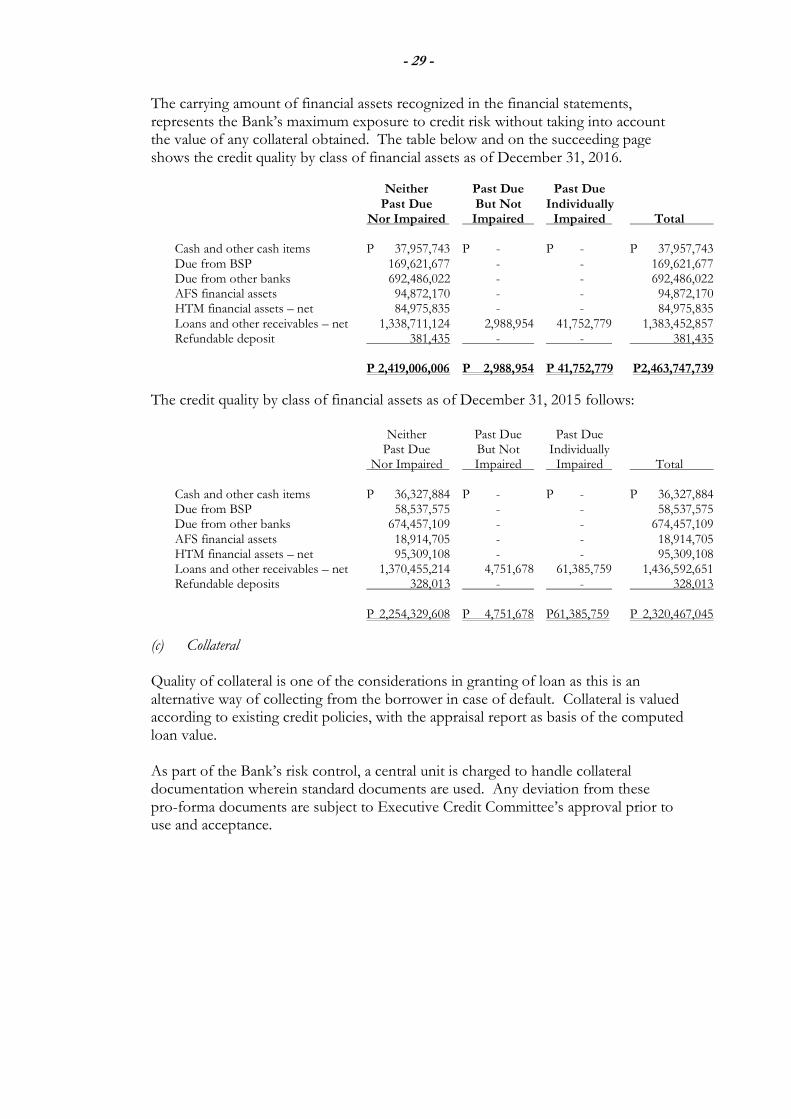
- 29 -
DRAFT As reviewed by P&A- March 10, 2017
The carrying amount of financial assets recognized in the financial statements, represents the Bank’s maximum exposure to credit risk without taking into account the value of any collateral obtained. The table below and on the succeeding page shows the credit quality by class of financial assets as of December 31, 2016.
Neither Past Due Past Due Past Due But Not Individually Nor Impaired Impaired Impaired Total Cash and other cash items P 37,957,743 P - P - P 37,957,743 Due from BSP 169,621,677 - - 169,621,677 Due from other banks 692,486,022 - - 692,486,022 AFS financial assets 94,872,170 - - 94,872,170 HTM financial assets – net 84,975,835 - - 84,975,835
Loans and other receivables – net 1,338,711,124 2,988,954 41,752,779 1,383,452,857 Refundable deposit 381,435 - - 381,435 P 2,419,006,006 P 2,988,954 P 41,752,779 P2,463,747,739
The credit quality by class of financial assets as of December 31, 2015 follows: Neither Past Due Past Due Past Due But Not Individually Nor Impaired Impaired Impaired Total Cash and other cash items P 36,327,884 P - P - P 36,327,884 Due from BSP 58,537,575 - - 58,537,575 Due from other banks 674,457,109 - - 674,457,109 AFS financial assets 18,914,705 - - 18,914,705 HTM financial assets – net 95,309,108 - - 95,309,108
Loans and other receivables – net 1,370,455,214 4,751,678 61,385,759 1,436,592,651 Refundable deposits 328,013 - - 328,013 P 2,254,329,608 P 4,751,678 P61,385,759 P 2,320,467,045
(c) Collateral Quality of collateral is one of the considerations in granting of loan as this is an alternative way of collecting from the borrower in case of default. Collateral is valued according to existing credit policies, with the appraisal report as basis of the computed loan value.
As part of the Bank’s risk control, a central unit is charged to handle collateral documentation wherein standard documents are used. Any deviation from these pro-forma documents are subject to Executive Credit Committee’s approval prior to use and acceptance.

- 30 -
DRAFT As reviewed by P&A- March 10, 2017
The table below provides the collateral profile of the outstanding loan portfolio (receivables from customers) of the Bank:
2016 2015
Directors, officers, stockholders and related interests (DOSRI) loans Secured Residential P - P 20,805 Non-risk assets - 272,219 Others 781,400 - 781,400 293,024 Unsecured 116,543 188,881 897,943 481,905 Non-DOSRI loans Secured Real estate mortgage 799,950,901 923,765,969 Non-risk assets 46,843,149 42,480,983 Others 212,120,666 200,239,596 1,059,696,096 1,166,486,548 Unsecured 310,624,619 254,354,099 1,370,320,715 1,420,840,647 P 1,371,218,658 P 1,421,322,552
The Bank normally grants loans to borrowers at a maximum rate of 60% of the latest appraised value of the borrowers’ collateral. Non-risk assets are securities covered by back-to-back on deposits. Others on the non-DOSRI loans includes chattel mortgages. (d) Other exposures to credit risk The credit risk for cash and cash equivalents is considered negligible, since the counterparty is a reputable bank with high quality external credit ratings. Included in cash and cash equivalents are cash in banks and short-term investments which are insured by the Philippine Deposit Insurance Corporation up to a maximum coverage of P0.5 million for every depositor per banking institution. There is also no significant credit risk relating to HTM financial assets and AFS financial assets since these are guaranteed by the Philippine government.
4.4 Liquidity Risk
Liquidity risk is the risk that funds available may not be adequate to meet the credit demands of the Bank’s customers and repay deposits on maturity. The Bank manages liquidity risk by holding sufficient liquid assets of appropriate quality to ensure short-term funding requirements are met and by maintaining a loan portfolio with evenly-spaced maturities and cash flows. In addition, the Bank seeks to maintain sufficient liquidity to take advantage of interest rate opportunities when they arise.

- 31 -
DRAFT As reviewed by P&A- March 10, 2017
The main responsibility of daily asset liability management lies with the Treasury Unit. Liquidity risk management is monitored through Asset-Liability Management Committee. The Bank’s principal source of liquidity is comprised of cash and other cash items, due from BSP and due from other banks. Analysis of maturity profile of the financial assets and financial liabilities of the Bank are shown below and on the succeeding page.
2016
One Three Less than to Three Months to More than One Month Months One Year One Year Total
Resources: Cash and other cash items P 37,957,743 P - P - P - P 37,957,743 Due from BSP 169,621,677 - - - 169,621,677 Due from other banks 572,670,499 63,394,019 56,421,504 - 692,486,022
AFS financial assets 94,872,170 - - - 94,872,170 HTM financial assets 19,997,562 8,011,785 56,966,487 - 84,975,834 Loans and other receivables - net 25,620,002 138,074,353 281,146,301 938,612,201 1,383,452,857 Refundable deposits - - 48,426 333,009 381,435 920,739,653 209,480,157 394,582,718 938,945,210 2,463,747,738
Liabilities: Deposit liabilities 1,740,799,262 265,767,963 45,091,419 53,798,400 2,105,457,044 Bills payable 150,000,000 - - - 150,000,000 Other liabilities 21,679,893 - - - 21,679,893 1,912,479,155 265,767,963 45,091,419 53,798,400 2,277,136,937
Net periodic gap (P 991,739,502) ( 56,287,806) 349,491,299 885,146,810 186,610,801 Cumulative total gap (P 991,739,502) (P1,048,027,308) ( P 698,536,009) P 186,610,801 P - 2015
One Three Less than to Three Months to More than One Month Months One Year One Year Total
Resources: Cash and other cash items P 36,327,884 P - P - P - P 36,327,884 Due from BSP 58,537,575 - - - 58,537,575 Due from other banks 601,823,414 62,432,533 10,201,162 - 674,457,109 AFS financial assets 18,914,705 - - - 18,914,705 HTM financial assets 7,996,903 20,056,781 20,232,983 47,022,442 95,309,109 Loans and other receivables - net 44,782,296 115,446,073 271,718,838 1,004,645,444 1,436,592,651 Refundable deposits - - 65,953 262,060 328,013 768,382,777 197,935,387 302,218,936 1,051,929,946 2,320,467,046 Liabilities: Deposit liabilities 1,507,129,941 284,014,993 42,425,498 66,078,400 1,899,648,832 Bills payable 200,000,000 - - - 200,000,000 Other liabilities 27,091,840 - - - 27,091,840 1,734,221,781 284,014,993 42,425,498 66,078,400 2,126,740,672 Net periodic gap ( 965,839,004 ) ( 86,079,606 ) 259,793,438 985,851,546 193,726,374 Cumulative total gap (P 965,839,004 (P 1,051,918,610 ) (P 792,125,172 ) P 193,726,374 P -

- 32 -
DRAFT As reviewed by P&A- March 10, 2017
5. CATEGORIES AND OFFSETTING OF FINANCIAL ASSETS AND FINANCIAL LIABILITIES 5.1 Carrying Amounts and Fair Values by Category The carrying amounts and fair values of the categories of financial assets and financial liabilities presented in the statements of financial position are shown below.
2016 2015 Carrying Fair Carrying Fair Amounts Values Amounts Values
Financial assets Loans and receivables: Cash and other cash items P 37,957,743 P 37,957,743 P 36,327,884 P 36,327,884 Due from BSP 169,621,677 169,621,677 58,537,575 58,537,575 Due from other banks 692,486,022 692,486,022 674,457,109 674,457,109 Loans and other receivables 1,383,452,857 1,383,452,857 1,436,592,651 1,436,592,651 Refundable deposits 381,435 381,435 328,013 328,013 2,283,899,734 2,283,899,734 2,206,243,232 2,206,243,232 AFS financial assets 94,872,170 94,872,170 18,914,705 18,914,705 HTM financial assets 84,975,835 85,795,860 95,309,108 99,581,806 P 2,463,747,739 P 2,464,567,764 P 2,320,467,045 P 2,324,739,743 Financial liabilities At amortized cost: Deposit liabilities P 2,105,457,044 P2,105,457,044 P 1,899,648,831 P 1,899,648,831 Bills payable 150,000,000 150,000,000 200,000,000 200,000,000 Other liabilities 21,679,893 21,679,893 27,091,840 27,091,840 P 2,277,136,937 P2,277,136,937 P 2,126,740,671 P 2,126,740,671
See Notes 2.3 and 2.8 for the description of the accounting policies for each category of financial instruments. A description of the Bank’s risk management objectives and policies for financial instruments is provided in Note 4.
5.2 Offsetting of Financial Assets and Financial Liabilities Certain financial assets and financial liabilities of the Bank with amounts presented in the statements of financial position as of December 31, 2016 and 2015 are subject to offsetting, enforceable master netting arrangements and similar agreements. However, there were no financial assets presented at net in the statements of financial position. Presented below are the financial assets subject to offsetting in the event of default but the related amounts are not set-off in the statements of financial position.
December 31, 2016 December 31, 2015 Related amounts not set off in the Related amounts not set off in the statements of financial position statements of financial position Financial Collateral Net Financial Collateral Net instruments received amount instruments received amount Financial assets – Loans and receivables P1,383,452,857 (P 197,624,549) P1,185,828,308 P1,436,592,651 (P 242,753,202) P1,193,839,449 Financial liabilities: Deposit liabilities P2,105,457,044 (P 47,624,549) P2,057,832,495 P1,899,648,831 (P 42,753,202) P1,856,895,629 Bills payable 150,000,000 ( 150,000,000) - 200,000,000 ( 200,000,000) -
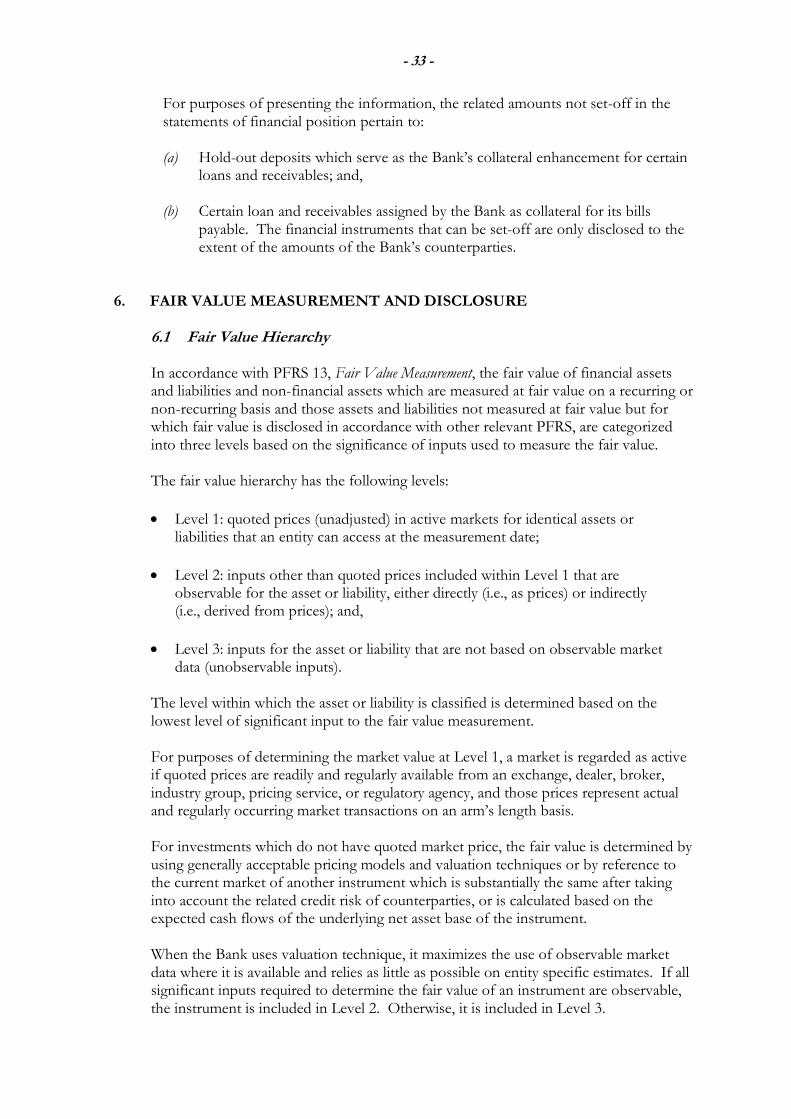
- 33 -
DRAFT As reviewed by P&A- March 10, 2017
For purposes of presenting the information, the related amounts not set-off in the statements of financial position pertain to: (a) Hold-out deposits which serve as the Bank’s collateral enhancement for certain
loans and receivables; and,
(b) Certain loan and receivables assigned by the Bank as collateral for its bills payable. The financial instruments that can be set-off are only disclosed to the extent of the amounts of the Bank’s counterparties.
6. FAIR VALUE MEASUREMENT AND DISCLOSURE
6.1 Fair Value Hierarchy
In accordance with PFRS 13, Fair Value Measurement, the fair value of financial assets and liabilities and non-financial assets which are measured at fair value on a recurring or non-recurring basis and those assets and liabilities not measured at fair value but for which fair value is disclosed in accordance with other relevant PFRS, are categorized into three levels based on the significance of inputs used to measure the fair value. The fair value hierarchy has the following levels:
Level 1: quoted prices (unadjusted) in active markets for identical assets or liabilities that an entity can access at the measurement date;
Level 2: inputs other than quoted prices included within Level 1 that are observable for the asset or liability, either directly (i.e., as prices) or indirectly (i.e., derived from prices); and,
Level 3: inputs for the asset or liability that are not based on observable market data (unobservable inputs).
The level within which the asset or liability is classified is determined based on the lowest level of significant input to the fair value measurement. For purposes of determining the market value at Level 1, a market is regarded as active if quoted prices are readily and regularly available from an exchange, dealer, broker, industry group, pricing service, or regulatory agency, and those prices represent actual and regularly occurring market transactions on an arm’s length basis. For investments which do not have quoted market price, the fair value is determined by using generally acceptable pricing models and valuation techniques or by reference to the current market of another instrument which is substantially the same after taking into account the related credit risk of counterparties, or is calculated based on the expected cash flows of the underlying net asset base of the instrument. When the Bank uses valuation technique, it maximizes the use of observable market data where it is available and relies as little as possible on entity specific estimates. If all significant inputs required to determine the fair value of an instrument are observable, the instrument is included in Level 2. Otherwise, it is included in Level 3.
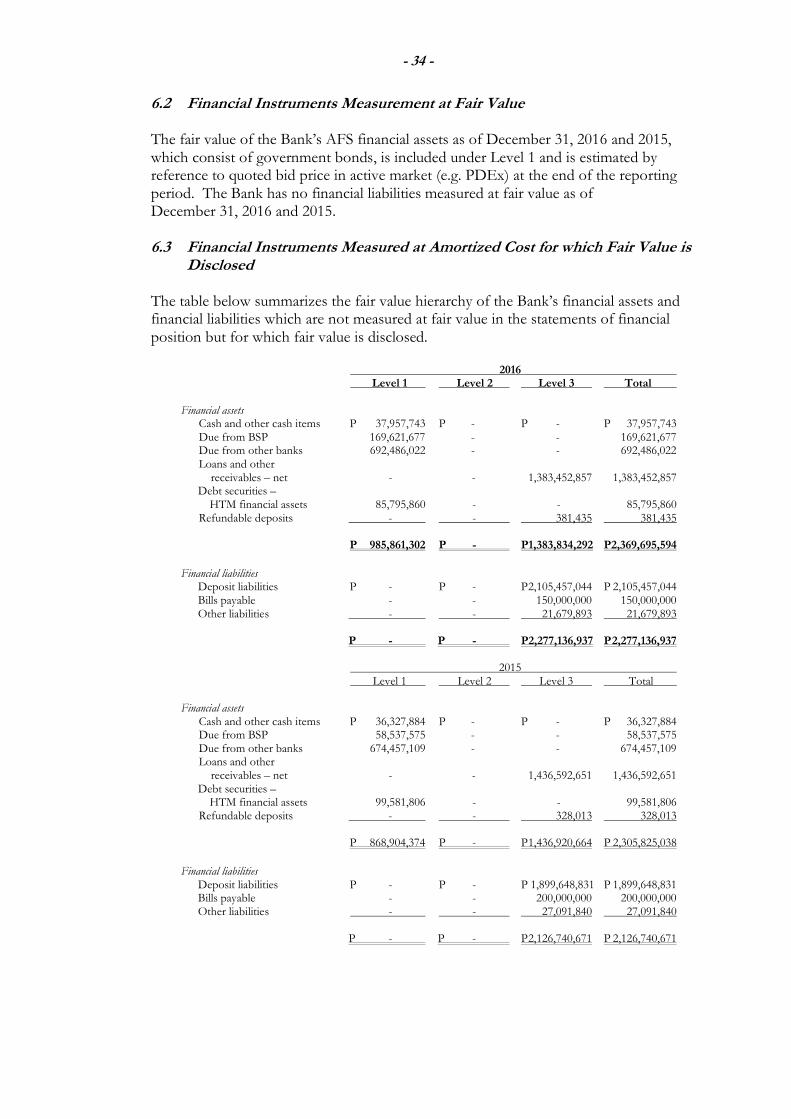
- 34 -
DRAFT As reviewed by P&A- March 10, 2017
6.2 Financial Instruments Measurement at Fair Value The fair value of the Bank’s AFS financial assets as of December 31, 2016 and 2015, which consist of government bonds, is included under Level 1 and is estimated by reference to quoted bid price in active market (e.g. PDEx) at the end of the reporting period. The Bank has no financial liabilities measured at fair value as of December 31, 2016 and 2015. 6.3 Financial Instruments Measured at Amortized Cost for which Fair Value is
Disclosed The table below summarizes the fair value hierarchy of the Bank’s financial assets and financial liabilities which are not measured at fair value in the statements of financial position but for which fair value is disclosed.
2016 Level 1 Level 2 Level 3 Total
Financial assets Cash and other cash items P 37,957,743 P - P - P 37,957,743 Due from BSP 169,621,677 - - 169,621,677 Due from other banks 692,486,022 - - 692,486,022 Loans and other
receivables – net - - 1,383,452,857 1,383,452,857 Debt securities –
HTM financial assets 85,795,860 - - 85,795,860 Refundable deposits - - 381,435 381,435 P 985,861,302 P - P1,383,834,292 P2,369,695,594
Financial liabilities
Deposit liabilities P - P - P 2,105,457,044 P 2,105,457,044 Bills payable - - 150,000,000 150,000,000
Other liabilities - - 21,679,893 21,679,893
P - P - P2,277,136,937 P 2,277,136,937 2015
Level 1 Level 2 Level 3 Total Financial assets Cash and other cash items P 36,327,884 P - P - P 36,327,884 Due from BSP 58,537,575 - - 58,537,575 Due from other banks 674,457,109 - - 674,457,109 Loans and other
receivables – net - - 1,436,592,651 1,436,592,651 Debt securities –
HTM financial assets 99,581,806 - - 99,581,806 Refundable deposits - - 328,013 328,013 P 868,904,374 P - P 1,436,920,664 P 2,305,825,038
Financial liabilities
Deposit liabilities P - P - P 1,899,648,831 P 1,899,648,831 Bills payable - - 200,000,000 200,000,000
Other liabilities - - 27,091,840 27,091,840
P - P - P 2,126,740,671 P 2,126,740,671
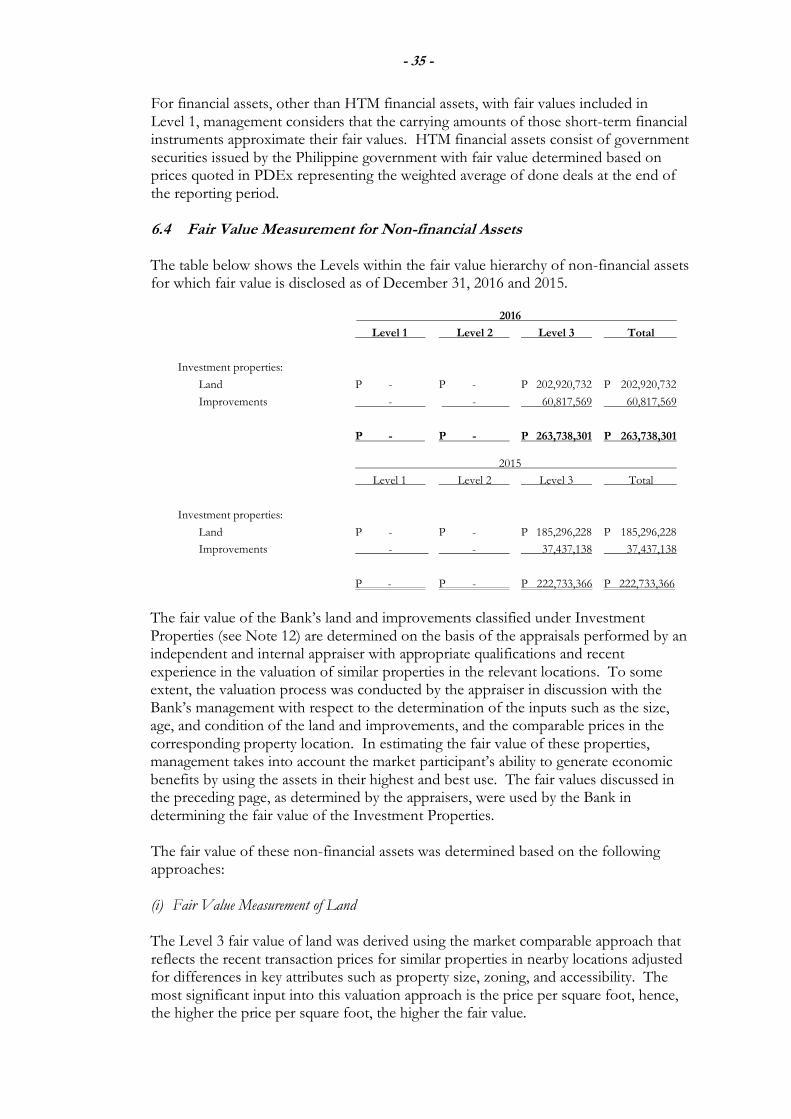
- 35 -
DRAFT As reviewed by P&A- March 10, 2017
For financial assets, other than HTM financial assets, with fair values included in Level 1, management considers that the carrying amounts of those short-term financial instruments approximate their fair values. HTM financial assets consist of government securities issued by the Philippine government with fair value determined based on prices quoted in PDEx representing the weighted average of done deals at the end of the reporting period.
6.4 Fair Value Measurement for Non-financial Assets
The table below shows the Levels within the fair value hierarchy of non-financial assets for which fair value is disclosed as of December 31, 2016 and 2015.
2016
Level 1 Level 2 Level 3 Total
Investment properties:
Land P - P - P 202,920,732 P 202,920,732
Improvements - - 60,817,569 60,817,569
P - P - P 263,738,301 P 263,738,301
2015
Level 1 Level 2 Level 3 Total
Investment properties:
Land P - P - P 185,296,228 P 185,296,228
Improvements - - 37,437,138 37,437,138
P - P - P 222,733,366 P 222,733,366
The fair value of the Bank’s land and improvements classified under Investment Properties (see Note 12) are determined on the basis of the appraisals performed by an independent and internal appraiser with appropriate qualifications and recent experience in the valuation of similar properties in the relevant locations. To some extent, the valuation process was conducted by the appraiser in discussion with the Bank’s management with respect to the determination of the inputs such as the size, age, and condition of the land and improvements, and the comparable prices in the corresponding property location. In estimating the fair value of these properties, management takes into account the market participant’s ability to generate economic benefits by using the assets in their highest and best use. The fair values discussed in the preceding page, as determined by the appraisers, were used by the Bank in determining the fair value of the Investment Properties. The fair value of these non-financial assets was determined based on the following approaches:
(i) Fair Value Measurement of Land
The Level 3 fair value of land was derived using the market comparable approach that reflects the recent transaction prices for similar properties in nearby locations adjusted for differences in key attributes such as property size, zoning, and accessibility. The most significant input into this valuation approach is the price per square foot, hence, the higher the price per square foot, the higher the fair value.

- 36 -
DRAFT As reviewed by P&A- March 10, 2017
(ii) Fair Value Measurement of Improvements The Level 3 fair value of the improvements, on the other hand, was determined using the cost approach that reflects the cost to a market participant to construct an asset of comparable usage, construction standards, design and layout, adjusted for obsolescence. The more significant inputs used in the valuation include direct and indirect costs of construction such as but not limited to, labor and contractor’s profit, materials and equipment, surveying and permit costs, electricity and utility costs, architectural and engineering fees, insurance and legal fees. These inputs were derived from various suppliers and contractor’s quotes, price catalogues, and construction price indices. Under this approach, higher estimated costs used in the valuation will result in higher fair value of the properties.
There has been no change to the valuation techniques used by the Bank during the year for its non-financial assets. Also, there were no transfers into or out of Level 3 fair value hierarchy in 2016 and 2015.
7. CASH AND DUE FROM BANGKO SENTRAL NG PILIPINAS
This account is composed of the following: Note 2016 2015
Cash and other cash items P 37,957,743 P 36,327,884 Due from BSP Mandatory reserves 14 168,436,563 57,183,769 Other than mandatory reserves 1,185,114 1,353,806 169,621,677 58,537,575
P 207,579,420 P 94,865,459 Cash consists primarily of funds in the form of Philippine currency notes and coins in the Bank’s vault and those in the possession of tellers. Other cash items include cash items (other than currency and coins on hand) such as checks drawn on other banks or that were received after the Bank’s clearing cut-off time until the close of the regular banking hours. Mandatory reserves represent the balance of the deposit account maintained with the BSP to meet reserve requirements. No interest income was recognized in 2016, 2015 and 2014 as the Due from BSP no longer bears interest.
8. DUE FROM OTHER BANKS
The breakdown of due from other banks by currency follows:
2016 2015
Philippine pesos P 692,337,508 P 674,341,066 United States dollars 148,514 116,043 P 692,486,022 P 674,457,109

- 37 -
DRAFT As reviewed by P&A- March 10, 2017
Due from other banks includes regular and time deposits with local banks. Annual interest rates on these deposits range from 0.0% to 4.0% in 2016, 2015 and 2014. Total interest income earned amounted to P11.0 million, P4.6 million and 3.0 million in 2016, 2015 and 2014, respectively, and are presented as Interest Income on Due from Other Banks in the statements of income. For statement of cash flows purposes, time deposits amounting to P56.4 million and P10.2 million as of December 31, 2016 and 2015, respectively, are not included as cash and cash equivalents since these have maturities of more than three months.
9. INVESTMENT SECURITIES
9.1 Available-for-Sale Financial Assets
This account pertains to investments in government bonds which are carried at fair market value in the statements of financial position. The Bank intends to hold these securities for sale when the need for fund arises, hence, classified as AFS financial assets.
Change in the AFS financial assets is summarized below. 2016 2015
Balance at beginning of year P 18,914,705 P 19,025,756 Additions 80,000,000 - Fair value loss ( 4,042,535) ( 111,051) Balance at end of year P 94,872,170 P 18,914,705
Interest income generated from AFS financial assets amounted to P1.3 million in 2016 and P0.7 million both in 2015 and 2014, and are shown as part of Interest Income on Investment Securities in the statements of income. Average interest rates on these investments are equivalent to 4.0% in 2016 and 3.3% per annum both in 2015 and 2014.
9.2 Held-to-Maturity Financial Assets
The maturity profile of this account, which pertains mainly to investments in government securities, is presented below.
2016 2015
Within one year P 28,000,000 P 48,000,000 Between two years and five years 56,950,000 37,000,000 Beyond five years - 9,950,000 84,950,000 94,950,000 Unamortized premium 125,835 459,108 Allowance for impairment loss ( 100,000 ) ( 100,000 ) P 84,975,835 P 95,309,108
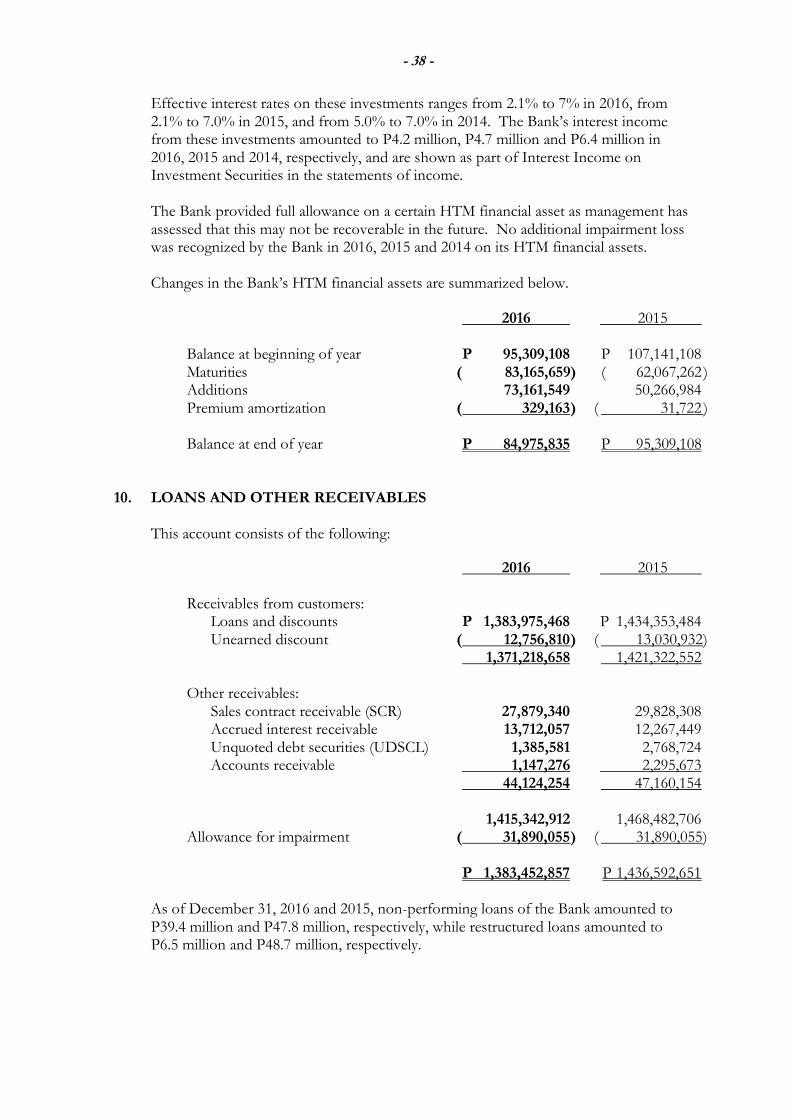
- 38 -
DRAFT As reviewed by P&A- March 10, 2017
Effective interest rates on these investments ranges from 2.1% to 7% in 2016, from 2.1% to 7.0% in 2015, and from 5.0% to 7.0% in 2014. The Bank’s interest income from these investments amounted to P4.2 million, P4.7 million and P6.4 million in 2016, 2015 and 2014, respectively, and are shown as part of Interest Income on Investment Securities in the statements of income. The Bank provided full allowance on a certain HTM financial asset as management has assessed that this may not be recoverable in the future. No additional impairment loss was recognized by the Bank in 2016, 2015 and 2014 on its HTM financial assets. Changes in the Bank’s HTM financial assets are summarized below.
2016 2015 Balance at beginning of year P 95,309,108 P 107,141,108 Maturities ( 83,165,659) ( 62,067,262 ) Additions 73,161,549 50,266,984 Premium amortization ( 329,163 ) ( 31,722 ) Balance at end of year P 84,975,835 P 95,309,108 10. LOANS AND OTHER RECEIVABLES
This account consists of the following:
2016 2015 Receivables from customers: Loans and discounts P 1,383,975,468 P 1,434,353,484
Unearned discount ( 12,756,810 ) ( 13,030,932) 1,371,218,658 1,421,322,552
Other receivables:
Sales contract receivable (SCR) 27,879,340 29,828,308 Accrued interest receivable 13,712,057 12,267,449 Unquoted debt securities (UDSCL) 1,385,581 2,768,724 Accounts receivable 1,147,276 2,295,673 44,124,254 47,160,154 1,415,342,912 1,468,482,706 Allowance for impairment ( 31,890,055 ) ( 31,890,055) P 1,383,452,857 P 1,436,592,651
As of December 31, 2016 and 2015, non-performing loans of the Bank amounted to P39.4 million and P47.8 million, respectively, while restructured loans amounted to P6.5 million and P48.7 million, respectively.
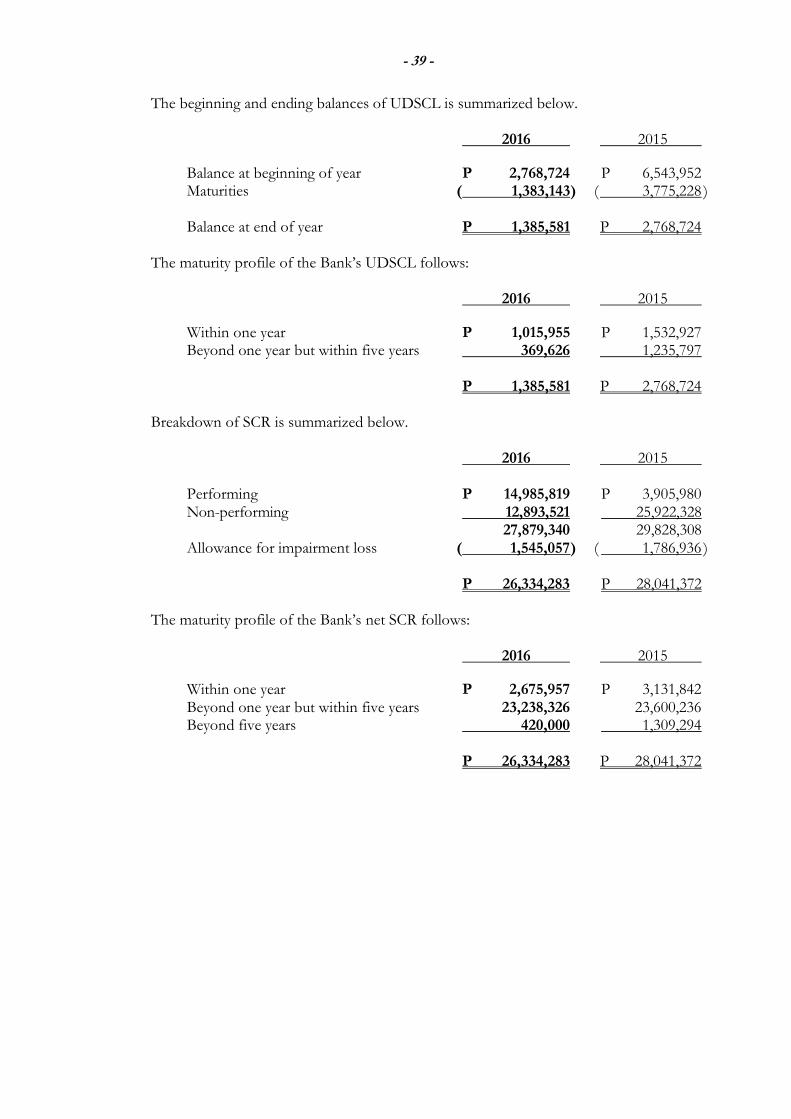
- 39 -
DRAFT As reviewed by P&A- March 10, 2017
The beginning and ending balances of UDSCL is summarized below. 2016 2015
Balance at beginning of year P 2,768,724 P 6,543,952 Maturities ( 1,383,143 ) ( 3,775,228 ) Balance at end of year P 1,385,581 P 2,768,724 The maturity profile of the Bank’s UDSCL follows:
2016 2015
Within one year P 1,015,955 P 1,532,927 Beyond one year but within five years 369,626 1,235,797 P 1,385,581 P 2,768,724
Breakdown of SCR is summarized below. 2016 2015 Performing P 14,985,819 P 3,905,980 Non-performing 12,893,521 25,922,328 27,879,340 29,828,308 Allowance for impairment loss ( 1,545,057 ) ( 1,786,936 ) P 26,334,283 P 28,041,372
The maturity profile of the Bank’s net SCR follows:
2016 2015
Within one year P 2,675,957 P 3,131,842 Beyond one year but within five years 23,238,326 23,600,236 Beyond five years 420,000 1,309,294 P 26,334,283 P 28,041,372
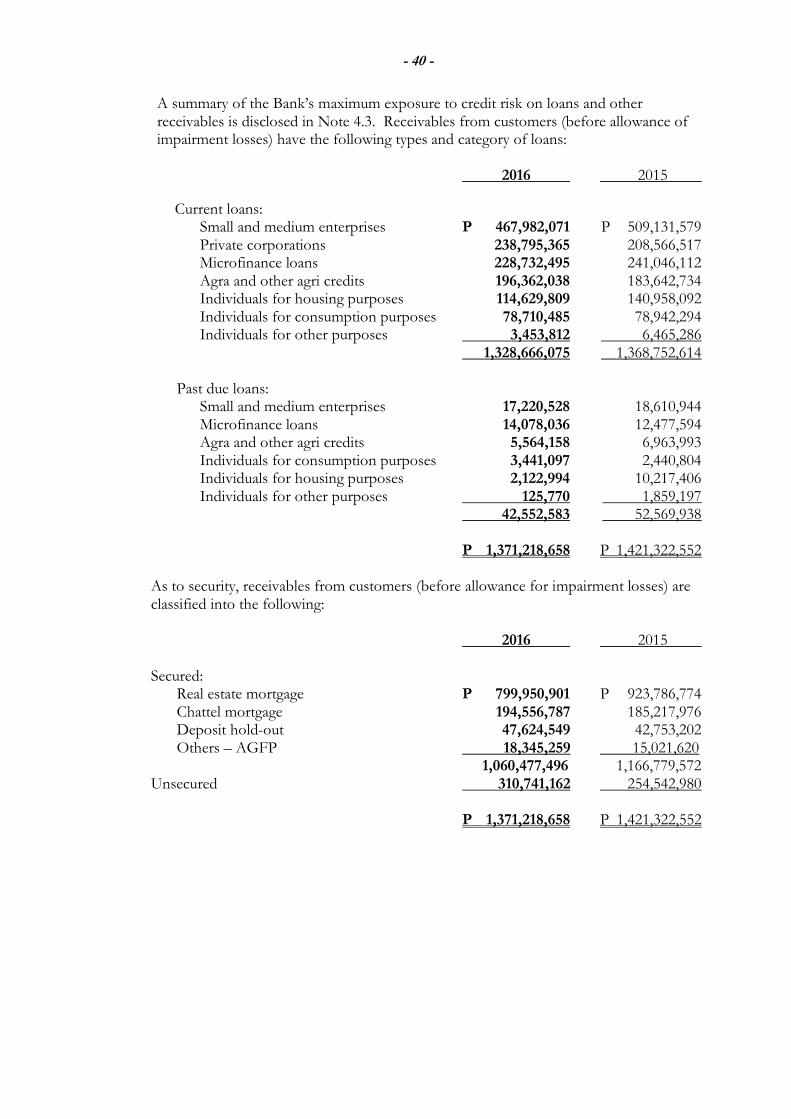
- 40 -
DRAFT As reviewed by P&A- March 10, 2017
A summary of the Bank’s maximum exposure to credit risk on loans and other receivables is disclosed in Note 4.3. Receivables from customers (before allowance of impairment losses) have the following types and category of loans:
2016 2015
Current loans: Small and medium enterprises P 467,982,071 P 509,131,579 Private corporations 238,795,365 208,566,517 Microfinance loans 228,732,495 241,046,112 Agra and other agri credits 196,362,038 183,642,734 Individuals for housing purposes 114,629,809 140,958,092 Individuals for consumption purposes 78,710,485 78,942,294 Individuals for other purposes 3,453,812 6,465,286 1,328,666,075 1,368,752,614 Past due loans: Small and medium enterprises 17,220,528 18,610,944 Microfinance loans 14,078,036 12,477,594 Agra and other agri credits 5,564,158 6,963,993 Individuals for consumption purposes 3,441,097 2,440,804 Individuals for housing purposes 2,122,994 10,217,406 Individuals for other purposes 125,770 1,859,197 42,552,583 52,569,938 P 1,371,218,658 P 1,421,322,552
As to security, receivables from customers (before allowance for impairment losses) are classified into the following:
2016 2015
Secured: Real estate mortgage P 799,950,901 P 923,786,774 Chattel mortgage 194,556,787 185,217,976 Deposit hold-out 47,624,549 42,753,202 Others – AGFP 18,345,259 15,021,620 1,060,477,496 1,166,779,572 Unsecured 310,741,162 254,542,980 P 1,371,218,658 P 1,421,322,552

- 41 -
DRAFT As reviewed by P&A- March 10, 2017
The Bank’s concentration of credit as to industry for its receivables from customers portfolio follows:
2016 2015 Wholesale and retail trade P 365,256,970 P 369,857,236 Real estate activities 236,185,736 295,476,816 Agriculture, forestry and fishing 214,444,972 209,583,830 Manufacturing 118,473,952 118,302,707 Consumption loans 84,726,389 89,707,581 Accommodation and food service activities 74,982,212 47,804,189 Administrative and support services 67,834,992 50,198,493 Transportation and storage 60,106,266 76,410,991 Construction 51,804,173 71,809,876 Education 37,433,432 23,119,128 Financial and insurance activities 13,955,525 15,285,610 Mining and quarrying 7,212,759 4,630,758 Water supply, sewerage, waste management and remediation activities 4,831,938 5,675,883 Information and communication 2,704,602 3,618,947 Professional, scientific and technical services 1,690,978 1,580,896 Arts, entertainment and recreation 1,234,783 2,140,560 Human health and social work activities 423,448 718,738 Other service activities 27,915,531 35,400,313 P 1,371,218,658 P 1,421,322,552
The maturity profile of the Bank’s receivables from customers follows:
2016 2015
Within one year P 451,189,705 P 434,635,831 Beyond one year but within five years 830,162,218 983,501,830 Beyond five years 89,866,735 3,184,891 P 1,371,218,658 P 1,421,322,552
All of the Bank’s loans and other receivables have been reviewed for indications of impairment. Certain loans and receivables were found to be impaired and provisions have been recorded accordingly. A reconciliation of allowance for impairment at the beginning and end of 2016 and 2015 is shown below.
2016 2015 Balance at beginning of year P 31,890,055 P 31,890,055 Provision for impairment losses 3,985,056 1,741,272 Write-offs ( 3,985,056) ( 1,741,272 ) Balance at end of year P 31,890,055 P 31,890,055

- 42 -
DRAFT As reviewed by P&A- March 10, 2017
In 2016, 2015 and 2014, the Bank recovered certain loans and receivables previously written-off. Such recoveries amounted to P3.0 million, P0.8 million and P0.6 million in 2016, 2015 and 2014, respectively, and are presented as net of provision for impairment losses under Impairment Losses – net account in the statements of income. Computation made by the Bank pertaining to allowance for impairment losses on loans and other receivables per BSP guidelines in 2016 and 2015 is shown below.
2016
Especially Substandard – Substandard – Mentioned Secured Unsecured Doubtful Loss Total Regular loans P 23,055,681 P 38,005,314 P 4,456,468 P 4,859,873 P 2,147,073 P 72,524,409 Specific loan loss provision on regular loans 1,150,202 3,804,123 1,114,117 2,429,936 2,147,073 10,645,451 Especially Mentioned Substandard Doubtful Loss Total Microfinance loans P 2,781,448 P 757,994 P 222,114 P 693,538 P 4,455,094
Specific loan loss provision on microfinance loans 55,629 189,498 111,057 693,538 1,049,722 Total specific loan loss provision 11,695,175 Required general loan loss provision 12,598,096 Required loan loss provision for SCR 1,545,057 Required loan loss provision for Accounts Receivable 74,126 Total required loan loss provision 25,912,454 Loan loss provision booked 31,890,055 Excess loans loss provision ( P 5,977,601)
2015
Especially Substandard – Substandard – Mentioned Secured Unsecured Doubtful Loss Total Regular loans P 22,253,611 P 82,926,152 P 484,396 P 4,382,352 P 2,334,636 P 112,381,147 Specific loan loss provision on regular loans 1,102,017 8,917,833 94,405 2,191,176 2,334,636 14,640,067
Especially Mentioned Substandard Doubtful Loss Total Microfinance loans P 3,641,475 P 721,875 P 415,312 P 1,483,481 P 6,262,143
Specific loan loss provision on microfinance loans 72,830 180,469 207,656 1,483,481 1,944,436 Total specific loan loss provision 16,584,502 Required general loan loss provision 12,722,497 Required loan loss provision for SCR 1,786,936 Required loan loss provision for Accounts Receivable 85,041 Total required loan loss provision 31,178,976 Loan loss provision booked 31,890,055 Excess loans loss provision (P 711,079 )
General loan loss provision is computed at 1.0% of the outstanding loan portfolio of the Bank net of non-risk receivables and classified loans subject to specific loan loss provision. Interest rates on receivables from customers range from 6.3% to 48.0% in 2016, 2015 and 2014. Interest rates on SCR range from 0.0% to 12.0% in 2016, from 7.0% to 15.0% in 2015, and from 0.0% to 15.0% in 2014. Interest rates on UDSCL range from 3.5% to 4.6% in 2016, 2015 and 2014. All other receivables are noninterest-bearing, unsecured and are generally payable on demand. Total interest income earned from loans and other receivables amounted to P217.8 million, P230.4 million and P211.0 million in 2016, 2015 and 2014, respectively, and are presented as Interest Income on Loans and Receivables in the statements of income.
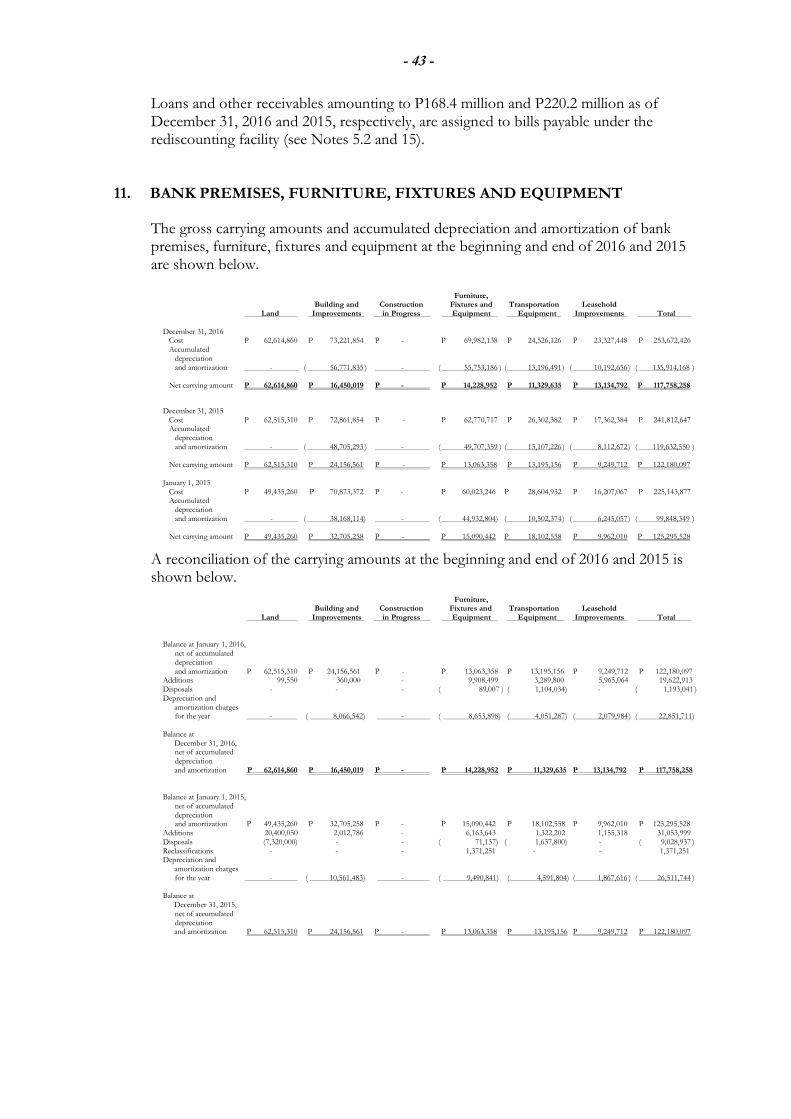
- 43 -
DRAFT As reviewed by P&A- March 10, 2017
Loans and other receivables amounting to P168.4 million and P220.2 million as of December 31, 2016 and 2015, respectively, are assigned to bills payable under the rediscounting facility (see Notes 5.2 and 15).
11. BANK PREMISES, FURNITURE, FIXTURES AND EQUIPMENT
The gross carrying amounts and accumulated depreciation and amortization of bank premises, furniture, fixtures and equipment at the beginning and end of 2016 and 2015 are shown below.
Furniture, Building and Construction Fixtures and Transportation Leasehold Land Improvements in Progress Equipment Equipment Improvements Total December 31, 2016 Cost P 62,614,860 P 73,221,854 P - P 69,982,138 P 24,526,126 P 23,327,448 P 253,672,426 Accumulated depreciation and amortization - ( 56,771,835 ) - ( 55,753,186 ) ( 13,196,491 ) ( 10,192,656 ) ( 135,914,168 )
Net carrying amount P 62,614,860 P 16,450,019 P - P 14,228,952 P 11,329,635 P 13,134,792 P 117,758,258
December 31, 2015 Cost P 62,515,310 P 72,861,854 P - P 62,770,717 P 26,302,382 P 17,362,384 P 241,812,647 Accumulated depreciation and amortization - ( 48,705,293 ) - ( 49,707,359 ) ( 13,107,226 ) ( 8,112,672 ) ( 119,632,550 )
Net carrying amount P 62,515,310 P 24,156,561 P - P 13,063,358 P 13,195,156 P 9,249,712 P 122,180,097
January 1, 2015
Cost P 49,435,260 P 70,873,372 P - P 60,023,246 P 28,604,932 P 16,207,067 P 225,143,877 Accumulated depreciation and amortization - ( 38,168,114) - ( 44,932,804) ( 10,502,374 ) ( 6,245,057 ) ( 99,848,349 ) Net carrying amount P 49,435,260 P 32,705,258 P - P 15,090,442 P 18,102,558 P 9,962,010 P 125,295,528
A reconciliation of the carrying amounts at the beginning and end of 2016 and 2015 is shown below.
Furniture, Building and Construction Fixtures and Transportation Leasehold Land Improvements in Progress Equipment Equipment Improvements Total
Balance at January 1, 2016,
net of accumulated depreciation
and amortization P 62,515,310 P 24,156,561 P - P 13,063,358 P 13,195,156 P 9,249,712 P 122,180,097 Additions 99,550 360,000 - 9,908,499 3,289,800 5,965,064 19,622,913 Disposals - - - ( 89,007 ) ( 1,104,034) - ( 1,193,041 ) Depreciation and
amortization charges for the year - ( 8,066,542) - ( 8,653,898) ( 4,051,287) ( 2,079,984 ) ( 22,851,711)
Balance at December 31, 2016, net of accumulated
depreciation and amortization P 62,614,860 P 16,450,019 P - P 14,228,952 P 11,329,635 P 13,134,792 P 117,758,258
Balance at January 1, 2015,
net of accumulated depreciation
and amortization P 49,435,260 P 32,705,258 P - P 15,090,442 P 18,102,558 P 9,962,010 P 125,295,528 Additions 20,400,050 2,012,786 - 6,163,643 1,322,202 1,155,318 31,053,999 Disposals (7,320,000) - - ( 71,137) ( 1,637,800) - ( 9,028,937 ) Reclassifications - - - 1,371,251 - - 1,371,251 Depreciation and
amortization charges for the year - ( 10,561,483) - ( 9,490,841) ( 4,591,804) ( 1,867,616 ) ( 26,511,744 )
Balance at December 31, 2015, net of accumulated
depreciation and amortization P 62,515,310 P 24,156,561 P - P 13,063,358 P 13,195,156 P 9,249,712 P 122,180,097
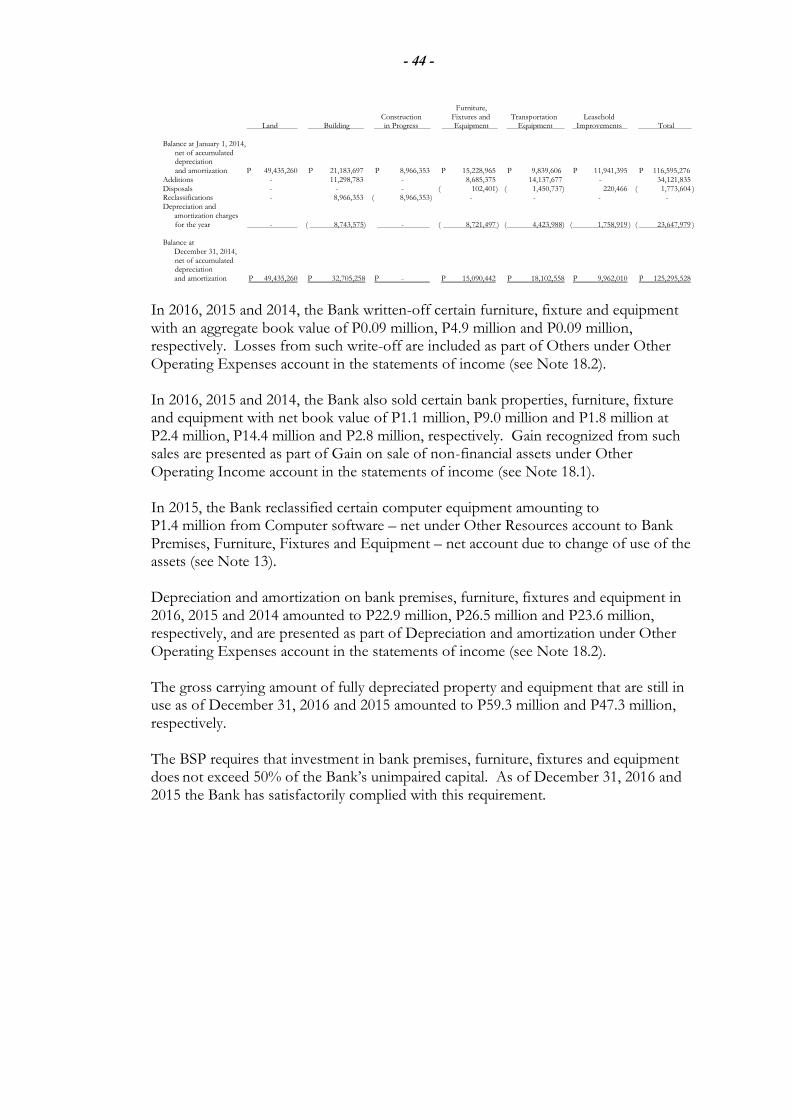
- 44 -
DRAFT As reviewed by P&A- March 10, 2017
Furniture, Construction Fixtures and Transportation Leasehold Land Building in Progress Equipment Equipment Improvements Total Balance at January 1, 2014,
net of accumulated depreciation
and amortization P 49,435,260 P 21,183,697 P 8,966,353 P 15,228,965 P 9,839,606 P 11,941,395 P 116,595,276 Additions - 11,298,783 - 8,685,375 14,137,677 - 34,121,835 Disposals - - - ( 102,401) ( 1,450,737) 220,466 ( 1,773,604 ) Reclassifications - 8,966,353 ( 8,966,353 ) - - - - Depreciation and
amortization charges for the year - ( 8,743,575) - ( 8,721,497 ) ( 4,423,988) ( 1,758,919 ) ( 23,647,979 )
Balance at December 31, 2014, net of accumulated
depreciation and amortization P 49,435,260 P 32,705,258 P - P 15,090,442 P 18,102,558 P 9,962,010 P 125,295,528
In 2016, 2015 and 2014, the Bank written-off certain furniture, fixture and equipment with an aggregate book value of P0.09 million, P4.9 million and P0.09 million, respectively. Losses from such write-off are included as part of Others under Other Operating Expenses account in the statements of income (see Note 18.2). In 2016, 2015 and 2014, the Bank also sold certain bank properties, furniture, fixture and equipment with net book value of P1.1 million, P9.0 million and P1.8 million at P2.4 million, P14.4 million and P2.8 million, respectively. Gain recognized from such sales are presented as part of Gain on sale of non-financial assets under Other Operating Income account in the statements of income (see Note 18.1). In 2015, the Bank reclassified certain computer equipment amounting to P1.4 million from Computer software – net under Other Resources account to Bank Premises, Furniture, Fixtures and Equipment – net account due to change of use of the assets (see Note 13). Depreciation and amortization on bank premises, furniture, fixtures and equipment in 2016, 2015 and 2014 amounted to P22.9 million, P26.5 million and P23.6 million, respectively, and are presented as part of Depreciation and amortization under Other Operating Expenses account in the statements of income (see Note 18.2). The gross carrying amount of fully depreciated property and equipment that are still in use as of December 31, 2016 and 2015 amounted to P59.3 million and P47.3 million, respectively. The BSP requires that investment in bank premises, furniture, fixtures and equipment does not exceed 50% of the Bank’s unimpaired capital. As of December 31, 2016 and 2015 the Bank has satisfactorily complied with this requirement.
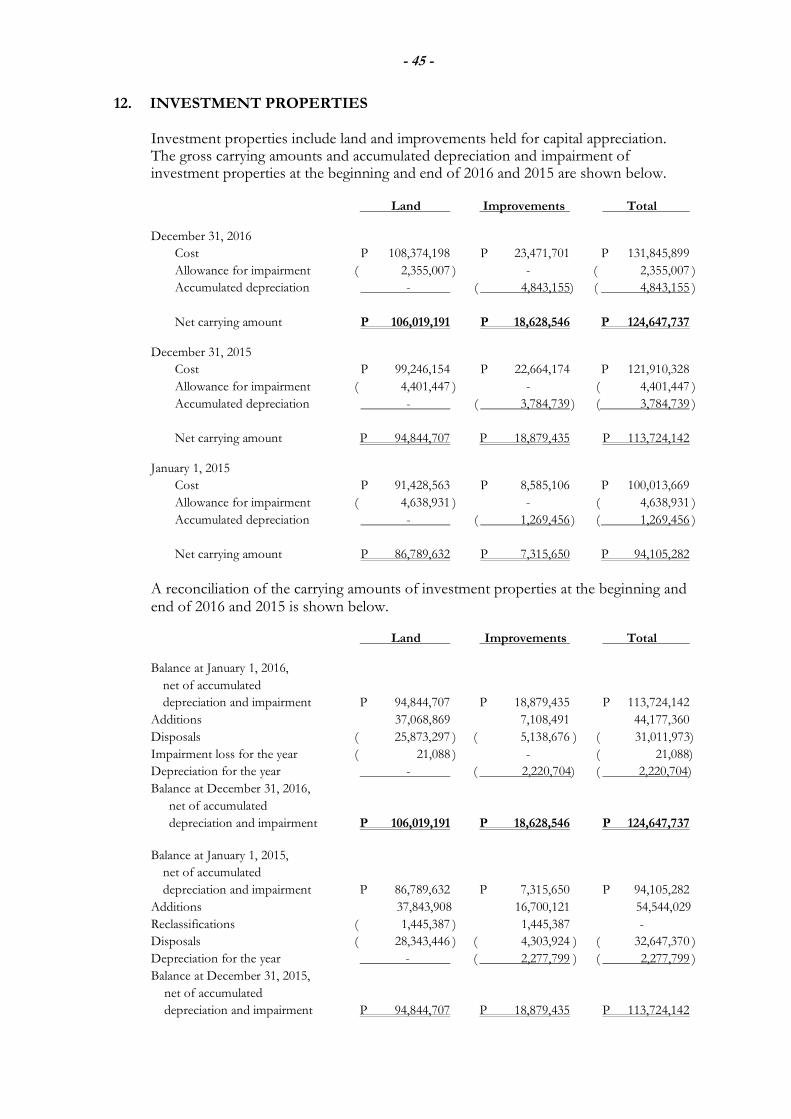
- 45 -
DRAFT As reviewed by P&A- March 10, 2017
12. INVESTMENT PROPERTIES
Investment properties include land and improvements held for capital appreciation. The gross carrying amounts and accumulated depreciation and impairment of investment properties at the beginning and end of 2016 and 2015 are shown below.
Land Improvements Total December 31, 2016
Cost P 108,374,198 P 23,471,701 P 131,845,899
Allowance for impairment ( 2,355,007 ) - ( 2,355,007 )
Accumulated depreciation - ( 4,843,155) ( 4,843,155 )
Net carrying amount P 106,019,191 P 18,628,546 P 124,647,737 December 31, 2015
Cost P 99,246,154 P 22,664,174 P 121,910,328
Allowance for impairment ( 4,401,447 ) - ( 4,401,447 )
Accumulated depreciation - ( 3,784,739 ) ( 3,784,739 )
Net carrying amount P 94,844,707 P 18,879,435 P 113,724,142
January 1, 2015
Cost P 91,428,563 P 8,585,106 P 100,013,669
Allowance for impairment ( 4,638,931 ) - ( 4,638,931 )
Accumulated depreciation - ( 1,269,456 ) ( 1,269,456 )
Net carrying amount P 86,789,632 P 7,315,650 P 94,105,282
A reconciliation of the carrying amounts of investment properties at the beginning and end of 2016 and 2015 is shown below.
Land Improvements Total Balance at January 1, 2016,
net of accumulated
depreciation and impairment P 94,844,707 P 18,879,435 P 113,724,142
Additions 37,068,869 7,108,491 44,177,360
Disposals ( 25,873,297 ) ( 5,138,676 ) ( 31,011,973)
Impairment loss for the year ( 21,088 ) - ( 21,088)
Depreciation for the year - ( 2,220,704) ( 2,220,704)
Balance at December 31, 2016,
net of accumulated
depreciation and impairment P 106,019,191 P 18,628,546 P 124,647,737
Balance at January 1, 2015,
net of accumulated
depreciation and impairment P 86,789,632 P 7,315,650 P 94,105,282
Additions 37,843,908 16,700,121 54,544,029
Reclassifications ( 1,445,387 ) 1,445,387 -
Disposals ( 28,343,446 ) ( 4,303,924 ) ( 32,647,370 )
Depreciation for the year - ( 2,277,799 ) ( 2,277,799 )
Balance at December 31, 2015,
net of accumulated
depreciation and impairment P 94,844,707 P 18,879,435 P 113,724,142

- 46 -
DRAFT As reviewed by P&A- March 10, 2017
Land Improvements Total
Balance at January 1, 2014,
net of accumulated
depreciation and impairment P 116,632,808 P 4,258,818 P 120,891,626
Additions 6,675,862 7,416,026 14,091,888
Reclassifications ( 528,075 ) 528,075 -
Disposals ( 35,990,963 ) ( 4,404,485 ) ( 40,395,448 )
Depreciation for the year - ( 482,784 ) ( 482,784 )
Balance at December 31, 2014,
net of accumulated
depreciation and impairment P 86,789,632 P 7,315,650 P 94,105,282
Depreciation on investment properties in 2016, 2015 and 2014 amounted to P2.2 million, P2.3 million and P0.5 million, respectively, and are presented as part of Depreciation and amortization under Other Operating Expenses account in the statements of income (see Note 18.2). The recoverable amount of the Bank’s investment properties used in determining the impairment losses to be recognized as of December 31, 2016 and 2015 was based on value in use computed through discounted cash flows method at nominal rate of 4.7% and 3.9% in 2016 and 2015, respectively, on a pretax basis. Fair value of the Bank’s investment properties in 2016 and 2015 amounted to P263.7 million and P222.7 million, respectively (see Note 6.4). In 2016, 2015 and 2014, gains on sale of investment properties amounted to P27.0 million, P17.1 million and P18.6 million, respectively, and are presented as part of Gain on sale of non-financial assets under Other Operating Income in the statements of income (see Note 18.1).
13. OTHER RESOURCES
This account consists of the following as of December 31: Notes 2016 2015 Computer software - net P 14,702,164 P 16,784,398 Deferred tax assets - net 20 14,065,925 14,869,384 Prepaid expenses 4,400,006 3,163,615 Office supplies 2,230,927 - Refundable deposits 381,435 328,013 Retirement benefit asset 19.2 337,129 - Miscellaneous 5,035,911 4,305,234 P 41,153,497 P 39,450,644

- 47 -
DRAFT As reviewed by P&A- March 10, 2017
Movements of computer software is shown below.
Notes 2016 2015 Balance at beginning of year P 16,784,398 P 20,415,528 Additions 2,657,919 2,105,845 Amortization 18.2 ( 4,740,153 ) ( 4,365,724 ) Reclassifications 11 - ( 1,371,251) Balance at end of year P 14,702,164 P 16,784,398
14. DEPOSIT LIABILITIES
The breakdown of deposit liabilities per classification follows:
2016 2015 Savings P 1,526,401,518 P 1,329,836,172 Time 565,951,913 560,097,458 Demand 13,103,613 9,715,201 P 2,105,457,044 P 1,899,648,831
Deposit liabilities are in the form of savings and time deposits with annual interest rates ranging from 0.3% to 7.0% in 2016 and from 0.4% to 7.0% per annum both in 2015 and 2014. Demand deposits, on the other hand, do not bear interest. Interest expense incurred on deposit liabilities amounted to P11.7 million, 11.4 million and P12.7 million in 2016, 2015 and 2014, respectively, and these are presented as Interest Expense on Deposit Liabilities in the statements of income. Interest payable as of December 31, 2016 and 2015 amounted to P5.9 million and P4.7 million, respectively, and are presented as part of Accrued interest payable under Other Liabilities account in the statements of financial position (see Note 16).
Under existing BSP regulations, deposit liabilities are subject to regular and liquidity reserve of 8% for demand, savings and time deposit in 2016 and 5% for demand and 3% for savings and time in 2015. The Bank is in compliance with these BSP regulations as of the end of each reporting period (see Note 7). The maturity profile of deposit liabilities as of December 31 is shown below.
2016 2015 Within one year P 2,051,658,644 P 1,833,570,431 Beyond one year but less than five years 47,798,400 57,678,400 Beyond five years 6,000,000 8,400,000 P 2,105,457,044 P 1,899,648,831

- 48 -
DRAFT As reviewed by P&A- March 10, 2017
15. BILLS PAYABLE
Bills payable pertain to the Bank’s borrowed funds, which consist of obligations of the Bank arising from availment of rediscounting facilities from government banks, with annual interest rate ranging from 2.75% to 4.0% in 2016 and from 3.0% to 4.0% both in 2015 and 2014. These payables have remaining maturities of less than one month both in 2016 and 2015. Interest expense, including amortization of discount, on bills payable amounted to P0.1 million, P0.2 million and P0.5 million in 2016, 2015 and 2014, respectively, and are presented as Interest Expense on Bills Payable in the statements of income. Interest, which remained unpaid as of December 31, 2016 and 2015 amounted to P0.003 million and P0.04 million, respectively, and are presented as part of Accrued interest payable under Other Liabilities account in the statements of financial position (see Note 16). Bills payable are collateralized by the assignment of certain loans and other receivables amounting to P168.4 million and P220.2 million as of December 31, 2016 and 2015, respectively (see Notes 5.2 and 10).
16. OTHER LIABILITIES
This account consists of: Notes 2016 2015 Accrued expenses P 8,668,015 P 8,456,888 Accrued interest payable 14, 15 5,900,351 4,731,742 Income tax payable 2,200,214 5,736,806 Withholding taxes payable 1,702,933 1,803,699 Gross receipts tax payable 1,680,181 1,366,101 Dividends payable 17.3 635,652 532,818 Retirement benefit obligation 19.2 - 5,544,873 Others 6,475,875 7,892,179 P 27,263,221 P 36,065,106 17. EQUITY
17.1 Capital Management Objectives, Policies and Procedures
The Bank’s policy is to maintain a strong capital base to maintain investor, creditor and market confidence and to sustain future development of the business. The impact of the level of capital on shareholder’s return is regularly accounted for and the Bank recognizes the need to maintain a balance between the higher returns that might be possible with greater gearing, and the advantages and security afforded through a sound capital position.

- 49 -
DRAFT As reviewed by P&A- March 10, 2017
(a) Unimpaired Capital
Under current banking regulations, the qualifying capital accounts of the Bank should not be less than the amount equal to ten percent (10%) of its risk-weighted assets. The qualifying capital of the Bank (for purposes of determining the capital-to-risk assets ratio) is total capital funds excluding:
Unbooked valuation reserves and other capital adjustments as may be required by the BSP;
Total outstanding unsecured credit accommodations to DOSRI;
Deferred tax assets;
Goodwill, if any;
Sinking fund for redemption of redeemable preferred shares; and,
Other regulatory deductions.
Risk assets consist of designated market risk and total risk-weighted assets after exclusion of cash on hand, due from BSP, loans covered by hold-out on or assignment of deposits, loans or acceptances under letters or credit to the extent covered by margin deposits, and other non-risk items as determined by the Monetary Board of the BSP. The amount of surplus funds available for dividend declaration is determined also on the basis of regulatory net worth after considering certain adjustments. Under the relevant BSP regulations, the regulatory capital is analyzed into two tiers which are Tier 1 Capital plus Tier 2 Capital less allowable deductions from the total of Tier 1 and Tier 2 capital.
Tier 1 Capital and Tier 2 Capital are defined as follows: (a) Tier 1 Capital includes the following:
a. paid-up common stock; b. surplus and surplus reserves; and, c. undivided profits (for domestic banks only). Subject to deductions for: a. treasury shares (if any); b. unrealized losses on underwritten listed equity securities purchased; c. unbooked valuation reserves, and other capital adjustments based on the
latest BSP report of examination; d. outstanding unsecured credit accommodations, both direct and indirect, to
DOSRI; e. goodwill; and, f. deferred income tax
(b) Tier 2 Capital includes: a. appraisal increment reserve – bank premises if any, as authorized by the
Monetary Board of the BSP; and, b. general loan loss provision, limited to a maximum of 1.0% of credit
risk-weighted assets.
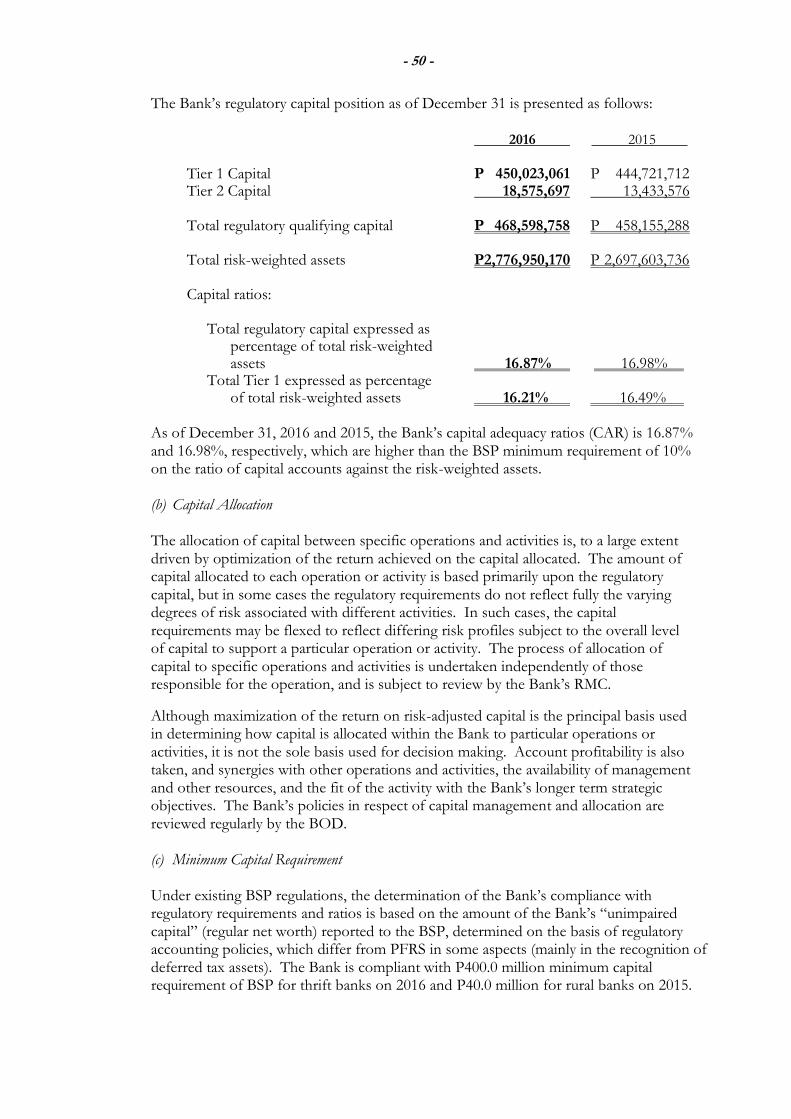
- 50 -
DRAFT As reviewed by P&A- March 10, 2017
The Bank’s regulatory capital position as of December 31 is presented as follows:
2016 2015
Tier 1 Capital P 450,023,061 P 444,721,712 Tier 2 Capital 18,575,697 13,433,576 Total regulatory qualifying capital P 468,598,758 P 458,155,288 Total risk-weighted assets P2,776,950,170 P 2,697,603,736 Capital ratios: Total regulatory capital expressed as percentage of total risk-weighted assets 16.87% 16.98% Total Tier 1 expressed as percentage of total risk-weighted assets 16.21% 16.49%
As of December 31, 2016 and 2015, the Bank’s capital adequacy ratios (CAR) is 16.87% and 16.98%, respectively, which are higher than the BSP minimum requirement of 10% on the ratio of capital accounts against the risk-weighted assets.
(b) Capital Allocation The allocation of capital between specific operations and activities is, to a large extent driven by optimization of the return achieved on the capital allocated. The amount of capital allocated to each operation or activity is based primarily upon the regulatory capital, but in some cases the regulatory requirements do not reflect fully the varying degrees of risk associated with different activities. In such cases, the capital requirements may be flexed to reflect differing risk profiles subject to the overall level of capital to support a particular operation or activity. The process of allocation of capital to specific operations and activities is undertaken independently of those responsible for the operation, and is subject to review by the Bank’s RMC.
Although maximization of the return on risk-adjusted capital is the principal basis used in determining how capital is allocated within the Bank to particular operations or activities, it is not the sole basis used for decision making. Account profitability is also taken, and synergies with other operations and activities, the availability of management and other resources, and the fit of the activity with the Bank’s longer term strategic objectives. The Bank’s policies in respect of capital management and allocation are reviewed regularly by the BOD.
(c) Minimum Capital Requirement
Under existing BSP regulations, the determination of the Bank’s compliance with regulatory requirements and ratios is based on the amount of the Bank’s “unimpaired capital” (regular net worth) reported to the BSP, determined on the basis of regulatory accounting policies, which differ from PFRS in some aspects (mainly in the recognition of deferred tax assets). The Bank is compliant with P400.0 million minimum capital requirement of BSP for thrift banks on 2016 and P40.0 million for rural banks on 2015.
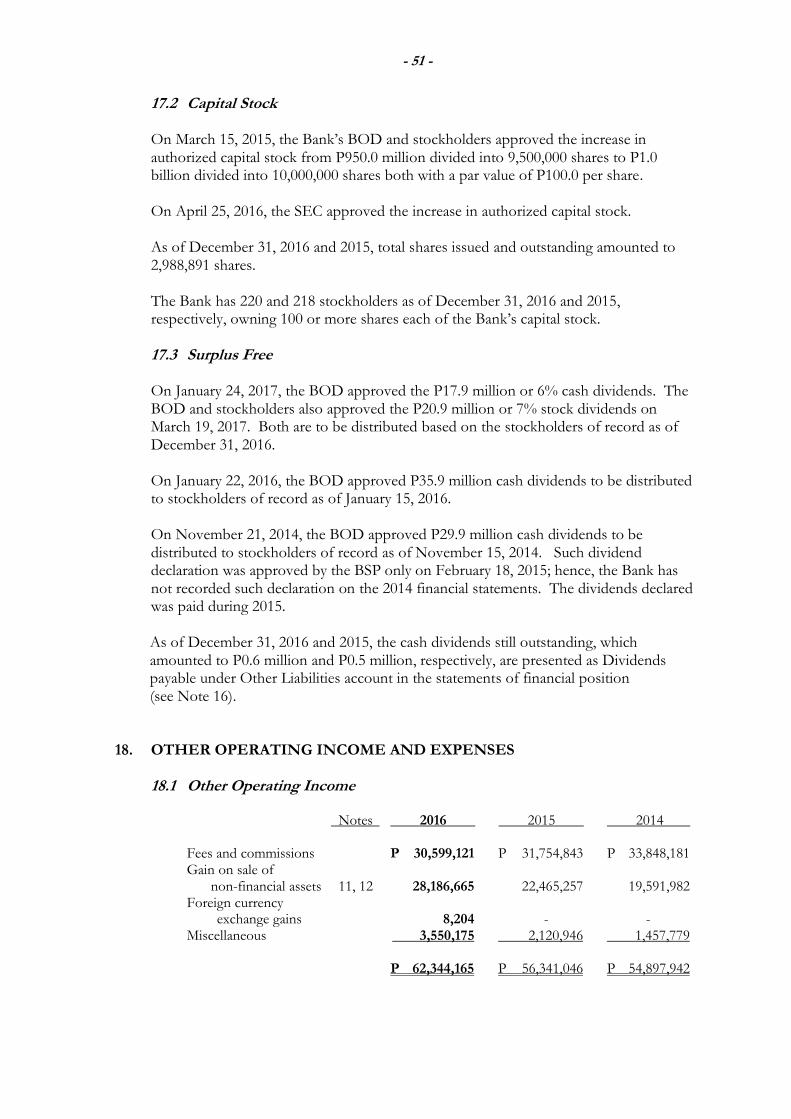
- 51 -
DRAFT As reviewed by P&A- March 10, 2017
17.2 Capital Stock On March 15, 2015, the Bank’s BOD and stockholders approved the increase in authorized capital stock from P950.0 million divided into 9,500,000 shares to P1.0 billion divided into 10,000,000 shares both with a par value of P100.0 per share. On April 25, 2016, the SEC approved the increase in authorized capital stock. As of December 31, 2016 and 2015, total shares issued and outstanding amounted to 2,988,891 shares. The Bank has 220 and 218 stockholders as of December 31, 2016 and 2015, respectively, owning 100 or more shares each of the Bank’s capital stock.
17.3 Surplus Free
On January 24, 2017, the BOD approved the P17.9 million or 6% cash dividends. The BOD and stockholders also approved the P20.9 million or 7% stock dividends on March 19, 2017. Both are to be distributed based on the stockholders of record as of December 31, 2016.
On January 22, 2016, the BOD approved P35.9 million cash dividends to be distributed to stockholders of record as of January 15, 2016.
On November 21, 2014, the BOD approved P29.9 million cash dividends to be distributed to stockholders of record as of November 15, 2014. Such dividend declaration was approved by the BSP only on February 18, 2015; hence, the Bank has not recorded such declaration on the 2014 financial statements. The dividends declared was paid during 2015.
As of December 31, 2016 and 2015, the cash dividends still outstanding, which amounted to P0.6 million and P0.5 million, respectively, are presented as Dividends payable under Other Liabilities account in the statements of financial position (see Note 16).
18. OTHER OPERATING INCOME AND EXPENSES
18.1 Other Operating Income
Notes 2016 2015 2014 Fees and commissions P 30,599,121 P 31,754,843 P 33,848,181 Gain on sale of non-financial assets 11, 12 28,186,665 22,465,257 19,591,982 Foreign currency exchange gains 8,204 - - Miscellaneous 3,550,175 2,120,946 1,457,779 P 62,344,165 P 56,341,046 P 54,897,942
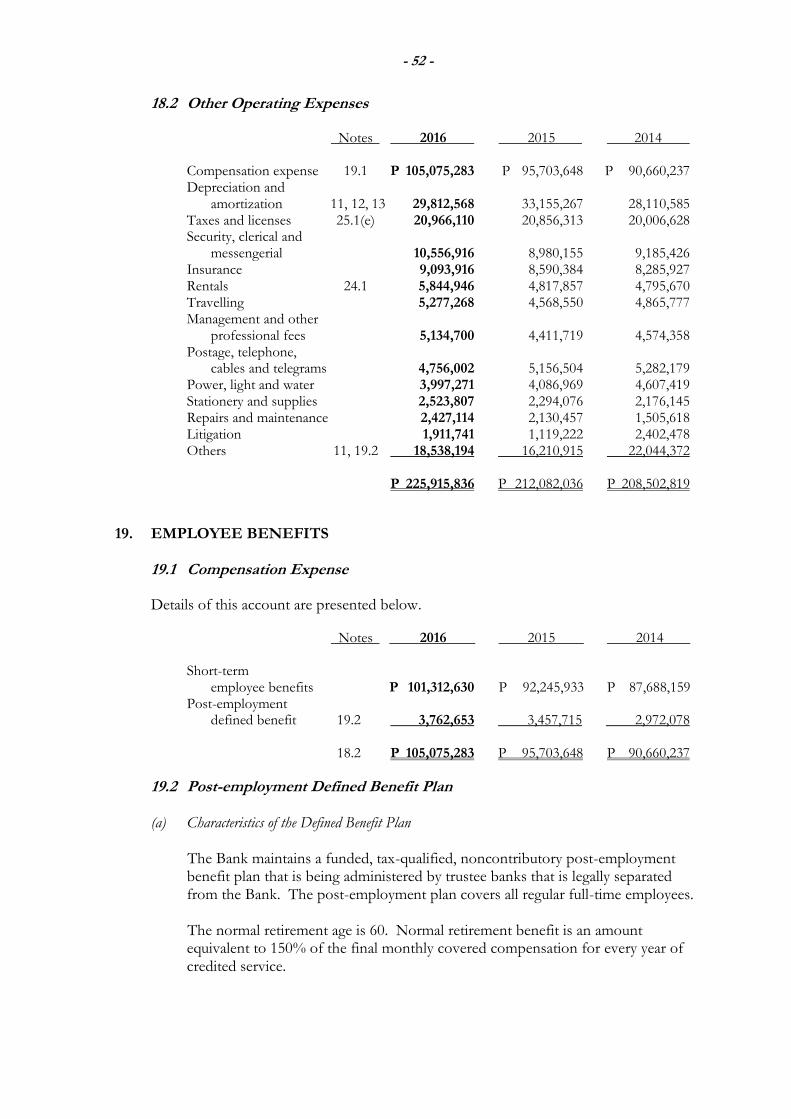
- 52 -
DRAFT As reviewed by P&A- March 10, 2017
18.2 Other Operating Expenses Notes 2016 2015 2014 Compensation expense 19.1 P 105,075,283 P 95,703,648 P 90,660,237 Depreciation and amortization 11, 12, 13 29,812,568 33,155,267 28,110,585 Taxes and licenses 25.1(e) 20,966,110 20,856,313 20,006,628 Security, clerical and messengerial 10,556,916 8,980,155 9,185,426 Insurance 9,093,916 8,590,384 8,285,927 Rentals 24.1 5,844,946 4,817,857 4,795,670 Travelling 5,277,268 4,568,550 4,865,777 Management and other professional fees 5,134,700 4,411,719 4,574,358 Postage, telephone, cables and telegrams 4,756,002 5,156,504 5,282,179 Power, light and water 3,997,271 4,086,969 4,607,419 Stationery and supplies 2,523,807 2,294,076 2,176,145 Repairs and maintenance 2,427,114 2,130,457 1,505,618 Litigation 1,911,741 1,119,222 2,402,478 Others 11, 19.2 18,538,194 16,210,915 22,044,372 P 225,915,836 P 212,082,036 P 208,502,819
19. EMPLOYEE BENEFITS
19.1 Compensation Expense
Details of this account are presented below. Notes 2016 2015 2014 Short-term employee benefits P 101,312,630 P 92,245,933 P 87,688,159 Post-employment defined benefit 19.2 3,762,653 3,457,715 2,972,078 18.2 P 105,075,283 P 95,703,648 P 90,660,237
19.2 Post-employment Defined Benefit Plan
(a) Characteristics of the Defined Benefit Plan The Bank maintains a funded, tax-qualified, noncontributory post-employment benefit plan that is being administered by trustee banks that is legally separated from the Bank. The post-employment plan covers all regular full-time employees. The normal retirement age is 60. Normal retirement benefit is an amount equivalent to 150% of the final monthly covered compensation for every year of credited service.

- 53 -
DRAFT As reviewed by P&A- March 10, 2017
(b) Explanation of Amounts Presented in the Financial Statements
Actuarial valuations are made annually to update the retirement benefit costs and the amount of contributions. All amounts presented below are based on the actuarial valuation reports obtained from an independent actuary in 2016 and 2015. The amounts of retirement benefit asset (obligation) recognized as part of Other Resources – net account and Other Liabilities account in the 2016 and 2015 statements of financial position, respectively, are determined as follows (see Notes 13 and 16):
2016 2015 Fair value of plan assets P 43,752,836 P 41,622,344 Present value of the obligation ( 43,397,569 ) ( 47,167,217 ) 355,267 ( 5,544,873 ) Unrecognized asset due to effect of asset ceiling limit ( 18,138 ) - P 337,129 ( P 5,544,873 )
The movements in the present value of the defined benefit obligation recognized in the financial statements are as follows:
2016 2015 Balance at beginning of year P 47,167,217 P 39,859,879 Current service cost 3,762,653 3,457,715 Interest expense 2,306,477 1,789,709 Remeasurements of actuarial losses (gains) arising from: Changes in financial assumptions ( 3,097,263) 2,563,792 Experience adjustments ( 1,251,274) ( 2,976,039 ) Changes in demographic assumptions ( 577,441) 2,642,042 Benefits paid ( 4,912,800) ( 994,375 ) Balance at end of year P 43,397,569 P 47,167,217

- 54 -
DRAFT As reviewed by P&A- March 10, 2017
The movements in the fair value of plan assets are presented below. 2016 2015 Balance at beginning of year P 41,622,344 P 42,087,567 Interest income 2,050,787 1,867,408 Loss on plan assets (excluding amounts included in net interest) ( 552,368) ( 1,338,256 ) Actual contributions 5,544,873 - Benefits paid ( 4,912,800 ) ( 994,375 ) Balance at end of year P 43,752,836 P 41,622,344
The composition of the fair value of plan assets at the end of the reporting period by category and risk characteristics is shown below. 2016 2015
Cash and cash equivalents P 12,068,494 P 1,112,599 Debt Instruments: Government bonds 23,620,191 25,600,000 Other bonds 48,420 1,509,596 Accrued interest receivable 81,382 103,798 Investment in Unit Investment Trust Fund (UITF) 6,717,962 10,236,819 Mutual funds - 2,179,130 Others (market gains/losses, etc.) 1,270,559 929,524 43,807,008 41,671,466 Accountabilities ( 54,172) ( 49,122 ) P 43,752,836 P 41,622,344
The fair values of the above debt securities and mutual funds are determined based on quoted market prices in active markets (classified as Level 1 of the fair value hierarchy). The Company’s investments in UITF as of December 31, 2016 is classified under Level 2. The plan assets earned a return of P1.5 million, P0.5 million and P1.3 million in 2016, 2015 and 2014, respectively. Plan assets do not comprise any of the Bank’s own financial instruments or any of its assets occupied and/or used in its operations.

- 55 -
DRAFT As reviewed by P&A- March 10, 2017
The components of amounts recognized in profit or loss and in other comprehensive income in respect of the defined benefit post-employment plan are as follows:
2016 2015 2014 Reported in profit or loss: Current service cost P 3,762,653 P 3,457,715 P 2,972,078 Net interest income 255,690 ( 77,699 ) ( 278,138 ) Interest expense on asset ceiling - 4,298 20,885 P 4,018,343 P 3,384,314 P 2,714,825
Reported in other comprehensive income: Actuarial gains arising from changes in: Experience adjustments ( P 1,251,274 ) P 2,976,039 (P 4,579,179 ) Changes in demographic assumptions ( 577,441 ) 2,642,042 22,411 Financial assumptions ( 3,097,263 ) ( 2,563,792) 4,203,692 Effect of asset ceiling test 18,138 ( 100,023 ) ( 317,741 ) Return on plan assets (excluding amounts included in net interest expense) 552,368 1,338,255 865,633 ( P 4,355,472 ) P 4,292,521 P 194,816
Current service cost and net interest expense (income) (includes the net interest expense on asset ceiling) are presented as part Compensation expense and Others under Other Operating Expenses and Interest Income – Others, respectively, in the statements of income (see Note 18.2).
Amounts recognized in other comprehensive income were included within item that will not be reclassified subsequently to profit or loss.
In determining the amounts of the defined benefit post-employment obligation, the following significant actuarial assumptions were used:
2016 2015 2014 Discount rates 5.5% 4.9% 4.5% Expected rate of salary increases 7.5% 7.5% 7.5%
- 56 -
DRAFT As reviewed by P&A- March 10, 2017
Assumptions regarding future mortality experience are based on published statistics and mortality tables. The average remaining working lives of an individual retiring at the age of 60 is 27.8 years for both males and females. These assumptions were developed by management with the assistance of an independent actuary. Discount factors are determined close to the end of each reporting period by reference to the interest rates of a zero coupon government bond with terms to maturity approximating the terms of the post-employment obligation. Other assumptions are based on current actuarial benchmarks and management’s historical experience.
(c) Risks Associated with the Retirement Plan
The plan exposes the Bank to actuarial risks such as investment risk, interest rate risk, longevity risk and salary risk.
(d) Investment and Interest Risks
The present value of the defined benefit obligation is calculated using a discount rate determined by reference to market yields of government bonds. Generally, a decrease in the interest rate of a reference government bond will increase the plan obligation. However, this will be partially offset by an increase in the return on the plan’s investments in debt securities and if the return on plan asset falls below this rate, it will create a deficit in the plan. Currently, the plan assets is concentrated on investment in debt securities and UITF. Due to the long-term nature of the plan obligation, a level of continuing debt and UITF investments is an appropriate element of the Bank’s long-term strategy to manage the plan efficiently.
(e) Longevity and Salary Risks
The present value of the defined benefit obligation is calculated by reference to the best estimate of the mortality of the plan participants both during and after their employment, and to their future salaries. Consequently, increases in the life expectancy and salary of the plan participants will result in an increase in the plan obligation.
(f) Other Information
The information on the sensitivity analysis for certain significant actuarial assumptions, the Bank’s asset-liability matching strategy, and the timing and uncertainty of future cash flows related to the retirement plan are described in the succeeding page.
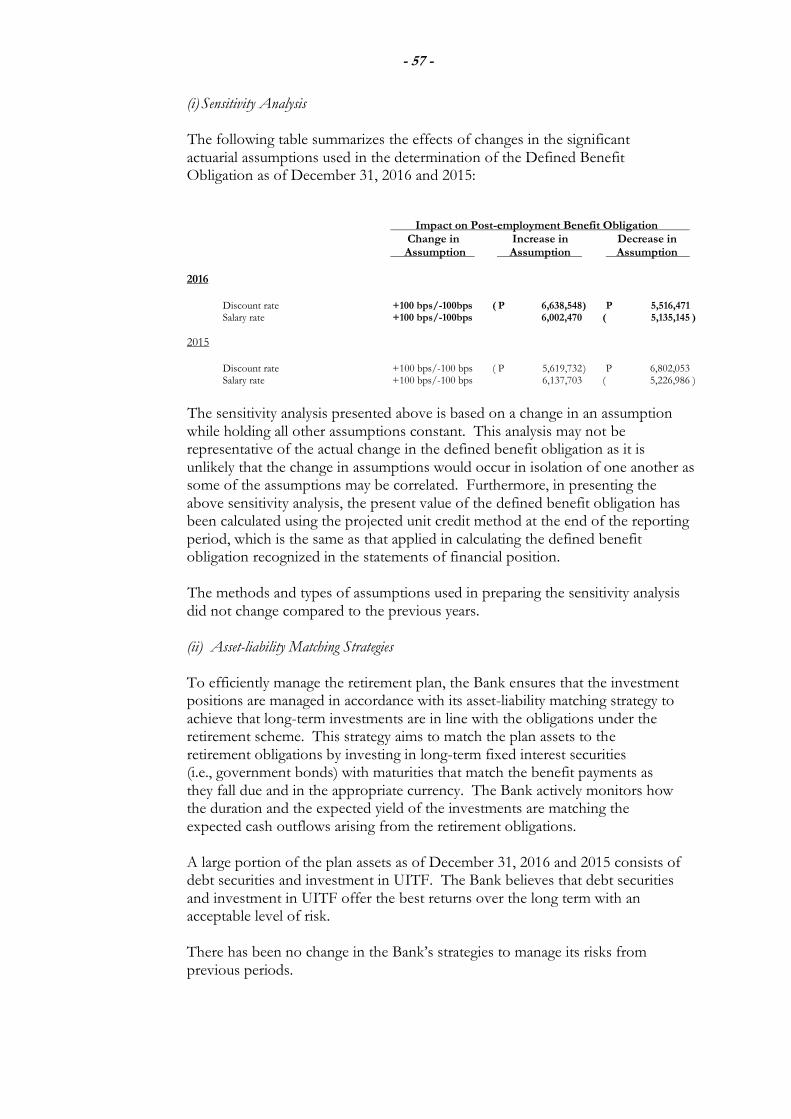
- 57 -
DRAFT As reviewed by P&A- March 10, 2017
(i) Sensitivity Analysis
The following table summarizes the effects of changes in the significant actuarial assumptions used in the determination of the Defined Benefit Obligation as of December 31, 2016 and 2015:
Impact on Post-employment Benefit Obligation
Change in Increase in Decrease in Assumption Assumption Assumption 2016 Discount rate +100 bps/-100bps ( P 6,638,548 ) P 5,516,471 Salary rate +100 bps/-100bps 6,002,470 ( 5,135,145 )
2015
Discount rate +100 bps/-100 bps ( P 5,619,732 ) P 6,802,053 Salary rate +100 bps/-100 bps 6,137,703 ( 5,226,986 )
The sensitivity analysis presented above is based on a change in an assumption while holding all other assumptions constant. This analysis may not be representative of the actual change in the defined benefit obligation as it is unlikely that the change in assumptions would occur in isolation of one another as some of the assumptions may be correlated. Furthermore, in presenting the above sensitivity analysis, the present value of the defined benefit obligation has been calculated using the projected unit credit method at the end of the reporting period, which is the same as that applied in calculating the defined benefit obligation recognized in the statements of financial position.
The methods and types of assumptions used in preparing the sensitivity analysis did not change compared to the previous years.
(ii) Asset-liability Matching Strategies
To efficiently manage the retirement plan, the Bank ensures that the investment positions are managed in accordance with its asset-liability matching strategy to achieve that long-term investments are in line with the obligations under the retirement scheme. This strategy aims to match the plan assets to the retirement obligations by investing in long-term fixed interest securities (i.e., government bonds) with maturities that match the benefit payments as they fall due and in the appropriate currency. The Bank actively monitors how the duration and the expected yield of the investments are matching the expected cash outflows arising from the retirement obligations. A large portion of the plan assets as of December 31, 2016 and 2015 consists of debt securities and investment in UITF. The Bank believes that debt securities and investment in UITF offer the best returns over the long term with an acceptable level of risk. There has been no change in the Bank’s strategies to manage its risks from previous periods.

- 58 -
DRAFT As reviewed by P&A- March 10, 2017
(iii) Funding Arrangements and Expected Contributions
The plan is currently overfunded by P0.3 million based on the latest actuarial valuation.
The maturity profile of undiscounted expected benefit payments from the plan for the next ten years follows:
2016 2015
Within one year P 1,108,500 P 6,052,500 More than one year to five years 1,079,596 1,025,954 More than five years to ten years 20,485,212 17,281,416 P 22,673,308 P 24,359,870
The weighted average duration of the defined benefit obligation at the end of the reporting period is 21.5 years.
20. TAXES
The components of tax expense (income) reported in the statements of income and statements of comprehensive income follow:
2016 2015 2014 Reported in statements of income Current tax expense: Regular corporate income tax (RCIT) at 30% P 13,636,040 P 22,074,670 P 15,484,608 Final tax at 20% 3,327,203 1,978,024 1,588,415 16,963,243 24,052,694 17,073,023 Deferred tax expense (income) relating to origination and reversal of temporary differences 709,578 ( 1,789,773 ) ( 86,453 ) P 17,672,821 P 22,262,921 P 16,986,570 Reported in statements of comprehensive income Deferred tax expense (income) relating to origination and reversal of temporary differences P 93,881 (P 1,321,071 ) (P 269,722 )

- 59 -
DRAFT As reviewed by P&A- March 10, 2017
A reconciliation of tax on pretax profit computed at the applicable statutory rates to tax expense reported in the statements of income follows:
2016 2015 2014 Tax on pretax profit at 30% P 17,323,804 P 21,664,163 P 15,579,303 Adjustment for income subjected to lower tax rates ( 1,663,601 ) ( 989,012 ) ( 794,207 ) Tax effects of: Non-deductible interest expense 1,663,601 989,012 786,265 Non-deductible other expenses 349,017 598,758 1,415,209 P 17,672,821 P 22,262,921 P 16,986,570
The net deferred tax assets relate to the following as of December 31 (see Note 13): Statements of Statements Financial Position Statements of Income Comprehensive Income 2016 2015 2016 2015 __ 2014 _ 2016 2015 2014 Deferred tax assets: Allowance for
impairment losses P 10,281,281 P 10,891,939 P 610,659 P 96,757 P - P - P - P - Unrealized fair market value gains on AFS financial assets 1,538,348 325,588 - - - ( 1,212,760 ) ( 33,315 ) ( 211,277) Accumulated depreciation on investment properties 1,452,946 1,135,422 ( 317,525) ( 754,584 ) 924,504 - - -
Accrued vacation leaves 896,949 855,453 ( 41,496 ) ( 118,143 ) ( 191,716 ) - - - Retirement benefit obligation - 1,663,461 4,272,830 ( 1,015,294 ) ( 814,448 ) ( 2,609,369 ) ( 1,287,756 ) ( 58,445) 14,169,524 14,871,863 4,524,467 ( 1,791,264 ) ( 81,660 ) ( 3,822,129 ) ( 1,321,071 ) ( 152,832 ) Deferred Tax Liabilities: Retirement benefit asset ( 101,138) - ( 3,814,872 ) - - 3,916,010 - -
Foreign exchange gains ( 2,461) ( 2,479 ) ( 18) ( 1,491 ) ( 4,793 ) - - - ( 103,599) ( 2,479 ) ( 3,814,889) ( 1,491 ) ( 4,793 ) ( 3,916,010 ) - - Net Deferred Tax Assets P 14,065,925 P 14,869,384 Deferred Tax Expense (Income) P 709,578 (P 1,792,755 ) (P 86,453 ) P 93,881 (P 1,321,071 ) (P 269,722 )
The Bank is subject to Minimum Corporate Income Tax (MCIT), which is computed at 2.0% of the Bank’s gross income as defined under the tax regulations or to RCIT, whichever is higher. No MCIT was reported in 2016, 2015 and 2014 as the RCIT was higher than MCIT in those years.
In 2016, 2015 and 2014 the Bank opted to claim itemized deductions for the computation of its income tax due.
21. EARNINGS PER SHARE
Earnings per share were computed as follows: 2016 2015 2014 Net profit P 40,073,191 P 49,950,955 P 34,944,440 Divided by the weighted average number of outstanding common shares 2,988,891 2,988,891 2,988,891 Earnings Per Share P 13.41 P 16.71 P 11.69
The Bank has no potentially dilutive instruments; thus, basic and dilutive earnings per share are the same.

- 60 -
DRAFT As reviewed by P&A- March 10, 2017
22. RELATED PARTY TRANSACTIONS The Bank’s related parties include its stockholders and the Bank’s key management personnel.
22.1 Key Management Compensation
Short-term benefits paid to key management employees amounted to P16.8 million, P16.0 million and P15.5 million in 2016, 2015 and 2014, respectively, which are presented as part of Compensation expense under Other Operating Expenses account in the statements of income (see Note 18.2). 22.2 Directors, Officers, Stockholders and Related Interests In the ordinary course of business, the Bank has loan and deposit transactions with certain DOSRI. Under existing policies of the Bank, DOSRI loans are made on substantially the same terms as loans granted to other individuals and businesses of comparable risks. The General Banking Act and BSP regulations limit the amount of the loans granted by the Bank to a single borrower to 25% of equity. The amount of individual loans to DOSRI, of which 70% must be secured, should not exceed the amount of the deposit and book value of their investment in the Bank. In the aggregate, loans to DOSRI generally should not exceed the total equity or 15% of the total loan portfolio of the Bank, whichever is lower. The Bank, during the year, has unsecured portion of loans to DOSRI. The unsecured portions however, are microfinance loans, and though classified as unsecured, all have hold-out savings and with weekly amortizations. Though it exceeds 30%, such loans are secured by deposits which is an exclusion from individual ceiling. As of December 31, 2016 and 2015, the Bank is in compliance with the existing BSP regulations on DOSRI. The following information relates to DOSRI loans of the Bank:
2016 2015 Total DOSRI loans P 897,943 P 481,905 Unsecured DOSRI loans 116,543 188,881 % of unsecured DOSRI loans to total DOSRI loans 12.98% 39.0% % of past-due DOSRI loans to total DOSRI loans 0.00% 0.0% % of non-performing DOSRI loans to total DOSRI loans 0.00% 0.0%
Also, as of December 31, 2016 and 2015, certain related parties have deposits with the Bank. Total amount of deposits received from the related parties with outstanding loan balance above, subject to hold-out, amounted to P1.3 million and P0.57 million as of December 31, 2016 and 2015, respectively. Interest expense incurred from these deposits amounted to P0.05 million in 2016 and P0.02 million in both 2015 and 2014.
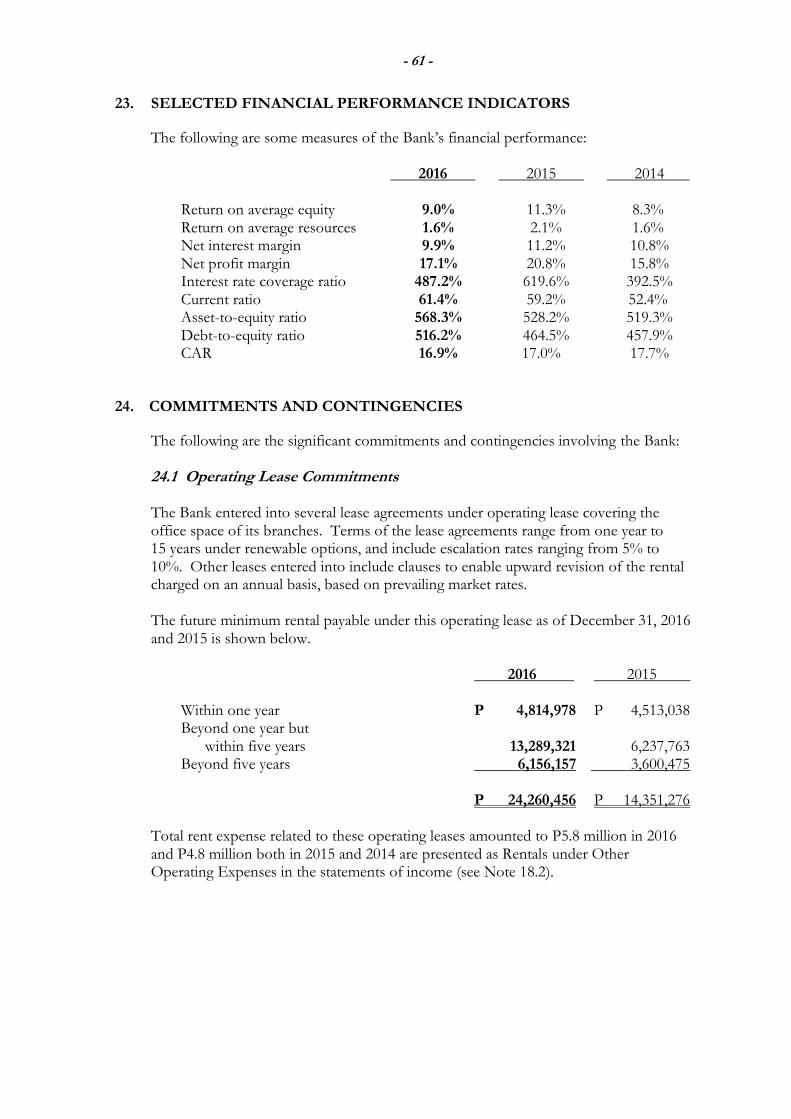
- 61 -
DRAFT As reviewed by P&A- March 10, 2017
23. SELECTED FINANCIAL PERFORMANCE INDICATORS
The following are some measures of the Bank’s financial performance:
2016 2015 2014 Return on average equity 9.0% 11.3% 8.3% Return on average resources 1.6% 2.1% 1.6% Net interest margin 9.9% 11.2% 10.8% Net profit margin 17.1% 20.8% 15.8% Interest rate coverage ratio 487.2% 619.6% 392.5% Current ratio 61.4% 59.2% 52.4% Asset-to-equity ratio 568.3% 528.2% 519.3% Debt-to-equity ratio 516.2% 464.5% 457.9% CAR 16.9% 17.0% 17.7%
24. COMMITMENTS AND CONTINGENCIES
The following are the significant commitments and contingencies involving the Bank: 24.1 Operating Lease Commitments The Bank entered into several lease agreements under operating lease covering the office space of its branches. Terms of the lease agreements range from one year to 15 years under renewable options, and include escalation rates ranging from 5% to 10%. Other leases entered into include clauses to enable upward revision of the rental charged on an annual basis, based on prevailing market rates. The future minimum rental payable under this operating lease as of December 31, 2016 and 2015 is shown below.
2016 2015 Within one year P 4,814,978 P 4,513,038 Beyond one year but within five years 13,289,321 6,237,763 Beyond five years 6,156,157 3,600,475 P 24,260,456 P 14,351,276
Total rent expense related to these operating leases amounted to P5.8 million in 2016 and P4.8 million both in 2015 and 2014 are presented as Rentals under Other Operating Expenses in the statements of income (see Note 18.2).
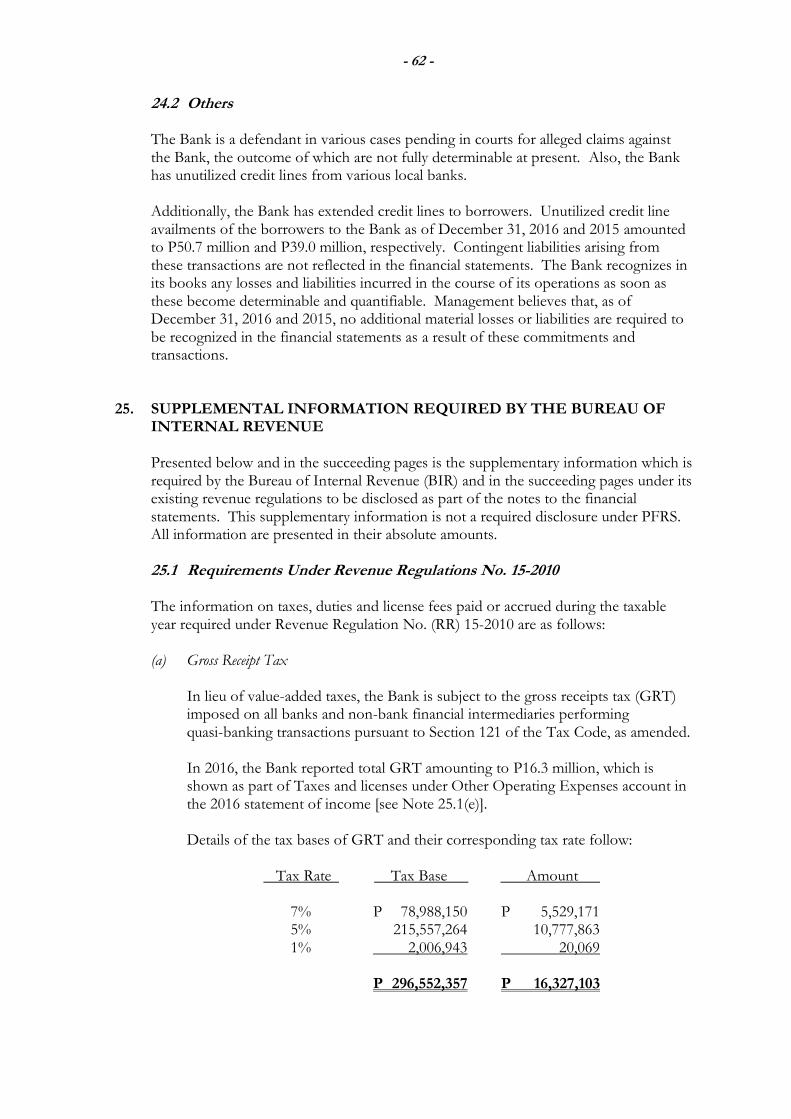
- 62 -
DRAFT As reviewed by P&A- March 10, 2017
24.2 Others The Bank is a defendant in various cases pending in courts for alleged claims against the Bank, the outcome of which are not fully determinable at present. Also, the Bank has unutilized credit lines from various local banks. Additionally, the Bank has extended credit lines to borrowers. Unutilized credit line availments of the borrowers to the Bank as of December 31, 2016 and 2015 amounted to P50.7 million and P39.0 million, respectively. Contingent liabilities arising from these transactions are not reflected in the financial statements. The Bank recognizes in its books any losses and liabilities incurred in the course of its operations as soon as these become determinable and quantifiable. Management believes that, as of December 31, 2016 and 2015, no additional material losses or liabilities are required to be recognized in the financial statements as a result of these commitments and transactions.
25. SUPPLEMENTAL INFORMATION REQUIRED BY THE BUREAU OF INTERNAL REVENUE
Presented below and in the succeeding pages is the supplementary information which is required by the Bureau of Internal Revenue (BIR) and in the succeeding pages under its existing revenue regulations to be disclosed as part of the notes to the financial statements. This supplementary information is not a required disclosure under PFRS. All information are presented in their absolute amounts.
25.1 Requirements Under Revenue Regulations No. 15-2010
The information on taxes, duties and license fees paid or accrued during the taxable year required under Revenue Regulation No. (RR) 15-2010 are as follows:
(a) Gross Receipt Tax
In lieu of value-added taxes, the Bank is subject to the gross receipts tax (GRT) imposed on all banks and non-bank financial intermediaries performing quasi-banking transactions pursuant to Section 121 of the Tax Code, as amended.
In 2016, the Bank reported total GRT amounting to P16.3 million, which is shown as part of Taxes and licenses under Other Operating Expenses account in the 2016 statement of income [see Note 25.1(e)]. Details of the tax bases of GRT and their corresponding tax rate follow:
Tax Rate Tax Base Amount
7% P 78,988,150 P 5,529,171 5% 215,557,264 10,777,863 1% 2,006,943 20,069 P 296,552,357 P 16,327,103

- 63 -
DRAFT As reviewed by P&A- March 10, 2017
(b) Documentary Stamp Tax
In general, the Bank’s documentary stamp tax (DST) transactions arise from the execution of debt instruments, security documents, certificates of deposits and bills of exchange. For the year ended December 31, 2016, DST affixed amounted to P7,030,999 representing documentary stamps imposed mainly on debt instruments documents issued during the year, of which P4,601,595 were charged to the Bank’s clients, hence, not reported as part of Taxes and licenses [see Note 25.1(e)].
(c) Taxes on Importations
The Bank has not paid or accrued any tax on importation as it has no importation for the year ended December 31, 2016.
(d) Excise Tax
The Bank did not have any transaction in 2016 which is subject to excise tax.
(e) Taxes and Licenses
The details of Taxes and licenses presented under Other Operating Expenses account in the 2016 statement of income follow (see Note 18.2):
Notes GRT 25.1(a) P 16,327,103 DST 25.1(b) 2,429,404 Business permits and other licenses 1,830,345 Real property tax 379,258 18.2 P 20,966,110
(f) Withholding Taxes
The details of total withholding taxes for the year ended December 31, 2016 are shown below.
Compensation and employee benefits P 8,600,768 Final 3,215,420 Expanded 2,586,139 P 14,402,327
(g) Deficiency Tax Assessments and Tax Cases
In 2015, the Bank was assessed by the BIR for the taxable year 2014. Examination of the Bank’s books was already completed for the year ended December 31, 2016. However, results of examination are not yet submitted by the BIR to the Bank.

- 64 -
DRAFT As reviewed by P&A- March 10, 2017
25.2 Requirements Under RR No. 19-2011
RR No. 19-2011 requires schedules of taxable revenues and other non-operating income, costs of services, itemized deductions and other significant tax information to be disclosed in the notes to financial statements. The amounts of taxable revenues and income, and deductible costs and expenses presented below are based on relevant tax regulations issued by the BIR; hence, may not be the same as the amounts reflected in the 2016 statement of income.
(a) Taxable Revenues
The Bank’s taxable revenues subject to regular tax rate for the year ended December 31, 2016 amounted to P217,563,835.
(b) Deductible Costs of Services
Deductible costs of services for the year ended December 31, 2016 under the regular tax rate regime comprise the following: Salaries, wages and benefits P 64,331,003
Interest 6,306,254 Insurance 3,920,345 BSP supervision fee 461,774 P 75,019,376
(c) Taxable Non-operating and Other Income
The details of taxable non-operating and other income in 2016 which are subject to regular tax rate are shown below.
Fees and commissions P 30,599,121 Gain on sale of non-financial assets 27,024,377 Others 3,558,433 P 61,181,931

- 65 -
DRAFT As reviewed by P&A- March 10, 2017
(d) Itemized Deductions
The amounts of itemized deductions for the year ended December 31, 2016 subject to regular tax rate follow:
Salaries and allowances P 33,710,442 Taxes and licenses 20,966,110 Depreciation 19,641,331 Security services 6,534,220 Rental 5,844,946 SSS, GSIS, Philhealth, HDMF and other contributions 5,639,378 Transportation and travel 5,277,268 Insurance 5,173,571 Postage, telephone, cables & telegrams 4,756,002 Amortization of intangible asset 4,740,153 Janitorial and messengerial services 4,022,696 Communication, light and water 3,997,271 Management and consultant fee 3,598,153 Losses 3,074,427 Directors’ fee 3,030,029 Office supplies 2,523,807 Repairs and maintenance 2,427,114 Amortization of leasehold improvement 2,079,984 Litigation expenses 1,911,741 Professional Fees 1,536,547 Advertising and promotions 1,296,595 Fuel and oil 945,615 Charitable contribution 894,428 Representation and entertainment 793,253 Miscellaneous 13,857,847 P 158,272,928

Hindi basta Bangko, Kabayan pa!


