107
Annual Report 2016

Annual Report2016

H.H Sheikh Khalifa Bin Zayed Al NahyanPresident of the United Arab Emirates
H.H Sheikh Mohammed Bin Rashid Al Maktoum Vice President, Prime Minister and Ruler of Dubai
H.H Dr. Sheikh Sultan Bin Mohammed Al Qasimi Member of the Supreme Council,
Ruler of Sharjah and its Dependencies

• Board Of Directors
• Chairman’s Speech
• Board Of Directors’ Report To The General Assembly
• GA RESOLUTIONS
TABLE OF CONTENTS

BOARD OF DIRECTORS

HONORARY CHAIRMANHis Highness, Doctor Sheikh Sultan Bin Mohammed Al Qasimi
CHAIRMANMr. Ahmed Abdalla Al Noman
VICE CHAIRMANSheikh Mohammad Bin Saud Al Qasimi
Sheikh Saif Bin MohammedBin Butti Al Hamed
H.E. Humaid Nasser Al Owais Mr. Abdul Rahman Bukhatir
Mr. Abdul Aziz HassanAl Midfa
Mr. Abdul Aziz MubarakAl Hasawi
Mr. Saud Al Besharah
Mr. Francois Dauge Executive Director & General ManagerMr. Varouj Nerguizian

CHAIRMAN’S SPEECH

Dear Valued Shareholders,
On behalf of the members of the Board of Directors I would like to welcome you to the General Assembly No. 43, and would like to express to you our deep gratitude for your support and your trust in our national institution.
I take this opportunity to extend on your behalf and on behalf of the Directors, our sincere appreciation and respect to H.H. Sheikh Khalifa bin Zayed Al Nahyan, UAE President, & H.H. Sheikh Mohammed bin Rashid Al Maktoum, Vice President Prime Minister & Ruler of Dubai, & H.H Sheikh Mohammed bin Zayed Al Nahyan, Crown Prince of Abu Dhabi, Deputy Supreme Commander of the Armed Forces, H.H. Dr. Sheikh Sultan bin Mohammed Al Qasimi, Ruler of Sharjah, & Their Highnesses the Rulers Members of the Supreme Council for their wisdom in leading our country towards prosperity and development.
The year 2016 witnessed major political and economic challenges; the major events were many and with multiple effects, to the extent that some of them will continue for many years ahead. Regionally, the Middle East remained plagued with intensifying military conflicts, as the waves of terrorist attacks escalated throughout the world.
Dear Valued Shareholders,
During 2016, the UAE continued as a champion of economic diversification by supporting projects that generate revenue distinct from oil income, seeking the revival of the economy by focusing on the sustained revenue stream and avoid the consequences of regional and international financial markets which are not expected to evolve positively.
During the year, the Bank continued to grow its loans and advances as well as its customer deposits, while maintaining high levels of liquidity and a low loan to deposit ratio of 87%.
Total Equity as at 31 December 2016 stood at AED 4,599 million after payment of 2015 dividends compared to AED 4,622 million for the corresponding year of 2015.
Net profit for the year 2016 reached AED 402 million, against AED 250 million for 2015, up by 61%. Earnings per share were up by 60% and reached 18.7 fils compared to 11.7 fils.
Capital Adequacy ratio remained at its high level reaching 22.70% in 2016 versus 21.13% in 2015.
Dear Valued Shareholders,
I take this opportunity to extend on your behalf to His Highness Dr. Sheikh Sultan Bin Mohammed Al Qasimi, Supreme Council Member and Ruler of Sharjah, our Honorary Chairman, our sincere gratitude and recognition for his patronage and continued support. Our appreciation goes as well to the Monetary Authorities. I would also thank all our customers and correspondents all over the world for their confidence in our national institution.
I would like to extend my thanks and appreciation to the Bank’s Management and staff for their tireless efforts and dedication to their work.
Finally, it is my honour to present to you the Board of Directors report for the year 2016.
Ahmed Abdalla Al NomanChairmanSharjah 29th April, 2017
Chairman’s Speech to the General Assembly

BOARD OF DIRECTORS’ REPORT TO
THE GENERAL ASSEMBLY
For the Year 2016

Board of Directors’ report to the General AssemblyFor the Year 2016
The year 2016 witnessed major political and economic challenges, the effects of which will continue for many years ahead. The exit of Britain from the European Union, the election of Donald Trump as president of the United States of America, the failed coup and the entailing backlash in Turkey, and the continuation of extension of persistent and new global and regional crisis characterized the geopolitical landscape of the year.
Internationally, the escalation of terrorist attacks through numerous and unprecedented attacks on France, Germany, Africa, the United States, Turkey and Pakistan, as well as the continued daily strikes in Syria, Iraq, Libya and Egypt, has brought the attention of the world to the importance of putting an end to these attacks. Turkey, and to a lesser extent Russia, has seen the influx of terrorist attacks from elements within its borders and from foreign sources, especially after the return of influence and Russian presence in the Middle East.
The uncertainty of a unified Europe rose to the forefront as Britain exited from the European Union by a popular referendum which risks the isolation of Great Britain from its regional counterparts. Brexit raises concern that other European countries may follow the campaign’s pretense of nationalism in favor of resolving macroeconomic uncertainties borne from the large footprint of the European Union. Internal financial crises, the falling Euro, conflicting policy perspectives, and the influx of refugees into Europe galvanized nationalist agendas that sought to break member states away from the European Union.
Although Britain’s exit from the European Union will not be rapid given the measures required by the European Parliament and the British House of Commons, the implications of Brexit swept the second half of 2016, particularly since Europe has not fully recovered from the 2008 crisis. Economic recession in Europe has been one of the longest since the European Central Bank reliance on quantitative easing policy will have, in the opinion of many insiders, only the devastating effect of both the economy and the currency.
The wave of nationalist agendas reached the United States where, in November 2016, Donald Trump was elected President on a platform that promised local economic resilience in a competitive and cost contained global economy. Elections elsewhere in the world have seen candidates who are discordant with established norms of economic openness, trade liberalization, immigration, and religious freedom.
After President Trump’s election, financial markets rallied on the stipulated tax law reform, easing of regulations, and new infrastructure projects. Meanwhile, the Federal Reserve increased the targets fund rate to reach between 0.50% and 0.75% as it aims to ease the US economy from the quantitative easing which brought liquidity to markets.
Following the signing of the Paris climate change agreement in December 2015, important strides in the areas of planning and implementation of programs to reduce climate pollutants were architected in 2016, primarily by levying taxes on pollution sources.
The declining oil prices and bearish financial markets witnessed at the onset of 2016 were predicated on the previous years’ economic crises and compounded by stagnation in the Chinese economy and devaluation of the yuan. However, the combined efforts of the global and regional economic powers prevented a dramatic deterioration of economies. Financial markets were broadly reassured that, while the impact of these crises may be major, their influence can be contained to avert a crisis similar to the global meltdown of 2008.
Nasdaq Dow Jones
Gold
Regionally, political and military conflicts continued in the regional countries, which increased the burden on local and regional budgets and negatively affected the financial and economic stability of the countries concerned directly and indirectly. The return of Iraqi forces to the Falluja area has had the effect of persuading many players on the regional and international arenas to come close to the inevitable end of terrorism. However, this brutal terrorism remains a major problem as the terrorist acts rocked European and Asian countries, claiming a lot of innocent lives, and negatively affecting the financial markets that remained cautious throughout the year.
During a meeting held in November 2016, the Organization of the Petroleum Exporting Countries (OPEC) agreed to reduce oil production to 32.5 million barrels per day with effect from January 2017, to provide price stability and strengthen the commodities and services markets. This joint endeavor will stabilize trade and enhance economic policies of OPEC member states that had undergone a fiscal deficit during 2015 and the beginning of 2016 as a result of the sharp drop in oil prices.

Financial markets continued to face major challenges as a result of the depressed oil economy and the persistent barrage of challenges from the protracted geopolitical conflict afflicting neighboring countries. Conflicts nearby and the spillover refugees have created circumstances that are a strain for social welfare planning and funding.
The Gulf Cooperation Council (GCC) affirmed its unity throughout 2016, where member states submitted five-year and ten-year plans that strengthen their economies and their capacity to prevent military and political strife.
In its plan for the year 2030, Saudi Arabia noted landmark steps to revive financial markets and secure its financial planning, beginning with a reduction in the country’s deficit from 367 billion Saudi riyals in 2015 to 326 billion Saudi riyals in 2016, a call to action to consolidate interbank rates, in light of the inflection of wealth in the Middle East shifting toward stocks and not bonds due to the flow of funds to emerging global markets.
Locally, during 2016, the UAE continued as a proponent of economic diversification by supporting projects that generate revenue distinct from oil income, and by focusing on revenue sustainability to avoid being affected by regional and international financial markets.
In 2016, the UAE remained prominent among its peers in creating a unique regional and international model, and continued to progress on all international economic, tourism, and security benchmarks. Abu Dhabi submitted alternative productive policies and issued Federal laws that carry the course of securing the country’s role in the developed world, Dubai inaugurated several new tourist destinations, such as the Dubai Water Canal and Dubai Parks, and Sharjah continued as a cornerstone of culture & education.
UAE markets demurred working to find opportunities and build on positive goodwill. In spite of the political and security difficulties in nations nearby, the UAE ended 2016 without any budgetary deficit and put forward one of the most ambitious five years Federal budgets, totaling AED 248 billion, which included AED 48.5 billion for 2017.
The UAE’s ongoing efforts have prompted the country to accelerate the pace of legislation during 2016. Among the new laws issued, the Bankruptcy Law and Movables Mortgage Law were mandated to confirm the veracity of financial claims and legitimize the quality of legal securities and guarantees, respectively.
Various Economic Departments in the Emirates are indicating an increase in the issuance of licenses, which reflects positively on the competitiveness on the local market level, reinforcing the confidence in the State and its developed sources for businesses. The Chamber of Commerce & Industry in Sharjah held a conference in the second half of Q4 2016 focused on a new generation of industrial outputs and the potential of factories in the UAE to meet their exigencies.
UAE Banks remained high in liquidity and proactively capable of adhering to new standards, such as CRS and IFRS9, and other financial control frameworks architected to safeguard the integrity and resiliency of the financial services industry and business-to-business transactions. Banks operating in the UAE saw total assets increase by AED 91 billion within 11 months, with continued funding of all sectors. The Central Bank’s oversight policy contributed to stimulate banks to adopt expansionary strategies, as exemplified by the merger of First Gulf Bank and National Bank of Abu Dhabi, marking an important UAE financial event for 2016.

The Abu Dhabi Exchange (ADX) enabled a short sale trading mechanism, put in place in a progressive way, where a trader can hold a position against a security contingent on the value trajectory of that security, allow-ing speculators to seed the market with growth. This initiative is intended to mobilize the ADX and render the market more palatable to foreign investors.
Dubai Financial Market General Index Abu Dhabi Securities Market General Index
The new Bank’s Law, announced by His Excellency the Governor of the Central Bank during the Middle East Banking Forum held in November 2016, entered the final stages of preparation, which will cater, once approved, to the banking sector and the national economy requirements; in addition to develop and update the systems, such as ‘‘Stored Values’’, e-payment, the development of new systems to support financial transactions, and organize collective funding through electronic platforms that will contribute to making the banking sector and the financial markets the safest for trading and more attractive for local, Arab and foreign investors.
In Sharjah, His Highness Sheikh Dr. Sultan bin Mohammed Al Qasimi, Ruler of Sharjah and its dependencies, enacted a general budget for 2017, with total expenses amounting to AED 22 billion. The budget focused on adopting many of the strategic goals and indicators with economic, social, scientific and cultural objectives, including the promotion of investment in human resources.
The Emirate held a prominent place in the region, and was able to be distinguished in the fields of culture and tourism, that contributed to attract regional and international airlines; resulting in increased air traffic at Sharjah International Airport by 6.3 % in 2016, where the number of passengers exceeded 11 million.
The Public Works Department in the Government of Sharjah announced the implementation of two essential projects in the area of waste management, costing AED 641 million, including the expansion of a sewage treatment factory to increase production from 230,000 cubic meters to 305,000 cubic meters per day. Sharjah Authority for Investment and Development (Shurooq) signed a MoU with the Mohammed Bin Rashid Establishment for the development of small and medium enterprises, where the two sides will coordinate to strengthen efforts to achieve the vision of the governments of Dubai and Sharjah in order to develop services that set a new standard for customer expectations.
His Highness the Ruler of Sharjah also announced that the American University of Sharjah plans to position itself to be one of the largest research universities in the Arab world over the next five years.
The Emirate of Sharjah constitutes a site for various local and international festivals, and these festivals became a special part of the Emirate, attracting many tourists and visitors who enjoy the festivities. During 2016, under the patronage of His Highness the Ruler of Sharjah, Sharjah hosted the annual Government Communication Forum, which aims to forward the latest professional methods in government communication, and build a dialogue around best practices in the field. In the month of February, Sharjah Lights Festival was held where
lights glimmered over nine days and highlighted the historical buildings in the Emirate.
Sharjah International Book Fair kicked off with its thirty-fifth fair, held in November and attracting a growing number of visitors, surpassing two million, as well as the participation of more than 45 countries and hundreds of publishers from various countries around the world. The 35th edition of the book fair held even more importance as it coincided with the Year of Reading, announced by the UAE Government in the beginning of 2016 and supported by the Reading Law issued by His Highness Sheikh Khalifa bin Zayed Al Nahyan, President of the UAE, marking a step in a road map to elevating a society of cultural depth that perseveres as a pioneer of development.
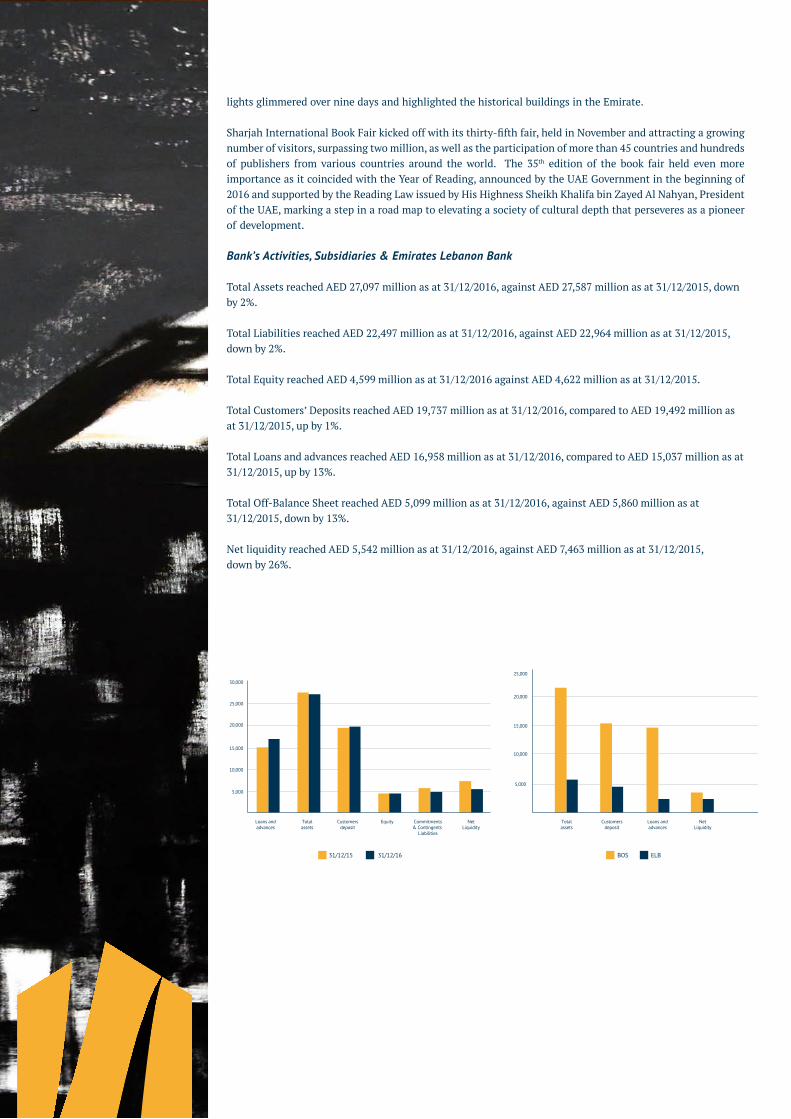
Bank’s Activities, Subsidiaries & Emirates Lebanon Bank
Total Assets reached AED 27,097 million as at 31/12/2016, against AED 27,587 million as at 31/12/2015, down by 2%.
Total Liabilities reached AED 22,497 million as at 31/12/2016, against AED 22,964 million as at 31/12/2015, down by 2%.
Total Equity reached AED 4,599 million as at 31/12/2016 against AED 4,622 million as at 31/12/2015.
Total Customers’ Deposits reached AED 19,737 million as at 31/12/2016, compared to AED 19,492 million as at 31/12/2015, up by 1%.
Total Loans and advances reached AED 16,958 million as at 31/12/2016, compared to AED 15,037 million as at 31/12/2015, up by 13%.
Total Off-Balance Sheet reached AED 5,099 million as at 31/12/2016, against AED 5,860 million as at 31/12/2015, down by 13%.
Net liquidity reached AED 5,542 million as at 31/12/2016, against AED 7,463 million as at 31/12/2015, down by 26%.
Loans and advances
Loans and advances
Totalassets
Totalassets
Customersdeposit
Customersdeposit
Equity Commitments& Contingents
Liabilities
NetLiquidity
NetLiquidity
5,000
5,000
10,000
15,000
20,000
25,000
10,000
15,000
20,000
25,000
30,000
31/12/15 31/12/16 BOS ELB

Income Statement:
Net interest income reached AED 522 million for the year ended 31/12/2016 versus AED 548 million for the year ended 31/12/2015, down by 5%.
Net operating income reached AED 695 million for the year ended 31/12/2016, against AED 536 million for the year ended 31/12/2015, up by 23%.
Net profit for the year reached AED 402 million for the year ended 31/12/2016, against AED 250 million for the year ended 31/12/2015, up by 61%.
Total comprehensive income reached AED 213 million for the year ended 31/12/2016 against AED 309 million for the year ended 31/12/2015, down by 31%, as a result of a drop in the value of our Bonds and the share.
31/12/15 31/12/16 BOS ELB
100100
200
300
400
500
600
200
300
400
500
600
700
Net Interestincome
Net Feesand commission
income
Net commission income
Net operatingincome
G&A expenses Net profitInvestmentIncome/Loss
Net operatingIncome
G&A expenses Net profit Comprehensive Income
Comprehensive Income
Public Disclosures on Capital Adequacy
The following qualitative and quantitative disclosures are being provided in accordance with the regulatory capital adequacy guidelines promulgated by the Central Bank of the United Arab Emirates. The guidelines are based on the standards established by the Basel Committee on Banking Supervision of the Bank for International Settlements (Basel II). These guidelines support market discipline by providing market participants with disclosures to help them understand the risk assessment and management process, risk exposures, capital structure, and capital adequacy.
Risk Management
Basel II guidelines require banks to have effective mechanisms in place for the active identification, measurement and monitoring of risks across all business lines. Key risks are classified as Credit Risk, Market Risk, Liquidity Risk or Operational Risk. The Bank has implemented appropriate structures to manage and mitigate these and other risks.
Risk Management Structure
Risk Management forms part of the overall governance structure of the Bank. Its aim is to protect the Bank and its stakeholders from exposure to undue losses by ensuring that the Bank’s credit and operational activities are constantly monitored and managed within prescribed policies and to ensure that the asset and liability profile is managed and maintained within approved parameters.
To fulfil its obligations to stakeholders, the Bank has established Senior Management committees to oversee risk management. The Executive Committee (EC), under delegation from the Board of Directors, has defined policies, processes and systems to monitor and manage credit risk, operational risk, market risk and liquidity risk. The members of the EC comprise of the Chairman and three Board Members, in addition to the Executive Director and General Manager. The EC meets once every 45 days, or more frequently as circumstances dictate.

The quorum requires all members to be present at the meeting and decisions taken should be unanimous.
In addition, a “Board Risk Committee” was established in 2011, meeting at least quarterly, to assist the Board to ensure that the Bank has implemented an effective policy and plan for risk management that will enhance the Bank’s ability to achieve strategic objectives, and that the disclosures regarding risk are comprehensive, timely, and relevant.
Additionally, the Bank has an independent Credit Risk function that monitors and reviews adherence to risk management policies and procedures. The Bank’s internal audit function, which is part of the risk framework, primarily evaluates the effectiveness of operational risk controls. This function is outsourced to one of the Big Four audit firms to lend the process greater independence and objectivity.
Credit Risk Management
Credit risk is the risk that one party to a financial instrument will fail to discharge an obligation and cause the other party to incur a financial loss. The Group attempts to control credit risk by monitoring credit exposures, limiting transactions with specific counter-parties, and continually assessing the creditworthiness of counter-parties. In addition to monitoring credit limits, the Group manages the credit exposure relating to its trading activities by entering into master netting agreements and collateral arrangements with counter-parties in appropriate circumstances, and by limiting the duration of exposure. In certain cases, the Group may also close out transactions or assign them to other counter-parties to mitigate credit risk.
Concentrations of credit risk arise when a number of counter-parties are engaged in similar business activities, or activities in the same geographic region, or have similar economic features that would cause their ability to meet contractual obligations to be similarly affected by changes in economic, political, or other conditions. Concentrations of credit risk indicate the relative sensitivity of the Group’s performance to developments affecting a particular industry or geographic location. Policies relating to credit are reviewed and approved by the Group’s Executive Committee. All credit lines are approved in accordance with the Group’s credit policy set out in the Credit Policy Manual. Credit and marketing functions are segregated. In addition, whenever possible, loans are secured by acceptable forms of collateral in order to mitigate credit risk. The Group further limits risk through diversification of its assets by economic and industry sectors.

The composition of the loans and advances portfolio by industry is as follows:
2016AED’000
2015AED’000
Economic sectorTrading 7,267,107 6,438,192Services 5,612,695 4,683,930Manufacturing 2,454,930 2,305,142Construction 949,431 1,262,612Personal loans for commercial purposes 668,178 502,340Personal loans for individual purposes 544,650 465,339Transport and communication 371,605 357,655Financial institutions 327,499 189,053Mining and quarrying 301,727 457,211Government 292,581 109,282Agriculture 34,928 22,150Public utilities 713 -Other 154,108 39,000
18,980,152 16,831,906Less: Allowance for impairment (1,583,551) (1,524,442)Less: Interest in suspense (321,604) (270,843)
17,074,997 15,036,621
The composition of the non-performing loans and advances portfolio by industry is as follows:
2016 AED’000
2015AED’000
Economic sectorTrading 773,022 1,177,345Manufacturing 141,667 128,317Transport and communication 86,616 80,382Services 28,741 30,435Personal loans for individual purposes 15,501 18,601Personal loans for commercial purposes 15,277 14,583Construction 1,705 1,764Other - 241
1,062,529 1,451,668

All credit facilities are administered and monitored by the Credit Administration Department. Periodic reviews are conducted by Credit Risk and facilities are risk graded based on criterion established in the Credit Policy Manual.
Cross border exposure and financial institutions exposure limits for money market and treasury activities are approved as per guidelines established by the Group’s Executive Committee and are monitored by the Senior Management on a daily basis.
The Executive Committee is responsible for setting credit policy of the Group. It also establishes industry caps, approves policy exceptions, and conducts periodic portfolio reviews to ascertain portfolio quality.
Commercial/Institutional lending underwriting
All credit applications for Commercial and Institutional lending are subject to the Group’s credit policies, underwriting standards and industry caps (if any) and to regulatory requirements, as applicable from time to time. The Group does not lend to companies operating in industries that are considered by the Group inherently risky and where industry knowledge specialisation is required. In addition, the Group sets credit limits for all customers based on their creditworthiness.
All credit facilities extended by the Group are made subject to prior approval pursuant to a delegated signature authority system under the ultimate authority of the Executive Committee or the Group’s Executive Director and General Manager under the supervision of the Board. At least two signatures are required to approve any commercial or institutional credit application.
Credit review procedures and loan classification
The Group’s Credit Risk department subjects the Group’s risk assets to an independent quality evaluation on a regular basis in conformity with the guidelines of the Central Bank of the U.A.E. and the Group’s internal policies in order to assist in the early identification of accrual and potential performance problems. The Credit Risk department validates the risk ratings of all commercial clients, provides an assessment of portfolio risk by product and industry and monitors the observance of all approved credit policies, guidelines and operating procedures across the Group. All commercial/institutional loan facilities of the Group are assigned one of nine risk ratings (A-I) where A is being excellent and I being loss with no reimbursement capacity and total provisioning.
If a credit is impaired, interest suspended will not be credited to the consolidated statement of profit or loss. Specific allowance for impairment of classified assets is made based on recoverability of outstanding and risk ratings of the assets.
The Group also complies with IAS 39 in accordance with which it assesses the need for any impairment losses on its loan portfolio by calculating the net present value of the expected future cash flows for each loan. As required by Central Bank of the U.A.E. guidelines, the Group takes the higher of the loan loss provisions required under IAS 39, and Central Bank regulations.
Impaired loans and securities
Impaired loans and securities are loans and securities for which the Group determines that it is likely the collectability of all principal and interest due according to the contractual terms of the loan/securities agreement(s) would be doubtful. These loans are graded G to I in the Group’s internal credit risk grading system.
Allowances for impairment
The Group establishes an allowance for impairment losses that represents its estimate of incurred losses in its loans and advances portfolio. The main components of this allowance are a specific loss component that relates to individually significant exposures and a collective loan loss allowance established for a group of homogeneous assets with respect to losses that have been incurred but have not been identified on loans subject to individual assessment for impairment.
Write-off policy
The Group writes off a loan/security balance (and any related allowances for impairment losses) when the Group determines that the loans/securities are uncollectible. This determination is reached after considering information such as the occurrence of significant changes in the borrower/issuer’s financial position such that

the borrower/issuer can no longer pay the obligation, or that proceeds from collateral will not be sufficient to pay back the entire exposure.
The Group holds collateral against loans and advances in the form of mortgage interests over properties, vehicles and machineries, cash margins, fixed deposits, guarantees and others. The Group accepts guarantees mainly from well-reputed local or international banks, well-established local or multinational corporate and high net worth private individuals.
Liquidity risk management
Executive Committee (EC) & Board Risk Committee (BRC)
Liquidity risk is the risk that the Group will encounter difficulty in meeting obligations from its financial liabilities.
In addition to its credit related activity, the Executive Committee along with the Board Risk Committee have a broad range of authority delegated by the Board of Directors to manage the Group’s asset and liability structure and funding strategy. The EC and BRC review liquidity ratios; asset and liability structure; interest rate and foreign exchange exposures; internal and statutory ratio requirements; funding gaps; and general domestic and international economic and financial market conditions. The EC & BRC formulate liquidity risk management guidelines for the Group’s operation on the basis of such review.
The Group’s Senior Management monitors the liquidity on a daily basis and uses an interest rate simulation model to measure and monitor interest rate sensitivity and varying interest rate scenarios.
The EC members comprise of the Chairman, three Board Members, in addition to the Executive Director and General Manager. The EC meets once or more every 45 days, as circumstances dictate. The quorum requires all members to be present at the meeting and decisions taken to be unanimous.
The Group manages its liquidity in accordance with U.A.E. Central Bank requirements and the Group’s internal guidelines. The U.A.E. Central Bank sets cash ratio requirements on overall deposits ranging between 1.0 percent for time deposits and 14.0 percent for demand deposits, according to the tenor of the deposits. The U.A.E. Central Bank also imposes a mandatory 1:1 utilisation ratio, whereby; loans and advances (combined with inter-bank placements having a remaining term of ‘greater than three months’) should not exceed stable funds as defined by the U.A.E. Central Bank. Stable funds are defined by the U.A.E. Central Bank to mean free-own funds, inter-bank deposits with a remaining term of more than six months, and stable customer deposits. To guard against liquidity risk, the Group diversifies its funding sources and manages its assets with liquidity in mind, seeking to maintain a preferable proportion between cash, cash equivalent, and readily marketable securities. The Board Risk Committee sets and monitors liquidity ratios and regularly revises and updates the Group’s liquidity management policies to ensure that the Group would be in a position to meet its obligations as they fall due. Management of liquidity risk within the parameters prescribed by the Board Risk Committee has been delegated to an Asset and Liability Committee (ALCO) comprising of Deputy General Manager and senior executives from treasury, finance, corporate credit, and investment departments.
The Group’s approach to managing liquidity is to ensure that it will always have sufficient liquidity to meet its liabilities when they fall due, under both normal and stressed conditions, without incurring unacceptable losses or potential damage to the Group’s reputation.
The Treasury department communicates with other business units regarding the liquidity profile of their financial assets and liabilities and details of other projected cash flows arising from projected future business. The Treasury maintains a portfolio of short-term liquid assets to ensure liquidity is maintained within the Group’s operations as a whole.
The daily liquidity position is monitored and regular liquidity stress testing is performed under a variety of scenarios covering both normal and severe market conditions. All liquidity policies and procedures are subject to review and approval by the Board Risk Committee. The Daily Position sheet, which reports the liquidity and exchange positions of the Group is reviewed by the Senior Management. A summary report, including any exceptions and remedial action taken, is submitted to the Board Risk Committee.

Market risk management
Market Risk is the risk that the fair value or future cash flows of the financial instruments will fluctuate due to changes in market variables such as interest rates, foreign exchange rates, and equity prices. The Group classifies exposures to market risk into trading, or non-trading/banking book.
a) Market risk - trading bookThe Executive Committee has set limits for acceptable level of risks in managing the trading book. The Group maintains a well-diversified portfolio. In order to manage the market risk in the trading book, the Group carries a limited amount of market risk based on the policy preference and this is continuously monitored by the Senior Management. Proprietary trading for the account of the Group is managed by a proprietary trading limit with a stop-loss limit.
The Group’s trading book mainly comprises of equity instruments in companies listed on the U.A.E. exchanges. As such, the market risk in the trading book is limited to equity price risk.
Equity price risk refers to the risk of a decrease in the fair values of equities in the Group’s trading investment portfolio as a result of reasonable possible changes in levels of equity indices and the value of individual stocks.
b) Market risk - non-trading or banking bookMarket risk on non-trading or banking positions mainly arises from the interest rate, foreign currency exposures and equity price changes.
i) Interest rate risk
Interest rate risk arises from the possibility that changes in interest rates will affect the value of financial instruments. The Group is exposed to interest rate risk as a result of mismatches or gaps in the amounts of assets and liabilities.
The Group uses simulation-modelling tools to periodically measure and monitor interest rate sensitivity. The results are monitored and analysed by the Senior Management. Since most of the Group’s financial assets and liabilities are floating rates, deposits and loans generally re-price simultaneously providing a natural hedge, which reduces interest rate exposure. Moreover, the majority of the Group’s assets and liabilities will be re-priced within one year or less, thereby further limiting interest rate risk.
The effective interest rate (effective yield) of a monetary financial instrument is the rate that, when used in a present value calculation, results in the carrying amount of the instrument, excluding non-interest bearing items. The rate is a historical rate for a fixed rate instrument carried at amortised cost and the current market rate for a floating rate instrument or for an instrument carried at fair value.
ii) Currency risk
Currency risk represents the risk of change in the value of financial instruments due to changes in foreign exchange rates. The Board has set limits on positions by currencies, which are monitored daily, and hedging instruments are also used to ensure that positions are maintained within the limits.
The Group’s assets are typically funded in the same currency as that of the business transacted in order to eliminate foreign exchange exposure. However, in the normal course of business the Group takes on foreign currency exposures to finance its client’s activities. The Executive Committee sets the limits on the level of exposure by currency for both overnight and intra-day positions, which are closely monitored by the Senior Management.
iii) Equity price risk
Equity price risk refers to the risk of a decrease in the fair value of equities in the Group’s non-trading investment portfolio as a result of reasonable possible changes in levels of equity indices and the value of individual stocks.
Operational risk
Operational risk is the risk of loss arising from system failure, human error, fraud, or external events. When controls fail to perform, operational risks can cause damage to reputation, and may have legal or regulatory implications, or lead to financial losses. The Group would not be able to eliminate all operational risks, but through a control framework and by monitoring and responding to potential risks, the Group could minimise the risks. Controls include effective segregation of duties, access, authorisation and reconciliation procedures, staff education and assessment processes, including the use of internal audit.
Capital Management and Allocation

The Basel II and the U.A.E. Central Bank (CBUAE) guidelines require banks to maintain adequate levels of regulatory capital against risk-bearing assets and off-balance-sheet exposure.
Capital is also set aside for operational risk and for market risk associated with trading activities. In accordance with the CBUAE guidelines, U.A.E. banks must maintain a minimum capital adequacy ratio of 12% (compared with the internationally agreed minimum of 8%).
Capital Adequacy Framework (Basel II)
The Basel II framework incorporates three equally important and mutually reinforcing pillars:
Pillar I
Minimum Capital requirements for credit risk-weighted assets, market risk-weighted assets, and operational risk.
Credit risk-weighted assets are measured by means of a hierarchy of risk weightings classified according to the nature of each asset (on and off-balance sheet) and counterparty, taking into account any eligible collateral or guarantees.
Market risk-weighted assets are determined by taking into account market related risks such as foreign exchange, interest rate, and equity position risks.
Credit risk
Basel II has specified three approaches to the calculation of the regulatory capital requirement for credit risk which are (1) the Standardised approach, (2) the Foundation Internal Ratings-Based (‘IRB’) approach and (3) the Advanced ‘IRB’ approach.
Bank of Sharjah applies the Standardised approach that uses external credit ratings provided by External Credit Assessment Institutions (ECAI) approved by CBUAE, to determine the risk weightings to be applied to rated counterparties. Risk weightings for non-rated counterparties are assigned at 100%.
Market risk
The Bank assesses Market Risk through the Standardised approach, under which interest rate risk and equity position risks are restricted to the trading book. Foreign exchange, commodity, and option risks are applied on the banking book.
Operational Risk
The Bank applies the Basic Indicator Approach.
Pillar II - Supervisory Review Process (SRP)
The SRP requires banks to implement a process for assessing their capital adequacy in relation to their risk profiles as well as a strategy for maintaining their capital levels. Under this pillar, banks’ procedures and measures should ensure (1) an appropriate identification and measurement of the risk profile of their activities; (2) an appropriate level of internal capital to cover these risks, and (3) application and further development of suitable risk management systems.
Supervisors are required to intervene at an early stage to prevent capital falling below the minimum levels required to support the risk characteristics of the Bank.
Pillar III - Market Discipline
The purpose behind this pillar is to enhance transparency by expanding public reporting on the risk position of banks, hence increasing comparability among them.
Bank of Sharjah implements all three pillars of the Basel II framework.

Capital Structure:The Bank’s components of Tier 1 and Tier 2 capital base are as follows:
Tier 1 Capital
2016 AED ‘000
2015 AED ‘000
Core Capital
Share capital 2,100,000 2,100,000Legal reserves 1,050,000 1,050,000General reserves 610,000 580,000Retained earning 606,035 476,485Minority interests 210,857 203,527
Total core capital 4,576,892 4,410,012Less: Goodwill and other intangibles (228,324) (234,234)
Total Qualifying Tier 1 capital 4,348,568 4,175,778
Tier 2 Capital
Collective impairment allowance on loans and advances (Note 1)
235,383 246,831
Cumulative changes in fair value (Note 2) 10,276 95,594
Total Qualifying Tier 2 Capital 245,659 342, 425
Total Eligible Regulatory Capital 4,594,227 4,518,203
Note 1 General Provisions are restricted to a maximum of 1.25% of RWA
Note 2 Limited to a maximum of 45% of the excess of the market value over net book valueRevaluation reserves in respect of a bank’s property assets are not to be includedNegative reserves deducted at 100%
Capital Management:
The Bank’s capital adequacy policy is to maintain a strong capital base to support the development and growth of the business. Current and future capital requirements are determined on the basis of expected growth of the banking facilities (including off-balance sheet) for each business group activity, for future sources and uses of funds, and for the Bank’s future dividends policy.
Capital is allocated to different business groups and stress testing is used to ensure that the Bank’s internal capital targets are consistent with the risk profile of the Bank.

Capital Adequacy The table below details the risk-weighted assets, regulatory capital requirements and regulatory capital ratios for Bank of Sharjah as at 31 December 2016.
1- Risk Weighted Assets
2016 AED ‘000
2015 AED ‘000
Pillar 1
Credit Risk 18,830,611 19,746,453Market Risk 171,177 131,933Operational Risk 1,484,159 1,502,954
Total Risk Weighted Assets 20,485,947 21,381,340
Credit Risk
AED 000’s
Asset Classes On & Off Balance
Sheet Credit Risk Mitigation (CRM)
Risk Weighted
Assets
Gross Outstanding
Exposure Before CRM
CRM After CRM
2016
Claims on Sovereigns 5,266,226 5,266,226 - 5,195,704 2,265,967
Claims on Non-Commercial Public Sector Entities (PSEs) 506,652 506,652 - 101,811 -
Claims on Multi-LateralDevelopment Banks - - - - -
Claims on Banks 1,415,566 1,415,566 1,840 1,379,662 174,915
Claims on Securities Firms 10,695 10,695 - 10,695 3,499
Claims on Corporates & GREs 18,241,092 17,844,598 4,930,876 14,796,734 10,461,976
Claims Included in the Regulatory Retail Portfolio 1,605,890 1,605,890 73,111 1,469,097 1,388,776
Claims Secured by Residential Property 2,681,432 2,681,432 702,536 2,681,432 1,495,575
Claims Secured by Commercial Real Estate 141,149 141,149 - 140,598 140,598
Past Due Loans 1,072,066 (212,442) - (215,304) (209,520)
Higher-Risk Categories 833,730 833,730 - 833,730 1,250,595
Other Assets 2,065,523 2,065,523 - 2,065,523 1,858,230
Total Claims 33,840,021 32,159,019 5,708,363 28,459,682 18,830,611
Settlement Risk
Total Credit Risk 18,830,611

AED 000’s
Asset Classes On & Off Balance
Sheet Credit Risk Mitigation (CRM)
Risk Weighted
Assets
Gross Outstanding
Exposure Before CRM
CRM After CRM
2015
Claims On Sovereigns 7,040,489 7,040,489 - 6,969,967 2,272,611
Claims On Non-Commercial Public Sector Entities (PSEs) 605,918 605,918 - 144,166 -
Claims on Multi-LateralDevelopment Banks - - - - -
Claims On Banks 1,323,807 1,323,807 3 1,279,001 459,020
Claims on Securities Firms 19,375 19,375 - 19,375 6,534
Claims On Corporates & GREs 16,514,008 16,512,998 3,234,715 13,792,511 10,557,799
Claims Included In The Regulatory Retail Portfolio 1,614,792 1,614,792 169,335 1,500,795 1,321,328
Claims Secured By Residential Property 3,332,918 3,332,918 788,300 3,332,918 1,919,930
Claims Secured By Commercial Real Estate 152,362 152,362 - 151,811 151,811
Past Due Loans 1,451,842 (91,391) 233 (91,478) (74,152)
Higher-Risk Categories 798,212 798,212 - 798,212 1,197,318
Other Assets 2,109,131 2,109,131 - 2,109,131 1,934,253
Total Claims 34,962,854 33,418,611 4,192,586 30,006,409 19,746,453
Settlement Risk
Total Credit Risk 19,746,453
Market Risk 2016AED ‘000
2015AED ‘000
Interest rate risk-Trading book - 10,548Foreign exchange risk 1,939 124Equity exposure risk-Trading book 18,602 5,160
Market risk total capital charge 20,541 15,832
Market risk-risk weighted assets (above total x8.33 ) 171,177 131,933

Tier 1 Ratio 2016AED ‘000
2015 AED ‘000
Tier 1 capital 4,348,568 (a) 4,175,778 (a)Total risk weighted assets 20,485,947 (b) 21,381,340 (b)
Tier 1 Ratio ((a)/(b)) 21.23 % 19.53 %
Capital Adequacy Ratio 2016AED ‘000
2015 AED ‘000
Capital Base 4,594,227 (a) 4,518,203 (a)Total risk weighted assets 20,485,947 (b) 21,381,340 (b)
Capital Adequacy Ratio ((a)/(b)) 22.43% 21.13%
Operational Risk 2016AED ‘000
2015 AED ‘000
Three-year average Gross Income 791,551 801,575
Capital charge (Beta factor (15%)) 118,733 120,236
Capital charge UAE (1.5* Capital Charge) 178,099 180,354
Operational risk-risk weighted assets (above total x8.33)
1,484,159 1,502,954
2- Capital ratio

GA RESOLUTIONS

General Assembly GA RESOLUTIONS
The General Assembly resolutions No. 43:
1- The General Assembly approves unanimously the Board of Directors’ report on the bank’s activities for the year ending 31/12/2016.2- The General Assembly approves unanimously the Auditors’ Report for the year ending 31/12/2016.3- The General Assembly approves unanimously the Balance Sheet and the Profit & Loss Statements as at 31/12/2016.4- The General Assembly approves unanimously the appropriation of profits and the distribution of 7.66% cash dividends as follows:
5- The General Assembly approves unanimously to discharge the liability of the Directors for their services during the period ending 31/12/2016.6- The General Assembly approves unanimously to discharge the liability of the External Auditors for their
services during the period ending 31/12/2016. 7- The General Assembly approves unanimously to approve the Board of Directors remuneration for the year 2016.8- The General Assembly approves unanimously to appoint the External Auditors for the financial year
2017 and fix their remunerations at AED 700,000.
Special decisions:
10 - The General Assembly approves unanimously the update of the supplement to the Bank’s Euro Medium Term Note Program, which was originally established pursuant to the approval of the General Assembly No. 42 held on 30th April 2016, such update or supplement to take place at any time (and, if required, multiple times) prior to the next General Assembly of the Bank.
The issuance by the Bank, or by a special purpose vehicle established for such purpose, of any senior unsecured notes under the Bank’s Euro Medium Term Note Program, either as it currently stands or as updated or supplemented pursuant to item (i) above, or of any other senior debt securities, whether secured or unsecured, on a stand-alone basis or under an issuance program, including, without limitation, certificates of deposit or commercial paper, in a total amount of up to U.S. $ 1,500,000,000 at any points in time prior to the next Ordinary General Assembly of the Bank.
The above will be subject to the resolutions of such matters by the Board, which may proceed to implement such transactions accordingly, and any approvals required by relevant authorities.
11 - The General Assembly by majority voting approves the amendment of Article 18 of the Articles of Association, whereby the number of the Board members will be decreased from 11 to 9, one shareholder holding 533,796 shares objects the amendment. As such, the amended article will be as follows:
Subject to the approval of the relevant authorities.
AED’000 2016 2015Proposed appropriation AED’000 AED’000
Transfer to statutory reserve - -Transfer to contingency reserves 50,000 30,000 Board of Directors remuneration 7,500 7,500Proposed cash dividend (2016-7.66%)(2015- nil) 160,860 -Treasury share distribution (2016-nil) (2015- 5.24%) - 220,000Charity donations 7,500 2,500Retained earnings 380,175 216,845Total 606,035 476,485

Article (18)Formation of the Board
The Company shall be managed by a Board of Directors, which shall consist of nine members to be elected by the General Assembly by secret cumulative ballot PROVIDED at least one third of them are Independent Directors and the majority are Non-Executive Directors. It will not be permitted for the Chairman of the Board to be the General Manager of the Company or its Managing Director.
In all events, the majority of the Directors, including the Chairman, must be UAE citizens.
If the Director was an individual, he must hold shares of a par value of not less than Dirhams One Hundred Thousand. However, if he was acting for a corporate body, the corporate body represented by such Director shall have to be the holder of shares having the aforementioned value. The Director must retain these shares for the full tenure of his directorship as security to the Company’s benefit against his management errors.
A detailed statement on each candidate is presented. Then a secret cumulative voting for the new Board consisting of 9 members is initiated by the shareholders.
9 – The General Assembly elects a new Board for 3 years, composed of:
Mr. Ahmed Abdalla Al Noman Sh. Mohammed Bin Saud Al QasimiSh. Seif Bin Mohammed Butti Al HamedH.E. Humaid Naser Al OwaisMr. Abdul Aziz Hassan Al MidfaMr. Abdul Aziz Mubarak Al HasawiMr. Saud Al Besharah Mr. Francois DaugeMr. Salem Humeid Salem Al Ghammai

Consolidated financial statements
for the year ended 31 December 2016

•
• Board of Directors’ report 1
• Independent auditor’s report 2 - 9
• Consolidated statement of financial position 10
• Consolidated statement of profit or loss 11
• Consolidated statement of profit and loss and other 12 comprehensive income
• Consolidated statement of changes in equity 13
• Consolidated statement of cash flows 14
• Notes to the consolidated financial statements 15 - 81
TABLE OF CONTENTS

BOARD OF DIRECTORS’
REPORT

Bank of Sharjah P.J.S.C.
Board of Directors’ report
The Board has pleasure in submitting their report and the audited consolidated financial statements for the year ended 31 December 2016.
Incorporation And Registered Office
Bank of Sharjah P.J.S.C. (the “Bank”) is a Public Joint Stock Company with Limited Liability, incorporated by an Amiri Decree issued on 22 December 1973 by His Highness The Ruler of Sharjah and was registered in February 1993 under Commercial Companies Law Number 8 of 1984 (as amended). The Bank commenced operations under a banking license issued from United Arab Emirates Central Bank dated 26 January 1974.
The Bank’s registered office is located at Al Khan Road, P.O. Box 1394, Sharjah, United Arab Emirates.
Principal Activities
The Bank’s principal activities are commercial and investment banking.
Results
The profit for the year ended 31 December 2016 amounted to AED 402 million (2015: AED 250 million). The total comprehensive income for the year ended 31 December 2016 amounted to AED 213 million (2015: AED 309 million) after taking into consideration unrealised loss on revaluation of financial assets and liabilities measured at fair value through other comprehensive income and through profit or loss due to credit risk, respectively, amounting to AED 190 million (2015: gain of AED 58 million). The detailed results are set out in the attached consolidated financial statements.
DirectorsThe Directors during the year were:
1. Mr. Ahmed Abdalla Al Noman (Chairman) 2. Sheikh Mohammed Bin Saud Al Qassimi3. Sheikh Seif Bin Mohd Bin Butti Al Hamed4. H.E. Humeid Naser Al Owais5. Mr. Abdul Rahman Bukhatir (resigned on 10 January 2017)6. Mr. Abdul Aziz Hassan Al Midfa7. Mr. Abdul Aziz Mubarak Al Hassawi8. Mr. Saud Al Besharah9. Mr. Francois Dauge10. Mr. Varouj Nerguizian
On behalf of the Board
Mr. Ahmed Abdalla Al Noman ChairmanSharjah22 February 2017

INDEPENDENT AUDITORS’
REPORT

Independent Auditors’ ReportTo the Shareholders of Bank of Sharjah P.J.S.C.
Report on the Audit of the Consolidated Financial Statements
Opinion
We have audited the consolidated financial statements of Bank of Sharjah P.J.S.C. (“the Bank”) and its subsidiaries (“the Group”), which comprise of the consolidated statement of financial position as at 31 December 2016, the consolidated statements of profit or loss, profit or loss and other comprehensive income, changes in equity and cash flows for the year then ended, and notes, comprising of significant accounting policies and other explanatory information.
In our opinion, the accompanying consolidated financial statements present fairly, in all material respects, the consolidated financial position of the Group as at 31 December 2016, and its consolidated financial performance and its consolidated cash flows for the year then ended in accordance with International Financial Reporting Standards (IFRS).
Basis for Opinion
We conducted our audit in accordance with International Standards on Auditing (ISAs). Our responsibilities under those standards are further described in the Auditors’ Responsibilities for the Audit of the Consolidated Financial Statements section of our report. We are independent of the Group in accordance with International Ethics Standards Board for Accountants Code of Ethics for Professional Accountants (IESBA Code) together with the ethical requirements that are relevant to our audit of the consolidated financial statements in the United Arab Emirates, and we have fulfilled our other ethical responsibilities in accordance with these requirements and the IESBA Code. We believe that the audit evidence we have obtained is sufficient and appropriate to provide a basis for our opinion.
Key Audit Matters
Key audit matters are those matters that, in our professional judgment, were of most significance in our audit of the consolidated financial statements of the current period. These matters were addressed in the context of our audit of the consolidated financial statements as a whole, and in forming our opinion thereon, and we do not provide a separate opinion on these matters.
Credit risk and impairment of loans and advances to customers
Refer to note 5.1(i), 9, 33 and 38 of the consolidated financial statements.
Impairment is a subjective area due to the level of judgement applied by the management in determining the impairment allowance. Due to the significance of loans and advances (representing 63% of total assets) and the related estimation uncertainty, this is considered a key audit matter.
Judgement is applied to determine appropriate parameters and assumptions used to calculate impairment. For example, the assumption of customers that will default, the valuation of collateral for secured lending and the future cash flows of corporate loan customers. In addition, we also focused on individually significant exposures that either continued to be, have become, or were at risk of being individually impaired.
Our Response
Our audit procedures included the assessment of controls over the approval, recording and monitoring of loans and advances, and evaluating the methodologies, inputs and assumptions used by the Group in calculating collectively assessed impairments, and assessing the adequacy of impairment allowances for individually assessed loans.

1. For the top 10 large corporate exposures that makes a significant portion of the gross loans of the Bank, our procedures included:
• Performing detailed credit assessments for each loan. We assessed the reasonableness of the forecast of recoverable cash flows, realisation of collateral and other possible sources of repayment. We compared key assumptions to progress against business plans and our own understanding of the relevant industries and business environment. We also compared them, where significant, to externally derived evidence such as audited accounts of the borrowers and real estate valuations for assessing the appropriateness of the collateral values held by the bank.
2. For the remaining corporate exposures, our procedures included:
• Testing the key controls over the internal credit grading and monitoring process, to assess if the risk grades allocated to counterparties were appropriately identified and updated, on a timely basis.
• Substantive testing of a selection of credit grades to test the appropriateness of the credit grades at a given point in time.
• Performing credit assessments for selected loans. We assessed the reasonableness of the forecast of recoverable cash flows, realisation of collateral and other possible sources of repayment. We compared key assumptions to progress against business plans and our own understanding of the relevant industries and business environment. We also compared them, where significant, to externally derived evidence such as audited accounts of the borrowers and real estate valuations for assessing the appropriateness of the collateral values held by the bank.
3. For collective provision, our procedures included:
• Testing the key management controls over the impact of underlying data into the models;
• Evaluating the methodology and the key assumptions and assessing the appropriateness of the emergence period used in determining the estimate and where possible, we compare the key assumptions used to externally available industry, financial and economic data.
• For judgemental overlays, we challenged management to provide objective evidence that the overlays were appropriate.
4. For the key underlying systems used for the processing of transactions we involved our information technology specialists to test a selection of automated controls within these systems.
5. Assessing whether the consolidated financial statement disclosures appropriately reflect the Group’s exposure to credit risk.
Valuation of Level 3 financial instruments
Refer to note 5.2(i), 10 and 40 of the consolidated financial statements.
The risk is that the valuation of financial instruments maybe misstated due to the application of valuation techniques which often involve the exercise of significant judgement and the use of assumptions and estimates.
Of the financial instruments that are held at fair value through profit or loss or as FVTOCI in the Group’s statement of financial position, 83% (2015: 84%) were measured using level 3 inputs in the fair value hierarchy as at 31 December 2016.
Financial instruments are classed at Level 3 because significant pricing inputs to them are unobservable. The determination of these prices is inherently more subjective and as such due to the uncertainty in estimating some of the fair values, this is considered as a key audit matter.
Our response
Our audit procedures included:
1. The assessment of controls over the identification, measurement and management of valuation risk, evaluating the methodologies, reasonableness of inputs and assumptions used by the Group in determining fair values.
2. Assessing, for a selection of investments, key inputs, assumptions, considering alternate valuation methods used by management and supporting to key factors.
3. We compared observable inputs against independent sources and externally available market data. For significant unobservable valuation inputs, we involved our valuation specialist to critically assess the reasonableness of the assumptions and models used by the management for valuation of level 3 investments.

4. Additionally, we assessed whether the consolidated financial statements disclosures of fair value risks and sensitivities appropriately reflect the Group’s exposure to valuation risk.
Management is responsible for the other information. Other information consists of the information included in the Group’s 2016 Annual Report, other than the consolidated financial statements and our auditors’ report thereon. We obtained the report of Group’s Board of Directors, prior to the date of our auditors’ report, and we expect to obtain the remaining sections of the Group’s 2016 Annual Report after the date of auditors’ report.
Our opinion on the consolidated financial statements does not cover the other information and we do not express any form of assurance conclusion thereon.
In connection with our audit of the consolidated financial statements, our responsibility is to read the other information and, in doing so, consider whether the other information is materially inconsistent with the consolidated financial statements or our knowledge obtained in the audit, or otherwise appears to be materially misstated. If, based on the work we have performed, we conclude that there is a material misstatement of this other information, we are required to report that fact. We have nothing to report in this regard.
When we will read the Reports, if we conclude that there is a material misstatement therein, we are required to communicate the matter to those charged with governance and take appropriate actions in accordance with ISAs.
Responsibilities of Management and Those Charged with Governance for the Consolidated Financial Statements
Management is responsible for the preparation and fair presentation of the consolidated financial statements in accordance with IFRSs and their preparation in compliance with the applicable provisions of the UAE Federal Law No. (2) of 2015, and for such internal control as management determines is necessary to enable the preparation of consolidated financial statements that are free from material misstatement, whether due to fraud or error.
In preparing the consolidated financial statements, management is responsible for assessing the Group’s ability to continue as a going concern, disclosing, as applicable, matters related to going concern and using the going concern basis of accounting unless management either intends to liquidate the Group or to cease operations, or has no realistic alternative but to do so.
Those charged with governance are responsible for overseeing the Group’s financial reporting process.
Auditors’ Responsibilities for the Audit of the Consolidated Financial Statements
Our objectives are to obtain reasonable assurance about whether the consolidated financial statements as a whole are free from material misstatement, whether due to fraud or error, and to issue an auditors’ report that includes our opinion. Reasonable assurance is a high level of assurance, but is not a guarantee that an audit conducted in accordance with ISAs will always detect a material misstatement when it exists. Misstatements can arise from fraud or error and are considered material if, individually or in the aggregate, they could reasonably be expected to influence the economic decisions of users taken on the basis of these consolidated financial statements.
As part of an audit in accordance with ISAs, we exercise professional judgment and maintain professional skepticism throughout the audit. We also:
• Identify and assess the risks of material misstatement of the consolidated financial statements, whether due to fraud or error, design and perform audit procedures responsive to those risks, and obtain audit evidence that is sufficient and appropriate to provide a basis for our opinion. The risk of not detecting a material misstatement resulting from fraud is higher than for one resulting from error, as fraud may involve collusion, forgery, intentional omissions, misrepresentations, or the override of internal control.
• Obtain an understanding of internal control relevant to the audit in order to design audit procedures that are appropriate in the circumstances, but not for the purpose of expressing an opinion on the effectiveness of the Group’s internal control.
• Evaluate the appropriateness of accounting policies used and the reasonableness of accounting estimates and related disclosures made by management.
• Conclude on the appropriateness of management’s use of the going concern basis of accounting and, based on the audit evidence obtained, whether a material uncertainty exists related to events or conditions that may cast significant doubt on the Group’s ability to continue as a going concern.
• If we conclude that a material uncertainty exists, we are required to draw attention in our auditors’ report to the related disclosures in the consolidated financial statements or, if such disclosures are inadequate, to modify our opinion. Our conclusions are based on the audit evidence obtained up to the date of our auditors’ report. However, future events or conditions may cause the Group to cease to continue as a going concern.

• Evaluate the overall presentation, structure and content of the consolidated financial statements, including the disclosures, and whether the consolidated financial statements represent the underlying transactions and events in a manner that achieves fair presentation.
• Obtain sufficient appropriate audit evidence regarding the financial information of the entities or business activities within the Group to express an opinion on the consolidated financial statements. We are responsible for the direction, supervision and performance of the group audit. We remain solely responsible for our audit opinion.
We communicate with those charged with governance regarding, among other matters, the planned scope and timing of the audit and significant audit findings, including any significant deficiencies in internal control that we identify during our audit.
We also provide those charged with governance with a statement that we have complied with relevant ethical requirements regarding independence, and communicate with them all relationships and other matters that may reasonably be thought to bear on our independence, and where applicable, related safeguards.
From the matters communicated with those charged with governance, we determine those matters that were of most significance in the audit of the consolidated financial statements of the current period and are therefore the key audit matters. We describe these matters in our auditors’ report unless law or regulation precludes public disclosure about the matter or when, in extremely rare circumstances, we determine that a matter should not be communicated in our report because the adverse consequences of doing so would reasonably be expected to outweigh the public interest benefits of such communication.
Report on Other Legal and Regulatory Requirements
Further, as required by the UAE Federal Law No. (2) of 2015, we report that:
i) we have obtained all the information and explanations we considered necessary for the purposes of our audit;
ii) the consolidated financial statements have been prepared and comply, in all material respects, with the applicable provisions of the UAE Federal Law No. (2) of 2015;
iii) the Group has maintained proper books of account;
iv) the financial information included in the Directors’ report, in so far as it relates to these consolidated financial statements, is consistent with the books of account of the Group;
v) as disclosed in note 10 to the consolidated financial statements, the Group has purchased shares during the year ended 31 December 2016;
vi) note 35 to the consolidated financial statements discloses material related party transactions and the terms under which they were conducted;
vii) based on the information that has been made available to us, nothing has come to our attention which causes us to believe that the Group has contravened during the financial year ended 31 December 2016 any of the applicable provisions of the UAE Federal Law No.(2) of 2015 or in respect of the Bank, its Articles of Association, which would materially affect its activities or its consolidated financial position as at 31 December 2016; and
viii) note 34 to the consolidated financial statements discloses the social contributions made during the year.
Further, as required by the UAE Union Law No (10) of 1980, as amended, we report that we have obtained all the information and explanations we considered necessary for the purposes of our audit.
On behalf of KPMG Lower Gulf Limited
Fawzi AbuRass Registered Auditor Number: 968Dubai, United Arab Emirates

CONSOLIDATED STATEMENT
OF FINANCIAL POSITION

Bank of Sharjah P.J.S.C.
Consolidated statement of financial positionAs at 31 December Notes 2016
AED’0002015
AED’000ASSETSCash and balances with central banks 6 4,308,887 6,436,195Deposits and balances due from banks 7 691,673 1,072,415Reverse-repo placements 8 639,476 -Loans and advances, net 9 17,074,997 15,036,621Other financial assets measured at fair value 10 1,100,834 1,214,878Other financial assets measured at amortised cost 10 747,237 527,330Investment properties 11 281,337 270,441Goodwill and other intangibles 12 228,324 234,234Other assets 13 1,750,008 2,519,598Property and equipment 15 274,196 275,206
Total assets 27,096,969 27,586,918
LIABILITIES AND EQUITYLiabilitiesCustomers’ deposits 18 19,736,917 19,491,815Deposits and balances due to banks 19 97,789 45,479Other liabilities 20 835,897 1,689,682Issued bonds 21 1,826,638 1,737,498
Total liabilities 22,497,241 22,964,474
EquityCapital and reservesShare capital 22 (a) 2,100,000 2,100,000Statutory reserve 22 (b) 1,050,000 1,050,000Contingency reserve 22 (c) 510,000 480,000General reserve 22 (d) 100,000 100,000Investment fair value reserve 22,836 212,432Retained earnings 606,035 476,485
Equity attributable to equity holders of the Bank 4,388,871 4,418,917Non-controlling interests 17 (b) 210,857 203,527
Total equity 4,599,728 4,622,444
Total liabilities and equity 27,096,969 27,586,918
Mr. Ahmed Abdalla Al Noman Mr. Varouj NerguizianChairman Executive Director & General Manager
The accompanying notes form an integral part of these consolidated financial statements.

CONSOLIDATED STATEMENT OF
PROFIT OR LOSS

Bank of Sharjah P.J.S.C.
Consolidated statement of profit or loss for the year ended 31 December
Notes 2016AED’000
2015AED’000
Interest income 28 1,054,337 1,028,211Interest expense 29 (532,355) (480,120)
Net interest income 521,982 548,091Net fee and commission income 30 173,979 160,113Exchange profit 21,046 21,473Income on investments 31 9,545 11,530Revaluation (loss)/gain on investment properties 11 (66) 4,143Other income 32 31,199 87,736
Operating income 757,685 833,086Net impairment loss on financial assets 33 (62,337) (297,006)
Net operating income 695,348 536,080General and administrative expenses 34 (276,242) (267,559)Amortisation of intangible assets 12 (b) (5,910) (7,784)
Profit before discontinued operations 413,196 260,737Discontinued operations 16 - (3,438)
Profit before taxes 413,196 257,299Income tax expense - overseas (11,040) (6,998)
Net profit for the year 402,156 250,301
Attributable to:Equity holders of the Bank 392,018 243,754Non-controlling interests 10,138 6,547
Net profit for the year 402,156 250,301
Basic and diluted earnings per share (AED) 23 0.19 0.12
The accompanying notes form an integral part of these consolidated financial statements.

CONSOLIDATED STATEMENT OF
PROFIT AND LOSS AND OTHER
COMPREHENSIVE INCOME

Bank of Sharjah P.J.S.C. Consolidated statement of profit and loss and other comprehensive income for the year ended 31 December
2016AED’000
2015AED’000
Net profit for the year 402,156 250,301
Other comprehensive income itemsItems that will not be reclassified subsequently to consolidated statement of profit or loss:
Net changes in fair value of financial assets measured at fair value through other comprehensive income
(100,989) (33,576)
Net changes in fair value of financial liabilities measured at fair value through profit or loss due to credit risk
(88,594) 92,003
Other comprehensive (loss)/income for the (189,583) 58,427
Total comprehensive income for the year 212,573 308,728
Attributable to:Equity holders of the Bank 202,422 302,177Non-controlling interests 10,151 6,551
Total comprehensive income for the year 212,573 308,728
The accompanying notes form an integral part of these consolidated financial statements.

CONSOLIDATED STATEMENT OF
CHANGES IN EQUITY

Consolidated statement of changes in equityfor the year ended 31 December
Sharecapital
Treasury shares
Statutoryreserve
Contin-gency
reserveGeneralreserve
Investmentfair value
reserveRetainedearnings
Total equity
attribut-able to
owners of the parent
Non-controlling
interestsTotal
equityAED’000 AED’000 AED’000 AED’000 AED’000 AED’000 AED’000 AED’000 AED’000 AED’000
Balance at 1 January 2015 2,100,000 (196,726) 1,050,000 450,000 100,000 154,009 543,427 4,200,710 211,949 4,412,659Profit for the year - - - - - - 243,754 243,754 6,547 250,301Other comprehensive income
- - - - - 58,423 - 58,423 4 58,427
Total comprehensive income for the year
- - - - - 58,423 243,754 302,177 6,551 308,728
Resale of investments (Note 16)
- - - - - - - - (12,515) (12,515)
Transactions with owners of the GroupTreasury shares (Note 24) - 196,726 - - - - (196,726) - - -Directors’ remuneration (Note 24)
- - - - - - (9,970) (9,970) (617) (10,587)
Charity donations (Note 24) - - - - - - (2,500) (2,500) - (2,500)Transfer to contingency reserve
- - - 30,000 - - (30,000) - - -
Cash dividends (Note 24) - - - - - - (71,500) (71,500) (1,841) (73,341)
Balance at 31 December 2015
2,100,000 - 1,050,000 480,000 100,000 212,432 476,485 4,418,917 203,527 4,622,444
Profit for the year - - - - - - 392,018 392,018 10,138 402,156Other comprehensive loss
- - - - - (189,596) - (189,596) 13 (189,583)
Total comprehensive income for the year
- - - - - (189,596) 392,018 202,422 10,151 212,573
Transactions with owners of the GroupDirectors’ remuneration (Note 24)
- - - - - - (9,968) (9,968) (617) (10,585)
Charity donations (Note 24) - - - - - - (2,500) (2,500) - (2,500)Transfer to contingency reserve
- - - 30,000 - - (30,000) - - -
Treasury shares (Note 24) - - - - - - (220,000) (220,000) - (220,000)Cash Dividends (Note 24) - - - - - - - - (2,204) (2,204)
Balance at 31 December 2016
2,100,000 - 1,050,000 510,000 100,000 22,836 606,035 4,388,871 210,857 4,599,728
The accompanying notes form an integral part of these consolidated financial statements.
Bank of Sharjah P.J.S.C. Consolidated statement of changes in equity for the year ended 31 December

CONSOLIDATED STATEMENT OF
CASH FLOWS

Bank of Sharjah P.J.S.C. Consolidated statement of cash flowsfor the year ended 31 December
2016AED’000
2015AED’000
Cash flows from operating activitiesProfit for the year 402,156 250,301Adjustments for:Depreciation of property and equipment 25,386 35,064Amortisation of other intangible assets 5,910 7,784Amortisation of premium on debt instruments 504 162Gain on sale of property and equipment (209) (46,189)Net fair value gain on issued debt securities (4,507) (511)Net fair value loss on interest rate swaps 4,507 511Gain on sale of investment properties - (5,894)Net fair value loss/ (gain) on other financial assets 1,771 (3,873)Fair value gain on revaluation of investment properties (66) (4,143)Unrealized loss on assets acquired in settlement of debts 3,264 -Amortization of transaction costs on issued bonds 6,489 -Net impairment loss on financial assets 62,337 297,006Dividends income (2,798) (1,835)Operating profit before changes in operating assets and liabilities 504,876 528,383Changes in Deposits and balances due from banks maturing after three months
(121,882) (175,031)
Statutory deposits with central banks (51,720) (31,016)Loans and advances (2,313,687) (1,253,525)Other assets 751,328 (706,472)Customers’ deposits 245,102 1,690,933Other liabilities (860,238) 8,312
Cash (used in)/generated from operating activities (1,846,221) 61,584Payment of directors’ remuneration and charity donations
(13,085) (13,087)
Net cash (used in)/generated from operating activities (1,859,306) 48,497
Cash flows from investing activitiesPurchase of property and equipment (25,232) (37,384)Proceeds from sale of property and equipment 1,065 81,370Purchase of other financial assets (516,558) (189,058)Proceeds from sale of investment properties - 250,878Additions to investment properties (812) (190,867)Proceeds from sale of other financial assets 305,759 180,966Dividends received 2,798 1,835
Net cash (used in)/generated from investing activities (232,980) 97,740
Cash flows from financing activitiesDividends paid (2,204) (69,441)Issued bonds - 1,829,498Syndicated loan - (734,600)
Net cash (used in)/generated from financing activities (2,204) 1,025,457
Net (decrease)/increase in cash and cash equivalents (2,094,490) 1,171,694Cash and cash equivalents at the beginning of the year 5,110,335 3,938,641
Cash and cash equivalents at the end of the year (Note 26) 3,015,845 5,110,335
The accompanying notes form an integral part of these consolidated financial statements.

NOTES TO THE CONSOLIDATED
FINANCIAL STATEMENTS

1. General information
Bank of Sharjah P.J.S.C. (the “Bank”), is a public joint stock company incorporated by an Amiri Decree issued on 22 December 1973 by His Highness The Ruler of Sharjah and was registered in February 1993 under the Commercial Companies Law Number 8 of 1984 (as amended). The Bank commenced its operations under a banking license issued by the United Arab Emirates Central Bank dated 26 January 1974. The Bank is engaged in commercial and investment banking activities.
The Bank’s registered office is located at Al Khan Road, P.O. Box 1394, Sharjah, United Arab Emirates. The Bank operates through five branches in the United Arab Emirates located in the Emirates of Sharjah, Dubai, Abu Dhabi, and City of Al Ain.
The accompanying consolidated financial statements combine the activities of the Bank and its subsidiaries (collectively the “Group”).
2. Application of new and revised International Financial Reporting Standards (“IFRSs”)
New and revised IFRSs in issue but not yet effective and not early adopted
The Group has not early applied the following new standards, amendments and interpretations that have been issued but are not yet effective:
New and revised IFRSs
Effective for annual periods beginning
on or after
• IFRS 9 (Phase II and Phase III) includes new guidance on expected credit loss model for calculating impairment on financial assets and a new general hedge accounting requirements. It also carries forward the guidance on recognition and derecognition of financial instruments from IAS 39. The Bank has performed a preliminary assessment of the impact of IFRS 9 ‘Financial Instruments’ as per the instructions of the Central Bank of UAE. The Bank’s focus continues to be on developing the impairment models and processes which are needed for the parallel run during 2017 in order to be fully compliant with IFRS 9. The Bank believes that once they finalize the impairment model and processes, they will be in a better position to assess the potential impact of IFRS 9 on the consolidated financial statements and any consequential effects on regulatory capital requirements
1 January 2018
• IFRS 15 Revenue from Contracts with Customers: IFRS 15 provides a single, principles based five-step model to be applied to all contracts with customers.
1 January 2017
Bank of Sharjah P.J.S.C. Notes to the consolidated financial statementsfor the year ended 31 December 2016

2. Application of new and revised International Financial Reporting Standards (“IFRSs”) Standards and interpretation adopted for accounting periods beginning on 1 January 2016
New and revised IFRSs Effective for annual periods beginning on or after
• IFRS 14 Regulatory Deferral Accounts issued in January 2014 specifies the financial reporting requirements for ‘regulatory deferral account balance’ that arise when an entity provides good or services to customers at a price or rate that is subject to rate regulation.
1 January 2016
• Annual Improvements to IFRSs 2012 - 2014 Cycle that include amendments to IFRS 5, IFRS 7, IAS 19 and IAS 34.
1 January 2016
• Amendments to IAS 16 and IAS 38 to clarify the acceptable methods of depreciation and amortisation.
1 January 2016
• Amendments to IFRS 11 to clarify accounting for acquisitions of Interests in Joint Operations.
1 January 2016
• Amendments to IAS 16 and IAS 41 require biological assets that meet the definition of a bearer plant to be accounted for as property, plant and equipment in accordance with IAS 16.
1 January 2016
• Amendments to IFRS 10 and IAS 28 clarify that the recognition of the gain or loss on the sale or contribution of assets between an investor and its associate or joint venture depends on whether the assets sold or contributed constitute a business.
1 January 2016
• Amendments to IAS 27 allow an entity to account for investments in subsidiaries, joint ventures and associates either at cost, in accordance with IAS 39/IFRS 9 or using the equity method in an entity’s separate financial statements.
1 January 2016
• Amendments to IFRS 10 and IAS 28 clarifying certain aspects of applying the consolidation exception for investment entities.
1 January 2016
• Amendments to IAS 1 to address perceived impediments topreparers exercising their judgment in presenting their financial reports.
1 January 2016
Management anticipates that these new standards, interpretations and amendments will be adopted in the Group’s consolidated financial statements for the period beginning 1 January 2016 or as and when they are applicable and adoption of these new standards, interpretations and amendments, except for IFRS 9, may have no material impact on the consolidated financial statements of the Group in the period of initial application.
3. Basis of preparation
3.1 Statement of compliance
The consolidated financial statements have been prepared in accordance with the International Accounting Standard No. 34 - Interim Financial Reporting (“IAS 34”) issued by the International Accounting Standards Board and also comply with the applicable requirements of the laws in the U.A.E. and U.A.E. Central Bank regulations. UAE Federal Law No 2 of 2015 (“UAE Companies Law of 2015”) was issued on 1 April 2015 and has come into force on 1 July 2015. Companies are allowed to ensure compliance with the UAE Companies Law of 2015 by 30 June 2017 as per the transitional provisions contained therein. The Bank is currently in the process of implementing all changes required by the UAE Companies Law of 2015.
3.2 Basis of measurement
The consolidated financial statements have been prepared on the historical cost basis except for certain financial instruments that are measured at fair values at the end of each reporting period, as explained in the accounting policies below.
Historical cost is generally based on the fair value of the consideration given in exchange for assets, goods and services.

3. Basis of preparation
3.3 Functional and presentation currency
The consolidated financial statements are presented in Arab Emirates Dirham (AED) and all values are rounded to the nearest thousands dirham, except when otherwise indicated.
The principal accounting policies are set out below.
4- Summary of significant accounting policies
4.1 Basis of consolidation
These consolidated financial statements incorporate the financial statements of the Bank and entities controlled by the Bank. Control is achieved when the Bank has:• power over the investee, • exposure, or has rights, to variable returns from its involvement with the investee; and • the ability to use its power over the investee to affect its returns.
The Bank reassesses whether or not it controls an investee if facts and circumstances indicate that there are changes to one or more of the three elements of control listed above.
When the Bank has less than a majority of the voting rights of an investee, it has power over the investee when the voting rights are sufficient to give it the practical ability to direct the relevant activities of the investee unilaterally. The Bank considers all relevant facts and circumstances in assessing whether or not the Bank’s voting rights in an investee are sufficient to give it power, including:
• the size of the Bank’s holding of voting rights relative to the size and dispersion of holdings of the other vote holders;
• potential voting rights held by the Bank, other vote holders and other parties;• rights raising from other contractual arrangements; and • any additional facts and circumstances that indicate that the Bank has, or does not have, the current
ability to direct the relevant activities at the time that decisions need to be made, including voting patterns and previous shareholders’ meetings.
Consolidation of a subsidiary begins when the Bank obtains control over the subsidiary and ceases when the Bank loses control of the subsidiary. Specifically, income and expenses of a subsidiary acquired or disposed of during the year are included in the consolidated statement of profit or loss from the date the Bank gains control until the date when the Bank ceases to control the subsidiary.
Profit or loss and each component of other comprehensive income are attributable to the owners of the Bank and to the non-controlling interests. Total comprehensive income of the subsidiaries is attributable to the owners of the parent and to the non-controlling interest even if this results in the non-controlling interests having a deficit balance.
When necessary, adjustments are made to the financial statements of subsidiaries to bring their accounting policies into line with the Bank’s accounting policies.
All intragroup assets, liabilities, equity, income, expenses and cash flows relating to transactions between entities of the Bank are eliminated in full on consolidation.
Changes in the Bank’s ownership interests in subsidiaries that do not result in the Bank losing control over the subsidiaries are accounted for as equity transactions. The carrying amounts of the Bank’s interests and the non-controlling interests are adjusted to reflect the changes in their relative interests in the subsidiaries. Any difference between the amount by which the non-controlling interests are adjusted and the fair value of the consideration paid/payable or received/receivable is recognised directly in equity and attributed to owners of the Bank.
When the Bank loses control of a subsidiary, a gain or loss is recognised in the consolidated statement of profit or loss and is calculated as the difference between (i) the aggregate of the fair value of the consideration received and the fair value of any retained interest, and (ii) the previous carrying amount of the assets (including goodwill) and liabilities of the subsidiary, and any non-controlling interests. All amounts previously recognised in other comprehensive income in relation to that subsidiary are accounted for as if the Bank had directly disposed of the related assets or liabilities of the subsidiary (i.e. reclassified to statement of profit or loss or transferred to another category of equity as specified/permitted by applicable IFRSs). The fair value of any investment retained in the former subsidiary at the date when control is lost is regarded as the fair value on initial recognition for subsequent accounting under IFRS 9, when applicable, the cost on initial recognition of an investment in an associate or a joint venture.

4. Summary of significant accounting policies
4.2 Cash and cash equivalents
Cash and cash equivalents disclosed in the consolidated statement of cash flows consist of cash on hand, current accounts and other balances with central banks, certificate of deposits, balances with banks, and money market placements which have original maturity of less than three months from the date of acquisition.
4.3 Due from banks
Due from banks are stated at cost less any amounts written-off and allowance for impairment, if any. 4.4 Reverse-repo placements
Securities sold subject to a commitment to repurchase them at a predetermined price at a specified future date (repos) are continued to be recognised in the consolidated statement of financial position and a liability is recorded in respect of the consideration received under repo borrowings. The difference between sale and repurchase price is treated as an interest expense using the effective interest rate yield method over the life of the agreement. Assets purchased with a corresponding commitment to resell at a specified future date (reverse repos) are not recognised in the consolidated statement of financial position. Amounts placed under these agreements are included as an asset under reverse-repo placements. The difference between purchase and resale price is treated as interest income using the effective yield method over the life of the agreement.
4.5 Financial instruments 4.5.1 Initial recognition
The Group recognises a financial asset or liability in its consolidated statement of financial position only when it becomes party to the contractual provisions of that instrument.
4.5.2 Initial measurement
Financial assets and liabilities are initially measured at fair value. Transaction costs that are directly attributable to the acquisition or issue of financial assets and liabilities (other than financial assets and financial liabilities at fair value through profit or loss) are added to or deducted from the fair value of the financial assets or financial liabilities, as appropriate, on initial recognition. Transaction costs directly attributable to the acquisition of financial assets or financial liabilities at fair value through profit or loss are recognised immediately in the consolidated statement of profit or loss.
4.5.3 Financial assets
All regular way purchases or sales of financial assets are recognised and derecognised on a trade date basis. Regular way purchases or sales are purchases or sales of financial assets that require delivery of assets within the time frame established by regulation or convention in the marketplace.
All recognised financial assets are subsequently measured in their entirety at either amortised cost or fair value, depending on the classification of the financial assets.
Classification of financial assets
For the purposes of classifying financial assets an instrument is an ‘equity instrument’ if it is a non-derivative and meets the definition of ‘equity’ for the issuer except for certain non-derivative puttable instruments presented as equity by the issuer. All other non-derivative financial assets are ‘debt instruments’. Balances with central banks, due from banks and financial institutions, financial assets and certain items in receivables and other assets that meet the following conditions are subsequently measured at amortised cost less impairment loss and deferred income, if any (except for those assets that are designated as at fair value through profit or loss on initial recognition):
• the asset is held within a business model whose objective is to hold assets in order to collect contractual cash flows; and
• the contractual terms of the instrument give rise on specified dates to cash flows that are solely payments of principal and profit on the principal amount outstanding.
All other financial assets are subsequently measured at fair value. Financial assets measured at amortised cost The effective interest rate method is a method of calculating the amortised cost of those financial instruments measured at amortised cost and of allocating income over the relevant period. The effective interest rate is the rate that is used to calculate the present value of the estimated future cash receipts (including all fees and points paid or received that form an integral part of the effective interest rate, transaction costs and other premiums or discounts) through the expected life of the financial instruments, or, where appropriate, a shorter period, to arrive at the net carrying amount on initial recognition.Income is recognised in the consolidated statement of profit or loss on an effective interest rate basis for financing and investing instruments measured subsequently at amortised cost.

4. Summary of significant accounting policies
4.5.3 Financial assets Financial assets measured at FVTPL Investments in equity instruments are classified as financial assets measured at FVTPL, unless the Group designates fair value through other comprehensive income (FVTOCI) at initial recognition.
Financial assets that do not meet the amortised cost criteria described above, or that meet the criteria but the Group has chosen to designate as at FVTPL at initial recognition, are measured at FVTPL.
Financial assets (other than equity instruments) may be designated at FVTPL upon initial recognition if such designation eliminates or significantly reduces a measurement or recognition inconsistency that would arise from measuring assets or liabilities or recognizing the gains or losses on them on different basis.
Financial assets are reclassified from amortised cost to FVTPL when the business model is changed such that the amortised cost criteria are no longer met.
Reclassification of financial assets (other than equity instruments) designated as at FVTPL at initial recognition is not permitted. Financial assets measured at FVTPL are measured at fair value at the end of each reporting period, with any gains or losses arising on re-measurement recognised in the consolidated statement of profit or loss at the end of each reporting period. The net gain or loss recognised in the consolidated statement of profit or loss. Fair value is determined in the manner described in note 40. Dividend income on investments in equity instruments at FVTPL is recognised in the consolidated statement of profit or loss when the Group’s right to receive the dividends is established.
Financial assets measured at FVTOCI On initial recognition, the Group can make an irrevocable election (on an instrument-by-instrument basis) to designate investments in equity instruments as at FVTOCI. Designation at FVTOCI is not permitted if the equity investment is held for trading. A financial asset is held for trading if: • it has been acquired principally for the purpose of selling it in the near term; • on initial recognition it is part of a portfolio of identified financial instruments that the Group manages
together and has evidence of a recent actual pattern of short-term profit-taking; or • it is a derivative that is not designated and effective as a hedging instrument or a financial guarantee. Investments in equity instruments at FVTOCI are initially measured at fair value plus transaction costs. Subsequently, they are measured at fair value with gains and losses arising from changes in fair value recognised in other comprehensive income and accumulated in the investments fair value reserve. Where the asset is disposed of, the cumulative gain or loss previously accumulated in the investments fair value reserve is not transferred to consolidated statement of profit or loss. Dividends on these investments in equity instruments are recognised in the consolidated statement of profit or loss when the Group’s right to receive the dividends is established, unless the dividends clearly represent a recovery of part of the cost of the investment.
4.6 Definition of fair value
Fair value is the price that would be received to sell an asset or paid to transfer a liability in an orderly transaction between market participants at the measurement date, regardless of whether that price is directly observable or estimated using another valuation technique. In estimating the fair value of an asset or a liability, the Group takes into account when pricing the asset or liability if market participants would take those characteristics into account when pricing the asset or liability at the measurement date. Fair value for measurement and/or disclosure purposes in these consolidated financial statements is determined on such a basis, except for measurements that have some similarities to fair value but are not fair value such as value in use in IAS 36.
All financial instruments are recognised initially at fair value. The fair value of a financial instrument on initial recognition is normally the transaction price, i.e. the fair value of the consideration given or received.
• The fair value of financial assets and financial liabilities with standard terms and conditions and traded on active liquid markets is determined with reference to quoted market prices;
• The fair value of other financial assets and financial liabilities (excluding derivative instruments) is determined in accordance with generally accepted pricing models based on discounted cash flow analysis using prices from observable current market transactions and dealer quotes for similar instruments; and
• The fair value of derivative instruments is calculated using quoted prices. Where such prices are not available, use is made of discounted cash flow analysis using the applicable yield curve for the duration of the instruments for non-optional derivatives, and option pricing models for optional derivatives.

4. Summary of significant accounting policies
4.7 Investment properties
Investment properties are held to earn rental income and/or capital appreciation. Investment properties include cost of initial purchase, developments transferred from property under development, subsequent cost of development, and fair value adjustments. Investment properties are reported at valuation based on fair value at the end of the reporting period. The fair value is determined on a periodic basis by independent professional valuers. Fair value adjustments on investment property are included in the consolidated statement of profit or loss in the period in which these gains or losses arise.
Investment properties are derecognised when either they have been disposed of or when the investment property is permanently withdrawn from use and no future economic benefit is expected from its disposal. The difference between the net disposal proceeds and the carrying amount of the asset is recognised in the consolidated statement of profit or loss in the period of derecognition.
Transfers are made to or from investment property only when there is a change in use. For a transfer from investment property to owner occupied property, the deemed cost for subsequent accounting is the fair value at the date of change in use. If owner occupied property becomes an investment property, the Group accounts for such property in accordance with the policy stated under property, plant and equipment up to the date of change in use.
4.8 Property and equipment
Property and equipment are stated at historical cost less accumulated depreciation and impairment loss, if any. Historical cost includes expenditure that is directly attributable to the acquisition of the asset.
Depreciation is charged so as to write off the cost or valuation of assets, over their estimated useful lives using the straight-line method as follows:
Years
Buildings 20 - 40Furniture and office equipment 2 - 6Installation, partitions and decorations 3 - 4Leasehold improvements 5 - 10Motor vehicles 3
Subsequent costs are included in the asset’s carrying amount or recognized as a separate asset, as appropriate, only when it is probable that future economic benefits associated with the item will flow to the Group and the cost of the item can be measured reliably. All other repairs and maintenance are charged to the consolidated statement of other comprehensive income when incurred.
Gain or loss arising on the disposal or retirement of an asset is determined as the difference between the sales proceeds and the carrying amount of the asset at that date and is recognised in the consolidated statement of profit or loss.
Capital work-in-progress is carried at cost, less any accumulated impairment loss. Cost includes professional fees and, for qualifying assets, borrowing costs capitalised in accordance with the Group’s accounting policy. Depreciation of these assets commences when the assets are ready for their intended use.
4.9 Intangible assets acquired separately
Intangible assets acquired in a business combination and recognised separately from goodwill are initially recognised at their fair value at the acquisition date (which is regarded as their cost).
Subsequent to initial recognition, intangible assets acquired in a business combination are reported at cost less accumulated amortisation and accumulated impairment losses. Amortisation is recognised on a straight-line basis over their estimated useful lives. The estimated useful life and amortisation method are reviewed at the end of each annual reporting period, with the effect of any changes in estimate being accounted for on a prospective basis.
4. Summary of significant accounting policies
4.9 Intangible assets acquired separately
Amortisation is charged so as to write off the cost of intangible assets, over their estimated useful lives using the straight-line method as follows:
YearsBanking license IndefiniteLegal corporate setup in Lebanon 10Customer base 10Branch network 10
4.10 Impairment of tangible and intangibles At the end of each reporting period, the Group reviews the carrying amounts of its tangible and intangibles to determine whether there is any indication that those assets have suffered an impairment loss. If any such indication exists, the recoverable amount of the assets is estimated in order to determine the extent of the impairment loss, if any. Where it is not possible to estimate the recoverable amount of an individual asset, the Group estimates the recoverable amount of the cash-generating unit to which the asset belongs.
The recoverable amount is the higher of fair value less costs to sell and value in use. In assessing value in use, the estimated future cash flows are discounted to their present value using a pre-tax discount rate that reflects current market assessments of the time value of money and the risks specific to the asset.
If the recoverable amount of an asset (or cash-generating unit) is estimated to be less than its carrying amount, the carrying amount of the asset (cash-generating unit) is reduced to its recoverable amount. An impairment loss is recognised in the consolidated statement of profit or loss, unless the relevant asset is carried at a revalued amount, in which case the impairment loss is treated as a revaluation decrease.
Where an impairment loss subsequently reverses, the carrying amount of the asset (cash-generating unit) is increased to the revised estimate of its recoverable amount, such that the increased carrying amount does not exceed the carrying amount that would have been determined had no impairment loss been recognised for the asset (cash-generating unit) in prior years. A reversal of an impairment loss is recognised in the consolidated statement of profit or loss, unless the relevant asset is carried at a revalued amount, in which case the reversal of the impairment loss is treated as a revaluation increase.
4.11 Impairment of financial assets
Financial assets that are measured at amortised cost are assessed for impairment at the end of each reporting period. Financial assets are considered to be impaired when there is objective evidence that, as a result of one or more events that occurred after the initial recognition of the financial assets, the estimated future cash flows of the asset have been affected.
Objective evidence of impairment could include:
• significant financial difficulty of the issuer or counterparty; or
• breach of contract, such as a default or delinquency in interest or principal payments; or• it’s becoming probable that the borrower will enter bankruptcy or financial re-organisation; or • the disappearance of an active market for that financial asset because of financial difficulties.
The amount of the impairment loss recognised is the difference between the asset’s carrying amount and the present value of estimated future cash flows reflecting the amount of collateral and guarantee, discounted at the financial asset’s original effective interest rate.
The carrying amount of the financial asset is reduced by the impairment loss directly for all financial assets with the exception of loans and advances, where the carrying amount is reduced through the use of an allowance account. When a loan is considered uncollectible, it is written off against the allowance account. Subsequent recoveries of amounts previously written off are credited against the allowance account. Changes in the carrying amount of the allowance account are recognised in the consolidated statement of profit or loss.
If, in a subsequent period, the amount of the impairment loss decreases and the decrease can be related objectively to an event occurring after the impairment was recognised, the previously recognised impairment loss is reversed through the consolidated statement of profit or loss to the extent that the carrying amount of the financial asset at the date the impairment is reversed does not exceed what the amortised cost would have been had the impairment not been recognised.
Impairment of loans and advances measured at amortised costs are assessed by the Group as follows:

Individually assessed loans
Individually assessed loans mainly represent corporate and commercial loans which are assessed individually in order to determine whether there exists any objective evidence that a loan is impaired. Loans are classified as impaired as soon as there is doubt about the borrower’s ability to meet payment obligations to the Group in accordance with the original contractual terms. Doubt about the borrower’s ability to meet payment obligations generally arises when:
a) Principal and interest are not serviced as per contractual terms; and b) When there is significant deterioration in the borrower’s financial condition and the amount expected to
be realised from disposal of collateral, if any, is not likely to cover the present carrying value of the loan.
Impaired loans are measured on the basis of the present value of expected future cash flows discounted at the loan’s effective interest rate or, as a practical expedient, at the loan’s observable market price or fair value of the collateral if the loan is collateral dependent.
Impairment loss is calculated as the difference between the loan’s carrying value and its present impaired value.
Collectively assessed loans
Impairment losses of collectively assessed loans include the allowances calculated on:
a) Performing loansb) Retail loans with common features and which are not individually significant.
Performing loans
Where individually assessed loans are evaluated and no evidence of loss has been identified, these loans are classified as performing loans portfolios with common credit risk characteristics based on industry, product or loan rating. Impairment covers losses which may arise from individual performing loans that are impaired at the end of the reporting period but were not specifically identified as such until sometime in the future. The estimated impairment is calculated by the Group’s management for each identified portfolio based on historical experience and the assessed inherent losses which are reflected by the economic and credit conditions.
Retail loans with common features and which are not individually significant
Impairment of retail loans is calculated by applying a formulaic approach which allocates progressively higher loss rates in line with the overdue instalment date.
Renegotiated loans
Retail loans, which are subject to collective impairment review and whose terms have been renegotiated, are no longer considered to be past due and consequently impaired only when the minimum required number of payments under the new arrangements has not been received and the borrower has not complied with the revised terms and conditions.
Loans subject to individual impairment assessment, whose terms have been renegotiated, are subject to continuous review to determine whether they remain impaired or are considered to be past due depending upon the borrower complying with the revised terms and conditions and making the minimum required payments for the loans to be moved to performing category.
Loans that are either subject to collective impairment assessment or are individually significant and whose terms have been renegotiated are no longer considered to be past due but are treated as new loans. In subsequent years, the asset is considered to be past due and disclosed only if renegotiated.
4.12 Derecognition of financial assets
The Group derecognises a financial asset only when the contractual rights to the cash flows from the asset expire, or when it transfers the financial asset and substantially all the risks and rewards of ownership of the asset to another entity. If the Group neither transfers nor retains substantially all the risks and rewards of ownership and continues to control the transferred asset, the Group recognises its retained interest in the asset and an associated liability for amounts it may have to pay. If the Group retains substantially all the risks and rewards of ownership of a transferred financial asset, the Group continues to recognise the financial asset and also recognises a collateralised borrowing for the proceeds received.
On derecognition of a financial asset measured at amortised cost, the difference between the asset’s carrying amount and the sum of the consideration received and receivable is recognised in the consolidated statement of profit or loss.
On derecognition of a financial asset that is classified as FVTOCI, the cumulative gain or loss previously accumulated in the investments fair value reserve is not reclassified to the consolidated statement of profit or loss, but is reclassified to retained earnings within equity.

4. Summary of significant accounting policies
4.13 Offsetting
Financial assets and liabilities are offset and reported net in the consolidated financial position only when there is a legally enforceable right to set off the recognised amounts and when the Group intends to settle either on a net basis, or to realise the asset and settle the liability simultaneously.
Income and expenses are presented on a net basis only when permitted by the accounting standards, or for gains and losses arising from a group of similar transactions such as in the Group trading activity.
The Group is party to a number of arrangements, including master netting agreements, that give it the right to offset financial assets and financial liabilities but where it does not intend to settle the amounts net or simultaneously and therefore the assets and liabilities concerned are presented on a gross basis.
4.14 Assets acquired in settlement of debt
The Group occasionally acquires real estate and other collateral in settlement of certain loans and advances. Such real estate and other collateral are stated at the lower of the net realisable value of the loans and advances and the current fair value of such assets at the date of acquisition. Gains or losses on disposal and unrealised losses on revaluation are recognised in the consolidated statement of profit or loss.
4.15 Derivative financial instruments
A derivative is a financial instrument whose value changes in response to an underlying variable, that requires little or no initial investment and that is settled at a future date.
The Group enters into a variety of derivative financial instruments to manage its exposure to foreign exchange rate risks, including forward foreign exchange contracts, interest rate swaps and currency swaps.
Derivative financial instruments are initially measured at cost, being the fair value at contract date, and are subsequently re-measured at fair value. All derivatives are carried at their fair values as assets where the fair values are positive and as liabilities where the fair values are negative.
Fair values are generally obtained by reference to quoted market prices, discounted cash flow models and recognised pricing models as appropriate.
For the purpose of hedge accounting, the Group classifies hedges into two categories: (a) fair value hedges, which hedge the exposure to changes in the fair value of a recognised asset or liability; and (b) cash flow hedges, which hedge exposure to variability in cash flows that are either attributable to a particular risk associated with a recognised asset or liability, or a highly probable forecasted transaction that will affect future reported net income.
In order to qualify for hedge accounting, it is required that the hedge should be expected to be highly effective, i.e. the changes in fair value or cash flows of the hedging instrument should effectively offset corresponding changes in the hedged item and should be reliably measurable. At inception of the hedge, the risk management objectives and strategies are documented including the identification of the hedging instrument, the related hedged item, the nature of risk being hedged, and how the Group will assess the effectiveness of the hedging relationship. Subsequently, the hedge is required to be assessed and determined to be an effective hedge on an ongoing basis.
Fair value hedges
Where a hedging relationship is designated as a fair value hedge, the hedged item is adjusted for the change in fair value in respect of the risk being hedged. Gains or losses on the re-measurement of both the derivative and the hedged item are recognised in the consolidated statement of profit or loss. Fair value adjustments relating to the hedging instrument are allocated to the same consolidated statement of profit or loss category as the related hedged item. Any ineffectiveness is also recognised in the same consolidated statement of profit or loss category as the related hedged item. If the derivative expires, is sold, terminated, exercised, no longer meets the criteria for fair value hedge accounting, or the designation is revoked, hedge accounting is discontinued. Any adjustment up to that point to a hedged item for which the effective interest method is used, is amortised in the consolidated statement of profit or loss as part of the recalculated effective interest rate over the period to maturity.
Cash flow hedges
The effective portion of changes in the fair value of derivatives that are designated and qualify as cash flow hedges are recognised in the cash flow hedging reserve in equity. The ineffective part of any gain or loss is recognised immediately in the consolidated statement of profit or loss as trading revenue/loss. Amounts accumulated in equity are transferred to the consolidated statement of profit or loss in the periods in which the hedged item affects profit or loss. However, when the forecast transaction that is hedged results in the recognition of a non-financial asset or a non-financial liability, the cumulative gains or losses previously deferred in equity are transferred from equity and included in the initial measurement of the cost of the asset

4. Summary of significant accounting policies
4.15 Derivative financial instruments
or liability. When a hedging instrument expires or is sold, or when a hedge no longer meets the criteria for hedge accounting, the cumulative gains or losses recognised in other comprehensive income remain in equity until the forecast transaction is recognised, in the case of a non-financial asset or a non-financial liability, or until the forecast transaction affects the consolidated statement of profit or loss. If the forecast transaction is no longer expected to occur, the cumulative gains or losses recognised in other comprehensive income are immediately transferred to the consolidated statement of profit or loss and classified as trading revenue/loss.
Derivatives that do not qualify for hedge accounting
All gains and losses from changes in the fair values of derivatives that do not qualify for hedge accounting are recognised immediately in the consolidated statement of profit or loss as trading revenue/loss. However, the gains and losses arising from changes in the fair values of derivatives that are managed in conjunction with financial instruments designated at fair value are included in net income from financial instruments designated at fair value under other non-interest revenue/loss.
Derivatives embedded in other financial instruments or other non-financial host contracts are treated as separate derivatives when their risks and characteristics are not closely related to those of the host contract and the host contract is not carried at fair value with unrealised gains or losses reported in the consolidated statement of profit or loss.
4.16 Financial liabilities
Financial liabilities are classified as either financial liabilities ‘at FVTPL’ or ‘other financial liabilities’. The Group initially recognises financial liabilities such as deposits and debt securities issued on the date at which they are originated. All other financial liabilities (including liabilities designated at fair value through profit or loss) are initially recognised on the trade date at which the Group becomes party to the contractual provision of the instrument. Financial liabilities at FVTPL Financial liabilities are classified at FVTPL where the financial liability is either held for trading or it is designated at FVTPL and measured at fair value. Determination is made at initial recognition and is not reassessed.
Financial liabilities measured at FVTPL are measured at fair value at the end of each reporting period, with any gains or losses arising on re-measurement recognised in the consolidated statement of profit or loss at the end of each reporting period. The net gain or loss recognised in the consolidated statement of profit or loss. Other changes in fair value attributable to credit risk are recognized in other comprehensive income. Amounts presented in other comprehensive income shall not be subsequently transferred to profit or loss. However, the Bank may transfer the cumulative gain or loss within equity. Fair value is determined in the manner described in note 40. The Bank has elected to designate the issued bond as at FVTPL as the Bank will be managing and evaluating the performance of the issued bond alongside a group of financial assets in such a way that measuring that a group at FVTPL results in more relevant information. Other financial liabilities Other financial liabilities, including borrowings, are initially measured at fair value, net of transaction costs. Other financial liabilities are subsequently measured at amortised cost using the effective interest method, with interest expense recognised on an effective yield basis. The effective interest method is a method of calculating the amortised cost of a financial liability and of allocating interest expense over the relevant period. The effective interest rate is the rate that exactly discounts estimated future cash payments through the expected life of the financial liability, or, where appropriate, a shorter period. De-recognition of financial liabilities Financial liabilities are derecognised when they are extinguished - that is when the obligation specified in the contract is discharged, cancelled or expired.
4.17 Customers’ deposits and syndicated loan
Customers’ deposits and syndicated loan are initially measured at fair value which is a normally considered received net of directly attributable transaction costs incurred, and subsequently measured at their amortised cost using the effective interest method.

4. Summary of significant accounting policies
4.18 Business combinations
Acquisitions of subsidiaries and businesses are accounted for using the purchase method. The cost of the business combination is measured at the aggregate of the fair values, at the date of exchange, of assets given, liabilities incurred or assumed, and equity instruments issued by the Group in exchange for control of the acquiree, plus any costs directly attributable to the business combination. The acquiree’s identifiable assets, liabilities and contingent liabilities that meet the conditions for recognition under IFRS 3 Business Combinations are recognised at their fair values at the acquisition date; except for non-current assets (or disposal banks) that are classified as held for sale in accordance with IFRS 5 Non-current Assets Held for Sale and Discontinued Operations, which are recognised and measured at fair value less costs to sell.
Goodwill arising on acquisition is recognised as an asset and initially measured at cost, being the excess of the cost of the business combination over the Group’s interest in the net fair value of the identifiable assets, liabilities and contingent liabilities recognised. If, after reassessment, the Group’s interest in the net fair value of the acquiree’s identifiable assets, liabilities and contingent liabilities exceeds the cost of the business combination, the excess is recognised immediately in the consolidated statement of profit or loss.
The interest of non-controlling shareholders in the acquiree is initially measured at the non-controlling shareholder’s proportion of the net fair value of the assets, liabilities and contingent liabilities recognised.
4.19 Goodwill
Goodwill is initially recognised as an asset at cost and is subsequently measured at cost less any accumulated impairment losses.
For the purpose of impairment testing, goodwill is allocated to each of the Group’s cash-generating units expected to benefit from the synergies of the combination. Cash-generating units to which goodwill has been allocated are tested for impairment annually, or more frequently when there is an indication that the unit may be impaired. If the recoverable amount of the cash-generating unit is less than the carrying amount of the unit, the impairment loss is allocated first to reduce the carrying amount of any goodwill allocated to the unit and then to the other assets of the unit pro-rata on the basis of the carrying amount of each asset in the unit. An impairment loss recognised for goodwill is not reversed in a subsequent period.
4.20 Employees’ end-of-service benefits
The Group provides end of service benefits for its expatriate employees in accordance with the U.A.E. Labour Law. The entitlement to these benefits is based upon the employees’ length of service and completion of a minimum service period. The expected costs of these benefits are accrued over the period of employment.
Pension and national insurance contributions for U.A.E. citizens are made by the Group in accordance with Federal Law No. 2 of 2000.
4.21 Provisions and contingent liabilities
Provisions are recognised when the Group has a present obligation (legal or constructive) as a result of a past event, it is probable that the Group will be required to settle the obligation, and a reliable estimate can be made of the amount of the obligation
The amount recognised as a provision is the best estimate of the consideration required to settle the present obligation at the end of the reporting period, taking into account the risks and uncertainties surrounding the obligation. When a provision is measured using the cash flows estimated to settle the present obligation, its carrying amount is the present value of those cash flows.
When some or all of the economic benefits required to settle a provision are expected to be recovered from a third party, a receivable is recognised as an asset if it is virtually certain that reimbursement will be received and the amount of the receivable can be measured reliably.
Contingent liabilities, which include certain guarantees and letters of credit pledged as collateral security, are possible obligations that arise from past events whose existence will be confirmed only by the occurrence, or non-occurrence, of one or more uncertain future events not wholly within the Group’s control. Contingent liabilities are not recognised in the consolidated financial statements but are disclosed in the notes to the consolidated financial statements.
4.22 Acceptances
Acceptances are recognised as financial liabilities in the consolidated statement of financial position with a contractual right of reimbursement from the customer as a financial asset. Therefore, commitments with respect to acceptances have been accounted for as financial assets and financial liabilities.

4. Summary of significant accounting policies
4.23 Financial guarantees
Financial guarantees are contracts that require the Group to make specified payments to reimburse the holder for a loss it incurs because a specified party fails to meet its obligation when due in accordance with the contractual terms.
Financial guarantees are initially recognised at their fair value, which is the premium received on issuance. The received premium is amortised over the life of the financial guarantee. The guarantee liability (the notional amount) is subsequently recognised at the higher of this amortised amount and the present value of any expected payments (when a payment under guarantee has become probable).
4.24 Leasing Leases are classified as finance leases whenever the terms of the lease transfer substantially all the risks and rewards of ownership to the lessee. All other leases are classified as operating leases.
The Group as lessorRental income from operating leases is recognised on a straight-line basis over the term of the relevant lease. Initial direct costs incurred in negotiating and arranging an operating lease are added to the carrying amount of the leased asset and recognised on a straight-line basis over the lease term.
The Group as lesseeOperating lease payments are recognised as an expense on a straight-line basis over the lease term, except where another systematic basis is more representative of the time pattern in which economic benefits from the leased asset are consumed. Contingent rentals arising under operating leases are recognised as an expense in the period in which they are incurred.
In the event that lease incentives are received to enter into operating leases, such incentives are recognised as a liability. The aggregate benefit of incentives is recognised as a reduction of rental expense on a straight-line basis, except where another systematic basis is more representative of the time pattern in which economic benefits from the leased asset are consumed.
4.25 Revenue and expense recognition
4.25.1 Interest income and expense
Interest income and interest expense are recognised in consolidated statement of profit or loss using the effective interest method. The effective interest rate is the rate that exactly discounts the estimated future cash payments and receipts through the expected life of the financial asset or liability (or, where appropriate, a shorter period) to the carrying amount of the financial asset or liability. When calculating the effective interest rate, the Group estimates the future cash flows considering all contractual terms of the financial instrument, but not future credit losses. The calculation of the effective interest rate includes transactions costs, fees and points paid or received that are an integral part of the effective interest rate. Transaction costs include incremental costs that are directly attributable to the acquisition or issue of a financial asset or liability.
Interest income and expense presented in the consolidated statement of profit or loss include:- interest on financial assets and financial liabilities measured at amortised cost calculated on an effective
interest basis;- the effective portion of fair value changes in qualifying hedging derivatives designated in cash flow
hedges of variability in interest cash flows, in the same period that the hedged cash flows affect interest income/expenses; and
- the effective portion of fair value changes in qualifying hedging derivatives designated in fair value hedges of interest rate risk.
Interest income and expense on all trading assets and liabilities are considered to be incidental to the Group’s trading operations and are presented together with all other changes in the fair value of trading assets and liabilities in net income from investments.
Fair value changes on the other derivatives held for risk management purposes, and other financial assets and financial liabilities carried at fair value through profit and loss (FVTPL) are presented in net trading income from foreign currencies and net income from investment securities in the consolidated statement of profit or loss. 4.25.2 Fees and commission income and expense
Fees and commission income and expense that are integral to the effective interest rate on a financial asset or liability are included in the measurement of the effective interest rate.

4. Summary of significant accounting policies
4.25.2 Fees and commission income and expense
Other fees and commission income are generally recognised on an accrual basis when the related services are performed by the Group. When a loan commitment is not expected to result in the draw-down of a loan, commitment fees are recognised on a straight line basis over the commitment period.
Other fees and commission expenses are expensed as the related services are received.
4.25.3 Dividend income
Dividend income is recognised in the consolidated statement of profit or loss when the Group’s right to receive such income is established. Usually this is the ex-dividend date for equity securities.
4.26 Foreign currency transactions Transactions in foreign currencies are recorded in the functional currency at the rate of exchange prevailing on the date of the transaction. Monetary assets and liabilities denominated in foreign currencies are translated into the functional currency at the rate of exchange prevailing at the consolidated statement of financial position date. Non-monetary assets and liabilities that are measured at historical cost in a foreign currency are translated into the functional currency using rate of exchange at the date of initial transaction. Non-monetary assets and liabilities measured at fair value in a foreign currency are translated into the functional currency using the rate of exchange at the date the fair value was determined. Foreign currency differences are generally recognised in the statement of profit or loss. For financial assets measured at FVTPL, the foreign exchange component is recognised in the consolidated statement of profit or loss. For financial assets measured at FVTOCI any foreign exchange component is recognised in other comprehensive income. For foreign currency denominated debt instruments measured at amortised cost, the foreign exchange gains and losses are determined based on the amortised cost of the asset and are recognised in the consolidated statement of profit or loss.
4.27 Foreign operations
In the consolidated financial statements, the assets, including related goodwill where applicable, and liabilities of branches, subsidiaries, joint ventures and associates whose functional currency is not AED, are translated into the Group’s presentation currency at the rate of exchange ruling at the consolidated statement of financial position date. The results of branches, subsidiaries, joint ventures and associates whose functional currency is not AED are translated into AED at the average rates ofexchange for the reporting period. Exchange differences arising from the retranslation of opening foreign currency net investments, and exchange differences arising from retranslation of the result for the reporting period from the average rate to the exchange rate prevailing at the period end, are recognised in other comprehensive income and accumulated in equity in the ‘foreign exchange reserve’.
On disposal or partial disposal (i.e. of associates or jointly controlled entities not involving a change of accounting basis) of a foreign operation, exchange differences relating thereto and previously recognised in reserves are recognised in the consolidated statement of profit or loss on proportionate basis except in the case of partial disposal (i.e. no loss of control) of a subsidiary that includes a foreign operation, the proportionate share of accumulated exchange differences are re-attributed to non-controlling interests and are not recognised in consolidated statement of profit or loss.
Goodwill and fair value adjustments arising on the acquisition of a foreign operation are treated as assets and liabilities of the foreign operation and translated at the closing rate.
4.28 Non-current assets classified as held for sale
Non-current assets and disposal groups are classified as held for sale if their carrying amount will be recovered principally through a sale transaction rather than through continuing use. This condition is regarded as met only when the asset (or disposal group) is available for immediate sale in its present condition subject only to terms that are usual and customary for sales of such asset (or disposal group) and its sale is highly probable. Management must be committed to the sale which should be expected to qualify for recognition as a comparable sale within one year from the date of classification.Non-current assets (or disposal groups) classified as held for sale are measured at the lower of their previous carrying amount and fair value less costs to sell.
4.29 Fiduciary activities
The Group acts as a trustee/manager and in other capacities that result in holding or placing of assets in a fiduciary capacity on behalf of trusts or other institutions. Such assets and income arising thereon are not included in the Group’s consolidated financial statements as they are not assets of the Group.

4. Summary of significant accounting policies
4.30 Taxation
Provision is made for current and deferred taxes arising from operating results of overseas subsidiaries in accordance with the fiscal regulations of the respective countries in which the subsidiaries operate.
4.31 Current tax
The tax currently payable is based on taxable profit for the year. Taxable profit differs from profit as reported in the consolidated statement of profit or loss because of items of income or expense that are taxable or deductible in other years and items that are never taxable or deductible.
4.32 Deferred tax
Deferred tax is recognised on temporary differences between the carrying amounts of assets and liabilities in the consolidated financial statements and the corresponding tax bases used in the computation of taxable profit.Deferred tax liabilities are generally recognised for all taxable temporary differences. Deferred tax assets are generally recognised for all deductible temporary differences to the extent that it is probable that taxable profits will be available against which those deductible temporary differences can be utilised. Such deferred tax assets and liabilities are not recognised if the temporary difference arises from goodwill or from the initial recognition (other than in a business combination) of other assets and liabilities in a transaction that affects neither the taxable profit nor the accounting profit.Deferred tax liabilities are recognised for taxable temporary differences associated with investments in subsidiaries and associates, and interests in joint ventures, except where the Group is able to control the reversal of the temporary difference and it is probable that the temporary difference will not reverse in the foreseeable future. Deferred tax assets arising from deductible temporary differences associated with such investments and interests are only recognised to the extent that it is probable that there will be sufficient taxable profits against which to utilise the benefits of the temporary differences and they are expected to reverse in the foreseeable future.
The carrying amount of deferred tax assets is reviewed at the end of each reporting period and reduced to the extent that it is no longer probable that sufficient taxable profits will be available to allow all or part of the asset to be recovered.
5. Critical accounting judgments and key sources of estimation of uncertainty
While applying the accounting policies as stated in Note 4, the management of the Group has made certain judgments, estimates and assumptions that are not readily apparent from other sources. The estimates and associated assumptions are based on historical experience and other factors that are considered to be relevant. Actual results may differ from these estimates.
The estimates and underlying assumptions are reviewed on an ongoing basis. Revisions to accounting estimates are recognised in the period of the revision in which the estimate is revised if the revision affects only that period, or in the period of the revision and future periods if the revision affects both current and future periods.
Significant areas where management has used estimates, assumptions or exercised judgments are as follows:
5.1 Critical accounting judgments
i. Impairment of financial assets measured at amortised cost and loans and advances
The Group’s accounting policy for allowances in relation to impaired financial assets carried at amortised cost is described in Note 4. Impairment is calculated on the basis of discounted estimated future cash flows or by applying a statistical modelling on the performing unclassified loans and advances book based on market trend and historical pattern of defaults. For retail loans and advances impairment is calculated based on a formulaic approach depending on past due instalments and payments.
The allowance for loans and advances losses is established through charges to income in the form of an allowance. Increases and decreases in the allowance due to changes in the measurement of the impaired loans and advances are included in the allowance for loans and advances losses and affect the consolidated statement of profit or loss accordingly.
Loans and advances
The impairment allowance for loan losses is established through charges to the consolidated statement of profit or loss in the form of an impairment allowance for doubtful loans and advances.

5. Critical accounting judgments and key sources of estimation of uncertainty
i. Impairment of financial assets measured at amortised cost and loans and advances
Individually assessed loans
Impairment losses for individually assessed loans are determined by an evaluation of exposure on a case-by-case basis. This procedure is applied to all classified corporate loans and advances which are individually significant accounts or are not subject to the portfolio-based-approach.
The following factors are considered by management when determining the allowance for impairment on individual loans and advances which are significant:
• The amount expected to be realised on disposal of collateral.• The Group’s ability to enforce its claim on the collateral and the associated cost of litigation.• The expected time frame to complete legal formalities and disposal of collateral.
The Group’s policy requires quarterly review of the level of impairment allowances on individual facilities and regular valuation of the collateral and its enforceability.
Impaired loans continue to be classified as impaired unless they are brought fully current and the collection of scheduled interest and principal is considered probable.
Collectively assessed loans
Collective assessment of allowance for impairment is made for overdue retail loans with common features which are not individually significant and performing loans which are not found to be individually impaired.
The following factors are considered by management when determining allowance for impairment for such loans:
Retail loans - All the loans falling under similar overdue category are assumed to carry similar credit risk and allowance for impairment is taken on a gross basis.
Other performing loans - The management of the Group assesses, based on historical experience and the prevailing economic and credit conditions, the magnitude of loans which may be impaired but not identified as of the end of the reporting period.
ii. Classification of properties
In the process of classifying properties, the management has made various judgements. Judgement is needed to determine whether a property qualifies as an investment property, property and equipment, and/or property held for resale. The Group develops criteria so that it can exercise that judgement consistently in accordance with the definitions of investment property, property and equipment, and property held for resale. In making its judgement, management considered the detailed criteria and related guidance for the classification of properties as set out in IAS 2, IAS 16 and IAS 40, in particular, the intended usage of property as determined by the management.
iii. Fair value of investment properties and investment properties under development
The best evidence of fair value is current prices in an active market for similar lease and other contracts. In the absence of such information, the Group determined the amount within a range of reasonable fair value estimates. In making its judgment, the Group considered recent prices of similar properties in the same location and similar conditions, with adjustments to reflect any changes in the nature, location or economic conditions since the date of the transactions that occurred at those prices. Such estimation is based on certain assumptions, which are subject to uncertainty and might materially differ from the actual results.
The determination of the fair value of revenue-generating properties requires the use of estimates such as future cash flows from assets (such as leasing, tenants’ profiles, future revenue streams, capital values of fixtures and fittings, and the overall repair and condition of the property) and discount rates applicable to those assets. In addition, development risks (such as construction and leasing risks) are also taken into consideration when determining the fair value of investment properties under development. These estimates are based on local market conditions existing at the end of the reporting period.
iv. Useful lives of property and equipment and intangible assets
Management reviews the residual values and estimated useful lives of property and equipment and intangible assets at the end of each annual reporting period in accordance with IAS 16 and IAS 38. Management determined that current year expectations do not differ from previous estimates based on its review.

5. Critical accounting judgments and key sources of estimation of uncertainty
5.2 Key sources of estimation of uncertainty The key assumptions concerning the future, and other key sources of estimation of uncertainty at the end of the reporting period, that have a significant risk of causing a material adjustment to the carrying amounts of assets and liabilities within the next financial year, are discussed below:
i. Valuation of unquoted equity investments
The valuation of unquoted equity investments is normally based on recent market transactions done on an arm’s length basis, or the fair value of another instrument that is substantially the same, or the expected cash flows discounted at current rates for similar instruments, or on other valuation models. The inputs to these models are derived from observable market data where possible, but where observable market data are not available, judgment is required to establish fair values. Management believes that the chosen valuation techniques and assumptions used are appropriate in determining the fair value of the unquoted equity investments.
ii. Derivative financial instruments
Subsequent to initial recognition, the fair values of derivative financial instruments measured at fair value are generally obtained by reference to quoted market prices, discounted cash flow models and recognised pricing models as appropriate. When independent prices are not available, fair values are determined by using valuation techniques which refer to observable market data. These include comparison with similar instruments where market observable prices exist, discounted cash flow analysis, option pricing models, and other valuation techniques commonly used by market participants. The main factors which management considers when applying a model are:
a) The likelihood and expected timing of future cash flows on the instrument. These cash flows are usually governed by the terms of the instrument, although management’s judgment may be required in situations where the ability of the counterparty to service the instrument in accordance with the contractual terms is in doubt; and
b) An appropriate discount rate for the instrument. Management determines this rate, based on its assessment of the appropriate spread of the rate for the instrument over the risk-free rate. When valuing instruments by reference to comparable instruments, management takes into account the maturity, structure, and rating of the instrument with which the position held is being compared. When valuing instruments on a model basis using the fair value of underlying components, management considers, in addition, the need for adjustments to take account of a number of factors such as bid-offer spread, credit profile, servicing costs of portfolios and model uncertainty.
iii. Valuation of investment properties
The Group values its investment properties at fair value on the basis of market valuations prepared by an independent chartered surveyor and property consultant. The fair values were derived by using appropriate valuation methods. The valuations are based on assumptions such as comparison with sale price of land for comparable developments, plot sizes and the recent value of any expected timing of payments and receipts in short-term to long-term, which are mainly on market conditions existing at the reporting date. Therefore, any future change in the market conditions could change significantly the fair value of these properties.
All investments properties have been classified as Level 3 in the fair value hierarchy. Level 3 reconciliation has been presented in note 11.
6. Cash and balances with central banks
(a) The analysis of the Group’s cash and balances with central banks is as follows:
2016AED’000
2015AED’000
Cash on hand 50,165 68,370Statutory deposits (note 6.1) 1,138,555 1,086,835Current accounts 1,011,892 2,147,281Certificates of deposits 2,108,275 3,133,709
4,308,887 6,436,195
6. Cash and balances with central banks
(b) The geographical analysis of the cash and balances with central banks is as follows:
2016AED’000
2015AED’000
Banks abroad 1,712,280 1,760,984Banks in the U.A.E. 2,596,607 4,675,211
4,308,887 6,436,195
6.1 The Group is required to maintain statutory deposits with Central Bank of UAE and Central Bank of Lebanon on demand, time and other deposits as per the statutory requirements. The statutory deposits with the Central Banks are not available to finance the day to day operations of the Group. However, as per notice 4310/2008, the Central Bank of the U.A.E. has allowed banks to borrow up to 100% of their AED and US$ reserve requirement limit. As at 31 December 2016, the statutory deposits with the Central Bank of the U.A.E. amounted to AED 534 million (31 December 2015: AED 498 million).
7. Deposits and balances due from banks
(a) The analysis of the Group’s deposits and balances due from banks is as follows:
2016AED’000
2015AED’000
Demand 537,573 705,511Time 154,100 366,904
691,673 1,072,415
8. Reverse-repo placements
The analysis of the Group’s repurchase agreements is as follows:
2016AED’000
2015AED’000
Banks abroad 121,417 -Banks in the U.A.E. 518,059 -
639,476 -
The Bank entered into reverse-repo agreements under which bonds with fair value of AED 649 million (December 31, 2015 - Nil) were received as collateral against cash placements. The risks and rewards relating to these bonds remain with the counter parties.
(b) The geographical analysis of the deposits and balances due from banks is as follows: Banks abroad 2016
AED’000
656,250
2015AED’000
723,382Banks in the U.A.E. 35,423 349,033
691,673 1,072,415

9. Loans and advances, net (a) The analysis of the Group’s loans and advances measured at amortised cost is as follows:
2016AED’000
2015AED’000
Overdrafts 7,822,091 8,916,160Commercial loans 9,392,326 6,131,020Bills discounted 1,096,629 789,213Other advances 669,106 995,513
Gross amount of loans and advances 18,980,152 16,831,906Less: Allowance for impairment (1,583,551) (1,524,442)Less: Interest in suspense (321,604) (270,843)
Net loans and advances 17,074,997 15,036,621
(b) The geographic analysis of the gross loans and advances of the Group is as follows:
2016AED’000
2015AED’000
Loans and advances in the U.A.E. 16,288,853 14,222,200Loans and advances abroad 2,691,299 2,609,706
18,980,152 16,831,906
(c) Loans and advances are stated net of allowance for impairment. The movement in the allowance during the year was as follows:
2016AED’000
2015AED’000
At 1 January 1,524,442 1,347,377Additions through collective impairment, net 28,202 1,510Additions (Note 33) 183,722 386,490Transfer from interest in suspense 11,000 -Write-offs (41,549) (138,736)Write-backs (122,266) (72,199)
Balance at the end of the year 1,583,551 1,524,442
Additions/(reversals) through collective impairment represent the fees charged/refunded to clients upon sanctioning/renewing any facilities on the limit and allocated directly to collective impairment provision.
(d) The movement in the interest in suspense account during the year is as follows:
2016AED’000
2015AED’000
At 1 January 270,843 288,004Additions 87,394 102,106Transfer to specific provision (11,000) -Write-offs (21,830) (101,982)Write-backs (3,803) (17,285)
Balance at the end of the year 321,604 270,843

9. Loans and advances, net
(e) The composition of the loans and advances portfolio by industry is as follows:
2016 2015AED’000 AED’000
Economic sectorTrading 7,267,107 6,438,192Services 5,612,695 4,683,930Manufacturing 2,454,930 2,305,142Construction 949,431 1,262,612Personal loans for commercial purposes 668,178 502,340Personal loans for individual purposes 544,650 465,339Transport and communication 371,605 357,655Financial institutions 327,499 189,053Mining and quarrying 301,727 457,211Government 292,581 109,282Agriculture 34,928 22,150Public utilities 713 -Other 154,108 39,000
18,980,152 16,831,906Less: Allowance for impairment (1,583,551) (1,524,442)Less: Interest in suspense (321,604) (270,843)
17,074,997 15,036,621
(f) The composition of the non-performing loans and advances portfolio by industry is as follows:
2016 2015AED’000 AED’000
Economic sectorTrading 773,022 1,177,345Manufacturing 141,667 128,317Transport and communication 86,616 80,382Services 28,741 30,435Personal loans for individual purposes 15,501 18,601Personal loans for commercial purposes 15,277 14,583Construction 1,705 1,764Other - 241
1,062,529 1,451,668

10. Other financial assets
(a) The analysis of the Group’s other financial assets is as follows:
2016 2015AED’000 AED’000
Other financial assets measured at fair value(i) Investments measured at FVTPL Quoted equity 77,510 21,500 Quoted debt securities - 68,604
77,510 90,104
(ii) Investments measured at FVTOCI Quoted equity 110,314 101,800 Unquoted equity 913,010 1,022,974
1,023,324 1,124,774
Total other financial assets measured at fair value 1,100,834 1,214,878
Other financial assets measured at amortised costDebt securities 747,237 527,330
Total other financial assets 1,848,071 1,742,208
The majority of the quoted investments are listed on the securities exchanges in the U.A.E. (Abu Dhabi Securities Exchange and Dubai Financial Market).
(b) The composition of the other financial assets by geography is as follows:
2016AED’000
2015AED’000
United Arab Emirates 397,448 223,210G.C.C. countries (other than U.A.E.) 8,499 5,754Middle East (other than G.C.C. countries) 1,442,017 1,513,132Europe 107 112
1,848,071 1,742,208
(c) Other financial assets measured at FVTOCI are strategic equity investments that are not held to benefit from changes in their fair value and are not held for trading. The management believes therefore that designating these investments as at FVTOCI provides a more meaningful presentation of its medium to long-term interest in its investments rather than fair valuing through profit and loss.
During the year ended 31 December 2015, 57.5 million shares of equity securities were acquired at an amount of AED 77.13 million.
(d) During the year ended 31 December 2016, dividends received from financial assets measured at FVTOCI amounting to AED 3 million (2015: AED 2 million) have been recognised as investment income in the consolidated statement of profit or loss.

11. Investment properties
Details of investment properties are as follows:
Plots of land in the U.A.E.
AED’000
Commercial and residential units
in the U.A.E.AED’000
TotalAED’000
Fair value at 1 January 2015 73,799 262,344 336,143Transfer to property and equipment (Note 15) - (15,726) (15,726)Increase in fair value during the year 2,215 1,928 4,143Additions/ disposals, net during the year (39,637) (14,482) (54,119)
Fair value at 31 December 2015 36,377 234,064 270,441Transfer from assets acquired in settlement of - 10,150 10,150Increase in fair value during the year - (66) (66)Additions/ disposals, net during the year - 812 812
Fair value at 31 December 2016 36,377 244,960 281,337
The fair value of the Group’s investment properties is estimated annually by considering recent prices for similar properties in the same location and similar conditions, with adjustments to reflect any changes in the nature, location or economic conditions since the date of the transactions that occurred at these prices. In estimating the fair value of the properties, the highest and best use of the properties is their current use. As at 31 December 2016, the valuations were carried out by professional valuers not related to the Group who hold recognised and relevant professional qualifications and have recent experience in the location and category of the investment properties being valued.
(a) The analysis of the Group’s goodwill and other intangibles is as follows:
Goodwill represents the excess of the cost of acquisition over the fair value of the Group’s share in the net identifiable assets, liabilities and contingent liabilities of a Lebanese branch of a multinational bank acquired in 2008.
2016AED’000
2015AED’000
Goodwill 184,733 184,733
Other intangiblesBanking license 18,365 18,365Legal corporate setup in Lebanon 12,887 17,181Customer base 11,240 12,489Branch network 1,099 1,466
43,591 49,501
Total 228,324 234,234
The recoverable amount of the assets acquired in the business combination (cash generating unit) described above is determined based on fair value less cost of disposal which is determined to be higher than the asset’s carrying value using the market approach.
12. Goodwill and other intangibles

12. Goodwill and other intangibles
(b) The movement on other intangible assets during the year is as follows:
Other intangibles Banking license
AED’000
Legal corporate
setup in Lebanon
Customer base
AED’000
Branch networkAED’000
TotalAED’000
AED’000
Balance as at 1 January 2015 18,365 21,475 15,611 1,834 57,285Amortisation in 2015 - (4,294) (3,122) (368) (7,784)
Balance as at 31 December 2015
18,365 17,181 12,489 1,466 49,501
Amortisation in 2016 - (4,294) (1,249) (367) (5,910)
Balance as at 31 December 2016
18,365 12,887 11,240 1,099 43,591
2016 2015AED’000 AED’000
Acceptances – contra (Note 20) 557,288 1,441,148Receivable from sale of investments 200,000 203,330Assets acquired in settlement of debt (Note 11) 833,730 798,212Clearing receivables and accrued income 76,125 -Interest receivable 23,396 20,504Prepayments 13,719 9,600Positive fair value of derivatives (Note 14) 1,682 1,945Other 44,068 44,859
1,750,008 2,519,598
Assets acquired in settlment of debt amounting to AED 834 million are net of AED 3 million unrealized losses. Of this amount AED 679 million pertains to the properties and plots of lands acquired in settlement of debt. Fair valuations of the properties and plots of land were carried out by independent valuers having appropriate professional qualifications and are based on recent experience in the location and category of the properties and plots of land being valued. The fair value of those properties and plots of land as at 31 December 2016 amounted to AED 793 million.
As per UAE Central Bank regulation, the Bank can hold the real estate assets for a maximum period of three years and can extend the holding after obtaining Central Bank approval. The Bank can also rent the properties and earn rental income.
The Group reports under other assets, positive fair value of derivative contracts used by the Group in the ordinary course of business. Refer to Note 14 below for further details about the nature and type of derivative contracts utilised by the Group, together with the notional amounts and maturities.
13. Other Assets
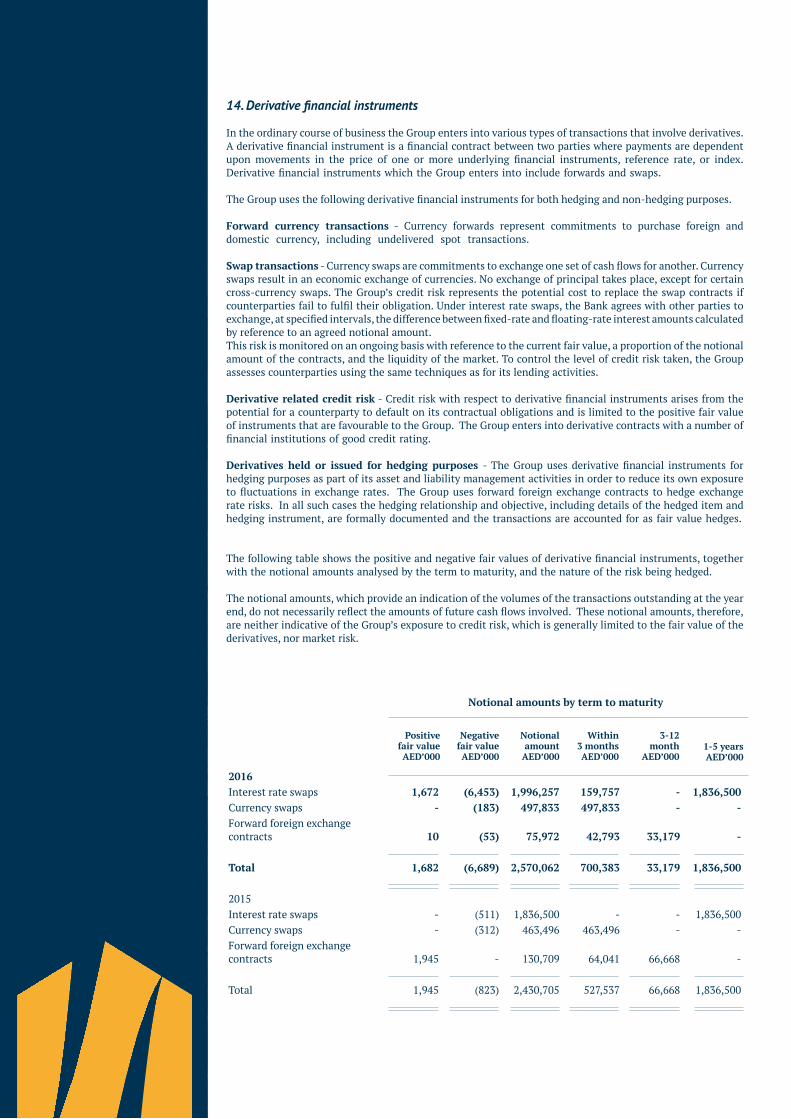
14. Derivative financial instruments
In the ordinary course of business the Group enters into various types of transactions that involve derivatives. A derivative financial instrument is a financial contract between two parties where payments are dependent upon movements in the price of one or more underlying financial instruments, reference rate, or index. Derivative financial instruments which the Group enters into include forwards and swaps.
The Group uses the following derivative financial instruments for both hedging and non-hedging purposes.
Forward currency transactions - Currency forwards represent commitments to purchase foreign and domestic currency, including undelivered spot transactions.
Swap transactions - Currency swaps are commitments to exchange one set of cash flows for another. Currency swaps result in an economic exchange of currencies. No exchange of principal takes place, except for certain cross-currency swaps. The Group’s credit risk represents the potential cost to replace the swap contracts if counterparties fail to fulfil their obligation. Under interest rate swaps, the Bank agrees with other parties to exchange, at specified intervals, the difference between fixed-rate and floating-rate interest amounts calculated by reference to an agreed notional amount.This risk is monitored on an ongoing basis with reference to the current fair value, a proportion of the notional amount of the contracts, and the liquidity of the market. To control the level of credit risk taken, the Group assesses counterparties using the same techniques as for its lending activities.
Derivative related credit risk - Credit risk with respect to derivative financial instruments arises from the potential for a counterparty to default on its contractual obligations and is limited to the positive fair value of instruments that are favourable to the Group. The Group enters into derivative contracts with a number of financial institutions of good credit rating.
Derivatives held or issued for hedging purposes - The Group uses derivative financial instruments for hedging purposes as part of its asset and liability management activities in order to reduce its own exposure to fluctuations in exchange rates. The Group uses forward foreign exchange contracts to hedge exchange rate risks. In all such cases the hedging relationship and objective, including details of the hedged item and hedging instrument, are formally documented and the transactions are accounted for as fair value hedges.
The following table shows the positive and negative fair values of derivative financial instruments, together with the notional amounts analysed by the term to maturity, and the nature of the risk being hedged.
The notional amounts, which provide an indication of the volumes of the transactions outstanding at the year end, do not necessarily reflect the amounts of future cash flows involved. These notional amounts, therefore, are neither indicative of the Group’s exposure to credit risk, which is generally limited to the fair value of the derivatives, nor market risk.
2016 Interest rate swaps 1,672 (6,453) 1,996,257 159,757 - 1,836,500Currency swaps - (183) 497,833 497,833 - -Forward foreign exchange contracts 10 (53) 75,972 42,793 33,179 -
Total 1,682 (6,689) 2,570,062 700,383 33,179 1,836,500
2015Interest rate swaps - (511) 1,836,500 - - 1,836,500Currency swaps - (312) 463,496 463,496 - -Forward foreign exchange contracts 1,945 - 130,709 64,041 66,668 -
Total 1,945 (823) 2,430,705 527,537 66,668 1,836,500
Positive fair valueAED’000
Negative fair valueAED’000
Notional amount
AED’000
Within 3 monthsAED’000
3-12 month
AED’0001-5 yearsAED’000
Notional amounts by term to maturity

15. Property and equipment
Land &buildingsAED’000
Furnitureand office
equipmentAED’000
Leaseholdimprovements
installation,partitions
and decorationAED’000
Motor vehiclesAED’000
Total AED’000
Cost
At 1 January 2015 245,845 96,886 94,372 5,126 442,229
Additions 15,350 7,300 13,480 1,254 37,384
Transfer from investment properties (Note 11)
15,726 - - - 15,726
Disposals/ write-offs (38,529) (2,473) (11,520) (877) (53,399)
At 31 December 2015 238,392 101,713 96,332 5,503 441,940
Additions - 11,842 12,678 712 25,232
Eliminated on disposals - (7,129) (5,284) (1,063) (13,476)
At 31 December 2016 238,392 106,426 103,726 5,152 453,696
Accumulated depreciation
At 1 January 2015 16,473 79,052 51,042 3,321 149,888
Charge for the year 16,458 9,015 8,368 1,223 35,064
Disposals/ write-offs (3,776) (2,250) (11,463) (729) (18,218)
At 31 December 2015 29,155 85,817 47,947 3,815 166,734
Charge for the year 5,055 10,543 8,938 850 25,386
Eliminated on disposals - (7,112) (4,511) (997) (12,620)
At 31 December 2016 34,210 89,248 52,374 3,668 179,500
Net book value:
At 31 December 2016 204,182 17,178 51,352 1,484 274,196
At 31 December 2015 209,237 15,896 48,385 1,688 275,206

16. Non-current assets classified as held for sale
In 2013, Borealis Gulf FZC a wholly owned subsidiary of the Bank has acquired with a view to reselling an 80% equity interest in two Jebel Ali Free Zone entities. The entities are in the facilities management business and the assets and associated liabilities from this acquisition transaction have been classified as held for sale. The consideration was settled by offsetting credit to the seller’s overdraft and loans accounts with the Group.
In January 2015, a potential buyer has irrevocably undertaken to buy the shares of Borealis Gulf FZC in both companies within the period prior to 30 June 2015. Accordingly, the resale of the 80% equity interest in both companies was completed in June 2015.
17. Subsidiaries
a) The Bank’s interests, held directly or indirectly, in the subsidiaries are as follows:
Name of Subsidiary
Proportion of ownership
interest
Year ofincorporation
Country of incorporation
Principal activities
2016 2015
Emirates Lebanon Bank S.A.L.
80% 80% 1965 Lebanon Financial institution
BOS Real Estate FZC 100% 100% 2009 U.A.E. Real estate development activities
BOS Capital FZC 100% 100% 2009 U.A.E. Investment
Polyco General Trading L.L.C.
100% 100% 2008 U.A.E. General trading
Borealis Gulf FZC
BOS Funding Limited
100%
100%
100%
100%
2011
2015
U.A.E.
Cayman Islands
Investment & Real estate development activities
Financing activities
Name of subsidiary
Proportion of ownership
interests and voting rights held
by the non-controlling
interests
Profit allocated to non-controlling
interests
Accumulated non-controlling
interests
2016 2015 2016 AED’000
2015AED’000
2016 AED’000
2015AED’000
Emirates Lebanon Bank .S.A.L
20% 20% 10,138 6,547 210,857 203,527
b) Non-controlling interest:
The table below shows details of non-wholly owned subsidiaries of the Bank that have material non-controlling interests:

17. Subsidiaries
b) Non-controlling interest:
On 14 December 2016, the Board of Directors of the Bank decided to increase the shareholding of the Bank in Emirates Lebanon Bank S.A.L. by acquiring the remaining shares representing 20% of share capital, which is still subject to the approval of the Central Bank of Lebanon. c) Emirates Lebanon Bank S.A.L summarised statements of financial position, comprehensive income and cash flows as at and for the years ended 31 December 2016 and 2015:
2016 2015AED’000 AED’000
Statement of financial position
Total assets 5,834,519 5,549,600
Total liabilities 4,821,438 4,531,766
Equity 1,013,081 1,017,834
Dividends paid to non-controlling interests 2,204 1,841
Statement of comprehensive income
Interest income 264,809 251,050
Profit for the year 50,692 32,734
Total comprehensive income 50,757 32,756
Statement of cash flowsNet cash flows generated from/ (used in) operating activities 203,681 (156,975)Net cash flows (used in)/ generated from investing activities (96,203) 53,464Net cash flows used in financing activities (33,057) (9,183)
Net cash flows generated from/ (used in) during the year 74,421 (112,694)
2016 2015AED’000 AED’000
Current and other accounts 4,997,698 4,008,397Saving accounts 1,727,095 1,634,738 Time deposits 13,012,124 13,848,680
19,736,917 19,491,815
18. Customers’ deposits
The analysis of customers’ deposits is as follows:

19. Deposits and balances due to banks
The analysis of deposits and balances due to banks is as follows:
2016AED’000
2015AED’000
Demand 5,867 839Time 91,922 44,640
97,789 45,479
Due to banks represent due to:2016 2015
AED’000 AED’000
Banks in the U.A.E. 4,246 -Banks abroad 93,543 45,479
97,789 45,479
20. Other liabilities
2016AED’000
2015AED’000
Acceptances – contra (Note 13) 557,288 1,441,148
Accrued expenses and others 90,997 76,943
Interest payable 83,962 84,858
Provision for employees’ end of service benefits (Note 20.1) 40,597 39,374Unearned income 38,325 22,362
Managers’ cheques 18,039 24,174
Negative fair value of derivatives (Note 14) 6,689 823
835,897 1,689,682
20.1 The movement in the provision for employees’ end of service benefits is as follows:
2016AED’000
2015AED’000
At 1 January 39,374 33,025Charged during the year 5,758 7,203Payments during the year (4,535) (854)
At 31 December 40,597 39,374
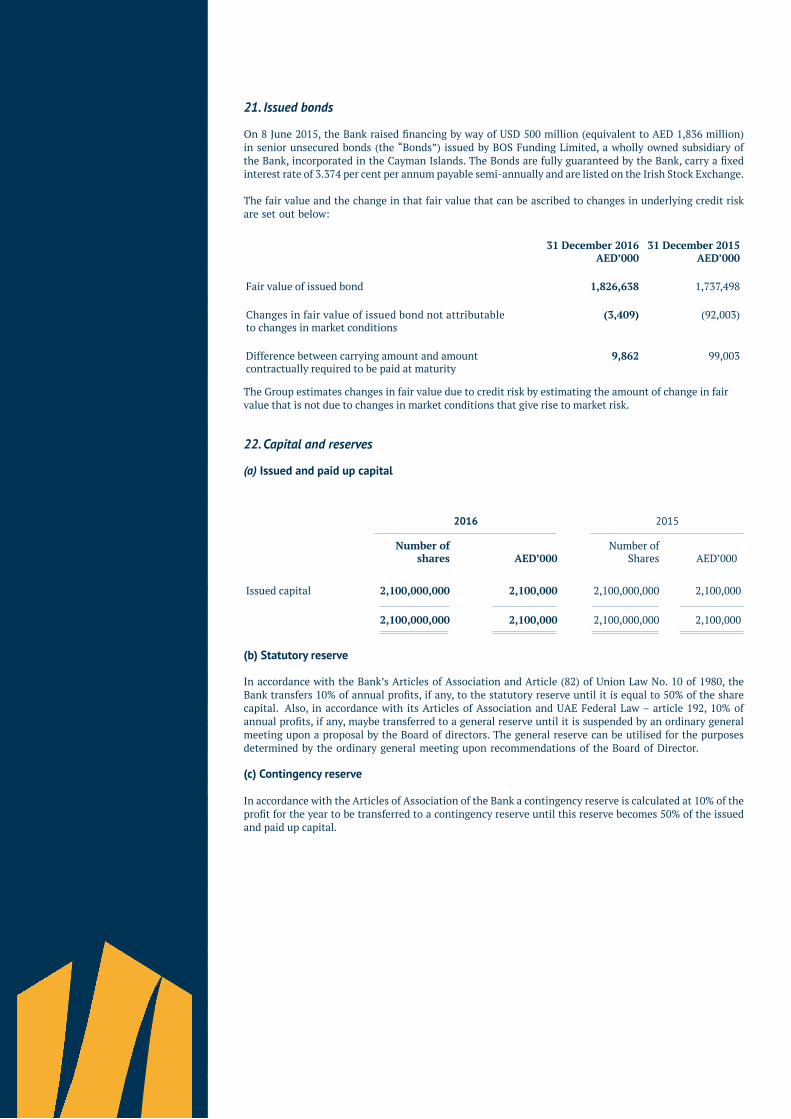
21. Issued bonds
On 8 June 2015, the Bank raised financing by way of USD 500 million (equivalent to AED 1,836 million) in senior unsecured bonds (the “Bonds”) issued by BOS Funding Limited, a wholly owned subsidiary of the Bank, incorporated in the Cayman Islands. The Bonds are fully guaranteed by the Bank, carry a fixed interest rate of 3.374 per cent per annum payable semi-annually and are listed on the Irish Stock Exchange.
The fair value and the change in that fair value that can be ascribed to changes in underlying credit risk are set out below:
31 December 2016AED’000
31 December 2015AED’000
Fair value of issued bond 1,826,638 1,737,498
Changes in fair value of issued bond not attributable to changes in market conditions
(3,409) (92,003)
Difference between carrying amount and amountcontractually required to be paid at maturity
9,862 99,003
The Group estimates changes in fair value due to credit risk by estimating the amount of change in fair value that is not due to changes in market conditions that give rise to market risk.
22. Capital and reserves
(a) Issued and paid up capital
Number ofshares AED’000
Number ofShares AED’000
Issued capital 2,100,000,000 2,100,000 2,100,000,000 2,100,000
2,100,000,000 2,100,000 2,100,000,000 2,100,000
(b) Statutory reserve
In accordance with the Bank’s Articles of Association and Article (82) of Union Law No. 10 of 1980, the Bank transfers 10% of annual profits, if any, to the statutory reserve until it is equal to 50% of the share capital. Also, in accordance with its Articles of Association and UAE Federal Law – article 192, 10% of annual profits, if any, maybe transferred to a general reserve until it is suspended by an ordinary general meeting upon a proposal by the Board of directors. The general reserve can be utilised for the purposes determined by the ordinary general meeting upon recommendations of the Board of Director.
(c) Contingency reserve
In accordance with the Articles of Association of the Bank a contingency reserve is calculated at 10% of the profit for the year to be transferred to a contingency reserve until this reserve becomes 50% of the issued and paid up capital.
2016 2015

22. Capital and reserves
(d) General reserve
Transfers to general reserve are made based on the discretion of the Board of Directors and is subject to the approval of the shareholders at the annual general meeting.
23. Earnings per share
Earnings per share are computed by dividing the profit for the year by the average number of shares outstanding during the year as follows:
2016 2015Basic and diluted earnings per shareProfit attributable to owners of the Bank for the year (AED’000)
392,018 243,754
Profit available to the owners of the Bank 392,018 243,754
Weighted average number of ordinary shares:Ordinary shares at the beginning of the year
2,100,000 2,000,473
Effect of scrip dividend issued during the year - 99,527
Weighted average number of shares outstandingduring the year (in thousands shares)
2,100,000 2,083,412
Basic and diluted earnings per share (AED) 0.19 0.12
As at the reporting date, the diluted earnings per share is equal to the basic earnings per share as the Group has not issued any financial instruments that should be taken into consideration when the diluted earnings per share is calculated.
24. Transactions with owners and directors of the Group
Bank of Sharjah
Treasury sharesAt the Annual General Meeting of the shareholders held on 30 April 2016, the shareholders approved a 5.24% treasury shares distribution (110 million shares) amounting to AED 220 million which were acquired against settlement of loans (2015: 4.98% treasury share distribution (99.5 million shares) amounting to AED 197 million). These shares were re-distributed to the existing shareholders as per their existing proportionate shareholding.
Directors’ remunerationAt the Annual General Meeting of the shareholders held on 30 April 2016, the shareholders of the Bank also approved Directors’ remuneration of AED 7.5 million (2014: AED 7.5 million).
Charity donationsAt the Annual General Meeting of the shareholders held on 30 April 2016, the shareholders also approved charitable donations of AED 2.5 million (2014: AED 2.5 million).
Transfer to reservesAt the Annual General Meeting of the shareholders held on 30 April 2016, the shareholders also approved the appropriation of AED 30 million (2014: AED 30 million) to contingency reserves.
Cash dividendNil dividend was distributed to the shareholders for 2015 (2014: 3.4% cash dividend amounting to AED 71.5 million).

24. Transactions with owners and directors of the Group
Emirates Lebanon Bank
Cash dividendAt the Annual General Meeting held on 6 February 2016 of the shareholders of Emirates Lebanon Bank S.A.L, a subsidiary of the Bank, the shareholders approved a cash dividend for an amount of AED 11.0 million (2014: cash dividend of AED 9.2 million) out of which the non-controlling interest share amounted to AED 2.2 million (2014: AED 1.8 million).
Directors’ remunerationAt the Annual General Meeting held on 6 February 2016 of the shareholders of Emirates Lebanon Bank S.A.L, a subsidiary of the Bank, approved Directors’ remuneration of AED 3.1 million (2014: AED 3.1 million) out of which the non-controlling interest share amounted to AED 0.6 million (2014: AED 0.6 million).
25. Commitments and contingent liabilities
2016AED’000
2015AED’000
Financial guarantees for loans 424,325 706,794Other guarantees 2,034,327 2,247,582
Letters of credit 1,223,786 1,307,698Capital commitments 32,753 44,929
3,715,191 4,307,003 Irrevocable commitments to extend credit 1,383,783 1,552,812
5,098,974 5,859,815
These contingent liabilities have off-balance sheet credit risk as only the related fees and accruals for probable losses are recognised in the statement of financial position until the commitments are fulfilled or expire. Many of the contingent liabilities will expire without being advanced in whole or in part. Therefore, the amounts do not represent expected future cash-flows.
Credit-related commitments include commitments to extend credit, standby letters of credit, and guarantees which are designed to meet the requirements of the Group’s customers.
Commitments to extend credit represent contractual commitments to make loans and advances and revolving credits. Commitments generally have fixed expiry dates, or other termination clauses. Since commitments may expire without being drawn upon, the total contract amounts do not necessarily represent future cash requirements.
Letters of credit and guarantees commit the Group to make payments on behalf of customers contingent upon the failure of the customer to perform under the terms of the contract. These contracts would have market risk if issued or extended at a fixed rate of interest. However, these contracts are primarily made at zero or floating interest rates.
The Bank receives legal claims against it arising in the normal course of business. The Bank considers none of these matters as material either individually or in aggregate. Where appropriate, the Bank recognises a provision for liabilities when it is probable that an outflow of economic resources embodying economic benefits will be required and for which a reliable estimate can be made of the obligation. The Bank seeks to comply with all applicable laws and regulations, but may be subject to regulatory actions and investigations from time to time, the outcome of which are generally difficult to predict and can be material.

26. Cash and cash equivalents
2016AED’000
2015AED’000
Cash and balances with central banks (Note 6) 4,308,887 6,436,195Deposits and balances due from banks (Note 7) 691,673 1,072,415Reverse-repo placements (Note 8) 639,476 -Deposits and balances due to banks (Note 19) (97,789) (45,479)
5,542,247 7,463,131Less: Deposits and balances due from
banks - original maturity more than three months (1,387,847) (1,265,961)
Less: Statutory deposits with central banks (Note 6 )
(1,138,555) (1,086,835)
3,015,845 5,110,335
27. Fiduciary assets
The Group holds investments amounting to AED 0.7 billion (31 December 2015: AED 0.8 billion) which are held on behalf of customers and not treated as assets in the consolidated statement of financial position.
28. Interest income
2016AED’000
2015AED’000
Loans and advances 908,476 907,032Certificates of deposit and treasury bills with central banks and debt instruments 108,698 99,623Net interest income on swaps 19,120 13,374Placements with banks 14,356 8,182Reverse-repo placements 3,687 -
1,054,337 1,028,211
29. Interest expense
2016AED’000
2015AED’000
Customers’ deposits 462,620 426,711Issued bonds 61,964 34,768Interest on cash contribution towards capital due to non-controlling interests 6,611 6,611Banks’ deposits 1,160 12,030
532,355 480,120

30. Net fee and commission income
2016AED’000
2015AED’000
Corporate banking credit related fees 97,774 59,765
Trade finance activities 42,383 62,554
Letters of guarantee 28,596 33,863
Other 5,226 3,931
173,979 160,113
31. Income on investments
2016AED’000
2015AED’000
Dividends 2,798 1,835Realized and unrealized gain on investments measured at FVTPL
752 3,873
Other investment income 5,995 5,822
9,545 11,530
32. Other income
2016AED’000
2015AED’000
Income on sale of fixed assets 209 46,189Rental income and others 30,990 41,547
31,199 87,736

33. Net impairment loss on financial assets2016
AED’0002015
AED’000
Collective impairment of loans and advances 33 67,500
Specific provision of loans and advances 183,689 318,990Direct write-off 1,113 -
Total charge for the year (Note 9) 184,835 386,490Write backs (122,498) (89,484)
62,337 297,006
34. General and administrative expenses
2016AED’000
2015AED’000
Salaries and employees related expenses 166,666 159,640Depreciation on property and equipment (Note 15) 25,386 35,064Rent leases 19,395 12,069Consultancy and expert fees 7,752 7,034* Others 57,043 53,752
276,242 267,559
*Others include an amount of AED 7.1 million representing social contributions made during the year ended 31 December 2016.
35. Related party transactions
The Group enters into transactions with major shareholders, directors, senior management and their related concerns in the ordinary course of business at commercial interest and commission rates.
Transactions within the Group and its subsidiaries have been eliminated on consolidation and are not disclosed in this note.
The related parties balances included in the consolidated statement of financial position and the significant transactions with related parties are as follows:
2016AED’000
2015AED’000
Loans and advances 2,273,609 2,162,402 Letters of credit, guarantee and acceptances 284,170 389,072
2,557,779 2,551,474
Collateral deposits 233,393 169,941
Net exposure 2,324,386 2,381,533
Other deposits 112,512 120,235

35. Related party transactions
As at 31 December 2016, entities related to one of the directors accounted for 69% (31 December 2015: 74%) of the total aforementioned net exposure mainly on account of the fact that the director reduced his gross exposure during the year. Subsequent to 31 December 2016, there was a significant reduction in the exposure by 48% for which the accounting impact will be adjusted in 2017.
No impairment loss has been recognised against balances outstanding with key management personnel and other related parties.
36. Segmental information
36.1 IFRS 8 Operating Segments
IFRS 8 requires operating segments to be identified on the basis of internal reports about components of the Group that are regularly reviewed by the chief operating decision maker in order to allocate resources to the segment and to assess its performance.
36.2 Products and services from which reportable segments derive their revenues
Information reported to the Group’s chief operating decision maker for the purposes of resource allocation and assessment of segment performance is specifically focused on the type of business activities undertaken as a Group. For operating purposes, the Group is organised into two major business segments:
(i) Commercial Banking, which principally provides loans and other credit facilities, deposits and current accounts for corporate, government, institutional and individual customers; and
(ii) Investment Banking, which involves the management of the Group’s investment portfolio.
2016AED’000
2015AED’000
Interest income 99,881 132,337
Interest expense 10,657 9,558
Compensation of Directors and key management personnel:
2016AED’000
2015AED’000
Short term benefits 22,447 18,721
Directors fees 8,117 8,117
End of service benefits 3,452 3,028
Total compensation as at 31 December 34,016 29,866

36. Segmental information
36.2 Products and services from which reportable segments derive their revenues
The following table presents information regarding the Group’s operating segments for the year ended 31 December 2016:
CommercialbankingAED’000
InvestmentbankingAED’000
UnallocatedAED’000
TotalAED’000
Operating income- Net interest income 487,948 34,034 - 521,982- Net fee and commission income 173,979 - - 173,979- Exchange profit 21,046 - - 21,046- Investment income - 9,545 - 9,545- Revaluation (loss) on investment
properties (66) (66)
- Other income - - 31,199 31,199
Total operating income 682,973 43,513 31,199 757,685
Other material non-cash items- Net impairment charge on financial assets
(62,337) - - (62,337)
- Depreciation of property and equipment
- - (25,386) (25,386)
- General and administrative expenses
(213,227) (37,629) - (250,856)
- Amortization of intangible assets (5,910) - - (5,910)- Income tax expenses – overseas - - (11,040) (11,040)
Net profit for the year 401, 499 5,884 (5,227) 402,156
Segment assets 22,592,369 3,237,684 1,266,916 27,096,969
Segment liabilities 20,391,994 1,826,638 278,609 22,497,241
- -

The following table presents information regarding the Group’s operating segments for the year ended 31 December 2015:
CommercialBankingAED’000
InvestmentBankingAED’000
UnallocatedAED’000
TotalAED’000
Operating income- Net interest income 537,955 10,136 - 548,091- Net fee and commission income 160,113 - - 160,113- Exchange profit 21,473 - - 21,473- Investment income - 11,530 - 11,530- Revaluation gain on investment properties - 4,143 - 4,143- Other income - - 87,736 87,736
Total operating income 719,541 25,809 87,736 833,086
Other material non-cash items- Net impairment charge on financial assets
(297,006) - - (297,006)
- Depreciation of property and - - (35,064) (35,064) equipment- General and administrative (197,621) (34,874) - (232,495) expenses- Amortization of intangible assets (7,784) - - (7,784)- Income tax expenses – overseas - - (6,998) (6,998)- Discontinued operations - (3,438) - (3,438)
Net profit for the year 217,130 (12,503) 45,674 250,301
Segment assets 23,211,903 3,224,689 1,150,326 27,586,918
Segment liabilities 20,978,441 1,737,498 248,535 22,964,474
Revenue reported above represents revenue generated from external customers. There were no inter-segment sales during the year (2015: Nil). Transactions between segments, inter-segment cost of funds and allocation of expenses are not determined by management for resource allocation purpose. The accounting policies of the reportable segments are the same as the Group’s accounting policies described in note 4.
For the purposes of monitoring segment performance and allocating resources between segments:
• All assets are allocated to reportable segments except for property and equipment, goodwill and other intangibles and certain amounts included in other assets; and
• All liabilities are allocated to reportable segments except for certain amounts included in other liabilities.
36. Segmental information
36.2 Products and services from which reportable segments derive their revenues

36. Segmental information
36.3 Geographical information
The Group operates in two principal geographical areas - United Arab Emirates (country of domicile) and Lebanon (referred to as ‘foreign’).
The Group’s operating income and information about its non-current assets by geographical location are detailed below:
Country of domicile Foreign Total
2016 AED’000 AED’000 AED’000
Operating income 631,524 126,161 757,685
Non-current assets 1,609,434 291,018 1,900,452
2015 Operating income 732,320 100,766 833,086
Non-current assets 1,566,425 291,905 1,858,330
36.4 Information about major customers
In 2016, one customer accounted for more than 10% of the Group’s net operating income (2015: two customers accounted for more than 10% of the Group’s net operating income, each).
37. Classification of financial assets and liabilities
(a) The table below sets out the Group’s classification of each class of financial assets and liabilities and their carrying amounts as at 31 December 2016:
FVTPLAED’000
FVTOCI
AED’000
Amortised cost
AED’000Total
AED’000
Financial assets:Cash and balances with central banks - - 4,308,887 4,308,887Deposits and balances due from banks - - 691,673 691,673Reverse-repo placements - - 639,476 639,476Loans and advances, net - - 17,074,997 17,074,997Other financial assets measured at fair value 77,510 1,023,324 - 1,100,834Other financial assets measured at amortised cost
- - 747,237 747,237
Other assets 1,682 - 900,877 902,559
Total 79,192 1,023,324 24,363,147 25,465,663
Financial liabilities:Customers’ deposits - - 19,736,917 19,736,917Deposits and balances due to banks - - 97,789 97,789Other liabilities 6,453 - 750,525 756,978Issued Bonds 1,826,638 - - 1,826,638
Total 1,833,091 - 20,585,231 22,418,322

37. Classification of financial assets and liabilities
(b) The table below sets out the Group’s classification of each class of financial assets and liabilities and their carrying amounts as at 31 December 2015:
FVTPLAED’000
FVTOCIAED’000
Amortisedcost
AED’000Total
AED’000
Financial assets:
Cash and balances with central banks - - 6,436,195 6,436,195Deposits and balances due from banks - - 1,072,415 1,072,415Loans and advances, net - - 15,036,621 15,036,621Other financial assets measured at fair value 90,104 1,124,774 - 1,214,878Other financial assets measured at amortised cost - - 527,330 527,330Other assets 1,945 - 1,709,834 1,711,779
Total 92,049 1,124,774 24,782,395 25,999,218
Financial liabilities:Customers’ deposits - - 19,491,815 19,491,815Deposits and balances due to banks - - 45,479 45,479Other liabilities 823 - 1,627,123 1,627,946Issued Bonds 1,737,498 - - 1,737,498
Total 1,738,321 - 21,164,417 22,902,738
38. Risk management
The Group has Senior Management committees to oversee the risk management. The Executive Committee and the Board Risk Committee, under delegation from the Board of Directors defines policies, processes, and systems to manage and monitor credit risk. It also sets policies, system and limits for interest rate risk, foreign exchange risk, and liquidity risk. The Group also has a Credit Risk function which independently reviews adherence to all risk management policies and processes. The Group’s internal audit function, which is part of risk review, primarily evaluates the effectiveness of the controls addressing operational risk.
Credit risk management
Credit risk is the risk that one party to a financial instrument will fail to discharge an obligation and cause the other party to incur a financial loss. The Group attempts to control credit risk by monitoring credit exposures, limiting transactions with specific counter-parties, and continually assessing the creditworthiness of counter-parties. In addition to monitoring credit limits, the Group manages the credit exposure relating to its trading activities by entering into master netting agreements and collateral arrangements with counter-parties in appropriate circumstances, and by limiting the duration of exposure. In certain cases, the Group may also close out transactions or assign them to other counter-parties to mitigate credit risk.
Concentrations of credit risk arise when a number of counter-parties are engaged in similar business activities, or activities in the same geographic region, or have similar economic features that would cause their ability to meet contractual obligations to be similarly affected by changes in economic, political, or other conditions. Concentrations of credit risk indicate the relative sensitivity of the Group’s performance to developments affecting a particular industry or geographic location.
Policies relating to credit are reviewed and approved by the Group’s Executive Committee. All credit lines are approved in accordance with the Group’s credit policy set out in the Credit Policy Manual. Credit and marketing functions are segregated. In addition, whenever possible, loans are secured by acceptable forms of collateral in order to mitigate credit risk. The Group further limits risk through diversification of its assets by economic and industry sectors.
All credit facilities are administered and monitored by the Credit Administration Department. Periodic reviews are conducted by Credit Risk and facilities are risk graded based on criterion established in the Credit Policy Manual.
Cross border exposure and financial institutions exposure limits for money market and treasury activities are approved as per guidelines established by the Group’s Executive Committee and are monitored by the Senior Management on a daily basis.
The Executive Committee is responsible for setting credit policy of the Group. It also establishes industry caps, approves policy exceptions, and conducts periodic portfolio reviews to ascertain portfolio quality.

38. Risk management
Commercial/Institutional lending underwriting
All credit applications for Commercial and Institutional lending are subject to the Group’s credit policies, underwriting standards and industry caps (if any) and to regulatory requirements, as applicable from time to time. The Group does not lend to companies operating in industries that are considered by the Group inherently risky and where industry knowledge specialisation is required. In addition, the Group sets credit limits for all customers based on their creditworthiness.
All credit facilities extended by the Group are made subject to prior approval pursuant to a delegated signature authority system under the ultimate authority of the Executive Committee or the Group’s Executive Director and General Manager under the supervision of the Board. At least two signatures are required to approve any commercial or institutional credit application.
Credit review procedures and loan classification
The Group’s Credit Risk department subjects the Group’s risk assets to an independent quality evaluation on a regular basis in conformity with the guidelines of the Central Bank of the U.A.E. and the Group’s internal policies in order to assist in the early identification of accrual and potential performance problems. The Credit Risk department validates the risk ratings of all commercial clients, provides an assessment of portfolio risk by product and industry and monitors observance of all approved credit policies, guidelines and operating procedures across the Group. All commercial/institutional loan facilities of the Group are assigned one of nine risk ratings (A-I) where A is being excellent and I being loss with no reimbursement capacity and total provisioning.
If a Loan is impaired, interest suspended will not be credited to the consolidated statement of profit or loss. Specific allowance for impairment of classified assets is made based on recoverability of outstanding and risk ratings of the assets.
The Group also complies with IAS 39 in accordance with which it assesses the need for any impairment losses on its loan portfolio by calculating the net present value of the expected future cash flows for each loan.
Maximum exposure to credit risk Loans and advances to customers
2016AED’000
2015AED’000
Carrying amount Individually impaired Grade (G-I) - gross amount 1,062,529 1,451,668
Neither past due nor impairedGrade A 1,755,175 93,434Grade B 10,502,173 8,934,128Grade C 2,093,175 2,900,980Grade D 1,509,602 2,148,505Grade E 1,111,043 654,853Grade F 333,260 122,144
18,366,957 16,305,712Past due but not impaired 613,195 526,194
Total carrying amount 18,980,152 16,831,906
Allowance for impairment (including interest in suspense)
(1,905,155) (1,795,285)
Net carrying amount 17,074,997 15,036,621

38. Risk management
Credit quality per class of financial assets
The credit quality of financial assets is managed by the Group using internal credit ratings. The table below shows the credit quality by class of assets for certain key statement of financial position items, based on the Group rating system.
Neither past due nor impairedHigh grade Standard
grade Watch-list
grade Past due or
individuallyimpaired
Total
2016 2016 2016 2016 2016AED’000 AED’000 AED’000 AED’000 AED’000
Balances with Central Banks 4,258,722 - - - 4,258,722 Deposits and balances due frombanks 686,685 4,988 - - 691,673Reverse-repo placements 639,476 - - - 639,476Investments in debt securities 747,237 - - - 747,237Loans and advances, (gross) 1,755,175 14,104,950 1,444,303 1,675,724 18,980,152Other assets - 1,550,008 - 200,000 1,750,008
Neither past due nor impairedHigh grade Standard
grade Watch-list
gradePast due or
individually impaired
Total
2015 2015 2015 2015 2015AED’000 AED’000 AED’000 AED’000 AED’000
Balances with Central Banks 6,367,825 - - - 6,367,825 Deposits and balances due frombanks 558,016 514,399 - - 1,072,415Investments in debt securities 595,934 - - - 595,934Loans and advances, (gross) 93,434 13,983,613 776,997 1,977,862 16,831,906Other assets - 2,319,598 - 200,000 2,519,598
2016AED’000
2015AED’000
Performing loans 15,997,329 13,166,537 Other loans exceptionally monitored 1,920,294 2,213,701 Non-performing loans 1,062,529 1,451,668
---------------------- ----------------------18,980,152 16,831,906
Less: Allowance for impairment (1,583,551) (1,524,442)Less: Interest in suspense (321,604) (270,843)
----------------------- -----------------------17,074,997 15,036,621
The table below shows the maximum exposure to credit risk for the components of the statement of financial position, including contingent liabilities and commitments. The maximum exposure is shown, before the effect of mitigation through the use of credit enhancements, master netting and collateral agreements.
The risk classification of loans and advances

Notes2016
AED’0002015
AED’000
Balances with Central Banks 6 4,258,722 6,367,825Deposits and balances due from banks 7 691,673 1,072,415Reverse-repo placements 8 639,476 -Loans and advances , net 9 17,074,997 15,036,621Investments in debt securities 10 747,237 595,934Other assets (excluding prepayments& assets acquired in settlement of debts) 927,584 1,741,364
Total 24,339,689 24,814,859
Letters of credit 25 1,223,786 1,307,698 Guarantees 25 2,458,652 2,954,376 Undrawn loan commitments 25 1,383,783 1,552,812 Total 5,066,221 5,814,886Total credit risk exposure 29,405,910 30,629,745 Where financial instruments are recorded at fair value the amounts shown above represent the currentcredit risk exposure but not the maximum risk exposure that could arise in the future as a result of changes in values.
Aging analysis of past due but not impaired loans per class of on-balance sheet financial assets
Less than 30days
31 to 89 days
More than 90days
Total
2016 2016 2016 2016
AED’000 AED’000 AED’000 AED’000
Loans and advances 232,034 151,259 229,902 613,195
Less than 30 days
31 to 89 days
More than 90 days
Total
2015 2015 2015 2015
AED’000 AED’000 AED’000 AED’000
Loans and advances 356,143 46,236 123,815 526,194
Collaterals held against loans and advances
The fair value of the collateral that the Group held at 31 December 2016 for past due but not impaired loans and advances to customers covers 112% (2015: 127%) of the outstanding balance. For each loan, the value of disclosed collateral is capped to the nominal amount of the loan that is held against.
Carrying amount per class of on-balance sheet financial assets whose terms have been renegotiated
2016AED’000
2015AED’000
Loans and advances 1,519,626 1,109,691
Impaired loans
Impaired loans are loans for which the Group determines that it is likely the collectability of all principal and interest due according to the contractual terms of the loan/securities agreement(s) would be doubtful. These loans are graded G to I in the Group’s internal credit risk grading system.
Allowances for impairment
The Group establishes an allowance for impairment losses that represents its estimate of incurred losses in its loans and advances portfolio. The main components of this allowance are a specific loss component that relates to individually significant exposures and a collective loan loss allowance established for group of homogeneous assets with respect to losses that have been incurred but have not been identified on loans subject to individual assessment for impairment.
38. Risk management
Credit quality per class of financial assets

Write-off policy
The Group writes off a loan/security balance (and any related allowances for impairment losses) when the Group determines that the loans/securities are uncollectible. This determination is reached after considering information such as the occurrence of significant changes in the borrower/issuer’s financial position such that the borrower/issuer can no longer pay the obligation, or that proceeds from collateral will not be sufficient to pay back the entire exposure.
The Group holds collateral against loans and advances in the form of mortgage interests over properties, vehicles and machineries, cash margins, fixed deposits, guarantees and others. The Group accepts guarantees mainly from well-reputed local or international banks, well-established local or multinational corporate and high net worth private individuals. Management has estimated the fair value of collateral to be AED 13.4 billion (2015: AED 12.2 billion). The fair value of the collateral includes cash deposits which are not under lien and the Group has right to set-off against the outstanding facilities.
No collateral are held against investment securities.
Concentration risk arises when a number of counterparties are engaged in similar business activities or activities in same geographic region or have similar economic features that would cause their ability to meet contractual obligations to be similarly affected by changes in economic, political or other conditions. The Group measure its exposure to credit risk by reference to gross carrying amount of financial assets less amounts offset, profit suspended and impairment losses, if any.
Concentration of credit risk by industrial sector for loans and advances are presented in notes 9e and 9f. Concentration of credit risk by geographical distribution of loans and advances and financial investments is set out in note 9b and 10b.
Liquidity risk management
Executive Committee (EC) & Board Risk Committee (BRC)
Liquidity risk is the risk that the Group will encounter difficulty in meeting obligations from its financial liabilities.
In addition to its credit related activity, the Executive Committee along with the Board Risk Committee have a broad range of authority delegated by the Board of Directors to manage the Group’s asset and liability structure and funding strategy. The EC and BRC review liquidity ratios; asset and liability structure; interest rate and foreign exchange exposures; internal and statutory ratio requirements; funding gaps; and general domestic and international economic and financial market conditions. The EC & BRC formulate liquidity risk management guidelines for the Group’s operation on the basis of such review.
The Group’s Senior Management monitors the liquidity on a daily basis and uses an interest rate simulation model to measure and monitor interest rate sensitivity and varying interest rate scenarios.
The EC members comprise of the Chairman, three Board Members, in addition to the Executive Director and General Manager. The EC meets once or more every 45 days, as circumstances dictate. The quorum requires all members to be present at the meeting and decisions taken to be unanimous.
The Group manages its liquidity in accordance with U.A.E. Central Bank requirements and the Group’s internal guidelines. The U.A.E. Central Bank sets cash ratio requirements on overall deposits ranging between 1.0 percent for time deposits and 14.0 percent for demand deposits, according to the tenor of the deposits. The U.A.E. Central Bank also imposes a mandatory 1:1 utilisation ratio, whereby; loans and advances (combined with inter-bank placements having a remaining term of ‘greater than three months’) should not exceed stable funds as defined by the U.A.E. Central Bank. Stable funds are defined by the U.A.E. Central Bank to mean free-own funds, inter-bank deposits with a remaining term of more than six months, and stable customer deposits. To guard against liquidity risk, the Group diversifies its funding sources and manages its assets with liquidity in mind, seeking to maintain a preferable proportion between cash, cash equivalent, and readily marketable securities. The Board Risk Committee sets and monitors liquidity ratios and regularly revises and updates the Group’s liquidity management policies to ensure that the Group would be in a position to meet its obligations as they fall due. Management of liquidity risk within the parameters prescribed by the Board Risk Committee has been delegated to an Asset and Liability Committee (ALCO) comprising the Deputy General Manager and senior executives from treasury, finance, corporate credit, and investment departments.
The Group’s approach to managing liquidity is to ensure that it will always have sufficient liquidity to meet its liabilities when they fall due, under both normal and stressed conditions, without incurring unacceptable losses or potential damage to the Group’s reputation.
The Treasury department communicates with other business units regarding the liquidity profile of their financial assets and liabilities and details of other projected cash flows arising from projected future business. The Treasury maintains a portfolio of short-term liquid assets to ensure liquidity is maintained within the
38. Risk management
Credit quality per class of financial assets

Group’s operations as a whole. The daily liquidity position is monitored and regular liquidity stress testing is performed under a variety of scenarios covering both normal and severe market conditions. All liquidity policies and procedures are subject to review and approval by the Board Risk Committee. The Daily Position sheet, which reports the liquidity and exchange positions of the Group is reviewed by Senior Management. A summary report, including any exceptions and remedial action taken, is submitted to the Board Risk Committee.
The maturity profile of the assets and liabilities at 31 December 2016 based on the remaining period from the end of the reporting period to the contractual maturity date is as follows:
Within3 monthsAED’000
Over 3 months
to 1 yearAED’000
Over 1 yearAED’000
UndatedAED’000
TotalAED’000
Assets
Cash and balances with centralbanks
2,911,388 342,643 1,040,326 14,530 4,308,887
Deposits and balances due from banks
691,673 - - - 691,673
Reverse-repo placements 639,476 - - - 639,476Loans and advances, net 7,789,131 2,353,076 6,927,295 5,495 17,074,997Other financial assets measured at fair value
77,510 - - 1,023,324 1,100,834
Other financial assets measured at amortised cost
48,662 116,276 575,094 7,205 747,237
Investment properties - - - 281,337 281,337Goodwill and other intangibles - - - 228,324 228,324Other assets 532,306 5,480 1,206,852 5,370 1,750,008Property and equipment - - - 274,196 274,196
Total assets 12,690,146 2,817,475 9,749,567 1,839,781 27,096,969
Liabilities and equity
Customers’ deposits 15,283,556 4,182,282 271,079 - 19,736,917
Deposits and balances due to banks 97,789 - - - 97,789
Other liabilities 790,204 45,693 - - 835,897
Issued Bonds - - 1,826,638 - 1,826,638
Equity - - - 4,599,728 4,599,728
Total liabilities and equity 16,171,549 4,227,975 2,097,717 4,599,728 27,096,969
Net liquidity gap (3,481,403) (1,410,500) 7,651,850 (2,759,947)
38. Risk management
Liquidity risk management

Within3 monthsAED’000
Over 3 months
to 1 yearAED’000
Over1 year
AED’000UndatedAED’000
TotalAED’000
Assets
Cash and balances with central banks
5,170,234 36,730 1,229,231 - 6,436,195
Deposits and balances due from banks
839,742 232,673 - - 1,072,415
Loans and advances, net 9,221,352 1,568,863 4,246,406 - 15,036,621
Other financial assets measured at fair value
21,500 68,604 - 1,124,774 1,214,878
Other financial assets measured at amortised cost
27,510 20,228 471,817 7,775 527,330
Investment properties - - - 270,441 270,441
Goodwill and other intangibles - - - 234,234 234,234
Other assets 1,486,039 2,521 1,025,349 5,689 2,519,598
Property and equipment - - - 275,206 275,206
Total assets 16,766,377 1,929,619 6,972,803 1,918,119 27,586,918
Liabilities and equity
Customers’ deposits 14,895,061 4,333,640 263,114 - 19,491,815
Deposits and balances due to banks 45,479 - - - 45,479
Other liabilities 1,596,749 40,571 52,362 - 1,689,682
Issued Bonds - - 1,737,498 - 1,737,498
Equity - - - 4,622,444 4,622,444
Total liabilities and equity 16,537,289 4,374,211 2,052,974 4,622,444 27,586,918
Net liquidity gap 229,088 (2,444,592) 4,919,829 (2,704,325) -
The maturity profile of the assets and liabilities at 31 December 2015 based on the remaining period from the end of the reporting period to the contractual maturity date is as follows:
38. Risk management
Liquidity risk management

Market risk management
Market Risk is the risk that the fair value or future cash flows of the financial instruments will fluctuate due to changes in market variables such as interest rates, foreign exchange rates, and equity prices. The Group classifies exposures to market risk into trading, or non-trading/banking book.
(a) Market risk - trading book
The Executive Committee has set limits for acceptable level of risks in managing the trading book. The Group maintains a well-diversified portfolio. In order to manage the market risk in the trading book, the Group carries a limited amount of market risk based on the policy preference and this is continuously monitored by the Senior Management. Proprietary trading for the account of the Group is managed by a proprietary trading limit with a stop-loss limit.
The Group’s trading book mainly comprises of equity instruments in companies listed on the U.A.E. exchanges. As such, the market risk in the trading book is limited to equity price risk.
Equity price risk refers to the risk of a decrease in the fair values of equities in the Group’s trading investment portfolio as a result of reasonable possible changes in levels of equity indices and the value of individual stocks.
The effect on the Group’s equity investments held in the trading book due to a reasonable possible change in U.A.E. equity indices, with all other variables held constant is as follows:
(b) Market risk - non-trading or banking book
Market risk on non-trading or banking positions mainly arises from the interest rate, foreign currency exposures and equity price changes.
(i) Interest rate risk
Interest rate risk arises from the possibility that changes in interest rates will affect the value of financial instruments. The Group is exposed to interest rate risk as a result of mismatches or gaps in the amounts of assets and liabilities.
The Group uses simulation-modelling tools to periodically measure and monitor interest rate sensitivity. The results are monitored and analysed by the Senior Management. Since most of the Group’s financial assets and liabilities are floating rate, deposits and loans generally re-price simultaneously providing a natural hedge, which reduces interest rate exposure. Moreover, the majority of the Group’s assets and liabilities will be re-priced within one year or less, thereby further limiting interest rate risk.
31 December 2016 31 December 2015
Market indicesChange in
equity priceEffect on
income Change in
equity priceEffect on
income% AED’000 % AED’000
Global stock markets +1% 775 +1% 901Global stock markets -1% (775) -1% (901)
38. Risk management

The Group’s interest sensitivity position, based on the contractual re-pricing or maturity dates, whichever dates are earlier as at 31 December 2016 was as follows:
Weighted Average
Effective Rate
Within3 monthsAED’000
Over 3 months
to 1 yearAED’000
Over1 year
AED’000
Non-interest
sensitiveAED’000
TotalAED’000
Assets
Cash and balances with central banks
0.77% 1,826,953 34,111 832,801 1,615,022 4,308,887
Deposits and balances due from banks
0.80% 363,873 - - 327,800 691,673
Reverse-repo placements 0.73% 639,476 - - - 639,476
Loans and advances, net 5.90% 16,802,237 89,437 10,822 172,501 17,074,997
Other financial assets - Equity instruments
- - - - 1,100,834 1,100,834
Other financial assets - Debt securities
4.64% 55,973 289,633 396,074 5,557 747,237
Investment properties - - - - 281,337 281,337
Goodwill and other intangibles
- - - - 228,324 228,324
Other assets - - - - 1,750,008 1,750,008
Property and equipment, net
- - - - 274,196 274,196
Total assets 19,688,512 413,181 1,239,697 5,755,579 27,096,969
Liabilities and equity
Customers’ deposits 2.40% 10,925,840 4,218,807 98,033 4,494,237 19,736,917
Deposits and balances due to banks
1.96% 92,220 - - 5,569 97,789
Other liabilities - - - - 835,897 835,897
Issued Bonds 3.73% - - 1,826,638 - 1,826,638
Equity - - - - 4,599,728 4,599,728
Total liabilities and equity 11,018,060 4,218,807 1,924,671 9,935,431 27,096,969
On statement of financial position gap
8,670,452 (3,805,626) (684,974) (4,179,852) -
Cumulative interest rate sensitivity gap
8,670,452 4,864,826 4,179,852 - -
38. Risk management
(i) Interest rate risk

The Group’s interest sensitivity position, based on the contractual re-pricing or maturity dates, whichever dates are earlier as at 31 December 2015 was as follows:
Weighted Average
Effective Rate
Within3 monthsAED’000
Over 3 months
to 1 yearAED’000
Over1 year
AED’000
Non-interest
sensitiveAED’000
TotalAED’000
Assets
Cash and balances with central banks
0.98% 2,907,889 - 795,818 2,732,488 6,436,195
Deposits and balances due from banks
0.09% 230,181 - - 842,234 1,072,415
Loans and advances, net 6.22% 14,823,009 152,626 18,324 42,662 15,036,621
Other financial assets - Equity instruments
- - - - 1,214,878 1,214,878
Other financial assets - Debt securities
6.08% 36,767 27,207 457,162 6,194 527,330
Investment properties - - - - 270,441 270,441
Goodwill and other intangibles
- - - - 234,234 234,234
Other assets - - - - 2,519,598 2,519,598
Property and equipment - - - - 275,206 275,206
Total assets 17,997,846 179,833 1,271,304 8,137,935 27,586,918
Liabilities and equity
Customers’ deposits 2.20% 11,869,108 4,204,849 270,576 3,147,282 19,491,815
Deposits and balances due to banks
1.73% 15,529 - - 29,950 45,479
Other liabilities - - - - 1,689,682 1,689,682
Issued Bonds 3.37% - - 1,737,498 - 1,737,498
Equity - - - - 4,622,444 4,622,444
Total liabilities and equity 11,884,637 4,204,849 2,008,074 9,489,358 27,586,918
On statement of financial position gap
6,113,209 (4,025,016) (736,770) (1,351,423) -
Cumulative interest rate sensitivity gap
6,113,209 2,088,193 1,351,423 - -
38. Risk management
(i) Interest rate risk

The effective interest rate (effective yield) of a monetary financial instrument is the rate that, when used in a present value calculation, results in the carrying amount of the instrument, excluding non-interest bearing items. The rate is a historical rate for a fixed rate instrument carried at amortised cost and the current market rate for a floating rate instrument or for an instrument carried at fair value.
The following table depicts the sensitivity to a reasonable possible change in interest rates, with other variables held constant, on the Group’s consolidated statement of profit or loss or equity. The sensitivity of the income is the effect of the assumed changes in interest rates on the net interest income for one year, based on the floating rate non-trading financial assets and financial liabilities held as at 31 December 2016, including the effect of hedging instruments. The sensitivity of equity is calculated by revaluing the fixed rate available for sale financial assets, including the effect of any associated hedges as at 31 December 2016 for the effect of assumed changes in interest rates. The sensitivity of equity is analysed by maturity of the asset or swap. All the banking book exposures are monitored and analysed in currency concentrations and relevant sensitivities are disclosed in AED thousands.
2016Currency
Increasein basis
Sensitivityof interest income
Sensitivityof equity
AED +25 12,222 12,222USD +25 (826) (826)Others +25 (421) (421)
AED -25 (12,222) (12,222)USD -25 826 826Others -25 421 421
2015Currency
Increasein basis
Sensitivityof interest income
Sensitivityof equity
AED +25 10,877 10,877USD +25 (5,369) (5,369)Others +25 (257) (257)
AED -25 (10,877) (10,877)USD -25 5,369 5,369Others -25 257 257
ii) Currency risk
Currency risk represents the risk of change in the value of financial instruments due to changes in foreign exchange rates. The Board has set limits on positions by currencies, which are monitored daily, and hedging instruments are also used to ensure that positions are maintained within the limits.
The Group’s assets are typically funded in the same currency as that of the business transacted in order to eliminate foreign exchange exposure. However, in the normal course of business the Group takes on foreign currency exposures to finance its client’s activities. The Executive Committee sets the limits on the level of exposure by currency for both overnight and intra-day positions, which are closely monitored by the Senior Management. As at 31 December 2016, the Group’s net currency position was not material, and all the positions were within limits approved by the Executive Committee.
As the UAE Dirham and other GCC currencies are currently pegged to the US Dollar, balances in US Dollars are not considered to represent significant currency risk.
The table below shows the foreign currencies to which the Group has a significant exposure to:
2016AED’000
equivalentlong (short)
2015AED’000
equivalentlong (short)
Euro 119 167
38. Risk management
(i) Interest rate risk

38. Risk management
ii) Currency risk
The analysis below calculates the effect of a possible movement of the currency rate against AED, with all other variables held constant, on the consolidated statement of profit or loss (due to the fair value of the currency sensitive non-trading monetary assets and liabilities) and equity (due to change in fair value of currency swaps and forward foreign exchange contracts used as cash flow hedges). A positive effect shows a potential increase in consolidated statement of profit or loss or equity; whereas a negative effect shows a potential net reduction in consolidated statement of profit or loss or equity.
(AED’000) Currency exposure as at
31 December 2016Change in currency
rate in %Change on
net profitChange on
Equity
EUR +5% 6 6
EUR -5% (6) (6)
(AED’000) Currency exposure as at
31 December 2015Change in currency
rate in %Change on
net profitChange on
Equity
EUR +5% 8 8EUR -5% (8) (8)
iii) Equity price risk
Equity price risk refers to the risk of a decrease in the fair value of equities in the Group’s non-trading investment portfolio as a result of reasonable possible changes in levels of equity indices and the value of individual stocks.
The effect on the Group’s quoted equity investments held as financial assets at FVTOCI due to reasonable possible change in equity prices, with all other variables held constant is as follows:
31 December 2016 31 December 2015
Market indices Changein equity
price%
Effect onequity
AED’000
Change inequity
priceEffect on
equityAED’000%
Global stock markets +1% 1,103 +1% 1,018
Global stock markets -1% (1,103) -1% (1,018)
Operational risk
Operational risk is the risk of loss arising from system failure, human error, fraud, or external events. When controls fail to perform, operational risks can cause damage to reputation, and may have legal or regulatory implications, or lead to financial losses. The Group would not be able to eliminate all operational risks, but through a control framework and by monitoring and responding to potential risks, the Group could minimise the risks. Controls include effective segregation of duties, access, authorisation and reconciliation procedures, staff education and assessment processes, including the use of internal audit.

39. Capital adequacy and capital management
Capital management process
The Group’s objectives when managing capital, which is a broader concept than the ‘equity’ in the consolidated statement of financial positions, are:
• To comply with the capital requirements set by the Central Bank of United Arab Emirates;• To safeguard the Group’s ability to continue as a going concern and increase the returns for the
shareholders; and• To maintain a strong capital base to support the development of its business.
Capital adequacy and the use of regulatory capital are monitored on a regular basis by the Group’s management, employing techniques based on the guidelines developed by the Basel Committee and the Central Bank of United Arab Emirates. The required information is filed with the authority on a quarterly basis.
The U.A.E Central Bank vide its circular No.27/2009 dated 17 November 2009 informed all the Banks operating in the U.A.E to implement the Standardised Approach of Basel II from the date of the circular. For credit and market risks, the Central Bank has issued draft guidlines for implementation of Standardised Approach and banks are expected to comply and report under Pillar 2-Internal Capital Adequacy Assessment Process (ICAAP) requirements by March 2010. For op[erational risk, the Central Park has given banks the option to use the Basic Indicators Approach or the Standardised Approach and the Group has chosen to use the Basic Indicator Approach. The capital adequacy ratio required under Basel II is 12% to be mantained at all times.
The ratios calculated in accordance with Basel II are as follows:
Basel II2016
AED’0002015
AED’000
Tier 1 capital
Share capital 2,100,000 2,100,000
Statutory reserve 1,050,000 1,050,000
Contingency and general reserves 610,000 580,000
Retained earnings 606,035 476,485
Non-controlling interest in equity of subsidiaries 210,857 203,527
Goodwill and other intangibles (228,324) (234,234)
4,348,568 4,175,778
Tier 2 capitalCollective impairment allowance on loans and advances 235,383 246,831
Cumulative change in fair value 10,276 95,594
245,659 342,425
Total regulatory capital 4,594,227 4,518,203
Risk-weighted assets:Credit risk 18,830,611 19,746,453
Market risk 171,177 131,933
Operational risk 1,484,159 1,502,954
Total risk-weighted assets 20,485,947 21,381,340
Capital adequacy ratio 22.43% 21.13%

(2015: AED 1,023 million) which are measured at fair value. Fair values are determined in accordance with generally accepted pricing models based on comparable ratios backed by discounted cash flow analysis depending on the investment and industry. The valuation model includes some assumptions that are not supported by observable market prices or rates. For investments valued using comparable ratios, share prices of comparable companies represent significant inputs to the valuation model. If the share prices of the comparable companies were 5% higher/lower while all other variables were held constant, then the fair value of the securities would increase/decrease by AED 46 million (2015: AED 51 million).
The impact of the change in fair valuation from previously existing carrying amounts have been recognised as a part of cumulative changes in fair value in equity.
Fair value of financial assets carried at amortised cost
Except as detailed in the following table, the management considers that the carrying amounts of financial assets and financial liabilities measured at amortised cost in the consolidated financial statements approximate their fair values.
2016 2015
Carryingamount
AED’000
Fairvalue
AED’000
Fair value
AED’000
Carrying amount
AED’000
Financial assets- Other financial assets measured at amortised cost 747,237 749,067 527,330 527,752
Fair value measurements recognised in the consolidated statement of financial position
The following table provides an analysis of financial instruments that are measured at fair value. They are banked into levels 1 to 3 based on the degree to which the fair value is observable.
• Level 1 fair value measurements are those derived from quoted prices (unadjusted) in active markets for identical assets or liabilities.
• Level 2 fair value measurements are those derived from inputs other than quoted prices included within Level 1 that are observable for the asset or liability, either directly (i.e. as prices) or indirectly (i.e. derived from prices, including over-the-counter quoted prices).
• Level 3 fair value measurements are those derived from valuation techniques that include inputs for the asset or liability that are not based on observable market data (unobservable inputs).
The fair value for other financial assets measured at amortised cost is based on market prices.
40. Fair value of financial instruments
Investments held at fair value through profit and loss
Investments held for trading or designated at fair value through profit and loss represent investment securities that present the Group with opportunity for returns through dividend income, trading gains and capital appreciation. Including in these investment listed equity securities for which the fair values are based on quoted prices at close of business as of 31 December 2016, and unlisted bonds for which the fair values are derived from internal valuation performed based on generally accepted pricing models, all inputs used for the valuation are supposed by observable market prices or rates.
Unquoted investments held at fair value through other comprehensive income
The consolidated financial statements include holdings in unquoted securities amounting to AED 913 million

Level 1AED’000
Level 2AED’000
Level 3AED’000
TotalAED’000
At 31 December 2016Other financial assets measured at fair valueInvestment measured at FVTPLQuoted equity 77,510 - - 77,510
Investments measured at FVTOCIQuoted equity 110,314 - - 110,314Unquoted equity - - 913,010 913,010
Total 187,824 - 913,010 1,100,834
Other financial liabilities measured at fair valueIssued bonds measured at FVTPLQuoted debt securities 1,826,638 - - 1,826,638
Other assets /liabilitiesPositive fair value of derivatives - 1,672 - 1,672Negative fair value of derivatives - (6,679) - (6,679)
At 31 December 2015Other financial assets measured at fair valueInvestment measured at FVTPLQuoted equity 21,500 - - 21,500Quoted debt securities - 68,604 - 68,604
Investments measured at FVTOCIQuoted equity 101,800 - - 101,800
Unquoted equity - - 1,022,974 1,022,974
Total 123,300 68,604 1,022,974 1,214,878
Other financial liabilities measured at fair valueIssued bonds measured at FVTPLQuoted debt securities 1,737,498 - - 1,737,498
Other assets/liabilitiesPositive fair value of derivatives - 1,945 - 1,945Negative fair value of derivatives - (823) - (823)
There were no transfers between Level 1 and Level 2 during the current year.
40. Fair value of financial instruments

Reconciliation of Level 3 fair value measurements of other financial assets measured at FVTOCI:
2016AED’000
2015AED’000
Opening balance 1,022,974 973,661Additions - 77,133Losses recognised in other comprehensive income (109,964) (27,820)
Closing balance 913,010 1,022,974
Unobservable inputs used in measuring fair value
The effect of unobservable input on fair value measurement
Although the Group believes that its estimates of fair value are appropriate, the use of different methodologies or assumptions could lead to different measurements of fair value. For fair value measurements in Level 3, 10% change in the underlying value of these investments would have the following effects.
Effect on OCI
31 December 2016 Favorable+913
Unfavorable-913
Effect on OCI
31 December 2015 Favorable+1,023
Unfavorable-1,023
Impact on fair value of level 3 financial instruments measured at fair value of changes to key assumptions
The impact on the fair value of level 3 instruments of using reasonably possible alternative assumptions by class of instrument is negligible. Financial Instruments not recorded at fair value
The fair values of financial instruments not recorded at fair value includes cash and balances with Central Banks, due from banks and financial institutions, loans and advances, net, other assets (excluding prepayments), due to banks, customers’ deposits and other liabilities that are categorised as level two based on market observable inputs. The fair values of financial instruments not recorded at fair value are not materially different to their carrying values. The following describes the methodologies and assumptions used to determine fair values for those financial instruments which are not already recorded at fair value in the financial statements: Asset for which fair value approximates carrying valueFor financial assets and financial liabilities that have short term maturity (less than three months) it is assumed that the carrying amounts approximate to their fair value. This assumption is also applied to demand deposits and savings accounts without specific maturity.
Fixed rate financial instrumentsThe fair value of fixed rate financial assets and liabilities carried at amortised cost are estimated by comparing market interest rates when they were first recognised with current market rates for similar financial instruments. The estimated fair value of fixed interest bearing deposits is based on discounted cash flows using prevailing money market interest rates for debts with similar credit and maturity. For other variable rate instruments an adjustment is also made to reflect the change in required credit spread since the instrument was first recognised.
41. Comparative figures
Certain comparative figures have been reclassified where appropriate to conform with the presentation in these consolidated financial statements.
42. Approval of the consolidated financial statements
The consolidated financial statements were approved by the Board of Directors and authorised for issue on 22 February 2017.
40. Fair value of financial instruments

GRAPHS

Evolution of Total Assests, Liabilities and Shareholders’ Equity
AED
MIL
LIO
NS
AED
MIL
LIO
NS
Evolution of Total Advances Deposits and Net Liquidity
DEPOSITS
Advances
YE 2011YE 2010 YE 2012 YE 2013 YE 2014 YE 2015 YE 2016
ADVANCES NET LIQUIDITY
0
5,000
12’ 13’ 14’ 15’ 16’ 12’ 13’ 14’ 15’ 16’ 12’ 13’ 14’ 15’ 16’
3%
12% -3%
10,000
15,000
20,000
25,000
0
2,000
4,000
6,000
8,000
10,000
12,000
14,000
16,000
18,000
9% 1%
6%7%
7%
14%
26%23% 23%
-18% -26%
10%
AED
MIL
LIO
NS
ASSETS LIABILITIES EQUITY
0
5,000
12’ 13’ 14’ 15’ 16’ 12’ 13’ 14’ 15’ 16’ 12’ 13’ 14’ 15’ 16’
11%
10,000
15,000
20,000
25,000
30,000
0%
Consolidated Statement of Financial Position Structure - Assets
58%
9% 9%
16%
8% 7% 8% 8%8%
7%
15%
11%14%
10%
7%
16%15%
11%
7%
11%
23%
12%
6%4%
16%
9%
7%5%
16%
53%50%
52%
56%
55%
63%
Cash & Central Bank Other assests Investments Due from banks
9%
9% 0%
10% -2%
11% 0%
11% -2%
4% 1% 5% 0%

Evolution of Documentary Credits and Guarantees
AED
MIL
LIO
NS
0
500
7%
1,000
1,500
2,000
2,500
3,000
3,500
LETTERS OF CREDIT GUARANTEES
31%
-12%8%
-6%
-6%5%
-7% 1%
-17%
2012
SHARE CAPITAL
2013 2014 2015 2016
Evolution of Share Capital, Equity & Profit
AED
MIL
LIO
NS
0
500
1,000
1,500
100
2,000
2,500
3,000
3,500
4,000
4,500
5,000
2012 2013 2014 2015 20160
200
300
400
500
EQUITY NET PROFIT COMPREHENSIVE INCOME
273
433
353
286
228213
402
309 250
277

AED
MIL
LIO
NS
NET INTERESTINCOME
NET COMMISSIONINCOME
NET OPERATINGINCOME
G&A EXPENSES NET PROFIT COMPREHENSIVEINCOME
0
100
200
300
400
500
600
Consolidated Statement of Profit or Loss
ELB BOS
ELB BOS
87%
13%
79%
21%
71%
29%
79%
21%
70%
30%
87%
13%
76%
24%
AED
MIL
LIO
NS
Consolidated Statement of Financial Position
TOTAL ASSETS CUSTOMER’S DEPOSITS LOANS AND ADVANCES NET LIQUIDITY0
5,000
10,000
15,000
20,000
25,000
77%
23%
86%
14%62%
38%

0
500,000
1,000,000
1,500,000
2,000,000
2,500,000
3,000,000
Evolution of Capital Vis a Vis Rights Issue, Bonus Issue and Dividens Paid up to 2016
1,244,472
2,351,166
840,528
2,278,313
269,527
CAPITAL INCREASE/ RIGHTS ISSUE (AED 000) AMOUNT PAID BY SHAREHOLDERSDIVIDENDS (AED 000)
(AED 000)
BONUS ISSUE (AED 000)
TREASURY ISSUES
VOLUME VALUE
Sale Volume & Value of Transactions for the Year 2016
JAN- 16 FEB- 16 MAR- 16 APR- 16 MAY- 16 JUN- 16 JUL- 16 AUG- 16 SEP- 16 OCT- 16 NOV- 16 DEC- 160
5,000,000
10,000,000
15,000,000
20,000,000
25,000,000

Capital Structure 2016
776SHAREHOLDERS24.14%
16SHAREHOLDERS75.86%
Capital Structure 2015
790SHAREHOLDERS24.67%
17SHAREHOLDERS75.33%
>1%
<1%
>1%
<1%

Shareholders by Emirate for the Year 2016
65 SHAREHOLDERS13.19%
48 SHAREHOLDERS0.56%
340 SHAREHOLDERS8%
126 SHAREHOLDERS23.40%
103 SHAREHOLDERS7.67%
110 SHAREHOLDERS47.19%
ABU DHABIDUBAI
SHARJAHOTHER EMIRATESGCC OTHERS


