63
Annual Report 2016 PWR Holdings Limited and its controlled entities ACN:105 326 850
Annual Report
2016
PWR Holdings Limited and its controlled entities
ACN:105 326 850

Message from Managing Director and Chairman
1
Contents Page
Highlights 2
Message from the Chairman and Managing Director 3
Directors' Report 4
Remuneration Report 11
Lead Auditors’ Independence Declaration 20
Consolidated Financial Statements
Consolidated Statement of Profit or Loss and Other Comprehensive Income 21
Consolidated Statement of Financial Position 22
Consolidated Statement of Changes in Equity 23
Consolidated Statement of Cash Flows 24
Notes to the Consolidated Financial Statements 25
Directors' Declaration 58
Independent Auditor’s Report 59
Additional information 61
2016 Annual General Meeting
The details of the 2016 Annual General Meeting for PWR Holdings Limited are:
10am (Brisbane time), Friday, 21 October 2016
Offices of Corrs Chambers Westgarth Level 42 One One One Eagle 111 Eagle Street Brisbane QLD 4000
Key Dates for Shareholders
Date Event 1 September 2016 Ex-dividend 2 September 2016 Record date for final dividend
19 September 2016 Payment of final dividend 21 October 2016 Annual General Meeting 31 December 2016 Half year-end February 2017 Half year results and investor presentation April 2017 Proposed payment of 2017 interim dividend 30 June 2017 Full year-end August 2017 Annual results and investor presentation

Message from Managing Director and Chairman
2
Highlights
ü Pro forma NPAT $10.8 million ü Statutory NPAT $8.7 million ü Total fully franked dividend of 4.4 cents per share, representing 50% of statutory NPAT ü Revenue, EBITDA and NPAT exceeded prospectus forecasts, despite the strengthening AUD in the second half ü Organic growth exceeded expectations ü Secured two new Original Equipment Manufacturer (“OEM”) contracts in Australia and Europe ü Investment in engineering and production personnel and infrastructure to facilitate growth ü Continued the C&R Racing integration and strengthened USA focus ü Developed channels to the USA automotive aftermarket ü Strong cash conversion ü Zero core debt
The full year results are summarised below:
A$'000 FY16 Prospectus forecast
Variance
Revenue 47,348 46,994 + 0.8%
Pro forma EBITDA (i) (ii) 16,903 16,162 + 4.6%
Pro forma EBITDA margin (ii) 35.7% 34.4% + 1.3%
Pro forma net profit after tax (ii) 10,766 10,462 +2.9%
Statutory net profit after tax 8,735 8,325 +4.9%
Pro forma free cash flow 10,452 11,748 - 11.0%
Pro forma earnings per share 10.8 cents 10.5 cents + 2.9%
Total dividend 4.4 cents 4.2 cents + 4.8% (i) Earnings Before Interest, Tax, Depreciation and Amortisation (“EBITDA”) is a non-IFRS term which has not been subject to audit or review
but has been determined using information presented in the Company’s annual financial statements. (ii) Pro forma adjustments relate to IPO costs ($2.7 million before tax) and interest costs ($0.2 million before tax) associated with bank
facilities repaid from IPO proceeds.
Outlook
After a strong initial full year result as a public company, PWR is well positioned to take advantage of future growth opportunities globally as it continues to: ü Be “Resource Ready” to take advantage of growth opportunities through ongoing investment in
infrastructure and engineering and production personnel; ü Develop channels to the USA automotive aftermarket; ü Expand its product offering to capture greater customer spend; ü Invest in R&D, including an electronic cooling test facility in the emerging technology sector; ü Deliver new OEM contracts in Australia and Europe; and ü Progress other OEM opportunities.
Message from Managing Director and Chairman
3
Dear Fellow Shareholder,
On behalf of the Board and Management of PWR Holdings Limited (“PWR”), we are pleased to present our 2016 Annual Report, our first since listing on the ASX.
PWR listed on the ASX on 18 November 2015. PWR is a home grown Australian company that designs, engineers, manufactures, tests, validates and sells customised cooling solutions for elite motorsports, high performance automotive applications, automotive aftermarket and emerging sectors domestically and globally. Your Board and management are focused on continuing to maintain revenue growth while building the governance and operating platform to support future growth plans.
By leveraging off our track record in elite motorsports, coupled with PWR’s DNA of passion, winning and results, the team has delivered strong revenue and profit growth above the forecast in our Prospectus, a credit to the focus and dedication of our people.
Financial Performance PWR achieved FY16 revenue of $47.3m, an increase of 45.6% on that achieved in FY15 (FY15: $32.5m). Growth in revenue was driven by increased organic growth primarily in the motorsports and automotive aftermarket sectors combined with a full year contribution of the C&R Racing business which was acquired in late March 2015. This revenue outcome was achieved despite the strengthening of the Australian dollar in the second half of FY16, which impacted revenue negatively by $1.1m.
Net profit after tax of $8.7m included the recognition of $2.7 million (pre-tax) of one-off expenses in relation to listing. Excluding the impact of this amount, plus an additional pro forma interest adjustment of $0.2 million (pre-tax), profit from ordinary activities after tax attributed to members was up 21% to $10.8 million on the prior corresponding period (FY15: $8.9m). EBITDA for FY16 (excluding IPO costs of $2.7 million) was $16.9 million (FY15: $13.0 million). Financial Position Operating cash flow for the year was strong at $12.5 million (2015: $8.1 million). The balance sheet remains strong with cash of $8.8 million (2015: $1.0 million), net assets of $36.7 million (2015: $5.2 million) and no core debt.
Dividends The successful first period since listing on the stock exchange resulted in a total fully franked dividend to shareholders of 4.4 cents per share, representing 50% of statutory NPAT, in line with the prospectus forecast. A final dividend of 3.78 cents per share has been declared by the Directors following the interim dividend of 0.62 cents paid last April.
Outlook FY17 will see a focus on PWR being “Resource Ready” to take advantage of growth opportunities. Key to this will be continued investment in infrastructure, engineering, production, sales and human resources personnel and research and development including an electronic cooling test facility in the emerging technology sector. To leverage off our investment in C&R Racing, we will continue to develop channels to the USA automotive aftermarket and expand our product offering to increase customer spend. In addition, delivering new OEM contracts in Australia and Europe and progressing other OEM opportunities will also be on the agenda for what is shaping up to be another exciting year for PWR.
On behalf of the Board, we would like to thank all our staff for their hard work and dedication over the last year and commitment to achieving the goals outlined in our prospectus.
The Board would also like to express its gratitude to you, our shareholders, for your support and interest in PWR.
Kees Weel Bob Thorn Managing Director Chairman
PWR Holdings Limited and its controlled entities
Directors' report For the year ended 30 June 2016
4
The Directors present their report together with the financial report of PWR Holdings Limited (the “Company") and its controlled entities (the “Group”) for the year ended 30 June 2016 and the auditor's report thereon.
1. Directors
The Directors of the Company at any time during or since the end of the financial year are:
Director Experience Robert (Bob) Thorn Independent Chairman, Non-Executive Director Appointed 7 August 2015 Member of Audit and Risk Committee Member of Nomination and Remuneration Committee
Bob brings considerable board and senior management experience to PWR from his thirteen years at Super Retail Group, including nine years as Managing Director. During his time at the company Bob drove Australian and New Zealand expansions and led the creation of the Boating Camping Fishing (BCF) business, the market leader in camping and leisure. In 2004, Bob was awarded the Ernst and Young Australian Entrepreneur of the Year for Retailer, Consumer and Industrial Products. In that same year, he was awarded the National Retailers’ Association Special Individual Achiever’s Award. He was previously General Manager at Lincraft, and held senior roles at other major retailers including nine years with David Jones. Bob has also been the Chairman of MotorCycle Holdings, Cutting Edge, and a Director at WOW Sight and Sound, Babies Galore, and Unity Water. Bob is currently a Non-Executive Director of Myer, a position he has held since February 2014. Bob is an active motorsports participant and is also a Member of the Australian Institute of Company Directors.
Year of next scheduled re-election
2017
Current directorships of listed entities
Myer Limited (appointed 6 February 2014)
Directorships of listed entities over last 3 years
MotorCycle Holdings Limited (8 March 2016 to 22 July 2016)
Kees Weel Managing Director and Chief Executive Officer Appointed 30 June 2003
Kees has more than 30 years of experience in the automotive cooling industry. He is a key relationship and business development manager for top tier local and overseas customers. Kees also actively leads the product development management team. Kees was a team principal of PWR Racing V8 Super Car Team 1998-2007 and was a board member for Tega V8 Supercars in 2007.
Year of next scheduled re-election
Not applicable
Current directorships of listed entities
Nil
Directorships of listed entities over last 3 years
Nil
PWR Holdings Limited and its controlled entities
Directors' report For the year ended 30 June 2016
5
1. Directors (continued)
Director Experience Jeffrey Forbes Independent, Non-Executive Director Appointed 7 August 2015 Chairman of Audit and Risk Committee Member of Nomination and Remuneration Committee
Jeff has 34 years’ experience in senior finance and management roles with extensive mergers and acquisitions experience. Jeff retired in March 2013 as Chief Financial Officer, Executive Director and Company Secretary of Cardno, an ASX-listed engineering consultancy company. Prior to joining Cardno, Jeff was Chief Financial Officer and Executive Director at Highlands Pacific and has previously held senior finance roles in the resources sector. Jeff holds a Bachelor of Commerce from the University of Newcastle and is a Graduate of the Australian Institute of Company Directors. Jeff is a Non-Executive Director of Cardno and Chairman of Herron Todd White Australia and Herron Todd White Consolidated. Jeff also sits on the board of not-for-profit Horizon Housing Group and the AFSL company, Australian Affordable Housing.
Year of next scheduled re-election
2016
Current directorships of listed entities
Cardno Limited (appointed 27 January 2016)
Directorships of listed entities over last 3 years
CMI Limited (10 April 2014 to 29 February 2016) Affinity Education Group Limited (6 November 2013 to 15 December 2015) Exoma Energy Limited (1 July 2014 to 27 February 2015) Talon Petroleum Limited (4 April 2013 to 3 November 2014)
Teresa Handicott Independent, Non-Executive Director Appointed 1 October 2015 Chairman of Nomination and Remuneration Committee Member of Audit and Risk Committee
Teresa spent over 30 years practicing as a corporate lawyer, specialising in mergers and acquisitions, capital markets and corporate governance. She was a partner of national law firm Corrs Chambers Westgarth for 22 years. She served as a member of its National Board for seven years including four as National Chairman prior to her retirement from the partnership in June 2015. Teresa was recently appointed director of ASX listed company Downer EDI Limited and of four subsidiaries of the Local Government Association of Queensland (LGAQ), which are responsible for its commercial operations, Propel Partnership JV, Local Buy Pty Ltd, Local Government Infrastructure Services Pty Ltd and Resolute IT. Teresa serves on the Queensland University of Technology (QUT) Council, where she chairs the Audit and Risk Committee and is a member of the Investment and Borrowings Committee. She is a director of Bangarra Dance Theatre Limited and chairs its Remuneration Committee. Teresa is a Divisional Councillor of the Queensland Division of the Australian Institute of Company Directors (AICD) and is a member of the AICD’s National Law Committee. She also serves on the Sunshine Coast Council’s Economic Futures Board. Teresa is a Member of Chief Executive Women (CEW) where she serves on the Scholarship Committee, is a Senior Fellow of Finsia and a Graduate of the AICD. Teresa’s previous positions include Member of the Takeovers Panel, Associate Member of the Australian Competition and Consumer Commission (ACCC), Member of the Finsia Queensland Regional Council, Director of CS Energy Limited, Principal Law Lecturer for the Securities Institute of Australia (now Finsia) and Tutor in Corporate Governance for the AICD Directors Course.
PWR Holdings Limited and its controlled entities
Directors' report For the year ended 30 June 2016
6
1. Directors (continued)
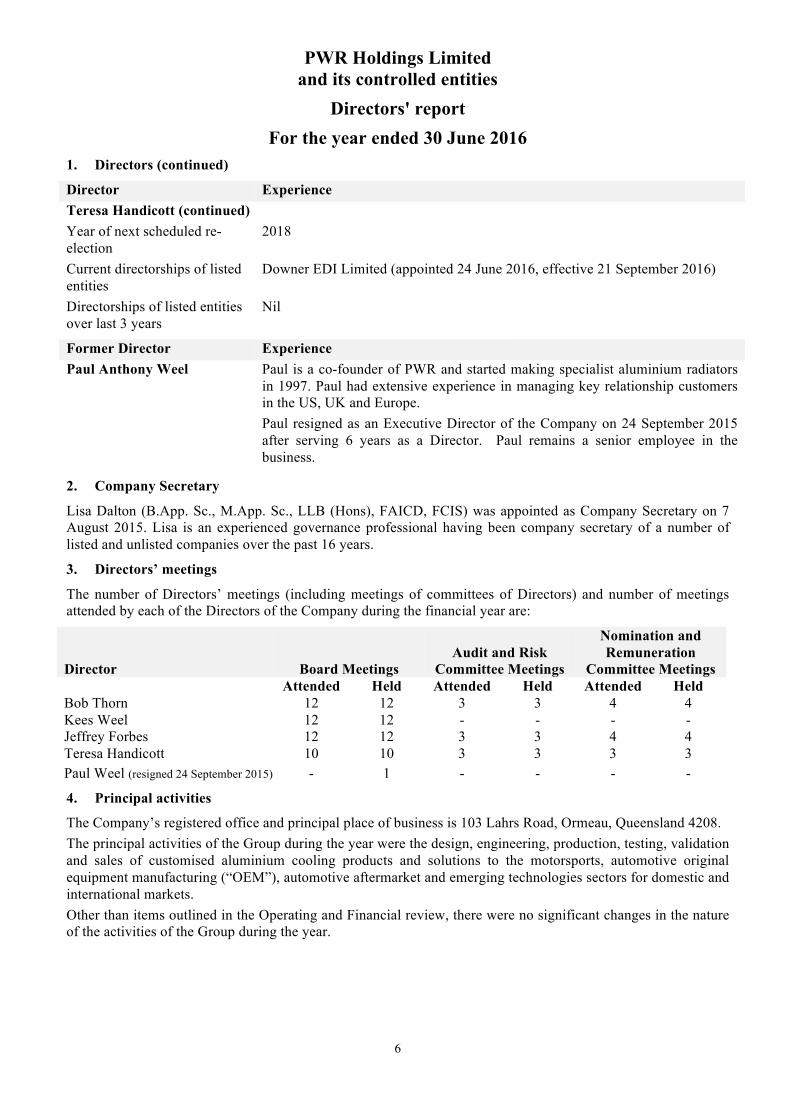
Director Experience Teresa Handicott (continued)Year of next scheduled re-election
2018
Current directorships of listed entities
Downer EDI Limited (appointed 24 June 2016, effective 21 September 2016)
Directorships of listed entities over last 3 years
Nil
Former Director Experience Paul Anthony Weel
Paul is a co-founder of PWR and started making specialist aluminium radiators in 1997. Paul had extensive experience in managing key relationship customers in the US, UK and Europe. Paul resigned as an Executive Director of the Company on 24 September 2015 after serving 6 years as a Director. Paul remains a senior employee in the business.
2. Company Secretary
Lisa Dalton (B.App. Sc., M.App. Sc., LLB (Hons), FAICD, FCIS) was appointed as Company Secretary on 7 August 2015. Lisa is an experienced governance professional having been company secretary of a number of listed and unlisted companies over the past 16 years.
3. Directors’ meetings
The number of Directors’ meetings (including meetings of committees of Directors) and number of meetings attended by each of the Directors of the Company during the financial year are:
Director Board Meetings Audit and Risk
Committee Meetings
Nomination and Remuneration
Committee Meetings Attended Held Attended Held Attended Held Bob Thorn 12 12 3 3 4 4 Kees Weel 12 12 - - - - Jeffrey Forbes 12 12 3 3 4 4 Teresa Handicott 10 10 3 3 3 3 Paul Weel (resigned 24 September 2015) - 1 - - - -
4. Principal activities
The Company’s registered office and principal place of business is 103 Lahrs Road, Ormeau, Queensland 4208. The principal activities of the Group during the year were the design, engineering, production, testing, validation and sales of customised aluminium cooling products and solutions to the motorsports, automotive original equipment manufacturing (“OEM”), automotive aftermarket and emerging technologies sectors for domestic and international markets. Other than items outlined in the Operating and Financial review, there were no significant changes in the nature of the activities of the Group during the year.
PWR Holdings Limited and its controlled entities
Directors' report For the year ended 30 June 2016
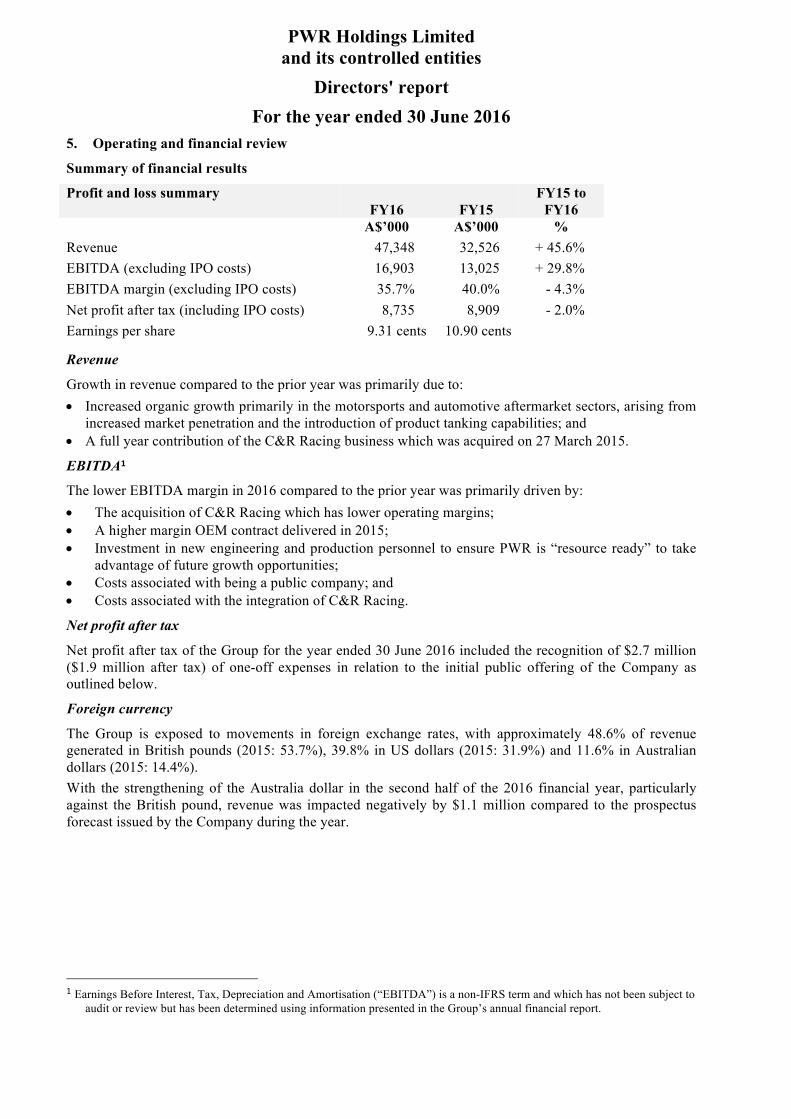
5. Operating and financial review
Summary of financial results
Profit and loss summary FY16 FY15
FY15 to FY16
A$’000 A$’000 % Revenue 47,348 32,526 + 45.6% EBITDA (excluding IPO costs) 16,903 13,025 + 29.8% EBITDA margin (excluding IPO costs) 35.7% 40.0% - 4.3% Net profit after tax (including IPO costs) 8,735 8,909 - 2.0% Earnings per share 9.31 cents 10.90 cents
Revenue
Growth in revenue compared to the prior year was primarily due to: • Increased organic growth primarily in the motorsports and automotive aftermarket sectors, arising from
increased market penetration and the introduction of product tanking capabilities; and • A full year contribution of the C&R Racing business which was acquired on 27 March 2015.
EBITDA1
The lower EBITDA margin in 2016 compared to the prior year was primarily driven by: • The acquisition of C&R Racing which has lower operating margins; • A higher margin OEM contract delivered in 2015; • Investment in new engineering and production personnel to ensure PWR is “resource ready” to take
advantage of future growth opportunities; • Costs associated with being a public company; and • Costs associated with the integration of C&R Racing.
Net profit after tax
Net profit after tax of the Group for the year ended 30 June 2016 included the recognition of $2.7 million ($1.9 million after tax) of one-off expenses in relation to the initial public offering of the Company as outlined below.
Foreign currency
The Group is exposed to movements in foreign exchange rates, with approximately 48.6% of revenue generated in British pounds (2015: 53.7%), 39.8% in US dollars (2015: 31.9%) and 11.6% in Australian dollars (2015: 14.4%). With the strengthening of the Australia dollar in the second half of the 2016 financial year, particularly against the British pound, revenue was impacted negatively by $1.1 million compared to the prospectus forecast issued by the Company during the year.
1 Earnings Before Interest, Tax, Depreciation and Amortisation (“EBITDA”) is a non-IFRS term and which has not been subject to
audit or review but has been determined using information presented in the Group’s annual financial report.
PWR Holdings Limited and its controlled entities
Directors' report For the year ended 30 June 2016
8
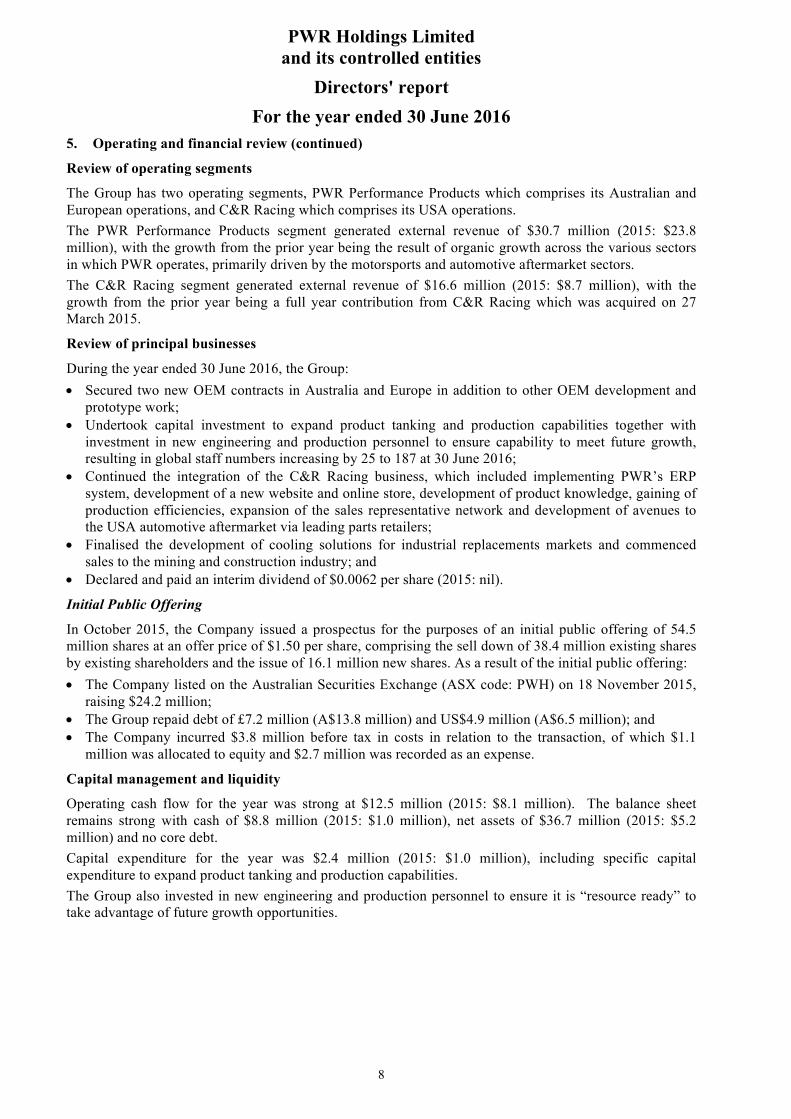
5. Operating and financial review (continued)
Review of operating segments
The Group has two operating segments, PWR Performance Products which comprises its Australian and European operations, and C&R Racing which comprises its USA operations. The PWR Performance Products segment generated external revenue of $30.7 million (2015: $23.8 million), with the growth from the prior year being the result of organic growth across the various sectors in which PWR operates, primarily driven by the motorsports and automotive aftermarket sectors. The C&R Racing segment generated external revenue of $16.6 million (2015: $8.7 million), with the growth from the prior year being a full year contribution from C&R Racing which was acquired on 27 March 2015.
Review of principal businesses
During the year ended 30 June 2016, the Group: • Secured two new OEM contracts in Australia and Europe in addition to other OEM development and
prototype work; • Undertook capital investment to expand product tanking and production capabilities together with
investment in new engineering and production personnel to ensure capability to meet future growth, resulting in global staff numbers increasing by 25 to 187 at 30 June 2016;
• Continued the integration of the C&R Racing business, which included implementing PWR’s ERP system, development of a new website and online store, development of product knowledge, gaining of production efficiencies, expansion of the sales representative network and development of avenues to the USA automotive aftermarket via leading parts retailers;
• Finalised the development of cooling solutions for industrial replacements markets and commenced sales to the mining and construction industry; and
• Declared and paid an interim dividend of $0.0062 per share (2015: nil).
Initial Public Offering
In October 2015, the Company issued a prospectus for the purposes of an initial public offering of 54.5 million shares at an offer price of $1.50 per share, comprising the sell down of 38.4 million existing shares by existing shareholders and the issue of 16.1 million new shares. As a result of the initial public offering: • The Company listed on the Australian Securities Exchange (ASX code: PWH) on 18 November 2015,
raising $24.2 million; • The Group repaid debt of £7.2 million (A$13.8 million) and US$4.9 million (A$6.5 million); and • The Company incurred $3.8 million before tax in costs in relation to the transaction, of which $1.1
million was allocated to equity and $2.7 million was recorded as an expense.
Capital management and liquidity
Operating cash flow for the year was strong at $12.5 million (2015: $8.1 million). The balance sheet remains strong with cash of $8.8 million (2015: $1.0 million), net assets of $36.7 million (2015: $5.2 million) and no core debt. Capital expenditure for the year was $2.4 million (2015: $1.0 million), including specific capital expenditure to expand product tanking and production capabilities. The Group also invested in new engineering and production personnel to ensure it is “resource ready” to take advantage of future growth opportunities.

PWR Holdings Limited and its controlled entities
Directors' report For the year ended 30 June 2016
9
5. Operating and financial review (continued)
Business risks and opportunities
The following are key opportunities and risks that may impact the Group’s financial and operating results in future periods:
Opportunities Risks
• Leverage off reputation in elite motorsports to increase penetration into existing and emerging sectors
• Pursue OEM opportunities • Expansion of product offering to capture
greater customer spend • Continued intellectual property and product
development • Continued globalisation and standardisation of
motorsports • Global investment in the development of
electric and hybrid engines
• Loss of key customers • Loss of key employees • Emergence of domestic and international
competitors • Unfavourable movement in foreign currency
exchange rates • Integration of the C&R Racing acquisition • Manufacturing equipment failure • Failure of supply chain • Product defects or failure • Workplace incidents
Significant changes in the state of affairs
Other than as outlined in the operating and financial review, there were no significant changes in the nature of the activities of the Group during the year.
6. Dividends
Dividends paid or declared by the Company to members since the end of the previous financial year were:
Declared and paid during the year Amount per share
Total amount $ Date of payment
Interim 2016 ordinary $0.0062 620,000 8 April 2016 Total amount 620,000
Declared after end of year
The following dividends were declared by the Directors since the end of the financial year:
Amount per share
Total amount $ Date of payment
Final 2016 ordinary $0.0378 3,780,000 19 September 2016 Total amount 3,780,000
The financial effect of this dividend has not been brought to account in the consolidated financial statements for the year end 30 June 2016 and will be recognised in subsequent financial reports. There is no Dividend Re-investment plan in operation.
7. Likely developments
The Group will continue its strategy of increasing profitability and market share within existing markets and pursue opportunities in emerging markets during the next financial year. Further information about likely developments in the operations of the Group and the expected results of those operations in future financial years has not been included in this report because disclosure of the information would be likely to result in unreasonable prejudice to the Group.

PWR Holdings Limited and its controlled entities
Directors' report For the year ended 30 June 2016
10
8. Events subsequent to reporting date
The Board declared a fully franked final dividend of 3.78 cents per share. The financial effect of this dividend has not been brought to account in the consolidated financial statements for the year ended 30 June 2016. Other than the matter noted above, there has not arisen in the interval between the end of the financial year and the date of this report any item, transaction or event of a material and unusual nature likely, in the opinion of the Directors of the Company, to affect significantly the operations of the Group, the results of those operations, or the state of affairs of the Group, in future financial years. 9. Environmental regulation
The Group is not subject to any significant environmental regulations.
10. Indemnification and insurance of officers
The Group has indemnified the Directors’ and Executives’ for costs incurred, in their capacity as a Director or Executive, for which they may be held personally liable, except where there is a lack of good faith. During the financial year, the Group paid insurance premiums in respect of a contract to insure the Directors and Executives of the Group against a liability to the extent permitted by the Corporations Act 2001. The insurance contract prohibits disclosure of the nature of liability and the amount of the premium.
11. Proceedings on behalf of the Company
No person has applied to the Court under section 237 of the Corporations Act 2001 for leave to bring proceedings on behalf of the Company, or to intervene in any proceedings to which the Company is a party for the purpose of taking responsibility on behalf of the Company for all or part of those proceedings.
12. Non-audit services
During the year KPMG, the Group’s auditor, has not performed any services other than the audit and review of the financial statements.
13. Lead auditor’s independence declaration
The lead auditor’s independence declaration is set out on page 20 and forms part of the directors’ report for the financial year ended 30 June 2016.
14. Directors’ interests
Details of the Directors’ interests in the securities of the Company are disclosed in the remuneration report. At the date of this report their holdings do not differ from the amount held at 30 June 2016.
15. Rounding
In accordance with the ASIC Corporations (Rounding in Financial/Directors’ Reports) Instrument 2016/191 commencing 1 April 2016, amounts in the financial report and Directors’ report have been rounded to the nearest dollar, unless otherwise stated.
PWR Holdings Limited and its controlled entities
Directors' report For the year ended 30 June 2016
11
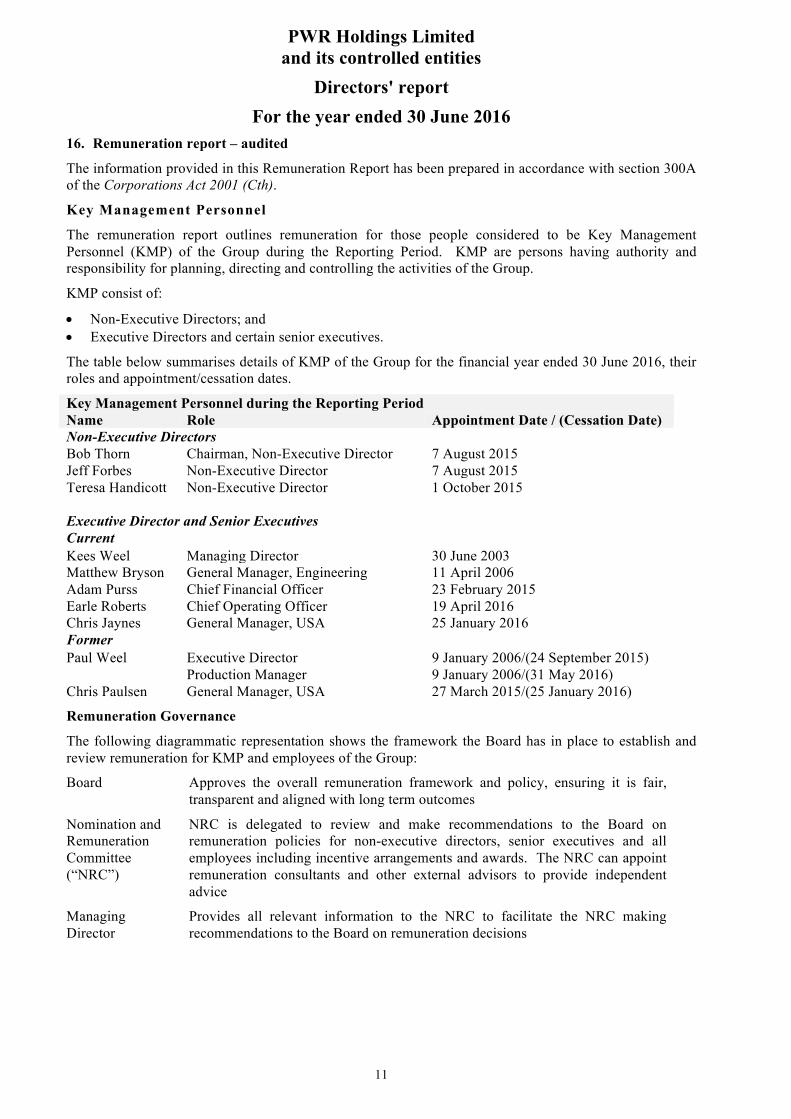
16. Remuneration report – audited
The information provided in this Remuneration Report has been prepared in accordance with section 300A of the Corporations Act 2001 (Cth).
Key Management Personnel
The remuneration report outlines remuneration for those people considered to be Key Management Personnel (KMP) of the Group during the Reporting Period. KMP are persons having authority and responsibility for planning, directing and controlling the activities of the Group.
KMP consist of:
• Non-Executive Directors; and • Executive Directors and certain senior executives.
The table below summarises details of KMP of the Group for the financial year ended 30 June 2016, their roles and appointment/cessation dates.
Key Management Personnel during the Reporting PeriodName Role Appointment Date / (Cessation Date) Non-Executive DirectorsBob Thorn Chairman, Non-Executive Director 7 August 2015 Jeff Forbes Non-Executive Director 7 August 2015 Teresa Handicott
Non-Executive Director 1 October 2015
Executive Director and Senior ExecutivesCurrent Kees Weel Managing Director 30 June 2003 Matthew Bryson General Manager, Engineering 11 April 2006 Adam Purss Chief Financial Officer 23 February 2015 Earle Roberts Chief Operating Officer 19 April 2016 Chris Jaynes General Manager, USA 25 January 2016 Former Paul Weel Executive Director
Production Manager 9 January 2006/(24 September 2015) 9 January 2006/(31 May 2016)
Chris Paulsen General Manager, USA 27 March 2015/(25 January 2016)
Remuneration Governance
The following diagrammatic representation shows the framework the Board has in place to establish and review remuneration for KMP and employees of the Group:
Board Approves the overall remuneration framework and policy, ensuring it is fair, transparent and aligned with long term outcomes
Nomination and Remuneration Committee (“NRC”)
NRC is delegated to review and make recommendations to the Board on remuneration policies for non-executive directors, senior executives and all employees including incentive arrangements and awards. The NRC can appoint remuneration consultants and other external advisors to provide independent advice
Managing Director
Provides all relevant information to the NRC to facilitate the NRC making recommendations to the Board on remuneration decisions
PWR Holdings Limited and its controlled entities
Directors' report For the year ended 30 June 2016
16. Remuneration report – audited (continued)
Non-Executive Director Remuneration
Policy
A copy of the remuneration policy for Non-Executive Directors is available on the Group’s website. The Board’s Non-Executive Director remuneration policy is to:
• Provide a clear fee arrangement that avoids potential conflicts of interest associated with performance incentives,
• Remunerate Directors at market rates for their commitment and responsibilities, and • Obtain independent external remuneration advice when required.
Non-Executive Directors receive remuneration for undertaking their role. They do not participate in the Group’s incentive plans or receive any variable remuneration. Non-Executive Directors are not entitled to retirement payments.
The aggregate Non-Executive Director remuneration cap approved by shareholders in 2015 is $750,000 per annum (inclusive of superannuation contributions). The Board determines the distribution of Non-Executive Director fees within the approved remuneration cap.
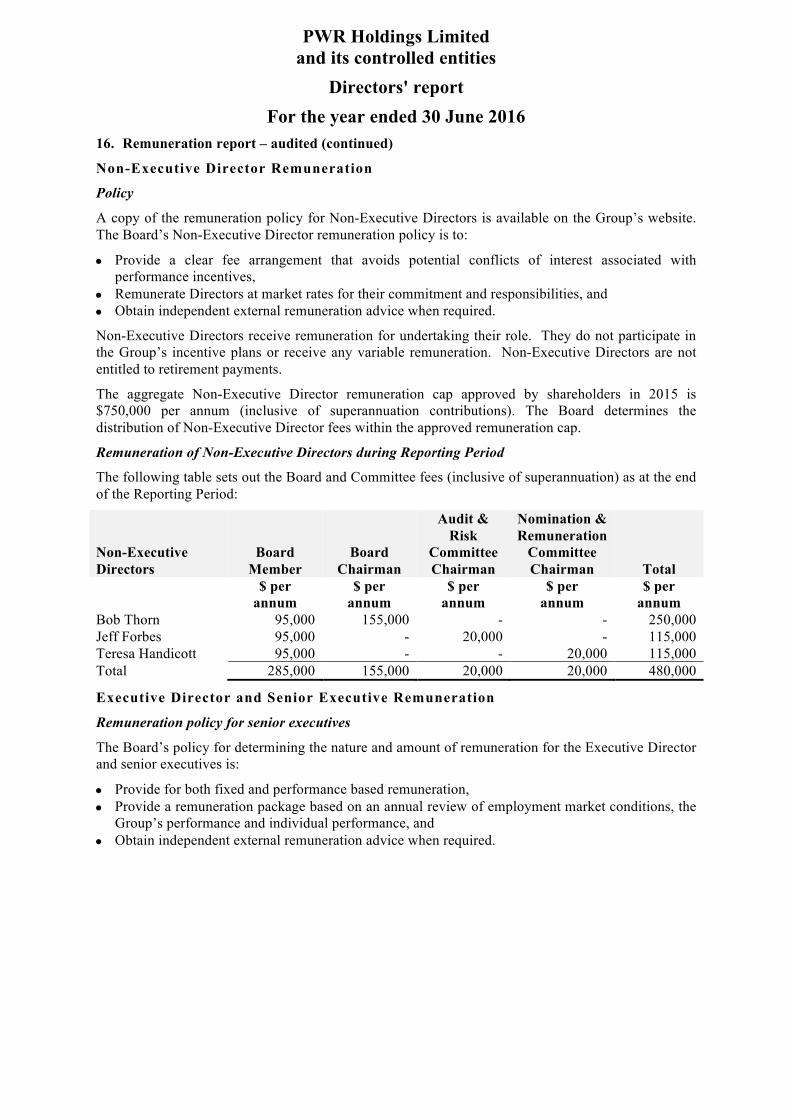
Remuneration of Non-Executive Directors during Reporting Period
The following table sets out the Board and Committee fees (inclusive of superannuation) as at the end of the Reporting Period:
Non-Executive Directors
Board Member
Board Chairman
Audit & Risk
Committee Chairman
Nomination & Remuneration
Committee Chairman Total
$ per annum
$ per annum
$ per annum
$ per annum
$ per annum
Bob Thorn 95,000 155,000 - - 250,000 Jeff Forbes 95,000 - 20,000 - 115,000 Teresa Handicott 95,000 - - 20,000 115,000 Total 285,000 155,000 20,000 20,000 480,000
Executive Director and Senior Executive Remuneration
Remuneration policy for senior executives
The Board’s policy for determining the nature and amount of remuneration for the Executive Director and senior executives is:
• Provide for both fixed and performance based remuneration, • Provide a remuneration package based on an annual review of employment market conditions, the
Group’s performance and individual performance, and • Obtain independent external remuneration advice when required.
PWR Holdings Limited and its controlled entities
Directors' report For the year ended 30 June 2016
13
16. Remuneration report – audited (continued)
Executive Director and Senior Executive Remuneration (continued)
Components of remuneration
The remuneration framework for senior executives comprises two elements:
1. Fixed remuneration; and 2. “At risk” or performance linked remuneration.
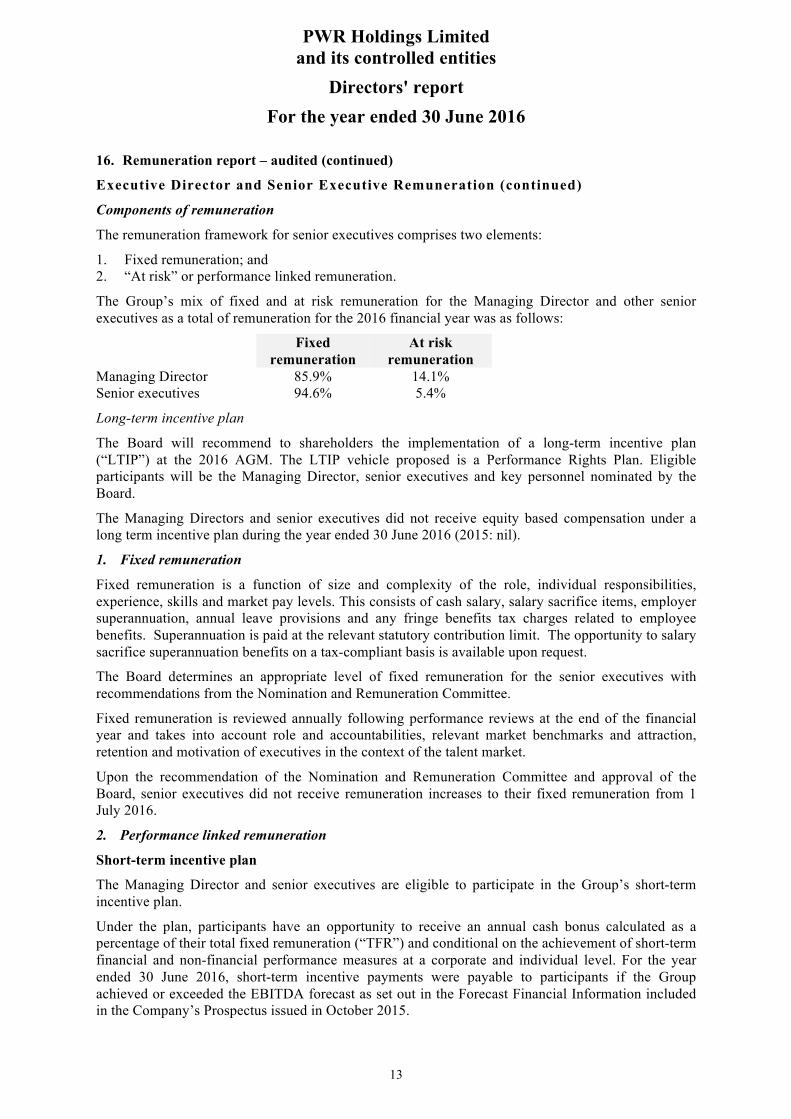
The Group’s mix of fixed and at risk remuneration for the Managing Director and other senior executives as a total of remuneration for the 2016 financial year was as follows:
Fixed remuneration
At risk remuneration
Managing Director 85.9% 14.1% Senior executives 94.6% 5.4%
Long-term incentive plan
The Board will recommend to shareholders the implementation of a long-term incentive plan (“LTIP”) at the 2016 AGM. The LTIP vehicle proposed is a Performance Rights Plan. Eligible participants will be the Managing Director, senior executives and key personnel nominated by the Board.
The Managing Directors and senior executives did not receive equity based compensation under a long term incentive plan during the year ended 30 June 2016 (2015: nil).
1. Fixed remuneration
Fixed remuneration is a function of size and complexity of the role, individual responsibilities, experience, skills and market pay levels. This consists of cash salary, salary sacrifice items, employer superannuation, annual leave provisions and any fringe benefits tax charges related to employee benefits. Superannuation is paid at the relevant statutory contribution limit. The opportunity to salary sacrifice superannuation benefits on a tax-compliant basis is available upon request.
The Board determines an appropriate level of fixed remuneration for the senior executives with recommendations from the Nomination and Remuneration Committee.
Fixed remuneration is reviewed annually following performance reviews at the end of the financial year and takes into account role and accountabilities, relevant market benchmarks and attraction, retention and motivation of executives in the context of the talent market.
Upon the recommendation of the Nomination and Remuneration Committee and approval of the Board, senior executives did not receive remuneration increases to their fixed remuneration from 1 July 2016.
2. Performance linked remuneration
Short-term incentive plan
The Managing Director and senior executives are eligible to participate in the Group’s short-term incentive plan.
Under the plan, participants have an opportunity to receive an annual cash bonus calculated as a percentage of their total fixed remuneration (“TFR”) and conditional on the achievement of short-term financial and non-financial performance measures at a corporate and individual level. For the year ended 30 June 2016, short-term incentive payments were payable to participants if the Group achieved or exceeded the EBITDA forecast as set out in the Forecast Financial Information included in the Company’s Prospectus issued in October 2015.
PWR Holdings Limited and its controlled entities
Directors' report For the year ended 30 June 2016
14
16. Remuneration report – audited (continued)
Executive Director and Senior Executive Remuneration (continued)
Components of remuneration (continued)
2. Performance linked remuneration (continued)
Short-term incentive plan (continued)
Awards to be made under the short-term incentive plan were assessed by the Nomination and Remuneration Committee and approved by the Board. The Board retains an overall discretion on whether to pay all, a portion of, or no annual bonus.
Annual bonus
The executive director and senior executives are eligible for an annual bonus each financial year.
The annual bonus plan focuses attention on short-term non-financial and financial objectives at a corporate and individual level. The quantum of the cash award varies based on the year’s accomplishments, including the EBITDA of the Group which acts as a gate for the annual bonus plan to operate. In addition, financial and non-financial targets were established by the Board at the beginning of the Reporting Period and assessed at the end of the Reporting Period.
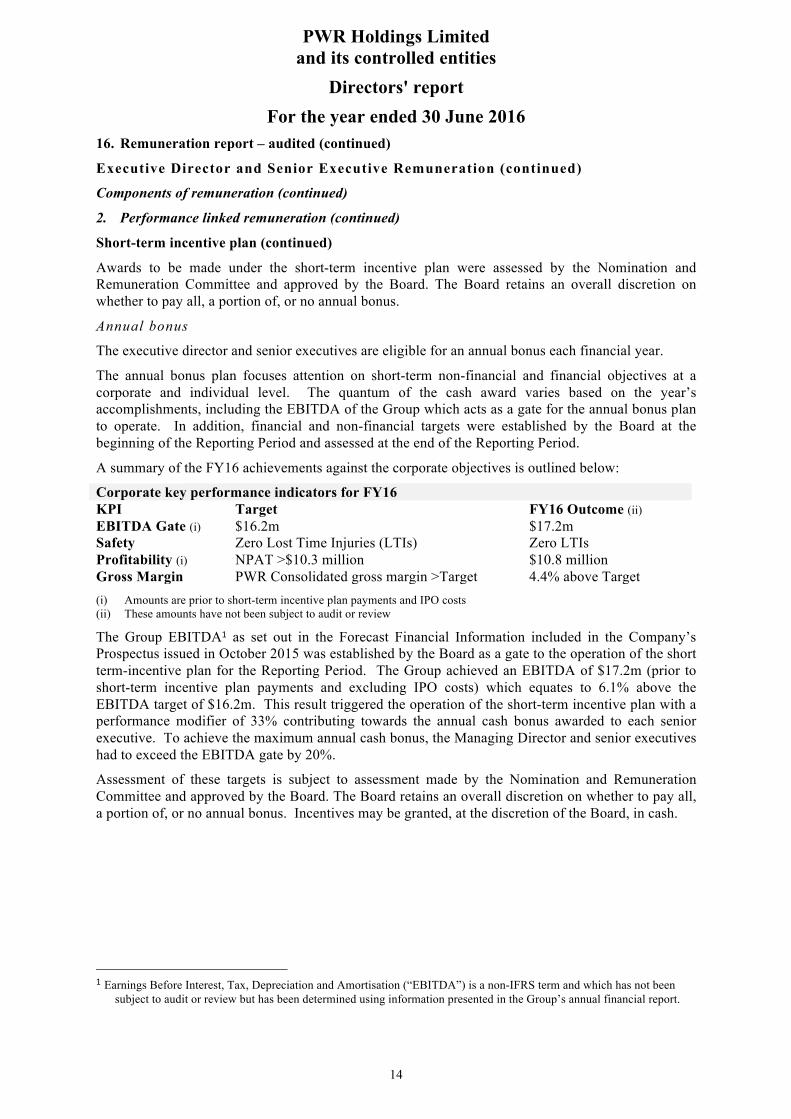
A summary of the FY16 achievements against the corporate objectives is outlined below:
Corporate key performance indicators for FY16 KPI Target FY16 Outcome (ii) EBITDA Gate (i) $16.2m $17.2m Safety Zero Lost Time Injuries (LTIs) Zero LTIs Profitability (i) NPAT >$10.3 million $10.8 million Gross Margin PWR Consolidated gross margin >Target 4.4% above Target (i) Amounts are prior to short-term incentive plan payments and IPO costs (ii) These amounts have not been subject to audit or review
The Group EBITDA1 as set out in the Forecast Financial Information included in the Company’s Prospectus issued in October 2015 was established by the Board as a gate to the operation of the short term-incentive plan for the Reporting Period. The Group achieved an EBITDA of $17.2m (prior to short-term incentive plan payments and excluding IPO costs) which equates to 6.1% above the EBITDA target of $16.2m. This result triggered the operation of the short-term incentive plan with a performance modifier of 33% contributing towards the annual cash bonus awarded to each senior executive. To achieve the maximum annual cash bonus, the Managing Director and senior executives had to exceed the EBITDA gate by 20%.
Assessment of these targets is subject to assessment made by the Nomination and Remuneration Committee and approved by the Board. The Board retains an overall discretion on whether to pay all, a portion of, or no annual bonus. Incentives may be granted, at the discretion of the Board, in cash.
1 Earnings Before Interest, Tax, Depreciation and Amortisation (“EBITDA”) is a non-IFRS term and which has not been
subject to audit or review but has been determined using information presented in the Group’s annual financial report.
PWR Holdings Limited and its controlled entities
Directors' report For the year ended 30 June 2016
15
16. Remuneration report – audited (continued)
Executive Director and Senior Executive Remuneration (continued)
Components of remuneration (continued)
2. Performance linked remuneration (continued)
Short-term incentive plan (continued)
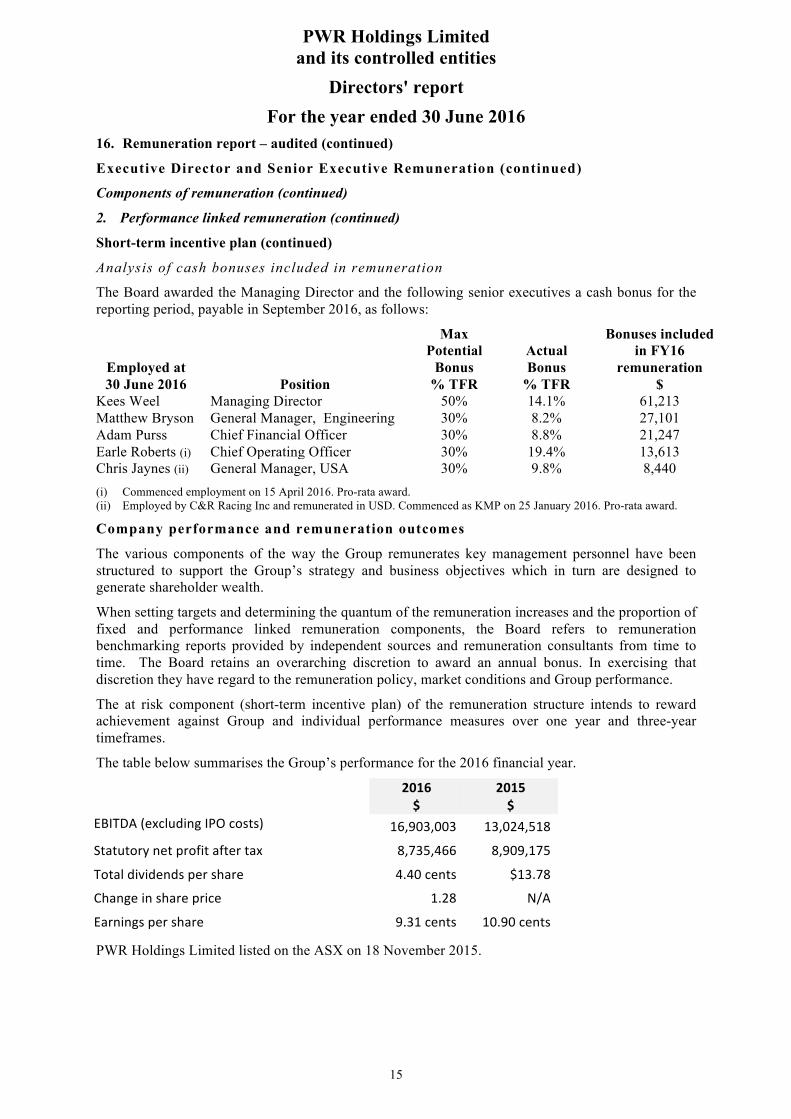
Analysis of cash bonuses included in remuneration
The Board awarded the Managing Director and the following senior executives a cash bonus for the reporting period, payable in September 2016, as follows:
Employed at 30 June 2016 Position
Max Potential
Bonus % TFR
Actual Bonus
% TFR
Bonuses included in FY16
remuneration
$
Kees Weel Managing Director 50% 14.1% 61,213 Matthew Bryson General Manager, Engineering 30% 8.2% 27,101 Adam Purss Chief Financial Officer 30% 8.8% 21,247 Earle Roberts (i) Chief Operating Officer 30% 19.4% 13,613 Chris Jaynes (ii) General Manager, USA 30% 9.8% 8,440 (i) Commenced employment on 15 April 2016. Pro-rata award. (ii) Employed by C&R Racing Inc and remunerated in USD. Commenced as KMP on 25 January 2016. Pro-rata award.
Company performance and remuneration outcomes
The various components of the way the Group remunerates key management personnel have been structured to support the Group’s strategy and business objectives which in turn are designed to generate shareholder wealth.
When setting targets and determining the quantum of the remuneration increases and the proportion of fixed and performance linked remuneration components, the Board refers to remuneration benchmarking reports provided by independent sources and remuneration consultants from time to time. The Board retains an overarching discretion to award an annual bonus. In exercising that discretion they have regard to the remuneration policy, market conditions and Group performance.
The at risk component (short-term incentive plan) of the remuneration structure intends to reward achievement against Group and individual performance measures over one year and three-year timeframes.
The table below summarises the Group’s performance for the 2016 financial year.
2016 $
2015 $
EBITDA(excludingIPOcosts) 16,903,003 13,024,518
Statutorynetprofitaftertax 8,735,466 8,909,175
Totaldividendspershare 4.40cents $13.78
Changeinshareprice 1.28 N/A
Earningspershare 9.31cents 10.90cents
PWR Holdings Limited listed on the ASX on 18 November 2015.

PWR Holdings Limited and its controlled entities
Directors' report For the year ended 30 June 2016
16
16. Remuneration report – audited (continued)
Company performance and remuneration outcomes (continued)
RemunerationGovernance
TotalFixedRemuneration(TFR)
Salaryandotherbenefitsincludingstatutorysuperannuation
AnnualBonus Cashfortargeted
performanceaboveandbeyondrole
Total
Remuneration(TR)
PerformanceMeasures
PersonalDevelopmentPlans • Performancetorole • PWRDNA • STIGuidelines
• Profitgate–minimumEBITDAistobereachedbeforeoperationoftheannualbonusplan
• Summarisedonpage14oftheRemunerationReport)=40%,personalgoalsrelevanttoareaofaccountabilityand60%linkedtoCorporategoals
• Themaximumamountofremunerationabletobeearnedbykeymanagementpersonnel
ComponentofRemuneration
Guaranteed ExecutiveEmploymentAgreement
Atrisk ManagingDirectorupto50%TFR OtherKMPupto30%TFR
Linktoperformance
TheobjectivesoftheGroup’sremunerationpolicyareto: • Alignremunerationpracticeswithsustainableshareholdervalue
• Providefair,consistentandcompetitiveremunerationtoattractandretainthebestemployees
• MotivateemployeestoperforminthebestinterestsoftheGroupandourstakeholders
• Ensuregenderpayequity
• Rewardscorporatefinancialandnon-financialperformance. TheEBITDAgateandfinancialperformancemeasureswerechosenprincipallybecauseGroupearningsandgrossmarginshoulddrivedividendsandsharepricegrowthovertime. • AlignstoGroup’sstrategicgoals.Recognisesandrewardsachievementofstrategyimplementationrelevanttoareaofaccountability
• DrivesleadershipperformanceandbehavioursconsistentwiththeGroup’svalues
PWR Holdings Limited and its controlled entities
Directors' report For the year ended 30 June 2016
17
16. Remuneration report – audited (continued)
Key Management Personnel Remuneration
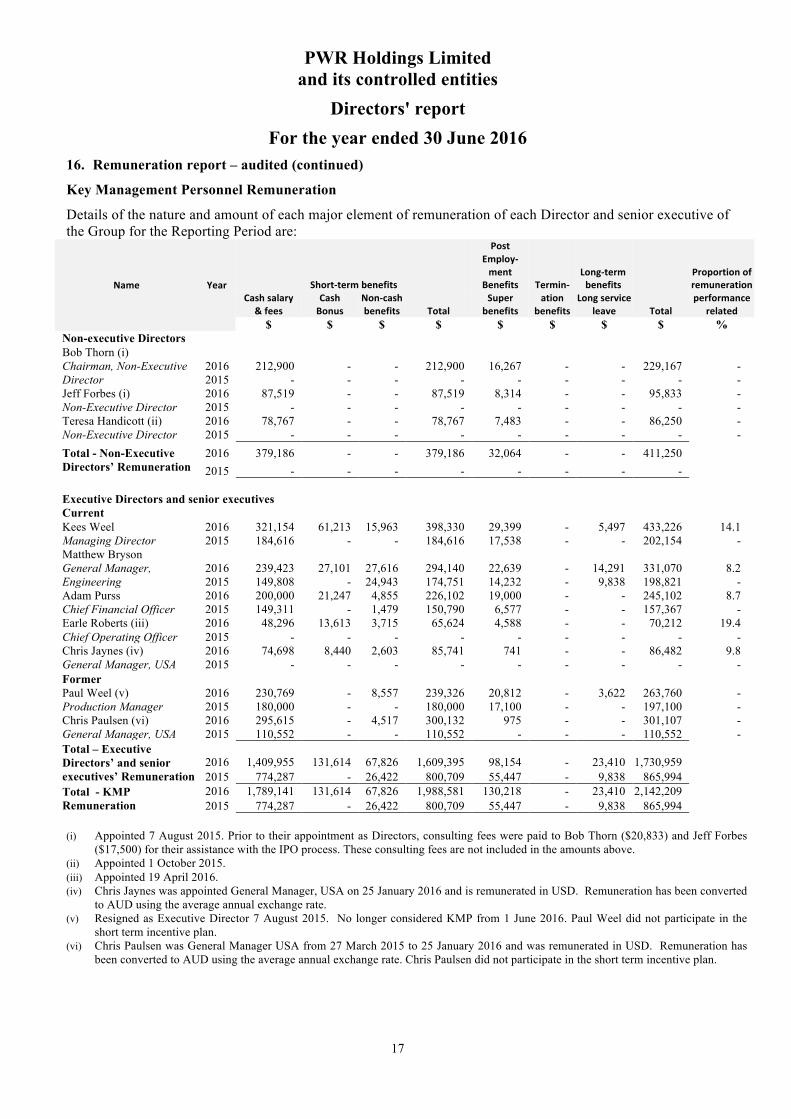
Details of the nature and amount of each major element of remuneration of each Director and senior executive of the Group for the Reporting Period are:
Name Year Short-termbenefits
Post Employ- ment
Benefits Termin- ation
benefits
Long-termbenefits
Total
Proportionofremunerationperformance
related Cashsalary&fees
Cash Bonus
Non-cashbenefits Total
Superbenefits
Longserviceleave
$ $ $ $ $ $ $ $ % Non-executive Directors Bob Thorn (i) Chairman, Non-Executive Director
2016 212,900 - - 212,900 16,267 - - 229,167 - 2015 - - - - - - - - -
Jeff Forbes (i) Non-Executive Director
2016 87,519 - - 87,519 8,314 - - 95,833 - 2015 - - - - - - - - -
Teresa Handicott (ii) Non-Executive Director
2016 78,767 - - 78,767 7,483 - - 86,250 - 2015 - - - - - - - - -
Total - Non-Executive Directors’ Remuneration
2016 379,186 - - 379,186 32,064 - - 411,250 2015 - - - - - - - -
Executive Directors and senior executives Current Kees Weel Managing Director
2016 321,154 61,213 15,963 398,330 29,399 - 5,497 433,226 14.1 2015 184,616 - - 184,616 17,538 - - 202,154 -
Matthew Bryson General Manager, Engineering
2016 239,423 27,101 27,616 294,140 22,639 - 14,291 331,070 8.2 2015 149,808 - 24,943 174,751 14,232 - 9,838 198,821 -
Adam Purss Chief Financial Officer
2016 200,000 21,247 4,855 226,102 19,000 - - 245,102 8.7 2015 149,311 - 1,479 150,790 6,577 - - 157,367 -
Earle Roberts (iii) Chief Operating Officer
2016 48,296 13,613 3,715 65,624 4,588 - - 70,212 19.4 2015 - - - - - - - - -
Chris Jaynes (iv) General Manager, USA
2016 74,698 8,440 2,603 85,741 741 - - 86,482 9.8 2015 - - - - - - - - -
Former Paul Weel (v) Production Manager
2016 230,769 - 8,557 239,326 20,812 - 3,622 263,760 - 2015 180,000 - - 180,000 17,100 - - 197,100 -
Chris Paulsen (vi) General Manager, USA
2016 295,615 - 4,517 300,132 975 - - 301,107 - 2015 110,552 - - 110,552 - - - 110,552 -
Total – Executive Directors’ and senior executives’ Remuneration
2016 1,409,955 131,614 67,826 1,609,395 98,154 - 23,410 1,730,959 2015 774,287 - 26,422 800,709 55,447 - 9,838 865,994
Total - KMP Remuneration
2016 1,789,141 131,614 67,826 1,988,581 130,218 - 23,410 2,142,209 2015 774,287 - 26,422 800,709 55,447 - 9,838 865,994
(i) Appointed 7 August 2015. Prior to their appointment as Directors, consulting fees were paid to Bob Thorn ($20,833) and Jeff Forbes
($17,500) for their assistance with the IPO process. These consulting fees are not included in the amounts above. (ii) Appointed 1 October 2015. (iii) Appointed 19 April 2016. (iv) Chris Jaynes was appointed General Manager, USA on 25 January 2016 and is remunerated in USD. Remuneration has been converted
to AUD using the average annual exchange rate. (v) Resigned as Executive Director 7 August 2015. No longer considered KMP from 1 June 2016. Paul Weel did not participate in the
short term incentive plan. (vi) Chris Paulsen was General Manager USA from 27 March 2015 to 25 January 2016 and was remunerated in USD. Remuneration has
been converted to AUD using the average annual exchange rate. Chris Paulsen did not participate in the short term incentive plan.
PWR Holdings Limited and its controlled entities
Directors' report For the year ended 30 June 2016
18
16. Remuneration report – audited (continued)
Other Information
Contract duration and termination requirements
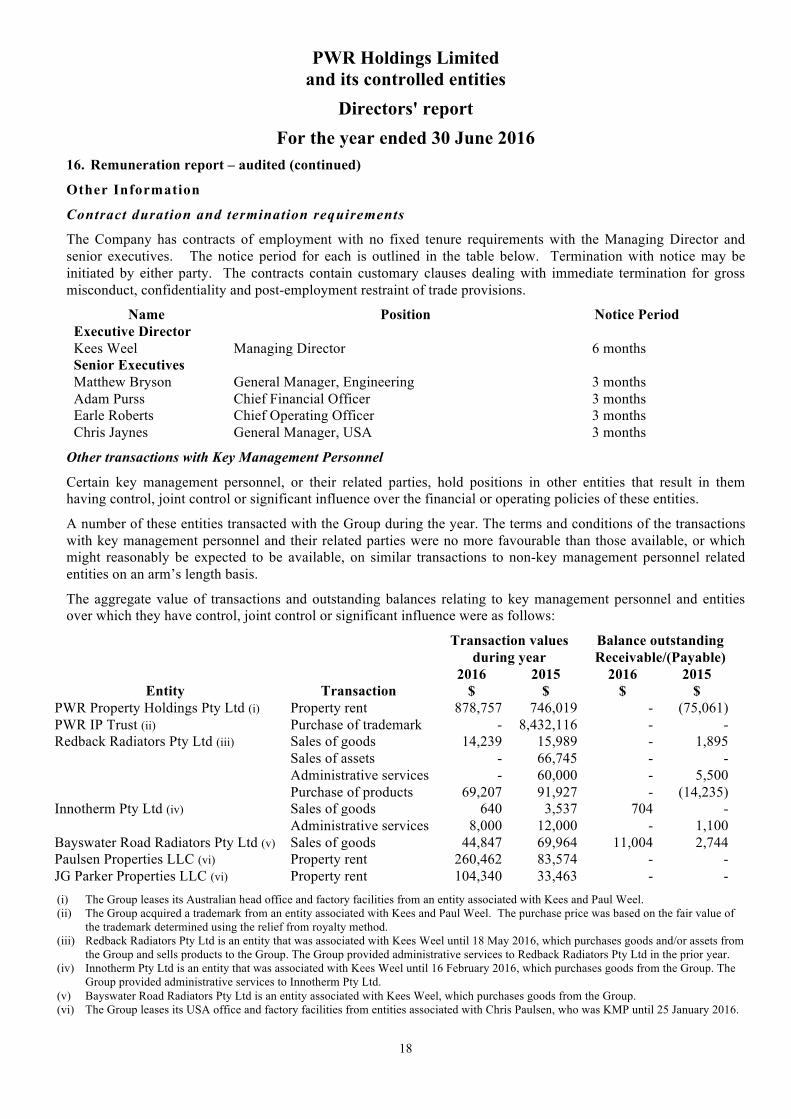
The Company has contracts of employment with no fixed tenure requirements with the Managing Director and senior executives. The notice period for each is outlined in the table below. Termination with notice may be initiated by either party. The contracts contain customary clauses dealing with immediate termination for gross misconduct, confidentiality and post-employment restraint of trade provisions.
Name Position Notice Period Executive Director Kees Weel Managing Director 6 months Senior Executives Matthew Bryson General Manager, Engineering 3 months Adam Purss Chief Financial Officer 3 months Earle Roberts Chief Operating Officer 3 months Chris Jaynes General Manager, USA 3 months
Other transactions with Key Management Personnel
Certain key management personnel, or their related parties, hold positions in other entities that result in them having control, joint control or significant influence over the financial or operating policies of these entities.
A number of these entities transacted with the Group during the year. The terms and conditions of the transactions with key management personnel and their related parties were no more favourable than those available, or which might reasonably be expected to be available, on similar transactions to non-key management personnel related entities on an arm’s length basis.
The aggregate value of transactions and outstanding balances relating to key management personnel and entities over which they have control, joint control or significant influence were as follows:
Transaction values during year
Balance outstanding Receivable/(Payable)
2016 2015 2016 2015 Entity Transaction $ $ $ $
PWR Property Holdings Pty Ltd (i) Property rent 878,757 746,019 - (75,061) PWR IP Trust (ii) Purchase of trademark - 8,432,116 - - Redback Radiators Pty Ltd (iii) Sales of goods 14,239 15,989 - 1,895 Sales of assets - 66,745 - - Administrative services - 60,000 - 5,500 Purchase of products 69,207 91,927 - (14,235) Innotherm Pty Ltd (iv) Sales of goods 640 3,537 704 - Administrative services 8,000 12,000 - 1,100 Bayswater Road Radiators Pty Ltd (v) Sales of goods 44,847 69,964 11,004 2,744 Paulsen Properties LLC (vi) Property rent 260,462 83,574 - - JG Parker Properties LLC (vi) Property rent 104,340 33,463 - - (i) The Group leases its Australian head office and factory facilities from an entity associated with Kees and Paul Weel. (ii) The Group acquired a trademark from an entity associated with Kees and Paul Weel. The purchase price was based on the fair value of
the trademark determined using the relief from royalty method. (iii) Redback Radiators Pty Ltd is an entity that was associated with Kees Weel until 18 May 2016, which purchases goods and/or assets from
the Group and sells products to the Group. The Group provided administrative services to Redback Radiators Pty Ltd in the prior year. (iv) Innotherm Pty Ltd is an entity that was associated with Kees Weel until 16 February 2016, which purchases goods from the Group. The
Group provided administrative services to Innotherm Pty Ltd. (v) Bayswater Road Radiators Pty Ltd is an entity associated with Kees Weel, which purchases goods from the Group. (vi) The Group leases its USA office and factory facilities from entities associated with Chris Paulsen, who was KMP until 25 January 2016.

PWR Holdings Limited and its controlled entities
Directors' report For the year ended 30 June 2016
19
16. Remuneration report – audited (continued)
Other Information (continued)
Share holdings of Key Management Personnel
The movement during the year in the number of ordinary shares in PWR Holdings Limited held, directly, indirectly or beneficially, by each member of the Key Management Personnel, including their related parties, is as follows:
Name
Shareholdings of KMP Opening Balance
1 July 2015 (ii)
Shares acquired
during the year
Shares disposed of
during the year
Other (iv) Closing Balance
30 June 2016
Non-executive Directors Bob Thorn - 400,000 - 400,000 Jeff Forbes - 20,000 - 20,000 Teresa Handicott - 13,500 - 13,500 Executive Directors and Senior Executives Current Kees Weel 76,768,500 - (38,400,000) (iii) 38,368,500 (i) Matthew Bryson 4,195,000 14,000 - 4,209,000 Adam Purss - 13,330 - 13,330 Earle Roberts - 21,800 - 21,800 Chris Jaynes - - - - Former Paul Weel 76,768,500 - (38,400,000) (iii) (38,368,500) (i) N/A Chris Paulsen 2,936,500 - - (2,936,500) N/A (i) 38,368,500 shares held by KPW Property Holdings Pty Ltd as trustee for the KPW Holdings Trust. At 30 June 2016 Kees and Paul
Weel are directors of the trustee and beneficiaries of the trust. (ii) Shares held at 1 July 2015 represent shares held prior to the IPO. Pre-IPO shares were subject to pre-IPO share split in the ratio of
1:83.9. The opening balance represents the number of shares post the share split which occurred on 9 October 2015. (iii) Shares disposed represent shares sold by KPW Property Holdings Pty Ltd into the IPO. (iv) Shares no longer held in capacity as KMP.
Remuneration consultants
The Board did not retain remuneration consultants during the Reporting Period.
Employee Share Plans
There were no employee share plans in place during the Reporting Period.
This report is made with a resolution of the directors:
Bob Thorn Kees Weel Chairman Managing Director Dated at Brisbane, this 25th day of August 2016. Dated at Brisbane, this 25th day of August 2016.
20
ABCD
KPMG, an Australian partnership and a member firm of the KPMG network of independent member firms affiliated with KPMG International Cooperative (“KPMG International”), a Swiss entity.
Liability limited by a scheme approved under Professional Standards Legislation.
Lead Auditor’s Independence Declaration under Section 307C of the Corporations Act 2001
To: the directors of PWR Holdings Limited
I declare that, to the best of my knowledge and belief, in relation to the audit for the financial year ended 30 June 2016 there have been:
i. no contraventions of the auditor independence requirements as set out in the Corporations Act 2001 in relation to the audit; and
ii. no contraventions of any applicable code of professional conduct in relation to the audit.
KPMG
Jason Adams Partner
Brisbane 25 August 2016
PWR Holdings Limited and its controlled entities
Consolidated Statement of Profit or Loss and Other Comprehensive Income For the year ended 30 June 2016
21
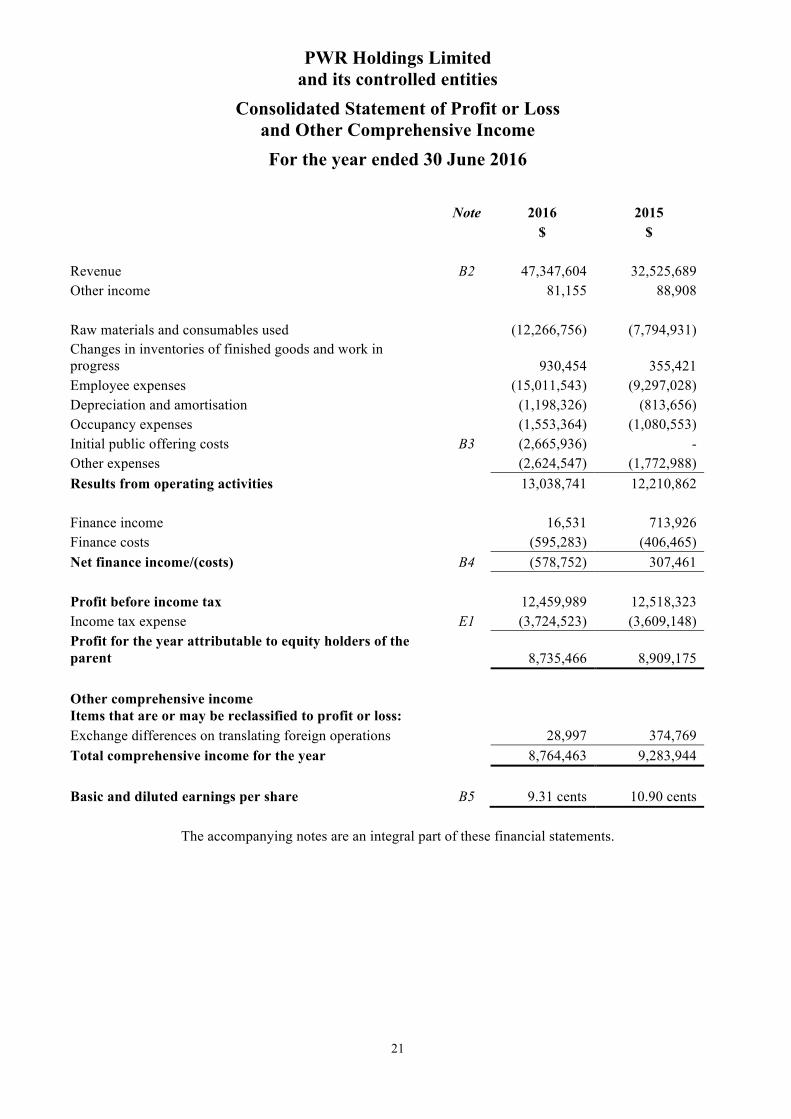
Note 2016 2015 $ $ Revenue B2 47,347,604 32,525,689 Other income 81,155 88,908 Raw materials and consumables used (12,266,756) (7,794,931) Changes in inventories of finished goods and work in progress
930,454 355,421
Employee expenses (15,011,543) (9,297,028) Depreciation and amortisation (1,198,326) (813,656) Occupancy expenses (1,553,364) (1,080,553) Initial public offering costs B3 (2,665,936) - Other expenses (2,624,547) (1,772,988) Results from operating activities 13,038,741 12,210,862 Finance income 16,531 713,926 Finance costs (595,283) (406,465) Net finance income/(costs) B4 (578,752) 307,461 Profit before income tax 12,459,989 12,518,323 Income tax expense E1 (3,724,523) (3,609,148) Profit for the year attributable to equity holders of the parent
8,735,466 8,909,175
Other comprehensive income Items that are or may be reclassified to profit or loss:
Exchange differences on translating foreign operations 28,997 374,769 Total comprehensive income for the year 8,764,463 9,283,944 Basic and diluted earnings per share B5 9.31 cents 10.90 cents
The accompanying notes are an integral part of these financial statements.

PWR Holdings Limited and its controlled entities
Consolidated Statement of Financial Position At 30 June 2016
22
Note 2016 2015 Assets $ $ Current assets Cash and cash equivalents C1 8,796,805 1,005,861 Trade and other receivables C2 4,089,710 4,314,617 Inventories C3 6,743,778 5,106,744 Current tax assets E2 - 170,388 Other assets including derivatives C4 631,403 1,411,715 Total current assets 20,261,696 12,009,325 Non-current assets Property, plant and equipment C5 5,909,144 4,727,525 Intangible assets C6 14,174,350 14,125,891 Deferred tax assets E2 1,821,995 656,145 Total non-current assets 21,905,489 19,509,561 Total assets 42,167,185 31,518,886 Liabilities Current liabilities Trade and other payables C7 2,662,196 1,849,531 Loans and borrowings F1 396,621 5,579,444 Employee benefits D1 969,807 868,600 Provisions C8 119,009 99,688 Current tax liabilities E2 408,648 - Total current liabilities 4,556,281 8,397,263 Non-current liabilities Loans and borrowings F1 763,641 17,794,203 Employee benefits D1 123,765 115,960 Total non-current liabilities 887,406 17,910,163 Total liabilities 5,443,687 26,307,426 Net assets 36,723,498 5,211,460 Equity Issued capital F2 25,920,826 2,553,251 Reserves F2 514,065 485,068 Retained earnings 10,288,607 2,173,141 Total equity 36,723,498 5,211,460
The accompanying notes are an integral part of these financial statements.

PWR Holdings Limited 23 and its controlled entities
Consolidated Statement of Changes in Equity For the year ended 30 June 2016
23
Share
Capital
Foreign currency
translation reserve
Retained earnings Total equity
Note $ $ $ $ Balance at 1 July 2015 2,553,251 485,068 2,173,141 5,211,460 Total comprehensive income for the year
Profit for the year - - 8,735,466 8,735,466 Other comprehensive income - 28,997 - 28,997 Total comprehensive income - 28,997 8,735,466 8,764,463 Transactions with owners, recorded directly in equity
Share issued during the year, net of costs F2 23,367,575 - - 23,367,575 Dividends paid F3 - - (620,000) (620,000) Total transactions with owners 23,367,575 - (620,000) 22,747,575 Balance at 30 June 2016 25,920,826 514,065 10,288,607 36,723,498 Balance at 1 July 2014 1 110,299 6,563,966 6,674,266 Total comprehensive income for the year Profit for the year - - 8,909,175 8,909,175 Other comprehensive income - 374,769 - 374,769 Total comprehensive income - 374,769 8,909,175 9,283,944 Transactions with owners, recorded directly in equity
Share issued during the year F2 2,553,250 - - 2,553,250 Dividends paid F3 - - (13,300,000) (13,300,000) Total transactions with owners 2,553,250 - (13,300,000) (10,746,750) Balance at 30 June 2015 2,553,251 485,068 2,173,141 5,211,460
The accompanying notes are an integral part of these financial statements.
PWR Holdings Limited and its controlled entities
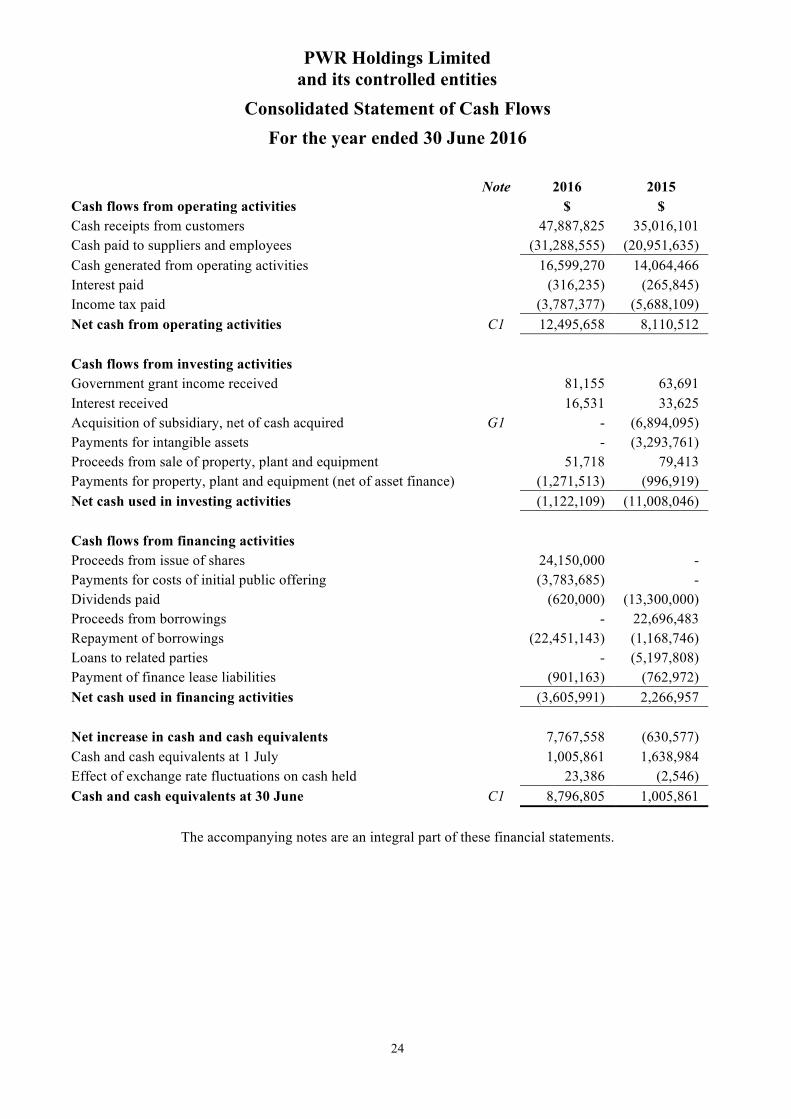
Consolidated Statement of Cash Flows For the year ended 30 June 2016
24
Note 2016 2015 Cash flows from operating activities $ $ Cash receipts from customers 47,887,825 35,016,101 Cash paid to suppliers and employees (31,288,555) (20,951,635) Cash generated from operating activities 16,599,270 14,064,466 Interest paid (316,235) (265,845) Income tax paid (3,787,377) (5,688,109) Net cash from operating activities C1 12,495,658 8,110,512 Cash flows from investing activities Government grant income received 81,155 63,691 Interest received 16,531 33,625 Acquisition of subsidiary, net of cash acquired G1 - (6,894,095) Payments for intangible assets - (3,293,761) Proceeds from sale of property, plant and equipment 51,718 79,413 Payments for property, plant and equipment (net of asset finance) (1,271,513) (996,919) Net cash used in investing activities (1,122,109) (11,008,046) Cash flows from financing activities Proceeds from issue of shares 24,150,000 - Payments for costs of initial public offering (3,783,685) - Dividends paid (620,000) (13,300,000) Proceeds from borrowings - 22,696,483 Repayment of borrowings (22,451,143) (1,168,746) Loans to related parties - (5,197,808) Payment of finance lease liabilities (901,163) (762,972) Net cash used in financing activities (3,605,991) 2,266,957 Net increase in cash and cash equivalents 7,767,558 (630,577) Cash and cash equivalents at 1 July 1,005,861 1,638,984 Effect of exchange rate fluctuations on cash held 23,386 (2,546) Cash and cash equivalents at 30 June C1 8,796,805 1,005,861
The accompanying notes are an integral part of these financial statements.
PWR Holdings Limited and its controlled entities
Notes to the consolidated financial statements For the year ended 30 June 2016
25
Section A About this Report
A1 Reporting entity
PWR Holdings Limited (the “Company”) is a Company domiciled in Australia.
The consolidated financial statements of the Company as at and for the year ended 30 June 2016 comprise the Company and its subsidiaries (together referred to as the “Group” and individually as “Group Entities”).
The Group is involved in the design, engineering, production, testing, validation and sales of customised aluminium cooling products and solutions to the motorsports, automotive original equipment manufacturing, automotive aftermarket and emerging technologies sectors for domestic and international markets.
The Company’s registered office and principal place of business is 103 Lahrs Road, Ormeau, Queensland 4208.
The Group is a for-profit entity for the purposes of preparing these financial statements.
Rounding
In accordance with the ASIC Corporations (Rounding in Financial/Directors’ Reports) Instrument 2016/191 commencing 1 April 2016, amounts in the financial report and Directors’ report have been rounded to the nearest dollar, unless otherwise stated.
A2 Basis of preparation
(a) Statement of compliance
The consolidated financial statements are general purpose financial statements which have been prepared in accordance with Australian Accounting Standards (AASBs) adopted by the Australian Accounting Standards Board (AASB) and the Corporations Act 2001. The consolidated financial statements comply with International Financial Reporting Standards (IFRS) adopted by the International Accounting Standards Board (IASB).
The financial statements were approved by the Board of Directors on 25 August 2016.
(b) Basis of measurement
The consolidated financial statements have been prepared on the historical cost basis except for any derivative financial instruments which are recognised at fair value.
(c) Functional and presentation currency
These consolidated financial statements are presented in Australian dollars, which is the Company's functional currency.
(d) Use of estimates and judgements
The preparation of consolidated financial statements requires management to make judgements, estimates and assumptions that affect the application of accounting policies and the reported amounts of assets, liabilities, income and expenses. The estimates and associated assumptions are based on historical experience and various other factors that are believed to be reasonable under the circumstances, the results of which form the basis of making judgments about carrying values of the entities within the Group. Actual results may differ from these estimates.
Estimates and underlying assumptions are reviewed on an ongoing basis. Revisions to accounting estimates are recognised in the period in which the estimate is revised and in any future periods affected.
PWR Holdings Limited and its controlled entities
Notes to the consolidated financial statements For the year ended 30 June 2016
26
Section A About this Report (continued)
A2 Basis of preparation (continued)
(d) Use of estimates and judgements (continued)
Information about critical judgements, estimates and assumptions in applying accounting policies that have the most significant effect on the amounts recognised in the consolidated financial statements is included in the following notes:
• Note C3 – Inventories • Note C6 – Intangible assets • Section E – Taxation
• Note C8 – Provisions • Note G1 – Business combinations
A3 Significant accounting policies
The accounting policies set out in the individual notes to the consolidated financial statements have been applied consistently to all periods presented in these consolidated financial statements.
A4 Foreign currency transactions and operations
Transactions in foreign currencies are translated to the respective functional currencies of Group entities at exchange rates at the dates of the transactions. Monetary assets and liabilities denominated in foreign currencies are translated to the functional currency at the exchange rate at that date.
Non-monetary assets and liabilities that are measured at fair value in a foreign currency are translated to the functional currency at the exchange rate when the fair value was determined. Non-monetary items that are measured based on historical cost in a foreign currency are translated using the exchange rate at the date of the transaction.
Foreign currency differences are generally recognised in profit or loss.
The assets and liabilities of foreign operations, including goodwill and fair value adjustments arising on acquisition are translated to the functional currency at exchange rates at the reporting date. The income and expenses of foreign operations are translated to the functional currency at exchange rates at the dates of the transactions.
Foreign currency translation differences are recognised in other comprehensive income and presented in the foreign currency translation reserve in equity.
A5 Determination of fair values
A number of the Group’s accounting policies and disclosures require the determination of fair value, for both financial and non-financial assets and liabilities. Fair values have been determined for measurement and/or disclosure purposes based on the following methods. Where applicable, further information about the assumptions made in determining fair values is disclosed in the notes specific to that asset or liability.
Non-derivative financial liabilities
Fair value, which is determined for disclosure purposes, is calculated based on the present value of future principal and interest cash flows, discounted at the market rate of interest at reporting date.
Derivative financial instruments
Fair value, which is determined for recognition and disclosure purposes, is calculated based on valuation techniques using observable market inputs.
PWR Holdings Limited and its controlled entities
Notes to the consolidated financial statements For the year ended 30 June 2016
27
Section B Business Performance
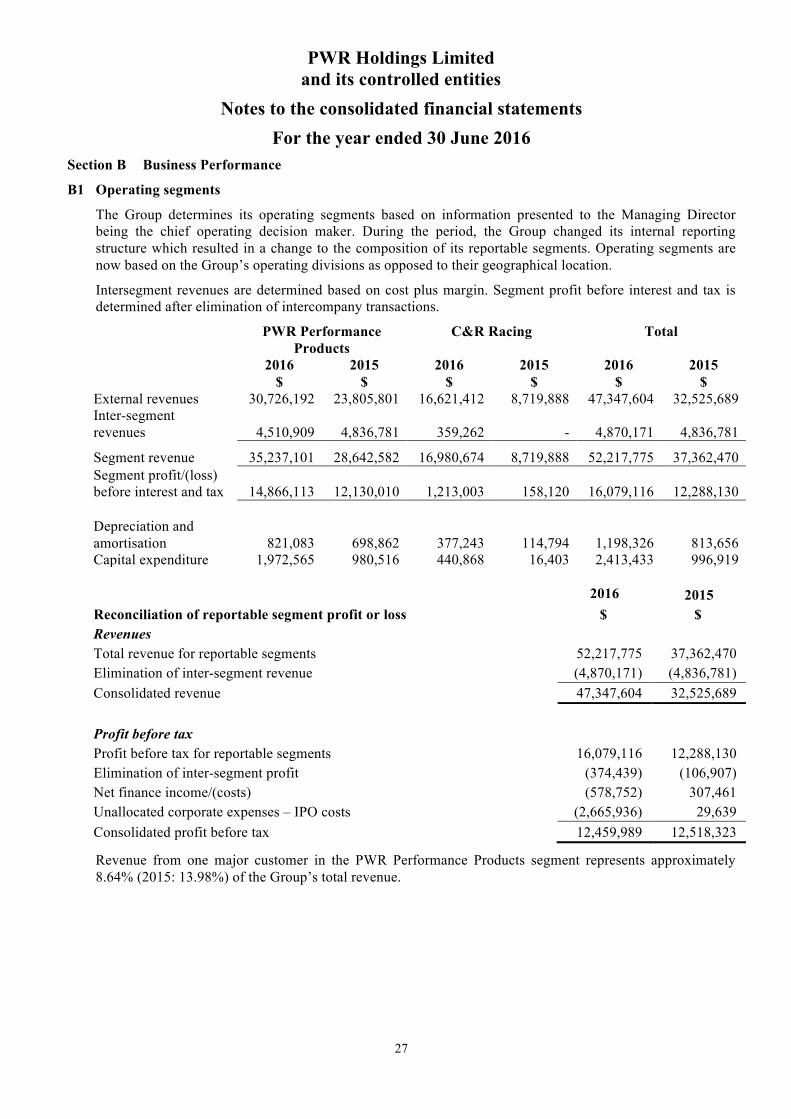
B1 Operating segments
The Group determines its operating segments based on information presented to the Managing Director being the chief operating decision maker. During the period, the Group changed its internal reporting structure which resulted in a change to the composition of its reportable segments. Operating segments are now based on the Group’s operating divisions as opposed to their geographical location.
Intersegment revenues are determined based on cost plus margin. Segment profit before interest and tax is determined after elimination of intercompany transactions.
PWR Performance Products
C&R Racing Total
2016 2015 2016 2015 2016 2015 $ $ $ $ $ $ External revenues 30,726,192 23,805,801 16,621,412 8,719,888 47,347,604 32,525,689 Inter-segment revenues 4,510,909 4,836,781 359,262 - 4,870,171 4,836,781
Segment revenue 35,237,101 28,642,582 16,980,674 8,719,888 52,217,775 37,362,470 Segment profit/(loss) before interest and tax 14,866,113
12,130,010
1,213,003
158,120
16,079,116
12,288,130
Depreciation and amortisation 821,083 698,862 377,243 114,794 1,198,326 813,656 Capital expenditure 1,972,565 980,516 440,868 16,403 2,413,433 996,919 2016 2015 Reconciliation of reportable segment profit or loss $ $ Revenues Total revenue for reportable segments 52,217,775 37,362,470 Elimination of inter-segment revenue (4,870,171) (4,836,781) Consolidated revenue 47,347,604 32,525,689 Profit before tax Profit before tax for reportable segments 16,079,116 12,288,130 Elimination of inter-segment profit (374,439) (106,907) Net finance income/(costs) (578,752) 307,461 Unallocated corporate expenses – IPO costs (2,665,936) 29,639 Consolidated profit before tax 12,459,989 12,518,323
Revenue from one major customer in the PWR Performance Products segment represents approximately 8.64% (2015: 13.98%) of the Group’s total revenue.
PWR Holdings Limited and its controlled entities
Notes to the consolidated financial statements For the year ended 30 June 2016
28
Section B Business Performance (continued)
B1 Operating segments (continued)
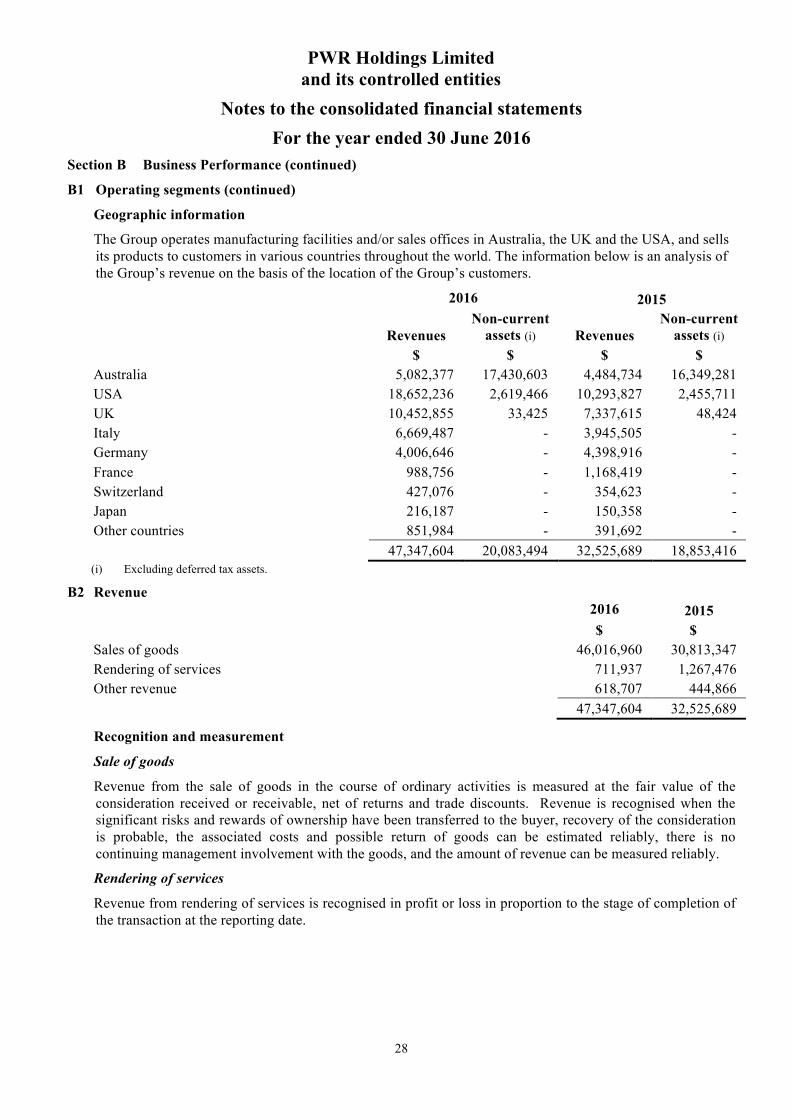
Geographic information
The Group operates manufacturing facilities and/or sales offices in Australia, the UK and the USA, and sells its products to customers in various countries throughout the world. The information below is an analysis of the Group’s revenue on the basis of the location of the Group’s customers.
2016 2015
Revenues Non-current
assets (i) Revenues Non-current
assets (i) $ $ $ $ Australia 5,082,377 17,430,603 4,484,734 16,349,281 USA 18,652,236 2,619,466 10,293,827 2,455,711 UK 10,452,855 33,425 7,337,615 48,424 Italy 6,669,487 - 3,945,505 - Germany 4,006,646 - 4,398,916 - France 988,756 - 1,168,419 - Switzerland 427,076 - 354,623 - Japan 216,187 - 150,358 - Other countries 851,984 - 391,692 - 47,347,604 20,083,494 32,525,689 18,853,416 (i) Excluding deferred tax assets.
B2 Revenue 2016 2015 $ $ Sales of goods 46,016,960 30,813,347 Rendering of services 711,937 1,267,476 Other revenue 618,707 444,866 47,347,604 32,525,689
Recognition and measurement
Sale of goods
Revenue from the sale of goods in the course of ordinary activities is measured at the fair value of the consideration received or receivable, net of returns and trade discounts. Revenue is recognised when the significant risks and rewards of ownership have been transferred to the buyer, recovery of the consideration is probable, the associated costs and possible return of goods can be estimated reliably, there is no continuing management involvement with the goods, and the amount of revenue can be measured reliably.
Rendering of services
Revenue from rendering of services is recognised in profit or loss in proportion to the stage of completion of the transaction at the reporting date.

PWR Holdings Limited and its controlled entities
Notes to the consolidated financial statements For the year ended 30 June 2016
29
Section B Business Performance (continued)
B3 Expenses
Significant items
During the year, the Company incurred $3.8 million before tax in one-off costs in relation to the initial public offering undertaken by the Company, of which $1.12 million was allocated to equity and $2.7 million was recorded as an expense. These non-recurring expenses are included in “Initial Public Offering Expenses” in the Consolidated Statement of Profit or Loss and Other Comprehensive Income.
B4 Finance income and expense
2016 2015 $ $
Interest income 16,531 33,625 Net foreign exchange gain - 680,301 16,531 713,926 Interest expense (316,235) (265,845) Borrowing costs - (140,620) Net foreign exchange loss (279,048) - (595,283) (406,465) Net finance costs (578,752) 307,461
Recognition and measurement
Finance income comprises interest income on funds invested and changes in the fair value of derivative financial instruments at fair value through profit or loss. Interest income is recognised as it accrues in profit or loss, using the effective interest method.
Finance costs comprise interest expense on borrowings and changes in the fair value of derivative financial instruments at fair value through profit or loss. Borrowing costs that are not directly attributable to the acquisition, construction or production of a qualifying asset are recognised in profit or loss using the effective interest method.
Foreign currency gains and losses on monetary assets and liabilities are reported on a net basis as either finance income or finance costs depending on whether foreign currency movements are in a net gain or net loss position.
PWR Holdings Limited and its controlled entities
Notes to the consolidated financial statements For the year ended 30 June 2016
30
Section B Business Performance (continued)
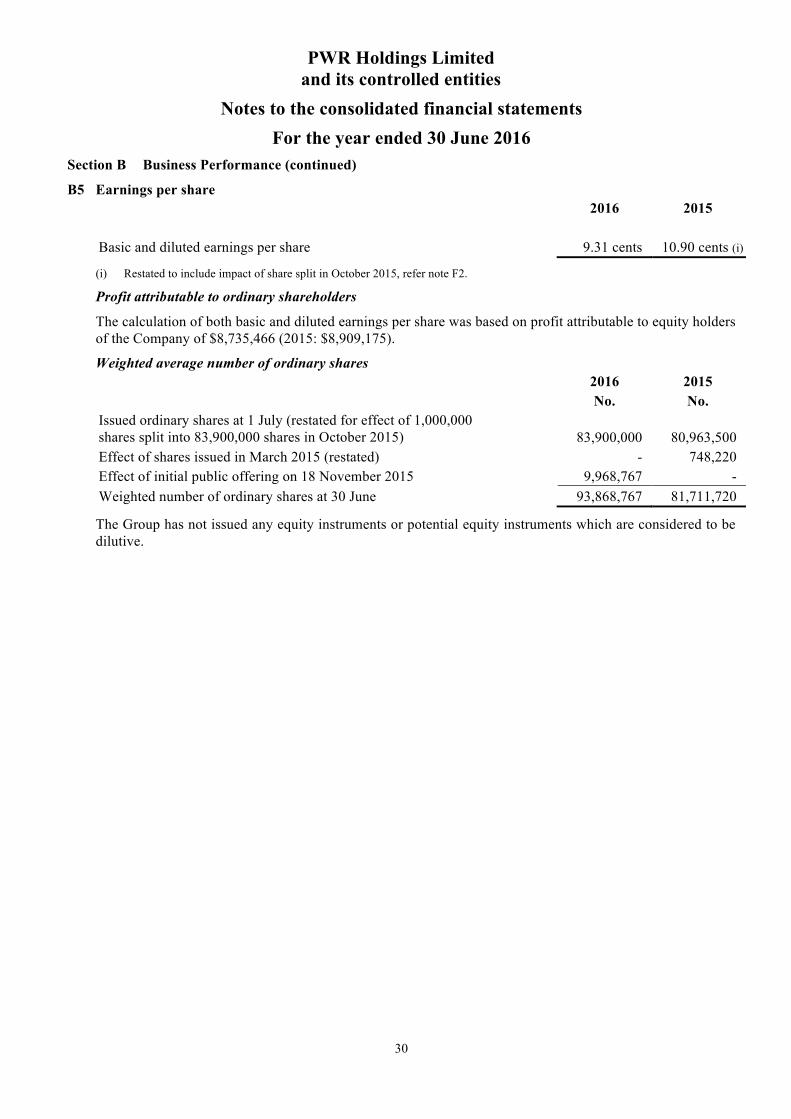
B5 Earnings per share 2016 2015 Basic and diluted earnings per share 9.31 cents 10.90 cents (i)
(i) Restated to include impact of share split in October 2015, refer note F2.
Profit attributable to ordinary shareholders
The calculation of both basic and diluted earnings per share was based on profit attributable to equity holders of the Company of $8,735,466 (2015: $8,909,175).
Weighted average number of ordinary shares 2016 2015 No. No. Issued ordinary shares at 1 July (restated for effect of 1,000,000 shares split into 83,900,000 shares in October 2015)
83,900,000 80,963,500
Effect of shares issued in March 2015 (restated) - 748,220 Effect of initial public offering on 18 November 2015 9,968,767 - Weighted number of ordinary shares at 30 June 93,868,767 81,711,720
The Group has not issued any equity instruments or potential equity instruments which are considered to be dilutive.
PWR Holdings Limited and its controlled entities
Notes to the consolidated financial statements For the year ended 30 June 2016
31
Section C Operating Assets and Liabilities
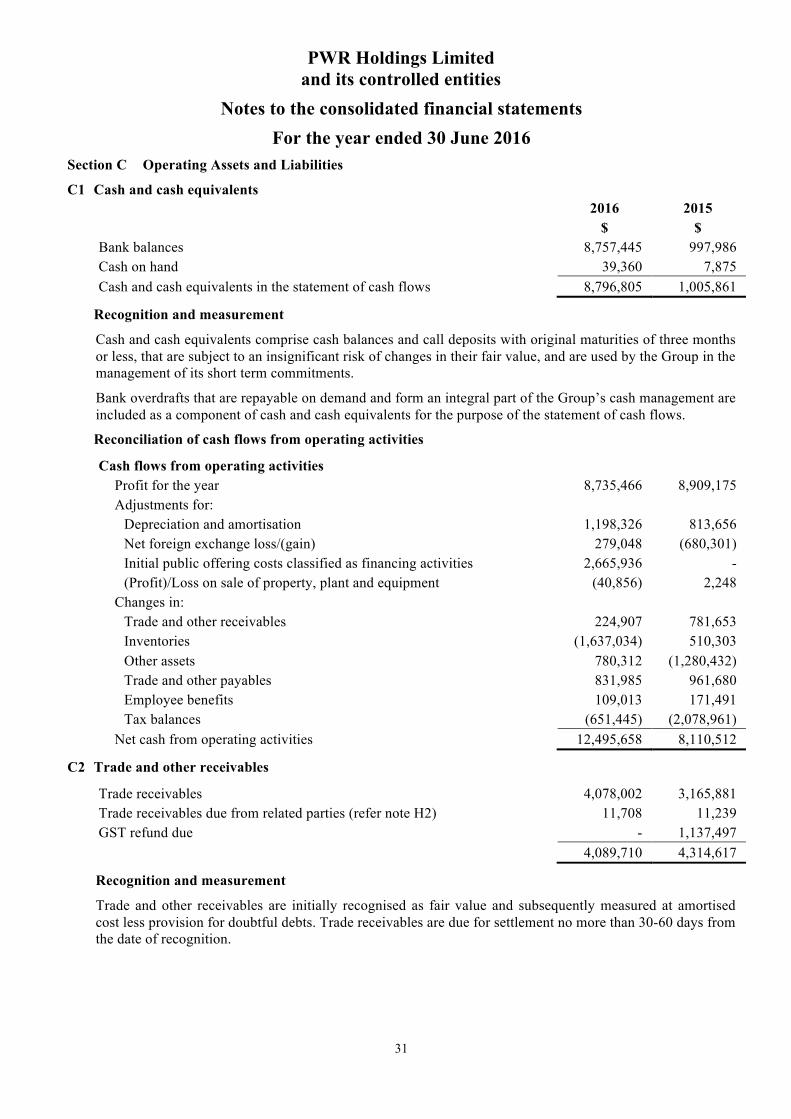
C1 Cash and cash equivalents 2016 2015 $ $ Bank balances 8,757,445 997,986 Cash on hand 39,360 7,875 Cash and cash equivalents in the statement of cash flows 8,796,805 1,005,861
Recognition and measurement
Cash and cash equivalents comprise cash balances and call deposits with original maturities of three months or less, that are subject to an insignificant risk of changes in their fair value, and are used by the Group in the management of its short term commitments.
Bank overdrafts that are repayable on demand and form an integral part of the Group’s cash management are included as a component of cash and cash equivalents for the purpose of the statement of cash flows.
Reconciliation of cash flows from operating activities
Cash flows from operating activities Profit for the year 8,735,466 8,909,175 Adjustments for:
Depreciation and amortisation 1,198,326 813,656 Net foreign exchange loss/(gain) 279,048 (680,301) Initial public offering costs classified as financing activities 2,665,936 - (Profit)/Loss on sale of property, plant and equipment (40,856) 2,248
Changes in: Trade and other receivables 224,907 781,653 Inventories (1,637,034) 510,303 Other assets 780,312 (1,280,432) Trade and other payables 831,985 961,680 Employee benefits 109,013 171,491 Tax balances (651,445) (2,078,961)
Net cash from operating activities 12,495,658 8,110,512
C2 Trade and other receivables
Trade receivables 4,078,002 3,165,881 Trade receivables due from related parties (refer note H2) 11,708 11,239 GST refund due - 1,137,497 4,089,710 4,314,617
Recognition and measurement
Trade and other receivables are initially recognised as fair value and subsequently measured at amortised cost less provision for doubtful debts. Trade receivables are due for settlement no more than 30-60 days from the date of recognition.
PWR Holdings Limited and its controlled entities
Notes to the consolidated financial statements For the year ended 30 June 2016
32
Section C Operating Assets and Liabilities (continued)
C2 Trade and other receivables (continued)
Recognition and measurement (continued)
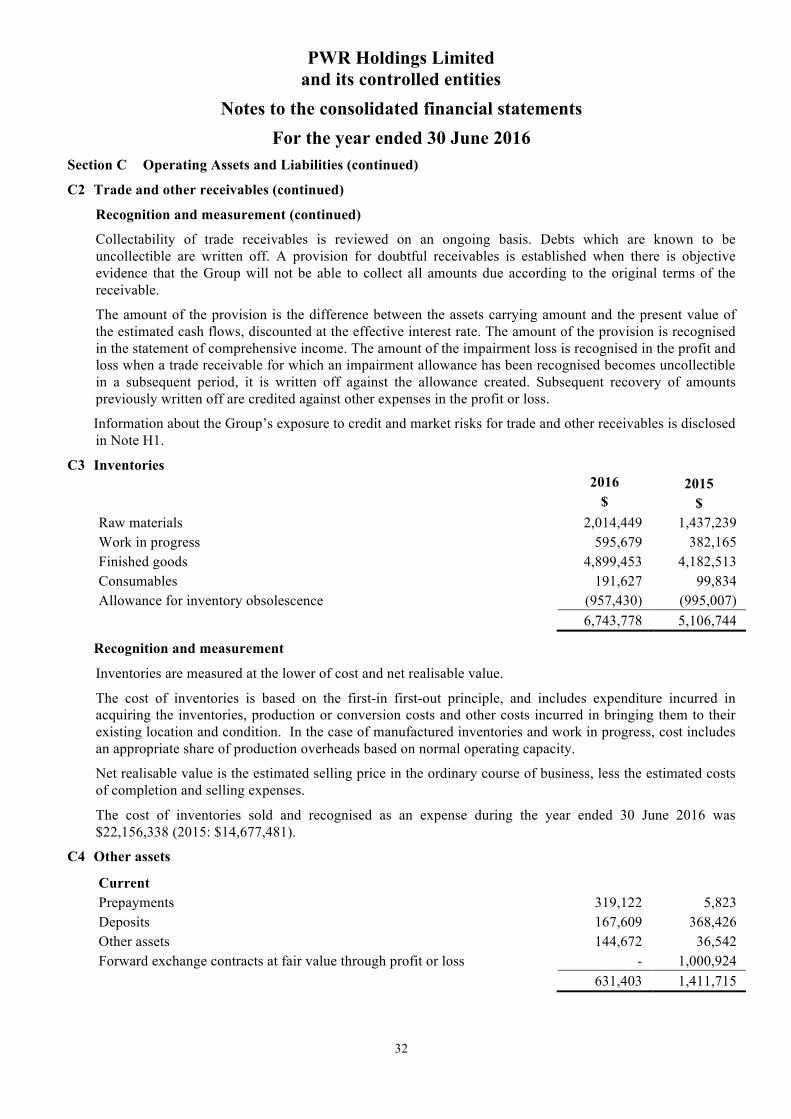
Collectability of trade receivables is reviewed on an ongoing basis. Debts which are known to be uncollectible are written off. A provision for doubtful receivables is established when there is objective evidence that the Group will not be able to collect all amounts due according to the original terms of the receivable.
The amount of the provision is the difference between the assets carrying amount and the present value of the estimated cash flows, discounted at the effective interest rate. The amount of the provision is recognised in the statement of comprehensive income. The amount of the impairment loss is recognised in the profit and loss when a trade receivable for which an impairment allowance has been recognised becomes uncollectible in a subsequent period, it is written off against the allowance created. Subsequent recovery of amounts previously written off are credited against other expenses in the profit or loss.
Information about the Group’s exposure to credit and market risks for trade and other receivables is disclosed in Note H1.
C3 Inventories 2016 2015 $ $ Raw materials 2,014,449 1,437,239 Work in progress 595,679 382,165 Finished goods 4,899,453 4,182,513 Consumables 191,627 99,834 Allowance for inventory obsolescence (957,430) (995,007) 6,743,778 5,106,744
Recognition and measurement
Inventories are measured at the lower of cost and net realisable value.
The cost of inventories is based on the first-in first-out principle, and includes expenditure incurred in acquiring the inventories, production or conversion costs and other costs incurred in bringing them to their existing location and condition. In the case of manufactured inventories and work in progress, cost includes an appropriate share of production overheads based on normal operating capacity.
Net realisable value is the estimated selling price in the ordinary course of business, less the estimated costs of completion and selling expenses.
The cost of inventories sold and recognised as an expense during the year ended 30 June 2016 was $22,156,338 (2015: $14,677,481).
C4 Other assets
Current Prepayments 319,122 5,823 Deposits 167,609 368,426 Other assets 144,672 36,542 Forward exchange contracts at fair value through profit or loss - 1,000,924 631,403 1,411,715
PWR Holdings Limited and its controlled entities
Notes to the consolidated financial statements For the year ended 30 June 2016
33
Section C Operating Assets and Liabilities (continued)
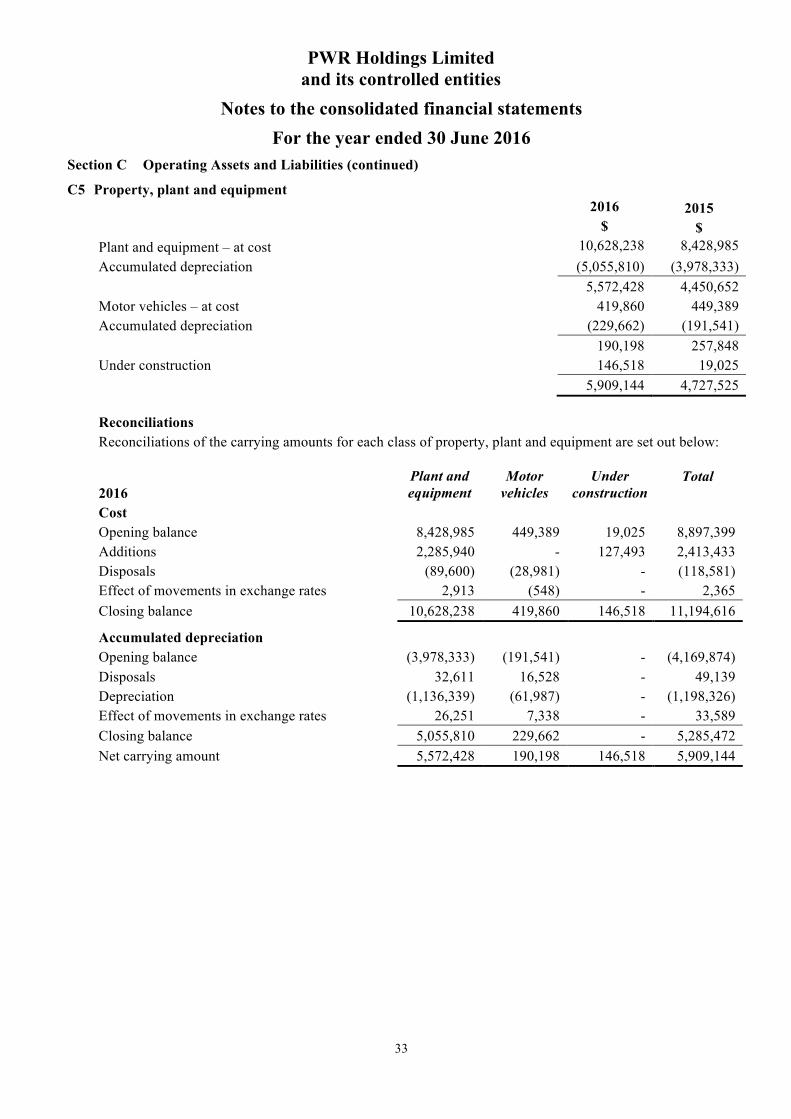
C5 Property, plant and equipment 2016 2015 $ $ Plant and equipment – at cost 10,628,238 8,428,985 Accumulated depreciation (5,055,810) (3,978,333) 5,572,428 4,450,652 Motor vehicles – at cost 419,860 449,389 Accumulated depreciation (229,662) (191,541) 190,198 257,848 Under construction 146,518 19,025 5,909,144 4,727,525
Reconciliations Reconciliations of the carrying amounts for each class of property, plant and equipment are set out below:
2016 Plant and equipment
Motor vehicles
Under construction
Total
Cost Opening balance 8,428,985 449,389 19,025 8,897,399 Additions 2,285,940 - 127,493 2,413,433 Disposals (89,600) (28,981) - (118,581) Effect of movements in exchange rates 2,913 (548) - 2,365 Closing balance 10,628,238 419,860 146,518 11,194,616
Accumulated depreciation
Opening balance (3,978,333) (191,541) - (4,169,874) Disposals 32,611 16,528 - 49,139 Depreciation (1,136,339) (61,987) - (1,198,326) Effect of movements in exchange rates 26,251 7,338 - 33,589 Closing balance 5,055,810 229,662 - 5,285,472 Net carrying amount 5,572,428 190,198 146,518 5,909,144

PWR Holdings Limited and its controlled entities
Notes to the consolidated financial statements For the year ended 30 June 2016
34
Section C Operating Assets and Liabilities (continued)
C5 Property, plant and equipment
Reconciliations (continued)
2015 Plant and equipment
Motor vehicles
Under construction
Total
Cost Opening balance 6,469,499 599,447 59,537 7,128,483 Additions 982,028 14,891 - 996,919 Acquired through business combination 1,041,894 152,196 - 1,194,090 Transfers 40,512 - (40,512) - Disposals (130,999) (321,264) - (452,263) Effect of movements in exchange rates 26,051 4,119 - 30,170 Closing balance 8,428,985 449,389 19,025 8,897,399
Accumulated depreciation
Opening balance (3,297,505) (307,847) - (3,605,352) Disposals 92,792 184,963 - 277,755 Depreciation (751,528) (62,128) - (813,656) Effect of movements in exchange rates (22,092) (6,529) - (28,621) Closing balance (3,978,333) (191,541) - (4,169,874) Net carrying amount 4,450,652 257,848 19,025 4,727,525
The plant and equipment balance as at 30 June 2016 includes assets with carrying amounts of $1,937,418 under finance lease (2015: $1,057,901). The motor vehicles balance as at 30 June 2016 includes no assets under finance lease (2015: $50,295). During the year, the Group acquired assets of $1,138,910 under finance lease (2015: nil).
Recognition and measurement
Items of property, plant and equipment are measured at cost less accumulated depreciation and accumulated impairment losses.
Cost includes expenditure that is directly attributable to the acquisition of the asset. The cost of self-constructed assets includes the cost of materials and direct labour, any other costs directly attributable to bringing the assets to a working condition for their intended use, and the costs of dismantling and removing the items and restoring the site on which they are located, and capitalised borrowing costs. Cost also may include transfers from other comprehensive income of any gain or loss on qualifying cash flow hedges of foreign currency purchases of property, plant and equipment. Purchased software that is integral to the functionality of the related equipment is capitalised as part of that equipment.
When parts of an item of property, plant and equipment have different useful lives, they are accounted for as separate items (major components) of property, plant and equipment.
Gains and losses on disposal of an item of property, plant and equipment are determined by comparing the proceeds from disposal with the carrying amount of property, plant and equipment and are recognised net within other income in profit or loss.
Subsequent costs
Subsequent expenditure is capitalised only if it is probable that the future economic benefits associated with the expenditure will flow to the Group. Ongoing repairs and maintenance are expensed as incurred.
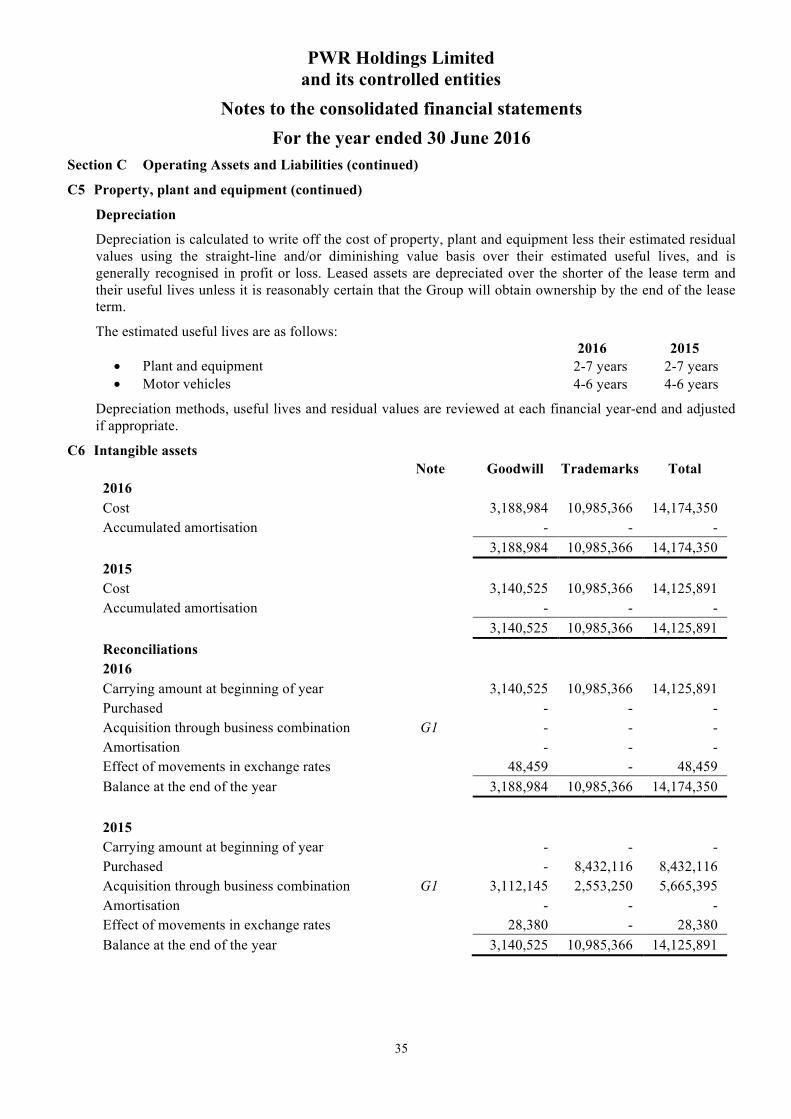
PWR Holdings Limited and its controlled entities
Notes to the consolidated financial statements For the year ended 30 June 2016
35
Section C Operating Assets and Liabilities (continued)
C5 Property, plant and equipment (continued)
Depreciation
Depreciation is calculated to write off the cost of property, plant and equipment less their estimated residual values using the straight-line and/or diminishing value basis over their estimated useful lives, and is generally recognised in profit or loss. Leased assets are depreciated over the shorter of the lease term and their useful lives unless it is reasonably certain that the Group will obtain ownership by the end of the lease term.
The estimated useful lives are as follows: 2016 2015
• Plant and equipment 2-7 years 2-7 years • Motor vehicles 4-6 years 4-6 years
Depreciation methods, useful lives and residual values are reviewed at each financial year-end and adjusted if appropriate.
C6 Intangible assets Note Goodwill Trademarks Total 2016 Cost 3,188,984 10,985,366 14,174,350 Accumulated amortisation - - - 3,188,984 10,985,366 14,174,350 2015 Cost 3,140,525 10,985,366 14,125,891 Accumulated amortisation - - - 3,140,525 10,985,366 14,125,891 Reconciliations 2016 Carrying amount at beginning of year 3,140,525 10,985,366 14,125,891 Purchased - - - Acquisition through business combination G1 - - - Amortisation - - - Effect of movements in exchange rates 48,459 - 48,459 Balance at the end of the year 3,188,984 10,985,366 14,174,350 2015 Carrying amount at beginning of year - - - Purchased - 8,432,116 8,432,116 Acquisition through business combination G1 3,112,145 2,553,250 5,665,395 Amortisation - - - Effect of movements in exchange rates 28,380 - 28,380 Balance at the end of the year 3,140,525 10,985,366 14,125,891
PWR Holdings Limited and its controlled entities
Notes to the consolidated financial statements For the year ended 30 June 2016
36
Section C Operating Assets and Liabilities (continued)
C6 Intangible assets (continued)
Recognition and measurement
Goodwill
Goodwill on acquisition is initially measured at cost, being the excess of the cost of the business combination over the acquirer’s interest in the net fair value of the identifiable assets, liabilities and contingent liabilities. At the acquisition date, any goodwill acquired is allocated to each of the cash-generating units expected to benefit from the combination’s synergies. Goodwill is not amortised.
Trademarks
Separately acquired trademarks are measured initially at cost of acquisition. Trademarks acquired in a business combination are recognised at fair value at the acquisition date. Fair value is determined using the relief from royalty method.
The Group’s trademarks are subsequently carried at cost less impairment losses and are not amortised as they are considered to have an indefinite useful life.
Impairment
Non-financial assets
The carrying amounts of the Group’s non-financial assets, other than inventories and deferred tax assets, are reviewed at each reporting date to determine whether there is any indication of impairment. If any such indication exists then the asset’s recoverable amount is estimated. Goodwill and trademarks with an indefinite life are tested annually for impairment.
An impairment loss is recognised if the carrying amount of an asset or its related cash-generating unit (CGU) exceeds its estimated recoverable amount. The recoverable amount of an asset or CGU is the greater of its value in use and its fair value less costs to sell. In assessing value in use, the estimated future cash flows are discounted to their present value using a pre-tax discount rate that reflects current market assessments of the time value of money and the risks specific to the asset or CGU. For the purpose of impairment testing, assets that cannot be tested individually are grouped together into the smallest group of assets that generates cash inflows from continuing use that largely independent of the cash inflows of other assets or CGU.
Impairment losses are recognised in profit or loss. Impairment losses recognised in respect of CGUs are allocated first to reduce the carrying amount of any goodwill allocated to the CGU, and then to reduce the carrying amounts of other assets in the CGU on a pro rata basis. An impairment loss in respect of goodwill is not reversed. For other assets, an impairment loss is reversed only to the extent that the asset’s carrying amount does not exceed the carrying amount that would have been determined, net of depreciation or amortisation, if no impairment loss had been recognised.
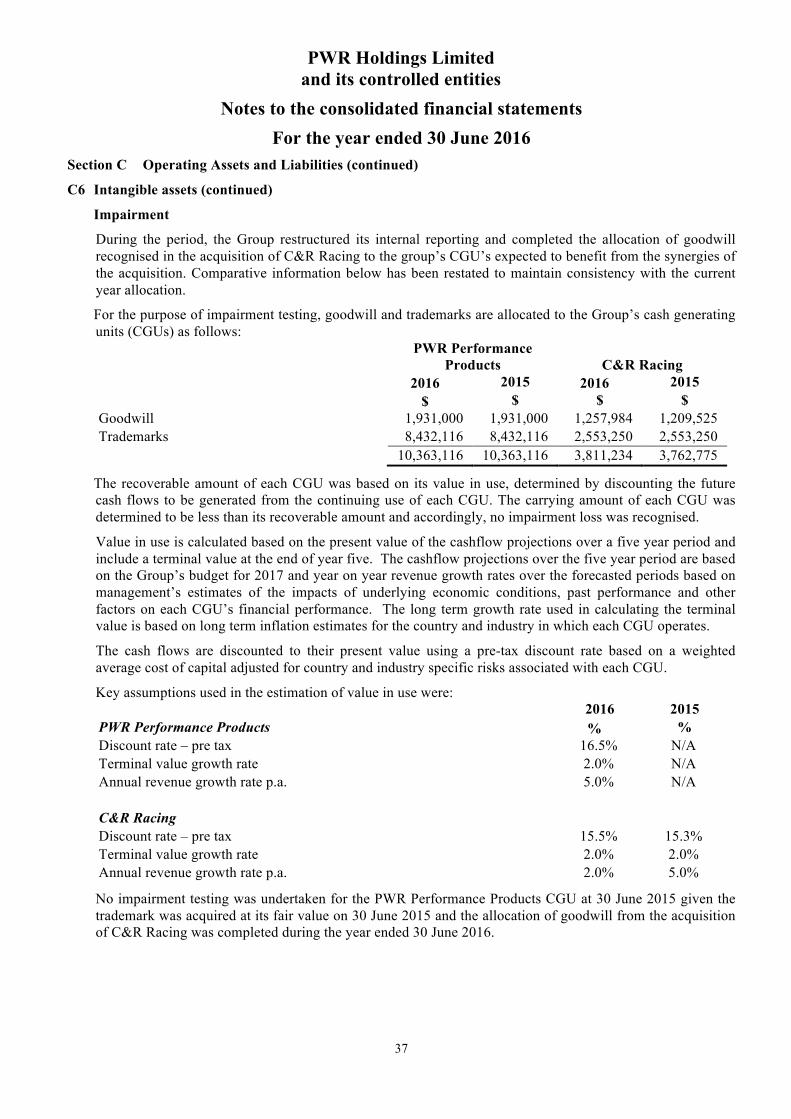
PWR Holdings Limited and its controlled entities
Notes to the consolidated financial statements For the year ended 30 June 2016
37
Section C Operating Assets and Liabilities (continued)
C6 Intangible assets (continued)
Impairment
During the period, the Group restructured its internal reporting and completed the allocation of goodwill recognised in the acquisition of C&R Racing to the group’s CGU’s expected to benefit from the synergies of the acquisition. Comparative information below has been restated to maintain consistency with the current year allocation.
For the purpose of impairment testing, goodwill and trademarks are allocated to the Group’s cash generating units (CGUs) as follows: PWR Performance
Products
C&R Racing 2016 2015 2016 2015 $ $ $ $ Goodwill 1,931,000 1,931,000 1,257,984 1,209,525 Trademarks 8,432,116 8,432,116 2,553,250 2,553,250 10,363,116 10,363,116 3,811,234 3,762,775
The recoverable amount of each CGU was based on its value in use, determined by discounting the future cash flows to be generated from the continuing use of each CGU. The carrying amount of each CGU was determined to be less than its recoverable amount and accordingly, no impairment loss was recognised.
Value in use is calculated based on the present value of the cashflow projections over a five year period and include a terminal value at the end of year five. The cashflow projections over the five year period are based on the Group’s budget for 2017 and year on year revenue growth rates over the forecasted periods based on management’s estimates of the impacts of underlying economic conditions, past performance and other factors on each CGU’s financial performance. The long term growth rate used in calculating the terminal value is based on long term inflation estimates for the country and industry in which each CGU operates.
The cash flows are discounted to their present value using a pre-tax discount rate based on a weighted average cost of capital adjusted for country and industry specific risks associated with each CGU.
Key assumptions used in the estimation of value in use were: 2016 2015 PWR Performance Products % % Discount rate – pre tax 16.5% N/A Terminal value growth rate 2.0% N/A Annual revenue growth rate p.a. 5.0% N/A C&R Racing Discount rate – pre tax 15.5% 15.3% Terminal value growth rate 2.0% 2.0% Annual revenue growth rate p.a. 2.0% 5.0%
No impairment testing was undertaken for the PWR Performance Products CGU at 30 June 2015 given the trademark was acquired at its fair value on 30 June 2015 and the allocation of goodwill from the acquisition of C&R Racing was completed during the year ended 30 June 2016.
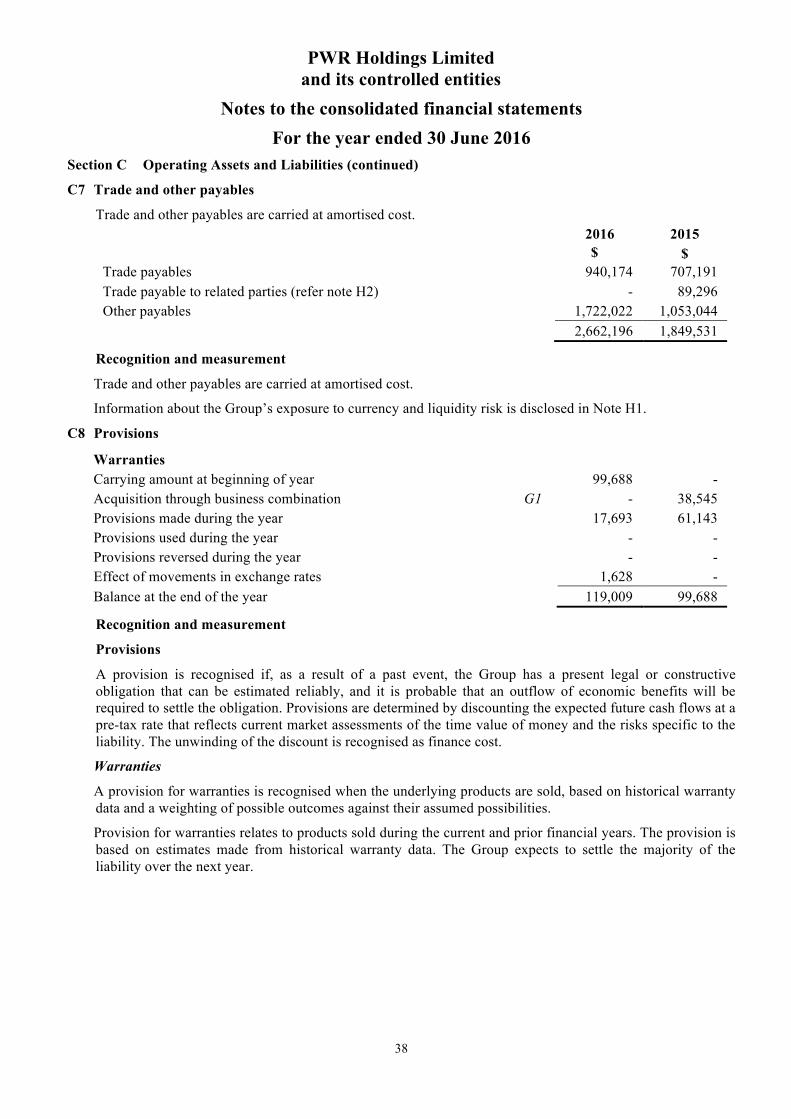
PWR Holdings Limited and its controlled entities
Notes to the consolidated financial statements For the year ended 30 June 2016
38
Section C Operating Assets and Liabilities (continued)
C7 Trade and other payables
Trade and other payables are carried at amortised cost. 2016 2015 $ $
Trade payables 940,174 707,191 Trade payable to related parties (refer note H2) - 89,296 Other payables 1,722,022 1,053,044 2,662,196 1,849,531
Recognition and measurement
Trade and other payables are carried at amortised cost.
Information about the Group’s exposure to currency and liquidity risk is disclosed in Note H1.
C8 Provisions
Warranties Carrying amount at beginning of year 99,688 - Acquisition through business combination G1 - 38,545 Provisions made during the year 17,693 61,143 Provisions used during the year - - Provisions reversed during the year - - Effect of movements in exchange rates 1,628 - Balance at the end of the year 119,009 99,688
Recognition and measurement
Provisions
A provision is recognised if, as a result of a past event, the Group has a present legal or constructive obligation that can be estimated reliably, and it is probable that an outflow of economic benefits will be required to settle the obligation. Provisions are determined by discounting the expected future cash flows at a pre-tax rate that reflects current market assessments of the time value of money and the risks specific to the liability. The unwinding of the discount is recognised as finance cost.
Warranties
A provision for warranties is recognised when the underlying products are sold, based on historical warranty data and a weighting of possible outcomes against their assumed possibilities.
Provision for warranties relates to products sold during the current and prior financial years. The provision is based on estimates made from historical warranty data. The Group expects to settle the majority of the liability over the next year.

PWR Holdings Limited and its controlled entities
Notes to the consolidated financial statements For the year ended 30 June 2016
39
Section D Employee Benefits
D1 Employee benefits 2016 2015 Current $ $ Annual leave liability 744,724 727,048 Long service leave liability 225,083 141,552 969,807 868,600 Non-current Long service leave liability 123,765 115,960
During the year ended 30 June 2016, the Group contributed $711,406 (2015: $480,789) to defined contribution plans. These contributions are included in employee expenses in the statement of profit or loss and other comprehensive income.
Recognition and measurement
Short-term employee benefits
Short-term employee benefits are expensed as the related service is provided. A liability is recognised for the amount expected to be paid if the Group has a present legal or constructive obligation to pay this amount as a result of past services provided by the employee and the obligation can be estimated reliably.
Long-term employee benefits
The Group’s net obligation in respect of long-term employee benefits is the amount of future benefits that employees have earned in return for their service in the current and prior periods. That benefit is discounted to determine its present value. Re-measurements are recognised in profit or loss in the period in which they arise.
Termination benefits
Termination benefits are expensed at the earlier of when the Group can no longer withdraw the offer of those benefits and when the Group recognises costs for a restructuring. If benefits are not expected to be settled wholly within 12 months of the reporting date, then they are discounted.
Defined contribution funds
Obligations for contributions to defined contribution plans are expensed as the related service is provided.
D2 Key management personnel compensation
Key management personnel compensation comprised the following:
Short-term employee benefits 1,988,581 800,709 Post-employment benefits 130,218 55,447 Other long term benefits 23,410 9,838 2,142,209 865,994
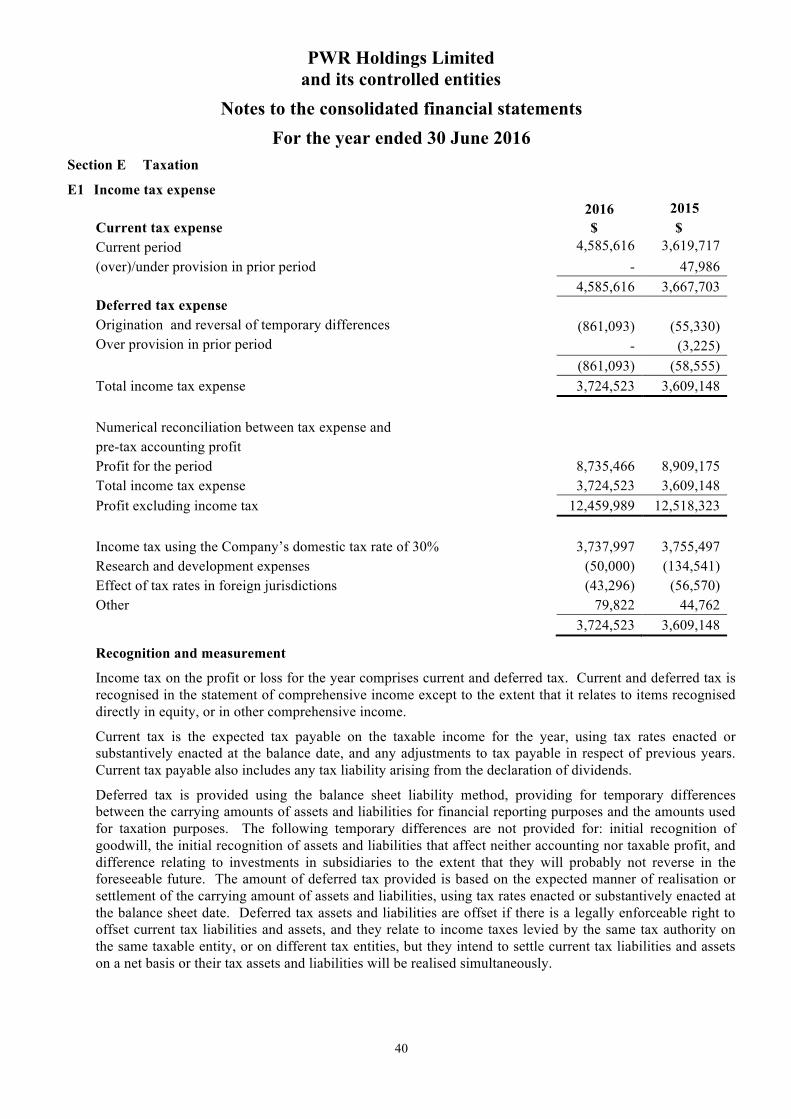
PWR Holdings Limited and its controlled entities
Notes to the consolidated financial statements For the year ended 30 June 2016
40
Section E Taxation
E1 Income tax expense 2016 2015 Current tax expense $ $ Current period 4,585,616 3,619,717 (over)/under provision in prior period - 47,986 4,585,616 3,667,703 Deferred tax expense Origination and reversal of temporary differences (861,093) (55,330) Over provision in prior period - (3,225) (861,093) (58,555) Total income tax expense 3,724,523 3,609,148 Numerical reconciliation between tax expense and pre-tax accounting profit Profit for the period 8,735,466 8,909,175 Total income tax expense 3,724,523 3,609,148 Profit excluding income tax 12,459,989 12,518,323 Income tax using the Company’s domestic tax rate of 30% 3,737,997 3,755,497 Research and development expenses (50,000) (134,541) Effect of tax rates in foreign jurisdictions (43,296) (56,570) Other 79,822 44,762 3,724,523 3,609,148
Recognition and measurement
Income tax on the profit or loss for the year comprises current and deferred tax. Current and deferred tax is recognised in the statement of comprehensive income except to the extent that it relates to items recognised directly in equity, or in other comprehensive income.
Current tax is the expected tax payable on the taxable income for the year, using tax rates enacted or substantively enacted at the balance date, and any adjustments to tax payable in respect of previous years. Current tax payable also includes any tax liability arising from the declaration of dividends.
Deferred tax is provided using the balance sheet liability method, providing for temporary differences between the carrying amounts of assets and liabilities for financial reporting purposes and the amounts used for taxation purposes. The following temporary differences are not provided for: initial recognition of goodwill, the initial recognition of assets and liabilities that affect neither accounting nor taxable profit, and difference relating to investments in subsidiaries to the extent that they will probably not reverse in the foreseeable future. The amount of deferred tax provided is based on the expected manner of realisation or settlement of the carrying amount of assets and liabilities, using tax rates enacted or substantively enacted at the balance sheet date. Deferred tax assets and liabilities are offset if there is a legally enforceable right to offset current tax liabilities and assets, and they relate to income taxes levied by the same tax authority on the same taxable entity, or on different tax entities, but they intend to settle current tax liabilities and assets on a net basis or their tax assets and liabilities will be realised simultaneously.

PWR Holdings Limited and its controlled entities
Notes to the consolidated financial statements For the year ended 30 June 2016
41
Section E Taxation (continued)
E1 Income tax expense (continued)
Recognition and measurement (continued)
In determining the amount of current and deferred tax the Group takes into account the impact of uncertain tax positions and whether additional taxes and interest may be due. The Group believes that its accruals for tax liabilities are adequate for all open tax years based on its assessment of many factors, including interpretations of tax law and prior experience. This assessment relies on estimates and assumptions and may involve series judgements about future events. New information may become available that causes the Group to change its judgement regarding the adequacy of existing tax liabilities; such changes to tax liabilities will impact tax expense in the period that such a determination is made.
A deferred tax asset is recognised only to the extent that it is probable that future taxable profits will be available against which the asset can be utilised. Deferred tax assets are reduced to the extent that it is no longer probable that the related tax benefit will be realised.
Additional income taxes that arise from the distribution of dividends are recognised at the same time as the liability to pay the related dividend.
E2 Tax assets and liabilities
Current tax assets and liabilities
The current tax liability of $408,648 (2015: asset of $170,388) represents the amount of income tax receivable/payable in respect of current and prior periods to the relevant tax authority.
Movement in deferred tax balances Net
balance at 1 July
Recognised in profit or
loss Recognised
in equity
Acquired in business
combination
Exchange rate
movements Net Deferred tax assets
Deferred tax
liabilities 2016 $ $ $ $ $ $ $ $ Property, plant and equipment (86,549) 86,549 - - - - - - Employee benefits 318,885 (19,238) - - (14,270) 285,377 285,377 - Accruals 150,222 135,439 - - (12,332) 273,329 273,329 - Inventories 282,566 44,331 - - (3,965) 322,932 322,932 - Unrealised foreign exchange (70,070) 23,284 - - - (46,786) - (46,786) Tax losses 94,672 (94,672) - - - - - - Capital raising costs - 639,825 335,324 - - 975,149 975,149 - Other items (33,581) 45,575 - - - 11,994 11,994 - Net tax assets/(liabilities) 656,145 861,093 335,324 - (30,567) 1,821,995 1,868,781 (46,786) 2015 Property, plant and equipment (70,598) (15,951) - - - (86,549) - (86,549) Employee benefits 167,159 52,159 - 97,231 2,336 318,885 318,885 - Accruals 6,506 92,149 - 50,357 1,210 150,222 150,222 - Inventories - (75,759) - 349,917 8,408 282,566 282,566 - Unrealised foreign exchange - (48,956) (21,114) - - (70,070) - (70,070) Tax losses - 94,672 - - - 94,672 94,672 - Other items 6,178 (39,759) - - - (33,581) - (33,581) Net tax assets/(liabilities) 109,245 58,555 (21,114) 497,505 11,954 656,145 846,345 (190,200)

PWR Holdings Limited and its controlled entities
Notes to the consolidated financial statements For the year ended 30 June 2016
42
Section F Capital Structure and Borrowings
F1 Loans and borrowings 2016 2015 Current $ $ Secured bank loans - 4,726,556 Finance lease liability 396,621 852,888 396,621 5,579,444 Non-current Secured bank loans - 17,724,587 Finance lease liability 763,641 69,616 763,641 17,794,203
During the year, the Group repaid in full its domestic foreign currency debt facilities of £7.2 million (A$13.8 million) and US$4.9 million (A$6.5 million). The repayment was funded by the proceeds of the initial public offering undertaken by the Company during the year.
Finance facilities
The terms and conditions of the Group’s finance facilities are as follows: 2016 2015
Facility
Currency
Nominal interest
rate Maturity
Facility limit
$
Carrying amount
$
Facility limit
$
Carrying amount
$ Trade finance AUD Variable - 500,000 - 234,000 - Corporate credit card AUD Variable - 50,000 - 50,000 - Domestic foreign currency
GBP LIBOR+ 2.25% 2018 - - 15,628,213 15,628,213
Domestic foreign currency
USD LIBOR+ 2.25% 2018 - - 6,822,930 6,822,930
Finance lease AUD 5.4%-8.2% 2015-2017 5,000,000 1,160,262 2,500,000 922,504 Finance lease AUD - - - - 2,000,000 - 5,550,000 1,160,262 27,235,143 23,373,647
Finance facilities are secured by charges over the Group’s assets. Under the terms of the agreements, the Company and several of its wholly owned subsidiaries jointly and severally guarantee and indemnify the lender in relation to the borrower’s obligations.
Finance leases
Finance lease liabilities are payable as follows:
Future minimum lease payments Interest
Present value of minimum lease payments
2016 $
2015 $
2016 $
2015 $
2016 $
2015 $
Less than one year 440,337 893,901 43,716 41,013 396,621 852,888 Between one and five years 822,956 71,672 59,315 2,056 763,641 69,616 More than five years - - - - - -
1,263,293 965,573 103,031 43,069 1,160,262 922,504
The Group leases operating equipment used in the manufacturing process and motor vehicles under finance leases.
PWR Holdings Limited and its controlled entities
Notes to the consolidated financial statements For the year ended 30 June 2016
43
Section F Capital Structure and Borrowings (continued)
F1 Loans and borrowings (continued)
Recognition and measurement
Non-derivative financial liabilities
The Group initially recognises debt securities issued and subordinated liabilities on the date that they are originated. All other financial liabilities are recognised initially on the trade date at which the Group becomes a party to the contractual provisions of the instrument.
The Group derecognises a financial liability when its contractual obligations are discharged or cancelled or expire.
The Group classifies non-derivative financial liabilities into the other financial liabilities category. Such financial liabilities are recognised initially at fair value less any directly attributable transaction costs. Subsequent to initial recognition, these financial liabilities are measured at amortised cost using the effective interest rate method.
Interest-bearing loans and liabilities are recognised initially at fair value less attributable transaction costs. Subsequent to initial recognition, interest-bearing borrowings are stated at amortised cost with any difference between cost and redemption value being recognised in the income statement over the period of the borrowings on an effective interest basis.
Derivative financial instruments
The Group may use derivative financial instruments to manage its foreign currency exposures. Embedded derivatives are separated from the host contract and accounted for separately if certain criteria are met.
Derivatives are recognised initially at fair value, any directly attributable transaction costs are recognised in profit or loss as they are incurred. Subsequent to initial recognition, derivatives are measured at fair value, and changes therein are generally recognised in profit or loss.
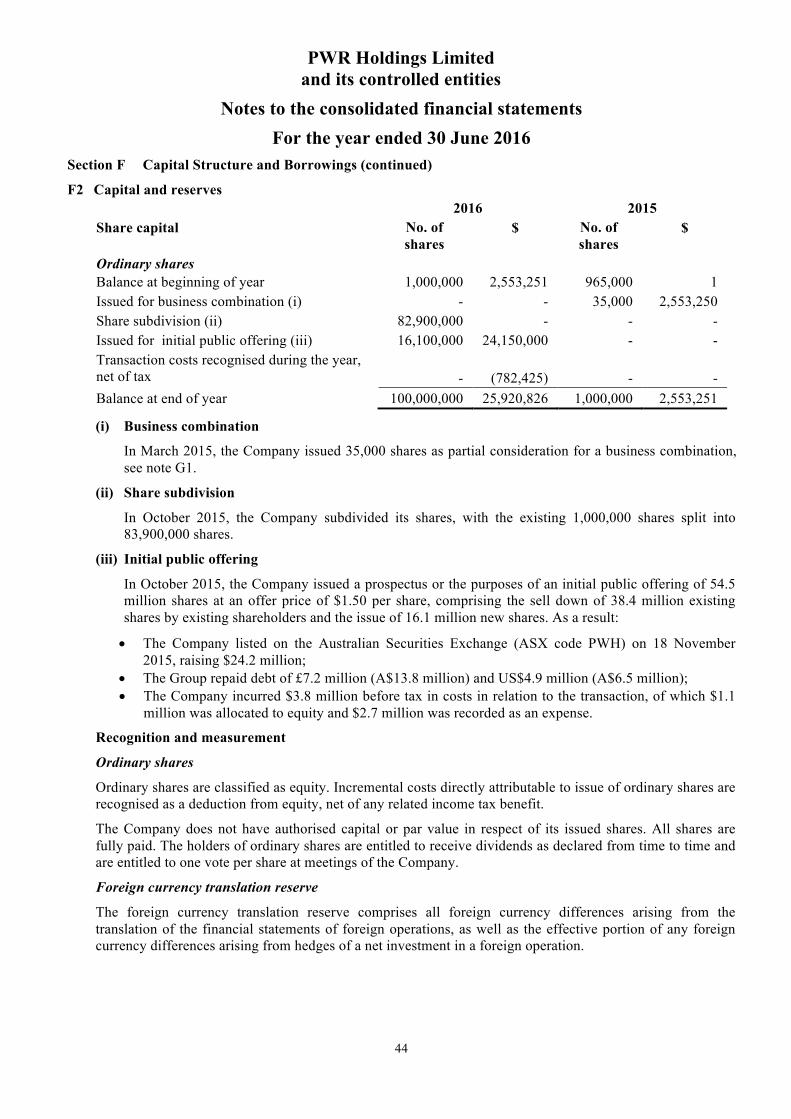
PWR Holdings Limited and its controlled entities
Notes to the consolidated financial statements For the year ended 30 June 2016
44
Section F Capital Structure and Borrowings (continued)
F2 Capital and reserves 2016 2015 Share capital No. of
shares $ No. of
shares $
Ordinary shares Balance at beginning of year 1,000,000 2,553,251 965,000 1 Issued for business combination (i) - - 35,000 2,553,250 Share subdivision (ii) 82,900,000 - - - Issued for initial public offering (iii) 16,100,000 24,150,000 - - Transaction costs recognised during the year, net of tax
-
(782,425)
-
-
Balance at end of year 100,000,000 25,920,826 1,000,000 2,553,251
(i) Business combination
In March 2015, the Company issued 35,000 shares as partial consideration for a business combination, see note G1.
(ii) Share subdivision
In October 2015, the Company subdivided its shares, with the existing 1,000,000 shares split into 83,900,000 shares.
(iii) Initial public offering
In October 2015, the Company issued a prospectus or the purposes of an initial public offering of 54.5 million shares at an offer price of $1.50 per share, comprising the sell down of 38.4 million existing shares by existing shareholders and the issue of 16.1 million new shares. As a result:
• The Company listed on the Australian Securities Exchange (ASX code PWH) on 18 November 2015, raising $24.2 million;
• The Group repaid debt of £7.2 million (A$13.8 million) and US$4.9 million (A$6.5 million); • The Company incurred $3.8 million before tax in costs in relation to the transaction, of which $1.1
million was allocated to equity and $2.7 million was recorded as an expense.
Recognition and measurement
Ordinary shares
Ordinary shares are classified as equity. Incremental costs directly attributable to issue of ordinary shares are recognised as a deduction from equity, net of any related income tax benefit.
The Company does not have authorised capital or par value in respect of its issued shares. All shares are fully paid. The holders of ordinary shares are entitled to receive dividends as declared from time to time and are entitled to one vote per share at meetings of the Company.
Foreign currency translation reserve
The foreign currency translation reserve comprises all foreign currency differences arising from the translation of the financial statements of foreign operations, as well as the effective portion of any foreign currency differences arising from hedges of a net investment in a foreign operation.
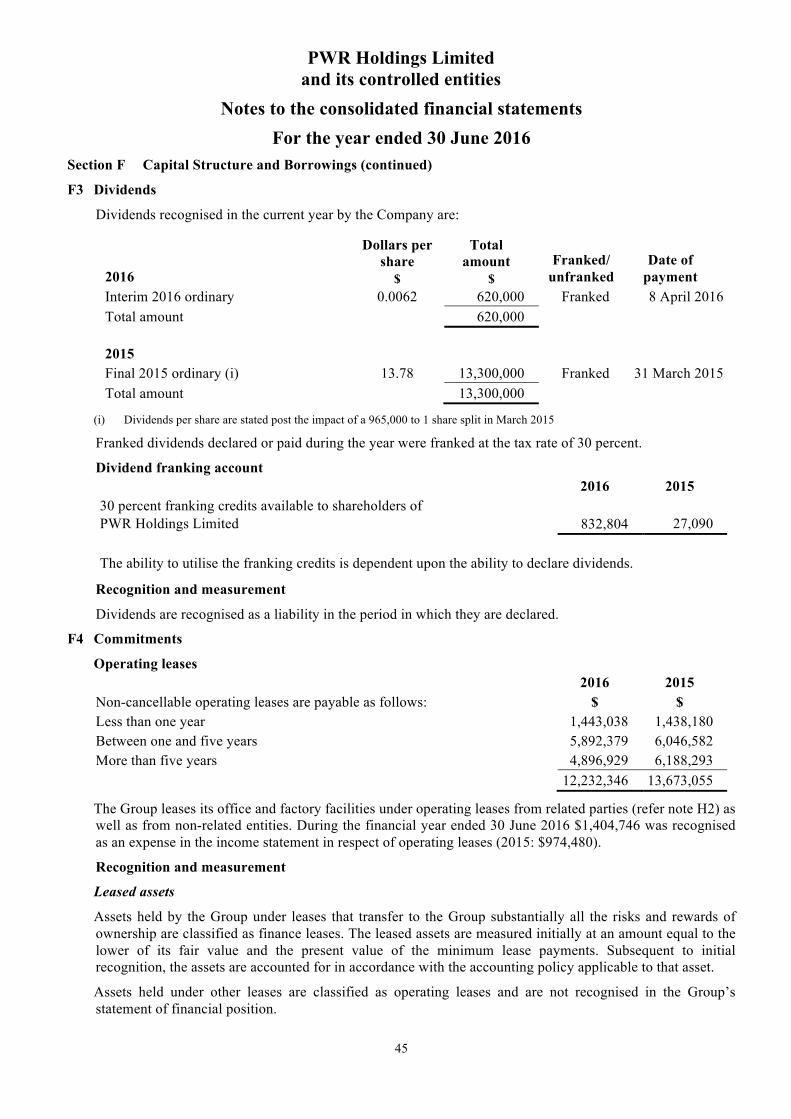
PWR Holdings Limited and its controlled entities
Notes to the consolidated financial statements For the year ended 30 June 2016
45
Section F Capital Structure and Borrowings (continued)
F3 Dividends
Dividends recognised in the current year by the Company are:
2016
Dollars per share
$
Total amount
$ Franked/
unfranked Date of
payment Interim 2016 ordinary 0.0062 620,000 Franked 8 April 2016 Total amount 620,000
2015 Final 2015 ordinary (i) 13.78 13,300,000 Franked 31 March 2015 Total amount 13,300,000
(i) Dividends per share are stated post the impact of a 965,000 to 1 share split in March 2015
Franked dividends declared or paid during the year were franked at the tax rate of 30 percent.
Dividend franking account 2016 2015
30 percent franking credits available to shareholders of PWR Holdings Limited 832,804
27,090
The ability to utilise the franking credits is dependent upon the ability to declare dividends.
Recognition and measurement
Dividends are recognised as a liability in the period in which they are declared.
F4 Commitments
Operating leases 2016 2015 Non-cancellable operating leases are payable as follows: $ $ Less than one year 1,443,038 1,438,180 Between one and five years 5,892,379 6,046,582 More than five years 4,896,929 6,188,293
12,232,346 13,673,055
The Group leases its office and factory facilities under operating leases from related parties (refer note H2) as well as from non-related entities. During the financial year ended 30 June 2016 $1,404,746 was recognised as an expense in the income statement in respect of operating leases (2015: $974,480).
Recognition and measurement
Leased assets
Assets held by the Group under leases that transfer to the Group substantially all the risks and rewards of ownership are classified as finance leases. The leased assets are measured initially at an amount equal to the lower of its fair value and the present value of the minimum lease payments. Subsequent to initial recognition, the assets are accounted for in accordance with the accounting policy applicable to that asset.
Assets held under other leases are classified as operating leases and are not recognised in the Group’s statement of financial position.
PWR Holdings Limited and its controlled entities
Notes to the consolidated financial statements For the year ended 30 June 2016
46
Section F Capital Structure and Borrowings (continued)
F4 Commitments (continued)
Operating leases (continued)
Recognition and measurement (continued)
Lease payments
Payments made under operating leases are recognised in profit or loss on a straight-line basis over the term of the lease. Lease incentives received are recognised as an integral part of the total lease expense, over the term of the lease.
Minimum lease payments made under finance leases are apportioned between the finance expense and the reduction of the outstanding liability. The finance expense is allocated to each period during the lease term so as to produce a constant periodic rate of interest on the remaining balance of the liability.
Other commitments
At 30 June 2016, the Group had agreed to purchase plant and equipment for $764,280 (2015: $723,000).
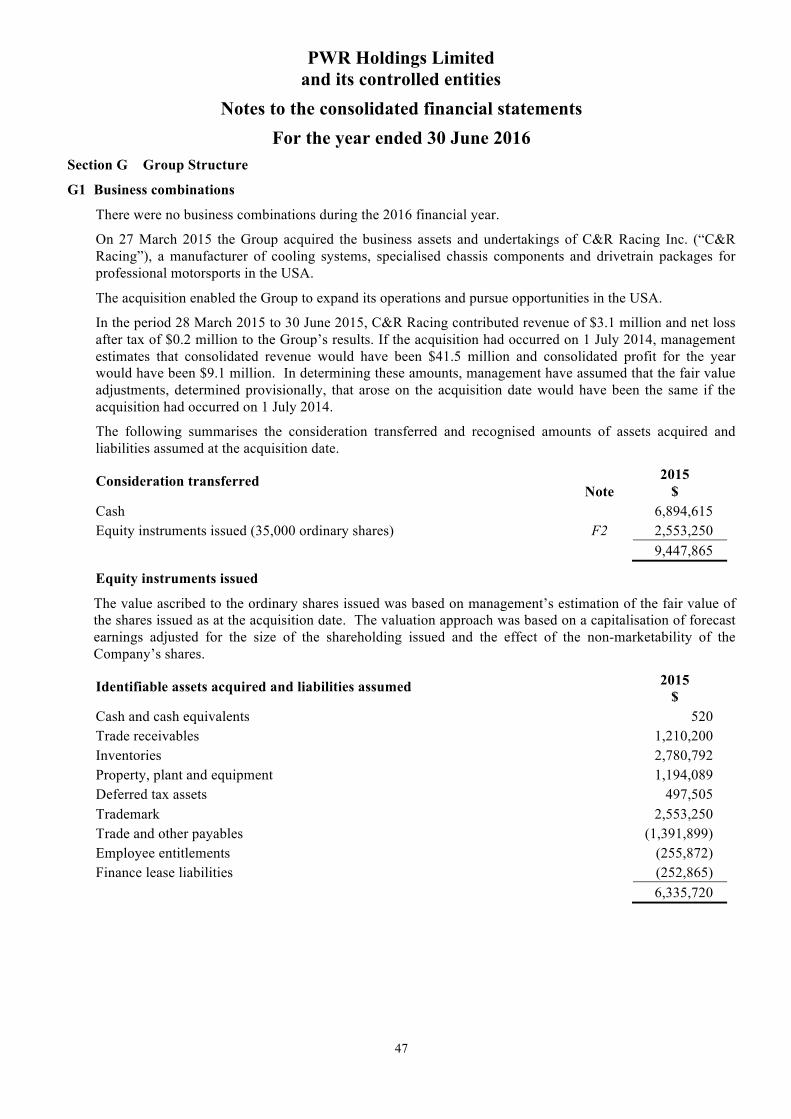
PWR Holdings Limited and its controlled entities
Notes to the consolidated financial statements For the year ended 30 June 2016
47
Section G Group Structure
G1 Business combinations
There were no business combinations during the 2016 financial year.
On 27 March 2015 the Group acquired the business assets and undertakings of C&R Racing Inc. (“C&R Racing”), a manufacturer of cooling systems, specialised chassis components and drivetrain packages for professional motorsports in the USA.
The acquisition enabled the Group to expand its operations and pursue opportunities in the USA.
In the period 28 March 2015 to 30 June 2015, C&R Racing contributed revenue of $3.1 million and net loss after tax of $0.2 million to the Group’s results. If the acquisition had occurred on 1 July 2014, management estimates that consolidated revenue would have been $41.5 million and consolidated profit for the year would have been $9.1 million. In determining these amounts, management have assumed that the fair value adjustments, determined provisionally, that arose on the acquisition date would have been the same if the acquisition had occurred on 1 July 2014.
The following summarises the consideration transferred and recognised amounts of assets acquired and liabilities assumed at the acquisition date.
Consideration transferred Note
2015 $
Cash 6,894,615 Equity instruments issued (35,000 ordinary shares) F2 2,553,250
9,447,865
Equity instruments issued
The value ascribed to the ordinary shares issued was based on management’s estimation of the fair value of the shares issued as at the acquisition date. The valuation approach was based on a capitalisation of forecast earnings adjusted for the size of the shareholding issued and the effect of the non-marketability of the Company’s shares.
Identifiable assets acquired and liabilities assumed
2015 $
Cash and cash equivalents 520 Trade receivables 1,210,200 Inventories 2,780,792 Property, plant and equipment 1,194,089 Deferred tax assets 497,505 Trademark 2,553,250 Trade and other payables (1,391,899) Employee entitlements (255,872) Finance lease liabilities (252,865) 6,335,720
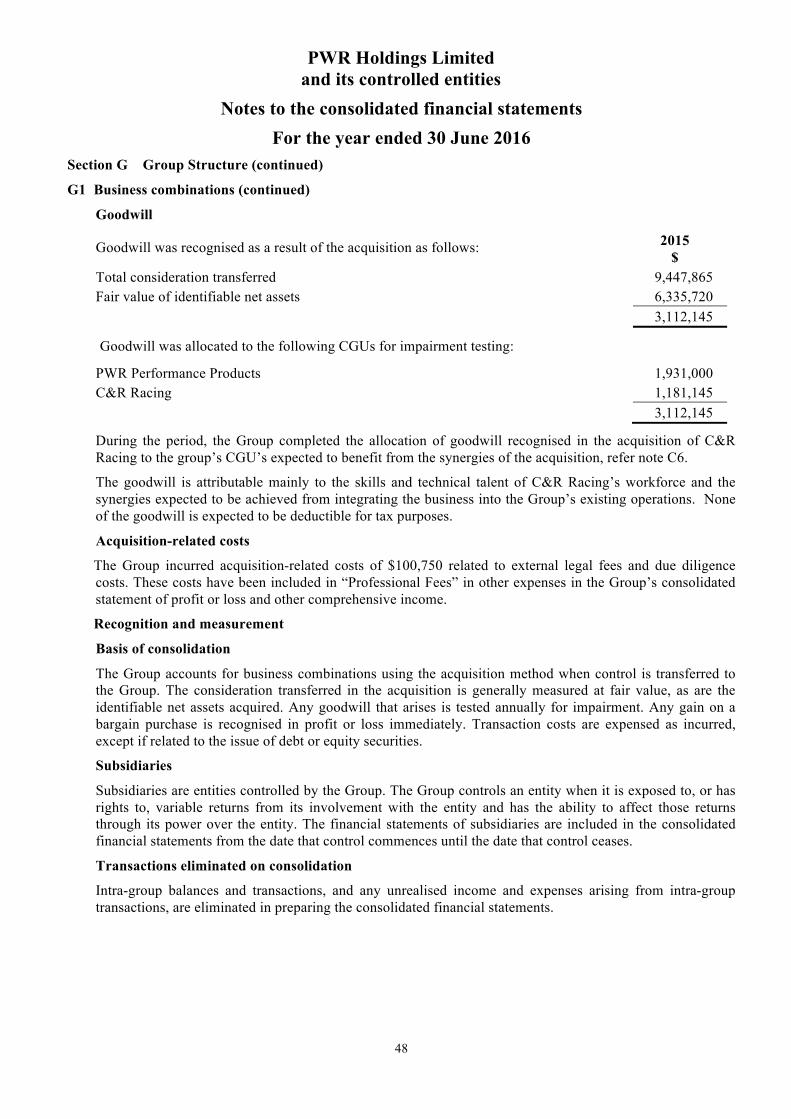
PWR Holdings Limited and its controlled entities
Notes to the consolidated financial statements For the year ended 30 June 2016
48
Section G Group Structure (continued)
G1 Business combinations (continued)
Goodwill
Goodwill was recognised as a result of the acquisition as follows:
2015 $
Total consideration transferred 9,447,865 Fair value of identifiable net assets 6,335,720 3,112,145
Goodwill was allocated to the following CGUs for impairment testing:
PWR Performance Products 1,931,000 C&R Racing 1,181,145 3,112,145
During the period, the Group completed the allocation of goodwill recognised in the acquisition of C&R Racing to the group’s CGU’s expected to benefit from the synergies of the acquisition, refer note C6.
The goodwill is attributable mainly to the skills and technical talent of C&R Racing’s workforce and the synergies expected to be achieved from integrating the business into the Group’s existing operations. None of the goodwill is expected to be deductible for tax purposes.
Acquisition-related costs
The Group incurred acquisition-related costs of $100,750 related to external legal fees and due diligence costs. These costs have been included in “Professional Fees” in other expenses in the Group’s consolidated statement of profit or loss and other comprehensive income.
Recognition and measurement
Basis of consolidation
The Group accounts for business combinations using the acquisition method when control is transferred to the Group. The consideration transferred in the acquisition is generally measured at fair value, as are the identifiable net assets acquired. Any goodwill that arises is tested annually for impairment. Any gain on a bargain purchase is recognised in profit or loss immediately. Transaction costs are expensed as incurred, except if related to the issue of debt or equity securities.
Subsidiaries
Subsidiaries are entities controlled by the Group. The Group controls an entity when it is exposed to, or has rights to, variable returns from its involvement with the entity and has the ability to affect those returns through its power over the entity. The financial statements of subsidiaries are included in the consolidated financial statements from the date that control commences until the date that control ceases.
Transactions eliminated on consolidation
Intra-group balances and transactions, and any unrealised income and expenses arising from intra-group transactions, are eliminated in preparing the consolidated financial statements.
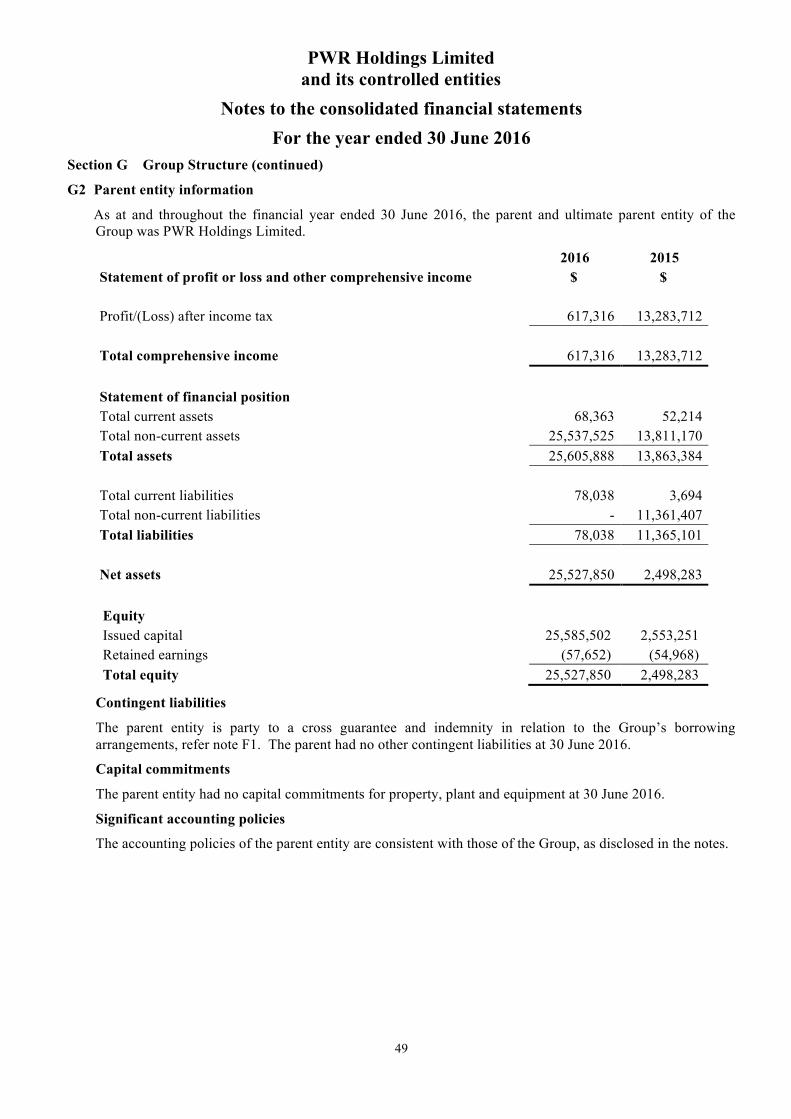
PWR Holdings Limited and its controlled entities
Notes to the consolidated financial statements For the year ended 30 June 2016
49
Section G Group Structure (continued)
G2 Parent entity information
As at and throughout the financial year ended 30 June 2016, the parent and ultimate parent entity of the Group was PWR Holdings Limited.
2016 2015 Statement of profit or loss and other comprehensive income $ $ Profit/(Loss) after income tax 617,316 13,283,712 Total comprehensive income 617,316 13,283,712 Statement of financial position Total current assets 68,363 52,214 Total non-current assets 25,537,525 13,811,170 Total assets 25,605,888 13,863,384 Total current liabilities 78,038 3,694 Total non-current liabilities - 11,361,407 Total liabilities 78,038 11,365,101 Net assets 25,527,850 2,498,283 Equity Issued capital 25,585,502 2,553,251 Retained earnings (57,652) (54,968) Total equity 25,527,850 2,498,283
Contingent liabilities
The parent entity is party to a cross guarantee and indemnity in relation to the Group’s borrowing arrangements, refer note F1. The parent had no other contingent liabilities at 30 June 2016.
Capital commitments
The parent entity had no capital commitments for property, plant and equipment at 30 June 2016.
Significant accounting policies
The accounting policies of the parent entity are consistent with those of the Group, as disclosed in the notes.

PWR Holdings Limited and its controlled entities
Notes to the consolidated financial statements For the year ended 30 June 2016
50
Section G Group Structure (continued)
G3 Controlled entities
The following entities are subsidiaries of the parent entity, the results of which are included in the consolidated financial statements of the Group. Ownership interest Country of
incorporation 2016 2015
% % PWR Performance Products Pty Ltd Australia 100 100 PWR IP Pty Ltd Australia 100 100 PWR Europe Limited UK 100 100 C&R Racing Inc USA 100 100 PWR UK Holdings Pty Ltd (i) Australia - 100 PWR USA Holdings Pty Ltd (i) Australia - 100 PWR USA Inc (i) USA - 100
(i) Deregistered in the 2016 financial year
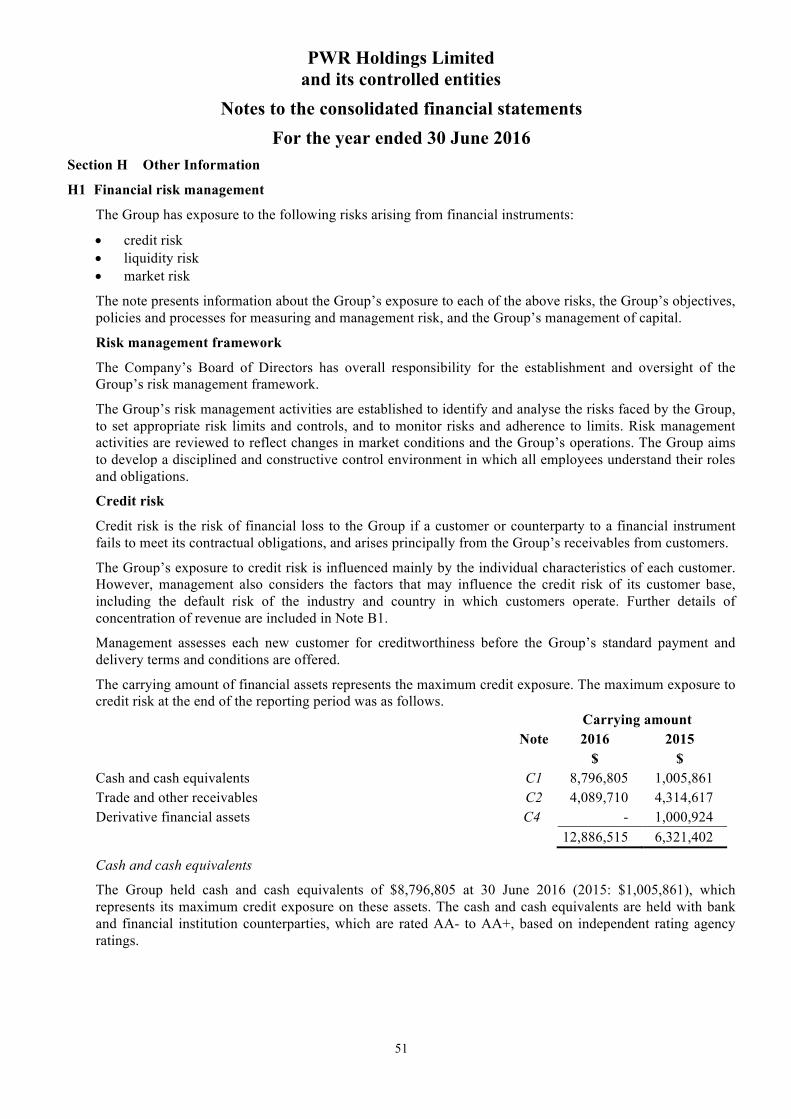
PWR Holdings Limited and its controlled entities
Notes to the consolidated financial statements For the year ended 30 June 2016
51
Section H Other Information
H1 Financial risk management
The Group has exposure to the following risks arising from financial instruments:
• credit risk • liquidity risk • market risk
The note presents information about the Group’s exposure to each of the above risks, the Group’s objectives, policies and processes for measuring and management risk, and the Group’s management of capital.
Risk management framework
The Company’s Board of Directors has overall responsibility for the establishment and oversight of the Group’s risk management framework.
The Group’s risk management activities are established to identify and analyse the risks faced by the Group, to set appropriate risk limits and controls, and to monitor risks and adherence to limits. Risk management activities are reviewed to reflect changes in market conditions and the Group’s operations. The Group aims to develop a disciplined and constructive control environment in which all employees understand their roles and obligations.
Credit risk
Credit risk is the risk of financial loss to the Group if a customer or counterparty to a financial instrument fails to meet its contractual obligations, and arises principally from the Group’s receivables from customers.
The Group’s exposure to credit risk is influenced mainly by the individual characteristics of each customer. However, management also considers the factors that may influence the credit risk of its customer base, including the default risk of the industry and country in which customers operate. Further details of concentration of revenue are included in Note B1.
Management assesses each new customer for creditworthiness before the Group’s standard payment and delivery terms and conditions are offered.
The carrying amount of financial assets represents the maximum credit exposure. The maximum exposure to credit risk at the end of the reporting period was as follows. Carrying amount
Note 2016 2015 $ $ Cash and cash equivalents C1 8,796,805 1,005,861 Trade and other receivables C2 4,089,710 4,314,617 Derivative financial assets C4 - 1,000,924 12,886,515 6,321,402
Cash and cash equivalents
The Group held cash and cash equivalents of $8,796,805 at 30 June 2016 (2015: $1,005,861), which represents its maximum credit exposure on these assets. The cash and cash equivalents are held with bank and financial institution counterparties, which are rated AA- to AA+, based on independent rating agency ratings.
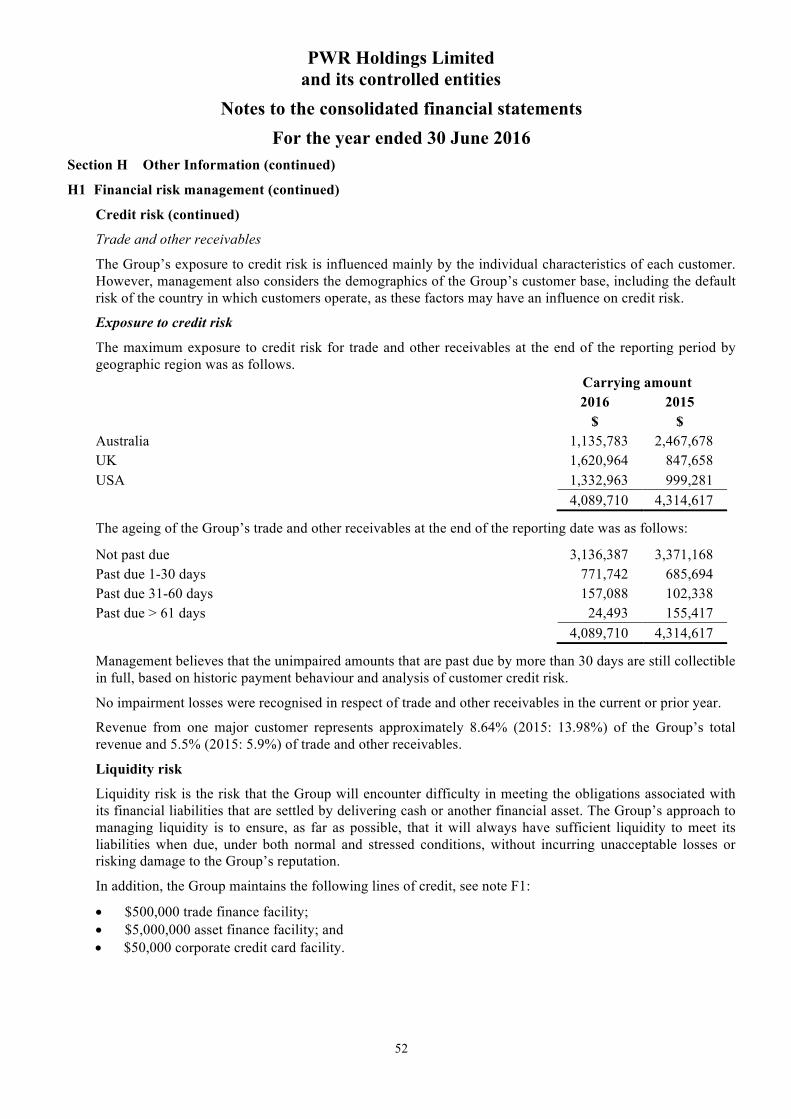
PWR Holdings Limited and its controlled entities
Notes to the consolidated financial statements For the year ended 30 June 2016
52
Section H Other Information (continued)
H1 Financial risk management (continued)
Credit risk (continued)
Trade and other receivables
The Group’s exposure to credit risk is influenced mainly by the individual characteristics of each customer. However, management also considers the demographics of the Group’s customer base, including the default risk of the country in which customers operate, as these factors may have an influence on credit risk.
Exposure to credit risk
The maximum exposure to credit risk for trade and other receivables at the end of the reporting period by geographic region was as follows. Carrying amount
2016 2015 $ $ Australia 1,135,783 2,467,678 UK 1,620,964 847,658 USA 1,332,963 999,281
4,089,710 4,314,617
The ageing of the Group’s trade and other receivables at the end of the reporting date was as follows:
Not past due 3,136,387 3,371,168 Past due 1-30 days 771,742 685,694 Past due 31-60 days 157,088 102,338 Past due > 61 days 24,493 155,417
4,089,710 4,314,617
Management believes that the unimpaired amounts that are past due by more than 30 days are still collectible in full, based on historic payment behaviour and analysis of customer credit risk.
No impairment losses were recognised in respect of trade and other receivables in the current or prior year.
Revenue from one major customer represents approximately 8.64% (2015: 13.98%) of the Group’s total revenue and 5.5% (2015: 5.9%) of trade and other receivables.
Liquidity risk
Liquidity risk is the risk that the Group will encounter difficulty in meeting the obligations associated with its financial liabilities that are settled by delivering cash or another financial asset. The Group’s approach to managing liquidity is to ensure, as far as possible, that it will always have sufficient liquidity to meet its liabilities when due, under both normal and stressed conditions, without incurring unacceptable losses or risking damage to the Group’s reputation.
In addition, the Group maintains the following lines of credit, see note F1:
• $500,000 trade finance facility; • $5,000,000 asset finance facility; and • $50,000 corporate credit card facility.
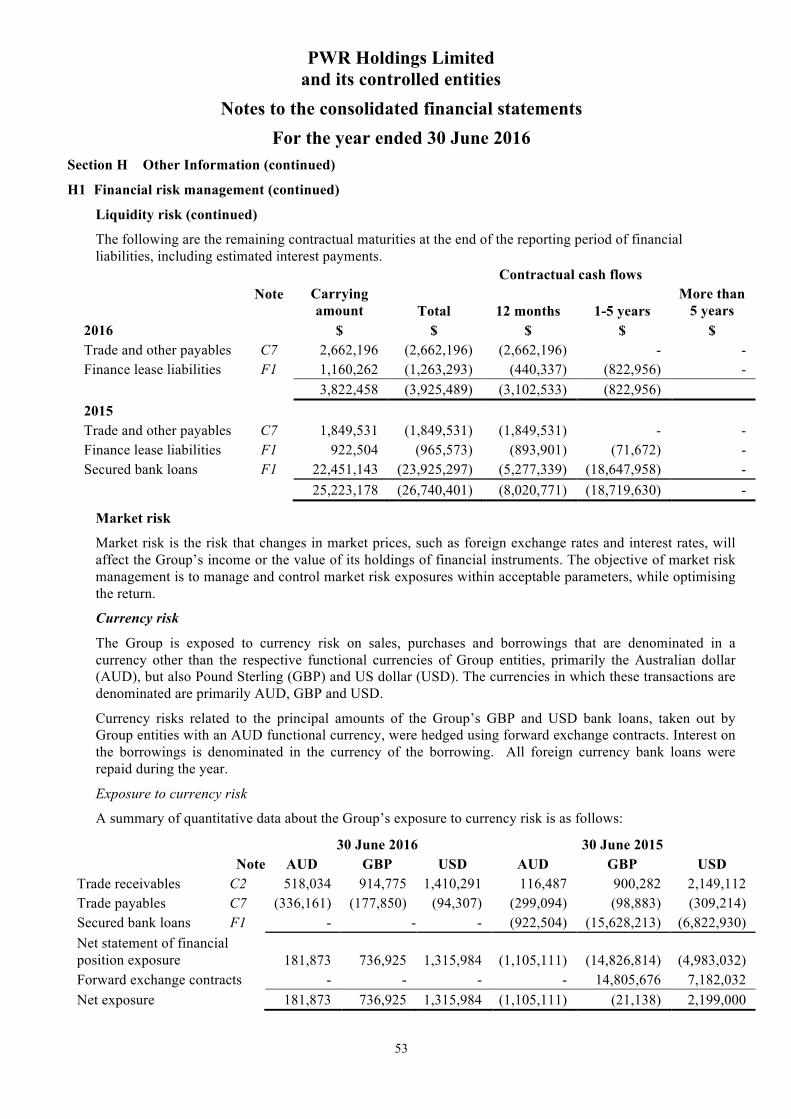
PWR Holdings Limited and its controlled entities
Notes to the consolidated financial statements For the year ended 30 June 2016
53
Section H Other Information (continued)
H1 Financial risk management (continued)
Liquidity risk (continued)
The following are the remaining contractual maturities at the end of the reporting period of financial liabilities, including estimated interest payments.
Contractual cash flows
Note Carrying
amount Total 12 months 1-5 years More than
5 years 2016 $ $ $ $ $ Trade and other payables C7 2,662,196 (2,662,196) (2,662,196) - - Finance lease liabilities F1 1,160,262 (1,263,293) (440,337) (822,956) -
3,822,458 (3,925,489) (3,102,533) (822,956) 2015 Trade and other payables C7 1,849,531 (1,849,531) (1,849,531) - - Finance lease liabilities F1 922,504 (965,573) (893,901) (71,672) - Secured bank loans F1 22,451,143 (23,925,297) (5,277,339) (18,647,958) -
25,223,178 (26,740,401) (8,020,771) (18,719,630) -
Market risk
Market risk is the risk that changes in market prices, such as foreign exchange rates and interest rates, will affect the Group’s income or the value of its holdings of financial instruments. The objective of market risk management is to manage and control market risk exposures within acceptable parameters, while optimising the return.
Currency risk
The Group is exposed to currency risk on sales, purchases and borrowings that are denominated in a currency other than the respective functional currencies of Group entities, primarily the Australian dollar (AUD), but also Pound Sterling (GBP) and US dollar (USD). The currencies in which these transactions are denominated are primarily AUD, GBP and USD.
Currency risks related to the principal amounts of the Group’s GBP and USD bank loans, taken out by Group entities with an AUD functional currency, were hedged using forward exchange contracts. Interest on the borrowings is denominated in the currency of the borrowing. All foreign currency bank loans were repaid during the year.
Exposure to currency risk
A summary of quantitative data about the Group’s exposure to currency risk is as follows:
30 June 2016 30 June 2015 Note AUD GBP USD AUD GBP USD
Trade receivables C2 518,034 914,775 1,410,291 116,487 900,282 2,149,112 Trade payables C7 (336,161) (177,850) (94,307) (299,094) (98,883) (309,214) Secured bank loans F1 - - - (922,504) (15,628,213) (6,822,930) Net statement of financial position exposure 181,873 736,925 1,315,984 (1,105,111) (14,826,814) (4,983,032) Forward exchange contracts - - - - 14,805,676 7,182,032 Net exposure 181,873 736,925 1,315,984 (1,105,111) (21,138) 2,199,000
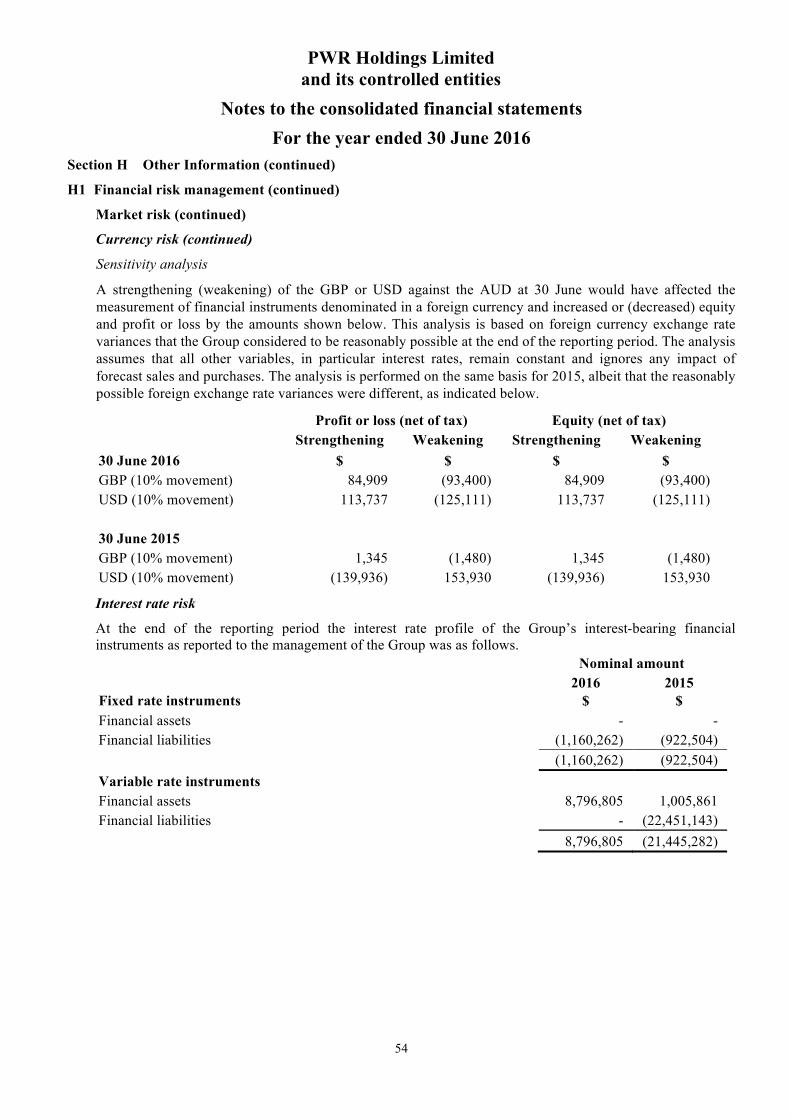
PWR Holdings Limited and its controlled entities
Notes to the consolidated financial statements For the year ended 30 June 2016
54
Section H Other Information (continued)
H1 Financial risk management (continued)
Market risk (continued)
Currency risk (continued)
Sensitivity analysis
A strengthening (weakening) of the GBP or USD against the AUD at 30 June would have affected the measurement of financial instruments denominated in a foreign currency and increased or (decreased) equity and profit or loss by the amounts shown below. This analysis is based on foreign currency exchange rate variances that the Group considered to be reasonably possible at the end of the reporting period. The analysis assumes that all other variables, in particular interest rates, remain constant and ignores any impact of forecast sales and purchases. The analysis is performed on the same basis for 2015, albeit that the reasonably possible foreign exchange rate variances were different, as indicated below.
Profit or loss (net of tax) Equity (net of tax) Strengthening Weakening Strengthening Weakening 30 June 2016 $ $ $ $ GBP (10% movement) 84,909 (93,400) 84,909 (93,400) USD (10% movement) 113,737 (125,111) 113,737 (125,111) 30 June 2015 GBP (10% movement) 1,345 (1,480) 1,345 (1,480) USD (10% movement) (139,936) 153,930 (139,936) 153,930
Interest rate risk
At the end of the reporting period the interest rate profile of the Group’s interest-bearing financial instruments as reported to the management of the Group was as follows. Nominal amount Fixed rate instruments
2016 $
2015 $
Financial assets - - Financial liabilities (1,160,262) (922,504)
(1,160,262) (922,504) Variable rate instruments Financial assets 8,796,805 1,005,861 Financial liabilities - (22,451,143) 8,796,805 (21,445,282)
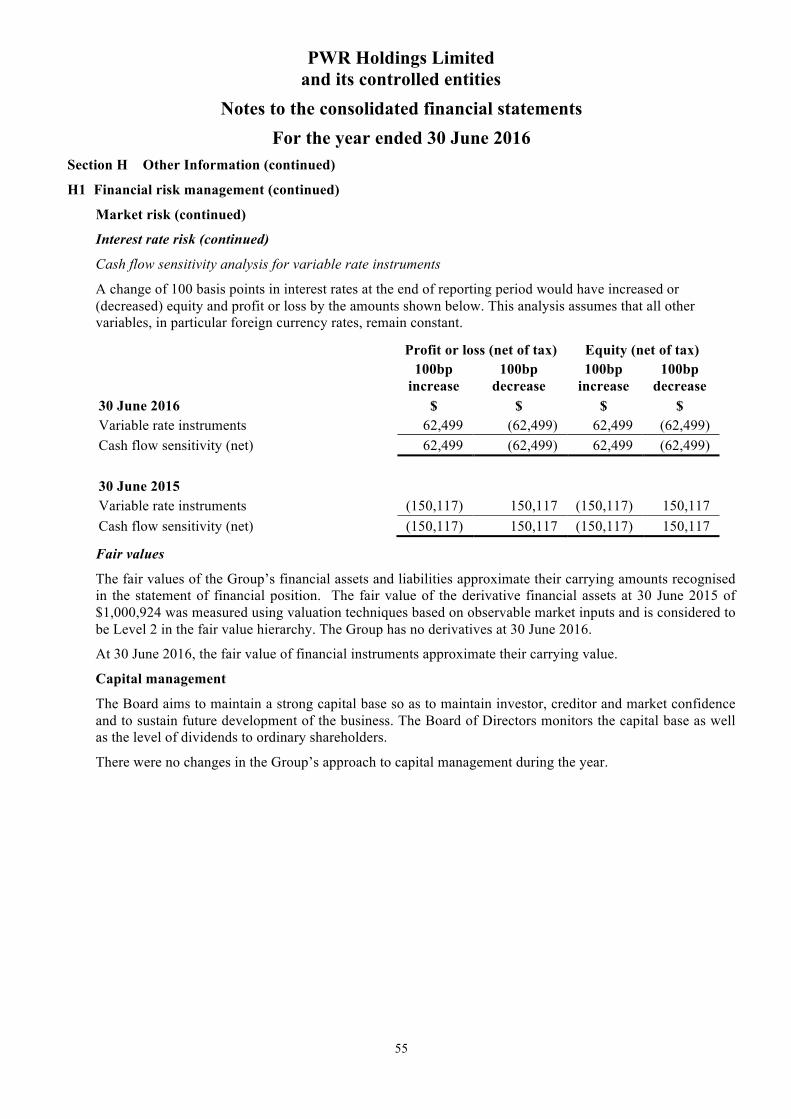
PWR Holdings Limited and its controlled entities
Notes to the consolidated financial statements For the year ended 30 June 2016
55
Section H Other Information (continued)
H1 Financial risk management (continued)
Market risk (continued)
Interest rate risk (continued)
Cash flow sensitivity analysis for variable rate instruments
A change of 100 basis points in interest rates at the end of reporting period would have increased or (decreased) equity and profit or loss by the amounts shown below. This analysis assumes that all other variables, in particular foreign currency rates, remain constant.
Profit or loss (net of tax) Equity (net of tax) 100bp
increase 100bp
decrease 100bp
increase 100bp
decrease 30 June 2016 $ $ $ $ Variable rate instruments 62,499 (62,499) 62,499 (62,499) Cash flow sensitivity (net) 62,499 (62,499) 62,499 (62,499) 30 June 2015 Variable rate instruments (150,117) 150,117 (150,117) 150,117 Cash flow sensitivity (net) (150,117) 150,117 (150,117) 150,117
Fair values
The fair values of the Group’s financial assets and liabilities approximate their carrying amounts recognised in the statement of financial position. The fair value of the derivative financial assets at 30 June 2015 of $1,000,924 was measured using valuation techniques based on observable market inputs and is considered to be Level 2 in the fair value hierarchy. The Group has no derivatives at 30 June 2016.
At 30 June 2016, the fair value of financial instruments approximate their carrying value.
Capital management
The Board aims to maintain a strong capital base so as to maintain investor, creditor and market confidence and to sustain future development of the business. The Board of Directors monitors the capital base as well as the level of dividends to ordinary shareholders.
There were no changes in the Group’s approach to capital management during the year.
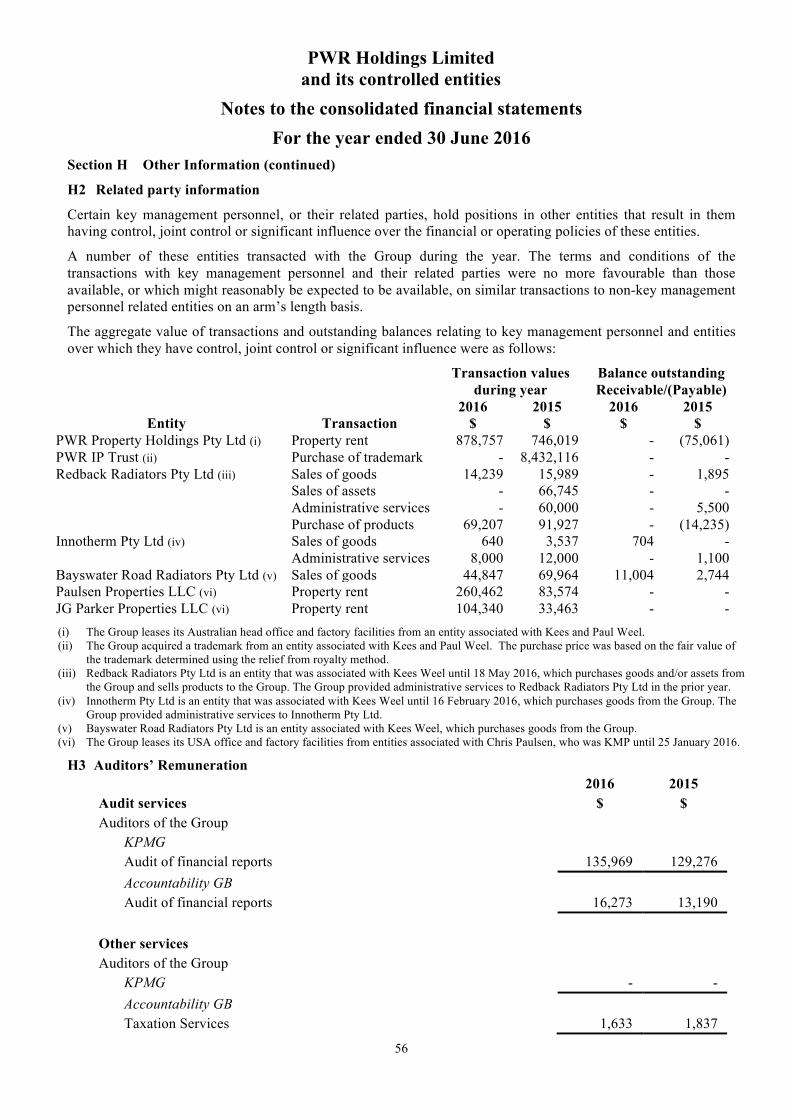
PWR Holdings Limited and its controlled entities
Notes to the consolidated financial statements For the year ended 30 June 2016
56
Section H Other Information (continued)
H2 Related party information
Certain key management personnel, or their related parties, hold positions in other entities that result in them having control, joint control or significant influence over the financial or operating policies of these entities.
A number of these entities transacted with the Group during the year. The terms and conditions of the transactions with key management personnel and their related parties were no more favourable than those available, or which might reasonably be expected to be available, on similar transactions to non-key management personnel related entities on an arm’s length basis.
The aggregate value of transactions and outstanding balances relating to key management personnel and entities over which they have control, joint control or significant influence were as follows:
Transaction values during year
Balance outstanding Receivable/(Payable)
2016 2015 2016 2015 Entity Transaction $ $ $ $
PWR Property Holdings Pty Ltd (i) Property rent 878,757 746,019 - (75,061) PWR IP Trust (ii) Purchase of trademark - 8,432,116 - - Redback Radiators Pty Ltd (iii) Sales of goods 14,239 15,989 - 1,895 Sales of assets - 66,745 - - Administrative services - 60,000 - 5,500 Purchase of products 69,207 91,927 - (14,235) Innotherm Pty Ltd (iv) Sales of goods 640 3,537 704 - Administrative services 8,000 12,000 - 1,100 Bayswater Road Radiators Pty Ltd (v) Sales of goods 44,847 69,964 11,004 2,744 Paulsen Properties LLC (vi) Property rent 260,462 83,574 - - JG Parker Properties LLC (vi) Property rent 104,340 33,463 - - (i) The Group leases its Australian head office and factory facilities from an entity associated with Kees and Paul Weel. (ii) The Group acquired a trademark from an entity associated with Kees and Paul Weel. The purchase price was based on the fair value of
the trademark determined using the relief from royalty method. (iii) Redback Radiators Pty Ltd is an entity that was associated with Kees Weel until 18 May 2016, which purchases goods and/or assets from
the Group and sells products to the Group. The Group provided administrative services to Redback Radiators Pty Ltd in the prior year. (iv) Innotherm Pty Ltd is an entity that was associated with Kees Weel until 16 February 2016, which purchases goods from the Group. The
Group provided administrative services to Innotherm Pty Ltd. (v) Bayswater Road Radiators Pty Ltd is an entity associated with Kees Weel, which purchases goods from the Group. (vi) The Group leases its USA office and factory facilities from entities associated with Chris Paulsen, who was KMP until 25 January 2016.
H3 Auditors’ Remuneration 2016 2015 Audit services $ $ Auditors of the Group
KPMG Audit of financial reports 135,969 129,276 Accountability GB Audit of financial reports 16,273 13,190
Other services Auditors of the Group
KPMG - - Accountability GB Taxation Services 1,633 1,837

PWR Holdings Limited and its controlled entities
Notes to the consolidated financial statements For the year ended 30 June 2016
57
Section H Other Information (continued)
H4 Subsequent events
The Board declared a fully franked final dividend of 3.78 cents per share. The financial effect of the 2016 declared final dividend has not been brought to account in the consolidated financial statements for the year ended 30 June 2016.
Other than the matter noted above, there has not arisen in the interval since the end of the financial year and the date of this report any item, transaction or event of a material and unusual nature likely, in the opinion of the Directors of the Group, to affect significantly the operations of the Group, the results of those operations, or the state of affairs of the Group in future financial years.
H5 New accounting standards
New standards and interpretations not yet adopted
A number of new standards, amendments to standards and interpretations are effective for annual periods beginning after 1 July 2015, and have not been applied in preparing these consolidated financial statements.
AASB 9 (2014) Financial Instruments
AASB 9 replaces the existing guidance in AASB 139 Financial Instruments: Recognition and Measurement. AASB 9 includes revised guidance on the classification and measurement of financial instruments including a new expected credit loss model for calculating impairment on financial assets and the new general hedge accounting requirements. AASB 9 is effective for annual financial reporting periods beginning on or after 1 January 2018. The Group has not determined the extent of the impact of the new standard and does not currently plan to adopt it early.
AASB 15 Revenue from Contracts with Customers
AASB 15 establishes principles for reporting the nature, amount, timing and uncertainty of revenue and cash flows arising from an entity’s contracts with customers. AASB 15 is effective for annual financial reporting periods beginning on or after 1 January 2018. The Group has not determined the extent of the impact of the new standard and does not currently plan to adopt it early.
AASB 16 Leases
AASB 16 sets out the principles for the recognition, measurement, presentation and disclosure of leases. AASB 16 is effective for annual financial reporting periods beginning on or after 1 January 2019. The Group has not determined the extent of the impact of the new standard and does not currently plan to adopt it early.

PWR Holdings Limited and its controlled entities
Directors’ declaration For the year ended 30 June 2016
58
Directors’ declaration
1. In the opinion of the directors of PWR Holdings Limited (the “Company”):
(a) the consolidated financial statements and notes that are set out on pages 21 to 57 and the Remuneration report in section 16 in the Directors’ report, are in accordance with the Corporations Act 2001, including:
(i) giving a true and fair view of the Group’s financial position as at 30 June 2016 and of its performance for the financial year ended on that date; and
(ii) complying with Australian Accounting Standards and the Corporations Regulations 2001;
(b) there are reasonable grounds to believe that the Company will be able to pay its debts as and when they become due and payable.
2. The directors have been given the declarations required by Section 295A of the Corporations Act 2001 from the Chief Executive Officer and Chief Financial Officer for the financial year ended 30 June 2016.
3. The directors draw attention to Note A2 to the consolidated financial statements, which includes a statement of compliance with International Financial Reporting Standards.
Signed in accordance with a resolution of directors.
Kees Weel Bob Thorn Managing Director Chairman
Dated at Brisbane this 25th day of August 2016
59
ABCD
KPMG, an Australian partnership and a member firm of the KPMG network of independent member firms affiliated with KPMG International Cooperative (“KPMG International”), a Swiss entity.
Liability limited by a scheme approved under Professional Standards Legislation.
Independent auditor’s report to the members of PWR Holdings Limited
Report on the financial report
We have audited the accompanying financial report of PWR Holdings Limited (the company), which comprises the consolidated statement of financial position as at 30 June 2016, and the consolidated statement of profit or loss and other comprehensive income, consolidated statement of changes in equity and consolidated statement of cash flows for the year ended on that date, notes A to H5 comprising a summary of significant accounting policies and other explanatory information and the directors’ declaration of the Group comprising the company and the entities it controlled at the year’s end or from time to time during the financial year.
Directors’ responsibility for the financial report The directors of the company are responsible for the preparation of the financial report that gives a true and fair view in accordance with Australian Accounting Standards and the Corporations Act 2001 and for such internal control as the directors determine is necessary to enable the preparation of the financial report that is free from material misstatement whether due to fraud or error. In note A2, the directors also state, in accordance with Australian Accounting Standard AASB 101 Presentation of Financial Statements, that the financial statements of the Group comply with International Financial Reporting Standards.
Auditor’s responsibility Our responsibility is to express an opinion on the financial report based on our audit. We conducted our audit in accordance with Australian Auditing Standards. These Auditing Standards require that we comply with relevant ethical requirements relating to audit engagements and plan and perform the audit to obtain reasonable assurance whether the financial report is free from material misstatement.
An audit involves performing procedures to obtain audit evidence about the amounts and disclosures in the financial report. The procedures selected depend on the auditor’s judgement, including the assessment of the risks of material misstatement of the financial report, whether due to fraud or error. In making those risk assessments, the auditor considers internal control relevant to the entity’s preparation of the financial report that gives a true and fair view in order to design audit procedures that are appropriate in the circumstances, but not for the purpose of expressing an opinion on the effectiveness of the entity’s internal control. An audit also includes evaluating the appropriateness of accounting policies used and the reasonableness of accounting estimates made by the directors, as well as evaluating the overall presentation of the financial report.
We performed the procedures to assess whether in all material respects the financial report presents fairly, in accordance with the Corporations Act 2001 and Australian Accounting Standards, a true and fair view which is consistent with our understanding of the Group’s financial position and of its performance.
We believe that the audit evidence we have obtained is sufficient and appropriate to provide a basis for our audit opinion.
60
ABCD
Independence In conducting our audit, we have complied with the independence requirements of the Corporations Act 2001.
Auditor’s opinion
In our opinion:
(a) the financial report of the Group is in accordance with the Corporations Act 2001, including:
(i) giving a true and fair view of the Group’s financial position as at 30 June 2016 and of its performance for the year ended on that date; and
(ii) complying with Australian Accounting Standards and the Corporations Regulations 2001; and
(b) the financial report also complies with International Financial Reporting Standards as disclosed in note A2.
Report on the Remuneration Report
We have audited the Remuneration Report included in Section 16 of the Directors’ Report for the year ended 30 June 2016. The directors of the company are responsible for the preparation and presentation of the Remuneration Report in accordance with Section 300A of the Corporations Act 2001. Our responsibility is to express an opinion on the Remuneration Report, based on our audit conducted in accordance with auditing standards.
Auditor’s opinion In our opinion, the Remuneration Report of PWR Holdings Limited for the year ended 30 June 2016 complies with Section 300A of the Corporations Act 2001.
KPMG
Jason Adams Partner
Brisbane 25 August 2016
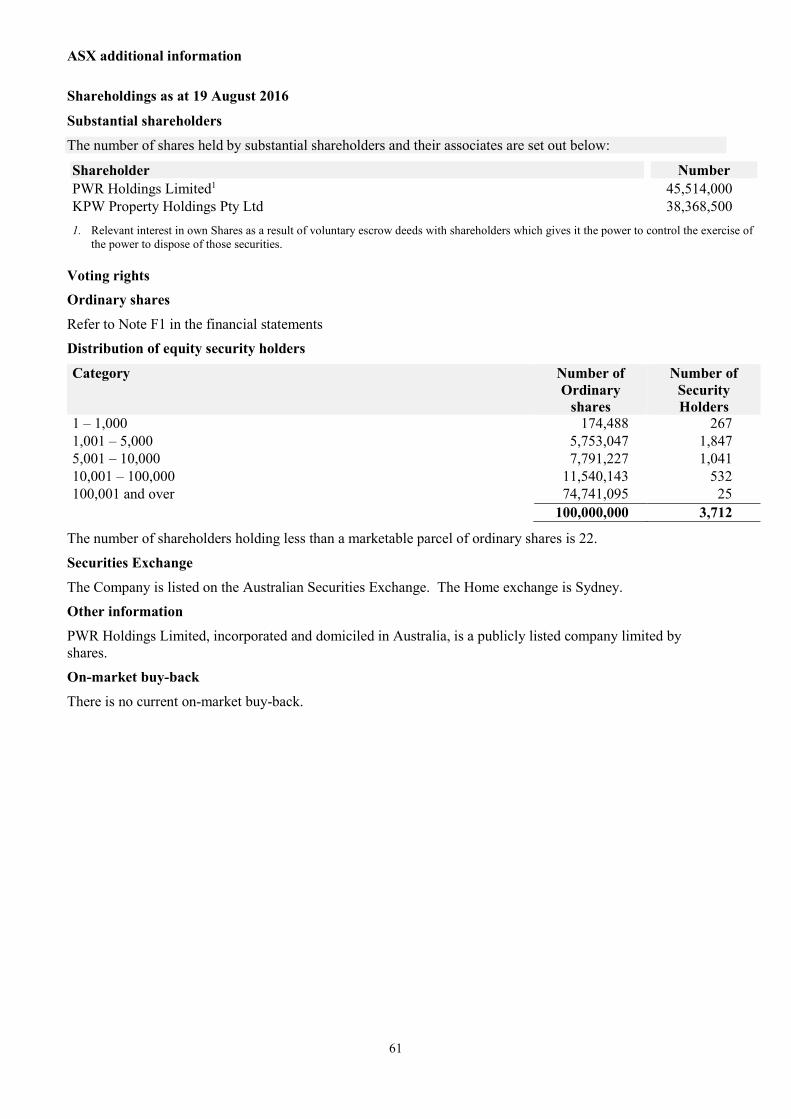
ASX additional information
61
Shareholdings as at 19 August 2016
Substantial shareholders
The number of shares held by substantial shareholders and their associates are set out below:
Shareholder Number PWR Holdings Limited1 45,514,000 KPW Property Holdings Pty Ltd 38,368,500 1. Relevant interest in own Shares as a result of voluntary escrow deeds with shareholders which gives it the power to control the exercise of
the power to dispose of those securities.
Voting rights Ordinary shares
Refer to Note F1 in the financial statements Distribution of equity security holders
Category Number of Ordinary
shares
Number of Security Holders
1 – 1,000 174,488 267 1,001 – 5,000 5,753,047 1,847 5,001 – 10,000 7,791,227 1,041 10,001 – 100,000 11,540,143 532 100,001 and over 74,741,095 25 100,000,000 3,712
The number of shareholders holding less than a marketable parcel of ordinary shares is 22.
Securities Exchange
The Company is listed on the Australian Securities Exchange. The Home exchange is Sydney. Other information
PWR Holdings Limited, incorporated and domiciled in Australia, is a publicly listed company limited by shares. On-market buy-back
There is no current on-market buy-back.
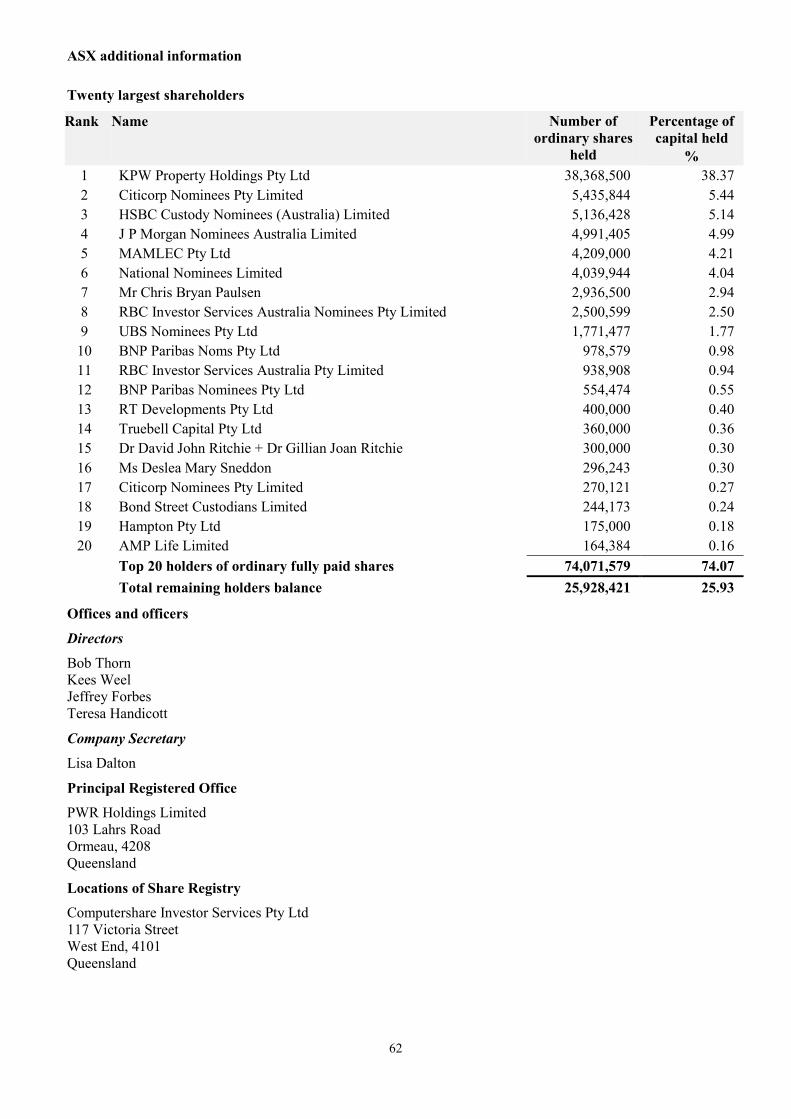
ASX additional information
62
Twenty largest shareholders
Rank Name Number of ordinary shares
held
Percentage of capital held
% 1 KPW Property Holdings Pty Ltd 38,368,500 38.37 2 Citicorp Nominees Pty Limited 5,435,844 5.44 3 HSBC Custody Nominees (Australia) Limited 5,136,428 5.14 4 J P Morgan Nominees Australia Limited 4,991,405 4.99 5 MAMLEC Pty Ltd 4,209,000 4.21 6 National Nominees Limited 4,039,944 4.04 7 Mr Chris Bryan Paulsen 2,936,500 2.94 8 RBC Investor Services Australia Nominees Pty Limited 2,500,599 2.50 9 UBS Nominees Pty Ltd 1,771,477 1.77
10 BNP Paribas Noms Pty Ltd 978,579 0.98 11 RBC Investor Services Australia Pty Limited 938,908 0.94 12 BNP Paribas Nominees Pty Ltd 554,474 0.55 13 RT Developments Pty Ltd 400,000 0.40 14 Truebell Capital Pty Ltd 360,000 0.36 15 Dr David John Ritchie + Dr Gillian Joan Ritchie 300,000 0.30 16 Ms Deslea Mary Sneddon 296,243 0.30 17 Citicorp Nominees Pty Limited 270,121 0.27 18 Bond Street Custodians Limited 244,173 0.24 19 Hampton Pty Ltd 175,000 0.18 20 AMP Life Limited 164,384 0.16
Top 20 holders of ordinary fully paid shares 74,071,579 74.07 Total remaining holders balance 25,928,421 25.93
Offices and officers
Directors
Bob Thorn Kees Weel Jeffrey Forbes Teresa Handicott
Company Secretary
Lisa Dalton
Principal Registered Office
PWR Holdings Limited 103 Lahrs Road Ormeau, 4208 Queensland
Locations of Share Registry
Computershare Investor Services Pty Ltd 117 Victoria Street West End, 4101 Queensland


